UNITED STATES
SECURITIES AND EXCHANGE COMMISSION
Washington, D.C. 20549
FORM N-CSR
CERTIFIED SHAREHOLDER REPORT OF REGISTERED
MANAGEMENT INVESTMENT COMPANIES
Investment Company Act file number | 811-21589 |
|
CREDIT SUISSE COMMODITY STRATEGY FUNDS (formerly known as Credit Suisse Commodity Return Strategy Fund) |
(Exact name of registrant as specified in charter) |
|
Eleven Madison Avenue, New York, New York | | 10010 |
(Address of principal executive offices) | | (Zip code) |
|
John G. Popp Credit Suisse Commodity Strategy Funds Eleven Madison Avenue New York, New York 10010 |
(Name and address of agent for service) |
|
Registrant’s telephone number, including area code: | (212) 325-2000 | |
|
Date of fiscal year end: | October 31st | |
|
Date of reporting period: | November 1, 2018 to October 31, 2019 | |
| | | | | | | | | |
Item 1. Reports to Stockholders.

CREDIT SUISSE FUNDS
Annual Report
October 31, 2019
n CREDIT SUISSE
COMMODITY RETURN STRATEGY FUND
Beginning on January 1, 2021, as permitted by regulations adopted by the Securities and Exchange Commission, paper copies of the Fund's shareholder reports will no longer be sent by mail, unless you specifically request paper copies of the reports from Credit Suisse Asset Management, LLC or from your financial intermediary, such as a broker-dealer or bank. Instead, the reports will be made available on a website, and you will be notified by mail each time a report is posted and provided with a website link to access the report.
You may elect to receive all future reports in paper free of charge. If you hold accounts directly with the Fund, you can call 877-870-2874 to inform Credit Suisse Asset Management, LLC that you wish to continue receiving paper copies of your shareholder reports. If you hold accounts through a financial intermediary, you can contact your financial intermediary to request that you continue to receive paper copies of your shareholder reports. Please note that not all financial intermediaries may offer this service. Your election to receive reports in paper will apply to all funds advised by Credit Suisse Asset Management, LLC, or all funds held with your financial intermediary, as applicable.
If you already elected to receive shareholder reports electronically, you will not be affected by this change and you need not take any action. You may elect to receive electronic delivery of shareholder reports and other communications by: (i) accessing the Credit Suisse Asset Management, LLC website at www.credit-suisse.com/us/funds and logging into your accounts, if you hold accounts directly with the Fund, or (ii) contacting your financial intermediary, if you hold accounts through a financial intermediary. Please note that not all financial intermediaries may offer this service.
The Fund's investment objectives, risks, charges and expenses (which should be considered carefully before investing), and more complete information about the Fund, are provided in the Prospectus, which should be read carefully before investing. You may obtain additional copies by calling 877-870-2874 or by visiting our website at www.credit-suisse.com/us/funds.
Credit Suisse Securities (USA) LLC, Distributor, is located at Eleven Madison Avenue, New York, NY 10010. Credit Suisse Funds are advised by Credit Suisse Asset Management, LLC.
Investors in the Credit Suisse Funds should be aware that they may be eligible to purchase Class I shares (where offered) directly or through certain intermediaries. Such shares are not subject to a sales charge. Investors in the Credit Suisse Funds should also be aware that they may be eligible for a reduction or waiver of the sales charge with respect to Class A or C shares (where offered). For more information, please review the relevant prospectuses or consult your financial representative.
Fund shares are not deposits or other obligations of Credit Suisse Asset Management, LLC ("Credit Suisse") or any affiliate, are not FDIC-insured and are not guaranteed by Credit Suisse or any affiliate. Fund investments are subject to investment risks, including loss of your investment.
Credit Suisse Commodity Return Strategy Fund
Annual Investment Adviser's Report
October 31, 2019 (unaudited)
November 19, 2019
Dear Shareholder:
We are pleased to present this Annual Report covering the activities of the Credit Suisse Commodity Return Strategy Fund (the "Fund") for the 12-month period ended October 31, 2019.
Performance Summary
11/01/18 – 10/31/19
Fund & Benchmark | |
Class I1 | | | -3.13 | % | |
Class A1,2 | | | -3.24 | % | |
Class C1,2 | | | -4.23 | % | |
Bloomberg Commodity Index Total Return3 | | | -2.58 | % | |
Performance shown for the Fund's Class A and Class C Shares does not reflect sales charges, which are a maximum of 4.75% and 1.00%, respectively.2
Market and Strategy Review:
Commodities declined for the annual period ended October 31, 2019. The Bloomberg Commodity Index Total Return (the "Benchmark") decreased 2.58%, with 15 out of 23 index constituents trading lower.
For the 12-month period ended October 31, 2019, the Fund outperformed the Benchmark before fees and Fund expenses. Commodity strategies contributed positively to relative performance while cash management detracted from returns for the period. Within the portfolio's commodity exposure, forward curve positioning in the Energy sector had the largest positive impact relative to the Benchmark. Positioning within the Agriculture, Livestock, and Industrial Metals sectors detracted from relative performance. On an individual commodity level, the top three estimated contributors to relative performance versus the Benchmark were Natural Gas (+0.63%), WTI Crude Oil (+0.03%) and Copper (+0.01%). Meanwhile, RBOB Gasoline (-0.09%), Chicago Wheat (-0.08%) and Brent Crude Oil (-0.05%) had the largest negative impact relative to the benchmark. The Fund's Class I, A and C Shares underperformed the Benchmark after fees and Fund expenses.
Energy declined the most for the period, decreasing 15.70%. Natural Gas fell 27.40%, as stronger-than-expected production growth out of the US Northeast and South Central regions far outweighed demand growth over the period. Despite the US ending the 2018-2019 Winter season with substantial Natural Gas storage deficits, supplies grew quickly throughout the spring and summer
1
Credit Suisse Commodity Return Strategy Fund
Annual Investment Adviser's Report (continued)
October 31, 2019 (unaudited)
inventory building season. This allowed US inventories to flip to a surplus ahead of the 2019-2020 Winter season. WTI Crude Oil, down 17.27%, and petroleum products also ended the period in negative territory. The petroleum complex fell sharply towards the end of 2018 as the global supply and demand balance for crude shifted from tight to oversupplied following stronger-than-expected oil exports from Saudi Arabia and other members of the OPEC-led production agreement. In late 2018, the US also granted oil waivers to eight of the largest buyers of Iranian oil, which helped lead to builds in inventories globally. Oil and petroleum products recovered all of their losses and reached higher levels through the first four months of 2019 as OPEC+ decided to extend their production cut agreement into 2020, with strong compliance reported. However, a shift in sentiment towards weakening future demand expectations, due to growing global growth concerns, helped drive prices lower.
Agriculture declined 5.29% for the one year period. Kansas City Wheat fell 24.43%, after stronger-than-expected crop yields for Russia, the European Union, and the Black Sea region increased global competition for US wheat supplies. In addition, favorable weather conditions in the US Northern Plains during the latter months of the period led to better-than-expected crop yields for the 2019-2020 season. Coffee fell 20.29% after beneficial weather in Brazil's key growing regions allowed the 2019 harvest to exceed last year's pace, increasing supply expectations. Local farmers in Brazil were also encouraged to sell their inventories priced in US Dollars as the Brazilian Real depreciated versus the greenback. Cotton decreased 17.44% on concerns that China may not take delivery of all of the US cotton it had committed to purchase as trade talks between the nations soured in 2Q19. Moreover, despite lower-than-expected planted acres of cotton, beneficial weather during the first half of 2019 increased harvest prospects.
Livestock declined 4.15%. Lean Hogs fell 16.46% on reduced international appetite over the period and muted expectations of exports in the near-term as the US continued to be entangled in various trade disputes with key trading partners. The US Department of Agriculture also reported increased pork production and larger US hog herd sizes throughout 2019. Live Cattle, up 1.89%, slightly offset some of the losses in the sector. US beef export expectations improved after the US and Japan, the largest buyer of US beef, reached a trade agreement in October 2019.
Industrial Metals gained 5.49%. Nickel increased 46.43% throughout the one-year period. In early 2019, Vale SA, the world's largest nickel producer, reduced production at multiple mines as part of a safety overhaul exercise following a severe dam breach in Brazil. During the latter half of 2019, Nickel
2
Credit Suisse Commodity Return Strategy Fund
Annual Investment Adviser's Report (continued)
October 31, 2019 (unaudited)
received additional support after the Indonesian government announced that the ban on all nickel ore exports planned for January 2022 would be moved forward by two years, tightening the supply outlook. Zinc rose 7.75% as the global refined supply deficit persisted into its third year, as reported by the International Lead and Zinc Study Group.
Precious Metals performed the best, increasing 24.13%. Ongoing uncertainty surrounding US-China trade negotiations and Brexit discussions translated into a slower global growth trajectory. These developments, along with poor economic data releases from various statistical agencies, helped spur central banks globally to enact looser monetary policies in an effort to support their local economies. Most notably, the US Federal Reserve took a dovish tilt in 2019, cutting the Federal Funds rate three times during the year after raising rates multiple times in 2018. This raised the demand for Gold and Silver as alternative stores of wealth.
Outlook:
A move towards resolution became the theme for major geopolitical affairs in October as trade negotiations and Brexit talks seemingly progressed. The US and China neared a partial trade agreement that would at minimum address the sales of US agricultural goods, particularly soybeans and pork, to the expansive Chinese market. By month end, the two administrations showed preference towards finalizing the deal's terms. Both countries announced plans to find another location to sign the agreement after Chile cancelled the mid-November Asia-Pacific Economic Cooperation meeting amid growing domestic social unrest. Any meaningful progress in the US-China trade war may help to improve commodities demand expectations and the global growth outlook. In addition, the US successfully made a trade deal with Japan, which should help improve US beef export demand.
In Chile, the largest producer of copper, public protests have already disrupted mining operations and caused transportation delays. Prolonged unrest may hinder copper production into 2020. Across the Pacific Ocean, supply disruptions appeared sooner than expected after the Indonesian government purportedly made a verbal agreement with its domestic mining industry to temporarily restrict the flow of high-grade nickel ore exports ahead of the revised January 2020 export ban deadline as it attempts to shore up profits all along the nickel production supply chain. However, Indonesia's policy towards nickel production and exports has varied widely over the past years, so potential uncertainty remains for further adjustments to these rules, which could help to tighten supplies further.
3
Credit Suisse Commodity Return Strategy Fund
Annual Investment Adviser's Report (continued)
October 31, 2019 (unaudited)
In macroeconomic news, leading economic indicators for large economies continued to show weakness. The US and the Eurozone both suffered lower manufacturing PMI readings for September. Meanwhile, China's PMI readings varied, though all were near contraction territory. China's GDP for the third quarter of 2019 fell to 6%, the lowest quarterly reading since 1993. Until trade frictions among the largest economies ease, central banks are likely to continue to act to support economic activity in an effort to help counteract any impediments to growth.
The Credit Suisse Commodities Management Team
Nelson Louie
Christopher Burton
This Fund is non-diversified, which means it may invest a greater proportion of its assets in the securities of a smaller number of issuers than a diversified mutual fund and may therefore be subject to greater volatility. The Fund's investment in commodity linked derivative instruments may subject the Fund to greater volatility than investment in traditional securities, particularly in investments involving leverage.
The use of derivatives such as commodity-linked structured notes, swaps and futures entails substantial risks, including risk of loss of a significant portion of their principal value, commodity exposure risks, correlation risk, derivatives risk, exposure risk, fixed income risk, futures contract risk, leveraging risk, liquidity risk, interest-rate risk, market risk, non-diversified status, portfolio turnover risk, structured note risk, subsidiary risk, swap agreement risk, U.S. government securities risk, credit risk and tax risk. Gains and losses from speculative positions in derivatives may be much greater than the derivative's cost. At any time, the risk of loss of any individual security held by the Fund could be significantly higher than 50% of the security's value. For a detailed discussion of these and other risks, please refer to the Fund's Prospectus, which should be read carefully before investing.
In addition to historical information, this report contains forward-looking statements, which may concern, among other things, domestic and foreign market, industry and economic trends and developments and government regulation and their potential impact on the Fund's investments. These statements are subject to risks and uncertainties and actual trends, developments and regulations in the future, and their impact on the Fund could be materially different from those projected, anticipated or implied. The Fund has no obligation to update or revise forward-looking statements.
4
Credit Suisse Commodity Return Strategy Fund
Annual Investment Adviser's Report (continued)
October 31, 2019 (unaudited)
The views of the Fund's management are as of the date of the letter and the Fund holdings described in this document are as of October 31, 2019; these views and Fund holdings may have changed subsequent to these dates. Nothing in this document is a recommendation to purchase or sell securities.
1 Fee waivers and/or expense reimbursements may reduce expenses for the Fund, without which performance would be lower.
2 Total return for the Fund's Class A shares for the reporting period, based on offering price (including maximum sales charge of 4.75%), was -7.81%. Total return for the Fund's Class C shares for the reporting period, based on redemption value (including maximum contingent deferred sales charge of 1.00%), was -5.18%.
3 The Bloomberg Commodity Index Total Return is composed of futures contracts on 23 physical commodities. The index does not have transaction costs and investors may not invest directly in the index.
5
Credit Suisse Commodity Return Strategy Fund
Annual Investment Adviser's Report (continued)
October 31, 2019 (unaudited)
Comparison of Change in Value of $10,000 Investment in the
Credit Suisse Commodity Return Strategy Fund1 Class I Shares,
Class A Shares2, Class C Shares2 and the Bloomberg
Commodity Index Total Return3
For Ten Years
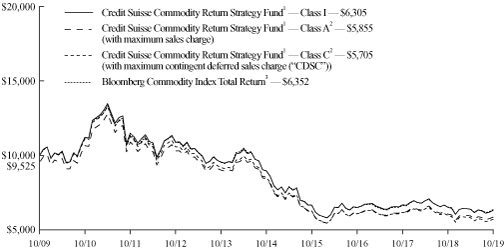
1 Fee waivers and/or expense reimbursements may reduce expenses for the Fund, without which performance would be lower. The Fund entered into a written contract to limit expenses to 0.80% of the Fund's average daily net assets for Class I shares, 1.05% of the Fund's average daily net assets for Class A shares and 1.80% of the Fund's average daily net assets for Class C shares through at least February 28, 2021. This limit excludes certain expenses, as set out in the Fund's Prospectus.
2 Total return for the Fund's Class A shares for the reporting period, based on offering price (including maximum sales charge of 4.75%), was -7.81%. Total return for the Fund's Class C shares for the reporting period, based on redemption value (including maximum contingent deferred sales charge of 1.00%), was -5.18%.
3 The Bloomberg Commodity Index Total Return is a broadly diversified futures index currently composed of futures contracts on 23 physical commodities. The index does not have transaction costs and investors may not invest directly in the index.
6
Credit Suisse Commodity Return Strategy Fund
Annual Investment Adviser's Report (continued)
October 31, 2019 (unaudited)
Average Annual Returns as of October 31, 20191
| | | 1 Year | | 5 Years | | 10 Years | |
Class I | | | (3.13 | )% | | | (6.77 | )% | | | (4.51 | )% | |
Class A Without Sales Charge | | | (3.24 | )% | | | (6.99 | )% | | | (4.75 | )% | |
Class A With Maximum Sales Charge | | | (7.81 | )% | | | (7.89 | )% | | | (5.21 | )% | |
Class C Without CDSC | | | (4.23 | )% | | | (7.71 | )% | | | (5.46 | )% | |
Class C With CDSC | | | (5.18 | )% | | | (7.71 | )% | | | (5.46 | )% | |
Returns represent past performance and include change in share price and reinvestment of dividends and capital gain distributions, if any. Past performance cannot guarantee future results. The current performance of the Fund may be lower or higher than the figures shown. Returns and share price will fluctuate, and redemption value may be more or less than original cost. The performance results do not reflect the deduction of taxes that a shareholder would pay on Fund distributions or the redemption of Fund shares. Performance information current to the most recent month end is available at www.credit-suisse.com/us/funds.
The annual gross expense ratios are 0.78% for Class I shares, 1.03% for Class A shares and 1.78% for Class C shares.
1 Fee waivers and/or expense reimbursements reduce expenses for the Fund, without which performance would be lower. The Fund entered into a written contract to limit expenses to 0.80% of the Fund's average daily net assets for Class I shares, 1.05% of the Fund's average daily net assets for Class A shares and 1.80% of the Fund's average daily net assets for Class C shares through at least February 28, 2021. This limit excludes certain expenses, as set forth in the Fund's Prospectus.
7
Credit Suisse Commodity Return Strategy Fund
Annual Investment Adviser's Report (continued)
October 31, 2019 (unaudited)
Information About Your Fund's Expenses
As an investor of the Fund, you incur two types of costs: ongoing expenses and transaction costs. Ongoing expenses include management fees, distribution and service (12b-1) fees and other Fund expenses. Examples of transaction costs include sales charges (loads), redemption fees and account maintenance fees, which are not shown in this section and which would result in higher total expenses. The following table is intended to help you understand your ongoing expenses of investing in the Fund and to help you compare these expenses with the ongoing expenses of investing in other mutual funds. The table is based on an investment of $1,000 made at the beginning of the six months ended October 31, 2019.
The table illustrates your Fund's expenses in two ways:
• Actual Fund Return. This helps you estimate the actual dollar amount of ongoing expenses paid on a $1,000 investment in the Fund using the Fund's actual return during the period. To estimate the expenses you paid over the period, simply divide your account value by $1,000 (for example, an $8,600 account value divided by $1,000 = 8.6), then multiply the result by the number in the "Expenses Paid per $1,000" line.
• Hypothetical 5% Fund Return. This helps you to compare the Fund's ongoing expenses with those of other mutual funds using the Fund's actual expense ratio and a hypothetical rate of return of 5% per year before expenses. Examples using a 5% hypothetical fund return may be found in the shareholder reports of other mutual funds. The hypothetical account values and expenses may not be used to estimate the actual ending account balance or expenses you paid for the period.
Please note that the expenses shown in these tables are meant to highlight your ongoing expenses only and do not reflect any transaction costs, such as sales charges (loads) or redemption fees. If these transaction costs had been included, your costs would have been higher. The "Expenses Paid per $1,000" line of the tables is useful in comparing ongoing expenses only and will not help you determine the relative total expenses of owning different funds.
8
Credit Suisse Commodity Return Strategy Fund
Annual Investment Adviser's Report (continued)
October 31, 2019 (unaudited)
Expenses and Value for a $1,000 Investment
for the six-month period ended October 31, 2019
Actual Fund Return | | Class I | | Class A | | Class C | |
Beginning Account Value 05/01/19 | | $ | 1,000.00 | | | $ | 1,000.00 | | | $ | 1,000.00 | | |
Ending Account Value 10/31/19 | | $ | 989.20 | | | $ | 987.70 | | | $ | 982.90 | | |
Expenses Paid per $1,000* | | $ | 3.81 | | | $ | 5.06 | | | $ | 8.80 | | |
Hypothetical 5% Fund Return | |
Beginning Account Value 05/01/19 | | $ | 1,000.00 | | | $ | 1,000.00 | | | $ | 1,000.00 | | |
Ending Account Value 10/31/19 | | $ | 1,021.37 | | | $ | 1,020.11 | | | $ | 1,016.33 | | |
Expenses Paid per $1,000* | | $ | 3.87 | | | $ | 5.14 | | | $ | 8.94 | | |
| | | Class I | | Class A | | Class C | |
Annualized Expense Ratios* | | | 0.80 | % | | | 1.05 | % | | | 1.80 | % | |
* Expenses are equal to the Fund's annualized expense ratio for each share class, multiplied by the average account value over the period, multiplied by 184/365 to reflect the one-half year period.
The "Expenses Paid per $1,000" and the "Annualized Expense Ratios" in the tables are based on actual expenses paid by the Fund during the period, net of fee waivers and/or actual expense reimbursements, if applicable. If those fee waivers and/or expense reimbursements had not been in effect, the Fund's actual expenses would have been higher. Expenses do not reflect additional charges and expenses that are, or may be, imposed under the variable contracts or plans. Such charges and expenses are described in the prospectus of the insurance company separate account or in the plan documents or other informational materials supplied by plan sponsors. The Fund's expenses should be considered with these charges and expenses in evaluating the overall cost of investing in the separate account.
For more information, please refer to the Fund's Prospectus.
Portfolio Breakdown*
United States Agency Obligations | | | 72.50 | % | |
United States Treasury Obligations | | | 27.50 | | |
Total | | | 100.00 | % | |
* Expressed as a percentage of total investments (excluding securities lending collateral, if applicable) and may vary over time.
9
Credit Suisse Commodity Return Strategy Fund
Consolidated Schedule of Investments
October 31, 2019
Par
(000) | |
| | Ratings†
(S&P/Moody's) | | Maturity | | Rate% | | Value | |
| UNITED STATES AGENCY OBLIGATIONS (68.7%) | | | |
$ | 56,750 | | | Federal Farm Credit Banks,
USBMMY3M + 0.140%(1) | | (AA+, Aaa) | | 09/17/21 | | | 1.767 | | | $ | 56,590,687 | | |
| | 41,450 | | | Federal Farm Credit Banks,
FEDL01 + 0.220%(1) | | (AA+, Aaa) | | 10/12/21 | | | 2.040 | | | | 41,437,878 | | |
| | 29,600 | | | Federal Farm Credit Banks,
USBMMY3M + 0.140%(1) | | (AA+, Aaa) | | 11/08/21 | | | 1.767 | | | | 29,504,878 | | |
| | 85,000 | | | Federal Farm Credit Banks,
FCPR DLY - 2.800%(1) | | (AA+, Aaa) | | 11/23/21 | | | 2.200 | | | | 85,216,115 | | |
| | 49,200 | | | Federal Farm Credit Banks,
FCPR DLY - 2.800%(1) | | (AA+, Aaa) | | 03/14/22 | | | 2.200 | | | | 49,268,417 | | |
| | 87,700 | | | Federal Farm Credit Banks,
SOFR + 0.200%(1) | | (AA+, Aaa) | | 04/22/22 | | | 2.010 | | | | 87,560,675 | | |
| | 38,000 | | | Federal Farm Credit Banks,
USBMMY3M + 0.270%(1) | | (AA+, Aaa) | | 05/16/22 | | | 1.897 | | | | 37,904,381 | | |
| | 56,700 | | | Federal Farm Credit Banks,
FCPR DLY - 2.810%(1) | | (AA+, Aaa) | | 05/20/22 | | | 2.190 | | | | 56,743,644 | | |
| | 28,800 | | | Federal Farm Credit Banks | | (AA+, Aaa) | | 08/20/24 | | | 2.100 | | | | 28,848,164 | | |
| | 6,010 | | | Federal Farm Credit Banks | | (AA+, Aaa) | | 10/15/26 | | | 2.230 | | | | 6,001,552 | | |
| | 21,500 | | | Federal Home Loan Bank
Discount Notes(2) | | (AA+, Aaa) | | 12/03/19 | | | 1.696 | | | | 21,467,584 | | |
| | 10,000 | | | Federal Home Loan Banks,
SOFR + 0.050%(1) | | (AA+, Aaa) | | 01/22/21 | | | 1.860 | | | | 9,989,563 | | |
| | 10,100 | | | Federal Home Loan Banks,
TBILL 3M + 0.090%(1) | | (AA+, Aaa) | | 02/01/21 | | | 1.754 | | | | 10,082,224 | | |
| | 42,605 | | | Federal Home Loan Banks | | (AA+, Aaa) | | 02/05/21 | | | 2.150 | | | | 42,626,738 | | |
| | 25,000 | | | Federal Home Loan Banks,
SOFR + 0.075%(1) | | (AA+, Aaa) | | 06/11/21 | | | 1.885 | | | | 24,963,802 | | |
| | 16,300 | | | Federal Home Loan Banks | | (AA+, Aaa) | | 08/05/21 | | | 2.250 | | | | 16,300,526 | | |
| | 74,900 | | | Federal Home Loan Banks | | (AA+, Aaa) | | 08/05/22 | | | 2.250 | | | | 74,971,097 | | |
| | 21,000 | | | Federal Home Loan Banks | | (AA+, Aaa) | | 08/21/24 | | | 2.000 | | | | 20,935,927 | | |
| | 22,750 | | | Federal Home Loan Mortgage Corp. | | (AA+, Aaa) | | 08/19/21 | | | 2.000 | | | | 22,760,205 | | |
| | 218,200 | | | Federal Home Loan Mortgage Corp.,
SOFR + 0.130%(1) | | (AA+, Aaa) | | 08/05/22 | | | 1.940 | | | | 217,335,967 | | |
| | 11,000 | | | Federal Home Loan Mortgage Corp. | | (AA+, Aaa) | | 08/26/22 | | | 2.050 | | | | 11,014,237 | | |
| | 18,500 | | | Federal Home Loan Mortgage Corp. | | (AA+, Aaa) | | 08/12/24 | | | 2.250 | | | | 18,506,433 | | |
| | 10,000 | | | Federal Home Loan Mortgage Corp. | | (AA+, Aaa) | | 08/28/24 | | | 2.010 | | | | 10,001,950 | | |
| | 16,000 | | | Federal National Mortgage Association,
SOFR + 0.100%(1) | | (AA+, Aaa) | | 04/30/20 | | | 1.910 | | | | 16,004,793 | | |
| | 72,000 | | | Federal National Mortgage Association,
SOFR + 0.075%(1) | | (AA+, Aaa) | | 10/30/20 | | | 1.885 | | | | 71,985,550 | | |
| | 58,300 | | | Federal National Mortgage Association,
SOFR + 0.040%(1) | | (AA+, Aaa) | | 01/29/21 | | | 1.850 | | | | 58,245,478 | | |
| | 30,000 | | | Federal National Mortgage Association | | (AA+, Aaa) | | 10/28/22 | | | 1.950 | | | | 30,033,255 | | |
| TOTAL UNITED STATES AGENCY OBLIGATIONS (Cost $1,157,309,626) | | | 1,156,301,720 | | |
See Accompanying Notes to Consolidated Financial Statements.
10
Credit Suisse Commodity Return Strategy Fund
Consolidated Schedule of Investments (continued)
October 31, 2019
Par
(000) | |
| | Ratings†
(S&P/Moody's) | | Maturity | | Rate% | | Value | |
| UNITED STATES TREASURY OBLIGATIONS (26.1%) | | | |
$ | 15,000 | | | United States Treasury Bills(2) | | (AA+, Aaa) | | 11/19/19 | | | 1.718 | | | $ | 14,987,119 | | |
| | 50,000 | | | United States Treasury Bills(2) | | (AA+, Aaa) | | 11/26/19 | | | 1.542 | | | | 49,946,458 | | |
| | 17,000 | | | United States Treasury Bills(2) | | (AA+, Aaa) | | 01/09/20 | | | 1.875 | | | | 16,950,229 | | |
| | 88,000 | | | United States Treasury Floating Rate Notes,
USBMMY3M + 0.115%(1),(3) | | (AA+, Aaa) | | 01/31/21 | | | 1.752 | | | | 87,914,524 | | |
| | 50,000 | | | United States Treasury Floating Rate Notes,
USBMMY3M + 0.139%(1),(3) | | (AA+, Aaa) | | 04/30/21 | | | 1.665 | | | | 49,943,240 | | |
| | 100,000 | | | United States Treasury Floating Rate Notes,
USBMMY3M + 0.220%(1),(4) | | (AA+, Aaa) | | 07/31/21 | | | 1.857 | | | | 100,002,142 | | |
| | 28,000 | | | United States Treasury Floating Rate Notes,
USBMMY3M + 0.300%(1) | | (AA+, Aaa) | | 10/31/21 | | | 1.826 | | | | 28,023,584 | | |
| | 20,000 | | | United States Treasury Notes | | (AA+, Aaa) | | 03/31/20 | | | 2.250 | | | | 20,053,125 | | |
| | 28,000 | | | United States Treasury Notes | | (AA+, Aaa) | | 04/30/20 | | | 1.125 | | | | 27,934,922 | | |
| | 42,800 | | | United States Treasury Notes | | (AA+, Aaa) | | 05/31/20 | | | 1.375 | | | | 42,740,648 | | |
| TOTAL UNITED STATES TREASURY OBLIGATIONS (Cost $438,399,635) | | | 438,495,991 | | |
| TOTAL INVESTMENTS AT VALUE (94.8%) (Cost $1,595,709,261) | | | 1,594,797,711 | | |
| OTHER ASSETS IN EXCESS OF LIABILITIES (5.2%) | | | 87,213,391 | | |
| NET ASSETS (100.0%) | | $ | 1,682,011,102 | | |
† Credit ratings given by the S&P Global Ratings Division of S&P Global Inc. ("S&P") and Moody's Investors Service, Inc. ("Moody's") are unaudited.
(1) Variable rate obligation — The interest rate shown is the rate in effect as of October 31, 2019.
(2) Securities are zero coupon. Rate presented is yield to maturity as of October 31, 2019.
(3) At October 31, 2019, $43,141,494 in the value of this securities has been pledged as collateral for open swap contracts.
(4) At October 31, 2019, $5,000,000 in the value of this security has been pledged to cover initial margin requirements for open futures contracts.
INVESTMENT ABBREVIATIONS
3M = 3 Month
DLY = Daily
FCPR = Federal Reserve Bank Prime Loan Rate U.S.
FEDL01 = Federal Funds Rate
SOFR = Secured Overnight Financing Rate
TBILL = Treasury Bill Rate
USBMMY3M = U.S. Treasury 3 Month Bill Money Market Yield
See Accompanying Notes to Consolidated Financial Statements.
11
Credit Suisse Commodity Return Strategy Fund
Consolidated Schedule of Investments (continued)
October 31, 2019
Futures Contracts
Contract Description | | Currency | | Expiration
Date | | Number of
Contracts | | Notional
Value | | Net Unrealized
Appreciation
(Depreciation) | |
Contracts to Purchase | |
Energy | |
Brent Crude Oil Futures | | USD | | | | Jun 2020 | | | 126 | | | $ | 7,219,800 | | | $ | 22,336 | | |
Light Sweet Crude Oil Futures | | USD | | | | Jun 2020 | | | 117 | | | | 6,196,320 | | | | 75,665 | | |
Contracts to Sell | |
Energy | |
Brent Crude Oil Futures | | USD | | | | Dec 2020 | | | (126 | ) | | | (7,073,640 | ) | | $ | 9,537 | | |
Light Sweet Crude Oil Futures | | USD | | | | Dec 2020 | | | (117 | ) | | | (6,020,820 | ) | | | (145,446 | ) | |
Net unrealized appreciation (depreciation) | | | | | | | | | | | | | | | | | | $ | (37,908 | ) | |
Commodity Index Swap Contracts | |
Currency | | Notional
Amount | | Expiration
Date | | Counterparty | | Receive
Return of the
Reference
Index | | Pay | | Payment
Frequency | | Upfront
Premiums
Paid/
(Received) | | Net Unrealized
Appreciation
(Depreciation) | |
USD | | | | $ | 41,152,112 | | | 11/21/19 | | Bank of America | | Bloomberg Commodity
Index 3 Month Forward
Total Return | | | 1.70 | % | | At
Maturity | | $ | — | | | $ | 275,641 | | |
USD | | | | | 12,514,799 | | | 11/21/19 | | Bank of America | | BofA Merrill Lynch
Commodity
MLCILP2
Total Return Strategy(a) | | | 1.78 | % | | At
Maturity | | | — | | | | 87,951 | | |
USD | | | | | 207,776,427 | | | 11/21/19 | | Bank of America | | Merrill Lynch Commodity
Index Extra CS2T
Total Return(a) | | | 1.88 | % | | At
Maturity | | | — | | | | 2,098,367 | | |
USD | | | | | 83,799,918 | | | 11/21/19 | | BNP Paribas | | Bloomberg Commodity
Index Total Return | | | 1.74 | % | | At
Maturity | | | — | | | | 812,582 | | |
USD | | | | | 101,283,886 | | | 11/21/19 | | CIBC | | Bloomberg Commodity
Index Total Return | | | 1.74 | % | | At
Maturity | | | — | | | | 982,160 | | |
USD | | | | | 20,311,981 | | | 11/21/19 | | CIBC | | Bloomberg Commodity
Index 2 Month Forward
Total Return | | | 1.79 | % | | At
Maturity | | | — | | | | 143,784 | | |
USD | | | | | 178,332,633 | | | 11/21/19 | | Citigroup | | Bloomberg Commodity
Index Total Return | | | 1.73 | % | | At
Maturity | | | — | | | | 1,534,690 | | |
USD | | | | | 169,057,341 | | | 11/21/19 | | Goldman Sachs | | Bloomberg Commodity
Index Total Return | | | 1.72 | % | | At
Maturity | | | — | | | | 1,640,201 | | |
USD | | | | | 36,183,840 | | | 11/21/19 | | Goldman Sachs | | Bloomberg Commodity
Index 2 Month Forward
Total Return | | | 1.78 | % | | At
Maturity | | | — | | | | 256,227 | | |
USD | | | | | 70,601,909 | | | 11/21/19 | | JP Morgan Chase | | Bloomberg Commodity
Index Total Return | | | 1.72 | % | | At
Maturity | | | — | | | | 521,906 | | |
USD | | | | | 15,213,077 | | | 11/21/19 | | JP Morgan Chase | | Bloomberg Commodity
Index 2 Month Forward
Total Return | | | 1.73 | % | | At
Maturity | | | — | | | | 107,896 | | |
See Accompanying Notes to Consolidated Financial Statements.
12
Credit Suisse Commodity Return Strategy Fund
Consolidated Schedule of Investments (continued)
October 31, 2019
| Commodity Index Swap Contracts (continued) | |
Currency | | Notional
Amount | | Expiration
Date | | Counterparty | | Receive
Return of the
Reference
Index | | Pay | | Payment
Frequency | | Upfront
Premiums
Paid/
(Received) | | Net Unrealized
Appreciation
(Depreciation) | |
USD | | | | $ | 19,979,056 | | | 11/21/19 | | Macquarie | | Bloomberg Commodity
Index Total Return | | | 1.71 | % | | At
Maturity | | $ | — | | | $ | 193,887 | | |
USD | | | | | 212,967,044 | | | 11/21/19 | | Macquarie | | Macquarie Commodity
Customized
Product 112T Index(b) | | | 1.88 | % | | At
Maturity | | | — | | | | 2,054,499 | | |
USD | | | | | 46,122,710 | | | 11/21/19 | | Morgan Stanley | | Bloomberg Commodity
Index 2 Month Forward
Total Return | | | 1.76 | % | | At
Maturity | | | — | | | | 397,695 | | |
USD | | | | | 104,270,923 | | | 11/21/19 | | RBC Capital | | Bloomberg Commodity
Index Total Return | | | 1.74 | % | | At
Maturity | | | — | | | | 1,011,126 | | |
USD | | | | | 58,502,619 | | | 11/21/19 | | RBC Capital | | Bloomberg Commodity
Index 2 Month Forward
Total Return | | | 1.80 | % | | At
Maturity | | | — | | | | 413,983 | | |
USD | | | | | 17,610,910 | | | 11/21/19 | | Societe Generale | | Bloomberg Commodity
Index Total Return | | | 1.73 | % | | At
Maturity | | | — | | | | 170,818 | | |
USD | | | | | 12,444,244 | | | 11/21/19 | | Societe Generale | | Bloomberg Commodity
Index 2 Month Forward
Total Return | | | 1.76 | % | | At
Maturity | | | — | | | | 88,182 | | |
USD | | | | | 168,688,423 | | | 11/21/19 | | Societe Generale | | Societe Generale
P04 TR Index(c) | | | 1.88 | % | | At
Maturity | | | — | | | | 1,596,329 | | |
USD | | | | | 78,714,174 | | | 11/21/19 | | UBS | | Bloomberg Commodity
Index Total Return | | | 1.73 | % | | At
Maturity | | | — | | | | 763,494 | | |
USD | | | | | 15,110,767 | | | 11/21/19 | | UBS | | Bloomberg Commodity
Index 2 Month Forward
Total Return | | | 1.75 | % | | At
Maturity | | | — | | | | 107,115 | | |
| | $ | 15,258,533 | | |
(a) The constituents are available at the counterparty's website.
(b) The index seeks to provide exposure to a diversified group of commodities, inclusive of energy, livestock and meat, agricultural and metals. The Fund has indirect exposure to all of the below underlying positions that make up the custom index. When applicable, the table is limited to the largest 50 positions (based on absolute market value) and any other position where the notional value for the position exceeds 1% of the notional value of the index.
Commodity Name | | Weight | | Quantity(1) | | 10/31/19 Value(1) | |
Bean Oil JAN 20 Futures | | | 3.20 | % | | | 370.72 | | | | 6,888,678 | | |
CBOT Corn MAR 20 Futures | | | 5.71 | % | | | 616.52 | | | | 12,291,789 | | |
NYMEX WTI Crude Oil JAN 20 Futures | | | 8.24 | % | | | 326.81 | | | | 17,729,266 | | |
NYBOT Cotton DEC 19 Futures | | | 1.23 | % | | | 81.91 | | | | 2,639,255 | | |
COMEX Gold DEC 19 Futures | | | 13.58 | % | | | 192.90 | | | | 29,220,938 | | |
COMEX High Grade Copper DEC 19 Futures | | | 6.94 | % | | | 226.46 | | | | 14,935,289 | | |
NYMEX Heating Oil JAN 20 Futures | | | 2.20 | % | | | 60.33 | | | | 4,733,947 | | |
NYBOT Coffee DEC 19 Futures | | | 2.31 | % | | | 129.90 | | | | 4,966,290 | | |
KCBOT Kansas Wheat MAR 20 Futures | | | 1.01 | % | | | 100.66 | | | | 2,175,607 | | |
CME Live Cattle DEC 19 Futures | | | 3.66 | % | | | 167.78 | | | | 7,867,201 | | |
ICE Brent Crude Oil FEB 20 Futures | | | 7.38 | % | | | 269.38 | | | | 15,869,335 | | |
ICE Gas Oil JAN 20 Futures | | | 2.64 | % | | | 101.19 | | | | 5,684,368 | | |
See Accompanying Notes to Consolidated Financial Statements.
13
Credit Suisse Commodity Return Strategy Fund
Consolidated Schedule of Investments (continued)
October 31, 2019
Commodity Name | | Weight | | Quantity(1) | | 10/31/19 Value(1) | |
CME Lean Hogs DEC 19 Futures | | | 1.89 | % | | | 153.75 | | | | 4,058,940 | | |
LME Aluminium JAN 20 Futures | | | 3.90 | % | | | 191.44 | | | | 8,384,883 | | |
LME Nickel MAR 20 Futures | | | 4.09 | % | | | 88.27 | | | | 8,796,426 | | |
LME Zinc MAR 20 Futures | | | 3.02 | % | | | 105.07 | | | | 6,491,880 | | |
NYMEX Nat Gas MAR 20 Futures | | | 7.52 | % | | | 630.21 | | | | 16,183,815 | | |
NYMEX Unleaded Gasoline JAN 20 Futures | | | 2.56 | % | | | 83.56 | | | | 5,516,239 | | |
CBOT Soybeans JAN 20 Futures | | | 5.75 | % | | | 265.56 | | | | 12,378,610 | | |
NYBOT Sugar MAR 20 Futures | | | 2.93 | % | | | 450.31 | | | | 6,294,308 | | |
COMEX Silver DEC 19 Futures | | | 4.20 | % | | | 99.96 | | | | 9,029,660 | | |
CBOT Soy Meal JAN 20 Futures | | | 3.11 | % | | | 218.23 | | | | 6,697,402 | | |
CBOT Wheat MAR 20 Futures | | | 2.92 | % | | | 244.30 | | | | 6,287,775 | | |
(1) Amounts represent quantity and value of index components as they relate specifically to the Fund's swap position as of October 31, 2019.
(c) The index seeks to provide exposure to a diversified group of commodities, inclusive of energy, livestock and meat, agricultural and metals. The Fund has indirect exposure to all of the below underlying positions that make up the custom index. When applicable, the table is limited to the largest 50 positions (based on absolute market value) and any other position where the notional value for the position exceeds 1% of the notional value of the index.
Commodity Name | | Weight | | Quantity(1) | | 10/31/19 Value(1) | |
LME Aluminium JAN 20 Futures | | | 3.92 | % | | | 152.32 | | | | 6,671,467 | | |
ICE Brent Crude Oil JAN 20 Futures | | | 7.54 | % | | | 215.34 | | | | 12,838,655 | | |
CBOT Bean Oil JAN 20 Futures | | | 3.19 | % | | | 292.19 | | | | 5,429,511 | | |
NYMEX WTI Crude Oil JAN 20 Futures | | | 8.44 | % | | | 265.11 | | | | 14,382,156 | | |
NYBOT Coffee DEC 19 Futures | | | 2.32 | % | | | 103.56 | | | | 3,959,267 | | |
CBOT Corn DEC 19 Futures | | | 5.63 | % | | | 491.70 | | | | 9,588,104 | | |
NYBOT Cotton DEC 19 Futures | | | 1.21 | % | | | 63.77 | | | | 2,054,594 | | |
COMEX High Grade Copper DEC 19 Futures | | | 6.89 | % | | | 177.98 | | | | 11,738,102 | | |
ICE Gas Oil JAN 20 Futures | | | 2.67 | % | | | 80.85 | | | | 4,541,913 | | |
NYMEX Heating Oil JAN 20 Futures | | | 2.24 | % | | | 48.57 | | | | 3,811,050 | | |
CME Live Cattle DEC 19 Futures | | | 3.68 | % | | | 133.70 | | | | 6,269,407 | | |
CME Lean Hogs DEC 19 Futures | | | 1.82 | % | | | 117.32 | | | | 3,097,223 | | |
NYMEX Nat Gas JAN 20 Futures | | | 7.64 | % | | | 476.11 | | | | 13,007,316 | | |
LME Nickel MAR 20 Futures | | | 4.06 | % | | | 69.41 | | | | 6,916,791 | | |
NYMEX Unleaded Gasoline JAN 20 Futures | | | 2.63 | % | | | 67.74 | | | | 4,472,063 | | |
CBOT Soy Meal JAN 20 Futures | | | 3.07 | % | | | 170.20 | | | | 5,223,370 | | |
CBOT Soybeans JAN 20 Futures | | | 5.70 | % | | | 208.40 | | | | 9,714,174 | | |
NYBOT Sugar MAR 20 Futures | | | 2.89 | % | | | 351.88 | | | | 4,918,418 | | |
KCBOT Kansas Wheat DEC 19 Futures | | | 1.01 | % | | | 82.15 | | | | 1,724,087 | | |
CBOT Wheat MAR 20 Futures | | | 2.92 | % | | | 193.48 | | | | 4,979,749 | | |
COMEX Silver DEC 19 Futures | | | 4.14 | % | | | 78.06 | | | | 7,051,379 | | |
COMEX Gold DEC 19 Futures | | | 13.37 | % | | | 150.37 | | | | 22,777,710 | | |
LME Zinc MAR 20 Futures | | | 3.03 | % | | | 83.55 | | | | 5,162,039 | | |
(1) Amounts represent quantity and value of index components as they relate specifically to the Fund's swap position as of October 31, 2019.
See Accompanying Notes to Consolidated Financial Statements.
14
Credit Suisse Commodity Return Strategy Fund
Consolidated Statement of Assets and Liabilities
October 31, 2019
Assets | |
Investments at value (Cost $1,595,709,261) (Note 2) | | $ | 1,594,797,711 | | |
Cash | | | 78,249,876 | | |
Cash segregated held at brokers for futures contracts and swap contracts (Note 2) | | | 37,124,813 | | |
Receivable for Investments sold | | | 41,170,669 | | |
Unrealized appreciation on open swap contracts (Note 2) | | | 15,258,533 | | |
Interest receivable | | | 4,161,056 | | |
Receivable for Fund shares sold | | | 1,767,281 | | |
Prepaid expenses and other assets | | | 53,363 | | |
Total assets | | | 1,772,583,302 | | |
Liabilities | |
Investment advisory fee payable (Note 3) | | | 839,157 | | |
Administrative services fee payable (Note 3) | | | 51,669 | | |
Shareholder servicing/Distribution fee payable (Note 3) | | | 12,775 | | |
Payable for investments purchased | | | 46,062,277 | | |
Payable for Fund shares redeemed | | | 43,016,665 | | |
Variation margin payable on futures contracts (Note 2) | | | 28,710 | | |
Trustees' fee payable | | | 16,998 | | |
Accrued expenses | | | 543,949 | | |
Total liabilities | | | 90,572,200 | | |
Net Assets | |
Capital stock, $.001 par value (Note 6) | | | 370,794 | | |
Paid-in capital (Note 6) | | | 1,891,569,520 | | |
Total distributable earnings (loss) | | | (209,929,212 | ) | |
Net assets | | $ | 1,682,011,102 | | |
I Shares | |
Net assets | | $ | 1,634,168,629 | | |
Shares outstanding | | | 359,972,735 | | |
Net asset value, offering price and redemption price per share | | $ | 4.54 | | |
A Shares | |
Net assets | | $ | 44,468,586 | | |
Shares outstanding | | | 10,012,665 | | |
Net asset value and redemption price per share | | $ | 4.44 | | |
Maximum offering price per share (net asset value/(1-4.75%)) | | $ | 4.66 | | |
C Shares | |
Net assets | | $ | 3,373,887 | | |
Shares outstanding | | | 808,201 | | |
Net asset value and offering price per share | | $ | 4.17 | | |
See Accompanying Notes to Consolidated Financial Statements.
15
Credit Suisse Commodity Return Strategy Fund
Consolidated Statement of Operations
For the Year Ended October 31, 2019
Investment Income | |
Interest | | $ | 51,775,869 | | |
Securities lending (net of rebates) | | | 2,518 | | |
Total investment income | | | 51,778,387 | | |
Expenses | |
Investment advisory fees (Note 3) | | | 12,694,149 | | |
Administrative services fees (Note 3) | | | 339,352 | | |
Shareholder servicing/Distribution fees (Note 3) | |
Class A | | | 223,875 | | |
Class C | | | 44,057 | | |
Transfer agent fees (Note 3) | | | 3,011,501 | | |
Printing fees | | | 186,450 | | |
Registration fees | | | 130,425 | | |
Custodian fees | | | 124,136 | | |
Insurance expense | | | 74,234 | | |
Trustees' fees | | | 61,767 | | |
Audit and tax fees | | | 61,632 | | |
Legal fees | | | 60,425 | | |
Commitment fees (Note 4) | | | 34,606 | | |
Miscellaneous expense | | | 38,419 | | |
Total expenses | | | 17,085,028 | | |
Net investment income | | | 34,693,359 | | |
Net Realized and Unrealized Gain (Loss) from Investments, Futures Contracts and Swap Contracts | |
Net realized gain from investments | | | 673,815 | | |
Net realized loss from futures contracts | | | (22,841 | ) | |
Net realized loss from swap contracts | | | (185,793,544 | ) | |
Net change in unrealized appreciation (depreciation) from investments | | | (2,260,378 | ) | |
Net change in unrealized appreciation (depreciation) from futures contracts | | | 815,676 | | |
Net change in unrealized appreciation (depreciation) from swap contracts | | | 81,325,382 | | |
Net realized and unrealized loss from investments, futures contracts and swap contracts | | | (105,261,890 | ) | |
Net decrease in net assets resulting from operations | | $ | (70,568,531 | ) | |
See Accompanying Notes to Consolidated Financial Statements.
16
Credit Suisse Commodity Return Strategy Fund
Consolidated Statements of Changes in Net Assets
| | | For the Year
Ended
October 31, 2019 | | For the Year
Ended
October 31, 2018 | |
From Operations | |
Net investment income | | $ | 34,693,359 | | | $ | 34,182,546 | | |
Net realized loss from investments, futures contracts and swap contracts | | | (185,142,570 | ) | | | (48,204,917 | ) | |
Net change in unrealized appreciation (depreciation) from investments,
futures contracts and swap contracts | | | 79,880,680 | | | | (72,548,613 | ) | |
Net decrease in net assets resulting from operations | | | (70,568,531 | ) | | | (86,570,984 | ) | |
From Distributions | |
From distributable earnings | |
Class I | | | (27,184,125 | ) | | | (110,199,957 | ) | |
Class A | | | (867,010 | ) | | | (2,626,381 | ) | |
Class C | | | (15,463 | ) | | | (107,870 | ) | |
Net decrease in net assets resulting from dividends | | | (28,066,598 | ) | | | (112,934,208 | ) | |
| From Capital Share Transactions (Note 6) | |
Proceeds from sale of shares | | | 1,021,883,081 | | | | 1,142,029,980 | | |
Reinvestment of dividends | | | 15,834,996 | | | | 76,767,968 | | |
Net asset value of shares redeemed | | | (2,002,760,382 | ) | | | (1,755,696,347 | ) | |
Net decrease in net assets from capital share transactions | | | (965,042,305 | ) | | | (536,898,399 | ) | |
Net decrease in net assets | | | (1,063,677,434 | ) | | | (736,403,591 | ) | |
Net Assets | |
Beginning of year | | | 2,745,688,536 | | | | 3,482,092,127 | | |
End of year | | $ | 1,682,011,102 | | | $ | 2,745,688,536 | | |
See Accompanying Notes to Consolidated Financial Statements.
17
Credit Suisse Commodity Return Strategy Fund
Consolidated Financial Highlights
(For a Class I Share of the Fund Outstanding Throughout Each Year)
| | | For the Year Ended October 31, | |
| | | 2019 | | 2018 | | 2017 | | 2016 | | 2015 | |
Per share data | |
Net asset value, beginning of year | | $ | 4.75 | | | $ | 5.04 | | | $ | 4.91 | | | $ | 5.02 | | | $ | 6.76 | | |
INVESTMENT OPERATIONS | |
Net investment income (loss)1 | | | 0.07 | | | | 0.05 | | | | 0.01 | | | | (0.01 | ) | | | (0.03 | ) | |
Net gain (loss) from investments, futures
contracts and swap contracts
(both realized and unrealized) | | | (0.22 | ) | | | (0.17 | ) | | | 0.12 | | | | (0.10 | ) | | | (1.71 | ) | |
Total from investment operations | | | (0.15 | ) | | | (0.12 | ) | | | 0.13 | | | | (0.11 | ) | | | (1.74 | ) | |
LESS DIVIDENDS | |
Dividends from net investment income | | | (0.06 | ) | | | (0.17 | ) | | | — | | | | — | | | | — | | |
Total dividends | | | (0.06 | ) | | | (0.17 | ) | | | — | | | | — | | | | — | | |
Net asset value, end of year | | $ | 4.54 | | | $ | 4.75 | | | $ | 5.04 | | | $ | 4.91 | | | $ | 5.02 | | |
Total return2 | | | (3.13 | )% | | | (2.48 | )% | | | 2.65 | % | | | (2.19 | )% | | | (25.74 | )% | |
RATIOS AND SUPPLEMENTAL DATA | |
Net assets, end of year (000s omitted) | | $ | 1,634,169 | | | $ | 2,654,009 | | | $ | 3,383,007 | | | $ | 3,874,976 | | | $ | 5,103,563 | | |
Ratio of net expenses to average net assets | | | 0.78 | % | | | 0.78 | % | | | 0.79 | % | | | 0.79 | % | | | 0.78 | % | |
Ratio of net investment income (loss) to
average net assets | | | 1.62 | % | | | 1.02 | % | | | 0.23 | % | | | (0.16 | )% | | | (0.48 | )% | |
Portfolio turnover rate | | | 130 | % | | | 90 | % | | | 86 | % | | | 151 | % | | | 122 | % | |
1 Per share information is calculated using the average shares outstanding method.
2 Total returns are historical and include change in share price and reinvestment of all dividends and distributions.
See Accompanying Notes to Consolidated Financial Statements.
18
Credit Suisse Commodity Return Strategy Fund
Consolidated Financial Highlights
(For a Class A Share of the Fund Outstanding Throughout Each Year)
| | | For the Year Ended October 31, | |
| | | 2019 | | 2018 | | 2017 | | 2016 | | 2015 | |
Per share data | |
Net asset value, beginning of year | | $ | 4.64 | | | $ | 4.93 | | | $ | 4.81 | | | $ | 4.93 | | | $ | 6.65 | | |
INVESTMENT OPERATIONS | |
Net investment income (loss)1 | | | 0.06 | | | | 0.04 | | | | (0.00 | )2 | | | (0.02 | ) | | | (0.04 | ) | |
Net gain (loss) from investments, futures
contracts and swap contracts
(both realized and unrealized) | | | (0.21 | ) | | | (0.18 | ) | | | 0.12 | | | | (0.10 | ) | | | (1.68 | ) | |
Total from investment operations | | | (0.15 | ) | | | (0.14 | ) | | | 0.12 | | | | (0.12 | ) | | | (1.72 | ) | |
LESS DIVIDENDS | |
Dividends from net investment income | | | (0.05 | ) | | | (0.15 | ) | | | — | | | | — | | | | — | | |
Total dividends | | | (0.05 | ) | | | (0.15 | ) | | | — | | | | — | | | | — | | |
Net asset value, end of year | | $ | 4.44 | | | $ | 4.64 | | | $ | 4.93 | | | $ | 4.81 | | | $ | 4.93 | | |
Total return3 | | | (3.24 | )% | | | (2.97 | )% | | | 2.49 | % | | | (2.43 | )% | | | (25.86 | )% | |
RATIOS AND SUPPLEMENTAL DATA | |
Net assets, end of year (000s omitted) | | $ | 44,469 | | | $ | 86,467 | | | $ | 93,047 | | | $ | 94,484 | | | $ | 132,417 | | |
Ratio of net expenses to average net assets | | | 1.03 | % | | | 1.03 | % | | | 1.04 | % | | | 1.04 | % | | | 1.03 | % | |
Ratio of net investment income (loss) to
average net assets | | | 1.38 | % | | | 0.78 | % | | | (0.01 | )% | | | (0.42 | )% | | | (0.73 | )% | |
Portfolio turnover rate | | | 130 | % | | | 90 | % | | | 86 | % | | | 151 | % | | | 122 | % | |
1 Per share information is calculated using the average shares outstanding method.
2 This amount represents less than $0.01 per share.
3 Total returns are historical and include change in share price, reinvestment of all dividends and distributions and no sales charge.
See Accompanying Notes to Consolidated Financial Statements.
19
Credit Suisse Commodity Return Strategy Fund
Consolidated Financial Highlights
(For a Class C Share of the Fund Outstanding Throughout Each Year)
| | | For the Year Ended October 31, | |
| | | 2019 | | 2018 | | 2017 | | 2016 | | 2015 | |
Per share data | |
Net asset value, beginning of year | | $ | 4.37 | | | $ | 4.61 | | | $ | 4.54 | | | $ | 4.68 | | | $ | 6.37 | | |
INVESTMENT OPERATIONS | |
Net investment income (loss)1 | | | 0.03 | | | | 0.002 | | | | (0.04 | ) | | | (0.05 | ) | | | (0.08 | ) | |
Net gain (loss) from investments, futures
contracts and swap contracts
(both realized and unrealized) | | | (0.21 | ) | | | (0.15 | ) | | | 0.11 | | | | (0.09 | ) | | | (1.61 | ) | |
Total from investment operations | | | (0.18 | ) | | | (0.15 | ) | | | 0.07 | | | | (0.14 | ) | | | (1.69 | ) | |
LESS DIVIDENDS | |
Dividends from net investment income | | | (0.02 | ) | | | (0.09 | ) | | | — | | | | — | | | | — | | |
Total dividends | | | (0.02 | ) | | | (0.09 | ) | | | — | | | | — | | | | — | | |
Net asset value, end of year | | $ | 4.17 | | | $ | 4.37 | | | $ | 4.61 | | | $ | 4.54 | | | $ | 4.68 | | |
Total return3 | | | (4.23 | )% | | | (3.42 | )% | | | 1.54 | % | | | (2.99 | )% | | | (26.53 | )% | |
RATIOS AND SUPPLEMENTAL DATA | |
Net assets, end of year (000s omitted) | | $ | 3,374 | | | $ | 5,213 | | | $ | 6,038 | | | $ | 6,516 | | | $ | 8,155 | | |
Ratio of net expenses to average net assets | | | 1.78 | % | | | 1.78 | % | | | 1.79 | % | | | 1.79 | % | | | 1.78 | % | |
Ratio of net investment income (loss) to
average net assets | | | 0.62 | % | | | 0.02 | % | | | (0.77 | )% | | | (1.16 | )% | | | (1.49 | )% | |
Portfolio turnover rate | | | 130 | % | | | 90 | % | | | 86 | % | | | 151 | % | | | 122 | % | |
1 Per share information is calculated using the average shares outstanding method.
2 This amount represents less than $0.01 per share.
3 Total returns are historical and include change in share price, reinvestment of all dividends and distributions and no sales charge.
See Accompanying Notes to Consolidated Financial Statements.
20
Credit Suisse Commodity Return Strategy Fund
Notes to Consolidated Financial Statements
October 31, 2019
Credit Suisse Commodity Return Strategy Fund (the "Fund"), a series of Credit Suisse Commodity Strategy Funds (the "Trust"), a Delaware statutory trust, is registered under the Investment Company Act of 1940, as amended (the "1940 Act"), as a non-diversified open-end management investment company that seeks total return that exceeds the return of its benchmark index, the Bloomberg Commodity Index Total Return (the "Benchmark"). The Trust was organized under the laws of the State of Delaware as a statutory trust on May 19, 2004.
Credit Suisse Asset Management, LLC ("Credit Suisse"), the investment adviser to the Fund, is registered as an investment adviser with the Securities and Exchange Commission and as a Commodity Pool Operator with the Commodity Futures Trading Commission. The Fund intends to gain exposure to commodity derivatives through investing in a wholly-owned subsidiary, Credit Suisse Cayman Commodity Fund I, Ltd. (the "Subsidiary"), organized under the laws of the Cayman Islands. The Subsidiary invests in commodity-linked derivative instruments, such as swaps and futures. The Subsidiary may also invest in debt securities, some of which are intended to serve as margin or collateral for the Subsidiary's derivatives positions.
The Subsidiary is managed by the same portfolio managers that manage the Fund and the accompanying financial statements reflect the financial position of the Fund and the Subsidiary and the results of operations on a consolidated basis. The consolidated financial statements include portfolio holdings of the Fund and the Subsidiary and all intercompany transactions and balances have been eliminated. The Fund may invest up to 25% of its total assets in the Subsidiary. As of October 31, 2019, the Fund held $328,621,524 in the Subsidiary, representing 19.5% of the Fund's consolidated net assets. For the year ended October 31, 2019, the net realized loss on securities and other financial instruments held in the Subsidiary was $185,859,917.
Subsequent references to the Fund within the Notes to Consolidated Financial Statements collectively refer to the Fund and the Subsidiary.
The Fund offers three classes of shares: Class I shares, Class A shares and Class C shares. Each class of shares represents an equal pro rata interest in the Fund, except the share classes bear different expenses. Class A shares are sold subject to a front-end sales charge of up to 4.75%. Class C shares are sold subject to a contingent deferred sales charge ("CDSC") of 1.00% if the shares are redeemed within the first year of purchase. Class I shares are sold without a sales charge.
21
Credit Suisse Commodity Return Strategy Fund
Notes to Consolidated Financial Statements (continued)
October 31, 2019
Note 2. Significant Accounting Policies
The following is a summary of significant accounting policies followed by the Fund in the preparation of its consolidated financial statements. The policies are in accordance with generally accepted accounting principles in the United States of America ("GAAP"). The preparation of consolidated financial statements requires management to make estimates and assumptions that affect the reported amounts and disclosures in the consolidated financial statements. Actual results could differ from those estimates. The Fund is considered an investment company for financial reporting purposes under GAAP and follows the accounting and reporting guidance in Financial Accounting Standards Board ("FASB") Accounting Standards Codification ("ASC") Topic 946 — Financial Services — Investment Companies.
A) SECURITY VALUATION — The Board of Trustees (the "Board") is responsible for the Fund's valuation process. The Board has delegated the supervision of the daily valuation process to Credit Suisse Asset Management, LLC, the Fund's investment adviser ("Credit Suisse" or the "Adviser"), who has established a Pricing Committee which, pursuant to the policies adopted by the Board, is responsible for making fair valuation determinations and overseeing the Fund's pricing policies. The net asset value of the Fund is determined daily as of the close of regular trading on the New York Stock Exchange, Inc. (the "Exchange") on each day the Exchange is open for business. The valuations for fixed income securities (which may include, but are not limited to, corporate, government, municipal, mortgage-backed, collateralized mortgage obligations and asset-backed securities) and certain derivative instruments are typically the prices supplied by independent third party pricing services, which may use market prices or broker/dealer quotations or a variety of valuation techniques and methodologies. The independent third party pricing services use inputs that are observable such as issuer details, interest rates, yield curves, prepayment speeds, credit risks/spreads, default rates and quoted prices for similar securities. These pricing services generally price fixed income securities assuming orderly transactions of an institutional "round lot" size, but some trades occur in smaller "odd lot" sizes which may be affected at lower prices than institutional round lot trades. Structured note agreements are valued in accordance with a dealer-supplied valuation based on changes in the value of the underlying index. Futures contracts are valued daily at the settlement price established by the board of trade or exchange on which they are traded. Forward contracts are valued at the London closing spot rates and the London closing forward point rates on a daily basis. The currency forward contract pricing model derives the differential in point rates to the expiration date of the forward and calculates its present value. Equity
22
Credit Suisse Commodity Return Strategy Fund
Notes to Consolidated Financial Statements (continued)
October 31, 2019
Note 2. Significant Accounting Policies (continued)
securities for which market quotations are available are valued at the last reported sales price or official closing price on the primary market or exchange on which they trade. The Fund may utilize a service provided by an independent third party which has been approved by the Board to fair value certain securities. When fair value pricing is employed, the prices of securities used by the Fund to calculate its net asset value may differ from quoted or published prices for the same securities. If independent third party pricing services are unable to supply prices for a portfolio investment, or if the prices supplied are deemed by the investment adviser to be unreliable, the market price may be determined by the investment adviser using quotations from one or more brokers/dealers or at the transaction price if the security has recently been purchased and no value has yet been obtained from a pricing service or pricing broker. When reliable prices are not readily available, such as when the value of a security has been significantly affected by events after the close of the exchange or market on which the security is principally traded, but before the Fund calculates its net asset value, these securities will be fair valued in good faith by the Pricing Committee, in accordance with procedures adopted by the Board.
The Fund uses valuation techniques to measure fair value that are consistent with the market approach and/or income approach, depending on the type of security and the particular circumstance. The market approach uses prices and other relevant information generated by market transactions involving identical or comparable securities. The income approach uses valuation techniques to discount estimated future cash flows to present value.
GAAP established a disclosure hierarchy that categorizes the inputs to valuation techniques used to value assets and liabilities at each measurement date. These inputs are summarized in the three broad levels listed below:
• Level 1 – quoted prices in active markets for identical investments
• Level 2 – other significant observable inputs (including quoted prices for similar investments, interest rates, prepayment speeds, credit risk, etc.)
• Level 3 – significant unobservable inputs (including the Fund's own assumptions in determining the fair value of investments)
The inputs or methodologies used to value securities are not necessarily an indication of the risk associated with investing in those securities.
23
Credit Suisse Commodity Return Strategy Fund
Notes to Consolidated Financial Statements (continued)
October 31, 2019
Note 2. Significant Accounting Policies (continued)
The following is a summary of the inputs used as of October 31, 2019 in valuing the Fund's assets and liabilities carried at fair value:
Assets | | Level 1 | | Level 2 | | Level 3 | | Total | |
Investments in Securities | |
United States Agency Obligations | | $ | — | | | $ | 1,156,301,720 | | | $ | — | | | $ | 1,156,301,720 | | |
United States Treasury Obligations | | | — | | | | 438,495,991 | | | | — | | | | 438,495,991 | | |
| | | $ | — | | | $ | 1,594,797,711 | | | $ | — | | | $ | 1,594,797,711 | | |
Other Financial Instruments* | |
Futures Contracts | | $ | 107,539 | | | $ | — | | | $ | — | | | $ | 107,539 | | |
Swap Contracts** | | | — | | | | 15,258,533 | | | | — | | | | 15,258,533 | | |
Liabilities | | Level 1 | | Level 2 | | Level 3 | | Total | |
Other Financial Instruments* | |
Futures Contracts | | $ | 145,446 | | | $ | — | | | $ | — | | | $ | 145,446 | | |
* Other financial instruments include unrealized appreciation/(depreciation) on futures and swap contracts.
** Value includes any premium paid or received with respect to swap contracts, if applicable.
For the year ended October 31, 2019, there were no transfers among Level 2 and Level 3. All transfers, if any, are assumed to occur at the end of the reporting period.
B) DERIVATIVE INSTRUMENTS AND HEDGING ACTIVITIES — The Fund adopted amendments to authoritative guidance on disclosures about derivative instruments and hedging activities which require that a fund disclose (a) how and why an entity uses derivative instruments, (b) how derivative instruments and hedging activities are accounted for and (c) how derivative instruments and related hedging activities affect a fund's financial position, financial performance and cash flows. For the year ended October 31, 2019, the Fund's derivatives did not qualify for hedge accounting as they are held at fair value.
The following table presents the fair value and the location of derivatives within the Consolidated Statement of Assets and Liabilities at October 31, 2019 and the effect of these derivatives on the Consolidated Statement of Operations for the year ended October 31, 2019.
24
Credit Suisse Commodity Return Strategy Fund
Notes to Consolidated Financial Statements (continued)
October 31, 2019
Note 2. Significant Accounting Policies (continued)
| Primary Underlying Risk | | Derivative
Assets(1) | | Derivative
Liabilities(1) | | Realized
Gain (Loss) | | Change in Unrealized
Appreciation
(Depreciation) | |
Commodity price | |
Futures contracts(2) | | $ | 107,539 | | | $ | 145,446 | | | $ | (22,841 | ) | | $ | 815,676 | | |
Total return swap contracts(3) | | | 15,258,533 | | | | — | | | | (185,793,544 | ) | | | 81,325,383 | | |
| | | $ | 15,366,072 | | | $ | 145,446 | | | $ | (185,816,385 | ) | | $ | 82,141,059 | | |
(1) Generally, the balance sheet location for asset derivatives is receivables/net unrealized appreciation (depreciation) and for liability derivatives is payables/net unrealized appreciation (depreciation).
(2) Includes cumulative appreciation (depreciation) of futures contracts as reported in the Schedule of Investments. Only variation margin is reported within the receivables and/or payables on the Statement of Assets and Liabilities.
(3) Includes cumulative appreciation (depreciation) of total return swap contracts as reported in the Schedule of Investments. Only variation margin is reported within the receivables and/or payables on the Statement of Assets and Liabilities.
The notional amount of futures contracts and swap contracts open at October 31, 2019 is reflected in the Consolidated Schedule of Investments. For the year ended October 31, 2019, the Fund held average monthly notional values on a net basis of $14,634,943, $13,883,285 and $2,168,238,901 in long futures contracts, short futures contracts and swap contracts, respectively.
The Fund is a party to International Swap and Derivatives Association, Inc. ("ISDA") Master Agreements ("Master Agreements") with certain counterparties that govern over-the-counter derivative (including Total Return, Credit Default and Interest Rate Swaps) and foreign exchange contracts entered into by the Fund. The Master Agreements may contain provisions regarding, among other things, the parties' general obligations, representations, agreements, collateral requirements, events of default and early termination. Termination events applicable to the Fund may occur upon a decline in the Fund's net assets below a specified threshold over a certain period of time.
The following table presents by counterparty the Fund's derivative assets, net of related collateral held by the Fund, at October 31, 2019:
| Counterparty | | Gross Amount of
Assets Presented in
the Consolidated
Statement of Assets
and Liabilities(a) | | Financial
Instruments
and Derivatives
Available for Offset | | Non-Cash
Collateral
Received(b) | | Cash
Collateral
Received(b) | | Net Amount
of Derivative
Assets | |
Bank of America | | $ | 2,461,959 | | | $ | — | | | $ | — | | | $ | — | | | $ | 2,461,959 | | |
BNP Paribas | | | 812,582 | | | | — | | | | — | | | | — | | | | 812,582 | | |
CIBC | | | 1,125,944 | | | | — | | | | — | | | | — | | | | 1,125,944 | | |
Citigroup | | | 1,534,690 | | | | — | | | | — | | | | — | | | | 1,534,690 | | |
Goldman Sachs | | | 1,896,428 | | | | — | | | | — | | | | — | | | | 1,896,428 | | |
JP Morgan Chase | | | 629,802 | | | | — | | | | — | | | | — | | | | 629,802 | | |
Macquarie | | | 2,248,386 | | | | — | | | | — | | | | — | | | | 2,248,386 | | |
Morgan Stanley | | | 397,695 | | | | — | | | | — | | | | — | | | | 397,695 | | |
RBC Capital | | | 1,425,109 | | | | — | | | | — | | | | — | | | | 1,425,109 | | |
25
Credit Suisse Commodity Return Strategy Fund
Notes to Consolidated Financial Statements (continued)
October 31, 2019
Note 2. Significant Accounting Policies (continued)
| Counterparty | | Gross Amount of
Assets Presented in
the Consolidated
Statement of Assets
and Liabilities(a) | | Financial
Instruments
and Derivatives
Available for Offset | | Non-Cash
Collateral
Received(b) | | Cash
Collateral
Received(b) | | Net Amount
of Derivative
Assets | |
Societe Generale | | $ | 1,855,329 | | | $ | — | | | $ | — | | | $ | — | | | $ | 1,855,329 | | |
UBS | | | 870,609 | | | | — | | | | — | | | | — | | | | 870,609 | | |
| | | $ | 15,258,533 | | | $ | — | | | $ | — | | | $ | — | | | $ | 15,258,533 | | |
(a) Swap contracts are included.
(b) The actual collateral pledged may be more than the amounts shown.
C) SECURITY TRANSACTIONS AND INVESTMENT INCOME/EXPENSE — Security transactions are accounted for on a trade date basis. Interest income/expense is recorded on the accrual basis. The Fund amortizes premiums and accretes discounts using the effective interest method. Dividend income/expense is recorded on the ex-dividend date. Certain expenses are class-specific expenses, vary by class and are charged only to that class. Income, expenses (excluding class-specific expenses) and realized/unrealized gains/losses are allocated proportionately to each class of shares based upon the relative net asset value of the outstanding shares of that class. The cost of investments sold is determined by use of the specific identification method for both financial reporting and income tax purposes. To the extent any issuer defaults or a credit event occurs that impacts the issuer, the Fund may halt any additional interest income accruals and consider the realizability of interest accrued up to the date of default or credit event.
D) DIVIDENDS AND DISTRIBUTIONS TO SHAREHOLDERS — Dividends from net investment income, if any, are declared and paid quarterly. Distributions of net realized capital gains, if any, are declared and paid at least annually. However, to the extent that a net realized capital gain can be reduced by a capital loss carryforward, such gain will not be distributed. Dividends and distributions to shareholders of the Fund are recorded on the ex-dividend date and are determined in accordance with federal income tax regulations, which may differ from GAAP.
E) FEDERAL AND OTHER TAXES — No provision is made for federal taxes as it is the Fund's intention to continue to qualify as a regulated investment company ("RIC") under the Internal Revenue Code of 1986, as amended (the "Code"), and to make the requisite distributions to its shareholders, which will be sufficient to relieve it from federal income and excise taxes.
In order to qualify as a RIC under the Code, the Fund must meet certain requirements regarding the source of its income, the diversification of its assets
26
Credit Suisse Commodity Return Strategy Fund
Notes to Consolidated Financial Statements (continued)
October 31, 2019
Note 2. Significant Accounting Policies (continued)
and the distribution of its income. One of these requirements is that the Fund derive at least 90% of its gross income for each taxable year from dividends, interest, payments with respect to certain securities loans, gains from the sale or other disposition of stock, securities or foreign currencies, other income derived with respect to its business of investing in such stock, securities or currencies or net income derived from interests in certain publicly-traded partnerships ("Qualifying Income").
The Fund may invest in structured notes designed to track the performance of the Benchmark. The Fund may, through its investment in the Subsidiary, invest in commodity-linked swaps and/or futures contracts.
If the Fund is unable to ensure continued qualification as a RIC, the Fund may be required to change its investment objective, policies or techniques, or may be liquidated. If the Fund fails to qualify as a RIC, the Fund will be subject to federal income tax on its net income and capital gains at regular corporate rates (without reduction for distributions to shareholders). If the Fund were to fail to qualify as a RIC and become subject to federal income tax, shareholders of the Fund would be subject to the risk of diminished returns.
The Fund adopted the authoritative guidance for uncertainty in income taxes and recognizes a tax benefit or liability from an uncertain position only if it is more likely than not that the position is sustainable based solely on its technical merits and consideration of the relevant taxing authority's widely understood administrative practices and procedures. The Fund has reviewed its current tax positions and has determined that no provision for income tax is required in the Fund's financial statements. The Fund's federal and state income and federal excise tax returns for tax years for which the applicable statutes of limitations have not expired are subject to examination by the Internal Revenue Service and state departments of revenue.
F) CASH — The Fund's uninvested cash balance is held in an interest bearing variable rate demand deposit account at State Street Bank and Trust Company ("SSB"), the Fund's custodian.
G) FUTURES — The Fund may enter into futures contracts to the extent permitted by its investment policies and objectives. The Fund may use futures contracts to gain exposure to or hedge against changes in commodities. Upon entering into a futures contract, the Fund is required to deposit cash and/or pledge U.S. Government securities as initial margin with a Futures Commission Merchant ("FCM"). Subsequent payments, which are dependent on the daily fluctuations in the value of the underlying instrument, are made or received by
27
Credit Suisse Commodity Return Strategy Fund
Notes to Consolidated Financial Statements (continued)
October 31, 2019
Note 2. Significant Accounting Policies (continued)
the Fund each day (daily variation margin) and are recorded as unrealized gains or losses in the Consolidated Statement of Operations until the contracts are closed. When the contracts are closed, the Fund records a realized gain or loss equal to the difference between the proceeds from (or cost of) the closing transaction and the Fund's basis in the contract. Risks of entering into futures contracts for hedging purposes include the possibility that a change in the value of the contract may not correlate with the changes in the value of the underlying instruments. Futures have minimal counterparty credit risk because futures are exchange traded and the exchange's clearinghouse, as counterparty to all exchange-traded futures, guarantees the futures against default. In addition, the purchase of a futures contract involves the risk that the Fund could lose more than the original margin deposit and subsequent payments may be required for a futures transaction. The Fund's open futures contracts are disclosed in the Consolidated Schedule of Investments. At October 31, 2019, the amount of restricted cash held at brokers related to open futures contracts was $0.
The Commodity Exchange Act requires an FCM to segregate all customer transactions and assets from the FCM's proprietary activities. A customer's cash and other equity deposited with an FCM are considered commingled with all other customer funds subject to the FCM's segregation requirements. In the event of an FCM's insolvency, recovery may be limited to the Fund's pro-rata share of segregated customer funds available. It is possible that the recovery amount could be less than the total of cash and other equity deposited.
H) SWAPS — The Fund may enter into commodity index swaps either for hedging purposes or to seek to increase total return. A swap contract is an agreement that obligates two parties to exchange a series of cash flows at specified intervals based upon or calculated by reference to changes in specified prices or rates for a specified amount of an underlying asset or notional principal amount. The Fund will enter into swap contracts only on a net basis, which means that the two payment streams are netted out, with the Fund receiving or paying, as the case may be, only the net amount of the two payments. Risks may arise as a result of the failure of the counterparty to the swap contract to comply with the terms of the swap contract. The extent of the Fund's exposure to credit and counterparty risks is the discounted net value of the cash flows to be received from the counterparty over the contract's remaining life, to the extent that the amount is positive. These risks are mitigated by having a master netting arrangement between the Fund and the counterparty and by the posting of collateral by the counterparty to the Fund to cover the Fund's exposure to the counterparty. Therefore, the Fund considers the creditworthiness of each counterparty as well as the amounts posted by
28
Credit Suisse Commodity Return Strategy Fund
Notes to Consolidated Financial Statements (continued)
October 31, 2019
Note 2. Significant Accounting Policies (continued)
the counterparty pursuant to the master netting agreement to a swap contract in evaluating potential credit risk. Additionally, risks may arise from unanticipated movements in interest rates or in the value of the underlying reference asset or index.
The Fund may enter into total return swap contracts, involving commitments to pay interest in exchange for a market-linked return, both based on notional amounts. The Fund may invest in total return swap contracts for hedging purposes or to seek to increase total return. To the extent the total return of the security or index underlying the transaction exceeds or falls short of the offsetting interest rate obligation, the Fund will receive a payment from or make a payment to the counterparty.
The Fund records unrealized gains or losses on a daily basis representing the value and the current net receivable or payable relating to open swap contracts. Net amounts received or paid on the swap contract are recorded as realized gains or losses. Fluctuations in the value of swap contracts are recorded for financial statement purposes as unrealized appreciation or depreciation from swap contracts. Realized gains and losses from terminated swaps are included in net realized gains/losses from swap contracts. The Fund's open swap contracts are disclosed in the Consolidated Schedule of Investments. At October 31, 2019, the amount of restricted cash held at brokers related to open swap contracts was $37,124,813.
I) SECURITIES LENDING — The initial collateral received by the Fund is required to have a value of at least 102% of the market value of domestic securities on loan (including any accrued interest thereon) and 105% of the market value of foreign securities on loan (including any accrued interest thereon). The collateral is maintained thereafter at a value equal to at least 102% of the current market value of the securities on loan. The market value of loaned securities is determined at the close of each business day of the Fund and any additional required collateral is delivered to the Fund, or excess collateral returned by the Fund, on the next business day. Cash collateral received by the Fund in connection with securities lending activity may be pooled together with cash collateral for other funds/portfolios advised by Credit Suisse and may be invested in a variety of investments, including funds advised by SSB, the Fund's securities lending agent, or money market instruments. However, in the event of default or bankruptcy by the other party to the agreement, realization and/or retention of the collateral may be subject to legal proceedings.
29
Credit Suisse Commodity Return Strategy Fund
Notes to Consolidated Financial Statements (continued)
October 31, 2019
Note 2. Significant Accounting Policies (continued)
SSB has been engaged by the Fund to act as the Fund's securities lending agent. The Fund's securities lending arrangement provides that the Fund and SSB will share the net income earned from securities lending activities. Securities lending income is accrued as earned. At October 31, 2019, there were no securities out on loan.
During the year ended October 31, 2019, total earnings from the Fund's investment in cash collateral received in connection with securities lending arrangements was $43,548, of which $40,190 was rebated to borrowers (brokers). The Fund retained $2,518 in income from the cash collateral investment, and SSB, as lending agent, was paid $839. Securities lending income is accrued as earned.
J) OTHER — In the normal course of business the Fund trades financial instruments and enters into financial transactions for which risk of potential loss exists due to changes in the market (market risk) or failure of the other party to a transaction to perform (credit risk). Similar to credit risk, the Fund may be exposed to counterparty risk, including securities lending, or the risk that an institution or other entity with which the Fund has unsettled or open transactions will default. The potential loss could exceed the value of the financial assets recorded in the consolidated financial statements. Financial assets, which potentially expose the Fund to credit risk, consist principally of cash due from counterparties and investments. The extent of the Fund's exposure to credit and counterparty risks in respect to these financial assets approximates their carrying value as recorded in the Fund's Consolidated Statement of Assets and Liabilities.
K) RECENT ACCOUNTING PRONOUNCEMENTS — In August 2018, the FASB issued Accounting Standards Update 2018-13, Fair Value Measurement (Topic 820): Disclosure Framework — Changes to the Disclosure Requirements for Fair Value Measurement ("ASU 2018-13"). The update provides guidance that eliminates, adds and modifies certain disclosure requirements for fair value measurements. ASU 2018-13 will be effective for annual periods beginning after December 15, 2019. Management is currently assessing the potential impact of these changes to future financial statements.
L) SUBSEQUENT EVENTS — In preparing the financial statements as of October 31, 2019, management considered the impact of subsequent events for potential recognition or disclosure in these financial statements through the date of release of this report. No such events requiring recognition or disclosure were identified through the date of the release of this report.
30
Credit Suisse Commodity Return Strategy Fund
Notes to Consolidated Financial Statements (continued)
October 31, 2019
Note 3. Transactions with Affiliates and Related Parties
Credit Suisse serves as investment adviser and co-administrator for the Fund. For its investment advisory and administration services, Credit Suisse is entitled to receive a fee from the Fund at an annualized rate of 0.59% of the Fund's average daily net assets. For the year ended October 31, 2019, investment advisory and administration fees earned $12,694,149. Credit Suisse has contractually agreed to limit expenses so that the Fund's annual operating expenses do not exceed 0.80% of the Fund's average daily net assets for Class I shares, 1.05% of the Fund's average daily net assets for Class A shares, and 1.80% of the Fund's average daily net assets for Class C shares. The Fund is authorized to reimburse Credit Suisse for management fees previously limited and/or for expenses previously reimbursed by Credit Suisse, provided, however, that any reimbursements must be paid at a date not more than thirty-six months following the applicable month during which such fees were limited or expenses were reimbursed by Credit Suisse and the reimbursements do not cause the Fund to exceed the applicable expense limitation in the contract at the time the fees are recouped. This contract may not be terminated before February 28, 2021.
For its co-administrative services, SSB receives a fee, exclusive of out-of-pocket expenses, calculated in total for all the Credit Suisse funds/portfolios co-administered by SSB and allocated based upon the relative average net assets of each fund/portfolio, subject to an annual minimum fee. For the year ended October 31, 2019, co-administrative services fees earned by SSB (including out-of-pocket expenses) with respect to the Fund were $339,352.
Credit Suisse Securities (USA) LLC ("CSSU"), an affiliate of Credit Suisse, serves as the distributor of the Fund's shares. Pursuant to a distribution plan adopted by the Fund pursuant to Rule 12b-1 under the 1940 Act, CSSU receives fees for its distribution services. These fees are calculated at an annual rate of 0.25% of the average daily net assets of the Class A shares. For the Class C shares, the fee is calculated at an annual rate of 1.00% of the average daily net assets. For the year ended October 31, 2019, the Fund paid Rule 12b-1 distribution fees of $223,875 for Class A shares and $44,057 for Class C shares. Class I shares are not subject to Rule 12b-1 distribution fees.
Certain brokers, dealers and financial representatives provide transfer agent-related services to the Fund and receive compensation from the Fund. For the year ended October 31, 2019, the Fund paid $2,483,675, which is included within transfer agent fees.
31
Credit Suisse Commodity Return Strategy Fund
Notes to Consolidated Financial Statements (continued)
October 31, 2019
Note 3. Transactions with Affiliates and Related Parties (continued)
For the year ended October 31, 2019, CSSU and its affiliates advised the Fund that they retained $1,475 from commissions earned on the sale of the Fund's Class A shares. There were no commissions earned on the sale of Class C shares.
Note 4. Line of Credit
The Fund, together with other funds/portfolios advised by Credit Suisse (collectively, the "Participating Funds"), participates in a committed, unsecured line of credit facility ("Credit Facility"), with SSB in an aggregated amount of $250 million for temporary or emergency purposes under a first-come, first-served basis. Under the terms of the Credit Facility, the Participating Funds pay an aggregate commitment fee on the average unused amount of the Credit Facility, which is allocated among the Participating Funds in such manner as is determined by the governing Boards of the Participating Funds. In addition, the Participating Funds pay interest on borrowings at either the Overnight Federal Funds rate or the Overnight LIBOR rate plus a spread. At October 31, 2019 and during the year ended October 31, 2019, the Fund had no borrowings outstanding under the Credit Facility.
Note 5. Purchases and Sales of Securities
For the year ended October 31, 2019, purchases and sales of investment securities (excluding short-term investments) and U.S. Government and Agency Obligations were as follows:
Investment Securities | | U.S. Government/
Agency Obligations | |
| Purchases | | Sales | | Purchases | | Sales | |
| $ | 0 | | | $ | 0 | | | $ | 2,532,290,282 | | | $ | 3,728,892,033 | | |
Note 6. Capital Share Transactions
The Fund is authorized to issue an unlimited number of full and fractional shares of beneficial interest, $.001 par value per share. The Fund offers Class I,
32
Credit Suisse Commodity Return Strategy Fund
Notes to Consolidated Financial Statements (continued)
October 31, 2019
Note 6. Capital Share Transactions (continued)
Class A and Class C shares. Transactions in capital shares for each class of the Fund were as follows:
| | | Class I | |
| | | For the Year Ended
October 31, 2019 | | For the Year Ended
October 31, 2018 | |
| | | Shares | | Value | | Shares | | Value | |
Shares sold | | | 208,048,866 | | | $ | 953,727,365 | | | | 218,658,591 | | | $ | 1,093,945,672 | | |
Shares issued in reinvestment
of dividends | | | 3,384,657 | | | | 15,387,022 | | | | 15,009,252 | | | | 75,138,477 | | |
Shares redeemed | | | (410,527,652 | ) | | | (1,893,825,796 | ) | | | (345,514,859 | ) | | | (1,704,374,012 | ) | |
Net decrease | | | (199,094,129 | ) | | $ | (924,711,409 | ) | | | (111,847,016 | ) | | $ | (535,289,863 | ) | |
| | | Class A | |
| | | For the Year Ended
October 31, 2019 | | For the Year Ended
October 31, 2018 | |
| | | Shares | | Value | | Shares | | Value | |
Shares sold | | | 15,161,669 | | | $ | 67,592,496 | | | | 9,530,877 | | | $ | 46,390,090 | | |
Shares issued in reinvestment
of dividends | | | 97,917 | | | | 435,371 | | | | 315,909 | | | | 1,546,908 | | |
Shares redeemed | | | (23,865,915 | ) | | | (106,745,169 | ) | | | (10,110,942 | ) | | | (49,043,477 | ) | |
Net decrease | | | (8,606,329 | ) | | $ | (38,717,302 | ) | | | (264,156 | ) | | $ | (1,106,479 | ) | |
| | | Class C | |
| | | For the Year Ended
October 31, 2019 | | For the Year Ended
October 31, 2018 | |
| | | Shares | | Value | | Shares | | Value | |
Shares sold | | | 134,502 | | | $ | 563,220 | | | | 366,497 | | | $ | 1,694,218 | | |
Shares issued in reinvestment
of dividends | | | 3,013 | | | | 12,603 | | | | 17,876 | | | | 82,583 | | |
Shares redeemed | | | (523,127 | ) | | | (2,189,417 | ) | | | (499,563 | ) | | | (2,278,858 | ) | |
Net decrease | | | (385,612 | ) | | $ | (1,613,594 | ) | | | (115,190 | ) | | $ | (502,057 | ) | |
On October 31, 2019, the number of shareholders that held 5% or more of the outstanding shares of each class of the Fund was as follows:
| | | Number of
Shareholders | | Approximate Percentage
of Outstanding Shares | |
Class I | | | 4 | | | | 69 | % | |
Class A | | | 3 | | | | 56 | % | |
Class C | | | 5 | | | | 66 | % | |
The Fund's performance may be negatively impacted in the event one or more of the Fund's greater than 5% shareholders were to redeem at a given time. Some of the shareholders may be omnibus accounts, which hold shares on behalf of individual shareholders.
33
Credit Suisse Commodity Return Strategy Fund
Notes to Consolidated Financial Statements (continued)
October 31, 2019
Note 7. Income Tax Information and Distributions to Shareholders
Income and capital gain distributions are determined in accordance with federal income tax regulations, which may differ from GAAP.
The tax character of distributions paid by the Fund during the year ended October 31, 2019 and 2018, respectively, was as follows:
Ordinary Income | |
| 2019 | | 2018 | |
| $ | 28,066,598 | | | $ | 112,934,208 | | |
The tax basis components of distributable earnings differ from the amounts reflected in the Consolidated Statement of Assets and Liabilities by temporary book/tax differences. At October 31, 2019, the components of distributable earnings on a tax basis were as follows:
Accumulated realized loss | | $ | (225,615,340 | ) | |
Undistributed ordinary Income | | | 1,377,053 | | |
Unrealized appreciation | | | 14,309,075 | | |
| | | $ | (209,929,212 | ) | |
At October 31, 2019, the Fund had $177,772,705 of unlimited short-term capital loss carryforwards and $47,842,635 of unlimited long-term capital loss carryforwards available to offset possible future capital gains.
At October 31, 2019, the cost and net unrealized appreciation (depreciation) of investments and derivatives for income tax purposes were as follows:
Cost of Investments | | $ | 1,595,709,261 | | |
Unrealized appreciation | | $ | 16,045,758 | | |
Unrealized depreciation | | | (1,736,683 | ) | |
Net Unrealized appreciation (depreciation) | | $ | 14,309,075 | | |
To adjust for current period permanent book/tax differences which arose principally from differing book/tax treatment of net operating losses and Subsidiary cumulative income/loss, paid-in capital was charged $177,665,558, and distributable earnings/loss was credited $177,665,558. Net assets were not affected by this reclassification.
Note 8. Contingencies
In the normal course of business, the Fund may provide general indemnifications pursuant to certain contracts and organizational documents. The Fund's maximum exposure under these arrangements is dependent on future claims that may be made against the Fund and, therefore, cannot be estimated; however, based on experience, the risk of loss from such claims is considered remote.
34
Credit Suisse Commodity Return Strategy Fund
Report of Independent Registered Public Accounting Firm
To the Shareholders and Board of Trustees
Credit Suisse Commodity Return Strategy Fund:
Opinion on the Consolidated Financial Statements
We have audited the accompanying consolidated statement of assets and liabilities of Credit Suisse Commodity Return Strategy Fund (the Fund), a series of the Credit Suisse Commodity Strategy Funds, including the consolidated schedule of investments, as of October 31, 2019, the related consolidated statement of operations for the year then ended, the consolidated statements of changes in net assets for each of the years in the two-year period then ended, and the related notes (collectively, the consolidated financial statements) and the consolidated financial highlights for each of the years in the five-year period then ended. In our opinion, the consolidated financial statements and consolidated financial highlights present fairly, in all material respects, the financial position of the Fund as of October 31, 2019, the results of its operations for the year then ended, the changes in its net assets for each of the years in the two-year period then ended, and the consolidated financial highlights for each of the years in the five-year period then ended, in conformity with U.S. generally accepted accounting principles.
Basis for Opinion
These consolidated financial statements and consolidated financial highlights are the responsibility of the Fund's management. Our responsibility is to express an opinion on these consolidated financial statements and consolidated financial highlights based on our audits. We are a public accounting firm registered with the Public Company Accounting Oversight Board (United States) (PCAOB) and are required to be independent with respect to the Fund in accordance with the U.S. federal securities laws and the applicable rules and regulations of the Securities and Exchange Commission and the PCAOB.
We conducted our audits in accordance with the standards of the PCAOB. Those standards require that we plan and perform the audit to obtain reasonable assurance about whether the consolidated financial statements and consolidated financial highlights are free of material misstatement, whether due to error or fraud. Our audits included performing procedures to assess the risks of material misstatement of the consolidated financial statements and consolidated financial highlights, whether due to error or fraud, and performing procedures that respond to those risks. Such procedures included examining, on a test basis, evidence regarding the amounts and disclosures in the consolidated financial statements and consolidated financial highlights. Such procedures also included confirmation of securities owned as of October 31, 2019, by correspondence with
35
Credit Suisse Commodity Return Strategy Fund
Report of Independent Registered Public Accounting Firm
custodians and brokers or by other appropriate auditing procedures when replies were not received. Our audits also included evaluating the accounting principles used and significant estimates made by management, as well as evaluating the overall presentation of the consolidated financial statements and consolidated financial highlights. We believe that our audits provide a reasonable basis for our opinion.
We have served as the auditor of one or more Credit Suisse Asset Management, LLC investment companies since 2015.
New York, New York
December 20, 2019
36
Credit Suisse Commodity Return Strategy Fund
Information Concerning Trustees and Officers (unaudited)
Name, Address
(Year of Birth) | | Position(s)
Held with
Fund | | Term
of Office1
and
Length
of Time
Served | | Principal
Occupation(s) During
Past Five Years | | Number of
Portfolios
in Fund
Complex
Overseen
by Trustee | | Other
Trusteeships
Held by Trustee
During Past Five Years | |
Independent Trustees | | | | | | | | | | | |
Laura A. DeFelice
c/o Credit Suisse Asset
Management, LLC
Attn: General Counsel
Eleven Madison Avenue
New York, New York
10010
(1959) | | Trustee, Nominating and Audit Committee member | | Since 2017 | | Partner of Acacia Properties LLC (multi-family and commercial real estate ownership and operation) from 2008 to present; Stonegate Advisors LLC (renewable energy and energy efficiency) from 2007 to present. | | | 9 | | | None | |
Jeffrey E. Garten
c/o Credit Suisse Asset Management, LLC
Attn: General Counsel Eleven Madison Avenue New York, New York 10010
(1946) | | Trustee, Nominating and Audit Committee member | | Since Fund Inception | | Dean Emeritus of Yale School of Management from July 2015 to present; The Juan Trippe Professor in the Practice of International Trade, Finance and Business, Yale School of Management, from July 2005 to July 2015; Partner and Chairman of Garten Rothkopf (consulting firm) from October 2005 to June 2017. | | | 9 | | | Director of Aetna, Inc. (insurance company); Director of CarMax Group (used car dealers); Director of Miller Buckfire & Co., LLC (financial restructuring). | |
1 Subject to the Trust's retirement policy, each Trustee may continue to serve as a Trustee until the last day of the calendar year in which the applicable Trustee attains age 75. Officer serves until his or her respective successor has been duly elected and qualified.
37
Credit Suisse Commodity Return Strategy Fund
Information Concerning Trustees and Officers (unaudited) (continued)
Name, Address
(Year of Birth) | | Position(s)
Held with
Fund | | Term
of Office1
and
Length
of Time
Served | | Principal
Occupation(s) During
Past Five Years | | Number of
Portfolios
in Fund
Complex
Overseen
by Trustee | | Other
Trusteeships
Held by Trustee
During Past Five Years | |
Independent Trustees | | | | | | | | | | | |
Mahendra R. Gupta
c/o Credit Suisse Asset
Management, LLC
Attn: General Counsel
Eleven Madison Avenue
New York, New York
10010
(1956) | | Trustee, Nominating Committee member and Audit Committee Chairman | | Since 2017 | | Professor, Washington University in St. Louis from July 1990 to present; Dean of Olin Business School at Washington University in St. Louis from July 2005 to July 2016; Partner, R.J. Mithaiwala (food manufacturing and retail, India) from March 1977 to present; Partner, F.F.B. Corporation (agriculture, India) from March 1977 to present; Partner, RPMG Research Corporation (benchmark research) from July 2001 to present. | | | 9 | | | Director of Caleres Inc. (footwear) from May 2012 to present; Director of Koch Development Corporation (real estate development) from November 2017 to present; Director of Supernova (fin-tech) from June 2014 to September 2018. | |
1 Subject to the Trust's retirement policy, each Trustee may continue to serve as a Trustee until the last day of the calendar year in which the applicable Trustee attains age 75. Officer serves until his or her respective successor has been duly elected and qualified.
38
Credit Suisse Commodity Return Strategy Fund
Information Concerning Trustees and Officers (unaudited) (continued)
Name, Address
(Year of Birth) | | Position(s)
Held with
Fund | | Term
of Office1
and
Length
of Time
Served | | Principal
Occupation(s) During
Past Five Years | | Number of
Portfolios
in Fund
Complex
Overseen
by Trustee | | Other
Trusteeships
Held by Trustee
During Past Five Years | |
Independent Trustees | | | | | | | | | | | |
Steven N. Rappaport
c/o Credit Suisse Asset Management, LLC
Attn: General Counsel
Eleven Madison Avenue
New York, New York
10010
(1948) | | Chairman of the Board, Nominating Committee Chairman and Audit Committee member | | Trustee since Portfolio Inception and Chairman since 2005 | | Partner of Lehigh Court, LLC and RZ Capital (private investment firms) from July 2002 to present; Partner of Backstage Acquisition Holdings, LLC (publication job postings) from November 2013 to 2018. | | | 9 | | | Director of Aberdeen Emerging Markets Equity Income Fund, Inc. (a closed-end investment company); Director of Aberdeen Funds (25 open-end portfolios); Director of iCAD, Inc. (surgical & medical instruments & apparatus company) from 2006 to 2018. | |
Interested Trustee | | | | | | | | | | | |
John G. Popp2
Credit Suisse Asset
Management, LLC
Eleven Madison Avenue
New York, New York
10010
Year of Birth: 1956 | | Trustee, Chief Executive Officer and President | | Trustee since 2017
Chief Executive Officer and President since 2010 | | Managing Director of Credit Suisse; Global Head and Chief Investment Officer of the Credit Investments Group; Associated with Credit Suisse or its predecessor since 1997; Officer of other Credit Suisse Funds. | | | 9 | | | None. | |
1 Subject to the Trust's retirement policy, each Trustee may continue to serve as a Trustee until the last day of the calendar year in which the applicable Trustee attains age 75. Officer serves until his or her respective successor has been duly elected and qualified.
2 Mr. Popp is an "interested person" of the Trust, as defined in the 1940 Act, by virtue of his current position as an officer of Credit Suisse.
39
Credit Suisse Commodity Return Strategy Fund
Information Concerning Trustees and Officers (unaudited) (continued)
Name, Address
(Year of Birth) | | Position(s)
Held with
Fund | | Term of
Office1
and
Length of
Time
Served | | Principal Occupation(s) During Past Five Years | |
Emidio Morizio
Credit Suisse Asset
Management, LLC
Eleven Madison Avenue
New York, New York 10010
(1966) | | Chief Compliance Officer | | Since Fund Inception | | Managing Director and Global Head of Compliance of Credit Suisse since 2010; Associated with Credit Suisse since July 2000; Officer of other Credit Suisse Funds. | |
Lou Anne McInnis
Credit Suisse Asset Management, LLC
Eleven Madison Avenue
New York, New York 10010
(1959) | | Chief Legal Officer | | Since 2015 | | Director of Credit Suisse; Associated with Credit Suisse since April 2015; Counsel at DLA Piper US LLP from 2011 to April 2015; Associated with Morgan Stanley Investment Management from 1997 to 2010; Officer of other Credit Suisse Funds. | |
Omar Tariq
Credit Suisse Asset
Management, LLC
Eleven Madison Avenue
New York, New York 10010
(1983) | | Chief Financial Officer and Treasurer | | Since 2019 | | Director of Credit Suisse since 2019; Senior Manager of PricewaterhouseCoopers,LLP from September 2010 to March 2019; Officer of other Credit Suisse Funds. | |
Karen Regan
Credit Suisse Asset
Management, LLC
Eleven Madison Avenue
New York, New York 10010
(1963) | | Vice President and Secretary | | Since 2010 | | Vice President of Credit Suisse; Associated with Credit Suisse since December 2004; Officer of other Credit Suisse Funds. | |
1 Subject to the Trust's retirement policy, each Trustee may continue to serve as a Trustee until the last day of the calendar year in which the applicable Trustee attains age 75. Officer serves until his or her respective successor has been duly elected and qualified.
* The officers of the Trust shown are officers that make policy decisions.
The Statement of Additional Information includes additional information about the Trustees and is available, without charge, upon request, by calling 877-870-2874.
40
Credit Suisse Commodity Return Strategy Fund
Proxy Voting and Portfolio Holdings Information (unaudited)
Information regarding how the Fund voted proxies related to its portfolio securities during the 12-month period ended June 30 of each year, as well as the policies and procedures that the Fund uses to determine how to vote proxies relating to its portfolio securities are available:
• By calling 1-877-870-2874
• On the Fund's website, www.credit-suisse.com/us/funds
• On the website of the Securities and Exchange Commission, www.sec.gov
The Fund files a complete schedule of its portfolio holdings for the first and third quarters of its fiscal year with the SEC as an exhibit to its reports on Form N-PORT, and for reporting periods ended prior to March 31, 2019, filed such information on Form N-Q. The Fund's Forms N-PORT and N-Q are available on the SEC's website at www.sec.gov.
41

P.O. BOX 219916, KANSAS CITY, MO 64121-9916
877-870-2874 n www.credit-suisse.com/us/funds
CREDIT SUISSE SECURITIES (USA) LLC, DISTRIBUTOR. COM-AR-1019
Item 2. Code of Ethics.
The registrant has adopted a code of ethics applicable to its Chief Executive Officer, President, Chief Financial Officer and Chief Accounting Officer, or persons performing similar functions. A copy of the code is filed as Exhibit 12(a)(1) to this Form. There were no amendments to the code during the fiscal year ended October 31, 2019. There were no waivers or implicit waivers from the code granted by the registrant during the fiscal year ended October 31, 2019.
Item 3. Audit Committee Financial Expert.
The registrant’s governing board has determined that it has two audit committee financial experts serving on its audit committee: Mahendra R. Gupta and Steven N. Rappaport. Each audit committee financial expert is “independent” for purposes of this item.
Item 4. Principal Accountant Fees and Services.
(a) through (d). The information in the table below is provided for services rendered to the registrant by its independent registered public accounting firm, KPMG LLP (“KPMG”), for its fiscal years ended October 31, 2018 and October 31, 2019.
| | 2018 | | 2019 | |
Audit Fees | | $ | 49,600 | | $ | 51,300 | |
Audit-Related Fees(1) | | $ | 5,100 | | $ | 6,830 | |
Tax Fees(2) | | $ | 6,840 | | $ | 3,420 | |
All Other Fees | | $ | 4,950 | | $ | — | |
Total | | $ | 66,490 | | $ | 61,550 | |
(1) Services include agreed-upon procedures in connection with the registrant’s semi-annual financial statements ($5,100 in 2018 and $6,830 in 2019).
(2) Tax services in connection with the registrant’s excise tax calculations and review of the registrant’s applicable tax returns.
The information in the table below is provided with respect to non-audit services that directly relate to the registrant’s operations and financial reporting and that were rendered by KPMG to the registrant’s investment adviser, Credit Suisse Asset Management, LLC (“Credit Suisse”), and any service provider to the registrant controlling, controlled by or under common control with Credit Suisse that provided ongoing services to the registrant (“Covered Services Provider”), for the registrant’s fiscal years ended October 31, 2018 and October 31, 2019.
| | 2018 | | 2019 | |
Audit-Related Fees | | N/A | | N/A | |
Tax Fees | | N/A | | N/A | |
All Other Fees | | N/A | | N/A | |
Total | | N/A | | N/A | |
(e)(1) Pre-Approval Policies and Procedures. The Audit Committee (“Committee”) of the registrant is responsible for pre-approving (i) all audit and permissible non-audit services to be provided by the independent registered public accounting firm to the registrant and (ii) all permissible non-audit services to be provided by the independent registered public accounting firm to Credit Suisse and any Covered Services Provider if the engagement relates directly to the operations and financial reporting of the registrant. The Committee may delegate its responsibility to pre-approve any such audit and permissible non-audit services to the Chairperson of the Committee, and the Chairperson shall report to the Committee, at its next regularly scheduled meeting after the Chairperson’s pre-approval of such services, his or her decision(s). The Committee may also establish detailed pre-approval policies and procedures for pre-approval of such services in accordance with applicable laws, including the delegation of some or all of the Committee’s pre-approval responsibilities to other persons (other than Credit Suisse or the registrant’s officers). Pre-approval by the Committee of any permissible non-audit services shall not be required so long as: (i) the aggregate amount of all such permissible non-audit services provided to the registrant, Credit Suisse and any Covered Services Provider constitutes not more than 5% of the total amount of revenues paid by the registrant to its independent registered public accounting firm during the fiscal year in which the permissible non-audit services are provided; (ii) the permissible non-audit services were not recognized by the registrant at the time of the engagement to be non-audit services; and (iii) such services are promptly brought to the attention of the Committee and approved by the Committee (or its delegate(s)) prior to the completion of the audit.
(e)(2) The information in the table below sets forth the percentages of fees for services (other than audit, review or attest services) rendered by KPMG to the registrant for which the pre-approval requirement was waived pursuant to Rule 2-01(c)(7)(i)(C) of Regulation S-X:
| | 2018 | | 2019 | |
Audit-Related Fees | | N/A | | N/A | |
Tax Fees | | N/A | | N/A | |
All Other Fees | | N/A | | N/A | |
Total | | N/A | | N/A | |
The information in the table below sets forth the percentages of fees for services (other than audit, review or attest services) rendered by KPMG to Credit Suisse and any Covered Services Provider required to be approved pursuant to Rule 2-01(c)(7)(ii) of Regulation S-X, for the registrant’s fiscal years ended October 31, 2018 and October 31, 2019:
| | 2018 | | 2019 | |
Audit-Related Fees | | N/A | | N/A | |
Tax Fees | | N/A | | N/A | |
All Other Fees | | N/A | | N/A | |
Total | | N/A | | N/A | |
(f) Not Applicable.
(g) The aggregate fees billed by KPMG for non-audit services rendered to the registrant, Credit Suisse and Covered Service Providers for the fiscal years ended October 31, 2018 and October 31, 2019 were $0 and $0, respectively.
(h) Not Applicable.
Item 5. Audit Committee of Listed Registrants.
Form N-CSR disclosure requirement is not applicable to the registrant.
Item 6. Schedule of Investments.
Included as part of the report to shareholders filed under Item 1 of this Form.
Item 7. Disclosure of Proxy Voting Policies and Procedures for Closed-End Management Investment Companies.
Form N-CSR disclosure requirement is not applicable to the registrant.
Item 8. Portfolio Managers of Closed-End Management Investment Companies.
Form N-CSR disclosure requirement is not applicable to the registrant.
Item 9. Purchases of Equity Securities by Closed-End Management Investment Company and Affiliated Purchasers.
Form N-CSR disclosure requirement is not applicable to the registrant.
Item 10. Submission of Matters to a Vote of Security Holders.
None.
Item 11. Controls and Procedures.
(a) As of a date within 90 days from the filing date of this report, the principal executive officer and principal financial officer concluded that the registrant’s disclosure controls and procedures (as defined in Rule 30a-3(c) under the Investment Company Act of 1940 (the “Act”)) were effective based on their evaluation of the disclosure controls and procedures required by Rule 30a-3(b) under the Act and Rules 13a-15(b) or 15d-15(b) under the Securities Exchange Act of 1934.
(b) There were no changes in registrant’s internal control over financial reporting (as defined in Rule 30a-3(d) under the Act) that occurred during the most recent fiscal half-year covered by this report that have materially affected, or are reasonably likely to materially affect, the registrant’s internal control over financial reporting.
Item 12. Disclosure of Securities Lending Activities for Closed-End Management Investment Companies.
Form N-CSR disclosure requirement is not applicable to the registrant.
Item 13. Exhibits.
(a)(1) Registrant’s Code of Ethics is an exhibit to this report.
(a)(2) The certifications of the registrant as required by Rule 30a-2(a) under the Act are exhibits to this report.
(a)(3) Not applicable.
(b) The certifications of the registrant as required by Rule 30a-2(b) under the Act are an exhibit to this report.
(other) Iran related activities disclosure requirement.
SIGNATURES
Pursuant to the requirements of the Securities Exchange Act of 1934 and the Investment Company Act of 1940, the registrant has duly caused this report to be signed on its behalf by the undersigned, thereunto duly authorized.
CREDIT SUISSE COMMODITY STRATEGY FUNDS
/s/ John G. Popp | |
Name: | John G. Popp |
Title: | Chief Executive Officer and President | |
Date: | January 6, 2020 | |
Pursuant to the requirements of the Securities Exchange Act of 1934 and the Investment Company Act of 1940, this report has been signed below by the following persons on behalf of the registrant and in the capacities and on the dates indicated.
/s/ John G. Popp | | | |
Name: | John G. Popp | | | |
Title: | Chief Executive Officer and President | | | |
Date: | January 6, 2020 | | | |
| | | |
/s/ Omar Tariq | | | |
Name: | Omar Tariq | | | |
Title: | Chief Financial Officer and Treasurer | | | |
Date: | January 6, 2020 | | | |