SECURITIES AND EXCHANGE COMMISSION
Washington, D.C. 20549
FORM 6-K
REPORT OF FOREIGN ISSUER
PURSUANT TO RULE 13a-16 OR 15d-16 OF THE
SECURITIES EXCHANGE ACT OF 1934
For the month of February 2020
(Commission File No. 001-32221)
GOL LINHAS AÉREAS INTELIGENTES S.A.
(Exact name of registrant as specified in its charter)
GOL INTELLIGENT AIRLINES INC.
(Translation of registrant’s name into English)
Praça Comandante Linneu Gomes, Portaria 3, Prédio 24
Jd. Aeroporto
04630-000 São Paulo, São Paulo
Federative Republic of Brazil
(Address of registrant’s principal executive offices)
Indicate by check mark whether the registrant files or will file
annual reports under cover Form 20-F or Form 40-F.
Form 20-F ___X___ Form 40-F ______
Indicate by check mark whether the registrant by furnishing the
information contained in this Form is also thereby furnishing the
information to the Commission pursuant to Rule 12g3-2(b) under
the Securities Exchange Act of 1934.
Yes ______ No ___X___
![]()
Conference call connection information
4Q19 Earnings Calls Thursday, February 20, 2020
Live Webcast Access atwww.voegol.com.br/ir
In English | In Portuguese |
10:00 a.m. (US EST) 12:00 p.m. (Brasília) | 1:30 p.m. (Brasília) 11:30 a.m. (US EST) |
Phone: +1 (412) 317-6382 | Phone: +55 (11) 3181-8565 |
Code: GOL | Code: GOL |
Replay: +1 (412) 317-0088 | Replay: +55 (11) 3193-1012 |
Code: 10138690 | Code: 2000720# |
1 |
|
 GOL Linhas Aéreas Inteligentes S.A.
| Earnings Report Fourth Quarter 2019 |
GOL Airlines’ Net Revenue Grows By Over 18% In 4Q19
Brazil’s largest domestic airline reports record net revenue of R$3.8 billion;
recurring EBITDA margin was 38.5% (+22.2 p.p.); recurring earnings per diluted share of R$0.88
February 20, 2020 – São Paulo - GOL Linhas Aéreas Inteligentes S.A. (“GOL” or “Company”) (NYSE: GOL and B3: GOLL4), Brazil’s largest domestic airline, today announces its consolidated results for the fourth quarter of 2019 (4Q19). Net revenue was R$3.8 billion, the highest quarterly revenue ever recorded by the Company, and an increase of 18.8% compared to 4Q18. In 4Q19, recurring earnings per diluted share were R$0.88 and recurring earnings per diluted ADS were US$0.43.
“Our record revenues this quarter rounds out what has been an outstanding year in GOL’s history,” said the Company’s CEO, Paulo Kakinoff. “It’s testament to our team delivering exceptional customer experience, combined with GOL’s low-cost operating model and sophisticated fleet management, that are powering our growth, in both domestic and international markets.”
All information is presented in Brazilian Reais (R$), in accordance with international accounting standards (IFRS), and comparisons are with the fourth quarter 2018, unless stated otherwise.
Summary
· In 4Q19, recurring earnings per diluted share were R$0.88 and recurring earnings per diluted ADS were US$0.43. GOL’s 2020 EPS e EPADS guidance is R$2.65-R$3.15 and US$1.25-US$1.50, respectively.
· Recurring pre-tax margin, was 14.5% in 4Q19, an increase of 20.7 p.p. quarter-over-quarter. In 2019, recurring pre-tax margin was 8.3%, a growth of 10.3 p.p. year-over-year. GOL's 2020 pre-tax margin guidance is approximately 13%.
· Recurring EBITDA margin was 38.5% in 4Q19, an increase of 22.2 p.p. quarter-over-quarter. In 2019, recurring EBITDA margin was 31.5%, a growth of 11.5 p.p. year-over-year. GOL’s 2020 EBITDA margin guidance is approximately 30%.
· Net revenue was R$3.8 billion in 4Q19, the highest ever recorded by the Company, an increase of 18.8% compared to 4Q18. In 2019, net revenue reached R$13.9 billion, an increase of 21.5% compared to 2018. GOL's net revenue guidance for 2020 is approximately R$15.4 billion.
· Revenue Passenger Kilometer (RPK) increased 5.5% totaling 10.8 billion in 4Q19, driven by an 8.0% growth in the number of transported passengers, while Available Seat Kilometer (ASK) growth was 6.0%.
· GOL transported approximately 9.7 million customers during 4Q19, an increase of 8.0% over the same period last year, with a 38% market share in the Brazilian domestic market (source: ANAC). 38% of passengers in the corporate segment, according to ABRACORP data, travelled on GOL.
· The Company returned R$800.0 million of cash to capital partners in the fourth quarter, mainly comprised of R$617.1 million of debt repayments, R$50.2 million of interest on own capital and R$102.4 million of share repurchases.
Strong operating indicators: Revenue per Passenger Kilometer (RPK) increased 5.5% totaling R$10.8 billion in 4Q19, driven by an 8.0% growth in the number of transported passengers, while Available Seal Kilometer (ASK) growth was 6.0%. Strong passenger demand and dynamic revenue management enabled GOL to manage the increase in unit operating costs, achieving the following indicators:
(i) Average yield per passenger of 33.17 cents (R$), an increase of 13.8% compared to 4Q18;
(ii) Average load factor of 81.5%, a reduction 0.4 p.p. quarter-over-quarter;
(iii) Average aircraft utilization of 12.2 hours/day, an increase of 6.1% quarter-over-quarter; and
(iv) Flight completion of 99.2% in 4Q19, an increase of 0.6 p.p., according to Infraero and data from major airports.
Record revenues: Net revenue was R$3.8 billion in 4Q19, the highest for a quarter ever recorded by the Company, and an increase of 18.8% over 4Q18. GOL carried 9.7 million customers in the quarter, with 9.2 million in the domestic market (+9.5% over 4Q18) and 0.5 million in the international market. Net Revenue per Available Seat Kilometer (RASK) was 28.69 cents (R$) in 4Q19, an increase of 12.1% over 4Q18. Net Passenger Revenue per Available Seat Kilometer (PRASK) was 27.04 cents (R$) in 4Q19, an increase of 13.3% over 4Q18.
2 |
|
| Earnings Report Fourth Quarter 2019 |
Controlled costs: GOL has the lowest unit costs in its markets. Unit costs based on Cost per Available Seat Kilometer (CASK), excluding non-recurring expenses, decreased by 12.8%, from 24.19 cents (R$) in 4Q18 to 21.10 cents (R$), partially impacted by 17% decrease in the average fuel price and a 2% reduction in fuel consumption per flight hour. Fuel costs per ASK decreased 15.6%, mainly due to a reduction of fuel taxes. CASK ex-fuel, excluding non-recurring expenses, increased by 11.1% primarily due to increased productivity (operating efficiency, aircraft utilization and increase in ASKs), and a reduction in aircraft maintenance expenses due to a decrease in aircraft returns in the 4Q19, partially offset by:
(i) A 32.6% increase in depreciation due to the addition of 16 aircraft in the fleet and a reduction in the depreciable life of capitalized engine maintenance and large components; and
(ii) A 23.8% growth in personnel expenses, mainly due to an increase in the federal payroll tax rate to 20%, and the hiring and training of 819 new employees due to the expansion of operations, new routes and new bases.
Healthy margins: Due to strong cost control, capacity, and yield management, the Company achieved operating profits for the 14th consecutive quarter. 4Q19 demand enabled GOL to achieve a recurring EBIT margin of 26.5%, the highest achieved by the Company since 2004. Recurring operating income (EBIT) was R$1,006.3 million in the quarter and R$2,645.0 million in 2019; R$830.0 million and R$1,601.1 million higher than in 4Q18 and 2018, respectively. Recurring EBITDA margin was 38.5% in the period, an increase of 22.2 p.p. quarter-over-quarter.
Balance sheet strengthening: GOL reported operating cash flow generation of approximately R$1.0 billion in the quarter. Total liquidity was R$4.3 billion, R$238.4 million higher in comparison to September 30, 2019 and R$1.3 billion higher than December 31, 2018. In 4Q19, the Company repaid R$617.1 million in principal debt and leasing payments, R$50.2 million of interest on own capital and repurchased R$102.4 million of shares. The net exchange and monetary variation gains in the quarter totaled R$372.4 million. Net debt (excluding perpetual bonds and Exchangeable Senior Notes) to LTM EBITDA was 2.4x as of December 31, 2019.
Guidance: GOL’s 2020 and 2021 guidance is on page 14 of this document.
1Q20 Outlook
Based on current cost trends, GOL estimates first quarter 2020 recurring CASK ex-fuel to increase by approximately 4% to 6%, year-over-year. The Company has hedged approximately 90% of its fuel consumption for 1Q20 and 68% for 2020. Currently, passenger booking and revenue trends remain healthy, and the Company expects first quarter 2020 RASK to increase between approximately 4% and 6%, compared to the first quarter of 2019.
Management’s Comments on Results
In 2019, GOL accomplished a number of significant milestones in its business strategy to be The First Airline for Everyone and to grow its network both internationally and domestically.
“Be The First Airline For Everyone”
Strong customer demand, especially in the corporate segment, combined with our capacity discipline enabled us to deliver excellent operating results in 4Q19. We’d like to particularly thank the dedication and engagement of the Team of Eagles who, amid challenging market conditions, met the demands of our customers in Brazil and abroad in a fast and safe manner.
We transported almost 10 million passengers in 4Q19, a growth of 8.0% over the same period last year.
This year, we also achieved a Black Friday sales record with more than 450,000 tickets sold, which corresponds to more than R$120 million in just one day, and a total sale in the promotional period of more than R$250 million. That represents an increase of more than 50% in sales compared to Black Friday of 2018.
“The excellent sales numbers in the fourth quarter underline our purpose of being The First Airline For Everyone, by providing the best customer experience in terms of products and services, with the lowest cost in the market”, said GOL CEO, Paulo Kakinoff.
Our Net Promoter Score (NPS) was 35 in the quarter and is indicative of the winning combination of our best-in-market product and our highly engaged customer service team. For the third consecutive year, we won the Top of Mind award from Datafolha São Paulo Institute as the most remembered and preferred airline by Brazilians. We also won, for the sixth time, the Companies of the Decade award byConsumidor Moderno, being the only airline among the winning companies.
“These acknowledgments are the result of the continuous innovation across our products and services, and they reflect the close relationship we maintain with our customers in their daily lives,” added Kakinoff.
Growth of the GOL Network
In the quarter, we expanded our reach in regional markets in Brazil, adding three more destinations. In addition, we enhanced our partnerships with two regional carriers that added 22 new destinations for GOL customers.
GOL is the largest regional carrier in Brazil, as measured by ASKs. The new regional destinations have strengthened our overall network, increased connectivity, and reduced our exposure to highly competitive markets. These destinations also generate even more feeder traffic from customers connecting to our international hubs in Guarulhos, Rio de Janeiro, Brasília and Fortaleza.
3 |
|
| Earnings Report Fourth Quarter 2019 |
We continued our long-term term growth strategy in international markets in the quarter. We began regular flights between São Paulo and Lima, Peru. In the period, we also launched weekly flights between Manaus and Orlando and seasonal flights between Porto Alegre and Punta del Este. In addition, we renewed our strategic partnership with Air France-KLM for another five years, through which we have already jointly carried more than 1 million customers. Our partnership currently covers over 99% of the demand between Brazil and Europe, and one in four Air France-KLM passengers choose to make connections with GOL flights
At the end of December, GOL also celebrated 15 years of operating in Argentina, where we have transported over 12 million passengers on 77 weekly flights.
We seek to continue our growth in domestic and international markets.
In February 2020, we announced a new codeshare with American Airlines. The flights will operate from GOL’s hubs in São Paulo (GRU), Rio de Janeiro (GIG), Brasília (BSB) and Fortaleza (FOR), and will add to GOL’s existing regular flights to Miami and Orlando. Also, we signed a new codeshare with Avianca Holdings that includes 60 domestic Brazil GOL destinations and 16 GOL international destinations, in 11 countries, and 26 domestic Colombia Avianca destinations and another 50 in America and Europe.
“By strengthening these partnerships, we reiterate our expansion plan in both domestic and international markets and consolidate our purpose of being The First Airline For Everyone. Our codeshare with Air France-KLM covers more than 18 countries, including 66 cities in Europe and more than 30 cities in Brazil. In addition, our recently announced codeshare with American Airlines will offer more daily flights between South America and the U.S. than any other airline partnership. It will double the number of seats we offer in this market,enabling GOL’s customers to travel seamlessly to more than 30 destinations in the U.S,” added Kakinoff.
Agile Fleet Management
Despite the temporary grounding of the 737 MAX aircraft, the flexibility of our fleet plan enabled us to serve all of our markets with a high utilization rate of our aircraft, which reached 12.2 hours in the quarter. GOL’s route network is based on a high connectivity with the main markets. This sophisticated model has enabled us to create greater capillarity for corporate routes and to reduce the average stage length. When combined with the intensive use of data analytics and a focus on the personalization of our services, this has best positioned GOL to capture economic growth. Based on Boeing’s latest forecast, we believe that the regulatory agencies will approve the return of MAX aircraft at the beginning of the second half of 2020.
At the beginning of the fourth quarter, 14 aircraft went under unplanned maintenance on pickle forks, in compliance with FAA Airworthiness Directive. Maintenance was 100% completed at the end of December when the aircraft returned to the fleet, thanks to the prompt response of GOL Aerotech.
In November 2019, GOL Aerotech was formally launched; a new business unit that leverages GOL’s aircraft maintenance expertise to provide aircraft and components maintenance, repairs, and overhauls to third-party airlines. This generates a new source of revenue and reduces our costs for the Company. With 760 employees and over 600,000 hours of availability per year, GOL Aerotech is qualified by ANAC, FAA and EASA to perform maintenance services for four Boeing models: the 737 Classic, the 737 Next Generation, the 737 MAX, and the 767 family. Aviation Capital Group (ACG) and Dubai Aerospace are among our first customers. In 2020, we expect revenues of R$140 million from GOL Aerotech.
Effective Balance Sheet Management
Despite several operational challenges, such as the temporary grounding of the MAX and the unplanned maintenance on the pickle fork, GOL posted outstanding results. We registered record revenues and high margins, with operating cash flow generation around R$1.0 billion in the quarter. Through this, we implemented a R$102.4 million share repurchase program and improved our credit profile.
Quarterly net revenue increased 18.8% year-over-year, with a record of R$3.8 billion in the 4Q19. Currently, trends in revenue and passenger bookings remain strong, and the Company expects the first quarter RASK to increase by 4% to 6%, compared to 1Q19.
GOL remains the lowest unit cost leader in South America for the 19th consecutive year. Recurring CASK in 2019 increased 1.9% over the previous year, to R$21.97. Based on current trends, the Company estimates that the recurring CASK in the first quarter of 2020 will increase approximately 0% to 2%, year-over-year. The Company has a high level of fuel hedging protection in place, with around 90% hedged in the first quarter of 2020 and 68% hedged in 2020.
“We are working hard to further increase GOL's competitiveness through fuel hedging," said Richard Lark, GOL’s CFO.
In 4Q19, recurring earnings per diluted share were R$0.88 and recurring earnings per diluted ADS were US$0.43. Operating activities generated R$1.0 billion in cash in the quarter. From the net cash flow generation of R$637.3 million in 4Q19, we repaid R$617.1 million in debt, paid R$50.2 million of interest on own capital, and repurchased R$102.4 million of shares. Before share repurchases and interest on own capital, free cash flow to equity was R$219.2 million. On December 31, 2019, total liquidity was R$4.3 billion, R$1.3 billion higher than on December 31, 2018.
“We continue to strengthen the Company's equilibrium through disciplined working capital management and capital structure optimization,” added Lark.
In February 2020, GOL signed sale and leaseback agreements for 11 Boeing 737 Next Generation (NG) aircraft. The transaction will reduce GOL’s net debt by approximately R$500 million, comprised of a R$130 million reduction in finance lease debt and a R$370 million increase in cash liquidity. The Company plans to use a portion of these proceeds to call the outstanding amount of its 8.875% Senior Notes due in 2022. The asset management income and reduction in interest expense will contribute over R$420million to the Company’s 2020 earnings and improve GOL’s credit ratios by reducing the net debt/EBITDA ratio by 0.2x and increase the EBITDA/net interest expense ratio by 0.5x.
4 |
|
| Earnings Report Fourth Quarter 2019 |
The results obtained in GOL’s aircraft disposals demonstrate the consistent market value of the Boeing 737 aircraft and the continuous creation of value for all GOL shareholders.Making GOL The First Airline For Everyone is what drives our best-in-Brazil aviation team. “We are, and will continue to be, an even stronger Company,” said Lark.
Operating and Financial Indicators
Traffic Data – GOL (in Millions) | 4Q19 | 4Q18 | % Var. | 2019 | 2018 | % Var. |
RPK GOL – Total | 10,806 | 10,244 | 5.5% | 41,863 | 38,424 | 9.0% |
RPK GOL – Domestic | 9,630 | 9,037 | 6.6% | 36,391 | 34,266 | 6.2% |
RPK GOL – International | 1,176 | 1,207 | -2.6% | 5,472 | 4,158 | 31.6% |
ASK GOL – Total | 13,257 | 12,506 | 6.0% | 51,065 | 48,058 | 6.3% |
ASK GOL – Domestic | 11,667 | 10,901 | 7.0% | 43,897 | 42,428 | 3.5% |
ASK GOL – International | 1,590 | 1,605 | -0.9% | 7,168 | 5,630 | 27.3% |
GOL Load Factor – Total | 81.5% | 81.9% | -0.4 p.p. | 82.0% | 80.0% | 2.0 p.p. |
GOL Load Factor – Domestic | 82.5% | 82.9% | -0.4 p.p. | 82.9% | 80.8% | 2.1 p.p. |
GOL Load Factor – International | 74.0% | 75.2% | -1.2 p.p. | 76.3% | 73.9% | 2.4 p.p. |
Operating Data | 4Q19 | 4Q18 | % Var. | 2019 | 2018 | % Var. |
Revenue Passengers - Pax on Board ('000) | 9,660 | 8,944 | 8.0% | 36,445 | 33,446 | 9.0% |
Aircraft Utilization (Block Hours/Day) | 12.2 | 11.5 | 6.1% | 12.3 | 11.8 | 4.2% |
Departures | 68,228 | 63,431 | 7.6% | 259,377 | 250,040 | 3.7% |
Total Seats (‘000) | 12,142 | 11,079 | 9.6% | 45,574 | 42,968 | 6.1% |
Average Stage Length (km) | 1,089 | 1,108 | -1.7% | 1,114 | 1,098 | 1.5% |
Fuel Consumption (mm liters) | 382 | 365 | 4.7% | 1,475 | 1,403 | 5.1% |
Full-time Employees (at Period End) | 16,113 | 15,294 | 5.4% | 16,113 | 15,294 | 5.4% |
Average Operating Fleet(6) | 117 | 116 | 0.9% | 113 | 112 | 0.9% |
On-time Departures | 86.2% | 87.5% | -1.3 p.p. | 89.0% | 91.8% | -2.8 p.p. |
Flight Completion | 99.2% | 98.6% | 0.6 p.p. | 98.1% | 98.5% | 0.4 p.p. |
Passenger Complaints (per 1,000 pax) | 0.88 | 1.31 | -32.8% | 1.12 | 1.75 | -36.0% |
Lost Baggage (per 1,000 pax) | 2.08 | 2.19 | -5.0% | 2.09 | 2.03 | 3.0% |
Financial Data | 4Q19 | 4Q18(1) | % Var. | 2019 | 2018(1) | % Var. |
Net YIELD (R$ cents) | 33.17 | 29.14 | 13.8% | 31.24 | 27.67 | 12.9% |
Net PRASK (R$ cents) | 27.04 | 23.87 | 13.3% | 25.61 | 22.13 | 15.7% |
Net RASK (R$ cents) | 28.69 | 25.59 | 12.1% | 27.15 | 23.75 | 14.3% |
CASK (R$ cents)(5) | 21.10 | 24.19 | -12.8% | 21.97 | 21.57 | 1.9% |
CASK Ex-Fuel (R$ cents)(5) | 13.49 | 15.17 | -11.1% | 14.05 | 12.95 | 8.5% |
Breakeven Load Factor(5) | 60.0% | 77.4% | -17.4 p.p. | 66.3% | 72.6% | -6.3 p.p. |
Average Exchange Rate(2) | 4.1158 | 3.8084 | 8.1% | 3.9461 | 3.6558 | 7.9% |
End of Period Exchange Rate(2) | 4.0307 | 3.8748 | 4.0% | 4.0307 | 3.8748 | 4.0% |
WTI (Average per Barrel. US$)(3) | 56.87 | 59.34 | -4.2% | 57.04 | 64.90 | -12.1% |
Price per Liter Fuel (R$)(4) | 2.71 | 3.28 | -17.4% | 2.79 | 2.91 | -4.1% |
Gulf Coast Jet Fuel (Average per Liter, US$)(3) | 0.49 | 0.52 | -5.8% | 0.50 | 0.47 | 6.4% |
(1) Amounts restated in accordance with IFRS 16. (2) Source: Brazilian Central Bank; (3) Source: Bloomberg; (4) Fuel expenses excluding hedge results and PIS/COFINS credits/liters consumed; (5) Excluding non-recurring expenses. (6) Average operating fleet excluding aircraft in sub-leasing and MRO. Certain calculations may not match with the financial statements due to rounding.
Domestic market
GOL’s domestic supply increased by 7.0%, and demand increased by 6.6% in comparison to 4Q18. As a result, the Company’s load factor reached 82.5%. GOL transported 9.2 million passengers in the quarter, an increase of 9.5% compared with the same period in 2018. In 2019, GOL’s domestic supply increased by 3.5%, and demand increased by 6.2% year-over-year. The Company is the leader in transporting passengers in the Brazilian market.
International market
GOL’s international supply decreased by 0.9%, and international demand decreased by 2.6% in 4Q19 compared to 4Q18. The Company’s load factor in 4Q19 was 74.0%, a decrease of 1.2 p.p. During the quarter, the Company transported 0.5 million passengers in the international market, the same as in 4Q18. In 2019, GOL’s international supply increased by 27.3%, and demand increased by 31.6% year-over-year.
Volume of Departures and Total Seats
The total volume of GOL departures was 68,228, an increase of 7.6% over 4Q18. The total number of seats available to the market was 12.1 million in the fourth quarter of 2019, increase of 9.6% quarter-over-quarter.
5 |
|
| Earnings Report Fourth Quarter 2019 |
PRASK, Yield and RASK
Net PRASK increased by 13.3% in the quarter when compared to 4Q18, reaching 27.04 cents (R$), driven by a growth in net passenger revenue of 20.1% in the quarter. GOL’s net RASK was 28.69 cents (R$) in 4Q19, an increase of 12.1% over 4Q18. Net yieldincreased by 13.8% over 4Q18, reaching 33.17 cents (R$).
Income Statement
Income Statement in IFRS (R$ MM, unaudited) | 4Q19 | 4Q18(1) | % Var. | 2019 | 2018(1) | % Var. |
Net Operating Revenues | 3,803.3 | 3,200.9 | 18.8% | 13,864.7 | 11,411.4 | 21.5% |
Passenger | 3,584.5 | 2,985.2 | 20.1% | 13,077.7 | 10,633.5 | 23.0% |
Cargo and Other | 218.8 | 215.7 | 1.4% | 787.0 | 777.9 | 1.2% |
Operating Costs and Expenses | (3,108.5) | (2,392.5) | 29.9% | (11,732.0) | (9,482.8) | 23.7% |
Salaries, Wages and Benefits | (647.2) | (522.7) | 23.8% | (2,361.3) | (1,903.8) | 24.0% |
Salaries, Wages and Benefits - Operations | (455.2) | (310.9) | 46.4% | (1,671.6) | (1,215.3) | 37.5% |
Salaries, Wages and Benefits – Other | (192.0) | (211.8) | -9.3% | (689.7) | (688.5) | 0.2% |
Aircraft Fuel | (1,009.3) | (1,127.5) | -10.5% | (4,047.3) | (3,867.6) | 4.6% |
Taxes on Aircraft Fuel | (102.5) | (164.5) | -37.7% | (523.3) | (577.1) | -9.3% |
Aircraft Fuel (Ex-Taxes) | (906.8) | (962.1) | -5.7% | (3,524.0) | (3,289.6) | 7.1% |
Landing Fees | (155.1) | (201.2) | -22.9% | (759.8) | (743.3) | 2.2% |
Passenger Costs | (136.4) | (128.1) | 6.5% | (578.7) | (474.1) | 22.1% |
Services Provided | (183.3) | (174.2) | 5.2% | (707.4) | (613.7) | 15.3% |
Sales and Marketing | (174.8) | (153.8) | 13.7% | (670.4) | (582.1) | 15.2% |
Maintenance Materials and Repairs | (156.9) | (281.6) | -44.3% | (569.2) | (570.3) | -0.2% |
Depreciation and Amortization | (458.6) | (345.8) | 32.6% | (1,728.0) | (1,234.6) | 40.0% |
Other | (186.9) | 542.4 | NM | (309.9) | 506.7 | NM |
Equity Income | - | - | NM | 0.1 | 0.4 | -75.0% |
Operating Result (EBIT) | 694.8 | 808.4 | -14.1% | 2,132.7 | 1,929.0 | 10.6% |
Operating Margin | 18.3% | 25.3% | -7.0 p.p. | 15.4% | 16.9% | -1.5 p.p. |
Financial Results | (134.0) | 19.3 | 12.2% | (1,743.8) | (2,970.5) | -41.3% |
Interest on Loans | (335.3) | (307.0) | 9.2% | (1,266.8) | (1,116.8) | 13.4% |
Gains (Losses) From Financial Investments | 22.1 | 26.1 | -15.3% | 113.9 | 127.2 | -10.5% |
Exchange and Monetary Variations(2) | 372.4 | 394.0 | -5.5% | (180.2) | (1,694.7) | -89.4% |
Derivatives Results, Net | 43.5 | (32.4) | NM | (2.1) | (7.7) | -72.7% |
Exchangeable and Capped Calls Results | (87.5) | - | NM | (169.0) | - | NM |
Other Revenues (Expenses), Net | (149.2) | (61.4) | 143.0% | (239.6) | (278.5) | -14.0% |
Income (Loss) Before Income Taxes | 560.8 | 827.7 | -32.2% | 388.9 | (1,041.5) | -137.3% |
Pre-tax Margin | 14.7% | 25.9% | -11.2p.p. | 2.8% | -9.1% | 11.9 p.p. |
Income Tax | (124.5) | (74.5) | 67.1% | (209.6) | (297.1) | -29.5% |
Current Income Tax | (53.4) | (44.6) | 19.7% | (178.6) | (52.1) | 242.8% |
Deferred Income Tax | (71.1) | (29.9) | 137.8% | (31.0) | (245.0) | -87.3% |
Net Income (Loss) before Minority Interest | 436.3 | 753.2 | -42.1% | 179.3 | (1,338.6) | -113.4% |
Minority Interest | 84.4 | 77.9 | 8.3% | 296.6 | 305.6 | -2.9% |
Net Income (Loss) after Minority Interest | 351.9 | 675.3 | -47.9% | (117.3) | (1,644.2) | -92.9% |
Net Margin(3) | 9.2% | 21.1% | -11.9 p.p. | -0.8% | -14.4% | 13.6 p.p. |
Earnings Per Share (EPS) in R$ | 0.99 | 1.93 | -48.7% | (0.33) | (4.70) | -93.0% |
Weighted Average Shares Outstanding MM(5) | 355.7 | 349.9 | 1.7% | 355.7 | 349.9 | 1.7% |
Earnings Per ADS Equivalent in US$ | 0.48 | 1.01 | -52.5% | (0.17) | (2.57) | -93.4% |
Weighted Average ADSs Outstanding MM(5) | 177.8 | 174.9 | 1.7% | 177.8 | 174.9 | 1.7% |
Earnings Per Diluted Share (EPS) in R$ | 0.90 | - | NM | (0.30) | - | NM |
Weighted Average Diluted Shares Outstanding MM(6) | 391.0 | - | NM | 392.0 | - | NM |
Earnings Per Diluted ADS Equivalent in US$ | 0.44 | - | NM | (0.15) | - | NM |
Weighted Average Diluted ADSs Outstanding MM(6) | 195.5 | - | NM | 196.0 | - | NM |
|
|
|
|
|
|
|
Recurring (R$ MM, unaudited) | 4Q19 | 4Q18(1) | % Var. | 2019 | 2018(1) | % Var. |
Net Income (Loss) Before Minority | 436.3 | 753.2 | -42.1% | 179,3 | (1,338.6) | NM |
Expenses (Revenues), Non-Recurring, Net | (311.5) | 632.1 | NM | (512.3) | 885.1 | NM |
Net Income (Loss) Before Minority(3) | 747,6 | 121,0 | NM | 691,6 | (2.223,7) | NM |
EBITDA(4) | 1,464.9 | 522.1 | 180.5% | 4,373.0 | 2,278.5 | 91.9% |
EBITDA Margin(4) | 38.5% | 16.3% | 22.2 p.p. | 31.5% | 20.0% | 11.5 p.p. |
EBIT(4) | 1,006.3 | 176.3 | NM | 2,645.0 | 1,043.9 | 153.4% |
EBIT Margin(4) | 26.5% | 5.5% | 21.0 p.p. | 19.1% | 9.1% | 10.0 p.p. |
Pre-tax Income(3)(4) | 553.3 | (198.5) | NM | 1,154.2 | (232.1) | NM |
Pre-taxMargin(3)(4) | 14.5% | -6.2% | 20.7 p.p. | 8.3% | -2.0% | 10.3 p.p. |
Net Income After Minority(3)(4) | 344.7 | (350.8) | NM | 648.0 | (834.6) | NM |
Net MarginAfter Minority(3)(4) | 9.1% | -11.0% | 20.1 p.p. | 4.7% | -7.3% | 12.0 p.p. |
Earnings Per Diluted Share (EPS) in R$(3)(4)(6) | 0.88 | - | NM | 1.65 | - | NM |
Earnings Per Diluted ADS Equivalent in US$(3)(4)(6) | 0.43 | - | NM | 0.84 | - | NM |
(1) Amounts restated in accordance with IFRS 16. (2) The difference with the amount disclosed in the statements of operations in the financial statements of the year ended December 31, 2019 is the Exchangeable and Capped Calls results. (3) Excluding unrealized ESN / Capped Calls mark-to-market gains and losses and exchange rate gains and losses on debt. (4)Excluding non-recurring net expenses (revenues). (5) Excluding effects of stock options and warrants related to the Exchangeable. (6) Including effects of stock options and warrants related to the Exchangeable.
6 |
|
| Earnings Report Fourth Quarter 2019 |
Net revenue
Quarterly net revenue was R$3.8 billion, an increase of 18.8% when compared to 4Q18, mainly due to a 20.1% increase in passenger revenues and a 4.9% increase in cargo revenues, partially offset by a 4.0% decrease in loyalty program revenues, in comparison to 4Q18. In 2019, net revenue reached R$13.9 billion, an increase of 21.5% compared to 2018.
GOL carried approximately 9.7 million customers in the quarter (+8.0%), with 9.2 million in the domestic market (+9.5%) and 0.5 million in the international market (+0.3%). Net Passenger Revenue per Available Seat-Kilometer (PRASK) reached 27.04 cents (R$), an increase of 13.3%. Load factor decreased 0.4 p.p., and yield in the quarter increased 13.8% compared to the same period of 2018.
Operating expenses
Total recurring CASK decreased by 12.8%, from 24.19 cents (R$) in 4Q18 to 21.10 cents (R$), primarily due to increased productivity (operating efficiency, aircraft utilization and increase in ASKs), partially offset by increases in depreciation and personnel. Fuel costs per ASK decreased 15.6%, mainly due to reductions in fuel taxes, partially offset by consumption of an additional 7.3 million liters due to the MAX delays.
CASK ex-fuel, excluding non-recurring expenses, decreased by 11.1% in line with what was explained above, which reflects a better productivity (operational efficiency, use of aircraft and increase in ASK), partially offset by 32.6% higher depreciation. This was due to the addition of 16 aircraft in the fleet and a reduction in the depreciable life of capitalized engine maintenance and large components; a 23.8% increase on personnel expenses, mainly due to the increase in the federal payroll tax rate to 20%; and the hiring and training of 819 new employees due to the expansion of operations, new routes and new bases. Fuel costs per ASK decreased 15.6%, mainly due to reductions in fuel taxes.
Breakeven load factor (excluding non-recurring expenses) reduced by 17.4 p.p., reaching 60.0% versus 77.4% in 4Q18, due to passenger net revenue growth in the quarter. The breakdown of the Company’s operating costs and expenses is presented as follows:
Operating Costs and Expenses (R$ MM, unaudited) | 4Q19 | 4Q18(1) | % Var. | 2019 | 2018(1) | % Var. |
Salaries, Wages and Benefits | (647.2) | (522.7) | 23.8% | (2,361.3) | (1,903.8) | 24.0% |
Salaries, Wages and Benefits - Operations | (455.2) | (310.9) | 46.4% | (1,671.6) | (1,215.3) | 37.5% |
Salaries, Wages and Benefits – Other | (192.0) | (211.8) | -9.3% | (689.7) | (688.5) | 0.2% |
Aircraft Fuel | (1,009.3) | (1,127.5) | -10.5% | (4,047.3) | (3,867.6) | 4.6% |
Taxes on Aircraft Fuel | (102.5) | (164.5) | -37.7% | (523.3) | (577.1) | -9.3% |
Aircraft Fuel (Ex-Taxes) | (906.8) | (962.1) | -5.7% | (3,524.0) | (3,289.6) | 7.1% |
Landing Fees | (155.1) | (201.2) | -22.9% | (759.8) | (743.3) | 2.2% |
Passenger Costs | (136.4) | (128.1) | 6.5% | (578.7) | (474.1) | 22.1% |
Services Provided | (183.3) | (174.2) | 5.2% | (707.4) | (613.7) | 15.3% |
Sales and Marketing | (174.8) | (153.8) | 13.7% | (670.4) | (582.1) | 15.2% |
Maintenance Materials and Repairs | (156.9) | (281.6) | -44.3% | (569.2) | (570.3) | -0.2% |
Depreciation and Amortization | (458.6) | (345.8) | 32.6% | (1,728.0) | (1,234.6) | 40.0% |
Other | (186.9) | 542.4 | NM | (309.9) | 506.7 | NM |
Total Operating Expenses | (3,108.5) | (2,392.5) | 29.9% | (11,732.0) | (9,482.8) | 23.7% |
Operating Expenses Ex-Fuel | (2,099.2) | (1,265.0) | 65.9% | (7,684.7) | (5,615.2) | 36.9% |
Non-Recurring Expenses | (311.5) | 632.1 | NM | (512.3) | 885.1 | NM |
Operating Costs and Expenses per ASK (R$ cents) | 4Q19 | 4Q18(1) | % Var. | 2019 | 2018(1) | % Var. |
Salaries, Wages and Benefits | (4.88) | (4.18) | 16.7% | (4.62) | (3.96) | 16.7% |
Salaries, Wages and Benefits - Operations | (3.43) | (2.49) | 37.8% | (3.27) | (2.53) | 29.2% |
Salaries, Wages and Benefits – Other | (1.45) | (1.69) | -14.2% | (1.35) | (1.43) | -5.6% |
Aircraft Fuel | (7.61) | (9.02) | -15.6% | (7.93) | (8.05) | -1.5% |
Taxes on Aircraft Fuel | (0.77) | (1.32) | -41.7% | (1.02) | (1.20) | -15.0% |
Aircraft Fuel (Ex-Taxes) | (6.84) | (7.69) | -11.1% | (6.90) | (6.85) | 0.7% |
Landing Fees | (1.17) | (1.61) | -27.3% | (1.49) | (1.55) | -3.9% |
Passenger Costs | (1.03) | (1.02) | 1.0% | (1.13) | (0.99) | 14.1% |
Services Provided | (1.38) | (1.39) | -0.7% | (1.39) | (1.27) | 9.4% |
Sales and Marketing | (1.32) | (1.23) | 7.3% | (1.31) | (1.21) | 8.3% |
Maintenance Materials and Repairs | (1.18) | (2.25) | -47.6% | (1.11) | (1.19) | -6.7% |
Depreciation and Amortization | (3.46) | (2.77) | 24.9% | (3.38) | (2.57) | 31.5% |
Other | (1.41) | 4.34 | NM | (0.61) | 1.04 | NM |
CASK | (23.45) | (19.13) | 22.6% | (22.97) | (19.73) | 16.4% |
CASK(2) | (21.10) | (24.19) | -12.8% | (21.97) | (21.57) | 1.9% |
CASK Ex-Fuel(2) | (13.49) | (15.17) | -11.1% | (14.05) | (12.95) | 8.5% |
(1) Amounts restated in accordance with IFRS 16. (2) Excluding non-recurring results, net.
7 |
|
| Earnings Report Fourth Quarter 2019 |
Salaries, wages and benefits per ASK: increased 16.7%, mainly due to an increase in the federal payroll taxes rate from 0% to 20%, a 3.5% COLA, an increase on payments per hour due the higher volume of operating hours in 7.5% during 4Q19, and the hiring of 819 new employees for expansion of operations, routes and bases.
Aircraft fuel per ASK:reduced 15.6% primarily due to a decrease in the average fuel price per liter of 17.4%, this primarily due to the reduction of 4.7 p.p. in GOL’s average ICMS tax rate on jet fuel to 9.9% in 4Q19 from an average rate of 14.6% in 4Q18, and a 34.6% decrease in the ex-refinery price due to a 4.2% reduction in the USD oil price per barrel, partially offset by a 8.1% USD appreciation (average rate).
Landing fees per ASK: decreased 27.3% primarily due to the reduction of PIS and COFINS taxes.
Expenses with passengers by ASK:increased 1.0% principally due to an increase ramp and handling costs.
Services provided by ASK:reduced 0.7% principally due to a reduction in consulting expenses.
Sales and marketing per ASK: increased 7.3% primarily due to a 14.5% increase in sales commissions from the increase in net revenue.
Maintenance materials and repairs per ASK(1): decreased 47.6% mainly related to fewer NG aircraft redeliveries, partially offset by advanced scheduled maintenance on two aircraft to support high-season demand.
Depreciation and amortization per ASK: increased 24.9% mainly due to the incorporation of 16 aircraft into the operational fleet and a reduction in the depreciation term for capitalized engine maintenance.
Other expenses per ASK: increased mainly due to the aircraft sales on 4Q18 of R$634.7 million, non-recurring in 2019.
(1) Scheduled maintenance is treated as recurring and un-scheduled maintenance related to the MAX delays is considered non-recurring.
Operating results
Operating income (EBIT) for the quarter was R$1,006.3 million, an increase of R$830.0 million when compared to the same period of 2018. In 2019, operating income reached R$2,645.0 million, an increase of 153% compared to 2018. Operating margin was 26.5%, an increase of 21.0 p.p. over 4Q18. On a per available seat-kilometer basis, recurring EBIT was 7.59 cents (R$) in 4Q19, an increase of 6.19 cents (R$) compared to 4Q18.
EBITDA totaled R$1.5 billion in the period, an increase of 180.5% over 4Q18. EBITDA per available seat-kilometer was 11.05 cents (R$), an increase of 6.88 cents (R$) when compared to the same period last year.
EBIT and EBITDA reconciliation (R$ MM, unaudited)* | 4Q19 | 4Q18(1) | % Var. | 2019 | 2018(1) | % Var. |
Net Income (Loss)(2) | 747.6 | 121.0 | NM | 691.6 | (2,223.7) | NM |
(-) Income Taxes | 124.5 | 74.5 | 67.1% | 209.6 | 297.1 | -29.5% |
(-) Net Financial Result | 134.0 | (19.3) | NM | 1,743.8 | 2,970.5 | -41.3% |
EBIT(2) | 1,006.3 | 176.3 | NM | 2,645.0 | 1,043.9 | 153.4% |
EBIT Margin(2) | 26.5% | 5.5% | 21.0 p.p. | 19.1% | 9.1% | 10.0 p.p. |
(-) Depreciation and Amortization | 458.6 | 345.8 | 32.6% | 1,728.0 | 1,234.6 | 40.0% |
EBITDA(2) | 1,464.9 | 522.1 | 180.5% | 4,373.0 | 2,278.5 | 91.9% |
EBITDA Margin(2) | 38.5% | 16.3% | 22.2 p.p. | 31.5% | 20.0% | 11.5 p.p. |
EBITDA Calculation (R$ cents/ASK, unaudited) | 4Q19 | 4Q18(1) | % Var. | 2019 | 2018(1) | % Var. |
Net Revenues | 28.69 | 25.59 | 12.1% | 27.15 | 23.75 | 14.3% |
Operating Expenses(2) | (21.10) | (24.19) | -12.8% | (21.97) | (21.57) | 1.9% |
EBIT(2) | 7.59 | 1.40 | NM | 5.18 | 2.18 | 137.6% |
Depreciation and Amortization | (3.46) | (2.77) | 24.9% | (3.38) | (2.57) | 31.5% |
EBITDA(2) | 11.05 | 4.17 | 165.0% | 8.56 | 4.75 | 80.2% |
(1) Amounts restated in accordance with IFRS 16. (2) Excluding non-recurring expenses. * In accordance with CVM Instruction 527, the Company presents the reconciliation of EBIT and EBITDA, whereby: EBIT = net income (loss) (+) income tax and social contribution (+) net financial result; and EBITDA = net income (loss) (+) income tax and social contributions (+) net financial result (+) depreciation and amortization. Some report valuesmay differ from the financial statements due to rounding.
Financial Results
Net financial expense was R$134.0 million, an increase of R$153.3 million compared to 4Q18. The variation is mainly due to issuance in March 2019 of Exchangeable Senior Notes. Net results on derivatives were R$75.9 million higher than 4Q18. The exchange and monetary variations resulted in gains of R$21.6 million lower compared to 4Q18.
Interest on loans: increased 9.2%, from R$307.0 million to R$335.3 million, mainly due to an average total debt approximately R$1.0 billion higher than the previous period and the average BRL exchange rate devaluation of 8.1%, partially offset by a reduction in the average interest rate from 6.9% to 5.9%.
8 |
|
| Earnings Report Fourth Quarter 2019 |
Gains from financial investments: reduced R$4.0 million, mainly due to lower yields on investments in fixed income securities and investment funds.
Net exchange and monetary variation:totaled gains of R$372.4 million in 4Q19, a decrease of 5.5% compared to 4Q18. In 3Q19, the Company adopted hedge accounting corresponding to 50 lease agreements with a total volume de R$928.0 million. The total amount in 4Q19 of exchange variation expenses registered in other comprehensive income in shareholders' equity related to the hedge accounting corresponded to R$125.7 million, partially offset by the depreciation of the Brazilian Real vs. U.S. Dollar (end of the period) of R$3.1% in the quarter, from R$4.16 per U.S. Dollar as of September 30, 2019 to R$4.03 per U.S. Dollar as of December 31, 2019.
ESN and capped calls results: registered expenses of R$87.5 million, comprised of R$34.0 million of interest expense, R$110.5 million of unrealized losses on the mark-to-market of the convertible, partially offset by R$18.4 million of unrealized gains on the mark-to-market on the exchange features and capped calls.
Net result of derivatives:was a R$43.5 million gain in 4Q19, in comparison to R$32.4 million loss in 4Q18, mainly due oil price hedging operations.
Other financial expenses: totaled R$149.2 million of expenses in 4Q19, in comparison to R$61.4 million of expenses in 4Q18.
Hedge results
The Company uses hedge accounting for some of its derivative instruments. In 4Q19, GOL registered a net gain of R$31.8 million from hedge operations, of which R$10.5 million were losses recorded in operating income and R$42.3 million were gains recorded in financial income.
Fuel:fuel hedge operations made through derivative contracts tied to WTI resulted in a loss in operating results of R$9.1 million and a gain of R$43.6 million in the financial result in this quarter.
Interest:swap operations to protect the cash flow of future contracted leases, the installments of which are exposed to the volatility of the Libor rate until receiving aircraft, resulted in losses of R$2.1 million in 4Q19.
Exchange rate:the Company recognized R$0.6 million on exchange rate hedge losses in 4Q19.
Income taxes
Income taxes in the quarter represented a loss of R$124.5 million, compared to an income tax expense of R$74.5 million in 4Q18. The Company, GLA and Smiles have net operating loss carryforwards, comprised of accumulated income tax losses and negative basis of social contribution, their use is limited to 30% of the annual taxable income, without limitation period, in the amounts of R$159.6, R$5,017.2 million and R$8.3 million, respectively, and such amounts are not recorded in the Company's balance sheet.
Loyalty Program - Smiles Fidelidade S.A.
Revenues in 4Q19 reduced 9.2% to R$253.2 million. The operating income in 4Q19 increased 13.2% to R$226.8 million, mainly due to the reduction in operating expenses resulting from revenue from tax credits on expenses considered essential to the operation recognized of the last 5 years in the amount of R$50.1 million, previously classified as administrative expenses, resulting in operating margin of 89.6%. Net income in 4Q19 was R$179.5 million (+9.1% compared to 4Q18).
Financial information (R$ MM, unaudited) | 4Q19 | 4Q18 | % Var. | 2019 | 2018 | % Var. |
Net Revenues | 253.2 | 278.9 | -9.2% | 1,051.1 | 987.4 | 6.5% |
Operating Income | 226.8 | 200.4 | 13.2% | 765.8 | 742.0 | 3.2% |
Operating Margin | 89.6% | 71.9% | 17.7 p.p. | 72.9% | 75.1% | -2.2 p.p. |
Net Income | 179.5 | 164.6 | 9.1% | 626.7 | 645.8 | -3.0% |
Net Margin | 70.9% | 59.0% | 11.9 p.p. | 59.6% | 65.4% | -5.8 p.p. |
9 |
|
| Earnings Report Fourth Quarter 2019 |
Net Income and Earnings per Share
In 4Q19, the Company reported net income after minority interest of R$344.7 million (excluding exchange and monetary variations of R$372.4 million gains, non-recurring expenses of R$311.5 and a loss of R$53.7 million related to ExchangeableNotesand capped calls unrealized results), compared to net losses of R$350.8(1) million(excludingnon-recurring gains of R$632.1 and exchange and monetary variations gains of R$394.0 million)during 4Q18, an increase of R$695.5 million. Net margin in 4Q19 was 9.1%, a growth of 20.1 p.p. year-over-year. In 2019, net income after minority interest was R$648.0million (excluding exchange and monetary losses of R$180.2million, non-recurring expenses of R$512.3 and a loss of R$72.8million related to Exchangeable and capped calls unrealized results), compared to netloss of R$834.6(1) million in 2018. Net margin in 2019 was 4.7%, a growth of 12.0 p.p. year-over-year.
Net Result (R$ MM, unaudited) | 4Q19 | 4Q18(1) | % Var. | 2019 | 2018(1) | % Var. |
Net Income (Loss) Before Minority Interest | 436.3 | 753.2 | -42.1% | 179.3 | (1.338.6) | NM |
(-) Minority Interest | 84.4 | 77.9 | 8.3% | 296.6 | 305.6 | -2.9% |
Net Income (Loss) After Minority Interest | 351.9 | 675.3 | -47.9% | (117.3) | (1.644.2) | -92.9% |
(-) ESN And Capped Calls Unrealized Results | 53.7 | - | NM | 72.8 | - | NM |
(-) Exchange Variations, Net(2) | (372.4) | (394.0) | -5.5% | 180.2 | 1.694.7 | -89.4% |
(-) Non-Recurring Expenses and Revenues, net | 311.5 | (632.1) | NM | 512.3 | (885.1) | NM |
Net Income (Loss) | 344.7 | (350.8) | NM | 648.0 | (834.6) | NM |
EPS And EPADS (unaudited) | 4Q19 | 4Q18(1) | % Var. | 2019 | 2018(1) | % Var. |
Weighted Average Shares Outstanding(3) | 355.7 | 349.9 | 1.7% | 355.7 | 349.9 | 1.7% |
Weighted Average Shares ADS Outstanding (4) | 177.8 | 174.9 | 1.7% | 177.8 | 174.9 | 1.7% |
Net Income (Loss) Per Share in R$ | 0.99 | 1.93 | -48.7% | (0.33) | (4.70) | -93.0% |
Net Income (Loss) Per ADS in US$ | 0.48 | 1.01 | -52.5% | (0.17) | (2.57) | -93.4% |
Earnings (Loss) Per Share in R$(5) | 0.97 | (1.00) | NM | 1.82 | (2.39) | NM |
Earnings (Loss) Per ADS in US$(5) | 0.47 | (0.53) | NM | 0.92 | (1.31) | NM |
Earnings Per Diluted Share and Diluted ADS (unaudited) | 4Q19 | 4Q18(6) | % Var. | 2019 | 2018(6) | % Var. |
Weighted Average Shares Outstanding(3) | 391.0 | - | NM | 392.0 | - | NM |
Weighted Average Shares ADS Outstanding(4) | 195.5 | - | NM | 196.0 | - | NM |
Earnings (Loss) Per Diluted Share in R$(5) | 0.88 | - | NM | 1.65 | - | NM |
Earnings (Loss) Per Diluted ADS in US$(5) | 0.43 | - | NM | 0.84 | - | NM |
(1) Amounts restated in accordance with IFRS 16. (2) The difference between the amount presented and the amount disclosed in the financial statements for the year ended in 12/31/2019 is allocated to the ESN and capped calls results. (3) Considers the ratio of 35 common shares per preferred share. Total number of diluted shares considered in calculation was 391.0 million in 4Q19, including the dilution from ESNs conversion into shares. (4) Considers the ratio of 2 preferred shares per ADS. (5) Earnings per diluted share excludes results of (i) exchange variation, net; (ii) Exchangeable and capped calls; and (iii) non-recurring expenses. (6) Not applicable, there is no provision for dilution of impairment in international accounting standards (IFRS).
Earnings per diluted share were R$0.88 in 4Q19.
Earnings per diluted share were R$1.65 in 2019.
Earnings per diluted ADS were US$0.43 in 4Q19.
Earnings per diluted ADS were US$0.84 in 2019.
10 |
|
| Earnings Report Fourth Quarter 2019 |
Cash Flow
As of December 31, 2019, total liquidity (cash and cash equivalents, cash investments, restricted cash, and accounts receivable) totaled R$4.3 billion, an increase of R$238.4 million when compared to September 30, 2019 and R$1.3 billion higher than December 31, 2018.
Operating activities generated R$962.3 million in 4Q19, a decrease of 10.2% when compared to 4Q18, mainly due to lower derivative results, higher consumer claims, more aircraft returns and higher income tax expenses in comparison with 4Q18.
Investment activities consumed a net R$325.0 million in the quarter, mainly due to capitalized engine maintenance of aircraft. Net cash flow was R$637.3 million in the quarter.
Financing activities in 4Q19 consumed R$398.9 million, mainly due to the payment of R$223.1 million of financial debt, R$394.0 million of lease debt in the quarter, R$102.4 million of share repurchases, and R$50.2 million of payments of interest on own capital, partially compensated by R$325.5 million of financings. Before stock repurchases and interest on own capital, cash flow to equity was R$219.2 million.
Consolidated Cash Flow Summary (R$ MM, unaudited) | 4Q19 | 4Q18(2) | % Var. | 3Q19 | % Var. |
Net Income (Loss) For The Period | 436.1 | 753.2 | -42.1% | (171.1) | NM |
Adjustment of Non-Cash Items | 426.8 | 546.8 | -21.9% | 1,450.7 | -70.6% |
Net Income After Adjusting Non-Cash Items | 862.9 | 1,300.0 | -33.6% | 1,279.6 | -32.6% |
Net Cash Provided to Operating Activities | 962.3 | 1,071.6 | -10.2% | 1,075.7 | -10.5% |
Net Cash Provided to (Used In) Investment Activities | (325.0) | (484.8) | -33.0% | (264.7) | 22.8% |
Net Cash Flow | 637.3 | 586.8 | 8.6% | 811.0 | -21.4% |
Net Cash Used In Financing Activities | (398.9) | (615.2) | -35.2% | (441.3) | -9.6% |
Net Increase (Decrease) in Cash, Equivalents and Accounts Receivable(1) | 238.4 | (28.4) | NM | 369.7 | -35.5% |
Total Liquidity at The Beginning of Period | 4,034.6 | 3,008.4 | 34.1% | 3,664.9 | 10.1% |
Accounts Receivable Beginning of Period | 1,178.0 | 1,055.8 | 11.6% | 1,282.3 | -8.1% |
Accounts Receivable End of Period | 1,229.5 | 853.3 | 44.1% | 1,178.0 | 4.4% |
Total Liquidity at The End of Period | 4,273.0 | 2,980.0 | 43.4% | 4,034.6 | 5.9% |
(1) Includes cash, cash equivalents, short-term investments, restricted cash and accounts receivable.(2) Amounts restated in accordance with IFRS 16.
11 |
|
| Earnings Report Fourth Quarter 2019 |
Liquidity and Indebtedness
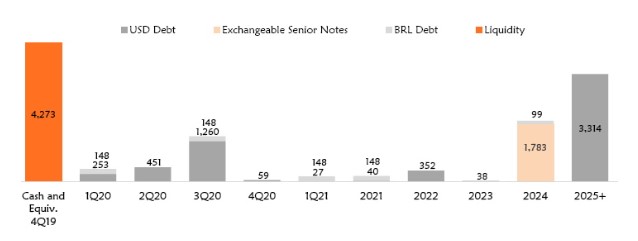
GOL increased its liquidity and reduced its cost of debt during 4Q19. As of December 31, 2019, the Company had total liquidity of R$4.3 billion, an increase of R$1.3 billion compared to December 31, 2018.
The Company registered total loans and financings as of December 31, 2019 of R$14.5 billion (including leases), a decrease of 0.4% versus 3Q19. During the quarter, the Company effected R$659.7 million of total debt service, including R$223.1 million of principal payments and R$36.9 million of interest payments on loans and financing, R$394.0 million of principal payments and R$5.7 million of interest payments related to lease obligations.
The net debt (excluding perpetual bonds and Exchangeable Notes) to EBITDA LTM ratio was 2.4x as of December 31, 2019, compared to 2.5x at September 30, 2019, in a quarter where the US dollar appreciated against the Real by 4.0%. Including the perpetual bonds and Exchangeable Notes, the ratio of net debt to LTM EBITDA as 3.0x at December 31, 2019. The average maturity of the Company's long-term debt in 4Q19, including aircraft leases and financings and perpetual bond is 3.5 years. GOL’s average interest rate on local-currency debt reduced to 5.3%, and its average interest rate on U.S. Dollar-dominated debt, including aircraft leases and financings and perpetual bonds, reduced to 5.9%.
Liquidity (R$ MM, unaudited) | 4Q19 | 4Q18(1) | % Var. | 3Q19 | % Var. |
Cash, Cash Equivalents and Restricted Cash | 3,043.5 | 2,126.7 | 43.1% | 2,856.6 | 6.5% |
Short-Term Accounts Receivable | 1,229.5 | 853.3 | 44.1% | 1,178.0 | 4.4% |
Total Liquidity | 4,273.0 | 2,980.0 | 43.4% | 4,034.6 | 5.9% |
Total Liquidity as % of LTM Net Revenues | 30.8% | 26.1% | 4.7 p.p. | 30.4% | 0.4 p.p. |
Indebtedness (R$ MM, unaudited) | 4Q19 | 4Q18(1) | % Var. | 3Q19 | % Var. |
Loans and Financings | 1,229.5 | 713.6 | 72.3% | 1,247.8 | -1.5% |
Aircraft Financing | 1,322.4 | 1,459.6 | -9.4% | 1,234.6 | 7.1% |
Aircraft Rent | 6,052.8 | 6,283.0 | -3.7% | 6,218.1 | -2.7% |
Debt Issuance | 3,528.1 | 3,745.0 | -5.8% | 3,567.9 | -1.1% |
Exchangeable Notes | 1,783.0 | - | N.M. | 1,680.8 | 6.1% |
Perpetual Notes | 546.8 | 525.6 | 4.0% | 564.9 | -3.2% |
Total Loans and financings | 14,462.6 | 12,726.8 | 13.6% | 14,514.1 | -0.4% |
Short-term debt | 3,947.7 | 2,208.2 | 78.8% | 3,811.3 | 3.6% |
Short-term Debt in US$ | 907.6 | 495.3 | 83.2% | 845.4 | 7.4% |
Short-term Debt in BRL | 289.4 | 289.0 | 0.1% | 290.9 | -0.5% |
Long-term debt | 10,514.9 | 10,518.7 | 0.0% | 10,702.8 | -1.8% |
Long-term Debt in US$ | 2,536.9 | 2,565.5 | -1.1% | 2,501.4 | 1.4% |
Long-term Debt in BRL | 289.3 | 578.0 | -49.9% | 285.9 | 1.2% |
Debt and Leverage(2) (R$ MM, unaudited) | 4Q19 | 4Q18(1) | % Var. | 3Q19 | % Var. |
Gross Debt | 12,132.8 | 12,201.2 | -0.6% | 12,268.4 | -1.1% |
(-) Total Cash | 3,043.5 | 2,126.7 | 43.1% | 2,856.6 | 6.5% |
Net Debt | 9,089.4 | 10,074.5 | -9.8% | 9,411.8 | -3.4% |
% of debt in Foreign Currency | 96.0% | 93.2% | 2.8 p.p. | 96.0% | 0.0 p.p. |
% of debt in Short-Term | 27.3% | 16.4% | 10.9 p.p. | 26.3% | 1.0 p.p. |
% of debt in Long-Term | 72.7% | 83.6% | -10.9 p.p. | 73.7% | -1.0 p.p. |
LTM EBITDA(3) | 3,860.7 | 3,163.6 | 22.0% | 3,861.7 | 0.0% |
Net Debt / LTM EBITDA | 2.4x | 3.2x | -0.8x | 2.5x | -0.1x |
Gross Debt / LTM EBITDA | 3,1x | 3,9x | -0,8x | 3,2x | -0,1x |
(1) The results have been restated based on IFRS 16. (2) Excluding Perpetual and Exchangeable Notes. (3) Excluding non-recurring results.
12 |
|
| Earnings Report Fourth Quarter 2019 |
Financial Debt Amortization Schedule - 4Q19 (R$ MM)
Fleet
At the end of 4Q19, GOL's total fleet was 137 Boeing 737 aircraft, comprised of 130 NGs and 7 MAXs (the latter non-operational). At the end of 4Q18, GOL's total operating fleet was 121 aircraft, of which 6 were MAX aircraft. During the quarter, GOL entered a leasing contracts for 13 additional aircraft, of which 12 were 737-800 NG aircraft and 1 was a 737-700 NG aircraft. The average age of the Company's fleet was 9.9 years at the end of 4Q19.
Total Fleet at the End of Period | 4Q19 | 4Q18 | Var. | 3Q19 | Var. |
B737s | 137 | 121 | +16 | 125 | +12 |
B737-7 NG | 24 | 24 | 0 | 24 | 0 |
B737-8 NG | 106 | 91 | +15 | 94 | +12 |
B737-8 MAX | 7 | 6 | +1 | 7 | 0 |
As of December 31, 2019, the Company had 129 firm orders for the acquisition of Boeing 737 MAX aircraft, of which 99 were orders for 737 MAX-8 and 30 orders were for 737 MAX-10.
Fleet Plan | 2019 | 2020E | 2021E | >2022E | Total |
Operating Fleet at the End of the Year | 137 | 140 |
|
|
|
Aircraft Commitments (R$ MM)* | - | - | 7,113.8 | 58,666.1 | 65,779.9 |
(*) Considers aircraft list price.
In February 2020, GOL signed sale and leaseback agreements on 11 Boeing 737 Next Generation (NG) aircraft. GOL’s aircraft transactions demonstrate the consistent market value of Boeing 737 aircraft and the continuous value creation for all of GOL's shareholders.
13 |
|
| Earnings Report Fourth Quarter 2019 |
Outlook
The Company’s guidance highlights key metrics which impact financial results and drive long-term shareholder value. GOL provides forward-looking information that is focused on the main metrics the Company uses to measure business performance. These indicators are useful for investors and analysts who project GOL’s results.
Financial Outlook (Consolidated, IFRS) | 2020E | 2021E | ||
Previous | Revised |
| Preliminary | |
Total fleet (average) | 134 to 139 | 135 to 139 |
| 137 to 141 |
Total operational fleet (average) | 127 | 125 | 130 | |
ASKs, System (% change) | 7 to 9 | 7 to 9 | 7 to 9 | |
- Domestic | 6 to 9 | 6 to 9 | 6 to 9 | |
- International | 15 to 20 | 7 to 10 | 15 to 20 | |
Seats, System (% change) | 6 to 8 | 8 to 10 | 6 to 8 | |
Departures, System (% change) | 6 to 8 | 7 to 9 | 8 to 10 | |
Net revenues (R$ billion) | ~15.5 | ~15.4 | ~17.0 | |
EBITDA margin (%) | ~30 | ~30 | ~31 | |
EBIT margin (%) | ~19 | ~19 | ~20 | |
Pre-tax margin(1) (%) | ~13 | ~13 | ~13 | |
Effective income tax rate (%) | ~15 | ~15 | ~15 | |
Minority interest(R$ MM) | ~311 | ~250 | ~270 | |
Net Debt / EBITDA(3)(x) | ~2.0x | ~2.0x | ~1.9x | |
Fully-diluted shares out. (2) (mm) | 391 | 391 | 391 | |
EPS, fully diluted(1)(R$) | 2.80 to 3.30 | 2.65 to 3.15 | 4.00 to 4.70 | |
Fully-diluted ADS out.(2) (mm) | 195.5 | 195.5 | 195.5 | |
EPADS, fully diluted(1) (US$) | 1.40 to 1.65 | 1.25 to 1.50 | 1.90 to 2.30 | |
(1) Excluding currency gains and losses and Unrealized gains/losses on Exchangeable Notes. (2) Assumes stock option exercises and conversion of the Exchangeable Notes. (3) Excluding Perpetual and Exchangeable Notes.
14 |
|
| Earnings Report Fourth Quarter 2019 |
Environmental, Social and Governance (“ESG”) Information
GOL seeks to be a world leader in making aviation more sustainable.
The Company manages greenhouse gas emissions (“GHGs”) through fuel efficiency and network management. Since 2016, the Company is in the ICO2 Index, has voluntarily adhered to the Carbon Pricing Leadership Coalition (CPLC), a global initiative to adequately price carbon to mitigate climate change and decarbonize the economy, and Below50, which puts together entities that undertake to use renewable fuel that reduce GHG emissions by 50% or more, if compared to equivalent fossil fuel.
And by providing ESG data to investors, GOL aims to encourage the airline industry as a whole to become more sustainable, green and transparent. GOL reports relevant ESG information to investors in accordance with the Sustainability Accounting Standards Board (“SASB”) standard for the airline industry (TR0201).
The Company is actively looking to increase its sustainability through the adoption of new aviation technologies that reduce fuel consumption and GHG emissions. As part of that strategy, the Company operates a standardized fleet and is transitioning to 737 MAX-8s, which consume 15% less fuel than the 737-800 NG aircraft. Estimates are that the 737 MAX will return to service in the second half of 2020, based on the latest guidance from Boeing, and that the MAX will be GOL's future aircraft that will carry Customers with maximum safety and fuel efficiency.
Environmental | 2019 | 2018 | 2017 | 2016 |
Fuel |
|
|
|
|
Total Fuel Consumed (GJ x 1,000) | 51,492 | 48,935 | 45,891 | 46,331 |
% Fuel Renewable | 0 | 0 | 0 | 0 |
Total Fuel Consumed (liters x 1,000 /ASK) | 28.9 | 29.2 | 29.5 | 30.0 |
Gross global Scope 1 emissions |
|
|
|
|
Greenhouse gas (GHG) emissions (tons CO2) | 3,743,873 | 3,394,307 | 3,316,590 | 3,348,291 |
Greenhouse gas (GHG) emissions/flight hour (tons CO2) | 8.7 | 8.3 | 8.1 | 7.9 |
Greenhouse gas (GHG) eliminated (tons CO2) | 92,221 | 70,606 | 138,910 | 36,820 |
Greenhouse gas (GHG) compensated (tons CO2) | 0 | 0 | 0 | 0 |
Fleet |
|
|
|
|
Average Age of Fleet | 9.9 | 9.5 | 9.2 | 8.0 |
Social | 2019 | 2018 | 2017 | 2016 |
Labor Relations |
|
|
|
|
Employee Gender (% Male/Female) | 55/45 | 55/45 | 55/45 | 55/45 |
Age: Under 30 years (%) | 26 | 29 | 26 | 27 |
Between 30 and 50 years (%) | 62 | 60 | 63 | 63 |
Over 50 years (%) | 12 | 11 | 11 | 10 |
Active Workforce Under Collective-Bargaining Agreements (%) | 100 | 100 | 100 | 100 |
Number and Duration Of Strikes And Lockout (# days) | - | - | - | - |
Customer & Company behavior |
|
|
|
|
Customer Satisfaction Index (SMS score) | 8.28 | 8.39 | 8.33 | 8.24 |
On-time Departures (%) | 88.98 | 91.82 | 94.61 | 94.77 |
Flight Completion (%) | 98.10 | 98.49 | 98.50 | 94.20 |
Lost Baggage (per 1,000 pax) | 2.09 | 2.03 | 2.06 | 2.23 |
Safety |
|
|
|
|
Number of Fatalities | - | - | - | - |
Number of Governmental Enforcement Actions and Aviation Safety | - | - | - | - |
Governance | 2019 | 2018 | 2017 | 2016 |
Management |
|
|
|
|
Independent Directors (%) | 50 | 44 | 44 | 44 |
Participation of Woman in Leadership Positions (%) | 33 | 38 | 37 | 35 |
Committees and Policies |
|
|
|
|
Number of Committees: All With Independent Members Included |
| 5 | 5 | 5 |
Compliance Policy (on IR Website) | ü | ü | ü | ü |
Disclosure of Information and Securities Trading Policy (IR website) | ü | ü | ü | ü |
Shareholder Meetings |
|
|
|
|
Representation of Voting Capital at the Shareholders Meetings (%) | 100 | 100 | 100 | 100 |
15 |
|
| Earnings Report Fourth Quarter 2019 |
Recently adopted accounting standards – IFRS 16
In January 2016, the International Accounting Standards Board ("IASB") issued the accounting pronouncement "IFRS 16 - Leases" adopted in Brazil under CPC 06 (R2). The new standard came into effect for annual periods beginning on January 1, 2019.
For reference, find below the Company’s quarterly periods income statement for the year of 2018, in accordance with IFRS 16:
Statements of operations (R$ MM, unaudited) | 1Q18 | 2Q18 | 3Q18 | 4Q18 | 2018 |
ASK | 12,421.0 | 10,672.7 | 12,458.2 | 12,506.0 | 48,057.9 |
Net operating revenues | 2,964.3 | 2,353.8 | 2,892.4 | 3,200.9 | 11,411.4 |
Passenger | 2,798.9 | 2,146.2 | 2,703.2 | 2,985.2 | 10,633.5 |
Cargo and other | 165.4 | 207.6 | 189.2 | 215.7 | 777.9 |
PRASK | 22.5 | 20.1 | 21.7 | 23.9 | 22.1 |
RASK | 23.9 | 22.1 | 23.2 | 25.6 | 23.7 |
Operating costs and expenses | (2,361.3) | (2,181.1) | (2,547.9) | (2,392.5) | (9,482.8) |
Salaries | (483.7) | (410.7) | (486.7) | (522.7) | (1,903.8) |
Aircraft fuel | (884.2) | (792.7) | (1,063.2) | (1,127.5) | (3,867.6) |
Landing fees | (187.4) | (168.1) | (186.6) | (201.2) | (743.3) |
Passenger costs | (119.7) | (103.9) | (122.4) | (128.1) | (474.1) |
Services provided | (130.2) | (144.3) | (165.0) | (174.2) | (613.7) |
Sales and marketing | (127.3) | (152.7) | (148.3) | (153.8) | (582.1) |
Maintenance materials and repairs | (110.3) | (88.8) | (89.6) | (281.6) | (570.3) |
Depreciation and amortization | (284.7) | (299.9) | (304.2) | (345.8) | (1,234.6) |
Other | (33.8) | (20.0) | 18.1 | 542.4 | 506.7 |
Total CASK | 19.0 | 20.4 | 20.5 | 19.1 | 19.7 |
CASK ex-fuel | 11.9 | 13.0 | 11.9 | 10.1 | 11.7 |
CASK excluding fuel and non-recurring | 12.4 | 13.8 | 12.7 | 15.2 | 13.5 |
Equity | - | 0.2 | 0.2 | - | 0.4 |
Operating Result (EBIT) | 603.0 | 172.9 | 344.7 | 808.4 | 1,929.0 |
EBIT Margin | 20.3% | 7.3% | 11.9% | 25.3% | 16.9% |
EBITDA | 887.6 | 472.9 | 648.8 | 1,154.2 | 3.163.5 |
EBITDA Margin | 29.9% | 20.1% | 22.4% | 36.1% | 27.7% |
Financial results | (321.6) | (1,994.0) | (674.2) | 19.3 | (2.970.5) |
Interest on loans | (250.2) | (269.3) | (290.3) | (298.9) | (1,108.7) |
Gains from financial investments | 35.3 | 21.6 | 32.6 | (43.7) | 45.8 |
Exchange and monetary variations | (38.2) | (1,680.5) | (370.0) | 394.0 | (1,694.7) |
Derivatives result, net | 25.6 | (6.2) | 5.3 | (32.4) | (7.7) |
Other expenses (revenues), net | (94.1) | (59.6) | (51.8) | 0.3 | (205.2) |
Income (loss) before income tax and social contribution | 281.4 | (1,821.1) | (329.5) | 827.7 | (1,041.5) |
Net income (loss) | 215.6 | (1,874.6) | (433.1) | 753.2 | (1,338.9) |
Net income (loss) after non-controlling interests | 142.3 | (1,928.6) | (533.5) | 675.3 | (1,644.5) |
16 |
|
| Earnings Report Fourth Quarter 2019 |
Consolidated Income Statement
(R$ thousand, unaudited) | 4Q19 | 4Q18(1) | % Var. | 2019 | 2018(1) | % Var. |
Net operating revenues | 3,803,343 | 3,200,868 | 18.8% | 13,864,704 | 11,411,354 | 21.5% |
Passenger | 3,584,555 | 2,985,208 | 20.1% | 13,077,743 | 10,633,488 | 23.0% |
Cargo and other | 218,788 | 215,660 | 1.5% | 786,961 | 777,866 | 1.2% |
Total net operating expenses | (3,108,664) | (2,392,534) | 29.9% | (11,732,042) | (9,482,898) | 23.7% |
Salaries | (647,205) | (522,744) | 23.8% | (2,361,268) | (1,903,852) | 24.0% |
Aircraft fuel | (1,009,317) | (1,127,531) | -10.5% | (4,047,344) | (3,867,673) | 4.6% |
Landing fees | (155,027) | (201,235) | -23.0% | (759,774) | (743,362) | 2.2% |
Passenger costs | (136,439) | (128,088) | 6.5% | (578,744) | (474,117) | 22.1% |
Services provided | (183,324) | (174,194) | 5.2% | (707,392) | (613,768) | 15.3% |
Sales and marketing | (174,838) | (153,770) | 13.7% | (670,392) | (581,977) | 15.2% |
Maintenance, materials and repairs | (156,976) | (281,579) | -44.3% | (569,229) | (570,333) | -0.2% |
Depreciation and amortization | (458,544) | (345,811) | 32.6% | (1,727,982) | (1,234,592) | 40.0% |
Other | (186,994) | 542,418 | -134.5% | (309,917) | 506,776 | NM |
Equity income | (2) | 27 | NM | 77 | 387 | -80.1% |
Operating income | 694,677 | 808,361 | -14.1% | 2,132,739 | 1,928,843 | 10.6% |
Financial Income (expense), net | (134,144) | 19,273 | NM | (1,743,794) | (2,970,546) | -41.3% |
Income (Loss) before income taxes | 560,533 | 827,634 | -32.3% | 388,945 | (1,041,703) | NM |
Current income and social contribution taxes | (53,418) | (44,635) | 19.7% | (178,621) | (52,139) | 242.6% |
Deferred income and social contribution taxes | (71,039) | (29,917) | 137.5% | (30,986) | (244,989) | -87.4% |
Net income (loss) before non-controlling interests | 436,076 | 753,082 | -42.1% | 179,338 | (1,338,831) | -113.4% |
Non-controlling interests from Smiles | 84,367 | 77,885 | 8.3% | 296,611 | 305,669 | -3.0% |
Net income (loss) after non-controlling interests | 351,709 | 675,197 | -47.9% | (117,273) | (1,644,500) | -92.9% |
EPS in R$ after non-controlling interests | 0,99 | 1,93 | -48.7% | (0,33) | (4,70) | -93.0% |
Earnings per ADS in US$ after non-controlling interests | 0,48 | 1,01 | -52.5% | (0,17) | (2,57) | -93.4% |
Number of shares at the end of the period (MM) | 355,7 | 349,9 | 1.7% | 355,7 | 349,9 | 1.7% |
(1) results have been restated based on IFRS 16.
17 |
|
| Earnings Report Fourth Quarter 2019 |
Consolidated Balance Sheet
(R$ thousand, unaudited) | 12/31/2019 | 12/31/2018(1) | % Variation |
ASSETS | 15,298,446 | 13,312,800 | 14.9% |
Current assets | 4,927,377 | 3,310,835 | 48.8% |
Cash and cash equivalents | 1,645,425 | 826,187 | 99.2% |
Short-term investments | 953,762 | 478,364 | 99.4% |
Restricted cash | 304,920 | 133,391 | 128.6% |
Trade receivables | 1,229,530 | 853,328 | 44.1% |
Inventories | 199,213 | 180,141 | 10.6% |
Recoverable income taxes | 309,674 | 360,796 | -14.2% |
Advances for suppliers | 142,338 | 68,394 | 108.1% |
Derivatives | 3,500 | - | NM |
Other current assets | 139,015 | 410,234 | -66.1% |
Noncurrent assets | 10,371,069 | 10,001,965 | 3.7% |
Deposits | 1,968,355 | 1,612,295 | 22.1% |
Restricted cash | 139,386 | 688,741 | -79.8% |
Advances for suppliers | 48,387 | - | NM |
Recoverable income taxes | 174,142 | 95,873 | 81.6% |
Deferred taxes | 59,809 | 74,100 | -19.3% |
Other noncurrent assets | 991 | - | NM |
Derivatives | 143,969 | - | NM |
Investments | 1,254 | 1,177 | 6.5% |
Property, plant and equipment | 6,058,101 | 5,752,313 | 5.3% |
Intangible assets | 1,776,675 | 1,777,466 | 0.0% |
LIABILITIES AND SHAREHOLDERS’ EQUITY (DEFICIT) | 15,298,446 | 13,312,800 | 14.9% |
Current liabilities | 10,362,600 | 8,049,596 | 28.7% |
Short-term debt | 2,543,039 | 1,103,206 | 130.5% |
Leases | 1,404,712 | 1,104,957 | 27.1% |
Suppliers | 1,286,275 | 1,403,815 | -8.4% |
Suppliers – Forfaiting | 554,467 | 365,696 | 51.6% |
Salaries | 396,010 | 368,764 | 7.4% |
Income taxes payable | 116,523 | 111,702 | 4.3% |
Landing fees | 728,339 | 556,300 | 30.9% |
Advance ticket sales | 1,966,148 | 1,673,987 | 17.5% |
Mileage program | 1,009,023 | 826,284 | 22.1% |
Advances from customers | 16,424 | 169,967 | -90.3% |
Provisions | 203,816 | 70,396 | 189.5% |
Derivatives | 9,080 | 195,444 | -95.4% |
Other current liabilities | 128,744 | 99,078 | 29.9% |
Noncurrent liabilities | 12,041,263 | 12,204,889 | -1.3% |
Long-term debt | 5,866,802 | 5,340,601 | 9.9% |
Leases | 4,648,068 | 5,178,056 | -10.2% |
Suppliers | 10,142 | 120,137 | -91.6% |
Provisions | 1,053,240 | 829,198 | 27.0% |
Mileage program | 171,651 | 192,569 | -10.9% |
Deferred taxes | 244,041 | 227,290 | 7.4% |
Taxes payable | 84 | 54,659 | -99.8% |
Derivatives | 11,270 | 214,218 | -94.7% |
Other noncurrent liabilities | 35,965 | 48,161 | -25.3% |
Shareholders' equity (deficit) | (7,105,417) | (6,941,685) | 2.4% |
Capital stock | 3,008,178 | 3,055,940 | -1.6% |
Advance for future capital increase | 584 | 2,818 | -79.3% |
Treasury shares | (102,543) | (126) | NM |
Capital reserves | 225,276 | 205,889 | 9.4% |
Equity valuation adjustments | 188,247 | 259,962 | -27.59% |
Accumulated losses | (10,996,413) | (10,946,229) | 0.5% |
Non-controlling interests from Smiles | 571,254 | 480,061 | 19.0% |
(1) 2018 results have been restated based on IFRS 16.
18 |
|
| Earnings Report Fourth Quarter 2019 |
Consolidated Cash Flow
(R$Thousands, unaudited) | 4Q19 | 4Q18(1) | % Var. | 2019 | 2018(1) | % Var. |
Net Income (Loss) for the Period | 436,076 | 753,161 | -42.1% | 179,338 | (1,338,909) | NM |
Adjustment to Reconcile Net Income (Loss) to Cash From Operating Activities |
|
|
|
|
|
|
Depreciation and Amortization | 458,544 | 354,526 | 29.3% | 1,727,982 | 1,252,473 | 38.0% |
Allowance for Doubtful Accounts | 4,663 | (7,482) | NM | 5,668 | (9,789) | NM |
Provisions for Legal Proceedings | 50,177 | 49,802 | 0.8% | 195,465 | 243,860 | -19.8% |
Provision for Inventory Obsolescence | 2,136 | 83 | NM | 2,168 | 5,023 | -56.8% |
Provision for Losses on Advances for Suppliers | 161,228 | - | NM | 161,228 | - | NM |
Present Value Adjustments of Advances for Suppliers | 10,604 | - | NM | 10,604 | - | NM |
Deferred Taxes | 71,039 | 29,917 | 137.5% | 30,986 | 244,989 | -87.4% |
Equity Results | 2 | (27) | NM | (77) | (387) | -80.1% |
Share-Based Payments | 8,590 | 5,207 | 65.0% | 40,725 | 18,572 | 119.3% |
Actuarial Losses on Post-Employment Benefit | 4,907 | - | NM | 4,907 | - | NM |
Exchange and Monetary Variations, net | (268,756) | (407,786) | -34,1% | 399,174 | 1,637,573 | -75,6% |
Interest on Debt, Financial Lease and Other Liabilities | 322,723 | 294,871 | 9,4% | 1,126,527 | 1,077,209 | 4,6% |
Provision and Amortization for Aircraft and Engine Return | (37,613) | - | NM | 231,821 | - | NM |
Reversion of Provision to Maintenance | 130,797 | - | NM | 75,451 | - | NM |
Result Of Derivatives Recognized In Results | (116,879) | - | NM | 22,022 | - | NM |
Unrealized Hedge Results | 110,452 | 29,164 | 278.7% | (40,717) | (13,239) | 207.6% |
Termination of Obligation Due to Contractual Term Reduction | (13,352) | - | NM | (275,921) | - | 0.0% |
Provision for Labor Obligations | (486,154) | 54,865 | NM | (280,320) | 127,618 | NM |
Write-Off of Property, Plant and Equipment and Intangible Assets | 16,294 | 78,401 | -79.2% | 152,017 | 90,639 | 67.7% |
Other | (2,564) | 65,334 | NM | (14,602) | 65,334 | NM |
Adjusted Net Income | 862,914 | 1,300,036 | -33.6% | 3,754,446 | 3,400,966 | 10.4% |
Changes in Operating Assets and Liabilities: |
|
|
|
|
|
|
Trade Receivables | (59,142) | 209,374 | NM | (384,147) | 95,844 | NM |
Short-Term Investments | 134,205 | 236,325 | -43.2% | 162,167 | 695,831 | -76.7% |
Inventories | (6,714) | 23,159 | NM | (21,240) | (6,673) | 218.3% |
Deposits | (206,086) | (151,963) | 35.6% | (399,345) | (372,115) | 7.3% |
Recoverable Taxes | (128,030) | - | NM | (27,147) | - | NM |
Suppliers | 1,950 | (177,975) | NM | (232,021) | 16,382 | NM |
Suppliers Forfaiting | (5,036) | 9,191 | NM | 188,771 | 267,502 | -29.4% |
Advance Ticket Sales | (19,402) | 141,531 | NM | 292,161 | 197,473 | 47.9% |
Mileage Program | 81,881 | 5,876 | NM | 161,821 | 65,535 | 146.9% |
Advances From Customers | 1,884 | (124,998) | NM | (153,543) | 148,249 | NM |
Salaries | 462,820 | (39,630) | NM | 307,566 | (64,308) | NM |
Landing Fees | 39,940 | 325,419 | -87.7% | 172,039 | 190,649 | -9.8% |
Taxes Receivables | 68,409 | (14,623) | NM | 179,706 | 127,663 | 40.8% |
Derivatives | (98,693) | (18,051) | NM | (124,548) | (20,998) | NM |
Fuel Derivative Premium Received (Paid) | (25,381) | 29,383 | NM | (43,008) | 29,383 | NM |
Advance to Suppliers | (21,446) | - | NM | (305,906) | - | NM |
Legal and Aircraft Returns Payments | (108,689) | - | NM | (317,591) | - | NM |
Provisions | - | (63,549) | NM | - | (236,882) | NM |
Other Credits and Obligations, net | 92,827 | (451,330) | NM | 501 | (766,716) | NM |
Prepaid Expenses | (49,352) | - | NM | (49,352) | - | NM |
Interest Paid | (42,539) | (129,914) | -67.3% | (470,794) | (609,128) | -22.7% |
Income Taxes Paid | (53,170) | (6,373) | NM | (229,460) | (167,642) | 36.9% |
Net Cash Flows From Operating Activities | 923,150 | 1,101,888 | -16.2% | 2,461,076 | 2,991,015 | -17.7% |
Short-Term Investments of Smiles | 40,654 | 134,898 | -69.9% | (501,607) | (163,218) | 207.3% |
Restricted Cash | 377,826 | (506,828) | NM | 377,826 | (548,928) | NM |
Receipt of Interest on Capital and Dividends Received | - | 543 | NM | - | 543 | NM |
Advances for Property, Plant and Equipment Acquisition | 8,614 | (23,277) | NM | (30,804) | (106,628) | -71.1% |
Aircraft Sale | - | - | NM | 348,389 | - | NM |
Acquisition of Property, Plant and Equipment | (311,263) | (2,574) | NM | (872,570) | (686,946) | 27.0% |
Acquisition of Intangible Assets | (22,332) | (26,123) | -14.5% | (75,845) | (82,079) | -7.6% |
Net Cash Flows Used in Investing Activities | (107,342) | (423,361) | -74.6% | (754,611) | (1,587,256) | -52.5% |
Loan Funding | 325,575 | 881,106 | -63.0% | 2,275,615 | 1,703,933 | 33.6% |
Loan Funding and Exchange Offer Costs | (3,871) | (23,565) | -83.6% | (80,953) | (39,926) | 102.8% |
Loan Payments | (223,124) | (1,129,227) | -80.2% | (793,537) | (1,318,349) | -39.8% |
Senior Notes Early Redemption | - | (2,794) | NM | - | (630,989) | NM |
Lease Payments | (393,992) | (348,716) | 13.0% | (1,617,677) | (1,160,401) | 39.4% |
Repurchase of Treasury Shares | (102,417) | - | NM | (102,417) | (15,929) | NM |
Derivative Operation Premiums | (4,300) | - | NM | (407,322) | - | NM |
Dividends And Interest Equity Paid to Non-Controlling Interest | (1,092) | (302) | 261.6% | (210,242) | (219,795) | -4.3% |
Warrants | 3,116 | - | NM | 12,250 | - | NM |
Capital Increase | 28,950 | 5,658 | NM | 31,526 | 15,428 | 104.3% |
Capital Increase of Non-Controlling Shareholders | - | - | NM | - | 875 | NM |
Shares to Issue | (27,759) | 2,651 | NM | 584 | 2,818 | -79.3% |
Net Cash Used in Financing Activities | (398,914) | (615,189) | -35.2% | (892,173) | (1,662,335) | -46.3% |
Foreign Exchange Variation on Cash Held In Foreign Currencies | (30,934) | 72,409 | NM | 4,946 | 57,901 | -91.5% |
Net Increase (Decrease) in Cash and Cash Equivalents | 385,960 | 135,747 | 184.3% | 819,238 | (200,675) | NM |
Cash and Cash Equivalents at Beginning of the Period | 1,259,465 | 690,440 | 82.4% | 826,187 | 1,026,862 | -19.5% |
Cash and Cash Equivalents at The End of the Period | 1,645,425 | 826,187 | 99.2% | 1,645,425 | 826,187 | 99.2% |
(1) 2018 results have been restated based on IFRS 16.
19 |
|
| Earnings Report Fourth Quarter 2019 |
Glossary of industry terms
· AIRCRAFT LEASING:an agreement through which a company (the lessor), acquires a resource chosen by its client (the lessee) for subsequent rental to the latter for a determined period.
· AIRCRAFT UTILIZATION:the average number of hours operated per day by the aircraft.
· AVAILABLE SEAT KILOMETERS (ASK):the aircraft seating capacity multiplied by the number of kilometers flown.
· AVAILABLE FREIGHT TONNE KILOMETER (AFTK): cargo capacity in tonnes multiplied by number of kilometers flown.
· AVERAGE STAGE LENGTH:the average number of kilometers flown per flight.
· EXCHANGEABLE SENIOR NOTES (ESN): convertible securities.
· BLOCK HOURS:the time an aircraft is in flight plus taxiing time.
· BREAKEVEN LOAD FACTOR:the passenger load factor that will result in passenger revenues being equal to operating expenses.
· BRENT:oil produced in the North Sea, traded on the London Stock Exchange and used as a reference in the European and Asian derivatives markets.
· CHARTER:a flight operated by an airline outside its normal or regular operations.
· FREIGHT LOAD FACTOR (FLF):percentage of cargo capacity that is actually utilized (calculated dividing FTK by AFTK)
· FREIGHT TONNE KILOMETERS (FTK): weight of revenue cargo in tonnes multiplied by number of kilometers flown by such tonnes.
· LESSOR:the party renting a property or other asset to another party, the lessee.
· LOAD FACTOR:the percentage of aircraft seating capacity that is actually utilized (calculated by dividing RPK by ASK).
· LONG-HAUL FLIGHTS:long-distance flights (in GOL's case, flights of more than four hours' duration).
· OPERATING COST PER AVAILABLE SEAT KILOMETER (CASK):operating expenses divided by the total number of available seat kilometers.
· OPERATING COST PER AVAILABLE SEAT KILOMETER EX-FUEL (CASK EX-FUEL):operating cost divided by the total number of available seat kilometers excluding fuel expenses.
· OPERATING REVENUE PER AVAILABLE SEAT KILOMETER (RASK):total operating revenue divided by the total number of available seat kilometers.
· PASSENGER REVENUE PER AVAILABLE SEAT KILOMETER (PRASK): total passenger revenue divided by the total number of available seat kilometers.
· PDP:credit for advance payments for aircraft purchases financing.
· REVENUE PASSENGERS:the total number of passengers on board who have paid more than 25% of the full flight fare.
· REVENUE PASSENGER KILOMETERS (RPK):the sum of the products of the number of paying passengers on a given flight and the length of the flight.
· SALE-LEASEBACK: a financial transaction whereby a resource is sold and then leased back, enabling use of the resource without owning it.
· SLOT:the right of an aircraft to take off or land at a given airport for a determined period of time.
· SUB-LEASE:an arrangement whereby a lessor in a rent agreement leases the item rented to a fourth party.
· TOTAL CASH:the sum of cash, financial investments and short and long-term restricted cash.
· WTI BARREL:West Texas Intermediate - the West Texas region, where US oil exploration is concentrated. Serves as a reference for the US petroleum byproduct markets.
· YIELD PER PASSENGER KILOMETER:the average value paid by a passenger to fly one kilometer.
About GOL Linhas Aéreas Inteligentes S.A.
GOLserves more than 36 million passengers annually. With Brazil's largest network,GOL offers customers more than 750 daily flights to over 100 destinations in Brazil and in South America, the Caribbean and the United States.GOLLOG’s cargo transportation and logistics business serves more than 3,400 Brazilian municipalities and more than 200 international destinations in 95 countries.SMILES allows over 16 million registered clients to accumulate miles and redeem tickets to more than 700 destinations worldwide on the GOL partner network. Headquartered in São Paulo, GOL has a team of approximately 16,000 highly skilled aviation professionals and operates a fleet of 137 Boeing 737 aircraft, delivering Brazil's top on-time performance and an industry leading 19-year safety record. GOL has invested billions of Reais in facilities, products and services and technology to enhance the customer experience in the air and on the ground. GOL's shares are traded on the NYSE (GOL) and the B3 (GOLL4). For further information, visitwww.voegol.com.br/ir.
Disclaimer
This release contains forward-looking statements relating to the prospects of the business, estimates for operating and financial results, and those related to growth prospects of GOL, as well as the expected impact of the recently issued accounting standard IFRS 16. These are merely estimates and projections and, as such, are based exclusively on the expectations of GOL’s management. Such forward-looking statements depend, substantially, on external factors, in addition to the risks disclosed in GOL’s filed disclosure documents and are, therefore, subject to change without prior notice.
Non-GAAP Measures
To be consistent with industry practice. GOL discloses so-called non-GAAP financial measures, which are not recognized under IFRS or U.S. GAAP, including “Net Debt”, “total liquidity” and "EBITDA". The Company’s management believes that disclosure of non-GAAP measures provides useful information to investors, financial analysts and the public in their review of its operating performance and their comparison of its operating performance to the operating performance of other companies in the same industry and other industries. However, these non-GAAP items do not have standardized meanings and may not be directly comparable to similarly-titled items adopted by other companies. Potential investors should not rely on information not recognized under IFRS as a substitute for the GAAP measures of earnings or liquidity in making an investment decision.
Contacts
E-mail:ri@voegol.com.br
Phone: +55 (11) 2128-4700
Website:www.voegol.com.br/ir
21 |
|
SIGNATURE
Pursuant to the requirements of the Securities Exchange Act of 1934, the registrant has duly caused this report to be signed on its behalf by the undersigned, thereunto duly authorized.
Date:February 20, 2020
GOL LINHAS AÉREAS INTELIGENTES S.A. | |
By: | /s/ Richard F. Lark, Jr. |
| Name: Richard F. Lark, Jr. Title: Investor Relations Officer |
FORWARD-LOOKING STATEMENTS
This press release may contain forward-looking statements. These statements are statements that are not historical facts, and are based on management’s current view and estimates of future economic circumstances, industry conditions, company performance and financial results. The words “anticipates,” “believes,” “estimates,” “expects,” “plans” and similar expressions, as they relate to the company, are intended to identify forward-looking statements. Statements regarding the declaration or payment of dividends, the implementation of principal operating and financing strategies and capital expenditure plans, the direction of future operations and the factors or trends affecting financial condition, liquidity or results of operations are examples of forward-looking statements. Such statements reflect the current views of management and are subject to a number of risks and uncertainties. There is no guarantee that the expected events, trends or results will actually occur. The statements are based on many assumptions and factors, including general economic and market conditions, industry conditions and operating factors. Any changes in such assumptions or factors could cause actual results to differ materially from current expectations.