SECURITIES AND EXCHANGE COMMISSION
Washington, D.C. 20549
FORM 6-K
REPORT OF FOREIGN ISSUER
PURSUANT TO RULE 13a-16 OR 15d-16 OF THE
SECURITIES EXCHANGE ACT OF 1934
For the month of May 2020
(Commission File No. 001-32221)
GOL LINHAS AÉREAS INTELIGENTES S.A.
(Exact name of registrant as specified in its charter)
GOL INTELLIGENT AIRLINES INC.
(Translation of registrant’s name into English)
Praça Comandante Linneu Gomes, Portaria 3, Prédio 24
Jd. Aeroporto
04630-000 São Paulo, São Paulo
Federative Republic of Brazil
(Address of registrant’s principal executive offices)
Indicate by check mark whether the registrant files or will file
annual reports under cover Form 20-F or Form 40-F.
Form 20-F ___X___ Form 40-F ______
Indicate by check mark whether the registrant by furnishing the
information contained in this Form is also thereby furnishing the
information to the Commission pursuant to Rule 12g3-2(b) under
the Securities Exchange Act of 1934.
Yes ______ No ___X___
Individual and Consolidated
Preliminary Quarterly Information, Without Independent Auditors’ Limited Review Report
The preliminary quarterly information as of and for the three-month period ended March 31, 2020, without independent auditors’ limited review report is part of the (appendix) Earnings Release First Quarter 2020.
GOL Linhas Aéreas Inteligentes S.A.
March 31, 2020
Gol Linhas Aéreas Inteligentes S.A.
Individual and Consolidated Preliminary Quarterly Information, without Independent Auditors’ Limited Review Report
March 31, 2020
Contents
Balance sheets | 03 |
Income statements | 05 |
Statements of Comprehensive Income | 06 |
Statements of Changes in Shareholders’ Equity | 07 |
Statements of Cash Flows | 08 |
Statements of Value Added | 10 |
Notes to the individual and consolidated preliminary quarterly information | 11 |
Gol Linhas Aéreas Inteligentes S.A.
NOTICE TO THE USERS OF THE PRELIMINARY QUARTERLY INFORMATION – PARENT COMPANY AND CONSOLIDATEDWITHOUT INDEPENDENT AUDITORS’ LIMITED REVIEW REPORT
The preliminary quarterly information as of and for the three-month period ended March 31, 2020 contained herein has not been subject to a limited review by GOL's independent auditors. The complete quarterly Information for the first quarter of 2020 is still under review by the Company's independent auditors and will be released after the completion of the relevant work by the independent auditors.
As the complete quarterly information are still subject to review by GOL's independent auditors, the preliminary quarterly information for the first quarter of 2020 is subject to adjustments and changes, which may cause the results, performances or events hereby disclosed to be substantially different from those to be reported in the company's complete quarterly information to be released after the issuance of the limited review report by the Company’s independent auditors. Notwithstanding, GOL does not anticipate that adjustments or changes to the information disclosed herein will be necessary.
| Balance sheets (without independent auditors’ limited review report) March 31, 2020 and December 31, 2019 (In thousands of Reais - R$)
|
Parent company | Consolidated | ||||
Assets | Note | 03/31/2020 | 12/31/2019 | 03/31/2020 | 12/31/2019 |
(Unaudited) |
| (Unaudited) | |||
Current assets | |||||
Cash and cash equivalents | 6 | 438,663 | 1,016,746 | 659,027 | 1,645,425 |
Short-term investments | 7 | 514 | 673 | 1,133,502 | 953,762 |
Amounts receivable | 1,3 | 446,942 | - | 446,942 | - |
Restricted cash | 8 | 6,545 | 6,399 | 1,059,579 | 304,920 |
Trade receivables | 9 | - | - | 791,841 | 1,229,530 |
Inventories | 10 | - | - | 215,780 | 199,213 |
Recoverable taxes | 11 | 6,686 | 5,163 | 205,227 | 309,674 |
Derivative assets | 34,2 | - | - | - | 3,500 |
Advance to suppliers and third Parties | 13 | 48 | 37 | 187,328 | 142,338 |
Other assets |
| 66,297 | 79,587 | 172,386 | 139,015 |
Total current assets |
| 965,695 | 1,108,605 | 4,871,612 | 4,927,377 |
|
|
|
| ||
Noncurrent |
|
|
| ||
Restricted cash | 9 | - | - | 140,195 | 139,386 |
Deposits | 14 | 129,070 | 112,502 | 2,411,796 | 1,968,355 |
Advance to suppliers and third parties | 13 | - | - | 48,665 | 48,387 |
Recoverable taxes | 11 | 17,538 | 22,449 | 417,403 | 174,142 |
Deferred taxes | 12 | 54,618 | 56,903 | 58,102 | 59,809 |
Other credits and amounts |
| - | - | 4,033 | 991 |
Related parties | 28 | 4,921,516 | 3,440,701 | - | - |
Derivative assets | 34,2 | 14,127 | 143,969 | 14,127 | 143,969 |
Investments | 15 | 545,817 | 501,986 | 1,254 | 1,254 |
Property, plant and equipment | 16 | 541 | 240,379 | 5,884,464 | 6,058,101 |
Intangible assets | 17 | - | - | 1,773,176 | 1,776,675 |
Total noncurrent assets |
| 5,683,227 | 4,518,889 | 10,753,215 | 10,371,069 |
|
|
|
|
|
|
Total |
| 6,648,922 | 5,627,494 | 15,624,827 | 15,298,446 |
The accompanying notes are an integral part of the individual and consolidated preliminary quarterly information.
3
| Balance sheets (without independent auditors’ limited review report) March 31, 2020 and December 31, 2019 (In thousands of Reais - R$)
|
| Parent company | Consolidated | |||
Liabilities | Note | 03/31/2020 | 12/31/2019 | 03/31/2020 | 12/31/2019 |
(Unaudited) | (Unaudited) | ||||
Current liabilities | |||||
Loans and financing | 18 | 1,636,180 | 1,359,547 | 3,208,438 | 2,543,039 |
Leases | 19 | - | - | 1,781,432 | 1,404,712 |
Suppliers | 20 | 16,834 | 19,116 | 1,272,819 | 1,286,275 |
Suppliers - forfaiting | 21 | - | - | 781,600 | 554,467 |
Salaries |
| 34 | 137 | 406,595 | 396,010 |
Taxes payable | 22 | 1,691 | 4,261 | 113,940 | 116,523 |
Landing fees |
| - | - | 779,939 | 728,339 |
Advance ticket sales | 23 | - | - | 1,604,106 | 1,966,148 |
Mileage program |
| - | - | 1,124,633 | 1,009,023 |
Advances from customers |
| - | - | 19,691 | 16,424 |
Provisions | 24 | - | - | 270,327 | 203,816 |
Derivatives | 34,2 | - | - | 702,604 | 9,080 |
Other liabilities |
| - | - | 68,316 | 128,744 |
Total current liabilities |
| 1,654,739 | 1,383,061 | 12,134,440 | 10,362,600 |
|
|
|
|
|
|
Noncurrent liabilities |
|
| |||
Loans and financing | 18 | 5,720,569 | 5,235,593 | 6,315,251 | 5,866,802 |
Leases | 19 | - | - | 5,637,222 | 4,648,068 |
Suppliers | 20 | - | - | 56,203 | 10,142 |
Provisions | 24 | - | - | 1,342,356 | 1,053,240 |
Mileage program |
| - | - | 217,342 | 171,651 |
Deferred taxes | 12 | - | - | 260,900 | 244,041 |
Taxes payable | 22 | - | - | 21 | 84 |
Related parties | 28 | 454,889 | 163,350 | - | - |
Derivatives | 34,2 | - | - | 65,597 | 11,270 |
Provision for loss on investment | 15 | 9,832,633 | 6,498,660 | - | - |
Other liabilities |
| 23,393 | 23,501 | 34,940 | 35,965 |
Total noncurrent liabilities |
| 16,031,484 | 11,921,104 | 13,929,832 | 12,041,263 |
|
|
|
|
|
|
Equity (deficit) |
|
|
| ||
Capital stock | 25,1 | 3,008,178 | 3,008,178 | 3,008,178 | 3,008,178 |
Capital increase |
| 727 | 584 | 727 | 584 |
Treasury shares | 25,2 | (102,543) | (102,543) | (102,543) | (102,543) |
Capital reserves |
| 230,751 | 225,276 | 230,751 | 225,276 |
Equity valuation adjustments |
| (889,042) | 188,247 | (889,042) | 188,247 |
Accumulated losses |
| (13,285,372) | (10,996,413) | (13,285,372) | (10,996,413) |
Deficit attributable to equity holders of the parent company |
| (11,037,301) | (7,676,671) | (11,037,301) | (7,676,671) |
|
|
|
| ||
Non-controlling interest (NCI) |
| - | - | 597,856 | 571,254 |
Total deficit |
| (11,037,301) | (7,676,671) | (10,439,445) | (7,105,417) |
|
|
|
| ||
Total liabilities and deficit |
| 6,648,922 | 5,627,494 | 15,624,827 | 15,298,446 |
The accompanying notes are an integral part of the individual and consolidated preliminary quarterly information.
4
Income Statements(without independent auditors’ limited review report)Quarters ended on March 31, 2020 and 2019(In thousands of Reais - R$, except Basic and Diluted Earnings (Loss) per Share) |
Income Statement
| Parent company | Consolidated | |||
| Note | 03/31/2020 | 03/31/2019 | 03/31/2020 | 03/31/2019 |
|
| (Unaudited) |
| (Unaudited) |
|
|
|
|
|
|
|
Net revenue |
|
|
|
|
|
Passenger |
| - | - | 2,941,333 | 3,033,553 |
Cargo and other |
| - | - | 206,394 | 177,255 |
Total net revenue | 29 | - | - | 3,147,727 | 3,210,808 |
|
|
|
|
|
|
Cost of services provided | 30 | - | - | (2,579,910) | (2,302,137) |
Gross profit |
| - | - | 567,817 | 908,671 |
|
|
|
|
|
|
Operating income (expenses) |
|
|
|
|
|
Selling expenses |
| - | - | (168,957) | (186,005) |
Administrative expenses |
| (4,999) | (4,635) | (328,277) | (224,458) |
Other income and expenses, net |
| 376,308 | 18,145 | 954,838 | 7,924 |
Total operating expenses | 30 | 371,309 | 13,510 | 457,604 | (402,539) |
|
|
|
|
|
|
Equity method investees | 15 | (2,217,639) | 17,865 | - | 78 |
|
|
|
|
|
|
Income before financial income (Expense), exchange (variation) and income taxes |
| (1,846,330) | 31,375 | 1,025,421 | 506,210 |
|
|
|
|
|
|
Financial results |
|
|
|
|
|
Financial income |
| 616,916 | 74,137 | 698,246 | 102,440 |
Financial expenses |
| (334,259) | (146,168) | (998,456) | (388,203) |
Total financial results, net | 31 | 282,657 | (72,031) | (300,210) | (285,763) |
|
|
|
|
|
|
Income before exchange rate variation, net |
| (1,563,673) | (40,656) | 725,211 | 220,447 |
|
|
|
|
|
|
Exchange rate change, net | 31 | (721,263) | (15,029) | (2,943,404) | (115,332) |
|
|
|
|
|
|
(Loss) income Before Income Taxes |
| (2,284,936) | (55,685) | (2,218,193) | 105,115 |
|
|
|
|
|
|
Income taxes |
|
|
|
|
|
Current |
| (1,048) | (1,913) | (24,273) | (40,048) |
Deferred |
| (2,285) | 25,291 | (19,143) | (29,861) |
Total income taxes | 12 | (3,333) | 23,378 | (43,416) | (69,909) |
|
|
|
|
|
|
Net income (loss) for the period before minority interests |
| (2,288,269) | (32,307) | (2,261,609) | 35,206 |
|
|
|
|
|
|
Net income (loss) attributable to: |
|
|
|
|
|
Equity holders of the parent company |
| (2,288,269) | (32,307) | (2,288,269) | (32,307) |
Non-controlling interest shareholders |
| - | - | 26,660 | 67,513 |
|
|
|
|
|
|
Basic loss per share | 26 |
|
|
|
|
Per common share |
| (0.184) | (0.003) | (0.184) | (0.003) |
Per preferred share |
| (6.433) | (0.092) | (6.433) | (0.092) |
|
|
|
|
|
|
Diluted loss per share | 26 |
|
|
|
|
Per common share |
| (0.184) | (0.003) | (0.184) | (0.003) |
Per preferred share |
| (6.433) | (0.092) | (6.433) | (0.092) |
The accompanying notes are an integral part of the individual and consolidated preliminary quarterly information.
5
Statements of Comprehensive Income(without independent auditors’ limited review)Quarters ended on March 31, 2020 and 2019(In thousands of Reais - R$)
|
Statement of comprehensive income
| Parent company | Consolidated | ||
| 03/31/2020 | 03/31/2019 | 03/31/2020 | 03/31/2019 |
| (Unaudited) | (Unaudited) |
| |
|
|
|
|
|
Net income (loss) for the period | (2,288,269) | (32,307) | (2,261,609) | 35,206 |
| ||||
Other comprehensive income to be reclassified | ||||
Cash flow hedge, net of income tax and social contribution | (1,077,289) | 256,819 | (1,077,289) | 256,819 |
| (1,077,289) | 256,819 | (1,077,289) | 256,819 |
| ||||
Total comprehensive income loss for the period | (3,365,558) | 224,512 | (3,338,898) | 292,025 |
Comprehensive income loss attributable to: | ||||
Equity holders of the parent company | (3,365,558) | 224,512 | (3,365,558) | 224,512 |
Non-controlling interest shareholders | - | - | 26,660 | 67,513 |
The accompanying notes are an integral part of the individual and consolidated preliminary quarterly information.
6
Statements of Changes in Shareholders’ Equity(without independent auditors’ limited review)Quarters ended on March 31, 2020 and 2019(In thousands of Reais - R$)
|
DMPL
| Parent company and consolidated | ||||||||||||
|
|
|
| Capital reserves | adjustments of equity valuation |
|
|
|
| ||||
| Capital stock | Advance for future capital increase | Treasury shares | Premium on transfer of shares | Special premium reserve of subsidiary | Share- based payments | Cash flow hedge reserve | Post-employment benefit | Net gains from purchase/sale of non-controlling interest | Accumulated losses | Deficit attributable to equity holders of the parent company | Non-controlling interests | Total |
Balances as of december 31, 2018 | 2,942,612 | 2,818 | (126) | 17,497 | 70,979 | 117,413 | (500,022) | - | 759,984 | (8,396,567) | (4,985,412) | 480,061 | (4,505,351) |
|
|
|
|
|
|
|
|
|
|
|
|
|
|
Adoption of accounting standards | - | - | - | - | - | - | - | - | - | (2,482,573) | (2,482,573) | (256) | (2,482,829) |
Adjusted balance as of january 1, 2019 | 2,942,612 | 2,818 | (126) | 17,497 | 70,979 | 117,413 | (500,022) |
| 759,984 | (10,879,140) | (7,467,985) | 479,805 | (6,988,180) |
Other comprehensive income (loss), net | - | - | - | - | - | - | 256,819 | - | - | - | 256,819 | - | 256,819 |
Capital Increase by stock options period | 4,589 | (2,306) | - | - | - | - | - | - | - | - | 2,283 | 106 | 2,389 |
Stock options exercised | - | - | - | - | - | 3,557 | - | - | - | - | 3,557 | 384 | 3,941 |
Effects of the change in interest in investment | - | - | - | - | - | - | - | - | (649) | - | (649) | 649 | - |
Net loss for the period | - | - | - | - | - | - | - | - | - | (32,307) | (32,307) | 67,513 | 35,206 |
Dividends and interest on shareholders’ equity paid by Smiles subsidiary | - | - | - | - | - | - | - | - | - | - | - | (8,249) | (8,249) |
Balances as of march 31, 2019 | 2,947,201 | 512 | (126) | 17,497 | 70,979 | 120,970 | (243,203) | - | 759,335 | (10,911,447) | (7,238,282) | 540,208 | (6,698,074) |
|
|
|
|
|
|
|
|
|
|
|
|
|
|
Balances as of december 31, 2019 | 3,008,178 | 584 | (102,543) | 17,497 | 83,229 | 124,550 | (530,043) | (41,045) | 759,335 | (10,996,413) | (7,676,671) | 571,254 | (7,105,417) |
Other comprehensive income (loss), net | - | - | - | - | - | - | (1,077,289) | - | - | - | (1,077,289) | - | (1,077,289) |
Net income (loss) for the period | - | - | - | - | - | - | - | - | - | (2,288,269) | (2,288,269) | 26,660 | (2,261,609) |
Total comprehensive income (loss) for the period | - | - | - | - | - | - | (1,077,289) | - | - | (2,288,269) | (3,365,558) | 26,660 | (3,338,898) |
Capital increase by stock options period | - | 143 | - | - | - | - | - | - | - | - | 143 | - | 143 |
Stock options | - | - | - | - | - | 5,005 | - | - | - | - | 5,005 | (58) | 4,947 |
Effects of the change in Interest in investment | - | - | - | - | 470 | - | - | - | - | (690) | (220) | - | (220) |
Balances as of march 31, 2020(Unaudited) | 3,008,178 | 727 | (102,543) | 17,497 | 83,699 | 129,555 | (1,607,332) | (41,045) | 759,335 | (13,285,372) | (11,037,301) | 597,856 | (10,439,445) |
The accompanying notes are an integral part of the individual and consolidated preliminary quarterly information.
7
Statements of Cash Flows(without independent auditors’ limited review)Quarters ended on March 31, 2020 and 2019(In thousands of Reais - R$)
|
DFC
| Parent company | Consolidated | ||
| 03/31/2020 | 03/31/2019 | 03/31/2020 | 03/31/2019 |
| (Unaudited) |
| (Unaudited) |
|
|
|
|
|
|
Net income (loss) for the period | (2,288,269) | (32,307) | (2,261,609) | 35,206 |
Adjustments to reconcile net income (loss) to net cash flows from Operating activities |
|
|
|
|
Depreciation and amortization | - | - | 528,036 | 405,577 |
Provision (reversal) for expected credit losses | - | - | 2,518 | (6,986) |
Provision for legal proceedings | - | - | 74,502 | 47,103 |
Provision for inventory obsolescence | - | - | 45 | 22 |
Recovery of one-off credits | - | - | (126,675) | - |
Deferred taxes | 2,285 | (25,291) | 19,143 | 29,861 |
Equity method investees | 2,217,639 | (17,865) | - | (78) |
Share-based payments | - | 3,557 | 4,947 | 3,941 |
Recovery of expenses | - | (309,980) | - | |
Sale-leaseback | - | - | (112,590) | - |
Actuarial losses from post-employment benefits | - | - | 4,750 | - |
Foreign exchange, net | 1,229,175 | 14,276 | 3,588,432 | 132,817 |
Interest income | (3,045) |
| (11,657) |
|
Interest on loans and financing and leases | 81,041 | 63,811 | 304,163 | 260,297 |
Losses from investment funds | - | - | 233,812 | - |
Provision for aircraft and engine return | - | - | 31,906 | - |
Provision for maintenance reserve | - | - | 53,871 | - |
Result of derivatives recognized | 148,500 | (30,093) | 130,200 | (9,030) |
Unrealized hedge results - ESN | (575,357) | - | (575,357) | - |
Change in contractual term of leases | - | - | (20,968) | - |
Provision for labor obligations | - | - | 70,461 | 2,392 |
Disposals of property, plant and equipment and intangible assets | 108,538 | 3,301 | 15,478 | 2,196 |
Others | - | - | (2,209) | (50,458) |
Adjusted net income | 920,507 | (20,611) | 1,641,219 | 852,860 |
|
|
|
|
|
Changes in operating assets and liabilities: |
|
|
|
|
Trade receivables | - | - | 449,475 | 36,102 |
Short-term investments | 3,204 | 92,015 | (11,775) | 93,502 |
Inventories | - | - | (16,612) | (6,888) |
Deposits | (2,248) | (4,533) | (159,717) | (41,212) |
Recoverable taxes | 3,388 | - | (12,139) | - |
Suppliers | (2,104) | (142,775) | (54,202) | (227,717) |
Suppliers – forfaiting | - | - | 227,552 | (35,549) |
Advance from ticket sales | - | - | (362,042) | (336,175) |
Mileage program | - | - | 161,301 | 71,352 |
Advances from customers | - | - | 3,267 | (109,203) |
Salaries | (103) | (327) | (59,876) | 31,754 |
Landing fees | - | - | 51,600 | 38,246 |
Taxes obligation | (12,836) | (1,002) | 25,822 | (38,485) |
Obligations with derivative transactions | - | - | (329,438) | (64,197) |
Advance to suppliers and third parties | (11) | - | (45,268) | - |
Payments for lawsuits and aircraft return | - | - | (72,686) | (38,287) |
Prepaid expenses | - | - | (38,308) | - |
Other credits (obligations) | (1,345) | 495,025 | (44,748) | 391,121 |
Interest paid | (207,971) | (144,156) | (234,352) | (189,624) |
Income tax paid | (2,040) | - | (28,468) | (21,559) |
Net cash flows from operating activities | 698,441 | 273,636 | 1,090,605 | 406,041 |
|
|
|
|
|
Loan receivable from related parties | (985,402) | (414,611) | - | - |
Short-term investments | - | - | (241,810) | 29,868 |
Restricted cash | (146) | (1,238) | (839,593) | 345,801 |
Receipt of dividends and interest on shareholders’ equity through subsidiary | 15,002 | 8,203 | - | - |
Advances for property, plant and equipment acquisition, net | - | (13,202) | (56,851) | (2,131) |
Acquisition of fixed assets | (5,662) | - | (232,457) | (99,901) |
Acquisition of intangible assets | - | - | (18,610) | (20,782) |
Net cash flows used in investing activities | (976,208) | (420,848) | (1,389,321) | 252,855 |
|
|
|
|
|
8
Statements of Cash Flows(without independent auditors’ limited review)Quarters ended on March 31, 2020 and 2019(In thousands of Reais - R$)
|
| Parent company | Consolidated | ||
| 03/31/2020 | 03/31/2019 | 03/31/2020 | 03/31/2019 |
| (Unaudited) |
| (Unaudited) |
|
|
|
|
|
|
Loans and financing issued, net of costs | - | 1,169,010 | 60,975 | 1,208,246 |
Costs of borrowing and repurchasing securities | - | (47,065) | (819) | (48,829) |
Loan and financing payments | (405,878) | - | (501,570) | (228,289) |
Early payment of senior notes | - | (50,320) |
| (50,320) |
Lease payments | - | - | (421,713) | (354,926) |
(Payment) receipt of premium | - | (102,055) | 21,800 | (102,055) |
Dividends and interest on shareholders’ equity paid to non-Controlling interests | - | - | (14,811) | (7,371) |
Capital increase | - | 1,771 | - | 1,771 |
Capital increase from non-controlling interests | - | - | - | 106 |
Shares to be issued | 143 | 512 | 143 | 512 |
Net cash flows (used in) from financing activities | (405,735) | 971,853 | (855,995) | 418,845 |
|
|
|
|
|
Foreign exchange variation on cash held in foreign currencies | 105,419 | (15,352) | 168,313 | (23,290) |
|
|
|
|
|
(Decrease) increase in cash and cash equivalents | (578,083) | 809,289 | (986,398) | 1,054,451 |
|
|
|
|
|
Cash and cash equivalents at the beginning of the period | 1,016,746 | 282,465 | 1,645,425 | 826,187 |
Cash and cash equivalents at the end of the period | 438,663 | 1,091,754 | 659,027 | 1,880,638 |
|
|
|
|
|
The accompanying notes are an integral part of the individual and consolidated preliminary quarterly information.
9
Statements of Added Value(without independent auditors’ limited review)Quarter ended on March 31, 2020 and 2019(In thousands of Reais - R$)
|
DVA
| Parent company | Consolidated | ||
| 03/31/2020 | 03/31/2019 | 03/31/2020 | 03/31/2019 |
| (Unaudited) |
| (Unaudited) |
|
Revenues |
|
|
|
|
Passengers, cargo and other | - | - | 3,267,055 | 3,351,958 |
Other operating income | 376,308 | 14,419 | 305,915 | 44,179 |
Allowance for doubtful accounts | - | - | (2,518) | 6,986 |
| 376,308 | 14,419 | 3,570,452 | 3,403,123 |
Inputs acquired from third parties (including ICMS and IPI) |
|
|
|
|
Suppliers of aircraft fuel | - | - | (1,001,138) | (1,024,374) |
Material, electricity, third-party services and others | (3,424) | 626 | (176,154) | (651,129) |
Aircraft insurance | - | - | (8,546) | (6,188) |
Sales and marketing | (367) | - | (118,012) | (140,103) |
Gross added value | 372,517 | 15,045 | 2,266,602 | 1,581,329 |
|
|
|
|
|
Depreciation and amortization | - | - | (528,036) | (405,577) |
Net added value produced (used) by the Company | 372,517 | 15,045 | 1,738,566 | 1,175,752 |
|
|
|
|
|
Value added received in transfer |
|
|
|
|
Equity results | (2,217,639) | 17,865 | - | 78 |
Financial income | 616,916 | 60,472 | 698,246 | 923,210 |
Total added value to be distributed (distributed) | (1,228,206) | 93,382 | 2,436,812 | 2,099,040 |
|
|
|
|
|
Distribution of value added: |
|
|
|
|
Salaries | 770 | 958 | 432,448 | 378,505 |
Benefits | - | - | 50,774 | 42,862 |
FGTS | - | - | 29,993 | 33,512 |
Personnel | 770 | 958 | 513,215 | 454,879 |
|
|
|
|
|
Federal taxes | 3,771 | (21,832) | 228,524 | 275,028 |
State taxes | - | - | 4,964 | 4,740 |
Municipal taxes | - | - | 1,331 | 1,001 |
Tax, charges and contributions | 3,771 | (21,832) | 234,819 | 280,769 |
|
|
|
|
|
Interest and foreign exchange variation | 1,055,522 | 146,533 | 3,929,575 | 1,313,946 |
Rent | - | - | 19,669 | 14,176 |
Other | - | 30 | 1,143 | 64 |
Third-party capital remuneration | 1,055,522 | 146,563 | 3,950,387 | 1,328,186 |
|
|
|
|
|
Net loss for the period | (2,288,269) | (32,307) | (2,288,269) | (32,307) |
Net income for the period attributable to non- controlling interests | - | - | 26,660 | 67,513 |
Remuneration of own capital | (2,288,269) | (32,307) | (2,261,609) | 35,206 |
|
|
|
|
|
Total added value distributed | (1,228,206) | 93,382 | 2,436,812 | 2,099,040 |
The accompanying notes are an integral part of the individual and consolidated preliminary quarterly information.
10
| Notes to the Preliminary Quarterly Information (without independent auditors’ limited review report) For the three-month period ended March 31, 2020. (In thousands of Reais - R$, except when otherwise indicated) |
1. Operating Context
Gol Linhas Aéreas Inteligentes S.A. (the “Company” or “GOL”) is a publicly-listed company incorporated on March 12, 2004, under the Brazilian Corporate Law. The Company’s bylaws provide that it has as its corporate purpose the exercise of share control of GOL Linhas Aéreas S.A. (“GLA”), which provides regular and non-scheduled air transportation services for passengers, and development of loyalty programs, among others.
The Company’s shares are traded on B3 S.A. - Brasil, Bolsa, Balcão (“B3”) and on the New York Stock Exchange (“NYSE”) under the ticker GOLL4 and GOL, respectively. The Company adopted Level 2 Differentiated Corporate Governance Practices from B3 and is included in the Special Corporate Governance Stock Index (“IGC”) and the Special Tag Along Stock Index (“ITAG”), which were created for companies committed to applying differentiated corporate governance practices.
The Company’s corporate address is located at Praça Comandante Linneu Gomes, s/n, portaria 3, prédio 24, Jardim Aeroporto, São Paulo, Brazil.
1.1 Actions and impacts resulting from the COVID-19 pandemic
The COVID-19 pandemic, which is seen by the World Health Organization as a “public health emergency of international interest,” has rapidly disseminated throughout the world, causing important disruptions in the global economic activity and starting an unprecedented crisis.
This crisis has significantly increased the uncertainty in the macroeconomic environment, and it will inevitably lead to global recession, according to the World Bank’s report named “The Economy in the Time of COVID-19,” published on April 12.In Brazil, a 5% GDP retraction is being expected in 2020, caused, above all, by weak external demand, lower oil prices, and sharp fall in the economic activity in order to contain the virus.
The measures taken in Brazil to reduce the speed of spread and dissemination of the disease include social distancing, travel restrictions and the closing of borders. As a result, the aircraft industry was one of the first and more affected sectors with regard to its operations and results. These impacts were immediate and severe.
To face this absolutely disruptive scenario, our Company, through its Executive Committee, which is made up of all management bodies, is attentively monitoring this situation and its developments; establishing financial and operational strategies; and defining how it can support the society. In a moment like this, our Company is willing to make all contributions possible by using the tools under its control. This said, our Management took the following actions:
1.1.1. Adjustment of operations – Essential Network
On March 16, GOL started to reduce its capacity by 50% to 60% in the domestic market, and by 90% to 95% in the international market, in order to reflect the changes in the demand from Customers.
On March 24, as Brazilians were adopting responsible social distancing measures and avoiding travelling due to the pandemic, we adjusted our network again from 750 to 50 essential daily flights between the São Paulo International Airport, located in the city of Guarulhos, and all 26 state capitals and Brasília (“Essential Network”).
11
| Notes to the Preliminary Quarterly Information (without independent auditors’ limited review report) For the three-month period ended March 31, 2020. (In thousands of Reais - R$, except when otherwise indicated) |
1.1.2. Reduction in fixed and variable costs
· Variable costs:as mentioned above, we reviewed our flight network as the end of March in order to ensure essential services in all Brazilian capitals and the federal district, which corresponded to a reduction of 93% in domestic flights, and a temporary interruption in all international flights, thus reducing the related variable costs;
· Personnel Expenses:with effects expected as of April, the Company adopted measures aiming at a planned reduction of approximately 50% in payroll expenses and relevant charges, particularly with reduction of working hours and, consequently, a reduction of 35% in salaries of air service and ground service workers; negotiation to reduce the working hours of our crew by 50%; 40% reduction in the compensation of our officers; adoption of unpaid leave (LNR) by approximately 5.4 thousand employees (approximately 34% of our total staff), with these adoptions signed until March 31, 2020; and
In April, with effects expected as of May, we adopted the measures provided for in MP [Provisional Measure] 936/20, reducing the salaries of employees by 50%, the compensation of officers by 60%, and adopting the suspension of labor agreements of around 800 employees, in addition to the 5,400 employees previously mentioned.
· Other expenses:suspension of expenses for advertising and publicity, and immediate interruption of projects of any nature that are not absolutely essential for the continuity of operations.
1.1.3. Preservation and strengthening of our cash position and liquidity
· Aircraft and engines lease:negotiation with key lessors on the postponement of payments for a period of 3 to 6 months, which should enable us to retain funds of approximately R$452.4 million;
· Fuel costs:agreements with suppliers on the postponement of payments, which should be resumed in installments as of September 2020;
· Personnel Expenses:interruption in the payment of profit sharing and bonuses for the year 2019, and in the payment of the advance of the 13th salary and vacation pay;
· Investments:suspension of non-essential CAPEX, including the interruption of “pre-delivery payments (PDPs);“
· Engine maintenance services:postponement by 60 to 90 days of payments to suppliers;
· Taxes, contributions and social charges – suspension of payment of federal taxes through the issue of a court injunction, and also as a result of the measures enacted by the Federal Government;
· Other expenses and revenues:agreement on the refund of expenses incurred since grounding of 737MAX aircraft, with an immediate effect of R$447 million on cash (see note 1.3); and
· Loans and financing:postponement of the R$148-million installment maturing in March 2020 to March 2022; obtainment of a waiver for all covenants maturing in2020; and postponement of the maturity of working capital transactions scheduled for the first quarter of 2020.
12
| Notes to the Preliminary Quarterly Information (without independent auditors’ limited review report) For the three-month period ended March 31, 2020. (In thousands of Reais - R$, except when otherwise indicated) |
1.1.4. Support from the Government and regulatory bodies
· Maintenance of receivables from air tickets:reduction in reimbursements and cancellations based on the Provisional Measure enacted by the Government, which provides for the rescheduling of flights within a period of up to 12 months;
· Airport fees:change in the terms of payment of navigation and airport fees, which may be paid until December without penalties; and
· Maintenance of slots – ANAC:(i) allowance for cancellation of slots as per the regularity index, valid until the end of October 2020, in line with a similar decision issued by other civil aviation organizations and authorities, such as the European Commission and FAA; and (ii) extension of 120 days for renewal of licenses.
1.1.5. Impacts on the individual and consolidated preliminary quarterly information
As mentioned above, the impacts of the COVID-19 pandemic on the Company were immediate and severe, its main consequence being the adoption of the essential network. Below is presented a table summarizing the adjustments and reclassifications made in this preliminary quarterly information, as well as the details on each of these items and additional disclosures in the text below:
Description |
| Parent Company | Consolidated |
Adjustments |
|
| (Unaudited) |
Provision for cancellation of mileage exchange |
| - | (22,271) |
De-recognition of the cash flow hedge – fuel |
| - | (291,925) |
De-recognition of the cash flow hedge – revenues in US$ |
| - | (290,346) |
|
|
|
|
Reclassifications |
|
|
|
Taxes to recover in the short- and long-term |
| - | 61,020 |
|
|
|
|
As a link between the travel and tourism industries, our Smiles subsidiary is also being affected by the crisis, with impacts on its operations and results. The main effect was the reduction, in the first quarter of 2020, in the volume of redemption of miles accumulated by the participants of the Smiles Program, particularly regarding air tickets, hotel accommodation and car rental. In April, the Company also recorded cancellations, above the usual levels, of miles redeemed in previous months. Accordingly, a provision for cancellations, in the amount of R$22,271 was recorded as of March 31, 2020.
Additionally, as a result of the reduction in operations due to the adoption of the essential network, the Company derecognized cash flow hedging transactions, since it expects a drop in the fuel consumption previously estimated. Accordingly, the amount of R$291,925 was transferred from the “equity valuation adjustment” group, in shareholders’ equity, to the item “derivative losses” in financial income.
Also, as a result of the temporary interruption in all international flights, the Company also derecognized the hedge accounting transactions used for protecting future revenues in foreign currency (subject matter of the hedge), using lease agreements as hedge instruments. Accordingly, the amount of R$290,346 was transferred from the “equity valuation adjustment” group, in shareholders’ equity, to the item “exchange variation expenses” in financial income.
13
| Notes to the Preliminary Quarterly Information (without independent auditors’ limited review report) For the three-month period ended March 31, 2020. (In thousands of Reais - R$, except when otherwise indicated) |
The expectations of realization of assets and liabilities were reviewed. As a result, the Company reclassified Recoverable taxes and contributions in the amount of R$61,020, since the realization of these assets will be postponed.
Another impact on the balance sheet was the lower performance of investment funds in the period. All activities and growth estimates were adjusted to negative figures.
It is important to note that, during this period, management maintained the Company’s investment policy, by investing in sovereign equity funds linked to the SELIC basic rate, and private credit fixed income funds with high liquidity and high quality.
With regard to lease balances payable as of March 31, 2020, short-term obligations in the amount of R$233,081 were renegotiated with creditors.
The Company has also conducted impairment tests in the balances of property, plant and equipment, goodwill and slots rights. No provision for impairment was recorded, as mentioned in notes 17 and 18.
The Company we have also carried out a detailed review of budget estimates for the current and coming years (“Business Plan”). Accordingly, we are able to evidence and conclude, based on the information available, that we have the conditions to continue operating and to fulfill our obligations according to the maturities that were renegotiated with our suppliers and creditors, as detailed in Note 1.2.
1.1.6. Support to the Society, the Employees and the Customers
Passenger transportation services are essential for the society. We recognize our duty of care towards our audiences, and we are working closely to the authorities to help reduce the impact of COVID-19 on the population and the health services.
Regarding the flights in our essential network, we are taking extraordinary measures in addition to the strict sanitation standards of the civil aviation sector. Our aircraft are sanitized and disinfected on a daily basis.
The measures used include keeping the integrity and health of our employees as a priority. As from the second week of March, all administrative employees have been working remotely. The employees are being continuously monitored by the Company’s leadership and the People and Culture area, which manages our human resources.
In order to improve our Customer Assistance services in a period of high demand and uncertainty, we created specific communication channels on the coronavirus that are constantly updated. We reinforced our dedicated Customer Assistance team, giving priority to more urgent cases. This team helps customers with the reorganization of air ticket bookings with flexible conditions for changes in future flights.
Regarding the Smiles loyalty program, we have also improved the digital channels by deploying the free online cancellation self-service, which is available in our website and in the “Smiles Fidelidade” app, and our chat, for customers with optional GOL tickets. This system was developed internally in a record time.
Since the crisis may last for an undefined period and, thus, impact customers’ travel plans, our Smiles subsidiary announced that the effectiveness of the program’s categories is being postponed. Moreover, the current year is not being considered as base for requalification forthe next year, since the analysis of downgrade of categories would take into account the accumulation of miles originated from stretches flown in the period from January to December 2020.This enables customers to gain more time within their categories, and take advantage of the benefits provided.
14
| Notes to the Preliminary Quarterly Information (without independent auditors’ limited review report) For the three-month period ended March 31, 2020. (In thousands of Reais - R$, except when otherwise indicated) |
At the social level, as a contribution to and in recognition of those who fight COVID-19 on the frontline of the battle, the Company, in partnership with GLA, is now providing free transportation to health professionals, and in partnership with the subsidiary Smiles is now crediting miles for them to travel throughout Brazil to provide care to patients affected. At each GOL stretch flown, they receive 1,000 miles.
With the purpose of reducing the negative impacts of the COVID-19 crisis, Smiles Fidelidade has launched several initiatives to stimulate participants to use their miles in products offered by other partners, particularly retailers, through the Shopping Smiles program.
The Company’s most important commitment will continue to be the integrity and health of persons. Accordingly, we are strictly following the guidelines issued by WHO, and undertaking to do everything we can to face this turbulent period in the best way possible.
1.2 Capital structure and net current capital
As of March 31, 2020, the Company’s negative shareholders’ equity attributed to the controlling shareholders amounted to R$11,037,301 (R$7,676,671 on December 31, 2019), while the negative net current capital was R$7,262,828 (negative R$5,435,223 as of December 31, 2019).
The variation recorded in the three-month period ended March 31, 2020 is the result of a devaluation of approximately 30% of the Real against the US Dollar.
As shown in note 1.1, due to the outbreak of the COVID-19 pandemic, the Company took a series of measures in March and April 2020. In this period, we have also carried out a detailed review of budget estimates of its Business Plan. Accordingly, we are able to evidence and conclude, based on the information available, that we have the conditions to continue operating and to fulfill our obligations according to the maturities that were renegotiated with our suppliers and creditors.
The Management’s assessment considers the Company’s business plan that includes future actions planned by Management, as well as other relevant macroeconomic and aviation sector’s assumptions, such as the estimate of the US dollar exchange rate and aviation fuel prices. The Management’s assessment also assumes that the Company will adjust its fleet size to demand and match seat supply to demand, in order to maintain a high load factor, reduce costs and adjust its capital structure.
In accordance with the Management’s assessment, the consolidated current assets and the budget forecast of cash flows to be generated by the operation will be sufficient to meet the Company’s working capital and investment needs in the next 12 months.
Additionally, the Company has access to credit lines, should it be necessary.
The Company will continue to strengthen its balance sheet management and results in order to guarantee sustainability. Management believes that the business plan reviewed, presented and approved by the Board of Directors on April 30, 2020, demonstrates all elements required to continue as going concern.
15
| Notes to the Preliminary Quarterly Information (without independent auditors’ limited review report) For the three-month period ended March 31, 2020. (In thousands of Reais - R$, except when otherwise indicated) |
Based on this assessment, the Management concluded that there are no material uncertainties related to the Company’s ability to continue operating; therefore, the financial statements have been prepared based on this assumption.
1.3. Grounding status of Boeing 737 MAX
On March 11, 2019, as a result of a second accident involving a Boeing 737 MAX 8 aircraft, and as SAFETY is GOL’s number one value, the Company’s Management decided to suspend the operation of its seven aircraft before being required to do so by the regulatory authorities.
As a result of this strategy, the Company quickly reconfigured its flight network in order to supply the capacity required to meet the new demand levels, through revised lease agreements. The aircraft downtime and additional efforts caused the Company to incur unplanned costs, including interline fares due to the relocation of passengers, accommodation, meals and other expenses for passengers, additional fuel consumption, airport tariffs and fees, salaries and charges related to overtime, payment for the lease of additional aircraft and negative publicity, causing disruption in the Company’s business.
The return of these aircraft is subject to authorization by the Brazilian regulatory authorities and destination countries, mainly Brazil and the United States of America.
As a consequence and in recognition of a long-lasting partnership, the Company reached an agreement with Boeing. The terms of the agreement are strictly confidential, but they aim at providing (a) compensation that addresses damages resulting from the aircraft grounding to date, and as a result of the non-delivery of aircraft, as set forth in the purchase agreements; (b) reduction in the number of firm commitments by 34 aircraft to 95 in total; (c) the flexibility to additionally adjust the number of aircraft; and (d) the flexibility to convert the existing orders for other Max-models.
In accordance with the accounting principles and standards in force, the amounts mentioned in the agreement were recognized in this quarterly financial information as follows: R$446,942 as “Receivables” in the current assets group, with counter-entries of R$136,962 in “advances for acquisition of property, plant and equipment” in fixed assets, since it is a repayment of “pre delivery payment” and R$309,980 recorded in the income statement, with R$63,041 as a result of exchange variation, R$193,503 as other income and expenses, net since it refers to a reimbursement of expenses incurred in prior years, and the remaining amount distributed in the other lines of the income statement. These amounts do not affect the statements of cash flow presented in this quarterly financial information.
The amount of R$446,942 was received in full by GOL on April 1, 2020.
Additionally, subject to future events, the Company will be entitled to credits with a present value of approximately R$1,9 billion to be invested in future acquisition of new aircraft, which, in turn, will reduce the amount of future depreciation and financial costs, since the credits will affect the present values of assets and liabilities related to use rights.
16
| Notes to the Preliminary Quarterly Information (without independent auditors’ limited review report) For the three-month period ended March 31, 2020. (In thousands of Reais - R$, except when otherwise indicated) |
1.4. Ownership Structure
The corporate structure of the Company and its subsidiaries, on March 31, 2020, is shown below:
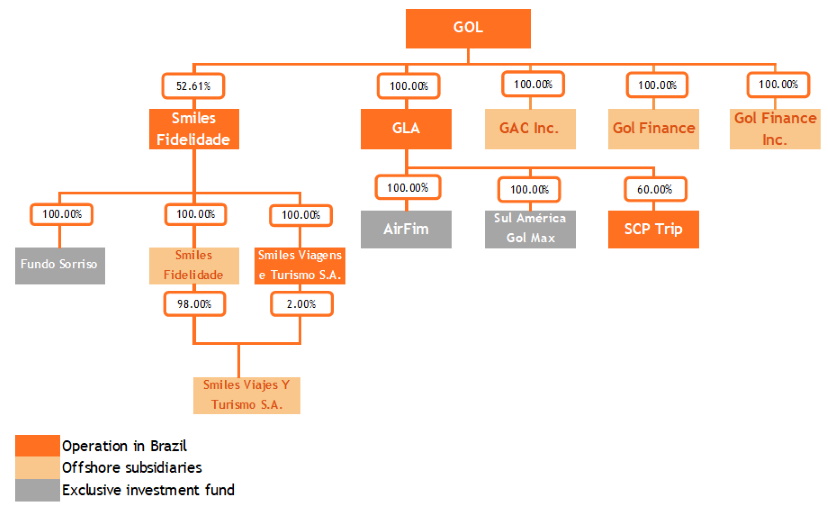
The Company’s ownership interest in the capital of its subsidiaries, as of March 31, 2020, is shown below:
Entity | Date of Incorporation | Location | Principal Activity | Type of Control | % of Interest | |
03/31/2020 | 12/31/2019 | |||||
Offshore Subsidiaries: |
|
|
|
|
|
|
GAC | 03/23/2006 | Cayman Islands | Aircraft Acquisition | Direct | 100,00 | 100,00 |
Gol Finance Inc. | 03/16/2006 | Cayman Islands | Fund-Raising | Direct | 100,00 | 100,00 |
Gol Finance | 06/21/2013 | Luxembourg | Fund-Raising | Direct | 100,00 | 100,00 |
Subsidiaries: |
|
|
|
|
|
|
GLA | 04/09/2007 | Brazil | Flight Transportation | Direct | 100,00 | 100,00 |
AirFim | 11/7/2003 | Brazil | Investment Fund | Indirect | 100,00 | 100,00 |
Sul América Gol Max | 01/14/2014 | Brazil | Investment Fund | Indirect | 100,00 | 100,00 |
Smiles Fidelidade | 08/01/2011 | Brazil | Loyalty Program | Direct | 52,61 | 52,61 |
Smiles Viagens | 08/10/2017 | Brazil | Tourism Agency | Indirect | 52,61 | 52,61 |
Smiles Fidelidade Argentina (a) | 11/07/2018 | Argentina | Loyalty Program | Indirect | 52,61 | 52,61 |
Smiles Viagens Argentina (a) | 11/20/2018 | Argentina | Tourism Agency | Indirect | 52,61 | 52,61 |
Fundo Sorriso | 07/14/2014 | Brazil | Investment Fund | Indirect | 52,61 | 52,61 |
Company booked as an investment: | ||||||
SCP Trip | 04/27/2012 | Brazil | Flight Magazine | Indirect | 60,00 | 60,00 |
(a) Companies with functional currency in Argentine pesos.
1.5. Corporate Reorganization Plan
On December 9, 2019, and February 4, 2020, through a Material Fact, the Company, together with its subsidiaries, announced the corporate reorganization plans with the main purpose ofensuring the long-term competitiveness of GOL Group, by aligning the interests of all stakeholders, reinforcing a consolidated capital structure, simplifying the corporate governance of companies, reducing the operating, administrative and financial costs and expenses, and increasing the market liquidity for all GOL’s shareholders, through the incorporation of Smiles shares by GLA.
17
| Notes to the Preliminary Quarterly Information (without independent auditors’ limited review report) For the three-month period ended March 31, 2020. (In thousands of Reais - R$, except when otherwise indicated) |
On March 13, 2020, the Company and its subsidiary Smiles issued a Material Fact informing that, due to the extraordinary events in the national and international markets caused by the spread of COVID-19, and particularly by virtue of its structuring impacts on the aviation sector, they had canceled the corporate reorganization proposal submitted on December 9, 2019 and on February 4, 2020.
1.6. Compliance Program
Since 2016, the Company has adopted several measures to strengthen and expand its internal control and compliance programs, presented in detail in the annual financial statements issued on February 28, 2020.
The Management is constantly reinforcing to its employees, customers and suppliers its commitment to continue improving its internal control and compliance programs.
As previously disclosed in the financial statements for the year ended December 31, 2017, 2018 and 2019, the Company entered into an agreement with the Brazilian Federal Public Ministry in December 2016 (“Agreement”), under which the Company agreed to pay R$12 million in fines and make improvements to its compliance program. In turn, the Federal Public Ministry agreed not to raise any charges related to activities that are the subject of the Agreement. In addition, the Company paid R$4.2 million in fines to the Brazilian tax authorities.
The Company voluntarily informed the U.S. Department of Justice (“DOJ”), the Securities and Exchange Commission (“SEC”) and the Brazilian Securities and Exchange Commission (“CVM”) of the Agreement and the external independent investigation hired by the Company, and about the Agreement. The investigation was completed in April 2017 and revealed that immaterial payments were made to politically exposed people. None of the current employees, representatives or members of the Company’s Board or Management knew of any illegal purpose behind any of the transactions identified, or of any unlawful benefit to the Company arising from the investigated operations.
The Company informed the due authorities of the result of the investigation and will continue to communicate on the development of the issue, following the analyses already initiated by these bodies. These authorities may impose fines and possibly other sanctions on the Company.
There were no further developments on the subject during the quarter ended March 31, 2020.
2. Statementof the Management, basis for preparing and presenting the individual and consolidated preliminary quarterly information
The Company’s preliminary quarterly information was prepared in accordance with accounting practices adopted in Brazil. The accounting practices adopted in Brazil include those in the Brazilian Corporation Law and in the technical pronouncements, guidelines and interpretations issued by the Accounting Pronouncements Committee (“CPC”), approved by the Federal Accounting Council (“CFC”) and the Brazilian Securities and Exchange Commission(“CVM”).
18
| Notes to the Preliminary Quarterly Information (without independent auditors’ limited review report) For the three-month period ended March 31, 2020. (In thousands of Reais - R$, except when otherwise indicated) |
The Company’s consolidated preliminary quarterly information was prepared in accordance with accounting practices adopted in Brazil and the International Financial Reporting Standards (“IFRS”) issued by the International Accounting Standards Board (“IASB”). The accounting practices adopted in Brazil include those in the Brazilian Corporation Law and in the technical pronouncements, guidelines and interpretations issued by the Accounting Pronouncements Committee (“CPC”), and approved by the Federal Accounting Council (“CFC”) and the Brazilian Securities and Exchange Commission (“CVM”).
The Company’s individual and consolidated preliminary quarterly information was prepared based on the Real (“R$”) as the functional and presentation currency, expressed in thousands of Reais, except when otherwise indicated. The items disclosed in foreign currencies are duly identified, when applicable.
The preparation of the Company’s individual and consolidated preliminary quarterly information requires Management to make judgments, use estimates and adopt assumptions affecting the stated amounts of revenues, expenses, assets, and liabilities. However, the uncertainty inherent in these judgments, assumptions, and estimates could give rise to results that require a material adjustment of the book value of certain assets and liabilities in future reporting years.
The Company is continually reviewing its judgments, estimates, and assumptions.
The Management, when preparing this individual and consolidated preliminary quarterly information, used disclosure criteria based on regulatory aspects and the relevance of the transactions for understanding the changes in the Company’s economic and financial position and its performance since the end of the fiscal year ended on December 31, 2019, as well as the update of significant information included in the annual financial statements issued on February 28, 2020.
The Management confirms that all the material information in this individual and consolidated preliminary preliminary quarterly information is being demonstrated and corresponds to the information used by Management in the development of its business management activities.
The individual and consolidated preliminary quarterly information has been prepared based on historical cost, with the exception of the following material items recognized in the balance sheets:
· short-term investments classified as cash and cash equivalents measured at fair value;
· short-term investments comprising mainly exclusive investment funds, measured at fair value;
· restricted cash measured at fair value;
· derivative financial instruments measured at fair value; and
· investments accounted for using the equity method.
The Company’s individual and consolidated preliminary quarterly information for the period ended March 31, 2020 was prepared based on the assumption of its operational continuity, which includes the realization of assets and the settlement of liabilities in the regular course of business, as detailed in Note 1.2.
19
| Notes to the Preliminary Quarterly Information (without independent auditors’ limited review report) For the three-month period ended March 31, 2020. (In thousands of Reais - R$, except when otherwise indicated) |
3. Approval of Individual and Consolidated Financial Statements
The approval and authorization for the issuance of these individual and consolidated preliminary quarterly information took place at the Board of Directors’ meeting held on April 30, 2020.
4. Summary of Significant Accounting Practices
The individual and consolidated preliminary quarterly information presented herein was prepared based on the policies, accounting practices and methods for calculation of estimates adopted and presented in detail in the annual financial statements for the year ended December 31, 2019 and issued on February 28, 2020.
4.1. New accounting standards and interpretations adopted in the period
There are no new standards and interpretations adopted in the three-month period ended March 31, 2020.
4.2. New Accounting Standards and Pronouncements Not Yet Adopted
According to Management, there are no other standards and interpretations issued andnot yet adopted that may have a significant impact on the result or equity disclosed by the Company.
4.3. Transactions in Foreign Currency
Foreign currency transactions are recorded at the exchange rate change prevailing on the date on which the transactions take place. Monetary assets and liabilities designated in foreign currency are calculated based on the exchange rate change on the balance sheet date. Any difference resulting from the translation of currencies is recorded under the item “Exchange Rate Change, Net” in the income statement for the period.
The exchange rate changes inReaisin effect on the base date of this individual and consolidated preliminary quarterly information are as follows:
| Final Rate | Average rate | ||
| 03/31/2020 | 12/31/2019 | 03/31/2020 | 12/31/2019 |
| (Unaudited) |
| (Unaudited) |
|
|
|
|
|
|
US Dollar | 5,1987 | 4,0307 | 4,8643 | 4,1102 |
Argentinean Peso | 0,0807 | 0,0673 | 0,0769 | 0,0686 |
5. Seasonality
In normal economic and social conditions, the Company expects revenues and operating results from its flights to be at their highest levels in the summer and winter months of January and July, respectively, and during the last weeks of December and in the year-end holiday period. Given the high proportion of fixed costs, this seasonality tends to drive variations in operating results across the fiscal-year quarters.
20
| Notes to the Preliminary Quarterly Information (without independent auditors’ limited review report) For the three-month period ended March 31, 2020. (In thousands of Reais - R$, except when otherwise indicated) |
6. Cash and Cash Equivalents
| Parent Company | Consolidated | ||
| 03/31/2020 | 12/31/2019 | 03/31/2020 | 12/31/2019 |
| (Unaudited) |
| (Unaudited) |
|
|
|
|
|
|
Cash and Bank Deposits | 438,535 | 488 | 568,662 | 418,447 |
Cash Equivalents | 128 | 1,016,258 | 90,365 | 1,226,978 |
Total | 438,663 | 1,016,746 | 659,027 | 1,645,425 |
The breakdown of cash equivalents is as follows:
|
| Parent Company | Consolidated | ||
| Weighted Average Rate (p.a.) | 03/31/2020 | 12/31/2019 | 03/31/2020 | 12/31/2019 |
|
| (Unaudited) |
| (Unaudited) |
|
|
|
|
|
|
|
Local Currency |
|
|
|
|
|
Financial deposits | 94.8% of CDI | 128 | 366,338 | 88,676 | 514,356 |
Automatic Deposits | 23.5% of CDI | - | - | 626 | 5,505 |
Total Local Currency |
| 128 | 366,338 | 89,302 | 519,861 |
|
|
|
|
|
|
Foreign Currency |
|
|
|
|
|
Financial deposits | 0.1% | - | 649,920 | 98 | 707,117 |
Investment funds |
| - | - | 965 | - |
Total Foreign Currency |
| - | 649,920 | 1,063 | 707,117 |
|
|
|
|
|
|
Total |
| 128 | 1,016,258 | 90,365 | 1,226,978 |
7. Short-Term Investments
|
| Parent Company | Consolidated | ||
| Weighted Average Rate (p.a.) | 03/31/2020 | 12/31/2019 | 03/31/2020 | 12/31/2019 |
|
| (Unaudited) |
| (Unaudited) |
|
|
|
|
|
|
|
Local Currency |
|
|
|
|
|
Government Bonds | 97.1% of CDI | - | - | 39.763 | 56.532 |
Investment Funds | 55.7% of CDI | 514 | 673 | 1,091,302 | 862.868 |
Total Local Currency |
| 514 | 673 | 1,131,065 | 919.400 |
|
|
|
|
|
|
Foreign Currency |
|
|
|
|
|
Deposits with Banks | 3.00% | - | - | 2,437 | 1,713 |
Government Bonds | -% | - | - | - | 29,684 |
Investment Funds | - | - | - | - | 2,965 |
Total Foreign Currency |
| - | - | 2,437 | 34,362 |
|
|
|
|
|
|
Total |
| 514 | 673 | 1,131,502 | 953,762 |
The decrease in the performance of the investment funds’ profitability in the period also reflects the outbreak of the COVID-19 pandemic, with all activity and growth estimates being revised to fundamentally negative numbers.
21
| Notes to the Preliminary Quarterly Information (without independent auditors’ limited review report) For the three-month period ended March 31, 2020. (In thousands of Reais - R$, except when otherwise indicated) |
8. Restricted Cash
|
| Parent Company | Consolidated | ||
| Weighted Average Profitability (p.a.)
| 03/31/2020 | 12/31/2019 | 03/31/2020 | 12/31/2019 |
|
| (Unaudited) |
| (Unaudited) |
|
|
|
|
|
|
|
Local Currency |
|
|
|
|
|
Deposits in Guarantee of Letter of Credit | 97.1% of CDI | 4,092 | 3,948 | 104,287 | 138,164 |
Deposits in Guarantee of Letter of Credit -lawsuits | 95.7% of CDI | 2,430 | - | 85,164 | 85,351 |
Deposit for Hedge Margin | 100.0% of CDI | - | - | 101,160 | - |
Lease Agreement Letter of Credit | 98.4% of CDI | - | - | 125,104 | 136,438 |
Other deposits | 69.7% of CDI | 23 | 2,451 | 5,159 | 9,922 |
Total Local Currency |
| 6,545 | 6,399 | 420,874 | 369,875 |
|
|
|
|
|
|
Foreign Currency |
|
|
|
|
|
Deposits for Hedge Margin | 0.1% | - | - | 778,900 | 74,431 |
Total Foreign Currency |
| - | - | 778,900 | 74,431 |
|
|
|
|
|
|
Total |
| 6,545 | 6,399 | 1,199,774 | 444,306 |
|
|
|
|
|
|
Current |
| 6,545 | 6,399 | 1,059,579 | 304,920 |
Noncurrent |
| - | - | 140,195 | 139,386 |
9. Trade Receivables
| Consolidated | |
| 03/31/2020 | 12/31/2019 |
| (Unaudited) |
|
|
|
|
Local Currency |
|
|
Credit Card Administrators | 363,478 | 740,967 |
Travel Agencies | 185,214 | 253,494 |
Cargo Agencies | 30,409 | 33,677 |
Airline Partner Companies | 5,453 | 291 |
Other | 15,929 | 15,690 |
Total Local Currency | 600,483 | 1,044,119 |
|
|
|
Foreign Currency |
|
|
Credit Card Administrators | 109,730 | 121,844 |
Travel Agencies | 24,047 | 36,845 |
Cargo Agencies | 1,985 | 1,384 |
Airline Partner Companies | 21,675 | 30,740 |
Other | 53,391 | 11,550 |
Total Foreign Currency | 210,828 | 202,363 |
|
|
|
Total | 811,311 | 1,246,482 |
|
|
|
Allowance for expected loss on trade receivables accounts | (19,470) | (16,952) |
|
|
|
Total Trade Receivables | 791,841 | 1,229,530 |
22
| Notes to the Preliminary Quarterly Information (without independent auditors’ limited review report) For the three-month period ended March 31, 2020. (In thousands of Reais - R$, except when otherwise indicated) |
The aging list of trade receivables, net of allowance for expected loss on trade receivables accounts, is as follows:
| Consolidated | |
| 03/31/2020 | 12/31/2019 |
| (Unaudited) |
|
Not Yet Due |
|
|
Until 30 days | 446,330 | 567,567 |
31 to 60 days | 117,219 | 213,334 |
61 to 90 days | 54,064 | 100,478 |
91 to 180 days | 76,248 | 187,883 |
181 to 360 days | 50,352 | 76,902 |
Above 360 days | 1,143 | 1,499 |
Total not Yet Due | 745,356 | 1,147,663 |
|
|
|
Overdue |
|
|
Until 30 days | 30,845 | 47,959 |
31 to 60 days | 4,789 | 23,290 |
61 to 90 days | 4,731 | 3,986 |
91 to 180 days | 2,039 | 3,009 |
181 to 360 days | 845 | 421 |
Above 360 days | 3,236 | 3,202 |
Total Overdue | 46,485 | 81,867 |
|
|
|
Total | 791,841 | 1,229,530 |
The changes in an expected loss on trade receivables are as follows:
| Consolidated | |
| 03/31/2020 | 12/31/2019 |
| (Unaudited) |
|
Balance at the Beginning of the Period | (16,952) | (11,284) |
Addition and Exclusions | (2,726) | (13,499) |
Write-off of Bad Debts | 208 | 7,831 |
Balance at the End of the Period | (19,470) | (16,952) |
10. Inventories
| Consolidated | |
| 03/31/2020 | 12/31/2019 |
| (Unaudited) |
|
|
|
|
Consumables | 18,603 | 14,274 |
Parts and maintenance materials | 197,177 | 184,939 |
Total | 215,780 | 199,213 |
The changes in the provision for obsolescence are as follows:
| Consolidated | |
| 03/31/2020 | 12/31/2019 |
| (Unaudited) |
|
Balances at the Beginning of the Period | (14,302) | (12,808) |
Additions | (45) | (2,168) |
Write-offs | 293 | 674 |
Balances at the End of the Period | (14,054) | (14,302) |
23
| Notes to the Preliminary Quarterly Information (without independent auditors’ limited review report) For the three-month period ended March 31, 2020. (In thousands of Reais - R$, except when otherwise indicated) |
11. RecoverableTaxes to Recover
| Parent Company | Consolidated | ||
| 03/31/2020 | 12/31/2019 | 03/31/2020 | 12/31/2019 |
| (Unaudited) |
| (Unaudited) |
|
|
|
|
|
|
IRPJ and CSLL Prepayments | 22,641 | 27,552 | 186,613 | 195,864 |
Withholding Income Tax | 1,523 | - | 7,635 | 3,969 |
PIS and COFINS to recover(*) | - | - | 407,360 | 273,152 |
Value Added Tax (VAT) Abroad | - | - | 8,708 | 4,650 |
Other | 60 | 60 | 12,314 | 6,181 |
Total | 24,224 | 27,612 | 622,630 | 483,816 |
|
|
|
|
|
Current | 6,686 | 5,163 | 205,227 | 309,674 |
Noncurrent | 17,538 | 22,449 | 417,403 | 174,142 |
(*) During the quarter ended March 31, 2020, the subsidiary GLA ascertained out-of-date tax credits from PIS and COFINS, in the total amount of R$126,675.
24
| Notes to the Preliminary Quarterly Information (without independent auditors’ limited review report) For the three-month period ended March 31, 2020. (In thousands of Reais - R$, except when otherwise indicated) |
12. Deferred Taxes
12.1.Deferred Tax Assets (Liabilities)
The positions of deferred assets and liabilities are presented below and comply with the enforceable offset legal rights that consider taxes levied by the same tax authority under the same tax entity.
Parent Company | Consolidated | ||||||
| 12/31/2019 | Result | 03/31/2020 | 12/31/2019 | Result | Exchange Rate Change | 03/31/2020 |
|
|
| (Unaudited) |
|
|
| (Unaudited) |
Income Tax Losses Carry Forward | 39,890 | (332) | 39,558 | 42,795 | (331) | 578 | 43,042 |
Negative Basis of Social Contribution | 14,360 | (120) | 14,240 | 14,360 | (120) | - | 14,240 |
Temporary Differences |
|
|
|
|
| ||
Allowance for loss on other credits | 1,957 | (1,822) | 135 | 1,958 | (1,823) | - | 135 |
Provision for Legal Proceedings and Tax Liabilities | 696 | (11) | 685 | 696 | (11) | - | 685 |
Total Deferred Taxes - Assets | 56,903 | (2,285) | 54,618 | 59,809 | (2,285) | 578 | 58,102 |
Controlled Subsidiary GLA and Smiles |
|
|
|
|
| ||
Temporary Differences |
|
|
|
|
|
| |
Allowance for expenses loss on trade receivables and other credits | - | - | - | 56,738 | (16,086) | - | 40,652 |
Breakage Provision | - | - | - | (196,206) | (12,048) | - | (208,254) |
Provision for Losses on Other Credits | - | - | - | 143,350 | - | - | 143,350 |
Provision for Legal Proceedings and Tax Liabilities | - | - | - | 91,051 | 7,602 | - | 98,653 |
Aircraft Return | - | - | - | 146,239 | 1,615 | 2 | 147,856 |
Derivative Transactions | - | - | - | (42,154) | 83,776 | - | 41,622 |
Flight Rights | - | - | - | (353,226) | - | - | (353,226) |
Depreciation of Engines and Parts for Aircraft Maintenance | - | - | - | (183,977) | (3,445) | - | (187,422) |
Reversal of Goodwill Amortization for Tax Purpose | - | - | - | (127,659) | - | - | (127,659) |
Aircraft Leases and Other | - | - | - | 64,379 | (42,753) | - | 21,626 |
Other | - | - | - | 89,313 | (28,233) | (3) | 61,077 |
Unrealized Profits | - | - | - | 68,111 | (7,286) | - | 60,825 |
Total Deferred Taxes – Liabilities | - | - | - | (244,041) | (16,858) | (1) | (260,900) |
Total deferred taxes on income | - | (2,285) | - | - | (19,143) | - | - |
25
| Notes to the Preliminary Quarterly Information (without independent auditors’ limited review report) For the three-month period ended March 31, 2020. (In thousands of Reais - R$, except when otherwise indicated) |
The Management considers that the deferred assets and liabilities recorded on March 31, 2020, resulting from temporary differences will be realized in proportion to the realization of their bases and the expectation of future results.
The analysis of the realization of deferred tax credits was performed by the company, as follows:
GOL: has the total tax credits of R$54,618, of which R$53,798 refers to tax loss and negative basis of social contribution and R$820 refers to temporary differences, with realization supported by the long-term plan.
The Management estimates that deferred tax credits, recorded on tax losses and negative social contribution basis, may be realized as follows:
Year | Amount |
| (Unaudited) |
|
|
2020 | 4,316 |
2021 | 8,375 |
2022 | 7,473 |
2023 | 8,332 |
2024 | 9,471 |
2025 to 2029 | 15,831 |
Total | 53,798 |
Smiles Fidelidade Argentina:The Management estimates that the deferred tax assets relating to tax losses totaling R$3,484 will be realized in 36 months.
The direct subsidiary GLA has tax losses and negative social contribution bases in the determination of taxable profit, to be offset against 30% of future annual tax profits, with no time limit for prescription, off-balance sheet, in the following amounts:
| GLA | |
| 03/31/2020 | 12/31/2019 |
| (Unaudited) |
|
|
|
|
IRPJ tax loss | 6,158,776 | 5,017,227 |
CSLL negative base | 6,158,776 | 5,017,227 |
|
|
|
Potential tax credit | 2,093,984 | 1,705,857 |
26
| Notes to the Preliminary Quarterly Information (without independent auditors’ limited review report) For the three-month period ended March 31, 2020. (In thousands of Reais - R$, except when otherwise indicated) |
The reconciliation of effective income taxes and social contribution rates for the periods ended on March 31, 2020, and 2019 is as follows:
| Parent Company | Consolidated | ||
| 03/31/2020 | 03/31/2019 | 03/31/2020 | 03/31/2019 |
| (Unaudited) |
| (Unaudited) |
|
|
|
|
|
|
Income (Loss) Before Income Taxes | (2,284,936) | (55,685) | (2,218,193) | 105,115 |
Combined Tax Rate | 34% | 34% | 34% | 34% |
Income at the statutory combined tax rate | 776,878 | 18,933 | 754,186 | (35,739) |
|
|
|
|
|
Adjustments to calculate the effective tax rate: |
|
|
|
|
Equity Method Investees | (753,997) | 6,074 | - | 27 |
Tax difference on results of subsidiaries | 160,843 | (19,722) | 160,843 | (40,037) |
Income tax on permanent differences and others | (204) | (249) | 50,194 | 46,941 |
Exchange Rate Change on Foreign Investments | (186,853) | (4,910) | (131,967) | (42,630) |
Interest on Shareholders’ Equity | - | (3,114) | - | 2,805 |
Non-deferred Asset Benefit, negative base | - | 26,366 | (876,672) | (1,276) |
Total Income Tax | (3,333) | 23,378 | (43,416) | (69,909) |
|
|
|
|
|
Income Taxes |
|
|
|
|
Current | (1,048) | (1,913) | (24,273) | (40,048) |
Deferred | (2,285) | 25,291 | (19,143) | (29,861) |
Total Income Taxes | (3,333) | 23,378 | (43,416) | (69,909) |
13. Advance to Suppliers and Third Parties
| Parent Company | Consolidated | ||
| 03/31/2020 | 12/31/2019 | 03/31/2020 | 12/31/2019 |
| (Unaudited) |
| (Unaudited) |
|
|
|
|
|
|
Oceanair Advance | 207,949 | 161,228 | 239,435 | 192,715 |
Advance to National Suppliers | - | - | 129,911 | 95,596 |
Advance to International Suppliers | 48 | 37 | 36,268 | 25,316 |
Advance for Materials and Repairs | - | - | 48,932 | 48,930 |
Total | 207,997 | 161,265 | 454,546 | 362,557 |
Adjustment to Present Value of Advance to Suppliers | - | - | (10,604) | (10,604) |
Provision for Loss of Advance to Oceanair | (207,949) | (161,228) | (207,949) | (161,228) |
Total Advance to Suppliers | 48 | 37 | 235,993 | 190,725 |
|
|
|
|
|
Current | 48 | 37 | 187,328 | 142,338 |
Noncurrent | - | - | 48,665 | 48,387 |
(*) increase due to US dollar exchange rate difference.
14. Deposits
| Parent Company | Consolidated | ||
| 03/31/2020 | 12/31/2019 | 03/31/2020 | 12/31/2019 |
| (Unaudited) |
| (Unaudited) |
|
|
|
|
|
|
Judicial Deposits | 60,973 | 61,447 | 861,349 | 841,746 |
Maintenance Deposits | - | - | 1,140,179 | 830,282 |
Deposits in Guarantee for Lease Agreements | 68,097 | 51,055 | 410,268 | 296,327 |
Total | 129,070 | 112,502 | 2,411,796 | 1,968,355 |
27
| Notes to the Preliminary Quarterly Information (without independent auditors’ limited review report) For the three-month period ended March 31, 2020. (In thousands of Reais - R$, except when otherwise indicated) |
15. Investments
15.1.Breakdown of Investments
The investment information is shown below:
| Parent Company |
| Consolidated | |
| GLA | Smiles Fidelidade |
| Trip |
Relevant Information of the Subsidiaries on March 31, 2020 (Unaudited) |
|
|
|
|
Total Number of Shares | 5,262,335,049 | 124,158,953 |
| - |
Capital Stock | 4,554,280 | 254,609 |
| 1,318 |
Interest | 100,0% | 52,61% |
| 60,0% |
Total Equity (negative) | (9,832,633) | 1,261,975 |
| 2,103 |
Unrealized Profits (a) | - | (118,072) |
| - |
|
|
|
|
|
Adjusted Equity (b) | (9,832,633) | 545,817 |
| 1,254 |
Net Income (Loss) for the Period | (2,261,376) | 56,252 |
| - |
Unrealized Profits in the Period (a) | - | 14,144 |
| - |
Net Income for the Period Attributable to the Company’s Interest (b) | (2,261,376) | 43,737 |
| - |
| Parent Company |
| Consolidated | |
| GLA | Smiles Fidelidade |
| Trip |
Relevant Information of the Subsidiaries on March 31, 2019 |
|
|
|
|
Total Number of Shares | 5,262,335,049 | 124,158,953 |
| - |
Capital Stock | 4,554,280 | 254,610 |
| 1,318 |
Interest | 100.00% | 52.61% |
| 60.00% |
Total Equity (negative) | (6,498,660) | 1,205,335 |
| 2,103 |
Unrealized Profits (a) | - | (132,215) |
| - |
|
|
|
|
|
Adjusted Equity (b) | (6,498,660) | 501,986 |
| 1,254 |
Net Income (Loss) for the Period | 215,027 | 626,725 |
| 129 |
Unrealized Profits in the Period (a) | - | (35,909) |
| - |
Net Income for the Period Attributable to the Company’s Interest (b) | 215,027 | 294,899 |
| 77 |
(a) Corresponds to transactions involving revenue from mileage redemption for airline tickets by members in the Smiles Program which, for the purposes of preliminary quarterly information, are only accrued when program members are actually transported by GLA.
(b) Adjusted shareholders’ equity and net income corresponds to the percentage of total shareholders’ equity and income for the period net of unrealized profits.
15.2.Changes in Investments
| Parent Company | Consolidated | ||
| GLA | Smiles Fidelidade | Total | Trip |
Balances on December 31, 2019 | (6,498,660) | 501,986 | (5,996,674) | 1,254 |
Equity Method Results | (2,261,376) | 43,737 | (2,217,639) | - |
Unrealized Gains on Hedges | (1,077,289) | - | (1,077,289) | - |
Share-based Payments | - | 315 | 315 | - |
Other Equity Changes in Investments | 4,692 | (221) | 4,471 | - |
Balances on March 31, 2020 (Unaudited) | (9,832,633) | 545,817 | (9,286,816) | 1,254 |
28
| Notes to the Preliminary Quarterly Information (without independent auditors’ limited review report) For the three-month period ended March 31, 2020. (In thousands of Reais - R$, except when otherwise indicated) |
16. Property, Plant and Equipment
16.1.Parent Company
On March 31, 2020, the balance of other property, plant and equipment assets reached R$541. On December 31, 2019, the balance was of R$131,841, mainly referring to advances for the acquisition of aircraft, which were returned by the manufacturer, as mentioned in note 1.3. In addition, there is no residual value of the ownership rights on March 31, 2020 (R$108,538 as of December 31, 2019), both recorded in the subsidiary GAC.
29
| Notes to the Preliminary Quarterly Information (without independent auditors’ limited review report) For the three-month period ended March 31, 2020. (In thousands of Reais - R$, except when otherwise indicated) |
16.2.Consolidated
| Weighted average rate (p.a.) | December 31, 2019 | Additions | Write-off | Transfers | March 31, 2020 |
|
|
|
|
|
| (Unaudited) |
Flight Equipment | ||||||
Cost | ||||||
Aircraft - ROU(1) with Purchase Option(5) |
| 660,256 | - | (660,256) | - | - |
Aircraft - ROU with no Purchase Option |
| 3,561,980 | 520,594 | (53,301) | - | 4,029,273 |
Spare Parts and Engines - Own |
| 1,764,295 | 13,025 | (2,816) | (250) | 1,774,254 |
Spare Parts and Engines - Rou |
| 109,977 | - | - | - | 109,977 |
Aircraft and Engine Overhauling |
| 3,084,023 | 316,482 | (20,321) | - | 3,380,184 |
Tools |
| 53,454 | 1,691 | (32) | 250 | 55,363 |
| 9,233,985 | 851,792 | (736,726) | - | 9,349,051 | |
Depreciation |
|
|
|
|
| |
Aircraft - ROU with Purchase Option(5) | 5.76% | (226,433) | (2,935) | 229,368 | - | - |
Aircraft - ROU with no Purchase Option | 21.09% | (719,377) | (216,287) | 39,427 | - | (896,237) |
Spare Parts and Engines – Own | 7.29% | (706,381) | (32,238) | 1,415 | - | (737,204) |
Spare Parts and Engines – Rou | 33.29% | (26,745) | (9,007) | - | - | (35,752) |
Aircraft and Engine Overhauling | 60.87% | (1,717,552) | (232,290) | 20,439 | - | (1,929,403) |
Tools | 10.00% | (24,712) | (1,040) | 12 | - | (25,740) |
|
| (3,421,200) | (493,797) | 290,661 | - | (3,624,336) |
|
|
|
|
|
|
|
Total, Net - Flight Equipment |
| 5,812,785 | 357,995 | (446,065) | - | 5,724,715 |
Property, Plant and Equipment in Use |
|
|
|
| ||
Cost |
|
|
|
| ||
Vehicles |
| 11,681 | 172 | (43) | - | 11,810 |
Machinery and Equipment |
| 63,091 | 218 | (544) | - | 62,765 |
Furniture and Fixtures |
| 32,983 | 1,242 | (155) | - | 34,070 |
Computers and Peripherals – Own |
| 45,732 | 2,083 | (402) | - | 47,413 |
Computers and Peripherals – ROU |
| 21,992 | - | - | - | 21,992 |
Communication Equipment |
| 2,548 | 11 | (180) | - | 2,379 |
Safety Equipment |
| 856 | - | (789) | - | 67 |
Improvement on third party property - CMA(3) |
| 107,637 | - | - | - | 107,637 |
Leasehold Improvements |
| 71,174 | 347 | - | 3,099 | 74,620 |
Third-Party Real Estate – ROU |
| 22,354 | - | - | - | 22,354 |
Construction in Progress |
| 17,906 | 1,042 | - | (3,099) | 15,849 |
397,954 | 5,115 | (2,113) | - | 400,956 | ||
Depreciation |
|
|
|
| ||
Vehicles | 20.00% | (9,291) | (190) | 43 | - | (9,438) |
Machinery and Equipment | 10.00% | (45,437) | (1,055) | 485 | - | (46,007) |
Furniture and Fixtures | 10.00% | (19,908) | (547) | 150 | - | (20,305) |
Computers and Peripherals – Own | 20.00% | (33,190) | (954) | 397 | - | (33,747) |
Computers and Peripherals – ROU | 36.13% | (7,682) | (1,997) | - | - | (9,679) |
Communication Equipment | 10.00% | (2,081) | (40) | 164 | - | (1,957) |
Safety Equipment | 10.00% | (615) | (1) | 573 | - | (43) |
Leasehold Improvements – CMA | 10.43% | (102,675) | (2,820) | - | - | (105,495) |
Leasehold Improvements | 21.94% | (39,039) | (2,733) | - | - | (41,772) |
Third Party Real Estate – ROU | 32.18% | (7,156) | (1,793) | - | - | (8,949) |
|
| (267,074) | (12,130) | 1,812 | - | (277,392) |
Total, Net - Property, Plant and Equipment in Use | 130,880 | (7,015) | (301) | - | 123,564 | |
|
|
|
|
| ||
Impairment Losses(2) | - | (41,719) | - | 1,860 | - | (39,859) |
Total |
| 5,901,946 | 350,980 | (444,506) | - | 5,808,420 |
|
|
|
|
|
|
|
Advances to suppliers(4) | - | 156,155 | 56,851 | (136,962) | - | 76,044 |
Total Property, Plant and Equipment | 6,058,101 | 407,831 | (581,468) | - | 5,884,464 |
(1) ROU - Right of Use
(2) Balance referring to impairment losses for rotatable items (spare parts), classified under the item “Spare parts and engines”, referring to the Company so that the assets are presented by their actual capacity to generate expected future benefits
(3) CMA - Maintenance Center - Confins/MG
(4) The write-off refers to return of PDP as mentioned in Note 1.3.
(5) Write-off due to the sale-leaseback transaction.
30
| Notes to the Preliminary Quarterly Information (without independent auditors’ limited review report) For the three-month period ended March 31, 2020. (In thousands of Reais - R$, except when otherwise indicated) |
In the quarter, Management evaluated and run impairment test for the assets that comprise the group of flight equipment of the fixed assets, by comparing the book value with the market value indicated by specialized publications (“Bluebook”) and concluded that there are no losses related to these assets and, therefore, no provision was recorded.
17. Intangible Assets
The breakdown of and changes in intangible assets are as follows:
| Weighted Average Rate (p.a.) | December 31, 2019 | Additions | Write-offs | March 31, 2020 |
|
|
|
|
| (Unaudited) |
|
|
|
|
|
|
Cost |
|
|
|
|
|
Goodwill | - | 542,302 | - | - | 542,302 |
Slots | - | 1,038,900 | - | - | 1,038,900 |
Software | - | 579,370 | 18,610 | (9,352) | 588,628 |
Other | - | 10,000 | - | - | 10,000 |
Total Cost |
| 2,170,572 | 18,610 | (9,352) | 2,179,830 |
|
|
|
|
|
|
Amortization |
|
|
|
|
|
Software | 24.74% | (389,730) | (21,609) | 9,352 | (401,987) |
Other | 20.00% | (4,167) | (500) | - | (4,667) |
Total Amortization |
| (393,897) | (22,109) | 9,352 | (406,654) |
|
|
|
|
|
|
Net Intangible Assets |
| 1,776,675 | (3,499) | - | 1,773,176 |
17.1 Impairment and sensitivity test
The balances of goodwill and slots were tested for impairment on March 31, 2020 and December 31, 2019 through the discounted cash flow for each cash-generating unit, giving rise to the value in use.
For the purposes of assessing the impairment, assets are grouped at the lowest level for which there is separately identifiable cash flow (cash-generating unit - CGU). To establish the book value of each CGU, the Company considers not only the recorded intangible assets but also all tangible assets necessary for conducting business, as it is only through the use of this set that the Company will generate economic benefits.
The Company allocates goodwill to two cash-generating units: GLA and Smiles, and airport operating rights are fully allocated to GLA’s cash-generating unit, as shown below:
Goodwill GLA | Goodwill Smiles | Airport Operation Rights | |
March 31, 2020 (Unaudited) |
|
|
|
Book value | 325,381 | 216,921 | 1,038,900 |
Value in Use | 17,200,418 | 7,528,353 | 18,482,572 |
|
|
|
|
Discount Rate | 11.18% | 10.98% | 12.46% |
Perpetuity Growth Rate | 3.39% | 3.39% | 3.39 |
|
|
|
|
Sensitivity |
|
|
|
10% variation | 12.25% | 12.09% | 13.63% |
Value in Use | 14,632,253 | 6,804,578 | 16,622,795 |
Change in Value in Use | (2,568,165) | (723,775) | (1,859,777) |
|
|
|
|
25% variation | 13.85% | 13.77% | 15.39% |
Value in Use | 11,521,462 | 5,940,276 | 14,381,635 |
Change in Value in Use | (5,678.956) | (1,588,077) | (4,100,937) |
31
| Notes to the Preliminary Quarterly Information (without independent auditors’ limited review report) For the three-month period ended March 31, 2020. (In thousands of Reais - R$, except when otherwise indicated) |
The results obtained were compared with the book value of each cash-generating unit and, as a result, the Company did not recognize losses in relation to the impairment of its CGUs.
The assumptions adopted in the impairment tests of intangible assets are in accordance with the internal projections for the five-year period. For the period after five years, extrapolation is applied using a perpetuity growth rate. The discounted cash flow that calculated the value in use of the cash-generating units was prepared in accordance with the Company’s business plan and approved by the Company’s Board of Directors.
The main assumptions considered by the Company to calculate the value in use of the cash generating units are:
· Capacity and Fleet: Considers the utilization, the capacity of the aircraft used in each section and the projection of the size of the fleet in operation.
· Demand: Market efficiency is the main input for the Company’s projected growth in demand. The Management considers that market efficiency is the ratio between its market share and its seat share. This indicator reflects how efficiently the company employs its share of the total market supply due to its capture of demand for air transportation.
· Revenue per Passenger: Considers the average price charged by GLA and considers the effects of market variables (see variables used below).
· Operating costs associated with the business: Based on its historical cost and updated by indicators, such as inflation, relation to supply, demand and variation in the US currency.
The Company also considered market variables such as GDP (source: Central Bank of Brazil), US dollar (source: Central Bank of Brazil), kerosene barrel (source: Brazilian Agency of Oil - “ANP”) and interest rate (source: Bloomberg).
32
| Notes to the Preliminary Quarterly Information (without independent auditors’ limited review report) For the three-month period ended March 31, 2020. (In thousands of Reais - R$, except when otherwise indicated) |
18. Loans and Financing
The breakdown of and changes in short and long-term debt are as follows:
| ||||||||||||||
|
|
| 12/31/2019 |
|
|
|
|
|
|
| 03/31/2020 | |||
| Maturity | Interest Rate p.a. | Current | Noncurrent | Total | Unrealized Gain and Loss from ESN | Payment of Principal | Interest | Interest Paid | Exchange Rate Change | Cost amortization / goodwill | Current | Noncurrent | Total |
|
|
|
|
|
|
|
|
|
|
|
| (Unaudited) | ||
|
|
|
|
|
|
|
|
|
|
|
|
|
|
|
In US$: |
|
| ||||||||||||
Term Loan | 08/2020 | 6.70% | 1,229,600 | - | 1,229,600 | - | - | 21,583 | (43,704) | 354,897 | 2,287 | 1,564,663 | - | 1,564,663 |
Senior Bonus IV | 01/2022 | 9.10% | 12,102 | 313,267 | 325,369 | - | (405,878) | 7,052 | (20,695) | 92,730 | 1,422 | - | - | - |
ESN(*) | 07/2024 | 3.75% | 29,443 | 1,753,526 | 1,782,969 | (575,357) | - | 37,351 | (34,023) | 426,315 | (280) | 17,261 | 1,619,714 | 1,636,975 |
Senior Bonus VIII | 01/2025 | 7.09% | 75,587 | 2,548,472 | 2,624,059 | - | - | 50,070 | (97,131) | 760,224 | 1,275 | 37,726 | 3,300,771 | 3,338,497 |
Perpetual Notes | - | 8.75% | 12,815 | 620,328 | 633,143 | - | - | 13,021 | (12,418) | 182,868 | - | 16,530 | 800,084 | 816,614 |
Total |
|
| 1,359,547 | 5,235,593 | 6,595,140 | (575,357) | (405,878) | 129,077 | (207,971) | 1,817,034 | 4,704 | 1,636,180 | 5,720,569 | 7,356,749 |
Consolidated | |||||||||||||||
|
|
| 12/31/2019 |
|
|
|
|
|
|
| 03/31/2020 | ||||
| Maturity | Interest Rate p.a. | Current | Noncurrent | Total | Funding | Unrealized Gain and Loss from ESN | Payment of principal | Interest | Interest Paid | Exchange Rate Change | Amortization of cost / Goodwill | Current | Noncurrent | Total |
|
|
|
|
|
|
|
|
|
|
|
|
| (Unaudited) | ||
In R$: |
|
| |||||||||||||
Debentures VII | 09/2021 | 120% of CDI rate | 289,423 | 289,302 | 578,725 | - | - | - | 7,214 | (7,233) | - | 1,867 | 435,764 | 144,809 | 580,573 |
|
|
|
|
|
|
|
|
|
| ||||||
In US$: |
|
|
|
|
|
|
|
|
|
| |||||
Term Loan | 08/2020 | 6.70% | 1,229,600 | - | 1,229,600 | - | - | - | 21,583 | (43,704) | 354,897 | 2,287 | 1,564,663 | - | 1,564,663 |
Import financing | 11/2020 | 5.32% | 663,979 | - | 663,979 | 25,974 | - | - | 10,245 | (7,116) | 196,702 |
| 889,784 | - | 889,784 |
Senior Bonus IV | 11/2022 | 9.10% | 12,102 | 313,267 | 325,369 | - | - | (405,878) | 7,052 | (20,695) | 92,730 | 1,422 | - | - | - |
ESN(1) | 07/2024 | 3.75% | 29,443 | 1,753,526 | 1,782,969 | - | (575,357) | - | 37,351 | (34,023) | 426,315 | (280) | 17,261 | 1,619,714 | 1,636,975 |
Credit Line - Engine Maintenance | 09/2024 | 2.75% | 198,363 | 277,479 | 475,842 | - | - | (72,964) | 4,446 | (4,581) | 129,531 | 2,276 | 219,016 | 315,534 | 534,550 |
Senior Bonus VIII | 01/2025 | 7.09% | 75,587 | 2,548,472 | 2,624,059 | - | - | - | 50,070 | (97,131) | 760,224 | 1,275 | 37,726 | 3,300,771 | 3,338,497 |
Loan with guarantee of engines | 12/2026 | 5.16% | 31,727 | 150,821 | 182,548 | 59,976 | - | (22,728) | 2,921 | (2,921) | 53,620 | 45 | 27,697 | 245,764 | 273,461 |
Perpetual Notes(2) | - | 8.75% | 12,815 | 533,935 | 546,750 | - | - | - | 12,857 | (12,418) | 157,997 | - | 16,527 | 688,659 | 705,186 |
Total |
|
| 2,543,039 | 5,866,802 | 8,409,841 | 85,950 | (575,357) | (501,570) | 153,739 | (229,822) | 2,172,016 | 8,892 | 3,208,438 | 6,315,251 | 9,523,689 |
(1) Exchangeable Senior Notes, see note 34.2.
(2) Considers the exclusion of related parts amounting to R$111,428
33
| Notes to the Preliminary Quarterly Information (without independent auditors’ limited review report) For the three-month period ended March 31, 2020. (In thousands of Reais - R$, except when otherwise indicated) |
The conditions of loans and financing raised up to December 31, 2019 by the Company and its subsidiaries were disclosed in detail in the financial statements for the year ended December 31, 2019 and did not undergo contractual changes during the three-month period ended on March 31, 2020.
Total consolidated loans and financing as at March 31, 2020 include funding costs of R$116,714 (R$143,119 as at December 31, 2019) that are amortized over the term of the respective loans and financing.
As at March 31, 2020, a General Debenture Holder Meeting was held, where it was decided to suspend the effects of automatic early maturity, in view of the failure to pay the unit face value of the debentures referring to the installment due on March 28, 2020.At that meeting, it was decided to extend the debentures' principal amortization obligations by 10 days, therefore, for the purposes of preparing this preliminary quarterly information, the balance of such obligations was maintained in the short term.
18.1.New Loans and Financing Contracted during the three-month period ended March 31, 2020
18.1.1.Import financing
During the three-month period ended March 31, 2020, the Company, through its subsidiary GLA, obtained funding and renegotiated the maturities of the agreements, with the issue of promissory notes as collateral for these transactions, which are part of a credit line maintained by GLA for import financing in order to carry out engine maintenance, purchase spare parts and aircraft equipment. The funding operations are as follows:
Transaction | Principal Amount | Interest | Maturity | |
Date | (US$ thousand) | (R$ thousand) | Rate (p.a.) |
|
(Unaudited) | ||||
New Issuances |
|
|
|
|
02/19/2020 | 5,920 | 25,974 | 4.07% | 02/13/2021 |
|
|
|
|
|
Renegotiations |
|
|
|
|
01/02/2020 | 4,335 | 17,431 | 5.79% | 06/30/2020 |
01/14/2020 | 4,571 | 18,943 | 6.22% | 05/13/2020 |
01/17/2020 | 6,455 | 27,005 | 5.71% | 07/15/2020 |
01/21/2020 | 8,595 | 36,112 | 6.22% | 05/20/2020 |
01/24/2020 | 4,815 | 20,112 | 4.17% | 01/18/2021 |
01/31/2020 | 5,925 | 25,296 | 5.63% | 07/29/2020 |
02/14/2020 | 7,069 | 30,512 | 5.59% | 08/12/2020 |
02/21/2020 | 6,531 | 28,688 | 5.56% | 08/19/2020 |
18.1.2.Loan with Guarantee of Engines
In the three-month period ended March 31, 2020, the Company, through its subsidiary GLA, obtained funding with a guarantee of the Company’s own engines. The funding operations are as follows:
Transaction | Principal Amount | Costs | Interest | Maturity | ||
Date | (US$ thousand) | (R$ thousand) | (US$ thousand) | Date | (p.a.) |
|
(Unaudited) | ||||||
March 20, 2020 | 12,000 | 60,874 | 177 | 898 | Libor 1m+3,33% p.a. | March 20, 2028 |
34
| Notes to the Preliminary Quarterly Information (without independent auditors’ limited review report) For the three-month period ended March 31, 2020. (In thousands of Reais - R$, except when otherwise indicated) |
18.1.3.Loan and Financing - Noncurrent
As at March 31, 2020, the maturities of loans and financing recorded in non-current liabilities are as follows:
| 2021 | 2022 | 2023 | 2024 | 2024 onwards | Without Maturity Date | Total |
(Unaudited) | |||||||
Parent Company | |||||||
In US$: | |||||||
ESN | - | - | - | 1,619,714 | - | - | 1,619,714 |
Senior Notes VIII | - | - | - | - | 3,300,771 | - | 3,300,771 |
Perpetual Notes | - | - | - | - | - | 800,084 | 800,084 |
Total | - | - | - | 1,619,714 | 3,300,771 | 800,084 | 5,720,569 |
Consolidated | |||||||
In R$: |
|
|
|
|
|
|
|
Debentures VII | 144,809 | - | - | - | - |
| 144,809 |
In US$: |
|
|
|
|
|
|
|
Credit Line - Engine Maintenance | 79,681 | 23,011 | 23,011 | 189,831 | - | - | 315,534 |
ESN | - | - | - | 1,619,714 | - | - | 1,619,714 |
Senior Notes VIII | - | - | - | - | 3,300,771 | - | 3,300,771 |
Loan with Guarantee of Engines | 21,357 | 29,265 | 30,189 | 31,165 | 133,788 | - | 245,764 |
Perpetual Notes | - | - | - | - | - | 688,659 | 688,659 |
Total | 245,847 | 52,276 | 53,200 | 1,840,710 | 3,434,559 | 688,659 | 6,315,251 |
The fair value of debt as of March 31, 2020 is as follows:
Parent Company | Consolidated | |||
| Accounting | Fair Value | Accounting | Fair Value |
(Unaudited) | ||||
|
|
|
|
|
Senior Notes and Perpetual Notes | 4,155,111 | 1,905,250 | 4,043,683 | 1,868,153 |
Term Loan | 1,564,663 | 1,559,577 | 1,564,663 | 1,559,577 |
ESN | 1,636,975 | 815,424 | 1,636,975 | 815,424 |
Debentures | - | - | 580,573 | 591,666 |
Other | - | - | 1,697,795 | 1,697,795 |
Total | 7,356,749 | 4,280,251 | 9,523,689 | 6,532,615 |
18.2.Covenants
The Company has restrictive covenants on the Term Loan and Debentures VII.
The Company has restrictive covenants on the Term Loan and must make deposits for reaching contractual limits of the debt pegged to the U.S. dollar. As at March 31, 2020, the Company did not have collateral deposits linked to the contractual limits of the Term Loan.
The mandatory measurement of such indicators is carried out in compliance with the debentures issue deed, that is, every six months. The next measurement will be carried out at the end of the first half of 2020.
On April 9, 2020, a Debenture Holders’ Meeting granted the waiver regarding the non-compliance with the financial rates and limits set for the fiscal year of 2020, which would bemeasured on June 30 and December 31, 2020. The current readings will remain in force as of the fiscal year of 2021.
35
| Notes to the Preliminary Quarterly Information (without independent auditors’ limited review report) For the three-month period ended March 31, 2020. (In thousands of Reais - R$, except when otherwise indicated) |
19. Leases
|
|
| ||||||||||||
|
| 12/31/2019 |
|
|
|
|
|
|
| 03/31/2020 | ||||
| Weighted Average Rate (p.a.) | Current | Noncurrent | Total | Additions | Write-offs |
| Payments | Interest incurred | Interest Payment | Exchange Rate Change | Current | Noncurrent | Total |
|
|
|
|
|
|
|
|
|
|
|
| (Unaudited) | ||
|
|
|
|
|
|
|
|
|
|
|
|
|
|
|
In R$: |
|
|
|
|
|
|
|
|
|
| ||||
Right of use leases without purchase option | 13.28% | 21,781 | 23,026 | 44,807 | - | - | - | (4,371) | 3,234 | - | - | 23,880 | 19,790 | 43,670 |
Total | 21,781 | 23,026 | 44,807 | - | - | - | (4,371) | 3,234 | - | - | 23,880 | 19,790 | 43,670 | |
|
|
|
|
|
|
|
|
|
| |||||
In US$: |
|
|
|
|
|
|
|
|
|
| ||||
Right of use leases with purchase option | 3.75% | 128,936 | 419,894 | 548,830 | - | (618,487) | - | (26,049) | 4,592 | (4,592) | 95,706 | - | - | - |
Right of Use Leases Without Purchase Option | 8.54% | 1,253,995 | 4,205,148 | 5,459,143 | 516,234 | - | 58,402 | (391,293) | 133,706 | - | 1,598,792 | 1,757,552 | 5,617,432 | 7,374,984 |
Total | 1,382,931 | 4,625,042 | 6,007,973 | 516,234 | (618,487) | 58,402 | (417,342) | 138,298 | (4,592) | 1,694,498 | 1,757,552 | 5,617,432 | 7,374,984 | |
|
|
|
|
|
|
|
|
|
|
|
| |||
Total Leases | 1,404,712 | 4,648,068 | 6,052,780 | 516,234 | (618,487) | 58,402 | (421,713) | 141,532 | (4,592) | 1,694,498 | 1,781,432 | 5,637,222 | 7,418,654 | |
36
| Notes to the Preliminary Quarterly Information (without independent auditors’ limited review report) For the three-month period ended March 31, 2020. (In thousands of Reais - R$, except when otherwise indicated) |
The future payments of financial lease agreements are detailed as follows:
| Without Purchase Option | With Purchase option | |
| 03/31/2020 | 12/31/2019 | 12/31/2019 |
| (Unaudited) |
|
|
|
|
|
|
2020 | 1,841,870 | 1,691,357 | 148,613 |
2021 | 1,849,999 | 1,324,403 | 148,744 |
2022 | 1,588,504 | 1,125,060 | 207,654 |
2023 | 1,292,134 | 904,627 | 72,801 |
2024 onwards | 2,798,165 | 1,938,987 | 16,830 |
Total Minimum Lease Payments | 9,370,672 | 6,984,434 | 594,642 |
Less Total Interest | (1,952,018) | (1,480,484) | (45,812) |
Present Value of Minimum Lease Payments | 7,418,654 | 5,503,950 | 548,830 |
Less Current Portion | (1,781,432) | (1,275,776) | (128,936) |
Noncurrent Portion | 5,637,222 | 4,228,174 | 419,894 |
19.1.Sale-leaseback Transactions
During the three-year period ended March 31, 2020, the Company recorded a net gain of R$594,587 (unaudited) (R$7,924 as at March 31, 2020) in the consolidated arising from 11 aircraft sale-leaseback transaction recorded under “Sale-Leaseback Transactions” in Other operating income (expenses), net (Note 30).
20. Suppliers
Parent Company | Consolidated | |||
| 03/31/2020 | 12/31/2019 | 03/31/2020 | 12/31/2019 |
| (Unaudited) |
| (Unaudited) |
|
|
|
|
|
|
Local Currency | 12,283 | 15,952 | 778,709 | 833,781 |
Foreign Currency | 4,551 | 3,164 | 550,313 | 462,636 |
Total | 16,834 | 19,116 | 1,329,022 | 1,296,417 |
|
|
|
|
|
Current | 16,834 | 19,116 | 1,272,819 | 1,286,275 |
Noncurrent | - | - | 56,203 | 10,142 |
As at March 31, 2020, the balance to be paid to related parties recorded in the consolidated caption “Suppliers” was R$1,887 (R$1,882 as at December 31, 2019), and refers substantially to transportation operations with Viação Piracicabana Ltda.
21. Suppliers - Forfaiting
The Company has an arrangement in place that allow suppliers to receive their payments in advance with the financial institution. As at March 31, 2020, the amount recorded under current liabilities from forfeiting operations totaled R$781,600 (unaudited) (R$554,467 as of December 31, 2019).
37
| Notes to the Preliminary Quarterly Information (without independent auditors’ limited review report) For the three-month period ended March 31, 2020. (In thousands of Reais - R$, except when otherwise indicated) |
22. Taxes Payable
| Parent Company | Consolidated | ||
| 03/31/2020 | 12/31/2019 | 03/31/2020 | 12/31/2019 |
| (Unaudited) |
| (Unaudited) |
|
|
|
|
|
|
PIS and COFINS | 212 | 2,278 | 65,839 | 39,133 |
Installment Payments - PRT and PERT | - | - | 1,955 | 2,117 |
Withholding Income Tax on Salaries | 327 | 32 | 34,420 | 54,649 |
ICMS | - | - | 284 | 424 |
IRPJ and CSLL Payable | 190 | 1,951 | - | 9,496 |
Other | 962 | - | 11,463 | 10,788 |
Total | 1,691 | 4,261 | 113,961 | 116,607 |
|
|
|
|
|
Current | 1,691 | 4,261 | 113,940 | 116,523 |
Noncurrent | - | - | 21 | 84 |
23. Advance from Ticket Sales
As at March 31, 2020, the balance of Advance from Ticket Sales classified in current liabilities was R$1,604,106 (R$1,966,148 as at December 31, 2019) and is represented by 5,079,110 tickets sold and not yet used (6,239,179 as at December 31, 2019) with an average use of 154 days (59 days as at December 31, 2019).
As determined by the regulatory agencies, travel bookings may be made within a period corresponding to 12 months, and therefore it was not necessary to reclassify any portion of the transport-related obligations to be carried out to non-current liabilities.
The balances of transportations to be carried out are presented net of breakage amount to R$430,025 as at March 31, 2020 (R$415,688 as at December 31, 2019).
24. Provisions
| Consolidated | |||
| Provisions Post-Employment Benefit | Provision for aircraft and engine return | Provision for legal proceedings (a) | Total |
Balances on December 31, 2019 | 96,760 | 869,078 | 291,218 | 1,257,056 |
Additional provisions recognized | 3,003 | 109,967 | 74,502 | 187,472 |
Provisions Used | - | (20,484) | (52,202) | (72,686) |
Adjustment to Present Value | 1,747 | - | - | 1,747 |
Foreign Exchange Rate Change, Net | - | 238,867 | 227 | 239,094 |
Balances on March 31, 2020 (Unaudited) | 101,510 | 1,197,428 | 313,745 | 1,612,683 |
|
|
|
|
|
As of March 31, 2020 (Unaudited) |
|
|
|
|
Current | - | 270,327 | - | 270,327 |
Noncurrent | 101,510 | 927,101 | 313,745 | 1,342,356 |
Total | 101,510 | 1,197,428 | 313,745 | 1,612,683 |
|
|
|
|
|
As of December 31, 2019 |
|
|
|
|
Current | - | 203,816 | - | 203,816 |
Noncurrent | 96,760 | 665,262 | 291,218 | 1,053,240 |
Total | 96,760 | 869,078 | 291,218 | 1,257,056 |
(a) The provisions consider write-offs due to the revaluation of the estimate and settled proceedings.
38
| Notes to the Preliminary Quarterly Information (without independent auditors’ limited review report) For the three-month period ended March 31, 2020. (In thousands of Reais - R$, except when otherwise indicated) |
24.1.Provisions for Post-Employment Benefits
The Company offers its employees a health care plan that, in compliance with the current legislation, generates an obligation for post-employment benefits.
The changes in actuarial assets and liabilities related to the post-employment benefit, prepared based on an actuarial report, are presented below:
| Consolidated | |
| 03/31/2020 | 12/31/2019 |
| (Unaudited) |
|
|
|
|
Actuarial Liabilities at Beginning of the Year | 96,760 | 46,496 |
Current Service Cost Recognized in Income | 3,003 | 4,910 |
Cost of Interests Recognized in Income | 1,747 | 4,311 |
Sponsor Contributions | - | (2) |
Effect of Changing Financial Assumptions (decrease in discount rate) | - | 34,305 |
Effect of Plan Experience | - | 6,740 |
Actuarial Liabilities at the End of the Period | 101,510 | 96,760 |
|
|
|
Actuarial Assumptions |
| |
Weighted average of assumptions to determine the defined benefit obligation |
| |
Nominal Discount Rate | 7.23% | 7.23% |
Long-Term Estimated Inflation Rate | 3.50% | 3.50% |
HCCTR - Medical Inflation Rate | 6.86% | 6.86% |
Mortality Table | AT-2000 loosened by 10% | AT-2000 loosened by 10% |
Weighted average of assumptions to determine the cost (revenue) of the defined benefit |
|
|
Nominal Discount Rate | 9.27% | 9.27% |
Long-Term Estimated Inflation Rate | 4.00% | 4.00% |
HCCTR - Medical Inflation Rate | 7.38% | 7.38% |
Mortality Table | AT-2000 loosened by 10% | AT-2000 loosened by 10% |
24.2.Provision for Aircraft and Engine Return
Such provisions consider the costs that meet the contractual conditions for the return of engines held under an operating lease, as well as for the costs to be incurred to reconfigure the aircraft, upon their return, according to the conditions established in the lease agreements. The consideration is capitalized in fixed assets, under the heading “Aircraft and Engines Overhauling”.
24.3.Provision for Legal Proceedings
As at March 31, 2020, the Company and its subsidiaries are parties to judicial and administrative proceedings. Details on the significant proceedings were provided in the financial statements for the year ended December 31, 2019.
The Company’s Management believes that the provision for tax, civil and labor risks, created in accordance with CPC 25 – “Provisions, Contingent Assets and Liabilities”, equivalent to IAS 37, is sufficient to cover possible losses from administrative and legal proceedings. The breakdown of the expected probable and possible losses is as shown below:
39
| Notes to the Preliminary Quarterly Information (without independent auditors’ limited review report) For the three-month period ended March 31, 2020. (In thousands of Reais - R$, except when otherwise indicated) |
| Consolidated | |||
| Probable Loss | Possible Loss | ||
| 03/31/2020 | 12/31/2019 | 03/31/2020 | 12/31/2019 |
| (Unaudited) |
| (Unaudited) |
|
|
|
|
|
|
Civil Status | 82,848 | 78,119 | 46,898 | 62,473 |
Labor | 219,446 | 210,699 | 246,283 | 237,253 |
Taxes | 11,451 | 2,400 | 597,159 | 586,812 |
Total | 313,745 | 291,218 | 890,340 | 886,538 |
25. Shareholders’ Equity
25.1.Capital Stock
As at March 31, 2020, capital amounted to R$3,163,796, represented by 3,137,364,724 shares, with 2,863,682,710 common shares and 273,682,014 preferred shares.
The cost with the issuance of shares as at March 31, 2020 and December 31, 2019 corresponds to R$155,618.
The Company’s shareholding structure is as follows:
| 03/31/2020 | 12/31/2019 | ||||
| Common | Preferred | Total | Common | Preferred | Total |
|
| (Unaudited) |
|
| ||
|
|
|
|
|
|
|
Fundo Volluto | 100.00% | 0.00% | 23.00% | 100.00% | - | 23.00% |
Mobi FIA | - | 37.59% | 28.94% | - | 37.59% | 28.94% |
AirFrance - KLM | - | 1.55% | 1.19% | - | 1.55% | 1.19% |
Other | - | 2.23% | 1.73% | - | 2.23% | 1.73% |
Free Float | - | 58.63% | 45.14% | - | 58.63% | 45.14% |
Total | 100.00% | 100.00% | 100.00% | 100.00% | 100.00% | 100.00% |
The authorized share capital on December 31, 2019, is R$6 billion. Within the authorized limit, the Company may, upon a resolution of the Board of Directors, increase the share capital regardless of statutory reform, by issuing shares, without keeping a proportion between the different types of shares. Under the terms of the Law, in the case of a capital increase within the authorized limit, the Board of Directors will establish the issuance conditions, including the price and payment term.
25.2.Treasury Shares
As at March 31, 2020, the Company had 3,006,390 treasury shares, totaling R$102,543 (3,006,390 shares in the amount of R$102,543 as at December 31, 2019). As at March 31, 2020, the average market price of treasury shares was R$11.37 (R$33.84 as at December 31, 2019).
40
| Notes to the Preliminary Quarterly Information (without independent auditors’ limited review report) For the three-month period ended March 31, 2020. (In thousands of Reais - R$, except when otherwise indicated) |
26. Earnings (Loss) per Share
Earnings (loss) per Company share was determined as follows:
| Parent Company and Consolidated | |||||
| 03/31/2020 | 03/31/2019 | ||||
| Common | Preferred | Total | Common | Preferred | Total |
| (Unaudited) |
|
|
| ||
|
|
|
|
|
|
|
Numerator |
|
|
|
| ||
Net Loss for the Period Attributable to Equity Holders of the Parent | (526,378) | (1,761,891) | (2,288,269) | (7,553) | (24,754) | (32,307) |
|
|
|
|
|
|
|
Denominator |
|
|
|
|
|
|
Weighted Average Number of Outstanding Shares (in thousands) | 2,863,683 | 273,866 | - | 2,863,683 | 268,138 |
|
Adjusted weighted average number of outstanding shares and diluted presumed conversions (in thousands) | 2,863,683 | 273,866 | - | 2,863,683 | 268,138 |
|
Basic Loss per Share | (0.184) | (6.433) |
| (0.003) | (0.092) |
|
Diluted Loss per Share | (0.184) | (6.433) |
| (0.003) | (0.092) |
|
Diluted earnings (loss) per share are calculated by adjusting the weighted average number of outstanding shares by instruments potentially convertible into shares. The Company has only one category of potentially dilutive shares (stock option), as described in Note 27. However, due to the losses ascertained in the year ended on December 31, 2019 and March 31, 2020, these instruments issued by the parent company have no dilutive effect and therefore were not included in the total quantity of outstanding shares to calculate diluted losses per share.
27. Share-based payments
The conditions of the share-based compensation plans and restricted shares granted to the Company’s executives were detailed in the financial statements for the year ended December 31, 2019, and have not changed in the period ended March 31, 2020.
Changes in plans for the period ended March 31, 2020 are shown below:
27.1.Stock Option Plan - GOL
| Number of Stock Options | Weighted Average Exercise Price |
Outstanding Options on December 31, 2019 | 7,660,855 | 7.11 |
Options Exercised | (11,000) | 12.81 |
Options Canceled and Adjustments in Estimated Prescribed Rights | 1,769 | 27.45 |
Outstanding Options on March 31, 2020(Unaudited) | 7,651,624 | 7.10 |
|
|
|
Number of Options Exercisable as of: |
|
|
December 31, 2019 | 5,939,631 | 8.42 |
March 31, 2020 (Unaudited) | 5,930,400 | 8.41 |
41
| Notes to the Preliminary Quarterly Information (without independent auditors’ limited review report) For the three-month period ended March 31, 2020. (In thousands of Reais - R$, except when otherwise indicated) |
The expense recognized in income for the year corresponding to the stock option plans in the three-month period ended March 31, 2020 was R$3,100 (R$6,128 in the three-month period ended March 31, 2019).
27.2.Restricted Share Plan - GOL
| Total Restricted Shares |
Transferable Restricted Shares as of December 31, 2019 | 1,533,996 |
Transferable Restricted Shares as of March 31, 2020 (Unaudited) | 1,533,996 |
The expense recognized in income for the year corresponding to the stock option plans for the three-month period ended March 31, 2020 was R$ 1,592 (R$ 2,433 for the three-month period ended March 31, 2019).
27.3.Stock Option Plan – Smiles Fidelidade
During the year ended on March 31, 2020, the Company recognized R$598 in equity referring to the share-based compensation with a corresponding entry in the income statement under personnel expenses (R$811 for the three-month period ended on March 31, 2019).
Additionally, referenced to the Company’s shares, a complementary cash-settled bonus is granted to executives and employees, to strengthen their commitment and productivity with the results. On March 31, 2020, the balance of this obligation totaled R$702 (R$6,079 as of December 31, 2019) recorded under “Salaries”, referenced to 43,892 equivalent Company’s shares. The same amount was recorded under “Personnel Expenses” in the statement of operations (R$1,438 during the three-month period ended March 31, 2019) related to these rights.
42
| Notes to the Preliminary Quarterly Information (without independent auditors’ limited review report) For the three-month period ended March 31, 2020. (In thousands of Reais - R$, except when otherwise indicated) |
28. Transactions with Related Parties
28.1.Loan Agreements - Non-current Assets and Liabilities
The parent company maintains assets and liabilities from loan agreements with its subsidiary GLA without interest, as shown in the table below:
|
|
|
| Assets | Liabilities |
| |
Creditor | Debtor | Type of Transaction | Interest Rate (p.a.) | 03/31/2020 | 12/31/2019 | 03/31/2020 | 12/31/2019 |
|
|
|
| (Unaudited) |
| (Unaudited) |
|
|
|
|
|
|
|
|
|
GOL | GLA | Loan | 5.46% | 886,053 | 507,408 | - | 2,121 |
GAC | GLA | Loan | (*) | 1,313,473 | 1,018,369 | 454,889 | 161,229 |
Gol Finance | GLA | Loan | 4.92% | 2,721,990 | 1,914,924 | - | - |
Total |
|
|
| 4,921,516 | 3,440,701 | 454,889 | 163,350 |
(*) According to the local legislation, the Company applies symbolic interest rates.
In addition to the amounts above, the following table shows the balances between the Companies eliminated in the Consolidated:
|
|
|
|
| Balances | |
Creditor | Debtor | Type of Transaction | Maturity of the Contracts | Interest Rate (p.a.) | 03/31/2020 | 12/31/2019 |
|
|
|
|
| (Unaudited) |
|
|
|
|
|
|
|
|
Gol Finance | Gol | Subscription Bonus (*) | July 2024 | - | 602,350 | 602,350 |
Gol Finance Inc, | GAC | Loan | January 2023 | 8,64% | 1,114,346 | 1,267,594 |
Gol Finance | GAC | Loan | March 2025 | 4,19% | 1,265,233 | 1,061,747 |
Gol Finance | Gol Finance Inc, | Loan | January 2020 | 9,83% | 159,213 | 945,721 |
Gol Finance Inc, | Gol Finance | Loan | July 2020 | 11,70% | 19,307 | 196,298 |
Smiles Fidelidade | GLA | Advance ticket purchases | December 2032 | 5,87% | 1,174,996 | 970,899 |
Smiles Fidelidade | GLA | Miles Sold | December 2032 | - | 18,589 | 32,271 |
Smiles Fidelidade | GLA | Management Fees | December 2032 | - | 1,329 | 1,300 |
Smiles Fidelidade | GLA | Letter of Indemnity Agreement | - | - | 1,115 | 1,414 |
Smiles Fidelidade | GLA | Shared Services | December 2032 | - | 8,013 | 6,283 |
Smiles Fidelidade | GLA | Transfer - GLA | December 2032 | - | 6,209 | 23,540 |
Smiles Viagens | Smiles fidelidade | Dividends | December 2032 | - | 267 | 267 |
Smiles Fidelidade | GOL | Dividends | - |
| 54,544 | 69,548 |
Total |
|
|
|
| 4,425,511 | 5,179,232 |
(*) The subsidiary Gol Finance, through Gol Equity Finance, acquired the subscription bonus issued by the Company under the Exchangeable Senior Notes.
28.2.Transportation and Consulting Services
In the course of its operations, the Company, by itself and through its subsidiaries, entered into agreements with the companies listed below:
· Mobitrans Administração e Participações S.A.: Business consultancy and advisory services, valid for an indefinite period
· Viação Piracicabana Ltda.:Provision of passenger, baggage, crew and employee transportation services between airports, effective until September 30, 2021.
On March 31, 2020, the subsidiary GLA recognized a total expense related to these services ofR$2,009 (R$2,758 on March 31, 2019). On the same date, the balance payable to related companies, under “suppliers”, was of R$1,887 (R$1,822 on December 31, 2019), and refers mainly to transportation operations with Viação Piracicabana Ltda.
43
| Notes to the Preliminary Quarterly Information (without independent auditors’ limited review report) For the three-month period ended March 31, 2020. (In thousands of Reais - R$, except when otherwise indicated) |
28.3.Contracts of Account Opening UATP (“Universal Air Transportation Plan”) to Grant Credit Limit
The subsidiary GLA entered into UATP account opening agreements with the related parties indicated below: Aller Participações S.A.; BR Mobilidade Baixada Santista S.A. SPE; Breda Transportes e Serviços S.A.; Comporte Participações S.A.; Empresa Cruz de Transportes Ltda.; Empresa de Ônibus Pássaro Marron S.A.; Empresa Princesa do Norte S.A.; Expresso Itamarati S.A.; Expresso Maringá do Vale S.A.; Expresso União Ltda.; Glarus Serviços Tecnologia e Participações S.A.; Limmat Participações S.A.; Quality Bus Comércio de Veículos S.A.; Super Quadra Empreendimentos Imobiliários S.A.; Thurgau Participações S.A.; Transporte Coletivo Cidade Canção Ltda.; Turb Transporte Urbano S.A.; Vaud Participações S.A.; and Viação Piracicabana Ltda., all with no expiration date, whose purpose is to issue credits to purchase airline tickets issued by the Company.The UATP account (virtual card) is accepted as a payment method on the purchase of airline tickets and related services, seeking to simplify billing and facilitate payment between the participating companies.
Such companies are owned by the individuals who control the funds FIP Volutto and Mobi FIA, the main shareholders of the Company
28.4.Commercial Partnership and Maintenance Agreement
On February 19, 2014, the Company signed an exclusive strategic partnership agreement for business cooperation with AirFrance-KLM. On January 1, 2017, the Company signed an extension of the scope for the inclusion of maintenance services. During the three-month period ended March 31, 2020, expenses on component maintenance carried out at the AirFrance-KLM workshop were R$171,290 (R$42,363 on March 31, 2019). As of March 31, 2020, the Company has R$142,338 in the “Suppliers” account in current liabilities (R$142,241 as of December 31, 2019).
28.5.Remuneration of Key Management Personnel
| Consolidated | |
| 03/31/2020 | 03/31/2019 |
| (Unaudited) |
|
|
|
|
Salaries and Benefits (*) | 12,968 | 20,205 |
Related Taxes and Charges | 1,828 | 2,127 |
Share-Based Payments | 2,554 | 2,668 |
Total | 17,350 | 25,000 |
(*) Includes compensation for members of the management, audit committee and supervisory board.
44
| Notes to the Preliminary Quarterly Information (without independent auditors’ limited review report) For the three-month period ended March 31, 2020. (In thousands of Reais - R$, except when otherwise indicated) |
| Consolidated | |
| 03/31/2020 | 03/31/2019 |
| (Unaudited) |
|
|
|
|
Number of members |
|
|
Board of Directors | 9 | 9 |
Board of Directors – subsidiary | 3 | 3 |
Statutory Executive Officers | 4 | 4 |
Statutory Executive Officers - subsidiary | 2 | 2 |
Non-Statutory Executive Officers | 26 | 25 |
Fiscal Council | 3 | 3 |
Fiscal Council – subsidiary | 3 | 3 |
Statutory Audit Committee | 3 | 3 |
Statutory Audit Committee - subsidiary | 3 | 3 |
Total | 56 | 55 |
29. Revenue
Consolidated | ||
| 03/31/2020 | 03/31/2019 |
| (Unaudited) |
|
|
|
|
Passenger Transportation (*) | 3,026,498 | 3,129,021 |
Job Title | 100,356 | 92,233 |
Mileage Revenue | 109,887 | 102,111 |
Other Revenue | 30,314 | 28,741 |
Gross Revenue | 3,267,055 | 3,352,106 |
|
| |
Related Tax | (119,328) | (141,298) |
Net Revenue | 3,147,727 | 3,210,808 |
(*) Of the total amount, the amount of R$139,257 in the three-month period ended March 31, 2020 is comprised of revenue from non-attendance of passengers, rescheduling, ticket cancellation (R$122,513 for the three-month period ended in March 31, 2019).
| Consolidated | |||
| 03/31/2020 | % | 03/31/2019 | % |
| (Unaudited) |
|
|
|
|
|
|
|
|
Domestic | 2,652,079 | 84.3 | 2,688,589 | 83.7 |
International | 495,648 | 15.7 | 522,219 | 16.3 |
Net Revenue | 3,147,727 | 100.0 | 3,210,808 | 100.0 |
45
| Notes to the Preliminary Quarterly Information (without independent auditors’ limited review report) For the three-month period ended March 31, 2020. (In thousands of Reais - R$, except when otherwise indicated) |
30. Operating Costs, Selling and Administrative Expenses
Parent Company | Consolidated | |||
| 03/31/2020 | 03/31/2019 | 03/31/2020 | 03/31/2019 |
| (Unaudited) |
| (Unaudited) |
|
|
|
|
|
|
Cost of Services Provided | ||||
Personnel | - | - | (453,316) | (431,525) |
Fuel and lubricants | - | - | (1,001,138) | (995,186) |
Maintenance, Material and Repairs | - | - | (144,321) | (44,294) |
Passenger Costs | - | - | (176,041) | (152,145) |
Services Provided | - | - | (45,493) | (31,603) |
Landing Fees | - | - | (201,742) | (196,577) |
Depreciation and Amortization | - | - | (496,290) | (396,112) |
Recovery of depreciation costs (c) | - | - | 25,962 | - |
Other Operating Costs | - | - | (87,531) | (54,695) |
Total Cost of Services Provided | - | - | (2,579,910) | (2,302,137) |
|
|
|
|
|
Selling Expenses |
|
| ||
Personnel | - | - | (9,429) | (9,820) |
Services Provided | - | - | (35,330) | (37,621) |
Sales and Marketing | - | - | (118,012) | (133,055) |
Other Selling Expenses | - | - | (6,186) | (5,509) |
Total Selling Expenses | - | - | (168,957) | (186,005) |
|
|
|
|
|
Administrative Expenses |
|
| ||
Salaries (a) | (1,121) | (1,052) | (132,478) | (132,473) |
Services Provided | (2,178) | (3,583) | (93,145) | (80,282) |
Depreciation and Amortization | - | - | (31,746) | (9,465) |
Administrative and Other | - | - | (70,908) | (2,238) |
Total Administrative Expenses | (4,999) | (4,635) | (328,277) | (224,458) |
|
|
|
|
|
Other Operating Income |
|
| ||
Sale-Leaseback Transactions (b) | 372,712 | 7,413 | 594,587 | 7,924 |
Other Operating Expenses | - | - | - | - |
Other Operating Income (c) | 3,596 | 10,732 | 360,251 | - |
Total Other Operating Income (expenses), Net | 376,308 | 18,145 | 954,838 | 7,924 |
|
|
|
|
|
Total | 371,309 | 13,510 | (2,122,306) | (2,704,676) |
(a) The Company recognizes compensation paid to members of the Audit Committee, the Board of Directors and the Fiscal Council in the “Salaries” line item.
(b) During the period ended March 31, 2020, the Company recorded a net gain of R$594,587 related to the sale-leaseback transaction of 11 aircraft (In the period ended March 31, 2019, the Company recorded a net gain of R$7,924 arising from sale-leaseback operations of 1 aircraft traded in the period).
(c) See note 1.3, agreement Boeing.
46
| Notes to the Preliminary Quarterly Information (without independent auditors’ limited review report) For the three-month period ended March 31, 2020. (In thousands of Reais - R$, except when otherwise indicated) |
31. Financial Income
| Parent Company | Consolidated | ||
| 03/31/2020 | 03/31/2019 | 03/31/2020 | 03/31/2019 |
| (Unaudited) |
| (Unaudited) |
|
|
|
|
|
|
Financial Income |
|
|
|
|
Gain on Derivatives | - | 49,381 | - | 51,453 |
Gains from Financial Investments | 5,226 | 2,484 | 119,479 | 30,242 |
Inflation Indexation | 316 | 374 | 4,651 | 24,636 |
(-) Taxes on Financial Income (a) | (539) | (953) | (13,112) | (7,976) |
Unrealized Gains - Conversion Right – ESN (b) | 575,357 | - | 575,357 | - |
Interest Income | 32,727 | 22,694 | - | - |
Other | 3,829 | 157 | 11,871 | 4,085 |
Total Financial Income | 616,916 | 74,137 | 698,246 | 102,440 |
|
|
|
|
|
Financial Expenses |
|
|
|
|
Loss with Derivatives | - | (19,288) | (354,528) | (30,327) |
Derivative Losses - Capped Call (b) | (148,500) | - | (148,500) | - |
Unrealized Loss - Conversion Right | (131,033) | (93,691) | (206,556) | (176,429) |
Bank Charges and Expenses | (45,386) | (3,829) | (51,285) | (12,318) |
Exchange Offer Costs | - | - |
| - |
Losses from Financial Investments | - | - | (57,248) | (9,689) |
Interest on Leases | - | - | (138,389) | (119,653) |
Other | (9,340) | (29,360) | (41,950) | (39,787) |
Total Financial Expenses | (334,259) | (146,168) | (998,456) | (388,203) |
|
|
|
|
|
Foreign Exchange Rate Change, Net | (721,263) | (15,029) | (2,943,404) | (115,332) |
|
|
|
|
|
Total | (438,606) | (87,060) | (3,243,614) | (401,095) |
(a) Relates to taxes on financial income (PIS and COFINS), according to Decree 8426 of April 1, 2015.
(b) See note 34.2.
47
| Notes to the Preliminary Quarterly Information (without independent auditors’ limited review report) For the three-month period ended March 31, 2020. (In thousands of Reais - R$, except when otherwise indicated) |
32. Segments
The information below presents the summarized financial position of the reportable operating segments as of March 31, 2020 and December 31, 2019:
32.1.Assets and Liabilities of the Operating Segments
| 03/31/2020 | ||||
| Flight Transportation | Smiles Loyalty Program | Combined Information | Eliminations | Total Consolidated |
| (Unaudited) | ||||
|
|
|
|
|
|
Assets |
|
|
|
|
|
Current | 3,252,226 | 2,485,012 | 5,737,238 | (865,626) | 4,871,612 |
Noncurrent | 11,324,405 | 550,423 | 11,874,828 | (1,121,613) | 10,753,215 |
Total Assets | 14,576,631 | 3,035,435 | 17,612,066 | (1,987,239) | 15,624,827 |
|
|
|
|
|
|
Liabilities |
|
|
|
|
|
Current | 11,459,188 | 1,359,004 | 12,818,192 | (683,752) | 12,134,440 |
Noncurrent | 14,154,744 | 414,457 | 14,569,201 | (639,369) | 13,929,832 |
Total Equity (Deficit) | (11,037,301) | 1,261,974 | (9,775,327) | (664,118) | (10,439,445) |
Total Liabilities and Equity (Deficit) | 14,576,631 | 3,035,435 | 17,612,066 | (1,987,239) | 15,624,827 |
| 12/31/2019 | ||||
| Flight Transportation | Smiles Loyalty Program | Combined Information | Eliminations | Total Consolidated |
Assets |
|
|
|
|
|
Current | 3,243,363 | 2,763,448 | 6,006,811 | (1,079,434) | 4,927,377 |
Noncurrent | 10,888,299 | 121,135 | 11,009,434 | (638,365) | 10,371,069 |
Total Assets | 14,131,662 | 2,884,583 | 17,016,245 | (1,717,799) | 15,298,446 |
|
|
|
|
|
|
Liabilities |
|
|
|
|
|
Current | 9,941,112 | 1,321,534 | 11,262,646 | (900,046) | 10,362,600 |
Noncurrent | 11,867,062 | 357,714 | 12,224,776 | (183,513) | 12,041,263 |
Total Equity (Deficit) | (7,676,512) | 1,205,335 | (6,471,177) | (634,240) | (7,105,417) |
Total Liabilities and Equity (Deficit) | 14,131,662 | 2,884,583 | 17,016,245 | (1,717,799) | 15,298,446 |
48
| Notes to the Preliminary Quarterly Information (without independent auditors’ limited review report) For the three-month period ended March 31, 2020. (In thousands of Reais - R$, except when otherwise indicated) |
32.2.Results of the operating segments
| 03/31/2020 | ||||
| Flight Transportation | Smiles Loyalty Program | Combined Information | Eliminations | Total Consolidated |
| (Unaudited) | ||||
|
|
|
|
|
|
Net Revenue |
|
|
|
|
|
Passenger | 2,877,677 | - | 2,877,677 | 63,656 | 2,941,333 |
Cargo and Other | 118,385 | - | 118,385 | (21.878) | 206,394 |
Mileage Revenue | - | 171,331 | 171,331 | (61,444) | - |
Total net revenue (a) | 2,996,062 | 171,331 | 3,167,393 | (19,666) | 3,147,727 |
|
|
|
|
|
|
Cost of Services Provided (b) | (2,585,498) | (24,002) | (2,609,500) | 29,590 | (2,579,910) |
Gross Profit | 410,564 | 147,329 | 557,893 | 9,924 | 567,817 |
|
|
|
|
|
|
Operating Income (Expenses) |
|
|
|
|
|
Selling Expenses | (135,699) | (33,258) | (168,957) | - | (168,957) |
Administrative Expenses (c) | (300,669) | (39,053) | (339,722) | 11,445 | (328,277) |
Other Operating Income, Net | 951,342 | 3,496 | 954,838 | - | 954,838 |
Total Operating Expenses | 514,974 | (68,815) | 446,159 | 11,445 | 457,604 |
|
|
|
|
|
|
Equity Results | 43,737 | - | 43,737 | (43,737) | - |
|
|
|
|
|
|
Operating Result Before Net Financial Result and Income Taxes | 969,275 | 78,514 | 1,047,789 | (22,368) | 1,025,421 |
|
|
|
|
|
|
Financial Income (Expenses) |
|
|
|
|
|
Financial Income | 689,137 | 22,591 | 711,728 | (13,482) | 698,246 |
Financial Expenses | (1,004,086) | (9,852) | (1,013,938) | 15,482 | (998,456) |
Financial Revenues (Expenses), Net | (314,949) | 12,739 | (302,210) | 2,000 | (300,210) |
|
|
|
|
|
|
Income Before the Exchange Rate Change, Net | 654,326 | 91,252 | 745,579 | (20,368) | 725,211 |
|
|
|
|
|
|
Foreign Exchange Rate Change, Net | (2,938,694) | (2,772) | (2,941,466) | (1,938) | (2,943,404) |
|
|
|
|
|
|
Income (Loss) Before Income Taxes | (2,284,368) | 88,481 | (2,195,887) | (22,306) | (2,218,193) |
|
|
|
|
|
|
Income and Social Contribution Taxes | (3,901) | (32,229) | (36,130) | (7,286) | (43,416) |
Net Income (Loss) for the Period | (2,288,269) | 56,252 | (2,232,017) | (29,592) | (2,261,609) |
|
|
|
|
|
|
Net Income Attributable to Equity Holders of the Parent Company | (2,288,269) | 29,592 | (2,258,677) | (29,592) | (2,288,269) |
Participation of Non-Controlling Interests | - | 26,660 | 26,660 | - | 26,660 |
49
| Notes to the Preliminary Quarterly Information (without independent auditors’ limited review report) For the three-month period ended March 31, 2020. (In thousands of Reais - R$, except when otherwise indicated) |
| 03/31/2019 | ||||
| Flight Transportation | Smiles Loyalty Program | Combined Information | Eliminations | Total Consolidated |
Net Revenue |
|
|
|
|
|
Passenger | 2,909,297 | - | 2,909,297 | 124,256 | 3,033,553 |
Cargo and Other | 99,272 | - | 99,272 | (3,150) | 96,122 |
Mileage Revenue | - | 240,567 | 240,567 | (159,434) | 81,133 |
Total net revenue (a) | 3,008,569 | 240,567 | 3,249,136 | (38.328) | 3,210,808 |
|
|
|
|
|
|
|
|
|
|
|
|
Cost of Services Provided | (2,291,567) | (17,224) | (2,308,791) | 6,654 | (2,302,137) |
Gross Profit | 717,002 | 223,343 | 940,345 | (31,674) | 908,671 |
|
|
|
|
|
|
Operating Income (Expenses) |
|
|
|
|
|
Selling Expenses | (211,004) | (28,167) | (239,171) | 53,166 | (186,005) |
Administrative Expenses (c) | (186,683) | (30,401) | (217,084) | (7,374) | (224,458) |
Other Operating Income (expenses), Net | 7,924 | 914 | 8,838 | (914) | 7,924 |
Total Operating Expenses | (389,763) | (57,654) | (447,417) | 44,878 | (402,539) |
|
|
|
|
|
|
Equity Results | 84,002 | - | 84,002 | (83,924) | 78 |
|
|
|
|
|
|
Operating Result Before Net Financial Result and Income Taxes | 411,241 | 165,689 | 576,930 | (70,720) | 506,210 |
Financial Income (Expenses) |
|
|
|
|
|
Financial Income | 89,857 | 34,908 | 124,765 | (22,325) | 102,440 |
Financial Expenses | (409,666) | (862) | (410,528) | 22,325 | (388,203) |
Financial Revenues (Expenses), Net | (319,809) | 34,046 | (285,763) | - | (285,763) |
|
|
|
|
|
|
Income Before the Exchange Rate Change, Net | 91,432 | 199,735 | 291,167 | (70,720) | 220,447 |
|
|
|
|
|
|
Foreign Exchange Rate Change, Net | (116,161) | 20 | (116,141) | 809 | (115,332) |
|
|
|
|
|
|
Income (Loss) Before Income Taxes | (24,729) | 199,755 | 175,026 | (69,911) | 105,115 |
|
|
|
|
|
|
Income and Social Contribution Taxes | (7,578) | (57,841) | (65,419) | (4,490) | (69,909) |
Net Income (Loss) for the Period | (32,307) | 141,914 | 109,607 | (74,401) | 35,206 |
|
|
|
|
|
|
Net Income Attributable to Equity Holders of the Parent Company | (32,307) | 74,401 | 42,094 | (74,401) | (32,307) |
Participation of Non-Controlling Interests | - | 67,513 | 67,513 | - | 67,513 |
(a) Eliminations are entirely related to transactions between GLA and Smiles Fidelidade.
(b) Includes depreciation and amortization charges totaling R$496,290 in the three-month period ended March 31, 2020 (R$396,112 in the three-month period ended March 31, 2019) allocated to the following segments (R$489,703 for air transportation and R$6,587 for the Smiles loyalty program (R$391,527 and R$4,585 in the three-month period ended March 31, 2019, respectively).
(c) Includes depreciation and amortization charges totaling R$31,746 in the three-month period ended March 31, 2020 (R$9,465 for the three-month period ended March 31, 2019), allocated to the following segments: R$30,578 for air transportation and R$898 for Smiles loyalty program (R$8,616 and R$849 in the three-month period ended March 31, 2019, respectively).
33. Commitments
On March 31, 2020, the Company had 95 firm commitments for aircraft acquisitions with Boeing. These aircraft acquisition commitments include estimates for contractual price increases during the construction phase. The approximate amount of firm commitments in the current quarter considers an estimate of contractual discounts, and corresponds to approximately R$26,739,541 (corresponding to US$5,143,505 on the balance sheet date) and are segregated as follows:
| 03/31/2020 |
| (Unaudited) |
2023 | 3,607,188 |
2024 onwards | 23,132,353 |
Total | 26,739,541 |
50
| Notes to the Preliminary Quarterly Information (without independent auditors’ limited review report) For the three-month period ended March 31, 2020. (In thousands of Reais - R$, except when otherwise indicated) |
34. Financial Instruments and Risk Management
Operational activities expose the Company and its subsidiaries to market risk (fuel prices, foreign currency and interest rate), credit risk and liquidity risk. These risks can be mitigated by using swaps, futures and options contracts based on oil, U.S. dollar and interest markets.
Financial instruments are managed by the Financial Policy Committee (“CPF”) in line with the Risk Management Policy approved by the Risk Policy Committee (“CPR”) and submitted to the Board of Directors. The details regarding the way the Company conducts risk management was broadly and in detail presented in the financial statements for the year ended December 31, 2019, and there have been no changes since.
51
| Notes to the Preliminary Quarterly Information (without independent auditors’ limited review report) For the three-month period ended March 31, 2020. (In thousands of Reais - R$, except when otherwise indicated) |
34.1.Accounting Classifications of Financial Instruments
The accounting classifications of the Company’s consolidated financial instruments on March 31, 2020 and December, 31 2019 are as follows:
Parent Company | Consolidated | |||||||
Measured at Fair Value through Profit or Loss | Amortized Cost (c) | Measured at Fair Value through Profit or Loss | Amortized Cost (c) | |||||
| 03/31/2020 | 12/31/2019 | 03/31/2020 | 12/31/2019 | 03/31/2020 | 12/31/2019 | 03/31/2020 | 12/31/2019 |
| (Unaudited) |
| (Unaudited) |
| (Unaudited) |
| (Unaudited) |
|
|
|
|
|
|
|
|
|
|
Assets |
| |||||||
Cash and Cash Equivalents | - | - | 438,663 | 1,016,746 | 1,591 | 5,505 | 657,436 | 1,639,920 |
Short-Term Investments | 514 | 673 | - | - | 1,133,502 | 953,762 | - | - |
Restricted Cash | 6,545 | 6,399 | - | - | 1,199,774 | 444,306 | - | - |
Derivative Assets | 14,127 | 143,969 | - | - | 14,127 | 147,469 | - | - |
Trade Receivables | - | - | - | - | - | - | 791,841 | 1,229,530 |
Securities and values receivable | - | - | 446,942 | - | - | - | 446,942 | - |
Deposits (a) | - | - | 68,097 | 51,055 | - | - | 1,550,447 | 1,126,609 |
Related Parties | - | - | 4,921,516 | 3,440,701 | - | - | - | - |
Other Assets | - | - | 66,297 | 79,587 | - | - | 176,419 | 140,006 |
|
|
|
| |||||
Liabilities |
|
|
|
| ||||
Debt (b) | 141,588 | 626,557 | 7,215,161 | 5,968,583 | 141,588 | 626,557 | 9,382,101 | 7,783,284 |
Suppliers | - | - | 16,834 | 19,116 | - | - | 1,329,022 | 1,296,417 |
Suppliers - Forfaiting | - | - | - | - | - | - | 781,600 | 554,467 |
Derivatives | - | - | - | - | 768,201 | 20,350 | - | - |
Payables to related parties | - | - | 454,889 | 163,350 | - | - | - | - |
Airport fees and charges | - | - | - | - | - | - | 779,939 | 728,339 |
Leases | - | - | - | - | - | - | 7,418,654 | 6,052,780 |
Other Liabilities | - | - | 23,393 | 23,501 | - | - | 103,256 | 164,709 |
(a) Excludes judicial deposits, as described in Note 15.
(b) The amount on March 31, 2020 and December 31, 2019, classified as measured at fair value through profit or loss, is related to the derivative contracted through Exchange Senior Notes.
(c) Items classified as amortized cost refer to credits, debt with private institutions which, in any early settlement, there are no substantial alterations in relation to the values recorded, except the amounts related to Perpetual Notes and Senior Notes, as disclosed in Note 19. The fair values approximate the book values, according to the short-term maturity period of these assets and liabilities.
52
| Notes to the Preliminary Quarterly Information (without independent auditors’ limited review report) For the three-month period ended March 31, 2020. (In thousands of Reais - R$, except when otherwise indicated) |
During the year quarter ended March 31, 2020, there was no change on the classification between categories of the financial instruments.
34.2.Derivative and Non-Derivative Financial Instruments
The Company’s derivative financial instruments were recorded in the following balance sheet items:
Derivatives | Non-Derivative |
| |||||
| Fuel | Interest Rate Risk | Foreign Currency Risk | Capped Call | ESN (**) | Revenue Hedge | Total |
Fair Value Variations: | |||||||
Derivative Rights (Obligations) on December 31, 2019 | (20,350) | - | 3,500 | 143,969 | (626,557) | - | (499,438) |
Gains (losses) Recognized in Profit or Loss | - | - | 18,300 | (148,500) | 575,357 | - | 445,157 |
Gains (losses) recognized as exchange variation | - | - | - | 18,658 | (90,388) | - | (71,730) |
Gains (losses) recognized in other comprehensive income (loss) | (880,412) | - | - | - | - | - | (880,412) |
Settlements (Payments Received) During the Period | 132,561 | - | (21,800) | - | - | - | 110,761 |
Derivative Assets (Liabilities) at March 31, 2020 (Unaudited) | (768,201) | - | - | 14,127 | (141,588) | - | (895,662) |
Changes in Other Comprehensive Income (Loss) |
|
|
|
|
|
|
|
Balances on December 31, 2019 | (53,242) | (311,365) | - |
|
| (165,436) | (530,043) |
Amounts transferred from income statement | (880,412) | - | - |
|
| - | (880,412) |
Adjustments of Hedge Accounting of Revenue | - | - | - |
|
| (931,086) | (931,086) |
Reversal to Profit or Loss | 109,145 | 2,108 | - | - | - | 40,685 | 151,938 |
Derecognition of hedge | 291,925 | - | - |
|
| 290,346 | 582,271 |
Balances at March 31, 2020 (Unaudited) | (532,584) | (309,257) | - |
|
| (765,491) | (1,607,332) |
|
|
|
|
|
|
| |
Effect on Profit or Loss | (401,070) | (2,108) | 18,300 | (129,842) | 484,969 | 600,055 | 570,304 |
Classification of Effects on Income |
| Classification | 03/31/2020 |
|
|
| (Unaudited) |
Revenue hedge |
| Net revenue | (16,086) |
Revenue hedge |
| Financial expense | 616,141 |
Fuel |
| Costs | (28,902) |
Fuel |
| Financial expense | (372,168) |
Lease |
| Financial expense | (2,108) |
Unrealized Losses with Conversion Right – ESN |
| Financial expense | 575,357 |
Unrealized Losses with Conversion Right – ESN |
| Exchange variation | (90,388) |
Derivative Losses - Capped Call |
| Financial expense | (148,500) |
Derivative Losses - Capped Call |
| Exchange variation | 18,658 |
Foreign Exchange Rate Change, Net |
| Exchange variation | 18,300 |
Total assets |
|
| 570,304 |
The Company may adopt hedge accounting for derivatives contracted to hedge the cash flow and that qualify for this classification as per CPC 48 - “Financial Instruments” (IFRS 9). On March 31, 2020, the Company adopts as a cash flow hedge to protect the interest rates (predominantly Libor), and to protect the aviation fuel and future income in US dollar.
As disclosed in Note 1.1, because of the reduction in operations due to the adoption of the essential network, the Company discontinued the hedge relations of operations designated as cash flow hedges, as a previously estimated drop in fuel consumption is expected. Accordingly, we transferred the amount of R$291,925 from the “equity appraisal adjustment” group in equity to “financial losses” as “derivative losses”.
53
| Notes to the Preliminary Quarterly Information (without independent auditors’ limited review report) For the three-month period ended March 31, 2020. (In thousands of Reais - R$, except when otherwise indicated) |
Additionally, because of the temporary interruption of all international flights, the Company also discontinued the hedge relations of hedge accounting operations used to protect future revenues in foreign currency (hedged object), using leasing contracts as hedge instruments. That said, we transferred from the “equity valuation adjustment” group in shareholders’ equity to the financial result as “exchange variation expenses” the amount corresponding to R$290,346.
34.3.Market Risks
34.3.1.Fuel
The price of aircraft fuel varies depending on the volatility of the price of crude oil and its derivatives. To mitigate losses linked to variations in the fuel market, on March 31, 2020, the Company had call options and Collar, Brent and WTI derivatives. During the three-month period ended March 31, 2020, the Company recognized total losses in the income statement in the total amount of R$401,071 related to fuel derivatives (as at March 31, 2019, the Company recognized total losses in the statement of income) result in the total amount of R$18,190).
34.3.2.Interest Rate
The Company is exposed to future leasing operations, whose installments to be paid are exposed to the variation of the Libor rate until the receipt of the aircraft. To mitigate such risks, the Company may use derivative financial instruments of the Libor interest rate swap type. During the three-month period ended March 31, 2020, the Company recognized a total loss from interest hedge transactions in the amount of R$2,108 (loss of R$4,851 in the three-month period ended March 31, 2019).
34.3.3.Foreign Currency Risk
The foreign exchange risk arises from the possibility of unfavorable exchange rate variations to which the Company’s liabilities or cash flow are exposed. During the three-month period ended March 31, 2020, the Company recognized a total gain from foreign exchange hedge operations in the amount of R$18,300 (as of March 31, 2019 the gain recognized in the result was R$1,978).
54
| Notes to the Preliminary Quarterly Information (without independent auditors’ limited review report) For the three-month period ended March 31, 2020. (In thousands of Reais - R$, except when otherwise indicated) |
The Company’s foreign currency exposure is summarized below:
| Parent Company | Consolidated | ||
| 03/31/2020 | 12/31/2019 | 03/31/2020 | 12/31/2019 |
| (Unaudited) |
| (Unaudited) |
|
|
|
|
|
|
Assets |
|
|
|
|
Cash, Equivalents, Short-Term Investments and Restricted Cash | 438,049 | 647,671 | 1,327,049 | 1,035,802 |
Trade Receivables | - | - | 210,828 | 202,363 |
Securities receivable | 446,942 | - | 446,942 | - |
Recoverable Taxes | - | - | 10,451 | 5,312 |
Deposits | 65,850 | 51,056 | 1,550,447 | 1,126,609 |
Derivative Assets | 14,127 | 143,969 | 14,127 | 147,469 |
Total Assets | 964,968 | 842,696 | 3,559,844 | 2,517,555 |
|
|
|
|
|
Liabilities |
|
|
|
|
Short and Long-Term Debt | (7,356,748) | (6,595,140) | (8,943,116) | (7,831,116) |
Suppliers | (4,551) | (3,164) | (550,313) | (462,636) |
Derivatives | - | - | (768,201) | (20,350) |
Operating Leases | - | - | (7,374,984) | (6,007,973) |
Total Liabilities | (7,361,299) | (6,598,304) | (17,636,614) | (14,322,075) |
|
|
|
|
|
Exchange Exposure | (6,396,331) | (5,755,335) | (14,076,769) | (11,804,517) |
|
|
|
|
|
Commitments Not Recorded in the Statements of Financial Position |
|
|
|
|
Future Commitments Resulting from Firm Aircraft Orders | (26,739,541) | (65,779,883) | (26,739,541) | (65,779,883) |
Total | (26,739,541) | (65,779,883) | (26,739,541) | (65,779,883) |
|
|
|
|
|
Total Foreign Currency Exposure - R$ | (33,135,872) | (71,535,491) | (40,816,310) | (77,584,400) |
Total Foreign Currency Exposure - US$ | (6,373,877) | (17,747,659) | (7,851,253) | (19,248,369) |
Exchange Rate (R$/US$) | 5.1987 | 4.0307 | 5.1987 | 4.0307 |
The Company is mainly exposed to the variation of the U.S. dollar.
34.3.4.Capped Call
The Company, through Gol Equity Finance, in the context of the pricing of the ESN issued on March 26, April 17, and July 17, 2019, contracted private derivative operations (“capped call”) with part of the Note subscribers with the purpose of minimizing the potential dilution of the Company’s preferred shares and ADSs.
The Company recognized a total expense with capped call operations in the amount of R$129,842, comprising R$148,500 of changes in fair value, net of R$18,658 of exchange rate variation, for the three-month period ended March 31, 2020 (R$19,288 as of March 31, 2019).
34.4.Credit Risk
The credit risk is inherent in the Company’s operating and financing activities, mainly represented by cash and cash equivalents, short-term investments and trade receivables.Financial assets classified as cash, cash equivalents, and short-term investments are deposited with counterparties rated investment grade or higher by S&P or Moody’s (between AAA and AA-), pursuant to risk management policies.
55
| Notes to the Preliminary Quarterly Information (without independent auditors’ limited review report) For the three-month period ended March 31, 2020. (In thousands of Reais - R$, except when otherwise indicated) |
Credit limits are set for all customers based on internal credit rating criteria and carrying amounts represent the maximum credit risk exposure. Customer creditworthiness is assessed based on an internal system of extensive credit rating. Outstanding trade receivables are frequently monitored by the Company.
Derivative financial instruments are contracted in the over-the-counter market (OTC) with counterparties rated investment grade or higher, or in a commodities and futures exchange (B3 or NYMEX), thus substantially mitigating credit risk. The Company’s obligation is to evaluate counterparty risk involved in financial instruments and periodically diversify its exposure.
34.5.Liquidity Risk
The maturity schedules of the Company’s consolidated financial liabilities on March 31, 2020, and December 31, 2019 are as follows:
| Parent Company | ||||
| Less than 6 months | 6 to 12 months | 1 to 5 years | More than 5 Years | Total |
| (Unaudited) | ||||
|
|
|
|
|
|
Short and Long-Term Debt | 228,440 | 1,750,500 | 7,265,186 | 2,367,863 | 11,611,989 |
Suppliers | 16,834 | - | - | - | 16,834 |
At March 31, 2020 | 245,274 | 1,750,500 | 7,265,186 | 2,367,863 | 11,628,823 |
Short and Long-Term Debt | 200,598 | 1,413,645 | 6,587,415 | 1,923,019 | 10,124,677 |
Suppliers | 19,116 | - | - | - | 19,116 |
At December 31, 2019 | 219,714 | 1,413,645 | 6,587,415 | 1,923,019 | 10,143,793 |
Consolidated | |||||
| Less than 6 months | 6 to 12 months | 1 to 5 years | More than 5 years | Total |
| (Unaudited) | ||||
|
|
|
|
|
|
Short and Long-Term Debt | 636,898 | 2,089,696 | 7,956,408 | 2,465,682 | 13,148,684 |
Leases | 1,034,991 | 746,441 | 4,067,733 | 1,569,489 | 7,418,654 |
Suppliers | 1,272,819 | - | 56,203 | - | 1,328,603 |
Suppliers - Forfaiting | 781,600 | - | - | - | 782,019 |
Derivatives | 702,604 | - | 65,597 | - | 768,201 |
At March 31, 2020 | 4,428,912 | 2,836,137 | 12,145,941 | 4,035,171 | 23,446,161 |
Short and Long-Term Debt | 1,112,414 | 1,724,940 | 7,519,263 | 1,890,448 | 12,247,065 |
Leases | 1,257,430 | 1,018,266 | 5,862,268 | 967,404 | 9,105,368 |
Suppliers | 1,286,264 | - | 10,142 | - | 1,296,406 |
Suppliers - Forfaiting | 554,467 | - | - | - | 554,467 |
Derivatives | 9,080 | - | 11,270 | - | 20,350 |
At December 31, 2019 | 4,219,655 | 2,743,206 | 13,402,943 | 2,857,852 | 23,223,656 |
56
| Notes to the Preliminary Quarterly Information (without independent auditors’ limited review report) For the three-month period ended March 31, 2020. (In thousands of Reais - R$, except when otherwise indicated) |
34.6.Sensitivity Analysis of Financial Instruments
34.6.1.Foreign Currency Risk
On March 31, 2020, the Company adopted an exchange rate change of R$5.1987/US$1.00, corresponding to the month’s closing rate disclosed by the Central Bank of Brazil as a probable scenario. The table below shows the sensitivity analysis and the effect on profit or loss of exchange rate fluctuations in the exposure on March 31, 2020:
|
| Parent Company | Consolidated |
Exchange Rate | Effect on Profit or Loss | Effect on Profit or Loss | |
Net Liabilities Exposed to the Risk of Appreciation of the U.S. Dollar | 5.1987 | 6,396,331 | 14,076,769 |
| (Unaudited) | ||
|
|
|
|
Dollar Depreciation (-50%) | 2.5994 | 3,198,166 | 7,038,385 |
Dollar Depreciation (-25%) | 3.8990 | 1,599,083 | 3,519,192 |
Dollar Appreciation (+25%) | 6.4984 | (1,599,083) | (3,519,192) |
Dollar Appreciation (+50%) | 7.7981 | (3,198,166) | (7,038,385) |
34.6.2.Fuel Risk
On March 31, 2020, the Company, through its subsidiary GLA, has oil derivative contracts for protection equivalent to 71% of 12-month consumption, protection equivalent to 61% of 24-month consumption. The probable scenarios used by the Company are the market curves at the close of March 31, 2020, for derivatives that hedge the fuel price risk. The table below shows the sensitivity analysis in U.S. dollars of the fluctuations in jet fuel barrel prices:
|
| |
| Fuel | |
US$/bbl (WTI) | R$ (000) | |
Price barrel | 22.44 |
|
| (Unaudited) | |
|
|
|
Decline in Prices/Barrel (-50%) | 18.00 | (1,644,663) |
Decline in Prices/Barrel (-25%) | 26.99 | (1,225,805) |
Increase in Prices/Barrel (+25%) | 44.99 | (237,030) |
Increase in Prices/Barrel (+50%) | 53.99 | 394,231 |
34.6.3.Interest Rate Risk
On March 31, 2020, the Company holds financial investments and financial liabilities indexed to several rates and positions in Libor derivatives. In its sensitivity analysis of non- derivative financial instruments, it was considered the impacts on the yearly interest of the exposed values on March 31, 2020 (see Note 19) that were exposed to fluctuations in interest rates, as the scenarios below show. The amounts show the impacts on profit or loss according to the scenarios presented below:
57
| Notes to the Preliminary Quarterly Information (without independent auditors’ limited review report) For the three-month period ended March 31, 2020. (In thousands of Reais - R$, except when otherwise indicated) |
Short-term Investments Net of Financial Debt (a) | ||
Risk | Increase in the CDI Rate | Increase in the CDI Rate |
| (Unaudited) | |
|
|
|
Reference Rates | 3.65% | 1.45% |
Exposure Amount (Probable Scenario) (b) | 941.592 | (1.564.663) |
Remote Favorable Scenario (-50%) | (926,137) | 1,541,968 |
Possible Favorable Scenario (-25%) | 7,727 | (11,348) |
Possible Adverse Scenario (+25%) | 3,864 | (5,674) |
Remote Adverse Scenario (+50%) | (3,864) | 5,674 |
(a) Total invested and raised in the financial market at the CDI rate and Libor interest rate.
(b) Book balances recorded as of March 31, 2020.
Measurement of the Fair Value of Financial Instruments
To meet the disclosure requirements of financial instruments measured at fair value, the Company and its subsidiaries must group these instruments at levels 1 to 3 based on the observable degree of fair value:
· Level 1: Fair value measurements are obtained from quoted (unadjusted) prices in identical active or passive markets;
· Level 2: Fair value measurements are obtained from other variables other than the quoted prices included within Level 1, which are observable for the asset or liability, either directly (that is, as prices) or indirectly (that is, derived from prices); and
· Level 3: Fair value measurements are obtained from valuation techniques that include variables for the asset or liability but are not based on observable market data (unobservable data).
The following table shows a summary of the financial instruments measured at the fair value of the Company and its subsidiaries, including their related classifications of the valuation method, on March 31, 2020 and December 31, 2019:
| Parent Company | ||||
| 03/31/2020 | 12/31/2019 | |||
Fair Value Level | Book Value | Fair Value | Book Value | Fair Value | |
| (Unaudited) | ||||
|
|
|
|
|
|
Short-Term Investments | Level 1 | 514 | 514 | 673 | 673 |
Restricted Cash | Level 2 | 6,545 | 6,545 | 6,399 | 6,399 |
Rights with derivative transactions | Level 2 | 14,127 | 14,127 | 143,969 | 143,969 |
Derivative Assets | Level 2 | (141,587) | (141,587) | (626,557) | (626,557) |
| Consolidated | ||||
| 03/31/2020 | 12/31/2019 | |||
Fair Value Level | Book Value | Fair Value | Book Value | Fair Value | |
| (Unaudited) | ||||
|
|
|
|
|
|
Cash and Cash Equivalents | Level 1 | 1,591 | 1,591 | 5,505 | 5,505 |
Short-Term Investments | Level 1 | 1,133,502 | 1,133,502 | 953,762 | 953,762 |
Restricted Cash | Level 2 | 1,199,774 | 1,199,774 | 444,306 | 444,306 |
Derivative Assets | Level 2 | 14,127 | 14,127 | 147,469 | 147,469 |
Fair Value Adjustment of Derivatives | Level 2 | (141,587) | (141,587) | (626,557) | (626,557) |
Derivatives Liabilities | Level 2 | (768,201) | (768,201) | (20,350) | (20,350) |
58
| Notes to the Preliminary Quarterly Information (without independent auditors’ limited review report) For the three-month period ended March 31, 2020. (In thousands of Reais - R$, except when otherwise indicated) |
34.7. Capital Management
The Company seeks capital alternatives with the purpose to meet its operational needs, with the goal to achieve a capital structure the considers the due parameters for financial costs and the maturity terms of funding and its guarantees. The Company monitors its financial leverage degree, which corresponds to the net debt, including short- and long-term. The table below shows the financial leverage:
| Consolidated | |
| 03/31/2020 | 12/31/2019 |
| (Unaudited) |
|
|
|
|
Total Loans and Financing | (9,523,689) | (8,409,841) |
Total Leases to Pay | (7,418,654) | (6,052,780) |
(-) Cash and Cash Equivalents | 739,386 | 1,645,425 |
(-) Financial Investments | 1,053,143 | 953,762 |
Net Debt | (15,149,814) | (11,863,434) |
35. Non-cash Transactions
| Parent Company | |
| 03/31/2020 | 03/31/2019 |
| (Unaudited) |
|
|
|
|
Initial Adoption - IFRS 16 (Investments / Accumulated Losses) | - | 2,436,334 |
Share-Based Compensation (Investments / Share-Based Compensation) | (5,475) | - |
Unrealized Results from Derivatives (Investments / Equity Valuation Adjustment) | 1,077,289 | - |
Actuarial Losses from Post-Employment Benefits | - | 46,496 |
Interest on Shareholders’ Equity to be Distributed, Net of Taxes (Investments/ISE) | - | 8,338 |
Dividends (Investments / Dividends) | - | 228,359 |
Boeing agreement - exchange rate variation (Exchange rate variation / Related parties / Receivables / Fixed assets) | 383,900 | - |
| Consolidated | |
| 03/31/2020 | 03/31/2019 |
| (Unaudited) |
|
|
|
|
Initial Adoption - IFRS 16 | - | 2,436,334 |
Actuarial Losses from Post-Employment Benefits | - | 46,496 |
Interest on Shareholders’ Equity to be Distributed, Net of Taxes | - | (7,512) |
Dividends | - | 238,359 |
Write-off of Lease Agreements | (58,402) | 3,501 |
Acquisition of Property, Plant and Equipment through Financing (Fixed Assets / Loans and Financing) | 25,794 | 114,623 |
Guarantee Deposits (Deposits / Leases Payable) | - | (476) |
Maintenance Reserve (Deposits / Leases Payable) | - | (1,692) |
Right to Use Flight Equipment (Fixed Assets / Leases Payable) | 45,653 | - |
Provision for aircraft return (Fixed assets / Provisions) | (78,062) | - |
Unrealized income from derivatives (right with derivatives / equity valuation adjustment) | 880,412 | - |
Boeing Agreement - exchange rate variation (Exchange rate / Fixed assets) | 136,962 | - |
59
| Notes to the Preliminary Quarterly Information (without independent auditors’ limited review report) For the three-month period ended March 31, 2020. (In thousands of Reais - R$, except when otherwise indicated) |
36. Liabilities from Financing Activities
The movements for the three-month periods ended March 31, 2020 and 2019 of the liabilities of the Company’s financing activities are shown below:
36.1.Parent Company
03/31/2020 | |||||||
|
|
|
| Adjustment to profit |
| ||
| Opening balance | Cash flow | Payment of interest and loan costs | Exchange variations, net | Provision for lost and cost amortization | Unrealized derivatives results | Closing balance |
| (Unaudited) | ||||||
|
|
|
|
|
|
|
|
Loans and financing | 6,595,140 | (405,878) | (207,971) | 1,817,034 | 133,781 | (575,357) | 7,356,749 |
|
|
|
|
|
|
|
|
03/31/2019 | |||||||
|
|
|
| Adjustment to profit |
| ||
| Opening balance | Cash flow | Payment of interest and loan costs | Exchange variations, net | Provision for interest and cost amortization | Unrealized derivatives results | Closing balance |
Loans and financing | 4,659,102 | 1,071,625 | (145,580) | 18,562 | 86,460 | (49,381) | 5,640,788 |
|
|
|
|
|
|
|
|
60
| Notes to the Preliminary Quarterly Information (without independent auditors’ limited review report) For the three-month period ended March 31, 2020. (In thousands of Reais - R$, except when otherwise indicated) |
36.2.Consolidated
|
|
| 03/31/2020 | ||||||||
|
|
|
|
| Variations not affecting cash | Adjustment to profit |
|
| |||
| Opening Balance | Cash Flow | Payment of interest and loan costs | Obligations from derivatives transactions | Provision for property, plant and equipment | Acquisition of property, plant and equipment through financing | Exchange variations, net | Provision for interest and cost amortization | Unrealized derivatives results | Other | Closing Balance |
| (Unaudited) | ||||||||||
|
|
|
|
|
|
|
|
|
|
|
|
Loans and financing | 8,409,841 | (441,414) | (220,930) | - | - | 25,794 | 2,172,016 | 153,739 | 575,357- | - | 9,523,689 |
Leases payable | 6,052,780 | (421,714) | (4,530) | - | - | - | 1,694,437 | 141,532 | - | (43,851) | 7,418,654 |
Obligations from derivatives transactions | 20,350 | - | - | 747,851 | - | - | - | - | - | - | 768,201 |
|
|
|
|
|
| 03/31/2019 | |||||||
|
|
|
|
|
|
| Variations not affecting cash | Adjustment to profit |
|
| |||
| Opening Balance | Cash Flow | First-time adoption adjustmentCPC 06 (R2) | JSCP distributed through subsidiary Smiles | Payment of interest and loan costs | Obligations from derivatives transactions | Provision for property, plant and equipment | Acquisition of property, plant and equipment through financing | Exchange variations, net | Provision for interest and cost amortization | Unrealized derivatives results | Other | Closing Balance |
Loans and financing | 6,443,807 | 880,808 | - | - | (169,679) | - | - | 114,623 | 28,553 | 119,037 | (49,381) | - | 7,367,768 |
Leases payable | 912,145 | (354,926) | 5,370,868 | - | (5,965) | - | - | 232,513 | 40,863 | 122,778 | - | (2,168) | 6,316,108 |
Other obligations | 147,239 | (7,371) | - | 8,249 | - | - | - | - | - | - | - | (2,338) | 512 |
61
| Notes to the Preliminary Quarterly Information (without independent auditors’ limited review report) For the three-month period ended March 31, 2020. (In thousands of Reais - R$, except when otherwise indicated) |
37. Insurance Coverage
On March 31, 2020, the most relevant insurance coverage, by nature, considering the aircraft fleet in relation to the maximum reimbursable amounts indicated in U.S. dollars, together with the insurance coverage of the subsidiary Smiles, are as follows:
| In thousands of R$ | In thousands of US$ |
| (Unaudited) | |
|
|
|
GLA |
|
|
Warranty - Hull/War | 441,890 | 85,000 |
Civil Liability per Event/Aircraft (a) | 3,899,025 | 750,000 |
Inventories (local) (b) | 1,299,675 | 250,000 |
Smiles |
|
|
Rent Guarantee (Cond. Rio Negro - Alphaville) | 1,318 | - |
D&O Liability Insurance | 100,000 | - |
Fire (Property Insurance Cond. Rio Negro - Alphaville) | 12,747 | - |
(a) In accordance with the agreed amount for each aircraft up to the maximum limit indicated.
(b) Values per incident and annual aggregate.
Pursuant to Law 10.744 of October 9, 2003, the Brazilian government assumed the commitment to complement any civil-liability expenses related to third parties caused by war or terrorist events, in Brazil or abroad, which GLA may be required to pay, for amounts exceeding the limit of the insurance policies effective since September 10, 2001, limited to the amount in Brazilian Reais equivalent to US$1.0 billion.
38. Subsequent Events (Unaudited)
38.1.Impacts due to the COVID-19 Pandemic
As disclosed in note 1.1, the pandemic unleashed by COVID-19 is responsible for major disruptions in the global economic activity and has onset an unprecedented crisis.
Given this scenario, the Company adopted several measures in April, mainly to reduce fixed and variable costs, preserve the cash and strengthen the liquidity position. These measures are highly complex and have significant impacts on the Company’s business and were presented in detail in note 1.1 and its sub-items.
38.2.Change in the Maturity of the Debentures and Early Waiver Granted
On April 9, 2020, the Debenture Holders’ Meeting decided to postpone the amortization of debentures totaling R$148 million, originally scheduled to occur from March 28 to September 28, 2021. On this date, the Meeting also granted a waiver regarding the non-compliance with the financial rates and limits set for the fiscal year of 2020, which would be measured on June 30 and December 31, 2020. The current readings will remain in force as of the fiscal year of 2021
38.3.Renegotiation of Lease Agreements
In April 2020, the Company renegotiated 15 aircraft and engine lease agreements.
62
| Notes to the Preliminary Quarterly Information (without independent auditors’ limited review report) For the three-month period ended March 31, 2020. (In thousands of Reais - R$, except when otherwise indicated) |
Considering that there is no change in the total payment flow of these aircraft, sincewe have only delayed some lease installments until January / 2021, we will not have impacts recorded in the financial statements in the subsequent period, other than of interest total of R $ 644.
There was no change in the discount rates previously adopted due to renegotiations.
63
SIGNATURE
Pursuant to the requirements of the Securities Exchange Act of 1934, the registrant has duly caused this report to be signed on its behalf by the undersigned, thereunto duly authorized.
Date: May 4, 2020
GOL LINHAS AÉREAS INTELIGENTES S.A. | |
By: | /s/ Richard F. Lark, Jr. |
| Name: Richard F. Lark, Jr. Title: Investor Relations Officer |
FORWARD-LOOKING STATEMENTS
This press release may contain forward-looking statements. These statements are statements that are not historical facts, and are based on management’s current view and estimates of future economic circumstances, industry conditions, company performance and financial results. The words “anticipates,” “believes,” “estimates,” “expects,” “plans” and similar expressions, as they relate to the company, are intended to identify forward-looking statements. Statements regarding the declaration or payment of dividends, the implementation of principal operating and financing strategies and capital expenditure plans, the direction of future operations and the factors or trends affecting financial condition, liquidity or results of operations are examples of forward-looking statements. Such statements reflect the current views of management and are subject to a number of risks and uncertainties. There is no guarantee that the expected events, trends or results will actually occur. The statements are based on many assumptions and factors, including general economic and market conditions, industry conditions and operating factors. Any changes in such assumptions or factors could cause actual results to differ materially from current expectations.