SECURITIES AND EXCHANGE COMMISSION
Washington, D.C. 20549
FORM 6-K
REPORT OF FOREIGN ISSUER
PURSUANT TO RULE 13a-16 OR 15d-16 OF THE
SECURITIES EXCHANGE ACT OF 1934
For the month of October 2020
(Commission File No. 001-32221)
GOL LINHAS AÉREAS INTELIGENTES S.A.
(Exact name of registrant as specified in its charter)
GOL INTELLIGENT AIRLINES INC.
(Translation of registrant’s name into English)
Praça Comandante Linneu Gomes, Portaria 3, Prédio 24
Jd. Aeroporto
04630-000 São Paulo, São Paulo
Federative Republic of Brazil
(Address of registrant’s principal executive offices)
Indicate by check mark whether the registrant files or will file
annual reports under cover Form 20-F or Form 40-F.
Form 20-F ___X___ Form 40-F ______
Indicate by check mark whether the registrant by furnishing the
information contained in this Form is also thereby furnishing the
information to the Commission pursuant to Rule 12g3-2(b) under
the Securities Exchange Act of 1934.
Yes ______ No ___X___
Parent Company and Consolidated
Quarterly Information (ITR)
GOL Linhas Aéreas Inteligentes S.A.
September 30, 2020
with Review Report on the Quarterly Information
Gol Linhas Aéreas Inteligentes S.A.
Parent Company and Consolidated Quarterly Information (ITR)
September 30, 2020
Contents
| Comments on the Performance | 03 |
| Report of the Statutory Audit Committee | 08 |
| Statement of the Executive officers on the Parent Company and Consolidated Quarterly Information (ITR) | 09 |
| Statement of the Executive officers on the Independent Auditors’ Review Report | 10 |
| Independent Auditors’ Review Report on the Quarterly Information (ITR) | 11 |
| Balance Sheets | 12 |
| Income Statements | 14 |
| Statements of Comprehensive Income (SCI) | 16 |
| Statements of Changes in Shareholders’ Equity (SCSE) | 17 |
| Statements of Cash Flows (SCF) | 18 |
| Statements of Value Added (SVA) | 20 |
| Notes on the Parent Company and Consolidated Quarterly Information (ITR) | 21 |
Comments on Performance
The third quarter of 2020 reflects a period of strong recovery in the volume of operations, with a record number of passengers since GOL initiated its essential network in April. GOL is the only airline in Brazil that managed consistently to maintain a load factor at a level close to 80% across its network during the pandemic to date.
Added to the cost containment and cash preservation measures implemented by the Company, GOL is now in an advantageous position to capture market share as the demand for travel continues to increase. The operating environment remains challenging, but the Company is optimistic that conditions will continue to improve during the remainder of the year. We are seeing consistent growth in the search for GOL air tickets for leisure and holiday planning at the end of the year. This demand growth is specifically concentrated in the domestic market, which accounts for 100% of the Company’s network operations.
Team of Eagles: We are immensely proud to be the first and only airline in South America to announce agreements to guarantee the jobs of over 14,000 Employees, in addition to offering Voluntary Leave, Dismissal and Retirement Programs. The dedication, commitment and professionalism in this extremely challenging moment has been crucial for our success to date and it will be a great competitive differential for the recovery in 2021. Once again, we would like to thank our Employees for the demonstration of unity and proactiveness that are unique characteristics of GOL.
Customer Experience and Personal Safety: Net Promoter Score (NPS) remained stable at 38 in the quarter and is indicative of the combination of the Company’s best-in-market product and the high engagement of the Customer service team. For the third consecutive year, GOL was the most remembered brand in its category as measured in the 30th edition of “Folha Top of Mind 2020”, with 33% mentions among the more than 7,500 Brazilians interviewed. GOL’s strategy has proved to be effective as the Company increased its market share to 40% in the Brazilian domestic market, according to data from ANAC. GOL also owns a 42% share of the 3Q20 corporate passenger segment, according to data from ABRACORP.
Sales: The month of September was marked by a 43% increase in the search for airline tickets. As a result of this greater interest, the Company registered a 60% increase in ticket sales, across all of its channels, compared to August 2020. In the third quarter, consolidated gross sales reached approximately R$1.7 billion, an increase of 132% in relation to 2Q20. GOL’s daily sales in 3Q20 exceeded R$20 million, which represent 50% of pre-pandemic sales level. With additional flights during the month of September, passenger revenue increased 110% over July.
Also in September, GOL launched a new fast package delivery service, the “CHEGOL”. The service consists of express freight with priority throughout Brazil, without the need to weigh the product according to the dimensions of the freight box.
On September 15th, the Company celebrated the 14th anniversary of its Aeronautical Maintenance Center. This story started with the old Campaign Hangar, and today, thanks to the commitment to innovation and efficiency, together with the exceptional work of the Team of Eagles, this facility has become a business opportunity for GOL Aerotech.
Capacity: The Company maintains solid position in the main Brazilian commercial airports due to its irreplaceable network, with main hubs at GRU, GIG, BSB and FOR. In addition, it establishes a new hub in Salvador, through which GOL can explore new regional markets together with its strategic partners. The addition of capacity has clear profitability criteria to ensure the sustainable resumption of operations. During the quarter, the Company did not operate regular flights in the international market, however, we plan the reopening of these bases in a phased manner, according to the position of governments in relation to the reopening of borders for tourism and the demand behavior.
Our single-type fleet operating model and dominant position in the main Brazilian hubs with high density traffic allows us to quickly add routes where required by demand. We are adapting our network almost simultaneously to market variations, while maintaining our discipline to ensure equilibrium between supply and demand. We do not face the same concerns as our competitors with fleet complexity or the exposure of large aircraft exclusively destined for the international market. We have not deviated from what GOL has always focused on doing: delivering an efficient service with the best Customer experience and maintaining a resilient balance sheet to finance our operations and accelerate our profitable growth.
Operating and Financial Indicators
| Traffic Data – GOL (in Millions) | 3Q20 | 3Q19 | % Var. | 9M20 | 9M19 | % Var. |
| RPK GOL – Total | 3,164 | 11,114 | -71.5% | 13,884 | 31,056 | -55.3% |
| RPK GOL –Domestic | 3,164 | 9,595 | -67.0% | 12,594 | 26,760 | -52.9% |
| RPK GOL – International | - | 1,519 | NM | 1,290 | 4,295 | -70.0% |
| ASK GOL – Total | 3,992 | 13,406 | -70.2% | 17,444 | 37,808 | -53.9% |
| ASK GOL – Domestic | 3,992 | 11,463 | -65.2% | 15,660 | 32,230 | -51.4% |
| ASK GOL – International | - | 1,943 | NM | 1,784 | 5,578 | -68.0% |
| GOL Load Factor – Total | 79.3% | 82.9% | -3.6 p.p. | 79.6% | 82.1% | -2.5 p.p. |
| GOL Load Factor – Domestic | 79.3% | 83.7% | -4.4 p.p. | 80.4% | 83.0% | -2.6 p.p. |
| GOL Load Factor – International | - | 78.2% | NM | 72.3% | 77.0% | -4.7 p.p. |
| Operating Data | 3Q20 | 3Q19 | % Var. | 9M20 | 9M19 | % Var. |
| Revenue Passengers - Pax on Board ('000) | 2,604 | 9,803 | -73.4% | 11,577 | 26,939 | -57.0% |
| Aircraft Utilization (Block Hours/Day) | 6.7 | 12.6 | -46.8% | 9.8 | 12.4 | -21.0% |
| Departures | 19,338 | 68,579 | -71.8% | 87,440 | 191,149 | -54.3% |
| Total Seats (‘000) | 3,360 | 12,054 | -72.1% | 15,015 | 33,434 | -55.1% |
| Average Stage Length (km) | 1,172 | 1,110 | 5.6% | 1,146 | 1,123 | 2.0% |
| Fuel Consumption (mm liters) | 113 | 387 | -70.8% | 506 | 1,092 | -53.7% |
| Full-time Employees (at Period End) | 15,083 | 15,838 | -4.8% | 15,083 | 15,838 | -4.8% |
| Average Operating Fleet(6) | 63 | 115 | -45.2% | 65 | 111 | -41.4% |
| On-time Departures | 96.7% | 91.2% | 5.5 p.p. | 93.5% | 90.4% | 3.1 p.p. |
| Flight Completion | 98.1% | 98.8% | -0.7 p.p. | 97.5% | 98.5% | -1.0 p.p. |
| Passenger Complaints (per 1,000 pax) | 1.02 | 1.02 | 0.0% | 1.08 | 1.21 | -10.7% |
| Lost Baggage (per 1,000 pax) | 1.77 | 2.12 | -16.5% | 2.11 | 2.10 | 0.5% |
| Financial Data | 3Q20 | 3Q19 | % Var. | 9M20 | 9M19 | % Var. |
| Net YIELD (R$ cents) | 27.78 | 31.50 | -11.8% | 29.27 | 30.57 | -4.3% |
| Net PRASK (R$ cents) | 22.02 | 26.12 | -15.7% | 23.30 | 25.11 | -7.2% |
| Net RASK (R$ cents) | 24.42 | 27.67 | -11.7% | 25.68 | 26.61 | -3.5% |
| CASK (R$ cents)(4) | 34.12 | 22.51 | 51.6% | 24.97 | 22.17 | 12.6% |
| CASK Ex-Fuel (R$ cents)(4) | 26.19 | 14.56 | 79.9% | 16.64 | 14.14 | 17.7% |
| Adjusted CASK(6) | 21.56 | 22.51 | -4.2% | 19.53 | 22.17 | -11.9% |
| Adjusted CASK(6) Ex-Fuel (R$ cents)(4) | 15.11 | 14.56 | 3.8% | 11.98 | 14.14 | -15.3% |
| Breakeven Load Factor(4) | 110.7% | 67.4% | 43.3 p.p. | 77.4% | 68.4% | 9.0 p.p. |
| Average Exchange Rate(1) | 5.3772 | 3.9684 | 35.5% | 5.0793 | 3.8872 | 30.7% |
| End of Period Exchange Rate(1) | 5.6407 | 4.1644 | 35.5% | 5.6407 | 4.1644 | 35.5% |
| WTI (Average per Barrel. US$)(2) | 40.91 | 56.44 | -27.5% | 38.36 | 57.10 | -32.8% |
| Price per Liter Fuel (R$)(3) | 2.34 | 2.81 | -16.7% | 2.65 | 2.84 | -6.7% |
| Gulf Coast Jet Fuel (Average per Liter, US$)(2) | 0.28 | 0.51 | -45.1% | 0.28 | 0.50 | -44.0% |
(1) Source: Brazilian Central Bank; (2) Source: Bloomberg; (3) Fuel expenses excluding hedge results and PIS/COFINS credits/liters consumed; (4) Excluding non-recurring expenses and Idle expenses. (5) Average operating fleet excluding aircraft in sub-leasing and MRO. Certain calculations may not match with the financial statements due to rounding. (6) Considers only expenses related to current operating levels (3Q20).
Domestic market
GOL’s domestic demand was 3,164 million RPK, a decrease by 67.0%, while ASK supply reduced 65.2% in comparison to 3Q19, and the load factor reached 79.3% in the quarter. GOL transported 2.6 million Clients during the quarter, a decrease of 73.4% compared with the same quarter in 2019. The Company remains the leader in transporting passengers in Brazil.
International market
In 3Q20, GOL carried out non-regular charter flights for soccer teams in championships, related to our sponsorship of national teams. As most country borders were closed, the Company did not offer regular international flights.
Volume of Departures and Total Seats
The total volume of GOL’s departures was 19,338, a decrease of 71.8% over 3Q19. The total number of seats available to the market was 3.4 million in the third quarter of 2020, a decrease of 72.1% quarter-over-quarter.
PRASK, Yield and RASK
Net PRASK decreased by 15.7% in the quarter when compared to 3Q19, reaching 22.02 cents (R$), due to the decline of the levels of net passenger revenue and the ASK reduction of 70.2% in the quarter. GOL’s net RASK was 24.42 cents (R$) in 3Q20, a decrease of 11.7% over 3Q19. Net yield decreased 11.8% over 3Q19, reaching 27.78 cents (R$).
Fleet
At the end of 3Q20, GOL's total fleet was 129 Boeing 737 aircraft, comprised of 122 NGs and seven (7) MAXs (non-operational). At the end of 3Q19, GOL's total fleet was 125 aircraft, of which seven (7) were MAXs (non-operational). The average age of the Company's fleet was 10.8 years at the end of 3Q20.
GOL does not operate widebody aircraft, and has no aircraft financed via the capital markets, EETCs or finance leases. Its operating fleet is 100% composed of narrowbody aircraft financed via operating leases.
| Total Fleet at the End of Period | 3Q20 | 3Q19 | Var. | 2Q20 | Var. |
| B737s | 129 | 125 | +4 | 130 | -1 |
| B737-7 NG | 22 | 24 | -2 | 23 | -1 |
| B737-8 NG | 100 | 94 | +6 | 100 | 0 |
| B737-8 MAX | 7 | 7 | 0 | 7 | 0 |
As of September 30, 2020, GOL had 95 firm orders for the acquisition of Boeing 737 MAX aircraft, of which 73 were orders for 737 MAX-8 and 22 orders were for 737 MAX-10. The Company’s fleet plan is for a reduction of 4 operating aircraft through 2020, with the flexibility to return even more aircraft if necessary.
| Fleet Plan | 2020E | 2021E | 2022E | >2023E | Total |
| Operating Fleet at the End of the Year | 126 | 122 | |||
| Aircraft Commitments (R$ MM) | - | - | - | 25,091.1 | 25,091.1 |
At the end of 3Q20, the Company concluded renegotiations of part of its aircraft and operating engine leasing contracts with no purchase option, which resulted in contractual modifications related to term extensions and new monthly amounts compared to the original terms of the contracts. Leasing remeasurement took into account the new payment flows, the discount rate and the exchange rate on the date of the contractual changes. The calculated effects were recorded as a reduction in the lease liability in the amount of R$180 million, with a corresponding reduction in fixed assets of R$171 million and a gain of R$9 million in the operating result.
Glossary of industry terms
| · | AIRCRAFT LEASING: an agreement through which a company (the lessor), acquires a resource chosen by its client (the lessee) for subsequent rental to the latter for a determined period. |
| · | AIRCRAFT UTILIZATION: the average number of hours operated per day by the aircraft. |
| · | AVAILABLE SEAT KILOMETERS (ASK): the aircraft seating capacity multiplied by the number of kilometers flown. |
| · | AVAILABLE FREIGHT TONNE KILOMETER (AFTK): cargo capacity in tonnes multiplied by number of kilometers flown. |
| · | AVERAGE STAGE LENGTH: the average number of kilometers flown per flight. |
| · | EXCHANGEABLE SENIOR NOTES (ESN): convertible securities. |
| · | BLOCK HOURS: the time an aircraft is in flight plus taxiing time. |
| · | BREAKEVEN LOAD FACTOR: the passenger load factor that will result in passenger revenues being equal to operating expenses. |
| · | BRENT: oil produced in the North Sea, traded on the London Stock Exchange and used as a reference in the European and Asian derivatives markets. |
| · | CHARTER: a flight operated by an airline outside its normal or regular operations. |
| · | FREIGHT LOAD FACTOR (FLF): percentage of cargo capacity that is actually utilized (calculated dividing FTK by AFTK) |
| · | FREIGHT TONNE KILOMETERS (FTK): weight of revenue cargo in tonnes multiplied by number of kilometers flown by such tonnes. |
| · | LESSOR: the party renting a property or other asset to another party, the lessee. |
| · | LOAD FACTOR: the percentage of aircraft seating capacity that is actually utilized (calculated by dividing RPK by ASK). |
| · | LONG-HAUL FLIGHTS: long-distance flights (in GOL's case, flights of more than four hours' duration). |
| · | OPERATING COST PER AVAILABLE SEAT KILOMETER (CASK): operating expenses divided by the total number of available seat kilometers. |
| · | OPERATING COST PER AVAILABLE SEAT KILOMETER EX-FUEL (CASK EX-FUEL): operating cost divided by the total number of available seat kilometers excluding fuel expenses. |
| · | OPERATING REVENUE PER AVAILABLE SEAT KILOMETER (RASK): total operating revenue divided by the total number of available seat kilometers. |
| · | PASSENGER REVENUE PER AVAILABLE SEAT KILOMETER (PRASK): total passenger revenue divided by the total number of available seat kilometers. |
| · | PDP: credit for advance payments for aircraft purchases financing. |
| · | REVENUE PASSENGERS: the total number of passengers on board who have paid more than 25% of the full flight fare. |
| · | REVENUE PASSENGER KILOMETERS (RPK): the sum of the products of the number of paying passengers on a given flight and the length of the flight. |
| · | SALE-LEASEBACK: a financial transaction whereby a resource is sold and then leased back, enabling use of the resource without owning it. |
| · | SLOT: the right of an aircraft to take off or land at a given airport for a determined period of time. |
| · | SUB-LEASE: an arrangement whereby a lessor in a rent agreement leases the item rented to a fourth party. |
| · | TOTAL CASH: the sum of cash, financial investments and short and long-term restricted cash. |
| · | WTI BARREL: West Texas Intermediate - the West Texas region, where US oil exploration is concentrated. Serves as a reference for the US petroleum byproduct markets. |
| · | YIELD PER PASSENGER KILOMETER: the average value paid by a passenger to fly one kilometer. |
About GOL Linhas Aéreas Inteligentes S.A.
GOL serves more than 36 million passengers annually. With Brazil's largest network, GOL offers customers more than 750 daily flights to over 100 destinations in Brazil and in South America, the Caribbean and the United States. GOLLOG’s cargo transportation and logistics business serves more than 3,400 Brazilian municipalities and more than 200 international destinations in 95 countries. SMILES allows over 16 million registered clients to accumulate miles and redeem tickets to more than 700 destinations worldwide on the GOL partner network. Headquartered in São Paulo, GOL has a team of approximately 15,000 highly skilled aviation professionals and operates a fleet of 129 Boeing 737 aircraft, delivering Brazil's top on-time performance and an industry leading 19-year safety record. GOL has invested billions of Reais in facilities, products and services and technology to enhance the customer experience in the air and on the ground. GOL's shares are traded on the NYSE (GOL) and the B3 (GOLL4). For further information, visit www.voegol.com.br/ir.
Disclaimer
This release contains forward-looking statements relating to the prospects of the business, estimates for operating and financial results and growth prospects of GOL. These forward-looking statements, which are subject to change without prior notice, reflect mere estimates and projections and are based exclusively on the expectations of GOL’s management at the time the forward-looking statements are made. Further, these forward-looking statements depend substantially on external factors, many of which are highly uncertain, including (i) macroeconomic developments in Brazil and volatility in exchange rates, interest rates and other economic indicators, (ii) developments relating to the spread of COVID-19, such as the duration and extent of quarantine measures and travel restrictions and the impact on overall demand for air travel, (iii) the competitive environment in the Brazilian airline market and government measures that may affect it, (iv) fuel price volatility and (v) the risks disclosed in GOL’s filings with the U.S. Securities and Exchange Commission.
Non-GAAP Measures
To be consistent with industry practice, GOL discloses so-called non-GAAP financial measures, which are not recognized under IFRS or U.S. GAAP, including “net debt,” “total liquidity” and “EBITDA.” GOL’s management believes that disclosure of non-GAAP measures provides useful information to investors, financial analysts and the public in their review of its operating performance and their comparison of its operating performance to the operating performance of other companies in the same industry and other industries. However, these non-GAAP measures do not have standardized meanings and may not be directly comparable to similarly-titled measures adopted by other companies. Potential investors should not rely on information not recognized under IFRS as a substitute for the IFRS measures of earnings or cash flow in making an investment decision.
Contacts
E-mail: ri@voegol.com.br
Phone: +55 (11) 2128-4700
Website: www.voegol.com.br/ir
Report of the Statutory Audit Committee (“SAC”)
The Statutory Audit Committee of GOL LINHAS AÉREAS INTELIGENTES S.A., in compliance with its legal and statutory obligations, has reviewed the Parent Company and Consolidated Quarterly Information (ITR) for the period ended on September 30, 2020. Based on the procedures we have undertaken and considering the independent auditors’ review report issued by Grant Thornton Auditores Independentes, as well as the information and explanations we have received during the quarter, our opinion is that these documents can be submitted to the assessment of the Board of Directors.
São Paulo, October 29, 2020.
André Béla Jánszky
Member of the Statutory Audit Committee
Antônio Kandir
Member of the Statutory Audit Committee
Francis James Leahy Meaney
Member of the Statutory Audit Committee
Statement of the Executive Officers on the Parent Company and Consolidated Quarterly Information (ITR)
Under the provisions of CVM Instruction 480/09, the executive officers state that they have discussed, reviewed, and approved the Parent Company and Consolidated Quarterly Information (ITR) for the three-month period and nine-month period ended on September 30, 2020.
São Paulo, October 29, 2020.
Paulo Sérgio Kakinoff
Chief Executive Officer
Richard F. Lark Jr.
Executive Vice President, Chief Financial Officer and Investor Relations Officer
Statement of the Executive officers on the Independent Auditors’ Review Report
Under the provisions of CVM Instruction 480/09, the Executive Board states that it has discussed, reviewed and agreed with the conclusion of the review report from the independent auditor, Grant Thornton Auditores Independentes, on the Parent Company and Consolidated Quarterly Information (ITR) for the period ended on September 30, 2020.
São Paulo, October 29, 2020.
Paulo Sérgio Kakinoff
Chief Executive Officer
Richard F. Lark Jr.
Executive Vice President, Chief Financial Officer and Investor Relations Officer

Review Report on the Quarterly Information
Grant Thornton Auditores Independentes
Av. Eng. Luís Carlos Berrini, 105 - 12o andar
Phone: +55 11 3886-5100 |
To the Board of directors and shareholders of
Gol Linhas Aéreas Inteligentes S.A.
São Paulo – SP
Introduction
We have reviewed the accompanying individual and consolidated interim financial information of Gol Linhas Aéreas Inteligentes S.A. (“the Company”), comprised in the Quarterly Information Form for the quarter ended September 30, 2020, comprising the balance sheets as of September 30, 2020 and the respective statements of income and comprehensive income for the three and nine-month periods then ended, and of changes in shareholders’ equity and of cash flows for the period of nine months then ended, including the footnotes.
Management is responsible for the preparation of the individual and consolidated interim financial information in accordance with NBC TG 21 – Interim Financial Reporting and with international standard IAS 34 – Interim Financial Reporting, as issued by the International Accounting Standards Board (Iasb), such as for the presentation of these information in accordance with the standards issued by the Brazilian Exchange Securities Commission, applicable to the preparation of interim financial information. Our responsibility is to express a conclusion on this interim financial information based on our review.
Review scope
We conducted our review in accordance with the Brazilian and International standards on reviews of interim information (NBC TR 2410 – Review of Interim Financial Information Performed by the Independent Auditor of the Entity and ISRE 2410 – Review of Interim Financial Information Performed by the Independent Auditor of the Entity, respectively). The review of interim information consists of making inquiries, primarily of persons responsible for the financial and accounting matters and applying analytical and other review procedures. A review is substantially less in scope than an audit conducted in accordance with the audit standards and, consequently, does not enable us to obtain assurance that we would become aware of all significant matters that might be identified in an audit. Accordingly, we do not express an audit opinion.
Conclusion on the individual and consolidated interim financial information
Based on our review, nothing has come to our attention that causes us to believe that the accompanying individual and consolidated interim financial information included in the quarterly information form referred to above has not been prepared, in all material respects, in accordance with NBC TG 21 and IAS 34 applicable to the preparation of interim financial information, and presented in accordance with the standards issued by the Brazilian Securities and Exchange Commission.
Relevant uncertainty about going concern
We draw attention to Note 1, which mentions that the individual and consolidated interim financial information were prepared on the assumption of going concern. As described in the aforementioned note, the Company suffered recurring reductions in its operations and has a deficiency in net working capital which, together with other events and conditions, indicates the existence of relevant uncertainty that may raise significant doubt as to its ability to continue as a going concern. Management's plans and actions under development in order to reestablish the Company’s economic-financial balance and its equity position are described in Note 1. The individual and consolidated interim financial information do not include any adjustments that may arise from the result of this uncertainty. Our conclusion is not qualified in relation to this matter.
Other matters
Statements of value added
The quarterly information referred to above includes the individual and consolidated statements of value added for the period of nine months ended September 30, 2020, prepared under the responsibility of the Company's management and presented as supplementary information for the purposes of IAS 34. These statements were submitted to the same review procedures in conjunction with the review of the Company's interim financial information in the order to conclude they are reconciliated to the interim financial information and to the accounting records, as applicable, and whether the structure and content are in accordance with the criteria established in the NBC TG 09 - Statement of Value Added. Based on our review, nothing has come to our attention that causes us to believe that the accompanying statements of value added were not prepared, in all material respects, in accordance with the individual and consolidated interim financial information taken as a whole.
Audit and review of figures corresponding to the comparative year and period
The audit of the individual and consolidated financial statements for the year ended December 31, 2019 and the review of the individual and consolidated interim financial information for the three and nine-month periods ended September 30, 2019 were conducted under the responsibility of other independent auditor, which issued an audit report and a review report thereon, without qualifications, on February 28, 2020 and October 30, 2019, respectively.
São Paulo, October 29, 2020
Daniel Gomes Maranhão Junior
Assurance Partner
Grant Thornton Auditores Independentes
CRC 2SP-025.583/O-1
 | Balance Sheets September 30, 2020 and December 31, 2019 (In thousands of Brazilian Reais - R$) |
| Parent Company | Consolidated | ||||
| Assets | Note | September 30, 2020 | December 31, 2019 | September 30, 2020 | December 31, 2019 |
| Current | |||||
| Cash and Cash Equivalents | 6 | 6,628 | 1,016,746 | 498,754 | 1,645,425 |
| Financial Investments | 7 | 205 | 673 | 399,624 | 953,762 |
| Restricted Cash | 8 | 4,145 | 6,399 | 372,668 | 304,920 |
| Trade Receivables | 9 | - | - | 790,911 | 1,229,530 |
| Inventories | 10 | - | - | 199,717 | 199,213 |
| Taxes to Recover | 11 | 8,852 | 5,163 | 240,372 | 309,674 |
| Rights from Derivative Transactions | 35.2 | - | - | - | 3,500 |
| Advances to Suppliers and Third-Parties | 13 | 52 | 37 | 277,222 | 142,338 |
| Dividends and Interest on Shareholders’ Equity to Receive | 29.1 | 54,544 | 69,548 | - | - |
| Other Credits | 12,272 | 10,039 | 115,493 | 139,015 | |
| Total Current | 86,698 | 1,108,605 | 2,894,761 | 4,927,377 | |
| Noncurrent | |||||
| Restricted Cash | 8 | - | - | 180,388 | 139,386 |
| Deposits | 14 | 134,424 | 112,502 | 2,294,792 | 1,968,355 |
| Advances to Suppliers | 13 | - | - | 31,770 | 48,387 |
| Taxes to Recover | 11 | 11,879 | 22,449 | 322,172 | 174,142 |
| Deferred Taxes | 12 | 57,818 | 56,903 | 57,762 | 59,809 |
| Other Credits | - | - | 35,653 | 991 | |
| Credits with Related Companies | 29 | 5,150,125 | 3,440,701 | - | - |
| Rights from Derivative Transactions | 35.2 | 44,079 | 143,969 | 50,055 | 143,969 |
| Investments | 15.2 | 559,747 | 501,986 | 1,254 | 1,254 |
| Property, Plant & Equipment | 16 | 5,298 | 240,379 | 5,197,231 | 6,058,101 |
| Intangible Assets | 17 | - | - | 1,754,991 | 1,776,675 |
| Total Noncurrent | 5,963,370 | 4,518,889 | 9,926,068 | 10,371,069 | |
| Total | 6,050,068 | 5,627,494 | 12,820,829 | 15,298,446 | |
The accompanying notes are an integral part of the Parent Company and Consolidated Quarterly Information (ITR).
12
| | Balance Sheets September 30, 2020 and December 31, 2019 (In thousands of Brazilian Reais - R$) |
| Parent Company | Consolidated | |||||
| Liabilities | Note | September 30, 2020 | December 31, 2019 | September 30, 2020 | December 31, 2019 | |
| Current | ||||||
| Loans and Financing | 18 | 1,138,687 | 1,359,547 | 3,090,339 | 2,543,039 | |
| Leases to Pay | 19 | - | - | 2,247,758 | 1,404,712 | |
| Suppliers | 20 | 34,597 | 19,116 | 1,634,527 | 1,286,275 | |
| Suppliers - Forfaiting | 21 | - | - | 52,120 | 554,467 | |
| Labor Obligations | 170 | 137 | 338,989 | 396,010 | ||
| Taxes to Collect | 22 | 1,272 | 4,261 | 71,151 | 116,523 | |
| Landing Fees | - | - | 780,426 | 728,339 | ||
| Advance Ticket Sales | 23 | - | - | 1,805,930 | 1,966,148 | |
| Frequent-Flyer Program | 24 | - | - | 1,253,020 | 1,009,023 | |
| Advances from Customers | - | - | 19,989 | 16,424 | ||
| Provisions | 25 | - | - | 355,346 | 203,816 | |
| Obligations with Derivative Transactions | 35.2 | - | - | 100,962 | 9,080 | |
| Other Liabilities | - | - | 256,729 | 128,744 | ||
| Total Current | 1,174,726 | 1,383,061 | 12,007,286 | 10,362,600 | ||
| Noncurrent | ||||||
| Loans and Financing | 18 | 6,612,379 | 5,235,593 | 7,193,379 | 5,866,802 | |
| Leases to Pay | 19 | - | - | 5,735,626 | 4,648,068 | |
| Suppliers | 20 | - | - | 44,749 | 10,142 | |
| Provisions | 25 | - | - | 1,386,432 | 1,053,240 | |
| Frequent-Flyer Program | 24 | - | - | 307,592 | 171,651 | |
| Deferred Taxes | 12 | - | - | 218,621 | 244,041 | |
| Taxes to Collect | 22 | - | - | 34,536 | 84 | |
| Obligations to Related Parties | 29 | 9,509 | 163,350 | - | - | |
| Obligations with Derivative Transactions | 35.2 | - | - | - | 11,270 | |
| Provision for Investment Losses | 15.2 | 12,989,261 | 6,498,660 | - | - | |
| Other Liabilities | 23,394 | 23,501 | 29,554 | 35,965 | ||
| Total Noncurrent | 19,634,543 | 11,921,104 | 14,950,489 | 12,041,263 | ||
| Shareholders’ Equity | ||||||
| Share Capital | 26.1 | 3,009,132 | 3,008,178 | 3,009,132 | 3,008,178 | |
| Shares to Issue | 304 | 584 | 304 | 584 | ||
| Treasury Shares | 26.2 | (62,215) | (102,543) | (62,215) | (102,543) | |
| Capital Reserves | 202,574 | 225,276 | 202,574 | 225,276 | ||
| Equity Valuation Adjustments | (906,941) | 188,247 | (906,941) | 188,247 | ||
| Accumulated Losses | (17,002,055) | (10,996,413) | (17,002,055) | (10,996,413) | ||
| Negative Shareholders’ Equity (Deficit) Attributable to Controlling Shareholders | (14,759,201) | (7,676,671) | (14,759,201) | (7,676,671) | ||
| Non-Controlling Interests | - | - | 622,255 | 571,254 | ||
| Total Shareholders’ Equity (Deficit) | (14,759,201) | (7,676,671) | (14,136,946) | (7,105,417) | ||
| Total | 6,050,068 | 5,627,494 | 12,820,829 | 15,298,446 | ||
The accompanying notes are an integral part of the Parent Company and Consolidated Quarterly Information (ITR).
13
| | Income Statement Periods ended on September 30, 2020 and 2019 (In thousands of Brazilian Reais - R$, except basic and diluted loss per share) |
| Parent Company | ||||||
| Three-month period ended on | Nine-month period ended on | |||||
| Note | September 30, 2020 | September 30, 2019 | September 30, 2020 | September 30, 2019 | ||
| Operating Revenues (Expenses) | ||||||
| Administrative Expenses | (6,095) | (27,284) | (13,265) | (34,016) | ||
| Other Revenues and Expenses, Net | (18,289) | 25,780 | 357,970 | 35,591 | ||
| Total Operating (Expenses) Revenues | 31 | (24,384) | (1,504) | 344,705 | 1,575 | |
| Equity Income (Expenses) | 15 | (1,564,142) | (241,542) | (5,354,694) | (112,556) | |
| Operating Loss before Financial Income (Expenses) and Taxes | (1,588,526) | (243,046) | (5,009,989) | (110,981) | ||
| Financial Income (Expenses) | ||||||
| Financial Revenues | 244,748 | 157,594 | 1,010,892 | 99,630 | ||
| Financial Expenses | (272,462) | 54,791 | (1,013,662) | (303,172) | ||
| Financial Revenues (Expenses), Net | 32 | (27,714) | 212,385 | (2,770) | (203,542) | |
| Financial Income (Expenses) before Exchange Rate Change, Net | (1,616,240) | (30,661) | (5,012,759) | (314,523) | ||
| Exchange Rate Change, Net | 32 | (108,328) | (210,906) | (990,752) | (178,244) | |
| Loss before Income Tax and Social Contribution | (1,724,568) | (241,567) | (6,003,511) | (492,767) | ||
| Income Tax and Social Contribution | ||||||
| Current | 722 | (238) | (2,356) | (1,633) | ||
| Deferred | 4,076 | (247) | 915 | 25,418 | ||
| Total Income Tax and Social Contribution | 12 | 4,798 | (485) | (1,441) | 23,785 | |
| Net Loss of the Period before Non-Controlling Interests | (1,719,770) | (242,052) | (6,004,952) | (468,982) | ||
| Basic Loss | 27 | |||||
| Per Common Share | (0.163) | (0.020) | (0.570) | (0.038) | ||
| Per Preferred Share | (22.340) | (1.228) | (19.964) | (1.338) | ||
| Diluted Loss | 27 | |||||
| Per Common Share | (0.163) | (0.020) | (0.570) | (0.038) | ||
| Per Preferred Share | (22.340) | (1.228) | (19.964) | (1.338) | ||
The accompanying notes are an integral part of the Parent Company and Consolidated Quarterly Information (ITR).
14
| | Income Statement Periods ended on September 30, 2020 and 2019 (In thousands of Brazilian Reais - R$, except basic and diluted loss per share) |
| Consolidated | ||||||
| Three-month period ended on | Nine-month period ended on | |||||
| Note | September 30, 2020 | September 30, 2019 | September 30, 2020 | September 30, 2019 | ||
| Net Revenue | ||||||
| Passenger Transportation | 879,026 | 3,500,987 | 4,063,662 | 9,493,188 | ||
| Cargo and Others | 95,894 | 208,950 | 416,833 | 568,173 | ||
| Total Net Revenue | 30 | 974,920 | 3,709,937 | 4,480,495 | 10,061,361 | |
| Cost of Services | 31 | (958,970) | (2,546,834) | (4,040,886) | (7,311,700) | |
| gross profit | 15,950 | 1,163,103 | 439,609 | 2,749,661 | ||
| Operating Revenues (Expenses) | ||||||
| Selling Expenses | (82,257) | (247,492) | (317,431) | (669,412) | ||
| Administrative Expenses | (381,304) | (330,815) | (949,021) | (812,531) | ||
| Other Revenues and Expenses, Net | (312,836) | 28,178 | 194,217 | 170,265 | ||
| Total Operating Expenses | 31 | (776,397) | (550,129) | (1,072,235) | (1,311,678) | |
| Equity Income (Expenses) | 15 | - | - | - | 79 | |
| Operating Income (Loss) before Financial Income (Expenses) and Taxes | (760,447) | 612,974 | (632,626) | 1,438,062 | ||
| Financial Income (Expenses) | ||||||
| Financial Revenues | 242,584 | 200,658 | 1,137,231 | 282,965 | ||
| Financial Expenses | (618,460) | (262,486) | (2,339,673) | (1,211,288) | ||
| Financial Expenses, Net | 32 | (375,876) | (61,828) | (1,202,442) | (928,323) | |
| Financial Income (Expenses) before Exchange Rate Change, Net | (1,136,323) | 551,146 | (1,835,068) | 509,739 | ||
| Exchange Rate Change, Net | 32 | (551,232) | (728,623) | (4,064,660) | (681,327) | |
| Loss before Income Tax and Social Contribution | (1,687,555) | (177,477) | (5,899,728) | (171,588) | ||
| Income Tax and Social Contribution | ||||||
| Current | (42,093) | (49,560) | (77,946) | (125,203) | ||
| Deferred | 33,723 | 55,917 | 23,059 | 40,053 | ||
| Total Income Tax and Social Contribution | 12 | (8,370) | 6,357 | (54,887) | (85,150) | |
| Net Loss of the Period before Non-Controlling Interests | (1,695,925) | (171,120) | (5,954,615) | (256,738) | ||
| Income (Expenses) Attributed to: | ||||||
| Controlling Shareholders | (1,719,770) | (242,052) | (6,004,952) | (468,982) | ||
| Non-Controlling Shareholders | 23,845 | 70,932 | 50,337 | 212,244 | ||
| Basic Loss | 27 | |||||
| Per Common Share | (0.163) | (0.020) | (0.570) | (0.038) | ||
| Per Preferred Share | (22.340) | (1.228) | (19.964) | (1.338) | ||
| Diluted Loss | 27 | |||||
| Per Common Share | (0.163) | (0.020) | (0.570) | (0.038) | ||
| Per Preferred Share | (22.340) | (1.228) | (19.964) | (1.338) | ||
The accompanying notes are an integral part of the Parent Company and Consolidated Quarterly Information (ITR).
15
| | Statements of Comprehensive Income Periods ended on September 30, 2020 and 2019 (In thousands of Brazilian Reais - R$) |
| Parent Company | |||||
| Three-month period ended on | Nine-month period ended on | ||||
| September 30, 2020 | September 30, 2019 | September 30, 2020 | September 30, 2019 | ||
| Net Loss for the Period | (1,719,770) | (242,052) | (6,004,952) | (468,982) | |
| Other Comprehensive Income that will be Reversed to Income (Expenses) | |||||
| Cash Flow Hedge, Net of Income Tax and Social Contribution | (43,822) | (473,226) | (1,122,171) | (316,977) | |
| Actuarial Losses from Pension Plans and Post-Employment Benefits | - | - | 27,287 | - | |
| Other Comprehensive Income | (29) | - | (304) | - | |
| (43,851) | (473,226) | (1,095,188) | (316,977) | ||
| Total Comprehensive Income (Expenses) for the Period | (1,763,621) | (715,278) | (7,100,140) | (785,959) | |
| Consolidated | |||||
| Three-month period ended on | Nine-month period ended on | ||||
| September 30, 2020 | September 30, 2019 | September 30, 2020 | September 30, 2019 | ||
| Net Loss for the Period | (1,695,925) | (171,120) | (5,954,615) | (256,738) | |
| Other Comprehensive Income that will be Reversed to Income (Expenses) | |||||
| Cash Flow Hedge, Net of Income Tax and Social Contribution | (43,822) | (473,226) | (1,122,171) | (316,977) | |
| Actuarial Losses from Pension Plans and Post-Employment Benefits | - | - | 27,287 | - | |
| Other Comprehensive Income | (29) | - | (304) | - | |
| (43,851) | (473,226) | (1,095,188) | (316,977) | ||
| Total Comprehensive Income (Expenses) for the Period | (1,739,776) | (644,346) | (7,049,803) | (573,715) | |
| Comprehensive Income (Expenses) Attributed to: | |||||
| Controlling Shareholders | (1,763,621) | (715,278) | (7,100,140) | (785,959) | |
| Non-Controlling Shareholders | 23,845 | 70,932 | 50,337 | 212,244 | |
The accompanying notes are an integral part of the Parent Company and Consolidated Quarterly Information (ITR).
16
| | Statements of Changes in Shareholders’ Equity Periods ended on September 30, 2020 and 2019 (In thousands of Brazilian Reais - R$) |
| Parent Company and Consolidated | ||||||||||||||
| Capital Reserves | Equity Valuation Adjustments | |||||||||||||
| Share Capital | Shares to Issue | Treasury Shares | Premium when Granting Shares | Special Premium Reserve of the Subsidiary | Share-Based Compensation | Unrealized Income (Expenses) on Hedge | Post-Employment Benefits | Other Comprehensive Income | Effects from Changes in the Equity Interest | Accumulated Losses | Negative Shareholders’ Equity (Deficit) Attributable to Controlling Shareholders | Non-Controlling Interests - Smiles | Total | |
| Balances on December 31, 2018 | 3,055,940 | 2,818 | (126) | 17,497 | 70,979 | 117,413 | (500,022) | - | - | 759,984 | (8,509,895) | (4,985,412) | 480,061 | (4,505,351) |
| Initial Adoption of Accounting Standard - CPC 06 (IFRS 16) | - | - | - | - | - | - | - | - | - | - | (2,436,077) | (2,436,077) | (256) | (2,436,333) |
| Net Income (Loss) for the Period | - | - | - | - | - | - | - | - | - | - | (468,982) | (468,982) | 212,244 | (256,738) |
| Income (Expenses) from Cash Flow Hedge | - | - | - | - | - | - | (316,977) | - | - | - | - | (316,977) | - | (316,977) |
Capital Increase due to Stock Options Exercised | 5,401 | (2,818) | - | - | - | - | - | - | - | - | - | 2,583 | (6) | 2,577 |
| Advances for Future Capital Increase | - | 28,343 | - | - | - | - | - | - | - | - | - | 28,343 | - | 28,343 |
| Stock Option | - | - | - | - | - | 31,018 | - | - | - | - | - | 31,018 | 1,117 | 32,135 |
| Effects from Dilution in the Equity Interest | - | - | - | - | - | - | - | - | - | (649) | - | (649) | 649 | - |
| Subscription Bonus | - | - | - | - | 9,134 | - | - | - | - | - | - | 9,134 | - | 9,134 |
| Interest on Shareholders’ Equity Distributed by the Subsidiary Smiles | - | - | - | - | - | - | - | - | - | - | - | - | (143,137) | (143,137) |
| Balances on September 30, 2019 | 3,061,341 | 28,343 | (126) | 17,497 | 80,113 | 148,431 | (816,999) | - | - | 759,335 | (11,414,954) | (8,137,019) | 550,672 | (7,586,347) |
| Balances on December 31, 2019 | 3,008,178 | 584 | (102,543) | 17,497 | 83,229 | 124,550 | (530,043) | (41,045) | - | 759,335 | (10,996,413) | (7,676,671) | 571,254 | (7,105,417) |
| Other Comprehensive Income, Net | - | - | - | - | - | - | (1,122,171) | 27,287 | (304) | - | - | (1,095,188) | (73) | (1,095,261) |
| Net Income (Loss) for the Period | - | - | - | - | - | - | - | - | - | - | (6,004,952) | (6,004,952) | 50,337 | (5,954,615) |
| Total Comprehensive Income (Expenses) for the Period | - | - | - | - | - | - | (1,122,171) | 27,287 | (304) | - | (6,004,952) | (7,100,140) | 50,264 | (7,049,876) |
Capital Increase by Stock Option Period | 954 | (954) | - | - | - | - | - | - | - | - | - | - | - | - |
| Advances for Future Capital Increase | - | 674 | - | - | - | - | - | - | - | - | - | 674 | - | 674 |
| Transfer of Treasury Shares | - | - | 40,328 | - | - | (40,328) | - | - | - | - | - | - | - | - |
| Effects from Dilution in the Equity Interest | - | - | - | - | 642 | - | - | - | - | - | (690) | (48) | 48 | - |
| Stock Option | - | - | - | - | - | 16,984 | - | - | - | - | - | 16,984 | 689 | 17,673 |
| Balances on September 30, 2020 | 3,009,132 | 304 | (62,215) | 17,497 | 83,871 | 101,206 | (1,652,214) | (13,758) | (304) | 759,335 | (17,002,055) | (14,759,201) | 622,255 | (14,136,946) |
The accompanying notes are an integral part of the Parent Company and Consolidated Quarterly Information (ITR).
17
| | Statements of Cash Flows Periods ended on September 30, 2020 and 2019 (In thousands of Brazilian Reais - R$) |
| Parent Company | Consolidated | |||
| September 30, 2020 | September 30, 2019 | September 30, 2020 | September 30, 2019 | |
| Net Loss for the Period | (6,004,952) | (468,982) | (5,954,615) | (256,738) |
| Adjustments to Reconcile the Net Loss to Cash Generated from Operating Activities | - | |||
| Depreciation and Amortization | - | - | 1,469,790 | 1,269,438 |
| Provision for Doubtful Accounts | - | - | 598 | 1,005 |
| Provision for Legal Proceedings | - | - | 219,160 | 145,288 |
| Provisions for Inventory Obsolescence | - | - | 608 | 32 |
| Recovery of Overdue Credits | - | - | (126,675) | - |
| Adjustment to Present Value of Assets and Liabilities | - | - | 48,603 | - |
| Deferred Taxes | (915) | (25,418) | (23,059) | (40,053) |
| Equity Income (Loss) | 5,354,694 | 112,556 | - | (79) |
| Share-Based Compensation | - | 31,018 | 16,984 | 32,135 |
| Sale-Leaseback | - | - | (112,591) | - |
| Actuarial Losses from Post-Employment Benefits | - | - | 8,024 | - |
| Exchange Rate and Cash Changes, Net | 1,137,929 | 196,692 | 3,922,820 | 667,930 |
| Interest Assets | - | 322 | - | 6,790 |
| Interest on Loans and Leases | 342,241 | 248,854 | 1,075,638 | 797,014 |
| Change from Financial Investments | (5,422) | - | (110,796) | - |
| Provision for Aircraft and Engine Return | - | - | 90,883 | 269,434 |
| Provision for Maintenance Reserve | - | - | - | (55,346) |
| Write-off of Collateral Deposits for Lease and Maintenance | - | - | 117,310 | - |
| Income (Expenses) from Derivatives Recognized in Income (Expenses) | 121,745 | 41,582 | 668,447 | 138,901 |
| Unrealized Income (Expenses) on Derivatives – ESN (*) | (512,876) | (151,169) | (512,876) | (151,169) |
| Extinction of Obligation due to the Reduced Contractual Term | - | - | - | (262,569) |
| Provision for Labor Obligations | - | - | 131,494 | 205,834 |
| Write-off of Property, Plant & Equipment and Intangible Assets | 108,538 | 3,301 | 91,617 | 135,723 |
| Other Provisions | 1,313 | - | 54,500 | (12,038) |
| Adjusted Net Income (Expenses) | 542,295 | (11,244) | 1,075,864 | 2,891,532 |
| Changes in Operating Assets and Liabilities: | ||||
| Trade Receivables | - | - | 451,337 | (325,005) |
| Financial Investments | 5,975 | 87,478 | 231,223 | 27,962 |
| Restricted Cash | - | (2,354) | - | 200,841 |
| Inventories | - | - | (1,112) | (14,526) |
| Deposits | (2,270) | (4,694) | (30,995) | (158,851) |
| Deposit in Guarantee for Lease Agreements | - | - | (33,629) | (34,408) |
| Taxes to Recover | 6,881 | 731 | 47,947 | 100,883 |
| Suppliers | 15,950 | 15,742 | 336,321 | (233,971) |
| Suppliers - Forfaiting | - | - | (143,010) | 193,807 |
| Advance Ticket Sales | - | - | (160,218) | 311,563 |
| Frequent-Flyer Program | - | - | 379,938 | 79,940 |
| Advances from Customers | - | - | 3,565 | (155,427) |
| Labor Obligations | 33 | (445) | (188,515) | (155,254) |
| Landing Fees | - | - | 52,087 | 132,099 |
| Taxes to Collect | (4,667) | (22,529) | 40,142 | 111,297 |
| Obligations with Derivative Transactions | - | - | - | (25,855) |
| Liquidations with Derivative Transactions | - | - | (749,915) | (17,627) |
| Advances to Suppliers and Third-Parties | (15) | (157,991) | (139,149) | (284,460) |
| Payments for Lawsuits and Aircraft Return | - | - | (198,914) | (208,902) |
| Other Credits (Obligations) | (2,445) | (48,631) | 125,246 | (92,326) |
| Interest Paid | (465,844) | (313,273) | (546,360) | (428,255) |
| Income Tax Paid | (2,789) | (1,259) | (51,060) | (176,290) |
| Net Cash Flows from (Used in) Operating Activities | 93,104 | (458,469) | 500,793 | 1,738,767 |
18
| | Statements of Cash Flows Periods ended on September 30, 2020 and 2019 (In thousands of Brazilian Reais - R$) |
| Parent Company | Consolidated | |||
| September 30, 2020 | September 30, 2019 | September 30, 2020 | September 30, 2019 | |
| Loans Receivable from Related Parties | (629,303) | (926,118) | - | - |
| Restricted Cash | 2,254 | (108,750) | ||
| Financial Investments in Subsidiary | - | - | 497,777 | (542,261) |
| Dividends and Interest on Shareholders’ Equity Received through Subsidiary | 15,002 | 232,183 | - | - |
| Advances for Property, Plant & Equipment Acquisition, Net | - | (35,189) | (91,439) | (39,418) |
| Aircraft Sales Received | - | 348,389 | - | 348,389 |
| Return of Advance to Suppliers | 136,962 | - | 136,962 | - |
| Acquisition of Property, Plant & Equipment | (10,419) | - | (507,095) | (561,307) |
| Acquisition of Intangible Assets | - | - | (47,910) | (53,513) |
Net Cash Used in Investment Activities
Funding from Loans and Leases | (485,504) | (380,735) | (120,455) | (848,110) |
| 1,367,870 | 1,707,935 | 1,852,154 | 1,950,040 | |
| Funding Costs from Loans and Securities Buyback | (45) | (70,356) | (6,041) | (77,082) |
| Loan Payments | (2,131,879) | (50,320) | (2,761,194) | (570,413) |
| Lease Payments | - | - | (784,433) | (1,223,685) |
| Derivatives Paid (Received) | - | (153,038) | 21,800 | (403,022) |
| Dividends and Interest on Shareholders’ Equity Paid to Non-Controlling Shareholders | - | - | (14,811) | (209,150) |
| Capital Increase | - | 2,583 | - | 2,576 |
| Subscription Bonus | - | 9,134 | - | 9,134 |
| Shares to Issue | 674 | 28,343 | 674 | 28,343 |
| Net Cash (Used in) from Financing Activities | (763,380) | 1,474,281 | (1,691,851) | (493,259) |
| Exchange Rate Change of the Cash of Subsidiaries Abroad | 145,662 | 44,805 | 164,842 | 35,880 |
Net (Decrease) Increase in Cash and Cash Equivalents | (1,010,118) | 679,882 | (1,146,671) | 433,278 |
| Cash and Cash Equivalents at the Start of the Period | 1,016,746 | 282,465 | 1,645,425 | 826,187 |
| Cash and Cash Equivalents at the End of the Period | 6,628 | 962,347 | 498,754 | 1,259,465 |
(*) Exchangeable Senior Notes NE 35.2.
Transactions that do not affect cash are presented in Note 36 of this Parent Company and Consolidated Quarterly Information (ITR).
The accompanying notes are an integral part of the Parent Company and Consolidated Quarterly Information (ITR).
19
| | Statement of Value Added Periods ended on September 30, 2020 and 2019 (In thousands of Brazilian Reais - R$) |
| Parent Company | Consolidated | |||
| September 30, 2020 | September 30, 2019 | September 30, 2020 | September 30, 2019 | |
| Revenues | ||||
| Passenger, Cargo, and Other Transportation | - | - | 4,681,010 | 10,508,186 |
| Other Operational Revenues | 357,970 | 35,591 | 194,217 | 170,265 |
| Provision for Doubtful Accounts | - | - | (598) | (1,005) |
| 357,970 | 35,591 | 4,874,629 | 10,677,446 | |
| Inputs Acquired from Third Parties (includes ICMS and IPI) | ||||
| Fuel and Lubricant Suppliers | - | - | (1,506,552) | (3,099,808) |
| Materials, Energy, Third-Party Services, and Others | (8,567) | (29,870) | (961,465) | (2,248,352) |
| Aircraft Insurance | - | - | (27,332) | (18,927) |
| Sales and Marketing | (366) | (338) | (221,496) | (475,315) |
| Gross Added Value | 349,037 | 5,383 | 2,157,784 | 4,835,044 |
| Depreciation and Amortization | - | - | (1,469,790) | (1,269,438) |
| Net Added Value Produced by the Company | 349,037 | 5,383 | 687,994 | 3,565,606 |
| Added Value Received on Transfers | ||||
| Equity Income (Expenses) | (5,354,694) | (112,556) | - | 79 |
| Financial Revenue | 1,010,892 | 134,625 | 1,137,231 | 282,965 |
| Total Value Added (Distributed) to Distribute | (3,994,765) | 27,452 | 1,825,225 | 3,848,650 |
| Distribution of Value Added: | ||||
| Direct Compensation | 3,137 | 2,966 | 794,321 | 1,182,779 |
| Benefits | 1 | - | 128,945 | 135,379 |
| FGTS | - | - | 31,613 | 94,061 |
| Employees | 3,138 | 2,966 | 954,879 | 1,412,219 |
| Federal | 2,695 | (21,004) | 362,875 | 775,388 |
| State | - | - | 10,362 | 14,367 |
| Municipal | - | - | 2,373 | 3,062 |
| Taxes, Fees, and Contributions | 2,695 | (21,004) | 375,610 | 792,817 |
| Interest and Exchange Rate Change | 2,004,354 | 514,442 | 6,384,596 | 1,854,825 |
| Rents | - | - | 63,396 | 45,412 |
| Others | - | 30 | 1,359 | 115 |
| Third-Party Capital Compensation | 2,004,354 | 514,472 | 6,449,351 | 1,900,352 |
| Net Loss for the Period | (6,004,952) | (468,982) | (6,004,952) | (468,982) |
| Income (Expenses) of the Period Attributed to Non-Controlling Shareholders | - | - | 50,337 | 212,244 |
| Shareholders’ Equity Compensation | (6,004,952) | (468,982) | (5,954,615) | (256,738) |
| Total Value Added (Distributed) to Distribute | (3,994,765) | 27,452 | 1,825,225 | 3,848,650 |
The accompanying notes are an integral part of the Parent Company and Consolidated Quarterly Information (ITR).
16
| | Notes on the Parent Company and Consolidated Quarterly Information (ITR) September 30, 2020 (In thousands of Brazilian Reais - R$, except when otherwise indicated) |
| 1. | Operating Context |
Gol Linhas Aéreas Inteligentes S.A. (the “Company” or “GOL”) is a publicly-listed company incorporated on March 12, 2004, under the Brazilian Corporate Law. According to its Bylaws, the Company's purpose is to exercise control of GOL Linhas Aéreas S.A. (“GLA”), which operates regular and non-scheduled passenger flight transportation services and the development of loyalty programs, among others.
The Company’s shares are traded on B3 S.A. - Brasil, Bolsa, Balcão (“B3”) and on the New York Stock Exchange (“NYSE”) under the ticker GOLL4 and GOL, respectively. The Company adopted Level 2 Differentiated Corporate Governance Practices from B3 and is included in the Special Corporate Governance Stock Index (“IGC”) and the Special Tag Along Stock Index (“ITAG”), which were created for companies committed to apply the differentiated corporate governance practices.
The Company’s corporate address is located at Praça Comandante Linneu Gomes, s/n, concierge 3, building 24, Jardim Aeroporto, São Paulo, Brazil.
1.1. Measures taken by the Management regarding COVID-19 and the Gradual Resumption of Demand
The pandemic sparked by COVID-19, considered by the World Health Organization as a “public health emergency of international interest”, spread rapidly across the world, leading to unprecedented disruptions in the global economic activity.
Such crisis affected the macroeconomic environment. According to Getúlio Vargas Foundation’s economic activity indicator, the Brazilian economy retracted by 5.8% from January through the end of July 2020. The Focus Report, issued by the Central Bank on July 3, 2020, included forecasts for 2020 of a 6.50% and 8.10% retraction in gross domestic product and industrial production, respectively. With the improved visibility of the pandemic’s impacts and a phased return of economic activities, an updated Focus Report issued on October 16, 2020 forecasts a 5.00% decrease in gross domestic product and a 5.98% decrease in industrial production for 2020.
Among the measures taken in Brazil, which reduced the spread of the disease, are the recommendation of social distancing, restrictions and recommendations to reduce travel and closing of borders. As a consequence, the airline industry was one of the first and most affected sectors.
The highlight of the third quarter of 2020 was the return of growth in the volume of passengers in the Brazilian domestic market. Since the beginning of the pandemic, GOL has had consistent load factors around 80%, which, in addition to cost control and cash preservation measures implemented, have proven the sound management of the Company, which favorably positioned GOL to capture the expectedgrowth in demand. The scenario remains challenging, but Management is experiencing a consistent and increasing search for GOL’s tickets for leisure travel for the year-end vacations, specifically in the domestic market, which is GOL's main area of activity.
Due to the increased demand, in September 2020, the Company registered a 60% increase in ticket sales, in all of its channels, compared to August 2020. In the same month, GOL’s daily sales exceeded R$20 million, which represents more than 50% of pre-pandemic sales levels.
The Company operates with a significant cash balance, and a positive demand trend. GOL
17
| | Notes on the Parent Company and Consolidated Quarterly Information (ITR) September 30, 2020 (In thousands of Brazilian Reais - R$, except when otherwise indicated) |
believes that it has enough funds to meet its financial obligations in the next twelve months, after successfully adjusting its debt amortization schedule in the third quarter of 2020. GOL was the Brazilian airline that achieved the highest rate of job maintenance, and was able to strengthen its direct and transparent business relationships with its main business partners. A flexible business model based on a single fleet type of fleet has historically allowed the Company to reach the lowest operating costs and to manage the fleet's capacity to keep pace with Brazilian GDP and passenger demand. This flexibility was key in the first half of 2020 to meet the more than 90% drop in passenger demand due to government measures to control the spread of the COVID-19 pandemic. These qualifications led the Company to a strong position to capture passenger demand arising from the expected Brazilian economic recovery in the coming years.
In addition, GOL honored all its financial commitments, including the amortization of its 2022 Senior Notes in March, the full payment of interest on all its notes, and the fullrepayment of the Term Loan B totaling US$300 million in August.
GOL received a credit rating upgrade by Standard & Poor's on September 25, 2020, and by Fitch on October 9, 2020, which raised the Company's issuer and issue credit ratings to from “CCC-” to “CCC+”.
The Company, through its Executive Committee, with the participation of its entire management body, monitors the demand recovery and determines GOL’s financial and operational strategies, in addition to improving GOL’s support to the society. Among the measures already taken by the management, the following stand out:
| 1.1.1 | Operational Readjustment - Flight Network |
On March 16, 2020, GOL reduced its capacity by 50 to 60% in the domestic market, and by 90 to 95% in the international markets, to reflect the change in customer demand. The Company adjusted its network from 750 to 50 essential daily flights (“Essential Air Network”).
Since April 2020, GOL has already reopened flight to 36 destinations in Brazil, operating, on average, 210 daily flights in the third quarter of 2020, with daily peaks of up to 360 flights. GOL had no regular international flights between April and September.
GOL has been readjusting its flight network, expanding flights to the Northeast and launching Salvador as a hub to capture the resumption of leisure demand, which has had a load factor above 90% in this region. With the increased demand indicators and sales levels, GOL is well positioned with the most comprehensive Brazilian domestic network to expand its market share and reinforce its dominance in large domestic markets.
1.1.2 Decrease in Fixed and Variable Costs
| · | Variable Costs: At the end of March, the Company reformulated its flight network to ensure essential services to Brazilian state capitals and the federal district. With the demand resuming and airports reopening in a phased manner, according to the position of governments regarding the reopening for tourism, the Company reopened flights to 36 airports (15 in third quarter) to serve 134 markets (118 markets operated by the Company and 16 through its strategic partners). Currently, the Company’s network represents nearly 95% of the network operated at the beginning of year. The number of aircraft operated increased from 11 in the beginning of crisis to 71 by the end of third quarter, while consistent initiatives and efforts for cost reduction were implemented; |
18
| | Notes on the Parent Company and Consolidated Quarterly Information (ITR) September 30, 2020 (In thousands of Brazilian Reais - R$, except when otherwise indicated) |
| · | Personnel Expenses: Through the adoption of the government’s Provisional Measure MP 936, converted into Law 14020/20, the Company adopted measures to reduce about 50% of payroll expenses and respective charges, reducing the number of hours worked per day, suspending employment agreements, adopting unpaid leave (LNR) programs and reducing salaries by 50% for employees and by 60% for senior management (the latter which was not included in MP 936’s scope). |
In addition, in June, the Company signed collective bargaining agreements with the Brazilian Union of Aeronauts and the Aviators’ Unions, which, jointly, will ensure the maintenance of the jobs of pilots and crew. Among the main initiatives of the package of measures with the Unions, we highlight the salary reduction of up to 50% for the next 12 months and voluntary plans (voluntary dismissal program, retirement, part-time, and unpaid leave). This package of measures came into effect on July 1, and will remain in force for a period between 12 and 18 months, a period of post-crisis recovery, thus making it possible to manage a gradual growth of costs with the resumption of operations.
| · | Other Expenses: Suspension of advertising expenses, as well as the immediate interruption of projects that are not absolutely essential for the continuity of our operations. |
1.1.3 Preserving and Strengthening the Cash and Liquidity Position
| · | Aircraft and Engine Leases: The Company finalized the agreements with its lessors, renegotiated payment flows, obtained reductions in the current leases and converted a portion of the fixed monthly payments into variable payments (power-by-the-hour). The agreements ensure monthly lease payments and are adjusted to the demand recovery in 2020 and 2021, and will represent an actual saving in the Company’s structure of unit costs after the pandemic. For further information, see Note 19; |
| · | Fuel Costs: The Company entered into agreements with suppliers to postpone payments, and installment payments were resumed in September 2020; |
| · | Personnel Expenses: The Company postponed the payment of salary bonuses related to 2019 as well as vacation bonuses, and is not pre-paying employees’ t13th salary; |
| · | Investments: The Company suspended all non-essential investments, and interrupted “pre delivery payments (PDPs)”, and postponed deliveries of new aircraft with Boeing for the next two years; |
| · | Engine Maintenance: The Company postponed engine maintenance payments, which are being made according to specific negotiations with suppliers and the Company's operational needs; |
| · | Taxes, Contributions, and Social Charges: The Company postponed federal tax payments based on measures enacted by the Federal Government; |
| · | Other Expenses and Revenues: The Company entered into an agreement, under which Boing reimburses certain expenses incurred since the grounding of Boeing 737MAX aircraft, with immediate cash effect of R$447 million, received on April 1, 2020 with additional receivables to be received in 4Q20; and |
| · | Loans and Financing: The Company obtained the support of its main creditors and renegotiated the extension of terms and rollovers of its debt obligations, as further explained in Note 18. Highlights were the postponement of the amortization schedule for GOL’s debentures and the waiver obtained for the 2020 covenants under those debentures. |
19
| | Notes on the Parent Company and Consolidated Quarterly Information (ITR) September 30, 2020 (In thousands of Brazilian Reais - R$, except when otherwise indicated) |
| 1.1.4 | Government and Regulators Support |
| · | Preservation of Advance Ticket Sales: The Company reduced the level of refunds and cancellation based on measures enacted by the Federal Government that allowed rescheduling trips for up to 18 months; |
| · | Landing Fees: The Company changed the payment term for navigation fees and landing fees, which may be paid up to December 2020 without fines; and |
| · | Maintenance of ANAC’s Slots and Qualifications: The Company obtained, (i) a bonus for the cancellation of slots by the regularity index, valid until the end of October 2020, in line with a similar decision adopted by other organizations and civil aviation authorities, such as the European Commission and the FAA; and (ii) an extension for 120 days of the renewal of qualifications due between June and December 2020. |
1.1.5 Support to Society, Employees, and Customers
Air passenger transportation is an essential service for society. The Company recognizes the duty to care for its customers and is working with the authorities to help minimize the impact of COVID-19 on the country's population and health services.
For its flights, the Company adopted additional cleaning measures according to the new standards issued by ANVISA and international healthcare agencies. Among the main measures, we highlight the adoption of mandatory protection masks, closing VIP rooms, disconnection of self-service totems, implementation of segmented boarding and adoption of self-boarding without handling the boarding passes. The Company also expanded the incentive to use its digital channels and remodeled the in-flight service with sealed and sanitized products, along with the timely use of hand sanitizers. In addition, all aircraft are equipped with HEPA filters, which captures about 99.9% of viruses, bacteria and impurities, renewing the air every 3 minutes.
The Company created specific communication channels regarding the coronavirus, which are constantly updated, to improve customer service at a time of increasing demand and great uncertainty. The Company reinforced the dedicated team in its Call Center and continues to give priority to the most urgent cases. This team is committed to assisting customers in reorganizing their airline ticket reservations, with flexible conditions to change their future travel.
Currently, 90% of the processes for traveling with GOL happen without human contact. GOL's flight application allows Customers to purchase tickets, check in, check baggage and board, including through face recognition, in addition to the service via WhatsApp, in which many of its Customers perform check-ins without need for human interaction, consult their flight status and have the possibility of managing the reservation. Intensifying the use of technology and innovation is a strategic pillar of GOL’s business.
Regarding GOL’s Frequent-Flyer Program, Smiles, digital channels were also improved by implementing online cancellation self-service, free of charge, available on Smiles Fidelidade website and apps, and the Company improved Smiles’ online service (chat), for customers who have eligible GOL tickets. The system was developed internally, in record time.
Understanding that there is no set deadline for the end of this crisis and that this will inevitably have an impact on the travel planning of its customers, Smiles announced the extension of the maturity of the frequent-flyer program’s categories. Just as it chose not to consider the current year as the basis for the requalification of next year's customers, since
20
| | Notes on the Parent Company and Consolidated Quarterly Information (ITR) September 30, 2020 (In thousands of Brazilian Reais - R$, except when otherwise indicated) |
the analysis of categories would include miles accumulated from segments flown from January to December 2020. The measure allows customers to gain more time within their category and to take advantage of the benefits offered.
To mitigate negative impacts from the COVID-19 crisis, Smiles has launched a number of incentive initiatives for participants to use their miles on products offered by other partners, mainly retailers, through Shopping Smiles.
Socially, supporting and recognizing those who fight COVID-19 on the front lines, the Company, started transporting health professionals free of charge. By September 30, 2020, 1,390 airline tickets were granted. In turn, Smiles started to credit miles for these health professionals who travel around Brazil to provide care to affected patients. For each GOL segment, flown at no cost, the traveler receives 1,000 miles. Until September 30, 2020, a total of 309,800 miles were distributed, and did not generate material financial impacts on the Parent Company and Consolidated Quarterly Information (ITR).
Among all the measures adopted by GOL during the pandemic, keeping the integrity and health of the Company's employees is a priority. Since the second half of March 2020, all Company employees with administrative assignments started working from home. Employees are constantly being monitored by the Company's leadership and by the People & Culture area that manages human resources.
The Company’s greatest commitment will continue to be people’s integrity and health, strictly following the WHO’s guidelines as a commitment to do everything possible to get through this period of turbulence in the best possible way.
1.1.6 Effects on the Parent Company and Consolidated Quarterly Information (ITR)
As already mentioned, the COVID-19 pandemic’s impacts were immediate and severe for the Company. The main consequence was the reduction in the operational flight network.
Below is a table summarizing the accounting adjustments and reclassifications made in the nine month period ended September 30, 2020, as well as the details on each of these items and additional disclosures:
| September 30, 2020 | ||
| Nine-month period | ||
| Provisions for Cancellations of Miles Redeemed | (a) | (22,271) |
| Losses with Financial Investments | (b) | (63,104) |
| Derecognition of Cash Flow Hedge - Fuel | (c) | (315,286) |
| Derecognition of Cash Flow Hedge - Revenues in US$ | (d) | (290,345) |
| Lease contracts renegotiation – IFRS 16 | (e) | 8,482 |
| Appropriation of Interest due to Renegotiation with Suppliers | (23,435) | |
| Total | (714,441) |
| (a) | The subsidiary Smiles, which connects the travel and tourism segments, is also among the most affected by the crisis, with impacts to its operations and income (expenses). The main effect was the drop in the volume of miles redeemed by participants of the Smiles Program, mainly for airline tickets, hotel stays and car rentals. In April, the Company had cancellations of miles redeemed in previous months, in volumes higher than usual. Thus, a provision for cancellations was recorded on March 31, 2020, totaling R$22,271. This provision has been monitored and was considered sufficient to cover such losses, maintained on September 30, 2020. |
21
| | Notes on the Parent Company and Consolidated Quarterly Information (ITR) September 30, 2020 (In thousands of Brazilian Reais - R$, except when otherwise indicated) |
| (b) | Even though the Management of the Company and its subsidiaries have remained faithful to the Company’s investment policy, the abrupt changes in macroeconomic indicators, including cuts to the SELIC rate made by the Federal Government, led the Company to record unusual losses in its investments in sovereign fixed income funds linked to SELIC, as well as in private credit fixed income funds with a high degree of liquidity and high quality of credit. |
| (c) | Furthermore, due to the operations downsizing, the Company derecognized operations designated as cash flow hedges, as a drop is expected in the fuel consumption previously estimated. Accordingly, the Company transferred a total loss of R$315,286 (R$291,925 in the first quarter and R$23,361 in the second quarter) from the “equity valuation adjustment” group in shareholders’ equity to the financial income (expenses) as “losses from derivatives”. |
| (d) | Due to the temporary interruption of all international flights, the Company also derecognized hedge accounting transactions used to hedge future revenues in foreign currency (hedged object), using lease agreements as hedge instruments. That said, the Company transferred R$290,345 from the “equity valuation adjustment” group in shareholders' equity to the financial income (expenses) as “exchange rate change expenses”. |
| (e) | The Company entered into renegotiations for part of its aircraft and operating engine leasing contracts, with no purchase option, including postponement and deferral of payments, extension of terms and modification of monthly payment amounts, which resulted in a reduction of lease obligations by R$179,579 with an offset to aircraft rights of use in fixed assets of R$ 171,097 and in the result of R$8,482. |
| Consolidated | |||
| September 30, 2020 | |||
| Nine-Month Period | |||
| Balance Sheet - Reclassifications | Cost of Services | Other Revenues and Expenses, Net | |
| Personnel Costs - Idleness | (f) | 160,802 | (160,802) |
| Flight Equipment Depreciation - Idleness | (f) | 615,667 | (615,667) |
| (f) | Due to the drop in the number of flights operated and suspension of employment agreement, where the Company paid 30% of personnel expenses, by analogy to the provisions of CPC 16 (R1) - Inventories, equivalent to IAS 2, personnel expenses and depreciation of flight equipment not directly related to the revenues generated in the period, called idleness, were reclassified from the group of costs of services to the group of other revenues and expenses, net. |
| Consolidated | |||
| September 30, 2020 | |||
| Balance Sheet - Reclassifications | Current | Noncurrent | |
| Taxes and Contributions to Recover | (g) | (18,564) | 18,564 |
| (g) | Expectations of realization of assets and liabilities were reassessed and, as a result, R$18,564 were reclassified between short- and long-term of taxes and contributions to be recovered, since such asset will take longer to be realized. |
22
| | Notes on the Parent Company and Consolidated Quarterly Information (ITR) September 30, 2020 (In thousands of Brazilian Reais - R$, except when otherwise indicated) |
| Consolidated | |||
| September 30, 2020 | |||
| Balance Sheet - Adjustments | Noncurrent Liabilities | Other Comprehensive Income | |
| Provision for Post-Employment Benefits | (h) | (27,287) | 27,287 |
| (h) | Given the abrupt changes in the macroeconomic scenario, the Company updated the actuarial studies that establish obligations from post-employment benefits, and -- mainly due to the drop in the long-term interest rate -- the balance related to such obligations was reduced by R$27,287. For further details, see Note 25.1. |
On June 30, 2020, March 31, 2020 and December 31, 2019, the Company carried out impairment tests on the balances of fixed assets, goodwill and slot rights, no provision for impairment was recorded. On September 30, 2020, the Company assessed the indications of impairment of these assets and concluded that there is no evidence of loss due to impairment.
The Company reassessed the estimated realization of deferred tax assets recognized at the parent company and did not identify any need to adjust the balance.
The Company also carried out a thorough review of its budget estimates for the current and subsequent fiscal years (“Business Plan”), as detailed in Note 1.2.
| 1.2. | Capital Structure and Net Current Capital |
On September 30, 2020, the Company had a negative shareholders’ equity position attributed to the controlling shareholders of R$14,759,201 (R$7,676,671 on December 31, 2019).
The change observed in the nine-month period ended on September 30, 2020 is mainly due to the devaluation of the Real against US Dollar (approximately 29%), which negatively affected the result for the period due to exchange rate changes of around R$3.5 billion, as well as non-comprehensive income (expenses) of around R$1.0 billion, mainly due to derivative transactions, in addition to interest expenses of R$1.0 billion.
The negative net current capital position on September 30, 2020 was R$1,088,028 in the parent company and R$9,112,525 in the consolidated financial statements (R$274,456 and R$5,435,223 negative on December 31, 2019 in the parent company and in the consolidated financial statements, respectively). This change is mainly due to the increase in loan and lease obligations of around R$1.4 billion, due to the devaluation of Real against US Dollar and the reduction in the balance of accounts receivable of around R$451 million due to the downsizing in operations resulting from the economic crisis due to the COVID-19 pandemic.
23
| | Notes on the Parent Company and Consolidated Quarterly Information (ITR) September 30, 2020 (In thousands of Brazilian Reais - R$, except when otherwise indicated) |
The operations of the subsidiary GLA are sensitive to changes in the economic scenario and to the volatility of Real, given that around 35.3% of its costs are linked to the US dollar (“US$”), and its ability to adjust the price charged to its customers to pass through an appreciation of the US$ depends on the rational (offer) capacity and behavior of competitors.
Over the past four years, Management has taken many measures to adapt the size of its fleet to demand, matching the supply of seats to the demand to keep high occupancy rates, reducing costs and adjusting the capital structure, as well as implementing initiatives to restructure its balance sheet.
With the outbreak of the COVID-19 pandemic, which led to an unprecedented economic crisis, Management quickly reorganized the Company's businesses through the measures detailed in Note 1.1.
Management continuously monitors the effects of the crisis and will continue to take measures to strengthen GOL’s income (expenses) and balance sheet, thus ensuring the Company's sustainability.
Management understands that the business plan reviewed, presented, and approved by the Board of Directors on April 30, 2020 has all elements necessary for the operation’s continuity. Our consolidated interim financial statements have been prepared on an accounting base of continuity, which includes the continuity of operations, realization of assets and compliance with liabilities and commitments in the usual course of business. Accordingly, our interim consolidated financial statements do not include any adjustments that may result from the inability to continue operating. If we are unable to continue operating, adjustments to the book values and classification of our assets and liabilities and the reported amounts of revenues and expenses may be necessary and significant.
| 1.3. | Status of Boeing 737 MAX’s Grounding |
On March 11, 2019, due to a second accident with a Boeing 737 MAX 8 aircraft, with SAFETY as GOL’s #1 value, the Company’s Management decided to suspend the operations of its 7 aircraft of this model, well before being required to do so by any regulators.
In response to this measure, the Company quickly reconfigured its flight network, and, as a result, worked to rationally supply the required capacity to meet the demand levels through new lease agreements. The aircraft grounding and additional efforts led the Company to incur unplanned costs, related to, but not limited to: interline fares to relocate passengers, accommodation, meals and other passenger expenses, additional fuel consumption, taxes and landing fees, salaries and charges linked to overtime, payment to lease additional aircraft and negative publicity, disrupting the Company's business.
As a result, and in recognition of a long-standing partnership, the Company reached an agreement with Boeing, the terms of which are strictly confidential, but have as purpose to provide (a) compensation by Boeing addressing damages from unplanned additional costs incurred since the aircraft was grounded, to date, and due to the non-delivery of aircraft, as defined in purchase agreements; (b) reduction in the number of firm commitments for 34 aircraft; (c) flexibility to further adjust the number of aircraft; and (d) flexibility to convert existing orders to other models in the Max family.
Under current accounting principles and rules, an amount of R$446,942 received on April 1, 2020 was recorded in cash and cash equivalents with disbursement of R$136,962 in “advances for the acquisition of Property, Plant & Equipment” in property, plant & equipment, as this is a return of “pre delivery payment”, and the amount of R$309,980 was recorded in the income statement, with R$63,041 resulting from exchange rate variations, R$193,503 as other revenues and expenses, net, since this is a reimbursement of expenses incurred in previous years and the remaining amount distributed in other items of the income statement.
24
| | Notes on the Parent Company and Consolidated Quarterly Information (ITR) September 30, 2020 (In thousands of Brazilian Reais - R$, except when otherwise indicated) |
In addition, subject to future events, the Company will be entitled to additional payments and will benefit from credits with a present value of around R$1.9 billion to be invested in the acquisition of new aircraft, which in turn will reduce its costs with future depreciation and financings, since such credits will affect the present values of assets and liabilities related to rights of use.
On October 6, 2020, the Federal Aviation Administration (FAA) published a preliminary report from the Flight Standardization Board (FSB) on the proposed training for Boeing 737 MAX’s pilots, in which the agency established only one of six procedural steps that will need to be completed before FAA grants the final approval for airlines to fly this aircraft again. The report includes recommendations from the Joint Operations Evaluation Board (JOEB), which recently met for nine days. JOEB included civil aviation authorities from the United States, Canada, Brazil and the European Union. On October 26, 2020, the European Aviation Safety Agency (EASA) confirmed that it is also close to granting its full clearance.
GOL expects to resume operations with MAX in December 2020.
| 1.4. | Corporate Structure |
The corporate structure of the Company and its subsidiaries, on September 30, 2020, is shown below:
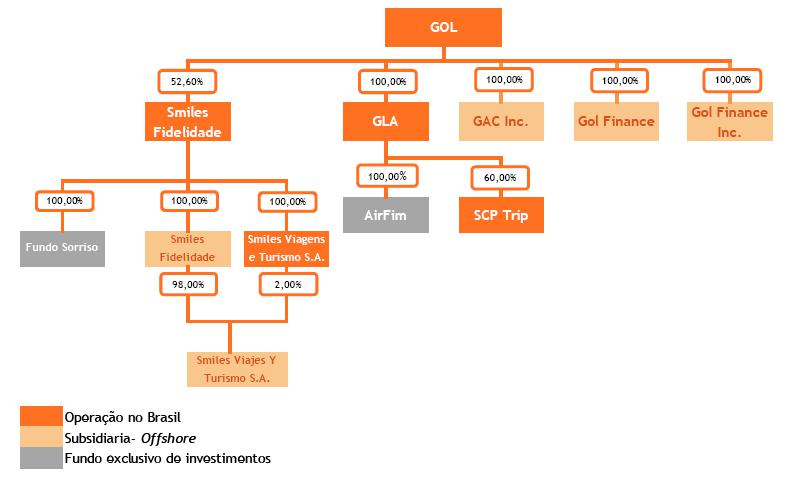
25
| | Notes on the Parent Company and Consolidated Quarterly Information (ITR) September 30, 2020 (In thousands of Brazilian Reais - R$, except when otherwise indicated) |
The Company’s equity interest in the capital of its subsidiaries, on September 30, 2020, is shown in the following table:
| Entity | Incorporation Date | Location | Main Activity | Type of Control | % of Interest in the Share Capital | |
| September 30, 2020 | December 31, 2019 | |||||
| GAC | March 23, 2006 | Cayman Islands | Aircraft acquisition | Direct | 100.00 | 100.00 |
| Gol Finance Inc. | March 16, 2006 | Cayman Islands | Fundraising | Direct | 100.00 | 100.00 |
| Gol Finance | June 21, 2013 | Luxembourg | Fundraising | Direct | 100.00 | 100.00 |
| GLA | April 9, 2007 | Brazil | Flight Transportation | Direct | 100.00 | 100.00 |
| AirFim | November 7, 2003 | Brazil | Investment fund | Indirect | 100.00 | 100.00 |
| Smiles Fidelidade | August 1, 2011 | Brazil | Frequent-Flyer Program | Direct | 52.60 | 52.61 |
| Smiles Viagens | August 10, 2017 | Brazil | Tourism Agency | Indirect | 52.60 | 52.61 |
| Smiles Fidelidade Argentina (a) | November 7, 2018 | Argentina | Frequent-Flyer Program | Indirect | 52.60 | 52.61 |
| Smiles Viagens Argentina (a) | November 20, 2018 | Argentina | Tourism Agency | Indirect | 52.60 | 52.61 |
| Fundo Sorriso | July 14, 2014 | Brazil | Investment fund | Indirect | 52.60 | 52.61 |
| Companies in Shareholding: | ||||||
| SCP Trip | April 27, 2012 | Brazil | On-Board Magazine | - | 60.00 | 60.00 |
(a) Companies with functional currency in Argentine pesos (ARS).
| 1.5. | Corporate Reorganization Plan |
On December 9, 2019 and February 4, 2020, through a Material Fact, the Company and its subsidiaries announced the corporate reorganization plans with the main purpose of ensuring the long-term competitiveness of the GOL group, by aligning the interests of all stakeholders, reinforcing a consolidated capital structure, simplifying the corporate governance of companies, reducing the operating, administrative and financial costs and expenses, and increasing the market liquidity for all GOL’s shareholders, through the incorporation of Smiles shares by GLA.
On March 13, 2020, through a Material Fact, the Company and its subsidiary Smiles announced that, due to the extraordinary events in the domestic and foreign markets resulting from the spread of COVID-19, especially due to its structural impacts in the aviation sector, it canceled the corporate restructuring proposal submitted on December 9, 2019 and February 4, 2020.
| 1.6. | Compliance Program |
Since 2016, the Company took several steps to strengthen and expand its internal control and compliance programs, detailed in the annual financial statements disclosed on February 28, 2020.
The Management is constantly reinforcing to its employees, customers, and suppliers its commitment to continue improving its internal control and compliance programs.
As previously disclosed in the financial statements for the year ended December 31, 2017, 2018, and 2019, the Company signed an agreement with the Brazilian Federal Public Ministry in December 2016 (“Agreement”), through which the Company agreed to pay R$12 million in fines and make improvements to its compliance program. In turn, the Federal Public Ministry agreed not to file any lawsuits related to activities under the Agreement. In addition, the Company paid R$4.2 million in fines to the Brazilian tax authorities.
The Company voluntarily informed the U.S. Department of Justice (“DOJ”), the Securities and Exchange Commission (“SEC”) and the Brazilian Securities and Exchange Commission (“CVM”) about the Agreement and the external independent investigation conducted by an independent committee of the Company. The investigation was completed in April 2017 and revealed that immaterial payments were made to politically exposed people. None of the Company’s current employees, representatives or members of the Board of Directors and Management was aware of any illegal purpose behind the transactions identified, or of any illegal benefit for the Company from the transactions under investigation.
26
| | Notes on the Parent Company and Consolidated Quarterly Information (ITR) September 30, 2020 (In thousands of Brazilian Reais - R$, except when otherwise indicated) |
The Company reported the conclusions of the investigation to the relevant authorities and will keep them informed of any future developments regarding this issue, as well as monitor the analyses already started by these bodies. These authorities may impose fines and possibly other sanctions to the Company.
There were no further developments on the subject during the nine-month period ended September 30, 2020.
| 2. | Message from the Management, base to Prepare and Present the Parent Company and Consolidated Quarterly Information (ITR) |
The Company’s Parent Company and Consolidated Quarterly Information (ITR) were prepared following accounting practices adopted in Brazil. The accounting practices adopted in Brazil include those in the Brazilian Corporation Law and in the technical pronouncements, guidelines and interpretations issued by the Accounting Pronouncements Committee (“CPC”), approved by the Federal Accounting Council (“CFC”) and the Brazilian Securities and Exchange Commission (“CVM”).
The Company’s consolidated quarterly information (ITR) was prepared in accordance with accounting practices adopted in Brazil and the International Financial Reporting Standards (“IFRS”) issued by the International Accounting Standards Board (“IASB”). The accounting practices adopted in Brazil include those in the Brazilian Corporation Law and in the technical pronouncements, guidelines and interpretations issued by the Accounting Pronouncements Committee (“CPC”), and approved by the Federal Accounting Council (“CFC”) and the Brazilian Securities and Exchange Commission (“CVM”).
The Company’s Parent Company and Consolidated Quarterly Information (ITR) was prepared using the Brazilian real (“R$”) as the functional and presentation currency. Figures are expressed in thousands of Brazilian reais, except when stated otherwise. The items disclosed in foreign currencies are duly identified, when applicable.
The preparation of the Parent Company and Consolidated Quarterly Information (ITR) requires the Management to make judgments, use estimates and adopt assumptions affecting the amounts presented of revenues, expenses, assets and liabilities. However, the uncertainty regarding these judgments, assumptions and estimates could give rise to results that require a significant adjustment of the book value of certain assets and liabilities in future reporting years.
The Company is continually reviewing its judgments, estimates, and assumptions.
When preparing this Parent Company and Consolidated Quarterly Information (ITR), the Management used disclosure criteria, considering regulatory aspects and the relevance of the transactions to understand the changes in the Company’s economic and financial position and its performance since the end of the fiscal year ended December 31, 2019, as well as the updates of relevant information included in the annual financial statements disclosed on February 28, 2020.
27
| | Notes on the Parent Company and Consolidated Quarterly Information (ITR) September 30, 2020 (In thousands of Brazilian Reais - R$, except when otherwise indicated) |
Management confirms that all material information in this Parent Company and Consolidated Quarterly Information (ITR) is being demonstrated and corresponds to the information used by Management in the development of its business management activities.
The Parent Company and Consolidated Quarterly Information (ITR) has been prepared based on historical cost, with the exception of the following material items recognized in the statements of financial position:
| · | short-term investments classified as cash and cash equivalents measured at fair value; |
| · | short-term investments mainly comprising exclusive investment funds, measured at fair value; |
| · | restricted cash measured at fair value; |
| · | derivative financial instruments measured at fair value; and |
| · | investments accounted for using the equity method. |
The Company’s Parent Company and Consolidated Quarterly Information (ITR) for the period ended September 30, 2020 has been prepared assuming that it will continue as going concern, realizing assets and settling liabilities in the normal course of business, as per Note 1.2.
28
| | Notes on the Parent Company and Consolidated Quarterly Information (ITR) September 30, 2020 (In thousands of Brazilian Reais - R$, except when otherwise indicated) |
| 3. | Approval of the Parent Company and Consolidated Financial Statements |
This Parent Company and Consolidated Quarterly Information (ITR) was authorized by the Board of Directors on July 29, 2020.
| 4. | Summary of Significant Accounting Practices |
The Parent Company and Consolidated Quarterly Information (ITR) presented herein was prepared based on policies, accounting practices and estimate calculation methods adopted and presented in detail in the annual financial statements for the year ended December 31, 2019, released on February 28, 2020.
| 4.1. | New Accounting Standards and Pronouncements Adopted in the Period |
On July 7, 2020, CVM, by means of Resolution 859, approved the Technical Pronouncements Review Document 16, referring to technical pronouncement CPC 06 (R2) - “Leases”, referring to Benefits Related to COVID-19 Granted to Leaseholders in Lease Contracts. For further details, see Note 19.
| 4.2. | New Accounting Standards and Pronouncements not yet Adopted |
According to the Management, there are no other standards and interpretations issued and not yet adopted that may have a significant impact on the income (expenses) or shareholders’ equity disclosed by the Company.
| 4.3. | Foreign Currency Transactions |
Foreign currency transactions are recorded at the exchange rate change prevailing on the date on which the transactions take place. Monetary assets and liabilities designated in foreign currency are calculated based on the exchange rate change on the balance sheet date. Any difference resulting from the translation of currencies is recorded under the item “Exchange rate change, net” in the income statement for the period.
The main exchange rates in reais in effect on the base date of this Parent Company and Consolidated Quarterly Information (ITR) are as follows:
| Final Rate | Average Rate | |||
| September 30, 2020 | December 31, 2019 | September 30, 2020 | December 31, 2019 | |
| U.S. Dollar | 5.6407 | 4.0307 | 5.38419 | 4.1102 |
| Argentinian Peso | 0.0740 | 0.0673 | 0.07161 | 0.0686 |
| 5. | Seasonality |
Under normal economic and social conditions, the Company expects revenues and operating income (expense) from its flights to be at their highest levels in the summer and winter months of January and July, respectively, and during the last weeks of December and in the year-end holiday period. Given the high proportion of fixed costs, this seasonality tends to drive changes in operating income (expense) across the fiscal-year quarters.
29
| | Notes on the Parent Company and Consolidated Quarterly Information (ITR) September 30, 2020 (In thousands of Brazilian Reais - R$, except when otherwise indicated) |
| 6. | Cash and Cash Equivalents |
| Parent Company | Consolidated | |||
| September 30, 2020 | December 31, 2019 | September 30, 2020 | December 31, 2019 | |
| Cash and Bank Deposits | 4,329 | 488 | 40,394 | 418,447 |
| Cash Equivalents | 2,299 | 1,016,258 | 458,360 | 1,226,978 |
| Total | 6,628 | 1,016,746 | 498,754 | 1,645,425 |
The breakdown of cash equivalents is as follows:
| Parent Company | Consolidated | ||||
| Weighted Average Profitability (p.a.) | September 30, 2020 | December 31, 2019 | September 30, 2020 | December 31, 2019 | |
| Domestic Currency | |||||
| Private Bonds | 90.5% of CDI | 7 | 366,338 | 432,078 | 514,356 |
| Automatic Investments | 23.8% of CDI | 2,292 | - | 26,282 | 5,505 |
| Total Domestic Currency | 2,299 | 366,338 | 458,360 | 519,861 | |
| Foreign Currency | |||||
| Private Bonds | 2.0% | - | 649,920 | - | 707,117 |
| Total Foreign Currency | - | 649,920 | - | 707,117 | |
| Total | 2,299 | 1,016,258 | 458,360 | 1,226,978 | |
| 7. | Financial Investments |
| Parent Company | Consolidated | ||||
| Weighted Average Profitability (p.a.) | September 30, 2020 | December 31, 2019 | September 30, 2020 | December 31, 2019 | |
| Domestic Currency | |||||
| Government Bonds (*) | -27.4% of CDI | - | - | 11,371 | 56,532 |
| Investment Funds | 71.9% of CDI | 205 | 673 | 384,596 | 862,868 |
| Total Domestic Currency | 205 | 673 | 395,967 | 919,400 | |
| Foreign Currency | |||||
| Private Bonds | 3.00% | - | - | 2,920 | 1,713 |
| Government Bonds | 1.80% | - | - | - | 29,684 |
| Investment Funds | 1.80% | - | - | 737 | 2,965 |
| Total Foreign Currency | - | - | 3,657 | 34,362 | |
| Total | 205 | 673 | 399,624 | 953,762 | |
(*) See Note 1.1.6 (b).
30
| | Notes on the Parent Company and Consolidated Quarterly Information (ITR) September 30, 2020 (In thousands of Brazilian Reais - R$, except when otherwise indicated) |
| 8. | Restricted Cash |
| Parent Company | Consolidated | ||||
Weighted Average Profitability (p.a.) | September 30, 2020 | December 31, 2019 | September 30, 2020 | December 31, 2019 | |
| Domestic Currency | |||||
| Import financing | 96.6% of CDI | - | 2,428 | 139,834 | 116,932 |
| Letter of Guarantee - Legal Proceedings | 96.1% of CDI | 4,145 | 3,971 | 81,540 | 115,995 |
| Letter of Credit – Maintenance Deposit | 98.0% of CDI | - | - | 143,670 | 136,438 |
| Working Capital | 99.8% of CDI | - | - | 26,693 | 510 |
| Hedge Margin | 100.0% of CDI | - | - | 4,926 | - |
| Total Domestic Currency | 4,145 | 6,399 | 396,663 | 369,875 | |
| Foreign Currency | |||||
| Financing with Ex-lm Bank Collateral | 0.2% | - | - | 33,856 | - |
| Hedge Margin | 0.1% | - | - | 122,537 | 74,431 |
| Total Foreign Currency | - | - | 156,393 | 74,431 | |
| Total | 4,145 | 6,399 | 553,056 | 444,306 | |
| Current | 4,145 | 6,399 | 372,668 | 304,920 | |
| Noncurrent | - | - | 180,388 | 139,386 | |
| 9. | Trade Receivables |
| Consolidated | ||
| September 30, 2020 | December 31, 2019 | |
| Domestic Currency | ||
| Credit Card Administrators | 359,646 | 740,967 |
| Travel Agencies | 299,011 | 253,494 |
| Cargo Agencies | 25,385 | 33,677 |
| Airline Partner Companies | 6,523 | 291 |
| Others | 2,779 | 15,690 |
| Total Domestic Currency | 693,344 | 1,044,119 |
| Foreign Currency | ||
| Credit Card Administrators | 91,906 | 121,844 |
| Travel Agencies | 13,275 | 36,845 |
| Cargo Agencies | 214 | 1,384 |
| Airline Partner Companies | 448 | 30,740 |
| Others | 9,274 | 11,550 |
| Total Foreign Currency | 115,117 | 202,363 |
| Total | 808,461 | 1,246,482 |
| Estimated Losses from Doubtful Accounts | (17,550) | (16,952) |
| Total Trade Receivables | 790,911 | 1,229,530 |
31
| | Notes on the Parent Company and Consolidated Quarterly Information (ITR) September 30, 2020 (In thousands of Brazilian Reais - R$, except when otherwise indicated) |
The aging list of trade receivables, net of allowance for expected loss on trade receivables accounts, is as follows:
| Consolidated | ||
| September 30, 2020 | December 31, 2019 | |
| To be Due | ||
| Until 30 days | 489,194 | 567,567 |
| From 31 to 60 days | 99,665 | 213,334 |
| From 61 to 90 days | 32,639 | 100,478 |
| From 91 to 180 days | 84,896 | 187,883 |
| From 181 to 360 days | 38,440 | 76,902 |
| Above 360 days | 282 | 1,499 |
| Total to be Due | 745,116 | 1,147,663 |
| Overdue | ||
| Until 30 days | 4,065 | 47,959 |
| From 31 to 60 days | 2,669 | 23,290 |
| From 61 to 90 days | 28,392 | 3,986 |
| From 91 to 180 days | 4,828 | 3,009 |
| From 181 to 360 days | 2,610 | 421 |
| Above 360 days | 3,231 | 3,202 |
| Total Overdue | 45,795 | 81,867 |
| Total | 790,911 | 1,229,530 |
The changes in the expected loss on trade receivables are as follows:
| Consolidated | ||
| September 30, 2020 | December 31, 2019 | |
| Balance at the Start of the Year | (16,952) | (11,284) |
| (Additions) and Exclusions | (598) | (13,499) |
| Unrecoverable Amounts | - | 7,831 |
| Balance at the End of the Year | (17,550) | (16,952) |
| 10. | Inventories |
| Consolidated | ||
| September 30, 2020 | December 31, 2019 | |
| Consumables | 20,048 | 14,274 |
| Parts and Maintenance Materials | 179,669 | 184,939 |
| Total | 199,717 | 199,213 |
The changes in the provision for obsolescence are as follows:
| Consolidated | ||
| September 30, 2020 | December 31, 2019 | |
| Balances at the Start of the Year | (14,302) | (12,808) |
| Additions | (608) | (2,168) |
| Write-Offs | 973 | 674 |
| Balances at the End of the Year | (13,937) | (14,302) |
32
| | Notes on the Parent Company and Consolidated Quarterly Information (ITR) September 30, 2020 (In thousands of Brazilian Reais - R$, except when otherwise indicated) |
| 11. | Taxes to Recover |
| Parent Company | Consolidated | |||
| September 30, 2020 | December 31, 2019 | September 30, 2020 | December 31, 2019 | |
| Prepaid Income Tax and Social Contribution to Recover | 20,622 | 27,552 | 152,710 | 195,864 |
| Withholding Income Tax | 49 | - | 2,629 | 3,969 |
| PIS and COFINS to Recover(*) | - | - | 384,249 | 273,152 |
| Value Added Tax (VAT), Abroad | - | - | 10,593 | 4,650 |
| Others | 60 | 60 | 12,363 | 6,181 |
| Total | 20,731 | 27,612 | 562,544 | 483,816 |
| Current | 8,852 | 5,163 | 240,372 | 309,674 |
| Noncurrent | 11,879 | 22,449 | 322,172 | 174,142 |
(*) During the period ended September 30, 2020, the subsidiary GLA recorded PIS and COFINS extemporaneous tax credits, in the total amount of R$126,675.
33
| | Notes on the Parent Company and Consolidated Quarterly Information (ITR) September 30, 2020 (In thousands of Brazilian Reais - R$, except when otherwise indicated) |
| 12. | Deferred Taxes |
| 12.1. | Deferred Tax Assets (Liabilities) |
The positions of deferred assets and liabilities are presented below and comply with the enforceable offset legal rights that consider taxes levied by the same tax authority under the same tax entity.
| Parent Company | Consolidated | ||||||
| December 31, 2019 | Income (Expenses) | September 30, 2020 | December 31, 2019 | Income (Expenses) | Exchange Rate Change(*) | September 30, 2020 | |
| Deferred Assets | |||||||
| Tax Losses | 39,890 | (748) | 39,142 | 42,795 | (3,965) | 256 | 39,086 |
| Negative Basis of Social Contribution | 14,360 | (269) | 14,091 | 14,360 | (269) | - | 14,091 |
| Temporary Differences: | |||||||
| Provision for Losses on Other Credits | 1,957 | 2,710 | 4,667 | 1,958 | 2,709 | - | 4,667 |
| Provision for Legal Proceedings and Tax Liabilities | 696 | (778) | (82) | 696 | (778) | - | (82) |
| Total Income Tax and Social Contribution Deferred - Assets | 56,903 | 915 | 57,818 | 59,809 | (2,303) | 256 | 57,762 |
| Deferred Liabilities | |||||||
| Temporary Differences: | |||||||
| Provision for Doubtful Accounts | - | - | - | 17,035 | 48,534 | - | 65,569 |
| Breakage Provision | - | - | - | (196,206) | 7,406 | - | (188,800) |
| Provision for Losses on Other Credits | - | - | - | 183,053 | (25,179) | - | 157,874 |
| Provision for Legal Proceedings and Tax Liabilities | - | - | - | 91,051 | 23,091 | - | 114,142 |
| Aircraft Return | - | - | - | 146,239 | 53,829 | - | 200,068 |
| Derivative Transactions | - | - | - | (42,154) | 11,674 | - | (30,480) |
| Flight Rights | - | - | - | (353,226) | - | - | (353,226) |
| Depreciation of Engines and Parts for Aircraft Maintenance | - | - | - | (183,977) | (8,673) | - | (192,650) |
| Reversal of Goodwill Amortization for Tax Purposes | - | - | - | (127,659) | - | - | (127,659) |
| Aircraft Leases and Others | - | - | - | 64,379 | (57,648) | - | 6,731 |
| Others | - | - | - | 89,313 | (26,953) | 58 | 62,418 |
| Unrealized Profits | - | - | - | 68,111 | (719) | - | 67,392 |
| Total Income Tax and Social Contribution Deferred - Liabilities | - | - | - | (244,041) | 25,362 | 58 | (218,621) |
| Total Effect of Deferred Taxes in the Income (Expenses) | - | 915 | - | - | 23,059 | - | - |
(*) Exchange rate change recognized in other comprehensive income.
34
| | Notes on the Parent Company and Consolidated Quarterly Information (ITR) September 30, 2020 (In thousands of Brazilian Reais - R$, except when otherwise indicated) |
The Company’s Management considers that the deferred assets and liabilities recognized on September 30, 2020 arising from temporary differences will be realized in proportion to realization of their bases and the expectation of future results.
The Management estimates that active deferred tax credits, recorded on tax losses and a negative social contribution base, may be realized as follows:
| Year | Amount |
| 2020 | 4,163 |
| 2022 | 4,630 |
| 2023 | 14,528 |
| 2024 | 12,144 |
| 2025 to 2029 | 17,768 |
| Total | 53,233 |
The direct subsidiary GLA has tax losses and negative bases of social contribution in the determination of taxable profit, to be offset against 30% of future annual tax profits, with no prescription period, not recorded in the balance sheet, in the following amounts:
| GLA | ||
| September 30, 2020 | December 31, 2019 | |
| Income Tax Loss | 8,411,890 | 5,017,227 |
| Negative Basis of Social Contribution | 8,411,890 | 5,017,227 |
| Potential Tax Credit | 2,860,042 | 1,705,857 |
The reconciliation of effective income taxes and social contribution rates for the periods ended September 30, 2020 and 2019 is as follows:
| Parent Company | ||||
| Three-month period ended on | Nine-month period ended on | |||
| September 30, 2020 | September 30, 2019 | September 30, 2020 | September 30, 2019 | |
| Loss before Income Tax and Social Contribution | (1,724,568) | (241,567) | (6,003,511) | (492,767) |
| Combined Nominal Tax Rate | 34% | 34% | 34% | 34% |
| Income Tax and Social Contribution by the Combined Tax Rate | 586,353 | 82,133 | 2,041,194 | 167,541 |
| Adjustments to Calculate the Actual Tax Rate: | ||||
| Equity Income (Loss) | (531,808) | (82,124) | (1,820,596) | (38,269) |
| Tax Rate Difference of the Income (Expenses) of Subsidiaries | (12,797) | 60,899 | 57,117 | (75,159) |
| Nondeductible Expenses, Net | (210) | (85) | (618) | (187) |
| Exchange Rate Change on Foreign Investments | (36,740) | (61,308) | (278,538) | (53,393) |
| Interest on Shareholders’ Equity | - | - | - | (3,114) |
| Benefit Constituted on Tax Losses, Negative Basis and Temporary Differences | - | - | - | 26,366 |
| Total Income Tax and Social Contribution | 4,798 | (485) | (1,441) | 23,785 |
| Income Tax and Social Contribution | ||||
| Current | 722 | (238) | (2,356) | (1,633) |
| Deferred | 4,076 | (247) | 915 | 25,418 |
| Total Income Tax and Social Contribution | 4,798 | (485) | (1,441) | 23,785 |
35
| | Notes on the Parent Company and Consolidated Quarterly Information (ITR) September 30, 2020 (In thousands of Brazilian Reais - R$, except when otherwise indicated) |
| Consolidated | ||||
| Three-month period ended on | Nine-month period ended on | |||
| September 30, 2020 | September 30, 2019 | September 30, 2020 | September 30, 2019 | |
| Loss before Income Tax and Social Contribution | (1,687,555) | (177,477) | (5,899,728) | (171,588) |
| Combined Nominal Tax Rate | 34% | 34% | 34% | 34% |
| Income Tax and Social Contribution by the Combined Tax Rate | 573,769 | 60,342 | 2,005,908 | 58,340 |
| Adjustments to Calculate the Actual Tax Rate: | ||||
| Equity Income (Loss) | - | - | - | 27 |
| Tax Rate Difference of the Income (Expenses) of Subsidiaries | 2,959 | 70,868 | 68,148 | (74,355) |
| Income tax on permanent differences and other | (45,236) | 19,366 | (40,236) | 51,821 |
| Exchange Rate Change on Foreign Investments | (45,743) | (83,077) | (224,697) | (114,188) |
| Overdue Tax Credit | - | - | - | 18,801 |
| Interest on Shareholders’ Equity | - | - | - | 2,805 |
| Benefit Not Constituted on Tax Losses, Negative Basis and Temporary Differences | (494,119) | (61,142) | (1,864,010) | (28,401) |
| Total Income Tax and Social Contribution | (8,370) | 6,357 | (54,887) | (85,150) |
| Income Tax and Social Contribution | ||||
| Current | (42,093) | (49,560) | (77,946) | (125,203) |
| Deferred | 33,723 | 55,917 | 23,059 | 40,053 |
| Total Income Tax and Social Contribution | (8,370) | 6,357 | (54,887) | (85,150) |
| 13. | Advances to Suppliers and Third-Parties |
| Parent Company | Consolidated | |||
| September 30, 2020 | December 31, 2019 | September 30, 2020 | December 31, 2019 | |
| Oceanair Advance(*) | 225,629 | 161,228 | 257,115 | 192,715 |
| Advance to Domestic Suppliers | - | - | 221,831 | 95,596 |
| Advances to Foreign Suppliers | 52 | 37 | 38,229 | 25,316 |
| Advance for Materials and Repairs | - | - | 48,932 | 48,930 |
| Total | 225,681 | 161,265 | 566,107 | 362,557 |
| Adjustment to Present Value of Advance to Suppliers | - | - | - | (10,604) |
| Provision for Loss of Advance to Oceanair | (225,629) | (161,228) | (257,115) | (161,228) |
| Total Advances to Suppliers | 52 | 37 | 308,992 | 190,725 |
| Current | 52 | 37 | 277,222 | 142,338 |
| Noncurrent | - | - | 31,770 | 48,387 |
(*) increase due to the change of the US dollar.
| 14. | Deposits |
| Parent Company | Consolidated | |||
| September 30, 2020 | December 31, 2019 | September 30, 2020 | December 31, 2019 | |
| Court Deposits | 60,155 | 61,447 | 714,062 | 841,746 |
| Maintenance Deposits(*) | - | - | 1,172,445 | 830,282 |
| Deposit in Guarantee for Lease Agreements | 74,269 | 51,055 | 408,285 | 296,327 |
| Total | 134,424 | 112,502 | 2,294,792 | 1,968,355 |
(*) Advances made in US dollars, the change in the period is essentially due to the appreciation of the dollar against the real.
36
| | Notes on the Parent Company and Consolidated Quarterly Information (ITR) September 30, 2020 (In thousands of Brazilian Reais - R$, except when otherwise indicated) |
| 15. | Investments |
| 15.1. | Breakdown of Investments |
The investment information is shown below:
| Parent Company | Consolidated | |||
| GLA | Smiles Fidelidade | Trip | ||
| Material Information on Subsidiaries on September 30, 2020 | ||||
| Total Number of Shares | 5,262,335,049 | 124,158,953 | - | |
| Share Capital | 4,554,280 | 254,609 | 1,318 | |
| Interest % | 100.0% | 52.6% | 60.0% | |
| Shareholders’ Equity (Deficit) | (12,989,261) | 1,312,822 | 2,091 | |
| Unrealized Gains (a) | - | (130,819) | - | |
| Adjusted Shareholders’ Equity (b) | (12,989,261) | 559,747 | 1,254 | |
| Net Income (Expenses) for the Period | (5,411,922) | 106,134 | - | |
| Unrealized Gains for the Period (a) | - | 1,396 | - | |
| Adjusted Net Income (Expenses) for the Period (b) | (5,411,922) | 52,228 | - | |
(a) Corresponds to transactions involving revenue from the miles redeemed for air tickets by participants of the Smiles Program, which, under the consolidated quarterly information, only take place when the program’s participants are actually transported by GLA.
(b) Adjusted shareholders’ equity and net income (expenses) for the adjusted period corresponds to the percentage of total equity and net income for unrealized profits.
| Parent Company | Consolidated | |||
| GLA | Smiles Fidelidade | Trip | ||
| Relevant Information of the Subsidiaries on December 31, 2019 | ||||
| Total Number of Shares | 5,262,335,049 | 124,158,953 | - | |
| Share Capital | 4,554,280 | 254,610 | 1,318 | |
| Interest % | 100.00% | 52.61% | 60.00% | |
| Shareholders’ Equity (Deficit) | (6,498,660) | 1,205,335 | 2,091 | |
| Unrealized Gains (a) | - | (132,215) | - | |
| Adjusted Shareholders’ Equity (b) | (6,498,660) | 501,986 | 1,254 | |
| Net Income (Expenses) for the Year | 215,027 | 626,725 | 129 | |
| Unrealized Gains for the Year (a) | - | (35,909) | - | |
| Adjusted Net Income (Expenses) for the Year (b) | 215,027 | 294,899 | 77 | |
| (a) | Corresponds to transactions involving revenue from the miles redeemed for air tickets by participants of the Smiles Program, which, under the consolidated quarterly information, only take place when the program’s participants are actually transported by GLA. |
| (b) | Adjusted shareholders’ equity and net income (expense) for the adjusted period corresponds to the percentage of total equity and net income for unrealized profits. |
| 15.2. | Changes in Investments |
| Parent Company | Consolidated | |||
| GLA | Smiles Fidelidade | Total | Trip | |
| Balances on December 31, 2019 | (6,498,660) | 501,986 | (5,996,674) | 1,254 |
| Equity Income (Expenses) | (5,411,922) | 57,228 | (5,354,964) | - |
| Unrealized Income (Expenses) on Hedge | (1,122,171) | - | (1,122,171) | - |
| Foreign Exchange Rate Change on Investment Conversion Abroad | - | (304) | (304) | - |
| Share-Based Compensation | 16,205 | 779 | 16,984 | - |
| Actuarial Losses from Post-Employment Benefits | 27,287 | - | 27,287 | - |
| Other Equity Changes in Investments | - | 58 | 58 | - |
| Balances on September 30, 2020 | (12,989,261) | 559,747 | (12,429,515) | 1,254 |
37
| | Notes on the Parent Company and Consolidated Quarterly Information (ITR) September 30, 2020 (In thousands of Brazilian Reais - R$, except when otherwise indicated) |
| 16. | Property, Plant & Equipment |
| 16.1. | Parent Company |
On September 30, 2020, the balance of Property, Plant & Equipment was R$5,298 in the subsidiary GAC (On December 31, 2019, the balance was of R$131,841, mainly related to advances for the acquisition of aircraft, which were returned by the manufacturer, as mentioned in Note 1.3).
Additionally, on September 30, 2020, there is no residual value of the ownership rights on aircraft in the subsidiary GAC (R$108,538 on December 31, 2019).
38
| | Notes on the Parent Company and Consolidated Quarterly Information (ITR) September 30, 2020 (In thousands of Brazilian Reais - R$, except when otherwise indicated) |
| 16.2. | Consolidated |
| Weighted Average Rate (p.a.) | December 31, 2019 | Additions | Write-Offs | Transfers | September 30, 2020 | |
| Flight Equipment | ||||||
| Cost | ||||||
| Aircraft - ROU(1) with Purchase Option (5) | 660,256 | - | (660,256) | - | - | |
| Aircraft - ROU with no Purchase Option | 3,561,980 | 535,950 | (151,540) | - | 3,946,390 | |
| Spare Parts and Engines - Own | 1,764,295 | 138,516 | (3,748) | (250) | 1,898,813 | |
| Spare Parts and Engines - ROU | 109,977 | (14,851) | (10,352) | - | 84,774 | |
| Aircraft and Engine Improvements | 3,084,023 | 385,512 | (112,009) | - | 3,357,526 | |
| Tools | 53,454 | 2,254 | (47) | 250 | 55,911 | |
| 9,233,985 | 1,047,381 | (937,952) | - | 9,343,414 | ||
| Depreciation | ||||||
| Aircraft - ROU with Purchase Option (5) | (226,433) | (2,935) | 229,368 | - | - | |
| Aircraft - ROU with no Purchase Option | 20.46% | (719,377) | (624,821) | 63,968 | - | (1,280,230) |
| Spare Parts and Engines - Own | 7.05% | (706,381) | (99,585) | 1,753 | - | (804,213) |
| Spare Parts and Engines - ROU | 25.53% | (26,745) | (24,539) | 9,079 | - | (42,205) |
| Aircraft and Engine Improvements | 48.98% | (1,717,552) | (612,178) | 111,767 | - | (2,217,963) |
| Tools | 10.00% | (24,712) | (3,139) | 27 | - | (27,824) |
| (3,421,200) | (1,367,197) | 415,962 | - | (4,372,435) | ||
| Total Net - Flight Equipment | 5,812,785 | (319,816) | (521,990) | - | 4,970,979 | |
| Property, Plant & Equipment in Use | ||||||
| Cost | ||||||
| Vehicles | 11,681 | 161 | (276) | - | 11,566 | |
| Machinery and Equipment | 63,091 | 792 | (544) | - | 63,339 | |
| Furniture and fixtures | 32,983 | 1,382 | (155) | - | 34,210 | |
| Computers and Peripherals - Own | 45,732 | 2,736 | (402) | - | 48,066 | |
| Computers and Peripherals – ROU | 21,992 | - | - | - | 21,992 | |
| Communication Equipment | 2,548 | 9 | (180) | - | 2,377 | |
| Security Equipment | 856 | - | (789) | - | 67 | |
| Third-Party Property Improvements - CMA (3) | 107,637 | - | - | - | 107,637 | |
| Third-Party Property Improvements | 71,174 | 335 | - | 3,226 | 74,735 | |
| Third-Party Properties - ROU | 22,354 | 5,471 | (70) | - | 27,755 | |
| Construction in Progress | 17,906 | 1,089 | - | (3,226) | 15,769 | |
| 397,954 | 11,975 | (2,416) | - | 407,513 | ||
| Depreciation | ||||||
| Vehicles | 20.00% | (9,291) | (477) | 145 | - | (9,623) |
| Machinery and Equipment | 10.00% | (45,437) | (3,109) | 485 | - | (48,061) |
| Furniture and Fixtures | 10.00% | (19,908) | (1,596) | 150 | - | (21,354) |
| Computers and Peripherals - Own | 20.00% | (33,190) | (2,818) | 397 | - | (35,611) |
| Computers and Peripherals – ROU | 36.13% | (7,682) | (5,934) | - | - | (13,616) |
| Communication Equipment | 10.00% | (2,081) | (90) | 164 | - | (2,007) |
| Security Equipment | 10.00% | (615) | (2) | 573 | - | (44) |
| Third-Party Property Improvements - CMA | 10.43% | (102,675) | (4,973) | - | - | (107,648) |
| Third-Party Property Improvements | 21.94% | (39,039) | (7,817) | - | - | (46,856) |
| Third-Party Properties - ROU | 32.18% | (7,156) | (6,267) | 71 | - | (13,352) |
| (267,074) | (33,083) | 1,985 | - | (298,172) | ||
| Total Net - Property, Plant & Equipment in Use | 130,880 | (21,108) | (431) | - | 109,341 | |
| Impairment Losses (2) | - | (41,719) | 5,536 | - | - | (36,183) |
| Total | 5,901,946 | (335,388) | (522,421) | - | 5,044,137 | |
| Advances to Suppliers(4) | - | 156,155 | 133,901 | (136,962) | - | 153,094 |
| Total Property, Plant & Equipment | 6,058,101 | (201,487) | (659,383) | - | 5,197,231 | |
(1) ROU - Right of Use
(2) Refers to provisions for impairment losses for rotable items (spare parts), classified under “Parts and spare engines", recorded by the Company in order to present its assets according to the actual capacity for the generation of expected future benefits.
(3) CMA - Maintenance Center - Confins/MG
(4) The write-off refers to PDP return, as mentioned in note 1.3.
(5) Write-off resulting from the sale-leaseback transaction.
39
| | Notes on the Parent Company and Consolidated Quarterly Information (ITR) September 30, 2020 (In thousands of Brazilian Reais - R$, except when otherwise indicated) |
| 17. | Intangible Assets |
The breakdown of and changes in intangible assets are as follows:
| Consolidated | |||||
| Weighted Average Rate (p.a.) | December 31, 2019 | Additions | Write-Offs | September 30, 2020 | |
| Cost | |||||
| Goodwill | - | 542,302 | - | - | 542,302 |
| Slots | - | 1,038,900 | - | - | 1,038,900 |
| Software | - | 579,370 | 47,910 | (68,319) | 558,961 |
| Others | - | 10,000 | - | - | 10,000 |
| Total Cost | 2,170,572 | 47,910 | (68,319) | 2,150,163 | |
| Amortization | |||||
| Software | 25.10% | (389,730) | (68,010) | 68,235 | (389,505) |
| Others | 20.00% | (4,167) | (1,500) | - | (5,667) |
| Total Amortization | (393,897) | (69,510) | 68,235 | (395,172) | |
| Intangible Assets, Net | 1,776,675 | (21,600) | (84) | 1,754,991 | |
40
| | Notes on the Parent Company and Consolidated Quarterly Information (ITR) September 30, 2020 (In thousands of Brazilian Reais - R$, except when otherwise indicated) |
| 18. | Loans and Financing |
The breakdown of and changes in short and long-term debt are as follows:
| Parent Company | |||||||||||||||
| December 31, 2019 | September 30, 2020 | ||||||||||||||
| Maturity | Interest Rate p.a. | Current | Noncurrent | Total | Funding | Unrealized Income (Expenses) on ESN | Principal Payment | Interest Incurred | Interest Paid | Exchange Rate Change | Amortization of Costs/Goodwill | Current | Noncurrent | Total | |
| In US$: | |||||||||||||||
| Term Loan B | 08/2020 | 6.50% | 1,229,600 | - | 1,229,600 | - | - | (1,641,390) | 65,382 | (97,632) | 437,942 | 6,098 | - | - | - |
| Guaranteed Funding | 12/2021 | 9.50% | - | - | - | 1,367,825 | - | (84,611) | 10,910 | (6,362) | 42,644 | - | 1,062,473 | 267,933 | 1,330,406 |
| Senior Notes IV | 01/2022 | 9.10% | 12,102 | 313,267 | 325,369 | - | - | (405,878) | 7,052 | (20,695) | 92,730 | 1,422 | - | - | - |
| ESN (1) | 07/2024 | 3.75% | 29,443 | 1,753,526 | 1,782,969 | - | (512,876) | - | 130,288 | (75,486) | 580,651 | (377) | 18,729 | 1,886,440 | 1,905,169 |
| Senior Notes VIII | 01/2025 | 7.00% | 75,587 | 2,548,472 | 2,624,059 | - | - | - | 171,023 | (215,506) | 1,043,455 | 6,417 | 39,551 | 3,589,897 | 3,629,448 |
| Perpetual Bonds | - | 8.75% | 12,815 | 620,328 | 633,143 | - | - | - | 51,166 | (50,161) | 251,895 | - | 17,934 | 868,109 | 886,043 |
| Total | 1,359,547 | 5,235,593 | 6,595,140 | 1,367,825 | (512,876) | (2,131,879) | 435,821 | (465,842) | 2,449,317 | 13,560 | 1,138,687 | 6,612,379 | 7,751,066 | ||
41
| | Notes on the Parent Company and Consolidated Quarterly Information (ITR) September 30, 2020 (In thousands of Brazilian Reais - R$, except when otherwise indicated) |
| Consolidated | |||||||||||||||
| December 31, 2019 | September 30, 2020 | ||||||||||||||
| Maturity | Effective Interest Rate (p.a.) | Current | Noncurrent | Total | Funding | Unrealized Income (Expenses) on ESN | Principal Payment | Interest Incurred | Interest Paid | Exchange Rate Change | Amortization of Costs/Goodwill | Current | Noncurrent | Total | |
| In R$: | |||||||||||||||
| Working Capital | 03/2021 | 6.48% | - | - | - | 624,377 | - | (314,479) | 14,239 | (11,947) | - | - | 312,190 | - | 312,190 |
| Debentures VII | 03/2022 | 3.41% (3) | 289,423 | 289,302 | 578,725 | - | - | - | 19,437 | (19,336) | - | 4,666 | 437,671 | 145,821 | 583,492 |
| In US$: | |||||||||||||||
| Term Loan B | 08/2020 | 6.50% | 1,229,600 | - | 1,229,600 | - | - | (1,641,390) | 65,382 | (97,632) | 437,942 | 6,098 | - | - | - |
| Import Financing | 01/2021 | 5.63% | 663,979 | - | 663,979 | 25,974 | - | (103,238) | 31,894 | (33,097) | 268,559 | - | 854,071 | - | 854,071 |
| Guaranteed Funding | 12/2021 | 9.50% | - | - | - | 1,367,825 | - | (84,611) | 10,910 | (6,362) | 42,644 | - | 1,062,473 | 267,933 | 1,330,406 |
| Senior Notes IV | 01/2022 | 9.10% | 12,102 | 313,267 | 325,369 | - | - | (405,878) | 7,052 | (20,695) | 92,730 | 1,422 | - | - | - |
| Financing with Ex-lm Bank Collateral | 12/2022 | 0.92% | 180,812 | 76,395 | 257,207 | 124,074 | - | (167,479) | 6,345 | (3,524) | 97,949 | 5,714 | 235,733 | 84,553 | 320,286 |
| ESN (1) | 07/2024 | 3.75% | 29,443 | 1,753,526 | 1,782,969 | - | (512,876) | - | 130,288 | (75,486) | 580,651 | (377) | 18,729 | 1,886,440 | 1,905,169 |
| Spare Engine Facility | 09/2024 | 2.56% | 17,551 | 201,084 | 218,635 | - | - | (11,853) | 7,217 | (7,644) | 87,627 | 211 | 74,070 | 220,123 | 294,193 |
| Senior Notes VIII | 01/2025 | 7.00% | 75,587 | 2,548,472 | 2,624,059 | - | - | - | 171,023 | (215,506) | 1,043,455 | 6,417 | 39,551 | 3,589,897 | 3,629,448 |
| Loan Facility | 03/2028 | 4.73% | 31,727 | 150,821 | 182,548 | 59,949 | - | (32,266) | 9,592 | (7,265) | 76,592 | 173 | 37,917 | 251,406 | 289,323 |
| Perpetual Notes(2) | - | 8.75% | 12,815 | 533,935 | 546,750 | - | - | - | 44,046 | (43,272) | 217,616 | - | 17,934 | 747,206 | 765,140 |
| Total | 2,543,039 | 5,866,802 | 8,409,841 | 2,202,199 | (512,876) | (2,761,194) | 517,425 | (541,766) | 2,945,765 | 24,324 | 3,090,339 | 7,193,379 | 10,283,718 | ||
| (1) | Exchangeable Senior Notes see Note 35.2. |
| (2) | Includes elimination of related parties in the amount of R$120,903. |
| (3) | During the 9 months ended on September 30, 2020, after Split there was division into three series: Series 1 with a CDI rate of 120%; Series 2 with CDI rate + 5.40% and Series 3 with CDI rate + 3.50%. |
42
| | Notes on the Parent Company and Consolidated Quarterly Information (ITR) September 30, 2020 (In thousands of Brazilian Reais - R$, except when otherwise indicated) |
The terms of the short and long-term debt contracted up to December 31, 2019 by the Company and its subsidiaries were disclosed in detail in the financial statements for the year ended December 31, 2019 and have not been affected by contractual alterations during the nine-month period ended on September 30, 2020, except as mentioned in this interim financial information.
Total consolidated debt included issuance costs of R$98,118 on September 30, 2020 (R$143,119 on December 31, 2019), which are amortized over the term of the related debt.
| 18.1. | New Loans and Financing During the Nine-Month Period Ended September 30, 2020 |
| 18.1.1. | Working Capital |
During the nine-month period ended September 30, 2020, the Company, through its subsidiary GLA, raised funds and renegotiated the due dates of this type of agreement, placing promissory notes as collateral for the transactions. These transactions have as purpose maintaining and managing the company's working capital. Information on such financing is presented below:
| Date - | Amount | Interest | Date - |
| Transaction | (R$ thousand) | Rate (p.a.) | Maturity |
New Funding | |||
| April 20, 2020 | 72,000 | 10.03% | July 20, 2020 |
| April 20, 2020 | 94,830 | 8.99% | August 18, 2020 |
| April 20, 2020 | 21,195 | 8.52% | July 20, 2020 |
| May 8, 2020 | 147,871 | CDI + 6.9% | August 7, 2020 |
| May 11, 2020 | 10,013 | 8.60% | August 10, 2020 |
| May 13, 2020 | 24,000 | 11.13% | March 12, 2021 |
| May 15, 2020 | 254,468 | CDI + 2.50% | November 9, 2020 |
| Total | 624.377 | ||
| Renegotiations | |||
| July 20, 2020 | 50,000 | 10.03% | December 1, 2020 |
| August 7, 2020 | 44,361 | CDI + 6.9% | November 5, 2020 |
| August 10, 2020 | 10,013 | 8.60% | September 30, 2020 |
| August 18, 2020 | 94,830 | 8.99% | September 30, 2020 |
| August 31, 2020 | 114,666 | CDI + 2.50% | March 15, 2021 |
| September 30, 2020 | 10,013 | 8.60% | December 15, 2020 |
| September 30, 2020 | 94,830 | 8.99% | December 15, 2020 |
| Total | 418.713 |
| 18.1.2. | Import Financing |
During the nine-month period ended September 30, 2020, the Company, through its subsidiary GLA, raised funds and renegotiated the due dates of this type of agreement, placing promissory notes as collateral for the transactions. Which are part of a credit line maintained by GLA for engine maintenance, import financing in order to purchase spare parts and aircraft equipment. Information on such financing is presented below:
43
| | Notes on the Parent Company and Consolidated Quarterly Information (ITR) September 30, 2020 (In thousands of Brazilian Reais - R$, except when otherwise indicated) |
| Date - | Amount | Interest | Date - | |
| Transaction | (US$ thousand) | (R$ thousand) | Rate (p.a.) | Maturity |
| New Funding | ||||
| February 19, 2020 | 5,920 | 25,974 | 4.07% | February 13, 2021 |
| Renegotiations | ||||
| January 2, 2020 | 4,335 | 17,431 | 5.79% | June 30, 2020 |
| January 14, 2020 | 4,571 | 18,943 | 6.22% | May 13, 2020 |
| January 17, 2020 | 6,455 | 27,005 | 5.71% | July 15, 2020 |
| January 21, 2020 | 8,595 | 36,112 | 6.22% | May 20, 2020 |
| January 24, 2020 | 4,815 | 20,112 | 4.17% | January 15, 2021 |
| January 31, 2020 | 5,925 | 25,296 | 5.63% | July 29, 2020 |
| February 14, 2020 | 7,069 | 30,512 | 5.59% | August 12, 2020 |
| February 21, 2020 | 6,531 | 28,688 | 5.56% | August 19, 2020 |
| April 22, 2020 | 5,407 | 29,611 | 8.60% | August 20, 2020 |
| April 22, 2020 | 7,711 | 42,225 | 5.65% | October 19, 2020 |
| April 22, 2020 | 6,053 | 33,144 | 5.65% | October 19, 2020 |
| April 24, 2020 | 9,347 | 51,184 | 8.52% | August 24, 2020 |
| May 13, 2020 | 4,571 | 25,030 | 7.93% | September 10, 2020 |
| May 20, 2020 | 5,148 | 28,192 | 7.87% | September 17, 2020 |
| May 29, 2020 | 7,195 | 39,402 | 5.12% | November 25, 2020 |
| June 8, 2020 | 9,638 | 52,778 | 4.95% | November 5, 2020 |
| June 8, 2020 | 7,823 | 42,837 | 4.29% | October 6, 2020 |
| June 8, 2020 | 10,436 | 57,150 | 4.95% | November 5, 2020 |
| June 8, 2020 | 6,990 | 38,277 | 4.29% | October 6, 2020 |
| June 8, 2020 | 7,045 | 38,579 | 4.95% | November 5, 2020 |
| June 15, 2020 | 735 | 4,024 | 6.45% | December 14, 2020 |
| June 16, 2020 | 10,400 | 56,950 | 4.29% | October 14, 2020 |
| June 30, 2020 | 4,335 | 23,737 | 4.92% | December 29, 2020 |
| July 15, 2020 | 6,455 | 28,688 | 4.87% | January 11, 2021 |
| July 29, 2020 | 5,925 | 28,688 | 4.85% | January 25, 2021 |
| August 12, 2020 | 7,069 | 28,688 | 4.32% | September 25, 2020 |
| August 14, 2020 | 3,396 | 19,156 | 3.84% | January 8, 2021 |
| August 18, 2020 | 5,920 | 33,393 | 4.06% | February 12, 2021 |
| August 19, 2020 | 6,531 | 28,688 | 4.30% | October 2, 2020 |
| August 20, 2020 | 5,407 | 30,499 | 7.75% | December 18, 2020 |
| August 24, 2020 | 9,347 | 52,724 | 7.76% | December 22, 2020 |
| September 10, 2020 | 4,571 | 25,784 | 7.75% | September 10, 2020 |
| September 17, 2020 | 5,148 | 29,038 | 7.75% | January 15, 2021 |
| September 25, 2020 | 7,069 | 28,688 | 4.35% | December 15, 2020 |
| Total | 217.968 | 1.101.253 | ||
| 18.1.3. | Financing with Ex-lm Bank Collateral |
In the nine-month period ended on September 30, 2020, the Company, through its subsidiary GLA, obtained funding as follows:
| Date - | Principal | Costs | Interest | Date - |
| Transaction | (R$ thousand) | (R$ thousand) | Rate (p.a.) | Maturity |
| June 23, 2020 | 129,263 | 5,189 | 9.05% | December 23, 2022 |
44
| | Notes on the Parent Company and Consolidated Quarterly Information (ITR) September 30, 2020 (In thousands of Brazilian Reais - R$, except when otherwise indicated) |
| 18.1.4. | Loan Facility |
In the nine-month period ended on September 30, 2020, the Company, through its subsidiary GLA, obtained funding with guarantee of the Company’s own engines. Information on such financing is presented below:
| Date - | Principal | Costs | Interest | Date - | ||
| Transaction | (US$ thousand) | (R$ thousand) | (US$ thousand) | (R$ thousand) | Rate (p.a.) | Maturity |
| March 20, 2020 | 12,000 | 60,847 | 177 | 898 | 4.16% p.a. | March 20, 2028 |
| 18.1.5. | Guaranteed Funding. |
In August 2020, the Company obtained a bilateral financing from Delta Airlines backed by Smiles shares and other assets totaling US$250 million, corresponding to R$1,367,825 on the funding date.
| Date - | Principal | Interest | Date - | |
| Transaction | (US$ thousand) | (R$ thousand) | Rate (p.a.) | Maturity |
| September 30, 2020 | 250,000 | 1,367,825 | 9.50% p.a. | December 30, 2021 |
| 18.1.6. | Loan and Financing - Noncurrent. |
On September 30, 2020, the maturities of loans and financing recorded in non-current liabilities are as follows:
| 2021 | 2022 | 2023 | 2024 | 2024 onwards | Without Maturity Date | Total | |
| Parent Company | |||||||
| In US$: | |||||||
| Guaranteed Funding | 267,933 | - | - | - | - | - | 267,933 |
| ESN | - | - | - | 1,886,440 | - | - | 1,886,440 |
| Senior Notes VIII | - | - | - | - | 3,589,897 | - | 3,589,897 |
| Perpetual Bonds | - | - | - | - | - | 868,109 | 868,109 |
| Total | 267,933 | - | - | 1,886,440 | 3,589,897 | 868,109 | 6,612,379 |
| Consolidated | |||||||
| In R$: | |||||||
| Debentures VII | - | 145,821 | - | - | - | - | 145,821 |
| In US$: | |||||||
| Financing with Ex-lm Bank Collateral | 29,852 | 54,701 | - | - | - | - | 84,553 |
| Spare Engine Facility | 6,262 | 25,049 | 25,049 | 163,763 | - | - | 220,123 |
| Guaranteed Funding | 267,933 | - | - | - | - | - | 267,933 |
| ESN | - | - | - | 1,886,440 | - | - | 1,886,440 |
| Senior Notes VIII | - | - | - | - | 3,589,897 | - | 3,589,897 |
| Loan Facility | 7,774 | 31,746 | 32,758 | 33,820 | 145,308 | - | 251,406 |
| Perpetual Bonds | - | - | - | - | - | 747,206 | 747,206 |
| Total | 311,821 | 257,317 | 57,807 | 2,084,023 | 3,735,205 | 747,206 | 7,193,379 |
45
| | Notes on the Parent Company and Consolidated Quarterly Information (ITR) September 30, 2020 (In thousands of Brazilian Reais - R$, except when otherwise indicated) |
The fair value of debt on September 30, 2020 is as follows:
| Parent Company | Consolidated | |||
| Accounting (*) | Fair Value | Accounting (*) | Fair Value | |
| ESN | 1,905,169 | 1,517,040 | 1,905,169 | 1,517,040 |
| Perpetual Notes and Other Senior Notes | 4,515,491 | 3,178,845 | 4,394,588 | 3,111,809 |
| Term Loan | 1,330,406 | 1,331,820 | 1,330,406 | 1,331,820 |
| Debentures | - | - | 583,492 | 591,666 |
| Other Existing Loans | - | - | 2,070,063 | 2,070,063 |
| Total | 7,751,066 | 6,027,705 | 10,283,718 | 8,622,398 |
(*) Net Total of Funding Costs.
| 18.2. | Covenants |
The Company has covenants in Guaranteed financing and in Debentures VII.
Within the scope of guaranteed financing, the Company has the observance of complying with specific guarantee conditions in the bilateral contract with Delta Airlines. On September 30, 2020, the Company had Smiles shares and other assets placed in guarantee by GLAI regarding this agreement, which meet the covenants.
In Debentures VII, the obligation to measure such indicators is semiannual, being that:
On March 31, 2020, the Debenture Holders’ Meeting was held, where it was decided to suspend the effects of automatic early maturity, given the failure to pay the unit face value of the debentures referring to the installment due on March 28, 2020. At that Meeting, it was decided to extend the debentures’ principal amortization liabilities by 10 days.
On April 9, 2020, the Debenture Holders’ Meeting decided to postpone the amortization of debentures totaling R$148 million, originally scheduled to occur on March 28, 2020 and thus postponed to March 28, 2022. On this date, the Meeting also granted a waiver regarding the non-compliance with the financial rates and limits set for the fiscal year of 2020, which would be measured on June 30 and December 31, 2020. The current readings will remain in force in the fiscal year of 2021.
On September 25, 2020, the Debenture Holders’ Meeting decided to postpone the amortization of debentures totaling R$148 million, originally scheduled to occur on September 28, 2020 and thus postponed to March 28, 2021.
46
| | Notes on the Parent Company and Consolidated Quarterly Information (ITR) September 30, 2020 (In thousands of Brazilian Reais - R$, except when otherwise indicated) |
| 19. | Leases to Pay |
| Consolidated | ||||||||||||||||
| December 31, 2019 | September 30, 2020 | |||||||||||||||
| Weighted Average Rate (p.a.) | Current | Noncurrent | Total | Additions | Write-Offs | Provision | Contractual Amendment | Payments | Deposit in Guarantee | Interest Incurred | Payment of Interest | Exchange Rate Change | Current | Noncurrent | Total | |
| In R$: | ||||||||||||||||
| Leases without Purchase Option | 13.10% | 21,781 | 23,026 | 44,807 | 5,189 | - | - | 281 | (12,987) | - | 10,096 | - | - | 30,025 | 17,361 | 47,386 |
| Total | 21,781 | 23,026 | 44,807 | 5,189 | - | - | 281 | (12,987) | - | 10,096 | - | - | 30,025 | 17,361 | 47,386 | |
| In US$: | ||||||||||||||||
| Leases with Purchase Option | 3.75% | 128,936 | 419,894 | 548,830 | - | (618,487) | - | - | (26,049) | - | 4,592 | (4,592) | 95,706 | - | - | - |
| Leases without Purchase Option | 11.46% | 1,253,995 | 4,205,148 | 5,459,143 | 596,406 | (2,138) | 29,225 | (115,692) | (745,398) | (18,920) | 519,201 | - | 2,214,171 | 2,217,733 | 5,718,265 | 7,935,998 |
| Total | 1,382,931 | 4,625,042 | 6,007,973 | 596,406 | (620,625) | 29,225 | (115,692) | (771,447) | (18,920) | 523,793 | (4,592) | 2,309,877 | 2,217,733 | 5,718,265 | 7,935,998 | |
| Total Leases | 1,404,712 | 4,648,068 | 6,052,780 | 601,595 | (620,625) | 29,225 | (115,411) | (784,434) | (18,920) | 533,889 | (4,592) | 2,309,877 | 2,247,758 | 5,735,626 | 7,983,384 | |
47
| | Notes on the Parent Company and Consolidated Quarterly Information (ITR) September 30, 2020 (In thousands of Brazilian Reais - R$, except when otherwise indicated) |
The future payments of financial lease agreements are detailed as follows:
| Without Purchase Option | With Purchase Option | ||
| September 30, 2020 | December 31, 2019 | December 31, 2019 | |
| 2020 | 1,316,455 | 1,691,357 | 148,613 |
| 2021 | 2,176,540 | 1,324,403 | 148,744 |
| 2022 | 1,952,772 | 1,125,060 | 207,654 |
| 2023 | 1,542,130 | 904,627 | 72,801 |
| 2024 onwards | 3,441,012 | 1,938,987 | 16,830 |
| Total Minimum Lease Payments | 10,401,909 | 6,984,434 | 594,642 |
| Less Total Interest | (2,418,525) | (1,480,484) | (45,812) |
| Present Value of Minimum Lease Payments | 7,983,384 | 5,503,950 | 548,830 |
| Less Current Portion | (2,247,758) | (1,275,776) | (128,936) |
| Noncurrent Portion | 5,735,626 | 4,228,174 | 419,894 |
On September 30, 2020, the Company concluded part of the renegotiations on its aircraft and operating engine lease agreements, with no purchase option, which led to contractual changes regarding the postponement of due dates and monthly payments compared to the original terms of the lease agreements. For renegotiated contracts that had their payments postponed until June 2021, the Company opted to not evaluate such changes as modifications to the lease contracts, as provided by the amendment to “Technical Pronouncement CPC 06 (R2) - Lease in due to a Benefit Granted in a Lease Agreement Related to Covid-19 for Lessee”. For other contracts, the Company recorded the update of these renegotiations, remeasuring the lease liability since the deferral of the installments will occur based on new payment flows, the discount rate and the exchange rate on the date of the contractual amendment, as provided for in the current regulations. The calculated accumulated effects were updated during the quarter ended on September 30, 2020 and were recorded as a reduction in the lease liability totaling R$179,759, with a corresponding entry to a reduction in fixed assets of R$171,098 and a result of R$8,482.
| 19.1. | Sale-Leaseback Transactions |
During the nine-month period ended on September 30, 2020, the Company recorded a net gain of R$594,587 (R$7,924 on September 30, 2019) in the consolidated results from the sale-leaseback transactions of 11 aircraft recognized recorded in the income statement under “Sale-leaseback transactions” in the group of other operating revenues and expenses, net see Note 31.
| 20. | Suppliers |
| Parent Company | Consolidated | |||
| September 30, 2020 | December 31, 2019 | September 30, 2020 | December 31, 2019 | |
| Domestic Currency | 15,162 | 15,952 | 1,001,373 | 833,781 |
| Foreign Currency | 19,435 | 3,164 | 677,903 | 462,636 |
| Total | 34,597 | 19,116 | 1,679,276 | 1,296,417 |
| Current | 34,597 | 19,116 | 1,634,527 | 1,286,275 |
| Noncurrent | - | - | 44,749 | 10,142 |
On September 30, 2020, the balance payable to related parties, recorded the consolidated under “suppliers”, was of R$2,735 (R$1,822 on December 31, 2019), and refers mainly to
48
| | Notes on the Parent Company and Consolidated Quarterly Information (ITR) September 30, 2020 (In thousands of Brazilian Reais - R$, except when otherwise indicated) |
transportation operations with Viação Piracicabana Ltda.
| 21. | Suppliers - Forfaiting |
The Company has operations that allow suppliers to receive their rights in advance from a financial institutions. On September 30, 2020, the amount recorded under current liabilities from forfaiting operations totaled R$52,120 (R$554,467 on December 31, 2019).
| 22. | Taxes to Collect |
| Parent Company | Consolidated | |||
| September 30, 2020 | December 31, 2019 | September 30, 2020 | December 31, 2019 | |
| PIS and COFINS | 1,223 | 2,278 | 14,709 | 39,133 |
| Installments | - | - | 43,820 | 2,117 |
| Income Tax on Salaries | 39 | 32 | 13,933 | 54,649 |
| ICMS | - | - | 152 | 424 |
| Income Tax and Social Contribution to Collect | - | 1,951 | 24,218 | 9,496 |
| Others | 10 | - | 8,855 | 10,788 |
| Total | 1,272 | 4,261 | 105,687 | 116,607 |
| Current | 1,272 | 4,261 | 71,151 | 116,523 |
| Noncurrent | - | - | 34,536 | 84 |
| 23. | Advance Ticket Sales |
On September 30, 2020, the balance of Advance from ticket sales classified in current liabilities was R$1,805,930 (R$1,966,148 on December 31, 2019) and is represented by 5,850,968 tickets sold and not yet used (6,239,179 on December 31, 2019) with an average use of 117 days (59 days on December 31, 2019).
As set forth by the regulators, travel bookings may be made within a period corresponding to 12 months, and, therefore, it was not necessary to reclassify any part of the obligations related to advance from tickets sales to non-current liabilities.
Balances of advance from ticket sales are shown net of breakage corresponding to R$349,027 on September 30, 2020 (R$415,688 on December 31, 2019).
| 24. | Frequent-Flyer Program |
| Consolidated | ||
| September 30, 2020 | December 31, 2019 | |
| Frequent-Flyer Program | 2,136,618 | 1,755,985 |
| Others | 5,527 | 1,764 |
| Breakage | (581,333) | (577,075) |
| Total | 1,560,612 | 1,180,674 |
| Current | 1,253,020 | 1,009,023 |
| Noncurrent | 307,592 | 171,651 |
The miles issued are initially recorded as deferred revenue, and as they are redeemed by members of the Smiles program, they are recognized in the income statement as revenue, net of direct costs associated with the products and services provided.
49
| | Notes on the Parent Company and Consolidated Quarterly Information (ITR) September 30, 2020 (In thousands of Brazilian Reais - R$, except when otherwise indicated) |
The breakage reflects the revenue recognized on the date that the member becomes the owner of the miles and represents the estimated miles issued for which redemption is not expected, i.e., miles that will expire without the expectation of use, as required by CPC 47, equivalent to IFRS 15.
| 25. | Provisions |
| Consolidated | ||||
| Provisions Post-Employment Benefit | Provisions for Aircraft and Engine Return | Legal Proceedings (a) | Total | |
| Balances on December 31, 2019 | 96,760 | 869,078 | 291,218 | 1,257,056 |
| Additional Provisions Recognized | 8,024 | 90,883 | 219,160 | 318,067 |
| Provisions Used | - | (49,465) | (149,449) | (198,914) |
| Changing of Assumptions | (27,287) | - | - | (27,287) |
| Present Value Adjustment | 4,974 | 54,233 | - | 59,207 |
| Exchange Rate Change | - | 333,691 | (42) | 333,649 |
| Balances on September 30, 2020 | 82,471 | 1,298,420 | 360,887 | 1,741,778 |
| On September 30, 2020 | ||||
| Current | - | 355,346 | - | 355,346 |
| Noncurrent | 82,471 | 943,074 | 360,887 | 1,386,432 |
| Total | 82,471 | 1,298,420 | 360,887 | 1,741,778 |
| On December 31, 2019 | ||||
| Current | - | 203,816 | - | 203,816 |
| Noncurrent | 96,760 | 665,262 | 291,218 | 1,053,240 |
| Total | 96,760 | 869,078 | 291,218 | 1,257,056 |
| (a) | The provisions used consider write-offs due to the revaluation of estimates and settled processes. |
| 25.1. | Provisions for Post-Employment Benefits |
The Company offers to its employees health care plans that, due to complying with current laws, generate obligations with post-employment benefits.
Due to the significant increase in the indicative rates for federal government bonds linked to inflation (NTN-B), with long maturities used, as determined by the applicable accounting standards, to define the discount rate used to calculate post-employment liabilities, generated a reduction in the obligation.
This significant change in the economic circumstance led to update the discount rate hypothesis and, consequently, the obligation and related accounting expense for the remainder of the fiscal year 2020.
The securities used to determine the discount rate assumption were those traded on June 22, 2020. In addition to the discount rate, the long-term inflation assumption was also updated consistent with the Central Bank inflation report. No updates were necessary for the other assumptions used in the calculation.
50
| | Notes on the Parent Company and Consolidated Quarterly Information (ITR) September 30, 2020 (In thousands of Brazilian Reais - R$, except when otherwise indicated) |
The changes in actuarial liabilities related to the post-employment benefit, prepared based on an actuarial report, are presented below:
| Consolidated | |||
| September 30, 2020 | December 31, 2019 | ||
| Actuarial Liabilities at the Start of the Year | 96,760 | 46,496 | |
| Current Service Cost Recognized in Income (Expenses) | 8,024 | 4,910 | |
| Cost of Interests Recognized in Income (Expenses) | 4,974 | 4,311 | |
| Sponsor Contributions | - | (2) | |
| Effect of Changing Financial Assumptions (reduction of the deduction rate) | (27,287) | 34,305 | |
| Effect of Plan’s Experience | - | 6,740 | |
| Actuarial Liabilities at the End of the Period | 82,471 | 96,760 | |
| Actuarial Assumptions | |||
| Weighted Average of Assumptions to Determine the Defined Benefit Obligation | |||
| Nominal Discount Rate p.a. | 7.49% | 7.23% | |
| Actual Discount Rate p.a. | 4.36% | 3.60% | |
| Long-Term Estimated Inflation Rate p.a. | 3.00% | 3.50% | |
| HCCTR - Nominal Medical Inflation Rate p.a. | 6.35% | 6.86% | |
| HCCTR - Actual Medical Inflation Rate p.a. | 3.25% | 3.25% | |
| Mortality Table | AT-2000 loosened by 10% | AT-2000 loosened by 10% | |
| Weighted Average of Assumptions to Determine the Cost (Revenue) of the Defined Benefit | |||
| Nominal Discount Rate | 7.23% | 9.93% | |
| Actual Discount Rate p.a. | 3.60% | 5.70% | |
| Long-Term Estimated Inflation Rate | 3.50% | 4.00% | |
| HCCTR - Nominal Medical Inflation Rate p.a. | 6.86% | 7.38% | |
| HCCTR - Actual Medical Inflation Rate p.a. | 3.25% | 3.25% | |
| Mortality Table | AT-2000 loosened by 10% | AT-2000 loosened by 10% | |
| Consolidated | |||
| September 30, 2020 | |||
| Current Service Cost Recognized in Income (Expenses) - 1st Half of 2020 | 6,005 | ||
| Current Service Cost to Recognize in Income (Expenses) - 2nd Half of 2020 | 4,037 | ||
| Cost of Interests Recognized in Income (Expenses) - 1st Half of 2020 | 3,495 | ||
| Cost of Interests to Recognize in Income (Expenses) - 2nd Half of 2020 | 2,958 | ||
| Total | 16,495 | ||
| 25.2. | Provisions for Aircraft and Engine Return |
Such provision considers the costs that meet the contractual conditions for the return of engines maintained under operating leases, as well as the costs to reconfigure aircraft when returned as described in the return conditions of the lease agreements. The consideration is capitalized in fixed assets, under the heading “Aircraft and Engines Overhauling”.
| 25.3. | Provision for Legal Proceedings |
On September 30, 2020, the Company and its subsidiaries are parties to lawsuits and administrative proceedings. Details on the relevant lawsuits were disclosed in the financial statements for the year ended December 31, 2019.
The Company's Management believes that the provision for tax, civil and labor risks, recorded in accordance with CPC 25 – “Provisions, Contingent Liabilities and Contingent Assets”, equivalent to IAS 37, is sufficient to cover possible losses on administrative and judicial
51
| | Notes on the Parent Company and Consolidated Quarterly Information (ITR) September 30, 2020 (In thousands of Brazilian Reais - R$, except when otherwise indicated) |
proceedings. The breakdown of the proceedings with probable and possible losses is presented below:
| Consolidated | ||||
| Probable Loss | Possible Loss | |||
| September 30, 2020 | December 31, 2019 | September 30, 2020 | December 31, 2019 | |
| Civil | 102,436 | 78,119 | 89,286 | 62,473 |
| Labor | 245,919 | 210,699 | 252,605 | 237,253 |
| Tax | 12,532 | 2,400 | 562,500 | 586,812 |
| Total | 360,887 | 291,218 | 904,391 | 886,538 |
| 26. | Shareholders’ Equity |
| 26.1. | Share Capital |
On September 30, 2020, the value of the capital stock was R$3,164,750, represented by 3,137,725,825 shares, of which 2,863,682,710 are common shares and 274,043,115 are preferred shares, being presented in the Balance Sheet and the statements of changes in equity, reduced by the costs of issuing shares in the amount of R$155,618 on September 30, 2020 and December 31, 2019.
The Company’s shares are held as follows:
| September 30, 2020 | December 31, 2019 | |||||
| Common Shares | Preferred Shares | Total | Common Shares | Preferred Shares | Total | |
| Fundo Volluto | 100.00% | - | 22.99% | 100.00% | - | 23.00% |
| Mobi FIA | - | 37.57% | 28.93% | - | 37.59% | 28.94% |
| Bank of America | - | 12,36% | 9,52% | - | - | - |
| AirFrance - KLM | - | 1.55% | 1.19% | - | 1.55% | 1.19% |
| Others | - | 1,91% | 1,48% | - | 2.23% | 1.73% |
| Market | - | 46,61% | 35,89% | - | 58.63% | 45.14% |
| Total | 100.00% | 100.00% | 100.00% | 100.00% | 100.00% | 100.00% |
The authorized share capital on September 30, 2020 is R$6 billion. Within the authorized limit, the Company can, once approved by the Board of Directors, increase its capital regardless of any amendment to its by-laws, by issuing shares, without necessarily maintaining the proportion between the different types of shares. Under the law terms, in case of capital increase within the authorized limit, the Board of Directors will define the issuance conditions, including pricing and payment terms.
| 26.2. | Treasury Shares |
On September 30, 2020, the Company had 1,824,034 treasury shares, totaling R$62,215 (3,006,390 shares totaling R$102,543 on December 31, 2019). On September 30, 2020, the average market value of treasury shares was R$17.05 (R$33.84 on December 31, 2019).
52
| | Notes on the Parent Company and Consolidated Quarterly Information (ITR) September 30, 2020 (In thousands of Brazilian Reais - R$, except when otherwise indicated) |
| 27. | Earnings (Loss) per Share |
The Company's earnings (loss) per share was determined as follows:
| Parent Company and Consolidated | ||||||
| Three-month period ended on | ||||||
| September 30, 2020 | September 30, 2019 | |||||
| Common Shares | Preferred Shares | Total | Common Shares | Preferred Shares | Total | |
| Numerator | ||||||
| Net Loss for the Period Attributed to Controlling Shareholders | (154,803) | (1,564,967) | (1,719,770) | (56,482) | (185,570) | (242,052) |
| Denominator | ||||||
| Weighted Average Number of Shares Outstanding (in thousands) | 947,619 | 70,052 | 2,863,683 | 151,165 | ||
Adjusted Weighted Average Number of Shares Outstanding and Conversions Presumed as Diluted (in thousands)
| 947,619 | 70,052 | 2,863,683 | 151,165 | ||
| Basic Loss per Share | (0.163) | (22.340) | (0.020) | (1.228) | ||
| Diluted Loss per Share | (0.163) | (22.340) | (0.020) | (1.228) | ||
| Parent Company and Consolidated | ||||||
| Nine-month period ended on | ||||||
| September 30, 2020 | September 30, 2019 | |||||
| Common Shares | Preferred Shares | Total | Common Shares | Preferred Shares | Total | |
| Numerator | ||||||
| Net Loss for the Period Attributed to Controlling Shareholders | (540,527) | (5,464,425) | (6,004,952) | (109,436) | (359,546) | (468,982) |
| Denominator | ||||||
| Weighted Average Number of Shares Outstanding (in thousands) | 947,619 | 273,711 | 2,863,683 | 268,814 | ||
Adjusted Weighted Average Number of Shares Outstanding and Conversions Presumed as Diluted (in thousands)
| 947,619 | 273,711 | 2,863,683 | 268,814 | ||
| Basic Loss per Share | (0.570) | (19.964) | (0.038) | (1.338) | ||
| Diluted Loss per Share | (0.570) | (19.964) | (0.038) | (1.338) | ||
Diluted earnings (loss) per share are calculated by adjusting the weighted average number of shares outstanding by instruments potentially convertible into shares. The Company has only one category of potentially dilutive shares (stock option), as described in note 28. However, due to the losses ascertained in the nine-month period ended on September 30, 2019 and the nine-month period ended on September 30, 2020, these instruments issued by the parent company have no dilutive effect and therefore were not included in the total quantity of outstanding shares to calculate diluted losses per share.
53
| | Notes on the Parent Company and Consolidated Quarterly Information (ITR) September 30, 2020 (In thousands of Brazilian Reais - R$, except when otherwise indicated) |
| 28. | Share-Based Compensation |
The conditions of the restricted share and share-based payment plans granted to the Company’s Executive Officers were disclosed in detail in the financial statements for the year ended December 31, 2019, and did not change during the period ended on September 30, 2020.
The movement of the stock options outstanding for in the period ended on September 30, 2020 is as follows:
| 28.1. | Stock Option - GOL |
Number of Stock Options | Average Price Weighted - Period | |
| Outstanding Shares on December 31, 2019 | 7,660,855 | 7.11 |
| Options Granted (*) | 655,437 | 20.57 |
| Options exercised | (156,134) | 4.31 |
| Options canceled and adjustments in estimated prescribed rights | 390,053 | 14.40 |
| Options Outstanding on September 30, 2020 | 8,550,211 | 12.95 |
| Number of Options Exercisable on: | ||
| December 31, 2019 | 5,939,631 | 8.42 |
| September 30, 2020 | 5,709,272 | 9.82 |
(*) Plan granted on April 30, 2020.
The expense recognized in income (expenses) for the fiscal year corresponding to the stock option plans for the nine-month period ended on September 30, 2020 was R$11,241 (R$32,042 for the nine-month period ended on September 30, 2019).
| 28.2. | Restricted Share Plan – GOL |
| Total Restricted Shares | |
| Restricted Shares Outstanding on December 31, 2019 | 1,533,996 |
| Shares Transferred (*) | (1,182,356) |
| Restricted Shares Cancelled and Adjustments in Estimated Expired Rights | 1,334,609 |
| Restricted Shares Transferable on September 30, 2020 | 1,686,249 |
(*) During the period ended on September 30, 2020, the Company transferred 1,182,356 shares via equity instruments (treasury shares).
The expense recognized in income (expenses) for the fiscal year corresponding to the stock option plans for the nine-month period ended on September 30, 2020 was R$4,964 (R$6,062 for the nine-month period ended on September 30, 2019).
| 28.3. | Stock Option Plan – Smiles Fidelidade |
During the period ended on September 30, 2020, the Company recognized R$1,793 in shareholders’ equity regarding the share-based compensation with a corresponding outflow in the income statement as personnel expenses (R$2,357 for the nine-month period ended on September 30, 2019).
Additionally, referenced in the Company’s shares, executives and employees are granted a complementary cash-settled bonus, as a way of strengthening their commitment and productivity with the incomes (expenses). On September 30, 2020, the balance of this obligation totaled R$1,881 (R$6,079 on December 31, 2019) recorded under “Salaries”, referenced to 119,784 equivalent Company’s shares. The same amount was recorded under
54
| | Notes on the Parent Company and Consolidated Quarterly Information (ITR) September 30, 2020 (In thousands of Brazilian Reais - R$, except when otherwise indicated) |
“Personnel” in the statement of operations (R$90,440 during the period ended on September 30, 2019) related to these bonuses.
| 29. | Transactions with Related Parties |
| 29.1. | Loan Agreements - Noncurrent Assets and Liabilities |
The parent company maintains assets and liabilities from loan agreements with its subsidiary GLA without interest, as shown in the table below:
| Assets | Liabilities | ||||||
| Creditor | Debtor | Type of Transaction | Interest Rate (p.a.) | September 30, 2020 | December 31, 2019 | September 30, 2020 | December 31, 2019 |
| GOL | GLA | Loan | 3,43% | 906,405 | 507,408 | - | 2,121 |
| GAC | GLA | Loan | (*) | 1,425,155 | 1,018,369 | 9,509 | 161,229 |
| Gol Finance | GLA | Loan | 4,63% | 2,818,565 | 1,914,924 | - | - |
| Total | 5,150,125 | 3,440,701 | 9,509 | 163,350 | |||
(*) According to the local legislation, the Company applies symbolic interest rates.
In addition to the values above, the following table shows the other balances between the Companies eliminated in the Consolidated:
| Balances | ||||||
| Creditor | Debtor | Type of Transaction | Maturity of the Agreements | Interest Rate (p.a.) | September 30, 2020 | December 31, 2019 |
| Gol Finance | GOL | Subscription Bonus(*) | 07/2024 | - | 602,350 | 602,350 |
| Gol Finance Inc. | GAC | Loan | 01/2023 | 8.64% | 1,247,703 | 1,267,594 |
| Gol Finance | GAC | Loan | 03/2025 | 4.19% | 1,410,788 | 1,061,747 |
| Gol Finance | Gol Finance Inc. | Loan | 04/2023 | 6.79% | 331,821 | 945,721 |
| Gol Finance Inc. | Gol Finance | Loan | 07/2020 | 11.70% | 1,959 | 196,298 |
| Smiles Fidelidade | GLA | Advance ticket purchases | 12/2032 | 3.74% | 1,179,319 | 970,899 |
| Smiles Fidelidade | GLA | Sale of Miles | 12/2032 | - | 3,117 | 32,271 |
| Smiles Fidelidade | GLA | Management Fees | 12/2032 | - | - | 1,300 |
| Smiles Fidelidade | GLA | Letter of Indemnity Agreement | - | - | 530 | 1,414 |
| GLA | Smiles Fidelidade | Shared Services | 12/2032 | - | 9,062 | 6,283 |
| GLA | Smiles Fidelidade | Onlending | 12/2032 | - | 13,984 | 23,540 |
| Smiles Fidelidade | Smiles Viagens | Dividends | - | - | 267 | 267 |
| GOL | Smiles Fidelidade | Dividends | - | - | 54,544 | 69,548 |
| Smiles Viagens | Smiles Fidelidade | Onlendings | - | - | 596 | 1,867 |
| Smiles Argentina | Smiles Fidelidade | Onlendings | - | - | 5,017 | 3,631 |
| Total | 4,861,057 | 5,184,730 | ||||
(*) The subsidiary Gol Finance, through Gol Equity Finance, acquired warrants issued by the Company in the context of the issue of Exchangeable Senior Notes.
| 29.2. | Transportation and Consulting Services |
In the course of its operations, the Company, by itself and through its subsidiaries, entered into agreements with the companies listed below:
| · | Expresso Caxiense S.A.: Provision of passenger transportation services in case of an interrupted flight, effective until March 9, 2023; and |
| · | Viação Piracicabana Ltda.: Provision of passenger, baggage, crew, and employee transportation services between airports, effective until September 30, 2021. |
55
| | Notes on the Parent Company and Consolidated Quarterly Information (ITR) September 30, 2020 (In thousands of Brazilian Reais - R$, except when otherwise indicated) |
On September 30, 2020, GLA recognized a total expense related to these services of R$5,097 (R$7,450 on September 30, 2019). On the same date, the balance payable to related companies, under “suppliers”, was of R$2,735 (R$1,822 on December 31, 2019), and refers mainly to transportation services with Viação Piracicabana Ltda.
| 29.3. | Contracts Account Opening UATP (“Universal Air Transportation Plan”) to Grant Credit Limit |
The subsidiary GLA entered into UATP account opening agreements with the related parties indicated below: Aller Participações S.A.; BR Mobilidade Baixada Santista S.A. SPE; Breda Transportes e Serviços S.A.; Comporte Participações S.A.; Empresa Cruz de Transportes Ltda.; Empresa de Ônibus Pássaro Marrom S.A.; Empresa Princesa do Norte S.A.; Expresso Itamarati S.A.; Expresso Maringá do Vale S.A.; Expresso União Ltda.; Glarus Serviços Tecnologia e Participações S.A.; Limmat Participações S.A.; Quality Bus Comércio de Veículos S.A.; Super Quadra Empreendimentos Imobiliários S.A.; Thurgau Participações S.A.; Transporte Coletivo Cidade Canção Ltda.; Turb Transporte Urbano S.A.; Vaud Participações S.A.; and Viação Piracicabana Ltda.; all with no expiration date, whose purpose is to issue credits to purchase airline tickets issued by the Company. The UATP account (virtual card) is accepted as a payment means on the purchase of airline tickets and related services, seeking to simplify billing and make feasible payment between the participating companies.
The companies indicated above are owned by the individuals who control FIP Volutto and Mobi FIA, the main shareholders of the Company.
| 29.4. | Commercial Partnership and Maintenance Agreement |
On February 19, 2014, the Company signed an exclusive strategic partnership agreement for business cooperation with AirFrance-KLM. On January 1, 2017, the Company signed an extension of the scope for the inclusion of maintenance services.
During the nine-month period ended on September 30, 2020, component maintenance expenses incurred at the AirFrance-KLM workshop were R$171,290 (R$59,961 on September 30, 2019). On September 30, 2020, the Company has R$116,100 in the “Suppliers” account under current liabilities (R$142,241 on December 31, 2019).
| 29.5. | Compensation of the Key Management Personnel |
| Consolidated | ||||
| Three-month period ended | Nine-month period | |||
| September 30, 2020 | September 30, 2019 | September 30, 2020 | September 30, 2019 | |
| Salaries, Bonus and Benefits (*) | 7,500 | 5,875 | 24,665 | 42,868 |
| Payroll Charges | 1,973 | 4,652 | 10,610 | 11,671 |
| Share-Based Compensation | 4,740 | 2,064 | 9,941 | 6,912 |
| Total | 14,213 | 12,591 | 45,216 | 61,451 |
(*) Includes payment for members of the management, audit committee, and fiscal council.
56
| | Notes on the Parent Company and Consolidated Quarterly Information (ITR) September 30, 2020 (In thousands of Brazilian Reais - R$, except when otherwise indicated) |
| Consolidated | ||
| September 30, 2020 | September 30, 2019 | |
| Number of Members | ||
| Board of Directors | 9 | 8 |
| Board of Directors in Subsidiary | 5 | 7 |
| Statutory Executive Officers | 4 | 4 |
| Statutory Executive Officers in Subsidiary | 3 | 2 |
| Non-Statutory Executive Officers | 21 | 22 |
| Non-Statutory Executive Officers in Subsidiaries | 3 | 3 |
| Fiscal Council | 3 | 3 |
| Fiscal Council in Subsidiary | 3 | 3 |
| Statutory Audit Committee | 3 | 3 |
| Audit Committee in Subsidiary | 2 | 1 |
| Total Members | 56 | 56 |
| 30. | Revenue |
| Consolidated | ||||
| Three-month period ended on | Nine-month period ended on | |||
| September 30, 2020 | September 30, 2019 | September 30, 2020 | September 30, 2019 | |
| Passenger Transportation (*) | 904,950 | 3,614,577 | 4,182,711 | 9,800,275 |
| Cargo | 72,236 | 104,600 | 217,361 | 298,501 |
| Mileage Revenue | 50,809 | 118,186 | 240,355 | 328,352 |
| Other Revenues | 2,816 | 28,114 | 40,583 | 81,331 |
| Gross Revenue | 1,030,811 | 3,865,477 | 4,681,010 | 10,508,459 |
| Related Tax | (55,891) | (155,540) | (200,515) | (447,098) |
| Net Revenue | 974,920 | 3,709,937 | 4,480,495 | 10,061,361 |
(*) Of the total amount, the amounts of R$28,827 and R$185,780 in the three-month and nine-month periods ended on September 30, 2020 includes revenues from non-attendance of passengers, rescheduling, ticket cancellation (R$138,907 and R$402,505 for the periods of three-month and nine-month periods ended on September 30, 2019).
| Consolidated | ||||||||
| Three-month period ended on | Nine-month period ended on | |||||||
| September 30, 2020 | % | September 30, 2019 | % | September 30, 2020 | % | September 30, 2019 | % | |
| Domestic | 890,103 | 91.3 | 3,187,580 | 85.9 | 3,861,431 | 86.2 | 8,635,771 | 85.8 |
| Foreign | 84,817 | 8.7 | 522,357 | 14.1 | 619,064 | 13.8 | 1,425,590 | 14.2 |
| Net Revenue | 974,920 | 100.0 | 3,709,937 | 100.0 | 4,480,495 | 100.0 | 10,061,361 | 100.0 |
57
| | Notes on the Parent Company and Consolidated Quarterly Information (ITR) September 30, 2020 (In thousands of Brazilian Reais - R$, except when otherwise indicated) |
| 31. | Operating Costs, Selling and Administrative Expenses |
| Parent Company | ||||
| Three-month period ended | Nine-month period ended | |||
| September 30, 2020 | September 30, 2019 | September 30, 2020 | September 30, 2019 | |
| Administrative Expenses | ||||
| Employees | (2,202) | (1,110) | (3,626) | (3,247) |
| Services | (7,347) | (10,971) | (10,019) | (23,269) |
| Other Administrative Revenues and (Expenses) | 3,454 | (15,203) | 380 | (7,500) |
| Total Administrative Expenses | (6,095) | (27,284) | (13,265) | (34,016) |
| Other Net Operating Revenues and Expenses | ||||
| Sale-Leaseback Transactions (a) | - | - | 372,712 | 7,413 |
| Other Revenues and (Expenses) | (18,289) | 25,780 | (14,742) | 28,178 |
| Total Other Operating Revenues | (18,289) | 25,780 | 357,970 | 35,591 |
| Total | (24,384) | (1,504) | 344,705 | 1,575 |
| (a) | During the period ended on September 30, 2020, the Company recorded a net gain of R$372,712, related to the sale-leaseback transaction of 11 aircraft (in the period ended on September 30, 2019, the Company recorded a net gain of R$7,413 arising from the sale-leaseback operations of 1 aircraft negotiated in the period). |
58
| | Notes on the Parent Company and Consolidated Quarterly Information (ITR) September 30, 2020 (In thousands of Brazilian Reais - R$, except when otherwise indicated) |
| Consolidated | ||||
| Three-month period ended | Nine-month period ended | |||
| September 30, 2020 | September 30, 2019 | September 30, 2020 | September 30, 2019 | |
| Cost of Services | ||||
| Employees | (201.214) | (412,501) | (711.389) | (1,216,443) |
| Fuels and Lubricants | (316.314) | (1,066,603) | (1.453.237) | (3,038,027) |
| Maintenance, Material and Repairs | (62.829) | (91,497) | (280.896) | (412,253) |
| Passenger Costs | (61.481) | (156,999) | (264.705) | (442,305) |
| Services | (43.908) | (38,100) | (130.324) | (110,792) |
| Landing Fees | (69.584) | (223,610) | (291.657) | (604,747) |
| Depreciation and Amortization | (152.298) | (444,417) | (758.069) | (1,239,971) |
| Recovery of Depreciation Costs (c) | - | - | 25.962 | - |
| Other Operating Costs | (51.342) | (113,107) | (176.571) | (247,162) |
| Total Cost of Services | (958.970) | (2,546,834) | (4.040.886) | (7,311,700) |
| Selling Expenses | ||||
| Employees | (6.179) | (8,818) | (19.856) | (27,240) |
| Services | (13.136) | (44,633) | (65.222) | (120,574) |
| Sales and Marketing | (60.454) | (179,644) | (221.496) | (495,554) |
| Other Selling Expenses | (2.488) | (14,397) | (10.857) | (26,044) |
| Total Selling Expenses | (82.257) | (247,492) | (317.431) | (669,412) |
| Administrative Expenses | ||||
| Salaries (a) | (158.249) | (199,155) | (382.852) | (470,380) |
| Services | (144.599) | (117,612) | (320.817) | (292,702) |
| Depreciation and Amortization | (30.593) | (4,218) | (96.054) | (29,467) |
| Other Administrative Revenues (d) | (47.863) | (9,830) | (149.298) | (19,982) |
| Total Administrative Expenses | (381.304) | (330,815) | (949.021) | (812,531) |
| Other Operational Revenues (Expenses) | ||||
| Sale-Leaseback Transactions (b) | - | - | 594.587 | 7,924 |
| Boeing Agreement Expense Recovery | - | - | 193.503 | - |
| Recovery of Taxes Paid | 41.169 | - | 184.462 | - |
| Idleness - Depreciation and Amortization (e) | (268.318) | - | (615.667) | - |
| Idleness - Personnel (e) | (72.894) | - | (160.802) | - |
| Other Operating Expenses | (12.793) | 28,178 | (1.866) | 162,341 |
| Total Other Operating Revenues and (Expenses), Net | (312.836) | 28,178 | 194.217 | 170,265 |
| Total | (1.735.367) | (3,096,963) | (5.113.121) | (8,623,378) |
| (a) | The Company recognizes compensation paid to members of the Audit Committee, the Board of Directors and the Fiscal Council in the "Salaries" line item. |
| (b) | During the period ended on September 30, 2020, the Company recorded a net gain of R$594,587, related to the sale-leaseback transaction of 11 aircraft (in the period ended on September 30, 2019, the Company recorded a net gain of R$7,924 arising from the sale-leaseback operations of 1 aircraft negotiated in the period). |
| (c) | Boeing Agreement explanatory note 1.3. |
| (d) | The 2019 figures are impacted by recovery of expenses. |
| (e) | See Note 1.1.6 (f). |
59
| | Notes on the Parent Company and Consolidated Quarterly Information (ITR) September 30, 2020 (In thousands of Brazilian Reais - R$, except when otherwise indicated) |
| 32. | Financial Income (Expenses) |
| Parent Company | Consolidated | |||||||
| Three-month period ended on | Nine-month period ended on | Three-month period ended on | Nine-month period ended on | |||||
| September 30, 2020 | September 30, 2019 | September 30, 2020 | September 30, 2019 | September 30, 2020 | September 30, 2019 | September 30, 2020 | September 30, 2019 | |
| Financial Revenues | ||||||||
| Gain from Derivatives | - | - | - | - | 1,157 | 9,251 | 59,669 | 49,368 |
| Derivative Gains - Capped Call (b) | 4,255 | 117,094 | 33,227 | - | 4,255 | 117,094 | 33,227 | - |
| Gains from Short-Term Investments | 128 | 8,767 | 5,422 | 20,542 | 19,667 | 66,665 | 173,900 | 196,797 |
| Cash Changes | 419 | 598 | 1,367 | 1,784 | 14,264 | 4,990 | 22,071 | 37,339 |
| (-) Taxes on Financial Revenues (a) | (440) | (607) | (1,497) | (1,904) | (7,577) | (5,666) | (32,460) | (18,697) |
| Unrealized Gains - Conversion Right – ESN (b) | 205,494 | - | 857,110 | - | 205,494 | - | 857,110 | - |
| Interest Assets | 33,671 | 28,817 | 105,577 | 75,963 | - | - | - | - |
| Others | 1,221 | 2,925 | 9,686 | 3,245 | 5,324 | 8,324 | 23,714 | 18,158 |
| Total Financial Revenues | 244,748 | 157,594 | 1,010,892 | 99,630 | 242,584 | 200,658 | 1,137,231 | 282,965 |
| Financial Expenses | ||||||||
| Losses with Derivatives | - | - | - | - | (3,218) | (48,017) | (421,016) | (94,997) |
| Derivative Losses - Capped Call (b) | (6,473) | - | (154,973) | (41,582) | (6,473) | - | (154,973) | (41,582) |
| Unrealized Loss - Conversion Right – ESN (b) | (101,753) | 200,701 | (344,233) | 134,079 | (101,753) | 200,701 | (344,233) | 134,079 |
| Interest on Loans, Financing and Others | (153,859) | (115,767) | (435,832) | (319,118) | (215,817) | (203,786) | (627,810) | (571,587) |
| Banking Commissions and Expenses | (4,272) | (15,023) | (55,293) | (21,781) | (14,732) | (26,988) | (82,737) | (53,256) |
| Losses with Financial Investments | - | - | - | - | (210) | (23,974) | (63,104) | (104,994) |
| Interest on Leases | - | - | - | - | (226,758) | (121,496) | (529,297) | (359,881) |
| Others | (6,105) | (15,120) | (23,331) | (54,770) | (49,499) | (38,926) | (116,503) | (119,070) |
| Total Financial Expenses | (272,462) | 54,791 | (1,013,662) | (303,172) | (618,460) | (262,486) | (2,339,673) | (1,211,288) |
| Exchange Rate Change, Net | (108,328) | (210,906) | (990,752) | (178,244) | (551,232) | (728,623) | (4,064,660) | (681,327) |
| Total | (136,042) | 1,479 | (993,522) | (381,786) | (927,108) | (790,451) | (5,267,102) | (1,609,650) |
(a) Relative to taxes on Financial Revenues (PIS and COFINS), according to Decree 8,426 of April 1, 2015.
(b) See Note 35.2.
60
| | Notes on the Parent Company and Consolidated Quarterly Information (ITR) September 30, 2020 (In thousands of Brazilian Reais - R$, except when otherwise indicated) |
| 33. | Information by Segment |
The information below presents the summarized financial position of the reportable operating segments on September 30, 2020 and December 31, 2019:
| 33.1. | Assets and liabilities of the operating segments |
| September 30, 2020 | |||||
| Flight Transportation | Smiles Frequent-Flyer Program | Combined Operating Segments | Eliminations | Total Consolidated | |
| Assets | |||||
| Current | 1,989,519 | 2,081,256 | 4,070,775 | (1,176,014) | 2,894,761 |
| Noncurrent | 10,354,866 | 1,260,813 | 11,615,679 | (1,689,611) | 9,926,068 |
| Total Assets | 12,344,385 | 3,342,069 | 15,686,454 | (2,865,625) | 12,820,829 |
| Liabilities | |||||
| Current | 11,453,121 | 1,546,651 | 12,999,772 | (992,486) | 12,007,286 |
| Noncurrent | 15,650,464 | 482,596 | 16,133,060 | (1,182,571) | 14,950,489 |
| Shareholders’ Equity (Deficit) | (14,759,200) | 1,312,822 | (13,446,378) | (690,568) | (14,136,946) |
| Total Liabilities and Shareholders’ Equity (Deficit) | 12,344,385 | 3,342,069 | 15,686,454 | (2,865,625) | 12,820,829 |
| December 31, 2019 | |||||
| Flight Transportation | Smiles Frequent-Flyer Program | Combined Operating Segments | Eliminations | Total Consolidated | |
| Assets | |||||
| Current | 3,243,363 | 2,763,448 | 6,006,811 | (1,079,434) | 4,927,377 |
| Noncurrent | 10,888,299 | 121,135 | 11,009,434 | (638,365) | 10,371,069 |
| Total Assets | 14,131,662 | 2,884,583 | 17,016,245 | (1,717,799) | 15,298,446 |
| Liabilities | |||||
| Current | 9,941,112 | 1,321,534 | 11,262,646 | (900,046) | 10,362,600 |
| Noncurrent | 11,867,062 | 357,714 | 12,224,776 | (183,513) | 12,041,263 |
| Shareholders’ Equity (Deficit) | (7,676,512) | 1,205,335 | (6,471,177) | (634,240) | (7,105,417) |
| Total Liabilities and Shareholders’ Equity (Deficit) | 14,131,662 | 2,884,583 | 17,016,245 | (1,717,799) | 15,298,446 |
61
| | Notes on the Parent Company and Consolidated Quarterly Information (ITR) September 30, 2020 (In thousands of Brazilian Reais - R$, except when otherwise indicated) |
| 33.2. | Income (Expenses) of the Operating Segments |
| September 30, 2020 | |||||
Flight Transportation | Smiles Frequent-Flyer Program | Combined Operating Segments | Eliminations | Total Consolidated | |
| Net Revenue | |||||
| Passenger Transportation | 3,939,886 | - | 3,939,886 | 123,776 | 4,063,662 |
| Cargo and Others | 244,864 | - | 244,864 | (29,087) | 215,777 |
| Revenue with Miles Redeemed | - | 361,751 | 361,751 | (160,695) | 201,056 |
| Total Net Revenue (a) | 4,184,750 | 361,751 | 4,546,501 | (66,006) | 4,480,495 |
| Cost of Services | (4,039,337) | (73,173) | (4,112,510) | 71,624 | (4,040,886) |
| Gross Profit | 145,413 | 288,578 | 433,991 | 5,618 | 439,609 |
| Operating Revenues (Expenses) | |||||
| Selling Expenses | (309,097) | (77,711) | (386,808) | 69,377 | (317,431) |
| Administrative Expenses | (810,261) | (94,937) | (905,198) | (43,823) | (949,021) |
| Other Operating (Expenses) Revenues, Net | 184,311 | 4,228 | 188,539 | 5,678 | 194,217 |
| Total Operating Expenses | (935,047) | (168,420) | (1,103,467) | 31,232 | (1,072,235) |
| Equity Income (Expenses) | 57,228 | - | 57,228 | (57,228) | - |
Operating Income (Expenses) before Income (Expenses) net and income taxes | (732,406) | 120,158 | (612,248) | (20,378) | (632,626) |
| Financial Income (Expenses) | |||||
| Financial Revenues | 1,122,438 | 68,504 | 1,190,942 | (53,711) | 1,137,231 |
| Financial Expenses | (2,381,454) | (11,926) | (2,393,380) | 53,707 | (2,339,673) |
| Financial Revenues (Expenses), Net | (1,259,016) | 56,578 | (1,202,438) | (4) | (1,202,442) |
| Financial Income (Expenses) before Exchange Rate Change, Net | (1,991,422) | 176,736 | (1,814,686) | (20,382) | (1,835,068) |
| Exchange Rate Change, Net | (4,063,316) | (1,369) | (4,064,685) | 25 | (4,064,660) |
| Income (Loss) before Income Tax and Social Contribution | (6,054,738) | 175,367 | (5,879,371) | (20,357) | (5,899,728) |
| Income Tax and Social Contribution | 15,065 | (69,233) | (54,168) | (719) | (54,887) |
| Net Income (Loss) for the Period | (6,039,673) | 106,134 | (5,933,539) | (21,076) | (5,954,615) |
| Income (Expenses) Attributed to Controlling Shareholders | (6,039,673) | 55,797 | (5,983,876) | (21,076) | (6,004,952) |
| Income (Expenses) Attributed to Non-Controlling Shareholders | - | 50,337 | 50,337 | - | 50,337 |
62
| | Notes on the Parent Company and Consolidated Quarterly Information (ITR) September 30, 2020 (In thousands of Brazilian Reais - R$, except when otherwise indicated) |
| September 30, 2019 | |||||
Flight Transportation | Frequent-Flyer Program Smiles | Combined Operating Segments | Eliminations | Total Consolidated | |
| Net Revenue | |||||
| Passenger Transportation | 9,137,160 | - | 9,137,160 | 356,028 | 9,493,188 |
| Cargo and Others | 315,003 | - | 315,003 | (10,265) | 304,738 |
| Revenue with Miles Redeemed | - | 797,860 | 797,860 | (534,425) | 263,435 |
| Total net revenue (a) | 9,452,163 | 797,860 | 10,250,023 | (188,662) | 10,061,361 |
| Cost of Services | (7,275,203) | (57,672) | (7,332,875) | 21,175 | (7,311,700) |
| Gross Profit | 2,176,960 | 740,188 | 2,917,148 | (167,487) | 2,749,661 |
| Operating Expenses | |||||
| Selling Expenses | (716,881) | (94,634) | (811,515) | 142,103 | (669,412) |
| Administrative Expenses | (677,677) | (107,464) | (785,141) | (27,390) | (812,531) |
| Other Operating (Expenses) Revenues, Net | 169,750 | 915 | 170,665 | (400) | 170,265 |
| Total Operating Expenses | (1,224,808) | (201,183) | (1,425,991) | 114,313 | (1,311,678) |
| Equity Income (Expenses) | 201,342 | - | 201,342 | (201,263) | 79 |
Operating Income (Expenses) before Financial Income (Expenses) and Taxes | 1,153,494 | 539,005 | 1,692,499 | (254,437) | 1,438,062 |
Financial Income (Expenses) | |||||
| Financial Revenues | 243,422 | 97,623 | 341,045 | (58,080) | 282,965 |
| Financial Expenses | (1,266,682) | (2,688) | (1,269,370) | 58,082 | (1,211,288) |
| Financial Revenues (Expenses), Net | (1,023,260) | 94,935 | (928,325) | 2 | (928,323) |
| Financial Income (Expenses) before Exchange Rate Change, Net | 130,234 | 633,940 | 764,174 | (254,435) | 509,739 |
| Exchange Rate Change, Net | (684,243) | 1,589 | (682,654) | 1,327 | (681,327) |
| Income (Loss) before Income Tax and Social Contribution | (554,009) | 635,529 | 81,520 | (253,108) | (171,588) |
| Income Tax and Social Contribution | 85,112 | (188,340) | (103,228) | 18,078 | (85,150) |
| Net Income (Loss) for the Period | (468,897) | 447,189 | (21,708) | (235,030) | (256,738) |
| Income (Expenses) Attributed to Controlling Shareholders | (468,897) | 234,945 | (233,952) | (235,030) | (468,982) |
| Income (Expenses) Attributed to Non-Controlling Shareholders | - | 212,244 | 212,244 | - | 212,244 |
| (a) | Eliminations are related to transactions between GLA and Smiles Fidelidade. |
| 34. | Commitments |
On September 30, 2020, the Company had 95 firm orders for aircraft acquisitions with Boeing. These aircraft acquisition commitments include estimates for contractual price increases during the construction phase. The approximate amount of firm orders in the current quarter considers an estimate of contractual discounts, and corresponds to approximately R$25,091,118 (corresponding to US$4,448,228 on September 30, 2020) and are segregated as follows:
| September 30, 2020 | |
| 2023 | 3,624,191 |
| 2024 onwards | 21,466,927 |
| Total | 25,091,118 |
Of the total commitments presented above, the Company should disburse the amount of R$9,026,258 (corresponding to US$1,600,202 on September 30, 2020) as advances for aircraft acquisition, according to the financial flow below:
63
| | Notes on the Parent Company and Consolidated Quarterly Information (ITR) September 30, 2020 (In thousands of Brazilian Reais - R$, except when otherwise indicated) |
| Consolidated | ||
| September 30, 2020 | December 31, 2019 | |
| 2020 | - | 1,169,967 |
| 2021 | 200,753 | 1,152,456 |
| 2022 | 1,397,043 | 1,300,668 |
| 2023 | 2,884,010 | 1,366,345 |
| 2024 onwards | 4,544,452 | 4,255,621 |
| Total | 9,026,258 | 9,245,057 |
The Company has been making payments related to aircraft acquisitions using its own resources, loans, cash generated from operations, short- and medium-term credit lines, and supplier financing.
The Company leases its entire aircraft fleet through a combination of leases without a purchase option. On September 30, 2020, the total fleet consisted of 129 aircraft, among which all were commercial leases with no purchase option.
| 35. | Financial Instruments and Risk Management |
Operational activities expose the Company and its subsidiaries to market risk (fuel prices, foreign currency and interest rate), credit risk and liquidity risk. These risks can be mitigated by using exchange swap derivatives, futures and options contracts based on oil, U.S. dollar and interest markets.
Financial instruments are managed by the Risk Policy Committee in line with the Risk Management Policy and submitted to the Board of Directors. The details regarding the way the Company manages risks have been widely presented in the financial statements related to the year ended December 31, 2019. Since then, there has been no changes.
64
| | Notes on the Parent Company and Consolidated Quarterly Information (ITR) September 30, 2020 (In thousands of Brazilian Reais - R$, except when otherwise indicated) |
| 35.1. | Accounting Classifications of Financial Instruments |
The accounting classifications of the Company's consolidated financial instruments on September 30, 2020 and December 31, 2019 are shown below:
| Parent Company | Consolidated | ||||||||
| Measured at Fair Value through Income (Expenses) | Amortized Cost (c) | Measured at Fair Value through Income (Expenses) | Amortized Cost (c) | ||||||
| Fair value level | September 30, 2020 | December 31, 2019 | September 30, 2020 | December 31, 2019 | September 30, 2020 | December 31, 2019 | September 30, 2020 | December 31, 2019 | |
| Assets | |||||||||
| Cash and Bank Deposits | Level 1 | 4,329 | 488 | - | - | 40,394 | 418,447 | - | - |
| Cash Equivalents | Level 2 | 2,299 | 1,016,258 | - | - | 458,360 | 1,226,978 | - | - |
| Financial Investments | Level 2 | 205 | 673 | - | - | 399,624 | 953,762 | - | - |
| Restricted Cash | Level 2 | 4,145 | 6,399 | - | - | 553,056 | 444,306 | - | - |
| Rights from Derivative Transactions | Level 2 | 44,079 | 143,969 | - | - | 50,055 | 147,469 | - | - |
| Trade Receivables | - | - | - | - | - | - | - | 790,911 | 1,229,530 |
| Deposits (a) | - | - | - | 74,269 | 51,055 | - | - | 1,580,730 | 1,126,609 |
| Credits with Related Companies | - | - | - | 5,150,125 | 3,440,701 | - | - | - | - |
| Dividends and Interest on Shareholders’ Equity to Receive | - | - | - | 54,544 | 69,548 | - | - | - | - |
| Other Credits | - | - | - | 12,272 | 10,039 | - | - | 151,146 | 140,006 |
| Liabilities | |||||||||
| Loans and Financing (b) | Level 2 | 230,193 | 626,557 | 7,520,873 | 5,968,583 | 230,193 | 626,557 | 10,053,525 | 7,783,284 |
| Suppliers | - | - | - | 34,597 | 19,116 | - | - | 1,679,276 | 1,296,417 |
| Suppliers - Forfaiting | - | - | - | - | - | - | 52,120 | 554,467 | |
| Obligations with Derivative Transactions | Level 2 | - | - | - | - | 100,962 | 20,350 | - | - |
| Obligations to Related Parties | - | - | - | 9,509 | 163,350 | - | - | - | - |
| Landing Fees | - | - | - | - | - | - | - | 780,426 | 728,339 |
| Leases to Pay | - | - | - | - | - | - | - | 7,983,384 | 6,052,780 |
| Other Liabilities | - | - | - | 23,394 | 23,501 | - | - | 286,283 | 164,709 |
| (a) | Excludes judicial deposits, as described in note 14. |
| (b) | The amounts on September 30, 2020 and December 31, 2019, classified as measured at fair value through income (expense), are related to the derivative contracted through Exchange Senior Notes. |
| (c) | Items classified as amortized cost refer to credits, debt with private institutions which, in any early settlement, there are no substantial alterations in relation to the values recorded. |
65
| | Notes on the Parent Company and Consolidated Quarterly Information (ITR) September 30, 2020 (In thousands of Brazilian Reais - R$, except when otherwise indicated) |
During the period ended on September 30, 2020, there was no change on the classification between categories of the financial instruments.
| 35.2. | Derivative and Non-Derivative Financial Instruments |
The Company's derivative financial instruments were recognized as follows in the Balance sheet:
| Derivatives | Non-Derivative | |||||||
| Fuel | Interest Rate | Exchange Rate | Capped Call | ESN | Revenue Hedge | Total | ||
| Fair Value Changes | ||||||||
| Rights (Obligations) with Derivatives on December 31, 2019 | (20,350) | - | 3,500 | 143,969 | (626,557) | - | (499,438) | |
| Gains (Losses) Recognized in Income (Expenses) | - | - | 18,300 | (121,745) | 512,876 | - | 409,431 | |
| Gains (Losses) Recognized as Exchange Rate Change | - | - | - | 21,855 | (116,512) | - | (94,657) | |
| Gains (Losses) Recognized in Equity Valuation Adjustments | (824,551) | - | - | - | - | - | (824,551) | |
| Settlements (Payments Received) During the Period | 749,915 | - | (21,800) | - | - | - | 728,115 | |
| Derivative Rights (Obligations) on September 30, 2020 | (94,986) | - | - | 44,079 | (230,193) | - | (281,100) | |
| Changes in the adjustment of equity valuation | ||||||||
| Balance on December 31, 2019 | (53,242) | (311,365) | - | - | - | (165,436) | (530,043) | |
| Fair Value Adjustments during the Period | (824,551) | - | - | - | - | - | (824,551) | |
| Adjustments of Hedge Accounting of Revenue | - | - | - | - | - | (1,162,454) | (1,162,454) | |
| Net Reversal to Income (Expenses) | 227,392 | 6,268 | - | - | - | 25,543 | 259,203 | |
| Derecognition of Hedge Object | 315,286 | - | - | - | - | 290,345 | 605,631 | |
| Balances on September 30, 2020 | (335,115) | (305,097) | - | - | - | (1,012,002) | (1,652,214) | |
| Effects on Income (Expenses) | (542,678) | (6,268) | 18,300 | (99,890) | 396,364 | 846,566 | 612,394 | |
| Hedge nature | Classification | September 30, 2020 | |
| USD Revenue | Net Revenue | (16,086) | |
| USD Revenue | Exchange Rate Change | 862,622 | |
| Fuel | Costs | (164,968) | |
| Fuel | Financial Income (Expenses) | (377,710) | |
| Interest - Lease | Financial Income (Expenses) | (1,937) | |
| Interest - Lease | Financial Income (Expenses) – Interest on Leases | (4,331) | |
| Conversion Right - ESN | Financial Income (Expenses) | 512,906 | |
| Conversion Right - ESN | Exchange Rate Change | (116,512) | |
| Capped Call – ESN | Financial Income (Expenses) | (121,745) | |
| Capped Call – ESN | Exchange Rate Change | 21,855 | |
| Exchange Rate | Exchange Rate Change | 18,300 | |
| Total Assets | 612,394 |
The Company may adopt hedge accounting for derivatives contracted to hedge cash flow and that qualify for this classification as per CPC 48 - Financial Instruments (equivalent to IFRS 9).
On September 30, 2020, the Company adopts cash flow hedge for the interest rate (mainly the Libor interest rates), and for aeronautical fuel protection and future revenue in US Dollar.
As disclosed in Note 1.1, due to the reduction in the volume of flight operations, the Company discontinued hedge relations of part of the fuel hedge operations designated as cash flow hedges, as a drop in fuel consumption was expected when compared to the amount previously estimated. Accordingly, the amount of R$315,286 was transferred from the "equity valuation adjustment" group in shareholders' equity to the financial income (expenses) under the "losses on derivatives" item.
66
| | Notes on the Parent Company and Consolidated Quarterly Information (ITR) September 30, 2020 (In thousands of Brazilian Reais - R$, except when otherwise indicated) |
In addition, due to the temporary interruption of all international flights, the Company also discontinued part of hedge accounting transactions used to hedge future revenues in foreign currency (hedged object), using lease agreements as hedge instruments. As a result, the amount of R$290,345 was transferred from the “equity valuation adjustment” group in the shareholders’ equity to the financial income (expenses) as “losses with exchange rate change”.
| 35.3. | Market Risks |
| 35.3.1. | Fuel |
The aircraft fuel prices fluctuate due to the volatility of the price of crude oil by product price fluctuations. To mitigate the risk of fuel price, on September 30, 2020, the Company held Brent, WTI and Collar derivatives, whose strategies are purchase options, Collar, Swap and futures. In the nine-month period ended on September 30, 2020, the Company recognized total losses of R$542,678 related to derivatives operations in the statement of operations (R$60,027 in the nine-month period ended on September 30, 2019).
| 35.3.2. | Interest Rate |
The Company is mainly exposed to lease transactions indexed to changes in the Libor rate until the aircraft is received. To mitigate such risks, the Company can use derivative financial instruments. In the nine-month period ended on September 30, 2020, the Company recognized a total loss with interest hedge transactions in the amount of R$6,268 (R$12,112 in the nine-month period ended on September 30, 2019).
| 35.3.3. | Exchange Rate |
Foreign currency risk derives from the possibility of unfavorable fluctuation of foreign currency to which the Company’s liabilities or cash flows are exposed. In the nine-month period ended on September 30, 2020, the Company recognized a total gain with exchange rate hedge transactions in the amount of R$18,300 (R$1,793 in the nine-month period ended on September 30, 2019).
67
| | Notes on the Parent Company and Consolidated Quarterly Information (ITR) September 30, 2020 (In thousands of Brazilian Reais - R$, except when otherwise indicated) |
The Company’s foreign currency exposure is summarized below:
| Parent Company | Consolidated | |||
| September 30, 2020 | December 31, 2019 | September 30, 2020 | December 31, 2019 | |
| Assets | ||||
| Cash, Short-Term Investments and Restricted Cash | 8,394 | 647,671 | 209,361 | 1,035,802 |
| Trade Receivables | - | - | 115,117 | 202,363 |
| Taxes to Recover | - | - | 13,608 | 5,312 |
| Deposits | 71,449 | 51,056 | 1,580,730 | 1,126,609 |
| Rights from Derivative Transactions | 44,079 | 143,969 | 50,055 | 147,469 |
| Total Assets | 123,922 | 842,696 | 1,968,871 | 2,517,555 |
| Liabilities | ||||
| Loans and Financing | (7,751,066) | (6,595,140) | (9,388,036) | (7,831,116) |
| Suppliers | (19,435) | (3,164) | (677,903) | (462,636) |
| Provision for Aircraft and Engine Return | - | - | (1,298,420) | (869,078) |
| Obligations with Derivative Transactions | - | - | (100,962) | (20,350) |
| Operating Leases | - | - | (7,935,998) | (6,007,973) |
| Total Liabilities | (7,770,501) | (6,598,304) | (19,401,319) | (15,191,153) |
| Exchange Rate Exposure Liabilities | (7,646,579) | (5,755,608) | (17,432,448) | (12,673,598) |
| Commitments Not Recorded in the Statements of Financial Position | ||||
| Future Obligations Resulting from Firm Aircraft Orders | (25,091,118) | (65,779,883) | (25,091,118) | (65,779,883) |
| Total | (25,091,118) | (65,779,883) | (25,091,118) | (65,779,883) |
| Total Exchange Rate Exposure R$ | (32,737,697) | (71,535,491) | (42,523,566) | (78,453,481) |
| Total Exchange Rate Exposure - US$ | (5,803,836) | (17,747,659) | (7,538,704) | (19,463,984) |
| Exchange Rate (R$/US$) | 5.6407 | 4.0307 | 5.6407 | 4.0307 |
The Company is mainly exposed to the exchange rate change of the U.S. dollar.
| 35.3.4. | Capped Call |
The Company, through Gol Equity Finance, in the context of the pricing of the ESN issued on March 26, April 17 and July 17, 2019, contracted private derivative transactions (Capped call) with part of the note subscribers with the purpose of minimizing the potential dilution of the Company’s preferred shares and ADSs.
The Company recognized a total expense for capped call operations in the amount of R$99,890, comprising R$121,745 of changes in fair value, net of R$21,855 of exchange rate change, for the nine-month period ended on September 30, 2020 (R$41,582 of changes in fair value on September 30, 2019).
| 35.4. | Credit Risk |
The credit risk is inherent in the Company’s operating and financing activities, mainly in cash and cash equivalents, short-term investments and trade receivables. Financial assets classified as cash, cash equivalents, and short-term investments are deposited with counterparties rated investment grade or higher by S&P or Moody's (between AAA and AA-),
68
| | Notes on the Parent Company and Consolidated Quarterly Information (ITR) September 30, 2020 (In thousands of Brazilian Reais - R$, except when otherwise indicated) |
pursuant to risk management policies.
Credit limits are set for all customers based on internal credit rating criteria and carrying amounts represent the maximum credit risk exposure. Customer creditworthiness is assessed based on an internal system of extensive credit rating. Outstanding trade receivables are frequently monitored by the Company.
Derivative financial instruments are contracted in the over-the-counter market (OTC) with counterparties rated investment grade or higher, or in a commodities and futures exchange (B3 or NYMEX), thus substantially mitigating credit risk. The Company's obligation is to evaluate counterparty risk involved in financial instruments and periodically diversify its exposure.
| 35.5. | Liquidity Risk |
The schedules of financial liabilities held by the Company's consolidated financial liabilities on September 30, 2020 and December 31, 2019 are as follows:
| Parent Company | |||||
| Less than 6 months | 6 to 12 months | 1 to 5 years | More than 5 years | Total | |
| Loans and Financing | 211,255 | 211,255 | 7,630,518 | 1,190,938 | 9,243,966 |
| Suppliers | 34,597 | - | - | - | 34,597 |
| Obligations to Related Parties | 9,509 | - | - | - | 9,509 |
| Other Liabilities | - | - | 23,394 | - | 23,394 |
| On September 30, 2020 | 255,361 | 211,255 | 7,653,912 | 1,190,938 | 9,311,466 |
| Loans and Financing | 200,598 | 1,413,645 | 6,587,415 | 1,923,019 | 10,124,677 |
| Suppliers | 19,116 | - | - | - | 19,116 |
| Obligations to Related Parties | 163,350 | - | - | - | 163,350 |
| Other Liabilities | - | - | 23,501 | - | 23,501 |
| On December 31, 2019 | 383,064 | 1,413,645 | 6,610,916 | 1,923,019 | 10,330,644 |
| Consolidated | |||||
| Less than 6 months | 6 to 12 months | 1 to 5 years | More than 5 years | Total | |
| Loans and Financing | 1,803,789 | 484,651 | 8,366,671 | 1,225,461 | 11,880,572 |
| Leases Payable | 1.172.978 | 934.823 | 5.389.711 | 967.404 | 8.464.916 |
| Suppliers | 1,634,527 | - | 44,749 | - | 1,679,276 |
| Suppliers - Forfaiting | 52,120 | - | - | - | 52,120 |
| Landing Fees | 780,426 | - | - | - | 780,426 |
| Obligations with Derivative Transactions | 100,962 | - | - | - | 100,962 |
| Other Liabilities | 256,729 | - | 29,554 | - | 286,283 |
| On September 30, 2020 | 5.801.531 | 1.419.474 | 13.830.685 | 2.192.865 | 23.244.555 |
| Loans and Financing | 1,112,414 | 1,724,940 | 7,519,263 | 1,890,448 | 12,247,065 |
| Leases to Pay | 1,257,430 | 1,018,266 | 5,862,268 | 967,404 | 9,105,368 |
| Suppliers | 1,286,264 | - | 10,142 | - | 1,296,406 |
| Suppliers - Forfaiting | 554,467 | - | - | - | 554,467 |
| Landing Fees | 728,339 | - | - | - | 728,339 |
| Obligations with Derivative Transactions | 9,080 | - | 11,270 | - | 20,350 |
| Other Liabilities | 128,744 | - | 35,965 | - | 164,709 |
| On December 31, 2019 | 5,076,738 | 2,743,206 | 13,438,908 | 2,857,852 | 24,116,704 |
69
| | Notes on the Parent Company and Consolidated Quarterly Information (ITR) September 30, 2020 (In thousands of Brazilian Reais - R$, except when otherwise indicated) |
| 35.6. | Sensitivity Analysis of Financial Instruments |
| 35.6.1. | Foreign Currency Risk |
On September 30, 2020, the Company considered the closing exchange rate of R$5.6407/US$1.00 as the likely scenario. The table below shows the sensitivity analysis and the effect on Income (Expenses) of exchange rate fluctuations in the exposure on September 30, 2020:
| Parent Company | Consolidated | ||
| Exchange Rate | Effect on Income (Expenses) | Effect on Income (Expenses) | |
| Net Liabilities Exposed to the Risk of Appreciation of the U.S. dollar | 5.6407 | 7,646,579 | 17,432,448 |
| Dollar Depreciation (-50%) | 2.8204 | 3,823,290 | 8,716,224 |
| Dollar Depreciation (-25%) | 4.2305 | 1,911,645 | 4,358,112 |
| Dollar Appreciation (+25%) | 7.0509 | (1,911,645) | (4,358,112) |
| Dollar Appreciation (+50%) | 8.4611 | (3,823,290) | (8,716,224) |
| 35.6.2. | Fuel Risk Factor |
On September 30, 2020, the Company, through its subsidiary GLA, has oil derivative contracts for protection equivalent to 56% of 12-month consumption, and 43% of 24-month consumption. The probable scenarios used by the Company are the market curves at the close of September 30, 2020, for derivatives that hedge the fuel price risk. The table below shows the sensitivity analysis in U.S. dollars of the fluctuations in jet fuel barrel prices:
| Fuel | ||
| US$/bbl (WTI) | R$ (000) | |
| Barrel Price | 39.60 | |
| Decline in Prices/Barrel (-50%) | 19.80 | (356,630) |
| Decline in Prices/Barrel (-25%) | 29.70 | (236,980) |
| Increase in Prices/Barrel (+25%) | 49.50 | 155,265 |
| Increase in Prices/Barrel (+50%) | 59.40 | 515,475 |
| 35.6.3. | Interest Rate Risk Factor |
On September 30, 2020, the Company held financial investments and debts with different types of fees. Its sensitivity analysis of non-derivative financial instruments examined the impact on annual interest rates only for positions with material amounts on September 30, 2020 that were exposed to fluctuations in interest rates, as the scenarios below show. The amounts show the impacts on Income (Expenses) according to the scenarios adopted below:
| Short-Term Investments Net of Financial Debt (a) | ||
| Risk | CDI Rate Drop | Libor Rate Increase |
| Reference Rates | 1.90% | 0.08% |
| Exposure Amount (Probable Scenario) (b) | (140,114) | 1,756,502 |
| Remote Favorable Scenario (-50%) | (1,524) | (686) |
| Possible Favorable Scenario (-25%) | (762) | (343) |
| Possible Adverse Scenario (+25%) | 762 | 343 |
| Remote Adverse Scenario (+50%) | 1,524 | 686 |
| (a) | Refers to the sum of the amounts invested and raised in the financial market and indexed to the CDI and Libor rates. |
| (b) | Book balances recorded on September 30, 2020. |
| 35.7. | Capital Management |
The Company seeks alternatives to capital in order to meet its operational needs, aiming a
70
| | Notes on the Parent Company and Consolidated Quarterly Information (ITR) September 30, 2020 (In thousands of Brazilian Reais - R$, except when otherwise indicated) |
capital structure that takes into account suitable parameters for the financial costs, the maturities of funding and its guarantees. The Company monitors its financial leverage ratio, which corresponds to net debt, including short and long-term debt. The following table shows the financial leverage:
| Consolidated | ||
| September 30, 2020 | December 31, 2019 | |
| Total Loans and Financing | (10,283,718) | (8,409,841) |
| Total Leases Payable | (7,983,384) | (6,052,780) |
| (-) Cash and Cash Equivalents | 498,754 | 1,645,425 |
| (-) Short-Term Investments | 399,624 | 953,762 |
| Net Debt | (17,368,724) | (11,863,434) |
| 36. | Non-Cash Transactions |
| Parent Company | ||
| September 30, 2020 | September 30, 2019 | |
| Initial adoption – IFRS 16 (investments / accumulated losses) | - | 2.436.334 |
| Interest on shareholder’s equity to be distributed, net of taxes (investments) | - | 8.338 |
| Share-Based Payment (Investments/Share-Based Payment) | 16,984 | - |
| Unrealized Income (Expenses) of Derivatives (Investments/Equity Valuation Adjustment) | (1,122,172) | - |
| Actuarial Losses from Post-Employment Benefits | 27,287 | - |
| Consolidated | ||
| September 30, 2020 | September 30, 2019 | |
| Initial adoption – IFRS 16 | - | 2.436.334 |
| Interest on shareholder’s equity to be distributed, net of taxes | - | (7.512) |
| Actuarial Losses from Post-Employment Benefits | 27,287 | - |
| Leaseback (Fixed Assets/Leases) | (35,316) | - |
| Forfaiting (Forfaiting/Loans) | (359,337) | - |
| Acquisition of Property, Plant & Equipment Through Financing (Property, Plant & Equipment / Loans And Financing) | 25,974 | 130,787 |
| Guarantee Deposits (Deposits / Leases Payable) | (18,920) | (476) |
| Maintenance Reserve (Deposits / Leases Payable) | (4,888) | |
| Maintenance Reserve (Deposits / Property, Plant & Equipment) | 42.463 | |
| Right of Use of Flight Equipment (Property, Plant & Equipment / Leases Payable) | 131,014 | 630,858 |
| Financial Lease Agreement Renegotiation (Property, Plant & Equipment / Leases Payable) | (115,692) | - |
| Unrealized Income (Expenses) of Derivatives (Derivative Rights/Equity Valuation Adjustment) | 824,551 | - |
71
| | Notes on the Parent Company and Consolidated Quarterly Information (ITR) September 30, 2020 (In thousands of Brazilian Reais - R$, except when otherwise indicated) |
| 37. | Liabilities from Financing Activities |
The changes in liabilities from the Company’s financing activities in the periods ended on September 30, 2020 and 2019 are as follows:
| 37.1. | Parent Company |
| September 30, 2020 | |||||||
| Adjustment to Profit | |||||||
| Opening Balance | Net Cash Flows (Used in) from Financing Activities | Net Cash Flows from Operating Activities | Exchange Rate Changes, Net | Provision for Interest and Cost Amortization | Unrealized Income (Expenses) on Derivatives | Closing Balance | |
| Loans and Financing | 6,595,140 | (764,054) | (465,842) | 2,449,317 | 449,381 | (512,876) | 7,751,066 |
| September 30, 2019 | |||||||||
| Non-Cash Transactions | Adjustment to Profit | ||||||||
| ‘ | Opening Balance | Net Cash Flows (Used in) from Financing Activities | Net Cash Flows from Operating Activities | Capital Increase | Exchange Rate Changes, Net | Provision for Interest and Cost Amortization | Unrealized Income (Expenses) on Derivatives | Closing Balance | |
| Loans and Financing | 4,659,102 | 1,587,259 | (319,223) | - | 472,992 | 324,984 | (151,169) | 6,573,945 | |
| Share Capital | 3,055,940 | 2,583 | - | 2,818 | - | - | - | 3,061,341 | |
| Capital Reserves | 88,476 | 9,134 | - | - | - | - | - | 97,610 | |
| Shares to Issue | 2,818 | 28,343 | - | (2,818) | - | - | - | 28,343 | |
72
| | Notes on the Parent Company and Consolidated Quarterly Information (ITR) September 30, 2020 (In thousands of Brazilian Reais - R$, except when otherwise indicated) |
| 37.2. | Consolidated |
| September 30, 2020 | ||||||||||||||
| Non-Cash Transactions | Adjustment to Profit | |||||||||||||
| Opening Balance | Net Cash Flows (Used in) from Financing Activities | Net Cash Flows from Operating Activities | Property, plant and equipment acquisition through financing | Forfaiting | Gains (Losses) Recognized in Equity Valuation Adjustments | Deposit in Guarantee | Write-Offs | Exchange Rate Changes, Net | Provision for Interest and Cost Amortization | Contractual Amendment | Unrealized Income (Expenses) on Derivatives | Closing Balance | ||
| Loans and Financing | 8,409,841 | (944,306) | (541,766) | 25,974 | 359,337 | - | - | - | 2,945,766 | 541,748 | - | (512,876) | 10,283,718 | |
| Leases Payable | 6,052,780 | (755,208) | (4,592) | 131,014 | - | - | (18,920) | (150,044) | 2.309.877 | 533.888 | (115.411) | - | 7.983.384 | |
| Derivatives | (127,119) | 21,800 | (749,915) | - | - | 824,551 | - | - | (21,855) | - | - | 103,445 | 50,907 | |
| September 30, 2019 | |||||||||||||||
| Dividends and Interest on Shareholders’ Equity paid through Subsidiary Smiles | Non-Cash Transactions | Adjustment to Profit | |||||||||||||
| Opening Balance | Net Cash Flows (Used in) from Financing Activities | Net Cash Flows from Operating Activities | Gains on Change in Equity Interest | Capital Increase | Initial Adoption Adjustment – CPC 06 (R2) | Provision Property, Plant & Equipment | Profit for the Period | Provision for Interests | Exchange Rate Change, Net | Unrealized Income (Expenses) on Derivatives | Others | Closing Balance | |||
| Loans and Financing | 6,443,807 | 1,302,545 | (378,072) | - | - | - | - | 130,787 | - | 390,643 | 557,493 | (151,169) | - | 8,296,034 | |
| Leases to Pay | 912,145 | (1,223,685) | (21,135) | - | - | - | 5,370,868 | 630,858 | - | 377,323 | 446,397 | - | (274,717) | 6,218,054 | |
| Derivatives | 409,662 | - | - | - | - | - | - | - | - | - | - | 153,615 | (323,907) | 239,370 | |
| Other Liabilities | 147,239 | - | - | - | - | (66,015) | - | - | - | - | - | - | (20,409) | 60,815 | |
| Share Capital | 3,055,940 | - | - | - | 5,401 | - | - | - | - | - | - | - | - | 3,061,341 | |
| Capital Reserves | 88,476 | 9,134 | - | - | - | - | - | - | - | - | - | - | - | 97,610 | |
| Shares to Issue | 2,818 | 28,343 | - | - | (2,818) | - | - | - | - | - | - | - | - | 28,343 | |
| Non-Controlling Interests | 480,061 | - | - | 649 | - | (143,136) | (256) | - | 212,244 | - | - | - | 1,110 | 550,672 | |
73
| | Notes on the Parent Company and Consolidated Quarterly Information (ITR) September 30, 2020 (In thousands of Brazilian Reais - R$, except when otherwise indicated) |
| 38. | Insurance Coverage |
On September 30, 2020, the most relevant insurance coverage, by nature, considering the aircraft fleet in relation to the maximum reimbursable amounts indicated in U.S. dollars, together with the insurance coverage of the subsidiary Smiles, are as follows:
In thousands of Reais | In thousands of U.S. dollars | |
| GLA | ||
| Guarantee - Hull/War | 479,460 | 85,000 |
| Civil Liability per Event/Aircraft (a) | 4,230,525 | 750,000 |
| Inventories (Local) (b) | 1,410,175 | 250,000 |
| Smiles | ||
| Rent Guarantee (Cond. Rio Negro - Alphaville) | 1,318 | - |
| D&O Liability Insurance | 100,000 | - |
| Fire (Property Insurance Cond. Rio Negro - Alphaville) | 12,747 | - |
| (a) | In accordance with the agreed amount for each aircraft up to the maximum limit indicated. |
| (b) | Values per incident and annual aggregate. |
Pursuant to Law 10744 of October 9, 2003, the Brazilian government assumed the commitment to complement any civil-liability expenses related to third parties caused by war or terrorist events, in Brazil or abroad, which GLA may be required to pay, for amounts exceeding the limit of the insurance policies effective since September 10, 2001, limited to the amount in Brazilian Reais equivalent to US$1.0 billion.
74
SIGNATURE
Pursuant to the requirements of the Securities Exchange Act of 1934, the registrant has duly caused this report to be signed on its behalf by the undersigned, thereunto duly authorized.
Date: October 30, 2020
| GOL LINHAS AÉREAS INTELIGENTES S.A. | |
| By: | /s/ Richard F. Lark, Jr. |
Name: Richard F. Lark, Jr. Title: Investor Relations Officer | |
FORWARD-LOOKING STATEMENTS
This press release may contain forward-looking statements. These statements are statements that are not historical facts, and are based on management’s current view and estimates of future economic circumstances, industry conditions, company performance and financial results. The words “anticipates,” “believes,” “estimates,” “expects,” “plans” and similar expressions, as they relate to the company, are intended to identify forward-looking statements. Statements regarding the declaration or payment of dividends, the implementation of principal operating and financing strategies and capital expenditure plans, the direction of future operations and the factors or trends affecting financial condition, liquidity or results of operations are examples of forward-looking statements. Such statements reflect the current views of management and are subject to a number of risks and uncertainties. There is no guarantee that the expected events, trends or results will actually occur. The statements are based on many assumptions and factors, including general economic and market conditions, industry conditions and operating factors. Any changes in such assumptions or factors could cause actual results to differ materially from current expectations.