SECURITIES AND EXCHANGE COMMISSION
Washington, D.C. 20549
FORM 6-K
REPORT OF FOREIGN ISSUER
PURSUANT TO RULE 13a-16 OR 15d-16 OF THE
SECURITIES EXCHANGE ACT OF 1934
For the month of March 2021
(Commission File No. 001-32221)
GOL LINHAS AÉREAS INTELIGENTES S.A.
(Exact name of registrant as specified in its charter)
GOL INTELLIGENT AIRLINES INC.
(Translation of registrant’s name into English)
Praça Comandante Linneu Gomes, Portaria 3, Prédio 24
Jd. Aeroporto
04630-000 São Paulo, São Paulo
Federative Republic of Brazil
(Address of registrant’s principal executive offices)
Indicate by check mark whether the registrant files or will file
annual reports under cover Form 20-F or Form 40-F.
Form 20-F ___X___ Form 40-F ______
Indicate by check mark whether the registrant by furnishing the
information contained in this Form is also thereby furnishing the
information to the Commission pursuant to Rule 12g3-2(b) under
the Securities Exchange Act of 1934.
Yes ______ No ___X___
Parent Company and Consolidated
Financial Statements
GOL Linhas Aéreas Inteligentes S.A.
December 31, 2020
with Independent Auditor’s Report
Gol Linhas Aéreas Inteligentes S.A.
Parent Company and Consolidated Financial Statements
December 31, 2019
Contents
Management’s report | 01 |
Comments on business forecast trends | 06 |
Report of the statutory audit committee (CAE) | 09 |
Report of the Fiscal Council | 11 |
Executive Officers’ Statement on Income Statements | 12 |
Executive Officers’ Statement on the Independent Auditor’s Report | 13 |
Independent Auditor’s Report on the Individual and Consolidated Financial Statements | 14 |
Statements of financial position | 19 |
Statements of operations | 20 |
Statements of comprehensive income | 21 |
Statement of changes in equity | 23 |
Statement of cash flows | 24 |
Statements of value added | 26 |
Notes on the financial statements | 27 |
Management’s report
On January 15, 2021, GOL celebrated its 20th anniversary, with over 500 million Customers transported over the course of its history. During these two decades of continuous innovation, GOL has transformed the history of commercial aviation in Brazil and popularized high-quality air travel, a journey that has made it the leader in Brazilian domestic market for the fifth consecutive year, with a market share of 38%. GOL has operated over 4.2 million flights to destinations in Brazil, Latin America, the Caribbean and the United States, while its fleet expanded from 13 aircraft in January/2001 to 128 today.
“This story is written every day by our Team of Eagles, comprised of thousands of people who dedicate themselves to GOL. Once again, we would like to thank our Employees for their continued loyalty, dedication and proactiveness, which are fundamental to GOL’s success. Even more so throughout this pandemic, when the hard work of our Team of Eagles provided an essential service to Brazilians, transported health professionals and is now helping to distribute the vaccine. We are proud that this is the result of developing an intelligent airline committed to efficiency. The democratization of air transportation will always be our trademark and it drives us to continue to broaden our horizons,” added Kakinoff.
Customer experience and personal Safety: GOL’s Net Promoter Score (NPS) was 34 in the quarter and 38 in FY20, a solid metric of the winning combination of the Company’s best-in-market product and highly engaged Customer service team. GOL won the Top of Mind award for the fifth consecutive year as the most remembered airline in the country.
“The reputation of GOL among our Customers attests to our ability to adapt in the face of a global crisis that has fully reshaped the commercial airline sector. Without a doubt, this award has made the entire Team of Eagles proud,” commented Kakinoff. “We believe that maintaining consumer trust will be important both during and after the pandemic as Customers will choose to fly with airlines that have a strong track record of Service and Safety.”
Sustainability as a strategic driver: Through its Sustainability Policy, the Company has established a strategy for strengthening its environmental, social and governance practices. In 2020, GOL was the only Brazilian company to be included in a select list of 13 global airlines that received Stage 1 certification of the IATA Environmental Assessment, IEnvA, which is validation that the Company has developed a consistent environmental policy and is fulfilling its responsibilities.
During the pandemic, GOL is also supporting important health and social initiatives, including the free transportation of Health Professionals flying for work, free transportation of medicine and making its network available to government entities for the roll-out of vaccines. In 2020, the Company partnered with Albert Einstein Hospital, a leading authority on private and public healthcare in Brazil and Latin America, to develop an advisory project for assessing, restructuring and certifying its already strict hygiene measures against the spread of coronavirus in aircraft and airports. GOL is the first and only company in Brazil to obtain the Einstein Covid-19 Quality and Safety Standards seal of approval.
Sales: In the fourth quarter, consolidated gross sales reached approximately R$2.5 billion, 44% more than in 3Q20. GOL’s average daily sales exceeded R$27 million, which represents around 80% of pre-pandemic sales levels. With additional flights in December, passenger revenue increased 91% over 3Q20. In November, the Company’s Black Friday campaign resulted in the sale of over half a million tickets.
Kakinoff commented: “We saw a substantial spike in sales during the fourth quarter as passengers returned to the skies. We know the recovery won’t be linear, but this indicates how rapidly demand could return as the vaccine roll-out progresses in Brazil. We are prepared to meet that demand with our flexible, low-cost operating model.”
The Ministry of Health of Brazil expects to have 576 million doses of vaccines against Covid-19 by the end of this year, according to a document presented at a federal hearing in the Senate on March 4, 2021. Of these, 415 million have already been contracted, while 161 million are under negotiation. The forecast includes the Oxford-AstraZeneca, CoronaVac, Covaxin, Sputnik V, Johnson&Johnson Janssen, Pfizer-BioNTech and Moderna vaccines. The estimate also includes nine million doses received by the Covax consortium. Some of these vaccines have not yet obtained registration or approval for emergency use by Anvisa (Brazil's Health Regulatory Agency). The Ministry of Health foresees that all Brazilians can be vaccinated by the end of 2021.
Capacity: The Company maintains solid position in the main Brazilian commercial airports due to its established network and with main hubs at GRU, GIG, BSB and FOR. In addition, in July/20, GOL established a new hub in Salvador, through which the Company can explore new regional markets together with its strategic partners.
| 1 |
Celso complemented: “Capacity adjustment based on demand has always been a competitive advantage of the Company’s fleet management, enabling us to maintain significant flexibility to response to major traffic trends. We do not face the same concerns as our competitors with fleet complexity or exposure to large aircraft exclusively for the international market. During the pandemic, we continued to lead the industry in capacity management, maintaining high load factors consistent with the pre-pandemic period.”
Adjustments of network and fleet: Compared to 3Q20, daily flights doubled to 403 in 4Q20, serving 177 markets and representing 54% of the daily flights in 4Q19. 166 of those markets are operated by the Company and 11 are operated by GOL partners. GOL reopened six bases in Brazil this quarter: Carajás (CKS), Fernando de Noronha (FEN), Cruzeiro do Sul (CZS), Jericoacoara (JJD), Caldas Novas (CLV) and Cabo Frio (CFB). As a result, during the fourth quarter GOL once again operated all of the domestic network bases that were operating before the pandemic. The Company remains attentive to rulings issued by governments of other countries and demand behavior in order to guide when to operate its international network. The Company concluded its 2020 fleet plan adjustments and ended December with a total fleet of 127 B737s, including seven MAX and 95 aircraft in operation, an increase of 24 aircraft compared to the end of September/20.
Liquidity and financial obligations: In 2020, GOL’s Management fully honored its commitments to the global capital markets, including the amortization of its 2022 Senior Notes (US$78 million in 1Q20), and its Term Loan B in the amount US$300 million in 3Q20. During 4Q20, the Company amortized approximately R$1 billion in financial debt, significantly reducing its short-term debt, which is primarily concentrated with local banks with which GOL maintains good relationships. Including the financeable amounts of deposits and unencumbered assets, the Company’s potential liquidity sources total over R$5 billion. The average maturity of the GOL’s long-term debt, excluding aircraft leases and perpetual notes, is approximately three years.
“Even during this very challenging year, we kept our liability management discipline and addressed all the relevant financial obligations provided for in our cash flow. We ended 2020 by significantly reducing our short-term debt and have strengthened our solid partnership with the main providers of working capital. Our new secured debt program also shows that the Company’s decision to wait for the best moment and cost in accessing capital was correct and aligned with value creation, increasing financial flexibility and reinforcing capital structure,” said Richard Lark, CFO. “Our financial management since the beginning of this pandemic reflects GOL’s commitment to having a sound capital structure and our focus on minimizing costs and strengthening the balance sheet as we manage through to a greater recovery.”
Proposal to Combine GLA and Smiles: In December, GOL and GLA (GOL Linhas Aéreas) submitted to Smiles’ Board of Directors a new proposal to combine the Company’s two operating subsidiaries, GLA, the largest domestic airline in Brazil, and Smiles, the loyalty and mileage program. With greater visibility on what is required to more efficiently manage its businesses, GOL believes the proposed transaction is an important milestone to maximize future value for both the Company and Smiles’ shareholders by increasing the GOL Group’s market competitiveness. As the Company manages through a challenging operating environment in Brazil, GOL believes the current situation makes the successful conclusion of this transaction even more critical for both companies and will reduce the risks both companies are facing during the pandemic. The proposed corporate merger has been submitted to the Company and Smiles’ shareholders for approval at a shareholders meeting to be held on March 24th.
Kakinoff commented: “We believe that this reorganization will ensure the continued necessary competitiveness of the airline and the loyalty program, simplify governance, strengthen the combined capital structure, and decrease operating, administrative and financial costs, which also reduces tax inefficiencies – thereby maximizing value for all shareholders of the GOL Group.”
| 2 |
Operating and Financial Indicators
| Traffic Data – GOL (in Millions) | 4Q20 | 4Q19 | % Var. | 2020 | 2019 | % Var. |
| RPK GOL – Total | 6,242 | 10,807 | -42.2% | 20,127 | 41,862 | -51.9% |
| RPK GOL –Domestic | 6,242 | 9,630 | -35.2% | 18,837 | 36,391 | -48.2% |
| RPK GOL – International | - | 1,176 | NM | 1,290 | 5,472 | -76.4% |
| ASK GOL – Total | 7,698 | 13,257 | -41.9% | 25,142 | 51,065 | -50.8% |
| ASK GOL – Domestic | 7,698 | 11,667 | -34.0% | 23,358 | 43,897 | -46.8% |
| ASK GOL – International | - | 1,590 | NM | 1,784 | 7,168 | -75.1% |
| GOL Load Factor – Total | 81.1% | 81.5% | -0.4 p.p. | 80.1% | 82.0% | -1.9 p.p. |
| GOL Load Factor – Domestic | 81.1% | 82.5% | -1.4 p.p. | 80.6% | 82.9% | -2.3 p.p. |
| GOL Load Factor – International | 0.0% | 74.0% | NM | 72.3% | 76.3% | -4.0 p.p. |
| Operating Data | 4Q20 | 4Q19 | % Var. | 2020 | 2019 | % Var. |
| Revenue Passengers - Pax on Board ('000) | 5,199 | 9,660 | -46.2% | 16,776 | 36,445 | -54.0% |
| Aircraft Utilization (Block Hours/Day) | 8.9 | 12.2 | -27.0% | 9.6 | 12.3 | -22.0% |
| Departures | 37,088 | 68,228 | -45.6% | 124,528 | 259,377 | -52.0% |
| Total Seats (‘000) | 6,525 | 12,142 | -46.3% | 21,540 | 45,574 | -52.7% |
| Average Stage Length (km) | 1,167 | 1,089 | 7.2% | 1,152 | 1,114 | 3.4% |
| Fuel Consumption (mm liters) | 216 | 382 | -43.5% | 722 | 1,475 | -51.1% |
| Full-time Employees (at Period End) | 13,899 | 16,113 | -13.7% | 13,899 | 16,113 | -13.7% |
| Average Operating Fleet(6) | 91 | 117 | -22.2% | 71 | 113 | -37.2% |
| On-time Departures | 92.5% | 86.2% | 6.3 p.p. | 93.7% | 89.0% | 4.7 p.p. |
| Flight Completion | 99.2% | 99.2% | 0.0 p.p. | 97.8% | 98.1% | -0.3 p.p. |
| Passenger Complaints (per 1,000 pax) | 0.56 | 0.88 | -36.4% | 0.92 | 1.12 | -17.9% |
| Lost Baggage (per 1,000 pax) | 2.07 | 2.08 | -0.5% | 2.10 | 2.09 | 0.5% |
| Financial Data | 4Q20 | 4Q19 | % Var. | 2020 | 2019 | % Var. |
| Net YIELD (R$ cents) | 27.55 | 33.17 | -16.9% | 28.74 | 31.24 | -8.0% |
| Net PRASK (R$ cents) | 22.34 | 27.04 | -17.4% | 23.00 | 25.61 | -10.2% |
| Net RASK (R$ cents) | 24.57 | 28.69 | -14.4% | 25.34 | 27.15 | -6.7% |
| CASK (R$ cents)(4) | 26.44 | 21.10 | 25.3% | 25.42 | 21.97 | 15.7% |
| CASK Ex-Fuel (R$ cents)(4) | 19.00 | 13.49 | 40.8% | 17.36 | 14.05 | 23.6% |
| Adjusted CASK(6) | 20.06 | 21.10 | -4.9% | 19.51 | 21.97 | -11.2% |
| Adjusted CASK(6) Ex-Fuel (R$ cents)(4) | 13.72 | 13.49 | 1.7% | 12.33 | 14.05 | -12.2% |
| Breakeven Load Factor(4) | 87.2% | 60.0% | 27.2 p.p. | 80.3% | 66.3% | 14.0 p.p. |
| Average Exchange Rate(1) | 5.3921 | 4.1158 | 31.0% | 5.1578 | 3.9461 | 30.7% |
| End of Period Exchange Rate(1) | 5.1967 | 4.0307 | 28.9% | 5.1967 | 4.0307 | 28.9% |
| WTI (Average per Barrel. US$)(2) | 41.44 | 56.87 | -27.1% | 39.13 | 57.04 | -31.4% |
| Price per Liter Fuel (R$)(3) | 2.32 | 2.71 | -14.4% | 2.55 | 2.79 | -8.6% |
| Gulf Coast Jet Fuel (Average per Liter, US$)(2) | 0.28 | 0.49 | -42.9% | 0.28 | 0.50 | -44.0% |
(1) Source: Brazilian Central Bank; (2) Source: Bloomberg; (3) Fuel expenses excluding hedge results and PIS/COFINS credits/liters consumed; (4) Excluding non-recurring expenses and Idle expenses. (5) Average operating fleet excluding aircraft in sub-leasing and MRO. Certain calculations may not match with the financial statements due to rounding. (6) Considers only expenses related to current operating levels (4Q20).
Domestic market
GOL’s domestic demand was 6,242 million RPK, a decrease by 35.2%, while ASK supply reduced 34.0% in comparison to 4Q19, and the load factor reached 81.1% in the quarter. The Company transported 5.2 million Clients during the quarter, a decrease of 43.3% compared with the same quarter in 2019. For the 5th consecutive year, GOL remains the leader in transporting passengers in Brazil.
International market
In 4Q20, the Company carried out non-regular charter flights for soccer teams and the Brazilian National Team in championships, related to its sponsorship of national teams. As most country borders were closed, GOL did not offer regular international flights.
Volume of Departures and Total Seats
The total volume of the Company’s departures was 37,088, a decrease of 45.6% over 4Q19. The total number of seats available to the market was 6.5 million in the fourth quarter of 2020, a decrease of 46.3% quarter-over-quarter.
PRASK, Yield and RASK
Net PRASK decreased by 17.4% in the quarter when compared to 4Q19, reaching 22.34 cents (R$), due to the decline of the levels of net passenger revenue and the ASK reduction of 41.9% in the quarter. GOL’s net RASK was 24.57 cents (R$) in 4Q20, a decrease of 14.4% over 4Q19. Net yield decreased 16.9% over 4Q19, reaching 27.55 cents (R$).
| 3 |
Net revenue
Net revenue within the quarter increased by 37% from October to December. Quarterly net revenue totaled R$1.9 billion, representing a decrease of 50.3% when compared to 4Q19, mainly due to the reduction in demand following the adoption of the social distancing by Customers and the closing of borders as a way of containing the worldwide contamination by Covid-19. Despite the significant decrease in the number of flights operated, cargo transportation revenues had a lower level of decrease, at 12.1%, mainly due to the launch in the quarter of CHEGOL, a new fast and efficient delivery service. Loyalty program revenues decreased 16.6% compared to 4Q19. In 2020, GOL achieved net revenue of R$6.4 billion, a 54.0% reduction compared to 2019.
Operating results
Adjusted EBIT for the quarter was R$346.8 million. Operating margin was 18.3%. On an available seat-kilometer basis, adjusted EBIT was 4.51 cents (R$). In 2020, adjusted EBIT reached R$1,554.2 million, with a margin of 24.4%, an increase of 5.3 p.p.
Adjusted EBITDA totaled R$558.5 million in the period. Adjusted EBITDA per available seat-kilometer was 7.25 cents (R$). In 2020, adjusted EBITDA reached R$2,469.0 million, with a margin of 38.7%, an increase of 7.2 p.p.
| EBIT and EBITDA reconciliation (R$ MM)* | 4Q20 | 4Q19 | % Var. | 2020 | 2019 | % Var. |
| Net Income (Loss) before NCI(1) | 234.5 | 747.6 | -68.6% | (4,962.2) | 691.6 | NM |
| (-) Income Taxes | 23.1 | 124.5 | -81.4% | 78.0 | 209.6 | -62.8% |
| (-) Financial Result | (401.7) | 134.1 | NM | 4,865.4 | 1,743.8 | 179.0% |
| EBIT(1) | (144.1) | 1,006.2 | NM | (18.8) | 2,645.0 | NM |
| EBIT Margin(1) | -7.6% | 26.5% | NM | -0.3% | 19.1% | NM |
| (-) Depreciation and Amortization | 276.9 | 458.5 | -39.6% | 1,105.1 | 1,728.0 | -36.0% |
| EBITDA(1) | 132.8 | 1,464.7 | -90.9% | 1,086.3 | 4,373.0 | -75.2% |
| EBITDA Margin(1) | 7.0% | 38.5% | -31.5 p.p. | 17.0% | 31.5% | -14.5 p.p. |
| Adjusted EBIT(2) | 346.8 | 1,006.2 | -65.5% | 1,554.2 | 2,645.0 | -41.2% |
| Adjusted EBIT Margin(2) | 18.3% | 26.5% | -8.2 p.p. | 24.4% | 19.1% | 5.3 p.p. |
| Adjusted EBITDA(2) | 558.5 | 1,464.7 | -61.9% | 2,469.0 | 4,373.0 | -43.5% |
| Adjusted EBITDA Margin(2) | 29.5% | 38.5% | -9.0 p.p. | 38.7% | 31.5% | 7.2 p.p. |
| EBITDA Calculation (R$ cents/ASK) | 4Q20 | 4Q19 | % Var. | 2020 | 2019 | % Var. |
| Net Revenues | 24.57 | 28.69 | -14.3% | 25.34 | 27.15 | -7.0% |
| Operating Expenses(1) | (26.44) | (21.10) | 25.1% | (25.42) | (21.97) | 15.5% |
| EBIT(1) | (1.87) | 7.59 | NM | (0.07) | 5.18 | NM |
| Depreciation and Amortization | (3.60) | (3.46) | 2.9% | (4.40) | (3.38) | 29.4% |
| EBITDA(1) | 1.73 | 11.05 | -84.5% | 4.32 | 8.56 | -50.0% |
| Adjusted EBIT(2) | 4.51 | 7.59 | -40.8% | 6.18 | 5.18 | 19.2% |
| Adjusted EBITDA(2) | 7.25 | 11.05 | -33.6% | 9.82 | 8.56 | 14.0% |
(1) Excluding non-recurring expenses and related to fleet idleness. * In accordance with CVM Instruction n.527, the Company presents the reconciliation of EBIT and EBITDA, whereby: EBIT = net income (loss) (+) income tax and social contribution (+) net financial result; and EBITDA = net income (loss) (+) income tax and social contributions (+) net financial result (+) depreciation and amortization. Some report values may differ from the financial statements due to rounding. (2) Considers expenses strictly related to current operating levels (3Q20).
Fleet
At the end of 4Q20, GOL's total fleet was 127 Boeing 737 aircraft, comprised of 120 NGs and seven (7) MAXs (operational). At the end of 4Q19, GOL's total fleet was 137 aircraft, of which seven (7) were MAXs (non-operational). The average age of the Company's fleet was 11.0 years at the end of 4Q20.
GOL does not operate widebody aircraft, and has no aircraft financed via the capital markets, EETCs or finance leases. Its operating fleet is 100% composed of narrowbody aircraft financed via operating leases.
| Total Fleet at the End of Period | 4Q20 | 4Q19 | % Var. | 3Q20 | % Var. |
| B737s | 127 | 137 | -10 | 129 | -2 |
| B737-7 NG | 23 | 24 | -1 | 22 | 1 |
| B737-8 NG | 97 | 106 | -9 | 100 | -3 |
| B737-8 MAX | 7 | 7 | 0 | 7 | 0 |
| 4 |
As of Dec. 31, 2020, GOL had 95 firm orders for the acquisition of Boeing 737 MAX aircraft, of which 73 were orders for 737 MAX-8 and 22 orders were for 737 MAX-10. The Company's fleet plan returns up to eleven (11) operational aircraft by the end of 2021, with the flexibility to return even more aircraft if necessary.
| Fleet Plan | 2021E | 2022E | 2023E | >2024E | Total |
| Operating Fleet at the End of the Year | 129 | 132 | |||
| Aircraft Commitments (R$ MM) | - | - | 3,353.7 | 19,915.4 | 23,269.2 |
At the end of 4Q20, the Company concluded renegotiations for part of its aircraft and operating engine leasing contracts with no purchase option, which resulted in contractual modifications related to term extensions and new monthly amounts compared to the original terms of the contracts. Leasing remeasurement took into account the new payment flows, the discount rate and the exchange rate on the date of the contractual changes. The calculated effects were recorded as a reduction in the lease liability in the amount of R$15.0 million, with a corresponding reduction in fixed assets of R$7.4 million and a gain of R$22.4 million in the operating result.
Relationship with Independent Auditors
When hiring services that are not related to external auditing from its independent auditors, Smiles bases its conduct on principles that preserve the auditor’s independence. Pursuant to internationally accepted standards, these principles consist of: (a) the auditors must not audit their own work, (b) the auditors must not execute managing functions for their clients and (c) the auditors must not represent their clients’ legal interests.
Based on the subparagraph III, article 2 of the CVM Instruction 381/2003, the Company adopts a formal procedure to hire services other than external auditing from our auditors, to consult its Audit Committee to ensure that those services shall not affect the independence and the objectivity, required for the independent audit performance. Additionally, formal statements are required from the auditors regarding their independence while providing such services.
The Company informs that its independent auditor for the period, Grant Thornton Auditores Independentes (“GT”) as the Company’s independent auditor for purposes of meeting the requirements of the CVM and Ernst & Young Auditores Independentes S.S. (“EY”) as the Company’s independent auditor for purposes of meeting the requirements of the U.S. Securities and Exchange Commission, did not provide additional services not related to auditing in the 2020 fiscal year.
| 5 |
Comments on business forecast trends
In 1Q21, the Company estimates an average operating fleet of 74 aircraft, which will represent 67% of the average fleet operated in the same quarter of 2019. Revenue for the quarter ended March 2021 is expected to decrease approximately 10% compared to the quarter ended December 2020.
GOL expects to end 1Q21 with R$1.9 billion in liquidity and R$14.3 billion in adjusted net debt. Several important initiatives are relevant to ensure that the Company maintains liquidity at expected levels in 1Q21.
With the objective of assisting investors and analysts in understanding how GOL is approaching its short-term planning, the Company is sharing these metrics:
| Metrics | 4Q20A | 1Q21E (Previous) | 1Q21E (Revised) |
Brazil Quarterly GDP Growth1 (%) Domestic Routes Served (average) % of 2019 Average Operating Fleet % of 2019 ASK (in million) % of 2019 Load Factor (%) | +2.4% ~161 94% ~91 77% ~7,698 58% ~81% | +3.0% ~167 85% ~102 92% ~9,400 76% ~78% | +1.0% ~159 81% ~74 67% ~7,100 55% ~82% |
Net Operating Revenues (R$ BN) % of 2019 Capex (R$ MM) Net Cash Generation (Burn) (R$/day) | ~1.9 50% ~62 ~3 | ~2.4 66% ~290 ~(2) | ~1.7 52% ~100 ~(3) |
Total Liquidity2 (R$ BN) Net Debt3 (R$ BN) Net Debt / LTM EBITDA Ratio3,4 (x) | ~2.6 ~13.0 ~5.3x | ~2.5 ~13.1 ~8x | ~1.9 ~14.3 ~17x |
(1) Sequential; Source: Brazilian Central Bank.
(2) Cash and cash equivalents, restricted cash, accounts receivable, securities and receivables.
(3) Excluding perpetual bonds and exchangeable notes.
(4) Pro-forma, excluding non-operating expenses and depreciation.
| 6 |
Glossary of industry terms
| · | AIRCRAFT LEASING: an agreement through which a company (the lessor), acquires a resource chosen by its client (the lessee) for subsequent rental to the latter for a determined period. |
| · | AIRCRAFT UTILIZATION: the average number of hours operated per day by the aircraft. |
| · | AVAILABLE SEAT KILOMETERS (ASK): the aircraft seating capacity multiplied by the number of kilometers flown. |
| · | AVAILABLE FREIGHT TONNE KILOMETER (AFTK): cargo capacity in tonnes multiplied by number of kilometers flown. |
| · | AVERAGE STAGE LENGTH: the average number of kilometers flown per flight. |
| · | EXCHANGEABLE SENIOR NOTES (ESN): convertible securities. |
| · | BLOCK HOURS: the time an aircraft is in flight plus taxiing time. |
| · | BREAKEVEN LOAD FACTOR: the passenger load factor that will result in passenger revenues being equal to operating expenses. |
| · | BRENT: oil produced in the North Sea, traded on the London Stock Exchange and used as a reference in the European and Asian derivatives markets. |
| · | CHARTER: a flight operated by an airline outside its normal or regular operations. |
| · | FREIGHT LOAD FACTOR (FLF): percentage of cargo capacity that is actually utilized (calculated dividing FTK by AFTK) |
| · | FREIGHT TONNE KILOMETERS (FTK): weight of revenue cargo in tonnes multiplied by number of kilometers flown by such tonnes. |
| · | LESSOR: the party renting a property or other asset to another party, the lessee. |
| · | LOAD FACTOR: the percentage of aircraft seating capacity that is actually utilized (calculated by dividing RPK by ASK). |
| · | LONG-HAUL FLIGHTS: long-distance flights (in GOL's case, flights of more than four hours' duration). |
| · | OPERATING COST PER AVAILABLE SEAT KILOMETER (CASK): operating expenses divided by the total number of available seat kilometers. |
| · | OPERATING COST PER AVAILABLE SEAT KILOMETER EX-FUEL (CASK EX-FUEL): operating cost divided by the total number of available seat kilometers excluding fuel expenses. |
| · | OPERATING REVENUE PER AVAILABLE SEAT KILOMETER (RASK): total operating revenue divided by the total number of available seat kilometers. |
| · | PASSENGER REVENUE PER AVAILABLE SEAT KILOMETER (PRASK): total passenger revenue divided by the total number of available seat kilometers. |
| · | PDP: credit for advance payments for aircraft purchases financing. |
| · | REVENUE PASSENGERS: the total number of passengers on board who have paid more than 25% of the full flight fare. |
| · | REVENUE PASSENGER KILOMETERS (RPK): the sum of the products of the number of paying passengers on a given flight and the length of the flight. |
| · | SALE-LEASEBACK: a financial transaction whereby a resource is sold and then leased back, enabling use of the resource without owning it. |
| · | SLOT: the right of an aircraft to take off or land at a given airport for a determined period of time. |
| · | SUB-LEASE: an arrangement whereby a lessor in a rent agreement leases the item rented to a fourth party. |
| · | TOTAL CASH: the sum of cash, financial investments and short and long-term restricted cash. |
| · | WTI BARREL: West Texas Intermediate - the West Texas region, where US oil exploration is concentrated. Serves as a reference for the US petroleum byproduct markets. |
| · | YIELD PER PASSENGER KILOMETER: the average value paid by a passenger to fly one kilometer. |
About GOL Linhas Aéreas Inteligentes S.A.
GOL serves more than 36 million passengers annually. With Brazil's largest network, GOL offers customers more than 750 daily flights to over 100 destinations in Brazil and in South America, the Caribbean and the United States. GOLLOG’s cargo transportation and logistics business serves more than 3,400 Brazilian municipalities and more than 200 international destinations in 95 countries. SMILES allows over 16 million registered clients to accumulate miles and redeem tickets to more than 700 destinations worldwide on the GOL partner network. Headquartered in São Paulo, GOL has a team of approximately 15,000 highly skilled aviation professionals and operates a fleet of 128 Boeing 737 aircraft, delivering Brazil's top on-time performance and an industry leading 20-year safety record. GOL has invested billions of Reais in facilities, products and services and technology to enhance the customer experience in the air and on the ground. GOL's shares are traded on the NYSE (GOL) and the B3 (GOLL4). For further information, visit www.voegol.com.br/ir.
| 7 |
Disclaimer
This release contains forward-looking statements relating to the prospects of the business, estimates for operating and financial results and growth prospects of GOL. These forward-looking statements, which are subject to change without prior notice, reflect mere estimates and projections and are based exclusively on the expectations of GOL’s management at the time the forward-looking statements are made. Further, these forward-looking statements depend substantially on external factors, many of which are highly uncertain, including (i) macroeconomic developments in Brazil and volatility in exchange rates, interest rates and other economic indicators, (ii) developments relating to the spread of Covid-19, such as the duration and extent of quarantine measures and travel restrictions and the impact on overall demand for air travel, (iii) the competitive environment in the Brazilian airline market and government measures that may affect it, (iv) fuel price volatility and (v) the risks disclosed in GOL’s filings with the U.S. Securities and Exchange Commission.
Non-GAAP Measures
To be consistent with industry practice, GOL discloses so-called non-GAAP financial measures, which are not recognized under IFRS or U.S. GAAP, including “net debt,” “total liquidity” and “EBITDA.” GOL’s management believes that disclosure of non-GAAP measures provides useful information to investors, financial analysts and the public in their review of its operating performance and their comparison of its operating performance to the operating performance of other companies in the same industry and other industries. However, these non-GAAP measures do not have standardized meanings and may not be directly comparable to similarly-titled measures adopted by other companies. Potential investors should not rely on information not recognized under IFRS as a substitute for the IFRS measures of earnings or cash flow in making an investment decision.
| 8 |
Report of the Statutory Audit Committee (CAE)
The Statutory Audit Committee (“CAE”) is a statutory body linked to the Board of Directors of Gol Linhas Aéreas Inteligentes S.A. (“Company”), with three independent members who are members of the Board of Directors and are elected by the board members annually. One of these members is qualified as a Financial Specialist. Under the terms of its charter, CAE’s main duties include supervising the quality and integrity of financial reports and statements, the compliance with legal, regulatory and statutory standards, the compliance with the processes related to risk management, policies and procedures for internal controls and the activities of the internal auditors. In addition, CAE supervises the work of the independent auditors, including their independence, the quality, and adequacy of the services provided, in addition to any differences of opinion with the management and approves the fees charged by them. Provides for the registration and exercise of independent audit activity within the scope of the Brazilian securities market (CVM), in addition to performing the function of Audit Committee, in compliance with the provisions of the Sarbanes Oxley Act, to which the Company is subject as a company registered with the Securities and Exchange Commission (“SEC”). Transactions with related parties, activities related to monitoring risks and compliance and the functioning of the complaints channel installed are also supervised by the CAE.
The activities carried out by CAE, through 6 meetings, for the year ended December 31, 2020, include:
| · | The CAE coordinator established the agendas and chaired the CAE meetings; |
| · | Evaluated the annual work plan and discussed the results of the activities performed by the independent auditors for the 2020 fiscal year; |
| · | Supervised the activities and performance of the Company’s internal audit, analyzing the annual work plan, discussing the results of the activities performed and the reviews carried out. The issues raised by the internal audit about improvements in the internal control environment are discussed with the responsible members of the management/board to implement continuous improvements. |
| · | Supervised and analyzed the effectiveness, quality, and integrity of the internal control mechanisms, in order, among others, to monitor the compliance with the provisions related to the integrity of the financial statements, including the quarterly earnings release and other interim statements; |
| · | Jointly supervised with the Management and the internal audit the agreements of different nature between the Company or its subsidiaries, on the one hand, and the controlling shareholder, on the other hand, to verify the compliance with the Company’s policies and controls in relation to the operations with related parties; |
| · | Gathered together with the independent auditors, KPMG Auditores Independentes, until the issue of the quarterly earnings release for the three-month period ended March 31, 2020, succeeded by Grant Thornton Auditores Independentes, for purposes of complying with CVM requirements, and by Ernst & Young Auditores Independentes, for purposes of complying with U.S. Securities and Exchange Commission requirements, having dealt with, among others, the following subjects: relationship and communication between CAE and the external auditors, scope of the auditors’ work, as well as the conclusions presented through the work plan of the Independent Auditors; and |
· Prepared CAE’s activity and operations report in 2020, following good corporate governance practices, as well as the applicable regulations.
| 9 |
Internal Control Systems
Based on the agenda defined for the 2020 fiscal year, CAE addressed the main issues related to the Company’s internal controls, evaluating the actions to mitigate risks and the commitment of the top management to its continuous improvement.
As a result of the meetings with the Company’s internal areas, the Statutory Audit Committee had the opportunity to offer suggestions to the Board of Directors to improve the processes, supervising the results already obtained in 2020.
Based on the work carried out throughout 2020, CAE believes that the internal control system of the Company and its subsidiaries is appropriate to the size and complexity of its business and structured to guarantee the efficiency of its operations, of the systems that generate financial reports, as well as the compliance with applicable internal and external standards.
Management of Corporate Risks
CAE members, within their legal duties and responsibilities, received information from the Management on the relevant corporate risks, including continuity risks, making their assessments and recommendations to increase the effectiveness of risk management processes, directly at meetings of the Board of Directors, contributing and ratifying the actions implemented in 2020.
Conclusion
CAE deemed the facts submitted to the body at the time of the work carried out and described in this Report to be appropriate, recommending, in its opinion, the approval of the Company’s audited financial statements for the year ended on December 31, 2020.
São Paulo, March 17, 2021.
André Béla Jánszky
Member of the Statutory Audit Committee
Antônio Kandir
Member of the Statutory Audit Committee
Francis James Leahy Meaney
Member of the Statutory Audit Committee
| 10 |
Report of the Fiscal Council
The Fiscal Council of Gol Linhas Aéreas Inteligentes S.A., within its legal and statutory duties, having examined the Management’s Report, the Statements of financial position, the statements of operations, the comprehensive income statement, the cash flow statement, the statement of changes in the shareholders’ equity, the statement of added value and the respective notes, individual and consolidated, related to the fiscal year ended on December 31, 2020, and accompanied by the independent auditors’ report, issues an opinion that the aforementioned pieces duly reflect the Company’s equity situation and economic-financial position on December 31, 2020, recognizing that they are able to be deliberate by the annual Shareholders’ Meeting.
São Paulo, March 17, 2021.
Renato Chiodaro
Chairman of the Fiscal Council
Marcelo Moraes
Member of the Fiscal Council
Marcela de Paiva
Member of the Fiscal Council
| 11 |
Executive Officers’ Statement on the Financial Statements
In compliance with the provisions of CVM Instruction 480/09, the officers state that they have discussed, reviewed and agreed with the financial statements for the year ended on December 31, 2020.
São Paulo, March 17, 2021.
Paulo Sérgio Kakinoff
President and Chief Executive Officer
Richard Freeman Lark Jr.
Executive Vice President and Chief Financial Officer
| 12 |
Executive Officers’ Statement on the Independent Auditor’s Report
In compliance with the provisions in CVM Instruction 480/09, the Board states that it has discussed, reviewed and agreed with the opinion issued by Grant Thornton Auditores Independentes in the independent auditor report on the parent company and consolidated financial statements for the year ended on December 31, 2020.
São Paulo, March 17, 2021.
Paulo Sérgio Kakinoff
President and Chief Executive Officer
Richard Freeman Lark Jr.
Executive Vice President and Chief Financial Officer
| 13 |

(Free translation from the original issued in Portuguese. In the event of any discrepancies, the Portuguese language version shall prevail.)
Independent auditor’s report on the individual and consolidated financial statements
To the Shareholders, Directors and Management of
GOL Linhas Aéreas Inteligentes S.A.
São Paulo – SP
Opinion
We have audited the accompanying individual and consolidated financial statements of GOL Linhas Aéreas Inteligentes S.A. (the “Company”), identified as parent and consolidated, respectively, which comprise the statement of financial position as of December 31, 2020, and the respective statements of income, of comprehensive income, of changes in equity and of cash flows for the year then ended, and notes to the consolidated financial statements, including a summary of significant accounting policies.
Opinion on the individual financial statements
In our opinion, the individual financial statements referred to above present fairly, in all material respects, the financial position of GOL Linhas Aéreas Inteligentes S.A. as of December 31, 2020, and its financial performance and its cash flows for the year then ended, in accordance with accounting practices adopted in Brazil.
Opinion on the consolidated financial statements
In our opinion, the consolidated financial statements referred to above present fairly, in all material respects, the consolidated financial position of GOL Linhas Aéreas Inteligentes S.A. as of December 31, 2020, and its consolidated financial performance and consolidated cash flows for the year then ended, in accordance with accounting practices adopted in Brazil and International Financial Reporting Standards (IFRS) issued by the International Accounting Standards Board (Iasb).
Basis for opinion
We conducted our audit in accordance with Brazilian and International Standards on Auditing (ISAs).
Our responsibilities under those standards are further described in the “Auditor’s responsibilities for the audit of the individual and consolidated financial statements” section of our report. We are independent of the Company and its subsidiaries in accordance with the relevant ethical requirements set forth in the Code of Ethics for Professional Accountants and the professional standards issued by the Federal Accounting Council and we have fulfilled our other ethical responsibilities in accordance with these requirements. We believe that the audit evidence we have obtained is sufficient and appropriate to provide a basis for our opinion.
| 14 |
Significant uncertainty as to the ability to continue as a going concern
We draw attention to Note 2, which states that the individual and consolidated financial statements were prepared under the going concern. Additionally, as described in Note 1, the Company faced recurring reductions in operations during 2020 mainly due to the effects of the COVID-19 pandemic, with a significant decrease in demand (a 56% reduction in passengers revenues in 2020 compared to 2019), and recorded net working capital deficit and equity deficiency as of December 31, 2020, which, together with other events and conditions, indicate the existence of material uncertainty that may cast significant doubt about the Company’s ability to continue as a going concern. The plans and actions being developed by Management to restore the Company’s financial-economic balance and financial position are described in Note 1. The individual and consolidated financial statements do not include any adjustments that may arise from the result of such uncertainties. Our opinion is not qualified regarding this matter.
Key audit matters
Key audit matters are those matters that, in our judgment, were of most significance in our audit in the current period. These matters were addressed in the context of our audit of the individual and consolidated financial statements taken as a whole and in forming our opinion on such individual and consolidated financial statements, and, therefore, we do not provide a separate opinion on these matters. In addition to the matter described in the “Significant uncertainty as to the ability to continue as a going concern” section, we determined that the matters below are the key audit matters that should be communicated in our report.
1. Passengers transport revenues (Notes 4.18.1, 8 and 29)
Why the matter was determined to be a key audit matter
As of December 31, 2020, the Company's passengers transportation revenues amounted to R$ 5,958 million, being recognized when the transportation service is provided. The process of recognizing this revenue is highly dependent on information technology systems, in addition to considering other complex aspects that may affect its recognition, such as the registration of tickets sold and not flown (and respective liabilities), among others. As a consequence, this matter was considered as a key audit matter and an area of focus in our audit due to its relevance in the context of the individual and consolidated financial statements, since the audit of passengers transport revenues, including the respective information generated by the environment of information technology mentioned above, required the performance of audit procedures with the involvement of our information technology specialists that, among other procedures, examined the design and carried out evaluation and tests of the integrity of the information technology environment, aiming to verify its sufficiency in the recognition of passengers transport revenues.
How the matter was addressed in our audit
Our audit procedures included, among others:
| · | with the involvement of our specialists in audit of systems, we identified the relevant systems that support the Company's passengers revenue recognition process, evaluated the design of the general controls of the processing environment and tested the operational effectiveness of these controls, including, when necessary, the tests of compensatory controls related to the operation, information security, development and maintenance of relevant systems focused on the aforementioned process; |
| · | we reviewed the design of the controls and performed audit procedures to test the records obtained from the information technology systems related to the transaction records of tickets sold, tickets flown and respective revenue recognition; |
| · | we carried out tests of details in the respective transactions and tests in the reconciliations provided by the Company; |
| · | evaluated if the disclosures in the individual and consolidated financial statements consider relevant information. |
Based on results of the auditing procedures previously described, we considered that the balances related to passengers transport revenues, as well as the respective disclosures, are acceptable in the context of the individual and consolidated financial statements taken as a whole. However, as a result of the aforementioned procedures, we identified a significant deficiency in the Information Technology systems that did not result in adjustments or reclassifications in the individual and consolidated financial statements.
| 15 |
2. Impairment of intangible assets – goodwill and airport slot rights (Note 16)
Why the matter was determined to be a key audit matter
As of December 31, 2020, the Company’s intangible assets having indefinite useful life (goodwill and airport slot rights) amounted to R$1,581 million. As discussed in Note 16 to the individual and consolidated financial statements, such assets are tested for impairment at least annually for each cash-generating unit. The auditing procedures to determine that the goodwill and the Company’s airport slot rights are adequate and recorded at their recoverable values are activities that require complex calculations and evaluations to be made due to the significant uncertainty inherent in the process of estimating and determining the recoverable use in use of said assets. The analyses performed include complex, significant and highly subjective assumptions that are used by Management, such as discount rates, exchange rates, aviation kerosene barrel price, among others. These assumptions are prospective and may be affected by future economic and market conditions, impacting the individual and consolidated financial statements. Due to these aspects, this issue was considered a key audit matter in our audit for the current year.
How the matter was addressed in our audit
Our audit procedures included, among others:
| · | examine the analysis prepared by Management, supported by our internal specialists, to evaluate the reasonableness of the model used in Management´s evaluation, the logical and arithmetic adequacy of the cash flow projections as well as test the consistency of the key information and assumptions used in cash flows projections by comparing them to budgets approved by management and the assumptions, market inputs and current industry trends (in addition to the Company´s historical results); |
| · | discussion with Management about the business plan; |
| · | challenging the assumptions used by Management in order to corroborate if there were assumptions not consistent and/or that might be revised; |
| · | sensitivity analysis for significant assumptions to evaluate the change in the assets’ value in use resulting from changes and assumptions; |
| · | analyzes and evaluation of the disclosures required in the individual and consolidated financial statements for consistency with the information and representations obtained from Management. |
Based on the procedures performed, we considered that the assumptions and methodologies used by the Company to evaluate the recoverable value of such assets are reasonable, and the information presented in the individual and consolidated financial statements is consistent with the information analyzed in our auditing procedures in the context of those individual and consolidated financial statements taken as a whole.
Other matters
Statements of value added
The individual and consolidated statements of value added (DVA) for the year ended December 31, 2020, prepared under the responsibility of the Company’s management and presented as supplemental information for IFRS purposes, have been subject to auditing procedures which were performed together with the audit of the Company’s financial statements. In forming our opinion, we evaluated if these statements are reconciled to the financial statements and accounting records, as applicable, and if their form and content are in accordance with the criteria defined in NBC TG 09 – Statement of Value Added. In our opinion, these statements of value added were appropriately prepared, in all material respects, according to the criteria defined in said technical pronouncement and are consistent in relation to the individual and consolidated financial statements taken as a whole.
Audit of the figures corresponding to the comparative year
The examination of the individual and consolidated financial statements as of December 31, 2019, which corresponding figures are presented for comparison purposes, was conducted under the responsibility of another independent auditor, which issued a report thereon dated February 28, 2020 without modifications (containing an emphasis-of-matter paragraph regarding the corporate reorganization plan then under discussion).
| 16 |
Other information accompanying the individual and consolidated financial statements and auditor’s report thereon
The Company’s Management is responsible for this other information that is included in the Management Report.
Our opinion on the individual and consolidated financial statements does not cover the Management Report and we do not express any form of assurance conclusion thereon.
In connection with our audit of the individual and consolidated financial statements, our responsibility is to read the Management Report and, in doing so, consider whether this report is materially inconsistent with the financial statements or our knowledge obtained in the audit, or otherwise, appears to be materially misstated. If, based on the work we have performed, we conclude that there is a material misstatement in the Management Report, we are required to report this fact. We have nothing to report in this regard.
Responsibilities of Management and those charged with governance for the individual and consolidated financial statements
Management is responsible for the preparation and fair presentation of the individual and consolidated financial statements in accordance with accounting practices adopted in Brazil and International Financial Reporting Standards (IFRS), issued by the International Accounting Standards Board (IASB), and for such internal control as management determines is necessary to enable the preparation of financial statements that are free from material misstatement, whether due to fraud or error.
In preparing the individual and consolidated financial statements, management is responsible for assessing the Company’s ability to continue as a going concern, disclosing, as applicable, matters related to going concern and using the going concern basis of accounting in preparing the financial statements, unless management either intends to liquidate the Company or to cease operations, or has no realistic alternative but to do so.
Those charged with the Company’s and its subsidiaries’ governance are responsible for overseeing the financial reporting process.
Auditor’s responsibility for the audit of the individual and consolidated financial statements
Our objectives are to obtain reasonable assurance about whether the individual and consolidated financial statements, taken as a whole, are free from material misstatement, whether due to fraud or error, and to issue an auditor’s report that includes our opinion. Reasonable assurance is a high level of assurance, but is not a guarantee that an audit conducted in accordance with Brazilian and International Standards on Auditing will always detect a material misstatement when it exists. Misstatements can arise from fraud or error and are considered material if, individually or in the aggregate, they could reasonably be expected to influence the economic decisions of users taken on the basis of these financial statements.
As part of an audit in accordance with Brazilian and International Standards on Auditing, we exercise professional judgment and maintain professional skepticism throughout the audit. We also:
| · | identify and assess the risks of material misstatement of the individual and consolidated financial statements, whether due to fraud or error, design and perform audit procedures responsive to those risks, and obtain audit evidence that is sufficient and appropriate to provide a basis for our opinion. The risk of not detecting a material misstatement resulting from fraud is higher than for one resulting from error, as fraud may involve override of internal control, collusion, forgery, intentional omissions or misrepresentations; |
| · | obtain an understanding of internal control relevant to the audit in order to design audit procedures that are appropriate in the circumstances, but not for the purpose of expressing an opinion on the effectiveness of the Company’s and its subsidiaries’ internal control; |
| · | evaluate the appropriateness of accounting policies used and the reasonableness of accounting estimates and related disclosures made by management; |
| · | conclude on the appropriateness of management’s use of the going concern basis of accounting and, based on the audit evidence obtained, whether a material uncertainty exists related to events or conditions that may cast significant doubt on the Company’s ability to continue as a going concern. If we conclude that a material uncertainty exists, we are required to draw attention in our auditor’s report to the related disclosures in the individual and consolidated financial statements or, if such disclosures are inadequate, to modify our opinion. Our conclusions are based on the audit evidence obtained up to the date of our auditor’s report. However, future events or conditions may cause the Company to cease to continue as a going concern; |
| 17 |
| · | evaluate the overall presentation, structure and content of the financial statements, including the disclosures, and whether the individual and consolidated financial statements represent the underlying transactions and events in a manner that achieves fair presentation; |
| · | obtain sufficient and appropriate audit evidence regarding the financial statements of the entities or business activities within the Group to express an opinion on the individual and consolidated financial statements. We are responsible for the direction, supervision and performance of the group audit and, consequently, for the audit opinion. |
We communicate with those charged with governance regarding, among other matters, the planned scope and timing of the audit and significant audit findings, including any significant deficiencies in internal control that we may have identified during our audit.
We also provide those charged with governance with a statement that we have complied with relevant ethical requirements, including those regarding independence, and communicate to them all relationships and other matters that may reasonably be thought to bear on our independence and, where applicable, related safeguards.
From the matters communicated with those charged with governance, we determined those matters that were of most significance in the audit of the financial statements for the current year and are, therefore, the key audit matters. We describe these matters in our audit report, unless law or regulation preclude public disclosure about the matter or when, in extremely rare circumstances, we determine that a matter should not be communicated in our report because the adverse consequences of doing so would reasonably be expected to outweigh the public interest benefits of such communication.
São Paulo, March 17, 2021
Daniel Gomes Maranhão Junior
Grant Thornton Auditores Independentes
| 18 |
 | Balance Sheets December 31, 2020 and 2019 (In thousand of Reais) |
| Parent Company | Consolidated | ||||
| Assets | Note | 2020 | 2019 | 2020 | 2019 |
| Current | |||||
| Cash and Cash Equivalents | 5 | 423,937 | 1,016,746 | 662,830 | 1,645,425 |
| Financial Investments | 6 | 236 | 673 | 628,343 | 953,762 |
| Restricted Cash | 7 | 4,194 | 6,399 | 355,769 | 304,920 |
| Trade Receivables | 8 | - | - | 739,699 | 1,229,530 |
| Inventories | 9 | - | - | 195,638 | 199,213 |
| Advances to Suppliers and Third-Parties | 10 | 10,441 | 37 | 318,769 | 142,338 |
| Taxes to Recover | 11 | 6,295 | 5,163 | 186,955 | 309,674 |
| Rights from Derivative Transactions | 34.2 | - | - | 12,526 | 3,500 |
| Dividends and Interest on Shareholders’ Equity to Receive | 28.1 | 24,120 | 69,548 | - | - |
| Other Credits | 9,640 | 10,039 | 144,822 | 139,015 | |
| Total Current | 478,863 | 1,108,605 | 3,245,351 | 4,927,377 | |
| Noncurrent | |||||
| Financial Investments | 6 | - | - | 992 | - |
| Restricted Cash | 7 | 7 | - | 188,838 | 139,386 |
| Deposits | 13 | 118,261 | 112,502 | 2,058,455 | 1,968,355 |
| Advances to Suppliers | 10 | - | - | 89,701 | 48,387 |
| Taxes to Recover | 11 | 12,102 | 22,449 | 318,404 | 174,142 |
| Deferred Taxes | 12 | 53,492 | 56,903 | 53,563 | 59,809 |
| Other Credits | - | - | 34,338 | 991 | |
| Credits with Related Parties | 28.1 | 4,897,331 | 3,440,701 | - | - |
| Rights from Derivative Transactions | 34.2 | 87,663 | 143,969 | 116,283 | 143,969 |
| Investments | 14 | 574,717 | 501,986 | 815 | 1,254 |
| Property, Plant & Equipment | 15 | 68,660 | 240,379 | 4,960,288 | 6,058,101 |
| Intangible Assets | 16 | - | - | 1,747,108 | 1,776,675 |
| Total Noncurrent | 5,812,233 | 4,518,889 | 9,568,785 | 10,371,069 | |
| Total | 6,291,096 | 5,627,494 | 12,814,136 | 15,298,446 | |
The accompanying notes are an integral part of these financial statements - parent company and consolidated.
| 19 |
| | Balance Sheets December 31, 2020 and 2019 (In thousand of Reais) |
| Parent Company | Consolidated | ||||
| Liabilities | Note | 2020 | 2019 | 2020 | 2019 |
| Current | |||||
| Loans and Financing | 17 | 638,964 | 1,359,547 | 2,353,279 | 2,543,039 |
| Leases to Pay | 18 | - | - | 1,317,008 | 1,404,712 |
| Suppliers | 19 | 72,702 | 19,116 | 1,612,536 | 1,286,275 |
| Suppliers - Forfaiting | 20 | - | - | - | 554,467 |
| Labor Obligations | 181 | 137 | 334,670 | 396,010 | |
| Taxes to Collect | 21 | 292 | 4,261 | 73,614 | 116,523 |
| Landing Fees | - | - | 907,958 | 728,339 | |
| Advance Ticket Sales | 22 | - | - | 2,050,799 | 1,966,148 |
| Frequent-Flyer Program | 23 | - | - | 1,258,502 | 1,009,023 |
| Advances from Customers | - | - | 27,897 | 16,424 | |
| Provisions | 24 | - | - | 169,381 | 203,816 |
| Obligations with Derivative Transactions | 34.2 | - | - | 5,297 | 9,080 |
| Other Liabilities | - | - | 287,275 | 128,744 | |
| Total Current | 712,139 | 1,383,061 | 10,398,216 | 10,362,600 | |
| Noncurrent | |||||
| Loans and Financing | 17 | 6,990,749 | 5,235,593 | 7,623,687 | 5,866,802 |
| Leases to Pay | 18 | - | - | 6,267,184 | 4,648,068 |
| Suppliers | 19 | - | - | 32,658 | 10,142 |
| Taxes to Collect | 21 | - | - | 32,362 | 84 |
| Frequent-Flyer Program | 23 | - | - | 322,460 | 171,651 |
| Provisions | 24 | - | - | 1,353,515 | 1,053,240 |
| Deferred Taxes | 12 | - | - | 219,634 | 244,041 |
| Obligations to Related Parties | 28.1 | 8,791 | 163,350 | - | - |
| Obligations with Derivative Transactions | 34.2 | - | - | - | 11,270 |
| Provision for Investment Losses | 14 | 12,670,479 | 6,498,660 | - | - |
| Other Liabilities | 316,030 | 23,501 | 331,479 | 35,965 | |
| Total Noncurrent | 19,986,049 | 11,921,104 | 16,182,979 | 12,041,263 | |
| Shareholders’ Equity | |||||
| Share Capital | 25.1 | 3,009,436 | 3,008,178 | 3,009,436 | 3,008,178 |
| Shares to Issue | 1,180 | 584 | 1,180 | 584 | |
| Treasury Shares | 25.2 | (62,215) | (102,543) | (62,215) | (102,543) |
| Capital Reserves | 207,246 | 225,276 | 207,246 | 225,276 | |
| Equity Valuation Adjustments | (577,369) | 188,247 | (577,369) | 188,247 | |
| Accumulated Losses | (16,985,370) | (10,996,413) | (16,985,370) | (10,996,413) | |
| Negative Shareholders’ Equity (Deficit) Attributable to the Parent Company | (14,407,092) | (7,676,671) | (14,407,092) | (7,676,671) | |
| Non-Controlling Interests | - | - | 640,033 | 571,254 | |
| Total Shareholders’ Equity (Deficit) | (14,407,092) | (7,676,671) | (13,767,059) | (7,105,417) | |
| Total | 6,291,096 | 5,627,494 | 12,814,136 | 15,298,446 | |
The accompanying notes are an integral part of these financial statements - parent company and consolidated.
| 20 |
 | Statements of Comprehensive Income Fiscal year ended on December 31, 2020 and 2019 (In thousands of Brazilian Reais - R$) |
| Parent Company | Consolidated | |||||
| Note | 2020 | 2019 | 2020 | 2019 | ||
| Net Revenue | ||||||
| Passenger | - | - | 5,783,323 | 13,077,743 | ||
| Cargo and Others | - | - | 588,494 | 786,961 | ||
| Total Net Revenue | 29 | - | - | 6,371,817 | 13,864,704 | |
| Cost from Services | 30 | - | - | (5,653,305) | (9,807,028) | |
| Gross Profit | - | - | 718,512 | 4,057,676 | ||
| Operating Revenues (Expenses) | ||||||
| Selling Expenses | - | - | (465,898) | (902,669) | ||
| Administrative Expenses | (44,506) | (212,783) | (1,319,981) | (1,341,698) | ||
| Other Revenues and Expenses, Net | 379,133 | 43,054 | 115,962 | 319,353 | ||
| Total Operating Expenses | 30 | 334,627 | (169,729) | (1,669,917) | (1,925,014) | |
| Equity Income (Expenses) | 14 | (5,326,571) | 509,926 | (439) | 77 | |
| Operating Profit (Loss) before Financial Results and Income Taxes | (4,991,944) | 340,197 | (951,844) | 2,132,739 | ||
| Financial results | ||||||
| Financial income | 528,365 | 155,838 | 736,969 | 389,563 | ||
| Financial expenses | (781,610) | (550,278) | (2,546,192) | (1,748,265) | ||
| Total financial results | 31 | (253,245) | (394,440) | (1,809,223) | (1,358,702) | |
| Income (Expenses) before Exchange Rate Variation, Net | (5,245,189) | (54,243) | (2,761,067) | 774,037 | ||
| Exchange rate variation, net | 31 | (733,302) | (87,133) | (3,056,226) | (385,092) | |
| (Loss) Income before Income Taxes | (5,978,491) | (141,376) | (5,817,293) | 388,945 | ||
| Income taxes | ||||||
| Current | (6,226) | (8,591) | (95,537) | (178,621) | ||
| Deferred | (3,411) | 32,694 | 17,579 | (30,986) | ||
| Total income taxes | 12 | (9,637) | 24,103 | (77,958) | (209,607) | |
| Net Income (Loss) for the Fiscal Year | (5,988,128) | (117,273) | (5,895,251) | 179,338 | ||
| Attributable to: | ||||||
| Shareholders of the Parent Company | (5,988,128) | (117,273) | (5,988,128) | (117,273) | ||
| Non-Controlling Shareholders | - | - | 92,877 | 296,611 | ||
| Basic Loss | 26 | |||||
| Per Common Share | (0.481) | (0.010) | (0.481) | (0.010) | ||
| Per Preferred Share | (16.831) | (0.333) | (16,831) | (0.333) | ||
| Diluted Loss | 26 | |||||
| Per Common Share | (0.481) | (0.010) | (0.481) | (0.010) | ||
| Per Preferred Share | (16.831) | (0.333) | (16.831) | (0.333) | ||
The accompanying notes are an integral part of these financial statements - parent company and consolidated.
| 21 |
| | Statements of Comprehensive Income Fiscal year ended on December 31, 2020 and 2019 (In thousands of Brazilian Reais - R$) |
| Parent Company | Consolidated | ||||
| 2020 | 2019 | 2020 | 2019 | ||
| Net Income (Loss) for the Fiscal Year | (5,988,128) | (117,273) | (5,895,251) | 179,338 | |
| Other Comprehensive Income that will be Reversed to Income (Expenses) | |||||
| Cash Flow Hedge, Net of Income Tax and Social Contribution | (781,033) | (30,021) | (781,033) | (30,021) | |
| Actuarial (Gains) Losses from Pension Plans and Post-Employment Benefits, Net of Income Tax and Social Contribution | 14,376 | (41,045) | 13,921 | (41,045) | |
| Cumulative Adjustment of Conversion into Subsidiaries | 564 | - | 1,010 | - | |
| (766,093) | (71,066) | (766,102) | (71,066) | ||
| Total Comprehensive Income (Expenses) for the Fiscal Year | (6,754,221) | (188,339) | (6,661,353) | 108,272 | |
| Comprehensive Income (Expenses) Attributed to: | |||||
| Shareholders of the Parent Company | (6,754,221) | (188,339) | (6,754,221) | (188,339) | |
| Non-Controlling Shareholders | - | - | 92,868 | 296,611 | |
The accompanying notes are an integral part of these financial statements - parent company and consolidated.
| 22 |
| | Statements of Changes in Shareholders’ Equity Fiscal year ended on December 31, 2020 and 2019 (In thousands of Brazilian Reais - R$) |
| Parent Company and Consolidated | ||||||||||||||
| Capital Reserves | Equity Valuation Adjustments | |||||||||||||
| Share Capital | Shares to Issue | Treasury Shares | Premium when Granting Shares | Special Premium Reserve of the Subsidiary | Share-Based Compensation | Unrealized Income (Expenses) on Hedge | Post-Employment Benefits | Other Comprehensive Income (Expenses) | Effects from Changes in the Equity Interest | Accumulated Losses | Negative Shareholders’ Equity (Deficit) Attributable to the Parent Company | Non-Controlling Interests
| Total | |
| Balances on December 31, 2018 | 2,942,612 | 2,818 | (126) | 17,497 | 70,979 | 117,413 | (500,022) | - | - | 759,984 | (8,396,567) | (4,985,412) | 480,061 | (4,505,351) |
| Initial Adoption of Accounting Standard - CPC 06 (IFRS 16) | - | - | - | - | - | - | - | - | - | - | (2,482,573) | (2,482,573) | (256) | (2,482,829) |
| Adjusted Balance on January 1, 2019 | 2,942,612 | 2,818 | (126) | 17,497 | 70,979 | 117,413 | (500,022) | - | - | 759,984 | (10,879,140) | (7,467,985) | 479,805 | (6,988,180) |
| Other Comprehensive Income (Expenses), Net | - | - | - | - | - | - | (30,021) | (41,045) | - | - | - | (71,066) | - | (71,066) |
| Net Income (Loss) for the Fiscal Year | - | - | - | - | - | - | - | - | - | - | (117,273) | (117,273) | 296,611 | 179,338 |
| Total Comprehensive Income (Expenses) for the Fiscal Year | - | - | - | - | - | - | (30,021) | (41,045) | - | - | (117,273) | (188,339) | 296,611 | 108,272 |
| Capital Increase due to Stock Options Exercised | 65,566 | (2,818) | - | - | - | 7,137 | - | - | - | - | - | 69,885 | 2,366 | 72,251 |
| Advances for Future Capital Increase | - | 584 | - | - | - | - | - | - | - | - | - | 584 | - | 584 |
| Effects from Dilution in the Equity Interest | - | - | - | - | - | - | - | - | - | (649) | - | (649) | 649 | - |
| Share Buyback | - | - | (102,417) | - | - | - | - | - | - | - | - | (102,417) | - | (102,417) |
| Subscription Bonus | - | - | - | - | 12,250 | - | - | - | - | - | - | 12,250 | - | 12,250 |
| Interest on Shareholders’ Equity Distributed by the Subsidiary Smiles | - | - | - | - | - | - | - | - | - | - | - | - | (208,177) | (208,177) |
| Balances on December 31, 2019 | 3,008,178 | 584 | (102,543) | 17,497 | 83,229 | 124,550 | (530,043) | (41,045) | - | 759,335 | (10,996,413) | (7,676,671) | 571,254 | (7,105,417) |
| Other Comprehensive Income (Expenses), Net | - | - | - | - | - | - | (781,033) | 14,376 | 564 | - | - | (766,093) | (9) | (766,102) |
| Loss for the Fiscal Year | - | - | - | - | - | - | - | - | - | - | (5,988,128) | (5,988,128) | 92,877 | (5,895,251) |
| Total Comprehensive Income (Expenses) for the Fiscal Year | - | - | - | - | - | - | (781,033) | 14,376 | 564 | - | (5,988,128) | (6,754,221) | 92,868 | (6,661,353) |
| Capital Increase due to Stock Options Exercised | 1,258 | (584) | - | - | - | - | - | - | - | - | - | 674 | - | 674 |
| Advances for Future Capital Increase | - | 1,180 | - | - | - | - | - | - | - | - | - | 1,180 | - | 1,180 |
| Transfer of Treasury Shares | - | - | 40,328 | - | - | (40,328) | - | - | - | - | - | - | - | - |
| Stock Option | - | - | - | - | - | 22,298 | - | - | - | - | - | 22,298 | 1,132 | 23,430 |
| Effects from Dilution in the Equity Interest | - | - | - | - | - | - | - | - | - | 477 | (829) | (352) | 352 | - |
| Interest on Shareholders’ Equity Distributed by the Subsidiary Smiles | - | - | - | - | - | - | - | - | - | - | - | - | (25,573) | (25,573) |
| Balances on December 31, 2020 | 3,009,436 | 1,180 | (62,215) | 17,497 | 83,229 | 106,520 | (1,311,076) | (26,669) | 564 | 759,812 | (16,985,370) | (14,407,092) | 640,033 | (13,767,059) |
The accompanying notes are an integral part of these financial statements - parent company and consolidated.
| 23 |
| | Statements of Cash Flows Fiscal year ended on December 31, 2020 and 2019 (In thousands of Brazilian Reais - R$) |
| Parent Company | Consolidated | |||
| 2020 | 2019 | 2020 | 2019 | |
| Net Income (Loss) for the Fiscal Year | (5,988,128) | (117,273) | (5,895,251) | 179,338 |
| Adjustments to Reconcile the Net Profit (Loss) to Cash Generated from Operating Activities | ||||
| Depreciation and Amortization | - | - | 1,870,552 | 1,727,982 |
| Provision for Doubtful Accounts | - | - | 1,095 | 5,668 |
| Provision for Legal Proceedings | - | - | 288,803 | 195,465 |
| Provisions for Inventory Obsolescence | - | - | 702 | 2,168 |
| Provision for Losses on Advance of Suppliers | - | 161,228 | 31,486 | 161,228 |
| Adjustment to Present Value of Assets and Liabilities | - | - | 63,493 | 10,604 |
| Deferred Taxes | 3,411 | (32,694) | (17,579) | 30,986 |
| Equity Income (Loss) | 5,326,571 | (509,926) | 439 | (77) |
| Share-Based Compensation | - | - | 23,430 | 40,725 |
| Sale-Leaseback | (372,712) | - | (551,942) | - |
| Actuarial Losses from Post-Employment Benefits | - | - | 10,677 | 4,907 |
| Foreign Exchange and Monetary Variation, Net | 872,622 | 82,657 | 3,114,032 | 399,174 |
| Interest on Loans and Leases | 472,956 | 344,192 | 1,545,847 | 1,126,527 |
| Provision for Aircraft and Engine Return | - | - | (58,702) | 231,821 |
| Provision for Maintenance Reserve and Deposits | - | - | 186,856 | 75,451 |
| Income (Expenses) from Derivatives Recognized in Income (Expenses) | 74,728 | 23,230 | 732,398 | 22,022 |
| Unrealized Income (Expenses) on Derivatives – ESN (*) | (374,994) | (40,717) | (374,994) | (40,717) |
| Extinction of Obligation due to the Reduced Contractual Term | - | - | (104,109) | (275,921) |
| Provision for Labor Obligations | - | - | 227,710 | 280,320 |
| Write-off of Property, Plant & Equipment and Intangible Assets | - | 3,301 | 96,594 | 152,017 |
| Other Provisions | - | - | (7,416) | (14,602) |
| Adjusted Net Income (Expenses) | 14,454 | (86,002) | 1,184,121 | 4,315,086 |
| Changes in Operating Assets and Liabilities: | ||||
| Trade Receivables | - | - | 498,901 | (384,147) |
| Financial Investments | 6,480 | 169,052 | (6,320) | 162,167 |
| Inventories | - | - | 2,873 | (21,240) |
| Advances to Suppliers and Third-Parties | (10,404) | (161,265) | (238,627) | (305,906) |
| Deposits | 9,361 | (2,141) | (52,016) | (399,345) |
| Taxes to Recover | 13,465 | 2,456 | (21,543) | (27,147) |
| Variable Leases | - | - | 18,731 | - |
| Suppliers | 53,682 | 8,335 | 392,236 | (232,021) |
| Suppliers - Forfaiting | - | - | (143,010) | 188,771 |
| Advance Ticket Sales | - | - | 84,651 | 292,161 |
| Frequent-Flyer Program | - | - | 400,288 | 161,821 |
| Advances from Customers | - | - | 11,473 | (153,543) |
| Labor Obligations | 44 | (341) | (289,050) | (253,074) |
| Landing Fees | - | - | 179,619 | 172,039 |
| Taxes to Collect | 372 | (20,375) | 82,716 | 179,706 |
| Obligations with Derivative Transactions | - | - | (779,462) | (167,556) |
| Payments for Lawsuits and Aircraft Return | - | - | (301,297) | (317,591) |
| Other Credits (Obligations) | 292,927 | (24,780) | 444,990 | (48,851) |
| Interest Paid | (515,278) | (330,824) | (619,557) | (470,794) |
| Income Tax Paid | (4,341) | (984) | (95,781) | (229,460) |
| Net Cash Flows from (Used in) Operating Activities | (139,238) | (446,869) | 753,936 | 2,461,076 |
| Loans Receivable from Related Parties | (680,441) | (758,935) | - | - |
| Financial Investments in Subsidiary | - | - | 271,935 | (501,607) |
| Restricted Cash | 2,198 | 33,385 | (100,301) | 377,826 |
| Interests Received | - | 5,950 | - | - |
| Dividends and Interest on Shareholders’ Equity Received through Subsidiary | 69,548 | 234,831 | - | - |
| Advances for Property, Plant & Equipment Acquisition, Net | - | (40,982) | (96,537) | (30,804) |
| Aircraft Sales Received | 448,482 | 348,389 | 448,482 | 348,389 |
| Return of Advance for Property, Plant and Equipment Acquisition | 73,600 | - | 73,600 | - |
| Acquisition of Property, Plant & Equipment | (10,419) | - | (501,416) | (872,570) |
| Acquisition of Intangible Assets | - | - | (63,993) | (75,845) |
| Net Cash Used in Investment Activities | (97,032) | (177,362) | 31,770 | (754,611) |
| 24 |
| | Statements of Cash Flows Fiscal year ended on December 31, 2020 and 2019 (In thousands of Brazilian Reais - R$) |
| Parent Company | Consolidated | |||
| 2020 | 2019 | 2020 | 2019 | |
| Funding from Loans and Leases | 2,357,656 | 1,638,011 | 2,933,529 | 2,194,662 |
| Loan Payments | (2,880,439) | (50,320) | (3,748,239) | (793,537) |
| Lease Payments | - | - | (1,058,692) | (1,617,677) |
| Treasury Share Buyback | - | (102,417) | - | (102,417) |
| Derivatives Paid (Received) | - | (153,252) | - | (407,322) |
| Dividends and Interest on Shareholders’ Equity Paid to Non-Controlling Shareholders | - | - | (63,949) | (210,242) |
| Subscription Bonus | - | 12,250 | - | 12,250 |
| Capital Increase | 1,180 | 31,526 | 1,180 | 31,526 |
| Shares to Issue | 674 | 584 | 674 | 584 |
| Net Cash Flows from (Used in) Financing Activities | (520,929) | 1,376,382 | (1,935,497) | (892,173) |
| Exchange Rate Change of the Cash of Subsidiaries Abroad | 164,390 | (17,870) | 167,196 | 4,946 |
Net (Decrease) Increase in Cash and Cash Equivalents | (592,809) | 734,281 | (982,595) | 819,238 |
| Cash and Cash Equivalents at the Start of the Fiscal Year | 1,016,746 | 282,465 | 1,645,425 | 826,187 |
| Cash and Cash Equivalents at the End of the Fiscal Year | 423,937 | 1,016,746 | 662,830 | 1,645,425 |
(*) Exchangeable Senior Notes
Transactions that do not affect cash are presented in Note 35 of these financial statements.
The accompanying notes are an integral part of these financial statements - parent company and consolidated.
| 25 |
| | Statement of Value Added Fiscal year ended on December 31, 2020 and 2019 (In thousands of Brazilian Reais - R$) |
| Parent Company | Consolidated | |||
| 2020 | 2019 | 2020 | 2019 | |
| Revenues | ||||
| Passenger, Cargo, and Other Transportation | - | - | 6,663,416 | 14,432,648 |
| Other Operational Revenues | 379,133 | 43,054 | 1,150,835 | 319,354 |
| Provision for Doubtful Accounts | - | - | (1,095) | (5,668) |
| 379,133 | 43,054 | 7,813,156 | 14,746,334 | |
| Inputs Acquired from Third Parties (includes ICMS and IPI) | ||||
| Fuel and Lubricant Suppliers | - | - | (2,094,946) | (4,047,344) |
| Materials, Energy, Third-Party Services, and Others | (31,911) | (207,078) | (2,375,632) | (3,182,978) |
| Aircraft Insurance | - | - | (34,592) | (25,676) |
| Sales and Marketing | (446) | (338) | (336,064) | (670,392) |
| Gross Added Value | 346,776 | (164,362) | 2,971,922 | 6,819,944 |
| Depreciation and Amortization | - | - | (1,870,552) | (1,727,982) |
| Net Added Value Produced by the Company | 346,776 | (164,362) | 1,101,370 | 5,091,962 |
| Added Value Received on Transfers | ||||
| Equity Income (Expenses) | (5,326,571) | 509,926 | (439) | 77 |
| Financial Revenue | 532,923 | 155,838 | 775,521 | 389,563 |
| Total Value Added (Distributed) to Distribute | (4,446,872) | 501,402 | 1,876,452 | 5,481,602 |
| Distribution of Value Added: | ||||
| Direct Compensation | 10,824 | 3,969 | 1,264,112 | 1,613,227 |
| Benefits | 1 | - | 180,770 | 194,429 |
| FGTS | - | - | 92,378 | 132,135 |
| Employees | 10,825 | 3,969 | 1,537,260 | 1,939,791 |
| Federal | 15,580 | (22,632) | 556,278 | 1,170,909 |
| State | - | - | 14,777 | 21,750 |
| Municipal | - | - | 2,920 | 4,119 |
| Taxes, Fees, and Contributions | 15,580 | (22,632) | 573,975 | 1,196,778 |
| Interest and Exchange Rate Change | 1,514,851 | 637,308 | 5,580,156 | 2,101,853 |
| Rents | - | - | 78,816 | 63,613 |
| Others | - | 30 | 1,496 | 229 |
| Third-Party Capital Compensation | 1,514,851 | 637,338 | 5,660,468 | 2,165,695 |
| Net Loss for the Fiscal Year | (5,988,128) | (117,273) | (5,988,128) | (117,273) |
| Net Profit for the Fiscal Year Attributed to Minority Shareholders | - | - | 92,877 | 296,611 |
| Shareholders’ Equity Compensation | (5,988,128) | (117,273) | (5,895,251) | 179,338 |
| Total Value Added (Distributed) to Distribute | (4,446,872) | 501,402 | 1,876,452 | 5,481,602 |
The accompanying notes are an integral part of these financial statements - parent company and consolidated.
| 26 |
| | Notes to the Financial Statements Fiscal Year ended December 31, 2020 (In thousands of Brazilian Reais - R$, except when otherwise indicated) |
| 1. | Operating Context |
Gol Linhas Aéreas Inteligentes S.A. (“Company” or “GOL”) is a limited liability company incorporated on March 12, 2004 under Brazilian laws. The Company’s bylaws states that the corporate purpose is exercising the equity control of GOL Linhas Aéreas S.A. (“GLA”), through subsidiaries or affiliated companies, as well as exploring:
| · | regular and non-regular flight transportation services of passengers, cargo and mailbags, domestically or internationally, according to the concessions granted by the regulator; |
| · | other activities in relation to flight transportation services of passengers, cargo and mailbags; |
| · | services to maintain and repair its own or third-party’s aircraft, engines and parts; |
| · | airplane hangar services; |
| · | services to manage aprons and runways, contract crew members and clean aircraft; |
| · | development of other activities related or supplementary to flight transportation and other above-mentioned activities; |
| · | development of frequent-flyer programs; and |
| · | interest in the capital of other companies as a partner or shareholder. |
The Company’s shares are traded on B3 S.A. - Brasil, Bolsa, Balcão (“B3”) and on the New York Stock Exchange (“NYSE”) under the ticker GOLL4 and GOL, respectively. The Company adopts B3’s Special Corporate Governance Practices Level 2 and is part of the Special Corporate Governance (“IGC”) and Special Tag Along (“ITAG”) indexes, created to distinguish companies that commit to special corporate governance practices.
The Company’s official headquarters are located at Praça Comandante Linneu Gomes, s/n, portaria 3, prédio 24, Jardim Aeroporto, São Paulo, Brazil.
| 1.1. | Measures taken by Management regarding COVID-19 and the Gradual Resumption of Demand |
The pandemic sparked by COVID-19, considered by the World Health Organization as a “public health emergency of international interest”, spread rapidly across the world, leading to unprecedented disruptions in the global economic activity.
Such crisis affected the macroeconomic environment, considering the uncertainties from public health, political and economic issues. As disclosed by the Brazilian Institute of Geography and Statistics (IBGE), in 2020, the Gross Domestic Product (GDP) decreased 4% when compared to 2019.
Among the measures taken in the country, which reduced the infection speed of the disease, are the recommendation of social distancing, restrictions and recommendations to reduce commute and closing the borders. Therefore, the airline industry was one of the first and most affected in its operations and income (expenses).
| 27 |
| | Notes to the Financial Statements Fiscal Year ended December 31, 2020 (In thousands of Brazilian Reais - R$, except when otherwise indicated) |
Since the beginning of the pandemic, GOL through the readjustment of its flight network, mainly in the second and third quarters of 2020 when there was a significant reduction in daily flights, has had consistent occupancy rates close to 80%, which, in addition to cost control and cash preservation measures implemented, have allowed the Company to be well positioned for the resumption of demand.
The flexible business model based on a single type of fleet has historically allowed the Company to reach the lowest operating costs and to manage the fleet's capacity to keep pace with the Brazilian GDP and passenger demand. This flexibility was key in the first half of 2020 to meet the more than 90% drop in passenger demand due to government measures to control the spread of the COVID-19 pandemic.
In 4Q 2020 the Company reached a 46% increase in consolidated gross sales, compared to 3Q 2020, particularly concentrated in leisure travel in domestic market, being the Company’s main area of activity. In the same period, GOL’s daily sales exceeded R$30 million, which represents over 80% of pre-pandemic sales levels. As for transportations carried out, on certain dates in December, GOL transported around 88,000 clients in a single day, equivalent to around 67% of the total recorded in the same day in 2019.
In 2020, the Company rebalanced amortization for the debt schedule, with significant debt maturities until 2024, and the issue of Senior Notes 2026, totaling US$200 million. GOL’s Management fully honored the financial commitments to the global capital market, including the amortization of its 2022 Senior Notes in March, the full payment of interest (coupons) on all its notes. As of December 31, 2020, the Company has a credit rating of “B3” by Moody's and “CCC+” by Fitch.
The Company’s management maintain continuous efforts in cash management in order to hold sufficient resources to fulfill its financial obligations for the upcoming twelve months, however, the scenario remains challenging due to uncertainties related to the pandemic, Brazilian economy recovery and air sector demand.
The Company, through its Executive Committee, with the participation of its entire management body, monitors the recovery of the demand and sets financial and operational strategies, besides defining how GOL can support society. Among the measures already taken by the management, the following stand out:
| 1.1.1 | Operational Readjustment - Flight Network |
On March 16, 2020, GOL reduced its capacity by 50 to 60% in the domestic market, and by 90 to 95% in the foreign market, to reflect the change in customer demand. The Company adjusted its network from 750 to 50 essential daily flights (essential flight network).
Compared to its essential flight network in April 2020, GOL has reopened 42 bases in Brazil and is now serving 63 bases, resuming operations in all the domestic bases operated in early 2020, with an average of 403 daily flights in 4Q 2020, which represents 54% of the daily frequency YoY. Since April 2020, GOL has not offered scheduled international flights.
With the continuous return of demand in 4Q 2020 and the beginning of the Brazilian summer, GOL expanded the flight offer to the Northeast region and launched four new domestic routes to ensure the most complete and comprehensive flight network to meet the resumption of leisure trips. With this, the Company reached 100% of national destinations operated in high season, compared to those operated in early 2020 (pre-pandemic). GOL's current share in the domestic market is around 40%, representing an increase of two percentage points since the beginning of the pandemic. GOL’s leadership in the domestic market and its network exposure in the Brazilian domestic market will further contribute to operational recovery, deleveraging and sustained competitiveness.
In February 2021, there was a 15% decrease in the search for the Company’s airline tickets, compared to January 2021, with a 28% reduction in the level of sales during this month, due to reduction in demand for travel as a consequence of “second wave” of Covid-19 cases in Brazil, customers awaiting vaccination and the beginning of low season. In response to the significant reduction in sales, increase in cancellations and no-shows, GOL’s network was reduced by 4% between the first and fourth weeks of February to adjust its costs to the level of inflows. In March 2021, the Company maintains the reduction plan with operation of around 250 flights per day, placing its operations at approximately 40% of March 2020.
| 28 |
| | Notes to the Financial Statements Fiscal Year ended December 31, 2020 (In thousands of Brazilian Reais - R$, except when otherwise indicated) |
| 1.1.2 | Preserving and Strengthening the Cash and Liquidity Position |
| · | Aircraft and Engine Leases: The Company concluded all its renegotiations with its aircraft leasing partners, which led to a decrease in cash flows from current and future leases, converting part of the fixed monthly payments into variable payments. GOL’s agreements are adjusted to the recovery in demand in 2021 and also represent actual savings in the Company’s unit cost structure. |
| · | Fuels: Agreements with suppliers to extend payments of the outstanding balance, which were resumed in installments from November 2020 to the end of 2021 and which will allow the Company to postpone the payment of subsequent operations as these installments are settled; |
| · | Personnel: Through the adoption of MP 936, converted into Law 14020/20, the Company adopted measures to reduce about 50% of payroll expenses and respective charges, reducing the working day, suspending employment agreements, adopting unpaid leave (LNR) and reducing salaries in 50% for employees and in 60% for officers, who were not included in MP 936’s scope. |
In June, the Company signed collective bargaining agreements with the National Aeronauts Union and the Airlines Workers Unions. Among the main initiatives of the package of measures with the Unions, we highlight the salary reduction of up to 50% for 12 months and voluntary plans (voluntary dismissal program, retirement, part-time, and unpaid leave). This package of measures came into effect on July 1st, with a term between 12 and 18 months, a period of post-crisis recovery, thus making it possible to manage a gradual growth of costs with the resumption of operations.
In addition, GOL postponed the payment of bonuses related to 2019 and vacation bonuses, besides the non-possibility of prepaying the 13th salary;
| · | Investments: Suspension of all non-essential investments, including the interruption of payments as “pre delivery payments (PDPs)” and the reduction of 34 orders for Boeing 737 MAX aircraft scheduled for 2020-2022 (from 129 to 95 future aircraft receipts) considering the Company's purchase orders with Boeing); |
| · | Engine Maintenance: Renegotiation with suppliers are constantly carried out, in line with the Company's operational needs; |
| · | Taxes, Contributions, and Social Charges: Postponement of federal tax payments due to measures enacted by the Federal Government; |
| · | Sales and Advertising: Suspension of advertising expenses, as well as the immediate interruption of projects that are not absolutely essential for the continuity of our operations; |
| · | Loans and Financing: The Company obtained the support of its main credit partners and renegotiated the extension of terms and rollovers of its debts, as explained in Note 17. Highlight for the postponement of debentures, the waiver obtained for the 2020 covenants and the Senior Notes 2026 issued. |
| 1.1.3 | Government and Regulators Support |
| · | Preservation of Advance Ticket Sales: Reduction in the level of refunds and cancellations due to measures enacted by the Federal Government that allowed rescheduling trips for up to 18 months; |
| 29 |
| | Notes to the Financial Statements Fiscal Year ended December 31, 2020 (In thousands of Brazilian Reais - R$, except when otherwise indicated) |
| · | Landing Fees: Change in the payment term for navigation fees and landing fees, which may be paid up to December without fines; and |
| · | Maintenance of the Brazilian Civil Aviation Agency (ANAC)’s Slots and Qualifications: (i) Bonus for the cancellation of slots by the regularity index, valid until the end of October 2020, in line with a similar decision adopted by other organizations and civil aviation authorities, such as the European Commission and the Federal Aviation Administration (FAA); and (ii) extension for 120 days of the renewal of qualifications due between February and December 2020. |
| 1.1.4 | Support to Society, Employees, and Customers |
Air passenger transportation is an essential service for society. The Company recognizes the duty to care for its customers and employees and is working with the authorities to help minimize the impact of COVID-19 on the country's population and health services.
Among the main measures, we highlight the adoption of mandatory protective masks, closing of VIP rooms, turning off of self-service totems, creation of communication channels specifically on the virus, implementation of segmented boarding and adoption of self-boarding without boarding pass handling. Currently, 90% of the processes for traveling with GOL happen without human contact. For its flights, the Company adopted additional cleaning measures according to the new standards issued by ANVISA and international bodies. On December 16, 2020, GOL received the Einstein Certification recognizing the strict Health and Safety protocols followed by the Company.
Regarding Smiles Frequent-Flyer Program, digital channels were also improved by implementing online cancellation self-service, free of charge, available on Smiles Fidelidade website and app, as well as in the online service (chat), for customers who have eligible GOL tickets. The system was developed internally, in record time.
Understanding that there is no set deadline for the end of this crisis and that this will inevitably have an impact on the travel planning of its customers, the subsidiary Smiles announced the extension of the maturity of the frequent-flyer program’s categories. Just as it chose not to consider the current year as the basis for the requalification of next year's customers, since the downgrade analysis of categories would include miles accumulated from segments flown from January to December 2020. The measure allows the customer to gain more time within his/her category, being able to take advantage of the benefits it offers.
In the social sphere, to contribute and recognize those fighting COVID-19 on the front lines, the Company started to transport health professionals at no charge, in addition to crediting 1,000 Smiles miles to each GOL segment, flown at no cost. In line with this attitude, the Company placed itself at the disposal of the country's authorities to transport COVID-19 vaccines at no charge, together with GOLLOG, considering the fleet and the highly capillary network.
Among the measures taken, keeping the integrity and health of the Company's employees is a priority. Since the second half of March 2020, all Company employees with administrative assignments started working from home. Employees are being guided and monitored, uninterruptedly, by the company's leadership and by the People & Culture area that manages human resources.
The Company’s greatest commitment will continue to be people’s integrity and health. Following to the letter, as has been done so far, WHO’s guidelines as a commitment to do everything possible to get through this period of turbulence in the best possible way.
| 30 |
| | Notes to the Financial Statements Fiscal Year ended December 31, 2020 (In thousands of Brazilian Reais - R$, except when otherwise indicated) |
| 1.1.5 | Impacts on the Parent Company and Consolidated Financial Statements |
As already mentioned, the pandemic’s impacts were immediate and severe for the Company. The main consequence was the reduction in the operational flight network.
The tables below summarize the adjustments and reclassifications made to these financial statements, as well as the details on each of these items and additional disclosures:
| Consolidated | ||
| December 31, 2020 | ||
| Losses with Financial Investments | (a) | (65,403) |
| Derecognition of Cash Flow Hedge - Fuel | (b) | (315,286) |
| Derecognition of Cash Flow Hedge - Revenues in US$ | (c) | (290,345) |
| Renegotiation of Lease Agreements – IFRS 16 | (d) | 19,080 |
| Total | (651,954) |
| (a) | Even though the Management of the Company and its subsidiaries have remained faithful to the Company’s investment policy, the abrupt changes in macroeconomic indicators, including cuts to the SELIC rate made by the Federal Government, led the Company to record unusual losses in its investments in sovereign fixed income funds linked to SELIC, as well as in private credit fixed income funds with a high degree of liquidity and high quality of credit. |
| (b) | Due to the operations downsizing, the Company derecognized operations designated as cash flow hedges, as a drop is expected in the fuel consumption previously estimated. Accordingly, the Company transferred R$315,286 in the fiscal year ended December 31, 2020 from the “equity valuation adjustment” group in the shareholders’ equity to the financial Income (Expenses) as “derivative losses”. |
| (c) | Due to the temporary interruption of all international flights, the Company also derecognized hedge accounting transactions used to reduce the volatility of future revenues in foreign currency (hedged object), using lease agreements as hedge instruments. That said, the Company transferred R$418,527 from the “equity valuation adjustment” group in shareholders' equity to the financial income (expenses) as “exchange rate change expenses”. |
| (d) | The Company signed renegotiations of its aircraft and operating engine lease agreements, with no purchase option, including postponement and deferral of payments, postponement of due dates and changes to the amounts due, which led to an increase in the rights of use in PP&E Assets and Lease liabilities of R$176,041 and R$156,961, respectively, resulting in R$19,080. |
| Consolidated | |||
| December 31, 2020 | |||
| Balance Sheet - Adjustments | Noncurrent Liabilities | Other Comprehensive Income | |
| Provision for Post-Employment Benefits | (e) | (24,541) | 24,541 |
| (e) | Given the abrupt changes in the macroeconomic scenario, the Company updated the actuarial studies that establish obligations from post-employment benefits, and -- mainly due to the drop in the long-term interest rate -- the balance related to such obligations was reduced by R$24,541. For further details, see Note 24. |
| 31 |
| | Notes to the Financial Statements Fiscal Year ended December 31, 2020 (In thousands of Brazilian Reais - R$, except when otherwise indicated) |
| Consolidated | |||
| December 31, 2020 | |||
| Income Statement - Reclassifications | Cost from Services | Other Revenues and Expenses, Net | |
| Personnel Costs - Idleness | (f) | 161,201 | (161,201) |
| Flight Equipment Depreciation - Idleness | (f) | 765,456 | (765,456) |
| (f) | Due to the drop in the number of flights operated and suspension of employment agreement, where the Company incurred with the burden of time lapsed and paid part of the personnel’s compensation, by analogy to the provisions of CPC 16 (R1) - Inventories, equivalent to IAS 2, personnel expenses and depreciation of flight equipment not directly related to the revenues generated in the period, called idleness, were reclassified from the group of costs of services to the group of other revenues and expenses, net. |
On December 31, 2020, the Company carried out impairment tests on the balance of property, plant & equipment, goodwill and slot rights. No provision for impairment was recorded, see Note 16.
The Company reassessed the estimated realization of deferred tax assets recognized at the parent company and did not identify any need to adjust the balance, as described in note 12.
| 1.2. | Capital Structure and Net Current Capital |
On December 31, 2020, the Company had a negative shareholders’ equity position attributed to the controlling shareholders of R$14,407,092 (R$7,676,671 on December 31, 2019).
The variation observed in the fiscal year ended December 31, 2020 is mainly due to the devaluation of Real against the US Dollar of around 28.9%, which negatively affected the income (expenses) for the fiscal year due to exchange rate changes of R$3,056,226 and the impacts related to the pandemic on the Company's operations, detailed in the previous note.
The net working capital on December 31, 2020 is negative by R$233,276 in the parent company and R$7,152,865 in the consolidated (negative by R$274,456 and R$5,435,223 on December 31, 2019 in the parent company and in the consolidated, respectively), the variation is mainly due to the lower balance of cash and cash equivalents and accounts receivable, totaling R$982,595 and R$489,831, respectively, due to the drop in operations from the economic crisis caused by the pandemic. Of the consolidated negative net working capital as of December 31, 2020, R$3,309,301 refers to advance ticket sales and frequent-flyer program, which are expected to be substantially recognized with services provided by the Company.
The operations of the Company are sensitive to changes in the economic scenario and to the volatility of Real, given that around 95.0% of its indebtedness (loans and financing and leases) are exposed to the US dollar (“US$”) and 36.5% of its costs are also pegged to the American currency, and its ability to adjust the price of fees charged from its customers to recapture the change of the US dollar depends on the rational (offer) capacity and behavior of competitors.
Over the past four years, the Management has taken many measures to adapt the size of its fleet to demand, matching the supply of seats the level of demand, thus promoting the maintenance of high occupancy rates, reducing costs and adjusting the capital structure, as well as implementing initiatives to restructure its balance sheet.
| 32 |
| | Notes to the Financial Statements Fiscal Year ended December 31, 2020 (In thousands of Brazilian Reais - R$, except when otherwise indicated) |
With the outbreak of the pandemic, which led to an unprecedented economic crisis, Management quickly reorganized the Company’s businesses through the measures detailed in Note 1.1. Management continuously monitors the effects of the crisis and will continue to take measures to strengthen its equity position and strategically manage the market to improve the performance of its operations, in order to ensure the Company's sustainability.
In addition to monitoring sales and operations, due to the scenario of uncertainty, the Administration also monitors possible measures for rebalancing the net working capital to 2021, which in case it becomes necessary, may include: issuing long term indebtedness titles to settle short term liabilities; new renegotiations with vendors and financial institutions; fleet reduction and orders with Boeing. Such measures, in case it’s adopted, will have the objective of optimizing the capital structure and the definition will be based on a detailed analysis of the economic conjecture and perspectives of that particular moment.
Our financial statements - parent company and consolidated - have been prepared on the assumption of the Company as a going concern, which includes the continuity of operations, realization of assets and compliance with liabilities and commitments in the usual course of business, in conformity with the business plan prepared by Management, revised and approved by the Board of Directors. Although there is still a substantial uncertainty about how long it will take the airline industry to recover, and that leads to material uncertainty on our ability to continue as a going concern, the parent company and consolidated financial statements as of December 31, 2020, do not include any adjustments that may result from the inability to continue operating.
| 1.3. | Resumption of Boeing 737 MAX’s Grounding |
On March 11, 2019, due to the second accident with a Boeing 737 MAX 8 aircraft, with safety as GOL’s #1 value, the Company’s Management decided to suspend the operations of its 7 aircraft of this model, before any statement from regulators.
In response to this measure, the Company quickly reconfigured its flight network, and, as a result, worked to rationally supply the required capacity to meet the demand levels through new lease agreements. The aircraft grounding and additional efforts led the Company to incur unplanned costs, related to, but not limited to: interline fares to relocate passengers, accommodation, meals and other passenger expenses, additional fuel consumption, taxes and landing fees, salaries and charges linked to overtime, payment to lease additional aircraft and negative publicity, disrupting the Company's business.
As a result and in recognition of a long-standing partnership, the Company reached and signed an agreement with Boeing. The terms of the said agreement are strictly confidential, but have as purpose to provide (a) compensation addressing damages from unplanned additional costs incurred since the aircraft was grounded, to date, and due to the non-delivery of aircraft, as defined in purchase agreements; (b) reduction in the number of firm commitments for 34 aircraft; (c) flexibility to further adjust the number of aircraft; and (d) flexibility to convert existing orders to other models in the Max family.
During 2020, the Company received R$607,466 in cash and cash equivalents; and R$53,508 in credits, which will be offset against outstanding GLA’s invoices from Boeing, totaling R$660,974. On the other hand, the amount of R$73,600 was recorded as a write-off of “advances for acquisition of PP&E” in property, plant and equipment, since it is a return of “pre delivery payment”, R$292,013 as an advance of credits in liabilities, and the other amounts recorded in the income (expenses) statement, which refer to: (i) reimbursement of expenses totaling R$246,938, with: R$53,299 in costs from services; R$136 in administrative expenses; R$193,503 in other net revenues and expenses, as these are expenses incurred in previous fiscal years; and (ii) R$48,423 as an exchange rate change.
| 33 |
| | Notes to the Financial Statements Fiscal Year ended December 31, 2020 (In thousands of Brazilian Reais - R$, except when otherwise indicated) |
After being grounded for 20 months, the Boeing 737-MAX aircraft resumed operations with the effective approval of the regulatory bodies – FAA and ANAC – and full recertification process, ensuring the highest levels of reliability and operational safety. GOL was the first company in the world to resume commercial flights with the MAX, reflecting the Company’s full confidence in this aircraft and the certainty that it is one of the safest and most efficient aircraft in the world. The Company has carried out a rigorous series of technical flights that exceeded the requirements imposed by the aviation regulatory agencies and reintegrated the aircraft into its fleet, with the first commercial flight on December 9.
| 1.4. | Corporate Structure |
The corporate structure of the Company and its subsidiaries, on December 31, 2020, is shown below:
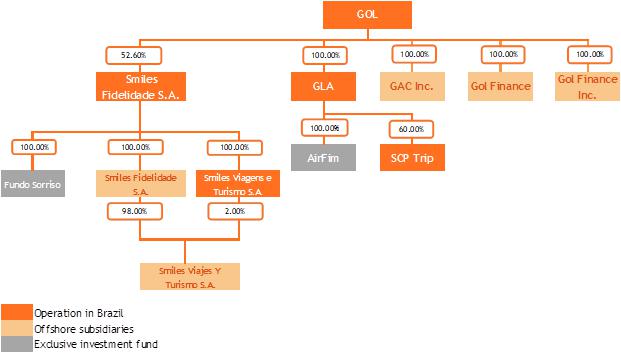
The Company’s equity interest in the capital of its subsidiaries, on December 31, 2020, is shown below:
| Entity | Incorporation Date | Location | Main Activity | Type of Control | % of Interest in the capital stock | |
| 2020 | 2019 | |||||
| GAC | March 23, 2006 | Cayman Islands | Aircraft acquisition | Direct | 100.00 | 100.00 |
| Gol Finance Inc. | March 16, 2006 | Cayman Islands | Fundraising | Direct | 100.00 | 100.00 |
| Gol Finance | June 21, 2013 | Luxembourg | Fundraising | Direct | 100.00 | 100.00 |
| GLA | April 9, 2007 | Brazil | Flight Transportation | Direct | 100.00 | 100.00 |
| AirFim | November 7, 2003 | Brazil | Investment fund | Indirect | 100.00 | 100.00 |
| Smiles Fidelidade | August 1, 2011 | Brazil | Frequent-Flyer Program | Direct | 52.60 | 52.61 |
| Smiles Viagens | August 10, 2017 | Brazil | Tourism Agency | Indirect | 52.60 | 52.61 |
| Smiles Fidelidade Argentina (a) | November 7, 2018 | Argentina | Frequent-Flyer Program | Indirect | 52.60 | 52.61 |
| Smiles Viagens Argentina (a) | November 20, 2018 | Argentina | Tourism Agency | Indirect | 52.60 | 52.61 |
| Fundo Sorriso | July 14, 2014 | Brazil | Investment fund | Indirect | 52.60 | 52.61 |
| Companies in Shareholding: | ||||||
| SCP Trip | April 27, 2012 | Brazil | On-Board Magazine | - | 60.00 | 60.00 |
(a) Companies with functional currency in Argentine pesos (ARS).
| 34 |
| | Notes to the Financial Statements Fiscal Year ended December 31, 2020 (In thousands of Brazilian Reais - R$, except when otherwise indicated) |
The subsidiaries GAC Inc., GOL Finance and GOL Finance Inc., are entities incorporated with the specific purpose of continuing the financial operations and related to the Company´s fleet. They do not have an independent management structure and are unable to make independent decisions. Thus, the assets and liabilities of these entities are consolidated in the parent company's financial statements.
The subsidiaries Smiles Fidelidade S.A. and Smiles Viajes Y Turismo S.A., incorporated and controlled by Smiles Fidelidade S.A., both headquartered in Buenos Aires, Argentina, have the purpose to promote operations of the Smiles Program and the sale of airline tickets in that country.
The subsidiary Smiles Fidelidade also controls Smiles Viagens e Turismo S.A. (“Smiles Viagens”), whose main purpose is intermediating travel organization services, by booking or selling airline tickets, accommodation, tourism packages, among others.
The investment funds Airfim and Fundo Sorriso, controlled by GLA and Smiles Fidelidade, respectively, have the characteristic of an exclusive fund and act as an extension of the subsidiaries to carry out operations with derivatives and investments, so that the Company consolidates the assets and liabilities of this fund in its consolidated financial statements.
| 1.5. | Corporate Reorganization Plan |
On December 7, 2020, the Company communicated to the Board of Directors of Smiles Fidelidade the proposal for the merger of shares involving its subsidiaries.
The merger proposal includes the following steps, which will be implemented concurrently and interdependently, with the consummation subject to the applicable corporate approvals and approval by the majority of the holders of outstanding shares of Smiles Fidelidade:
| · | incorporation of Smiles Fidelidade shares by GLA, issuing preferred shares and redeemable preferred shares of GLA to the shareholders of Smiles Fidelidade; |
| · | incorporation of GLA’s shares by the Company, issuing preferred shares and redeemable preferred shares of the Company to GLA’s shareholders; and |
| · | Redemption of GLA’s and the Company's redeemable preferred shares, with cash payment based on the redemption of the Company's redeemable preferred shares to the shareholders of Smiles Fidelidade. |
The merger of shares will result in the merger of the two operating subsidiaries of the Company, GLA and Smiles Fidelidade, with the purpose to maximize the value for all shareholders by aligning the interests of both companies, while ensuring the continuity of the airline and the frequent-flyer program, simplify corporate governance, strengthen the capital structure and reduce operating, administrative and financial costs, as well as tax inefficiencies.
This transaction will be analyzed and voted by Smiles Fidelidade shareholders and by the Company's shareholders, at their respective extraordinary shareholders meetings summoned to occur on March 24, 2021.
Further details about this operation, including the definitions of exchange ratios, protocol and reasoning, and other related documents, were disclosed by the Management and are available for reading and consultation at the Company's electronic address.
| 35 |
| | Notes to the Financial Statements Fiscal Year ended December 31, 2020 (In thousands of Brazilian Reais - R$, except when otherwise indicated) |
| 1.6. | Compliance Program |
Since 2016, the Company has adopted several measures to strengthen and expand its internal control and compliance programs, among which we can highlight:
| · | hiring specialized companies to assess risks and review internal controls regarding fraud and corruption; |
| · | integrating risk, compliance and internal control functions through the Executive Board of Corporate Risks, Compliance and Internal Controls, reporting directly to the CEO and with independent access to the Board of Directors and the Statutory Audit Committee; |
| · | monitoring transactions that represent greater risks from the compliance point of view; |
| · | updating the procurement policy and improving the procedures to supervise the execution of contracted services; |
| · | evaluating the third-party contracts in accordance with internal compliance policy; |
| · | reviewing the code of ethics, the conduct manual, and many compliance policies, including massive mandatory training; |
| · | developing and disclosing the rules of conduct for third parties in relation to GOL; |
| · | mapping risks and periodically reviewing them, including compliance risks; |
| · | constant training and communication actions on topics relevant to compliance, including encouraging the use of the ethics channel; and |
| · | constant support to areas to guide on the compliance with compliance policies. |
The Management is constantly reinforcing to its employees, customers, and suppliers its commitment to continue improving its internal control and compliance programs.
As previously disclosed in the financial statements for the fiscal year ended December 31, 2017, 2018, and 2019, the Company signed an agreement with the Brazilian Federal Public Ministry in December 2016 (“Agreement”), through which the Company agreed to pay R$12 million in fines and make improvements to its compliance program. In turn, the Federal Public Ministry agreed not to file any lawsuits related to activities under the Agreement. In addition, the Company paid R$4.2 million in fines to the Brazilian tax authorities.
The Company voluntarily informed the U.S. Department of Justice (“DOJ”), the Securities and Exchange Commission (“SEC”) and the Brazilian Securities and Exchange Commission (“CVM”) about the Agreement and the external independent investigation conducted by an independent committee of the Company. The investigation was completed in April 2017 and revealed that immaterial payments were made to politically exposed people. None of the Company’s current employees, representatives or members of the Board of Directors and Management was aware of any illegal purpose behind the transactions identified, or of any illegal benefit for the Company from the transactions under investigation.
The Company reported the conclusions of the investigation to the relevant authorities and will keep them informed of any future developments regarding this issue, as well as monitor the analyses already started by these bodies. These authorities may impose fines and possibly other sanctions to the Company.
There were no further developments on the subject during the fiscal year ended December 31, 2020.
| 2. | Statement of the Management, basis for preparing and presenting the financial statements |
The Company’s parent company financial statements were prepared in accordance with accounting practices adopted in Brazil. The accounting practices adopted in Brazil include those in the Brazilian Corporation Law and in the technical pronouncements, guidelines and interpretations issued by the Accounting Pronouncements Committee (“CPC”), approved by the Federal Accounting Council (“CFC”) and the Brazilian Securities and Exchange Commission (“CVM”).
| 36 |
| | Notes to the Financial Statements Fiscal Year ended December 31, 2020 (In thousands of Brazilian Reais - R$, except when otherwise indicated) |
The Company’s financial statements were prepared in accordance with accounting practices adopted in Brazil and the International Financial Reporting Standards (“IFRS”) issued by the International Accounting Standards Board (“IASB”).
The Company’s Parent Company and Consolidated Financial Statements were prepared using the Brazilian real (“R$”) as the functional and presentation currency. Figures are expressed in thousands of Brazilian reais, except when stated otherwise. The items disclosed in foreign currencies are duly identified, when applicable.
The preparation of the Company’s parent company and consolidated financial statements requires Management to make judgments, use estimates, and adopt assumptions affecting the stated amounts of revenues, expenses, assets, and liabilities. However, the uncertainty inherent in these judgments, assumptions, and estimates could give rise to results that require a material adjustment of the book value of certain assets and liabilities in future reporting fiscal years.
The Company is continually reviewing its judgments, estimates, and assumptions.
The Management, when preparing these financial statements, used the following disclosure criteria: (i) regulatory requirements; (ii) relevance and specificity of the information on the Company’s operations to users; (iii) the informational needs of users of financial statements; and (iv) information from other entities in the same industry, mainly in the foreign market.
Management confirms that all the material information in these parent company and consolidated financial statements are being demonstrated and corresponds to the information used by Management in the development of its business management activities.
The parent company and consolidated financial statements have been prepared based on historical cost, with the exception of the following material items recognized in the balance sheets:
| · | short-term investments classified as cash and cash equivalents measured at fair value; |
| · | short-term investments mainly comprising exclusive investment funds, measured at fair value; |
| · | restricted cash measured at fair value; |
| · | derivative financial instruments measured at fair value; and |
| · | investments accounted for using the equity method. |
The Company’s parent company and consolidated financial statements for the fiscal year ended December 31, 2020 has been prepared assuming that it will continue as going concern, realizing assets and settling liabilities in the normal course of business. Refer to Note 1.2. regarding the substantial double of the Company’s ability to continue as a going concern.
| 3. | Approval of the Parent Company and Consolidated Financial Statements |
The Parent Company and Consolidated Financial Statements were authorized by the Board of Directors on March 17, 2021.
| 37 |
| | Notes to the Financial Statements Fiscal Year ended December 31, 2020 (In thousands of Brazilian Reais - R$, except when otherwise indicated) |
| 4. | Summary of Significant Accounting Practices |
| 4.1. | Consolidation |
The consolidated financial statements include the financial statements of the Company and of the subsidiaries in which the Company has a direct or indirect control. Control is obtained when the Company:
| · | has power over the investee; |
| · | is exposed, or has rights, to variable returns from its involvement with the investee; and |
| · | has the ability to use that power to affect its returns. |
There is generally a presumption that a majority of voting rights results in control. To support this presumption and when the Company holds less than the majority of the voting rights of an investee, the Company considers all relevant facts and circumstances when assessing if it has power in relation to an investee. The Company reassesses if it has control over an investee if facts and circumstances indicate changes in one or more of the three control elements listed above.
The consolidation of a subsidiary begins when the Company obtains control over the subsidiary and ends when the Company loses control over the subsidiary. The variation in equity interest in subsidiary, without loss of control, is accounted for as an equity transaction.
Accounting practices were uniformly applied to all consolidated companies, consistent with those used by the parent company and adopted in the previous fiscal year. All transactions and balances between GOL and its subsidiaries were eliminated in the consolidation, as well as the unrealized profits or losses arising from these transactions, including charges and taxes. The income (expenses) and each component of other comprehensive income (expenses) are attributed to the shareholders of the parent company and to the minority shareholders, even if this results in a loss to minority shareholders.
In the parent company financial statements, the Company's investments in its subsidiaries are accounted for using the equity method.
| 4.2. | Investments |
Investments in associates are initially recognized at cost and subsequently adjusted using the equity method. If the investee generates operating losses that lead the shareholders’ equity to become negative, the Company adopts the provisions set forth in CPC 18 - “Investment in Associates, Subsidiaries and Jointly-Controlled Companies”, corresponding to IAS 28, and does not make additional records. The equity method result is recorded again when the investee recovers all accumulated losses.
| 4.3. | Cash and Cash Equivalents |
The Company classifies in this group the balances of cash, bank deposits, automatic financial investments, and securities of immediate liquidity, which, according to analyzes, are readily convertible into a known amount of cash with an insignificant risk of change in value. Financial investments classified in this group, due to their very nature, are measured at fair value through income (expenses) and will be used by the Company in a short period of time.
| 38 |
| | Notes to the Financial Statements Fiscal Year ended December 31, 2020 (In thousands of Brazilian Reais - R$, except when otherwise indicated) |
| 4.4. | Financial Investments |
In the presentation and measurement of financial assets, the Company considers the provisions of CPC 48 - “Financial Instruments”, corresponding to IFRS 9, which establishes that financial assets must be initially measured at fair value less costs directly linked to their acquisition. In turn, the subsequent measurement is divided into two categories:
| 4.4.1. | Amortized Cost |
Financial investments are measured at amortized cost when all of the following conditions are met:
| · | the Company plans to hold the financial asset to collect the contractual cash flows; and |
| · | the contractual cash flows represent only the payments of interest and principal (“SPPI”). |
| 4.4.2. | Fair Value |
· through comprehensive income (expenses): financial investments will be measured at fair value through comprehensive income (expenses) when both of the following conditions are met: (i) the Company plans to hold the financial asset to collect the contractual cash flows and sell the asset; and (ii) the contractual cash flows represent SPPI;
| · | through income (expenses): considered a residual category, that is, if the Company does not plan to hold the financial asset to collect the contractual cash flows and/or sell the asset, it must be measured at fair value through profit or loss. The Company may also choose, upon initial recognition, to designate the financial asset as measured at fair value through income (expenses), to eliminate or significantly reduce measurement or recognition inconsistencies, called "accounting mismatch". The financial instruments designated at fair value through income (expenses) are to eliminate or significantly reduce an accounting mismatch, thus appraised at market value. |
| 4.5. | Restricted Cash |
Restricted cash includes financial investments measured at fair value through income (expenses), used mainly as guarantees linked to short- and long-term financial instruments, as well as deposits for lease transactions.
| 4.6. | Trade Receivables |
They are measured based on the invoiced figure, net of estimated losses on provision for loan losses, and approximate the fair value given their short-term nature. In compliance with CPC 48 - “Financial Instruments”, corresponding to IFRS 9, the provision for loan losses was measured through a simplified approach, using historical data, projecting the expected loss over the contractual life, by segmenting the receivables portfolio into groups that have the same receipt pattern and according to the respective maturity terms. In addition, for certain cases, the Company carries out individual analyzes to assess the receipt risks.
| 4.7. | Inventories |
Inventory balances mainly include materials for maintenance and replacement of parts. Inventories are measured at the average acquisition cost plus expenses such as non-recoverable taxes and customs expenses incurred in the acquisition and transportation expenses until the current location of the items. Provisions for inventory obsolescence are recorded for those items that have no expectation of realization.
| 39 |
| | Notes to the Financial Statements Fiscal Year ended December 31, 2020 (In thousands of Brazilian Reais - R$, except when otherwise indicated) |
| 4.8. | Income Tax and Social Contribution |
| 4.8.1. | Current Taxes |
In Brazil, includes income tax (“IRPJ”) and social contribution on profit (“CSLL”), which are calculated monthly based on the taxable income, after offsetting tax losses and negative social contribution base, limited to 30% of the taxable income, applying the rate of 15% plus an additional 10% for the IRPJ and 9% for the CSLL.
| 4.8.2. | Deferred Taxes |
Deferred taxes represent credits and debits on IRPJ’s tax losses and negative CSLL bases, as well as temporary differences between the tax and accounting bases. Deferred tax and contribution assets and liabilities are classified as non-current.
An impairment loss on these assets is recognized when the Company’s internal studies indicate that the future use of these credits is not probable.
Deferred tax assets and liabilities are shown net if there is an enforceable legal right to offset tax liabilities against tax assets. However, for presentation purposes, if related to taxes levied by the same tax authority under the same taxable entity, the balances of tax assets and liabilities that do not meet the legal criterion of realization are disclosed separately. Deferred tax assets and liabilities were measured at the rates that are expected to be applicable in the period in which the asset is realized, or the liability is settled, based on the tax rates and legislation in force on the date of the financial statements.
The forecast of future taxable income on tax losses and negative social contribution base is prepared based on the business plans and are reviewed and approved annually by the Company’s Board of Directors.
| 4.9. | Rights and Obligations with Derivative Financial Instruments |
Variations in interest rates, foreign exchange rates and aviation fuel prices expose the Company and its subsidiaries to risks that may affect their financial performance. To mitigate such risks, the Company, through its subsidiaries, contracts derivative financial instruments that may or may not be designated for hedge accounting and, if designated, are classified as cash flow hedge.
| 4.9.1. | Derivative Financial Instruments not designated as Hedge Accounting |
The Company may contract derivative financial instruments that are not designated for hedge accounting when the Risk Management’s purposes do not require such classification. Transactions not designated as hedge accounting have the change in their fair value accounted for directly in the financial income (expenses).
| 4.9.2. | Derivative Instruments classified as Cash Flow Hedge |
The instruments designated as cash flow hedge have the purpose of protecting future income (expenses) arising from changes in interest rates, fuel prices and foreign exchange. The effectiveness of the variations is estimated based on statistical methods of correlation and by the proportion between the hedge’s gains and losses and the variation of the costs and expenses protected. The effective variations in fair value are recorded in the shareholders’ equity in “Other Comprehensive Income”, up to the recognition of the result of the hedged object. The inefficiencies found in each reporting period are recognized in the financial income (expenses). The hedge transactions recorded in “Other Comprehensive Income” are net of tax effects.
| 40 |
| | Notes to the Financial Statements Fiscal Year ended December 31, 2020 (In thousands of Brazilian Reais - R$, except when otherwise indicated) |
| 4.9.3. | Derecognition and Write-Off of Derivative Financial Instruments |
The hedge accounting is discontinued prospectively when the Company and its subsidiaries (i) cancel the protection relationship; (ii) the derivative instrument expires or is sold, terminated or executed, (iii) when there is low predictability of realization of the hedge’s object, or (iv) when it no longer qualifies as hedge accounting. If the operation is discontinued, any gains or losses previously recognized in “Other Comprehensive Income” and accumulated in the shareholders’ equity up to that date are immediately recognized in the income (expenses) for the fiscal year.
| 4.10. | Deposits |
| 4.10.1. | Deposits for the Maintenance of Aircraft and Engines |
Refer to payments made in US dollars to lessors for the future maintenance of aircraft and engines. The realization of these assets occurs, substantially, in the use of the deposit for payment to the workshop when the maintenance is carried out or through the receipt of financial resources, according to the negotiations carried out with the lessors. The exchange rate change of these payments is recognized as an expense or income in the financial income (expenses). The Management regularly assesses the impairment of these deposits based on the eligibility of the application of such amounts in future maintenance events and believes that the figures reflected in the balance sheet are realizable.
Some of the agreements foresee that, if there are no maintenance events with the possibility of using the deposits, the deposits for this operation are not refundable. Such amounts are retained by the lessor and represent payments made according to the use of the components until the return date. Accordingly, the amounts in this category are recognized directly in the Income (Expenses) for the Fiscal Year under “Maintenance, Material and Repairs”, considering the regular impairment test or when the asset is returned.
In addition, the Company has agreements with some lessors to replace deposits for credit bills, which can be executed by the lessors if the maintenance of the aircraft and engines does not occur according to the review schedule. Several aircraft lease agreements do not require maintenance deposits and have credit bills to ensure the maintenance is carried out in the scheduled periods. Until December 31, 2020, no credit bill had been executed against the Company.
| 4.10.2. | Court Deposits |
In the course of the lawsuits brought against the Company and on which the legitimacy of the claims is questioned, the Company may be required to make appeals and/or judicial deposits to continue its defense strategy. These amounts are monetarily restated, mostly by inflation indexes, and are characterized as non-reachable resources by the Company, pending a judicial decision.
| 41 |
| | Notes to the Financial Statements Fiscal Year ended December 31, 2020 (In thousands of Brazilian Reais - R$, except when otherwise indicated) |
| 4.10.3. | Deposits in Guarantee for Lease Agreements |
Deposits and guarantees are denominated in US dollars and updated monthly by the foreign exchange rates, without interest income and are refundable to the Company at the end of the lease agreements.
| 4.11. | Property, Plant & Equipment |
Property, plant, and equipment, including rotables (spare parts), are recorded at acquisition and/or construction cost. Interest and financial charges directly related to the acquisition, construction or production of a good that necessarily requires significant time to complete are capitalized as part of the cost of the corresponding asset.
Every item of the property, plant, and equipment that has a significant cost in relation to the total asset is depreciated separately. The estimated economic useful life of property, plant, and equipment, for purposes of depreciation, is shown in Note 15.
The estimated market price at the end of its useful life is the premise used to set the residual value of the Company’s property, plant, and equipment. The residual value and useful life of the assets are reviewed annually by the Company. Any variation due to changes in the expectation of using such items results in prospective changes.
The book value of the property, plant, and equipment is analyzed to verify possible impairment loss when facts or changes in circumstances indicate that the book value is greater than the estimated recoverable amount. The book value of the aircraft is annually tested for impairment, even if there are no circumstances that indicate losses.
An item of property, plant, and equipment is written-off after disposal or when there are no future economic benefits resulting from the continued use of the asset. Any gains or losses on the sale or write-off of an item are established by the difference between the amount received on the sale and the book value of the asset and are recognized in the income (expenses).
Additionally, the Company adopts the following treatment for the groups below:
| 4.11.1. | Prepayments for Aircraft Acquisition |
Refers to prepayments in US dollars made to Boeing for the acquisition of 737-MAX aircraft. Prepayments are converted at the historical rate.
| 4.11.2. | Lease Agreements |
As of January 1, 2019, the Company started recording lease agreements in accordance with the current standard, CPC 06 (R2) - “Leases”, corresponding to IFRS 16, which differs significantly from the accounting practice previously adopted.
CPC 06 (R2) established the principles for recognizing, measuring, presenting and disclosing lease transactions and required lessees to recognize all leases in accordance with a single statement of financial position model, similar to the recognition of finance leases pursuant to CPC 06 (R1). The Company adopts exemptions for lessees, set forth in the standard, for leases of “low value” assets, for example, personal computers, and short-term leases, i.e., leases for which the term ends within 12 months or less.
At the beginning of a lease, the Company, as lessee, recognizes a liability to carry out payments (lease liability) and an asset representing the right to use the leased item for the lease term (right-of-use asset). The Company recognizes interest expenses separately from the lease liability and depreciation expenses of the right-of-use asset.
| 42 |
| | Notes to the Financial Statements Fiscal Year ended December 31, 2020 (In thousands of Brazilian Reais - R$, except when otherwise indicated) |
| 4.11.2.1. | Right-of-Use Assets |
The Company recognizes the right-of-use assets on the starting date of the lease (that is, on the date when the underlying asset is available for use). Right-of-use assets are measured at cost, less any accumulated depreciation and impairment losses, and adjusted for any new remeasurements of lease liabilities. The cost of right-of-use assets includes the amount of recognized lease liabilities, initial direct costs incurred and lease payments made up to the starting date, less any lease incentives received.
Right-of-use assets are depreciated on a straight-line basis over the shortest period between the lease term and the estimated useful lives of the assets. In certain cases, if the ownership of the leased asset is transferred to the Company at the end of the lease term or if the cost represents the exercise of a call option, depreciation is calculated using the estimated useful life of the asset.
The cost of a right-of-use asset also includes an estimate of the costs to be incurred by the Company when returning the underlying asset, restoring the underlying asset to the condition required by the lease terms and conditions. The Company incurs an obligation for these costs, either on the start date or due to using the underlying asset during the term of the contract.
| 4.11.2.2. | Lease Liabilities |
On the lease’s start date, the Company recognizes lease liabilities measured at the present value of lease payments to be made during the lease term. Lease payments include fixed payments (including, substantially, fixed payments) less any lease incentives receivable, variable lease payments that depend on an index or rate, and expected amounts to be paid under residual value guarantees. Lease payments also include the exercise price of a purchase option reasonably certain to be exercised by the Company and payment of fines for terminating the lease, if the lease term reflects the exercise of the option to terminate the lease by the Company.
Variable lease payments that do not depend on an index or rate recognized as expenses in the period in which the event or condition that generates these payments occurs.
When calculating the present value of lease payments, the Company uses its additional loan rate on the start date because the interest rate implied by the lease is not easily ascertained. After the start date, the value of the lease liability is increased to reflect the time elapsed and, therefore, the increase in interest and reduced for the lease payments made. In addition, the book value of lease liabilities is remeasured if there is a change, a change in the lease term, a change in lease payments (for example, changes in future payments resulting from a change in an index or rate used to determine such lease payments) or a change in the valuation of a call option on the underlying asset.
The Company reassess the lease liability whenever certain events occur, such as a change in the term of the lease or a change in future lease payment flows due to a variation in the reference index or rate used to calculate such payments. Among the adoption methods provided for in the standard, the Company chose to adopt the modified retrospective approach.
| 43 |
| | Notes to the Financial Statements Fiscal Year ended December 31, 2020 (In thousands of Brazilian Reais - R$, except when otherwise indicated) |
| 4.11.2.3. | Leases and Sale-Leaseback Transactions |
The calculation to recognize the income (expenses) of sale-leaseback transactions uses the fair value of the negotiated asset as a reference. The source of information to obtain the fair value is the market price for items of a similar nature, considering the asset condition
After the fair value is defined, gains or losses are initially calculated based on the difference between the fair value and the book value of the assets and subsequently adjusted according to the proportionality of the right of use transferred to the lessor (the latter being the effective value recognized in the result as income (expenses)).
The proportionality calculation is carried out considering the present value of the adjusted lease by the anticipated payments or additional financing.
| 4.11.3. | Capitalization of Expenses with Major Maintenance of Engines, Aircraft, Landing Gear and APUs (Auxiliary Power Unit) |
Expenses with major maintenance events, which include replacement of parts and labor, are capitalized only when there is an extension of the estimated useful life of the corresponding asset. Such costs are capitalized and depreciated over the estimated period to be incurred until the next major maintenance or the return of the asset, whichever occurs first. Expenses incurred that do not extend the useful lives of assets are recognized directly in the income statement.
| 4.12. | Intangible Assets |
| 4.12.1. | Finite Useful Life |
Intangible assets acquired are measured at the cost of their initial recognition. After initial recognition, intangible assets with finite useful lives, usually software, are stated at cost, less the accumulated amortization and impairment losses, when applicable. Intangible assets generated internally, excluding development costs, are not capitalized, and the expense is reflected in the income statement for the fiscal year in which it was incurred.
The useful life of an intangible asset is evaluated as finite or indefinite. Intangible assets with finite lives are amortized over their useful economic lives and are assessed for impairment whenever there is an indication of impairment. The amortization period and method for an intangible asset with a finite life are reviewed at least at the end of each fiscal year. The amortization of intangible assets with finite lives is recognized in the income statement in the expense category consistent with the useful economic life of the intangible asset.
| 4.12.2. | Indefinite Useful Life |
| 4.12.2.1. | Goodwill for Expected Future Profitability |
In this category, the amounts corresponding to the goodwill arising from business combinations carried out by the subsidiaries GLA and Smiles Fidelidade are recorded. The goodwill value is tested annually by comparing the book value with the recoverable value of the cash-generating unit. The Management evaluates and establishes assumptions to assess the impact of macroeconomic and operational changes, to estimate future cash flows and measure the recoverable value of assets.
| 44 |
| | Notes to the Financial Statements Fiscal Year ended December 31, 2020 (In thousands of Brazilian Reais - R$, except when otherwise indicated) |
| 4.12.2.2. | Airport Operation Rights (“Slots”) |
In the business combination of GLA and Webjet, slots were acquired, recognized at their fair values on the acquisition date and were not amortized. The estimated useful life of these rights was considered indefinite due to several factors and considerations, including requirements and permits to operate in Brazil and the limited availability of use rights at the most important airports in terms of air traffic volume. The book value of these rights is assessed annually, based on the GLA cash-generating unit regarding its recoverable amount or in cases of changes in circumstances that indicate that the book value may not be recoverable. No impairment loss has been recorded to date.
| 4.13. | Loans and Financing |
Loans and financing are initially recognized at fair value less any directly attributable transaction costs. After the initial recognition, these financial liabilities are measured at amortized cost using the effective interest method, except for the contracted derivatives linked to Exchangeable Senior Notes, which are measured at fair value through income (expenses).
Gains and losses are recognized in the income statement when the liabilities are written off. The amortized cost is calculated considering any negative discount or goodwill in the contract and fees or costs that are fully part of the effective interest rate method. Amortization using the effective interest rate method is included as a financial expense in the income statement, except when subject to capitalization.
| 4.14. | Suppliers and Other Obligations |
They are initially recognized at fair value and subsequently increased, when applicable, by the corresponding charges and monetary and exchange rate changes incurred up to the closing dates of the financial statements.
| 4.14.1. | Suppliers - Forfaiting |
The Management carried out a negotiation with suppliers with the purpose of extending payment terms. Accordingly, the Company signed an agreement with financial institutions that allows receivables from its suppliers to be anticipated. Considering that the anticipation of this receipt with the financial institutions is an option of the suppliers, as well, the Company is not reimbursed and/or benefited by the financial institution with discounts for payment before the maturity date agreed with the supplier, there is no change in the degree of subordination in case of judicial execution.
| 4.15. | Advance Ticket Sales |
Represents the Company’s obligations to provide air transportation services and other ancillary services to its clients, net of breakage revenue already recognized in the income statement, as detailed in Note 4.18.1.
| 4.16. | Provisions |
Provisions are recognized when the Company has a present obligation, formalized or not, as a result of a past event, and it is probable that economic benefits will be required to settle the obligation and a reliable estimate of its value can be made.
| 45 |
| | Notes to the Financial Statements Fiscal Year ended December 31, 2020 (In thousands of Brazilian Reais - R$, except when otherwise indicated) |
| 4.16.1. | Provision for Aircraft Return |
Aircraft lease agreements regularly provide for contractual obligations establishing conditions for return. In these cases, the Company makes provisions for the return costs, since these present obligations, arising from past events and which will generate future disbursements, which are measured with reasonable certainty. These expenses basically refer to aircraft reconfiguration (interior and exterior), obtaining licenses and technical certifications, return checks, painting, among others, as established in the agreement. The estimated cost is initially recorded at the present value in property, plant, and equipment, and the corresponding entry of the provision for aircraft return is recorded in the “Provisions”. After the initial record, the liability is updated according to the capital remuneration rate estimated by the Company, with a corresponding entry in the income (expenses). Any changes in the estimate of expenses to be incurred are recorded prospectively.
| 4.16.2. | Provision for Return of Engines |
They are estimated based on the minimum contractual conditions under which the equipment must be returned to the lessor, observing the historical costs incurred and the conditions of the equipment at the time of the appraisal. These provisions are recorded in the income statement for the fiscal year from the moment the contractual requirements are met, and the next maintenance is scheduled for a date later than the date scheduled to return the engine. The Company estimates the provision for the return of the engine according to the expense expected to incur and when the amount can be reliably estimated. The amount of a provision will be the present value of the expenses that are expected to be required to settle the minimum obligation. The term will be based on the date that the leased engine is expected to be returned, that is, the term of the lease.
| 4.16.3. | Provision for Tax and Labor Risks |
The Company is a party to a number of judicial and administrative proceedings, mainly in Brazil, whose assessments of the likelihood of loss include an analysis of the available evidence, the hierarchy of laws, the available jurisprudence, the most recent court decisions, and their relevance in the legal system, as well as the assessment of external lawyers. Provisions are reviewed and adjusted to reflect changes in circumstances, such as the applicable statute of limitations, conclusions of tax inspections, or additional exposures identified based on new matters or court decisions.
| 4.17. | Post-Employment Benefits |
As of the fiscal year ended December 31, 2019, the Company started to recognize actuarial assets and liabilities related to the health care plan benefits offered to its employees in accordance with CPC 33 (R1) - “Benefits to Employees”, corresponding to IAS 19. Actuarial gains and losses are recognized in other comprehensive income (expenses) based on the actuarial report prepared by independent experts, while the benefits paid directly by the Company, the cost of current service and the cost of interest are recognized in the income (expense) for the fiscal year.
| 4.18. | Recognition of Revenue |
| 4.18.1. | Revenue from Passengers, Cargo and Ancillary Services |
Passenger revenue is recognized when air transportation is actually provided. Tickets sold but not yet used are recorded in the item of advance from ticket sales, representing deferred revenue from tickets sold to passengers to be transported at a future date, net of the estimated breakage revenue.
| 46 |
| | Notes to the Financial Statements Fiscal Year ended December 31, 2020 (In thousands of Brazilian Reais - R$, except when otherwise indicated) |
Breakage revenue calculates, on a historical basis, tickets issued that will expire due to non-use, that is, passengers who have purchased tickets and are highly likely not to use them. The calculations are reviewed at least once a year to reflect and capture changes in customer behavior in relation to ticket expiration.
Revenues from cargo shipments are recognized when performance obligations are met.
Other revenues that include charter services, on-board sales services, flight rebooking fees, baggage drop-off, and other additional services are recognized along with the primary passenger transportation obligation.
| 4.18.2. | Mileage Revenue |
The Smiles Program has the purpose to build customer loyalty by granting mileage credits to participants. The obligation generated by issuing miles is measured based on the price at which the miles were sold to Smiles’ air and non-air partners, considered as the fair value of the transaction.
The revenue is recognized in the income (expenses) for the fiscal year when the miles are redeemed by participants in the Smiles Program and exchanged for awards with their partners. From the perspective of the consolidated financial statements, the cycle of recognition of revenue in relation to the exchange of miles from the Smiles Program for airline tickets is only completed when passengers are effectively transported.
The subsidiary Smiles acts as an agent and fulfills its performance obligation when participants redeem the miles of the Smiles Program and exchange them for awards with its partners. This is the moment when revenue is recognized in the income (expenses). Accordingly, the gross revenue is shown net of its respective direct variable costs related to making goods and services available to participants.
As a result of its characteristics, the miles program also provides the possibility of recognizing a breakage revenue, which in turn is established based on the calculation of miles that have a high expiration potential to their non-use by the Smiles Program’s participants. The calculation is applied to the miles issued in the period, giving rise to the breakage revenue.
It should be noted that future events can significantly change the profile of customers and their historical pattern of redemption of miles. Such changes may lead to significant changes in the balance of deferred revenue, as well as in the recognition of breakage revenue, statistical calculation reviewed annually.
| 4.18.3. | Adoption of Hedge Accounting to Protect Future Revenues with Passengers and Ancillary Services |
In the regular course of its operations, the Company has recurring sales in U.S. dollars (“US$”), mainly as a result of international routes in South, Central, and North America. Accordingly, as of August 1, 2019, the Management has adopted the cash flow hedge accounting as a way to reduce the volatility for these future foreign currency revenues, which are considered highly probable, as provided for and stated in Paragraph 6.3.1 of CPC 48, using as hedge instruments the lease agreements recorded as a debt due to the adoption of CPC 06 (R2).
| 47 |
| | Notes to the Financial Statements Fiscal Year ended December 31, 2020 (In thousands of Brazilian Reais - R$, except when otherwise indicated) |
With the adoption of hedge accounting, the foreign exchange gains and losses arising from the lease agreements (hedge instrument) will be accumulated in shareholders’ equity, “Adjustments to Equity Valuation”, appropriated to the Company’s income (expenses) upon the realization of the revenues from sales in US$.
Hedge accounting derives from the natural hedge of the Company’s operations, portrayed by cash flow (revenues and amortization of debt in US$) and does not represent an increase in financial costs, allowing the elimination of some of the exchange rate volatility in the Company's income (expenses). The final position of shareholders’ equity is not affected by the adoption of this accounting practice. The elements of hedge accounting are: (1) hedged: highly probable sales revenue in US$; (2) hedge instrument: lease contracts linked to the US$; (3) amount designated: (1) hedged object: highly probable sales revenue in US$; (2) hedge instrument: 50 lease agreements linked to US$; (3) designated amount: 60 months of highly probable revenues based on a range of 80 to 85% of historically earned revenues, totaling US$903,102 at the initial adoption; (4) nature of the hedged risk: exchange rate change; (5) specification of the hedged risk: USD/BRL spot exchange rate change; (6) type of hedge: cash flow.
| 4.19. | Share-Based Compensation |
| 4.19.1. | Stock Options |
The Company offers stock option plans to its executives. The Company recognizes as an expense, on a straight-line basis, the fair value of the options or shares, calculated on the vesting date by the Black-Scholes method, during the period of service required by the plan, as a corresponding entry to the shareholders’ equity. The accumulated expense recognized reflects the acquisition period and the Company’s best estimate of the number of shares that will be acquired. The expense or revenue from the movement occurred during the fiscal year is recognized in the income statement.
The effect of outstanding options is reflected as an additional dilution in the calculation of diluted earnings per share.
The plans have been carried out with the delivery of the shares.
| 4.19.2. | Restricted Shares |
The Company can also offer to its executives a plan to transfer restricted shares, taking place at the end of three or four years after the grant date, as set forth in each program’s plan, provided that the beneficiary has held his/her employment relationship during this period. Such transfer occurs preferably through shares held in treasury.
The impact of any revision of the number of restricted shares that will not be acquired in relation to the original estimates, if any, is recognized in the income (expenses) for the fiscal year, in such a way that the accumulated expense reflects the revised estimates with the corresponding adjustment in the shareholders’ equity.
The plans have been carried out with the delivery of the shares.
| 4.20. | Profit-Sharing for Employees and Members of the Management |
The Company’s employees are entitled to profit sharing based on certain goals agreed annually. For the members of the management the goals are based on the statutory provisions proposed by the Board of Directors and approved by the shareholders. The profit sharing is recognized in the income statement for the period in which the goals are achieved.
| 48 |
| | Notes to the Financial Statements Fiscal Year ended December 31, 2020 (In thousands of Brazilian Reais - R$, except when otherwise indicated) |
| 4.21. | Financial Revenues and Expenses |
Include interest revenues on amounts invested, exchange rate changes on assets and liabilities, changes in the fair value of financial assets measured at fair value through profit or loss, gains and losses on hedge instruments that are recognized in the income (expenses), interest on loans and financing, commissions and bank charges, among others. Interest revenues and expenses are recognized in the income statement using the effective interest method.
| 4.22. | Earnings (Loss) per Share |
Basic earnings per share are calculated by dividing the net income for the fiscal year attributed to the Company’s controlling shareholders by the weighted average number of all classes of shares outstanding during the year.
Diluted earnings (loss) per share are calculated by adjusting the weighted average number of shares outstanding by instruments potentially convertible into shares unless these adjustments are not dilutive.
| 4.23. | Information by Segment |
An operating segment is part of the Company that develops business activities to obtain revenues and incur expenses. The operating segments reflect the way in which the Company’s management reviews the financial information to make decisions. The Company’s Management identified the operating segments, which meet the quantitative and qualitative parameters of disclosure and represent the main types of business: air transportation and mileage program.
| 4.23.1. | Air Transportation Segment |
The operations in this segment originate mainly from the subsidiary GLA, for the provision of air passenger transportation services and the main revenue-generating assets are its aircraft. Other revenues originate mainly from cargo operations and related services such as baggage drop-off, fines for rebooking and cancellation of tickets, etc.
| 4.23.2. | Loyalty Program Segment |
The operations of this segment are represented by transactions for the sale of miles to air and non-air partners. In this context, includes the management of the program, the marketing and redemption rights of products and services and the creation and management of a database of individuals and companies. The main cash-generating asset is its portfolio of program participants.
| 4.24. | Transactions in Foreign Currency |
Foreign currency transactions are recorded at the exchange rate change prevailing on the date on which the transactions take place. Monetary assets and liabilities designated in foreign currency are calculated based on the exchange rate change on the balance sheet date. Any difference resulting from the translation of currencies is recorded under the item “Exchange Rate Change, Net” in the income statement for the fiscal year.
| 49 |
| | Notes to the Financial Statements Fiscal Year ended December 31, 2020 (In thousands of Brazilian Reais - R$, except when otherwise indicated) |
The exchange rate changes in reais in effect on the base date of these financial statements are as follows:
| Final Rate | Average Rate | |||
| 2020 | 2019 | 2020 | 2019 | |
| U.S. Dollar | 5.1967 | 4.0307 | 5.1425 | 4.1102 |
| Argentinian Peso | 0.0617 | 0.0673 | 0.0622 | 0.0686 |
| 4.25. | Statement of Added Value (“DVA”) |
Has the purpose to show the wealth generated by the Company and its distribution during a given fiscal year. Presented by the Company as required by Brazilian Corporation Law as part of its financial statements and as additional information to the consolidated financial statements under IFRS standards. The DVA was prepared based on information obtained in the accounting records following the provisions in CPC 09 - “Statement of Added Value”.
| 4.26. | New Accounting Standards and Pronouncements Adopted in the Current Fiscal Year |
The standards listed below have become valid for annual periods beginning on or after January 1, 2020. The Company decided not to adopt in advance any other standard, interpretation or amendment that has been issued but is not yet in force.
| 4.26.1. | Changes to CPC 15 (R1): Definition of the Business |
The amendments to CPC 15 (R1) clarify that, to be considered a business, an integrated set of activities and assets must include, at a minimum, an input - input of resources and a substantive process that, together, contribute significantly to the capacity to generate output - output of resources. In addition, clarified that a business can exist without including all inputs - inputs of resources and processes necessary to create outputs - outputs of resources. These changes had no impact on the Company's parent company and consolidated financial statements, but may impact future periods if the Company enters into any business combinations.
| 4.26.2. | Changes to CPC 38, CPC 40 (R1) and CPC 48: Reform of the Reference Interest Rate. |
The amendments to Pronouncements CPC 38 and CPC 48 provide exemptions that apply to all protective relationships directly affected by the reference interest rate reform. A protective relationship is directly affected if the reform raises uncertainties about the period or the value of cash flows based on the reference interest rate of the hedged item or hedging instrument. These changes have no impact on the Company's parent company and consolidated financial statements, since it does not have interest rate hedging relationships.
| 4.26.3. | Changes to CPC 26 (R1) and CPC 23: Definition of the Material |
The amendments provide a new definition of material that states, “the information is material if its omission, distortion or obscurity could reasonably influence decisions that primary users of general purpose financial statements make based on those financial statements, which provide financial information on entity-specific report”. The amendments clarify that the materiality will depend on the nature or magnitude of the information, individually or in combination with other information, in the context of the financial statements. Distorted information is material if one could reasonably be expected to affect decisions made by primary users. These changes had no impact on the parent company and consolidated financial statements, nor is it expected to have any future impact for the Company.
| 50 |
| | Notes to the Financial Statements Fiscal Year ended December 31, 2020 (In thousands of Brazilian Reais - R$, except when otherwise indicated) |
| 4.26.4. | Revision in CPC 00 (R2): Conceptual Framework for the Financial Report |
The revised pronouncement include some new concepts, updates definitions and recognition criteria of assets and liabilities, and clarifies some important concepts. These changes had no impact on the Company's parent company and consolidated financial statements.
| 4.26.5. | Changes to CPC 06 (R2): Benefits related to COVID-19 granted to Lessees under Lease Agreements. |
The amendments provide for concession to lessees in the application of the guidelines of CPC 06 (R2), equivalent to IFRS 16, on the modification of the lease, when accounting for the related benefits as a direct result of the Covid-19 pandemic.
As a practical expedient, a lessee may choose not to assess if a benefit related to COVID-19 granted by the lessor is a modification of the lease. The lessee who makes this option must account for any change in the lease payment resulting from the benefit granted in the lease agreement related to COVID-19 in the same way that it would account for the change applying CPC 06 (R2) if the change was not a change of the lease agreement.
For agreements renegotiated until June 2020, which had only their payments postponed until June 2021, and meet the conditions provided for in the standard, the Company chose not to evaluate such changes as changes to the lease agreements, having applied the practical expedient above.
| 4.27. | Main Accounting Estimates and Assumptions Used |
As disclosed in Note 2, the Management made judgments that have a significant effect on the amounts recognized in the financial statements, namely:
• ticket and miles breakage revenue (Note 4.18.1 and 4.18.2);
• allowance for expected loss on trade receivables accounts (Note 8);
• advances to suppliers and third parties (Note 10);
• annual analysis of the recoverable amount of taxes deferred (Note 12);
• impairment test of maintenance deposits (Note 13);
• useful life of property, plant, and equipment and intangible assets with defined useful life (Notes 15 and 16);
• annual impairment test of goodwill (Note 16);
• impairment test of slots (Note 16);
• advance ticket sales (Note 22);
• provision for the return of aircraft and engines (Note 24);
• provisions for post-employment benefits (Note 24);
• provision for tax, civil and labor risks (Note 24);
• share-based compensation transactions (Note 27);
• rights and obligations with derivative transactions (Note 34); and
• fair value of financial instruments (Note 34).
The Company continuously reviews the assumptions used in its accounting estimates. The effect of revisions to accounting estimates is recognized in the financial statements in the period in which such revisions are made.
| 51 |
| | Notes to the Financial Statements Fiscal Year ended December 31, 2020 (In thousands of Brazilian Reais - R$, except when otherwise indicated) |
| 4.28. | New Accounting Standards and Pronouncements not yet Adopted |
| 4.28.1. | Changes to IAS 1: Classification of Liabilities as Current or Non-Current |
In January 2020, IASB issued amendments to Paragraphs 69 to 76 of IAS 1, related to CPC 26, to specify the requirements to classify the liability as current or non-current. The amendments clarify:
| · | What means a right to postpone liquidation; |
| · | That the right to postpone must exist on the base date of the report; |
| · | That this classification is not affected by the likelihood that an entity will exercise its right to postpone |
| · | That only if a derivative embedded in a convertible liability is itself an equity instrument would the terms of a liability not affect its classification |
The changes are valid for periods beginning on or after January 1, 2023 and must be applied retrospectively. The Company currently assesses if such changes will have an impact on its financial statements.
According to the Management, there are no other standards and interpretations issued and not yet adopted that may have a significant impact on the income (expenses) or shareholders’ equity disclosed by the Company.
| 5. | Cash and Cash Equivalents |
| Parent Company | Consolidated | |||
| 2020 | 2019 | 2020 | 2019 | |
| Cash and Bank Deposits | 374,271 | 488 | 428,812 | 418,447 |
| Cash Equivalents | 49,666 | 1,016,258 | 234,018 | 1,226,978 |
| Total | 423,937 | 1,016,746 | 662,830 | 1,645,425 |
The breakdown of cash equivalents is as follows:
| Parent Company | Consolidated | |||
| 2020 | 2019 | 2020 | 2019 | |
| Domestic Currency | ||||
| Private Bonds | 49,014 | 366,338 | 170,359 | 514,356 |
| Automatic Investments | 652 | - | 59,936 | 5,505 |
| Total Domestic Currency | 49,666 | 366,338 | 230,295 | 519,861 |
| Foreign Currency | ||||
| Private Bonds | - | 649,920 | 3,723 | 707,117 |
| Total Foreign Currency | - | 649,920 | 3,723 | 707,117 |
| Total | 49,666 | 1,016,258 | 234,018 | 1,226,978 |
| 6. | Financial Investments |
| Parent Company | Consolidated | ||||
| Weighted Average Profitability (p.a.) | 2020 | 2019 | 2020 | 2019 | |
| Domestic Currency | |||||
| Government Bonds | 72.7% of CDI | - | - | 22,465 | 56,532 |
| Investment Funds | 77.7% of CDI | 236 | 673 | 603,698 | 862,868 |
| Total Domestic Currency | 236 | 673 | 626,163 | 919,400 | |
| Foreign Currency | |||||
| Private Bonds | 0.6% | - | - | 2,415 | 1,713 |
| Government Bonds | - | - | - | - | 29,684 |
| Investment Funds | 0.6% | - | - | 757 | 2,965 |
| Total Foreign Currency | - | - | 3,172 | 34,362 | |
| Total | 236 | 673 | 629,335 | 953,762 | |
| Current | 236 | 673 | 628,343 | 953,762 | |
| Noncurrent | - | - | 992 | - | |
| 52 |
| | Notes to the Financial Statements Fiscal Year ended December 31, 2020 (In thousands of Brazilian Reais - R$, except when otherwise indicated) |
| 7. | Restricted Cash |
| Parent Company | Consolidated | ||||
Weighted Average Profitability (p.a.) | 2020 | 2019 | 2020 | 2019 | |
| Domestic Currency | |||||
| Import Financing | 96.6% of CDI | - | 2,428 | 213,153 | 116,932 |
| Letter of Guarantee - Legal Proceedings | 85.8% of CDI | 4,201 | 3,971 | 56,440 | 115,995 |
| Letter of Credit – Maintenance Deposit | 97.9% of CDI | - | - | 155,184 | 136,438 |
| Working Capital line of credit | 99.9% of CDI | - | - | 52,927 | 510 |
| Total Domestic Currency | 4,201 | 6,399 | 477,704 | 369,875 | |
| Foreign Currency | |||||
| Financing with Ex-lm Bank Collateral | 0.2% | - | - | 31,206 | - |
| Hedge Margin | - | - | - | 35,697 | 74,431 |
| Total Foreign Currency | - | - | 66,903 | 74,431 | |
| Total | 4,201 | 6,399 | 544,607 | 444,306 | |
| Current | 4,194 | 6,399 | 355,769 | 304,920 | |
| Noncurrent | 7 | - | 188,838 | 139,386 | |
| 8. | Trade Receivables |
| Consolidated | ||
| 2020 | 2019 | |
| Domestic Currency | ||
| Credit Card Administrators | 318,869 | 740,967 |
| Travel Agencies | 266,086 | 253,494 |
| Cargo Agencies | 29,902 | 33,677 |
| Airline Partner Companies | 8,877 | 291 |
| Others | 13,845 | 15,690 |
| Total Domestic Currency | 637,579 | 1,044,119 |
| Foreign Currency | ||
| Credit Card Administrators | 77,616 | 121,844 |
| Travel Agencies | 13,960 | 36,845 |
| Cargo Agencies | 122 | 1,384 |
| Airline Partner Companies | 19,464 | 30,740 |
| Others | 9,005 | 11,550 |
| Total Foreign Currency | 120,167 | 202,363 |
| Total | 757,746 | 1,246,482 |
| Estimated Losses from Doubtful Accounts | (18,047) | (16,952) |
| Total Trade Receivables | 739,699 | 1,229,530 |
| 53 |
| | Notes to the Financial Statements Fiscal Year ended December 31, 2020 (In thousands of Brazilian Reais - R$, except when otherwise indicated) |
The aging list of trade receivables, net of allowance for expected loss on trade receivables accounts, is as follows:
| Consolidated | ||
| 2020 | 2019 | |
| To be Due | ||
| Until 30 days | 459,338 | 567,567 |
| From 31 to 60 days | 88,893 | 213,334 |
| From 61 to 90 days | 33,121 | 100,478 |
| From 91 to 180 days | 54,832 | 187,883 |
| From 181 to 360 days | 41,484 | 76,902 |
| Above 360 days | 256 | 1,499 |
| Total to be Due | 677,924 | 1,147,663 |
| Overdue | ||
| Until 30 days | 10,278 | 47,959 |
| From 31 to 60 days | 21,677 | 23,290 |
| From 61 to 90 days | 13,501 | 3,986 |
| From 91 to 180 days | 11,474 | 3,009 |
| From 181 to 360 days | 785 | 421 |
| Above 360 days | 4,060 | 3,202 |
| Total Overdue | 61,775 | 81,867 |
| Total | 739,699 | 1,229,530 |
The changes in the expected loss on trade receivables are as follows:
| Consolidated | ||
| 2020 | 2019 | |
| Balance at the Start of the Fiscal Year | (16,952) | (11,284) |
| (Additions) and Exclusions | (1,095) | (13,499) |
| Unrecoverable Amounts | - | 7,831 |
| Balances at the End of the Fiscal Year | (18,047) | (16,952) |
| 9. | Inventories |
| Consolidated | ||
| 2020 | 2019 | |
| Consumables | 14,533 | 14,274 |
| Parts and Maintenance Materials | 181,105 | 184,939 |
| Total | 195,638 | 199,213 |
| 54 |
| | Notes to the Financial Statements Fiscal Year ended December 31, 2020 (In thousands of Brazilian Reais - R$, except when otherwise indicated) |
The changes in the provision for obsolescence are as follows:
| Consolidated | ||
| 2020 | 2019 | |
| Balances at the Start of the Fiscal Year | (14,302) | (12,808) |
| Additions | (702) | (2,168) |
| Write-Offs | 2,142 | 674 |
| Balances at the End of the Fiscal Year | (12,862) | (14,302) |
| 10. | Advances to Suppliers and Third-Parties |
| Parent Company | Consolidated | |||
| 2020 | 2019 | 2020 | 2019 | |
| Advance to Domestic Suppliers | - | - | 290,664 | 95,596 |
| Advances to Foreign Suppliers | 10,441 | 37 | 68,873 | 25,316 |
| Advance for Materials and Repairs | - | - | 48,933 | 48,930 |
| Other Advances | - | - | - | 20,883 |
| Total Advances to Suppliers | 10,441 | 37 | 408,470 | 190,725 |
| Current | 10,441 | 37 | 318,769 | 142,338 |
| Noncurrent | - | - | 89,701 | 48,387 |
| 11. | Taxes to Recover |
| Parent Company | Consolidated | |||
| 2020 | 2019 | 2020 | 2019 | |
| Prepaid Income Tax and Social Contribution to Recover | 18,335 | 27,552 | 109,231 | 195,864 |
| Withholding Income Tax | - | - | - | 3,969 |
| PIS and COFINS to Recover(*) | - | - | 387,033 | 273,152 |
| Value Added Tax (VAT), Abroad | - | - | 3,998 | 4,650 |
| Others | 62 | 60 | 5,097 | 6,181 |
| Total | 18,397 | 27,612 | 505,359 | 483,816 |
| Current | 6,295 | 5,163 | 186,955 | 309,674 |
| Noncurrent | 12,102 | 22,449 | 318,404 | 174,142 |
(*) During the fiscal year ended December 31, 2020, the subsidiary GLA recorded PIS and COFINS extemporaneous tax credits, in the total amount of R$126,675. As of December 31, 2019, the subsidiaries Smiles Fidelidade and GLA calculated out-of-date PIS and COFINS credits, totaling R$49,518 and R$91,066, respectively.
| 55 |
| | Notes to the Financial Statements Fiscal Year ended December 31, 2020 (In thousands of Brazilian Reais - R$, except when otherwise indicated) |
| 12. | Deferred Taxes |
| 12.1. | Deferred Tax Assets (Liabilities) |
The positions of deferred assets and liabilities are presented below and comply with the enforceable offset legal rights that consider taxes levied by the same tax authority under the same tax entity.
| Parent Company | Consolidated | ||||||
| December 31, 2019 | Income (Expenses) | December 31, 2020 | December 31, 2019 | Income (Expenses) | Shareholders’ Equity and Others (*) | December 31, 2020 | |
| Deferred Assets | |||||||
| Tax Losses | 39,890 | (1,969) | 37,921 | 42,795 | (5,186) | 312 | 37,921 |
| Negative Basis of Social Contribution | 14,360 | (710) | 13,650 | 14,360 | (710) | - | 13,650 |
| Temporary Differences: | |||||||
| Provision for Losses on Other Credits | 1,957 | 47 | 2,004 | 1,958 | 46 | - | 2,004 |
| Provision for Legal Proceedings and Tax Liabilities | 696 | (779) | (83) | 696 | (779) | - | (83) |
| Others | - | - | - | - | 15 | 56 | 71 |
| Total Income Tax and Social Contribution Deferred - Assets | 56,903 | (3,411) | 53,492 | 59,809 | (6,614) | 368 | 53,563 |
| Deferred Liabilities | |||||||
| Temporary Differences: | |||||||
| Derivative Transactions | - | - | - | (42,154) | 13,252 | - | (28,902) |
| Breakage Provision | - | - | - | (196,206) | 2,708 | - | (193,498) |
| Flight Rights | - | - | - | (353,226) | - | - | (353,226) |
| Depreciation of Engines and Parts for Aircraft Maintenance | - | - | - | (183,977) | (10,812) | - | (194,789) |
| Reversal of Goodwill Amortization for Tax Purposes | - | - | - | (127,659) | - | - | (127,659) |
| Provision for Doubtful Accounts | - | - | - | 17,035 | (6,737) | - | 10,298 |
| Provision for Losses on Other Credits | - | - | - | 183,053 | 8,095 | - | 191,148 |
| Provision for Legal Proceedings and Tax Liabilities | - | - | - | 91,051 | 33,672 | - | 124,723 |
| Aircraft Return | - | - | - | 146,239 | 44,539 | - | 190,778 |
| Aircraft Leases and Others | - | - | - | 64,379 | (55,793) | - | 10,586 |
| Unrealized Profits | - | - | - | 68,111 | 1,732 | - | 69,843 |
| Others | - | - | - | 89,313 | (8,463) | 214 | 81,064 |
| Total Income Tax and Social Contribution Deferred - Liabilities | - | - | - | (244,041) | 24,193 | 214 | (219,634) |
| Total Effect of Deferred Taxes in the Income (Expenses) | - | (3,411) | - | - | 17,579 | - | - |
(*) Exchange rate change recognized in other comprehensive income (expenses).
| 56 |
| | Notes to the Financial Statements Fiscal Year ended December 31, 2020 (In thousands of Brazilian Reais - R$, except when otherwise indicated) |
The Company’s Management considers that the deferred assets and liabilities recognized on December 31, 2020 arising from temporary differences will be realized in proportion to realization of their bases and the expectation of future income (expenses).
The Management estimates that active deferred tax credits, recorded on tax losses and a negative social contribution base, may be realized as follows:
| Year | Amount |
| 2021 | 1,438 |
| 2022 | 9,128 |
| 2023 | 12,657 |
| 2024 | 13,191 |
| 2025 to 2030 | 15,157 |
| Total | 51,571 |
The direct subsidiary GLA has tax losses and negative bases of social contribution in the determination of taxable profit, to be offset against 30% of future annual tax profits, with no prescription period, not recorded in the balance sheet, in the following amounts:
| GLA | ||
| 2020 | 2019 | |
| Income Tax Loss | 8,401,388 | 5,017,227 |
| Negative Basis of Social Contribution | 8,401,388 | 5,017,227 |
| Potential Tax Credit | 2,856,472 | 1,705,857 |
The reconciliation of effective income taxes and social contribution rates for the periods ended December 31, 2020 and 2019 is as follows:
| Parent Company | Consolidated | |||
| 2020 | 2019 | 2020 | 2019 | |
| Loss before Income Tax and Social Contribution | (5,978,491) | (141,376) | (5,817,293) | 388,945 |
| Combined Nominal Tax Rate | 34% | 34% | 34% | 34% |
| Income Tax and Social Contribution by the Combined Tax Rate | 2,032,687 | 48,068 | 1,977,880 | (132,241) |
| Adjustments to Calculate the Actual Tax Rate: | ||||
| Equity Income (Loss) | (1,811,034) | 173,375 | (149) | 26 |
| Tax Rate Difference of the Income (Expenses) of Subsidiaries | (29,562) | (192,511) | (4,734) | (207,565) |
| Nondeductible Expenses, Net | (1,028) | (956) | (124,577) | (61,219) |
| Exchange Rate Change on Foreign Investments | (191,052) | (29,603) | (174,151) | (101,329) |
| Interest on Shareholders’ Equity | (9,648) | (9,115) | 8,693 | 8,212 |
| Overdue Tax Credit | - | 34,845 | - | 31,942 |
| Benefit (Not Constituted) on Tax Losses, Negative Basis and Temporary Differences | - | - | (1,760,920) | 252,567 |
| Total Income Tax and Social Contribution | (9,637) | 24,103 | (77,958) | (209,607) |
| Income Tax and Social Contribution | ||||
| Current | (6,226) | (8,591) | (95,537) | (178,621) |
| Deferred | (3,411) | 32,694 | 17,579 | (30,986) |
| Total Income Tax and Social Contribution | (9,637) | 24,103 | (77,958) | (209,607) |
| 57 |
| | Notes to the Financial Statements Fiscal Year ended December 31, 2020 (In thousands of Brazilian Reais - R$, except when otherwise indicated) |
| 13. | Deposits |
| Parent Company | Consolidated | |||
| 2020 | 2019 | 2020 | 2019 | |
| Maintenance deposits | - | - | 1,032,418 | 830,282 |
| Court Deposits | 49,838 | 61,447 | 667,565 | 841,746 |
| Deposit in Guarantee for Lease Agreements | 68,423 | 51,055 | 358,472 | 296,327 |
| Total | 118,261 | 112,502 | 2,058,455 | 1,968,355 |
| 13.1. | Maintenance deposits |
The Company makes deposits in US dollars for the maintenance of aircraft and engines, which will be used in future events as established in certain lease agreements.
Maintenance deposits do not exempt the Company, as a lessee, from contractual obligations related to the maintenance or the risk associated with operating activities. These deposits can be replaced by bank guarantees or letters of credit (SBLC - stand by letter of credit) according to the conditions established in the aircraft lease. The Company has the right to choose to carry out the maintenance internally or through its suppliers.
The Company has two categories of maintenance deposits:
| · | Maintenance Guarantee: Refers to one-time deposits that are refunded at the end of the lease, and can also be used in maintenance events, depending on negotiations with lessors. The balance of these deposits on December 31, 2020 was R$273,311 (R$213,449 on December 31, 2019). |
| · | Maintenance Reserve: Refers to amounts paid monthly based on the use of components and can be used in maintenance events as set by an agreement. On December 31, 2020, the balance referring to such reserves was R$759,108 (R$616,833 on December 31, 2019). |
| 13.2. | Judicial Deposits |
Court deposits and blocks represent guarantees of tax, civil and labor lawsuits, kept in court until the resolution of the disputes to which they are related. Part of the court deposits refers to civil and labor lawsuits arising from succession requests in lawsuits filed against Varig S.A. or also labor lawsuits filed by employees who do not belong to GLA or any related party. Bearing in mind that the Company is not a legitimate party to appear on the liability side of the said lawsuits, whenever blocks occur, their exclusion and respective release of the retained funds is demanded. As of December 31, 2020, the blocked amounts referring to Varig S.A.'s succession proceedings and third-party proceedings were R$91,378 and R$108,350, respectively (R$115,390 and R$107,510 as of December 31, 2019), the remaining amounts refer to legal proceedings to which the Company is the main party.
| 13.3. | Deposits in Guarantee for Lease Agreements |
As required by the lease agreements, the Company makes guarantee deposits (in US dollars) to the leasing companies, which can be fully redeemed at maturity.
| 58 |
| | Notes to the Financial Statements Fiscal Year ended December 31, 2020 (In thousands of Brazilian Reais - R$, except when otherwise indicated) |
| 14. | Investments |
| 14.1. | Breakdown of Investments |
The investment information is shown below:
| Parent Company | Consolidated | |||
| GLA | Smiles Fidelidade | Trip | ||
| Material Information on Subsidiaries on December 31, 2020 | ||||
| Total Number of Shares | 5,262,335,049 | 124,158,953 | - | |
| Share Capital | 4,554,280 | 254,610 | 1,318 | |
| Interest % | 100.0% | 52.60% | 60.0% | |
| Shareholders’ Equity (Deficit) | (12,670,479) | 1,350,329 | 1,359 | |
| Unrealized Gains (a) | - | (135,578) | - | |
| Adjusted Shareholders’ Equity (b) | (12,670,479) | 574,717 | 815 | |
| Net Income (Loss) for the Fiscal Year | (5,426,288) | 195,957 | (732) | |
| Unrealized Gains for the Fiscal Year (a) | - | (3,363) | - | |
| Adjusted Net Income (Expenses) for the Fiscal Year (b) | (5,426,288) | 99,717 | (439) | |
| Material Information on Subsidiaries on December 31, 2019 | ||||
| Total Number of Shares | 5,262,335,049 | 124,158,953 | - | |
| Share Capital | 4,554,280 | 254,610 | 1,318 | |
| Interest % | 100.00% | 52.61% | 60.00% | |
| Shareholders’ Equity (Deficit) | (6,498,660) | 1,205,335 | 2,091 | |
| Unrealized Gains (a) | - | (132,215) | - | |
| Adjusted Shareholders’ Equity (b) | (6,498,660) | 501,986 | 1,254 | |
| Net Income (Expenses) for the Fiscal Year | 215,027 | 626,725 | 129 | |
| Unrealized Gains for the Fiscal Year (a) | - | (35,909) | - | |
| Adjusted Net Income (Expenses) for the Fiscal Year (b) | 215,027 | 294,899 | 77 | |
(a) Corresponds to transactions involving revenue from mileage redemption for airline tickets by members in the Smiles Program which, for the purposes of consolidated statements, are only accrued when program members are actually transported by GLA.
(b) Adjusted shareholders’ equity and adjusted net profit (loss) for the fiscal year corresponds to the percentage of total shareholders’ equity and net profit (loss) of unrealized profits.
| 14.2. | Changes in Investments |
| Parent Company | Consolidated | |||
| GLA | Smiles Fidelidade | Total | Trip | |
| Balances on December 31, 2019 | (6,498,660) | 501,986 | (5,996,674) | 1,254 |
| Equity Income (Expenses) | (5,426,288) | 99,717 | (5,326,571) | (439) |
| Unrealized Income (Expenses) on Hedge | (781,033) | - | (781,033) | - |
| Foreign Exchange Rate Change on Investment Conversion Abroad | - | 564 | 564 | - |
| Dividends and Interest on Shareholders’ Equity | - | (28,370) | (28,370) | - |
| Share-Based Compensation | 21,039 | 1.259 | 22,298 | - |
| Actuarial Losses from Post-Employment Benefits | 14,463 | (87) | 14,376 | - |
| Effect from Dilution in the Equity Interest | - | (353) | (352) | - |
| Balances on December 31, 2020 | (12,670,479) | 574,718 | (12,095,762) | 815 |
| 59 |
| | Notes to the Financial Statements Fiscal Year ended December 31, 2020 (In thousands of Brazilian Reais - R$, except when otherwise indicated) |
| 15. | Property, Plant & Equipment |
| 15.1. | Parent Company |
On December 31, 2020, the balance of Property, Plant & Equipment was R$68,660 in the subsidiary GAC. On December 31, 2019, the balance totaled R$131,841, mainly related to advances for the acquisition of aircraft, which were partially returned by the manufacturer during 2020, see agreement mentioned in Note 1.3, and R$108,538 relating to ownership rights over the aircraft in the subsidiary GAC, which were written-off in line with the sale leaseback transactions carried out in 2020.
| 60 |
| | Notes to the Financial Statements Fiscal Year ended December 31, 2020 (In thousands of Brazilian Reais - R$, except when otherwise indicated) |
| 15.2. | Consolidated |
| Weighted Average Rate (p.a.) | 2019 | Contractual Amendments | Write-Off | Transfers | 2020 | |
| Flight Equipment | ||||||
| Cost | ||||||
| Aircraft - ROU(1) with Purchase Option (5) | 660,256 | - | (660,256) | - | - | |
| Aircraft - ROU with no Purchase Option | 3,561,980 | 704,253 | (245,524) | - | 4,020,709 | |
| Spare Parts and Engines – Own(6) (7) | 1,764,295 | 206,253 | (5,887) | (250) | 1,964,411 | |
| Spare Parts and Engines - ROU | 109,977 | (15,296) | (10,352) | - | 84,329 | |
| Aircraft and Engine Improvements | 3,084,023 | 351,386 | (229,024) | - | 3,206,385 | |
| Tools | 53,454 | 2,311 | (194) | 250 | 55,821 | |
| 9,233,985 | 1,248,907 | (1,151,237) | - | 9,331,655 | ||
| Depreciation | ||||||
| Aircraft - ROU with Purchase Option (5) | (226,433) | (2,935) | 229,368 | - | - | |
| Aircraft - ROU with no Purchase Option | 16.52% | (719,377) | (783,678) | 82,407 | - | (1,420,648) |
| Spare Parts and Engines – Own (6) (7) | 7.13% | (706,381) | (133,806) | 3,139 | - | (837,048) |
| Spare Parts and Engines - ROU | 25.59% | (26,745) | (30,274) | 9,079 | - | (47,940) |
| Aircraft and Engine Improvements | 44.20% | (1,717,552) | (780,054) | 215,564 | - | (2,282,042) |
| Tools | 10.00% | (24,712) | (4,148) | 163 | - | (28,697) |
| (3,421,200) | (1,734,895) | 539,720 | - | (4,616,375) | ||
| Total Net - Flight Equipment | 5,812,785 | (485,988) | (611,517) | - | 4,715,280 | |
| Property, Plant & Equipment in Use | ||||||
| Cost | ||||||
| Vehicles | 11,681 | 159 | (576) | - | 11,264 | |
| Machinery and Equipment | 63,091 | 888 | (1,138) | - | 62,841 | |
| Furniture and fixtures | 32,983 | 1,386 | (1,579) | - | 32,790 | |
| Computers and Peripherals - Own | 45,732 | 2,863 | (1,108) | - | 47,487 | |
| Computers and Peripherals – ROU | 21,992 | - | - | - | 21,992 | |
| Communication Equipment | 2,548 | 8 | (323) | - | 2,233 | |
| Security Equipment | 856 | - | (801) | - | 55 | |
| Third-Party Property Improvements - CMA (3) | 107,637 | - | - | - | 107,637 | |
| Third-Party Property Improvements | 71,174 | 330 | - | 4,210 | 75,714 | |
| Third-Party Properties - ROU | 22,354 | 5,583 | (70) | - | 27,867 | |
| Construction in Progress | 17,906 | 1,141 | - | (4,210) | 14,837 | |
| 397,954 | 12,358 | (5,595) | - | 404,717 | ||
| Depreciation | ||||||
| Vehicles | 20.00% | (9,291) | (595) | 314 | - | (9,572) |
| Machinery and Equipment | 10.00% | (45,437) | (4,045) | 1,065 | - | (48,417) |
| Furniture and fixtures | 10.00% | (19,908) | (2,088) | 1,513 | - | (20,483) |
| Computers and Peripherals - Own | 20.00% | (33,190) | (3,740) | 1,093 | - | (35,837) |
| Computers and Peripherals – ROU | 35.26% | (7,682) | (7,778) | - | - | (15,460) |
| Communication Equipment | 10.00% | (2,081) | (95) | 305 | - | (1,871) |
| Security Equipment | 10.00% | (615) | (3) | 586 | - | (32) |
| Third-Party Property Improvements - CMA | 12.05% | (102,675) | (4,962) | - | - | (107,637) |
| Third-Party Property Improvements | 20.31% | (39,039) | (10,289) | - | - | (49,328) |
| Third-Party Properties - ROU | 35.57% | (7,156) | (8,748) | 70 | - | (15,834) |
| (267,074) | (42,343) | 4,946 | - | (304,471) | ||
| Total Net - Property, Plant & Equipment in Use | 130,880 | (29,985) | (649) | - | 100,246 | |
| Impairment Losses (2) | - | (41,719) | 7,389 | - | - | (34,330) |
| Total | 5,901,946 | (508,584) | (612,166) | - | 4,781,196 | |
| Advances to Suppliers (4) | - | 156,155 | 96,537 | (73,600) | - | 179,092 |
| Total Property, Plant & Equipment | 6,058,101 | (412,047) | (685,766) | - | 4,960,288 | |
(1) ROU - Right of Use
(2) Refers to provisions for impairment losses for rotable items (spare parts), classified under “Parts and spare engines", recorded by the Company in order to present its assets according to the actual capacity for the generation of expected future benefits.
(3) CMA - Maintenance Center - Confins/MG
(4) The write-off refers to PDP return, as mentioned in note 1.3.
(5) Write-off resulting from the sale-leaseback transaction, see Note 18.1.
(6) As of December 31, 2020, the balance of spare parts is granted as a guarantee to Secured Senior Notes 2026, according to note 17.
(7) As of December 31, 2020, 19 engines of the Company are granted as a guarantee to the Spare Engine Facility and the Loan Facility, according to note 17.
| 61 |
| | Notes to the Financial Statements Fiscal Year ended December 31, 2020 (In thousands of Brazilian Reais - R$, except when otherwise indicated) |
| 16. | Intangible Assets |
The breakdown of and changes in intangible assets are as follows:
| Consolidated | |||||
| Weighted Average Rate (p.a.) | 2019 | Additions | Write-Off | 2020 | |
| Cost | |||||
| Goodwill | - | 542,302 | - | - | 542,302 |
| Slots | - | 1,038,900 | - | - | 1,038,900 |
| Software | - | 579,370 | 63,993 | (135,629) | 507,734 |
| Others | - | 10,000 | - | - | 10,000 |
| Total Cost | 2,170,572 | 63,993 | (135,629) | 2,098,936 | |
| Amortization | |||||
| Software | 25.73% | (389,730) | (91,314) | 135,383 | (345,661) |
| Others | 20.00% | (4,167) | (2,000) | - | (6,167) |
| Total Amortization | (393,897) | (93,314) | 135,383 | (351,828) | |
| Intangible Assets, Net | 1,776,675 | (29,321) | (246) | 1,747,108 | |
The balances of goodwill and airport operating rights (slots) were tested for impairment on December 31, 2020, and 2019 through the discounted cash flow for each cash-generating unit, giving rise to the value in use.
In order to assess the recoverable value, assets are grouped at the lowest levels for which there are separately identifiable cash flows (Cash-Generating Units – “CGUs”). In order to determine the carrying amount of each cash-generating unit, the Company considers the intangible assets recorded and all necessary tangible assets to conduct the business, given that it will only generate economic benefits by using the combination of both.
| 62 |
| | Notes to the Financial Statements Fiscal Year ended December 31, 2020 (In thousands of Brazilian Reais - R$, except when otherwise indicated) |
The Company allocates goodwill to two cash-generating units: GLA and Smiles, and the slots are fully allocated to GLA’s cash-generating unit, as shown below.
| Goodwill | Slots | ||
| GLA | Smiles | ||
| December 31, 2020 | |||
| Book Value | 325,381 | 216,921 | 1,038,900 |
| Value in Use | 20,784,520 | 6,771,427 | 21,064,362 |
| Discount Rate | 13.98% | 14.72% | 12.20% |
| Perpetuity Growth Rate | 3.25% | 3.25% | 3.25% |
| December 31, 2019 | |||
| Book Value | 325,381 | 216,921 | 1,038,900 |
| Book Value – UGC | 3,615,949 | 161,669 | 3,615,949 |
| Value in Use | 26,543,428 | 6,061,994 | 21,373,789 |
| Discount Rate | 12.20% | 12.07% | 12.85% |
| Perpetuity Growth Rate | 3.55% | 3.55% | 3.53% |
The results obtained were compared with the carrying amount of each cash generating unit, and, as a result, the Company did not recognized impairment losses on its CGUs.
The assumptions adopted in the impairment testing of intangible assets are based on internal projections for a five-year period. For longer periods, the Company uses the perpetuity growth rate. The discounted cash flow that calculated the value in use of the cash-generating units was prepared in accordance with the Company’s business plan and approved by the Company’s Board of Directors.
The main assumptions taken into consideration by the Company to determine the value in use of the cash-generating units are:
| · | Capacity and fleet: considers the use, the aircraft capacity used in each flight and the projected size of the fleet in use. |
| · | Demand: Market efficiency is the main input to estimate the Company’s demand growth. Management considers market efficiency to be the ratio between its market share and its seat share. This indicator reflects how efficiently the Company uses its share of the market’s total supply based on how much demand for air transportation it absorbs. |
| · | Revenue per passenger: considers the average price charged by GLA and the effects of market variables (see the variables used below). |
| · | Operating costs related to the business: based on the historical cost and adjusted by indicators, such as inflation, supply, demand and variation of the U.S. dollar. |
The Company also considered market variables such as GDP (source: Central Bank of Brazil), US dollar (source: Central Bank of Brazil), kerosene barrel (source: Brazilian Agency of Oil - “ANP”) and interest rate (source: Bloomberg).
| 63 |
| | Notes to the Financial Statements Fiscal Year ended December 31, 2020 (In thousands of Brazilian Reais - R$, except when otherwise indicated) |
| 17. | Loans and Financing |
The breakdown of and changes in short and long-term debt are as follows:
| Parent Company | |||||||||||||||
| 2019 | 2020 | ||||||||||||||
| Maturity | Interest Rate p.a. | Current | Noncurrent | Total | Funding | Unrealized Income (Expenses) on ESN | Principal Payment | Interest Incurred | Interest Paid | Exchange Rate Change | Amortization of Costs and Goodwill | Current | Noncurrent | Total | |
| In US$: | |||||||||||||||
| Term Loan B (a) | 08/2020 | 6.50% | 1,229,600 | - | 1,229,600 | - | - | (1,641,390) | 65,382 | (97,632) | 437,942 | 6,098 | - | - | - |
| Guaranteed Funding (b) | 12/2021 | 9.50% | - | - | - | 1,367,825 | - | (833,171) | 36,749 | (36,366) | (50,924) | - | 484,113 | - | 484,113 |
| Senior Notes 2022 (c) | 01/2022 | 8.88% | 12,102 | 313,267 | 325,369 | - | - | (405,878) | 7,052 | (20,695) | 92,730 | 1,422 | - | - | - |
| ESN (1) (d) | 07/2024 | 3.75% | 29,443 | 1,753,526 | 1,782,969 | - | (374,994) | - | 178,414 | (75,486) | 424,327 | (416) | 37,960 | 1,896,854 | 1,934,814 |
| Senior Notes 2025 (e) | 01/2025 | 7.00% | 75,587 | 2,548,472 | 2,624,059 | 37,322 | - | - | 235,588 | (215,506) | 751,423 | 5,951 | 98,521 | 3,340,316 | 3,438,837 |
| Secured Notes 2026 (f) | 06/2026 | 8.00% | - | - | - | 952,509 | - | - | 1,828 | - | 20 | 1,293 | 1,848 | 953,802 | 955,650 |
| Perpetual Notes (g) | - | 8.75% | 12,815 | 620,328 | 633,143 | - | - | - | 69,356 | (69,593) | 183,393 | - | 16,522 | 799,777 | 816,299 |
| Total | 1,359,547 | 5,235,593 | 6,595,140 | 2,357,656 | (374,994) | (2,880,439) | 594,369 | (515,278) | 1,838,911 | 14,348 | 638,964 | 6,990,749 | 7,629,713 | ||
(1) Exchangeable Senior Notes see Note 34.2.
| (a) | Term Loan raised by Gol Finance on August 31, 2016 for aircraft purchases and bank repayment of loans, with backstop guarantee from Delta Airlines. |
| (b) | Backed financing raised by the subsidiary Gol Finance on August 31, 2020, with Delta Airlines, backed by Smiles’ shares and other assets, maturing on December 30, 2021. |
| (c) | Issuance of Senior Notes 2022 by the subsidiary Gol Finance on September 24, 2014, to renegotiate the Company's indebtedness. |
| (d) | Issuance of Exchangeable Senior Notes (“ESN”) by the subsidiary Gol Finance in March, April and July 2019, totaling US$425 million maturing in 2024, on which nominal interest of 3.75% p.a. will be charged. |
| (e) | Issuance of Senior Notes 2025 by the subsidiary Gol Finance on December 11, 2017 and February 2, 2018, to repurchase Senior Notes and general purposes of the Company. |
| (f) | Issuance of Secured Notes 2026 by the subsidiary Gol Finance on December 23, 2020 totaling US$200 million, maturing on June 30, 2026. |
| (g) | Issuance of Perpetual Notes by Gol Finance on April 5, 2006 to finance aircraft purchase. |
| 64 |
| | Notes to the Financial Statements Fiscal Year ended December 31, 2020 (In thousands of Brazilian Reais - R$, except when otherwise indicated) |
| Consolidated | |||||||||||||||
| 2019 | 2020 | ||||||||||||||
| Maturity | Interest Rate p.a. | Current | Noncurrent | Total | Funding | Unrealized Income (Expenses) on ESN | Principal Payment | Interest Incurred | Interest Paid | Exchange Rate Change | Amortization of Costs and Goodwill | Current | Noncurrent | Total | |
| In R$: | |||||||||||||||
| Working Capital (a) | 10/2025 | 6.48% | - | - | - | 704,172 | - | (450,532) | 20,261 | (17,011) | - | - | 239,615 | 17,275 | 256,890 |
| Debentures VII (b) | 03/2022 | 3.41% (3) | 289,423 | 289,302 | 578,725 | - | - | - | 25,936 | (23,638) | - | 6,065 | 440,918 | 146,170 | 587,088 |
| In US$: | |||||||||||||||
| Term Loan B (c) | 08/2020 | 6.50% | 1,229,600 | - | 1,229,600 | - | - | (1,641,390) | 65,382 | (97,632) | 437,942 | 6,098 | - | - | - |
| Import Financing (d) | 01/2021 | 5.63% | 663,979 | - | 663,979 | 25,974 | - | (103,238) | 41,326 | (45,856) | 201,474 | - | 783,659 | - | 783,659 |
| Guaranteed Funding (e) | 12/2021 | 9.50% | - | - | - | 1,367,825 | - | (833,171) | 36,749 | (36,366) | (50,924) | - | 484,113 | - | 484,113 |
| Senior Notes 2022 (f) | 01/2022 | 8.88% | 12,102 | 313,267 | 325,369 | - | - | (405,878) | 7,052 | (20,695) | 92,730 | 1,422 | - | - | - |
| Financing with Ex-lm Bank Collateral (g) | 12/2022 | 0.92% | 180,812 | 76,395 | 257,207 | 124,074 | - | (216,829) | 5,488 | (4,469) | 71,877 | 7,396 | 194,786 | 49,958 | 244,744 |
| ESN (1) (h) | 07/2024 | 3.75% | 29,443 | 1,753,526 | 1,782,969 | - | (374,994) | - | 178,414 | (75,486) | 424,327 | (416) | 37,960 | 1,896,854 | 1,934,814 |
| Spare Engine Facility (i) | 09/2024 | 2.56% | 17,551 | 201,084 | 218,635 | - | - | (63,482) | 8,957 | (9,282) | 64,670 | 282 | 22,771 | 197,009 | 219,780 |
| Senior Notes 2025 (j) | 01/2025 | 7.00% | 75,587 | 2,548,472 | 2,624,059 | 37,322 | - | - | 235,588 | (215,506) | 751,423 | 5,951 | 98,521 | 3,340,316 | 3,438,837 |
| Secured Notes 2026 (k) | 06/2026 | 8.00% | - | - | - | 952,509 | - | - | 1,828 | - | 20 | 1,293 | 1,848 | 953,802 | 955,650 |
| Loan Facility (l) | 03/2028 | 4.73% | 31,727 | 150,821 | 182,548 | 59,949 | - | (33,719) | 11,974 | (8,969) | 53,681 | 237 | 32,566 | 233,135 | 265,701 |
| Perpetual Bonds (2) (m) | - | 8.75% | 12,815 | 533,935 | 546,750 | 99,135 | - | - | 60,035 | (60,117) | 159,887 | - | 16,522 | 789,168 | 805,690 |
| Total | 2,543,039 | 5,866,802 | 8,409,841 | 3,370,960 | (374,994) | (3,748,239) | 698,990 | (615,027) | 2,207,107 | 28,328 | 2,353,279 | 7,623,687 | 9,976,966 | ||
(1) Exchangeable Senior Notes see Note 34.2.
(2) It includes the elimination of related parties, considering securities of this issue, carried out by Gol Finance, held by GLA on December 31, 2020, totaling R$10,609 (R$86,393 on December 31, 2019).
(3) During the fiscal year ended on December 31, 2020, after Split there was division into three series: Series 1 with a CDI rate of 120%; Series 2 with CDI rate + 5.40% and Series 3 with CDI rate + 3.50%.
(a) Issuance of transactions with the purpose maintaining and managing the Company's working capital.
(b) Issuance of 88,750 debentures by GLA on October 22, 2018 for early settlement of the Debentures VI.
(c) Term Loan raised by Gol Finance on August 31, 2016 for aircraft purchases and bank repayment of loans, with backstop guarantee from Delta Airlines.
(d) Credit lines with private banks used to finance the import of spare parts and aeronautical equipment. The interest rates negotiated are Libor 3m + 4.40% p.a. and Libor 1m + 3.25% p.a.
(e) Backed financing raised by the subsidiary Gol Finance on August 31, 2020, with Delta Airlines, backed by Smiles’ shares and other assets, maturing on December 30, 2021.
(f) Issuance of Senior Notes 2022 by the subsidiary Gol Finance on September 24, 2014, to renegotiate the Company's indebtedness.
(g) Financing to perform engine maintenance services with Ex-Im Bank guarantee with an average rate of 0.81% p.a., in four transactions, with three transaction maturing in 2021 and one transaction maturing in 2022.
(h) Issuance of Exchangeable Senior Notes (“ESN”) by the subsidiary Gol Finance in March, April and July 2019, totaling US$425 million maturing in 2024.
(i) Loan backed by the Company's own engines, maturing in 2024.
(j) Issuance of Senior Notes 2025 by the subsidiary Gol Finance on December 11, 2017 and February 2, 2018, to repurchase Senior Notes and general purposes of the Company.
(k) Issuance of Secured Notes 2026 by the subsidiary Gol Finance on December 23, 2020 totaling US$200 million, maturing in 2026.
(l) Loans with a guarantee of 5 engines in total, made on June 28, 2018. The contracted rates vary between Libor 1m + 3.25% p.a. until Libor 3m + 4.4% p.a.
(m) Issuance of Perpetual Notes by Gol Finance on April 5, 2006 to finance aircraft purchase.
| 65 |
| | Notes to the Financial Statements Fiscal Year ended December 31, 2020 (In thousands of Brazilian Reais - R$, except when otherwise indicated) |
Total debt of the parent company and consolidated included fundraising and premiums costs of R$173,086 and R$189,195, respectively, on December 31, 2020 (R$119,118 and R$143,119 on December 31, 2019), which are amortized over the term of the related debt. The total also includes amortizable goodwill and fair value of the derivative financial instrument, both referring to ESN, totaling R$42,226 and R$346,030, respectively, on December 31, 2020 (R$54,479 and R$626,557 on December 31, 2019).
| 17.1. | New Loans and Financing during the Fiscal Year ended on December 31, 2020 |
| 17.1.1. | Working Capital |
During the fiscal year ended December 31, 2020, the Company, through its subsidiary GLA, raised funds and renegotiated the due dates of this type of agreement, placing promissory notes as collateral for the transactions. These transactions have as purpose maintaining and managing the company's working capital. Information on such financing is presented below:
| Date - | Amount | Interest | Date - |
| Transaction | (R$ thousand) | Rate (p.a.) | Maturity |
New Funding | |||
| April 20, 2020 | 21,195 | 8.52% | July 20, 2020 |
| April 20, 2020 | 72,000 | 10.03% | July 20, 2020 |
| April 20, 2020 | 94,830 | 8.99% | August 18, 2020 |
| May 8, 2020 | 147,871 | CDI + 6.9% | August 7, 2020 |
| May 11, 2020 | 10,013 | 8.60% | August 10, 2020 |
| May 13, 2020 | 24,000 | CDI + 8% | March 12, 2021 |
| May 15, 2020 | 254,468 | CDI + 2.5% | November 9, 2020 |
| October 7, 2020 | 59,795 | 8.58% | December 7, 2020 |
| October 23, 2020 | 10,000 | 6.90% | October 23, 2025 |
| November 26, 2020 | 10,000 | 10.69% | May 19, 2023 |
| Total | 704,172 | ||
| Renegotiations | |||
| April 20, 2020 | 94,830 | 8.99% | August 18, 2020 |
| May 8, 2020 | 105,903 | CDI + 6.9% | August 7, 2020 |
| June 18, 2020 | 21,195 | 8.52% | August 20, 2020 |
| July 7, 2020 | 110,903 | CDI + 6.9% | August 7, 2020 |
| July 20, 2020 | 50,000 | 10.03% | November 17, 2020 |
| August 7, 2020 | 44,361 | CDI + 6.9% | November 5, 2020 |
| August 10, 2020 | 10,013 | 8.60% | September 30, 2020 |
| August 18, 2020 | 94,830 | 8.99% | September 30, 2020 |
| August 31, 2020 | 114,666 | CDI + 2.50% | March 15, 2021 |
| September 2, 2020 | 37,640 | 10.03% | December 1, 2020 |
| September 30, 2020 | 94,830 | 8.99% | December 15, 2020 |
| September 30, 2020 | 10,013 | 8.60% | December 15, 2020 |
| December 7, 2020 | 59,795 | 8.58% | March 5, 2021 |
| December 15, 2020 | 94,830 | 8.99% | March 15, 2021 |
| December 15, 2020 | 10,013 | 8.60% | March 15, 2021 |
| Total | 953,822 |
| 17.1.2. | Import Financing |
During the fiscal year ended December 31, 2020, the Company, through its subsidiary GLA, raised funds and renegotiated the due dates of this type of agreement, placing promissory notes as collateral for the transactions. Which are part of a credit line maintained by GLA for engine maintenance, import financing in order to purchase spare parts and aircraft equipment. Information on such financing is presented below:
| 66 |
| | Notes to the Financial Statements Fiscal Year ended December 31, 2020 (In thousands of Brazilian Reais - R$, except when otherwise indicated) |
| Date - | Amount | Interest | Date - | |
| Transaction | (US$ thousand) | (R$ thousand) | Rate (p.a.) | Maturity |
| New Funding | ||||
| February 19, 2020 | 5,920 | 25,974 | 4.07% | February 13, 2021 |
| Renegotiations | ||||
| January 2, 2020 | 4,335 | 18,508 | 5.79% | June 30, 2020 |
| January 14, 2020 | 4,571 | 19,516 | 6.22% | May 13, 2020 |
| January 17, 2020 | 6,455 | 27,560 | 5.71% | July 15, 2020 |
| January 21, 2020 | 8,595 | 36,696 | 6.22% | May 20, 2020 |
| January 24, 2020 | 4,815 | 20,558 | 4.17% | January 15, 2021 |
| January 31, 2020 | 5,925 | 25,297 | 5.63% | July 29, 2020 |
| February 14, 2020 | 7,069 | 31,801 | 5.59% | August 12, 2020 |
| February 21, 2020 | 6,531 | 29,381 | 5.56% | August 19, 2020 |
| April 16, 2020 | 10,400 | 56,441 | 4.14% | June 16, 2020 |
| April 22, 2020 | 5,407 | 29,344 | 8.60% | August 20, 2020 |
| April 22, 2020 | 7,711 | 41,848 | 5.65% | October 19, 2020 |
| April 22, 2020 | 6,053 | 32,850 | 5.65% | October 19, 2020 |
| April 24, 2020 | 9,347 | 50,726 | 8.52% | August 24, 2020 |
| May 13, 2020 | 4,571 | 19,516 | 7.93% | September 10, 2020 |
| May 20, 2020 | 5,148 | 21,979 | 7.87% | September 17, 2020 |
| May 29, 2020 | 7,195 | 39,042 | 5.12% | November 25, 2020 |
| June 8, 2020 | 9,638 | 52,778 | 4.95% | November 5, 2020 |
| June 8, 2020 | 7,823 | 42,839 | 4.29% | October 6, 2020 |
| June 8, 2020 | 10,436 | 57,148 | 4.95% | November 5, 2020 |
| June 8, 2020 | 6,990 | 38,277 | 4.29% | October 6, 2020 |
| June 8, 2020 | 7,045 | 38,578 | 4.95% | November 5, 2020 |
| June 15, 2020 | 735 | 4,025 | 4.98% | December 14, 2020 |
| June 16, 2020 | 10,400 | 56,441 | 4.29% | October 14, 2020 |
| June 30, 2020 | 4,335 | 18,508 | 4.92% | December 29, 2020 |
| July 15, 2020 | 6,455 | 27,560 | 4.87% | January 11, 2021 |
| July 29, 2020 | 5,925 | 25,297 | 4.85% | January 25, 2021 |
| August 12, 2020 | 7,069 | 31,801 | 4.32% | September 25, 2020 |
| August 14, 2020 | 3,396 | 18,581 | 3.84% | January 8, 2021 |
| August 19, 2020 | 6,531 | 29,381 | 4.30% | October 2, 2020 |
| August 20, 2020 | 5,407 | 29,344 | 7.75% | December 18, 2020 |
| August 24, 2020 | 9,347 | 50,726 | 7.76% | December 22, 2020 |
| September 10, 2020 | 4,571 | 19,516 | 7.75% | January 8, 2021 |
| September 17, 2020 | 5,148 | 21,979 | 7.75% | January 15, 2021 |
| September 25, 2020 | 7,069 | 31,801 | 4.35% | December 15, 2020 |
| October 2, 2020 | 6,531 | 29,381 | 4.36% | December 15, 2020 |
| October 6, 2020 | 7,823 | 42,839 | 2.93% | January 4, 2021 |
| October 6, 2020 | 6,990 | 38,277 | 2.93% | January 4, 2021 |
| October 14, 2020 | 10,400 | 56,441 | 2.92% | January 9, 2021 |
| October 19, 2020 | 7,711 | 41,848 | 4.74% | December 15, 2020 |
| October 19, 2020 | 6,053 | 32,850 | 4.74% | December 15, 2020 |
| November 5, 2020 | 9,638 | 52,778 | 2.92% | February 3, 2021 |
| November 5, 2020 | 10,436 | 57,148 | 2.92% | February 3, 2021 |
| November 5, 2020 | 7,045 | 38,578 | 2.92% | February 3, 2021 |
| November 12, 2020 | 6,668 | 35,554 | 2.91% | February 10, 2021 |
| November 25, 2020 | 7,195 | 39,042 | 4.42% | December 15, 2020 |
| December 14, 2020 | 735 | 4,025 | 4.76% | March 15, 2021 |
| December 15, 2020 | 6,531 | 29,381 | 4.54% | March 15, 2021 |
| December 15, 2020 | 7,711 | 41,848 | 4.54% | March 15, 2021 |
| December 15, 2020 | 6,053 | 32,850 | 4.54% | March 15, 2021 |
| December 15, 2020 | 7,195 | 39,042 | 4.54% | March 15, 2021 |
| December 15, 2020 | 7,069 | 31,801 | 4.54% | March 15, 2021 |
| December 18, 2020 | 5,407 | 29,344 | 7.76% | June 16, 2021 |
| December 22, 2020 | 9,347 | 50,726 | 7.76% | June 21, 2021 |
| December 29, 2020 | 4,335 | 18,508 | 4.78% | March 29, 2021 |
| Total | 363,321 | 1,837,904 | ||
| 67 |
| | Notes to the Financial Statements Fiscal Year ended December 31, 2020 (In thousands of Brazilian Reais - R$, except when otherwise indicated) |
| 17.1.3. | Guaranteed Funding |
In August 2020, the Company obtained a bilateral financing from Delta Airlines backed by Smiles shares and other assets totaling US$250 million, corresponding to R$1,367,825 on the funding date.
| Date - | Principal | Interest | Date - | |
| Transaction | (US$ thousand) | (R$ thousand) | Rate (p.a.) | Maturity |
| August 31, 2020 | 250,000 | 1,367,825 | 9.50% | December 30, 2021 |
The Company has already paid US$157 million, corresponding to R$833,171 of the principal raised. On December 31, 2020, the amount due, including principal and interest, is US$93,157, R$484,113 considering the closing price of the dollar on the date.
| 17.1.4. | Financing with Ex-lm Bank Collateral |
In June 2020, the Company, through its subsidiary GLA, made the following fundraising with restricted cash (Note 7) assigned as guarantee:
| Date - | Principal | Costs | Interest | Date - | ||
| Transaction | (US$ thousand) | (R$ thousand) | (US$ thousand) | (R$ thousand) | Rate (p.a.) | Maturity |
| June 19, 2020 | 25,000 | 129,263 | 1,003 | 5,189 | Libor 6M + 0.6% | December 23, 2022 |
| 17.1.5. | Senior Notes 2026 |
In December 2020, the Company raised a Senior Secured Notes maturing in June 2026 and backed by fiduciary sales of certain assets: (i) substantially all the Company's intellectual property, including patents, trademarks, brand names and domains; and (ii) GLA aircraft’s spare parts.
| Date - | Principal | Costs | Interest | Date - | |||||
| Transaction | (US$ thousand) | (R$ thousand) | (US$ thousand) | (R$ thousand) | Rate (p.a.) | Maturity | |||
| December 23, 2020 | 200,000 | 1,039,340 | 16,750 | 86,831 | 8.00% p.a. | June 30, 2026 | |||
| 17.1.6. | Loan Facility |
In March 2020, the Company, through its subsidiary GLA, obtained funding with guarantee of the Company’s own engines. Information on such financing is presented below:
| Date - | Principal | Costs | Interest | Date - | ||
| Transaction | (US$ thousand) | (R$ thousand) | (US$ thousand) | (R$ thousand) | Rate (p.a.) | Maturity |
| March 20, 2020 | 12,000 | 60,847 | 177 | 898 | Libor 1M + 3.33% | March 20, 2028 |
| 68 |
| | Notes to the Financial Statements Fiscal Year ended December 31, 2020 (In thousands of Brazilian Reais - R$, except when otherwise indicated) |
| 17.2. | Loans and Financing – Noncurrent |
On December 31, 2020, the maturities of loans and financing recorded in non-current liabilities were as follows:
| 2022 | 2023 | 2024 | 2025 | 2025 onwards | Without Maturity Date | Total | |
| Parent Company | |||||||
| In US$: | |||||||
| ESN | - | - | 1,896,854 | - | - | - | 1,896,854 |
| Senior Notes 2025 | - | - | - | 3,340,316 | - | - | 3,340,316 |
| Senior Notes 2026 | - | - | - | - | 953,802 | - | 953,802 |
| Perpetual Bonds | - | - | - | - | - | 799,777 | 799,777 |
| Total | - | - | 1,896,854 | 3,340,316 | 953,802 | 799,777 | 6,990,749 |
| Consolidated | |||||||
| In R$: | |||||||
| Working Capital | 7,543 | 4,752 | 2,500 | 2,480 | - | - | 17,275 |
| Debentures VII | 146,170 | - | - | - | - | - | 146,170 |
| In US$: | |||||||
| Financing with Ex-lm Bank Collateral | 49,958 | - | - | - | - | - | 49,958 |
| ESN | - | - | 1,896,854 | - | - | - | 1,896,854 |
| Spare Engine Facility | 23,075 | 23,075 | 150,859 | - | - | - | 197,009 |
| Senior Notes 2025 | - | - | - | 3,340,316 | - | - | 3,340,316 |
| Senior Notes 2026 | - | - | - | - | 953,802 | - | 953,802 |
| Loan Facility | 30,936 | 31,961 | 33,039 | 34,197 | 103,002 | - | 233,135 |
| Perpetual Bonds | - | - | - | - | - | 789,168 | 789,168 |
| Total | 257,682 | 59,788 | 2,083,252 | 3,376,993 | 1,056,804 | 789,168 | 7,623,687 |
The fair value of debt as of December 31, 2020, is as follows:
| Parent Company | Consolidated | |||
| Accounting (*) | Fair Value | Accounting (*) | Fair Value | |
| Debentures | - | - | 587,088 | 591,666 |
| Guaranteed Funding | 484,113 | 484,113 | 484,113 | 484,113 |
| ESN | 1,934,814 | 1,948,441 | 1,934,814 | 1,948,441 |
| Perpetual Notes and Other Senior Notes | 5,210,786 | 4,908,995 | 5,200,177 | 4,903,902 |
| Other Existing Loans | - | - | 1,770,774 | 1,770,774 |
| Total | 7,629,713 | 7,341,549 | 9,976,966 | 9,698,896 |
(*) Net Total of Funding Costs.
| 17.3. | Covenants |
The Company has covenants in Guaranteed financing and in Debentures VII.
Within the scope of guaranteed financing, the Company has the observance of complying with specific guarantee conditions in the bilateral contract with Delta Airlines. On December 31, 2020, the Company had Smiles shares and other assets placed in guarantee by GLAI regarding this agreement, which meet the covenants.
In Debentures VII, the obligation to measure such indicators is semiannual, being that:
On March 31, 2020, the Debenture Holders’ Meeting was held, where it was decided to suspend the effects of automatic early maturity, given the failure to pay the unit face value of the debentures referring to the installment due on March 28, 2020. At that Meeting, it was decided to extend the debentures’ principal amortization liabilities by 10 days.
| 69 |
| | Notes to the Financial Statements Fiscal Year ended December 31, 2020 (In thousands of Brazilian Reais - R$, except when otherwise indicated) |
On April 9, 2020, the Debenture Holders’ Meeting decided to postpone the scheduled payments of the debentures totaling R$148 million, originally scheduled to occur on March 28, 2020 and thus postponed to March 28, 2022. On this date, the meeting also granted a waiver regarding the non-compliance with the financial rates and limits set for the fiscal year of 2020, which would be measured on June 30 and December 31, 2020. The current waiver will remain in force in the fiscal year of 2021.
On September 25, 2020, the Debenture Holders’ Meeting decided to postpone the scheduled payments of debentures totaling R$148 million, originally scheduled to occur on September 28, 2020 and thus postponed to March 28, 2021.
| 70 |
| | Notes to the Financial Statements Fiscal Year ended December 31, 2020 (In thousands of Brazilian Reais - R$, except when otherwise indicated) |
| 18. | Leases to Pay |
On December 31, 2020, the balance of leases payable includes: (i) R$16,252 relating to variable payments, not included in the measurement of liabilities, and short-term leases, which fall under the exemption provided for in CPC 06 (R2) - Leases, equivalent to IFRS 16; and (ii) R$7,567,940 referring to the present value on this date of future lease payments. On December 31, 2019, all liabilities related to the present value of future lease payments.
The breakdown and changes in the present value of future lease payments are shown below:
| 2019 | 2020 | ||||||||||||||
| Weighted Average Rate (p.a.) | Current | Noncurrent | Total | Additions | Write-Off | Contractual amendment | Payments | Deposit in Guarantee | Interest Incurred | Payment of Interest | Exchange Rate Change | Current | Noncurrent | Total | |
| In R$: | |||||||||||||||
| Leases without Purchase Option | 13.11% | 21,781 | 23,026 | 44,807 | 5,189 | - | 399 | (15,044) | - | 12,164 | - | - | 32,530 | 14,985 | 47,515 |
| Total | 21,781 | 23,026 | 44,807 | 5,189 | - | 399 | (15,044) | - | 12,164 | - | - | 32,530 | 14,985 | 47,515 | |
| In US$: | |||||||||||||||
| Leases with Purchase Option | 3.72% | 128,936 | 419,894 | 548,830 | - | (618,486) | - | (26,049) | - | 4,592 | (4,530) | 95,643 | - | - | - |
| Leases without Purchase Option | 12.03% | 1,253,995 | 4,205,148 | 5,459,143 | 449,059 | (85,678) | 220,849 | (1,017,599) | (44,736) | 801,773 | - | 1,737,614 | 1,268,226 | 6,252,199 | 7,520,425 |
| Total | 1,382,931 | 4,625,042 | 6,007,973 | 449,059 | (704,164) | 220,849 | (1,043,648) | (44,736) | 806,365 | (4,530) | 1,833,257 | 1,268,226 | 6,252,199 | 7,520,425 | |
| Total Leases | 1,404,712 | 4,648,068 | 6,052,780 | 454,248 | (704,164) | 221,248 | (1,058,692) | (44,736) | 818,529 | (4,530) | 1,833,257 | 1,300,756 | 6,267,184 | 7,567,940 | |
In the Fiscal Year ended December 31, 2020, the Company directly recognized in the cost from services, totaling R$33,721 related to short-term leases and variable payments, on a straight-line basis.
| 71 |
| | Notes to the Financial Statements Fiscal Year ended December 31, 2020 (In thousands of Brazilian Reais - R$, except when otherwise indicated) |
The future payments of lease agreements are detailed as follows:
| Without Purchase Option | With Purchase Option | ||
| 2020 | 2019 | 2019 | |
| 2020 | - | 1,691,357 | 148,613 |
| 2021 | 2,102,771 | 1,324,403 | 148,744 |
| 2022 | 1,982,685 | 1,125,060 | 207,654 |
| 2023 | 1,642,264 | 904,627 | 72,801 |
| 2024 | 1,260,405 | 651,245 | 11,279 |
| Thereafter | 3,720,405 | 1,287,742 | 5,551 |
| Total Minimum Lease Payments | 10,708,530 | 6,984,434 | 594,642 |
| Less Total Interest | (3,124,338) | (1,480,484) | (45,812) |
| Present Value of Minimum Lease Payments | 7,584,192 | 5,503,950 | 548,830 |
| Less Current Portion | (1,317,008) | (1,275,776) | (128,936) |
| Noncurrent Portion | 6,267,184 | 4,228,174 | 419,894 |
During the fiscal year on December 31, 2020, the Company concluded part of the renegotiations of its aircraft and operating engine lease agreements, with no purchase option, which led to contractual changes regarding the postponement of due dates and monthly payments compared to the original terms of the lease agreements. For agreements renegotiated that had their payments postponed until June 2021, the Company chose not to evaluate such changes as modifications to the lease agreements, as foreseen in the amendment to “Technical Pronouncement CPC 06 (R2) – Lease due to Benefit Granted in Lease Agreement Related to Covid-19 for tenants.” For other contracts, the Company recorded the update of these renegotiations, remeasuring the lease liability since the deferral of the installments will occur based on new payment flows, discount rate and exchange rate on the date of the contractual amendment, as provided for in the current regulations. The accumulated effects calculated and updated in the fiscal year of December 31, 2020 were disclosed in note 1.1.5.
| 18.1. | Sale-Leaseback Transactions |
During the fiscal year ended on December 31, 2020, the Company recorded a net gain of R$372, 312 in the parent company results and R$551,942 in the consolidated results from the sale-leaseback transactions of 11 aircraft (R$7,413 and R$7,924 in the parent company and consolidated results respectively, from the sale-leaseback of 1 aircraft during the fiscal year ended on December 31, 2019) recognized recorded in the income statement under “Sale-leaseback transactions” in the group of other operating revenues and expenses, net, see Note 30.
| 19. | Suppliers |
| Parent Company | Consolidated | |||
| 2020 | 2019 | 2020 | 2019 | |
| Domestic Currency | 48,345 | 15,952 | 1,164,193 | 833,781 |
| Foreign Currency | 24,357 | 3,164 | 481,001 | 462,636 |
| Total | 72,702 | 19,116 | 1,645,194 | 1,296,417 |
| Current | 72,702 | 19,116 | 1,612,536 | 1,286,275 |
| Noncurrent | - | - | 32,658 | 10,142 |
| 72 |
| | Notes to the Financial Statements Fiscal Year ended December 31, 2020 (In thousands of Brazilian Reais - R$, except when otherwise indicated) |
| 20. | Suppliers - Forfaiting |
The Company has contracts that allow suppliers to receive their rights in advance from a financial institution and that have been converted into working capital transactions described in note 17. On December 31, 2020, there is no outstanding amount arising from the forfaiting transactions (R$554,467 on December 31, 2019).
| 21. | Taxes to Collect |
| Parent Company | Consolidated | |||
| 2020 | 2019 | 2020 | 2019 | |
| PIS and COFINS | 216 | 2,278 | 23,647 | 39,133 |
| Installments (*) | - | - | 41,641 | 2,117 |
| Income Tax on Salaries | 43 | 32 | 33,011 | 54,649 |
| ICMS | - | - | 472 | 424 |
| Income Tax and Social Contribution to Collect | - | 1,951 | 13 | 9,496 |
| Others | 33 | - | 7,192 | 10,788 |
| Total | 292 | 4,261 | 105,976 | 116,607 |
| Current | 292 | 4,261 | 73,614 | 116,523 |
| Noncurrent | - | - | 32,362 | 84 |
(*) In the fiscal year ended December 31, 2020, the Company paid PIS and COFINS contributions in the ordinary amount totaling R$43,945, for a period of 60 months, having already paid the total of R$4,443 in the same fiscal year.
| 22. | Advance Ticket Sales |
On December 31, 2020, the balance of Advance from ticket sales classified in current liabilities was R$2,050,799 (R$1,966,148 on December 31, 2019) and is represented by 6,691,911 tickets sold and not yet used (6,239,179 on December 31, 2019) with an average use of 102 days (59 days on December 31, 2019).
Balances of advance from ticket sales are shown net of breakage corresponding to R$299,188 on December 31, 2020 (R$415,688 on December 31, 2019).
On December 31, 2020, the Company has reimbursements to pay related to non-performed transports amounting to R$253,963, recorded as Other Current Liabilities.
| 23. | Frequent-Flyer Program |
| Consolidated | ||
| 2020 | 2019 | |
| Frequent-Flyer Program | 2,145,097 | 1,755,985 |
| Others | 5,817 | 1,764 |
| Breakage | (569,952) | (577,075) |
| Total | 1,580,962 | 1,180,674 |
| Current | 1,258,502 | 1,009,023 |
| Noncurrent | 322,460 | 171,651 |
Breakage consists of estimating miles that have a high potential to expire due to their expected non-use. CPC 47, equivalent to IFRS 15, provides for the recognition of revenue by the estimate (breakage) over the contractual period, therefore, before the redemption of miles, given that this is not expected before expiration.
| 73 |
| | Notes to the Financial Statements Fiscal Year ended December 31, 2020 (In thousands of Brazilian Reais - R$, except when otherwise indicated) |
| 24. | Provisions |
| Consolidated | ||||
| Provision for Post-Employment Benefits | Provisions for Aircraft and Engine Return | Legal Proceedings (a) | Total | |
| Balances on December 31, 2019 | 96,760 | 869,078 | 291,218 | 1,257,056 |
| Recognition (Reversal) of Provision | 10,136 | (58,702) | 288,803 | 240,237 |
| Provisions Used | - | (113,805) | (187,491) | (301,296) |
| Changing of Assumptions | (24,541) | - | - | (24,541) |
| Plan Experience | 10,706 | - | - | 10,706 |
| Present Value Adjustment | 6,488 | 67,609 | - | 74,097 |
| Exchange Rate Change | - | 266,735 | (98) | 266,637 |
| Balances on December 31, 2020 | 99,549 | 1,030,915 | 392,432 | 1,522,896 |
| On December 31, 2020 | ||||
| Current | - | 169,381 | - | 169,381 |
| Noncurrent | 99,549 | 861,534 | 392,432 | 1,353,515 |
| Total | 99,549 | 1,030,915 | 392,432 | 1,522,896 |
| On December 31, 2019 | ||||
| Current | - | 203,816 | - | 203,816 |
| Noncurrent | 96,760 | 665,262 | 291,218 | 1,053,240 |
| Total | 96,760 | 869,078 | 291,218 | 1,257,056 |
| (a) | The provisions used consider write-offs due to the revaluation of estimates and settled processes. |
| 24.1. | Provision for Post-Employment Benefits |
The Company offers to its employees health care plans that, due to complying with current laws, generate obligations with post-employment benefits.
Due to the significant increase in the indicative rates for federal government bonds linked to inflation (NTN-B), with long maturities used, as determined by the applicable accounting standards, to define the discount rate used to calculate post-employment liabilities, generated a reduction in the obligation.
This significant change in the economic circumstance led to update the discount rate hypothesis and, consequently, the obligation and related accounting expense for the remainder of the fiscal year 2020. The amounts referring to the change in the discount rate and loss of experience of the plan were recorded in other comprehensive income (expenses).
The securities used to determine the discount rate assumption were those traded on June 22, 2020. In addition to the discount rate, the long-term inflation assumption was also updated consistent with the Central Bank inflation report. No updates were necessary for the other assumptions used in the calculation.
| 74 |
| | Notes to the Financial Statements Fiscal Year ended December 31, 2020 (In thousands of Brazilian Reais - R$, except when otherwise indicated) |
The actuarial assumptions applied when measuring the post-employment benefit are presented below:
| Consolidated | |||
| Actuarial Assumptions | 2020 | 2019 | |
| Weighted Average of Assumptions to Determine the Defined Benefit Obligation | |||
| Nominal Discount Rate p.a. | 7.88% | 7.23% | |
| Actual Discount Rate p.a. | 4.23% | 3.60% | |
| Long-Term Estimated Inflation Rate p.a. | 3.00% | 3.50% | |
| HCCTR - Nominal Medical Inflation Rate p.a. | 6.35% | 6.86% | |
| HCCTR - Actual Medical Inflation Rate p.a. | 3.25% | 3.25% | |
| Mortality Table | AT-2000 loosened by 10% | AT-2000 loosened by 10% | |
| Weighted Average of Assumptions to Determine the Cost (revenue) of the Defined Benefit | |||
| Nominal Discount Rate | 7.23% | 9.93% | |
| Actual Discount Rate p.a. | 4.23% | 5.70% | |
| Long-Term Estimated Inflation Rate | 3.50% | 4.00% | |
| HCCTR - Nominal Medical Inflation Rate p.a. | 6.86% | 7.38% | |
| HCCTR - Actual Medical Inflation Rate p.a. | 3.25% | 3.25% | |
| Mortality Table | AT-2000 loosened by 10% | AT-2000 loosened by 10% | |
| Consolidated | |||
| 2020 | |||
| Current Service Cost Recognized in Income (Expenses) | 10,136 | ||
| Cost of Interests Recognized in Income (Expenses) | 6,488 | ||
| Total | 16,624 | ||
| 24.2. | Provisions for Aircraft and Engine Return |
Such provision considers the costs that meet the contractual conditions for the return of engines maintained under operating leases, as well as the costs to reconfigure aircraft when returned as described in the return conditions of the lease agreements. The initial recognition is capitalized against property, plant & equipment, under the item "Aircraft and Engine Improvements".
| 24.3. | Provision for Legal Proceedings |
The Company and its subsidiaries are involved in certain legal matters arising from the regular course of their business, which include civil, administrative, tax, social security, and labor lawsuits.
The Company classifies the risk of loss in legal proceedings as probable, possible, or remote. The provision recorded in relation to such lawsuits is set by the Company's Management, based on the analysis of its legal counsel, and reasonably reflects the estimated probable losses.
If the Company has lawsuits whose values are not known or reasonably estimated, but the likelihood of loss is probable, these will not be recorded, but their nature will be disclosed.
The Company's Management believes that the provision for tax, civil and labor risks, recorded in accordance with CPC 25 – “Provisions, Contingent Liabilities and Contingent Assets”, equivalent to IAS 37, is sufficient to cover possible losses on administrative and judicial proceedings, as shown below:
| 75 |
| | Notes to the Financial Statements Fiscal Year ended December 31, 2020 (In thousands of Brazilian Reais - R$, except when otherwise indicated) |
| Consolidated | ||||
| Probable Loss | Possible Loss | |||
| 2020 | 2019 | 2020 | 2019 | |
| Civil | 100,806 | 78,119 | 64,181 | 62,473 |
| Labor | 269,297 | 210,699 | 238,702 | 237,253 |
| Tax | 22,329 | 2,400 | 574,356 | 586,812 |
| Total | 392,432 | 291,218 | 877,239 | 886,538 |
Provisions are reviewed based on the evolution of lawsuits and the history of losses through the best current estimate for civil and labor claims.
The civil lawsuits are primarily related to compensation claims generally related to flight delays and cancellations, baggage loss and damage. The labor claims mainly consist of matters related to overtime, hazard pay, risk premium and wage differences.
The tax lawsuits presented below were assessed by Management and legal counsel as relevant and with possible risk on December 31, 2020:
| · | GLA is discussing the non-incidence of the additional 1% COFINS rate on the imports of aircraft and parts, amounting R$94,790 (R$82,301 as of December 31, 2019). The classification as a possible risk arises from the fact that there was no express revocation of the tax relief (zero rate) granted to regular air transportation companies. |
| · | Tax on Services of Any Nature (ISS), amounting to R$25,655 (R$24,809 as of December 31, 2019) arising from Tax Notices issued by the City of São Paulo against the Company, from January 2007 to December 2010, referring to a possible incidence of ISS on agreements signed with partners. The classification as possible risk arises from the fact that the matters under discussion are interpretative and involve discussions on factual and probative matters. In addition, there is no final positioning of the Superior Courts. |
| · | Customs fine totaling R$66,091 (R$64,923 on December 31, 2019) related to the Infraction Notices drawn up against the Company for an alleged non-compliance with customs rules related to temporary aircraft importation processes. The classification as possible risk arises from the fact that there is no final position of the Superior Courts on the matter. |
| · | Goodwill BSSF Air Holdings (“BSSF”), in the amount of R$65,611 (R$110,741 on December 31, 2019) arising from the Infraction Notice filed due to the deductibility of goodwill allocated as future profitability. The classification of possible risk results from the fact that there is no final positioning from the Superior Courts. |
| · | Goodwill GLA (arising from the acquisition of the former VRG) totaling R$88,631 (R$86,998 on December 31, 2019) arising from the Infraction Notice filed due to the deductibility of goodwill allocated as future profitability. The classification of possible risk results from the fact that there is no final positioning from the Superior Courts. |
| · | In May 2018, the subsidiary Smiles received a Infraction Notice related to 2014 and 2015, drawn up due to: (i) the deductibility of the goodwill allocated as future profitability after the process of merging GA Smiles into Smiles S.A. on December 31, 2013 and (ii) the deductibility of the financial expenses of the debentures issued in June 2014. The amount of R$126,410 on December 31, 2020 (R$123,495 as of December 31, 2019) was assessed by the Management and legal counsel as a possible risk accepted by the tax authorities, as there are defense arguments in administrative appeal. |
| 76 |
| | Notes to the Financial Statements Fiscal Year ended December 31, 2020 (In thousands of Brazilian Reais - R$, except when otherwise indicated) |
There are other tax lawsuits assessed by Management and legal counsel as a possible risk, totaling R$108,515 (R$93,545 on December 31, 2019) which, added to the above lawsuits, total R$574,356 on December 31, 2020 (R$586,812 on December 31, 2019).
| 25. | Shareholders’ Equity |
| 25.1. | Share Capital |
As of December 31, 2020, the Company’s capital stock was R$3,009,436 and represented by 3,137,706,967 shares, comprised by 2,863,682,710 common shares and 274,024,257 preferred shares. The share capital presented is reduced by the costs to issue shares totaling R$155,618 on December 31, 2020 and 2019.
The Company’s shares are held as follows:
| 2020 | 2019 | |||||
| Common Shares | Preferred Shares | Total | Common Shares | Preferred Shares | Total | |
| Fundo Volluto | 100.00% | - | 22.99% | 100.00% | - | 23.00% |
| Mobi FIA | - | 37.57% | 28.93% | - | 37.59% | 28.94% |
| AirFrance - KLM | - | 1.55% | 1.19% | - | 1.55% | 1.19% |
| Others | - | 1.91% | 1.47% | - | 2.23% | 1.73% |
| Market | - | 58.97% | 45.41% | - | 58.63% | 45.14% |
| Total | 100.00% | 100.00% | 100.00% | 100.00% | 100.00% | 100.00% |
The authorized share capital on December 31, 2020 is R$6 billion. Within the authorized limit, the Company can, once approved by the Board of Directors, increase its capital regardless of any amendment to its by-laws, by issuing shares, without necessarily maintaining the proportion between the different types of shares. Under the law terms, in case of capital increase within the authorized limit, the Board of Directors will define the issuance conditions, including pricing and payment terms.
| 25.2. | Treasury Shares |
On December 31, 2020, the Company had 1,824,034 treasury shares, totaling R$62,215 (3,006,390 shares totaling R$102,543 on December 31, 2019). On December 31, 2020, the closing market price for treasury shares was R$24.94 (R$36.80 on December 31, 2019).
| 26. | Earnings (Loss) per Share |
Although there are differences between common and preferred shares in terms of voting rights and preference in case of liquidation, the Company’s preferred shares do not grant the right to receive fixed dividends. Preferred shares have the economic power and the right to receive dividends 35 times greater than common shares. Accordingly, the Company considers that the economic power of preferred shares is greater than that of common shares. Therefore, the income (expenses) for the fiscal year attributed to the controlling shareholders is allocated proportionally in relation to the total economic participation of the amount of common and preferred shares.
Basic earnings per share are calculated by dividing the net income for the fiscal year attributed to the Company’s controlling shareholders by the weighted average number of all classes of shares outstanding during the year.
| 77 |
| | Notes to the Financial Statements Fiscal Year ended December 31, 2020 (In thousands of Brazilian Reais - R$, except when otherwise indicated) |
Diluted earnings (loss) per share are calculated by adjusting the weighted average number of shares outstanding by instruments potentially convertible into shares. On December 31, 2019 and on December 31, 2020, the Company has only one category of potentially dilutive shares (stock option), as described in note 27. Due to the losses ascertained in the fiscal years ended on December 31, 2020 and December 31, 2019, these instruments issued by the parent company have no dilutive effect and therefore were not included in the total quantity of outstanding shares to calculate diluted losses per share.
The Company's earnings (loss) per share was determined as follows:
| Parent Company and Consolidated | ||||||
| 2020 | 2019 | |||||
| Common Shares | Preferred Shares | Total | Common Shares | Preferred Shares | Total | |
| Numerator | ||||||
| Net Loss for the Fiscal Year Attributed to Controlling Shareholders | (1,377,078) | (4,611,050) | (5,988,128) | (27,269) | (90,004) | (117,273) |
| Denominator | ||||||
| Weighted average number of outstanding shares (in thousands) | 2,863,683 | 273,967 | 2,863,683 | 270,053 | ||
| Adjusted Weighted Average Number of Shares Outstanding and Conversions Presumed as Diluted (in thousands) | 2,863,683 | 273,967 | 2,863,683 | 270,053 | ||
| Basic Loss per Share | (0.481) | (16.831) | (0.010) | (0.333) | ||
| Diluted Loss per Share | (0.481) | (16.831) | (0.010) | (0.333) | ||
| 27. | Share-Based Compensation |
The Company has two additional compensation plans for the members of its Management: the Stock Option Plan (“Stock Option Plan”) and the Restricted Stock Plan, both with the purpose to stimulate and promote the alignment of the purposes of the Company, the members of the Management and the employees, and mitigate the risks generating value for the Company due to the loss of its executives, strengthening their commitment and productivity in long-term income (expenses).
| 27.1. | Stock Options Plan - GOL |
The beneficiaries of the Company’s stock option plan are allowed to purchase shares at the price agreed on the grant date after three or four years from the grant date, provided that they maintain their employment relationship up to the end of this period.
The stock options vesting in three years become vested at 20% as from the first year, an additional 30% as from the second year, and the remaining 50% as from the third year. For stock option plans exercisable in 4 years, beneficiaries may exercise 20% in the first year, 20% in the second year, 30% in the third year and 30% in the fourth year.
All stock options may also be exercised within 10 years after the grant date. For stock options granted, the expected volatility of the options is based on the historical volatility of 252 working days of the Company’s shares traded on the B3.
| 78 |
| | Notes to the Financial Statements Fiscal Year ended December 31, 2020 (In thousands of Brazilian Reais - R$, except when otherwise indicated) |
| Option Year | Approval Date | Total Options Granted | Number of Options Outstanding | Exercise Price of the Option (in Reais) | Fair Value on the Grant Date (in Reais) | Estimated Volatility of the Share Price | Expected Dividend | Risk-Free Return Rate | Average Remaining Maturity (in years) |
| 2012 | October 19, 2012 | 778,912 | 227,183 | 12.81 | 5.32 (a) | 52.25% | 2.26% | 9.00% | 1.7 |
| 2013 | May 13, 2013 | 802,296 | 220,413 | 12.76 | 6.54 (b) | 46.91% | 2.00% | 7.50% | 2.3 |
| 2014 | August 12, 2014 | 653,130 | 197,661 | 11.31 | 7.98 (c) | 52.66% | 3.27% | 11.00% | 3.5 |
| 2015 | August 11, 2015 | 1,930,844 | 601,793 | 9.35 | 3.37 (d) | 55.57% | 5.06% | 13.25% | 4.5 |
| 2016 | June 30, 2016 | 5,742,732 | 3,121,220 | 2.62 | 1.24 (e) | 98.20% | 6.59% | 14.25% | 5.4 |
| 2017 | August 8, 2017 | 947,767 | 548,604 | 8.44 | 7.91 (f) | 80.62% | 1.17% | 11.25% | 6.6 |
| 2018 | May 24, 2018 | 718,764 | 450,695 | 20.18 | 12.68 (g) | 55.58% | 0.60% | 6.50% | 7.4 |
| 2019 | December 11, 2019 | 1,749,223 | 1,506,606 | 25.40 | 12.10 (h) | 61.98% | 3.17% | 9.00% | 8.8 |
| 2020 | July 30, 2020 | 760,986 | 655,437 | 20.57 | 14.44(i) | 71.37% | 0.92% | 6.24% | 9.6 |
| Total | December 31, 2020 | 14,084,654 | 7.529.612 | 11.59 |
| (a) | The fair value is calculated by the average value from R$6.04, R$5.35 and R$4.56 for the respective vesting periods (2012, 2013 and 2014). |
| (b) | The fair value is calculated by the average value from R$7.34, R$6.58 and R$5.71 for the respective vesting periods (2013, 2014 and 2015). |
| (c) | The fair value is calculated by the average value from R$8.20, R$7.89 and R$7.85 for the respective vesting periods (2014, 2015 and 2016). |
| (d) | The fair value is calculated by the average value from R$3.61, R$3.30 and R$3.19 for the respective vesting periods (2015, 2016 and 2017). |
| (e) | On July 27, 2016, an additional grant of 900,000 shares referring to the 2016 plan was approved. The fair value was calculated by the average value from R$1.29, R$1.21 and R$1.22 for the respective vesting periods (2017, 2018 and 2019). |
| (f) | The fair value is calculated by the average value from R$8.12, R$7.88 and R$7.72 for the respective vesting periods (2017, 2018 and 2019). |
| (g) | The fair value is calculated by the average value from R$13.26, R$12.67 and R$12.11 for the respective vesting periods (2018, 2019 and 2020). |
| (h) | The fair value is calculated by the average value from R$12.90, R$12.32 and R$11.65 for the respective vesting periods (2019, 2020 and 2021). |
| (i) | The fair value is calculated by the average value from R$15.39, R$14.89, R$14.31 and R$13.64 for the respective vesting periods (2020, 2021, 2022 and 2023). |
The price of the Company's share traded on B3 on December 31, 2020 was R$24.94 (R$36.80 on December 31, 2019).
The movement in the stock options outstanding for the fiscal year ended December 31, 2020 is as follows:
Number of Stock Options | Weighted Average Price of the Period | |
| Outstanding Shares on December 31, 2019 | 7,660,855 | 7.11 |
| Options Granted (*) | 655,437 | 20.57 |
| Options Exercised | (452,899) | 4.09 |
| Options Canceled and Adjustments in Estimated Prescribed Rights | (333.781) | 22,06 |
| Outstanding Shares on December 31, 2020 | 7.529.612 | 11,59 |
| Number of Options Exercisable on: | ||
| December 31, 2019 | 5,939,631 | 8.42 |
| December 31, 2020 | 5.752.726 | 10.32 |
(*) Plan granted on July 30, 2020.
The expense recognized in income (expenses) for the fiscal year corresponding to the stock option plans for the fiscal year ended December 31, 2020 was R$12,063 (R$40,735 for the fiscal year ended December 31, 2019).
| 27.2. | Restricted Share Plan – GOL |
The Company’s restricted share plan was approved at the Extraordinary Shareholders’ Meeting of October 19, 2012, and the first grants were approved at the Board of Directors’ Meeting of November 13, 2012.
| Share Year | Approval Date | Total Shares Granted | Total Vested Shares | Average Fair Value on the Grant Date |
| 2016 | June 30, 2016 | 4,007,081 | - | 2.62 |
| 2017 | August 8, 2017 | 1,538,213 | - | 8.44 |
| 2018 | May 24, 2018 | 773,463 | 513,314 | 20.18 |
| 2020 | July 30, 2020 | 801,311 | 690,169 | 20.57 |
| Total | December 31, 2020 | 7,120,068 | 1,203,483 |
| 79 |
| | Notes to the Financial Statements Fiscal Year ended December 31, 2020 (In thousands of Brazilian Reais - R$, except when otherwise indicated) |
The movement in the restricted shares for the fiscal year ended December 31, 2020 is as follows:
| Total Restricted Shares | |
| Restricted Shares Outstanding on December 31, 2019 | 1,533,996 |
| Restricted Shares Granted | 801,311 |
| Shares Transferred (*) | (1,182,356) |
| Restricted Shares Cancelled and Adjustments in Estimated Expired Rights | 50,532 |
| Restricted Shares Outstanding on December 31, 2020 | 1,203,483 |
(*) During the fiscal year ended on December 31, 2020, the Company transferred 1,182,356 shares via equity instruments (treasury shares).
The expense recognized in income (expenses) for the fiscal year corresponding to the stock option plans for the fiscal year ended December 31, 2020 was R$8,976 (R$5,315 for the fiscal year ended December 31, 2019).
| 27.3. | Stock Option Plan – Smiles Fidelidade |
The beneficiaries of the Company’s stock option plan are allowed to purchase shares at the price agreed on the grant date after three years from the grant date, provided that they maintain their employment relationship up to the end of this period.
The stock options vest 20% as from the first year, an additional 30% as from the second year, and the remaining 50% as from the third year. All stock options may also be exercised within 10 years after the grant date. For stock options granted, the expected volatility of the options is based on the historical volatility of 252 working days of the Company’s shares traded on the B3.
Option Year | Approval Date | Total Options Granted | Number of Options Outstanding | Exercise Price of the Option (in Reais) | Average Fair Value on the Grant Date | Estimated Volatility of the Option Price | Expected Dividend | Risk-Free Return Rate | Average Remaining Maturity (in years) |
| 2013 | August 8, 2013 | 1,058,043 | - | 21.7 | 4.25(a) | 36.35% | 6.96% | 7.40% | 3.5 |
| 2014 | February 4, 2014 | 1,150,000 | - | 31.28 | 4.90(b) | 33.25% | 10.67% | 9.90% | 4.0 |
| 2018 | July 31, 2018 | 1,300,000 | 975,000 | 48.42 | 8.93(c) | 41.28% | 9.90% | 6.39% | 8.6 |
| Total | December 31, 2020 | 3,508,043 | 975,000 | 48.42 |
(a) Average fair value in Brazilian Reais calculated for the 2013 Stock Options was R$4.84 and R$4.20 for the vesting periods in 2013 and 2014, and R$3.73 for the vesting periods in 2015 and 2016.
(b) Average fair value In Brazilian Reais calculated for the 2014 Stock Options was R$4.35, R$4.63, R$4.90, R$5.15 and R$5.37 for the respective vesting periods from 2014 to 2018.
(c) Average fair value In Brazilian Reais calculated for the 2018 Stock Options was R$8.17, R$8.63, R$9.14 and R$9.77 for the respective vesting periods of 2019, 2020, 2021 and 2022.
The share price of the subsidiary Smiles traded at B3 on December 31, 2020 was R$23.45 (R$39.27 on December 31, 2019).
The trend in the stock options outstanding for the fiscal year ended December 31, 2020.
During the fiscal year ended on December 31, 2020, the Company recognized R$2,390 in shareholders’ equity regarding the share-based compensation with a corresponding outflow in the income statement as personnel expenses (R$3,131 for the fiscal year ended on December 31, 2019).
Additionally, referenced in the Company’s shares, executives and employees are granted a complementary cash-settled bonus, as a way of strengthening their commitment and productivity with the incomes (expenses). On December 31, 2020, the balance of this obligation totaled R$1,881 (R$6,079 on December 31, 2019) recorded under “Salaries”, referenced to 119,784 equivalent Company’s shares. The same amount was recorded under “Personnel” in the statement of operations (R$120,586 during the period ended on December 31, 2019) related to these bonuses.
| 80 |
| | Notes to the Financial Statements Fiscal Year ended December 31, 2020 (In thousands of Brazilian Reais - R$, except when otherwise indicated) |
| 28. | Transactions with Related Parties |
| 28.1. | Loan Agreements - Noncurrent Assets and Liabilities |
The parent company maintains assets and liabilities from loan agreements with its subsidiary GLA without interest, as shown in the table below:
| Assets | Liabilities | ||||||
| Creditor | Debtor | Type of Transaction | Interest Rate (p.a.) | 2020 | 2019 | 2020 | 2019 |
| GOL | GLA | Loan | 3.42% | 915,226 | 507,408 | - | 2,121 |
| GAC | GLA | Loan | (*) | 1,347,546 | 1,018,369 | 8,791 | 161,229 |
| Gol Finance | GLA | Loan | 4.59% | 2,634,559 | 1,914,924 | - | - |
| Total | 4,897,331 | 3,440,701 | 8,791 | 163,350 | |||
(*) According to the local legislation, the Company applies symbolic interest rates.
Additionally, on December 31, 2020, the Company has a balance of dividends and interest on shareholders’ equity receivable, which will be realized in January 2021, decided by the subsidiary Smiles Fidelidade, in the amount of R$24,120 (R$69,548 on December 31, 2019).
In addition to the values above, the following table shows the other balances between the Companies eliminated in the Consolidated:
| Balances | ||||||
| Creditor | Debtor | Type of Transaction | Maturity of the Agreements | Interest Rate (p.a.) | 2020 | 2019 |
| Gol Finance | GOL | Subscription Bonus(*) | 07/2024 | - | 602,350 | 602,350 |
| Gol Finance Inc. | GAC | Loan | 01/2023 | 8.64% | 1,149,501 | 1,267,594 |
| Gol Finance | GAC | Loan | 03/2025 | 4.19% | 1,157,009 | 1,061,747 |
| Gol Finance | Gol Finance Inc. | Loan | 04/2023 | 1.88% | 305,702 | 945,721 |
| Gol Finance Inc. | Gol Finance | Loan | 07/2020 | 11.70% | 1,805 | 196,298 |
| Smiles Fidelidade | GLA | Advance ticket purchases | 12/2032 | 3.40% | 2,011,291 | 970,899 |
| Smiles Fidelidade | GLA | Sale of Miles | 12/2032 | - | 9,627 | 32,271 |
| Smiles Fidelidade | GLA | Management Fees | 12/2032 | - | 308 | 1,300 |
| Smiles Fidelidade | GLA | Letter of Indemnity Agreement | - | - | 530 | 1,414 |
| GLA | Smiles Fidelidade | Shared Services | 12/2032 | - | 6,363 | 6,283 |
| GLA | Smiles Fidelidade | Onlending | 12/2032 | - | 15,683 | 23,540 |
| Smiles Fidelidade | Smiles Viagens | Dividends | - | - | 267 | 267 |
| Smiles Viagens | Smiles Fidelidade | Onlendings | - | - | 414 | 1,867 |
| Smiles Argentina | Smiles Fidelidade | Onlendings | - | - | 5,152 | 3,631 |
| Total | 5,266,002 | 5,115,182 | ||||
(*) The subsidiary Gol Finance, through Gol Equity Finance, acquired warrants issued by the Company in the context of the issue of Exchangeable Senior Notes.
| 28.2. | Transportation and Consulting Services |
In the course of its operations, the Company, by itself and through its subsidiaries, entered into agreements with the companies listed below, part of the same economic group as the Company:
| · | Expresso Caxiense S.A.: Provision of passenger transportation services in case of an interrupted flight, effective until March 9, 2023; and |
| 81 |
| | Notes to the Financial Statements Fiscal Year ended December 31, 2020 (In thousands of Brazilian Reais - R$, except when otherwise indicated) |
| · | Viação Piracicabana Ltda.: Provision of passenger, baggage, crew, and employee transportation services between airports, effective until September 30, 2021. |
On December 31, 2020, GLA recognized total expenses related to these services of R$5,779 (R$10,560 as of December 31, 2019). On the same date, the balance payable to related companies, under “suppliers”, was of R$3,344 (R$1,822 on December 31, 2019), and refers mainly to transportation services with Viação Piracicabana Ltda.
| 28.3. | Contracts Account Opening UATP (“Universal Air Transportation Plan”) to Grant Credit Limit |
The subsidiary GLA entered into UATP account opening agreements with the related parties indicated below: Aller Participações S.A.; BR Mobilidade Baixada Santista S.A. SPE; Breda Transportes e Serviços S.A.; Comporte Participações S.A.; Empresa Cruz de Transportes Ltda.; Empresa de Ônibus Pássaro Marrom S.A.; Empresa Princesa do Norte S.A.; Expresso Itamarati S.A.; Expresso Maringá do Vale S.A.; Expresso União Ltda.; Glarus Serviços Tecnologia e Participações S.A.; Limmat Participações S.A.; Quality Bus Comércio de Veículos S.A.; Super Quadra Empreendimentos Imobiliários S.A.; Thurgau Participações S.A.; Transporte Coletivo Cidade Canção Ltda.; Turb Transporte Urbano S.A.; Vaud Participações S.A.; and Viação Piracicabana Ltda.; all with no expiration date, whose purpose is to issue credits to purchase airline tickets issued by the Company. The UATP account (virtual card) is accepted as a payment means on the purchase of airline tickets and related services, seeking to simplify billing and make feasible payment between the participating companies.
The companies indicated above are owned by the individuals who control FIP Volutto and Mobi FIA, the main shareholders of the Company.
| 28.4. | Commercial Partnership and Maintenance Agreement |
On February 19, 2014, the Company signed an exclusive strategic partnership agreement for business cooperation with AirFrance-KLM. On January 1, 2017, the Company signed an extension of the scope for the inclusion of maintenance services. During the fiscal year ended on December 31, 2020, expenses with component maintenance incurred at the AirFrance-KLM workshop were R$171,290 (R$284,691 on December 31, 2019). On December 31, 2020, the Company has R$72,519 in the “Suppliers” account under current liabilities (R$142,241 on December 31, 2019).
| 28.5. | Compensation Agreement for the Provision of Guarantee |
On October 27, 2020, the Company, through its subsidiary Gol Finance, issued a debt (guaranteed financing) totaling US$250 million, for which it holds the guarantee of compliance with the obligations granted by Mobi FIA, which pledged US$20 million of preferred shares issued by GOL Linhas Aéreas Inteligentes S.A., through the execution of the Shares, Assets and Credit Rights Pledge Agreement and in consideration will receive remuneration from the Company, according to the terms agreed in the contract. For additional information, see Note 17.
| 82 |
| | Notes to the Financial Statements Fiscal Year ended December 31, 2020 (In thousands of Brazilian Reais - R$, except when otherwise indicated) |
| 28.6. | Compensation of the Key Management Personnel |
| Consolidated | ||
| 2020 | 2019 | |
| Salaries, Bonus, and Benefits | 35,147 | 69,609 |
| Payroll Charges | 13,454 | 15,813 |
| Share-Based Compensation | 15,509 | 8,880 |
| Total | 64,110 | 94,302 |
(*) Includes payment for members of the management, audit committee, and fiscal council.
| 29. | Revenue |
| Consolidated | ||
| 2020 | 2019 | |
| Passenger Transportation (*) | 5,958,848 | 13,461,470 |
| Cargo | 316,318 | 411,054 |
| Mileage Revenue | 341,197 | 446,871 |
| Other Revenues | 47,053 | 113,253 |
| Gross Revenue | 6,663,416 | 14,432,648 |
| Related Tax | (291,599) | (567,944) |
| Net Revenue | 6,371,817 | 13,864,704 |
(*) Of the total amount, the total of R$252,730 for the fiscal year ended on December 31, 2020, is made up of the revenue from non-attendance of passengers, rescheduling, ticket cancellation (R$583,242 for the year ended December 31, 2019).
Revenue by geographical location is as follows:
| Consolidated | ||||
| 2020 | % | 2019 | % | |
| Domestic | 5,642,471 | 88.6 | 11,965,181 | 86.3 |
| Foreign | 729,346 | 11.4 | 1,899,523 | 13.7 |
| Net Revenue | 6,371,817 | 100.0 | 13,864,704 | 100.0 |
| 83 |
| | Notes to the Financial Statements Fiscal Year ended December 31, 2020 (In thousands of Brazilian Reais - R$, except when otherwise indicated) |
| 30. | Costs from Services and Operational Expenses |
| Parent Company | Consolidated | |||
| 2020 | 2019 | 2020 | 2019 | |
| Cost from Services | ||||
| Salaries | - | - | (1,018,411) | (1,671,606) |
| Fuels and Lubricants | - | - | (2,025,701) | (4,047,344) |
| Maintenance, Material and Repairs | - | - | (335,868) | (569,229) |
| Passenger Costs | - | - | (389,998) | (578,744) |
| Services | - | - | (183,687) | (150,626) |
| Landing Fees | - | - | (411,065) | (759,774) |
| Depreciation and Amortization | - | - | (1,067,744) | (1,695,384) |
| Recovery of Depreciation Costs (c) | - | - | 25,962 | - |
| Other Operating Costs | - | - | (246,793) | (334,321) |
| Total Cost of Services | - | - | (5,653,305) | (9,807,028) |
| Selling Expenses | ||||
| Salaries | - | - | (27,039) | (36,820) |
| Services | - | - | (83,595) | (163,487) |
| Sales and Marketing | - | - | (324,185) | (670,392) |
| Other Selling Expenses | - | - | (29,935) | (31,970) |
| Total Selling Expenses | - | - | (464,754) | (902,669) |
| Administrative Expenses | ||||
| Salaries (a) | (11,418) | (4,340) | (558,977) | (652,842) |
| Services | (25,066) | (32,183) | (455,962) | (393,279) |
| Depreciation and Amortization | - | - | (37,352) | (32,598) |
| Other Administrative Expenses | (8,022) | (176,260) | (267,690) | (262,979) |
| Total Administrative Expenses | (44,506) | (212,783) | (1,319,981) | (1,341,698) |
| Other Operational Revenues (Expenses) | ||||
| Sale-Leaseback Transactions (b) | 372,712 | 7,413 | 551,942 | 7,924 |
| Boeing Agreement Expense Recovery | - | - | 193,503 | - |
| Recovery of Taxes Paid | - | - | 225,385 | - |
| Idleness - Depreciation and Amortization (d) | - | - | (765,456) | - |
| Idleness - Personnel (d) | - | - | (161,201) | - |
| Other Operating Expenses | 6,421 | 35,641 | 71,789 | 311,429 |
| Total Other Operating Revenues and (Expenses), Net | 379,133 | 43,054 | 115,962 | 319,353 |
| Total | 334,627 | (169,729) | (7,323,222) | (11,732,042) |
| (a) | The Company recognizes compensation paid to members of the Audit Committee, the Board of Directors and the Fiscal Council in the "Salaries" line item. |
| (b) | During the fiscal year ended December 31, 2020, the Company recorded a net gain of R$372,312 in the parent company and R$594,587 in the consolidated, related to the sale-leaseback transaction of 11 aircraft (R$7,413 and R$7,924 in the parent company and consolidated, respectively, from the sale-leaseback operations of one aircraft negotiated in the fiscal year ended December 31, 2019). |
| (c) | Amount related to the reimbursed portion of aircraft depreciation, according to the Agreement signed with Boeing detailed in note 1.3. |
| (d) | See Note 1.1.5. |
| 84 |
| | Notes to the Financial Statements Fiscal Year ended December 31, 2020 (In thousands of Brazilian Reais - R$, except when otherwise indicated) |
| 31. | Financial results |
| Parent Company | Consolidated | |||
| 2020 | 2019 | 2020 | 2019 | |
| Financial Revenues | ||||
| Gain from Derivatives | - | - | 59,669 | 84,862 |
| Gains from Short-Term Investments | 5,448 | 28,102 | 182,966 | 225,535 |
| Monetary variation | 1,905 | 2,816 | 28,043 | 42,967 |
| (-) Taxes on Financial Revenues (a) | (4,558) | (4,154) | (38,553) | (26,818) |
| Unrealized Gains - Conversion Right – ESN | 374,994 | 16,148 | 374,994 | 16,148 |
| Interest Assets | 135,213 | 106,093 | - | 7,451 |
| Others | 15,363 | 6,833 | 129,850 | 39,418 |
| Total Financial Revenues | 528,365 | 155,838 | 736,969 | 389,563 |
| Financial Expenses | ||||
| Losses with Derivatives | - | - | (428,060) | (86,990) |
| Derivative Losses - Capped Call | (74,728) | (23,229) | (74,728) | (23,229) |
| Interest on Loans, Financing and Others | (593,609) | (440,865) | (836,596) | (778,557) |
| Banking Commissions and Expenses | (60,825) | (25,149) | (119,641) | (73,171) |
| Losses with Financial Investments | - | - | (65,403) | (111,679) |
| Interest on Leases | - | - | (818,529) | (488,278) |
| Others | (52,448) | (61,035) | (203,235) | (186,361) |
| Total Financial Expenses | (781,610) | (550,278) | (2,546,192) | (1,748,265) |
| Exchange Rate Change, Net | (733,302) | (87,133) | (3,056,226) | (385,092) |
| Total | (986,547) | (481,573) | (4,865,449) | (1,743,794) |
(a) Relative to taxes on Financial Revenues (PIS and COFINS), according to Decree 8,426 of April 1, 2015.
| 85 |
| | Notes to the Financial Statements Fiscal Year ended December 31, 2020 (In thousands of Brazilian Reais - R$, except when otherwise indicated) |
| 32. | Information by Segment |
The information below presents the summarized financial position of the reportable operating segments on December 31, 2020 and December 31, 2019:
| 32.1. | Assets and liabilities of the operating segments |
| 2020 | |||||
| Flight Transportation | Smiles Frequent-Flyer Program | Combined Operating Segments | Eliminations | Total Consolidated | |
| Assets | |||||
| Current | 2,059,655 | 2,453,838 | 4,513,493 | (1,268,142) | 3,245,351 |
| Noncurrent | 10,040,986 | 908,246 | 10,949,232 | (1,380,447) | 9,568,785 |
| Total Assets | 12,100,641 | 3,362,084 | 15,462,725 | (2,648,589) | 12,814,136 |
| Liabilities | |||||
| Current | 9,975,367 | 1,502,179 | 11,477,546 | (1,079,330) | 10,398,216 |
| Noncurrent | 16,532,366 | 509,577 | 17,041,943 | (858,964) | 16,182,979 |
| Shareholders’ Equity (Deficit) | (14,407,092) | 1,350,328 | (13,056,764) | (710,295) | (13,767,059) |
| Total Liabilities and Shareholders’ Equity (Deficit) | 12,100,641 | 3,362,084 | 15,462,725 | (2,648,589) | 12,814,136 |
| 2019 | |||||
| Flight Transportation | Smiles Frequent-Flyer Program | Combined Operating Segments | Eliminations | Total Consolidated | |
| Assets | |||||
| Current | 3,243,363 | 2,763,448 | 6,006,811 | (1,079,434) | 4,927,377 |
| Noncurrent | 10,888,299 | 121,135 | 11,009,434 | (638,365) | 10,371,069 |
| Total Assets | 14,131,662 | 2,884,583 | 17,016,245 | (1,717,799) | 15,298,446 |
| Liabilities | |||||
| Current | 9,941,112 | 1,321,534 | 11,262,646 | (900,046) | 10,362,600 |
| Noncurrent | 11,867,062 | 357,714 | 12,224,776 | (183,513) | 12,041,263 |
| Shareholders’ Equity (Deficit) | (7,676,512) | 1,205,335 | (6,471,177) | (634,240) | (7,105,417) |
| Total Liabilities and Shareholders’ Equity (Deficit) | 14,131,662 | 2,884,583 | 17,016,245 | (1,717,799) | 15,298,446 |
| 86 |
| | Notes to the Financial Statements Fiscal Year ended December 31, 2020 (In thousands of Brazilian Reais - R$, except when otherwise indicated) |
| 32.2. | Income (Expenses) of the Operating Segments |
| 2020 | |||||
Transportation Transportation | Smiles Frequent-Flyer Program | Combined Operating Segments | Eliminations | Total Consolidated | |
| Net Revenue | |||||
| Passenger Transportation | 5,555,546 | - | 5,555,546 | 227,777 | 5,783,323 |
| Cargo and Others | 340,237 | - | 340,237 | (36,730) | 303,507 |
| Revenue with Miles Redeemed | - | 572,916 | 572,916 | (287,929) | 284,987 |
| Total Net Revenue (a) | 5,895,783 | 572,916 | 6,468,699 | (96,882) | 6,371,817 |
| Cost of Services (b) | (5,562,986) | (99,078) | (5,662,064) | 8,759 | (5,653,305) |
| Gross Profit | 332,797 | 473,838 | 806,635 | (88,123) | 718,512 |
| Operating Revenues (Expenses) | |||||
| Selling Expenses | (454,647) | (108,612) | (563,259) | 97,361 | (465,898) |
| Administrative Expenses (c) | (850,079) | (159,716) | (1,009,795) | (310,187) | (1,319,981) |
| Other Operating (Expenses) Revenues, Net (d) | (184,626) | 4,743 | (179,883) | 295,846 | 115,962 |
| Total Operating Expenses | (1,489,352) | (263,585) | (1,752,937) | 83,020 | (1,669,917) |
| Equity Income (Expenses) | 99,278 | - | 99,278 | (99,717) | (439) |
Operating Profit (Loss) before Financial Income (Expenses) and Income Taxes | (1,056,277) | 210,253 | (847,024) | (104,820) | (951,844) |
| Financial Income (Expenses) | |||||
| Financial Revenues | 719,560 | 89,503 | 809,063 | (72,094) | 736,969 |
| Financial Expenses | (2,604,999) | (13,295) | (2,618,294) | 72,102 | (2,546,192) |
| Financial Revenues (Expenses), Net | (1,885,439) | 76,208 | (1,809,231) | 8 | (1,809,223) |
| Financial Income (Expenses) before Exchange Rate Change, Net | (2,942,716) | 286,461 | (2,656,255) | (104,812) | (2,761,067) |
| Exchange Rate Change, Net | (3,058,275) | 2,049 | (3,056,226) | (3,056,226) | |
| Income (Loss) before Income Tax and Social Contribution | (6,000,991) | 288,510 | (5,712,481) | (104,812) | (5,817,293) |
| Income Tax and Social Contribution | 12,863 | (92,553) | (79,690) | 1,732 | (77,958) |
| Net Income (Loss) for the Period | (5,988,128) | 195,957 | (5,792,171) | (103,080) | (5,895,251) |
| Income (Expenses) Attributed to the Parent Company | (5,988,128) | 103,080 | (5,885,048) | (105,892) | (5,988,128) |
| Income (Expenses) Attributed to Non-Controlling Shareholders | - | 92,877 | 92,877 | - | 92,877 |
| 87 |
| | Notes to the Financial Statements Fiscal Year ended December 31, 2020 (In thousands of Brazilian Reais - R$, except when otherwise indicated) |
| 2019 | |||||
Transportation transportation | Frequent-Flyer Program Smiles | Combined Operating Segments | Eliminations | Total Consolidated | |
| Net Revenue | |||||
| Passenger Transportation | 12,592,018 | - | 12,592,018 | 485,725 | 13,077,743 |
| Cargo and Others | 463,651 | - | 463,651 | (38,563) | 425,088 |
| Revenue with Miles Redeemed | - | 1,051,124 | 1,051,124 | (689,251) | 361,873 |
| Total net revenue (a) | 13,055,669 | 1,051,124 | 14,106,793 | (242,089) | 13,864,704 |
| Cost of Services (b) | (9,759,821) | (73,466) | (9,833,287) | 26,259 | (9,807,028) |
| Gross Profit | 3,295,848 | 977,658 | 4,273,506 | (215,830) | 4,057,676 |
| Operating Expenses | |||||
| Selling Expenses | (971,204) | (127,943) | (1,099,147) | 196,478 | (902,669) |
| Administrative Expenses (c) | (1,216,166) | (131,407) | (1,347,573) | 5,875 | (1,341,698) |
| Other Operating (Expenses) Revenues, Net | 312,746 | 47,535 | 360,281 | (40,928) | 319,353 |
| Total Operating Expenses | (1,874,624) | (211,815) | (2,086,439) | 161,425 | (1,925,014) |
| Equity Income (Expenses) | 294,976 | - | 294,976 | (294,899) | 77 |
Operating Profit (Loss) before Financial Income (Expenses) and Income Taxes | 1,716,200 | 765,843 | 2,482,043 | (349,304) | 2,132,739 |
Financial Income (Expenses) | |||||
| Financial Revenues | 338,268 | 125,455 | 463,723 | (74,160) | 389,563 |
| Financial Expenses | (2,116,438) | (4,273) | (2,120,711) | 74,160 | (2,046,551) |
| Financial Revenues (Expenses), Net | (1,778,170) | 121,182 | (1,656,988) | - | (1,656,988) |
| Financial Income (Expenses) before Exchange Rate Change, Net | (61,970) | 887,025 | 825,055 | (349,304) | 475,751 |
| Exchange Rate Change, Net | (92,168) | 4,669 | (87,499) | 693 | (86,806) |
| Income (Loss) before Income Tax and Social Contribution | (154,138) | 891,694 | 737,556 | (348,611) | 388,945 |
| Income Tax and Social Contribution | 36,865 | (264,969) | (228,104) | 18,497 | (209,607) |
| Net Income (Loss) for the Period | (117,273) | 626,725 | 509,452 | (330,114) | 179,338 |
| Income (Expenses) Attributed to the Parent Company | (117,273) | 330,114 | 212,841 | (330,114) | (117,273) |
| Income (Expenses) Attributed to Non-Controlling Shareholders | - | 296,611 | 296,611 | - | 296,611 |
| (a) | Eliminations are related to transactions between GLA and Smiles Fidelidade. |
| (b) | Includes depreciation and amortization expenses in the amount of R$1,088,695 in the fiscal year ended December 31, 2020 allocated to the following segments: R$1,063,795 for flight transportation and R$24,900 for the Smiles loyalty program (R$911,581 and R$23,322 in the fiscal year ended December 31, 2019, respectively). |
| (c) | Includes depreciation and amortization expenses in the amount of R$39,352 in the fiscal year ended December 31, 2020 allocated to the following segments: R$35,675 for flight transportation and R$3,677 for the Smiles loyalty program (R$784,534 and R$3,547 in the fiscal year ended December 31, 2019, respectively). |
| (d) | Includes depreciation and amortization charges (idle) totaling R$765,456 for the fiscal year ended December 31, 2020, allocated entirely in the air transportation segment. |
In the stand alone financial statements of the subsidiary Smiles Fidelidade, which represents the segment Smiles Loyalty Program, and in the information provided to the relevant decision makers, the revenue recognition occurs upon redemption of the miles by the participants. Under the perspective of Smiles Fidelidade, this measurement is appropriate given that this is when the revenue recognition cycle is complete. At this point, Smiles has transferred to its suppliers the obligation to provide services or deliver products to its customers.
However, from a consolidated perspective, the revenue recognition cycle related to miles exchanged for flight tickets is only complete when the passengers are effectively transported. Therefore, for purposes of reconciliation with the consolidated assets, liabilities and income and expenses, as well as for purposes of equity method of accounting and for consolidation purposes, the Company performed, in addition to elimination entries, consolidating adjustments to adjust the accounting practices related to Smiles’ revenues. In this case, under the perspective of the consolidated financial statements, the mileages that were used to redeem airline tickets are only recognized as revenue when passengers are transported, in accordance with accounting practices and policies adopted by the Company.
| 88 |
| | Notes to the Financial Statements Fiscal Year ended December 31, 2020 (In thousands of Brazilian Reais - R$, except when otherwise indicated) |
| 33. | Commitments |
On December 31, 2020, the Company had 95 firm orders (129 on December 31, 2019) for aircraft acquisitions with Boeing. These aircraft acquisition commitments include estimates for contractual price increases during the construction phase. The approximate amount of firm orders in the current fiscal year considers an estimate of contractual discounts, and corresponds to around R$23,269,198 (R$29,600,947 on December 31, 2019) corresponding to US$4,447,687 on December 31, 2020 (US$7,343,873 on December 31, 2019) and are segregated as follows:
| Consolidated | ||
| 2020 | 2019 | |
| 2021 | - | 3,201,198 |
| 2022 | - | 3,690,205 |
| 2023 | 3,353,702 | 4,103,490 |
| 2024 onwards | 19,915,496 | 18,606,054 |
| Total | 23,269,198 | 29,600,947 |
Of the total commitments presented above, the Company should disburse the amount of R$8,315,768 (corresponding to US$1,600,202 on December 31, 2020) as advances for aircraft acquisition, according to the financial flow below:
| Consolidated | ||
| 2020 | 2019 | |
| 2020 | - | 1,169,967 |
| 2021 | 184,951 | 1,152,456 |
| 2022 | 1,287,077 | 1,300,668 |
| 2023 | 2,657,000 | 1,366,345 |
| 2024 onwards | 4,186,740 | 4,255,621 |
| Total | 8,315,768 | 9,245,057 |
The Company leases its entire aircraft fleet through a combination of leases without a purchase option. On December 31, 2020, the total fleet consisted of 127 aircraft, among which all were commercial leases with no purchase option.
| 34. | Financial Instruments and Risk Management |
Operational activities expose the Company and its subsidiaries to market risk, credit risk and liquidity risk. These risks can be mitigated by using exchange swap derivatives, futures and options contracts based on oil, U.S. dollar and interest markets.
Financial instruments are managed by the Financial Policy Committee (“CPF”) in line with the Risk Management Policy approved by the Risk Policy Committee (“CPR”) and submitted to the Board of Directors. The CPR establishes guidelines, limits, and monitors the controls, including mathematical models adopted to continuously monitor the exposures and possible financial impacts, in addition to preventing the exploitation of operations of a speculative nature with financial instruments.
| 89 |
| | Notes to the Financial Statements Fiscal Year ended December 31, 2020 (In thousands of Brazilian Reais - R$, except when otherwise indicated) |
The Company does not hedge the entire risk exposure; therefore, the Company is subject to market variations for a significant part of its assets and liabilities exposed to the above risks. The decisions on the part to be hedged consider the financial risks and costs of the hedging and are set and reviewed at least monthly, in line with CPR’s strategies. The income (expenses) obtained from the operations and the application of controls to manage risks are part of the monitoring carried out by the Committee and have been satisfactory to the proposed goals.
The airline industry remains exposed to the risks related to the pandemic’s evolution and new strains of the virus and to possible new restrictions imposed by government authorities to stop the disease, so that the Company's financial results may suffer impacts. Although the pandemic, mainly the prolongation of the pandemic and its uncertainties, is expected to have consequences for the financial income (expenses) of airlines in general, the risks related to the Company must be measured in light of its financial position.
| 90 |
| | Notes to the Financial Statements Fiscal Year ended December 31, 2020 (In thousands of Brazilian Reais - R$, except when otherwise indicated) |
| 34.1. | Accounting Classifications of Financial Instruments |
The accounting classifications of the Company’s consolidated financial instruments on December 31, 2020, and 2019 are as follows:
| Parent Company | Consolidated | |||||||
| Measured at Fair Value through Income (Expenses) | Amortized Cost | Measured at Fair Value through Income (Expenses) | Amortized Cost | |||||
| 2020 | 2019 | 2020 | 2019 | 2020 | 2019 | 2020 | 2019 | |
| Assets | ||||||||
| Cash and Bank Deposits | 374,271 | 488 | - | - | 428,812 | 418,447 | - | - |
| Cash Equivalents | 49,666 | 1,016,258 | - | - | 234,018 | 1,226,978 | - | - |
| Financial Investments | 236 | 673 | - | - | 629,335 | 953,762 | - | - |
| Restricted Cash | 4,201 | 6,399 | - | - | 544,607 | 444,306 | - | - |
| Trade Receivables | - | - | - | - | - | - | 739,699 | 1,229,530 |
| Rights from Derivative Transactions | 87,663 | 143,969 | - | - | 128,809 | 147,469 | - | - |
| Deposits (a) | - | - | 68,423 | 51,055 | - | - | 1,390,890 | 1,126,609 |
| Dividends and Interest on Shareholders’ Equity to Receive | - | - | 24,120 | 69,548 | - | - | - | - |
| Credits with Related Companies | - | - | 4,897,331 | 3,440,701 | - | - | - | - |
| Other Credits | - | - | 9,640 | 10,039 | - | - | 179,160 | 140,006 |
| Liabilities | ||||||||
| Loans and Financing (b) | 346,030 | 626,557 | 7,283,683 | 5,968,583 | 346,030 | 626,557 | 9,630,936 | 7,783,284 |
| Leases to Pay | - | - | - | - | - | - | 7,584,192 | 6,052,780 |
| Suppliers | - | - | 72,702 | 19,116 | - | - | 1,645,194 | 1,296,417 |
| Suppliers - Forfaiting | - | - | - | - | - | - | - | 554,467 |
| Landing Fees | - | - | - | - | - | - | 907,958 | 728,339 |
| Obligations with Derivative Transactions | - | - | - | - | 5,297 | 20,350 | - | - |
| Obligations to Related Parties | - | - | 8,791 | 163,350 | - | - | - | - |
| Other Liabilities | - | - | 316,030 | 23,501 | - | - | 618,754 | 164,709 |
| (a) | Excludes judicial deposits, as described in Note 13. |
| (b) | The amounts on December 31, 2020 and 2019, classified as measured at fair value through income (expense), are related to the derivative contracted through Exchange Senior Notes. |
| 91 |
| | Notes to the Financial Statements Fiscal Year ended December 31, 2020 (In thousands of Brazilian Reais - R$, except when otherwise indicated) |
In the fiscal year ended December 31, 2020, there was no change in the classification between categories of the financial instruments.
| 34.2. | Derivative and Non-Derivative Financial Instruments |
The Company's derivative financial instruments were recognized as follows in the Balance sheet:
| Derivatives | Non-Derivative | ||||||
| Fuel | Interest Rate | Exchange Rate | Capped Call | ESN | Revenue Hedge | Total | |
| Fair Value Changes | |||||||
| Rights (Obligations) with Derivatives on December 31, 2019 | (20,350) | - | 3,500 | 143,969 | (626,557) | - | (499,438) |
| Gains (Losses) Recognized in Income (Expenses) | - | - | 18,210 | (74,728) | 374,994 | - | 318,476 |
| Gains (Losses) Recognized as Exchange Rate Change | - | - | - | 18,422 | (94,467) | - | (76,045) |
| Gains (Losses) Recognized in Equity Valuation Adjustments | (744,973) | - | - | - | - | (744,973) | |
| Settlements (Payments Received) During the Period | 799,489 | - | (20,027) | - | - | - | 779,462 |
| Rights (Obligations) with Derivatives on December 31, 2020 | 34,166 | - | 1,683 | 87,663 | (346,030) | - | (222,518) |
| Rights from Derivative Transactions | 39,463 | - | 1,683 | 87,663 | - | - | 128,809 |
| Loans and Financing | - | - | - | - | (346,030) | - | (346,030) |
| Obligations with Derivative Transactions | (5,297) | - | - | - | - | - | (5,297) |
| Changes in the adjustment of equity valuation | |||||||
| Balance on December 31, 2019 | (53,242) | (311,365) | - | - | - | (165,436) | (530,043) |
| Fair Value Adjustments during the Period | (744,973) | - | - | - | - | - | (744,973) |
| Adjustments of Hedge Accounting of Revenue | - | - | - | - | - | (993,532) | (993,532) |
| Net Reversal to Income (Expenses) | 318,140 | 8,158 | - | - | - | 25,543 | 351,841 |
| Derecognition of Hedge Object | 315,286 | - | - | - | 290,345 | 605,631 | |
| Balances on December 31, 2020 | (164,789) | (303,207) | - | - | - | (843,080) | (1,311,076) |
| Effects on Income (Expenses) | (633,426) | (8,158) | 18,210 | (56,306) | 280,527 | 677,644 | 278,491 |
| Hedge nature | Classification | 2020 | |
| USD Revenue | Net Revenue | (16,086) | |
| USD Revenue | Exchange Rate Change | 693,730 | |
| Fuel | Cost from Services | (249,328) | |
| Fuel | Financial Income (Expenses) | (384,098) | |
| Interest - Lease | Financial Income (Expenses) | (8,158) | |
| Conversion Right - ESN | Financial Income (Expenses) | 374,994 | |
| Conversion Right - ESN | Exchange Rate Change | (94,467) | |
| Capped Call – ESN | Financial Income (Expenses) | (74,728) | |
| Capped Call – ESN | Exchange Rate Change | 18,422 | |
| Exchange Rate | Exchange Rate Change | 18,210 | |
| Total Effects on Income (Expenses) | 278,491 |
The Company may adopt hedge accounting for derivatives contracted to hedge cash flow and that qualify for this classification as per CPC 48 - Financial Instruments (equivalent to IFRS 9).
On December 31, 2020, the Company adopts cash flow hedge for the interest rate (mainly the Libor interest rates), and for aeronautical fuel protection and future revenue in US Dollar.
As a result from the reduction in the volume of flight and interruption of international operations, the Company discontinued hedge relations of part of the fuel hedge operations designated as cash flow hedges, and hedge accounting transactions used to hedge future revenues in foreign currency (hedged object), as presented in note 1.1.
Cash flow hedges are scheduled for realization and, therefore, reclassification to expense according to the following periods:
| 2021 | 2022 | 2023 | 2024 | 2025 onwards | |
| Fuel | 154,973 | 9,816 | - | - | - |
| Interest Rate | 15,878 | 21,707 | 26,575 | 26,412 | 212,635 |
| Revenue Hedge | 118,571 | 248,225 | 301,922 | 174,362 | - |
| Total | 289,422 | 279,748 | 328,497 | 200,774 | 212,635 |
| 34.3. | Market Risks |
Market risk is represented by the risk of fluctuations in the fair value of a financial instrument’s future cash flows due to variations in the market prices. The main market prices with an impact on the Company are: fuel price, exchange rate and interest rate.
| 92 |
| | Notes to the Financial Statements Fiscal Year ended December 31, 2020 (In thousands of Brazilian Reais - R$, except when otherwise indicated) |
The sensitivity analysis of financial instruments was prepared with the purpose to estimate the impact on profit (loss) before taxes and shareholders’ equity on: open derivatives position, currency exposure and interest rates on December 31, 2020 for the market risks considered relevant by the Company's management.
In the probable scenario, in the Company's assessment, the maintenance of market levels was considered, so that there are no impacts on profit (loss) before taxes and shareholders’ equity. The Company also considered the following scenarios in the risk variable:
| · | 10% deterioration (possible adverse scenario); |
| · | 25% deterioration (remote adverse scenario); |
The estimates presented do not necessarily reflect the amounts to be ascertained in the next financial statements. The use of different methodologies can have a material effect on the estimates presented.
| 34.3.1. | Fuel |
The aircraft fuel prices fluctuate due to the volatility of the price of crude oil by product price fluctuations. The Company uses different instruments to hedge its exposure to the fuel price. The choice depends on factors such as liquidity in the market, the market price of the components, levels of volatility, availability, and margin deposit. The main instruments are futures, calls, calls spreads, collars and swaps.
The Company’s strategy for Fuel Risk Management is based on statistical models. Through the developed model, the Company can (i) measure the economic relationship between the hedging instrument and the hedged object, thus able to assess if the relationship between the price of aviation fuel and the price of foreign fuel behaves as expected; and (ii) adequately define the hedged index, thus able to establish the appropriate volume to be contracted to hedge the number of liters of fuel that will be consumed in a given period.
The Company’s models consider the potential factors of inefficiency that may impact on risk management strategies, such as changes in the pricing of aviation fuel by suppliers and the mismatch of the term of the hedging instrument and the hedged object.
The Company has protected, through hedge agreements, 65% of its fuel consumption for the fiscal year 2021 and 23% for the fiscal year 2022.
The table below shows the sensitivity analysis considering the fluctuation of prices of air fuel priced in US dollars, based on the barrel price on December 31, 2020 at US$48.52:
| Fuel | ||
Barrel Price (in USD) | Impact (In thousand of Reais) | |
| Decline in Prices/Barrel (-25%) | 35.81 | (95,280) |
| Decline in Prices/Barrel (-10%) | 43.67 | (27,835) |
| Increase in Prices/Barrel (+10%) | 53.49 | 110,033 |
| Increase in Prices/Barrel (+25%) | 59.68 | 283,818 |
| 93 |
| | Notes to the Financial Statements Fiscal Year ended December 31, 2020 (In thousands of Brazilian Reais - R$, except when otherwise indicated) |
| 34.3.2. | Interest Rate |
The Company’s strategy for interest risk management combines fixed and floating interest rates and establishes if it will be necessary to expand or reduce the interest rate exposures. The Company manages its exposure by calculating the Basis Point Value (“BPV”) of each agreement and uses volumes that correspond to the amount of BPVs necessary to achieve the goals proposed in the Risk Management to contract derivatives.
Through statistical models, the Company proves the economic relationship between the hedging instrument and the hedged object, considering potential factors of ineffectiveness, such as the mismatch of the term of the hedging instrument and the hedged object.
The Company is mainly exposed to lease transactions indexed to changes in the Libor rate until the aircraft is received. To mitigate such risks, the Company can use derivative financial instruments. On December 31, 2020, the Company and its subsidiaries have open Libor interest derivative agreements
On December 31, 2020, the Company held financial investments and debts with different types of fees. Its sensitivity analysis of non-derivative financial instruments examined the impact on annual interest rates only for positions with material amounts on December 31, 2020 that were exposed to fluctuations in interest rates, as the scenarios below show. The amounts show the impacts on Income (Expenses) according to the scenarios adopted below:
| Short-Term Investments Net of Financial Debt (a) | ||
| Risk | CDI Rate Drop | Libor Rate Increase |
| Reference Rates | 1.90% | 0.08% |
| Exposure Amount (Probable Scenario) (b) | (565,397) | 3,201,557 |
| Remote Favorable Scenario (-25%) | 1,179 | (622) |
| Possible Favorable Scenario (-10%) | 426 | (249) |
| Possible Adverse Scenario (+10%) | (426) | 249 |
| Remote Adverse Scenario (+25%) | (1,179) | 622 |
| (a) | Refers to the sum of the amounts invested and raised in the financial market and indexed to the CDI and Libor rates. |
| (b) | Book balances recorded as of December 31, 2020. |
| 94 |
| | Notes to the Financial Statements Fiscal Year ended December 31, 2020 (In thousands of Brazilian Reais - R$, except when otherwise indicated) |
| 34.3.3. | Exchange Rate |
Foreign currency risk derives from the possibility of unfavorable fluctuation of foreign currency to which the Company’s liabilities or cash flows are exposed. In the fiscal year ended December 31, 2020, the Company recognized a total gain with foreign exchange hedge transactions in the amount of R$18,210 (R$1,207 in the fiscal year ended December 31, 2019).
The Company’s foreign currency exposure is summarized below:
| Parent Company | Consolidated | |||
| 2020 | 2019 | 2020 | 2019 | |
| Assets | ||||
| Cash, Short-Term Investments and Restricted Cash | 374,979 | 647,671 | 491,258 | 1,035,802 |
| Trade Receivables | - | - | 120,167 | 202,363 |
| Taxes to Recover | - | - | - | 5,312 |
| Deposits | 68,423 | 51,056 | 1,390,890 | 1,126,609 |
| Rights from Derivative Transactions | 87,663 | 143,969 | 128,809 | 147,469 |
| Total Assets | 531,065 | 842,696 | 2,131,124 | 2,517,555 |
| Liabilities | ||||
| Debt | (7,629,713) | (6,595,140) | (9,132,988) | (7,831,116) |
| Leases to Pay | - | - | (7,536,677) | (6,007,973) |
| Suppliers | (24,357) | (3,164) | (481,001) | (462,636) |
| Provision for Aircraft and Engine Return | - | - | (1,030,915) | (869,078) |
| Obligations with Derivative Transactions | - | - | (5,297) | (20,350) |
| Total Liabilities | (7,654,070) | (6,598,304) | (18,186,878) | (15,191,153) |
| Exchange Rate Exposure Liabilities | (7,123,005) | (5,755,608) | (16,055,754) | (12,673,598) |
| Commitments Not Recorded in the Statements of Financial Position | ||||
| Future Obligations Resulting from Firm Aircraft Orders | (23,269,198) | (65,779,883) | (23,269,198) | (65,779,883) |
| Total | (23,269,198) | (65,779,883) | (23,269,198) | (65,779,883) |
| Total Exchange Rate Exposure R$ | (30,392,203) | (71,535,491) | (39,324,952) | (78,453,481) |
| Total Exchange Rate Exposure - US$ | (5,848,366) | (17,747,659) | (7,567,293) | (19,463,984) |
| Exchange Rate (R$/US$) | 5.1967 | 4.0307 | 5.1967 | 4.0307 |
The Company is mainly exposed to the exchange rate change of the U.S. dollar.
As of December 31, 2020, the Company adopted the closing exchange rate of R$5.1967/US$1.00 as a likely scenario. The table below shows the sensitivity analysis and the effect on income (expenses) of exchange rate fluctuations in the exposure amount of the period as of December 31, 2020:
| Effect on Income (Expenses) | |||
| Exchange Rate | Parent Company | Consolidated | |
| Net Liabilities Exposed to the Risk of Appreciation of the U.S. dollar | 5.1967 | 7,123,005 | 16,055,754 |
| Dollar Depreciation (-25%) | 3.8975 | 1,780,751 | 4.013.939 |
| Dollar Depreciation (-10%) | 4.6770 | 712,301 | 1.605.575 |
| Dollar Appreciation (+10%) | 5.7164 | (712,301) | (1.605.575) |
| Dollar Appreciation (+25%) | 6.4959 | (1,780,751) | (4.013.939) |
| 95 |
| | Notes to the Financial Statements Fiscal Year ended December 31, 2020 (In thousands of Brazilian Reais - R$, except when otherwise indicated) |
| 34.3.4. | Capped Call |
The Company, through Gol Equity Finance, in the context of the pricing of the ESN issued on March 26, April 17 and July 17, 2019, contracted private derivative transactions (Capped call) with part of the note subscribers with the purpose of minimizing the potential dilution of the Company’s preferred shares and ADSs.
The Company recognized a total expense for capped call operations in the amount of R$56,306, comprising R$74,728 of changes in fair value, net of R$18,422 of exchange rate change, for the fiscal year ended on December 31, 2020 (R$23,229 of changes in fair value on December 31, 2019).
| 34.4. | Credit Risk |
The credit risk is inherent in the Company’s operating and financing activities, mainly in cash and cash equivalents, short-term investments and trade receivables. Financial assets classified as cash, cash equivalents, and short-term investments are deposited with counterparties rated investment grade or higher by S&P or Moody's (between AAA and AA-), pursuant to risk management policies.
Credit limits are set for all customers based on internal credit rating criteria and carrying amounts represent the maximum credit risk exposure. Customer creditworthiness is assessed based on an internal system of extensive credit rating. Outstanding trade receivables are frequently monitored by the Company.
Derivative financial instruments are contracted in the over-the-counter market (OTC) with counterparties rated investment grade or higher, or in a commodities and futures exchange (B3 or NYMEX), thus substantially mitigating credit risk. The Company's obligation is to evaluate counterparty risk involved in financial instruments and periodically diversify its exposure.
| 34.5. | Liquidity risk |
The Company is exposed to liquidity risk in two distinct ways: (i) market prices, which vary in accordance with the types of assets and markets where they are traded, and (ii) cash flow liquidity risk related to difficulties in meeting the contracted operating obligations at the maturity dates. In order to manage liquidity risk, the Company invests its funds in liquid assets (government bonds, CDBs and investment funds with daily liquidity) and its Cash Management Policy requires the weighted average maturity of its debt to be longer than the weighted average term of its investment portfolio term.
| 96 |
| | Notes to the Financial Statements Fiscal Year ended December 31, 2020 (In thousands of Brazilian Reais - R$, except when otherwise indicated) |
The schedules of financial liabilities held by the Company's consolidated financial liabilities on December 31, 2020, and 2019 are as follows:
| Parent Company | |||||
| Less than 6 months | 6 to 12 months | 1 to 5 years | More than 5 years | Total | |
| Debt | 638,965 | - | 6,201,580 | 789,168 | 7,629,713 |
| Suppliers | 72,702 | - | - | - | 72,702 |
| Obligations to Related Parties | 8,791 | - | - | - | 8,791 |
| Other Liabilities | - | - | 316,030 | - | 316,030 |
| On December 31, 2020 | 720,458 | - | 6,517,610 | 789,168 | 8,027,236 |
| Debt | 200,598 | 1,413,645 | 6,587,415 | 1,923,019 | 10,124,677 |
| Suppliers | 19,116 | - | - | - | 19,116 |
| Obligations to Related Parties | 163,350 | - | - | - | 163,350 |
| Other Liabilities | - | - | 23,501 | - | 23,501 |
| On December 31, 2019 | 383,064 | 1,413,645 | 6,610,916 | 1,923,019 | 10,330,644 |
| Consolidated | |||||
| Less than 6 months | 6 to 12 months | 1 to 5 years | More than 5 years | Total | |
| Debt | 2,120,462 | 232,817 | 6,804,167 | 819,520 | 9,976,966 |
| Leases to Pay | 647,850 | 669,159 | 4,763,614 | 1,503,567 | 7,584,190 |
| Suppliers | 1,612,536 | - | 32,658 | - | 1,645,194 |
| Landing Fees | 907,958 | - | - | - | 907,958 |
| Obligations with Derivative Transactions | 5,297 | - | - | - | 5,297 |
| Other Liabilities | 287,275 | - | 331,479 | - | 618,754 |
| On December 31, 2020 | 5,581,378 | 901,975 | 11,931,918 | 2,323,090 | 20,738,361 |
| Debt | 1,112,414 | 1,724,940 | 7,519,263 | 1,890,448 | 12,247,065 |
| Leases to Pay | 1,257,430 | 1,018,266 | 5,862,268 | 967,404 | 9,105,368 |
| Suppliers | 1,286,264 | - | 10,142 | - | 1,296,406 |
| Suppliers - Forfaiting | 554,467 | - | - | - | 554,467 |
| Landing Fees | 728,339 | - | - | - | 728,339 |
| Obligations with Derivative Transactions | 9,080 | - | 11,270 | - | 20,350 |
| Other Liabilities | 128,744 | - | 35,965 | - | 164,709 |
| On December 31, 2019 | 5,076,738 | 2,743,206 | 13,438,908 | 2,857,852 | 24,116,704 |
| 34.6. | Measurement of the Fair Value of Financial Instruments |
To meet the disclosure requirements of financial instruments measured at fair value, the Company and its subsidiaries must group these instruments at levels 1 to 3 based on the observable degree of fair value:
| · | Level 1: Fair value measurements are obtained from quoted (unadjusted) prices in identical active or passive markets; |
| · | Level 2: Fair value measurements are obtained from other variables other than the quoted prices included within Level 1, which are observable for the asset or liability, either directly (that is, as prices) or indirectly (that is, derived from prices); and |
| · | Level 3: Fair value measurements are obtained from valuation techniques that include variables for the asset or liability, but are not based on observable market data (unobservable data). |
The following table shows a summary of the financial instruments measured at the fair value of the Company and its subsidiaries, including their related classifications of the valuation method, on December 31, 2020, and 2019:
| 97 |
| | Notes to the Financial Statements Fiscal Year ended December 31, 2020 (In thousands of Brazilian Reais - R$, except when otherwise indicated) |
| Parent Company | |||||
| 2020 | 2019 | ||||
| Fair Value Level | Book value | Fair value | Book value | Fair value | |
| Cash and Cash Equivalents | Level 1 | 652 | 652 | - | - |
| Cash and Cash Equivalents | Level 2 | 49,014 | 49,014 | - | - |
| Financial Investments | Level 1 | - | - | 673 | 673 |
| Financial Investments | Level 2 | 236 | 236 | - | - |
| Restricted Cash | Level 2 | 4,201 | 4,201 | 6,399 | 6,399 |
| Rights from Derivative Transactions | Level 2 | 87,663 | 87,663 | - | - |
| Debt | Level 1 | (346,030) | (346,030) | (626,557) | (626,557) |
| Consolidated | |||||
| 2020 | 2019 | ||||
| Fair Value Level | Book value | Fair value | Book value | Fair value | |
| Cash and Cash Equivalents | Level 1 | 59,936 | 59,936 | 5,505 | 5,505 |
| Cash and Cash Equivalents | Level 2 | 170,359 | 170,359 | - | - |
| Financial Investments | Level 1 | 22,465 | 22,465 | 953,762 | 953,762 |
| Financial Investments | Level 2 | 606,870 | 606,870 | - | - |
| Restricted Cash | Level 2 | 544,607 | 544,607 | 444,306 | 444,306 |
| Rights from Derivative Transactions | Level 2 | 128,809 | 128,809 | 147,469 | 147,469 |
| Debt | Level 1 | (346,030) | (346,030) | (626,557) | (626,557) |
| Obligations with Derivative Transactions | Level 2 | (5,297) | (5,297) | (20,350) | (20,350) |
The fair value of financial instruments measured at amortized cost has not been disclosed since the fair value is close to its book value based on the conditions established, mainly due to the short term of the maturity of these assets and liabilities. The fair values for debt, which differ from accounting balances, in turn, are disclosed in note 17.
| 34.7. | Capital Management |
The Company seeks alternatives to capital in order to meet its operational needs, aiming a capital structure that takes into account suitable parameters for the financial costs, the maturities of funding and its guarantees. The Company monitors its financial leverage ratio, which corresponds to net debt, including short and long-term debt. The following table shows the financial leverage:
| Consolidated | ||
| 2020 | 2019 | |
| Total Loans and Financing | (9,976,966) | (8,409,841) |
| Total Leases Payable | (7,584,192) | (6,052,780) |
| (-) Cash and Cash Equivalents | 654,444 | 1,645,425 |
| (-) Short-Term Investments | 629,335 | 953,762 |
| Net Debt | (16,277,379) | (11,863,434) |
| 35. | Non-Cash Transactions |
| Parent Company | ||
| 2020 | 2019 | |
| Initial Adoption - IFRS 16 (Investments / Accumulated Losses) | - | 2,436,077 |
| Interest on Shareholders’ Equity for Distribution, Net of Taxes (Investments/ISE) | 24,120 | - |
| Share-Based Payment (Investments/Share-Based Payment) | (22,298) | (38,359) |
| Unrealized Income (Expenses) of Derivatives (Investments/Equity Valuation Adjustment) | (781,033) | 30,021 |
| Effects of changes in corporate interest (investments/capital reserves) | 352 | 649 |
| Actuarial Losses from Post-Employment Benefits | 14,376 | 87,541 |
| Dividends (Investments / Dividends) | - | 228,359 |
| 98 |
| | Notes to the Financial Statements Fiscal Year ended December 31, 2020 (In thousands of Brazilian Reais - R$, except when otherwise indicated) |
| Consolidated | ||
| 2020 | 2019 | |
| Initial Adoption - IFRS 16 | - | 2,436,333 |
| Share-Based Payment (Capital/Share-Based Payment) | (23,430) | (31,222) |
| Effects of Changes in Equity Interest (Capital Reserves / Minority Interest) | (352) | (649) |
| Interest on shareholders’ equity for distribution, net of taxes | 23,139 | - |
| Actuarial Losses from Post-Employment Benefits | 13,921 | 87,541 |
| Dividends | - | 238,359 |
| Leaseback (Fixed Assets) | (248,729) | - |
| Leaseback (Leases) | 289,102 | - |
| Forfaiting (Forfaiting/Loans) | (411,457) | - |
| Acquisition of Property, Plant & Equipment Through Financing (Property, Plant & Equipment / Loans And Financing) | 25,974 | 164,234 |
| Guarantee Deposits (Deposits / Leases Payable) | (77,009) | (6.974) |
| Maintenance Reserve (Deposits / Property, Plant & Equipment) | (39,729) | - |
| Right of Use of Flight Equipment (Property, Plant & Equipment / Leases Payable) | 165,146 | 957,027 |
| Financial Lease Agreement Renegotiation (Property, Plant & Equipment / Leases Payable) | 221,248 | - |
| Unrealized Income (Expenses) of Derivatives (Derivative Rights/Equity Valuation Adjustment) | - | 30,021 |
| 99 |
| | Notes to the Financial Statements Fiscal Year ended December 31, 2020 (In thousands of Brazilian Reais - R$, except when otherwise indicated) |
| 36. | Liabilities from Financing Activities |
The changes in and equity instruments issued liabilities from the Company’s financing activities in the periods ended December 31, 2020 and 2019 are as follows:
| 36.1. | Parent Company |
| 2020 | |||||||
| Adjustment to Profit | |||||||
| Opening Balance | Net Cash Flows from (Used in) Financing Activities | Net Cash Flows from Operating Activities | Exchange Rate Changes, Net | Provision for Interest and Cost Amortization | Unrealized Income (Expenses) on Derivatives | Closing Balance | |
| Debt | 6,595,140 | (522,783) | (515,278) | 1,838,911 | 608,717 | (374,994) | 7,629,713 |
| 2019 | |||||||||
| Non-Cash Transactions | Adjustment to Profit | ||||||||
| Opening Balance | Net Cash Flows from (Used in) Financing Activities | Net Cash Flows from Operating Activities | Capital Increase | Exchange Rate Changes, Net | Provision for Interest and Cost Amortization | Unrealized Income (Expenses) on Derivatives | Closing Balance | ||
| Debt | 4,659,102 | 1,587,691 | (330,824) | - | 269,593 | 450,295 | (40,717) | 6,595,140 | |
| 36.2. | Consolidated |
| 2020 | |||||||||||||||||||
| Non-Cash Transactions | Adjustment to Profit | ||||||||||||||||||
| Opening Balance | Net Cash Flows from (Used in) Financing Activities | Net Cash Flows from Operating Activities | Property, plant and equipment acquisition through financing | Forfaiting | Variation in Variable and Short-Term Liabilities | Deposit in Guarantee | Write-Off | Exchange Rate Changes, Net | Provision for Interest and Cost Amortization | Contractual Amendment | Unrealized Income (Expenses) on Derivatives | Closing Balance | |||||||
| Debt | 8,409,841 | (814,710) | (615,027) | 25,974 | 411,457 | - | - | - | 2,207,107 | 727,318 | - | (374,994) | 9,976,966 | ||||||
| Leases to Pay | 6,052,780 | (1,058,692) | (4,530) | 454,248 | - | 18,731 | (47,215) | (704,164) | 1,833,257 | 818,529 | 221,248 | - | 7,584,192 | ||||||
| 100 |
| | Notes to the Financial Statements Fiscal Year ended December 31, 2020 (In thousands of Brazilian Reais - R$, except when otherwise indicated) |
| 2019 | |||||||||||||||
| Dividends and Interest on Shareholders’ Equity paid through Subsidiary Smiles | Non-Cash Transactions | Adjustment to Profit | |||||||||||||
| Opening Balance | Net Cash Flows from (Used in) Financing Activities | Net Cash Flows from Operating Activities | Gains on Change in Equity Interest | Capital Increase | Initial Adoption Adjustment – CPC 06 (R2) | Provision Property, Plant & Equipment | Profit for the Period | Provision for Interest and Cost Amortization | Exchange Rate Change, Net | Unrealized Income (Expenses) on Derivatives | Others | Closing Balance | |||
| Debt | 6,443,807 | 1,401,125 | (444,006) | - | - | - | - | 164,234 | - | 571,681 | 313,717 | (40,717) | - | 8,409,841 | |
| Leases to Pay | 912,145 | (1,617,677) | (26,788) | - | - | - | 5,370,868 | - | - | 502,544 | 245,094 | - | 666,594 | 6,052,780 | |
| Derivatives | 409,662 | - | - | - | - | - | - | - | - | - | - | - | (389,312) | 20,350 | |
| Other Liabilities | 147,239 | - | - | - | - | - | - | - | - | - | - | - | 17,470 | 164,709 | |
| 101 |
| | Notes to the Financial Statements Fiscal Year ended December 31, 2020 (In thousands of Brazilian Reais - R$, except when otherwise indicated) |
SIGNATURE
Pursuant to the requirements of the Securities Exchange Act of 1934, the registrant has duly caused this report to be signed on its behalf by the undersigned, thereunto duly authorized.
Date: March 16, 2021
| GOL LINHAS AÉREAS INTELIGENTES S.A. | ||
| By: | /s/ Richard F. Lark, Jr. | |
Name: Richard F. Lark, Jr. Title: Investor Relations Officer | ||