SECURITIES AND EXCHANGE COMMISSION
Washington, D.C. 20549
FORM 6-K
REPORT OF FOREIGN ISSUER
PURSUANT TO RULE 13a-16 OR 15d-16 OF THE
SECURITIES EXCHANGE ACT OF 1934
For the month of September 2021
(Commission File No. 001-32221)
GOL LINHAS AÉREAS INTELIGENTES S.A.
(Exact name of registrant as specified in its charter)
GOL INTELLIGENT AIRLINES INC.
(Translation of registrant’s name into English)
Praça Comandante Linneu Gomes, Portaria 3, Prédio 24
Jd. Aeroporto
04630-000 São Paulo, São Paulo
Federative Republic of Brazil
(Address of registrant’s principal executive offices)
Indicate by check mark whether the registrant files or will file
annual reports under cover Form 20-F or Form 40-F.
Form 20-F ___X___ Form 40-F ______
Indicate by check mark whether the registrant by furnishing the
information contained in this Form is also thereby furnishing the
information to the Commission pursuant to Rule 12g3-2(b) under
the Securities Exchange Act of 1934.
Yes ______ No ___X___
Explanatory Note
We are re-submitting in this report on Form 6-K our unaudited interim condensed consolidated financial statements as of June 30, 2021 and for the six months ended June 30, 2021 (with corresponding figures for the six months ended June 30, 2020) in order to reflect certain non-cash adjustments to our recording of sale-leaseback transactions that occurred in the six months ended June 30, 2020 but were incorrectly recorded in the three-month period ended December 31, 2020. There was no effect on the full year financial statements as of and for the year ended December 31, 2020.
The re-submission of our financial statements in this report retroactively reflects these adjustments in the accounting period in which the relevant sale-leaseback transactions occurred, in the first semester of 2020.
No changes were made to the financial information as of and for the six months ended June 30, 2021 and for the years ended December 31, 2020, 2019 and 2018, as previously published.
Unaudited Interim Condensed
Consolidated Financial Statements
GOL Linhas Aéreas Inteligentes S.A.
June 30, 2021
Gol Linhas Aéreas Inteligentes S.A.
Unaudited interim condensed consolidated financial statements
June 30, 2021
Contents
Consolidated statements of financial position | 3 |
| Consolidated statements of operations | 5 |
| Consolidated statements of comprehensive income (loss) | 6 |
| Consolidated statements of changes in equity | 7 |
| Consolidated statements of cash flows | 8 |
| Notes to the unaudited interim condensed consolidated financial statements | 10 |
| | Consolidated statements of financial position June 30, 2021 and December 31, 2020 (In thousands of Reais - R$) |
Statements of financial position
| Assets | Note | June 30, 2021 | December 31, 2020 |
| Current assets | |||
| Cash and cash equivalents | 6 | 760,269 | 662,830 |
| Short-term investments | 7 | 22,838 | 628,343 |
| Restricted cash | 8 | 269,131 | 355,769 |
| Trade receivables | 9 | 717,408 | 739,699 |
| Inventories | 10 | 212,814 | 195,638 |
| Advance to suppliers and third parties | 11 | 198,813 | 318,769 |
| Recoverable taxes | 12 | 265,357 | 186,955 |
| Derivative assets | 33.2 | - | 12,526 |
| Other credits and amounts | 123,531 | 144,822 | |
| Total current assets | 2,570,161 | 3,245,351 | |
| Non-current assets | |||
| Short-term investments | 7 | 168 | 992 |
| Restricted cash | 8 | 44,684 | 188,838 |
| Deposits | 14 | 1,856,128 | 2,058,455 |
| Advance to suppliers and third parties | 11 | 97,417 | 89,701 |
| Recoverable taxes | 12 | 114,120 | 318,404 |
| Deferred taxes | 13 | 53,772 | 53,563 |
| Other credits and amounts | 31,889 | 34,338 | |
| Derivative assets | 33.2 | 63,574 | 116,283 |
| Investments | - | 815 | |
| Property, plant and equipment | 15 | 4,979,649 | 4,960,288 |
| Intangible assets | 16 | 1,757,598 | 1,747,108 |
| Total non-current assets | 8,998,999 | 9,568,785 | |
| Total | 11,569,160 | 12,814,136 |
The accompanying notes are an integral part of these unaudited interim condensed consolidated financial statements.
| 3 |
| | Consolidated statements of financial position June 30, 2021 and December 31, 2020 (In thousands of Reais - R$) |
| Liabilities and equity (deficit) | Note | June 30, 2021 | December 31, 2020 |
| Current liabilities | |||
| Loans and financing | 17 | 1,773,004 | 2,353,279 |
| Leases | 18 | 1,864,831 | 1,317,008 |
| Suppliers | 19 | 1,562,946 | 1,612,536 |
| Salaries, wages and benefits | 351,203 | 334,670 | |
| Taxes payable | 20 | 61,279 | 73,614 |
| Landing fees | 937,371 | 907,958 | |
| Advance ticket sales | 21 | 1,999,013 | 2,050,799 |
| Mileage program | 22 | 1,280,022 | 1,258,502 |
| Advances from customers | 54,878 | 27,897 | |
| Provisions | 23 | 252,046 | 169,381 |
| Derivatives liabilities | 32.2 | - | 5,297 |
| Other liabilities | 381,582 | 287,275 | |
| Total current liabilities | 10,518,175 | 10,398,216 | |
| Non-current liabilities | |||
| Loans and financing | 17 | 8,521,006 | 7,623,687 |
| Leases | 18 | 5,831,098 | 6,267,184 |
| Suppliers | 19 | 10,234 | 32,658 |
| Salaries, wages and benefits | 30,239 | - | |
| Taxes payable | 20 | 28,039 | 32,362 |
| Mileage program | 22 | 344,760 | 322,460 |
| Provisions | 23 | 1,363,988 | 1,353,515 |
| Deferred taxes | 13 | 206,695 | 219,634 |
| Derivatives liabilities | 32.2 | - | - |
| Other liabilities | 461,226 | 331,479 | |
| Total non-current liabilities | 16,797,285 | 16,182,979 | |
| Equity (deficit) | |||
| Capital stock | 24.1 | 4,039,336 | 3,009,436 |
| Advances for future capital increase | 2,088 | 1,180 | |
| Treasury shares | 24.2 | (41,514) | (62,215) |
| Capital reserves | 195,680 | 207,246 | |
| Equity valuation adjustments | (1,071,030) | (577,369) | |
| Accumulated losses | (18,870,860) | (16,985,370) | |
| Deficit attributable to equity holders of the parent company | (15,746,300) | (14,407,092) | |
| Non-controlling interest (NCI) | - | 640,033 | |
| Total deficit | (15,746,300) | (13,767,059) | |
| Total liabilities and deficit | 11,569,160 | 12,814,136 |
The accompanying notes are an integral part of these unaudited interim condensed consolidated financial statements.
| 4 |
Consolidated statements of operations
| | Consolidated statements of operations Six-month periods ended June 30, 2021 and 2020 (In thousands of Reais - R$, except Basic and Diluted loss per share) |
| Note | June 30, 2021 | June 30, 2020 | |
| Revenue | |||
| Passenger | 2,303,852 | 3,184,636 | |
| Mileage program, cargo and other | 292,147 | 320,939 | |
| Total revenue | 28 | 2.595,999 | 3,505,575 |
| Salaries, wages and benefits | (934,431) | (836,363) | |
| Aircraft fuel | (942,315) | (1,136,923) | |
| Landing fees | (183,754) | (222,073) | |
| Aircraft, traffic and mileage servicing | (379,481) | (314,720) | |
| Passenger service expenses | (226,590) | (203,224) | |
| Sales and marketing | (124,850) | (161,042) | |
| Maintenance, materials and repairs | (241,331) | (218,067) | |
| Depreciation and amortization | (634,638) | (1,018,581) | |
| Other income (expenses), net | (261,362) | 690,594 | |
| Total operating costs and expenses | (3,928,752) | (3,420,399) | |
| Income (loss) before financial results, exchange rate variation, net and income tax and social contribution | (1,332,753) | 85,176 | |
| Financial income (expenses) | |||
| Financial income | 163,651 | 894,647 | |
| Financial expenses | (1,047,355) | (1,721,213) | |
| Total financial income (expenses) | 29 | (883,704) | (826,566) |
| Loss before exchange rate variation, net and income tax and social contribution | (2,216,457) | (741,390) | |
| Exchange rate variation, net | 29 | 401,305 | (3,513,428) |
| Income (Loss) before income tax and social contribution | (1,815,152) | (4,254,818) | |
| Income tax and social contribution | |||
| Current | (45,588) | (35,853) | |
| Deferred | 12,984 | (10,664) | |
| Total income (loss) taxes | 13 | (32,604) | (46,517) |
| Income (Loss) for the period | (1,847,756) | (4,301,335) | |
| Income (Loss) attributable to: | |||
| Equity holders of the parent company | (1,885,490) | (4,327,827) | |
| Non-controlling interest shareholders | 37,734 | 26,492 | |
| Basic income (loss) per share | 25 | ||
| Per common share | (0,149) | (0.348) | |
| Per preferred share | (5.253) | (12.167) | |
| Diluted income (loss) per share | 25 | ||
| Per common share | (0.149) | (0.362) | |
| Per preferred share | (5.253) | (12.167) | |
The accompanying notes are an integral part of these unaudited interim condensed consolidated financial statements.
| 5 |
Statement of comprehensive income
| | Consolidated statements of comprehensive income (loss) Six-month periods ended June 30, 2021 and 2020 (In thousands of Reais - R$) |
| June 30, 2021 | June 30, 2020 | |
| Net income (loss) for the period | (1,847,756) | (4,301,335) |
| Other comprehensive (loss) income – items that are or may be reclassified subsequently to profit or loss | ||
| Cash flow hedge, net of income tax and social contribution | 415,782 | (1,078,349) |
| Actuarial losses from pension plans and post-employment benefits | - | 27,287 |
| Cumulative adjustment of conversion into subsidiaries | 808 | (553) |
| 416,590 | (1,051,615) | |
| Total comprehensive income (loss) for the period | (1,431,166) | (5,352,950) |
| Comprehensive income (loss) attributable to: | ||
| Equity holders of the parent company | (1,469,171) | (5,379,164) |
| Non-controlling interest shareholders | 38,005 | 26,214 |
The accompanying notes are an integral part of these unaudited interim condensed consolidated financial statements.
| 6 |
| | Consolidated statements of changes in equity Six-month periods ended June 30, 2021 and 2020 (In thousands of Reais - R$) |
| Capital reserves | Equity valuation adjustments | |||||||||||||
| Capital stock | Advances for future capital increase | Treasury shares | Premium on transfer of shares | Special premium reserve of subsidiary | Share- based payments | Cash flow hedge reserve | Post-employment benefits | Cumulative adjustment of conversion into subsidiaries | Effects from changes in the equity investments | Accumulated losses | Deficit attributable to equity holders of the parent company | Non-controlling interests
| Total | |
| Balances as of December 31, 2019 | 3,008,178 | 584 | (102,543) | 17,497 | 83,229 | 124,550 | (530,043) | (41,045) | - | 759,335 | (10,996,413) | (7,676,671) | 571,254 | (7,105,417) |
| Other comprehensive income (loss), net | - | - | - | - | - | - | (1,078,349) | 27,287 | (275) | - | - | (1,051,337) | (278) | (1,051,615) |
| Net income (loss) for the period | - | - | - | - | - | - | - | - | - | (4,327,827) | (4,327,827) | 26,492 | (4,301,335) | |
| Total comprehensive income (loss) for the period | - | - | - | - | - | - | (1,078,349) | 27,287 | (275) | - | (4,327,827) | (5,379,164) | 26,214 | (5,352,950) |
| Capital increase by stock options period | 727 | (727) | - | - | - | - | - | - | - | - | - | - | - | - |
| Advance for future capital increase | - | 278 | - | - | - | - | - | - | - | - | - | 278 | - | 278 |
| Transfer of treasury shares | - | - | 40,007 | - | - | (40,007) | - | - | - | - | - | - | - | - |
| Effects of the change in interest in investment | - | - | - | - | 548 | - | - | - | - | - | (690) | (142) | - | (142) |
| Stock options | - | - | - | - | - | 10,405 | - | - | - | - | - | 10,405 | 328 | 10,733 |
| Balances as of June 30, 2020 | 3,008,905 | 135 | (62,536) | 17,497 | 83,777 | 94,948 | (1,608,392) | (13,758) | (275) | 759,335 | (15,324,930) | (13,045,294) | 597,796 | (12,447,498) |
| Balances as of December 31, 2020 | 3,009,436 | 1,180 | (62,215) | 17,497 | 83,229 | 106,520 | (1.311,076) | (26,669) | 564 | 759,812 | (16,985,370) | (14,407,092) | 640,033 | (13,767,059) |
| Other comprehensive income (loss), net | - | - | - | - | - | - | 415,782 | - | 537 | - | - | 416,319 | 271 | 416,590 |
| Net income (loss) for the period | - | - | - | - | - | - | - | - | - | - | (1,885,490) | (1,885,490) | 37,734 | (1,847,756) |
| Total comprehensive income (loss) for the period | - | - | - | - | - | - | 415,782 | - | 537 | - | (1,885,490) | (1,469,171) | 38,005 | (1,431,166) |
| Stock options | - | - | - | - | - | 8,547 | - | - | - | - | - | 8,547 | 263 | 8,810 |
| Capital increase by exercising stock option | - | 908 | - | - | - | - | - | - | - | - | - | 908 | - | 908 |
| Interim dividends distributed by the subsidiary Smiles | - | - | - | - | - | - | - | - | - | - | - | - | (236,992) | (236,992) |
| Sale of treasury shares | - | - | 867 | (279) | - | - | - | - | - | - | - | 588 | - | 588 |
| Transfer of treasury shares | - | - | 19,834 | (6,198) | - | (13,636) | - | - | - | - | - | - | - | - |
| Acquisition of interest from non-controlling shareholders | 606,839 | - | - | 744,450 | - | - | - | - | - | (909,980) | - | 441,309 | (441,309) | - |
| Redemption of preferred shares | - | - | - | (744,450) | - | - | - | - | - | - | - | (744,450) | - | (744,450) |
| Capital increase | 423,061 | - | - | - | - | - | - | - | - | - | - | 423,061 | - | 423,061 |
| Balances as of June 30, 2021 | 4,039,336 | 2,088 | (41,514) | 11,020 | 83,229 | 101,431 | (895,294) | (26,669) | 1,101 | (150,168) | (18,870,860) | (15,746,300) | - | (15,746,300) |
The accompanying notes are an integral part of these unaudited interim condensed consolidated financial statements.
| 7 |
| | Consolidated statements of cash flows Six-month periods ended June 30, 2021 and 2020 (In thousands of Reais - R$) |
| June 30, 2021 | June 30, 2020 | |
| Net income (loss) for the period | (1,847,756) | (4,301,335) |
| Adjustments to reconcile net income (loss) to net cash flows from operating activities | ||
| Depreciation - aeronautical ROU | 280,221 | 452,342 |
| Depreciation and amortization - others | 354,417 | 566,239 |
| Provision (reversal) for expected credit losses | (1,081) | 1,440 |
| Provision for legal proceedings | 154,604 | 113,569 |
| Provision for inventory obsolescence | 54 | 73 |
| Provision for losses on advance of suppliers | (4,640) | - |
| Recovery of one-off credits | (57,422) | (126,675) |
| Adjustment to present value of assets and liabilities | 36,529 | 27,443 |
| Deferred taxes | (12,984) | 10,664 |
| Share-based payments | 8,810 | 10,405 |
| Sale-leaseback gains | - | (69,946) |
| Actuarial losses from post-employment benefits | 8,707 | 6,005 |
| Foreign exchange and monetary variation, net | (398,198) | 3,439,014 |
| Interest on loans and financing and leases | 898,511 | 660,101 |
| Provision for aircraft and engine return | 157,892 | 81,227 |
| Provision for maintenance deposit and reserve | 176,363 | 75,276 |
| Result of derivatives recognized in profit or loss | 80,357 | 690,643 |
| Unrealized hedge results – Exchangeable Senior Notes | (124,954) | (409,136) |
| Change in contractual term of leases | - | - |
| Provision for labor obligations | 94,490 | 53,091 |
| Disposals of property, plant and equipment and intangible assets | 1,583 | 33,489 |
| Other provisions | (2,240) | 45,579 |
| Adjusted net income | (196,737) | 1,359,508 |
| Changes in operating assets and liabilities: | ||
| Trade receivables | 20,192 | 705,431 |
| Short-term investments | 15,987 | 121,002 |
| Inventories | (17,230) | (19,029) |
| Advance to suppliers and third parties | 116,881 | (69,469) |
| Deposits | (35,040) | (189,850) |
| Recoverable taxes | 183,304 | (3,651) |
| Variable and short-term leases | 17,794 | - |
| Suppliers | (48,721) | 215,317 |
| Suppliers – forfaiting | - | (152,162) |
| Advance from ticket sales | (51,786) | (383,879) |
| Mileage program | 43,820 | 353,313 |
| Advances from customers | 26,981 | (2,401) |
| Salaries, wages and benefits | (47,718) | (96,675) |
| Landing fees | 29,413 | (39,134) |
| Taxes obligation | 23,814 | 2,236 |
| Derivatives | 133,331 | (545,300) |
| Payments for lawsuits and aircraft return | (237,982) | (103,964) |
| Other assets and liabilities, net | 270,934 | (51,676) |
| Interest paid | (378,944) | (281,153) |
| Income tax and social contribution paid | (40,472) | (29,176) |
| Net cash flows from operating activities | (172,179) | 789,288 |
| 8 |
| | Consolidated statements of cash flows Six-month periods ended June 30, 2021 and 2020 (In thousands of Reais - R$) |
| June 30, 2021 | June 30, 2020 | |
| Short-term investments, net | 606,115 | (483,112) |
| Restricted cash | 32,522 | (529,874) |
| Advances for property, plant and equipment acquisition, net | (29,377) | (56,782) |
| Acquisition of property, plant and equipment | (104,276) | (450,142) |
| Return of advances for the acquisition of fixed assets | 11,590 | 136,962 |
| Acquisition of intangible assets | (51,877) | (32,366) |
| Net cash flows used in investing activities | 464,697 | (1,415,314) |
| Loans and financing issued, net of costs | 1,512,521 | 449,062 |
| Loans and financing payments | (572,792) | (699,748) |
| Payments of lease liabilities - aeronautical | (515,891) | (517,795) |
| Payments of lease liabilities - others | (9,007) | (10,107) |
| Receipt of derivative premium | - | 21,800 |
| Sale of treasury shares | 588 | - |
| Acquisition of interest from non-controlling shareholders | (744,450) | - |
| Dividends and interest on shareholders’ equity paid to non-controlling interests | (260,131) | (14,811) |
| Capital increase by shareholders | 423,061 | - |
| Shares to be issued | 908 | 278 |
| Net cash flows used in financing activities | (165,193) | (771,321) |
| Foreign exchange variation on cash held in foreign currencies | (29,886) | 167,814 |
| Decrease in cash and cash equivalents | 97,439 | (1,229,533) |
| Cash and cash equivalents at the beginning of the year | 662,830 | 1,645,425 |
| Cash and cash equivalents at the end of the period | 760,269 | 415,892 |
The transactions that don’t affect cash and cash equivalents are presented in Note 33 of these unaudited interim condensed consolidated financial statements.
The accompanying notes are an integral part of these unaudited interim condensed consolidated financial statements.
| 9 |
| | Notes to the unaudited interim condensed consolidated financial information statements June 30, 2021 (In thousands of Reais - R$, except when otherwise indicated) |
| 1. | Operating context |
Gol Linhas Aéreas Inteligentes S.A. (“Company” or “GOL”) is a limited liability company incorporated on March 12, 2004 under Brazilian laws. The Company’s bylaws states that the corporate purpose is exercising the equity control of GOL Linhas Aéreas S.A. (“GLA”), which explores regular and non-regular flight transportation services of passengers, cargo and mailbags, domestically or internationally; development of loyalty programs; among others.
The Company’s shares are traded on B3 S.A. - Brasil, Bolsa, Balcão (“B3”) and on the New York Stock Exchange (“NYSE”) under the ticker GOLL4 and GOL, respectively. The Company adopts B3’s Special Corporate Governance Practices Level 2 and is part of the Special Corporate Governance (“IGC”) and Special Tag Along (“ITAG”) indexes, created to distinguish companies that commit to special corporate governance practices.
The Company’s official headquarters are located at Praça Comandante Linneu Gomes, s/n, portaria 3, prédio 24, Jardim Aeroporto, São Paulo, Brazil.
| 1.1. | Measures taken by Management regarding Covid-19 and the gradual resumption of demand |
The pandemic triggered by Covid-19 continues to significantly impact the Global economic activity in fiscal year 2021. In Brazil, the recent increase in the number of cases and deaths, linked to the discovery continues to be impacted by the pandemic triggered by Covid-19, mainly due to the uncertainties related to the emergence of new variants, caused state and municipal authorities to expand restrictive measures on circulation and restrict the operation of non-essential activities. Evolution in the cases’ number and occupation in the hospital network, which directly affects the demand for air tickets in the leisure and corporate markets.
The second quarter of 2021, historically a period of low season for the airline industry, proved to be a turning point for demand recovery after a strong impact caused by the second wave of Covid-19, considering the increase in sales and search for flights on search platforms, mainly resulting from the intensification in the pace of vaccination observed in the country, which currently has an average of more than 1.5 million vaccines administered per day and more than 45% of the population having already received the first dose.
GOL's operations reflected an increase in the volume of flights of 78% from 165 daily flights operated in in the first half of April to 295 at the second half of June 2021. The daily sales volume also reflected an increase from R$7 million per day to R$17 million per day in the same period. Since the beginning of the pandemic, GOL, through the readjustment of its air network, has maintained a consistent occupancy rate at a level close to 80%. The flexible business model based on a single type of fleet is essential to keep up with reductions of more than 90% in passenger demand observed during lockdown periods and the installation of sanitary barriers.
The Company, through its Executive Committee, which is entirely formed by the management board members, works promptly to support society, monitor demand, and define financial and operational strategies.
In this second quarter of 2021, GOL also completed important initiatives to strengthen its capital structure, such as: (i) acquisition of non-controlling shareholders in Smiles; (ii) issue (retap) of an additional Senior Secured Notes of US$300 million; (iii) capital increase of R$423 million, led by the Company's controlling shareholders and with participation in the subscription by minority shareholders and; (iv) full payment of the remaining balance of its principal amortizable debt, guaranteed financing, in the amount of R$410 million in principal and interest, with the release of assets in guarantee. The completion of these operations will provide better financial flexibility for the Company and sustain its liquidity through the resumption of the volume of its operations for the second half of 2021.
| 10 |
| | Notes to the unaudited interim condensed consolidated financial information statements June 30, 2021 (In thousands of Reais - R$, except when otherwise indicated) |
In 2021, Gol maintains the initiative to transport Covid-19 vaccines for free – with GOLLOG – and health professionals who work directly in the fight against the pandemic, besides crediting 1,000 Smiles miles to each GOL segment flown at no cost. There are also active and strict protocols for aircraft hygiene and safety and health, together with actions to reduce human contact throughout the entire chain.
The Management works continuously towards people’s health and integrity, managing the cash and has enough funds to meet financial obligations in the next twelve months. However, the scenario remains challenging due to uncertainties on the pandemic, recovery of the Brazilian economy, and demand in the airline industry.
Following WHO guidelines to the letter, the Company is currently working with its ecosystem to help advance the vaccination calendar, which should lead to the resumption of economic activity, as seen in initial forecasts in countries with advanced immunization.
| 1.1.1 | Impacts on the unaudited interim condensed consolidated financial statements |
As already mentioned, the impacts caused by the pandemic were immediate and severe to the Company, with the main consequence being the reduction in the operational network, in response to the drop in demand, which can be verified by the decrease in net revenue and reduction in the Company's margins.
Like all other business organizations, the Company cannot foresee the duration of the pandemic and the extent of the continuous impacts caused by it on future business, results, and cash generation. For this reason, when preparing this quarterly information, the Management considered the most recent forecasts available, duly reflected in the Company’s business plans. In the period ended on June 30, 2021, no adjustment was needed regarding impairments on the Company’s Recoverable taxes, Deferred tax assets, Property, plant & equipment, and Intangible assets.
| 1.2. | Capital structure and net working capital |
The net working capital consolidated on June 30, 2021, is negative by R$7,948,014 (negative by R$7,152,865 on December 31, 2020). The variation is mainly due to financial investments in the amount of R$605,505, and a higher balance of leases payable totaling R$547,823, due to the liquidity management and the drop in operations from the economic crisis caused by the pandemic, partially offset by the rebalancing of debts, which resulted in a reduction of R$580,275 in the balance of short-term loans and financing. Of the negative net working capital as of June 30, 2021, R$3,279,035 refers to advances from ticket sales and the mileage program, (R$3,309,301 on December 31, 2020), which are expected to be substantially recognized with the Company’s services.
On June 30, 2021, the Company also had a deficit attributable to equity holders of the parent company of R$15,746,300 (R$14,407,092 on December 31, 2020). The variation observed is mainly due to the pandemic’s impacts on the Company’s operations, with a loss of R$1,885,490 attributable to the controlling shareholders in the six-month period ended June 30, 2021. This impact was partially offset by the capital increase promoted by the Company's shareholders in the amount of R$423,061.
| 11 |
| | Notes to the unaudited interim condensed consolidated financial information statements June 30, 2021 (In thousands of Reais - R$, except when otherwise indicated) |
The operations of the Company are sensitive to changes in the economic scenario and to the volatility of the Real, given that around 95.4% of its indebtedness (loans and financing and leases) are exposed to the U.S. dollar (“US$”) and 35.2% of its costs are also pegged to the U.S. currency, and its ability to adjust the price of fees charged from its customers to recapture the change of the US$ depends on the rational (offer) capacity and behavior of competitors.
Over the past four years, Management has taken a series of measures to adapt the size of its fleet to demand, matching the supply of seats with the level of demand, thus promoting the maintenance of high occupancy rates, reducing costs and adapting the capital structure, as well as, executing structuring initiatives of its balance sheet, largely completed in the second quarter of 2021 and that will provide better financial flexibility as of the second half of 2021.
With the outbreak of the pandemic, which led to an unprecedented economic crisis, Management reorganized the Company’s businesses. By continuously monitoring Covid-19’s impacts on economic activity, the Company works promptly to ensure business sustainability, considering the market’s management and the Company’s financial position.
In addition to the continuous monitoring of operations and sales, with a focus on economic balance, given the uncertain scenario, Management monitors possible measures to rebalance net working capital for the second half of 2021. Such measures, in case adopted, will have the purpose of optimizing the capital structure, and the definition will be based on a detailed assessment of the economic situation and perspectives of that particular moment.
Our unaudited interim condensed consolidated financial statements have been prepared on the assumption of the Company as a going concern, which includes the continuity of operations, realization of assets and compliance with liabilities and commitments in the usual course of business, in conformity with the business plan prepared by Management, reviewed and approved by the Board of Directors.
Although there is still a substantial uncertainty about how long it will take the airline industry to recover, and that leads to material uncertainty on our ability to continue as a going concern, the unaudited interim condensed consolidated financial statements as of June 30, 2021, don’t include any adjustment that may result from inability to continue operating.
| 12 |
| | Notes to the unaudited interim condensed consolidated financial information statements June 30, 2021 (In thousands of Reais - R$, except when otherwise indicated) |
| 1.3. | Corporate structure |
The corporate structure of the Company and its subsidiaries, on June 30, 2021, is shown below:
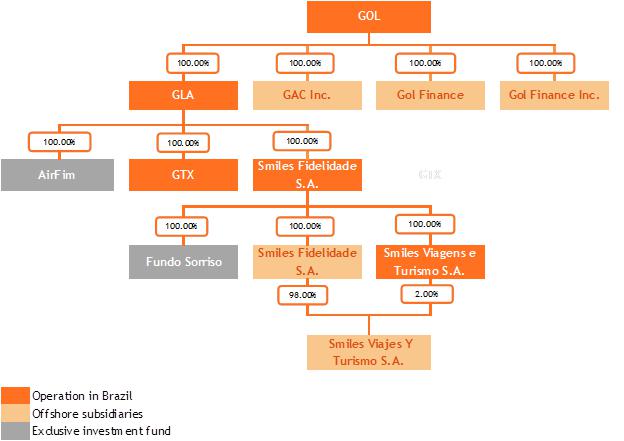
The Company’s equity interest in the capital of its subsidiaries, on June 30, 2021, is shown below:
| Entity | Date of incorporation | Location | Principal activity | Type of control | % of interest in the capital stock | |
| June 30, 2021 | December 31, 2020 | |||||
| GAC | March 23, 2006 | Cayman Islands | Aircraft acquisition | Direct | 100.00 | 100.00 |
| Gol Finance Inc. | March 16, 2006 | Cayman Islands | Fundraising | Direct | 100.00 | 100.00 |
| Gol Finance | June 21, 2013 | Luxembourg | Fundraising | Direct | 100.00 | 100.00 |
| GLA | April 9, 2007 | Brazil | Flight transportation | Direct | 100.00 | 100.00 |
| AirFim | November 7, 2003 | Brazil | Investment fund | Indirect | 100.00 | 100.00 |
| GTX | February 8, 2021 | Brazil | Equity investments | Indirect | 100.00 | - |
| Smiles Fidelidade | August 1, 2011 | Brazil | Loyalty program | Direct | 52.60 | 52.60 |
| Smiles Viagens | August 10, 2017 | Brazil | Tourism agency | Indirect | 52.60 | 52.60 |
| Smiles Fidelidade Argentina (a) | November 7, 2018 | Argentina | Loyalty program | Indirect | 52.60 | 52.60 |
| Smiles Viagens Argentina (a) | November 20, 2018 | Argentina | Tourism agency | Indirect | 52.60 | 52.60 |
| Fundo Sorriso | July 14, 2014 | Brazil | Investment fund | Indirect | 52.60 | 52.60 |
| Companies in Shareholding: | ||||||
| SCP Trip (b) | April 27, 2012 | Brazil | On-board magazine | - | - | 60.00 |
| (a) | Companies with functional currency in Argentine pesos (ARS). |
| (b) | GLA has cancelled its investment in SCP Trip in February, 2021. |
| (c) | In May, 2021, GOL transfered direct control (52.60% of the capital) of Smiles Fidelidade to its subsidiary GLA. In June, 2021, the Company completes the corporate transaction for the acquisition of minority interest, see note 1.4 |
| 13 |
| | Notes to the unaudited interim condensed consolidated financial information statements June 30, 2021 (In thousands of Reais - R$, except when otherwise indicated) |
The subsidiaries GAC Inc., GOL Finance and GOL Finance Inc. are entities incorporated with the specific purpose of continuing the financial operations and related to the Company's fleet. They do not have an independent management structure and are unable to make independent decisions. Thus, the assets and liabilities of these entities are consolidated in the parent company.
The subsidiaries Smiles Fidelidade S.A. and Smiles Viajes Y Turismo S.A., both headquartered in Buenos Aires, Argentina, incorporated and controlled by Smiles Fidelidade S.A, have the purpose to promote operations of the Smiles Program and the sale of airline tickets in that country.
The subsidiary Smiles Fidelidade also controls Smiles Viagens e Turismo S.A. (“Smiles Viagens”), whose main purpose is intermediating travel organization services, by booking or selling airline tickets, accommodation, tourism packages, among others.
The investment funds Airfim and Fundo Sorriso, controlled by GLA and Smiles Fidelidade, respectively, have the characteristic of an exclusive fund and act as an extension of the subsidiaries to carry out operations with derivatives and investments, so that the Company consolidates the assets and liabilities of this fund in its financial statements.
GTX S.A., directly controlled by GLA, is in a pre-operational stage and its corporate purpose is to manage its own assets and participate in the capital of other companies.
| 1.4. | Corporate reorganization plan |
On June 04, 2021, Smiles Fidelidade became a wholly owned subsidiary of GLA as a result of the proposed merger of shares approved by Smiles and GOL shareholders.
The merger proposal included the following steps, which were implemented concurrently and interdependently:
· incorporation of Smiles Fidelidade shares by GLA, issuing preferred shares and redeemable preferred shares of GLA to the shareholders of Smiles Fidelidade;
· incorporation of GLA’s shares by the Company, issuing preferred shares and redeemable preferred shares of the Company to GLA’s shareholders; and
· redemption of GLA’s and the Company's redeemable preferred shares, with cash payment based on the redemption of the Company's redeemable preferred shares to the shareholders of Smiles Fidelidade.
On April 28, 2021, the period for exercising the right of withdrawal expired, which was exercised on 176 preferred shares of GOL and 28,220 common shares of Smiles, whose total amount of R$299 was settled on May 12, 2021.
On May 25, 2021, the Company transferred to GLA the control of Smiles Fidelidade S.A. through a capital increase in the amount of R$350,075.
Considering the choice of Smiles' minority shareholders among the available exchange ratios, on June 04, 2021, GOL issued 22,433,975 new preferred shares, 25,707,301 class B preferred shares and 33,113,683 class C preferred shares. Classes B and C were redeemed and settled in cash on June 23, 2021 for the total amount of R$744,450.
| 14 |
| | Notes to the unaudited interim condensed consolidated financial information statements June 30, 2021 (In thousands of Reais - R$, except when otherwise indicated) |
| 1.5. | Acquisition of MAP Transportes Aéreos |
On June 08, 2021, GOL entered into an agreement to acquire MAP Transportes Aéreos Ltda. (“MAP”), a Brazilian domestic airline with flight routes to regional destinations and São Paulo´s Congonhas Airport, considering the Company's commitment to expand Brazilian demand for passenger air transport and an unparalleled market opportunity for rational consolidation in the Brazilian aviation market, as the country's economy recovers from Covid-19.
MAP will be acquired for R$28 million, to be paid upon satisfaction of all closing conditions, through 100,000 preferred shares (GOLL4) at R$28.00 per share and R$25 million in cash to be paid in twenty-four monthly installments. At closing, the Company will assume up to R$100 million in MAP's financial obligations.
The main benefits of this transaction are: (i) expansion to new routes; (ii) offering higher seat density to historically underserved markets; and (iii) enhancing cost-efficient operations.
The transaction closing is subject to approval by the National Civil Aviation Agency (ANAC) and by the Administrative Council for Economic Defense (CADE). Therefore, on June 30, 2021 there are no impacts from this transaction on the interim condensed consolidated financial information statements.
| 1.6. | Compliance program |
In December 2016 as a result of investigations involving the Company, GOL signed an agreement ("Agreement") with the Brazilian Federal Public Ministry, through which the Company agreed to pay fines and make improvements to its compliance program, in return for the commitment of the Brazilian Federal Public Ministry agreed not to file any lawsuits related to activities under the Agreement, as disclosed in the financial statements for the years ended December 31, 2017, 2018, 2019 and 2020.
The Company voluntarily informed the U.S. Department of Justice ("DOJ"), the Securities and Exchange Commission ("SEC") and the Brazilian Securities and Exchange Commission ("CVM") about the Agreement and the external and independent investigation conducted by an independent committee of the Company.
The investigation, completed in April 2017, revealed that immaterial payments were made to politically exposed people and the competent authorities were duly reported. None of the current employees, representatives or members of the Management and Board of Directors knew of any illegal purpose behind any of the transactions identified, or of any illegal benefit to the Company arising from the transactions under investigation.
The Company will keep reporting any future developments regarding this issue, as well as monitor the analyses already started by these agencies, which may impose new fines and possibly other sanctions to the Company.
Since 2016, the Company has adopted several measures to strengthen and expand its internal control and compliance, detailed in the financial statements for the years ended December 31, 2017, 2018, 2019 and 2020. In addition, Management constantly reinforces with its employees, customers and suppliers its commitment to continuous improvement in its internal control programs and compliance.
There were no further developments on the subject during the period ended June 30, 2021.
| 15 |
| | Notes to the unaudited interim condensed consolidated financial information statements June 30, 2021 (In thousands of Reais - R$, except when otherwise indicated) |
| 2. | Management’s statement, basis for preparing and presenting the unaudited interim condensed consolidated financial statements |
The Company’s unaudited interim condensed consolidated financial statements were prepared in accordance with the International Financial Reporting Standards (“IFRS”) issued by the International Accounting Standards Board (“IASB”).
The Company’s unaudited interim condensed consolidated financial statements were prepared using the Brazilian Real (“R$”) as the functional and presentation currency. Figures are expressed in thousands of Brazilian reais, except when stated otherwise. The items disclosed in foreign currencies are duly identified, when applicable.
The preparation of the Company’s unaudited interim condensed consolidated financial statements requires Management to make judgments, use estimates, and adopt assumptions affecting the stated amounts of revenues, expenses, assets, and liabilities. However, the uncertainty inherent in these judgments, assumptions, and estimates could give rise to results that require a material adjustment of the book value of certain assets and liabilities in future reporting fiscal years.
The Company is continually reviewing its judgments, estimates, and assumptions.
Management, when preparing these unaudited interim condensed consolidated financial statements, used the following disclosure criteria, considering regulatory aspects and the relevance of the transactions to understand the changes in the Company’s economic and financial position and its performance since the end of the fiscal year ended December 31, 2020, as well as the restatement of relevant information included in the annual financial statements related to the year ended December 31, 2020 disclosed on March 24, 2021.
Management confirms that all the material information in these unaudited interim condensed consolidated financial statements are being demonstrated and corresponds to the information used by Management in the development of its business management activities.
The unaudited interim condensed consolidated financial statements have been prepared based on historical cost, with the exception of the following material items recognized in the statements of financial positions:
· short-term investments classified as cash and cash equivalents measured at fair value;
· short-term investments mainly comprising exclusive investment funds, measured at fair value;
· restricted cash measured at fair value;
· derivative financial instruments measured at fair value; and
· investments accounted for using the equity method.
The Company’s unaudited interim condensed consolidated financial statements relating for the period ended on 30 June, 2021, has been prepared assuming that it will continue as a going concern, realizing assets and settling liabilities in the normal course of business, as per Note 1.2.
| 16 |
| | Notes to the unaudited interim condensed consolidated financial information statements June 30, 2021 (In thousands of Reais - R$, except when otherwise indicated) |
| 2.1. | Restatement of prior period |
As presented below, we are restating prior period as of June 30, 2020 and for the six months ended June 30, 2020, to reflect certain non-cash adjustments to our recording of sale-leaseback transactions that occurred in the six months ended June 30, 2020 but was incorrectly recorded in the three-month period ending December 31, 2020. There was no effect on the full year financial statements as of and for the year ended December 31, 2020.
The restatement of our financial statements in this report retroactively reflects these adjustments in the accounting period in which the relevant sale-leaseback transactions occurred, in the first semester of 2020.
No changes were made to the financial information as of and for the six months ended June 30, 2021 and for the years ended December 31, 2020, 2019 and 2018, as previously published.
Consolidated statements of operations
| June 30, 2020 | Adjustment | June 30, 2020 | |
| before | Restated | ||
| Restatement | |||
| Other income (expenses), net | 733,239 | (42,645) | 690,594 |
| Total operating costs and expenses | (3,377,754) | (42,645) | (3,420,399) |
| Income (loss) before financial results, exchange rate variation, net and income tax and social contribution | 127,821 | (42,645) | 85,176 |
| Loss before exchange rate variation, net and income tax and social contribution | (698,745) | (42,645) | (741,390) |
| Income (Loss) before income tax and social contribution | (4,212,173) | (42,645) | (4,254,818) |
| Income (Loss) for the period | (4,258,690) | (42,645) | (4,301,335) |
Consolidated statements of operations
| June 30, 2020 | Adjustment | June 30, 2020 | ||
| before | Restated | |||
| Restatement | ||||
| Net income (loss) for the period | (4,258,690) | (42,645) | (4,301,335) | |
| Total comprehensive income (loss) for the period | (5,310,305) | (42,645) | (5,352,950) | |
| 3. | Approval of unaudited interim condensed consolidated financial statements |
The approval and authorization for the issuance of these unaudited interim condensed consolidated financial statements took place at the Board of Directors’ meeting held on September 20, 2021.
| 17 |
| | Notes to the unaudited interim condensed consolidated financial information statements June 30, 2021 (In thousands of Reais - R$, except when otherwise indicated) |
| 4. | Summary of significant accounting practices |
The unaudited interim condensed consolidated financial statements were prepared based on policies, accounting practices and estimate calculation methods adopted and presented in detail in the annual financial statements related to the year ended December 31, 2020, issued on March 24, 2021.
| 4.1. | New accounting standards and pronouncements adopted in the period |
On March 31, 2021, IASB extended the possibility of applying the practical expedient with benefits granted to tenants in lease agreements for years beginning on or after April 1, 2021, with early adoption allowed. This change did not impact the Company’s unaudited interim condensed consolidated financial statements. Additionally, in the period ended June 30, 2021, standards or pronouncements issued in previous periods with an impact on the Company’s unaudited interim condensed consolidated financial statements did not enter into force.
| 4.2. | Transactions in foreign currency |
Foreign currency transactions are recorded at the exchange rate change prevailing on the date on which the transactions take place. Monetary assets and liabilities designated in foreign currency are calculated based on the exchange rate change on the balance sheet date. Any difference resulting from the translation of currencies is recorded under the item “Exchange rate change, net” in the statement of operations for the fiscal year.
The exchange rate changes in reais in effect on the base date of these unaudited interim condensed consolidated financial statements are as follows:
| Final Rate | Average Rate | |||
| June 30, 2021 | December 31, 2020 | June 30, 2021 | June 30, 2020 | |
| U.S. Dollar | 5.0022 | 5.1967 | 5.3842 | 5.1425 |
| Argentinian Peso | 0.0523 | 0.0617 | 0.0591 | 0.0622 |
| 5. | Seasonality |
Under normal economic and social conditions, the Company expects revenues and operating income (expense) from its flights to be at their highest levels in the summer and winter holiday periods, in January and July, respectively, and during the last weeks of December and in the year-end holiday period. Domestic demand, mainly from the corporate sector, is highly linked to the level of economic activity in Brazil (GDP). Given the high proportion of fixed costs, this seasonality tends to drive changes in operating income (expense) across the fiscal-year quarters. In the current context, considering all current unpredictability and uncertainty, the operations have shown a behavior negatively correlated with the number of cases and deaths caused by Covid-19. In other words, in the pandemic context, the recovery of the normalized behavior of demand in periods of high season will depend not only on the historical seasonality between the different months, but also on the observation of the reduction in the curve of cases and deaths.
| 6. | Cash and cash equivalents |
| June 30, 2021 | December 31, 2020 | |
| Cash and bank deposits | 75,761 | 428,812 |
| Cash equivalents | 684,508 | 234,018 |
| Total | 760,269 | 662,830 |
| 18 |
| | Notes to the unaudited interim condensed consolidated financial information statements June 30, 2021 (In thousands of Reais - R$, except when otherwise indicated) |
The breakdown of cash equivalents is as follows:
| June 30, 2021 | December 31, 2020 | |
| Local currency | ||
| Private bonds and deposits with banks | 627,338 | 170,359 |
| Automatic deposits | 57,145 | 59,936 |
| Total local currency | 684,483 | 230,295 |
| Foreign currency | ||
| Private bonds and deposits with banks | 25 | 3,723 |
| Total foreign currency | 25 | 3,723 |
| Total | 684,508 | 234,018 |
| 7. | Short-term investments |
| Weighted average rate (p.a.) | June 30, 2021 | December 31, 2020 | |
| Local currency | |||
| Government bonds | 95.2% of CDI | 168 | 22,465 |
| Investment funds | 95.4% of CDI | 22,823 | 603,698 |
| Total local currency | 22,991 | 626,163 | |
| Foreign currency | |||
| Deposits with banks | - | 2,415 | |
| Investment funds | 28.8% | 15 | 757 |
| Total foreign currency | 15 | 3,172 | |
| Total | 23,006 | 629,335 | |
| Current | 22,838 | 628,343 | |
| Non-current | 168 | 992 |
| 8. | Restricted cash |
| Weighted average rate (p.a.) | June 30, 2021 | December 31, 2020 | |
| Local currency | |||
| Import financing | 98.0% of CDI | 60,697 | 213,153 |
| Letter of guarantee - Legal proceedings | 84.7% of CDI | 55,282 | 56,440 |
| Letter of credit – Maintenance deposit | 98.1% of CDI | 156,467 | 155,184 |
| Collateral for working capital lines of credit | 99.8% of CDI | 9,711 | 52,927 |
| Total local currency | 282,157 | 477,704 | |
| Foreign currency | |||
| Collateral for financing with Ex-lm Bank | 0.2% | 30,065 | 31,206 |
| Letter of guarantee - Legal proceedings | - | 1,593 | - |
| Escrow deposits for hedge margin | - | - | 35,697 |
| Total foreign currency | 31,658 | 66,903 | |
| Total | 313,815 | 544,607 | |
| Current | 269,131 | 355,769 | |
| Non-current | 44,684 | 188,838 |
The decrease in restricted cash linked to import financing and working capital loan, in the period ended June 30, 2021, refers to using the asset to pay for debt operations to which they were linked.
| 19 |
| | Notes to the unaudited interim condensed consolidated financial information statements June 30, 2021 (In thousands of Reais - R$, except when otherwise indicated) |
| 9. | Trade receivables |
| June 30, 2021 | December 31, 2020 | |
| Local currency | ||
| Credit card administrators | 295,319 | 318,869 |
| Travel agencies | 297,523 | 266,086 |
| Cargo agencies | 28,632 | 29,902 |
| Airline partner companies | 9,118 | 8,877 |
| Other | 20,406 | 13,845 |
| Total local currency | 650,998 | 637,579 |
| Foreign currency | ||
| Credit card administrators | 52,589 | 77,616 |
| Travel agencies | 14,524 | 13,960 |
| Cargo agencies | 46 | 122 |
| Airline partner companies | 6,751 | 19,464 |
| Other | 9,466 | 9,005 |
| Total foreign currency | 83,376 | 120,167 |
| Total | 734,374 | 757,746 |
| Allowance for expected loss with trade receivables accounts | (16,966) | (18,047) |
| Total trade receivables | 717,408 | 739,699 |
The aging list of trade receivables, net of allowance for expected loss on trade receivables accounts, is as follows:
| June 30, 2021 | December 31, 2020 | |
| Not yet due | ||
| Until 30 days | 419,785 | 459,338 |
| 31 to 60 days | 104,797 | 88,893 |
| 61 to 90 days | 27,572 | 33,121 |
| 91 to 180 days | 55,038 | 54,832 |
| 181 to 360 days | 32,671 | 41,484 |
| Above 360 days | 125 | 256 |
| Total not yet due | 639,988 | 677,924 |
| Overdue | ||
| Until 30 days | 28,148 | 10,278 |
| 31 to 60 days | 5,168 | 21,677 |
| 61 to 90 days | 16,156 | 13,501 |
| 91 to 180 days | 10,117 | 11,474 |
| 181 to 360 days | 13,741 | 785 |
| Above 360 days | 4,090 | 4,060 |
| Total overdue | 77,420 | 61,775 |
| Total | 717,408 | 739,699 |
The changes in an expected loss on trade receivables are as follows:
| June 30, 2021 | December 31, 2020 | |
| Balance at the beginning of the year | (18,047) | (16,952) |
| (Additions) Exclusions | 1,081 | (1,095) |
| Balances at the end of the period | (16,966) | (18,047) |
| 20 |
| | Notes to the unaudited interim condensed consolidated financial information statements June 30, 2021 (In thousands of Reais - R$, except when otherwise indicated) |
| 10. | Inventories |
| June 30 2021 | December 31, 2020 | |
| Consumables | 20,343 | 14,533 |
| Parts and maintenance materials | 174,995 | 181,105 |
| Advance to suppliers | 17,476 | - |
| Total | 212,814 | 195,638 |
The changes in the provision for obsolescence are as follows:
| June 30, 2021 | December 31, 2020 | |
| Balances at the beginning of the year | (12,862) | (14,302) |
| Additions | (54) | (702) |
| Write-offs | 7,331 | 2,142 |
| Balances at the end of the period | (5,585) | (12,862) |
| 11. | Advance to suppliers and third parties |
| June 30, 2021 | December 31, 2020 | |
| Advance to domestic suppliers | 216,128 | 290,664 |
| Advances to international suppliers | 31,170 | 68,873 |
| Advance for materials and repairs | 48,932 | 48,933 |
| Total | 296,230 | 408,470 |
| Current | 198,813 | 318,769 |
| Non-current | 97,417 | 89,701 |
| 12. | Recoverable taxes |
| June 30, 2021 | December 31, 2020 | |
| IRPJ and CSLL prepayments | 93,249 | 109,231 |
| PIS and COFINS to recover (*) | 271,228 | 387,033 |
| Value added tax (VAT) abroad | 3,390 | 3,998 |
| Other | 11,610 | 5,097 |
| Total | 379,477 | 505,359 |
| Current | 265,357 | 186,955 |
| Non-current | 114,120 | 318,404 |
(*) During the period ended June 30, 2021, the subsidiary GLA recorded PIS and COFINS extemporaneous tax credits, in the total amount of R$57,422 (R$126,675 in the fiscal year ended December 31, 2020).
| 21 |
| | Notes to the unaudited interim condensed consolidated financial information statements June 30, 2021 (In thousands of Reais - R$, except when otherwise indicated) |
| 13. | Deferred taxes |
| 13.1. | Deferred tax assets (liabilities) |
The positions of deferred assets and liabilities are presented below and comply with the enforceable offset legal rights that consider taxes levied by the same tax authority under the same tax entity.
| December 31, 2020 | Statement of operations | Shareholders’ Equity(*) | June 30, 2021 | |
| Deferred assets | ||||
| Income tax losses carry forward | 37,921 | - | - | 37,921 |
| Negative basis of social contribution | 13,650 | - | - | 13,650 |
| Temporary differences: | ||||
| Allowance for expenses loss on trade receivables and other credits | 2,004 | 53 | - | 2,057 |
| Provision for legal proceedings and tax liabilities | (83) | (3) | - | (86) |
| Others | 71 | (5) | 164 | 230 |
| Total deferred taxes – assets | 53,563 | 45 | 164 | 53,772 |
| Deferred liabilities | ||||
| Temporary differences: | ||||
| Breakage provision | (193,498) | 892 | - | (192,606) |
| Slots | (353,226) | - | - | (353,226) |
| Depreciation of engines and parts for aircraft maintenance | (194,789) | (3,969) | - | (198,758) |
| Reversal of goodwill amortization for tax purposes | (127,659) | - | - | (127,659) |
| Derivative transactions | (28,902) | 43,490 | - | 14,588 |
| Allowance for expenses loss with trade receivables and other credits | 201,446 | (3,521) | - | 197,925 |
| Provision for legal proceedings and tax liabilities | 124,723 | 17,000 | - | 141,723 |
| Provisions for aircrafts redelivery | 190,778 | (21,390) | - | 169,388 |
| Aircraft leases and others | 10,586 | (3,797) | - | 6,789 |
| Unrealized profits | 69,843 | 6,326 | - | 76,169 |
| Others | 81,064 | (22,092) | - | 58,972 |
| Total deferred taxes – liabilities | (219,634) | 12,939 | - | (206,695) |
| Total effect of deferred taxes - income (expenses) | - | 12,984 | - | - |
(*) Exchange rate change recognized in other comprehensive income (expenses).
| 22 |
| | Notes to the unaudited interim condensed consolidated financial information statements June 30, 2021 (In thousands of Reais - R$, except when otherwise indicated) |
Management considers that the deferred assets and liabilities recognized on June 30, 2021, arising from temporary differences, will be realized in proportion to the realization of their bases and the expectation of future results.
Management estimates that deferred tax credits, recorded on tax losses and negative social contribution basis, will be realized as follows:
| Year | Amount |
| 2023 | 5,034 |
| 2024 | 12,183 |
| 2025 | 9,981 |
| 2025 onwards | 24,373 |
| Total | 51,571 |
The direct subsidiary GLA has tax losses and negative bases of social contribution in the determination of taxable profit, to be offset against 30% of future annual tax profits, with no prescription period, not recorded in the balance sheet, in the following amounts:
| GLA | ||
| June 30, 2021 | December 31, 2020 | |
| Acumulated income tax losses | 9,587,143 | 8,401,388 |
| Negative basis of social contribution | 9,587,143 | 8,401,388 |
| Potential tax credit | 3,259,629 | 2,856,472 |
The reconciliation of tax expenses and calculation of the loss before income tax and social contribution by the nominal tax rate for six-month periods ended June 30, 2021 and 2020 is as follows:
| June 30, 2021 | June 30, 2020 | |
| Loss before income tax and social contribution | (1,815,152) | (4,254,818) |
| Combined tax rate | 34% | 34% |
| Income at the statutory tax rate | 617,152 | 1,446,638 |
| Adjustments to calculate the effective tax rate: | ||
| Tax rate difference on results of offshore subsidiaries | (75,102) | 65,190 |
| Non-deductible expenses, net | (68,689) | 4,999 |
| Exchange rate change on foreign investments | 31,862 | (178,954) |
| Benefit constituted (not constituted) on tax loss, negative basis and temporary differences | (537,827) | (1,384,390) |
| Total income taxes | (32,604) | (46,517) |
| Income tax and social contribution | ||
| Current | (45,588) | (35,853) |
| Deferred | 12,984 | (10,664) |
| Total income (loss) taxes | (32,604) | (46,517) |
| 14. | Deposits |
| June 30, 2021 | December 31, 2020 | |
| Court deposits | 958,601 | 1,032,418 |
| Maintenance deposits | 601,808 | 667,565 |
| Deposits in guarantee for leases agreements | 295,719 | 358,472 |
| Total | 1,856,128 | 2,058,455 |
| 23 |
| | Notes to the unaudited interim condensed consolidated financial information statements June 30, 2021 (In thousands of Reais - R$, except when otherwise indicated) |
| 14.1. | Court deposits |
Court deposits and blocks represent guarantees of tax, civil and labor lawsuits, kept in court until the resolution of the disputes to which they are related. Part of the court deposits refers to civil and labor lawsuits arising from succession requests in lawsuits filed against Varig S.A. or also labor lawsuits filed by employees who do not belong to GLA or any related party. Considering that Management does not believe that the Company is legally responsible for such claims, the release of the court deposits has been claimed.
| 14.2. | Maintenance deposits |
The Company makes deposits in U.S. dollars for the maintenance of aircraft and engines, which will be used in future events as established in certain lease agreements.
Maintenance deposits do not exempt the Company, as a lessee, from contractual obligations related to the maintenance or the risk associated with operating activities. These deposits can be replaced by bank guarantees or letters of credit (SBLC - stand by letter of credit) according to the conditions established in the aircraft lease. The Company has the right to choose to carry out the maintenance internally or through its suppliers.
The Company has two categories of maintenance deposits:
· Maintenance guarantee: refers to one-time deposits that are refunded at the end of the lease, and can also be used in maintenance events, depending on negotiations with lessors. The balance of these deposits on June 30, 2021 was R$248,316 (R$273,311 on December 31, 2020).
· Maintenance reserve: refers to amounts paid monthly based on the use of components and can be used in maintenance events as set by an agreement. On June 30, 2021, the balance referring to such reserves was R$710,285 (R$759,108 on December 31, 2020).
| 14.3. | Deposits in guarantee for leases agreements |
As required by the lease agreements, the Company makes guarantee deposits (in U.S. dollars) to the leasing companies, which can be redeemed if replaced by other bank guarantees or fully redeemed at maturity.
| 24 |
| | Notes to the unaudited interim condensed consolidated financial information statements June 30, 2021 (In thousands of Reais - R$, except when otherwise indicated) |
| 15. | Property, plant and equipment |
The breakdown of and changes in property, plant and equipment are as follows:
| December 31, 2020 | June 30, 2021 | ||||||||||
| Weighted average rate (p.a.) | Historical cost | Accumulated depreciation | Net opening balance | Additions | Contractual amendments | Depreciation | Write-off | Net ending balance | Historical cost | Accumulated depreciation | |
| Flight equipment | |||||||||||
| Aircraft – ROU (1) with no purchase option | 20.29% | 4,020,709 | (1,420,648) | 2,600,061 | 428,632 | 47,417 | (271,624) | - | 2,804,486 | 4,455,675 | (1,651,189) |
| Spare parts and engines - Own (4) (5) | 6.95% | 1,964,411 | (837,048) | 1,127,363 | 23,010 | - | (66,182) | (1,323) | 1,082,868 | 1,983,222 | (900,354) |
| Spare parts and engines – ROU | 33.55% | 84,329 | (47,940) | 36,389 | 2,026 | - | (8,597) | - | 29,818 | 82,717 | (52,899) |
| Aircraft and engine improvements | 46.78% | 3,206,385 | (2,282,042) | 924,343 | 90,613 | - | (227,918) | - | 787,038 | 3,157,822 | (2,370,784) |
| Tools | 10.00% | 55,821 | (28,697) | 27,124 | 404 | - | (1,965) | (11) | 25,552 | 56,196 | (30,644) |
| 9,331,655 | (4,616,375) | 4,715,280 | 544,685 | 47,417 | (576,286) | (1,334) | 4,729,762 | 9,735,632 | (5,005,870) | ||
| Property, plant and equipment in use | |||||||||||
| Vehicles | 20.00% | 11,264 | (9,572) | 1,692 | 377 | - | (285) | - | 1,784 | 11,641 | (9,857) |
| Machinery and equipment | 10.00% | 62,841 | (48,417) | 14,424 | 40 | - | (1,441) | - | 13,023 | 62,862 | (49,839) |
| Furniture and fixtures | 10.00% | 32,790 | (20,483) | 12,307 | 24 | - | (996) | (44) | 11,291 | 32,502 | (21,211) |
| Computers and peripherals – Own | 20.00% | 47,487 | (35,837) | 11,650 | 99 | - | (1,860) | (5) | 9,884 | 47,219 | (37,335) |
| Computers and peripherals – ROU | 26.58% | 21,992 | (15,460) | 6,532 | - | - | (3,052) | - | 3,480 | 21,992 | (18,512) |
| Communication equipment | 10.00% | 2,233 | (1,871) | 362 | 5 | - | (55) | (8) | 304 | 2,216 | (1,912) |
| Security equipment | 10.00% | 55 | (32) | 23 | - | - | (2) | - | 21 | 55 | (34) |
| Third-party property improvements – CMA (3) | 12.05% | 107,637 | (107,637) | - | - | - | - | - | - | 107,637 | (107,637) |
| Third-party property improvements | 20.31% | 75,714 | (49,328) | 26,386 | 25 | - | (4,959) | - | 21,452 | 75,725 | (54,273) |
| Third-party property – ROU | 33.96% | 27,867 | (15,834) | 12,033 | - | 32 | (4,337) | - | 7,728 | 27,899 | (20,171) |
| Construction in progress | 14,837 | - | 14,837 | 5 | - | - | (170) | 14,672 | 14,672 | - | |
| 404,717 | (304,471) | 100,246 | 575 | 32 | (16,987) | (227) | 83,639 | 404,420 | (320,781) | ||
| Impairment losses (2) | - | (34,330) | - | (34,330) | 3,699 | - | - | - | (30,631) | (30,631) | - |
| Total | 9,702,042 | (4,920,846) | 4,781,196 | 548,959 | 47,449 | (593,273) | (1,561) | 4,782,770 | 10,109,421 | (5,326,651) | |
| Advances to suppliers | - | 179,092 | - | 179,092 | 29,377 | - | - | (11,590) | 196,879 | 196,879 | - |
| Total Property, plant and equipment | 9,881,134 | (4,920,846) | 4,960,288 | 578,336 | 47,449 | (593,273) | (13,151) | 4,979,649 | 10,306,300 | (5,326,651) | |
(1) ROU - Right of Use
(2) Refers to provisions for impairment losses for rotable items (spare parts), classified under “Parts and spare engines", recorded by the Company in order to present its assets according to the actual capacity for the generation of expected future benefits.
(3) CMA - Maintenance Center - Confins/MG
(4) As of June 30, 2021, the balance of spare parts is granted as a guarantee to Secured Notes 2026, according to Note 17.
(5) As of June 30, 2021, 19 engines of the Company are granted as a guarantee to the Spare Engine Facility and the Loan Facility, according to Note 17.
| 25 |
| | Notes to the unaudited interim condensed consolidated financial information statements June 30, 2021 (In thousands of Reais - R$, except when otherwise indicated) |
| 16. | Intangible assets |
The breakdown of and changes in intangible assets are as follows:
| December 31, 2020 | June 30, 2021 | |||||||||
| Weighted average rate (p.a.) | Historical cost | Accumulated amortization | Net opening balance | Additions | Write-off | Amortization | Net ending balance | Historical cost | Accumulated amortization | |
| Cost | ||||||||||
| Goodwill | - | 542,302 | - | 542,302 | - | - | - | 542,302 | 542,302 | - |
| Slots | - | 1,038,900 | - | 1,038,900 | - | - | - | 1,038,900 | 1,038,900 | - |
| Software | 25.73% | 507,734 | (345,661) | 162,073 | 51,877 | (22) | (40,365) | 173,563 | 496,829 | (323,266) |
| Others | 20.00% | 10,000 | (6,167) | 3,833 | - | - | (1,000) | 2,833 | 10,000 | (7,167) |
| Total | 2,098,936 | (351,828) | 1,747,108 | 51,877 | (22) | (41,365) | 1,757,598 | 2,088,031 | (330,433) | |
The balances of goodwill and airport operating rights (slots) were tested for impairment on December 31, 2020 through the discounted cash flow for each cash-generating unit, giving rise to the value in use. The results obtained were compared with the carrying amount of each cash-generating unit and, as a result, the Company did not recognize impairment losses on its CGUs.
In order to assess the recoverable value, assets are grouped at the lowest levels for which there are separately identifiable cash flows (Cash-Generating Units – “CGUs”). In order to determine the carrying amount of each cash-generating unit, the Company considers the intangible assets recorded and all necessary tangible assets to conduct the business, given that it will only generate economic benefits by using the combination of both.
| 26 |
| | Notes to the unaudited interim condensed consolidated financial information statements June 30, 2021 (In thousands of Reais - R$, except when otherwise indicated) |
| 17. | Loans and financing |
The breakdown of and changes in short and long-term loans and financing are as follows:
| December 31, 2020 | June 30, 2021 | ||||||||||||||
| Maturity | Interest rate p.a. | Current | Non-current | Total | Funding | Unrealized gain (loss) from ESN | Payments | Interest incurred | Interest paid | Exchange rate change | Amortization of cost and premium | Total | Current | Non-current | |
| Em R$: | |||||||||||||||
| Debentures | 03/2022 | 8.32% (3) | 440,918 | 146,170 | 587,088 | - | - | - | 16,064 | (18,149) | - | 2,799 | 587,802 | 587,802 | - |
| Working Capital | 10/2025 | 9.04% | 239,615 | 17,275 | 256,890 | - | - | (64,671) | 9,422 | (10,381) | - | - | 191,260 | 177,881 | 13,379 |
| Em US$: | |||||||||||||||
| Secured funding | 06/2021 | 9.50% | 484,113 | - | 484,113 | - | - | (499,663) | 17,000 | (17,745) | 16,295 | - | - | - | - |
| Import financing | 01/2022 | 4.79% | 783,659 | - | 783,659 | - | - | (152,258) | 15,717 | (18,873) | (14,238) | - | 614,007 | 614,007 | - |
| Financing with Ex-lm Bank collateral | 12/2022 | 2.77% | 194,786 | 49,958 | 244,744 | - | - | (51,403) | 1,255 | (1,360) | (7,839) | 2,905 | 188,302 | 164,295 | 24,007 |
| ESN 2024 (1) | 07/2024 | 3.75% | 37,960 | 1,896,854 | 1,934,814 | - | (124,954) | - | 98,139 | (43,636) | (78,149) | (15) | 1,786,199 | 36,540 | 1,749,659 |
| Spare engine facility | 09/2024 | 2.44% | 22,771 | 197,009 | 219,780 | - | - | - | 2,811 | (1,524) | (8,262) | 141 | 212,946 | 34,349 | 178,597 |
| Senior notes 2025 | 01/2025 | 7.00% | 98,521 | 3,340,316 | 3,438,837 | - | - | - | 122,502 | (124,577) | (128,037) | 4,596 | 3,313,321 | 94,833 | 3,218,488 |
| Senior secured notes 2026 | 06/2026 | 8.00% | 1,848 | 953,802 | 955,650 | 1,501,569 | - | 108,332 | (103,935) | (114,145) | 9,972 | 2,357,443 | - | 2,357,443 | |
| Loan facility | 03/2028 | 4.15% | 32,566 | 233,135 | 265,701 | - | - | (3,067) | 5,468 | (2,419) | (8,829) | 128 | 256,982 | 47,392 | 209,590 |
| Perpetual bonds (2) | - | 8.75% | 16,522 | 789,168 | 805,690 | 10,952 | - | - | 36,213 | (36,345) | (30,762) | - | 785,748 | 15,905 | 769,843 |
| Total | 2,353,279 | 7,623,687 | 9,976,966 | 1,512,521 | (124,954) | (771,062) | 432,923 | (378,944) | (373,966) | 20,526 | 10,294,010 | 1,773,004 | 8,521,006 | ||
(1) Exchangeable Senior Notes see Note 32.2.
(2) On December 31, 2020 It includes the elimination of related parties, considering securities of this issue, carried out by Gol Finance, held by GLA, totaling R$10,609. These securities were resold in the period ended June 30, 2021, therefore there is no elimination on this date.
(3) These securities are divided into three series: Series 1 with a CDI rate of 120%; Series 2 with CDI rate + 5.40% p.a. and Series 3 with CDI rate + 4.90% p.a..
| 27 |
| | Notes to the unaudited interim condensed consolidated financial information statements June 30, 2021 (In thousands of Reais - R$, except when otherwise indicated) |
The consolidated loans and financing includes fundraising and premiums costs of R$220,626 e R$230,763, respectively, on June 30, 2021 (R$ R$173,086 e R$189,195 on December 31, 2020), which are amortized over the term of the related debt. It also includes amortizable premium and fair value of the derivative financial instrument, both referring to ESN, totaling R$36,228 e R$205,838, respectively, on June 30, 2021 (R$42,226 and R$346,030 on December 31, 2020).
| 17.1. | New loans and financing contracted and renegotiated during the period ended June 30, 2021 |
The renegotiations detailed below were evaluated under IFRS 9 - “Financial Instruments” and did not meet the definitions to derecognize the liabilities (with the original financial liability extinguished and a new financial liability recognized).
| 17.1.1. | Debentures |
On March 26, 2021, the Annual Debenture Holders' Meeting decided to postpone the payment of series 3 with maturity on March 28, 2021, to April 7, 2021, totaling R$147,913, and suspend the early maturity of the installment of series 1, also maturing on March 28, 2021, and also totaling R$147,920.
On April 6, 2021, at the General Meeting of Debenture Holders, it was decided to postpone the payment of series 3 maturing on April 07, 2021 to May 12, 2021, in the amount of R$295,833 with new remuneration of CDI + 4.90 % a.a.
On May 11, 2021, at the General Meeting of Debenture Holders, the payment of series 3 maturing on May 12, 2021 was again postponed to June 26, 2021.
On June 25, 2021, the General Meeting of Debenture Holders resolved to postpone the payment of series 3 maturing on June 26, 2021 to August 10, 2021.
| 17.1.2. | Working capital – Lines of credit |
During the period ended June 30, 2021, the Company, through its subsidiary GLA, renegotiated the due dates of this type of agreement, placing promissory notes as collateral for the transactions. These transactions have as purpose maintaining and managing the company's working capital, and the main change was the maturity date and interest rate, as disclosed in the previous table.
| 17.1.3. | Import financing |
During the period ended June 30, 2021, the Company, through its subsidiary GLA, raised funds and renegotiated the due dates of this type of agreement, impacting the interest rate, disclosed in table above, and keeping promissory notes as collateral for the transactions, which are part of a credit line maintained by GLA for engine maintenance, import financing in order to purchase spare parts and aircraft equipment.
| 28 |
| | Notes to the unaudited interim condensed consolidated financial information statements June 30, 2021 (In thousands of Reais - R$, except when otherwise indicated) |
| 17.1.4. | Senior Secured Notes 2026 |
In May 2021, the Company raised Senior Secured Notes, as part of an additional issuance and consolidated of the Senior Secured Notes issued in December 2020, bearing interest of 8.00% p.a. and maturity in June 2026.
| Operation date | Principal | Costs | Interest rate (p.a.) | Date - Maturity | ||
| (US$ thousands) | (R$ thousands) | (US$ thousands) | (R$ thousands) | |||
| May 11, 2021 | 300,000 | 1,569,660 | 13,019 | 68,091 | 8.00% | June 30, 2026 |
| 17.2. | Loans and financing – Non-current |
On June 30, 2021, the maturities of loans and financing recorded in non-current liabilities were as follows:
| 2022 | 2023 | 2024 | 2025 | 2025 onwards | Without maturity date | Total | |
| In R$: | |||||||
| Working capital – Lines of credit | 4,152 | 4,644 | 2,500 | 2,083 | - | - | 13,379 |
| In US$: | |||||||
| Financing with Ex-lm Bank collateral | 24,007 | - | - | - | - | - | 24,007 |
| Spare engine facility | - | - | 1,749,659 | - | - | - | 1,749,659 |
| ESN 2024 | 11,149 | 22,299 | 145,149 | - | - | - | 178,597 |
| Senior notes 2025 | - | - | - | 3,218,488 | - | - | 3,218,488 |
| Senior secured notes 2026 | - | - | - | - | 2,357,443 | - | 2,357,443 |
| Loan facility | 15,044 | 30,948 | 31,991 | 33,113 | 98,494 | - | 209,590 |
| Perpetual bonds | - | - | - | - | - | 769,843 | 769,843 |
| Total | 54,352 | 57,891 | 1,929,299 | 3,253,684 | 2,455,937 | 769,843 | 8,521,006 |
The fair value of loans and financing as of June 30, 2021, is as follows:
| Book value (*) | Fair value | |
| Debentures | 587,802 | 591,666 |
| ESN 2024 | 1,786,199 | 1,976,859 |
| Senior Notes 2025 | 3,313,321 | 3,232,496 |
| Senior Secured Notes 2026 | 2,357,443 | 2,545,269 |
| Perpetual bonds | 785,748 | 689,834 |
| Other loans and financing | 1,463,497 | 1,463,497 |
| Total | 10,294,010 | 10,499,621 |
(*) Total net of funding costs.
| 17.3. | Covenants |
The Company has financial covenants in Debentures, which obligation to measure such indicators is semiannual. A waiver was granted by Debenture Holders regarding the non-compliance with the financial rates and limits set.
| 29 |
| | Notes to the unaudited interim condensed consolidated financial information statements June 30, 2021 (In thousands of Reais - R$, except when otherwise indicated) |
| 18. | Leases |
On June 30, 2021, the balance of leases payable includes: (i) R$31,249 relating to variable payments, not included in the measurement of liabilities, and short-term leases (R$16,252 on December 31, 2020), which fall under the exemption provided for in IFRS 16; and (ii) R$7,664,680 referring to the present value on this date of future lease payments (R$7,567,940 on December 31, 2020).
The breakdown and changes in the present value of future lease payments are shown below:
| December 31, 2020 | June 30,2021 | ||||||||||||
| Weighted average rate (p.a.) | Current | Non-current | Total | Additions | Contractual amendment | Payments | Deposit in guarantee | Interest incurred | Exchange rate change | Total | Current | Not Current | |
| In R$: | |||||||||||||
| Leases without purchase option | 13.13% | 32,530 | 14,985 | 47,515 | - | 32 | (9,007) | - | 3,214 | - | 41,754 | 31,096 | 10,658 |
| Total | 32,530 | 14,985 | 47,515 | - | 32 | (9,007) | - | 3,214 | - | 41,754 | 31,096 | 10,658 | |
| In US$: | |||||||||||||
| Leases without purchase option | 11.97% | 1,268,226 | 6,252,199 | 7,520,425 | 430,658 | 47,417 | (515,891) | (5,329) | 441,848 | (296,202) | 7,622,926 | 1,802,486 | 5,820,440 |
| Total | 1,268,226 | 6,252,199 | 7,520,425 | 430,658 | 47,417 | (515,891) | (5,329) | 441,848 | (296,202) | 7,622,926 | 1,802,486 | 5,820,440 | |
| Total Leases | 1,300,756 | 6,267,184 | 7,567,940 | 430,658 | 47,449 | (524,898) | (5,329) | 445,062 | (296,202) | 7,664,680 | 1,833,582 | 5,831,098 | |
In the six-month periods ended June 30, 2021, the Company directly recognized in the cost from services, totaling R$31,111, related to short-term leases and variable payments, on a straight-line basis.
| 30 |
| | Notes to the unaudited interim condensed consolidated financial information statements June 30, 2021 (In thousands of Reais - R$, except when otherwise indicated) |
The future payments of leases liabilities agreements are detailed as follows:
| Without purchase option | ||
| June 30, 2021 | December 31, 2020 | |
| 2021 | 1,562,699 | 2,102,771 |
| 2022 | 2,013,608 | 1,982,685 |
| 2023 | 1,670,573 | 1,642,264 |
| 2024 | 1,291,179 | 1,260,405 |
| 2025 | 1,046,907 | 1,018,896 |
| Thereafter | 3,008,085 | 2,701,509 |
| Total minimum lease payments | 10,593,051 | 10,708,530 |
| Less total interest | (2,897,122) | (3,124,338) |
| Present value of minimum lease payments | 7,695,929 | 7,584,192 |
| Less current portion | (1,864,831) | (1,317,008) |
| Non-current portion | 5,831,098 | 6,267,184 |
| 18.1. | Sale-leaseback transactions |
During the six-month period ended June 30, 2021, the Company did not carry out sale-leaseback transactions. In the six-month period ended June 30, 2020 the Company recognized a net gain of R$551,942 from the sale-leaseback transactions of 11 aircraft, recorded in the statement of operations in the group of “Other income (expenses), net”.
| 19. | Suppliers |
| June 30, 2021 | December 31, 2020 | |
| Local currency | 1,165,214 | 1,164,193 |
| Foreign currency | 407,966 | 481,001 |
| Total | 1,573,180 | 1,645,194 |
| Current | 1,562,946 | 1,612,536 |
| Non-current | 10,234 | 32,658 |
| 20. | Taxes payable |
| June 30, 2021 | December 31, 2020 | |
| PIS and COFINS | 23,935 | 23,647 |
| Installment payments - PRT and PERT | 37,375 | 41,641 |
| Withholding income tax on salaries | 17,550 | 33,011 |
| ICMS | 251 | 472 |
| IRPJ and CSLL payable | 3,847 | 13 |
| Other | 6,360 | 7,192 |
| Total | 89,318 | 105,976 |
| Current | 61,279 | 73,614 |
| Non-current | 28,039 | 32,362 |
| 21. | Advance ticket sales |
On June 30, 2021, the balance of advance ticket sales classified in current liabilities was R$1,999,013 (R$2,050,799 on December 31, 2020) and is represented by 5,941,658 tickets sold and not yet used (6,691,911 on December 31, 2020) with an average use of 120 days (102 days on December 31, 2020).
Balances of advance ticket sales are shown net of breakage corresponding to R$274,197 on June 30, 2021 (R$299,188 on December 31, 2020).
| 31 |
| | Notes to the unaudited interim condensed consolidated financial information statements June 30, 2021 (In thousands of Reais - R$, except when otherwise indicated) |
On June 30, 2021, the Company has reimbursements to pay related to non-performed transports in the amount of R$326,978 (R$253,963 on December 31, 2020), recorded as Other liabilities in current liabilities.
| 22. | Mileage program |
| June 30, 2021 | December 31, 2020 | |
| Mileage program | 2,187,188 | 2,145,097 |
| Others | 5,496 | 5,817 |
| Breakage | (567,902) | (569,952) |
| Total | 1,624,782 | 1,580,962 |
| Current | 1,280,022 | 1,258,502 |
| Non-current | 344,760 | 322,460 |
Breakage consists of estimating miles that have a high potential to expire due to their expected non-use. IFRS 15 – “Revenue from Contract with Customers”, provides for the recognition of revenue by the estimate (breakage) over the contractual period, therefore, before the redemption of miles, given that this is not expected before expiration.
| 23. | Provisions |
| Post-employment benefits | Aircraft and engine return | Legal proceedings (a) | Total | |
| Balances on December 31, 2020 | 99,549 | 1,030,915 | 392,432 | 1,522,896 |
| Recognition (reversal) of provision | 8,707 | 168,218 | 154,604 | 331,529 |
| Provisions used | - | (134,813) | (103,169) | (237,982) |
| Adjustment to present value | - | 36,529 | - | 36,529 |
| Exchange rate change | - | (37,335) | 397 | (36,938) |
| Balances on June 30, 2021 | 108,256 | 1,063,514 | 444,264 | 1,616,034 |
| On June 30, 2021 | ||||
| Current | - | 252,046 | - | 252,046 |
| Non-current | 108,256 | 811,468 | 444,264 | 1,363,988 |
| Total | 108,256 | 1,063,514 | 444,264 | 1,616,034 |
| On December 31, 2020 | ||||
| Current | - | 169,381 | - | 169,381 |
| Non-current | 99,549 | 861,534 | 392,432 | 1,353,515 |
| Total | 99,549 | 1,030,915 | 392,432 | 1,522,896 |
| (a) | The provisions used consider write-offs due to the revaluation of estimates and settled processes. |
| 23.1. | Provisions for post-employment benefits |
The Company offers to its employees health care plans that, due to complying with current laws, generate obligations with post-employment benefits.
The actuarial assumptions applied when measuring the post-employment benefit remain the same as those disclosed in the annual financial statements related to the year ended December 31, 2020.
| June 30, 2021 | |
| Current service cost recognized in income (expenses) | 4,785 |
| Cost of interests recognized in income (expenses) | 3,922 |
| Total | 8,707 |
| 32 |
| | Notes to the unaudited interim condensed consolidated financial information statements June 30, 2021 (In thousands of Reais - R$, except when otherwise indicated) |
| 23.2. | Provision for aircraft and engine return |
Such provision considers the costs that meet the contractual conditions for the return of engines maintained under operating leases, as well as the costs to reconfigure aircraft when returned as described in the return conditions of the lease agreements. The initial recognition is capitalized against property, plant and equipment, under the item "Aircraft and engine improvements".
| 23.3. | Provision for legal proceedings |
The Company and its subsidiaries are involved in certain legal matters arising from the regular course of their business, which include civil, administrative, tax, social security, and labor lawsuits.
The Company classifies the risk of loss in legal proceedings as probable, possible, or remote. The provision recorded in relation to such lawsuits is set by the Company's Management, based on the analysis of its legal counsel, and reasonably reflects the estimated probable losses.
If the Company has lawsuits whose values are not known or reasonably estimated, but the likelihood of loss is probable, these will not be recorded, but their nature will be disclosed.
The Company's Management believes that the provision for tax, civil and labor risks, recorded in accordance with IAS 37, is sufficient to cover possible losses on administrative and judicial proceedings, as shown below:
| Probable loss | Possible loss | |||
| June 30, 2021 | December 31, 2020 | June 30, 2021 | December 31, 2020 | |
| Civil | 96,511 | 100,806 | 70,286 | 64,181 |
| Labor | 322,976 | 269,297 | 213,832 | 238,702 |
| Tax | 24,777 | 22,329 | 613,357 | 574,356 |
| Total | 444,264 | 392,432 | 897,475 | 877,239 |
Details about the relevant lawsuits were disclosed in the annual financial statements related to the year ended December 31, 2020. In the period ended on June 30, 2021, there were no changes regarding new proceedings or reclassification of the relevant risk of loss.
| 24. | Shareholders’ equity |
| 24.1. | Capital stock |
On June 4, 2021, the Company's Board of Directors deliberated the increase of capital stock in the amount of R$606,839, as a result of the corporate reorganization for the merger of Smiles, with the issuance, by the Company, of 22,433,975 new preferred shares, 25,707,301 class B preferred shares and 33,113,683 class C preferred shares, with class B and C shares redeemed in the June’s month, within the scope of the approved merger proposal.
On June 15, 2021, the Directors’ Board ratified the capital increase, in the amount of R$423,061 with the issuance of 171,136,137 common shares and 12,581,185 preferred shares. In this same act, the 171,136,137 common shares were converted into 4,889,603 preferred shares issued by the Company, at the ratio of 35 common shares to 1 preferred share.
| 33 |
| | Notes to the unaudited interim condensed consolidated financial information statements June 30, 2021 (In thousands of Reais - R$, except when otherwise indicated) |
On June 30, 2021, the capital stock amount was R$4,039,336, represented by 3,177,611,730 shares, of which 2,863,682,710 common shares and 313,929,020 preferred shares (R$3,009,436, represented by 3,137,706,967 shares, of which 2,863,682,710 common shares and 274,024,257 preferred shares on December 31, 2020). The capital stock is reduced of share issuing costs in the amount of R$155,618 on June 30, 2021 and December 31, 2020.
The Company’s shares are held as follows:
| June 30, 2021 | December 31, 2020 | |||||
| Common shares | Preferred shares | Total | Common shares | Preferred shares | Total | |
| Fundo Volluto (2) | 100.00% | - | 20.67% | 100.00% | - | 22.99% |
| Mobi FIA (2) | - | 32.85% | 26.06% | - | 37.57% | 28.93% |
| Path Ltd. (2) | - | 3.46% | 2.74% | - | - | - |
| Capital International | - | 5.07% | 4.02% | - | - | - |
| AirFrance - KLM | - | 1.35% | 1.07% | - | 1.55% | 1.19% |
| Others | - | 1.54% | 1.22% | - | 1.91% | 1.47% |
| Market | - | 55.73% | 44.20% | - | 58.97% | 45.41% |
| Total | 100.00% | 100.00% | 100.00% | 100.00% | 100.00% | 100.00% |
(1) In the context of Exchangeable senior notes 2024, issued in 2019, as a result of transactions related to the ADS lending facility, Bank of America Corporation acquired 33,863,549 preferred shares, representing 10.8% of total preferred shares on June 30, 2021.
(2) Refers to legal entities controlled by the controlling shareholders (Constantino family).
The authorized share capital on June 30, 2021 and December 31, 2020 is R$6 billions. Within the authorized limit, the Company can, once approved by the Board of Directors, increase its capital regardless of any amendment to its by-laws, by issuing shares, without necessarily maintaining the proportion between the different types of shares. Under the law terms, in case of capital increase within the authorized limit, the Board of Directors will determine the issuance conditions, including pricing and payment terms.
| 24.2. | Treasury shares |
On June 30, 2021, the Company had 1,217,285 treasury shares, totaling R$41,514 (1,824,034 shares totaling R$62,215 on December 31, 2020). On June 30, 2021, the closing market price for treasury shares was R$22.96 (R$24.94 on December 31, 2020).
| 24.3. | Interim dividends – Non-controlling shareholders |
On March 25, 2021, the Smiles Fidelidade’s Board of Directors decided to distribute interim dividends in the amount of R$500,000, of which R$236,992 were allocated to minority shareholders and fully paid on April 16, 2021.
| 34 |
| | Notes to the unaudited interim condensed consolidated financial information statements June 30, 2021 (In thousands of Reais - R$, except when otherwise indicated) |
| 25. | Income (Loss) per share |
The Company's income (loss) per share was determined as follows:
| June 30, 2021 | June 30, 2020 | |||||
| Common shares | Preferred shares | Total | Common shares | Preferred shares | Total | |
| Numerator | ||||||
| Loss for the period attributed to controlling shareholders | (427,886) | (1,457,604) | (1,885,490) | (995,528) | (3,332,299) | (4,327,827) |
| Denominator | ||||||
| Weighted average number of outstanding shares (in thousands) | 2,863,683 | 277,503 | 2,863,683 | 273,872 | ||
| Adjusted weighted average number of outstanding shares and diluted presumed conversions (in thousands) | 2,863,683 | 277,503 | 2,863,683 | 273,872 | ||
| In Brazilian Real (R$) | ||||||
| Basic earnings (loss) per share | (0.149) | (5.253) | (0.348) | (12.167) | ||
| Diluted earnings (loss) per share | (0.149) | (5.253) | (0.348) | (12.167) | ||
| 26. | Share-based payments |
The conditions of the stock option and restricted share plans granted to the Company’s Executive Officers were disclosed in detail in the annual financial statements related to the year ended December 31, 2020, and did not change during the period ended on June 30, 2021.
| 26.1. | Stock option plan - GOL |
The movement of the stock options outstanding for in the six-month period ended June 30, 2021, is as follows:
| Number of stock options | Weighted average exercise price | |
| Outstanding options on December 31, 2020 | 7,529,612 | 11.59 |
| Options exercised | (111,557) | 3.99 |
| Options canceled and adjustments in estimated prescribed rights | 57,664 | 15.36 |
| Outstanding options on June 30, 2021 | 7,475,719 | 11.66 |
| Number of options exercisable on: | ||
| December 31, 2020 | 5,752,726 | 10.32 |
| June 30, 2021 | 6,011,535 | 10.74 |
The expenses recognized in the statement of operations for the period corresponding to the stock option plan in the six-month periods ended June 30, 2021, were R$4,626, respectively (R$5,694 in the six-month periods ended June 30, 2020).
| 35 |
| | Notes to the unaudited interim condensed consolidated financial information statements June 30, 2021 (In thousands of Reais - R$, except when otherwise indicated) |
| 26.2. | Restricted share plan - GOL |
| Restricted shares | |
| Restricted shares transferable on December 31, 2020 | 1,203,483 |
| Transferred shares (*) | (595,976) |
| Canceled shares and adjustments to the estimate of expired rights | 82,662 |
| Transferable Restricted Shares on June 30, 2021 | 690,169 |
(*) During the period ended June 30, 2021, the Company transferred 581,499 shares via equity instruments (treasury shares) and the amount of R$397 was paid in cash equivalent to 14,477 shares.
The expense recognized in the statement of operations for the period corresponding to the restricted share plans in the six-month periods ended June 30, 2021, were R$3,518 (R$4,083 in the six-month periods ended June 30, 2020).
| 26.3. | Stock option plan – Smiles Fidelidade |
There were no changes to options outstanding in the period ended June 30, 2021. On this date, the average exercise price, adjusted for earnings distributions, is R$41.36 (R$48.42 on December 31, 2020).
During the six-month periods ended June 30, 2021, the Company recorded R$666, in equity related to share-based compensation with a corresponding entry in the statement of operations (R$1.195 in the period ended June 30, 2020).
Additionally, referenced in the Company’s shares, executives and employees are granted a complementary cash-settled bonus, as a way of strengthening their commitment and productivity with the incomes (expenses). On June 30, 2021, the balance of this obligation totaled R$2,846 (R$1,881 on December 31, 2020) recorded under “Salaries, wages and benefits”, referenced to 135,012 equivalent Company’s shares (R$119,784 on December 31, 2020). The same amount was recorded under “Salaries, wages and benefits” in the statement of operations related to these bonuses (R$1,502 in the period ended June 30, 2020).
| 27. | Transactions with related parties |
| 27.1. | Transportation and consulting services |
In the course of its operations, the Company, by itself and through its subsidiaries, entered into agreements with the companies listed below, part of the same economic group as the Company:
· Expresso Caxiense S.A.: Provision of passenger transportation services in case of an interrupted flight, effective until March 9, 2023; and
· Viação Piracicabana Ltda.: Provision of passenger, baggage, crew, and employee transportation services between airports, effective until September 30, 2021.
On June 30, 2021, GLA recognized total expenses related to these services of R$1,601 (R$3,622 on June 30, 2020). On the same date, the balance payable to related companies, under “Suppliers”, was of R$4,965 (R$3,344 on December 31, 2020), and refers to transportation services with Viação Piracicabana Ltda and Expresso Caxiense S.A.
| 36 |
| | Notes to the unaudited interim condensed consolidated financial information statements June 30, 2021 (In thousands of Reais - R$, except when otherwise indicated) |
| 27.2. | Contracts of UATP (“Universal Air Transportation Plan”) to grant credit limit |
The subsidiary GLA entered into UATP account opening agreements with the related parties indicated below: Aller Participações S.A.; BR Mobilidade Baixada Santista S.A. SPE; Breda Transportes e Serviços S.A.; Comporte Participações S.A.; Empresa Cruz de Transportes Ltda.; Empresa de Ônibus Pássaro Marrom S.A.; Empresa Princesa do Norte S.A.; Expresso Itamarati S.A.; Expresso Maringá do Vale S.A.; Expresso União Ltda.; Glarus Serviços Tecnologia e Participações S.A.; Limmat Participações S.A.; Quality Bus Comércio de Veículos S.A.; Super Quadra Empreendimentos Imobiliários S.A.; Thurgau Participações S.A.; Transporte Coletivo Cidade Canção Ltda.; Turb Transporte Urbano S.A.; Vaud Participações S.A.; and Viação Piracicabana Ltda.; all with no expiration date, whose purpose is to issue credits to purchase airline tickets issued by the Company. The UATP account (virtual card) is accepted as a payment means on the purchase of airline tickets and related services, seeking to simplify billing and make feasible payment between the participating companies.
The companies indicated above are owned by the individuals who control FIP Volutto and Mobi FIA, the main shareholders of the Company.
| 27.3. | Commercial partnership and maintenance agreement |
At February 19, 2014, the Company signed an exclusive strategic partnership agreement for business cooperation with AirFrance-KLM. On January 1, 2017, the Company signed an extension of the scope for the inclusion of maintenance services. During the six-month period ended June 30, 2021, expenses with component maintenance incurred at the AirFrance-KLM workshop were R$34,420 (R$171,290 in the period ended June 30, 2020). On June 30, 2021, the Company has R$80,091 in the “Suppliers” account under current liabilities (R$72,519 on December 31, 2020).
| 27.4. | Compensation agreement for the provision of guarantee |
On October 27, 2020, the Company, through its subsidiary Gol Finance, issued a debt (guaranteed financing) totaling US$250 million, which holds guarantee of assets granted by Mobi FIA, through the execution of the Pledge Agreement of Shares, Assets and Credit Rights and in consideration, it will receive remuneration from the Company, according to the terms agreed in the agreement. For additional information, see Note 17.
On June 30, 2021, this debt was fully paid and the guarantees were released from their pledge.
| 27.5. | Compensation of key management personnel |
| June 30, 2021 | June 30, 2020 | |
| Salaries, wages and benefits (*) | 29,637 | 17,164 |
| Related taxes and charges | 7,731 | 8,637 |
| Share-based compensation | 9,590 | 5,201 |
| Total | 46,958 | 31,002 |
(*) Includes payment for members of Management, audit committee.
| 37 |
| | Notes to the unaudited interim condensed consolidated financial information statements June 30, 2021 (In thousands of Reais - R$, except when otherwise indicated) |
| 28. | Revenue |
| June 30, 2021 | June 30, 2020 | |
| Passenger transportation (*) | 2,382,290 | 3,277,761 |
| Cargo transportation | 167,044 | 145,125 |
| Mileage program | 171,100 | 189,546 |
| Other revenue | 15,226 | 37,767 |
| Related tax | (139,661) | (144,624) |
| Revenue | 2,595,999 | 3,505,575 |
(*) Of the total amount, the total of R$219,308 for the six-month periods ended June 30, 2021, are made up of the revenue from non-attendance of passengers, rescheduling, ticket cancellation (R$156,953 for the six-month periods ended June 30, 2020).
In the six-month periods ended June 30, 2021, revenues earned in the international market represent less than 10% of total revenues.
| 29. | Financial results |
| June 30, 2021 | June 30, 2020 | |
| Financial income | ||
| Gain on derivatives | 2,959 | 58,512 |
| Earnings with derivatives - capped call (b) | - | 28,972 |
| Gains from financial investments | 13,644 | 154,233 |
| Inflation indexation | 9,628 | 7,807 |
| (-) Taxes on financial income (a) | (9,755) | (24,883) |
| Unrealized gains - conversion right – ESN (b) | 124,954 | 651,616 |
| Interest income | 3,817 | - |
| Other | 18,404 | 18,390 |
| Total financial income | 163,651 | 894,647 |
| Financial expenses | ||
| Loss with derivatives | (1,045) | (417,798) |
| Derivative losses - capped call (b) | (21,587) | (148,500) |
| Unrealized loss - conversion right - ESN (b) | - | (242,480) |
| Interest on loans, financing and others | (450,090) | (411,993) |
| Bank charges and expenses | (40,522) | (68,005) |
| Losses from financial investments | - | (62,894) |
| Interest on leases | (445,058) | (302,539) |
| Other | (89,053) | (67,004) |
| Total financial expenses | (1,047,355) | (1,721,213) |
| Foreign exchange rate change, net | 401,305 | (3,513,428) |
| Total | (482,399) | (4,339,994) |
(a) Related to taxes on Financial Revenues (PIS and COFINS), according to Decree 8,426 of April 1, 2015.
(b) See note 32.2.
| 38 |
| | Notes to the unaudited interim condensed consolidated financial information statements June 30, 2021 (In thousands of Reais - R$, except when otherwise indicated) |
| 30. | Segments |
The information below presents the summarized financial position of the reportable operating segments on June 30, 2021 and December 31, 2020:
| 30.1. | Assets and liabilities of the operating segments |
| June 30, 2021 | |||||
| Flight transportation | Smiles loyalty program | Total reportable segments | Eliminations | Total | |
| Assets | |||||
| Current | 2,053,651 | 1,641,478 | 3,695,129 | (1,124,968) | 2,570,161 |
| Non-current | 9,445,840 | 1,103,156 | 10,548,996 | (1,549,997) | 8,998,999 |
| Total assets | 11,499,491 | 2,744,634 | 14,244,125 | (2,674,965) | 11,569,160 |
| Liabilities | |||||
| Current | 9,925,745 | 1,493,369 | 11,419,114 | (900,939) | 10,518,175 |
| Non-current | 17,320,046 | 571,587 | 17,891,633 | (1,094,348) | 16,797,285 |
| Total equity (deficit) | (15,746,300) | 679,678 | (15,066,622) | (679,678) | (15,746,300) |
| Total liabilities and deficit | 11,499,491 | 2,744,634 | 14,244,125 | (2,674,965) | 11,569,160 |
| December 31, 2020 | |||||
| Flight transportation | Smiles loyalty program | Total reportable segments | Eliminations | Total | |
| Assets | |||||
| Current | 2,059,655 | 2,453,838 | 4,513,493 | (1,268,142) | 3,245,351 |
| Non-current | 10,040,986 | 908,246 | 10,949,232 | (1,380,447) | 9,568,785 |
| Total assets | 12,100,641 | 3,362,084 | 15,462,725 | (2,648,589) | 12,814,136 |
| Liabilities | |||||
| Current | 9,975,367 | 1,502,179 | 11,477,546 | (1,079,330) | 10,398,216 |
| Non-current | 16,532,366 | 509,577 | 17,041,943 | (858,964) | 16,182,979 |
| Total equity (deficit) | (14,407,092) | 1,350,328 | (13,056,764) | (710,295) | (13,767,059) |
| Total liabilities and deficit | 12,100,641 | 3,362,084 | 15,462,725 | (2,648,589) | 12,814,136 |
| 39 |
| | Notes to the unaudited interim condensed consolidated financial information statements June 30, 2021 (In thousands of Reais - R$, except when otherwise indicated) |
| 30.2. | Results of the operating segments |
| June 30, 2021 | |||||
| Flight transportation | Smiles loyalty program (b) | Total reportable segments | Eliminations | Total consolidated | |
| Revenue | |||||
| Passenger (a) | 2,166,194 | - | 2,166,194 | 137,658 | 2,303,852 |
| Cargo and other (a) | 168,014 | - | 168,014 | (17,324) | 150,690 |
| Mileage program (a) | - | 315,296 | 315,296 | (173,839) | 141,457 |
| Revenue | 2,334,208 | 315,296 | 2,649,504 | (53,505) | 2,595,999 |
| Operating costs and expenses | |||||
| Salaries, wages and benefits | (893,710) | (40,721) | (934,431) | - | (934,431) |
| Aircraft fuel | (942,315) | - | (942,315) | - | (942,315) |
| Landing fees | (183,754) | - | (183,754) | - | (183,754) |
| Aircraft, traffic and mileage servicing | (326,013) | (93,612) | (419,625) | 40,144 | (379,481) |
| Passenger service expenses | (226,590) | - | (226,590) | - | (226,590) |
| Sales and marketing | (86,570) | (32,986) | (119,556) | (5,294) | (124,850) |
| Maintenance, materials and repairs | (241,331) | - | (241,331) | - | (241,331) |
| Depreciation and amortization | (616,723) | (17,915) | (634,638) | - | (634,638) |
| Other income (expenses), net | (259,465) | (1,897) | (261,362) | - | (261,362) |
| Total operating costs and expenses | (3,776,471) | (187,131) | (3,963,602) | 34,850 | (3,928,752) |
| Equity results | 67,876 | - | 67,876 | (67,876) | - |
| Operating result before financial result, net and income tax and social contribution | (1,374,387) | 128,165 | (1,246,222) | (86,531) | (1,332,753) |
| Financial income (expenses) | |||||
| Financial income | 157,930 | 42,811 | 200,741 | (37,090) | 163,651 |
| Financial expenses | (1,083,838) | (607) | (1,084,445) | 37,090 | (1,047,355) |
| Total financial income (expenses) | (925,908) | 42,204 | (883,704) | - | (883,704) |
| Income (loss) before exchange rate variation, net and income tax and social contribution | (2,300,295) | 170,369 | (2,129,926) | (86,531) | (2,216,457) |
| Exchange rate variation, net | 398,761 | 2,544 | 401,305 | - | 401,305 |
| Income (loss) before income tax and social contribution | (1,901,534) | 172,913 | (1,728,621) | (86,531) | (1,815,152) |
| Income tax and social contribution | 16,044 | (54,976) | (38,932) | 6,328 | (32,604) |
| Net income (loss) for the period | (1,885,490) | 117,937 | (1,767,553) | (80,203) | (1,847,756) |
| Attributable to equity holders of the parent | (1,885,490) | 80,203 | (1,805,287) | (80,203) | (1,885,490) |
| Attributable to non-controlling interests of Smiles | - | 37,734 | 37,734 | - | 37,734 |
| 40 |
| | Notes to the unaudited interim condensed consolidated financial information statements June 30, 2021 (In thousands of Reais - R$, except when otherwise indicated) |
| June 30, 2020 | |||||
| Flight transportation | Smiles loyalty program (b) | Total reportable segments | Eliminations | Total consolidated | |
| Revenue | |||||
| Passenger (a) | 3,136,765 | - | 3,136,765 | 47,871 | 3,184,636 |
| Cargo and other (a) | 170,964 | - | 170,964 | (39,571) | 131,393 |
| Mileage program (a) | - | 227,889 | 227,889 | (38,343) | 189,546 |
| Revenue | 3,307,729 | 227,889 | 3,535,618 | (30,043) | 3,505,575 |
| Operating costs and expenses | |||||
| Salaries, wages and benefits | (796,056) | (40,307) | (836,363) | - | (836,363) |
| Aircraft fuel | (1,136,923) | - | (1,136,923) | - | (1,136,923) |
| Landing fees | (222,073) | - | (222,073) | - | (222,073) |
| Aircraft, traffic and mileage servicing | (288,612) | (63,516) | (352,128) | 37,408 | (314,720) |
| Passenger service expenses | (203,224) | - | (203,224) | - | (203,224) |
| Sales and marketing | (129,965) | (27,540) | (157,505) | (3,537) | (161,042) |
| Maintenance, materials and repairs | (218,067) | - | (218,067) | - | (218,067) |
| Depreciation and amortization | (1,003,699) | (14,882) | (1,018,581) | - | (1,018,581) |
| Other income (expenses), net | 689,662 | (16,759) | 672,903 | 17,691 | 690,594 |
| Total operating costs and expenses | (3,308,957) | (163,004) | (3,471,961) | 51,562 | (3,420,399) |
| Equity results | 43,660 | - | 43,660 | (43,660) | - |
| Operating result before financial result, net and income tax and social contribution | 42,432 | 64,885 | 107,317 | (22,141) | 85,176 |
| Financial income (expenses) | |||||
| Financial income | 880,745 | 44,566 | 925,311 | (30,664) | 894,647 |
| Financial expenses | (1,740,867) | (11,126) | (1,751,993) | 30,780 | (1,721,213) |
| Total financial income (expenses) | (860,122) | 33,440 | (826,682) | 116 | (826,566) |
| Income (loss) before exchange rate variation, net and income tax and social contribution | (817,690) | 98,325 | (719,365) | (22,025) | (741,390) |
| Exchange rate variation, net | (3,511,199) | (2,130) | (3,513,329) | (99) | (3,513,428) |
| Income (loss) before income tax and social contribution | (4,328,889) | 96,195 | (4,232,694) | (22,124) | (4,254,818) |
| Income tax and social contribution | 1,062 | (40,293) | (39,231) | (7,286) | (46,517) |
| Net income for the period | (4,327,827) | 55,902 | (4,271,925) | (29,410) | (4,301,335) |
| Attributable to equity holders of the parent | (4,327,827) | 29,410 | (4,298,417) | (29,410) | (4,327,827) |
| Attributable to non-controlling interests of Smiles | - | 26,492 | 26,492 | - | 26,492 |
(a) Eliminations are related to transactions between GLA and Smiles Fidelidade.
In the stand-alone financial statements of the subsidiary Smiles Fidelidade, which represents the segment Smiles loyalty program, and in the information provided to the relevant decision makers, the revenue recognition occurs upon redemption of the miles by the participants. Under the perspective of Smiles Fidelidade, this measurement is appropriate given that this is when the revenue recognition cycle is complete. At this point, Smiles has transferred to its suppliers the obligation to provide services or deliver products to its customers.
However, from a consolidated perspective, the revenue recognition cycle related to miles exchanged for flight tickets is only complete when the passengers are effectively transported. Therefore, for purposes of reconciliation with the consolidated assets, liabilities and income and expenses, as well as for purposes of equity method of accounting and for consolidation purposes, the Company performed, in addition to elimination entries, consolidating adjustments to adjust the accounting practices related to Smiles’ revenues. In this case, under consolidated perspective, the mileages that were used to redeem airline tickets are only recognized as revenue when passengers are transported, in accordance with accounting practices and policies adopted by the Company.
| 41 |
| | Notes to the unaudited interim condensed consolidated financial information statements June 30, 2021 (In thousands of Reais - R$, except when otherwise indicated) |
| 31. | Commitments |
On June 30, 2021 and December 31, 2020, the Company had 95 firm orders for aircraft acquisitions with Boeing. These aircraft acquisition commitments include estimates for contractual price increases during the construction phase. The approximate amount of firm orders in the current period considers an estimate of contractual discounts, and corresponds to around R$23,567,598 (R$23,269,198 on December 31, 2020) corresponding to US$4,711,446 on June 30, 2021 (US$4,447,687 on December 31, 2020) and are segregated as follows:
| June 30, 2021 | December 31, 2020 | |
| 2022 | 899,270 | - |
| 2023 | 3,543,090 | 3,353,702 |
| 2024 onwards | 19,125,238 | 19,915,496 |
| Total | 23,567,598 | 23,269,198 |
Of the total commitments presented above, the Company should disburse the amount of R$8,371,226 (corresponding to US$1,673,509 on June 30, 2021) as advances for aircraft acquisition, according to the financial flow below:
| June 30, 2021 | December 31, 2020 | |
| 2021 | 182,092 | 184,951 |
| 2022 | 1,475,197 | 1,287,077 |
| 2023 | 2,697,202 | 2,657,000 |
| 2024 onwards | 4,016,735 | 4,186,740 |
| Total | 8,371,226 | 8,315,768 |
The Company leases its entire aircraft fleet through a combination of leases without a purchase option. On June 30, 2021, the total fleet consisted of 127 aircraft.
| 32. | Financial instruments and risk management |
Operational activities expose the Company and its subsidiaries to market risk, credit risk and liquidity risk. These risks can be mitigated by using exchange swap derivatives, futures and options contracts based on oil, U.S. dollar and interest markets.
Financial instruments are managed by the Financial Policy Committee (“CPF”) in line with the Risk Management Policy approved by the Risk Policy Committee (“CPR”) and submitted to the Board of Directors.
The details regarding how the Company manages risks have been widely presented in the annual financial statements related to the year ended December 31, 2020. Since then, there have been no changes.
| 42 |
| | Notes to the unaudited interim condensed consolidated financial information statements June 30, 2021 (In thousands of Reais - R$, except when otherwise indicated) |
| 32.1. | Accounting classifications of financial instruments |
The accounting classifications of the Company’s financial instruments on June 30, 2021 and December 31, 2020 are as follows:
| Measured at fair value through profit or loss | Amortized cost | |||
| June 30, 2021 | December 31, 2020 | June 30, 2021 | December 31, 2020 | |
| Assets | ||||
| Cash and bank deposits | 75,761 | 428,812 | - | - |
| Cash equivalents | 684,508 | 234,018 | - | - |
| Short-term investments | 23,006 | 629,335 | - | - |
| Restricted cash | 313,815 | 544,607 | - | - |
| Trade receivables | - | - | 717,408 | 739,699 |
| Derivative assets | 63,574 | 128,809 | - | - |
| Deposits (a) | - | - | 1,254,320 | 1,390,890 |
| Other credits and amounts | - | - | 155,420 | 179,160 |
| Liabilities | ||||
| Loans and financing (b) | 205,838 | 346,030 | 10,088,172 | 9,630,936 |
| Leases | - | - | 7,695,929 | 7,584,192 |
| Suppliers | - | - | 1,573,180 | 1,645,194 |
| Derivatives liabilities | - | 5,297 | - | - |
| Other liabilities | - | - | 842,808 | 618,754 |
| (a) | Excludes court deposits, as described in Note 14. |
| (b) | The amounts on June 30, 2021 and December 31, 2020, classified as measured at fair value through profit or loss, are related to the derivative contracted through Exchange Senior Notes. |
In the period ended June 30, 2021, there was no change in the classification between categories of the financial instruments.
| 43 |
| | Notes to the unaudited interim condensed consolidated financial information statements June 30, 2021 (In thousands of Reais - R$, except when otherwise indicated) |
| 32.2. | Derivative and non-derivative financial instruments |
The Company's derivative financial instruments were recognized as follows in the balance sheet:
| Derivatives | Non-derivative | ||||||
| Fuel | Interest rate | Foreign curency rate | Capped call | ESN | Revenue hedge | Total | |
| Fair value changes | |||||||
| Derivatives assets (liabilities) on December 31, 2020 | 34,166 | - | 1,683 | 87,663 | (346,030) | - | (222,518) |
| Gains (losses) recognized in income (expenses) | - | - | 635 | (21,587) | 132,470 | - | 111,518 |
| Gains (losses) recognized as exchange rate change | - | - | - | (2,502) | 7,722 | - | 5,220 |
| Gains (losses) recognized in equity valuation adjustments | 96,847 | - | - | - | - | - | 96,847 |
| Receipts during the period | (131,013) | - | (2,318) | - | - | - | (133,331) |
| Derivatives assets (liabilities) on June 30, 2021 | - | - | - | 63,574 | (205,838) | - | (142,264) |
| Derivative assets | - | - | - | 63,574 | - | - | 63,574 |
| Loans and financing | - | - | - | - | (205,838) | - | (205,838) |
| Changes in the adjustment of equity valuation | |||||||
| Balance on December 31, 2020 | (164,789) | (303,207) | - | - | - | (843,080) | (1,311,076) |
| Fair value adjustments during the period | 96,847 | - | - | - | - | - | 96,847 |
| Adjustments of hedge accounting of revenue | - | - | - | - | - | 259,345 | 259,345 |
| Net reversal to income (expenses) | 55,384 | 3,236 | - | - | - | 970 | 59,590 |
| Balances on June 30, 2021 | (12,558) | (299,971) | - | - | - | (582,765) | (895,294) |
| Effects on income (expenses) | (55,384) | (3,236) | 635 | (24,089) | 140,192 | (260,315) | (202,197) |
| Net Revenue | - | - | - | - | - | (150) | (150) |
| Fuel | (57,637) | - | - | - | - | - | (57,637) |
| Financial results | 2,253 | (3,236) | - | (21,587) | 132,470 | - | 109,900 |
| Exchange rate variation, net | - | - | 635 | (2,502) | 7,722 | (260,165) | (254,310) |
The Company may adopt hedge accounting for derivatives contracted to hedge cash flow and that qualify for this classification as per IFRS 9 – “Financial Instruments”.
On June 30, 2021, the Company adopts cash flow hedge for the interest rate (mainly the Libor interest rates), and for aeronautical fuel protection and future revenue in U.S. Dollars.
Cash flow hedges are scheduled for realization and, therefore, reclassification to expense according to the following periods:
| 2021 | 2022 | 2023 | 2024 | 2025 onwards | |
| Fuel | (1,090) | (11,468) | - | - | - |
| Interest Rate | (8,530) | (21,297) | (26,205) | (26,043) | (217,896) |
| Revenue Hedge | (20,677) | (155,293) | (263,645) | (143,150) | - |
| Total | (30,297) | (188,058) | (289,850) | (169,193) | (217,896) |
| 44 |
| | Notes to the unaudited interim condensed consolidated financial information statements June 30, 2021 (In thousands of Reais - R$, except when otherwise indicated) |
| 32.3. | Market risks |
32.3.1. Fuel
The aircraft fuel prices fluctuate due to the volatility of the price of crude oil by product price fluctuations. To mitigate such risks, the Company may use derivative financial instruments. On June 30, 2021, the Company didn’t have derivatives to protect this exposure.
32.3.2. Interest rate
The Company is mainly exposed to lease transactions indexed to changes in the Libor rate until the aircraft is received. To mitigate such risks, the Company can use derivative financial instruments. On June 30, 2021, the Company didn’t have derivatives to protect against interest rate exposure.
On June 30, 2021, the Company held financial investments and loans and financing with different types of fees. Its sensitivity analysis of non-derivative financial instruments examined the impact on annual interest rates only for positions with material amounts on June 30, 2021 that were exposed to fluctuations in interest rates, as the scenarios below show. The amounts show the impacts on Income (Expenses) according to the scenarios adopted below:
| Short-term investments net of financial debt (a) | ||
| Risk | CDI rate drop | Libor rate increase |
| Reference rates | 4.15% | 0.08% |
| Exposure amount (probable scenario) (b) | 186,788 | (2,867,820) |
| Remote favorable scenario (-25%) | 234 | 579 |
| Possible favorable scenario (-10%) | 94 | 231 |
| Possible adverse scenario (+10%) | (94) | (231) |
| Remote adverse scenario (+25%) | (234) | (579) |
| (a) | Refers to the sum of the amounts invested and raised in the financial market and indexed to the CDI and Libor rates. |
| (b) | Book balances recorded as of June 30, 2021. |
32.3.3. Exchange rate
Foreign currency risk derives from the possibility of unfavorable fluctuation of foreign currency to which the Company’s liabilities or cash flows are exposed. The Company is mainly exposed to the exchange rate change of the U.S. dollar.
| 45 |
| | Notes to the unaudited interim condensed consolidated financial information statements June 30, 2021 (In thousands of Reais - R$, except when otherwise indicated) |
The Company’s foreign currency exposure is summarized below:
| June 30, 2021 | December 31, 2020 | |
| Assets | ||
| Cash, short-term investments and restricted cash | 86,180 | 491,258 |
| Trade receivables | 83,376 | 120,167 |
| Deposits | 1,254,320 | 1,390,890 |
| Derivative assets | 63,574 | 128,809 |
| Total Assets | 1,487,450 | 2,131,124 |
| Liabilities | ||
| Loans and financing | (9,514,948) | (9,132,988) |
| Leases | (7,654,355) | (7,536,677) |
| Suppliers | (407,966) | (481,001) |
| Provisions | (1,063,514) | (1,030,915) |
| Derivatives liabilities | - | (5,297) |
| Total Liabilities | (18,640,783) | (18,186,878) |
| Exchange rate exposure liabilities | (17,153,333) | (16,055,754) |
| Commitments not recorded in the statements of financial position | ||
| Future obligations resulting from firm aircraft orders | (23,567,598) | (23,269,198) |
| Total | (23,567,598) | (23,269,198) |
| Total exchange rate exposure R$ | (40,720,931) | (39,324,952) |
| Total exchange rate exposure - US$ | (8,140,604) | (7,567,293) |
| Exchange rate (R$/US$) | 5.0022 | 5.1967 |
On June 30, 2021, the Company adopted the closing exchange rate of R$5.0022/US$1.00 as a likely scenario. The table below shows the sensitivity analysis and the effect on income (expenses) of exchange rate fluctuations in the exposure amount of the period on June 30, 2021:
| Exchange rate | Effect on income (expenses) | |
| Net liabilities exposed to the risk of appreciation of the U.S. dollar | ||
| Dollar depreciation (-25%) | 3.7517 | 4,288,333 |
| Dollar depreciation (-10%) | 4.5020 | 1,715,333 |
| Dollar appreciation (+10%) | 5.5024 | (1,715,333) |
| Dollar appreciation (+25%) | 6.2528 | (4,288,333) |
32.3.4. Capped call
The Company, through Gol Equity Finance, in the context of the pricing of the ESN issued on March 26, April 17 and July 17, 2019, contracted private derivative transactions (Capped call) with part of the note subscribers with the purpose of minimizing the potential dilution of the Company’s preferred shares and ADSs.
| 32.4. | Credit risk |
Credit risk is inherent in the Company’s operating and financing activities, mainly in cash and cash equivalents, short-term investments and trade receivables. Financial assets classified as cash, cash equivalents and financial investments are deposited with counterparties that have a local minimum investment grade rating in the assessment made by the S&P or Moody's agencies (between AAA and AA-), as established by risk management policies.
| 46 |
| | Notes to the unaudited interim condensed consolidated financial information statements June 30, 2021 (In thousands of Reais - R$, except when otherwise indicated) |
Credit limits are set for all customers based on internal credit rating criteria and carrying amounts represent the maximum credit risk exposure. Customer creditworthiness is assessed based on an internal system of extensive credit rating. Outstanding trade receivables are frequently monitored by the Company.
Derivative financial instruments are contracted in the over-the-counter market (OTC) with counterparties rated investment grade or higher, or in a commodities and futures exchange (B3 or NYMEX), thus substantially mitigating credit risk. The Company's obligation is to evaluate counterparty risk involved in financial instruments and periodically diversify its exposure.
| 32.5. | Liquidity risk |
The Company is exposed to liquidity risk in two distinct ways: (i) market prices, which vary in accordance with the types of assets and markets where they are traded, and (ii) cash flow liquidity risk related to difficulties in meeting the contracted operating obligations at the maturity dates. In order to manage liquidity risk, the Company invests its funds in liquid assets (government bonds, CDBs and investment funds with daily liquidity) and its Cash Management Policy requires the weighted average maturity of its debt to be longer than the weighted average term of its investment portfolio term.
The schedules of financial liabilities held by the Company on June 30, 2021 and December 31, 2020 are as follows:
| Less than 6 months | 6 to 12 months | 1 to 5 years | More than 5 years | Total | |
| Loans and financing | 1,570,337 | 202,667 | 8,460,767 | 60,239 | 10,294,010 |
| Leases | 1,175,629 | 689,202 | 4,295,309 | 1,535,789 | 7,695,929 |
| Suppliers | 1,562,946 | - | 10,234 | - | 1,573,180 |
| Other liabilities | 381,582 | - | 461,227 | - | 842,809 |
| On June 30, 2021 | 4,690,494 | 891,869 | 13,227,537 | 1,596,028 | 20,405,928 |
| Loans and financing | 2,120,462 | 232,817 | 6,804,167 | 819,520 | 9,976,966 |
| Leases | 647,850 | 669,158 | 4,763,614 | 1,503,570 | 7,584,192 |
| Suppliers | 1,612,536 | - | 32,658 | - | 1,645,194 |
| Derivatives liabilities | 5,297 | - | - | - | 5,297 |
| Others | 287,275 | - | 331,479 | - | 618,754 |
| On December 31, 2020 | 4,673,420 | 901,975 | 11,931,918 | 2,323,090 | 19,830,403 |
| 32.6. | Capital management |
The Company seeks alternatives to capital in order to meet its operational needs, aiming a capital structure that considers suitable parameters for the financial costs, the maturities of funding and its guarantees. The Company monitors its financial leverage ratio, which corresponds to net indebtedness, including short and long-term loans and financing and leases. The following table shows the financial leverage:
| June 30, 2021 | December 31, 2020 | |
| Total loans and financing | 10,294,010 | 9,976,966 |
| Total leases | 7,695,929 | 7,584,192 |
| (-) Cash and cash equivalents | (760,269) | (662,830) |
| (-) Short-term investments | (23,006) | (629,335) |
| (-) Restricted cash | (313,815) | (544,607) |
| Net indebtedness | 16,892,849 | 15,724,386 |
| 47 |
| | Notes to the unaudited interim condensed consolidated financial information statements June 30, 2021 (In thousands of Reais - R$, except when otherwise indicated) |
| 33. | Non-cash transactions |
| June 30, 2021 | June 30, 2020 | |
| Acquisition of Property, plant and equipment through financing (Property, plant and equipment / Loans and financing) | - | 25,974 |
| Amortization of debt with Restricted cash (Restricted cash / Loans and financing) | 198,270 | - |
| Amortization of debt whit deposits (Deposits / Leases payable) | (8,126) | - |
| Right of use of flight equipment (Property, plant and equipment / Leases payable) | 430,658 | 131,014 |
| Lease agreement renegotiation (Property, plant and equipment / Leases payable) | 47,449 | 156,424 |
| Actuarial losses of post-employment benefit | - | 27,287 |
| Back lease (Fixed assets / leases) | - | (35,316) |
| Withdrawal risk (Withdrawal risk / loans) | - | (359,337) |
| Provision for aircraft return (Property, plant and equipment / Provisions) | 10,326 | - |
| Unrealized result of derivatives (right with derivatives / equity valuation adjustment) | 415,782 | 810,199 |
| Capital increase with issuance of shares to non-controlling shareholders | 606,839 | - |
| Constitution of capital reserve | 744,450 | - |
| Result on the sale of treasury shares | 279 | - |
| Transfer of treasury shares | 19,834 | - |
| 48 |
| | Notes to the unaudited interim condensed consolidated financial information statements June 30, 2021 (In thousands of Reais - R$, except when otherwise indicated) |
| 34. | Liabilities from financing activities |
The changes in the liabilities of the Company’s financing activities are shown below for the period ended June 30, 2021, and 2020:
| Non-cash transactions | Adjustment to profit | |||||||||||
| Opening balance | Net cash generated by (used in) financing activities | Net cash used in operating activities | Property, plant and equipment acquisition through new agreements and contractual amendment | Transaction with non-controlling shareholders and sale/transfer of treasury shares | Amortization with related assets | Distribution of interim dividends | Exchange rate changes, net | Provision for interest and cost amortization | Unrealized income (expenses) on derivatives | Closing balance | ||
| Loans and financing | 9,976,966 | 939,729 | (378,944) | - | - | (198,270) | - | (373,966) | 453,449 | (124,954) | 10,294,010 | |
| Leases | 7,584,192 | (524,898) | 17,794 | 478,107 | - | (8,126) | - | (296,202) | 445,062 | - | 7,695,929 | |
| Dividends and interest on shareholders’ equity to pay (1) | 23,139 | (260,131) | - | - | - | - | 236,992 | - | - | - | - | |
| Share capital | 3,009,436 | 423,061 | - | - | 606,839 | - | - | - | - | - | 4,039,336 | |
| Shares to be issued | 1,180 | 908 | - | - | - | - | - | - | - | - | 2,088 | |
| Actions in Treasury | (62,215) | 588 | - | - | 20,113 | - | - | - | - | - | (41,514) | |
| Capital reserves | 207,246 | (744,450) | 8,547 | - | 724,337 | - | - | - | - | 195,680 | ||
| (1) | The amount is recorded in the Other liabilities group, in current liabilities. |
| Non-cash transactions | Adjustment to profit | |||||||||||
| Opening balance | Net cash flows (used in) from financing activities | Net cash flows used in operating activities | Property, plant, and equipment acquisition through financing | Forfaiting | Gains (losses) recognized in the adjustment of equity valuation | Write-offs | Exchange rate changes, net | Provision for interest and cost amortization | Write-offs and contractual amendments | Unrealized income (expenses) on derivatives | Closing balance | |
| Loans and financing | 8,409,841 | (250,686) | (276,623) | 25,974 | 359,337 | - | - | 2,673,698 | 351,037 | - | (409,136) | 10,883,442 |
| Leases | 6,052,780 | (527,902) | (4,530) | 104,055 | - | - | (120,947) | 2,088,048 | 309,064 | 156,424 | - | 8,056,992 |
| Derivatives | (127,119) | 21,800 | (545,300) | - | - | 810,199 | - | (20,709) | - | - | 101,228 | 240,099 |
| 49 |
SIGNATURE
Pursuant to the requirements of the Securities Exchange Act of 1934, the registrant has duly caused this report to be signed on its behalf by the undersigned, thereunto duly authorized.
Date: September 20, 2021
| GOL LINHAS AÉREAS INTELIGENTES S.A. | ||
| By: | /s/ Richard F. Lark, Jr. | |
Name: Richard F. Lark, Jr. Title: Investor Relations Officer | ||