SECURITIES AND EXCHANGE COMMISSION
Washington, D.C. 20549
FORM 6-K
REPORT OF FOREIGN ISSUER
PURSUANT TO RULE 13a-16 OR 15d-16 OF THE
SECURITIES EXCHANGE ACT OF 1934
For the month of April 2022
(Commission File No. 001-32221)
GOL LINHAS AÉREAS INTELIGENTES S.A.
(Exact name of registrant as specified in its charter)
GOL INTELLIGENT AIRLINES INC.
(Translation of registrant’s name into English)
Praça Comandante Linneu Gomes, Portaria 3, Prédio 24
Jd. Aeroporto
04630-000 São Paulo, São Paulo
Federative Republic of Brazil
(Address of registrant’s principal executive offices)
Indicate by check mark whether the registrant files or will file
annual reports under cover Form 20-F or Form 40-F.
Form 20-F ___X___ Form 40-F ______
Indicate by check mark whether the registrant by furnishing the
information contained in this Form is also thereby furnishing the
information to the Commission pursuant to Rule 12g3-2(b) under
the Securities Exchange Act of 1934.
Yes ______ No ___X___
Parent Company and Consolidated
Quarterly Information (ITR)
GOL Linhas Aéreas Inteligentes S.A.
March 31, 2022
with Review Report on the Quarterly Information
Gol Linhas Aéreas Inteligentes S.A.
Parent Company and Consolidated Quarterly Information (ITR)
March 31, 2022
Contents
Comments on the Performance | 2 |
Report of the Statutory Audit Committee (SAC) | 7 |
Statement of the Executive officers on the Parent Company and Consolidated Quarterly Information (ITR) | 8 |
Statement of the Executive officers on the Independent Auditors’ Review Report | 9 |
Review Report of the Independent Auditors on the Quarterly Information (ITR) | 10 |
Balance Sheets | 12 |
Income Statements | 14 |
Statements of Comprehensive Income (SCI) | 15 |
Statements of Changes in Shareholders’ Equity (SCSE) | 16 |
Statements of Cash Flows (SCF) | 17 |
Statements of Value Added (SVA) | 19 |
Notes to the Parent Company and Consolidated Quarterly Information (ITR) | 20 |
Comments on the Performance
GOL’s strong results are driven by its continuous investment in being the best Company to travel, work and invest, and reflect the social capital built up over two decades of collaboration with its Customers, Team of Eagles, suppliers, and investors.
Consistent Sales Growth and Focus on Sustainable Passenger Yields
Net revenue from passenger transportation grew significantly in the first quarter due to the strong, continued recovery in the domestic market. In January and February, sales levels surpassed the same pre-pandemic period in 2019 by 10% and 30%, respectively – further expanding to 60% in March 2022, driven by a 63% increase in corporate segment sales and a boost in combined business and leisure travel, also known as bleisure trips. This higher sales figure was enhanced by an adjustment in ticket prices, chiefly driven by higher jet fuel prices.
In January, GOL achieved 38.5% domestic market share and 99.7% flight completion. This was made possible by diligent capacity management efforts in the previous months. The Company increased its capacity by 14.7% sequentially – driven by a more robust recovery at Brazil’s main airports such as Congonhas (São Paulo), a significant hub for corporate passengers, an essential pillar for strengthening profitability.
Beginning on March 27th, 2022, key changes have taken place in GOL’s network to support the robust recovery in the corporate segment. The Company increased the offer by 30% at Congonhas airport, and by 100% in Curitiba. The GOL hub in Salvador launched 10 new destinations: Belém, Cuiabá, Curitiba, Florianópolis, Goiânia, Palmas, Porto Alegre, Recife, São Luis and Campinas, representing a 33% growth in departures as compared to 1Q19.
“We strongly believe that this new network, carefully studied in recent months and being implemented as we speak, will position us to support ongoing demand growth – particularly in the corporate segment. Our single fleet is a unique competitive advantage, as it ensures us greater flexibility for rapid adjustments to our network,” said Celso Ferrer, COO.
Acceleration of the Transition to the Boeing 737 MAX and Related Sustainability Initiatives
In the first quarter, the Company received eight new Boeing 737 MAX-8 aircraft. The fleet’s transformation to new and more efficient technology plays a key role in GOL’s strategy for the coming years, chiefly driven by increased productivity and cost efficiencies. These new aircraft reduce fuel consumption by 15% and carbon emissions by 16%, while offering improved range and 30% less noise as compared to the Boeing 737 NG.
Among the eight 737-MAX received, three aircraft are under finance leases – reopening GOL’s portfolio of leased aircraft, which the Company anticipates will expand to 50-60% of new aircraft adopted in the coming years.
“The Boeing 737 is key to our long-term liquidity. This new aircraft drives more efficient operational results in addition to strengthening our balance sheet”, said Richard Lark, CFO.
Liquidity and Capital Structure Management
GOL’s primary focus during the pandemic was to maintain a balanced capital structure, using various liquidity sources to keep its liabilities at sustainable levels, as well as lowering future obligations to fall short of its industry peers. In the quarter, the preservation of the Company’s workforce, combined with diligent capacity management, enabled a highly efficient operation in the busy season – without the impact of flight cancellations resulting from the spike in Omicron cases. With a healthy balance sheet as compared to industry peers, GOL is now shifting its focus to enhancing fleet productivity and profitability through essential investments in Capex and the repayment of operating liabilities.
GOL’s liquidity (cash and cash equivalents, financial investments, trade receivables and deposits) totaled R$3.3 billion at the end of 1Q22. The Company’s short-term loans and financing was R$721 million. GOL has no significant debt amortizations in the next twelve months, and has long-term financing for the acquisition of new 737 MAX aircraft, a key part of the fleet transformation plan.
| 2 |
“Although we saw an increase in leverage due to the accelerated transition of our aircraft fleet, we are optimistic that the improvement in EBITDA will lead us to a net debt/EBITDA ratio of approximately 8x by the end of 2022,” added Richard Lark.
Enhancing the Customer Experience and Maintaining Safety as our #1 Value
Along with the strong demand recovery and the increase in the number of passengers transported, GOL saw a critical increase in its NPS by 7 points to 45 – an important service quality metric and the Company’s highest score since adopting the indicator.
In January, GOL was awarded by ANAC (National Civil Aviation Agency) in the Safety & Security category, recognizing the Company’s continuous efforts to strengthen its #1 value – Safety. This InovANAC award aims to stimulate the innovation culture in civil aviation, rewarding innovative ideas and practices promoting operational safety.
GOL and American Airlines Conclude Agreement
On April 13, 2022, the exclusive codeshare agreement between GOL and American Airlines was finalized, including the closing of an equity investment into GOL by American Airlines in the amount of US$200 million (R$948.3 million) in 22.2 million newly issued preferred shares of the Company, reflecting a 5.3% participation in GOL’s economic interest. American Airlines was granted the right to appoint a member to the Company’s Board of Directors for the term of the exclusivity provided in the transaction. As a result of the issuance of the preferred shares, GOL shareholders are entitled to a pro rata preemptive subscription of preferred shares until May 13, 2022.
“The new, exclusive partnership between GOL and American Airlines will further enhance the travel experience for our Customers, primarily on routes connecting North and South America. The existing codeshare, in place since February 2020, already represented the largest route network in the Americas – enabling our passengers to travel seamlessly to more than 30 destinations in the U.S.,” commented Eduardo Bernardes, Vice President of Sales, Marketing and Clients.
Smiles: GOL’s Frequent-Flyer Program
Gross billing from Smiles grew 103.7% YoY and 15.4% sequentially to R$900.0 million. Notably, it increased by 43.6% as compared to the comparable pre-pandemic figure in 1Q19. The miles accumulated in the program totaled 49.5 billion in 1Q22, an increase of 150.7% and 73.6% over 1Q21 and 1Q19 respectively, illustrating the growing participation and increasing partners in GOL’s frequent flyer program.
Landmark Cargo and Logistics Services Agreement with Mercado Livre
This partnership represents a new milestone for the Company by launching a dedicated freighter fleet of six Boeing 737-800 BCF, which should begin operations in the second half of 2022, with the option of adding a further six cargo aircraft by 2025, reaching a total of twelve aircraft. Part of the aircraft used will be converted at GOL Aerotech, the Company’s maintenance unit.
Given this, GOLLOG plans to enhance its range of services and increase tonnage capacity 80% through 2023, generating approximately R$100 million in incremental revenue in 2022, and more than R$1.0 billion over the next five years.
GOL plans to end this year with 136 aircraft in its fleet, comprised of 44 Boeing 737-MAXs and 92 Boeing 737-NGs. The conversion of the six-cargo aircraft is expected to generate fleet optimization savings of approximately R$25 million in 2022 and a further R$75 million in 2023.
“Our cargo operation begins an exciting new chapter for GOL and GOLLOG, by integrating our synergies as the lowest cost operator in the region with the needs of Mercado Libre, the largest e-commerce platform in Latin America. This partnership not only increases the productivity of our fleet, but brings significant added value and will help to democratize logistics services for all Brazilians,” concluded Kakinoff.
| 3 |
ESG Initiatives
Currently, all our flights on the Recife - Fernando de Noronha and Congonhas - Bonito segments have all carbon emitted fully offset by the GOL and MOSS partnership. For voluntary emissions offset on other routes – in coordination with the Fleet and Supplies, Marketing, Products and Airports Teams – the Company launched a new convenient emissions offset service for all its Customers. Tickets issued at check-in will now have a QR Code on the back, directing them to MOSS website, where Customers can calculate and offset their carbon footprint on any GOL flight.
In early April, during the IATA (International Air Transportation Association) event “Wings of Change” in Santiago, Chile, GOL ratified its participation in 25by2025, a global initiative by the aviation industry to increase female participation in the industry. Currently, 35.3% of the Company’s leaders are female.
Operational and Financial Indicators
| Traffic Data – GOL (in millions) | 1Q22 | 1Q21 | % Chg. |
| RPK GOL – Total | 8,192 | 5,592 | 46.5% |
| RPK GOL – Domestic | 7,935 | 5,592 | 41.9% |
| RPK GOL – Foreign Market | 257 | - | NM |
| ASK GOL – Total | 10,110 | 6,999 | 44.4% |
| ASK GOL – Domestic | 9,769 | 6,999 | 39.6% |
| ASK GOL – Foreign Market | 340 | - | NM |
| GOL Load Factor – Total | 81.0% | 79.9% | 1.1 p.p. |
| GOL Load Factor – Domestic | 81.2% | 79.9% | 1.3 p.p. |
| GOL Load Factor – Foreign Market | 75.6% | 0.0% | NM |
| Operating Data | 1Q22 | 1Q21 | % Chg. |
| Revenue Passengers - Pax on Board ('000) | 6,718 | 4,495 | 49.5% |
| Aircraft Utilization (Block Hours/Day) | 11.0 | 9.7 | 13.4% |
| Departures | 48,746 | 32,797 | 48.6% |
| Total Seats (‘000) | 8,657 | 5,744 | 50.7% |
| Average Stage Length (km) | 1,168 | 1,205 | (3.1%) |
| Fuel Consumption in the Period (mm liters) | 275 | 192 | 43.2% |
| Full-Time Employees (at period end) | 13,927 | 13,999 | (0.5%) |
| Average Operating Fleet(4) | 101 | 77 | 31.2% |
| On-Time Departures | 92.27% | 96.3% | (4.0 p.p.) |
| Flight Completion | 99.67% | 98.4% | 1.3 p.p. |
| Passenger Complaints (per 1,000 pax) | 1.66 | 0.71 | 133.8% |
| Lost Baggage (per 1,000 pax) | 2.31 | 1.84 | 25.5% |
| Financial Data | 1Q22 | 1Q21 | % Chg. |
| Net YIELD (R$ cents) | 36.77 | 25.32 | 45.2% |
| Net PRASK (R$ cents) | 29.79 | 20.24 | 47.2% |
| Net RASK (R$ cents) | 31.85 | 22.40 | 42.2% |
| CASK (R$ cents) | 31.09 | 29.86 | 4.0% |
| CASK Ex-Fuel (R$ cents) | 19.17 | 21.77 | (11.9%) |
| Recurring CASK (cents R$) (5) | 30.06 | 28.23 | 6.5% |
| Recurring CASK Ex-Fuel (cents R$) (5) | 18.13 | 20.14 | (10.0%) |
| Breakeven Load Factor Ex-Non-Recurring Expenses | 76.5% | 100.7% | (24.2 p.p.) |
| Average Exchange Rate(1) | 5.23 | 5.47 | (4.4%) |
| End of Period Exchange Rate(1) | 5.10 | 5.70 | (10.5%) |
| WTI (Average per Barrel, US$)(2) | 94.29 | 57.84 | 63.0% |
| Price per Liter Fuel (R$)(3) | 4.48 | 2.79 | 60.6% |
| Gulf Coast Jet Fuel Cost (average per liter, US$)(2) | 0.73 | 0.41 | 78.0% |
(1) Source: Central Bank of Brazil; (2) Source: Bloomberg; (3) Fuel expenses excluding hedge results and PIS/COFINS credits/liters consumed; (4) Average operating fleet excluding aircraft in sub-leasing and MRO. Certain calculations may not match with the quarterly information due to rounding; (5) Excluding non-recurring expenses related to fleet transformation.
Domestic Market
Demand in the domestic market reached 7,935 million RPK, up by 41.9% over 1Q21, reaching 87.3% of the 1Q19 RPK.
Supply in the domestic market, in turn, reached 9,769 million ASK, up by 39.6% over 1Q21 and 88.6% over 1Q19.
The load factor reached 81.2%, and the Company transported around 6.7 million Customers in 1Q22, up by 49.5% YoY.
| 4 |
International Market
Supply in the international market, measured in ASK, reached 340 million, and the demand recorded, measured in RPK, reached 257 million. Comparing to 1Q21, there is a distortion given the fact that the international operation on 1Q21 was almost null
In this period, GOL transported around 104,136 passengers in the international market.
Take-Offs Volume and Total Seats
In 1Q22, the total volume of the Company’s take-offs reached 48,746, up by 48.6% over 1Q21. Total seats available on the market reached 8.6 million, up by 50.7% YoY.
PRASK, RASK and Yield
Net PRASK in 1Q22 grew by 47.2% over 1Q21, reaching 29.79 cents (R$). The Company’s net RASK reached 31.85 cents (R$), up by 42.2% YoY. 1Q22 net yield reached 36.77 cents (R$), up by 45.2% compared to 1Q21.
All the above profitability indicators for the quarter also showed a significant increase compared to the same period in 2019, confirming the Company’s efficient capacity management and pricing.
Fleet
At the end of 1Q22, GOL’s total fleet included 142 Boeing 737 aircraft, with 111 NGs and 31 MAXs. In the same period, the fleet’s average age was 10.3 years (versus 10.7 years in 4Q21). GOL’s entire fleet consists of narrow-body aircraft, with 98% financed through an operating lease and 2% financed through a financial lease.
| Total Fleet at the End of Period | 1Q22 | 1Q21 | Chg. | 4Q21 | Chg. |
| Boeing 737 | 142 | 127 | 15 | 135 | 7 |
| 737-700 NG | 22 | 23 | -1 | 23 | -1 |
| 737-800 NG | 89 | 96 | -7 | 89 | 0 |
| 737 MAX 8 | 31 | 8 | 23 | 23 | 8 |
On March 31, 2022, GOL had 95 firm orders to acquire Boeing 737-MAX aircraft, 70 for 737-MAX 8 model and 25 for 737-MAX 10 model. The Company’s fleet plan provides the return of up to 19 operational aircraft by the end of 2022, with the flexibility to accelerate or reduce the volume of returns if necessary.
Glossary of Industry Terms
| · | AIRCRAFT LEASING: an agreement through which a company (the lessor) acquires a resource chosen by its client (the lessee) for subsequent rental to the latter for a determined period. |
| · | AVAILABLE SEAT KILOMETERS (ASK): The aircraft seating capacity is multiplied by the number of kilometers flown. |
| · | BARREL OF WEST TEXAS INTERMEDIATE (WTI): Intermediate oil from Texas, a region that serves as a reference to the name for concentrating oil exploration in the USA. WTI is used as a reference point in oil for the US derivatives markets. |
| · | BRENT: Oil produced in the North Sea, traded on the London Stock Exchange and used as a reference in the European and Asian derivatives markets. |
| · | TOTAL CASH: Total cash, financial investments, and restricted cash in the short- and long-term. |
| · | OPERATING COST PER AVAILABLE SEAT KILOMETER (CASK): operating expenses divided by the total number of available seat kilometers. |
| · | OPERATING COST PER AVAILABLE SEAT KILOMETER EX-FUEL (CASK EX-FUEL): operating cost divided by the total number of available seat kilometers excluding fuel expenses. |
| · | AVERAGE STAGE LENGTH: It is the average number of kilometers flown per stage performed. |
| · | EXCHANGEABLE SENIOR NOTES (ESN): Securities convertible into shares. |
| · | AIRCRAFT CHARTER: Flight operated by a Company that is out of its normal or regular operation. |
| · | BLOCK HOURS: Time in which the aircraft is in flight, plus taxi time. |
| · | LESSOR: The party renting a property or other asset to another party, the lessee. |
| · | LONG-HAUL FLIGHTS: Long-distance flights (in GOL’s case, flights of more than four hours’ duration). |
| · | REVENUE PASSENGERS: total number of passengers on board who have paid more than 25% of the full flight fare. |
| · | REVENUE PASSENGER KILOMETERS PAID (RPK): sum of the products of the number of paying passengers on a given flight and the length of the flight. |
| · | PDP: Credit for financing prepayments for the acquisition of aircraft. |
| · | Load Factor: Percentage of the aircraft’s capacity used in terms of seats (calculated by dividing the RPK/ASK). |
| · | Break-Even Load Factor: Load factor required for operating revenues to correspond to operating expenses. |
| 5 |
| · | Aircraft Utilization Rate: Average number of hours per day that the aircraft was in operation. |
| · | Passenger Revenue per Available Seat Kilometer (PRASK): total passenger revenue divided by the total number of available seat kilometers. |
| · | Operating Revenue per Available Seat Kilometers (RASK): The operating revenue is divided by the total number of available seat kilometers. |
| · | Sale-leaseback: A financial transaction whereby a resource is sold and then leased back, enabling the use of the resource without owning it. |
| · | SLOT: The right of an aircraft to take off or land at a given airport for a determined period. |
| · | Sub-Lease: An arrangement whereby a lessor in a rent agreement leases the item rented to a fourth party. |
| · | Freight Load Factor (FLF): Measure of capacity utilization (% of AFTKs used). Calculated by dividing FTK by AFTK. |
| · | Freight Tonne Kilometers (FTK): The demand for cargo transportation, calculated as the weight of the cargo in tons multiplied by the total distance traveled. |
| · | Available Freight Tonne Kilometer (AFTK): Weight of the cargo in tons multiplied by the kilometers flown. |
| · | Yield per Passenger Kilometer: The average value paid by a passenger to fly one kilometer. |
Disclaimer
This release contains forward-looking statements relating to the prospects of the business, estimates for operating and financial income (expenses), and those related to growth prospects of GOL, which are, by nature, subject to significant risks and uncertainties. The estimates and forecasts in this document involve known and unknown risks, uncertainties, contingencies, and other factors, many of which are beyond GOL’s control and which may lead the results, performances, or events to be substantially different from those expressed or implied in these statements. The forward-looking statements in this document are based on several assumptions related to GOL’s current and future business strategies and GOL’s future operating environment and are not a guarantee of future performance. GOL does not issue any statement or provide any guarantee that the results anticipated by the estimates in this document will be equivalent to those effectively achieved by GOL. Although GOL believes that the estimates here are reasonable, they may prove incorrect, and the final results may differ. These are merely estimates and projections and, as such, are based exclusively on management’s expectations for GOL. Such forward-looking statements depend, substantially, on external factors and risks presented in the disclosure documents filed by GOL, apply exclusively to the date they were issued and are, therefore, subject to change without prior notice.
| 6 |
Non-Accounting Measures
To be consistent with industry practice, the Company discloses so-called non-GAAP financial measures, which are not recognized under IFRS or other accounting standards, including “Net Debt”, “Total Liquidity” and “EBITDA”. GOL’s Management believes that disclosure of non-GAAP measures provides useful information to investors, financial analysts, and the public in their review of its operating performance and their comparison of its operating performance to the operating performance of other airlines and other industries. However, these non-GAAP items do not have standardized meanings and may not be directly comparable to similarly-titled items adopted by other companies. Potential investors should not rely on information not recognized under IFRS as a substitute for the GAAP measures of earnings or liquidity in making an investment decision.
| 7 |
Report of the Statutory Audit Committee (“SAC”)
The Statutory Audit Committee of Gol Linhas Aéreas Inteligentes S.A., in compliance with its legal and statutory obligations, has reviewed the Parent Company and Consolidated Quarterly Information (ITR) for the three-month period ended on March 31, 2022. Based on the procedures we have undertaken and considering the independent auditors’ review report issued by Grant Thornton Auditores Independentes and the information and explanations we have received during the quarter, we conclude that these documents can be submitted to the assessment of the Board of Directors.
São Paulo, April 26, 2022.
André Béla Jánszky
Member of the Statutory Audit Committee
Antônio Kandir
Member of the Statutory Audit Committee
Germán Pasquale Quiroga Vilardo
Member of the Statutory Audit Committee
| 8 |
Statement of the Executive Officers on the Parent Company and Consolidated Quarterly Information (ITR)
Under the provisions of CVM Instruction 480/09, the executive officers state that they have discussed, reviewed, and approved the Parent Company and Consolidated Quarterly Information (ITR) for the three-month period ended on March 31, 2022.
São Paulo, April 26, 2022.
Paulo Sérgio Kakinoff
Chief Executive Officer
Richard Freeman Lark Jr.
Executive Vice President, Chief Financial Officer, and Investor Relations Officer
| 9 |
Statement of the Executive officers on the Independent Auditors’ Review Report
Under the provisions of CVM Instruction 480/09, the Executive Board states that it has discussed, reviewed, and agreed with the conclusion of the review report from the independent auditor, Grant Thornton Auditores Independentes, on the Parent Company and Consolidated Quarterly Information (ITR) for the three-month period ended on March 31, 2022.
São Paulo, April 26, 2022.
Paulo Sérgio Kakinoff
Chief Executive Officer
Richard Freeman Lark Jr.
Executive Vice President, Chief Financial Officer, and Investor Relations Officer
| 10 |
(Free translation from the original issued in Portuguese. In the event of any discrepancies, the Portuguese language version shall prevail.)
Independent auditor’s report on review of interim financial information
To the Board of directors and shareholders of
Gol Linhas Aéreas Inteligentes S.A.
São Paulo – SP
Introduction
We have reviewed the accompanying individual and consolidated interim financial information of Gol Linhas Aéreas Inteligentes S.A. (the Company), comprised in the Quarterly Information Form for the quarter ended March 31, 2022, comprising the balance sheet as of March 31, 2022 and the respective statements of income, of comprehensive income, of changes in shareholders’ equity and of cash flows for the period of three months then ended, including the footnotes.
Management is responsible for the preparation of the individual interim financial information in accordance with the NBC TG 21 – Interim Financial Reporting and of the consolidated interim financial information in accordance with the NBC TG 21 and with the international standard IAS 34 – Interim Financial Reporting, as issued by the International Accounting Standards Board (Iasb), such as for the presentation of these information in accordance with the standards issued by the Brazilian Exchange Securities Commission, applicable to the preparation of interim financial information. Our responsibility is to express a conclusion on this interim financial information based on our review.
Review scope
We conducted our review in accordance with the Brazilian and International standards on reviews of interim information (NBC TR 2410 – Review of Interim Financial Information Performed by the Independent Auditor of the Entity and ISRE 2410 – Review of Interim Financial Information Performed by the Independent Auditor of the Entity, respectively). The review of interim information consists of making inquiries, primarily of persons responsible for the financial and accounting matters and applying analytical and other review procedures. A review is substantially less in scope than an audit conducted in accordance with the audit standards and, consequently, does not enable us to obtain assurance that we would become aware of all significant matters that might be identified in an audit. Accordingly, we do not express an audit opinion.
Conclusion on the individual interim financial information
Based on our review, nothing has come to our attention that causes us to believe that the individual interim financial information included in the quarterly information form referred to above has not been prepared, in all material respects, in accordance with NBC TG 21 applicable to the preparation of interim financial information, and presented in accordance with the standards issued by the Brazilian Securities and Exchange Commission.
| 11 |

Conclusion on the consolidated interim financial information
Based on our review, nothing has come to our attention that causes us to believe that the consolidated interim financial information included in the quarterly information form referred to above has not been prepared, in all material respects, in accordance with NBC TG 21 and IAS 34 applicable to the preparation of interim financial information, and presented in accordance with the standards issued by the Brazilian Securities and Exchange Commission.
Emphasis of matter
Significant uncertainty as to the ability to continue as a going concern
We draw attention to Note 1.4, which states that the individual and consolidated interim financial information were prepared under the assumption of going concern. As described in the aforementioned note, the Company has faced impacts in operations due to the effects of the COVID-19 pandemic, with an increase in net working capital deficit as of March 31, 2022 compared to December 31, 2021 and equity deficiency as of March 31, 2022 which, together with other events and conditions, indicate the existence of material uncertainty that may cast significant doubt about the Company’s ability to continue as a going concern. The plans and actions being developed by Management to restore the Company’s financial economic balance and financial position are described in Note 1. The individual and consolidated interim financial information do not include any adjustment that may arise from the result of such uncertainty. Our review conclusion is not qualified regarding this matter.
Other matters
Statements of value added
The quarterly information referred to above includes the individual and consolidated statements of value added for the period of three months ended March 31, 2022, prepared under the responsibility of the Company's management and presented as supplementary information for the purposes of IAS 34.
These statements were submitted to the same review procedures in conjunction with the review of the Company's interim financial information in order to conclude they are reconciliated to the interim financial information and to the accounting records, as applicable, and whether the structure and content are in accordance with the criteria established in the NBC TG 09 - Statement of Value Added. Based on our review, nothing has come to our attention that causes us to believe that the accompanying statements of value added were not prepared, in all material respects, in accordance with the individual and consolidated interim financial information taken as a whole.
São Paulo, April 26, 2022
Octavio Zampirollo Neto
Assurance Partner
Grant Thornton Auditores Independentes
| 8 |
 | Balance Sheets March 31, 2022 and December 31, 2021 (In thousand of Reais) |
Balance Sheet
| Parent Company | Consolidated | ||||
| Assets | Note | March 31, 2022 | December 31, 2021 | March 31, 2022 | December 31, 2021 |
| Current | |||||
| Cash and Cash Equivalents | 6 | 10,247 | 210,941 | 135,236 | 486,258 |
| Financial Investments | 7 | 4,829 | 4,377 | 314,058 | 291,363 |
| Trade Receivables | 8 | - | - | 956,479 | 850,683 |
| Inventories | 9 | - | - | 293,089 | 269,585 |
| Deposits | 10 | - | - | 166,274 | 191,184 |
| Advances to Suppliers and Third-Parties | 11 | 1,251 | 83 | 304,891 | 270,342 |
| Taxes to Recover | 12 | 14,342 | 10,159 | 225,445 | 176,391 |
| Rights from Derivative Transactions | 33.2 | - | - | 11,256 | 4,936 |
| Other Credits | 96,035 | 14,458 | 234,819 | 147,299 | |
| Total Current | 126,704 | 240,018 | 2,641,547 | 2,688,041 | |
| Noncurrent | |||||
| Financial Investments | 7 | 1 | 1 | 81,766 | 82,326 |
| Deposits | 10 | 47,750 | 47,534 | 1,615,900 | 1,757,842 |
| Advances to Suppliers and Third-Parties | 11 | - | - | 64,473 | 76,138 |
| Taxes to Recover | 12 | 1,211 | 4,464 | 41,611 | 72,976 |
| Deferred Taxes | 13 | 70,432 | 75,560 | 70,620 | 75,799 |
| Rights from Derivative Transactions | 33.2 | 77,294 | 107,170 | 77,294 | 109,124 |
| Other Credits | 2 | - | 38,788 | 41,718 | |
| Credits with Related Parties | 28.1 | 6,007,136 | 7,008,275 | - | - |
| Property, Plant & Equipment | 14 | 361,919 | 451,320 | 9,029,056 | 7,675,170 |
| Intangible Assets | 15 | - | - | 1,855,454 | 1,823,209 |
| Total Noncurrent | 6,565,745 | 7,694,324 | 12,874,962 | 11,714,302 | |
| Total | 6,692,449 | 7,934,342 | 15,516,509 | 14,402,343 | |
The accompanying notes are an integral part of the Parent Company and Consolidated Quarterly Information (ITR).
| 9 |
| Balance Sheets March 31, 2022 and December 31, 2021 (In thousand of Reais) |
| Parent Company | Consolidated | ||||
| Liabilities | Note | March 31, 2022 | December 31, 2021 | March 31, 2022 | December 31, 2021 |
| Current | |||||
| Loans and Financing | 16 | 127,960 | 164,304 | 721,158 | 634,614 |
| Leases to Pay | 17 | - | - | 1,970,753 | 2,057,687 |
| Suppliers | 18 | 47,403 | 84,335 | 1,860,462 | 1,820,056 |
| Suppliers – factoring | 19 | - | - | 9,786 | 22,733 |
| Labor Obligations | 169 | 180 | 346,765 | 374,576 | |
| Taxes to Collect | 20 | 297 | 585 | 335,406 | 122,036 |
| Landing Fees | - | - | 1,019,084 | 911,174 | |
| Advance Ticket Sales | 21 | - | - | 2,752,828 | 2,670,469 |
| Frequent-Flyer Program | 22 | - | - | 1,358,868 | 1,298,782 |
| Advances from Customers | - | - | 87,337 | 237,092 | |
| Provisions | 23 | - | - | 491,992 | 477,324 |
| Other Liabilities | 85,666 | 85,843 | 414,567 | 455,251 | |
| Total Current | 261,495 | 335,247 | 11,369,006 | 11,081,794 | |
| Noncurrent | |||||
| Loans and Financing | 16 | 8,374,731 | 9,857,264 | 9,575,353 | 11,265,416 |
| Leases to Pay | 17 | - | - | 8,455,821 | 8,705,297 |
| Suppliers | 18 | 16 | 16 | 58,688 | 78,914 |
| Labor Obligations | - | - | 149,306 | 25,919 | |
| Taxes to Collect | 20 | - | - | 46,643 | 24,414 |
| Landing Fees | - | - | 265,698 | 277,060 | |
| Frequent-Flyer Program | 22 | - | - | 323,944 | 318,349 |
| Provisions | 23 | - | - | 2,889,897 | 3,109,998 |
| Deferred Taxes | 13 | - | - | 727 | 411 |
| Obligations to Related Parties | 28.1 | 76,009 | 6,692 | - | - |
| Provision for Investment Losses | 24 | 15,675,601 | 18,292,878 | - | - |
| Other Liabilities | 431,714 | 495,923 | 508,543 | 568,449 | |
| Total Noncurrent | 24,558,071 | 28,652,773 | 22,274,620 | 24,374,227 | |
| Shareholders’ Equity | |||||
| Share Capital | 25.1 | 4,039,464 | 4,039,112 | 4,039,464 | 4,039,112 |
| Shares to Issue | - | 3 | - | 3 | |
| Treasury Shares | 25.2 | (40,548) | (41,514) | (40,548) | (41,514) |
| Capital Reserves | 212,980 | 208,711 | 212,980 | 208,711 | |
| Equity Valuation Adjustments | (739,690) | (1,053,082) | (739,690) | (1,053,082) | |
| Accumulated Losses | (21,599,323) | (24,206,908) | (21,599,323) | (24,206,908) | |
| Negative Shareholders’ Equity (Deficit) Attributable to the Parent Company | (18,127,117) | (21,053,678) | (18,127,117) | (21,053,678) | |
| Total | 6,692,449 | 7,934,342 | 15,516,509 | 14,402,343 | |
The accompanying notes are an integral part of the Parent Company and Consolidated Quarterly Information (ITR).
| 10 |
| Income Statement Quarters ended March 31, 2022 and 2021 (In thousands of Brazilian reais - R$, except basic and diluted earnings (loss) per share) |
| Parent Company | Consolidated | |||||
| Note | March 31, 2022 | March 31, 2021 | March 31, 2022 | March 31, 2021 | ||
| Net Revenue | ||||||
| Passenger Transportation | - | - | 3,011,802 | 1,416,278 | ||
| Cargo and Others | - | - | 208,650 | 151,349 | ||
| Total Net Revenue | 29 | - | - | 3,220,452 | 1,567,627 | |
| Cost from Services | 30 | - | - | (2,613,501) | (1,635,245) | |
| Gross Profit (Loss) | - | - | 606,951 | (67,618) | ||
| Operating Revenue (Expenses) | ||||||
| Selling Expenses | 30 | - | - | (227,124) | (103,779) | |
| Administrative Expenses | 30 | (16,105) | (27,580) | (365,448) | (363,193) | |
| Other Revenues and Expenses, Net | 30 | 64,265 | 489 | 62,762 | 12,086 | |
| Total Operating Expenses | 48,160 | (27,091) | (529,810) | (454,886) | ||
| Equity Income (Expense) | 24 | 2,105,300 | (2,097,170) | - | - | |
| Income (Loss) before Financial Results and Income Taxes | 2,153,460 | (2,124,261) | 77,141 | (522,504) | ||
| Financial Income (Expenses) | ||||||
| Financial Revenue | 31 | 43,801 | 30,045 | 18,256 | 13,124 | |
| Financial Expenses | 31 | (214,631) | (186,249) | (756,608) | (516,752) | |
| Derivative Financial Instruments | 31 | (2,966) | 72,490 | (5,666) | 73,754 | |
| Financial Revenues (Expenses), Net | (173,796) | (83,714) | (744,018) | (429,874) | ||
| Income (Loss) before Monetary and Exchange Rate Variation, Net and Income Tax and Social Contribution | 1,979,664 | (2,207,792) | (666,877) | (947,582) | ||
| Monetary and Foreign Exchange Rate Variation, Net | 31 | 633,049 | (324,749) | 3,404,882 | (1,537,240) | |
| Income (Loss) before Income Tax and Social Contribution | 2,612,713 | (2,532,541) | 2,738,005 | (2,484,822) | ||
| Income Tax and Social Contribution | ||||||
| Current | - | - | (124,976) | (28,831) | ||
| Deferred | (5,128) | 4,138 | (5,444) | 7,862 | ||
| Total Income Tax and Social Contribution | 13 | (5,128) | 4,138 | (130,420) | (20,969) | |
| Net Income (Loss) for the Period | 2,607,585 | (2,528,403) | 2,607,585 | (2,505,791) | ||
| Net Income (Loss) Attributable to: | ||||||
| Shareholders of the Parent Company | 2,607,585 | (2,528,403) | 2,607,585 | (2,528,403) | ||
| Non-Controlling Shareholders | - | - | - | 22,612 | ||
| Basic Income (Loss) per Share | 26 | |||||
| Per Common Share | 0.188 | (0.203) | 0.188 | (0.203) | ||
| Per Preferred Share | 6.607 | (7.105) | 6.607 | (7.105) | ||
| Diluted Income (loss) per Share | 26 | |||||
| Per Common Share | 0,188 | (0,203) | 0,188 | (0,203) | ||
| Per Preferred Share | 6,569 | (7,105) | 6,569 | (7,105) |
The accompanying notes are an integral part of the parent company and consolidated interim financial information.
| 11 |
| Statements of Comprehensive Income (Expenses) Quarters ended March 31, 2022 and 2021 (In thousands of Brazilian Reais - R$) |
| Parent Company | Consolidated | ||||
| March 31, 2022 | March 31, 2021 | March 31, 2022 | March 31, 2021 | ||
| Net Income (Loss) for the Period | 2,607,585 | (2,528,403) | 2,607,585 | (2,505,791) | |
| Other Comprehensive Income that will be Reversed to Income (Expenses) | |||||
| Cash Flow Hedge, Net of Income Tax and Social Contribution | 314,169 | 96,722 | 314,169 | 96,722 | |
| Cumulative Adjustment of Conversion into Subsidiaries | (777) | 16 | (777) | 29 | |
| 313,392 | 96,738 | 313,392 | 96,751 | ||
| Total Comprehensive Income (Expenses) for the Period | 2,920,977 | (2,431,665) | 2,920,977 | (2,409,040) | |
| Comprehensive Income (Expenses) Attributed to: | |||||
| Shareholders of the Parent Company | 2,920,977 | (2,431,665) | 2,920,977 | (2,431,665) | |
| Non-Controlling Shareholders | - | - | - | 22,625 | |
The accompanying notes are an integral part of the parent company and consolidated interim financial information.
| 12 |
| Statements of Changes in Shareholders’ Equity Quarters ended March 31, 2022 and 2021 (In thousands of Brazilian Reais - R$) |
DMPL
| Parent Company and Consolidated | ||||||||||||||
| Capital Reserves | Equity Valuation Adjustments | |||||||||||||
| Share Capital | Shares to Issue | Treasury Shares | Premium when Granting Shares | Special Premium Reserve of the Subsidiary | Share-Based Compensation | Unrealized Income (Expenses) on Hedge | Post-Employment Benefit | Other Comprehensive Income | Effects from Changes in the Equity Interest | Accumulated Losses | Negative Shareholders’ Equity (Deficit) Attributable to the Parent Company | Non-Controlling Shareholders | Total | |
| Balances on December 31, 2020 | 3,009,436 | 1,180 | (62,215) | 17,497 | 83,229 | 106,520 | (1,311,076) | (26,669) | 564 | 759,812 | (16,985,370) | (14,407,092) | 640,033 | (13,767,059) |
| Other Comprehensive Income (Expenses), Net | - | - | - | - | - | - | 96,722 | - | 16 | - | - | 96,738 | 13 | 96,751 |
| Net Income (Loss) for the Period | - | - | - | - | - | - | - | - | - | - | (2,528,403) | (2,528,403) | 22,612 | (2,505,791) |
| Total Comprehensive Income (Expenses) for the Period | - | - | - | - | - | - | 96,722 | - | 16 | - | (2,528,403) | (2,431,665) | 22,625 | (2,409,040) |
| Stock Option | - | - | - | - | - | 5,010 | - | - | - | - | - | 5,010 | 161 | 5,171 |
| Interim Dividends Distributed by the Subsidiary Smiles | - | - | - | - | - | - | - | - | - | - | - | - | (236,992) | (236,992) |
| Balances on March 31, 2021 | 3,009,436 | 1,180 | (62,215) | 17,497 | 83,229 | 111,530 | (1,214,354) | (26,669) | 580 | 759,812 | (19,513,773) | (16,833,747) | 425,827 | (16,407,920) |
| Balances on December 31, 2021 | 4,039,112 | 3 | (41,514) | 11,020 | 83,229 | 114,462 | (918,801) | 14,855 | 1,032 | (150,168) | (24,206,908) | (21,053,678) | - | (21,053,678) |
| Other Comprehensive Income (Expenses), Net | - | - | - | - | - | - | 314,169 | - | (777) | - | - | 313,392 | - | 313,392 |
| Net Income for the Period | - | - | - | - | - | - | - | - | - | - | 2,607,585 | 2,607,585 | - | 2,607,585 |
| Total Comprehensive Income (Expenses) for the Period | - | - | - | - | - | - | 314,169 | - | (777) | - | 2,607,585 | 2,920,977 | - | 2,920,977 |
| Stock Option | - | - | - | - | - | 5,235 | - | - | - | - | - | 5,235 | - | 5,235 |
| Transfer of Treasury Shares | - | - | 966 | (502) | - | (464) | - | - | - | - | - | - | - | - |
| Capital Increase due to Stock Options Exercised | 352 | (3) | - | - | - | - | - | - | - | - | - | 349 | - | 349 |
| Balances on March 31, 2022 | 4,039,464 | - | (40,548) | 10,518 | 83,229 | 119,233 | (604,632) | 14,855 | 255 | (150,168) | (21,599,323) | (18,127,117) | - | (18,127,117) |
The accompanying notes are an integral part of the parent company and consolidated interim financial information.
| 13 |
| Cash Flow Statements Quarters ended March 31, 2022 and 2021 (In thousands of Brazilian Reais - R$) |
| Parent Company | Consolidated | |||
| March 31, 2022 | March 31, 2021 | March 31, 2022 | March 31, 2021 | |
| Net Income (Loss) for the Period | 2,607,585 | (2,528,403) | 2,607,585 | (2,505,791) |
| Adjustments to Reconcile the Net Loss to Cash Generated from Operating Activities | ||||
| Depreciation – Aeronautical ROU | - | - | 251,885 | 140,024 |
| Depreciation and Amortization – Others | - | - | 145,664 | 196,275 |
| Allowance for Expected Loss on Trade Receivables | - | - | (994) | (815) |
| Provision for Inventory Obsolescence | - | - | 280 | 50 |
| Provision for Impairment of Deposits | - | - | 6,284 | 9,678 |
| Provision for Losses on Advance to Suppliers and Third Parties | - | - | (144) | (4,640) |
| Adjustment to Present Value of Provision for Aircraft Return | - | - | 85,828 | 18,870 |
| Deferred Taxes | 5,128 | (4,138) | 5,444 | (7,862) |
| Equity Income (Expense) | (2,105,300) | 2,097,170 | - | - |
| Disposals of Property, Plant and Equipment and Intangible Assets | - | - | 1,345 | 500 |
| Sale-Leaseback | - | - | (55,491) | - |
| Reversal of Provisions | - | - | 172,502 | 184,041 |
| Actuarial Losses from Post-Employment Benefits | - | - | - | 4,353 |
| Exchange Rate and Cash Changes, Net | (616,679) | 318,496 | (3,327,120) | 1,503,093 |
| Interest on Loans and Leases and Amortization of Costs, Premiums and Goodwill | 172,696 | 136,805 | 525,121 | 421,967 |
| Derivative Financial Instruments Recognized in Income (Loss) | 2,966 | (70,439) | 34,457 | (27,103) |
| Provision for Labor Liabilities | - | - | - | 50,348 |
| Share-Based Compensation | - | - | 5,235 | 5,171 |
| Recovery of One-Off Tax Credits | - | - | - | (57,422) |
| Other Provisions | - | (16) | 4,047 | (1,007) |
| Adjusted Net Income (Expenses) | 66,396 | (50,525) | 461,928 | (70,270) |
| Changes in Operating Assets and Liabilities: | ||||
| Financial Investments | 709 | 165 | (23,696) | 13,820 |
| Trade Receivables | - | - | (113,501) | 201,276 |
| Inventories | - | - | (23,784) | 7,252 |
| Deposits | (637) | 671 | (52,098) | (36,742) |
| Advance to Suppliers and Third Parties | (1,168) | (1,005) | (22,740) | 167,636 |
| Taxes to Recover | (930) | 597 | (17,689) | 86,215 |
| Variable Leases | - | - | (5,106) | 12,353 |
| Suppliers | (40,670) | (23,605) | 101,236 | (117,066) |
| Suppliers – factoring | - | - | (12,947) | - |
| Labor Obligations | (11) | 4 | 95,576 | (53,944) |
| Taxes to Collect | (288) | 260 | 235,975 | 2,148 |
| Landing Fees | - | - | 96,548 | 32,650 |
| Advance from Ticket Sales | - | - | 82,359 | (388,760) |
| Frequent-Flyer Program | - | - | 65,681 | 63,980 |
| Advances from Customers | - | - | (149,755) | 52,882 |
| Provisions | - | - | (61,954) | (83,492) |
| Derivatives | - | - | (5,369) | 133,331 |
| Other Credits (Liabilities), Net | (145,965) | 108,577 | (34,737) | 220,338 |
| Interest Paid | (182,609) | (191,018) | (192,068) | (215,462) |
| Income Tax and Social Contribution Paid | - | - | (376) | (23,506) |
| Net Cash Flows (Used in) from Operating Activities | (305,173) | (155,879) | 423,483 | 4,639 |
| 14 |
| Cash Flow Statements Quarters ended March 31, 2022 and 2021 (In thousands of Brazilian Reais - R$) |
| Parent Company | Consolidated | |||
| March 31, 2022 | March 31, 2021 | March 31, 2022 | March 31, 2021 | |
| Loans Receivable from Related Parties | 137,235 | (31,626) | - | - |
| Financial Investments in Subsidiary | - | (41) | - | 127,445 |
| Dividends and Interest on Shareholders’ Equity Received through Subsidiary | - | 24,120 | - | - |
| Prepayment for Future Capital Increase in a Subsidiary | (193,350) | (66,000) | - | - |
| Advances for Property, Plant & Equipment Acquisition, Net | - | - | (39,517) | (65,574) |
| Acquisition of Property, Plant & Equipment | - | (111,429) | (175,546) | (56,426) |
| Sale-leaseback Transactions Received | - | - | 69,819 | - |
| Acquisition of Intangible Assets | 89,401 | - | (49,032) | (26,084) |
| Net Cash Flows (Used in) from Investment Activities | 33,286 | (184,976) | (194,276) | (20,639) |
| Loans and Financing Issued, Net of Costs | - | - | - | 10,952 |
| Loans Payments | - | (103,179) | (34,067) | (123,541) |
| Lease Payments - Aeronautical ROU | - | - | (525,130) | (125,302) |
| Lease Payments – Others | - | - | (2,890) | (3,226) |
| Loans from Related Parties | 75,276 | - | - | - |
| Dividends and Interest on Shareholders’ Equity Paid to Non-Controlling Interests | - | - | - | (23,139) |
| Capital Increase | 349 | - | 349 | - |
| Net Cash Flows (Used in) from Financing Activities | 75,625 | (103,179) | (561,738) | (264,256) |
| Foreign Exchange Variation on Cash Held in Foreign Currencies | (4,432) | 20,752 | (18,491) | 22,139 |
| Net Cash Decrease in Cash and Cash Equivalents | (200,694) | (423,282) | (351,022) | (258,117) |
| Cash and Cash Equivalents at the Start of Fiscal Year | 210,941 | 423,937 | 486,258 | 662,830 |
| Cash and Cash Equivalents at the End of the Period | 10,247 | 655 | 135,236 | 404,713 |
Transactions that do not affect cash are presented in Note 34 of this Quarterly Information.
The accompanying notes are an integral part of the parent company and consolidated interim financial information.
| 15 |
| Statement of Value Added Quarters ended March 31, 2022 and 2021 (In thousands of Brazilian Reais - R$) |
| Parent Company | Consolidated | |||
| March 31, 2022 | March 31, 2021 | March 31, 2022 | March 31, 2021 | |
| Revenues | ||||
| Passenger, Cargo, and Other Transportation | - | - | 3,347,877 | 1,643,979 |
| Other Operational Revenues | 50,110 | 489 | 98,858 | 74,761 |
| Allowance for Expected Loss on Trade Receivables | - | - | (1,233) | (1,095) |
| 50,110 | 489 | 3,445,502 | 1,717,645 | |
| Inputs Acquired from Third Parties (includes ICMS and IPI) | ||||
| Fuel and Lubricant Suppliers | - | - | (1,251,140) | (581,517) |
| Materials, Energy, Third-Party Services, and Others | (811) | (24,076) | (863,361) | (681,532) |
| Aircraft Insurance | - | - | (9,447) | (15,945) |
| Sales and Marketing | - | - | (165,719) | (67,026) |
| Gross Added Value | 49,299 | (23,587) | 1,155,835 | 371,625 |
| Depreciation – Aeronautical ROU | - | - | (251,885) | (144,145) |
| Depreciation and Amortization – Others | - | - | (145,664) | (192,154) |
| Net Added Value Produced by the Company | 49,299 | (23,587) | 758,286 | 35,326 |
| Added Value Received on Transfers | ||||
| Equity Income (Expenses) | 2,105,300 | (2,097,170) | - | - |
| Derivative Financial Instruments | (2,966) | 72,490 | (5,666) | 73,754 |
| Financial Revenue | 48,053 | 82,420 | 26,390 | 77,132 |
| Total Value Added (Distributed) to Distribute | 2,199,686 | (1,965,847) | 779,010 | 186,212 |
| Distribution of Value Added: | ||||
| Direct Compensation | 946 | 3,353 | 394,465 | 329,443 |
| Benefits | - | - | 64,496 | 53,110 |
| FGTS | - | - | 33,578 | 20,421 |
| Employees | 946 | 3,353 | 492,539 | 402,974 |
| Federal | 5,761 | (3,536) | 300,664 | 146,045 |
| State | - | - | 5,383 | 3,721 |
| Municipal | - | - | 348 | 610 |
| Taxes, Fees, and Contributions | 5,761 | (3,536) | 306,395 | 150,376 |
| Interest and Monetary and Foreign Exchange Rate Variation - Aeronautical ROU | - | - | (1,472,360) | 955,716 |
| Interest and Monetary and Foreign Exchange Rate Variation - Others | (414,645) | 562,739 | (1,207,716) | 1,151,399 |
| Rents | - | - | 20,482 | 31,448 |
| Others | 39 | - | 32,085 | 90 |
| Third-Party Capital Compensation | (414,606) | 562,739 | (2,627,509) | 2,138,653 |
| Net Income (Loss) for the Period | 2,607,585 | (2,528,403) | 2,607,585 | (2,528,403) |
| Net Profit of the Period Attributed to Non-Controlling Shareholders | - | - | - | 22,612 |
| Shareholders’ Equity Compensation | 2,607,585 | (2,528,403) | 2,607,585 | (2,505,791) |
| Total Value Added Distributed (to Distribute) | 2,199,686 | (1,965,847) | 779,010 | 186,212 |
The accompanying notes are an integral part of the parent company and consolidated interim financial information.
| 16 |
| Notes on the Parent Company and Consolidated Quarterly Information (ITR) March 31, 2022 (In thousands of Brazilian Reais - R$, except when otherwise indicated) |
| 1. | Operating Context |
Gol Linhas Aéreas Inteligentes S.A. (“Company” or “GOL”) is a limited liability company incorporated on March 12, 2004 under Brazilian laws. The Company’s bylaws states that the corporate purpose is exercising the equity control of GOL Linhas Aéreas S.A. (“GLA”), which provides scheduled and non-scheduled air transportation services for passengers and cargo, maintenance services for aircraft and components, develops frequent-flyer programs, among others.
The Company’s shares are traded on B3 S.A. - Brasil, Bolsa, Balcão (“B3”) and on the New York Stock Exchange (“NYSE”) under the ticker GOLL4 and GOL, respectively. The Company adopts B3’s Special Corporate Governance Practices Level 2 and is part of the Special Corporate Governance (“IGC”) and Special Tag Along (“ITAG”) indexes, created to distinguish companies that commit to special corporate governance practices.
The Company’s official headquarters are located at Praça Comandante Linneu Gomes, s/n, portaria 3, prédio 24, Jardim Aeroporto, São Paulo, Brazil.
1.1. Impacts and Management’s Measures regarding Covid-19
The airline industry was significantly impacted in the first days of 2022 due to the significant growth in the number of Covid-19 cases, with the spread “omicron” variant, which led to the cancellation of flights by several companies in Brazil and in the world. Through its business model and dynamic operational air network management carried out by the Management since the beginning of the pandemic, GOL did not observe any impacts on its operation in the period, with regularity above 99% in January 2022 and market leadership in domestic routes with 38.5% market share this month. The flexible business model based on a single type of fleet proved to be decisive and suitable all instabilities caused by the Covid-19 pandemic.
During March 2022, with the slowdown in registered cases of Covid-19, several states and cities suspended the use of face masks, as well as other health restrictions, which contributed to the continuity of the resumption of domestic demand.
In the first quarter of 2022, Company increased offer, measured by available seat kilometer (ASK), by 44.4% compared to the same period in 2021 and demand grew by 46.5% following the same comparison, load factor increased by 1.1 percentage points (from 79.9% in the first quarter of 2021 to 81.0% in the first quarter of 2022). In the scenario of gradual resumption of demand, Company had an income before financial results and income tax and social contribution of R$77,141, for the first time since the beginning of the pandemic, in the first quarter of 2020.
The Company, through its Executive Committee, which is entirely formed by the management board members, works promptly to support society, monitor demand, and define financial and operational strategies.
In 2022, GOL maintained the initiative to transport Covid-19 vaccines for free, with GOLLOG and health professionals to work directly in the fight against the pandemic, besides crediting 1,000 Smiles’ miles for each GOL flight, at no cost. There are also active and strict protocols for aircraft hygiene, as well as safety and health, together with actions to reduce human contact throughout the entire chain.
| 17 |
| Notes on the Parent Company and Consolidated Quarterly Information (ITR) March 31, 2022 (In thousands of Brazilian Reais - R$, except when otherwise indicated) |
1.1.1 Impacts on the Parent Company and Consolidated Quarterly Information
The main pandemic’s impact continues to be related to the reduction in operational air network, to meet the lower demand and crew availability, which was verified by the lower Company’s net revenue compared to pre-pandemic periods.
The table below details the reclassifications made in the period, which are directly related to the Covid-19 pandemic and additional disclosures:
| Consolidated | |||
| Income Statement - Reclassifications | Cost of Services | Other Revenues and Expenses, Net | |
| Flight Equipment Depreciation - Idleness | (a) | 36,772 | (36,772) |
| (a) | Due to the drop in the number of flights operated, where the Company incurred with the burden of time, by analogy to the provisions of CPC 16 (R1) - Inventories, equivalent to IAS 2, expenses and depreciation of flight equipment not directly related to the revenues generated in the period, called idleness, were reclassified from the group of costs of services to the group of other revenues and expenses, net. |
Like all other business organizations, the Company cannot foresee the duration of the pandemic and the extent of the impacts caused by it on future business, results, and cash generation. For this reason, when preparing this quarterly information, the Management considered the most recent forecasts available, duly reflected in the Company’s business plans. In the period ended March 31, 2022, no adjustment was needed regarding impairments on the Company’s Recoverable Taxes, Deferred Tax Assets, Property, Plant & Equipment, and Intangible Assets.
| 1.2. | Measures taken by Management regarding the Russian invasion of Ukraine |
On February 24, 2022, Russia started a military invasion of Ukraine, marking a sharp escalation in the existing conflict between these countries. The invasion received widespread condemnation from the international community, including sanctions aimed at crippling the Russian economy.
As a result of the invasion, Brent and WTI oil prices rose significantly, quoted above US$100 a barrel in March 31, 2022, with a direct impact on jet fuel, as describe in Note 30.
GOL's Management works with the Brazilian Association of Airlines (ABEAR) in negotiations with the federal government to contain the price increase and the consequent transfer through the increase in ticket prices. During the quarter ended March 31, 2022, given the increases in Brazilian jet fuel prices, Company reviewed financial projections, including its offer expectation measured by ASK.
| 18 |
| Notes on the Parent Company and Consolidated Quarterly Information (ITR) March 31, 2022 (In thousands of Brazilian Reais - R$, except when otherwise indicated) |
| 1.3. | Corporate Structure |
The Company’s corporate structure and equity interest in the capital of its subsidiaries, on March 31, 2022, are shown below:
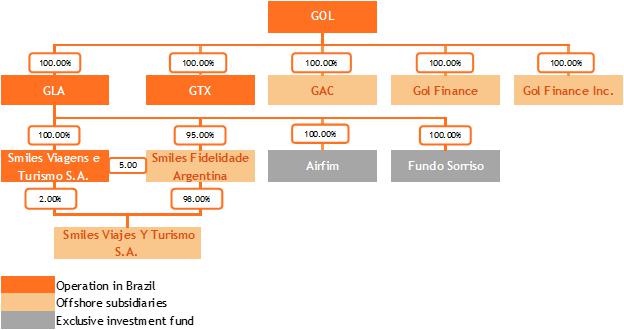
| Entity | Incorporation Date | Location | Principal Activity | Type of Control | % of Interest in the share capital | |
| Mar 31, 2022 | Dec 31, 2021 | |||||
| GAC | March 23, 2006 | Cayman Islands | Aircraft acquisition | Direct | 100.00 | 100.00 |
| Gol Finance Inc. | March 16, 2006 | Cayman Islands | Fundraising | Direct | 100.00 | 100.00 |
| Gol Finance | June 21, 2013 | Luxembourg | Fundraising | Direct | 100.00 | 100.00 |
| GLA | April 9, 2007 | Brazil | Flight transportation | Direct | 100.00 | 100.00 |
| GTX | February 8, 2021 | Brazil | Equity investments | Direct | 100.00 | 100.00 |
| Smiles Viagens | August 10, 2017 | Brazil | Tourism agency | Indirect | 100.00 | 100.00 |
| Smiles Fidelidade Argentina (a) | November 7, 2018 | Argentina | Loyalty program | Indirect | 100.00 | 100.00 |
| Smiles Viajes y Turismo (a) | November 20, 2018 | Argentina | Tourism agency | Indirect | 100.00 | 100.00 |
| AirFim | November 7, 2003 | Brazil | Investment fund | Indirect | 100.00 | 100.00 |
| Fundo Sorriso | July 14, 2014 | Brazil | Investment fund | Indirect | 100.00 | 100.00 |
| (a) | Companies with functional currency in Argentine pesos (ARS). |
The subsidiaries GAC Inc., GOL Finance and GOL Finance Inc. are entities incorporated with the specific purpose of continuing the financial operations and related to the Company's fleet. They do not have an independent management structure and are unable to make independent decisions, thus, the assets and liabilities of these entities are consolidated in the parent company.
GTX S.A., directly controlled by the Company, is in a pre-operational stage and its corporate purpose is to manage its own assets and participate in the capital of other companies.
Smiles Viagens e Turismo S.A. (“Smiles Viagens”), has as main purpose intermediate travel organization services, by booking or selling airline tickets, accommodation, tourism packages, among others. The subsidiaries Smiles Fidelidade Argentina S.A. and Smiles Viajes Y Turismo S.A., both headquartered in Buenos Aires, Argentina, have the purpose to promote operations of the Smiles Program and the sale of airline tickets in that country.
| 19 |
| Notes on the Parent Company and Consolidated Quarterly Information (ITR) March 31, 2022 (In thousands of Brazilian Reais - R$, except when otherwise indicated) |
The investment funds Airfim and Fundo Sorriso, controlled by GLA, have the characteristic of an exclusive fund and act as an extension to carry out operations with derivatives and investments, so that the Company consolidates the assets and liabilities of this fund in its financial statements.
| 1.4. | Capital Structure and Net Current Capital |
On March 31, 2022, the net working capital is negative by R$8,727,459 (negative by R$8,393,753 on December 31, 2021). There was a higher negative net working capital due to investments and obligations with customers to prepare for the high season. Of the negative net working capital, on March 31, 2022, R$4,111,696 refers to Advance Ticket Sales and the Frequent-Flyer Program (R$3,969,251 on December 31, 2021), which are expected to be substantially recognized with services provided by the Company.
On March 31, 2022, the Company also had a Deficit Attributed to Equity Holders of the Parent Company of R$18,127,117 (R$21,053,678 on December 31, 2021). The variation observed in the period ended March 31, 2022 is mainly due to the Company´s profit and the exchange rate, with evaluation of the Real against the U.S. Dollar.
The operations of the Company are sensitive to changes in the economic scenario and to the volatility of the Real, given that around 92.8% of its indebtedness (loans and financing and leases) are exposed to the U.S. dollar (“US$”) and 46.0% of its costs are also pegged to the U.S. currency, and its ability to adjust the price of fees charged from its customers to recapture the change of the US$ depends on the rational (offer) capacity and behavior of competitors.
Over the past five years, Management has taken many measures to adapt the size of GOL’s fleet to demand, matching the supply of seats to the level of demand and thus keeping high load factors, reducing costs and adjusting its capital structure, as well as implementing initiatives to restructure its balance sheet. In addition, the Company signed an exclusive codeshare agreement with American Airlines with a US$200 million investment made to the Company's capital, with effects in the financial information on second quarter 2022, as described in Note 36.
Our Parent Company and Consolidated Quarterly Information have been prepared on an accounting base of continuity, which includes the continuity of operations, realization of assets and compliance with liabilities and commitments in the usual course of business, in compliance with the business plan prepared by Management, reviewed and approved, at least annually, by GOL’s Board of Directors.
Although there is still significant uncertainty about how long it will take for the airline industry to recover, and this leads to a material uncertainty about our ability to remain in operation, on March 31, 2022, the parent company and consolidated quarterly information do not include any adjustments that may result from the inability to continue operating.
| 1.5. | Compliance Program |
Since 2016, we have taken several measures to strengthen and expand our internal control and compliance programs, which include:
· hiring specialized companies to evaluate risks and review internal controls related to fraud and corruption;
· integration the compliance and internal controls functions in the same department, which reports directly to our chief executive officer, and has independent access to our Board of Directors and Statutory Audit Committee;
| 20 |
| Notes on the Parent Company and Consolidated Quarterly Information (ITR) March 31, 2022 (In thousands of Brazilian Reais - R$, except when otherwise indicated) |
· monitoring transactions involving politically exposed persons;
· improvement of supervision procedures of the execution of services hired from third parties;
· updating our hiring policies and the management of our contracts flows; and
· review of the Company’s Code of ethics, Manual of conduct and several compliance policies, including the mandatory training policy.
Management has been constantly reinforcing our commitment towards improvement of our internal control and compliance programs to our employees, customers and suppliers.
In December 2016, GOL entered into an agreement with the Brazilian Federal Public Ministry, pursuant to which agreed to pay R$12.0 million in fines and make improvements to our compliance program. In turn, the Federal Public Ministry agreed not to bring any criminal or civil suits related to activities that are the subject of the agreement. In addition, the Company paid R$4.2 million in fines to the Brazilian tax authorities.
The Company voluntarily informed the U.S. Department of Justice (“DoJ”), the Securities and Exchange Commission (“SEC”) and the Comissão de Valores Mobiliários (“CVM”) of the external independent investigation hired by the Company and of the agreement with the Federal Public Ministry.
The external independent investigation, was concluded in April 2017, revealed that certain immaterial payments were made to politically exposed persons. None of our current employees, representatives or members of Company’s Board of Directors or Management knew of any illegal purpose behind any of the identified transactions or of any illicit benefit to the Company arising out of the investigated transactions.
The Company reported the conclusions of the investigation to the relevant authorities and will keep them informed of any developments, as well as collaborate and discuss their analysis with them, which may impose significant fines and possibly other sanctions.
| 1.6. | Acquisition of MAP Transportes Aéreos |
On June 8, 2021, GOL signed an agreement to acquire MAP Transportes Aéreos Ltda., a domestic Brazilian airline with routes to regional destinations and from Congonhas Airport in São Paulo, considering the Company's commitment to expand the air transportation demand and rationally consolidate in the domestic market as the country's economy recovers from Covid-19.
MAP will be acquired for R$28 million to be paid only after meeting all precedent conditions, through 100,000 preferred shares (GOLL4) at R$28.00 per share and R$25 million in cash in 24 monthly installments. At closing, the Company will assume up to R$100 million in MAP's financial commitments.
This transaction should bring as main benefits: (i) expanded new routes; (ii) higher seat supply to historically under-offered markets; and (iii) improved efficient operations.
On December 30, 2021, through SG Order 1929/2021, the Administrative Council for Economic Defense (CADE) approved the operation without restrictions. The transaction’s conclusion is subject to other conditions, which have not yet been fulfilled. Therefore, on March 31, 2022, there are no impacts on the Company's Parent Company and Consolidated Quarterly Information.
| 21 |
| Notes on the Parent Company and Consolidated Quarterly Information (ITR) March 31, 2022 (In thousands of Brazilian Reais - R$, except when otherwise indicated) |
| 1.7. | Acceleration of fleet transformation |
Following the plan disclosed in the fiscal year ended December 31, 2021, GOL continued the execution of fleet transformation acceleration plan on March 31, 2022, receiving 8 Boeing 737-MAX aircraft though leasing contracts, 3 of which have purchase option.
The Boeing 737-MAX consumes around 15% less fuel and produces around 16% less carbon and 40% less noise, besides having a longer flight range when compared to Boeing 737-NG aircraft.
With the demand’s recovery, the advanced vaccination in several states and markets, operations are resuming pre-pandemic levels and macroeconomic variables linked to costs due to the jet fuel price significantly higher, there is an increased need to accelerate the replacement of the current fleet of 737 NG with the objective of operational efficiency gains.
In addition, the Company managed to obtain agreements to acquire new 737 MAX aircraft with more favorable conditions compared to the pre-pandemic period, due to new facility lines to finance these aircraft and balance the Company's financing portfolio.
Due to the fleet transformation, Company will return 737-NG aircraft, with relevant future disbursements estimated, as disclosed in Note 23.2, which may be compensated with deposits disclosed in Note 10.
| 2. | Message from the Management, base to Prepare and Present the Parent Company and Consolidated Quarterly Information (ITR) |
The Company’s Parent Company Quarterly Information were prepared in accordance with accounting practices adopted in Brazil. The accounting practices adopted in Brazil include those in the Brazilian Corporation Law and in the technical pronouncements, guidelines and interpretations issued by the Accounting Pronouncements Committee (“CPC”), approved by the Federal Accounting Council (“CFC”) and the Brazilian Securities and Exchange Commission (“CVM”).
The Company’s Consolidated Quarterly Information was prepared in accordance with accounting practices adopted in Brazil and the International Financial Reporting Standards (“IFRS”) issued by the International Accounting Standards Board (“IASB”).
The Company’s Parent Company and Consolidated Quarterly Information (ITR) was prepared using the Brazilian real (“R$”) as the functional and presentation currency. Figures are expressed in thousands of Brazilian reais, except when stated otherwise. The items disclosed in foreign currencies are duly identified when applicable.
The Parent Company and Consolidated Quarterly Information (ITR) preparation requires the Management to make judgments, use estimates, and adopt assumptions affecting the amounts presented of revenues, expenses, assets, and liabilities. However, the uncertainty inherent in these judgments, assumptions and estimates could give rise to results that require a significant adjustment to the book value of certain assets and liabilities in future reporting periods.
When preparing this Parent Company and Consolidated Quarterly Information (ITR), the Management used disclosure criteria, considering regulatory aspects and the relevance of the transactions to understand the changes in the Company’s economic and financial position and its performance since the end of the fiscal year ended December 31, 2021, as well as the update of relevant information included in the annual financial statements disclosed on March 14, 2022.
| 22 |
| Notes on the Parent Company and Consolidated Quarterly Information (ITR) March 31, 2022 (In thousands of Brazilian Reais - R$, except when otherwise indicated) |
The Management confirms that all material information in this Parent Company and Consolidated Quarterly Information (ITR) is being demonstrated and corresponds to the information used by the Management in the development of its business management activities.
The Parent Company and Consolidated Quarterly Information (ITR) has been prepared based on historical cost, except for the following material items recognized in the statements of financial position:
| · | cash, cash equivalents and financial investments measured at fair value; |
| · | derivative financial instruments measured at fair value; and |
| · | investments accounted for using the equity method. |
The Company’s Parent Company and Consolidated Quarterly Information (ITR) for the period ended March 31, 2022, has been prepared considering that the Company will continue as a going concern, realizing assets, and settling liabilities in the normal course of business, as per Note 1.4.
| 3. | Approval of the Parent Company and Consolidated Quarterly Information |
The Board of Directors authorized this Parent Company and Consolidated Quarterly Information (ITR) at a Meeting held on April 26, 2022.
| 4. | Summary of Significant Accounting Practices |
The Parent Company and Consolidated Quarterly Information (ITR) presented herein was prepared based on policies, accounting practices and estimate calculation methods adopted and presented in detail in the annual financial statements for the year ended December 31, 2021, released on March 14, 2022.
| 4.1. | New Accounting Standards and Pronouncements Adopted in the Current Year |
The following amendments to accounting standards became effective for periods beginning after January 1, 2022:
| · | Onerous contracts – Costs of fulfilling a contract (Amendments to IAS 37); |
| · | Property, plant and equipment – Proceeds before intended use (Amendments to IAS 16); |
| · | Financial instruments - Fees in the ’10 per cent’ test for derecognition of financial liabilities (Amendments to IFRS 9); |
| · | Annual improvements to IFRS Standards 2018-2020 (Amendments to IFRS 1, IFRS 16 and IAS 41); and |
| · | References to Conceptual Framework (Amendments to IFRS 3). |
These changes did not impact the Company's quarterly information. Additionally, in the period ended March 31, 2022, no new standards or pronouncements were published which are expected to impact the Company's quarterly information. Finally, the Company did not opt for the early adoption of standards or pronouncements.
| 4.2. | Foreign Currency Transactions |
Foreign currency transactions are recorded at the exchange rate change prevailing on the transactions' date. Monetary assets and liabilities designated in foreign currency are calculated based on the exchange rate change on the balance sheet date. Any difference resulting from the translation of currencies is recorded under the item “Monetary and Foreign Exchange Rate Variation, Net” in the income statement for the period.
| 23 |
| Notes on the Parent Company and Consolidated Quarterly Information (ITR) March 31, 2022 (In thousands of Brazilian Reais - R$, except when otherwise indicated) |
The main exchange rates in reais in effect on the base date of this Parent Company and Consolidated Quarterly Information (ITR) are as follows:
| Final Rate | Average Rate | |||
| March 31, 2022 | December 31, 2021 | March 31, 2022 | March 31, 2021 | |
| U.S. Dollar | 4,7378 | 5,5805 | 4,9769 | 5,6383 |
| Argentinian Peso | 0,0427 | 0,0543 | 0,0455 | 0,0619 |
| 5. | Seasonality |
Under normal economic and social conditions, the Company expects revenues and operating income (expense) from its flights to be at their highest levels in the summer and winter vacation periods, in January and July, respectively, and during the last weeks of December and in the year-end holiday period. Given the high proportion of fixed costs, this seasonality tends to drive changes in operating income (expense) across the fiscal-year quarters. In the current context, the operations have also shown a behavior negatively correlated with the number of cases and deaths caused by Covid-19.
| 6. | Cash and Cash Equivalents |
| Parent Company | Consolidated | |||
| March 31, 2022 | December 31, 2021 | March 31, 2022 | December 31, 2021 | |
| Cash and Bank Deposits | 9,900 | 2,981 | 92,702 | 116,123 |
| Cash Equivalents | 347 | 207,960 | 42,534 | 370,135 |
| Total | 10,247 | 210,941 | 135,236 | 486,258 |
The breakdown of cash equivalents is as follows:
| Parent Company | Consolidated | |||
| March 31, 2022 | December 31, 2021 | March 31, 2022 | December 31, 2021 | |
| Domestic Currency | ||||
| Private Bonds | 253 | 207,656 | 40,880 | 329,235 |
| Automatic Investments | 94 | 304 | 1,631 | 40,873 |
| Total Domestic Currency | 347 | 207,960 | 42,511 | 370,108 |
| Foreign Currency | ||||
| Private Bonds | - | - | 23 | 27 |
| Total Foreign Currency | - | - | 23 | 27 |
| Total | 347 | 207,960 | 42,534 | 370,135 |
| 24 |
| Notes on the Parent Company and Consolidated Quarterly Information (ITR) March 31, 2022 (In thousands of Brazilian Reais - R$, except when otherwise indicated) |
| 7. | Financial Investments |
| Parent Company | Consolidated | ||||
| Weighted Average Profitability (p.a.) | March 31, 2022 | December 31, 2021 | March 31, 2022 | December 31, 2021 | |
| Domestic Currency | |||||
| Government Bonds | 116.3% do CDI | - | - | 632 | 2,042 |
| Private Bonds | 98.2% do CDI | 482 | 306,881 | 288,056 | |
| Investment Funds | 67.0% do CDI | 4,348 | 4,378 | 12,435 | 12,042 |
| Total Domestic Currency | 4,830 | 4,378 | 319,948 | 302,140 | |
| Foreign Currency | |||||
| Private Bonds | 0.4% | - | - | 28,513 | 33,570 |
| Investment Funds | - | - | 47,363 | 37,979 | |
| Total Foreign Currency | - | - | 75,876 | 71,549 | |
| Total | 4,830 | 4,378 | 395,824 | 373,689 | |
| Current | 4,829 | 4,377 | 314,058 | 291,363 | |
| Noncurrent | 1 | 1 | 81,766 | 82,326 | |
Of the total amount recorded in the parent company and in the consolidated on March 31, 2022, R$4,325 and R$346,482 (R$4,123 and R$333,984 on December 31, 2021), respectively, refer to financial investments used as guarantees linked to deposits for lease operations, derivative financial instruments, lawsuits and loans and financing.
| 8. | Trade Receivables |
| Consolidated | ||
| March 31, 2022 | December 31, 2021 | |
| Domestic Currency | ||
| Credit Card Administrators | 287,839 | 200,601 |
| Travel Agencies | 411,688 | 439,698 |
| Cargo Agencies | 34,833 | 27,418 |
| Partner Airlines | 12,290 | 11,921 |
| Others | 31,929 | 18,852 |
| Total Domestic Currency | 778,579 | 698,490 |
| Foreign Currency | ||
| Credit Card Administrators | 102,173 | 77,379 |
| Travel Agencies | 52,221 | 38,999 |
| Cargo Agencies | 242 | 211 |
| Partner Airlines | 22,666 | 27,863 |
| Others | 18,884 | 27,021 |
| Total Foreign Currency | 196,186 | 171,473 |
| Total | 974,765 | 869,963 |
| Estimated Losses from Doubtful Accounts | (18,286) | (19,280) |
| Total Trade Receivables | 956,479 | 850,683 |
| 25 |
| Notes on the Parent Company and Consolidated Quarterly Information (ITR) March 31, 2022 (In thousands of Brazilian Reais - R$, except when otherwise indicated) |
The aging list of trade receivables, net of allowance for estimated losses from doubtful accounts, is as follows:
| Consolidated | ||
| March 31, 2022 | December 31, 2021 | |
| To be Due | ||
| Until 30 days | 663,370 | 607,968 |
| From 31 to 60 days | 144,038 | 82,132 |
| From 61 to 90 days | 10,507 | 55,265 |
| From 91 to 180 days | 21,695 | 33,491 |
| From 181 to 360 days | 47,305 | 1,096 |
| Over 360 days | 110 | 379 |
| Total to be Due | 887,025 | 780,331 |
| Overdue | ||
| Until 30 days | 29,236 | 31,302 |
| From 31 to 60 days | 1,077 | 5,722 |
| From 61 to 90 days | 7,072 | 2,172 |
| From 91 to 180 days | 4,527 | 7,566 |
| From 181 to 360 days | 8,045 | 8,911 |
| Over 360 days | 19,497 | 14,679 |
| Total Overdue | 69,454 | 70,352 |
| Total | 956,479 | 850,683 |
The changes in the expected loss on trade receivables are as follows:
| Consolidated | ||
| March 31, 2022 | December 31, 2021 | |
| Balance at the Beginning of the Fiscal Year | (19,280) | (18,047) |
| (Additions) reversals | 994 | (1,233) |
| Balance at the End of the Period | (18,286) | (19,280) |
| 9. | Inventories |
| Consolidated | ||
| March 31, 2022 | December 31, 2021 | |
| Consumables | 22,815 | 20,585 |
| Parts and Maintenance Materials | 226,448 | 201,470 |
| Advances to Suppliers | 43,826 | 47,530 |
| Total | 293,089 | 269,585 |
The changes in the provision for obsolescence are as follows:
| Consolidated | ||
| March 31, 2022 | December 31, 2021 | |
| Balances at the Beginning of the Fiscal Year | (6,176) | (12,862) |
| Additions | (280) | (687) |
| Write-Offs | 247 | 7,373 |
| Balances at the End of the Period | (6,209) | (6,176) |
| 26 |
| Notes on the Parent Company and Consolidated Quarterly Information (ITR) March 31, 2022 (In thousands of Brazilian Reais - R$, except when otherwise indicated) |
| 10. | Deposits |
| Parent Company | Consolidated | |||
| March 31, 2022 | December 31, 2021 | March 31, 2022 | December 31, 2021 | |
| Maintenance Deposits | - | - | 852,881 | 1,000,995 |
| Court Deposits | 45,381 | 44,744 | 592,949 | 575,917 |
| Deposit in Guarantee for Lease Agreements | 2,369 | 2,790 | 336,344 | 372,114 |
| Total | 47,750 | 47,534 | 1,782,174 | 1,949,026 |
| Current | - | - | 166,274 | 191,184 |
| Non-current | 47,750 | 47,534 | 1,615,900 | 1,757,842 |
| 10.1. | Maintenance deposits |
The Company makes deposits in US dollars for aircraft and engine overhauling, which will be used in future events as established in certain lease agreements. The Company has the right to choose to carry out the maintenance internally or through its suppliers.
Maintenance deposits do not exempt the Company, as a lessee, from contractual obligations related to the maintenance or the risk associated with operating activities. These deposits can be replaced by bank guarantees or letters of credit (SBLC - stand by letter of credit) as established in the aircraft lease. These letters can be executed by the lessors if the maintenance of the aircraft and engines does not occur according to the review schedule. Several aircraft lease agreements do not require maintenance deposits and have credit bills to ensure the maintenance is carried out in the scheduled periods. Until March 31, 2022, no credit bill had been executed against the Company.
The Company has two categories of maintenance deposits:
| · | Maintenance Guarantee: Refers to one-time deposits that are refunded at the end of the lease and can also be used in maintenance events, depending on negotiations with lessors. The balance of these deposits on March 31, 2022, was R$222,487 (R$262,061 on December 31, 2021). |
| · | Maintenance Reserve: Refers to amounts paid monthly based on the use of components and can be used in maintenance events as set by an agreement. On March 31, 2022, the balance of these reserves was R$630,294 (R$738,934 on December 31, 2021). |
| 10.2. | Court Deposits |
Court deposits and blocks represent guarantees of tax, civil and labor lawsuits, kept in court until resolving the disputes to which they are related. Part of the court deposits refers to civil and labor lawsuits arising from succession requests in lawsuits filed against Varig S.A. or also labor lawsuits filed by employees who do not belong to GLA or any related party. Bearing in mind that the Company is not a legitimate party to appear on the liability side of the said lawsuits, their exclusion and respective release of the retained funds are demanded whenever blocks occur.
| 27 |
| Notes on the Parent Company and Consolidated Quarterly Information (ITR) March 31, 2022 (In thousands of Brazilian Reais - R$, except when otherwise indicated) |
| 10.3. | Deposits in guarantee for lease agreements |
As required by the lease agreements, the Company guarantees deposits (in US dollars) to the leasing companies, which may be redeemed if replaced by other bank guarantees or fully redeemed at maturity.
| 11. | Advances to Suppliers and Third-Parties |
| Parent Company | Consolidated | |||
| March 31, 2022 | December 31, 2021 | March 31, 2022 | December 31, 2021 | |
| Advance to Domestic Suppliers | - | - | 291,628 | 255,024 |
| Advances to Foreign Suppliers | 1,251 | 32 | 53,616 | 42,524 |
| Advance for Materials and Repairs | - | 51 | 24,120 | 48,932 |
| Total Advances to Suppliers | 1,251 | 83 | 369,364 | 346,480 |
| Current | 1,251 | 83 | 304,891 | 270,342 |
| Noncurrent | - | - | 64,473 | 76,138 |
| 12. | Taxes to Recover |
| Parent Company | Consolidated | |||
| March 31, 2022 | December 31, 2021 | March 31, 2022 | December 31, 2021 | |
| Prepaid Income Tax and Social Contribution to Recover | 15,533 | 14,575 | 57,279 | 51,282 |
| PIS and COFINS to recover (*) | - | - | 200,027 | 185,827 |
| Value Added Tax (VAT), Abroad | - | - | 4,968 | 4,035 |
| Others | 20 | 48 | 4,782 | 8,223 |
| Total | 15,553 | 14,623 | 267,056 | 249,367 |
| Current | 14,342 | 10,159 | 225,445 | 176,391 |
| Noncurrent | 1,211 | 4,464 | 41,611 | 72,976 |
| 28 |
| Notes on the Parent Company and Consolidated Quarterly Information (ITR) March 31, 2022 (In thousands of Brazilian Reais - R$, except when otherwise indicated) |
| 13. | Deferred Taxes |
| 13.1. | Deferred Tax Assets (Liabilities) |
The positions of deferred assets and liabilities are presented below and comply with the enforceable offset legal rights that consider taxes levied by the same tax authority under the same tax entity.
| Parent Company | Consolidated | ||||||
| December 31, 2021 | Income (Expenses) | March 31, 2022 | December 31, 2021 | Income (Expenses) | Shareholders’ Equity (*) | March 31, 2022 | |
| Deferred taxes assets (liabilities) – GOL and Smiles Argentina | |||||||
| Income tax losses carry forward | 50,385 | - | 50,385 | 50,385 | - | - | 50,385 |
| Negative basis of social contribution | 18,137 | - | 18,137 | 18,137 | - | - | 18,137 |
| Temporary differences: | |||||||
| Allowance for expected loss on other credits | 7,132 | (5,120) | 2,012 | 7,132 | (5,120) | - | 2,012 |
| Provision for legal proceedings and tax liabilities | (94) | (8) | (102) | (94) | (8) | - | (102) |
| Others | - | - | - | 239 | - | (51) | 188 |
| Total Income Tax and Social Contribution Deferred – Assets | 75,560 | (5,128) | 70,432 | 75,799 | (5,128) | (51) | 70,620 |
| Deferred taxes assets (liabilities) – GLA | |||||||
| Temporary Differences: | |||||||
| Slots | - | - | - | (353,226) | - | - | (353,226) |
| Depreciation of engines and parts for aircraft maintenance | - | - | - | (202,522) | (2,037) | - | (204,559) |
| Breakage provision | - | - | - | (197,246) | (10,900) | - | (208,146) |
| Goodwill amortization for tax purposes | - | - | - | (143,297) | (11,728) | - | (155,025) |
| Derivative transactions | - | - | - | (502) | 964 | - | 462 |
| Allowance for expected loss on trade receivable and other credits | - | - | - | 209,141 | 3,004 | - | 212,145 |
| Provision for aircraft and engine return | - | - | - | 310,746 | 5,077 | - | 315,823 |
| Provision for legal proceedings and tax liabilities | - | - | - | 243,826 | 10,007 | - | 253,833 |
| Aircraft leases and others | - | - | - | 84,500 | 4,117 | - | 88,617 |
| Others | - | - | - | 48,169 | 1,180 | - | 49,349 |
| Total Income Tax and Social Contribution Deferred - Liabilities | - | - | - | (411) | (316) | - | (727) |
| Total Effect of Deferred Taxes in the Income (Expenses) | - | (5,128) | - | - | (5,444) | ||
(*) Exchange rate change recognized in other comprehensive income.
| 29 |
| Notes on the Parent Company and Consolidated Quarterly Information (ITR) March 31, 2022 (In thousands of Brazilian Reais - R$, except when otherwise indicated) |
The Company’s Management considers that the deferred assets and liabilities recognized on March 31, 2022, arising from temporary differences, will be realized in proportion to the realization of their bases and the expectation of future results.
The Management estimates that active deferred tax credits, recorded on tax losses and a negative social contribution base, may be realized as follows:
| Year | Amount |
| 2022 | 7,156 |
| 2023 | 26,511 |
| 2024 | 18,581 |
| 2025 | 16,274 |
| Total | 68,522 |
The direct subsidiary GLA has tax losses and negative bases of social contribution in the determination of taxable profit, to be offset against 30% of future annual tax profits, with no prescription period, not recorded in the balance sheet, in the following amounts:
| GLA | ||
| March 31, 2022 | December 31, 2021 | |
| Accumulated Income Tax Losses and Negative Bases of Social Contribution | 11,917,442 | 12,076,378 |
| Potential Tax Credit | 4,051,930 | 4,105,969 |
During the period ended March 31, 2022, the direct subsidiary GLA used tax loss carryforwards of R$158,936 to offset taxable income in this period, with a reduction of R$54,038 in current tax.
The reconciliation between tax expense and multiplying the accounting profit by the nominal tax rate for the three-month periods ended March 31, 2022, and 2021 is shown below:
| Parent Company | Consolidated | |||
| March 31, 2022 | March 31, 2021 | March 31, 2022 | March 31, 2021 | |
| Income (Loss) before income tax and social contribution | 2,612,713 | (2,532,541) | 2,738,005 | (2,484,822) |
| Combined tax rate | 34% | 34% | 34% | 34% |
| Income Tax and Social Contribution by the Combined Tax Rate | (888,322) | 861,064 | (930,922) | 844,839 |
| Adjustments to Calculate the Actual Tax Rate: | ||||
| Equity Pickup | 715,802 | (713,038) | - | - |
| Tax Rate Difference of the Income (Expenses) of Subsidiaries | (44,785) | (32,225) | 5,704 | (35,386) |
| Nondeductible Expenses, Net | (2,811) | (1,723) | (15,710) | (35,119) |
| Exchange Rate Change on Foreign Investments | 221,887 | (109,940) | 191,664 | (99,770) |
| Benefit (Not Constituted) on Tax Losses, Negative Basis and Temporary Differences | (6,899) | - | 618,844 | (695,533) |
| Total Income Tax and Social Contribution | (5,128) | 4,138 | (130,420) | (20,969) |
| Income Tax and Social Contribution | ||||
| Current | - | - | (124,976) | (28,831) |
| Deferred | (5,128) | 4,138 | (5,444) | 7,862 |
| Total Income Tax and Social Contribution | (5,128) | 4,138 | (130,420) | (20,969) |
| 30 |
| Notes on the Parent Company and Consolidated Quarterly Information (ITR) March 31, 2022 (In thousands of Brazilian Reais - R$, except when otherwise indicated) |
| 14. | Property, Plant & Equipment |
| 14.1. | Parent Company |
On March 31, 2022, the balance of property, plant and equipment was R$361,919 in subsidiary GAC (R$451,320 on December 31, 2021), mainly due to advances in aircraft acquisition.
| 14.2. | Consolidated |
| December 31, 2021 | March 31, 2022 | ||||||||||
| Weighted Average Rate (p.a.) | Historical Cost | Accumulated Depreciation | Net Opening Balance | Additions | Contractual Amendment | Depreciation | Write-Offs | Net Closing Balance | Historical Cost | Accumulated Depreciation | |
| Flight Equipment | |||||||||||
| Aircraft – ROU (1) with Purchase Option | 9.48% | - | - | - | 726,057 | - | (8,654) | - | 717,403 | 726,057 | (8,654) |
| Aircraft – ROU (1) without Purchase Option | 18.33% | 7,127,628 | (1,958,755) | 5,168,873 | 696,523 | (21,422) | (236,570) | (133) | 5,607,271 | 7,790,431 | (2,183,160) |
| Spare Parts and Engines - Own (3) (4) | 7.27% | 2,062,646 | (963,949) | 1,098,697 | 59,893 | - | (35,092) | (262) | 1,123,236 | 2,122,219 | (998,983) |
| Spare Parts and Engines – ROU | 39.82% | 129,223 | (62,908) | 66,315 | - | 17,575 | (6,661) | - | 77,229 | 146,798 | (69,569) |
| Aircraft and Engine Overhauling | 46.64% | 3,143,372 | (2,370,691) | 772,681 | 132,795 | - | (83,532) | (1,098) | 820,846 | 3,235,158 | (2,414,312) |
| Tools | 10.00% | 56,826 | (32,327) | 24,499 | 296 | - | (943) | (4) | 23,848 | 57,116 | (33,268) |
| 12,519,695 | (5,388,630) | 7,131,065 | 1,615,564 | (3,847) | (371,452) | (1,497) | 8,369,833 | 14,077,779 | (5,707,946) | ||
| Property, Plant & Equipment in Use | |||||||||||
| Vehicles | 20.00% | 11,076 | (9,915) | 1,161 | - | - | (91) | (16) | 1,054 | 11,060 | (10,006) |
| Machinery and Equipment | 10.00% | 62,837 | (50,824) | 12,013 | 71 | - | (505) | (2) | 11,577 | 62,169 | (50,592) |
| Furniture and Fixtures | 10.00% | 32,508 | (22,024) | 10,484 | 153 | - | (464) | (2) | 10,171 | 32,522 | (22,351) |
| Computers, Peripherals and Equipment | 13.33% | 49,636 | (40,869) | 8,767 | 130 | - | (852) | (11) | 8,034 | 49,365 | (41,331) |
| Computers, Peripherals and Equipment – ROU | 35.18% | 23,210 | (20,251) | 2,959 | 1,816 | - | (824) | - | 3,951 | 25,026 | (21,075) |
| Leasehold Improvements | 16.18% | 183,345 | (166,832) | 16,513 | - | - | (2,403) | (59) | 14,051 | 183,286 | (169,235) |
| Third-Party Properties – ROU | 8.26% | 28,819 | (24,186) | 4,633 | 170,560 | - | (4,171) | - | 171,022 | 198,886 | (27,864) |
| Construction in Progress | 15,410 | - | 15,410 | 635 | - | - | - | 16,045 | 16,045 | - | |
| 406,841 | (334,901) | 71,940 | 173,365 | - | (9,310) | (90) | 235,905 | 578,359 | (342,454) | ||
| Impairment Losses (2) | - | (26,854) | - | (26,854) | 1,037 | - | - | - | (25,817) | (25,817) | - |
| Total | 12,899,682 | (5,723,531) | 7,176,151 | 1,789,966 | (3,847) | (380,762) | (1,587) | 8,579,921 | 14,630,321 | (6,050,400) | |
| Advances to Suppliers | - | 499,019 | - | 499,019 | 39,517 | - | - | (89,401) | 449,135 | 449,135 | - |
| Total Property, Plant & Equipment | 13,398,701 | (5,723,531) | 7,675,170 | 1,829,483 | (3,847) | (380,762) | (90,988) | 9,029,056 | 15,079,456 | (6,050,400) | |
(1) ROU – Right of use
(2) Refers to provisions for impairment losses for rotable items (spare parts), classified under “Parts and spare engines”, recorded by the Company to present its assets according to the actual capacity for the generation of expected future benefits.
(3) On March 31, 2022, the balance of spare parts is granted as a guarantee to the Secured Senior Notes 2026, as per Note 16.
(4) On March 31, 2022, 19 Company’s engines are granted as a guarantee to the Spare Engine Facility and the Loan Facility, according to Note 16.
| 31 |
| Notes on the Parent Company and Consolidated Quarterly Information (ITR) March 31, 2022 (In thousands of Brazilian Reais - R$, except when otherwise indicated) |
| 15. | Intangible Assets |
The breakdown of and changes in intangible assets are as follows:
Weighted average rate (p.a.) | December 31, 2021 | March 31, 2022 | |||||||
| Historical cost | Accumulated amortization | Net opening balance | Additions | Amortization | Net ending balance | Historical cost | Accumulated amortization | ||
| Goodwill | - | 542,302 | - | 542,302 | - | - | 542,302 | 542,302 | - |
| Slots | - | 1,038,900 | - | 1,038,900 | - | - | 1,038,900 | 1,038,900 | - |
| Softwares | 39.81% | 508,650 | (268,476) | 240,174 | 49,032 | (16,287) | 272,919 | 544,501 | (271,582) |
| Others | 20.00% | 10,000 | (8,167) | 1,833 | - | (500) | 1,333 | 10,000 | (8,667) |
| Total | 2,099,852 | (276,643) | 1,823,209 | 49,032 | (16,787) | 1,855,454 | 2,135,703 | (280,249) | |
The balances of goodwill and airport operating rights (slots) were tested for impairment on December 31, 2021 through the discounted cash flow for each cash-generating unit, giving rise to the value in use. The results obtained were compared with the carrying amount of each cash-generating unit and, as a result, the Company did not recognize impairment losses on its CGUs. On March 31, 2022, no indications of impairment on the cash-generating unit were identified.
In order to assess the recoverable value, assets are grouped at the lowest levels for which there are separately identifiable cash flows (Cash-Generating Units – “CGUs”). In order to determine the carrying amount of each cash-generating unit, the Company considers the intangible assets recorded and all necessary tangible assets to conduct the business, given that it will only generate economic benefits by using the combination of both.
| 32 |
| Notes on the Parent Company and Consolidated Quarterly Information (ITR) March 31, 2022 (In thousands of Brazilian Reais - R$, except when otherwise indicated) |
| 16. | Loans and Financing |
The breakdown of and changes in short and long-term debt are as follows:
| Parent Company | |||||||||||||
| December 31, 2021 | March 31, 2022 | ||||||||||||
| Maturity | Interest Rate p.a. | Current | Noncurrent | Total | Unrealized Income (Expenses) on ESN | Interest Incurred | Interest Paid | Exchange Rate Change | Amortization of Costs and Goodwill | Total | Current | Noncurrent | |
| Foreign currency contracts | |||||||||||||
| ESN 2024 (a) | 07/2024 | 3.75% | 40,764 | 1,947,463 | 1,988,227 | (13,820) | 50,795 | (42,692) | (295,498) | 7,025 | 1,694,037 | 15,731 | 1,678,306 |
| Senior Notes 2025 (b) | 01/2025 | 7.00% | 105,797 | 3,598,981 | 3,704,778 | - | 59,591 | (121,881) | (555,335) | 2,298 | 3,089,451 | 35,928 | 3,053,523 |
| Senior Secured Notes 2026 (c) | 06/2026 | 8.00% | - | 3,451,977 | 3,451,977 | - | 68,104 | - | (554,267) | 9,528 | 2,975,342 | 61,591 | 2,913,751 |
| Perpetual Bonds(d) | - | 8.75% | 17,743 | 858,843 | 876,586 | - | 17,247 | (18,036) | (131,936) | - | 743,861 | 14,710 | 729,151 |
| Total | 164,304 | 9,857,264 | 10,021,568 | (13,820) | 195,737 | (182,609) | (1,537,036) | 18,851 | 8,502,691 | 127,960 | 8,374,731 | ||
(a) The subsidiary Gol Finance issued Exchangeable Senior Notes (“ESN”) in March, April and July 2019, totaling US$425 million due in 2024, with holders entitled to exchange them for the Company’s American Depositary Shares ("ADSs"), see Note 33
(b) The subsidiary Gol Finance issued Senior Notes 2025 in December 2017 and February 2018 to buyback Senior Notes and for overall purposes of the Company.
(c) The subsidiary Gol Finance issued Senior Secured Notes 2026 in December 2020, May and September 2021, totaling US$650 million due in 2026.
(d) The subsidiary Gol Finance issued Perpetual Notes in April 2006 to finance the aircraft’s acquisition.
| 33 |
| Notes on the Parent Company and Consolidated Quarterly Information (ITR) March 31, 2022 (In thousands of Brazilian Reais - R$, except when otherwise indicated) |
| Consolidated | ||||||||||||||
| December 31, 2021 | March 31, 2022 | |||||||||||||
| Maturity | Interest rate p.a. | Current | Non-current | Total | Unrealized gain (loss) from ESN | Payments | Interest incurred | Interest paid | Exchange rate change | Amortization of costs and premium | Total | Current | Non-current | |
| Domestic currency contracts | ||||||||||||||
| Debentures (a) | 10/2024 | 16.67% | 109,519 | 1,055,249 | 1,164,768 | - | - | 43,183 | - | - | 3,135 | 1,211,086 | 295,857 | 915,229 |
| Working capital – Lines of credit (b) | 10/2025 | 17.96% | 48,239 | 9,757 | 57,996 | - | (1,837) | 1,047 | (1,847) | - | - | 55,359 | 47,993 | 7,366 |
| Foreign currency contracts | ||||||||||||||
| Import financing (c) | 07/2022 | 7.84% | 138,034 | - | 138,034 | - | - | 2,413 | (1,122) | (20,770) | - | 118,555 | 118,555 | - |
| Financing with Ex-lm Bank collateral (d) | 12/2022 | 2.82% | 99,396 | - | 99,396 | - | (15,457) | 117 | (109) | (15,174) | 502 | 69,275 | 69,275 | - |
| ESN 2024 (e) | 07/2024 | 3.75% | 40,764 | 1,947,463 | 1,988,227 | (13,820) | - | 50,795 | (42,692) | (295,498) | 7,025 | 1,694,037 | 15,731 | 1,678,306 |
| Spare engine facility (f) | 09/2024 | 2.47% | 24,651 | 125,106 | 149,757 | - | (5,347) | 837 | (791) | (22,702) | 70 | 121,824 | 20,894 | 100,930 |
| Senior notes 2025 (g) | 01/2025 | 7.00% | 105,797 | 3,598,981 | 3,704,778 | - | - | 59,591 | (121,881) | (555,335) | 2,298 | 3,089,451 | 35,928 | 3,053,523 |
| Senior secured notes 2026 (h) | 06/2026 | 8.00% | - | 3,451,977 | 3,451,977 | - | - | 68,104 | - | (554,267) | 9,528 | 2,975,342 | 61,591 | 2,913,751 |
| Loan facility (i) | 03/2028 | 4.22% | 50,471 | 218,040 | 268,511 | - | (11,426) | 2,541 | (2,564) | (39,405) | 64 | 217,721 | 40,624 | 177,097 |
| Perpetual bonds (j) | - | 8.75% | 17,743 | 858,843 | 876,586 | - | - | 17,247 | (18,036) | (131,936) | - | 743,861 | 14,710 | 729,151 |
| Total | 634,614 | 11,265,416 | 11,900,030 | (13,820) | (34,067) | 245,875 | (189,042) | (1,635,087) | 22,622 | 10,296,511 | 721,158 | 9,575,353 | ||
| (a) | The debentures total R$1.2 billion, considering the following issues: (i) 7th issue: 88,750 bonds by the subsidiary GLA in October 2018, for the early full settlement of the 6th issue; and (ii) 8th issue: 610,217 bonds by the subsidiary GLA in October 2021 to refinance short-term debt. Both issues have an interest rate of CDI+4.5% p.a. The debentures have personal guarantees from the Company and a real guarantee provided by GLA as a fiduciary assignment of certain credit card receivables, preserving the rights to prepay the receivables of these guarantees. |
| (b) | Issuance of transactions with the purpose maintaining and managing the Company's working capital. |
| (c) | Credit lines with private banks used to finance the import of spare parts and aeronautical equipment. The interest rates negotiated are Libor 3m + 4.40% p.a. and Libor 1m + 3.25% p.a. |
| (d) | Financing to perform engine maintenance with Ex-Im Bank guarantee, including 4 operations, 3 with maturities in 2021, duly liquidated, and 1 with maturity in 2022. |
| (e) | Issuance of Exchangeable Senior Notes (“ESN”), by the subsidiary Gol Finance, in March, April and July 2019, totaling US$425 million due in 2024, with holders entitled to exchange them for the Company’s American Depositary Shares ("ADSs"), see Note 33. |
| (f) | Loan backed by the Company's own engines, with maturity in 2024. |
| (g) | Issuance of Senior Notes 2025 by the subsidiary Gol Finance in December 2017 and February 2018 to buyback Senior Notes and for overall purposes of the Company. |
| (h) | Issuance of Secured Senior Notes 2026 by the subsidiary Gol Finance in December 2020, May and September 2021, totaling US$650 million due in 2026. |
| (i) | Loans with a guarantee of 5 engines in total, carried out in June 2018. The contracted rates vary between Libor 6m + 2.35% p.a. up to Libor 6m + 4.25% p.a. |
| (j) | Issuance of Perpetual Notes by the subsidiary Gol Finance in April 2006 to finance the aircraft’s acquisition. |
| 34 |
| Notes on the Parent Company and Consolidated Quarterly Information (ITR) March 31, 2022 (In thousands of Brazilian Reais - R$, except when otherwise indicated) |
The total parent company and consolidated loans and financing on March 31, 2022, includes funding costs and premiums totaling R$192,049 and R$227,769, respectively (R$210,902 and R$250,393 on December 31, 2021) that will be amortized over the term of their loans and financing. The total also includes the fair value of the derivative financial instrument, referring to the convertibility of the ESN, totaling R$129,942 on March 31, 2022 (R$162,568 on December 31, 2021).
| 16.1. | Renegotiations during the period ended on March 31, 2022 |
The renegotiations detailed below were evaluated under CPC 48 - “Financial Instruments”, corresponding to IFRS 9, and did not meet the definitions to derecognize the liabilities (with the original financial liability extinguished and a new financial liability recognized).
| 16.1.1. | Import Financing |
During the three-month period ended March 31, 2022, the Company, through its subsidiary GLA, renegotiated the due dates of this type of agreement, impacting the interest rate, disclosed in table above, and keeping promissory notes as collateral for the transactions, which are part of a credit line for engine maintenance, import financing in order to purchase spare parts and aircraft equipment.
| 16.1.2. | Financing with Ex-lm Bank collateral |
During the three-month period ended March 31, 2022, GLA also renegotiated the maturities of contracts of this type, with an impact on the interest rate, disclosed in the table above. The other conditions of this operation remain unchanged.
| 16.2. | Loans and Financing – Non-Current |
On March 31, 2022, the maturities of loans and financing recorded in non-current liabilities were as follows:
| 2023 | 2024 | 2025 | 2026 | 2026 onwards | Without Maturity Date | Total | |
| Parent Company | |||||||
| Foreign currency contracts | |||||||
| ESN 2024 | - | 1,678,306 | - | - | - | - | 1,678,306 |
| Senior Notes 2025 | - | - | 3,053,523 | - | - | - | 3,053,523 |
| Senior Secured Notes 2026 | - | - | - | 2,913,751 | - | - | 2,913,751 |
| Perpetual Bonds | - | - | - | - | - | 729,151 | 729,151 |
| Total | - | 1,678,306 | 3,053,523 | 2,913,751 | - | 729,151 | 8,374,731 |
| Consolidated | |||||||
| Domestic currency contracts | |||||||
| Debentures | 430,735 | 484,494 | - | - | - | - | 915,229 |
| Working capital – Lines of credit | 2,785 | 2,500 | 2,081 | - | - | - | 7,366 |
| Foreign currency contracts | |||||||
| ESN 2024 | - | 1,678,306 | - | - | - | - | 1,678,306 |
| Spare Engine Facility | 15,629 | 85,301 | - | - | - | - | 100,930 |
| Senior Notes 2025 | - | - | 3,053,523 | - | - | - | 3,053,523 |
| Senior Secured Notes 2026 | - | - | - | 2,913,751 | - | - | 2,913,751 |
| Loan Facility | 21,904 | 30,088 | 31,150 | 66,589 | 27,366 | - | 177,097 |
| Perpetual Bonds | - | - | - | - | - | 729,151 | 729,151 |
| Total | 471,053 | 2,280,689 | 3,086,754 | 2,980,340 | 27,366 | 729,151 | 9,575,353 |
| 35 |
| Notes on the Parent Company and Consolidated Quarterly Information (ITR) March 31, 2022 (In thousands of Brazilian Reais - R$, except when otherwise indicated) |
| 16.3. | Fair Value |
The fair value of debt on March 31, 2022, is as follows:
| Parent Company | Consolidated | |||
| Accounting (*) | Fair Value | Accounting (*) | Fair Value | |
| Debentures | - | - | 1,211,086 | 1,201,883 |
| ESN 2024 | 1,694,037 | 1,691,883 | 1,694,037 | 1,691,883 |
| Senior notes 2025 | 3,089,451 | 2,602,781 | 3,089,451 | 2,602,781 |
| Senior secured notes 2026 | 2,975,342 | 2,827,969 | 2,975,342 | 2,827,969 |
| Perpetual Notes and Other Senior Notes | 743,861 | 559,627 | 743,861 | 559,627 |
| Other Existing Loans | - | - | 582,734 | 582,734 |
| Total | 8,502,691 | 7,682,260 | 10,296,511 | 9,466,877 |
(*) Net Total of Funding Costs.
| 16.4. | Covenants |
The Company has covenants in the Debentures and Senior secured notes 2026.
After the renegotiation of the debentures during the year ended December 31, 2021, the mandatory measurement of the indicators provided for in the deeds of the 7th and 8th issuance will be as of December 2022.
Within the scope of the Senior secured notes 2026, the Company complies with guarantee conditions linked to inventory parts and intellectual property. On December 31, 2021, the Company had GLA’s parts and equipment guaranteed linked to this agreement meeting the contractual conditions. The next measurement will be in June 2022.
| 36 |
| Notes on the Parent Company and Consolidated Quarterly Information (ITR) March 31, 2022 (In thousands of Brazilian Reais - R$, except when otherwise indicated) |
| 17. | Leases Payable |
On March 31, 2022, the balance of leases payable included: (i) R$23,389 for variable payments, not included in the measurement of liabilities, and short-term leases (R$28,440 on December 31, 2021), which fall under the exemption provided for in CPC 06 (R2) - Leases, equivalent to IFRS 16; and (ii) R$10,403,185 referring to the present value on this date of future lease payments (R$10,734,544 on December 31, 2021).
The breakdown and changes in the present value of future lease payments are shown below:
| Weighted average rate (p.a.) | December 31, 2021 | March 31, 2022 | |||||||||||||
| Current | Non-current | Total | Additions | Write-offs | Contractual amendment | Payments | Interest paid | Interest incurred | Exchange rate change | Total | Current | Non-current | |||
| Agreements in local currency | |||||||||||||||
| Without purchase option | 10.81% | 29,456 | 8,552 | 38,008 | 170,560 | (242) | - | (2,890) | - | 15,269 | - | 220,705 | 43,256 | 177,449 | |
| With purchase option | 15.71% | - | - | - | 1,816 | - | - | - | - | - | - | 1,816 | 908 | 908 | |
| Agreements in foreign currency | |||||||||||||||
| Without purchase option | 10.09% | 1,999,791 | 8,696,745 | 10,696,536 | 690,189 | - | (3,847) | (521,415) | - | 234,671 | (1,647,686) | 9,448,448 | 1,833,765 | 7,614,683 | |
| With purchase option | 6.76% | - | - | - | 813,571 | - | - | (3,715) | (3,026) | 6,684 | (81,298) | 732,216 | 69,435 | 662,781 | |
| Total | 2,029,247 | 8,705,297 | 10,734,544 | 1,676,136 | (242) | (3,847) | (528,020) | (3,026) | 256,624 | (1,728,984) | 10,403,185 | 1,947,364 | 8,455,821 | ||
In the three-month period ended March 31, 2022, the Company recognized R$279 directly in the cost of services related to short-term leases and variable payments.
| 37 |
| Notes on the Parent Company and Consolidated Quarterly Information (ITR) March 31, 2022 (In thousands of Brazilian Reais - R$, except when otherwise indicated) |
The future payments of lease agreements are detailed as follows:
| March 31, 2022 | December 31, 2021 | |
| 2022 | 2,266,979 | 2,977,345 |
| 2023 | 2,236,533 | 2,370,391 |
| 2024 | 1,886,717 | 1,970,832 |
| 2025 | 1,631,032 | 1,673,635 |
| 2026 | 1,358,425 | 1,360,011 |
| 2026 Onwards | 5,398,398 | 4,610,635 |
| Total Minimum Lease Payments | 14,778,084 | 14,962,849 |
| Less Total Interest | (4,351,510) | (4,199,865) |
| Present Value of Minimum Lease Payments | 10,426,574 | 10,762,984 |
| Less Current Portion | (1,970,753) | (2,057,687) |
| Noncurrent Portion | 8,455,821 | 8,705,297 |
| 17.1. | Sale-Leaseback Transactions |
During the three-month period ended March 31, 2022, the Company recognized a net gain of R$ 49,156 in the parent company R$55,491 in the consolidated from the sale-leaseback transactions of 7 aircraft, recorded in the statement of operations in the group of “Other income (expenses), net”, see Note 30.
| 18. | Suppliers |
| Parent Company | Consolidated | |||
| March 31, 2022 | December 31, 2021 | March 31, 2022 | December 31, 2021 | |
| Domestic Currency | 24,682 | 52,079 | 1,420,224 | 1,401,093 |
| Foreign Currency | 22,737 | 32,272 | 498,926 | 497,877 |
| Total | 47,419 | 84,351 | 1,919,150 | 1,898,970 |
| Current | 47,403 | 84,335 | 1,860,462 | 1,820,056 |
| Noncurrent | 16 | 16 | 58,688 | 78,914 |
| 19. | Suppliers - Forfaiting |
The Company has an arrangement in place that allow suppliers to receive their payments in advance with the financial institution. On March 31, 2022, the amount recorded under current liabilities arising from forfeiting operations was R$9,786 (R$22,733 on December 31, 2021).
| 20. | Taxes to Collect |
| Parent Company | Consolidated | |||
| March 31, 2022 | December 31, 2021 | March 31, 2022 | December 31, 2021 | |
| PIS and COFINS | 248 | 510 | 141,099 | 71,515 |
| Installments | - | - | 60,079 | 34,213 |
| Income Tax on Salaries | 10 | 43 | 47,259 | 32,940 |
| ICMS | - | - | 594 | 244 |
| Income Tax and Social Contribution to Collect | - | - | 126,007 | 366 |
| Others | 39 | 32 | 7,011 | 7,172 |
| Total | 297 | 585 | 382,049 | 146,450 |
| Current | 297 | 585 | 335,406 | 122,036 |
| Noncurrent | - | - | 46,643 | 24,414 |
| 38 |
| Notes on the Parent Company and Consolidated Quarterly Information (ITR) March 31, 2022 (In thousands of Brazilian Reais - R$, except when otherwise indicated) |
| 21. | Advance Ticket Sales |
On March 31, 2022, the balance of Advance from ticket sales classified in current liabilities was R$2,752,828 (R$2,670,469 on December 31, 2021) and is represented by 7,197,598 tickets sold and not yet used (7,004,554 on December 31, 2021) with an average use of 154 days (126 days on December 31, 2021).
Balances of advance from ticket sales are shown net of breakage corresponding to R$246,323 on March 31, 2022 (R$226,905 on December 31, 2021).
On March 31, 2022, the Company has reimbursements payable for advance air tickets totaling R$271,624 (R$369,638 on December 31, 2021), recorded as Other liabilities in current liabilities.
| 22. | Frequent-Flyer Program |
| Consolidated | ||
| March 31, 2022 | December 31, 2021 | |
| Frequent-Flyer Program | 2,176,406 | 2,097,432 |
| Breakage | (493,594) | (480,301) |
| Total | 1,682,812 | 1,617,131 |
| Current | 1,358,868 | 1,298,782 |
| Noncurrent | 323,944 | 318,349 |
Breakage consists of the estimate of miles with a high potential to expire without being used. CPC 47 - “Revenue from Agreement with Client”, corresponding to IFRS 15, provides for the recognition of revenue by the estimate (breakage) over the contractual period, therefore, before the miles are redeemed, given that this is not expected before expiration.
| 23. | Provisions |
| Consolidated | ||||
| Post-Employment Benefit | Provisions for Aircraft and Engine Return | Legal Proceedings (a) | Total | |
| Balances on December 31, 2021 | 75,439 | 2,679,833 | 832,050 | 3,587,322 |
| Recognition (Reversal) of Provision | 15,835 | 120,536 | 54,558 | 190,929 |
| Provisions Used | - | (9,739) | (52,215) | (61,954) |
| Present Value Adjustment | 1,995 | 83,833 | - | 85,828 |
| Exchange Rate Change | - | (415,732) | (4,504) | (420,236) |
| Balances on March 31, 2022 | 93,269 | 2,458,731 | 829,889 | 3,381,889 |
| On March 31, 2022 | ||||
| Current | - | 491,992 | - | 491,992 |
| Noncurrent | 93,269 | 1,966,739 | 829,889 | 2,889,897 |
| Total | 93,269 | 2,458,731 | 829,889 | 3,381,889 |
| On December 31, 2021 | ||||
| Current | - | 477,324 | - | 477,324 |
| Noncurrent | 75,439 | 2,202,509 | 832,050 | 3,109,998 |
| Total | 75,439 | 2,679,833 | 832,050 | 3,587,322 |
| (a) | The provisions used consider write-offs due to the revaluation of estimates and settled processes. |
| 39 |
| Notes on the Parent Company and Consolidated Quarterly Information (ITR) March 31, 2022 (In thousands of Brazilian Reais - R$, except when otherwise indicated) |
| 23.1. | Post-Employment Benefit |
The Company offers to its employees health care plans that, due to complying with current laws, generate obligations with post-employment benefits.
The actuarial assumptions applied when measuring the post-employment benefit remain the same as those disclosed in the annual financial statements related to the year ended December 31, 2021.
| 23.2. | Provisions for Aircraft and Engine Return |
Such provision considers the costs that meet the contractual conditions for the return of engines maintained under operating leases, as well as the costs to reconfigure aircraft when returned as described in the return conditions of the lease agreements. The initial recognition is capitalized against Property, Plant & Equipment, under the item " Aircraft and Engine Overhauling".
The Company also has a provision for the return of aircraft and engines recorded against the “Cost of services”, considering the current conditions of the aircraft and engines and the forecast of use until the actual return. These provisions are measured at present value and will be disbursed until the aircraft and engines redelivery.
| 23.3. | Provision for Legal Proceedings |
On March 31, 2022, the Company and its subsidiaries are involved in certain legal matters arising from the regular course of their business, which include civil, administrative, tax, social security, and labor lawsuits.
The Company's Management believes that the provision for tax, civil and labor risks, recorded in accordance with IAS 37, is sufficient to cover possible losses on administrative and judicial proceedings, as shown below:
| Consolidated | ||||
| Probable Loss | Possible Loss | |||
| March 31, 2022 | December 31, 2021 | March 31, 2022 | December 31, 2021 | |
| Civil | 177,910 | 188,500 | 65,090 | 55,193 |
| Labor | 482,203 | 475,191 | 95,542 | 102,216 |
| Tax | 169,776 | 168,360 | 730,372 | 701,556 |
| Total | 829,889 | 832,051 | 891,004 | 858,965 |
In September 2020, a class action complaint was filed against the Company and senior management in the federal courts of New York. The plaintiff is claiming alleged losses resulting from alleged misleading disclosure. In March 2022, the New York court decided to dismiss the case. Consequently, we have not made any provisions related to this matter.
Details about the other relevant lawsuits were disclosed in the annual financial statements related to the year ended December 31, 2021. In the period ended March 31, 2022, there were no other changes regarding new proceedings or reclassification of the relevant risk of loss.
| 40 |
| Notes on the Parent Company and Consolidated Quarterly Information (ITR) March 31, 2022 (In thousands of Brazilian Reais - R$, except when otherwise indicated) |
| 24. | Provision for investment losses |
| 24.1. | Breakdown of Investments |
The investment information is shown below:
| Parent Company | ||
| 31/03/2022 | 31/12/2021 | |
| GOL Linhas Aéreas (GLA) | ||
| Total Number of Shares | 2,762,566,614 | 2,762,566,614 |
| Share Capital | 5,511,194 | 5,511,194 |
| Interest % | 100.00% | 100.00% |
| Shareholders’ Equity (Deficit) | (15,675,601) | (18,292,878) |
| 31/03/2022 | 31/03/2021 | |
| Net Income (Loss) for the Period | 2,105,300 | (2,134,944) |
| 24.2. | Changes in Investments |
| GLA | |
| Balances on December 31, 2021 | (18,292,878) |
| Equity Income | 2,105,300 |
| Unrealized Income (Expenses) on Hedge | 314,169 |
| Foreign Exchange Rate Change on Investment Conversion Abroad | (777) |
| Share-Based Compensation | 5,235 |
| Prepayment for Future Capital Increase | 193,350 |
| Balances on March 31, 2022 | (15,675,601) |
| 25. | Shareholders’ Equity |
| 25.1. | Share Capital |
On March 14, 2022, the Company's Board of Directors approved the capital increase in the amount of R$352, with the issuance of 35,673 preferred shares, all registered and without par value, resulting from the exercise of the stock option granted to eligible employees under the Stock Option Plan.
On March 31, 2022, the Company's share capital was R$4,039,464 (R$4,039,112 on December 31, 2021), represented by 3,178,079,596 shares, with 2,863,682,710 common shares and 314,396,886 preferred shares (3,178,043,923 shares, comprised by 2,863,682,710 common shares and 314,361,213 preferred shares on December 31, 2021). The share capital above is reduced by the costs to issue shares totaling R$157,495 on March 31, 2022 and December 31, 2021.
| March 31, 2022 | December 31, 2021 | |||||
| Common Shares | Preferred Shares | Total | Common Shares | Preferred Shares | Total | |
| MOBI (1) (2) | 100.00% | 32.80% | 46.68% | 100.00% | 32.81% | 46.69% |
| AirFrance – KLM | - | 1.35% | 1.07% | - | 1.35% | 1.07% |
| Path Brazil (2) | - | 3.45% | 2.74% | - | 3.45% | 2.74% |
| Others | - | 1.54% | 1.21% | - | 1.54% | 1.22% |
| Market | - | 60.86% | 48.30% | - | 60.85% | 48.28% |
| Total | 100.00% | 100.00% | 100.00% | 100.00% | 100.00% | 100.00% |
| (1) | In the context of the exchangeable senior notes, in 2019 MOBI lent up to 14,000,000 ADSs to Bank of America Corporation, which operates the ADS lending facility, in order to facilitate privately negotiated derivatives transactions or other hedging activities related to the exchangeable senior notes. The ADSs will be returned to MOBI upon maturity of the exchangeable senior notes or upon termination of the ADS lending agreement that it entered into. |
| (2) | It refers to legal entities controlled by the controlling shareholders (Constantino family). |
| 41 |
| Notes on the Parent Company and Consolidated Quarterly Information (ITR) March 31, 2022 (In thousands of Brazilian Reais - R$, except when otherwise indicated) |
The authorized share capital on March 31, 2022 is R$6 billion. Within the authorized limit, the Company can, once approved by the Board of Directors, increase its capital regardless of any amendment to its by-laws, by issuing shares, without necessarily maintaining the proportion between the different types of shares. Under the law terms, in case of capital increase within the authorized limit, the Board of Directors will define the issuance conditions, including pricing and payment terms.
| 25.2. | Treasury Shares |
On March 31, 2022, the Company had 1,188,970 treasury shares, totaling R$40,548 (1,217,285 shares totaling R$41,514 on December 31, 2021). On March 31, 2022, the closing market price for treasury shares was R$17.20 (R$17.03 on December 31, 2021).
| 26. | Earnings (Loss) per Share |
The Company's earnings (loss) per share was determined as follows:
| Parent Company and Consolidated | ||||||
| March 31, 2022 | March 31, 2021 | |||||
| Common Shares | Preferred Shares | Total | Common Shares | Preferred Shares | Total | |
| Numerator | ||||||
| Net Income (Loss) for the Period Attributed to Controlling Shareholders | 538,511 | 2,069,074 | 2,607,585 | (581,358) | (1,947,045) | (2,528,403) |
| Denominator | ||||||
| Weighted average number of outstanding shares (in thousands) | 2,863,683 | 313,179 | 2,863,683 | 274,024 | ||
| Effect of dilution from stock options | - | 1,806 | - | - | ||
| Adjusted Weighted Average Number of Shares Outstanding and Conversions Presumed as Diluted (in thousands) | 2,863,683 | 314,985 | 2,863,683 | 274,024 | ||
| Basic Income (Loss) per Share | 0.188 | 6.607 | (0.203) | (7.105) | ||
| Diluted Income (Loss) per Share | 0.188 | 6.569 | (0.203) | (7.105) | ||
| 27. | Share-Based Compensation |
The conditions of the stock option and restricted share plans granted to the Company’s Executive Officers were disclosed in detail in the annual financial statements related to the year ended December 31, 2021, and did not change during the period ended on March 31, 2022.
| 42 |
| Notes on the Parent Company and Consolidated Quarterly Information (ITR) March 31, 2022 (In thousands of Brazilian Reais - R$, except when otherwise indicated) |
The movement of the stock options outstanding for in the three-month period ended on March 31, 2022, is as follows:
| 27.1. | Stock Option Plan – GOL |
Number of Stock Shares | Average Price Weighted - Period | |
| Outstanding Shares on December 31, 2021 | 7,432,661 | 12.90 |
| Options exercised | (1,100) | 2.62 |
| Options canceled and adjustments in estimated prescribed rights | (1,898,519) | 20.78 |
| Outstanding Options on March 31, 2022 | 5,533,042 | 14.53 |
| Number of Options Exercisable on: | ||
| December 31, 2021 | 6,407,403 | 12.62 |
| March 31, 2022 | 5,025,847 | 14.91 |
The expense recognized in the statement of operations for period corresponding to the stock option plans in the three-month period ended March 31, 2022, was R$2,552 (R$2,788 in the period ended March 31, 2021).
| 27.2. | Restricted Share Plan – GOL |
On March 31, 2022, the company transferred 28,315 treasury shares to settle the restricted stock plan. As of March 31, 2022, the Company has 1,517,935 restricted shares (1,546,250 as of December 31, 2021).
The expense recognized in the statement of operations for the period corresponding to the restricted share plans in the three-month period ended March 31, 2022, was R$2,683 (R$2,047 in the period ended March 31, 2021).
| 28. | Transactions with Related Parties |
| 28.1. | Loan Agreements - Noncurrent Assets and Liabilities |
The parent company maintains assets and liabilities from loan agreements with its subsidiary GLA without interest, as shown in the table below:
| Assets | Liabilities | ||||||
| Creditor | Debtor | Type of Transaction | Interest Rate (p.a.) | March 31, 2022 | December 31, 2021 | March 31, 2022 | December 31, 2021 |
| GOL | GLA | Loan | 3.42% | 899,791 | 903,297 | - | - |
| GAC | GLA | Loan | 1.00% | 1,106,029 | 1,257,057 | 76,009 | 6,692 |
| Gol Finance | GLA | Loan | 4.06% | 4,001,316 | 4,847,921 | - | - |
| Total | 6,007,136 | 7,008,275 | 76,009 | 6,692 | |||
On March 31, 2022 and on December 31, 2021, the Company had no dividends and interest on shareholders’ equity receivable.
| 43 |
| Notes on the Parent Company and Consolidated Quarterly Information (ITR) March 31, 2022 (In thousands of Brazilian Reais - R$, except when otherwise indicated) |
In addition to the values above, the following table shows the other balances between the Companies eliminated in the Consolidated:
| Balances | ||||||
| Creditor | Debtor | Type of Transaction | Maturity of the Agreements | Interest Rate (p.a.) | March 31, 2022 | December 31, 2021 |
| Gol Finance | GOL | Subscription Bonus (*) | 07/2024 | - | 602,350 | 602,350 |
| Gol Finance Inc. | GAC | Loan | 02/2025 | 8.64% | 1,076,371 | 1,269,464 |
| Gol Finance | GAC | Loan | 01/2023 | 3.83% | 1,011,755 | 1,181,126 |
| Gol Finance | Gol Finance Inc. | Loan | 04/2023 | 1.92% | 473,899 | 557,544 |
| Gol Finance Inc. | Gol Finance | Loan | 03/2020 | 11.70% | 1,645 | 1,938 |
| GLA | Smiles Viagens | Dividends | - | - | 576 | 267 |
| Smiles Viagens | GLA | Onlendings | - | - | 7,287 | 687 |
| Smiles Argentina | GLA | Onlendings | - | - | 3,095 | 4,466 |
| Total | 3,176,978 | 3,617,842 | ||||
(*) Through Gol Equity Finance, the subsidiary Gol Finance acquired warrants issued by the Company in the context of the issue of Exchangeable Senior Notes.
| 28.2. | Transportation and Consulting Services |
In the course of its operations, the Company, by itself and through its subsidiaries, entered into agreements with the companies listed below, part of the Company’s economic group:
| · | Expresso Caxiense S.A.: Provision of passenger transportation services in case of an interrupted flight, effective until March 9, 2023; and |
| · | Viação Piracicabana Ltda.: Provision of passenger, baggage, crew, and employee transportation services between airports, effective until September 30, 2026. |
On March 31, 2022, the GLA subsidiary recognized a total expense related to these services totaling R$1.195 (R$13 on March 31, 2021). On the same date, the balance payable to related companies, under “suppliers”, was R$3,508 (R$3,397 on December 31, 2021).
| 28.3. | Contracts Account Opening UATP (“Universal Air Transportation Plan”) to Grant Credit Limit |
The subsidiary GLA entered into UATP account opening agreements with the related parties indicated below: Aller Participações S.A.; BR Mobilidade Baixada Santista S.A. SPE; Breda Transportes e Serviços S.A.; Comporte Participações S.A.; Empresa Cruz de Transportes Ltda.; Empresa de Ônibus Pássaro Marrom S.A.; Empresa Princesa do Norte S.A.; Expresso Itamarati S.A.; Expresso Maringá do Vale S.A.; Expresso União Ltda.; Glarus Serviços Tecnologia e Participações S.A.; Limmat Participações S.A.; Quality Bus Comércio de Veículos S.A.; Super Quadra Empreendimentos Imobiliários S.A.; Thurgau Participações S.A.; Transporte Coletivo Cidade Canção Ltda.; Turb Transporte Urbano S.A.; Vaud Participações S.A.; and Viação Piracicabana Ltda.; all with no expiration date, whose purpose is to issue credits to purchase airline tickets issued by the Company. The UATP account (virtual card) is accepted as a payment means on the purchase of airline tickets and related services, seeking to simplify billing and make feasible payment between the participating companies.
The companies indicated above are owned by the individuals who control MOBI and Path Brazil, the main shareholders of the Company.
| 44 |
| Notes on the Parent Company and Consolidated Quarterly Information (ITR) March 31, 2022 (In thousands of Brazilian Reais - R$, except when otherwise indicated) |
| 28.4. | Commercial Partnership and Maintenance Agreement |
On February 19, 2014, the Company signed an exclusive strategic partnership agreement for business cooperation with AirFrance-KLM. On January 1, 2017, the Company signed an extension of the scope to include maintenance services. During the period ended March 31, 2022, expenses with component maintenance incurred at the AirFrance-KLM workshop were R$2,567 (R$32,572 in the period ended March 31, 2021). On March 31, 2022, the Company has R$110,373 in the “Suppliers” account under current liabilities (R$99,976 on December 31, 2021).
| 28.5. | Multimodal transport commercial partnership agreement |
Company´s subsidiary GLA entered into a commercial partnership agreement with the companies União Transporte, Itamarati Express and Cruz Encomedas (together denominated, “Grupo Comporte”), Tex Transportes and Expresso Luxo, effective for 3 years, the purpose of which is to provide multimodal transport, including road freight transport by the Partners and air transport services provided by GLA.
In order to achieve the Agreement, GLA signed a Contract for the provision of multimodal transport services with each of these companies. The parties will be remunerated for the value of the service related to the section operated by each party, through the issuance of the respective CTe, in accordance with the values established in the price tables practiced by each Party.
Grupo Comporte are owned by the individuals who control MOBI and Path Brazil, the Company's main shareholders.
| 28.6. | Compensation of the Key Management Personnel |
| Consolidated | ||
| March 31, 2022 | March 31, 2021 | |
| Salaries, Bonus and Benefits (*) | 9,550 | 9,638 |
| Payroll Charges | 4,071 | 1,500 |
| Share-Based Compensation | 5,713 | 4,969 |
| Total | 19,334 | 16,107 |
(*) Includes compensation for members of the Management and audit committee.
| 29. | Revenue |
| Consolidated | ||
| March 31, 2022 | March 31, 2021 | |
| Passenger Transportation (*) | 3,115,492 | 1,462,845 |
| Cargo Transportation | 104,229 | 85,144 |
| Mileage Revenue | 117,596 | 88,264 |
| Other Revenues | 10,559 | 7,726 |
| Gross Revenue | 3,347,876 | 1,643,979 |
| Related Tax | (127,424) | (76,352) |
| Net Revenue | 3,220,452 | 1,567,627 |
(*) Of the total amount, the total of R$56,314 for the three-month period ended on March 31, 2022, is made up of the revenue from non-attendance of passengers, rescheduling, ticket cancellation (R$112,147 for the three-month period ended March 31, 2021).
In the three-month periods ended March 31, 2022 and March 31, 2021, revenues earned in the international market represent less than 10% of total revenues
| 45 |
| Notes on the Parent Company and Consolidated Quarterly Information (ITR) March 31, 2022 (In thousands of Brazilian Reais - R$, except when otherwise indicated) |
| 30. | Costs of Services and Operational Expenses |
| Parent Company | Consolidated | |||
| March 31, 2022 | March 31, 2021 | March 31, 2022 | March 31, 2021 | |
| Cost of Services | ||||
| Employees | - | - | (397,149) | (312,046) |
| Fuels and Lubricants (c) | - | - | (1,205,675) | (566,128) |
| Maintenance, Material and Repairs | - | - | (189,998) | (153,366) |
| Passenger Costs | - | - | (190,269) | (108,016) |
| Services | - | - | (51,167) | (43,039) |
| Landing Fees | - | - | (165,577) | (114,065) |
| Depreciation and Amortization | - | - | (334,843) | (239,904) |
| Other Operating Costs | - | - | (78,823) | (98,681) |
| Total Cost of Services | - | - | (2,613,501) | (1,635,245) |
| Selling Expenses | ||||
| Employees | - | - | (8,820) | (6,122) |
| Services | - | - | (43,568) | (23,513) |
| Sales and Marketing | - | - | (164,693) | (66,361) |
| Other Selling Expenses | - | - | (10,043) | (7,783) |
| Total Selling Expenses | - | - | (227,124) | (103,779) |
| Administrative Expenses | ||||
| Salaries (a) | (1,051) | (3,460) | (175,347) | (146,264) |
| Services | (6,151) | (18,167) | (91,635) | (120,550) |
| Depreciation and Amortization | - | - | (25,934) | (33,720) |
| Other Administrative Expenses | (8,903) | (5,953) | (72,532) | (62,659) |
| Total Administrative Expenses | (16,105) | (27,580) | (365,448) | (363,193) |
| Other Operational Revenues (Expenses) | ||||
| Sale-Leaseback Transactions (d) | 49,156 | - | 55,491 | - |
| Recovery of Taxes Paid | - | - | - | 59,874 |
| Idleness - Depreciation and Amortization (b) | - | - | (36,772) | (62,675) |
| Other Operating Expenses | 15,109 | 489 | 44,043 | 14,887 |
| Total Other Operating Revenues and (Expenses), Net | 64,265 | 489 | 62,762 | 12,086 |
| Total | 48,160 | (27,091) | (3,143,311) | (2,090,131) |
(a) The Company recognizes compensation paid to members of the Audit Committee, the Board of Directors, and the Fiscal Council in the "Salaries" line item.
(b) See Note 1.1.
(c) See Note 1.2.
(d) See Note 17.1
| 46 |
| Notes on the Parent Company and Consolidated Quarterly Information (ITR) March 31, 2022 (In thousands of Brazilian Reais - R$, except when otherwise indicated) |
| 31. | Financial Income (Expenses) |
| Parent Company | Consolidated | |||
| March 31, 2022 | March 31, 2021 | March 31, 2022 | March 31, 2021 | |
| Financial Revenues | ||||
| Gains from Financial Investments | 1,166 | 57 | 12,634 | 6,839 |
| Others (a) (b) | 42,635 | 29,988 | 5,622 | 6,285 |
| Total Financial Revenues | 43,801 | 30,045 | 18,256 | 13,124 |
| Financial Expenses | ||||
| Interest and Costs on Loans and Financing | (214,588) | (167,567) | (268,497) | (194,640) |
| Interest on Leases | - | - | (256,624) | (227,327) |
| Interests on the Provision for Aircraft Return | - | - | (83,833) | (18,870) |
| Commissions, Bank Charges and Interest on Other Operations (d) | (3) | (16,178) | (100,945) | (52,608) |
| Others | (40) | (2,504) | (46,709) | (23,307) |
| Total Financial Expenses | (214,631) | (186,249) | (756,608) | (516,752) |
| Derivative Financial Instruments | ||||
| Conversion Right and Derivatives - ESN, Net (c) | (2,966) | 72,490 | (2,966) | 72,490 |
| Other Derivative Financial Instruments, Net | - | - | (2,700) | 1,264 |
| Total Derivative Financial Instruments | (2,966) | 72,490 | (5,666) | 73,754 |
Monetary and Foreign Exchange Variations
| 633,049 | (324,566) | 3,404,882 | (1,532,444) |
| Total | 459,253 | (408,280) | 2,660,864 | (1,962,318) |
| (a) | In the period ended March 31, 2022 of the total parent company and consolidated balance, R$388 and R$4,302, respectively, refer to PIS and COFINS levied on financial revenues earned, as per Decree 8426 of April 1, 2015 (R$412 and R$4,791 in the period ended March 31, 2021). |
| (b) | The balance recorded in Others in the Parent Company includes interest on loan totaling R$43,023 in the period ended March 31, 2022 (R$30,401 in the period ended March 31, 2021). |
| (c) | See Note 33.2 (ESN and Capped call). |
| (d) | The increase in these expenses in the period is substantially linked to interest on prepayment of receivables in line with sales growth. |
| 32. | Commitments |
On March 31, 2022, the Company had 96 firm orders (103 on December 31, 2021) for aircraft acquisitions with Boeing. These aircraft acquisition commitments include estimates for contractual price increases during the construction phase. On March 31, 2022, the approximate amount of firm orders in the current period considers estimated contractual discounts and corresponds to around R$17,771,983 (R$21,947,804 on December 31, 2021) corresponding to US$3,751,104 (US$3,932,946 on December 31, 2021) and are segregated as follows:
| Parenty Company and Consolidated | ||
| March 31, 2022 | December 31, 2021 | |
| 2022 | 987,670 | 2,805,899 |
| 2023 | 3,540,630 | 3,384,587 |
| 2024 | 4,784,634 | 6,101,396 |
| 2025 | 5,631,487 | 6,428,138 |
| 2026 | 2,827,562 | 3,227,784 |
| Total | 17,771,983 | 21,947,804 |
| 47 |
| Notes on the Parent Company and Consolidated Quarterly Information (ITR) March 31, 2022 (In thousands of Brazilian Reais - R$, except when otherwise indicated) |
Of the total commitments presented above, the Company should disburse the amount of R$6,080,489 (corresponding to US$1,283,399 on March 31, 2022) as advances for aircraft acquisition, according to the financial flow below:
| Parenty Company and Consolidated | ||
| March 31, 2022 | December 31, 2021 | |
| 2022 | 213,988 | 248,109 |
| 2023 | 1,232,837 | 1,174,768 |
| 2024 | 1,673,243 | 2,145,764 |
| 2025 | 1,973,204 | 2,279,227 |
| 2026 | 987,217 | 1,141,513 |
| Total | 6,080,489 | 6,989,381 |
| 33. | Financial Instruments and Risk Management |
Operational activities expose the Company and its subsidiaries to market risk, credit risk and liquidity risk. These risks can be mitigated by using exchange swap derivatives, futures and options contracts based on oil, U.S. dollar and interest markets.
Financial instruments are managed by the Financial Policy Committee (“CPF”) in line with the Risk Management Policy approved by the Risk Policy Committee (“CPR”) and submitted to the Board of Directors.
The details regarding how the Company manages risks have been widely presented in the annual financial statements related to the year ended December 31, 2021. Since then, there have been no changes.
| 48 |
| Notes on the Parent Company and Consolidated Quarterly Information (ITR) March 31, 2022 (In thousands of Brazilian Reais - R$, except when otherwise indicated) |
| 33.1. | Accounting Classifications of Financial Instruments |
The accounting classifications of the Company's consolidated financial instruments on March 31, 2022, and December 31, 2021, are shown below:
| Parent Company | Consolidated | |||||||
| Measured at Fair Value through Income (Expenses) | Cost amortized | Measured at Fair Value through Income (Expenses) | Cost amortized | |||||
| March 31, 2022 | December 31, 2021 | March 31, 2022 | December 31, 2021 | March 31, 2022 | December 31, 2021 | March 31, 2022 | December 31, 2021 | |
| Cash and Bank Deposits | 9,900 | 2,981 | - | - | 92,702 | 116,123 | - | - |
| Cash Equivalents | 347 | 207,960 | - | - | 42,534 | 370,135 | - | - |
| Financial Investments | 4,830 | 4,378 | - | - | 395,824 | 373,689 | - | - |
| Trade Receivables | - | - | - | - | - | - | 956,479 | 850,683 |
| Rights from Derivative Transactions | 77,294 | 107,170 | - | - | 88,550 | 114,060 | - | - |
| Deposits (a) | - | - | 2,369 | 2,790 | - | - | 1,189,225 | 1,373,109 |
| Credits with Related Companies | - | - | 6,007,136 | 7,008,275 | - | - | - | - |
| Other Credits | - | - | 96,037 | 14,458 | - | - | 273,607 | 189,017 |
| Liabilities | ||||||||
| Loans and Financing (b) | 129,942 | 162,568 | 8,372,749 | 9,859,000 | 129,942 | 162,568 | 10,166,569 | 11,737,462 |
| Leases to Pay | - | - | - | - | - | - | 10,426,574 | 10,762,984 |
| Suppliers | - | - | 47,419 | 84,351 | - | - | 1,919,150 | 1,898,970 |
| Suppliers - factoring | - | - | - | - | - | - | 9,786 | 22,733 |
| Obligations to Related Parties | - | - | 76,009 | 6,692 | - | - | - | - |
| Other Liabilities | - | - | 517,379 | 581,767 | - | - | 923,110 | 1,023,070 |
| (a) | Excludes judicial deposits, as described in Note 10. |
| (b) | The amounts on March 31, 2022, and December 31, 2021, classified as measured at fair value through income (expense), are related to the derivative contracted through Exchange Senior Notes. |
In the period ended March 31, 2022, financial instruments were not reclassified.
| 49 |
| Notes on the Parent Company and Consolidated Quarterly Information (ITR) March 31, 2022 (In thousands of Brazilian Reais - R$, except when otherwise indicated) |
| 33.2. | Derivative and Non-Derivative Financial Instruments |
The Company's derivative financial instruments were recognized as follows in the Balance sheet:
| Derivatives | Non-derivative | ||||||
| Fuel | Interest rate | Foreign curency rate | Capped call | ESN | Revenue hedge | Total | |
| Fair value changes | |||||||
| Derivatives assets (liabilities) on December 31, 2021 | 6,890 | - | - | 107,170 | (162,568) | - | (48,508) |
| Gains (losses) recognized in income (expenses) | - | - | (2,855) | (29,876) | 32,626 | - | (105) |
| Gains (losses) recognized in equity valuation adjustments | 1,852 | - | - | - | - | - | 1,852 |
| Payments during the period | - | - | 5,369 | - | - | - | 5,369 |
| Derivatives assets (liabilities) on March 31, 2022 | 8,742 | - | 2,514 | 77,294 | (129,942) | - | (41,392) |
| Derivative assets – Current | 8,742 | - | 2,514 | - | - | - | 11,256 |
| Derivative assets – Non-current | - | - | - | 77,294 | - | - | 77,294 |
| Loans and financing | - | - | - | - | (129,942) | - | (129,942) |
| Changes in the adjustment of equity valuation | |||||||
| Balance on December 31, 2021 | (9,228) | (296,829) | - | - | - | (612,744) | (918,801) |
| Fair value adjustments during the period | 1,852 | - | - | - | - | - | 1,852 |
| Adjustments of hedge accounting of revenue | - | - | - | - | - | 289,363 | 289,363 |
| Net reversal to income (expenses) | (2,588) | 1,697 | - | - | - | 23,845 | 22,954 |
| Balances on March 31, 2022 | (9,964) | (295,132) | - | - | - | (299,536) | (604,632) |
| Effects on income (expenses) | 2,588 | (1,697) | (2,855) | (29,876) | 32,626 | (313,208) | (312,422) |
| Revenue | - | - | - | - | - | (29,527) | (29,527) |
| Aircraft fuel | 736 | - | - | - | - | - | 736 |
| Derivative financial results | 1,852 | (1,697) | (2,855) | (16,786) | 13,820 | - | (5,666) |
| Monetary and foreign exchange rate variation, net | - | - | - | (13,090) | 18,806 | (283,681) | (277,965) |
The Company may adopt hedge accounting for derivatives contracted to hedge cash flow and qualify for this classification as per CPC 48 - Financial Instruments (equivalent to IFRS 9).
On March 31, 2022, the Company adopts a cash flow hedge for the interest rate (mainly the Libor interest rates) and aeronautical fuel protection and future revenue in US Dollar.
The schedule for realizing the balance of equity valuation adjustments on March 31, 2022, referring to cash flow hedges, is as follows:
| 2022 | 2023 | 2024 | 2025 | 2026 | 2026 onwards | |
| Fuel | (9,964) | - | - | - | - | - |
| Interest rate | (5,389) | (28,033) | (32,781) | (34,419) | (34,252) | (160,258) |
| Revenue hedge | (61,199) | (131,057) | (107,280) | - | - | - |
| Total | (76,552) | (159,090) | (140,061) | (34,419) | (34,252) | (160,258) |
| 33.3. | Market Risks |
| 33.3.1. | Fuel |
The aircraft fuel prices fluctuate due to the volatility of the price of crude oil by product price fluctuations. The Company may uses different instruments to hedge its exposure to the fuel price.
| 50 |
| Notes on the Parent Company and Consolidated Quarterly Information (ITR) March 31, 2022 (In thousands of Brazilian Reais - R$, except when otherwise indicated) |
The table below shows the sensitivity analysis of the derivative financial instruments contracted on this date considering the fluctuation of prices of air fuel priced in U.S. dollars, based on the barrel price on March 31, 2022 at US$100.28:
| Fuel | ||
Barrel price (in USD) | Impact (in thousand of Reais) | |
| Decline in prices/barrel (-25%) | 75.21 | (3,477) |
| Decline in prices/barrel (-10%) | 90.25 | (1,203) |
| Increase in prices/barrel (+10%) | 110.31 | 934 |
| Increase in prices/barrel (+25%) | 125.35 | 1,907 |
| 33.3.2. | Interest Rate |
The Company is mainly exposed to lease transactions indexed to changes in the Libor rate until the aircraft is received. To mitigate such risks, the Company can use derivative financial instruments. On March 31, 2022, the Company and its subsidiaries have open interest derivative agreements.
On March 31, 2022, the Company held financial investments and loans and financing with different types of fees. Its sensitivity analysis of non-derivative financial instruments examined the impact on annual interest rates only for positions with material amounts on March 31, 2022 that were exposed to fluctuations in interest rates, as the scenarios below show. The amounts show the impacts on Income (Expenses) according to the scenarios adopted below:
| Financial investments net of financial debt (a) | ||
| Risk | CDI rate increase | Libor rate increase |
| Reference rates | 11.65% | 0.51% |
| Exposure amount (probable scenario) (b) | (904,557) | (2,152,137) |
| Remote favorable scenario (-25%) | 26,828 | 2,736 |
| Possible favorable scenario (-10%) | 10,731 | 1,094 |
| Possible adverse scenario (+10%) | (10,731) | (1,094) |
| Remote adverse scenario (+25%) | (26,828) | (2,736) |
| (a) | Refers to the sum of the amounts invested and raised in the financial market and indexed to the CDI and Libor rates. |
| (b) | Book balances recorded as of March 31, 2022. |
| 33.3.3. | Exchange Rate |
Foreign currency risk derives from the possibility of unfavorable fluctuation of foreign currency to which the Company’s liabilities or cash flows are exposed. The Company is mainly exposed to the exchange rate change of the U.S. dollar.
| 51 |
| Notes on the Parent Company and Consolidated Quarterly Information (ITR) March 31, 2022 (In thousands of Brazilian Reais - R$, except when otherwise indicated) |
The Company’s foreign currency exposure is summarized below:
| Parent Company | Consolidated | |||
| March 31, 2022 | December 31, 2021 | March 31, 2022 | December 31, 2021 | |
| Assets | ||||
| Cash, Cash Equivalents and Financial Investments | 1,012 | 3,626 | 139,923 | 153,040 |
| Trade Receivables | - | - | 196,186 | 171,473 |
| Deposits | 2,369 | 2,790 | 1,189,225 | 1,373,109 |
| Derivative Assets | 77,294 | 107,170 | 88,550 | 114,060 |
| Total Assets | 80,675 | 113,586 | 1,613,884 | 1,811,682 |
| Liabilities | ||||
| Loans and Financing | (8,502,691) | (10,021,568) | (9,030,066) | (10,677,266) |
| Leases to Pay | - | - | (10,204,053) | (10,724,976) |
| Suppliers | (22,737) | (32,272) | (498,926) | (497,877) |
| Provision for Aircraft and Engine Return | - | - | (2,458,731) | (2,679,833) |
| Total Liabilities | (8,525,428) | (10,053,840) | (22,191,776) | (24,579,952) |
| Exchange Rate Exposure Liabilities | (8,444,753) | (9,940,254) | (20,577,892) | (22,768,270) |
| Commitments Not Recorded in the Statements of Financial Position | ||||
| Future Obligations Resulting from Firm Aircraft Orders | (17,771,983) | (21,947,804) | (17,771,983) | (21,947,804) |
| Total | (17,771,983) | (21,947,804) | (17,771,983) | (21,947,804) |
| Total Exchange Rate Exposure - R$ | (26,216,736) | (31,888,058) | (38,349,875) | (44,716,074) |
| Total Exchange Rate Exposure - US$ | (5,533,525) | (5,714,194) | (8,094,448) | (8,012,915) |
| Exchange Rate (R$/US$) | 4.7378 | 5.5805 | 4.7378 | 5.5805 |
As of March 31, 2022, the Company adopted the closing exchange rate of R$4.7378/US$1.00 as a likely scenario. The table below shows the sensitivity analysis and the effect on income (expenses) of exchange rate fluctuations in the exposure amount of the period as of March 31, 2022:
| Effect on income (expenses) | |||
| Exchange rate | Parenty Company | Consolidated | |
| Net liabilities exposed to the risk of appreciation of the U.S. dollar | 4.7378 | 8,444,753 | 20,577,892 |
| Dollar depreciation (-25%) | 3.5534 | 2,111,188 | 5,144,473 |
| Dollar depreciation (-10%) | 4.2640 | 844,475 | 2,057,789 |
| Dollar appreciation (+10%) | 5.2116 | (844,475) | (2,057,789) |
| Dollar appreciation (+25%) | 5.9223 | (2,111,188) | (5,144,473) |
| 33.3.4. | Capped Call |
The Company, through Gol Equity Finance, in the context of the pricing of the ESN issued on March 26, April 17 and July 17, 2019, contracted private derivative transactions (Capped call) with part of the note subscribers with the purpose of minimizing the potential dilution of the Company’s preferred shares and ADSs.
| 52 |
| Notes on the Parent Company and Consolidated Quarterly Information (ITR) March 31, 2022 (In thousands of Brazilian Reais - R$, except when otherwise indicated) |
| 33.4. | Credit Risk |
Credit risk is inherent in the Company’s operating and financing activities, mainly in cash and cash equivalents, financial investments and trade receivables. Financial assets classified as cash, cash equivalents, and financial investments are deposited with counterparties rated investment grade or higher by S&P or Moody's (between AAA and AA-), pursuant to risk management policies.
Credit limits are set for all customers based on internal credit rating criteria and carrying amounts represent the maximum credit risk exposure. Customer creditworthiness is assessed based on an internal system of extensive credit rating. Outstanding trade receivables are frequently monitored by the Company.
Derivative financial instruments are contracted in the over-the-counter market (OTC) with counterparties rated investment grade or higher, or in a commodities and futures exchange (B3 or NYMEX), thus substantially mitigating credit risk. The Company's obligation is to evaluate counterparty risk involved in financial instruments and periodically diversify its exposure.
| 33.5. | Liquidity risk |
The Company is exposed to liquidity risk in two distinct ways: (i) market prices, which vary in accordance with the types of assets and markets where they are traded, and (ii) cash flow liquidity risk related to difficulties in meeting the contracted operating obligations at the maturity dates. In order to manage liquidity risk, the Company invests its funds in liquid assets (government bonds, CDBs and investment funds with daily liquidity) and its Cash Management Policy requires the weighted average maturity of its debt to be longer than the weighted average term of its investment portfolio term.
The schedules of financial liabilities held by the Company's financial liabilities on March 31, 2022 and December 31, 2021 are as follows:
| Parent Company | |||||
| Less than 6 months | 6 - 12 months | 1 - 5 years | More than 5 years | Total | |
| Loans and Financing | 127,960 | - | 7,645,580 | 729,151 | 8,502,691 |
| Suppliers | 47,403 | - | 16 | - | 47,419 |
| Obligations to Related Parties | - | - | 76,009 | - | 76,009 |
| Other Liabilities | 85,666 | - | 431,714 | - | 517,380 |
| On March 31, 2022 | 261,029 | - | 8,153,319 | 729,151 | 9,143,499 |
| Loans and Financing | 164,304 | - | 8,998,421 | 858,843 | 10,021,568 |
| Suppliers | 84,335 | - | 16 | - | 84,351 |
| Obligations to Related Parties | - | - | 6,692 | - | 6,692 |
| Other Liabilities | 85,843 | - | 495,923 | - | 581,766 |
| On December 31, 2021 | 334,482 | - | 9,501,052 | 858,843 | 10,694,377 |
| 53 |
| Notes on the Parent Company and Consolidated Quarterly Information (ITR) March 31, 2022 (In thousands of Brazilian Reais - R$, except when otherwise indicated) |
| Consolidated | |||||
| Less than 6 months | 6 - 12 months | 1 - 5 years | More than 5 years | Total | |
| Loans and Financing | 445,327 | 275,831 | 8,819,867 | 755,486 | 10,296,511 |
| Leases Payable | 1,198,746 | 772,007 | 4,592,335 | 3,863,486 | 10,426,574 |
| Suppliers | 1,860,462 | - | 58,688 | - | 1,919,150 |
| Suppliers - Forfaiting | 9,786 | - | - | - | 9,786 |
| Other Liabilities | 414,567 | - | 508,543 | - | 923,110 |
| On March 31, 2022 | 3,928,888 | 1,047,838 | 13,979,433 | 4,618,972 | 23,575,131 |
| Loans and Financing | 478,566 | 156,048 | 10,373,517 | 891,899 | 11,900,030 |
| Leases Payable | 1,209,215 | 848,472 | 5,159,608 | 3,545,689 | 10,762,984 |
| Suppliers | 1,820,056 | - | 78,914 | - | 1,898,970 |
| Suppliers - Forfaiting | 22,733 | - | - | - | 22,733 |
| Other Liabilities | 455,251 | - | 568,449 | - | 1,023,700 |
| On December 31, 2021 | 3,985,821 | 1,004,520 | 16,180,488 | 4,437,588 | 25,608,417 |
| 33.6. | Capital Management |
The Company seeks alternatives to capital to meet its operational needs, aiming at a capital structure that considers suitable parameters for the financial costs, the maturities of funding, and its guarantees. The Company monitors its financial leverage ratio, which corresponds to net debt, including short and long-term debt. The following table shows the financial leverage:
| March 31, 2022 | December 31, 2021 | |
| Total Loans and Financing | 10,296,511 | 11,900,030 |
| Total Leases | 10,426,574 | 10,762,984 |
| (-) Cash and Cash Equivalents | (135,236) | (486,258) |
| (-) Financial Investments | (395,824) | (373,689) |
| Net Iindebtedness | 20,192,025 | 21,803,067 |
| 34. | Non-Cash Transactions |
| Parent Company | ||
| March 31, 2022 | March 31, 2021 | |
| Dividends Receivable (Investments / Dividends Receivable) | - | 263,008 |
| Share-Based Compensation (Investments / Share-Based Payment) | 5,235 | 5,010 |
| Unrealized Income (Expenses) of Derivatives (Investments / Equity Valuation Adjustment) | 314,169 | 96,722 |
| Treasury Shares Transferred (Treasury Shares / Capital Reserves) | 966 | - |
| Consolidated | ||
| March 31, 2022 | March 31, 2021 | |
| Dividends payable (Non-Controlling Interest / Other liabilities) | - | 236,992 |
Write-off of lease agreements (Property, Plant and Equipment / Leases Payable) | 242 | - |
| Amortization of debt with financial investments (Financial Investments / Loans and Financing) | - | 198,270 |
| Amortization of debt whit deposits (Deposits / Leases Payable) | - | 2,838 |
| Sale-leaseback (Property, Plant and Equipment / Leases Payable) | 1,422,580 | - |
| Right of use of flight equipment (Property, Plant and Equipment / Leases Payable) | 172,376 | 153,126 |
| Lease agreement renegotiation (Property, Plant and Equipment / Leases Payable) | 3,847 | 2,500 |
| Provision for aircraft return (Property, Plant and Equipment / Provisions) | 18,427 | (3,629) |
| Unrealized income (expenses) of derivatives (Derivative Assets / Equity Valuation Adjustments) | 314,169 | - |
| Treasury shares transferred (Treasury Shares / Capital Reserves) | 966 | - |
| 54 |
| Notes on the Parent Company and Consolidated Quarterly Information (ITR) March 31, 2022 (In thousands of Brazilian Reais - R$, except when otherwise indicated) |
| 35. | Liabilities from Financing Activities |
The changes in and equity instruments issued liabilities from the Company’s financing activities in the periods ended March 31, 2022, and 2021 are as follows:
| 35.1. | Parent Company |
| 31/03/2022 | |||||||||
| Non-Cash Transactions | Adjustments to Profit | ||||||||
| Opening Balance | Net Cash Flows (Used in) from Financing Activities | Net Cash Flows from Operating Activities | Exchange Rate Changes, Net | Provision for Interest and Cost Amortization | Unrealized Income (Expenses) on Derivatives | Capital increase with shares to be issued | Closing Balance | ||
| Loans and Financing | 10,021,568 | - | (182,609) | (1,537,036) | 214,588 | (13,820) | - | 8,502,691 | |
| Obligations to Related Parties | 6,692 | 75,276 | - | (5,959) | - | - | - | 76,009 | |
| Share Capital | 4,039,112 | 349 | 3 | 4,039,464 | |||||
| March 31, 2021 | |||||||
| Adjustment to Profit | |||||||
| Opening Balance | Net Cash Flows (Used in) from Financing Activities | Net Cash Flows from Operating Activities | Exchange Rate Changes, Net | Provision for Interest and Cost Amortization | Unrealized Income (Expenses) on Derivatives | Closing Balance | |
| Loans and Financing | 7,629,713 | (103,179) | (191,018) | 737,242 | 167,567 | (116,546) | 8,123,779 |
| 55 |
| Notes on the Parent Company and Consolidated Quarterly Information (ITR) March 31, 2022 (In thousands of Brazilian Reais - R$, except when otherwise indicated) |
| 35.2. | Consolidated |
| March 31, 2022 | |||||||||||||
| Non-cash transactions | Adjustments to profit | ||||||||||||
| Opening balance | Net cash used in financing activities | Net cash used in operating activities | Capital increase with shares to be issued | Variation in variable and short-term leases | Property, plant and equipment acquisition through new agreements | Leases write-off | Exchange rate changes, net | Provision for interest and cost amortization | Contractual amendment | Unrealized income (expenses) on derivatives | Closing balance | ||
| Loans and financing | 11,900,030 | (34,067) | (189,042) | - | - | - | - | (1,635,087) | 268,497 | - | (13,820) | 10,296,511 | |
| Leases | 10,762,984 | (528,020) | (3,026) | - | (5,106) | 1,676,136 | (242) | (1,728,929) | 256,624 | (3,847) | - | 10,426,574 | |
| Capital stock | 4,039,112 | 349 | - | 3 | - | - | - | - | - | - | - | 4,039,464 | |
| March 31, 2021 | |||||||||||||
| Non-Cash Transactions | Adjustments to Profit | ||||||||||||
| Opening Balance | Net Cash from Financing Activities | Net Cash Used in Operating Activities | Acquisition of Property, Plant & Equipment under New Agreements | Liability Variation of Variable and Short-Term Leases | Amortization with related assets | Distribution of Interim Dividends | Exchange Rate Changes, Net | Provision for Interest and Cost Amortization | Contractual Amendment | Unrealized Income (Expenses) on Derivatives | Closing Balance | ||
| Loans and Financing | 9,976,966 | (112,589) | (215,462) | - | - | (198,270) | - | 878,083 | 194,640 | - | (116,546) | 10,406,822 | |
| Leases to Pay | 7,584,192 | (128,528) | - | 153,126 | 12,353 | (2,838) | - | 728,389 | 227,327 | 2,500 | - | 8,576,521 | |
| Dividends and ISE to Pay (1) | 23,139 | (23,139) | - | - | - | - | 236,992 | - | - | - | - | 236,992 | |
| (1) | The amount is recorded in the Other Liabilities group, in current liabilities. |
| 56 |
| Notes on the Parent Company and Consolidated Quarterly Information (ITR) March 31, 2022 (In thousands of Brazilian Reais - R$, except when otherwise indicated) |
| 36. | Subsequent Events |
| 36.1. | Exclusive codeshare agreement with American Airlines |
Following the agreement signed between GOL and American Airlines to expand their commercial cooperation, in April 2022 the Company announced a capital increase in the minimum amount of R$948,320, paid in by American Airlines on April 13, 2022. In this transaction, American Airlines obtains the right to appoint a member to GOL's Board of Directors for the next three years. The shareholders of the Company are entitled to pro rata preemptive in the subscription of preferred shares and may assign such preemptive rights to third parties until May 13, 2022.
| 36.2. | Landmark cargo and logistics services agreement |
In April 2022, Company signed a 10-year cargo service agreement with Mercado Livre. The agreement includes a dedicated freighter fleet of six Boeing 737-800 BCF and is expected to begin operations during second semester 2022. There is also the option of adding other six cargo aircraft by 2025.
GOL’s agreement with Mercado Livre is part of the Company’s investment to serve the needs of the growing Brazilian e-commerce market. As a result, the Company plans to increase its range of services and tonnage capacity to generate additional incremental revenue.
| 57 |
SIGNATURE
Pursuant to the requirements of the Securities Exchange Act of 1934, the registrant has duly caused this report to be signed on its behalf by the undersigned, thereunto duly authorized.
Date: April 266, 2022
| GOL LINHAS AÉREAS INTELIGENTES S.A. | ||
| By: | /s/ Richard F. Lark, Jr. | |
Name: Richard F. Lark, Jr. Title: Investor Relations Officer | ||