SECURITIES AND EXCHANGE COMMISSION
Washington, D.C. 20549
FORM 6-K
REPORT OF FOREIGN ISSUER
PURSUANT TO RULE 13a-16 OR 15d-16 OF THE
SECURITIES EXCHANGE ACT OF 1934
For the month of July 2022
(Commission File No. 001-32221)
GOL LINHAS AÉREAS INTELIGENTES S.A.
(Exact name of registrant as specified in its charter)
GOL INTELLIGENT AIRLINES INC.
(Translation of registrant’s name into English)
Praça Comandante Linneu Gomes, Portaria 3, Prédio 24
Jd. Aeroporto
04630-000 São Paulo, São Paulo
Federative Republic of Brazil
(Address of registrant’s principal executive offices)
Indicate by check mark whether the registrant files or will file
annual reports under cover Form 20-F or Form 40-F.
Form 20-F ___X___ Form 40-F ______
Indicate by check mark whether the registrant by furnishing the
information contained in this Form is also thereby furnishing the
information to the Commission pursuant to Rule 12g3-2(b) under
the Securities Exchange Act of 1934.
Yes ______ No ___X___
Quarterly Information (ITR)
Parent Company and Consolidated
GOL Linhas Aéreas Inteligentes S.A.
June 30, 2022
with Review Report on the Quarterly Information
Gol Linhas Aéreas Inteligentes S.A.
Parent Company and Consolidated Quarterly Information (ITR)
June 30, 2022
Contents
| Comments on the Performance | 2 |
| Report of the Statutory Audit Committee (SAC) | 7 |
| Statement of the Executive Officers on the Parent Company and Consolidated Quarterly Information (ITR) | 8 |
| Statement of the Executive Officers on the Independent Auditors’ Review Report | 9 |
| Independent Auditors’ Review Report on the Quarterly Information (ITR) | 10 |
| Balance Sheets | 12 |
| Income Statement | 14 |
| Comprehensive Income Statements | 16 |
| Statements of Changes in Shareholders’ Equity | 17 |
| Cash Flow Statements | 18 |
| Statement of Added Value | 20 |
| Notes on the Parent Company and Consolidated Quarterly Information (ITR) | 21 |
Comments on the Performance
The Company’s second-quarter results demonstrate the consistent recovery in a quarter historically characterized by low seasonality in the Brazilian airline industry. Investments in technology and product offerings are essential to expanding GOL’s leadership position, both with the current recovery of the corporate segment and the increase in the offer of new routes for Customers looking for leisure destinations.
Efficient Yield Management
In April, dynamic yield management enabled GOL to offset the increase in fuel costs. In May and June, concurrently with the transition to the low season, GOL adjusted its capacity level to stabilize fares in the short term. As a result, average yield per passenger for the quarter grew by 66.2% compared to 2Q21, to a record R$43 cents.
One of GOL’s key strengths has always been its discipline in managing capacity, due to its flexible single-fleet model, which enables the Company to rapidly adjust its flight offer to the projected demand in each market. This, combined with the continuous recovery of productivity through increased utilization and higher efficiency of its operating fleet, position GOL for further success in its margin expansion strategy.
“One of the synergies from the reintegration of Smiles is optimization in the sale of seats and, consequently, the growth of customer loyalty. We have compounded on that advantage with the resumption of investments in technology and data analysis that enable us to increase yield accuracy. As a result, we achieved the highest yield ever, even in the historically weakest quarter of the year,” said Eduardo Bernardes, Chief Revenue Officer.
Acceleration of Fleet Renewal with 737-MAX as Pillar in Cost Reduction
In this quarter, the Company received three new Boeing 737-MAX 8 aircraft, increasing the share of this model to 24% of the total fleet. Maintaining the pace of fleet transformation will enable GOL to end the year with 44 737-MAX 8 aircraft, or 33% of the total, with increased productivity and greater cost efficiency. These new aircraft are integral to GOL’s strategy for growth, consistency and proximity, including its goal to reach net zero carbon by 2050, and feature 15% fuel savings, 16% lower carbon emissions, 40% less noise and longer range compared to the Boeing 737-NG.
The Company carried out the scheduled return of a Boeing 737-NG aircraft and signed contracts for the early return of four other aircraft. GOL expects to end the year with 92 737-NG aircraft, of which three of them converted to dedicated freighter models for the partnership with MELI, which should generate approximately R$100 million in incremental revenue at GOLLOG. The first cargo aircraft will start operations at the end of August/22.
“We are confident that the increase in operating fleet utilization, which generated 27.5% productivity gains this quarter, combined with the fuel savings from the new generation 737-MAX aircraft will enable us to expand our leadership in unit costs and maintain disciplined growth of our offer for the second half of the year,” commented Celso Ferrer.
Network Expansion
The Company continues to expand its network, especially at airports with high corporate demand. The recovery of this market as of April/22 led to an increase of approximately 20% and 40% in the offer of flights, respectively in Congonhas (São Paulo) and Santos Dumont (Rio de Janeiro).
For regional markets, GOL’s network opened four new bases this quarter: Ribeirão Preto, São José do Rio Preto, Passo Fundo and Uruguaiana, all with connections in Guarulhos (São Paulo), in addition to announcing two new destinations, Ipatinga and Uberaba, both in Minas Gerais.
In the international market, flights to the United States, Argentina, Paraguay and Bolivia – all destinations, which had been suspended during the pandemic - were resumed. Specifically for Argentina, whose demand has strengthened due to the exchange rate, the “air bridge” between São Paulo (Guarulhos) and Buenos Aires (Aeroparque) was announced in partnership with Aerolineas Argentina, with which GOL has had a codeshare agreement for over 10 years. The direct flights will have exclusive facilities and benefits as of 4Q22.
“The consistent growth in our second quarter results reflects an expansion of our services in regional markets, increased presence in premium markets, and the creation of new opportunities to generate complementary revenues. We’ve achieved this while simultaneously preserving the flexibility of our single-fleet model which, combined with our experienced Team of Eagles, enables us to adapt to the evolving market dynamics quickly and efficiently,” commented Eduardo Bernardes.
| 2 |
Liquidity Management and Margin Strengthening
The Company ended June/22 with liquidity (cash and cash equivalents, financial investments, trade receivables and deposits) of R$4.0 billion. Disregarding the exchange rate variation, the level of financial debt remained stable when compared to the pre-pandemic period, with significantly lower short-term amortizations compared to its competitors and without significant maturities for the next two years. GOL maintained credit ratings of Fitch B-, Moody’s B3, S&P CCC+.
The maintenance costs required for new deliveries of the 737-MAX as part of the fleet renewal acceleration plan will largely be met through financing lines already obtained from counterparties and through use of the maintenance deposit balance. GOL does not have significant expenditures for future aircraft acquisition advances (“PDPs”), associated with additional new 737-MAX aircraft.
Richard Lark, CFO, said: “We prioritized liability management and preserved assets during the pandemic, as we believed we would be in a unique position to focus on recovering our margins and expanding our competitive cost advantages. We do not have significant maturities in the near-term and we will gradually lead GOL to strengthen its balance sheet with financial deleveraging.”
Continuous Focus on the Customer Experience
GOL believes that the Customer experience will be critical to growth of market share post-pandemic, as passengers will look to fly with airlines that they trust for Safety and Service. In the second quarter, the Company has made important progress in enhancing services for its Customers. In May/22, the VIP lounges for international and domestic departures (GOL Premium Lounge) at Guarulhos airport were reopened and on-board service on domestic flights was re-established. International flights have had full in-flight service since November/21. GOL’s domestic NPS increased to 44 in 2Q22.
In June, GOL received a new award as the airline with the best Wi-Fi in South America by APEX (Airline Passenger Experience Association), based on a survey that collected anonymous opinions from passengers on around 1 million flights carried out by more than 600 airlines around the world. As of July/22, Smiles Customers can use the Facebook and WhatsApp messaging applications completely free of charge on GOL flights with internet available.
The partnership between GOL and American Airlines (AA) was expanded so that Customers of both airlines’ loyalty programs can enjoy more benefits and convenience. For instance, the Top Tier benefit for AAdvantage and Smiles Diamante Customers, traveling to destinations operated between GOL and American Airlines transforms the entire trip into a unique experience, from ticket purchase to final destination. In operation since February/20, the existing codeshare agreement between GOL and AA represents the largest route network in the Americas and allows the Company's Customers to conveniently connect to more than 40 destinations in the United States.
“As we seek to further strengthen our market leadership in the post-pandemic environment, we have been improving the Customer experience on flights operated by GOL. We continue to invest in better products and technology that will create a new experience for travel. In the next growth cycle, we will strive toward greater excellence in our relationship with Customers and Employees,” commented Carla Fonseca, Chief Experience Officer.
Re-incorporation of Smiles, GOL’s Loyalty Program
2Q22 proved the continuous improvement in all of Smiles’ performance indicators, boosted by the operational and financial synergies captured after the merger was concluded. As anticipated, the Smiles re-incorporation led to new revenue-generating opportunities; the loyalty program reached a record 20 million Customers and revenue of approximately R$1.0 billion in the second quarter, more than doubling 2Q21 figure and being the 5th consecutive quarter of sales increase.
Adding the tax synergies, working capital and unified inventory management, approximately R$1.3 billion was captured in cash, resulting in a payback of less than 1 year on the acquisition price. The Company also plans to obtain approximately R$3 billion of incremental cash flow from further synergies in the coming years.
“Smiles’ performance has surpassed our expectations every quarter, demonstrating the success of the assertive moves to strengthen the balance sheet and capital structure led by GOL. In addition to promoting high added value to the Company’s operations, Smiles continues to be an extremely valuable unencumbered asset,” concluded Richard Lark.
| 3 |
ESG Initiatives
GOL continues to advance several projects and initiatives that focus on ESG. The Company’s Diversity, Equity and Inclusion (DEI) Committee, composed of a diverse selection of employees from its Team of Eagles, conducts in-depth discussions on DEI topics, studying and proposing actions to increase diversity in leadership positions.
GOL’s policies and ethics and compliance programs review organizational anti-corruption policies and current legal and compliance guidelines, strengthening the Company’s capabilities to prevent, detect and respond to violations.
GOL remains focused on its commitment to achieving net zero carbon by 2050. The IEnvA Stage 2 certification process provides a complete validation of the Company’s Environmental Management System (EMS) at a level equivalent to ISO 14001. In 2020, GOL was the first airline in Brazil and one of 14 worldwide to earn the Stage 1 Seal, a certification developed by IATA for airlines.
On-going environmental initiatives include the Company’s partnership with MOSS; GOL issues tickets at check-in with a QR-Code to the MOSS website, where Customers can calculate and offset their carbon footprint on any flight performed by the Company.
GOL is one of the most transparent companies on ESG initiatives. For more information, the Company’s 2022 Sustainability Report is available at the following link: https://ri.voegol.com.br/conteudo_en.asp?idioma=1&conta=44&tipo=53779
Operational and Financial Indicators
| Traffic Data – GOL (in millions) | 2Q22 | 2Q21 | % Chg. |
| RPK GOL – Total | 6,967 | 3,432 | 103.0% |
| RPK GOL – Domestic | 6,457 | 3,432 | 88.1% |
| RPK GOL – Foreign Market | 510 | - | NM |
| ASK GOL – Total | 9,021 | 4,033 | 123.7% |
| ASK GOL – Domestic | 8,432 | 4,033 | 109.1% |
| ASK GOL – Foreign Market | 589 | - | NM |
| GOL Load Factor – Total | 77.2% | 85.1% | (7.9 p.p.) |
| GOL Load Factor – Domestic | 76.6% | 85.1% | (8.5 p.p.) |
| GOL Load Factor – Foreign Market | 86.7% | - | NM |
| Operating Data | 2Q22 | 2Q21 | % Chg. |
| Revenue Passengers - Pax on Board ('000) | 5,847 | 2,922 | 100.1% |
| Aircraft Utilization (Block Hours/Day) | 10.2 | 8.0 | 27.5% |
| Departures | 45,538 | 19,662 | 131.6% |
| Total Seats (‘000) | 8,024 | 3,504 | 129.0% |
| Average Stage Length (km) | 1,124 | 1,139 | (1.3%) |
| Fuel Consumption in the Period (mm liters) | 245 | 113 | 116.8% |
| Full-Time Employees (at period end) | 14,290 | 13,754 | 3.9% |
| Average Operating Fleet(4) | 98 | 53 | 84.9% |
| On-Time Departures | 94.7% | 96.3% | (1.6 p.p.) |
| Flight Completion | 99.4% | 99.0% | 0.4 p.p. |
| Passenger Complaints (per 1,000 pax) | 2.42 | 1.35 | 79.3% |
| Lost Baggage (per 1,000 pax) | 2.25 | 1.89 | 19.0% |
| Financial Data | 2Q22 | 2Q21 | % Chg. |
| Net YIELD (R$ cents) | 43.00 | 25.87 | 66.2% |
| Net PRASK (R$ cents) | 33.21 | 22.01 | 50.9% |
| Net RASK (R$ cents) | 35.94 | 25.50 | 40.9% |
| CASK (R$ cents) | 38.07 | 45.59 | (16.4%) |
| Non-fuel CASK2 (R$ cents) | 22.01 | 36.26 | (39.4%) |
| Recurring CASK (R$ cents) (5) | 35.38 | 44.47 | (20.4%) |
| Recurring ex-fuel CASK (R$ cents) (5) | 19.31 | 35.15 | (45.1%) |
| Breakeven Load Factor Ex-Non Recurring Expenses | 76.0% | 148.4% | (72.4 p.p.) |
| Average Exchange Rate(1) | 4.92 | 5.29 | (7.0%) |
| End of Period Exchange Rate(1) | 5.24 | 5.00 | 4.7% |
| WTI (Average per Barrel, US$)(2) | 108.41 | 66.10 | 64.0% |
| Fuel Price per Liter (R$) (3) | 6.03 | 3.34 | 80.5% |
| Gulf Coast Jet Fuel Cost (average per liter, US$)(2) | 1.03 | 0.46 | 123.9% |
(1) Source: Central Bank of Brazil; (2) Source: Bloomberg; (3) Fuel expenses excluding hedge results and PIS/COFINS credits/liters consumed; (4) Average operating fleet excluding aircraft in sub-leasing and MRO. Certain calculations may not match with the quarterly information due to rounding. (5) Excludes non-recurring expenses with the fleet transformation
| 4 |
Domestic Market
Demand in the domestic market reached 6,457 million RPK, up by 88% compared to 2Q21, reaching 80% of the RPK recorded in 2Q19.
Supply in the domestic market, in turn, reached 8,432 million ASK, up by 109.1% compared to 2Q21 and achieving 87% of 2Q19 levels.
The load factor was 76.6% and the Company transported around 5.6 million Customers in 2Q22, up by 88% compared to the same quarter of the previous year.
International Market
Offer in the international market, measured in ASK, was 589 million, and demand, measured in RPK, was 510 million. Compared to 2Q21, the percentage comparison is distorted since the previous base is null.
In this period, GOL transported around 197,954 passengers in the international market.
Volume of Departures and Total Seats
In 2Q22, the Company's total volume of departures was 45,538, up by 131.6% compared to 2Q21. The total number of seats available on the market was 8.0 million, also up, by 129% compared to the same period of the previous year.
PRASK, RASK and Yield
Net PRASK in 2Q22 grew by 51% over 2Q21, reaching 33.21 cents (R$). The Company's net RASK reached 35.94 cents (R$), up by 41%, also compared to 2Q21. The net yield recorded in 2Q22 reached 43.00 cents (R$), up by 66.2% compared to the same quarter of the previous year.
All the quarterly profitability indicators, described above, also had a significant growth compared to 2019, proving the Company's continuous and efficient capacity management and pricing.
Fleet
At the end of 2Q22, GOL's total fleet reached 144 Boeing 737 aircraft, with 110 NGs and 34 MAXs. GOL’s entire fleet is made of narrow-body aircraft with 98% financed via operating leases and 2% financed via finance leases.
| Total Fleet at the End of Period | 2Q22 | 2Q21 | Chg. | 1Q22 | Chg. |
| Boeing 737 | 144 | 127 | 17 | 129 | 15 |
| 737-700 NG | 21 | 23 | -2 | 23 | -2 |
| 737-800 NG | 89 | 94 | -5 | 91 | -2 |
| 737 MAX 8 | 34 | 10 | 24 | 15 | 19 |
On June 30, 2022, GOL had 95 firm orders to acquire Boeing 737-MAX aircraft, 70 for the 737-MAX 8 model and 25 for the 737-MAX 10 model. The Company's fleet plan includes returning around 28 operational aircraft by the end of 2023, with the flexibility to return more or less aircraft if necessary.
Glossary of Industry Terms
| · | AIRCRAFT LEASING: An agreement through which a company (the lessor), acquires a resource chosen by its client (the lessee) for subsequent rental to the latter for a determined period. |
| · | AVAILABLE SEAT KILOMETERS (ASK): The aircraft seating capacity is multiplied by the number of kilometers flown. |
| · | BARREL OF WEST TEXAS INTERMEDIATE (WTI): Intermediate oil from Texas, a region that refers to the name for concentrating oil exploration in the USA. WTI is used as a reference point in oil for the US derivatives markets. |
| · | BRENT: Refers to oil produced in the North Sea, traded on the London Stock Exchange, serving as a reference for the derivatives markets in Europe and Asia. |
| · | TOTAL CASH: Total cash and cash equivalents and short- and long-term investments. |
| · | OPERATING COST PER AVAILABLE SEAT KILOMETER (CASK): Operating expenses divided by the total number of available seat kilometers. |
| · | OPERATING COST PER AVAILABLE SEAT KILOMETER EX-FUEL (CASK EX-FUEL): Operating cost divided by total available seat kilometers excluding fuel expenses. |
| · | AVERAGE STAGE LENGTH: It is the average number of kilometers flown per stage performed. |
| · | EXCHANGEABLE SENIOR NOTES (ESN): Securities convertible into shares. |
| 5 |
| · | AIRCRAFT CHARTER: Flight operated by a Company that is out of its normal or regular operation. |
| · | BLOCK HOURS: Time in which the aircraft is in flight, plus taxi time. |
| · | LESSOR: The party renting a property or other asset to another party, the lessee. |
| · | LONG-HAUL FLIGHTS: Long-distance flights (in GOL’s case, flights of more than four hours). |
| · | REVENUE PASSENGERS: Total number of passengers on board who have paid more than 25% of the full flight fare. |
| · | REVENUE PASSENGER KILOMETERS PAID (RPK): Sum of the products of the number of paying passengers on a given flight and the length of the flight. |
| · | PDP: Credit for financing advances for the acquisition of aircraft. |
| · | Load Factor: Percentage of the aircraft’s capacity used in terms of seats (calculated by dividing the RPK/ASK). |
| · | Break-Even Load Factor: Load factor required for operating revenues to correspond to operating expenses. |
| · | Aircraft Utilization Rate: Average number of hours per day that the aircraft was in operation. |
| · | Passenger Revenue per Available Seat Kilometer (PRASK): Total passenger revenue divided by the total available seat kilometers. |
| · | Operating Revenue per Available Seat Kilometers (RASK): The operating revenue is divided by the total available seat kilometers. |
| · | Sale-leaseback: A financial transaction whereby a resource is sold and then leased back, enabling use of the resource without owning it. |
| · | SLOT: The right of an aircraft to take off or land at a given airport for a determined period. |
| · | Sub-Lease: An arrangement whereby a lessor in a rent agreement leases the item rented to a fourth party. |
| · | Freight Load Factor (FLF): Measure of capacity utilization (% of AFTKs used). Calculated by dividing FTK by AFTK. |
| · | Freight Tonne Kilometers (FTK): The demand for cargo transportation is calculated as the cargo's weight in tons multiplied by the total distance traveled. |
| · | Available Freight Tonne Kilometer (AFTK): Weight of the cargo in tons multiplied by the kilometers flown. |
| · | Yield per Passenger Kilometer: The average value paid by a passenger to fly one kilometer. |
Disclaimer
This release contains forward-looking statements relating to the prospects of the business, estimates for operating and financial income (expenses), and those related to growth prospects of GOL, which are, by nature, subject to significant risks and uncertainties. The estimates and forecasts in this document involve known and unknown risks, uncertainties, contingencies and other factors, many of which are beyond GOL’s control, and which may lead the results, performances or events to be substantially different from those expressed or implied in these statements. The forward-looking statements in this document are based on several assumptions related to GOL’s current and future business strategies and GOL’s future operating environment and are not a guarantee of future performance. GOL does not issue any statement or provide any guarantee that the results anticipated by the estimates in this document will be equivalent to those achieved by GOL. Although GOL believes that the estimates here are reasonable, they may prove to be incorrect, and the results may be different. These are merely estimates and projections and, as such, are based exclusively on management's expectations for GOL. Such forward-looking statements depend, substantially, on external factors and risks presented in the disclosure documents filed by GOL, apply exclusively to the date they were issued and are, therefore, subject to change without prior notice.
Non-Accounting Measures
To be consistent with industry practice, GOL discloses so-called non-GAAP financial measures, which are not recognized under IFRS or U.S. GAAP, including “Net Debt”, “total liquidity” and "EBITDA". GOL’s Management believes that disclosure of non-GAAP measures provides useful information to investors, financial analysts and the public in their review of its operating performance and their comparison of its operating performance to the operating performance of other companies in the same industry and other industries. However, these non-GAAP items do not have standardized meanings and may not be directly comparable to similarly titled items adopted by other companies. Potential investors should not rely on information not recognized under IFRS as a substitute for the GAAP measures of earnings or liquidity in making an investment decision.
| 6 |
Report of the Statutory Audit Committee (“SAC”)
The Statutory Audit Committee of Gol Linhas Aéreas Inteligentes S.A., in compliance with its legal and statutory obligations, has reviewed the Parent Company and Consolidated Quarterly Information (ITR) for the period ended on June 30, 2022. Based on the procedures we have undertaken and considering the independent auditors’ review report issued by Ernst & Young Auditores Independentes S.S, as well as the information and explanations we have received during the quarter, our conclusion is that these documents can be submitted to the assessment of the Board of Directors.
São Paulo, July 27, 2022.
Germán Pasquale Quiroga Vilardo
Member of the Statutory Audit Committee
Marcela de Paiva Bomfim Teixeira
Member of the Statutory Audit Committee
Philipp Schiemer
Member of the Statutory Audit Committee
| 7 |
Statement of the Executive Officers on the Parent Company and Consolidated Quarterly Information (ITR)
Under CVM Instruction 80/2022, the executive officers state that they have discussed, reviewed and agreed with the parent company and consolidated quarterly information (ITR) for the three-month and six-month periods ended on June 30, 2022.
São Paulo, July 27, 2022.
Celso Ferrer
Chief Executive Officer
Richard Freeman Lark Jr.
Executive Vice President, Chief Financial Officer and Investor Relations Officer
| 8 |
Statement of the Executive Officers on the Independent Auditors’ Review Report
Under CVM Instruction 80/2022, the Executive Board states that it has discussed, reviewed and agreed with the conclusion of the review report from the independent auditor, Ernst & Young Auditores Independentes S.S, on the parent company and consolidated quarterly information (ITR) for the three-month and six-month periods ended on June 30, 2022.
São Paulo, July 27, 2022.
Celso Ferrer
Chief Executive Officer
Richard Freeman Lark Jr.
Executive Vice President, Chief Financial Officer and Investor Relations Officer
|
| 9 |
 | São Paulo Corporate Towers Av. Presidente Juscelino Kubitschek, 1.909 Vila Nova Conceição 04543-011 - São Paulo – SP - Brasil
Tel: +55 11 2573-3000 ey.com.br |
A free translation from Portuguese into English of independent auditor’s review report on quarterly information prepared in Brazilian currency in accordance with accounting practices adopted in Brazil and the International Financial Reporting Standards (IFRS)
Independent auditor’s review report on quarterly information
To the
Shareholders, Board of Directors and Management of
Gol Linhas Aéreas Inteligentes S.A.
Introduction
We have reviewed the accompanying individual and consolidated interim financial information, contained in the Quarterly Information Form (ITR) of Gol Linhas Aéreas Inteligentes S.A. (the Company) for the quarter ended June 30, 2022, comprising the balance sheet as of June 30, 2022 and the related statements of income and of comprehensive income for the three and six-month periods then ended, and the statements of changes in shareholders’ equity and of cash flows for the six-month period then ended, including the explanatory notes.
Management is responsible for preparation of the individual and consolidated interim financial information in accordance with Accounting Pronouncement NBC TG 21 – Interim Financial Reporting, and IAS 34 – Interim Financial Reporting, issued by the International Accounting Standards Board (IASB), as well as for the fair presentation of this information in conformity with the rules issued by the Brazilian Securities and Exchange Commission (CVM) applicable to the preparation of the Quarterly Information Form (ITR). Our responsibility is to express a conclusion on this interim financial information based on our review.
Scope of review
We conducted our review in accordance with Brazilian and international standards on review engagements (NBC TR 2410 and ISRE 2410 - Review of Interim Financial Information performed by the Independent Auditor of the Entity, respectively). A review of interim financial information consists of making inquiries, primarily of persons responsible for financial and accounting matters, and applying analytical and other review procedures. A review is substantially less in scope than an audit conducted in accordance with auditing standards and consequently does not enable us to obtain assurance that we would become aware of all significant matters that might be identified in an audit. Accordingly, we do not express an audit opinion.
Conclusion on the individual and consolidated interim financial information
Based on our review, nothing has come to our attention that causes us to believe that the accompanying individual and consolidated interim financial information included in the quarterly information referred to above are not prepared, in all material respects, in accordance with NBC TG 21 and IAS 34 applicable to the preparation of Quarterly Information Form (ITR), and presented consistently with the rules issued by the Brazilian Securities and Exchange Commission (CVM).
| 10 |
Emphasis of matter – The Company’s ability to continue as a going concern
We draw attention to note 1.4 to the individual and consolidated interim financial information, which states that, according to the individual and consolidated balance sheets as of June 30, 2022, the Company presented negative individual and consolidated shareholders’ equity of R$20,166,392 thousand, as well as that current liabilities exceeded total current assets, individual and consolidated, by R$41,958 thousand and R$9,519,045 thousand, respectively. As disclosed in note 1.4, these events or conditions, together with other matters described in Note 1.4, indicate the existence of substantial doubt about the Company’s ability to continue as a going concern. Our conclusion is not qualified in respect of this matter.
Other matters
Correspondent figures
The Company`s individual and consolidated financial statements for the year ended December 31, 2021 and the individual and consolidated interim financial information for the period ended June 30, 2021, were audited and reviewed under the responsibility of other independent auditor, who issued reports, on March 14, 2022 and July 28, 2021, with an unmodified opinion and conclusion over the individual and consolidated financial statements and the individual and consolidated interim financial information, respectively.
Statements of value added
The abovementioned quarterly information include the individual and consolidated statements of value added (SVA) for the six-month period ended June 30, 2022, prepared under Company’s Management responsibility and presented as supplementary information by IAS 34. These statements have been subject to review procedures performed together with the review of the quarterly information with the objective to conclude whether they are reconciled to the interim financial information and the accounting records, as applicable, and if its format and content are in accordance with the criteria set forth by NBC TG 09 – Statement of Value Added. Based on our review, nothing has come to our attention that causes us to believe that they were not prepared, in all material respects, consistently with the overall individual and consolidated interim financial information.
São Paulo, July 27, 2022.
ERNST & YOUNG
Auditores Independentes S.S.
CRC-2SP034519/O-6
Original report in Portuguese signed by
| Uilian Dias Castro de Oliveira |
| Accountant CRC-1SP223185/O-3 |
| 11 |
 | Balance Sheets June 30, 2022 and December 31, 2021 (In thousand of Brazilian Reais) |
Balance Sheet
| Parent Company | Consolidated | ||||
| Assets | Note | June 30, 2022 | December 31, 2021 | June 30, 2022 | December 31, 2021 |
| Current | |||||
| Cash and Cash Equivalents | 6 | 261,654 | 210,941 | 394,066 | 486,258 |
| Financial Investments | 7 | 4,467 | 4,377 | 335,753 | 291,363 |
| Trade Receivables | 8 | - | - | 1,091,852 | 850,683 |
| Inventories | 9 | - | - | 368,718 | 269,585 |
| Deposits | 10 | - | - | 209,296 | 191,184 |
| Advance to Suppliers and Third Parties | 11 | 1,256 | 83 | 361,467 | 270,342 |
| Taxes to Recover | 12 | 3,423 | 10,159 | 227,425 | 176,391 |
| Rights from Derivative Transactions | 33.2 | - | - | 52,491 | 4,936 |
| Other Credits | 27,464 | 14,458 | 171,477 | 147,299 | |
| Total Current | 298,264 | 240,018 | 3,212,545 | 2,688,041 | |
| Non-Current | |||||
| Financial Investments | 7 | 1 | 1 | 90,726 | 82,326 |
| Deposits | 10 | 49,849 | 47,534 | 1,867,198 | 1,757,842 |
| Advances to Suppliers and Third Parties | 11 | - | - | 60,401 | 76,138 |
| Taxes to Recover | 12 | 13,381 | 4,464 | 14,195 | 72,976 |
| Deferred Taxes | 13 | 71,476 | 75,560 | 71,826 | 75,799 |
| Rights from Derivative Transactions | 33.2 | 11,604 | 107,170 | 23,504 | 109,124 |
| Other Credits | 5 | - | 38,386 | 41,718 | |
| Credits with Related Companies | 28.1 | 6,471,832 | 7,008,275 | - | - |
| Property, Plant & Equipment | 14 | 386,227 | 451,320 | 9,246,475 | 7,675,170 |
| Intangible Assets | 15 | - | - | 1,857,220 | 1,823,209 |
| Total Non-Current | 7,004,375 | 7,694,324 | 13,269,931 | 11,714,302 | |
| Total | 7,302,639 | 7,934,342 | 16,482,476 | 14,402,343 | |
The accompanying notes are an integral part of the individual and consolidated quarterly information - ITR.
| 12 |
| | Balance Sheets June 30, 2022 and December 31, 2021 (In thousand of Brazilian Reais) |
| Parent Company | Consolidated | ||||
| Liabilities | Note | June 30, 2022 | December 31, 2021 | June 30, 2022 | December 31, 2021 |
| Current | |||||
| Loans and Financing | 16 | 153,828 | 164,304 | 761,543 | 634,614 |
| Leases to Pay | 17 | - | - | 2,094,826 | 2,057,687 |
| Suppliers | 18 | 43,471 | 84,335 | 1,845,395 | 1,820,056 |
| Suppliers - Forfaiting | 19 | - | - | 30,000 | 22,733 |
| Labor Obligations | 291 | 180 | 455,647 | 374,576 | |
| Taxes to Collect | 20 | 1,059 | 585 | 283,747 | 122,036 |
| Landing Fees | - | - | 1,043,059 | 911,174 | |
| Advance Ticket Sales | 21 | - | - | 3,651,292 | 2,670,469 |
| Frequent-Flyer Program | 22 | - | - | 1,415,560 | 1,298,782 |
| Advances from Customers | - | - | 42,567 | 237,092 | |
| Provisions | 23 | - | - | 708,228 | 477,324 |
| Other Liabilities | 141,573 | 85,843 | 399,726 | 455,251 | |
| Total Current | 340,222 | 335,247 | 12,731,590 | 11,081,794 | |
| Non-Current | |||||
| Loans and Financing | 16 | 9,213,722 | 9,857,264 | 10,255,637 | 11,265,416 |
| Leases to Pay | 17 | - | - | 9,516,790 | 8,705,297 |
| Suppliers | 18 | 16 | 16 | 59,004 | 78,914 |
| Labor Obligations | - | - | 200,535 | 25,919 | |
| Taxes to Collect | 20 | - | - | 43,100 | 24,414 |
| Landing Fees | - | - | 256,856 | 277,060 | |
| Frequent-Flyer Program | 22 | - | - | 245,685 | 318,349 |
| Provisions | 23 | - | - | 2,895,434 | 3,109,998 |
| Deferred Taxes | 13 | - | - | 6,284 | 411 |
| Obligations to Related Parties | 28.1 | 110,073 | 6,692 | - | - |
| Provision for Investment Losses | 24 | 17,450,595 | 18,292,878 | - | - |
| Other Liabilities | 354,403 | 495,923 | 437,953 | 568,449 | |
| Total Non-Current | 27,128,809 | 28,652,773 | 23,917,278 | 24,374,227 | |
| Shareholders’ Equity | |||||
| Share Capital | 25.1 | 4,039,806 | 4,039,112 | 4,039,806 | 4,039,112 |
| Shares to Issue | 591 | 3 | 591 | 3 | |
| Treasury Shares | 25.2 | (39,514) | (41,514) | (39,514) | (41,514) |
| Capital Reserve | 1,162,480 | 208,711 | 1,162,480 | 208,711 | |
| Equity Valuation Adjustments | (879,333) | (1,053,082) | (879,333) | (1,053,082) | |
| Year-to-Date Losses | (24,450,422) | (24,206,908) | (24,450,422) | (24,206,908) | |
| Negative Shareholders’ Equity (Deficit) Attributable to the Parent Company | (20,166,392) | (21,053,678) | (20,166,392) | (21,053,678) | |
| Total | 7,302,639 | 7,934,342 | 16,482,476 | 14,402,343 | |
The accompanying notes are an integral part of the individual and consolidated quarterly information - ITR.
| 13 |
| | Income Statement Periods ended June 30, 2022 and 2021 (In thousands of Brazilian reais - R$, except basic and diluted earnings (loss) per share) |
| Parent Company | ||||||
| Three-month period ended on | Six-month period ended on | |||||
| Note | June 30, 2022 | June 30, 2021 | June 30, 2022 | June 30, 2021 | ||
| Operating Revenues (Expenses) | ||||||
| Selling Expenses | 30 | (286) | (393) | (286) | (393) | |
| Administrative Expenses | 30 | (15,082) | (76,835) | (31,187) | (104,415) | |
| Other Revenues and Expenses, Net | 30 | (186) | (9) | 64,079 | 480 | |
| Total Operating Expenses | (15,554) | (77,237) | 32,606 | (104,328) | ||
| Equity Income | 24 | (2,342,793) | 387,393 | (237,493) | (1,709,777) | |
| Operating Profit (Loss) before Financial Income (Expenses) and Income Taxes | (2,358,347) | 310,156 | (204,887) | (1,814,105) | ||
| Financial Income (Expenses) | ||||||
| Financial Revenues | 31 | 51,455 | 33,126 | 95,256 | 63,171 | |
| Financial Expenses | 31 | (201,642) | (188,583) | (416,273) | (374,832) | |
| Derivative Financial Instruments | 31 | 36,526 | 30,876 | 33,560 | 103,366 | |
| Financial Revenues (Expenses), Net | (113,661) | (124,581) | (287,457) | (208,295) | ||
| Income (Loss) before monetary and exchange rate variation | (2,472,008) | 185,575 | (492,344) | (2,022,400) | ||
| Monetary and Foreign Exchange Rate Variations, Net | 31 | (380,135) | 461,426 | 25,914 | 136,860 | |
| Income (Loss) before income tax and social contribution | (2,852,143) | 647,001 | (239,430) | (1,885,540) | ||
| Income Tax and Social Contribution | ||||||
| Deferred | 1,044 | (4,088) | (4,084) | 50 | ||
| Total Income Tax and Social Contribution | 13 | 1,044 | (4,088) | (4,084) | 50 | |
| Net Income (Loss) for the Period | (2,851,099) | 642,913 | (243,514) | (1,885,490) | ||
| Basic Earnings (Loss) | 26 | |||||
| Per Common Share | (0,200) | 0,050 | (0,017) | (0,149) | ||
| Per Preferred Share | (7,041) | 1,768 | (0,609) | (5,253) | ||
| Diluted Earnings (Loss) | 26 | |||||
| Per Common Share | (0,200) | 0,050 | (0,017) | (0,149) | ||
| Per Preferred Share | (7,041) | 1,765 | (0,609) | (5,253) | ||
The accompanying notes are an integral part of the Parent Company and Consolidated Quarterly Information (ITR).
| 14 |
| | Income Statement Periods ended June 30, 2022 and 2021 (In thousands of Brazilian reais - R$, except basic and diluted earnings (loss) per share) |
| Consolidated | ||||||
| Three-month period ended on | Six-month period ended on | |||||
| Note | June 30, 2022 | June 30, 2021 | June 30, 2022 | June 30, 2021 | ||
| Net Revenue | ||||||
| Passenger Transportation | 2,995,692 | 887,574 | 6,007,494 | 2,303,852 | ||
| Cargo and Others | 246,363 | 140,798 | 455,013 | 292,147 | ||
| Total Net Revenue | 29 | 3,242,055 | 1,028,372 | 6,462,507 | 2,595,999 | |
| Cost of Services | 30 | (2,718,158) | (1,243,943) | (5,331,659) | (2,879,188) | |
| Gross Profit (Loss) | 523,897 | (215,571) | 1,130,848 | (283,189) | ||
| Operating Revenues (Expenses) | ||||||
| Selling Expenses | 30 | (310,251) | (101,046) | (537,375) | (204,825) | |
| Administrative Expenses | 30 | (303,328) | (432,030) | (668,776) | (795,223) | |
| Other Revenues and Expenses, Net | 30 | (102,232) | (61,602) | (39,470) | (49,516) | |
| Total Operating Expenses | (715,811) | (594,678) | (1,245,621) | (1,049,564) | ||
| Loss before financial income (expenses), monetary and exchange rate variation and income taxes | (191,914) | (810,249) | (114,773) | (1,332,753) | ||
| Financial Income (Expenses) | ||||||
| Financial Revenues | 31 | 31,104 | 6,558 | 49,360 | 19,681 | |
| Financial Expenses | 31 | (822,701) | (479,960) | (1,579,309) | (996,712) | |
| Derivative Financial Instruments | 31 | 39,149 | 29,264 | 33,483 | 103,018 | |
| Financial Revenues (Expenses), Net | (752,448) | (444,138) | (1,496,466) | (874,013) | ||
| Loss before monetary and exchange rate variation | (944,362) | (1,254,387) | (1,611,239) | (2,206,766) | ||
| Monetary and Foreign Exchange Rate Variations, Net | 31 | (2,024,113) | 1,924,057 | 1,380,769 | 391,614 | |
| Income (Loss) before income tax and social contribution | (2,968,475) | 669,670 | (230,470) | (1,815,152) | ||
| Income Tax and Social Contribution | ||||||
| Current | 121,889 | (16,757) | (3,087) | (45,588) | ||
| Deferred | (4,513) | 5,122 | (9,957) | 12,984 | ||
| Total Income Tax and Social Contribution | 13 | 117,376 | (11,635) | (13,044) | (32,604) | |
| Net Income (Loss) for the Period | (2,851,099) | 658,035 | (243,514) | (1,847,756) | ||
| Net Income (Loss) Attributable to: | ||||||
| Shareholders of the Parent Company | (2,851,099) | 642.913 | (243,514) | (1,885,490) | ||
| Non-Controlling Shareholders | - | 15.122 | - | 37,734 | ||
| Basic Earnings (Loss) | 26 | |||||
| Per Common Share | (0.200) | 0.050 | (0.017) | (0.149) | ||
| Per Preferred Share | (7.041) | 1.768 | (0.609) | (5.253) | ||
| Diluted Earnings (Loss) | 26 | |||||
| Per Common Share | (0.200) | 0.050 | (0.017) | (0.149) | ||
| Per Preferred Share | (7.041) | 1.765 | (0.609) | (5.253) | ||
The accompanying notes are an integral part of the Parent Company and Consolidated Quarterly Information (ITR).
| 15 |
| | Statements of Comprehensive Income Periods ended June 30, 2022 and 2021 (In thousands of Brazilian Reais - R$) |
| Parent Company | |||||
| Three-month period ended on | Six-month period ended on | ||||
| June 30, 2022 | June 30, 2021 | June 30, 2022 | June 30, 2021 | ||
| Net Income (Loss) for the Period | (2,851,099) | 642,913 | (243,514) | (1,885,490) | |
| Other Comprehensive Income that will be Reversed to Income (Expenses) | |||||
| Cash Flow Hedge, Net of Income Tax and Social Contribution | (139,549) | 319,060 | 174,620 | 415,782 | |
| Cumulative Adjustment of Conversion into Subsidiaries | (94) | 521 | (871) | 537 | |
| (139,643) | 319,581 | 173,749 | 416,319 | ||
| Total Comprehensive Income (Expenses) for the Period | (2,990,742) | 962,494 | (69,765) | (1,469,171) | |
| Consolidated | |||||
| Three-month period ended on | Six-month period ended on | ||||
| June 30, 2022 | June 30, 2021 | June 30, 2022 | June 30, 2021 | ||
| Net Income (Loss) for the Period | (2,851,099) | 658.035 | (243.514) | (1.847.756) | |
| Other Comprehensive Income that will be Reversed to Income (Expenses) | |||||
| Cash Flow Hedge, Net of Income Tax and Social Contribution | (139,549) | 319.060 | 174.620 | 415.782 | |
| Cumulative Adjustment of Conversion into Subsidiaries | (94) | 780 | (871) | 808 | |
| (139,643) | 319.840 | 173.749 | 416.590 | ||
| Total Comprehensive Income (Expenses) for the Period | (2,990,742) | 977.875 | (69.765) | (1.431.166) | |
| Comprehensive Income (Expenses) Attributed to: | |||||
| Shareholders of the Parent Company | (2,990,742) | 962.494 | (69.765) | (1.469.171) | |
| Non-Controlling Shareholders | - | 15.381 | - | 38.005 | |
The accompanying notes are an integral part of the Parent Company and Consolidated Quarterly Information (ITR).
| 16 |
| | Statements of Changes in Shareholders’ Equity Periods ended June 30, 2022 and 2021 (In thousands of Brazilian Reais - R$) |
DMPL
| Parent Company and Consolidated | ||||||||||||||
| Capital Reserve | Equity Valuation Adjustments | |||||||||||||
| Share Capital | Shares to Issue | Treasury Shares | Premium when Granting Shares | Special Premium Reserve of the Subsidiary | Share-Based Compensation | Unrealized Income (Expenses) on Hedge | Post-Employment Benefit | Other Comprehensive Income | Effects of Change in Equity Interest | Year-to-Date Losses | Negative Shareholders’ Equity (Deficit) Attributable to the Parent Company | Interest
Shareholders | Total | |
| Balances on December 31, 2020 | 3,009,436 | 1,180 | (62,215) | 17,497 | 83,229 | 106,520 | (1,311,076) | (26,669) | 564 | 759,812 | (16,985,370) | (14,407,092) | 640,033 | (13,767,059) |
| Other Comprehensive Income (Expenses), Net | - | - | - | - | - | - | 415,782 | - | 537 | - | - | 416,319 | 271 | 416,590 |
| Net Income (Loss) for the Period | - | - | - | - | - | - | - | - | - | - | (1,885,490) | (1,885,490) | 37,734 | (1,847,756) |
| Total Comprehensive Income (Expenses) for the Period | - | - | - | - | - | - | 415,782 | - | 537 | - | (1,885,490) | (1,469,171) | 38,005 | (1,431,166) |
| Stock Option | - | - | - | - | - | 8,547 | - | - | - | - | - | 8,547 | 263 | 8,810 |
| Capital Increase due to Stock Options Exercised | - | 908 | - | - | - | - | - | - | - | - | - | 908 | - | 908 |
| Interim dividends distributed by the subsidiary Smiles | - | - | - | - | - | - | - | - | - | - | - | - | (236,992) | (236,992) |
| Sale of Treasury Shares | - | - | 867 | (279) | - | - | - | - | - | - | - | 588 | - | 588 |
| Transfer of Treasury Shares | - | - | 19,834 | (6,198) | - | (13,636) | - | - | - | - | - | - | - | - |
| Acquisition of Interest from Non-Controlling Shareholders | 606,839 | - | - | 744,450 | - | - | - | - | - | (909,980) | - | 441,309 | (441,309) | - |
| Redemption of Preferred Shares | - | - | - | (744,450) | - | - | - | - | - | - | - | (744,450) | - | (744,450) |
| Capital Increase | 423,061 | - | - | - | - | - | - | - | - | - | - | 423,061 | - | 423,061 |
| Balances on June 30, 2021 | 4,039,336 | 2,088 | (41,514) | 11,020 | 83,229 | 101,431 | (895,294) | (26,669) | 1,101 | (150,168) | (18,870,860) | (15,746,300) | - | (15,746,300) |
| Balances on December 31, 2021 | 4,039,112 | 3 | (41,514) | 11,020 | 83,229 | 114,462 | (918,801) | 14,855 | 1,032 | (150,168) | (24,206,908) | (21,053,678) | - | (21,053,678) |
| Other Comprehensive Income (Expenses), Net | - | - | - | - | - | - | 174,620 | - | (871) | - | - | 173,749 | - | 173,749 |
| Loss for the Period | - | - | - | - | - | - | - | - | - | - | (243,514) | (243,514) | - | (243,514) |
| Total Comprehensive Income (Expenses) for the Period | - | - | - | - | - | - | 174,620 | - | (871) | - | (243,514) | (69,765) | - | (69,765) |
| Stock Option | - | - | - | - | - | 9,461 | - | - | - | - | - | 9,461 | - | 9,461 |
| Capital Increase due to Stock Options Exercised (Note 25.1) | 694 | 588 | - | - | - | - | - | - | - | - | - | 1,282 | - | 1,282 |
| Capital Increase (Note 25.1) | - | - | - | 946,308 | - | - | - | - | - | - | - | 946,308 | - | 946,308 |
| Transfer of Treasury Shares (Note 27.2) | - | - | 2,000 | (1,094) | - | (906) | - | - | - | - | - | - | - | - |
| Balances on June 30, 2022 | 4,039,806 | 591 | (39.514) | 956,234 | 83,229 | 123,017 | (744,181) | 14,855 | 161 | (150,168) | (24,450,422) | (20,166,392) | - | (20,166,392) |
The accompanying notes are an integral part of the Parent Company and Consolidated Quarterly Information (ITR).
| 17 |
| | Cash Flow Statements Periods ended June 30, 2022 and 2021 (In thousands of Brazilian Reais - R$) |
| Parent Company | Consolidated | |||
| June 30, 2022 | June 30, 2021 | June 30, 2022 | June 30, 2021 | |
| Loss for the Period | (243,514) | (1,885,490) | (243,514) | (1,847,756) |
| Adjustments to Reconcile the Loss to Cash Generated from Operating Activities | ||||
| Depreciation - Aircraft Right of Use | - | - | 527,393 | 280,221 |
| Depreciation and Amortization - Others | - | - | 297,405 | 354,417 |
| Provision for Doubtful Accounts | - | - | (735) | (1,081) |
| Provisions for Inventory Obsolescence | - | - | 426 | 54 |
| Provision for Impairment of Deposits | - | 63,361 | 6,284 | 176,363 |
| Provision for Loss on Prepayment from Suppliers | - | - | (149) | (4,640) |
| Adjustment to Present Value of Assets and Liabilities | - | - | 95,078 | 36,529 |
| Deferred Taxes | 4,084 | (50) | 9,957 | (12,984) |
| Equity Pickup | 237,493 | 1,709,777 | - | - |
| Write-off of Property, Plant & Equipment and Intangible Assets | - | - | 4,454 | 1,583 |
| Sale-Leaseback | (49,156) | - | (55,491) | - |
| Recognition (Reversal) of Provisions | - | - | 214,594 | 321,203 |
| Exchange Rate and Cash Changes, Net | (252,297) | (135,204) | (1,373,761) | (398,198) |
Interest on Loans and Leases and Amortization of Costs, Premiums and Goodwill | 331,528 | 335,048 | 1,115,439 | 898,511 |
| Income (Expenses) from Derivatives Recognized in Income (Expenses) | (33,560) | (103,367) | 13,876 | (44,597) |
| Provision for Labor Obligations | - | - | - | 94,490 |
| Share-Based Compensation | - | - | 9,461 | 8,810 |
| Recovery of Overdue Credits | - | - | - | (57,422) |
| Other Provisions | - | (537) | (2,737) | (2,240) |
| Adjusted Net Income (Expenses) | (5,422) | (16,462) | 617,980 | (196,737) |
| Changes in Operating Assets and Liabilities: | ||||
| Financial Investments | 12,229 | 1,376 | (18,863) | 15,987 |
| Trade Receivables | - | - | (245,010) | 20,192 |
| Inventories | - | - | (99,559) | (17,230) |
| Deposits | (2,486) | 5,438 | (208,759) | (35,040) |
| Advance to Suppliers and Third Parties | (1,173) | 10,388 | (75,239) | 116,881 |
| Taxes to Recover | (2,181) | 1,510 | 7,747 | 183,304 |
| Variable Leases | - | - | (533) | 17,794 |
| Suppliers | (42,264) | (8,632) | 24,594 | (48,721) |
| Suppliers - Forfaiting | - | - | 7,267 | - |
| Salaries, Wages and Benefits | 111 | (12) | 255,687 | (47,718) |
| Taxes Payable | 474 | 66 | 180,841 | 23,814 |
| Landing Fees | - | - | 111,681 | 29,413 |
| Advance Ticket Sales | - | - | 980,823 | (51,786) |
| Mileage program | - | - | 44,114 | 43,820 |
| Advances from Customers | - | - | (194,525) | 26,981 |
| Provisions | - | - | (139,540) | (237,982) |
| Liabilities with Derivative Transactions | - | - | (54,189) | 133,331 |
| Other Credits (Liabilities) | 2,937 | 119,365 | 2,575 | 270,934 |
| Interest Paid | (327,891) | (326,520) | (475,755) | (378,944) |
| Income Tax Paid | - | - | (444) | (40,472) |
| Net Cash (Used in) from Operating Activities | (365,666) | (213,483) | 720,893 | (172,179) |
| 18 |
| | Cash Flow Statements Periods ended June 30, 2022 and 2021 (In thousands of Brazilian Reais - R$) |
| Parent Company | Consolidated | |||
| June 30, 2022 | June 30, 2021 | June 30, 2022 | June 30, 2021 | |
| Loans Receivable from Related Parties | 236,657 | (1.196,212) | - | - |
| Financial Investments in Subsidiary | - | (244) | - | 638,637 |
| Dividends and Interest on Shareholders’ Equity Received through Subsidiary | - | 287,128 | - | - |
Prepayment for Future Capital Increase in a Subsidiary | (896,566) | (151,000) | - | - |
| Advance for Property, Plant & Equipment Acquisition, Net | (53,676) | 11,590 | (106,958) | (17,787) |
| Acquisition of Property, Plant & Equipment | - | (111,429) | (345,445) | (104,276) |
| Sale-Leaseback Transactions Received | 69,819 | - | 69,819 | - |
| Acquisition of Intangible Assets | - | - | (69,645) | (51,877) |
| Net Cash Flows (Used in) from Investment Activities | (643,766) | (1,160,167) | (452,229) | 464,697 |
| Fundraising in Loans and Financing | - | 1,501,569 | - | 1,512,521 |
| Loan Payments | - | (499,663) | (166,443) | (572,792) |
| Lease Payments - Aircraft | - | (1,116,697) | (515,891) | |
| Lease Payments - Others | - | (25,235) | (9,007) | |
| Related-Party Loans | 99,729 | - | - | - |
Dividends and Interest on Shareholders’ Equity Paid to Non-Controlling Interests | - | - | - | (744,450) |
| Acquisition of Non-Controlling Shareholders | - | - | - | (260,131) |
| Capital Increase | 946,308 | 423,061 | 946,308 | 423,061 |
| Shares to Issue | 1,282 | 908 | 1,282 | 908 |
| Sale of Treasury Shares | - | 588 | - | 588 |
| Net Cash Flows (Used in) from Financing Activities | 1,047,319 | 1,426,463 | (360,785) | (165,193) |
Foreign Exchange Variation on Cash Held in Foreign Currencies | 12,826 | (28,102) | (71) | (29,886) |
| Net Increase (Decrease) of Cash and Cash Equivalents | 50,713 | 24,711 | (92,192) | 97,439 |
| Cash and Cash Equivalents at the Beginning of the Fiscal Year | 210,941 | 423,937 | 486,258 | 662,830 |
| Cash and Cash Equivalents at the End of the Period | 261,654 | 448,648 | 394,066 | 760,269 |
Transactions that do not affect cash are presented in Note 34 of this Quarterly Information.
The accompanying notes are an integral part of the Parent Company and Consolidated Quarterly Information (ITR).
| 19 |
| | Statement of Added Value Periods ended June 30, 2022 and 2021 (In thousands of Brazilian Reais - R$) |
| Parent Company | Consolidated | |||
| June 30, 2022 | June 30, 2021 | June 30, 2022 | June 30, 2021 | |
| Revenues | ||||
| Passenger, Cargo, and Other Transportation | - | - | 6,715,813 | 2,735,660 |
| Other Operating Revenues | 50,133 | 480 | 111,509 | 93,373 |
| Provision for Doubtful Accounts | - | - | 735 | 1,081 |
| 50,133 | 480 | 6,828,057 | 2,830,114 | |
| Inputs Acquired from Third Parties (includes ICMS and IPI) | ||||
| Fuel and Lubricant Suppliers | - | - | (2,731,761) | (972,651) |
| Materials, Energy, Third-Party Services, and Others | (15,191) | (94,825) | (1,660,867) | (1,301,860) |
| Aircraft Insurance | - | - | (22,344) | (24,381) |
| Sales and Marketing | (285) | (345) | (412,260) | (129,577) |
| Gross Added Value | 34,657 | (94,690) | 2,000,825 | 401,645 |
| Depreciation - Aircraft Right of Use | - | - | (527,393) | (280,221) |
| Depreciation and Amortization - Others | - | - | (297,405) | (354,417) |
| Net Added Value Produced by the Company | 34,657 | (94,690) | 1,176,027 | (232,993) |
| Added Value Received on Transfers | ||||
| Equity Income | (237,493) | (1.709,777) | - | - |
| Derivative Financial Instruments | 33,560 | 103,066 | 33,483 | 103,018 |
| Financial Revenue | 104,260 | 136,926 | 67,929 | 114,631 |
| Total Value Added (Distributed) to Distribute | (65,016) | (1.564,475) | 1,277,439 | (15,344) |
| Distribution of Value Added: | ||||
| Direct Compensation | 1,623 | 9,417 | 737,647 | 674,093 |
| Benefits | - | - | 110,182 | 100,975 |
| FGTS | - | - | 61,902 | 37,742 |
| Personnel | 1,623 | 9,417 | 909,731 | 812,810 |
| Federal | 7,668 | 1,875 | 361,097 | 269,796 |
| State | - | - | 9,839 | 7,461 |
| Municipal | - | - | 464 | 1,218 |
| Taxes, Fees, and Contributions | 7,668 | 1,875 | 371,400 | 278.475 |
| Interest and Exchange Rate Change - Aircraft Leases | - | - | (99,228) | 148,860 |
| Interest and Exchange Rate Change - Others | 169,166 | 309,723 | 181,082 | 536,245 |
| Rents | - | - | 43,018 | 55,860 |
| Others | 41 | - | 114,950 | 162 |
| Third-Party Capital Compensation | 169,207 | 309,723 | 239,822 | 741,127 |
| Net Loss for the Period | (243,514) | (1,885,490) | (243,514) | (1,885,490) |
| Net Profit of the Period Attributed to Non-Controlling Shareholders | - | - | - | 37,734 |
| Shareholders’ Equity Compensation | (243,514) | (1,885,490) | (243,514) | (1,847,756) |
| Total Value Added Distributed (to Distribute) | (65,016) | (1,564,475) | 1,277,439 | (15,344) |
The accompanying notes are an integral part of the Parent Company and Consolidated Quarterly Information (ITR).
| 20 |
| | Notes on the Parent Company and Consolidated Quarterly Information (ITR) June 30, 2022 (In thousands of Brazilian Reais - R$, except when otherwise indicated) |
| 1. | Operating Context |
Gol Linhas Aéreas Inteligentes S.A. (“Company” or “GOL”) is a limited liability company incorporated on March 12, 2004 under Brazilian laws. The Company’s bylaws states that the corporate purpose is exercising the equity control of GOL Linhas Aéreas S.A. (“GLA”), which provides scheduled and non-scheduled air transportation services for passengers and cargo, maintenance services for aircraft and components, develops frequent-flyer programs, among others.
The Company’s shares are traded on B3 S.A. - Brasil, Bolsa, Balcão (“B3”) and on the New York Stock Exchange (“NYSE”) under the ticker GOLL4 and GOL, respectively. The Company adopts B3’s Special Corporate Governance Practices Level 2 and is part of the Special Corporate Governance (“IGC”) and Special Tag Along (“ITAG”) indexes, created to distinguish companies that commit to special corporate governance practices.
The Company’s official headquarters are located at Praça Comandante Linneu Gomes, s/n, portaria 3, prédio 24, Jardim Aeroporto, São Paulo, Brazil.
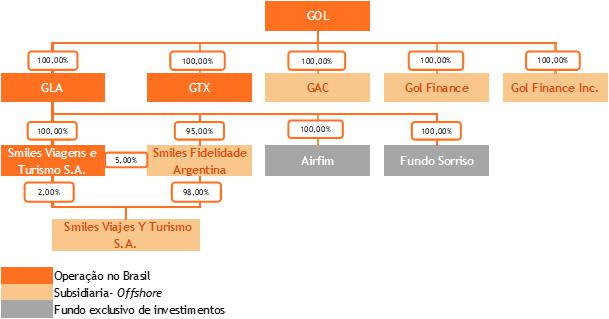
| 1.1. | Corporate Structure |
The corporate structure of the Company and its subsidiaries, on June 30, 2022, is shown below:
| 21 |
| | Notes on the Parent Company and Consolidated Quarterly Information (ITR) June 30, 2022 (In thousands of Brazilian Reais - R$, except when otherwise indicated) |
| Entity | Incorporation Date | Location | Main Activity | Type of Control | % of Interest in the Share Capital | |
| June 30, 2022 | December 31, 2021 | |||||
| GAC | March 23, 2006 | Cayman Islands | Aircraft Acquisition | Direct | 100.00 | 100.00 |
| Gol Finance Inc. | March 16, 2006 | Cayman Islands | Fundraising | Direct | 100.00 | 100.00 |
| Gol Finance | June 21, 2013 | Luxembourg | Fundraising | Direct | 100.00 | 100.00 |
| GLA | April 9, 2007 | Brazil | Flight Transportation | Direct | 100.00 | 100.00 |
| GTX | February 8, 2021 | Brazil | Equity in Companies | Direct | 100.00 | 100.00 |
| Smiles Viagens | August 10, 2017 | Brazil | Tourism Agency | Indirect | 100.00 | 100.00 |
| Smiles Fidelidade Argentina (a) | November 7, 2018 | Argentina | Frequent-Flyer Program | Indirect | 100.00 | 100.00 |
| Smiles Viajes Argentina (a) | November 20, 2018 | Argentina | Tourism Agency | Indirect | 100.00 | 100.00 |
| AirFim | November 7, 2003 | Brazil | Investment Fund | Indirect | 100.00 | 100.00 |
| Fundo Sorriso | July 14, 2014 | Brazil | Investment Fund | Indirect | 100.00 | 100.00 |
| (a) | Companies with functional currency in Argentine pesos (ARS). |
The subsidiaries GAC Inc., GOL Finance, and GOL Finance Inc. are entities created for the specific purpose of continuing financial operations and related to the Company's fleet. They do not have their own governing body and decision-making autonomy. Therefore, their assets and liabilities are consolidated in the Parent Company.
GTX S.A., direct subsidiary by the Company, is pre-operational and its corporate purpose is to manage its own assets and have an interest in the capital of other companies.
Smiles Viagens e Turismo S.A. (“Smiles Viagens”) has as main purpose intermediating travel organization services by booking or selling airline tickets, accommodation, tours, among others. The subsidiaries Smiles Fidelidade Argentina and Smiles Viajes Y Turismo S.A. both headquartered in Buenos Aires, Argentina, have the purpose to promote Smiles Program’s operations and the sale of airline tickets in this country.
The investment funds AirFim and Fundo Sorriso, controlled by GLA have the characteristic of an exclusive fund and act as an extension to carry out operations with derivatives and financial investments, so that the Company consolidates the assets and liabilities of this fund.
| 1.2. | Impacts and Measures taken by the Management regarding Covid-19 |
The first days of 2022 featured a significant growth in Covid-19 cases, with the “Omicron” variant, which led to flights cancelled by several companies in Brazil and worldwide. Through its flexible business model based on a single type of fleet, GOL did not see any operational impact in the period, with regularity above 99% in January 2022 and leading the domestic market with 38.5% market share this month.
In the second quarter, historically a low season, demand continued to resume, with the Company supply, measured by ASK, growing by 123.7% compared to the same period in 2021 and with the demand growing 103.0%, as measured by RPK.
To increase its positioning in the regional market, the Company expanded its operation to four new hubs this quarter: Ribeirão Preto, São José do Rio Preto, Passo Fundo and Uruguaiana, all with connections in Guarulhos. Besides expanding the domestic market, the second quarter of 2022 also featured the return of the Company's direct operations to the United States of America, Argentina, Paraguay and Bolivia.
The Company, through its Executive Committee, with its entire management body, works in a timely and close manner to support society, monitor demand, and define financial and operational strategies.
Given Anvisa’s (Brazilian Health Surveillance Agency) decision that allowed distributing snacks and beverages, GOL resumed on-board service on domestic flights in the second quarter of 2022. In 2022, GOL keeps the initiatives to transport Covid-19 vaccines for free, with GOLLOG and health professionals to work directly in the fight against the pandemic, besides crediting 1,000 Smiles’ miles for each GOL flight, at no cost. There are also active and strict protocols for aircraft hygiene, as well as safety and health, besides actions to reduce human contact throughout the entire chain.
| 22 |
| | Notes on the Parent Company and Consolidated Quarterly Information (ITR) June 30, 2022 (In thousands of Brazilian Reais - R$, except when otherwise indicated) |
| 1.2.1 | Impacts on the Parent Company and Consolidated Quarterly Information |
The pandemic’s main impact remains the decreased operational air network to meet the lower demand and crew availability, which was verified by the lower Company’s net revenue when compared to pre-pandemic periods.
The table below details the reclassifications made to the three- and six-month periods ended June 30, 2022, linked directly to the Covid-19 pandemic and additional disclosures:
| Three-Month Period | Six-Month Period | ||||
| Income Statement - Reclassifications | Cost of Services | Other Revenues and Expenses, Net | Cost of Services | Other Revenues and Expenses, Net | |
| Flight equipment depreciation – idleness | (a) | 39,074 | (39,074) | 75,846 | (75,846) |
| (a) | Due to the drop in the number of flights operated, where the Company incurred with the burden of time, by analogy to the provisions of CPC 16 (R1) - Inventories, equivalent to IAS 2, expenses and depreciation of flight equipment not directly related to the revenues generated in the period, called idleness, were reclassified from the group of costs of services to the group of other revenues and expenses, net. |
Like all other business organizations, the Company cannot foresee the duration of the pandemic and the extent of the impacts caused by it on future business, results, and cash generation. For this reason, when preparing this quarterly information, the Management considered the most recent forecasts available, duly reflected in the Company's business plans. In the period ended June 30, 2022, no adjustment was needed regarding impairments on the Company’s taxes to recover, deferred tax assets, Property, Plant & Equipment, and intangible assets.
| 1.3. | Impacts and Measures taken by the Management regarding the Russian Invasion of Ukraine |
On February 24, 2022, Russia launched a military invasion of Ukraine, severely escalating the existing conflict between these countries. The invasion was widely criticized by the international community, including sanctions to shut down the Russian economy.
Due to the invasion, Brent and WTI oil prices rose significantly, continuing above US$100 a barrel, directly affecting the jet fuel, as seen in higher costs with this in Note 30. Given this increase, the Company uses its capacity management, increased productivity and cost optimization to mitigate high QAV costs.
GOL's Management also works through its committees to assess strategies to protect future exposure and, with the Brazilian Association of Airlines (ABEAR), is negotiating with the federal government to restrain the rise in prices and the resulting transfer by increasing ticket prices.
| 1.4. | Capital Structure and Net Current Capital |
On June 30, 2022, the Company’s negative consolidated net working capital reached R$9,519,045 (R$8,393,753 negative on December 31, 2021). This is mainly due to an increased advance ticket sales and frequent-flyer program, on June 30, 2022, these obligations totaled R$5,066,852 (R$3,969,251 on December 31, 2021), which are expected to be substantially carried out with the Company’s services.
| 23 |
| | Notes on the Parent Company and Consolidated Quarterly Information (ITR) June 30, 2022 (In thousands of Brazilian Reais - R$, except when otherwise indicated) |
On June 30, 2022, the Company also had a negative shareholders’ equity position attributed to the controlling shareholders, totaling R$20,166,392 (R$21,053,678 negative on December 31, 2021). This is mainly due to the capital increase in the period.
The Company is highly sensitive to the macroeconomic scenario and Brazilian Real’s volatility, as approximately 93.8% of the indebtedness (loans and financing and leases) is linked to US dollars (“US$”) and 46.4% of costs are also linked to US dollars, while the capacity to adjust ticket prices charged to its customers in order to offset the U.S. dollar appreciation is dependent on capacity (offer) and ticket prices practiced by the competitors.
Over the past five years, Management has taken many measures to adapt the size of its fleet to demand, matching the supply of seats to demand and thus keeping high load factors, reducing costs and adjusting its capital structure.
Our Parent Company and Consolidated Quarterly Information have been prepared on an accounting base of continuity, which includes the continuity of operations, realization of assets and compliance with liabilities and commitments in the usual course of business, in compliance with the business plan prepared by Management, reviewed and approved, at least annually, by GOL's Board of Directors.
Although there is still significant uncertainty about how long it will take for the airline industry to recover, and this leads to a material uncertainty about our ability to remain in operation, on June 30, 2022, the Parent Company and Consolidated Quarterly Information do not include any adjustments that may result from the inability to continue operating.
| 24 |
| | Notes on the Parent Company and Consolidated Quarterly Information (ITR) June 30, 2022 (In thousands of Brazilian Reais - R$, except when otherwise indicated) |
| 1.5. | American Airlines Investment Agreement |
In the period ended June 30, 2022, GOL and American Airlines formalized an agreement to expand their commercial cooperation, with an investment of R$948,320, paid up in cash by American Airlines for 22,224,513 preferred shares of the Company.
As of this transaction, American Airlines has the right to appoint a member to the Company's Board of Directors for the next 3 years, having appointed Mr. Anmol Bhargava.
The exclusive codeshare agreement furthers the relationship between the two airlines, with more travel opportunities for passengers and improving the customer experience and GOL's competitive position on routes that connect North and South America.
| 1.6. | Advancing the Fleet Transformation Plan |
In line with the plan announced for the year ended December 31, 2021, GOL continued to accelerate its fleet transformation in the period ended June 30, 2022, receiving 11 Boeing 737-MAX aircraft through lease, with 4 having a purchase option.
The Boeing 737-MAX consumes around 15% less fuel and produces around 16% less carbon and 40% less noise, besides having a longer flight range when compared to Boeing 737-NG aircraft.
With the demand’s recovery, the advanced vaccination in several states and markets, operations close to resuming pre-pandemic levels and significantly higher macroeconomic variables, mainly the jet fuel price, there is an increased need to advance the replacement of the current fleet of 737 NG to gain operational efficiency.
Besides, the Company managed to obtain agreements to acquire new 737 MAX aircraft with more favorable conditions compared to the pre-pandemic period, due to new facility lines to finance these aircraft and balance the Company's financing portfolio.
Due to the advanced fleet transformation, the Company will return 737-NG aircraft, with relevant future disbursements estimated, as disclosed in Note 23.2, which may be offset with deposits disclosed in Note 10.
| 1.7. | Cargo and Logistics Services Agreement |
In April 2022, the Company signed a 10-year cargo service agreement with Mercado Livre. This agreement provides for a dedicated cargo fleet with 6 (six) Boeing 737-800 BCFs, allowing including another 6 cargo aircraft by 2025, and should start operating during the second half of 2022.
GOL's agreement with Mercado Livre is part of the Company's investment to meet the needs of the growing Brazilian e-commerce market.
As a result, the Company plans to expand its services and significantly increase available capacity in tons in 2023 to generate additional revenue.
| 1.8. | Agreement between the Controlling Shareholder and Main Investors of Avianca |
On May 11, 2022, the Company received a mail from its controlling shareholder MOBI Fundo de Investimento em Ações Investimento no Exterior (“MOBI FIA”) notifying that a Master Contribution Agreement was signed with some of the main shareholders of Investment Vehicle 1 Limited (“Avianca Holding”), including Kingsland International Group S.A., Elliott International L.P. and South Lake One LLC.
| 25 |
| | Notes on the Parent Company and Consolidated Quarterly Information (ITR) June 30, 2022 (In thousands of Brazilian Reais - R$, except when otherwise indicated) |
Under the Master Contribution Agreement, MOBI FIA will contribute with its shares in GOL and major investors in Avianca will contribute with their shares in Avianca Holding to create a privately held company, incorporated under the laws of England and Wales. GOL and Avianca will continue to operate independently and keep their brands and cultures.
The Transaction is conditioned to certain usual precedent conditions set forth in the Master Contribution Agreement, including the prior approval by the competent regulatory bodies. On June 30, 2022, there are no impacts on the Company's quarterly information.
| 1.9. | Acquisition of MAP Transportes Aéreos |
On June 8, 2021, GOL signed an agreement to acquire MAP Transportes Aéreos Ltda., a domestic Brazilian airline with routes to regional destinations and from Congonhas Airport in São Paulo, considering the Company's commitment to expand the air transportation demand and rationally consolidate in the domestic market as the country's economy recovers from Covid-19.
On December 30, 2021, through SG Order 1929/2021, the Administrative Council for Economic Defense (CADE) approved the operation without restrictions. The conclusion of the transaction is subject to other precedent conditions, which have not yet been fulfilled. Therefore, on June 30, 2022, there are no impacts on the Company's quarterly information.
MAP will be acquired for R$28 million to be paid only after meeting all precedent conditions, through 100,000 preferred shares (GOLL4) at R$28.00 per share and R$25 million in cash in 24 monthly installments. At closing, the Company will assume up to R$100 million in MAP's financial commitments.
This transaction should bring as main benefits: (i) expanded new routes; (ii) higher seat supply to historically under-offered markets; and (iii) improved efficient operations.
| 1.10. | Compliance Program |
Since 2016, we have adopted many measures to strengthen and expand our internal control and compliance programs, which include:
| · | hiring specialized companies to assess risks and review internal controls regarding fraud and corruption; |
| · | integrating the compliance and internal controls roles in the same department, reporting directly to our CEO and with independent access to the Board of Directors and Statutory Audit Committee; |
| · | monitoring transactions with politically exposed persons; |
| · | improving inspection procedures for services hired from third parties; |
| · | updating our procurement policies and managing our contract flows; and |
| · | reviewing the Code of Ethics, Conduct Manual and many compliance policies of the Company, including the mandatory training policy. |
The Management is constantly reinforcing to employees, customers, and suppliers the commitment to continue improving its internal control and compliance programs.
In December 2016, GOL signed an agreement with the Brazilian Federal Public Ministry, agreeing to pay fines totaling R$12 million and improve its compliance program. In turn, the Brazilian Federal Public Ministry agreed not to file criminal or civil lawsuits regarding activities under the agreement. In addition, the Company paid fines totaling R$4.2 million to the Brazilian tax authorities.
| 26 |
| | Notes on the Parent Company and Consolidated Quarterly Information (ITR) June 30, 2022 (In thousands of Brazilian Reais - R$, except when otherwise indicated) |
The Company voluntarily informed the U.S. Department of Justice (“DOJ”), the Securities and Exchange Commission (“SEC”) and the Brazilian Securities and Exchange Commission (“CVM”) about the Agreement with the Brazilian Federal Public Ministry and the external independent investigation hired by the Company. The external and independent investigation was completed in April 2017 and revealed that immaterial payments were made to politically exposed people. None of the Company’s current employees, representatives or members of the Board of Directors or Management was aware of any illegal purpose behind the transactions identified, or of any illegal benefit for the Company from the transactions under investigation.
The Company has reported the findings of the investigation to the due authorities and will continue to report any developments on the matter, besides assisting and discussing its analysis with these authorities, which may set significant fines and possibly other sanctions.
| 2. | Message from the Management, base to Prepare and Present the Parent Company and Consolidated Quarterly Information (ITR) |
The Company’s Parent Company and Consolidated Quarterly Information were prepared following accounting practices adopted in Brazil. The accounting practices adopted in Brazil include those in the Brazilian Corporation Law and in the technical pronouncements, guidelines and interpretations issued by the Accounting Pronouncements Committee (“CPC”), approved by the Federal Accounting Council (“CFC”) and the Brazilian Securities and Exchange Commission (“CVM”).
The Company’s consolidated quarterly information (ITR) was prepared under accounting practices adopted in Brazil and the International Financial Reporting Standards (“IFRS”) issued by the International Accounting Standards Board (“IASB”).
The Company’s Parent Company and Consolidated Quarterly Information was prepared using the Brazilian real (“R$”) as the functional and presentation currency. Figures are expressed in thousands of Brazilian reais, except when otherwise indicated. The items disclosed in foreign currencies are duly identified, when applicable.
The preparation of the Company’s parent company and consolidated quarterly information requires Management to make judgments, use estimates and adopt assumptions that affect the stated amounts of revenues, expenses, assets and liabilities. However, the uncertainty inherent in these judgments, assumptions and estimates could give rise to results that require a significant adjustment to the book value of certain assets and liabilities in future reporting periods.
When preparing this Parent Company and Consolidated Quarterly Information, the Management used disclosure criteria, considering regulatory aspects and the relevance of the transactions to understand the changes in the Company’s economic and financial position and its performance since the end of the fiscal year ended December 31, 2021, as well as the restatement of relevant information included in the annual financial statements disclosed on March 14, 2022.
The Management confirms that all material information in this Parent Company and Consolidated Quarterly Information is being demonstrated and corresponds to the information used by the Management in the development of its business management activities.
| 27 |
| | Notes on the Parent Company and Consolidated Quarterly Information (ITR) June 30, 2022 (In thousands of Brazilian Reais - R$, except when otherwise indicated) |
The Parent Company and Consolidated Quarterly Information has been prepared based on historical cost, except for the following material items recognized in the statements of financial position:
· cash, cash equivalents and financial investments measured at fair value;
· derivative financial instruments measured at fair value; and
· investments accounted for using the equity method.
��
The Company’s parent company and consolidated quarterly information for the period ended June 30, 2022 has been prepared assuming that it will continue as a going concern, realizing assets and settling liabilities in the normal course of business, see details in Note 1.4.
In order to maintain comparability between the periods, the Company revised the aggregations in the presentation of the Financial Result in the income statement for the periods ended June 30, 2021, in accordance with the provisions of CPC 26 (R1) - "Presentation of Financial Statements", equivalent to IAS 1.
| 3. | Approval of the Parent Company and Consolidated Quarterly Information |
This Parent Company and Consolidated Quarterly Information (ITR) was authorized by the Board of Directors on July 27, 2022.
| 4. | Summary of Significant Accounting Practices |
The Parent Company and Consolidated Quarterly Information (ITR) presented herein was prepared based on policies, accounting practices and estimate calculation methods adopted and presented in detail in the annual financial statements for the year ended December 31, 2021, released on March 14, 2022.
| 4.1. | New Accounting Standards and Pronouncements Adopted in the Current Year |
The following changes to accounting standards became effective for periods beginning after January 1, 2022:
· Onerous Agreements – Costs to fulfill an agreement (Amendments to IAS 37);
· Property, Plant & Equipment – Gains before intended use (Amendments to IAS 16);
· Rates on the '10 percent' test to derecognize financial liabilities (Amendments to IFRS 9);
· Annual improvements to IFRS 2018-2020 (Amendments to IFRS 1, IFRS 16 and IAS 41); and
· References to the Conceptual Framework (Amendments to IFRS 3).
These changes did not impact the Company's quarterly information. Additionally, in the period ended June 30, 2022, no new standards or pronouncements were published with an expected impact to the Company's quarterly information. Finally, the Company did not opt for the early adoption of standards or pronouncements.
| 4.2. | Foreign Currency Transactions |
Foreign currency transactions are recorded at the exchange rate change prevailing on the date on which the transactions take place. Monetary assets and liabilities designated in foreign currency are calculated based on the exchange rate change on the balance sheet date. Any difference resulting from the translation of currencies is recorded under the item “Monetary and Foreign Exchange Variations, Net” in the income statement for the period.
The main exchange rates in reais in effect on the base date of this Parent Company and Consolidated Quarterly Information (ITR) are as follows:
| 28 |
| | Notes on the Parent Company and Consolidated Quarterly Information (ITR) June 30, 2022 (In thousands of Brazilian Reais - R$, except when otherwise indicated) |
| Final Rate | Average Rate | |||
| June 30, 2022 | December 31, 2021 | June 30, 2022 | June 30, 2021 | |
| U.S. Dollar | 5.2380 | 5.5805 | 5.0766 | 5.3842 |
| Argentinian Peso | 0.0418 | 0.0543 | 0.0455 | 0.0591 |
| 5. | Seasonality |
The Company expects revenues and operating results from its flights to be at their highest levels in the summer and winter months of January and July, respectively, and during the last weeks of December and in the year-end holiday period. Given the high proportion of fixed costs, this seasonality tends to drive changes in operating income (expense) across the fiscal-year quarters. In the current context, operations have negatively correlated with cases and deaths by Covid-19.
| 6. | Cash and Cash Equivalents |
| Parent Company | Consolidated | |||
| June 30, 2022 | December 31, 2021 | June 30, 2022 | December 31, 2021 | |
| Cash and Bank Deposits | 20,527 | 2,981 | 130,822 | 116,123 |
| Cash Equivalents | 241,127 | 207,960 | 263,244 | 370,135 |
| Total | 261,654 | 210,941 | 394,066 | 486,258 |
The breakdown of cash equivalents is as follows:
| Parent Company | Consolidated | |||
| June 30, 2022 | December 31, 2021 | June 30, 2022 | December 31, 2021 | |
| Domestic Currency | ||||
| Private Bonds | 240,653 | 207,656 | 240,678 | 329,235 |
| Automatic Investments | 474 | 304 | 22,540 | 40,873 |
| Total Domestic Currency | 241,127 | 207,960 | 263,218 | 370,108 |
| Foreign Currency | ||||
| Private Bonds | - | - | 26 | 27 |
| Total Foreign Currency | - | - | 26 | 27 |
| Total | 241,127 | 207,960 | 263,244 | 370,135 |
| 29 |
| | Notes on the Parent Company and Consolidated Quarterly Information (ITR) June 30, 2022 (In thousands of Brazilian Reais - R$, except when otherwise indicated) |
| 7. | Financial Investments |
| Parent Company | Consolidated | |||||
| Weighted Average Profitability (p.a.) | June 30, 2022 | December 31, 2021 | June 30, 2022 | December 31, 2021 | ||
| Domestic Currency | ||||||
| Government Bonds | 106.3% of CDI | - | - | 648 | 2,042 | |
| Private Bonds | 98.0% of CDI | 336 | - | 305,589 | 288,056 | |
| Investment Funds | 73.8% of CDI | 4,132 | 4,378 | 10,706 | 12,042 | |
| Total Domestic Currency | 4,468 | 4,378 | 316,943 | 302,140 | ||
| Foreign Currency | ||||||
| Private Bonds | 1.7% | - | - | 31,566 | 33,570 | |
| Investment Funds | - | - | 77,970 | 37,979 | ||
| Total Foreign Currency | - | - | 109,536 | 71,549 | ||
| Total | 4,468 | 4,378 | 426,479 | 373,689 | ||
| Current | 4,467 | 4,377 | 335,753 | 291,363 | ||
| Non-Current | 1 | 1 | 90,726 | 82,326 | ||
Of the total amount recorded in the parent company and in the consolidated on June 30, 2022, R$4,309 and R$347,465 (R$4,123 and R$333,984 on December 31, 2021), respectively, refer to financial investments used as guarantees linked to deposits for lease operations, derivative financial instruments, lawsuits and loans and financing.
| 8. | Trade Receivables |
| June 30, 2022 | December 31, 2021 | |
| Domestic Currency | ||
| Credit Card Administrators | 314,747 | 200,601 |
| Travel Agencies | 469,023 | 439,698 |
| Cargo Agencies | 36,303 | 27,418 |
| Partner Airlines | 14,491 | 11,921 |
| Others | 39,308 | 18,852 |
| Total Domestic Currency | 873,872 | 698,490 |
| Foreign Currency | ||
| Credit Card Administrators | 109,264 | 77,379 |
| Travel Agencies | 85,113 | 38,999 |
| Cargo Agencies | 465 | 211 |
| Partner Airlines | 21,282 | 27,863 |
| Others | 20,401 | 27,021 |
| Total Foreign Currency | 236,525 | 171,473 |
| Total | 1,110,397 | 869,963 |
| Estimated Losses from Doubtful Accounts | (18,545) | (19,280) |
| Total Trade Receivables | 1,091,852 | 850,683 |
| 30 |
| | Notes on the Parent Company and Consolidated Quarterly Information (ITR) June 30, 2022 (In thousands of Brazilian Reais - R$, except when otherwise indicated) |
The aging list of trade receivables, net of allowance for doubtful accounts on trade receivables, is as follows:
| Consolidated | ||
| June 30, 2022 | December 31, 2021 | |
| To be Due | ||
| Up to 30 days | 711,594 | 607,968 |
| From 31 to 60 days | 170,886 | 82,132 |
| From 61 to 90 days | 18,537 | 55,265 |
| From 91 to 180 days | 37,300 | 33,491 |
| From 181 to 360 days | 58,788 | 1,096 |
| Above 360 days | 1,146 | 379 |
| Total to be Due | 998,251 | 780,331 |
| Overdue | ||
| Up to 30 days | 24,079 | 31,302 |
| From 31 to 60 days | 21,936 | 5,722 |
| From 61 to 90 days | 16,092 | 2,172 |
| From 91 to 180 days | 5,335 | 7,566 |
| From 181 to 360 days | 6,379 | 8,911 |
| Above 360 days | 19,780 | 14,679 |
| Total Overdue | 93,601 | 70,352 |
| Total | 1,091,852 | 850,683 |
The movement of estimated losses on doubtful accounts is as follows:
| Consolidated | ||
| June 30, 2022 | December 31, 2021 | |
| Opening Balance of the Fiscal Year | (19,280) | (18,047) |
| (Additions) Reversals | 735 | (1,233) |
| Closing Balance of the Period | (18,545) | (19,280) |
| 9. | Inventories |
| Consolidated | ||
| June 30, 2022 | December 31, 2021 | |
| Consumables | 24,466 | 20,585 |
| Parts and Maintenance Materials | 255,600 | 201,470 |
| Advances to Suppliers | 88,652 | 47,530 |
| Total | 368,718 | 269,585 |
The changes in the provision for obsolescence are as follows:
| Consolidated | ||
| June 30, 2022 | December 31, 2021 | |
| Balances at the Beginning of the Fiscal Year | (6,176) | (12,862) |
| Additions | (426) | (687) |
| Write-Offs | 449 | 7,373 |
| Closing Balances of the Period | (6,153) | (6,176) |
| 31 |
| | Notes on the Parent Company and Consolidated Quarterly Information (ITR) June 30, 2022 (In thousands of Brazilian Reais - R$, except when otherwise indicated) |
| 10. | Deposits |
| Parent Company | Consolidated | |||
| June 30, 2022 | December 31, 2021 | June 30, 2022 | December 31, 2021 | |
| Maintenance Deposits | - | - | 1,096,898 | 1,000,995 |
| Court Deposits | 47,230 | 44,744 | 571,677 | 575,917 |
| Deposit in Guarantee for Lease Agreements | 2,619 | 2,790 | 407,919 | 372,114 |
| Total | 49,849 | 47,534 | 2,076,494 | 1,949,026 |
| Current | - | - | 209,296 | 191,184 |
| Non-Current | 49,849 | 47,534 | 1,867,198 | 1,757,842 |
| 10.1. | Maintenance Deposits |
The Company makes deposits in US dollars for the maintenance of aircraft and engines, which will be used in future events as established in certain lease agreements. The Company has the right to choose to carry out the maintenance internally or through its suppliers.
Maintenance deposits do not exempt the Company, as a lessee, from contractual liabilities related to the maintenance or the risk associated with operating activities. These deposits can be replaced by bank guarantees or letters of credit (SBLC - stand by letter of credit) as established in the aircraft lease. Credit bills can be executed by the lessors if the maintenance of the aircraft and engines does not occur according to the review schedule. On June 30, 2022, no credit bill had been executed against the Company.
The Company has two categories of maintenance deposits:
| · | Maintenance Guarantee: Refers to one-time deposits that are refunded at the end of the lease, and can also be used in maintenance events, depending on negotiations with lessors. The balance of these deposits on June 30, 2022 was R$295,737 (R$262,061 on December 31, 2021). |
| · | Maintenance Reserve: Refers to amounts paid monthly based on the use of components and can be used in maintenance events as set by an agreement. On June 30, 2022, the balance referring to such reserves was R$801,161 (R$738,934 on December 31, 2021). |
| 10.2. | Court Deposits |
Court deposits and blocks represent guarantees of tax, civil and labor lawsuits, kept in court until the resolution of the disputes to which they are related. Part of the court deposits refers to civil and labor lawsuits from succession requests in lawsuits filed against Varig S.A. or also labor lawsuits filed by employees who do not belong to GLA or any related party. Bearing in mind that the Company is not a legitimate party to appear on the liability side of the said lawsuits, whenever blocks occur, their exclusion and respective release of the retained funds is demanded.
| 32 |
| | Notes on the Parent Company and Consolidated Quarterly Information (ITR) June 30, 2022 (In thousands of Brazilian Reais - R$, except when otherwise indicated) |
| 10.3. | Deposit in Guarantee for Lease Agreements |
As required by the lease agreements, the Company makes guarantee deposits (in US dollars) to the leasing companies, which may be redeemed if replaced by other bank guarantees or fully redeemed at maturity.
| 11. | Advance to Suppliers and Third Parties |
| Parent Company | Consolidated | |||
| June 30, 2022 | December 31, 2021 | June 30, 2022 | December 31, 2021 | |
| Advance to Domestic Suppliers | - | 32 | 208,448 | 255,024 |
| Advance to Foreign Suppliers | 1,256 | 51 | 189,227 | 42,524 |
| Advance for Materials and Repairs | - | - | 24,193 | 48,932 |
| Total Advances to Suppliers | 1,256 | 83 | 421,868 | 346,480 |
| Current | 1,256 | 83 | 361,467 | 270,342 |
| Non-Current | - | - | 60,401 | 76,138 |
| 12. | Taxes to Recover |
| Parent Company | Consolidated | |||
| June 30, 2022 | December 31, 2021 | June 30, 2022 | December 31, 2021 | |
| Income Tax and Social Contribution to Recover | 16,804 | 14,575 | 60,640 | 51,282 |
| PIS and COFINS to Recover | - | - | 167,433 | 185,827 |
| Value Added Tax (VAT), Abroad | - | - | 7,262 | 4,035 |
| Others | - | 48 | 6,285 | 8,223 |
| Total | 16,804 | 14,623 | 241,620 | 249,367 |
| Current | 3,423 | 10,159 | 227,425 | 176,391 |
| Non-Current | 13,381 | 4,464 | 14,195 | 72,976 |
| 33 |
| | Notes on the Parent Company and Consolidated Quarterly Information (ITR) June 30, 2022 (In thousands of Brazilian Reais - R$, except when otherwise indicated) |
| 13. | Deferred Taxes |
| 13.1. | Deferred Taxes (Liabilities) |
The positions of deferred assets and liabilities are presented below and comply with the enforceable offset legal rights that consider taxes levied by the same tax authority under the same tax entity.
| Parent Company | Consolidated | ||||||
| December 31, 2021 | Result | June 30, 2022 | December 31, 2021 | Result | Shareholders’ Equity (*) | June 30, 2022 | |
| Deferred Assets (Liabilities) – GOL and Smiles Argentina | |||||||
| Tax Losses | 50,385 | - | 50,385 | 50,385 | - | - | 50,385 |
| Negative Basis of Social Contribution | 18,137 | - | 18,137 | 18,137 | - | - | 18,137 |
| Temporary Differences: | |||||||
| Provision for Losses on Other Credits | 7,132 | (4,065) | 3,067 | 7,132 | (4,065) | - | 3,067 |
| Provision for Legal Proceedings and Tax Liabilities | (94) | (19) | (113) | (94) | (19) | - | (113) |
| Others | - | - | - | 239 | - | 111 | 350 |
| Total Deferred Tax Assets | 75,560 | (4,084) | 71,476 | 75,799 | (4,084) | 111 | 71,826 |
| Deferred Assets (Liabilities) - GLA | |||||||
| Temporary Differences: | |||||||
| Flight Rights | - | - | - | (353,226) | - | - | (353,226) |
| Depreciation of Engines and Parts for Aircraft Maintenance | - | - | - | (202,522) | (4,859) | - | (207,381) |
| Breakage Provision | - | - | - | (197,246) | (27,141) | - | (224,387) |
| Goodwill Amortization for Tax Purposes | - | - | - | (143,297) | (23,456) | - | (166,753) |
| Derivative Transactions | - | - | - | (502) | 4,438 | - | 3,936 |
| Estimated Losses on Doubtful Accounts – Trade Receivables and Other Receivables | - | - | - | 209,141 | (2,653) | - | 206,488 |
| Provision for Aircraft and Engine Return | - | - | - | 310,746 | 10,641 | - | 321,387 |
| Provision for Legal Proceedings and Tax Liabilities | - | - | - | 243,826 | 28,170 | - | 271,996 |
| Aircraft Leases and Others | - | - | - | 84,500 | 32,208 | - | 116,708 |
| Others | - | - | - | 48,169 | (23,221) | - | 24,948 |
| Total Deferred Tax Assets Liabilities | - | - | - | (411) | (5,873) | - | (6,284) |
| Total Effect of Deferred Taxes in the Income (Expenses) | - | (4,084) | - | - | (9,957) | - | |
(*) Exchange rate change recognized in other comprehensive income.
| 34 |
| | Notes on the Parent Company and Consolidated Quarterly Information (ITR) June 30, 2022 (In thousands of Brazilian Reais - R$, except when otherwise indicated) |
The Company’s Management considers that the deferred assets and liabilities recognized on June 30, 2022 arising from temporary differences will be realized in proportion to realization of their bases and the expectation of future results.
The Management estimates that active deferred tax credits, recorded on tax losses and a negative social contribution base, may be realized as follows:
| Year | Amount |
| 2022 | 11,329 |
| 2023 | 21,522 |
| 2024 | 20,290 |
| 2025 | 14,816 |
| 2026 | 565 |
| Total | 68,522 |
The direct subsidiary GLA has tax losses and negative bases of social contribution in the determination of taxable profit, to be offset against 30% of future annual tax profits, with no prescription period, not recorded in the balance sheet, in the following amounts:
| GLA | ||
| June 30, 2022 | December 31, 2021 | |
| Income Tax Losses and Negative Basis of Social Contribution | 13,027,993 | 12,076,378 |
| Potential Tax Credit | 4,429,518 | 4,105,969 |
The reconciliation between tax expense and multiplying the accounting profit by the nominal tax rate for the periods ended June 30, 2022 and 2021 is shown below:
| Parent Company | ||||
| Three-month period ended on | Six-month period ended on | |||
| June 30, 2022 | June 30, 2021 | June 30, 2022 | June 30, 2021 | |
| Income (Loss) before Income Tax and Social Contribution | (2,852,143) | 647,001 | (239,430) | (1,885,540) |
| Combined Nominal Tax Rate | 34% | 34% | 34% | 34% |
| Income Tax and Social Contribution by the Combined Tax Rate | 969,729 | (219,980) | 81,406 | 641,084 |
| Adjustments to Calculate the Actual Tax Rate: | ||||
| Equity Pickup | (796,550) | 131,714 | (80,748) | (581,324) |
| Tax Rate Difference of the Income (Expenses) of Subsidiaries | (43,135) | (43,546) | (87,920) | (75,772) |
| Nondeductible Expenses, Net | (1,331) | (21,377) | (4,142) | (23,100) |
| Exchange Rate Change on Foreign Investments | (133,712) | 163,130 | 88,175 | 53,192 |
| Benefit Not Constituted on Tax Losses and Negative Basis | 6,043 | (14,029) | (855) | (14,030) |
| Total Income Tax and Social Contribution | 1,044 | (4,088) | (4,084) | 50 |
| Income Tax and Social Contribution | ||||
| Current | - | - | - | - |
| Deferred | 1,044 | (4,088) | (4,084) | 50 |
| Total Income Tax and Social Contribution | 1,044 | (4,088) | (4,084) | 50 |
| 35 |
| | Notes on the Parent Company and Consolidated Quarterly Information (ITR) June 30, 2022 (In thousands of Brazilian Reais - R$, except when otherwise indicated) |
| Consolidated | ||||
| Three-month period ended on | Six-month period ended on | |||
| June 30, 2022 | June 30, 2021 | June 30, 2022 | June 30, 2021 | |
| Income (Loss) before Income Tax and Social Contribution | (2,968,475) | 669,670 | (230,470) | (1,815,152) |
| Combined Nominal Tax Rate | 34% | 34% | 34% | 34% |
| Income Tax and Social Contribution by the Combined Tax Rate | 1,009,282 | (227,687) | 78,360 | 617,152 |
| Adjustments to Calculate the Actual Tax Rate: | ||||
| Tax Rate Difference of the Income (Expenses) of Subsidiaries | (26,404) | (39,715) | (20,699) | (75,102) |
| Nondeductible Expenses, Net | (19,434) | (33,570) | (35,143) | (68,689) |
| Exchange Rate Change on Foreign Investments | (117,928) | 131,631 | 73,736 | 31,862 |
| Benefit Not Constituted on Tax Losses, Negative Basis and Temporary Differences | (728,140) | 157,706 | (109,298) | (537,827) |
| Total Income Tax and Social Contribution | 117,376 | (11,635) | (13,044) | (32,604) |
| Income Tax and Social Contribution | ||||
| Current | 121,889 | (16,757) | (3,087) | (45,588) |
| Deferred | (4,513) | 5,122 | (9,957) | 12,984 |
| Total Income Tax and Social Contribution | 117,376 | (11,635) | (13,044) | (32,604) |
| 14. | Property, Plant & Equipment |
| 14.1. | Parent Company |
On June 30, 2022, the balance of Property, Plant & Equipment was R$386,227 in GAC (R$451,320 on December 31, 2021), mainly from advances for aircraft acquisition.
| 36 |
| | Notes on the Parent Company and Consolidated Quarterly Information (ITR) June 30, 2022 (In thousands of Brazilian Reais - R$, except when otherwise indicated) |
| 14.2. | Consolidated |
| December 31, 2021 | June 30, 2022 | |||||||||||||
| Weighted Average Rate (p.a.) | Historical Cost | Year-to-date Depreciation | Net Opening Balance | Additions | Contractual Amendment | Depreciation | Write-Offs | Net Closing Balance | Historical Cost | Year-to-date Depreciation | ||||
| Flight Equipment | ||||||||||||||
| Aircraft - ROU(1) with Purchase Option | 9.48% | - | - | - | 941,348 | - | (25,284) | - | 916,064 | 941,348 | (25,284) | |||
| Aircraft - ROU(1) with no Purchase Option | 18.33% | 7,127,628 | (1,958,755) | 5,168,873 | 911,493 | (86,372) | (487,116) | (167) | 5,506,711 | 7,928,248 | (2,421,537) | |||
| Spare Parts and Engines - Own (3) (4) | 7.27% | 2,062,646 | (963,949) | 1,098,697 | 120,832 | - | (71,734) | (856) | 1,146,939 | 2,180,549 | (1,033,610) | |||
| Spare Parts and Engines - ROU | 39.82% | 129,223 | (62,908) | 66,315 | - | 23,845 | (14,993) | - | 75,167 | 153,068 | (77,901) | |||
| Aircraft and Engine Overhauling | 46.64% | 3,143,372 | (2,370,691) | 772,681 | 244,669 | - | (169,413) | (1,078) | 846,859 | 3,288,322 | (2,441,463) | |||
| Tools | 10.00% | 56,826 | (32,327) | 24,499 | 2,267 | - | (1,927) | (12) | 24,827 | 59,076 | (34,249) | |||
| 12,519,695 | (5,388,630) | 7,131,065 | 2,220,609 | (62,527) | (770,467) | (2,113) | 8,516,567 | 14,550,611 | (6,034,044) | |||||
| Non-Aeronautical Property, Plant & Equipment | ||||||||||||||
| Vehicles | 20.00% | 11,076 | (9,915) | 1,161 | - | - | (211) | - | 950 | 11,053 | (10,103) | |||
| Machinery and Equipment | 10.00% | 62,837 | (50,824) | 12,013 | 315 | - | (980) | (12) | 11,336 | 62,388 | (51,052) | |||
| Furniture and Fixtures | 10.00% | 32,508 | (22,024) | 10,484 | 731 | - | (937) | (3) | 10,275 | 33,068 | (22,793) | |||
| Computers, Peripherals and Equipment | 13.33% | 49,636 | (40,869) | 8,767 | 1,133 | - | (1,728) | (10) | 8,162 | 50,356 | (42,194) | |||
| Computers, Peripherals and Equipment – ROU | 35.18% | 23,210 | (20,251) | 2,959 | 1,816 | - | (1,798) | - | 2,977 | 25,026 | (22,049) | |||
| Third-Party Property Improvements | 16.18% | 183,345 | (166,832) | 16,513 | 3 | - | (4,924) | - | 11,592 | 183,263 | (171,671) | |||
| Third-Party Properties - ROU | 8.26% | 28,819 | (24,186) | 4,633 | 171,084 | 37,360 | (8,119) | - | 204,958 | 236,770 | (31,812) | |||
| Construction in Progress | 15,410 | - | 15,410 | 932 | - | - | - | 16,342 | 16,342 | - | ||||
| 406,841 | (334,901) | 71,940 | 176,014 | 37,360 | (18,697) | (25) | 266,592 | 618,266 | (351,674) | |||||
| Impairment Losses (2) | - | (26,854) | - | (26,854) | 2,962 | - | - | - | (23,892) | (23,892) | - | |||
| Total Property, Plant & Equipment in Use | 12,899,682 | (5,723,531) | 7,176,151 | 2,399,585 | (25,167) | (789,164) | (2,138) | 8,759,267 | 15,144,985 | (6,385,718) | ||||
| Advance to Suppliers | - | 499,019 | - | 499,019 | 106,958 | - | - | (118,769) | 487,208 | 487,208 | - | |||
| Total | 13,398,701 | (5,723,531) | 7,675,170 | 2,506,543 | (25,167) | (789,164) | (120,907) | 9,246,475 | 15,632,193 | (6,385,718) | ||||
| (1) | Right of Use (“ROU”) |
| (2) | Refers to provisions for impairment losses for rotable items (spare parts), classified under “Parts and spare engines", recorded by the Company in order to present its assets according to the actual capacity for the generation of expected future benefits. |
| (3) | On June 30, 2022, the balance of spare parts is granted as a guarantee to the Senior Secured Notes 2026, as per Note 16. |
| (4) | On June 30, 2022, 19 Company's engines are granted as a guarantee to the Spare Engine Facility and the Loan Facility, according to Note 16. |
| 37 |
| | Notes on the Parent Company and Consolidated Quarterly Information (ITR) June 30, 2022 (In thousands of Brazilian Reais - R$, except when otherwise indicated) |
| 15. | Intangible Assets |
The breakdown and changes in intangible assets are as follows:
| Consolidated | |||||||||
| December 31, 2021 | June 30, 2022 | ||||||||
| Weighted Average Rate (p.a.) | Historical Cost | Year-to-date Amortization | Net Opening Balance | Additions | Amortization | Net Closing Balance | Historical Cost | Year-to-date Amortization | |
| Goodwill | - | 542,302 | - | 542,302 | - | - | 542,302 | 542,302 | - |
| Slots | - | 1,038,900 | - | 1,038,900 | - | - | 1,038,900 | 1,038,900 | - |
| Software | 40.40% | 508,650 | (268,476) | 240,174 | 69,645 | (34,634) | 275,185 | 552,832 | (277,647) |
| Others | 20.00% | 10,000 | (8,167) | 1,833 | - | (1,000) | 833 | 10,000 | (9,167) |
| Total | 2,099,852 | (276,643) | 1,823,209 | 69,645 | (35,634) | 1,857,220 | 2,144,034 | (286,814) | |
The balances of goodwill and airport operating rights (slots) were tested for impairment on December 31, 2021, through the discounted cash flow for each cash-generating unit, giving rise to the value in use, not resulting in impairment. On June 30, 2022, no indications of devaluation of the cash-generating unit were identified.
To establish the book value of each CGU, the Company considers not only the recorded intangible assets but also all tangible assets necessary for conducting business, as it is only using this set that the Company will generate economic benefits.
| 38 |
| | Notes on the Parent Company and Consolidated Quarterly Information (ITR) June 30, 2022 (In thousands of Brazilian Reais - R$, except when otherwise indicated) |
| 16. | Loans and Financing |
The breakdown of and changes in short and long-term debt are as follows:
| Parent Company | |||||||||||||
| December 31, 2021 | June 30, 2022 | ||||||||||||
| Maturity | Interest Rate p.a. | Current | Non-Current | Total | Unrealized Income (Expenses) from ESN | Interest Incurred | Interest Paid | Exchange Rate Change | Amortization of Costs and Goodwill | Total | Current | Non-Current | |
| Foreign Currency Contracts | |||||||||||||
| ESN 2024 (a) | 07/2024 | 3.75% | 40,764 | 1,947,463 | 1,988,227 | (119,585) | 99,735 | (42,692) | (120,328) | 6,819 | 1,812,176 | 38,262 | 1,773,914 |
| Senior Notes 2025 (b) | 01/2025 | 7.00% | 105,797 | 3,598,981 | 3,704,778 | - | 115,492 | (121,881) | (222,731) | 4,596 | 3,480,254 | 99,303 | 3,380,951 |
| Senior Secured Notes 2026 (c) | 06/2026 | 8.00% | - | 3,451,977 | 3,451,977 | - | 131,991 | (128,721) | (225,894) | 23,372 | 3,252,725 | - | 3,252,725 |
| Perpetual Notes (d) | - | 8.75% | 17,743 | 858,843 | 876,586 | - | 33,792 | (34,597) | (53,386) | - | 822,395 | 16,263 | 806,132 |
| Total | 164,304 | 9,857,264 | 10,021,568 | (119,585) | 381,010 | (327,891) | (622,339) | 34,787 | 9,367,550 | 153,828 | 9,213,722 | ||
| (a) | The subsidiary Gol Finance issued Exchangeable Senior Notes (“ESN”) in March, April and July 2019, totaling US$425 million due in 2024, with holders entitled to exchange them for the Company’s American Depositary Shares (“ADSs”), see Note 33 |
| (b) | The subsidiary Gol Finance issued Senior Notes 2025 in December 2017 and February 2018 to buyback Senior Notes and for overall purposes of the Company, maturing in 2025. |
| (c) | The subsidiary Gol Finance issued Senior Secured Notes 2026 in December 2020, May and September 2021, totaling US$650 million due in 2026. |
| (d) | The subsidiary Gol Finance issued Perpetual Notes in April 2006 to finance the aircraft’s acquisition. |
| 39 |
| | Notes on the Parent Company and Consolidated Quarterly Information (ITR) June 30, 2022 (In thousands of Brazilian Reais - R$, except when otherwise indicated) |
| Consolidated | ||||||||||||||
| December 31, 2021 | June 30, 2022 | |||||||||||||
| Maturity | Interest Rate p.a. | Current | Non-Current | Total | Unrealized Income (Expenses) from ESN | Principal Payment | Interest Incurred | Interest Paid | Exchange Rate Change | Amortization of Costs and Goodwill | Total | Current | Non-Current | |
| Domestic Currency Contracts | ||||||||||||||
| Debentures (a) | 10/2024 | 18.24% | 109,519 | 1,055,249 | 1,164,768 | - | (35,140) | 89,248 | (113,314) | - | 6,250 | 1,111,812 | 369,492 | 742,320 |
| Working Capital (b) | 10/2025 | 19.18% | 48,239 | 9,757 | 57,996 | - | (17,088) | 2,947 | (3,811) | - | - | 40,044 | 34,214 | 5,830 |
| Foreign Currency Contracts | ||||||||||||||
| Import Financing (c) | 12/2022 | 9.13% | 138,034 | - | 138,034 | - | (27,573) | 4,744 | (4,104) | (8,953) | - | 102,148 | 102,148 | - |
| Financing with Ex-lm Bank Collateral (d) | 12/2022 | 3.56% | 99,396 | - | 99,396 | - | (52,891) | 482 | (717) | (9,536) | 1,004 | 37,738 | 37,738 | - |
| ESN 2024 (e) | 07/2024 | 3.75% | 40,764 | 1,947,463 | 1,988,227 | (119,585) | - | 99,735 | (42,692) | (120,328) | 6,819 | 1,812,176 | 38,262 | 1,773,914 |
| Spare Engine Facility (f) | 09/2024 | 3.25% | 24,651 | 125,106 | 149,757 | - | (11,226) | 1,902 | (1,923) | (9,675) | 141 | 128,976 | 23,112 | 105,864 |
| Senior Notes 2025 (g) | 01/2025 | 7.00% | 105,797 | 3,598,981 | 3,704,778 | - | - | 115,492 | (121,881) | (222,731) | 4,596 | 3,480,254 | 99,303 | 3,380,951 |
| Senior Secured Notes 2026 (h) | 06/2026 | 8.00% | - | 3,451,977 | 3,451,977 | - | - | 131,991 | (128,721) | (225,894) | 23,372 | 3,252,725 | - | 3,252,725 |
| Loan Facility (i) | 03/2028 | 4.22% | 50,471 | 218,040 | 268,511 | - | (22,525) | 5,028 | (5,167) | (17,063) | 128 | 228,912 | 41,011 | 187,901 |
| Perpetual Notes (j) | - | 8.75% | 17,743 | 858,843 | 876,586 | - | - | 33,792 | (34,597) | (53,386) | - | 822,395 | 16,263 | 806,132 |
| Total | 634,614 | 11,265,416 | 11,900,030 | (119,585) | (166,443) | 485,361 | (456,927) | (667,566) | 42,310 | 11,017,180 | 761,543 | 10,255,637 | ||
| (a) | The debentures total R$1.2 billion, considering the following issues: (i) 7th issue: 88,750 bonds by the subsidiary GLA in October 2018, for the early full settlement of the 6th issue; and (ii) 8th issue: 610,217 bonds by the subsidiary GLA in October 2021 to refinance short-term debt. Both have an interest rate of CDI+4.5% p.a. The debentures have personal guarantees from the Company and a real guarantee provided by GLA as a fiduciary assignment of certain credit card receivables, preserving the rights to prepay the receivables of these guarantees. |
| (b) | Issuing transactions that have as purpose maintaining and managing the Company's working capital. |
| (c) | Credit lines with private banks used to finance the import of spare parts and aeronautical equipment. The interest rates negotiated are Libor 3m + 4.40% p.a. and Libor 1m + 3.25% p.a. |
| (d) | Financing to carry out engine maintenance services with Ex-Im Bank guarantee, including 4 operations, 3 with maturities in 2021, duly liquidated, and 1 with maturity in 2022. |
| (e) | The subsidiary Gol Finance issued Exchangeable Senior Notes (“ESN”) in March, April and July 2019, totaling US$425 million due in 2024, with holders entitled to exchange them for the Company’s American Depositary Shares (“ADSs”), see Note 33. |
| (f) | Loan with guarantee of the Company's own engines, with maturity in 2024. |
| (g) | The subsidiary Gol Finance issued Senior Notes 2025 in December 2017 and February 2018 to buyback Senior Notes and for overall purposes of the Company. |
| (h) | The subsidiary Gol Finance issued Senior Secured Notes 2026 in December 2020, May and September 2021, totaling US$650 million due in 2026. |
| (i) | Loans with a guarantee totaling 5 engines, carried out in June 2018. The contracted rates vary between Libor 6m + 2.35% p.a. up to Libor 6m + 4.25% p.a. |
| (j) | The subsidiary Gol Finance issued Perpetual Notes in April 2006 to finance the aircraft’s acquisition. |
| 40 |
| | Notes on the Parent Company and Consolidated Quarterly Information (ITR) June 30, 2022 (In thousands of Brazilian Reais - R$, except when otherwise indicated) |
The total parent company and consolidated loans and financing on June 30, 2022 includes funding costs, premiums, goodwill and negative goodwill totaling R$176,113 and R$208,080, respectively (R$210,902 and R$250,393 on December 31, 2021) that will be amortized over the life of their loans and financing. The total also includes the fair value of the derivative financial instrument, referring to the convertibility of the ESN, totaling R$30,985 on December 30, 2022 (R$162,568 on December 31, 2021).
| 16.1. | Loans and Financing Renegotiated in the period ended on June 30, 2022 |
The renegotiations detailed below were evaluated under CPC 48 - “Financial Instruments”, corresponding to IFRS 9, and did not meet the definitions to derecognize the liabilities (with the original financial liability extinguished and a new financial liability recognized).
| 16.1.1. | Import Financing |
In the period ended June 30, 2022, the Company, through its subsidiary GLA, renegotiated the impact of maturities of this type of agreement, with in the interest rate, disclosed in the table above, and keeping the operational guarantees. Which is part of a credit line for engine maintenance, import financing in order to purchase spare parts and aircraft equipment.
| 16.1.2. | Financing with Ex-lm Bank Collateral |
In the period ended June 30, 2022, GLA also renegotiated the due dates of this type of agreement, impacting the interest rate, disclosed in the table above. The other conditions of this operation remained unchanged.
| 16.2. | Loans and Financing – Non-Current |
On June 30, 2022, the maturities of loans and financing recorded in non-current liabilities were as follows:
| 2023 | 2024 | 2025 | 2026 | 2026 onwards | Without Maturity Date | Total | |
| Parent Company | |||||||
| Foreign Currency Contracts | |||||||
| ESN 2024 | - | 1,773,914 | - | - | - | - | 1,773,914 |
| Senior Notes 2025 | - | - | 3,380,951 | - | - | - | 3,380,951 |
| Senior Secured Notes 2026 | - | - | - | 3,252,725 | - | - | 3,252,725 |
| Perpetual Notes | - | - | - | - | - | 806,132 | 806,132 |
| Total | - | 1,773,914 | 3,380,951 | 3,252,725 | - | 806,132 | 9,213,722 |
| Consolidated | |||||||
| Domestic Currency Contracts | |||||||
| Debentures | 259,467 | 482,853 | - | - | - | - | 742,320 |
| Working Capital | 1,250 | 2,500 | 2,080 | - | - | - | 5,830 |
| Foreign Currency Contracts | |||||||
| ESN 2024 | - | 1,773,914 | - | - | - | - | 1,773,914 |
| Spare Engine Facility | 11,535 | 94,329 | - | - | - | - | 105,864 |
| Senior Notes 2025 | - | - | 3,380,951 | - | - | - | 3,380,951 |
| Senior Secured Notes 2026 | - | - | - | 3,252,725 | - | - | 3,252,725 |
| Loan Facility | 16,218 | 33,290 | 34,464 | 73,644 | 30,285 | - | 187,901 |
| Perpetual Notes | - | - | - | - | - | 806,132 | 806,132 |
| Total | 288,470 | 2,386,886 | 3,417,495 | 3,326,369 | 30,285 | 806,132 | 10,255,637 |
| 41 |
| | Notes on the Parent Company and Consolidated Quarterly Information (ITR) June 30, 2022 (In thousands of Brazilian Reais - R$, except when otherwise indicated) |
| 16.3. | Fair Value |
The fair value of debt on June 30, 2022, is as follows:
| Parent Company | Consolidated | |||
| Fair Book Value (*) | Fair Book Value (*) | |||
| Debentures | - | - | 1,111,812 | 1,138,410 |
| ESN 2024 | 1,812,176 | 1,660,758 | 1,812,176 | 1,660,758 |
| Senior Notes 2025 | 3,480,254 | 2,190,368 | 3,480,254 | 2,190,368 |
| Senior Secured Notes 2026 | 3,252,725 | 2,347,847 | 3,252,725 | 2,347,847 |
| Perpetual Notes | 822,395 | 516,549 | 822,395 | 516,549 |
| Other Loans | - | - | 537,818 | 537,818 |
| Total | 9,367,550 | 6,715,522 | 11,017,180 | 8,391,750 |
(*) Net Total of Funding Costs.
| 16.4. | Covenants |
The Company has covenants in the Debentures and Senior Secured Notes 2026.
After renegotiating the debentures in the fiscal year ended December 31, 2021, the mandatory measurement of the indicators (biannual) provided for in the deeds of the 7th and 8th issuance will be as of December 2022.
Within the scope of the Senior Secured Notes 2026, the Company complies with guarantee conditions linked to inventory parts (biannual) and intellectual property (annual). On June 30, 2022, the Company had GLA’s parts and equipment guaranteed linked to this agreement meeting the contractual conditions.
| 42 |
| | Notes on the Parent Company and Consolidated Quarterly Information (ITR) June 30, 2022 (In thousands of Brazilian Reais - R$, except when otherwise indicated) |
| 17. | Leases to Pay |
On June 30, 2022, the balance of leases to pay includes: (i) R$27,962 from variable payments and short-term leases, exempted as per CPC 06 (R2) - Leases, equivalent to IFRS 16 (R$28,440 on December 31, 2021); and (ii) R$11,583,654 from present value on this date of future lease payments (R$10,734,544 on December 31, 2021).
The breakdown and changes in the present value of future lease payments are shown below:
| Consolidated | |||||||||||||||
| Weighted Average Rate (p.a.) | December 31, 2021 | June 30, 2022 | |||||||||||||
| Current | Non-Current | Total | Additions | Write-Off | Contractual Amendment | Payments | Interest Paid | Interest Incurred | Exchange Rate Change | Total | Current | Non-Current | |||
| Domestic Currency Contracts | |||||||||||||||
| Without Purchase Option | 10.65% | 29,456 | 8,552 | 38,008 | 171,084 | (242) | 37,360 | (24,801) | - | 20,431 | - | 241,840 | 28,552 | 213,288 | |
| With Purchase Option | 15.71% | - | - | - | 1,816 | - | - | (434) | (121) | 121 | - | 1,382 | 956 | 426 | |
| Foreign Currency Contracts | |||||||||||||||
| Without Purchase Option | 10.45% | 1,999,791 | 8,696,745 | 10,696,536 | 905,158 | 2,558 | (62,527) | (1,083,205) | - | 542,413 | (710,546) | 10,290,387 | 1,944,136 | 8,346,251 | |
| With Purchase Option | 6.93% | - | - | - | 1,053,891 | - | - | (33,492) | (18,707) | 24,803 | 23,550 | 1,050,045 | 93,219 | 956,826 | |
| Total | 2,029,247 | 8,705,297 | 10,734,544 | 2,131,949 | 2,316 | (25,167) | (1,141,932) | (18,828) | 587,768 | (686,996) | 11,583,654 | 2,066,863 | 9,516,791 | ||
In the three-month and six-month periods ended June 30, 2022, the Company directly recognized the cost of services, with R$4,856 and R$5,135, respectively, referring to short-term leases and variable payments.
| 43 |
| | Notes on the Parent Company and Consolidated Quarterly Information (ITR) June 30, 2022 (In thousands of Brazilian Reais - R$, except when otherwise indicated) |
The future payments of lease agreements are detailed as follows:
| June 30, 2022 | December 31, 2021 | |
| 2022 | 1,784,360 | 2,977,345 |
| 2023 | 2,582,740 | 2,370,391 |
| 2024 | 2,208,604 | 1,970,832 |
| 2025 | 1,918,098 | 1,673,635 |
| 2026 | 1,631,007 | 1,360,011 |
| 2026 onwards | 6,471,739 | 4,610,635 |
| Total Minimum Lease Payments | 16,596,548 | 14,962,849 |
| Less Total Interest | (4,984,932) | (4,199,865) |
| Present Value of Minimum Lease Payments | 11,611,616 | 10,762,984 |
| Less Current Portion | (2,094,826) | (2,057,687) |
| Non-Current Share | 9,516,790 | 8,705,297 |
| 17.1. | Sale-Leaseback Transactions |
In the six-month period ended June 30, 2022, the Company had 8 sale-leaseback transactions, with net gain totaling R$49,156 in the parent company and R$55,491 in the consolidated recognized as income under “Sale-Leaseback Transactions” in the group of Other Operating Revenues and Expenses, see Note 30.
| 18. | Suppliers |
| Parent Company | Consolidated | |||
| June 30, 2022 | December 31, 2021 | June 30, 2022 | December 31, 2021 | |
| Domestic Currency | 22,567 | 52,079 | 1,393,817 | 1,401,093 |
| Foreign Currency | 20,920 | 32,272 | 510,582 | 497,877 |
| Total | 43,487 | 84,351 | 1,904,399 | 1,898,970 |
| Current | 43,471 | 84,335 | 1,845,395 | 1,820,056 |
| Non-Current | 16 | 16 | 59,004 | 78,914 |
| 19. | Suppliers - Forfaiting |
The Company has contracts that allow suppliers to receive their rights in advance from a financial institution. On June 30, 2022, the amount recorded under current liabilities from forfaiting operations totaled R$30,000 (R$22,733 on December 31, 2021).
| 20. | Taxes to Collect |
| Parent Company | Consolidated | |||
| June 30, 2022 | December 31, 2021 | June 30, 2022 | December 31, 2021 | |
| PIS and COFINS | 956 | 510 | 202,304 | 71,515 |
| Installments | - | - | 56,939 | 34,213 |
| Income Tax on Salaries | 82 | 43 | 37,130 | 32,940 |
| ICMS | - | - | 239 | 244 |
| Income Tax and Social Contribution to Collect | - | - | 22,457 | 366 |
| Others | 21 | 32 | 7,778 | 7,172 |
| Total | 1,059 | 585 | 326,847 | 146,450 |
| Current | 1,059 | 585 | 283,747 | 122,036 |
| Non-Current | - | - | 43,100 | 24,414 |
| 44 |
| | Notes on the Parent Company and Consolidated Quarterly Information (ITR) June 30, 2022 (In thousands of Brazilian Reais - R$, except when otherwise indicated) |
| 21. | Advance Ticket Sales |
On June 30, 2022, the balance of advance from ticket sales classified in current liabilities was R$3,651,292 (R$2,670,469 on December 31, 2021) and is represented by 9,176,904 tickets sold and not yet used (7,004,554 on December 31, 2021) with an average use of 97 days (126 days on December 31, 2021).
Balances of advance from ticket sales are shown net of breakage corresponding to R$244,093 on June 30, 2022 (R$226,905 on December 31, 2021).
On June 30, 2022, the Company has reimbursements to pay for advance air tickets totaling R$225,858 (R$369,638 on December 31, 2021), recorded as Other liabilities in current liabilities.
| 22. | Frequent-Flyer Program |
| Consolidated | ||
| June 30, 2022 | December 31, 2021 | |
| Frequent-Flyer Program | 2,207,585 | 2,097,432 |
| Breakage | (546,340) | (480,301) |
| Total | 1,661,245 | 1,617,131 |
| Current | 1,415,560 | 1,298,782 |
| Non-Current | 245,685 | 318,349 |
Breakage consists of the estimate of miles with a high potential to expire without being used. CPC 47, corresponding to IFRS 15, provides for the recognition of revenue by the estimate (breakage) over the contractual period, therefore, before the miles are redeemed, given that this is not expected before expiration.
| 23. | Provisions |
| Consolidated | ||||
| Post-Employment Benefit | Aircraft and Engine Return | Processes Judicial (a) | Total | |
| Balances on December 31, 2021 | 75,439 | 2,679,833 | 832,050 | 3,587,322 |
| Constitution (Reversal) of Provision | 3,441 | 101,685 | 136,854 | 241,980 |
| Provisions Used | - | (19,652) | (125,099) | (144,751) |
| Present Value Adjustment | 3,989 | 91,089 | - | 95,078 |
| Monetary and Exchange Rate Change | - | (175,912) | (55) | (175,967) |
| Balances on June 30, 2022 | 82,869 | 2,677,043 | 843,750 | 3,603,662 |
| On June 30, 2022 | ||||
| Current | - | 708,228 | - | 708,228 |
| Non-Current | 82,869 | 1,968,815 | 843,750 | 2,895,434 |
| Total | 82,869 | 2,677,043 | 843,750 | 3,603,662 |
| On December 31, 2021 | ||||
| Current | - | 477,324 | - | 477,324 |
| Non-Current | 75,439 | 2,202,509 | 832,050 | 3,109,998 |
| Total | 75,439 | 2,679,833 | 832,050 | 3,587,322 |
| (a) | The provisions used consider write-offs due to the revaluation of estimates and settled processes. |
| 45 |
| | Notes on the Parent Company and Consolidated Quarterly Information (ITR) June 30, 2022 (In thousands of Brazilian Reais - R$, except when otherwise indicated) |
| 23.1. | Post-Employment Benefit |
The Company offers to its employees’ health care plans that, due to complying with current laws, generate liabilities with post-employment benefits.
The actuarial assumptions applied to measure the post-employment benefit remain the same as those disclosed in the annual financial statements.
| 23.2. | Provisions for Aircraft and Engine Return |
Such provision considers the costs that meet the contractual conditions to return aircraft and engines leased with no purchase rights, as well as the costs to reconfigure aircraft when returned as described in the return conditions of the lease agreements. The initial recognition is under property, plant & equipment, as “Aircraft and Engine Overhauling”.
The Company also has a provision to return aircraft and engines as compensation for the service costs, considering the current conditions of the aircraft and engines and the forecast of use until the actual return. These provisions are measured at present value and will be disbursed until the aircraft and engines are returned.
| 23.3. | Provision for Legal Proceedings |
On June 30, 2022, the Company and its subsidiaries are involved in certain legal matters from the regular course of their business, which include civil, administrative, tax, social security, and labor lawsuits.
The Company's Management believes that the provision for tax, civil and labor risks, recorded in accordance with CPC 25 – “Provisions, Contingent Liabilities and Contingent Assets”, equivalent to IAS 37, is sufficient to cover possible losses on administrative and judicial proceedings, as shown below:
| Consolidated | ||||
| Probable Loss | Possible Loss | |||
| June 30, 2022 | December 31, 2021 | June 30, 2022 | December 31, 2021 | |
| Civil | 191,644 | 188,500 | 64,634 | 55,193 |
| Labor | 477,944 | 475,191 | 125,178 | 102,216 |
| Tax | 174,162 | 168,359 | 748,922 | 701,556 |
| Total | 843,750 | 832,050 | 938,734 | 858,965 |
In September 2020, a class action was filed in the federal courts of New York against the Company and its Management. The plaintiffs claim alleged losses from an alleged misleading disclosure. In March 2022, the New York court ruled that the case should be closed. Therefore, there are no provisions for this matter.
Details on the other relevant lawsuits were disclosed in the financial statements for the year ended December 31, 2021. In the period ended June 30, 2022, there were no other changes regarding new proceedings or classification of the relevant risk of loss.
| 46 |
| | Notes on the Parent Company and Consolidated Quarterly Information (ITR) June 30, 2022 (In thousands of Brazilian Reais - R$, except when otherwise indicated) |
| 23.3.1. | Active Lawsuits |
In 2007, the Company filed an arbitration at the International Court of Arbitration (“ICC”) against the sellers of VRG and its controlling shareholders due to the purchase price adjustment. In January 2011, ICC ruled in GOL’s favor. The procedure to enforce the arbitration decision started at the Cayman Court, jurisdiction of one of the defendants, which ruled in May 2022 in GOL’s favor, confirming that the court decision can be fully enforced. On June 30, 2022, an agreement was signed between the parties, in which GOL will get paid US$42 million. The payment in this agreement and, therefore, the asset recognized by the Company are subject to certain conditions.
| 24. | Provisions for Investment Losses |
| 24.1. | Breakdown of Investments |
The investment information is shown below:
| Parent Company | ||
| June 30, 2022 | December 31, 2021 | |
| GOL Linhas Aéreas (GLA) | ||
| Total Number of Shares | 2,762,566,614 | 2,762,566,614 |
| Share Capital | 5,511,194 | 5,511,194 |
| Interest % | 100.00% | 100.00% |
| Shareholders’ Equity (Deficit) | (17,450,595) | (18,292,878) |
| June 30, 2022 | June 30, 2021 | |
| Loss for the Period | (237,493) | (2,134,944) |
| 24.2. | Changes in Investments |
| GLA | |
| Balances on December 31, 2021 | (18,292,878) |
| Equity Income | (237,493) |
| Unrealized Income (Expenses) on Hedge | 174,620 |
| Foreign Exchange Rate Change on Investment Conversion Abroad | (871) |
| Share-Based Compensation | 9,461 |
| Advances for Future Capital Increase | 896,566 |
| Balances on June 30, 2022 | (17,450,595) |
| (a) | Amounts contributed to cash by the parent company, which will be paid later in GLA in operation with the issue of shares. |
| 25. | Shareholders’ Equity |
| 25.1. | Share Capital |
On March 14 and April 6, 2022, the Company's Board of Directors approved the capital increases totaling R$352 and R$342, issuing 35,673 and 40,513 preferred shares, respectively, all registered and with no par value, from stock option exercised, which were granted to eligible employees under the Stock Option Plan.
Within the investment agreement between GOL and American Airlines and considering the shareholders who exercised their preemptive rights, on May 20, 2022, the Board of Directors approved a new capital increase, issuing 22,230,606 preferred shares registered and with no par value, totaling R$948,580, excluding costs incurred totaling R$2,272, with R$1.00 (one real) allocated to the share capital and the remainder allocated to the capital reserve.
On June 30, 2022, the Company's share capital totaled R$4,039,806 (R$4,039,112 on December 31, 2021), represented by 3,200,350,715 shares, with 2,863,682,710 common shares and 336,668,005 preferred shares. (3,178,043,923 shares, with 2,863,682,710 common shares and 314,361,213 preferred shares on December 31, 2021). The share capital above is reduced by the costs to issue shares totaling R$157,495 on June 30, 2022 and December 31, 2021.
| 47 |
| | Notes on the Parent Company and Consolidated Quarterly Information (ITR) June 30, 2022 (In thousands of Brazilian Reais - R$, except when otherwise indicated) |
The Company’s shares are held as follows:
| June 30, 2022 | December 31, 2021 | |||||
| Common Shares | Preferred Shares | Total | Common Shares | Preferred Shares | Total | |
| MOBI (1) (2) | 100.00% | 38.95% | 50.89% | 100.00% | 32.81% | 46.69% |
| American Airlines Inc. | - | 6.60% | 5.31% | - | - | - |
| Air France KLM. | - | 1.26% | 1.01% | - | 1.35% | 1.07% |
| Path Brazil (2) | - | 3.22% | 2.59% | - | 3.45% | 2.74% |
| Others | - | 1.41% | 1.14% | - | 1.54% | 1.22% |
| Market | - | 48.56% | 39.06% | - | 60.85% | 48.28% |
| Total | 100.00% | 100.00% | 100.00% | 100.00% | 100.00% | 100.00% |
| (1) | Regarding the Exchangeable Senior Notes issued in 2019, MOBI granted 14,000,000 ADSs lending facility to Bank of America Corporation, which operates the ADS lending facility, to facilitate privately traded derivative transactions or other hedges activities linked to the Exchangeable Senior Notes. The ADSs will be returned to MOBI at when the Exchangeable Senior Notes mature or at the end of the loan agreement. |
| (2) | It refers to legal entities controlled by the controlling shareholders (Constantino family). |
The authorized share capital on June 30, 2022 is R$6 billion. Within the authorized limit, the Company can, once approved by the Board of Directors, increase its capital regardless of any amendment to its by-laws, by issuing shares, without necessarily maintaining the proportion between the different types of shares. Under the Law, in case of capital increase within the authorized limit, the Board of Directors will define the issuance conditions, including pricing and payment terms.
| 25.2. | Treasury Shares |
On June 30, 2022, the Company had 1,158,656 treasury shares, totaling R$39,514 (1,217,285 shares totaling R$41,514 on December 31, 2021). On June 30, 2022, the closing price of the Company's shares was R$9.07 (R$17.03 on December 31, 2021).
| 48 |
| | Notes on the Parent Company and Consolidated Quarterly Information (ITR) June 30, 2022 (In thousands of Brazilian Reais - R$, except when otherwise indicated) |
| 26. | Earnings (Loss) per Share |
The Company's earnings (loss) per share was determined as follows:
| Parent Company and Consolidated | ||||||
| Three-month period ended on | ||||||
| June 30, 2022 | June 30, 2021 | |||||
| Common Shares | Preferred Shares | Total | Common Shares | Preferred Shares | Total | |
| Numerator | ||||||
| Net Loss (Income) for the Period Attributed to Controlling Shareholders | (574,030) | (2,277,069) | (2,851,099) | 144,024 | 498,889 | 642,913 |
| Denominator | ||||||
| Weighted average number of outstanding shares (in thousands) | 2,863,683 | 323,404 | 2.863,683 | 282,200 | ||
| Effect of Dilutive Securities | - | - | 430 | |||
| Adjusted weighted average number of outstanding shares and diluted presumed conversions (in thousands) | 2,863,683 | 323,404 | 2,863,683 | 282,630 | ||
| Basic Loss (Earnings) per Share | (0.200) | (7.041) | 0.050 | 1.768 | ||
| Diluted Loss (Earnings) per Share | (0.200) | (7.041) | 0.050 | 1.765 | ||
| Parent Company and Consolidated | ||||||||
| Six-month period ended on | ||||||||
| June 30, 2022 | June 30, 2021 | |||||||
| Common Shares | Preferred Shares | Total | Common Shares | Preferred Shares | Total | |||
| Numerator | ||||||||
| Net Loss for the Period Attributed to Controlling Shareholders | (49,651) | (193,863) | (243,514) | (427,886) | (1,457,604) | (1,885,490) | ||
| Denominator | ||||||||
| Weighted average number of outstanding shares (in thousands) | 2,863,683 | 318,307 | 2,863,683 | 277,503 | ||||
| Adjusted weighted average number of outstanding shares and diluted presumed conversions (in thousands) | 2,863,683 | 318,307 | 2,863,683 | 277,503 | ||||
| Basic Loss (Earnings) per Share | (0.017) | (0.609) | (0.149) | (5.253) | ||||
| Diluted Loss (Earnings) per Share | (0.017) | (0.609) | (0.149) | (5.253) | ||||
| 27. | Share-Based Compensation |
The conditions of the restricted share and stock options payment plans granted to the Company’s Executive Officers were disclosed in detail in the financial statements for the year ended December 31, 2021 and did not change during the period ended on June 30, 2022.
The movement of the plans in the period ended June 30, 2022 is as follows:
| 49 |
| | Notes on the Parent Company and Consolidated Quarterly Information (ITR) June 30, 2022 (In thousands of Brazilian Reais - R$, except when otherwise indicated) |
| 27.1. | Stock Option Plan – GOL |
Number of Stock Options | Weighted Average Price of the Period | |
| Options Outstanding on December 31, 2021 | 7,432,661 | 12.90 |
| Options Exercised | (207,179) | 3.87 |
| Options canceled and adjustments in estimated prescribed rights | (2,951,327) | 20.78 |
| Options Outstanding on June 30, 2022 | 4,274,155 | 15.65 |
| Number of Options Exercisable on: | ||
| December 31, 2021 | 6,407,403 | 12.62 |
| June 30, 2022 | 3,872,181 | 15.91 |
The expense recognized in income for the period corresponding to the stock option plans in the period ended June 30, 2022 was R$4,096 (R$4,626 in the period ended June 30, 2021).
| 27.2. | Restricted Share Plan – GOL |
In the period ended June 30, 2022, the Company transferred 58,630 treasury shares to settle the restricted stock plan. On June 30, 2022, the Company had 1,487,620 restricted shares (1,546,250 on December 31, 2021).
The expense recognized in income (expenses) for the period corresponding to the restricted shares plans in the period ended June 30, 2022 was R$5,365 (R$3,518 in the period ended June 30, 2021).
| 28. | Transactions with Related Parties |
| 28.1. | Loan Agreements - Non-current Assets and Liabilities |
The parent company maintains assets and liabilities from loan agreements with its subsidiary GLA without interest, as shown in the table below:
| Assets | Liabilities | ||||||
| Creditor | Debtor | Type of Transaction | Interest Rate (p.a.) | June 30, 2022 | December 31, 2021 | June 30, 2022 | December 31, 2021 |
| GOL | GLA | Loan | 3.42% | 902,730 | 903,297 | - | - |
| GAC | GLA | Loan | 1.00% | 1,110,897 | 1,257,057 | 110,073 | 6,692 |
| Gol Finance | GLA | Loan | 4.06% | 4,458,205 | 4,847,921 | - | - |
| Total | 6,471,832 | 7,008,275 | 110,073 | 6,692 | |||
On June 30, 2022 and December 31, 2021, the Company had no dividends and interest on shareholders’ equity receivable.
| 50 |
| | Notes on the Parent Company and Consolidated Quarterly Information (ITR) June 30, 2022 (In thousands of Brazilian Reais - R$, except when otherwise indicated) |
In addition to the values above, the following table shows the other balances between the Companies eliminated in the Consolidated:
| Balances | ||||||
| Creditor | Debtor | Type of Transaction | Maturity of the Contracts | Interest Rate (p.a.) | June 30, 2022 | December 31, 2021 |
| Gol Finance | GOL | Subscription Bonus(*) | 07/2024 | - | 602,350 | 602,350 |
| Gol Finance Inc. | GAC | Loan | 02/2025 | 8.64% | 1,188,247 | 1,269,464 |
| Gol Finance | GAC | Loan | 01/2023 | 3.83% | 992,092 | 1,181,126 |
| Gol Finance | Gol Finance Inc. | Loan | 04/2023 | 1.44% | 524,544 | 557,544 |
| Gol Finance Inc. | Gol Finance | Loan | 03/2020 | 11.70% | 1,819 | 1,938 |
| GLA | Smiles Viagens | Dividends | - | - | 576 | 267 |
| Smiles Viagens | GLA | Onlending | - | - | 7,703 | 687 |
| Smiles Argentina | GLA | Onlending | - | - | 1,092 | 4,466 |
| Total | 3,318,423 | 3,617,842 | ||||
(*) The subsidiary Gol Finance, through Gol Equity Finance, acquired warrants issued by the Company in the context of the issue of Exchangeable Senior Notes.
| 28.2. | Transportation and Consulting Services |
Throughout its operations, the Company, by itself and through its subsidiaries, signed agreements with the companies listed below, part of the Company’s economic group:
· Expresso Caxiense S.A.: Provision of passenger transportation services in case of an interrupted flight, effective until March 2023; and
· Viação Piracicabana Ltda.: Provision of passenger, baggage, crew, and employee transportation services between airports, actual until September 2026.
On June 30, 2022, the subsidiary GLA recognized a total expense related to these services of R$1,825 (R$1,601 on December 30, 2021). On the same date, the balance to pay to related companies, under “suppliers”, was of R$2,772 (R$3,397 on December 31, 2021).
| 28.3. | Account Opening UATP Contracts (“Universal Air Transportation Plan”) to Grant Credit Limit |
The subsidiary GLA entered into UATP account opening agreements with the related parties indicated below: Aller Participações S.A.; BR Mobilidade Baixada Santista S.A. SPE; Breda Transportes e Serviços S.A.; Comporte Participações S.A.; Empresa Cruz de Transportes Ltda.; Empresa de Ônibus Pássaro Marrom S.A.; Empresa Princesa do Norte S.A.; Expresso Itamarati S.A.; Expresso Maringá do Vale S.A.; Expresso União Ltda.; Glarus Serviços Tecnologia e Participações S.A.; Limmat Participações S.A.; Quality Bus Comércio de Veículos S.A.; Super Quadra Empreendimentos Imobiliários S.A.; Thurgau Participações S.A.; Transporte Coletivo Cidade Canção Ltda.; Turb Transporte Urbano S.A.; Vaud Participações S.A.; and Viação Piracicabana Ltda.; all with no expiration date, whose purpose is to issue credits to purchase airline tickets issued by the Company. The UATP account (virtual card) is accepted as a payment means on the purchase of airfare and related services, seeking to simplify billing and make feasible payment between the participating companies.
The companies indicated above are owned by the individuals who control Mobi and Path Brazil, the Company's main shareholders.
| 51 |
| | Notes on the Parent Company and Consolidated Quarterly Information (ITR) June 30, 2022 (In thousands of Brazilian Reais - R$, except when otherwise indicated) |
| 28.4. | Commercial Partnership and Maintenance Agreement |
In February 2014, the Company signed an exclusive strategic partnership agreement for business cooperation with AirFrance-KLM. In January 2017, the Company signed an extension of the scope for the inclusion of maintenance services. During the period ended June 30, 2022, component maintenance expenses carried out at the AirFrance-KLM workshop were R$27,283 (R$34,420 on June 30, 2021). On June 30, 2022, the Company has R$111,500 in the “Suppliers” account under current liabilities of these agreements (R$99,976 on December 31, 2021).
| 28.5. | Multimodal Transportation Commercial Partnership Agreement |
The subsidiary GLA signed a commercial partnership agreement with the companies União Transporte, Itamarati Express and Cruz Encomendas (together, “Grupo Comporte”), Tex Transportes and Expresso Luxo, effective for 3 years, to provide multimodal transportation services, including road freight transportation by the Partners and air transportation services by GLA. To attain the Agreement, GLA signed an Agreement to provide multimodal transportation services with each of the companies. The parties will be paid for the service linked to the section operated by each party, issuing their due CTe, according to the price tables established by each Party.
The companies from Grupo Comporte are owned by the individuals who control Mobi and Path Brazil, the Company's main shareholders.
| 28.6. | Compensation of the Key Management Personnel |
| Consolidated | ||||
| Three-Month Period Ended | Six-Month Period | |||
| June 30, 2022 | June 30, 2021 | June 30, 2022 | June 30, 2021 | |
| Salaries, Bonus and Benefits (*) | 8,700 | 16,066 | 18,863 | 29,637 |
| Payroll Charges | 2,282 | 6,230 | 6,353 | 7,731 |
| Share-Based Compensation | 4,234 | 4,622 | 9,391 | 9,590 |
| Total | 15,216 | 26,918 | 34,607 | 46,958 |
(*) Includes compensation for members of management and audit committee.
| 29. | Revenue |
| Consolidated | ||||
| Three-month period ended on | Six-month period ended on | |||
| June 30, 2022 | June 30, 2021 | June 30, 2022 | June 30, 2021 | |
| Passenger Transportation (*) | 3,096,924 | 919,445 | 6,212,416 | 2,382,290 |
| Cargo | 113,520 | 81,900 | 217,749 | 167,044 |
| Mileage Revenue | 146,587 | 82,836 | 264,183 | 171,100 |
| Other Revenues | 10,906 | 7,500 | 21,465 | 15,226 |
| Gross Revenue | 3,367,937 | 1,091,681 | 6,715,813 | 2,735,660 |
| Incurring Taxes | (125,882) | (63,309) | (253,306) | (139,661) |
| Net Revenue | 3,242,055 | 1,028,372 | 6,462,507 | 2,595,999 |
(*) Of the total amount, R$41,980 and R$98,294 in the three-month and six-month periods ended June 30, 2022 include revenues from no-show passengers, rebooking, ticket cancellation (R$107,162 and R$219,308 in the three-month and six-month periods ended June 30, 2021).
In the three-month and six-month periods ended June 30, 2022, revenues earned in the foreign market represent less than 10% of total revenues.
| 52 |
| | Notes on the Parent Company and Consolidated Quarterly Information (ITR) June 30, 2022 (In thousands of Brazilian Reais - R$, except when otherwise indicated) |
| 30. | Costs and Expenses by Nature |
| Parent Company | ||||
| Three-Month Period Ended | Six-Month Period Ended | |||
| June 30, 2022 | June 30, 2021 | June 30, 2022 | June 30, 2021 | |
| Selling Expenses | ||||
| Sales and Marketing | (285) | (48) | (285) | (48) |
| Other Selling Expenses | (1) | (345) | (1) | (345) |
| Total Selling Expenses | (286) | (393) | (286) | (393) |
| Administrative Expenses | ||||
| Personnel | (880) | (4,352) | (1,931) | (7,812) |
| Services | (8,347) | (6,378) | (14,498) | (24,545) |
| Other Administrative Expenses | (5,855) | (66,105) | (14,758) | (72,058) |
| Total Administrative Expenses | (15,082) | (76,835) | (31,187) | (104,415) |
| Other Operational Revenues (Expenses) | ||||
| Sale-Leaseback Transactions (a) | - | - | 49,156 | - |
| Other Operating Revenues (Expenses) | (186) | (9) | 14,923 | 480 |
| Total Other Operating Revenues and (Expenses), Net | (186) | (9) | 64,079 | 480 |
| Total | (15,554) | (77,237) | 32,606 | (104,328) |
| (a) | See Note 17.1 |
| 53 |
| | Notes on the Parent Company and Consolidated Quarterly Information (ITR) June 30, 2022 (In thousands of Brazilian Reais - R$, except when otherwise indicated) |
| Consolidated | ||||
| Three-Month Period Ended Six-Month Period Ended | ||||
| June 30, 2022 | June 30, 2021 | June 30, 2022 | June 30, 2021 | |
| Cost of Services | ||||
| Personnel | (357,582) | (296,421) | (754,731) | (608,467) |
| Fuels and Lubricants(c) | (1,448,857) | (376,187) | (2,654,532) | (942,315) |
| Maintenance, Material and Repairs | (89,647) | (87,965) | (279,645) | (241,331) |
| Passenger Costs | (171,320) | (118,574) | (361,589) | (226,590) |
| Services | (45,934) | (34,953) | (97,101) | (77,992) |
| Landing Fees | (172,110) | (69,689) | (337,687) | (183,754) |
| Depreciation and Amortization | (360,038) | (193,256) | (694,881) | (433,160) |
| Other Operating Costs | (72,670) | (66,898) | (151,493) | (165,579) |
| Total Cost of Services | (2,718,158) | (1,243,943) | (5,331,659) | (2,879,188) |
| Selling Expenses | ||||
| Personnel | (8,926) | (7,708) | (17,746) | (13,830) |
| Services | (38,610) | (26,469) | (82,178) | (49,982) |
| Sales and Marketing | (242,899) | (58,489) | (407,592) | (124,850) |
| Other Selling Expenses | (19,816) | (8,380) | (29,859) | (16,163) |
| Total Selling Expenses | (310,251) | (101,046) | (537,375) | (204,825) |
| Administrative Expenses | ||||
| Personnel (a) | (127,407) | (165,550) | (302,754) | (311,814) |
| Services | (131,193) | (130,957) | (222,828) | (251,507) |
| Depreciation and Amortization | (28,137) | (24,548) | (54,071) | (58,268) |
| Other Administrative Expenses | (16,591) | (110,975) | (89,123) | (173,634) |
| Total Administrative Expenses | (303,328) | (432,030) | (668,776) | (795,223) |
| Other Operating Revenues (Expenses) | ||||
| Sale-Leaseback Transactions (d) | - | - | 55,491 | - |
| Recovery of Taxes Paid | - | - | - | 59,874 |
| Idleness - Depreciation and Amortization (b) | (39,074) | (80,535) | (75,846) | (143,210) |
| Idleness - Personnel | - | (320) | - | (320) |
| Other Operating Revenues (Expenses) | (63,158) | 19,253 | (19,115) | 34,140 |
| Total Other Operating (Expenses) Revenues, Net | (102,232) | (61,602) | (39,470) | (49,516) |
| Total | (3,433,969) | (1,838,621) | (6,577,280) | (3,928,752) |
| (a) | The Company recognizes compensation paid to members of the Audit Committee, the Board of Directors and the Fiscal Board in the "Salaries" line item. |
| (b) | See Note 1.2.1 |
| (c) | See Note 1.3 |
| (d) | See Note 17.1 |
| 54 |
| | Notes on the Parent Company and Consolidated Quarterly Information (ITR) June 30, 2022 (In thousands of Brazilian Reais - R$, except when otherwise indicated) |
| 31. | Financial Income (Expenses) |
| Parent Company | Consolidated | |||||||
| Three-month period ended on | Six-month period ended on | Three-month period ended on | Six-month period ended on | |||||
| June 30, 2022 | June 30, 2021 | June 30, 2022 | June 30, 2021 | June 30, 2022 | June 30, 2021 | June 30, 2022 | June 30, 2021 | |
| Financial Revenues | ||||||||
| Gains from Financial Investments | 11,157 | 1,207 | 12,322 | 1,263 | 26,392 | 6,375 | 39,026 | 13,213 |
| Others (a) (b) | 40,298 | 31,919 | 82,934 | 61,908 | 4,712 | 183 | 10,334 | 6,468 |
| Total Financial Revenues | 51,455 | 33,126 | 95,256 | 63,171 | 31,104 | 6,558 | 49,360 | 19,681 |
| Financial Expenses | ||||||||
| Interest and Costs on Loans and Financing | (201,209) | (180,568) | (415,797) | (348,135) | (259,174) | (210,129) | (527,671) | (404,769) |
| Interest on Leases | - | - | - | - | (331,144) | (217,733) | (587,768) | (445,060) |
| Interests on the Provision for Aircraft Return | - | - | - | - | (7,256) | (19,021) | (91,089) | (37,891) |
| Commissions, Bank Charges and Interest on Other Operations (d) | (27) | (2,366) | (30) | (18,544) | (127,408) | (29,458) | (228,353) | (82,066) |
| Others | (406) | (5,649) | (446) | (8,153) | (97,719) | (3,619) | (144,428) | (26,926) |
| Total Financial Expenses | (201,642) | (188,583) | (416,273) | (374,832) | (822,701) | (479,960) | (1,579,309) | (996,712) |
| Derivative Financial Instruments | ||||||||
| Conversion Right and Derivatives - ESN, Net (c) | 36,526 | 30,876 | 33,560 | 103,366 | 36,526 | 30,876 | 33,560 | 103,366 |
| Other Derivative Financial Instruments, Net | - | - | - | - | 2,623 | (1,612) | (77) | (348) |
| Total Derivative Financial Instruments | 36,526 | 30,876 | 33,560 | 103,366 | 39,149 | 29,264 | 33,483 | 103,018 |
| Monetary and Foreign Exchange Rate Variations, Net | (380,135) | 461,426 | 252,914 | 136,860 | (2,024,113) | 1,924,057 | 1,380,769 | 391,614 |
| Total | (493,796) | 336,845 | (34,543) | (71,435) | (2,776,561) | 1,479,919 | (115,697) | (482,399) |
| (a) | In the period ended June 30, 2022, of the total parent company and consolidated balances, R$2,143 and R$11,230, respectively, refer to PIS and COFINS on financial revenues earned, as per Decree 8426 of April 1 2015 (R$889 and R$9,755 in the period ended June 30, 2021). |
| (b) | The balance recorded in Others in the Parent Company includes interest on loan totaling R$85,078 in the period ended June 30, 2022 (R$62,796 in the period ended June 30, 2021). |
| (c) | See Note 33.2 (ESN and Capped call). |
| (d) | The increase in these expenses in the period is substantially linked to interest on the advance of receivables with sales growth. |
| 55 |
| | Notes on the Parent Company and Consolidated Quarterly Information (ITR) June 30, 2022 (In thousands of Brazilian Reais - R$, except when otherwise indicated) |
| 32. | Commitments |
On June 30, 2022, the Company had 95 firm orders (103 on December 31, 2021) for aircraft acquisitions with Boeing. These aircraft acquisition commitments include estimates for contractual price increases during the construction phase. The present value of firm orders on June 30, 2022, considering an estimate of contractual discounts, corresponds to around R$20,274,246 (R$21,947,804 on December 31, 2021), equivalent to US$3,870,608 (US$3,932,946 on December 31, 2021), and are segregated as follows:
| Parent Company and Consolidated | ||
| June 30, 2022 | December 31, 2021 | |
| 2022 | 877,638 | 2,805,899 |
| 2023 | 4,057,379 | 3,384,587 |
| 2024 | 5,522,399 | 6,101,396 |
| 2025 | 6,530,234 | 6,428,138 |
| 2026 | 3,286,596 | 3,227,784 |
| Total | 20,274,246 | 21,947,804 |
Of the total commitments presented above, the Company must disburse R$6,870,960 (corresponding to US$1,311,753 on June 30, 2022) as advances for aircraft acquisition, according to the cash flow below:
| Parent Company and Consolidated | ||
| June 30, 2022 | December 31, 2021 | |
| 2022 | 181,327 | 248,109 |
| 2023 | 1,400,152 | 1,174,768 |
| 2024 | 1,905,895 | 2,145,764 |
| 2025 | 2,253,391 | 2,279,227 |
| 2026 | 1,130,195 | 1,141,513 |
| Total | 6,870,960 | 6,989,381 |
| 33. | Financial Instruments and Risk Management |
Operational activities expose the Company and its subsidiaries to market risk (fuel prices, foreign currency and interest rate), credit risk and liquidity risk. These risks can be mitigated by using exchange swap derivatives, futures and options contracts based on oil, U.S. dollar and interest markets.
Financial instruments are managed by the Financial Policy Committee (“CPF”) in line with the Risk Management Policy approved by the Risk Policy Committee (“CPR”) and submitted to the Board of Directors.
The details regarding the way the Company manages risks were presented in the financial statements related to the year ended December 31, 2021. Since then, there have been no changes.
| 56 |
| | Notes on the Parent Company and Consolidated Quarterly Information (ITR) June 30, 2022 (In thousands of Brazilian Reais - R$, except when otherwise indicated) |
| 33.1. | Accounting Classifications of Financial Instruments |
The accounting classifications of the Company's consolidated financial instruments on June 30, 2022 and December 31, 2021 are shown below:
| Parent Company | Consolidated | |||||||
| Measured at Fair Value through Income (Expenses) | Cost amortized | Measured at Fair Value through Income (Expenses) | Cost amortized | |||||
| June 30, 2022 | December 31, 2021 | June 30, 2022 | December 31, 2021 | June 30, 2022 | December 31, 2021 | June 30, 2022 | December 31, 2021 | |
| Assets | 2021 | |||||||
| Cash and Bank Deposits | 20,527 | 2,981 | - | - | 130,822 | 116,123 | - | - |
| Cash Equivalents | 241,127 | 207,960 | - | - | 263,244 | 370,135 | - | - |
| Financial Investments | 4,468 | 4,378 | - | - | 426,479 | 373,689 | - | - |
| Trade Receivables | - | - | - | - | - | - | 1,091,852 | 850,683 |
| Deposits (a) | - | - | 2,619 | 2,790 | - | - | 1,504,817 | 1,373,109 |
| Rights from Derivative Transactions | 11,604 | 107,170 | - | - | 75,995 | 114,060 | - | - |
| Credits with Related Companies | - | - | 6,471,832 | 7,008,275 | - | - | - | - |
| Other Credits | - | - | 27,469 | 14,458 | - | - | 209,863 | 189,017 |
| Liabilities | ||||||||
| Loans and Financing (b) | 30,985 | 162,568 | 9,336,565 | 9,859,000 | 30,985 | 162,568 | 10,986,195 | 11,737,462 |
| Leases to Pay | - | - | - | - | - | - | 11,611,616 | 10,762,984 |
| Suppliers | - | - | 43,487 | 84,351 | - | - | 1,904,399 | 1,898,970 |
| Suppliers - Forfaiting | - | - | - | - | - | - | 30,000 | 22,733 |
| Obligations to Related Parties | - | - | 110,073 | 6,692 | - | - | - | - |
| Other Liabilities | - | - | 495,976 | 581,766 | - | - | 837,679 | 1,023,700 |
| (a) | Excludes court deposits, as described in Note 10. |
| (b) | The balances on June 30, 2022 and December 31, 2021, classified as measured at fair value through income (expense), are related to the derivative contracted through Exchange Senior Notes. |
| 57 |
| | Notes on the Parent Company and Consolidated Quarterly Information (ITR) June 30, 2022 (In thousands of Brazilian Reais - R$, except when otherwise indicated) |
��
In the period ended June 30, 2022, there was no change in the classification between categories of the financial instruments.
| 33.2. | Derivative and Non-Derivative Financial Instruments |
The Company's derivative financial instruments were recognized as follows in the Balance sheet:
| Derivatives | Non-Derivative | |||||||
| Fuel | Interest Rate | Exchange Rate | Capped Call | ESN 2024 | Revenue Hedge | Total | ||
| Fair Value Changes | ||||||||
| Rights (Liabilities) with Derivatives on December 31, 2021 | 6,890 | - | - | 107,170 | (162,568) | - | (48,508) | |
| Gains (Losses) Recognized in Income (Expenses) | - | - | 6,996 | (95,566) | 131,583 | - | 43,013 | |
| Gains Recognized in Equity Valuation Adjustments | (3,684) | - | - | - | - | - | (3,684) | |
| Settlements (Payments Received) During the Period | 43,433 | - | 10,756 | - | - | - | 54,189 | |
| Rights (Obligations) with Derivatives on June 30, 2022 | 46,639 | - | 17,752 | 11,604 | (30,985) | - | 45,010 | |
| Rights from Derivative Transactions - Current | 34,739 | - | 17,752 | - | - | - | 52,491 | |
| Rights from Derivative Transactions - Non-Current | 11,900 | - | - | 11,604 | - | - | 23,504 | |
| Loans and Financing | - | - | - | - | (30,985) | - | (30,985) | |
| Changes in the Equity Valuation Adjustments | ||||||||
| Balance on December 31, 2021 | (9,228) | (296,829) | - | - | - | (612,744) | (918,801) | |
| Fair Value Adjustments During the Period | (3,684) | - | - | - | (3,684) | |||
| Adjustments of Hedge Accounting of Revenue | - | - | - | - | - | 129,644 | 129,644 | |
| Net Reversals to Income (Expenses) | 6,174 | 3,390 | - | - | - | 39,096 | 48,660 | |
| Balances on June 30, 2022 | (6,738) | (293,439) | - | - | - | (444,004) | (744,181) | |
| Effects on Income (Expenses) | (6,174) | (3,390) | 6,996 | (95,566) | 131,583 | (168,740) | (135,291) | |
| Net Revenue | - | - | - | - | - | (44,868) | (44,868) | |
| Cost of Services | (2,491) | - | - | - | - | - | (2,491) | |
| Financial Income (Expenses) | (3,683) | (3,390) | 6,996 | (86,025) | 119,585 | - | 33,483 | |
| Exchange Rate Change | - | - | - | (9,541) | 11,998 | (123,872) | (121,415) | |
The Company may adopt hedge accounting for derivatives contracted to hedge cash flow and that qualify for this classification as per CPC 48 - Financial Instruments (equivalent to IFRS 9).
On June 30, 2022, the Company adopts cash flow hedge for the interest rate (mainly the Libor interest rates) and for aeronautical fuel protection and future revenue in US Dollar.
The schedule to realize the balance of Equity Valuation Adjustments on June 30, 2022, referring to cash flow hedges, is as follows:
| 2022 | 2023 | 2024 | 2025 | 2026 | 2026 onwards | Total | |
| Fuel | (6,738) | - | - | - | - | - | (6,738) |
| Interest Rate | (3,616) | (29,617) | (33,000) | (34,301) | (34,134) | (158,771) | (293,439) |
| Revenue Hedge | (74,400) | (203,238) | (166,366) | - | - | - | (444,004) |
| Total | (84,754) | (232,855) | (199,366) | (34,301) | (34,134) | (158,771) | (744,181) |
| 58 |
| | Notes on the Parent Company and Consolidated Quarterly Information (ITR) June 30, 2022 (In thousands of Brazilian Reais - R$, except when otherwise indicated) |
| 33.3. | Market Risks |
| 33.3.1. | Fuel |
The aircraft fuel prices fluctuate due to the volatility of the price of crude oil by product price fluctuations. To mitigate such risks, the Company can use derivative financial instruments.
The table below shows the sensitivity analysis of the derivative financial instruments contracted on this base date, considering the fluctuation in the prices of a barrel of jet fuel in US dollars, at R$100.28 on June 30, 2022:
| Fuel | ||
| US$/bbl (WTI) | R$ (000) | |
| Decline in Prices/Barrel (-25%) | 82.99 | (31,349) |
| Decline in Prices/Barrel (-10%) | 95.18 | (15,565) |
| Increase in Prices/Barrel (+10%) | 113.41 | 20,206 |
| Increase in Prices/Barrel (+25%) | 138.31 | 58,925 |
| 33.3.2. | Interest Rate |
The Company is mainly exposed to lease transactions indexed to changes in the Libor rate until the aircraft is received. To mitigate such risks, the Company can use derivative financial instruments. On June 30, 2022, the Company did not have derivatives to hedge this exposure.
On June 30, 2022, the Company held financial investments and debts with different types of fees. Its sensitivity analysis of non-derivative financial instruments examined the impact on annual interest rates only for positions with material amounts on June 30, 2022 that were exposed to fluctuations in interest rates, as the scenarios below show. The amounts show the impacts on Income (Expenses) according to the scenarios adopted below:
| Financial Investments Net of Financial Debt (a) | ||
| Risk | Increase in the CDI rate | Libor Rate Increase |
| Reference Rates | 13.15% | 1.30% |
| Exposure Amount (Probable Scenario) (b) | (584,162) | (2,272,213) |
| Remote Favorable Scenario (-25%) | 19,890 | 7,375 |
| Possible Favorable Scenario (-10%) | 7,956 | 2,950 |
| Possible Adverse Scenario (+10%) | (7,956) | (2,950) |
| Remote Adverse Scenario (+25%) | (19,890) | (7,375) |
| (a) | Refers to the sum of the amounts invested and raised in the financial market and indexed to the CDI and Libor rates. |
| (b) | Equity book balances recorded on June 30, 2022. |
| 33.3.3. | Exchange Rate |
Foreign currency risk derives from the possibility of unfavorable fluctuation of foreign currency to which the Company’s liabilities or cash flows are exposed. The Company is mainly exposed to the exchange rate change of the U.S. dollar.
| 59 |
| | Notes on the Parent Company and Consolidated Quarterly Information (ITR) June 30, 2022 (In thousands of Brazilian Reais - R$, except when otherwise indicated) |
The Company’s foreign currency exposure is summarized below:
| Parent Company | Consolidated | |||
| June 30, 2022 | December 31, 2021 | June 30, 2022 | December 31, 2021 | |
| Assets | ||||
| Cash, Cash Equivalents and Financial Investments | 21,799 | 3,626 | 234,495 | 153,040 |
| Trade Receivables | - | - | 236,525 | 171,473 |
| Deposits | 2,619 | 2,790 | 1,504,817 | 1,373,109 |
| Rights from Derivative Transactions | 11,604 | 107,170 | 75,995 | 114,060 |
| Total Assets | 36,022 | 113,586 | 2,051,832 | 1,811,682 |
| Liabilities | ||||
| Loans and Financing | (9,367,550) | (10,021,568) | (9,865,324) | (10,677,266) |
| Leases to Pay | - | - | (11,368,394) | (10,724,976) |
| Suppliers | (20,920) | (32,272) | (510,582) | (497,877) |
| Provision for Aircraft and Engine Return | - | - | (2,677,043) | (2,679,833) |
| Total Liabilities | (9,388,470) | (10,053,840) | (24,421,343) | (24,579,952) |
| Exchange Rate Exposure Liabilities | (9,352,448) | (9,940,254) | (22,369,511) | (22,768,270) |
| Commitments Not Recorded in the Statements of Financial Position | ||||
| Future Liabilities from Firm Aircraft Orders | (20,274,246) | (21,947,804) | (20,274,246) | (21,947,804) |
| Total | (20,274,246) | (21,947,804) | (20,274,246) | (21,947,804) |
| Total Exchange Rate Exposure (in R$) | (29,626,694) | (31,888,058) | (42,643,758) | (44,716,074) |
| Total Foreign Exchange Exposure (in US$) | (5,656,108) | (5,714,194) | (8,141,229) | (8,012,915) |
| Exchange Rate (R$/US$) | 5.2380 | 5.5805 | 5.2380 | 5.5805 |
On June 30, 2022, the Company adopted the exchange rate of R$5.2380/US$1.00, corresponding to the closing rate for the month disclosed by the Central Bank of Brazil as a likely scenario. The table below shows the sensitivity analysis and the effect on Income (Expenses) of exchange rate fluctuations in the exposure on June 30, 2022:
| Effect on Income (Expenses) | |||
| Exchange Rate | Parent Company | Consolidated | |
| Net Liabilities Exposed to the Risk of Appreciation of the U.S. dollar | 5.2380 | (9,352,448) | (22,369,511) |
| Dollar Depreciation (-25%) | 3.9285 | 2,338,112 | 5,592,378 |
| Dollar Depreciation (-10%) | 4.7142 | 935,245 | 2,236,951 |
| Dollar Appreciation (+10%) | 5.7618 | (935,245) | (2,236,951) |
| Dollar Appreciation (+25%) | 6.5475 | (2,338,112) | (5,592,378) |
| 33.3.4. | Capped Call |
The Company, through Gol Equity Finance, in the context of the pricing of the ESN issued on March 26, April 17 and July 17, 2019, contracted private derivative transactions (Capped call) with part of the Note subscribers with the purpose of minimizing the potential dilution of the Company’s preferred shares and ADSs.
| 60 |
| | Notes on the Parent Company and Consolidated Quarterly Information (ITR) June 30, 2022 (In thousands of Brazilian Reais - R$, except when otherwise indicated) |
| 33.4. | Credit Risk |
The credit risk is inherent in the Company’s operating and financing activities, mainly in cash and cash equivalents, financial investments and trade receivables. Financial assets classified as cash, cash equivalents and financial investments are deposited with counterparties rated investment grade or higher by S&P or Moody's (between AAA and AA-), pursuant to risk management policies.
Credit limits are set for all customers based on internal credit rating criteria and carrying amounts represent the maximum credit risk exposure. Customer creditworthiness is assessed based on an internal system of extensive credit rating. Outstanding trade receivables are frequently monitored by the Company.
Derivative financial instruments are contracted in the over-the-counter market (OTC) with counterparties rated investment grade or higher, or in a commodities and futures exchange (B3 and NYMEX), thus substantially mitigating credit risk. The Company's obligation is to evaluate counterparty risk involved in financial instruments and periodically diversify its exposure.
| 33.5. | Liquidity Risk |
The Company is exposed to liquidity risk in two distinct ways: (i) market prices, which vary in accordance with the types of assets and markets where they are traded, and (ii) cash flow liquidity risk related to difficulties in meeting the contracted operating liabilities at the maturity dates. To meet the liquidity risk management, the Company invests its resources in liquid assets (federal government bonds, CDBs, and investment funds with daily liquidity) and the Cash Management Policy establishes that the weighted average term of the debt must be greater than the weighted average term of the investment portfolio.
The schedules of financial liabilities held by the Company's consolidated financial liabilities on June 30, 2022 and December 31, 2021 are as follows:
| Parent Company | |||||
| Less than 6 months | 6 to 12 months | 1 to 5 years | More than 5 years | Total | |
| Loans and Financing | 153,828 | - | 8,407,590 | 806,132 | 9,367,550 |
| Suppliers | 43,471 | - | 16 | - | 43,487 |
| Obligations to Related Parties | - | - | 110,073 | - | 110,073 |
| Other Liabilities | 141,573 | - | 354,403 | - | 495,976 |
| On June 30, 2022 | 338,872 | - | 8,872,082 | 806,132 | 10,017,086 |
| Loans and Financing | 164,304 | - | 8,998,421 | 858,843 | 10,021,568 |
| Suppliers | 84,335 | - | 16 | - | 84,351 |
| Obligations to Related Parties | - | - | 6,692 | - | 6,692 |
| Other Liabilities | 85,843 | - | 495,923 | - | 581,766 |
| On December 31, 2021 | 334,482 | - | 9,501,052 | 858,843 | 10,694,377 |
| 61 |
| | Notes on the Parent Company and Consolidated Quarterly Information (ITR) June 30, 2022 (In thousands of Brazilian Reais - R$, except when otherwise indicated) |
| Consolidated | |||||
| Less than 6 months | 6 to 12 months | 1 to 5 years | More than 5 years | Total | |
| Loans and Financing | 452,176 | 309,367 | 9,449,750 | 805,887 | 11,017,180 |
| Leases to Pay | 1,252,023 | 842,803 | 5,121,405 | 4,395,385 | 11,611,616 |
| Suppliers | 1,845,395 | - | 59,004 | - | 1,904,399 |
| Suppliers - Forfaiting | 30,000 | - | - | - | 30,000 |
| Other Liabilities | 399,726 | - | 437,953 | - | 837,679 |
| On June 30, 2022 | 3,979,320 | 1,152,170 | 15,068,112 | 5,201,272 | 25,400,874 |
| Loans and Financing | 478,566 | 156,048 | 10,373,517 | 891,899 | 11,900,030 |
| Leases to Pay | 1,209,215 | 848,472 | 5,159,608 | 3,545,689 | 10,762,984 |
| Suppliers | 1,820,056 | - | 78,914 | - | 1,898,970 |
| Suppliers - Forfaiting | 22,733 | - | - | - | 22,733 |
| Other Liabilities | 455,251 | - | 568,449 | - | 1,023,700 |
| On December 31, 2021 | 3,985,821 | 1,004,520 | 16,180,488 | 4,437,588 | 25,608,417 |
| 33.6. | Capital Management |
The Company seeks alternatives to capital in order to meet its operational needs, aiming a capital structure that considers suitable parameters for the financial costs, the maturities of funding and its guarantees. The Company monitors its financial leverage ratio, which corresponds to net debt, including short and long-term debt. The following table shows the financial leverage:
| Consolidated | ||
| June 30, 2022 | December 31, 2021 | |
| Total Loans and Financing | 11,017,180 | 11,900,030 |
| Total Leases to Pay | 11,611,616 | 10,762,984 |
| (-) Cash and Cash Equivalents | (394,066) | (486,258) |
| (-) Financial Investments | (426,479) | (373,689) |
| Net Debt | 21,808,251 | 21,803,067 |
| 34. | Non-Cash Transactions |
| Parent Company | ||
| June 30, 2022 | June 30, 2021 | |
| Share-Based Compensation (Investments / Capital Reserves) | 9,461 | 8,547 |
| Unrealized Income (Expenses) of Derivatives (Investments/Equity Valuation Adjustments) | 174,620 | 415,782 |
| Capital Increase by Issuing Shares to Minority Shareholders | - | 606,839 |
| Income (Expenses) on the Sale of Treasury Shares | - | 279 |
| Transfer of Treasury Shares | 2,000 | 19,834 |
| 62 |
| | Notes on the Parent Company and Consolidated Quarterly Information (ITR) June 30, 2022 (In thousands of Brazilian Reais - R$, except when otherwise indicated) |
| Consolidated | ||
| June 30, 2022 | June 30, 2021 | |
| Debt Amortization with Linked Investments (Financial Investments / Loans and Financing) | - | 198,270 |
| Write-Off of Lease Agreements (Other Revenues / Leases Payable) | 242 | - |
| Debt Amortization with Deposits Invested (Deposits / Leases to Pay) | - | (8,126) |
| Right of Use Non-Aeronautical Assets (Property, Plant & Equipment / Leases to Pay) | 172,900 | - |
| Leaseback and Additions of Aircraft Leases (Property, Plant & Equipment/Leases) | 1,852,842 | 430,658 |
| Contractual Leases Renegotiation (Property, Plant & Equipment / Leases to Pay) | 25,167 | 47,449 |
| Provision for Aircraft Return (Property, Plant & Equipment / Provisions) | 25,437 | 10,326 |
| Unrealized Income (Expenses) of Derivatives (Derivative Rights/Equity Valuation Adjustments) | 174,620 | 415,782 |
| Capital Increase by Issuing Shares to Minority Shareholders | - | 606,839 |
| Capital Reserve Recognized | - | 744,450 |
| Income (Expenses) on the Sale of Treasury Shares | - | 279 |
| Transfer of Treasury Shares | 2,000 | 19,834 |
| 63 |
| | Notes on the Parent Company and Consolidated Quarterly Information (ITR) June 30, 2022 (In thousands of Brazilian Reais - R$, except when otherwise indicated) |
| 35. | Liabilities from Financing Activities |
The changes for the periods ended June 30, 2022 and 2021 of the liabilities of the Company's financing activities are shown below:
| 35.1. | Parent Company |
| June 30, 2022 | |||||||||||
| Adjustment to Profit | Non-Cash Transactions | ||||||||||
| Opening Balance | Net Cash from Financing Activities | Net Cash Used in Operating Activities | Exchange Rate Changes, Net | Provision for Interest and Cost Amortization | Unrealized Hedge Results |
Share-Based Compensation | Income (Expenses) on the Sale and Transfer of Treasury Shares | Closing Balance | |||
| Obligations to Related Parties | 6,692 | 99,729 | - | 3,652 | - | - | - | - | 110,073 | ||
| Share Capital | 4,039,112 | 694 | - | - | - | - | - | - | 4,039,806 | ||
| Shares to Issue | 3 | 588 | - | - | - | - | - | - | 591 | ||
| Capital Reserve | 208,711 | 946,308 | - | - | - | - | 9,461 | (2,000) | 1,162,480 | ||
| June 30, 2021 | |||||||||||
| Adjustment to Profit | Non-Cash Transactions | ||||||||||
| Opening Balance | Net Cash (Used in) from Financing Activities | Net Cash from Operating Activities | Exchange Rate Changes, Net | Provision for Interest and Cost Amortization | Unrealized Hedge Results |
Capital Increase with Non-Controlling Shareholders | Income (Expenses) on the Sale and Transfer of Treasury Shares | Closing Balance | |||
| Loans and Financing | 7,629,713 | 1,001,906 | (326,520) | (334,229) | 396,795 | (124,954) |
- |
- | 8,242,711 | ||
| Obligations to Related Parties | 3,009,436 | 423,061 | - | - | - | - |
606,839 |
- | 4,039,336 | ||
| Share Capital | 1,180 | 908 | - | - | - | - | - | - | 2,088 | ||
| Shares to Issue | (62,215) | 588 | - | - | - | - | - | 20,113 | (41,514) | ||
| 64 |
| | Notes on the Parent Company and Consolidated Quarterly Information (ITR) June 30, 2022 (In thousands of Brazilian Reais - R$, except when otherwise indicated) |
| 35.2. | Consolidated |
| June 30, 2022 | |||||||||||||||
| Non-Cash Transactions | Adjustment to Profit | ||||||||||||||
| Opening Balance | Net Cash (Used in) from Financing Activities | Net Cash Used in Operating Activities | Transfer of Treasury Shares | Acquisition of Property, Plant & Equipment under New Agreements and Contractual Amendment | Write-Off of Lease Agreement | Exchange Rate Changes, Net | Provision for Interest and Cost Amortization | Unrealized Hedge Results |
Share-Based Compensation | Closing Balance | |||||
| Loans and Financing | 11,900,030 | (166,443) | (456,927) | - | - | - | (667,566) | 527,671 | (119,585) | - | 11,017,180 | ||||
| Leases to Pay | 10,762,984 | (1,141,932) | (19,361) | - | 2,106,782 | 2,316 | (686,941) | 587,768 | - | - | 11,611,616 | ||||
| Share Capital | 4,039,112 | 694 | - | - | - | - | - | - | - | - | 4,039,806 | ||||
| Shares to Issue | 3 | 588 | - | - | - | - | - | - | - | - | 591 | ||||
| Capital Reserve | 208,711 | 946,308 | - | (2,000) | - | - | - | 9,461 | 1,162,480 | ||||||
| June 30, 2021 | ||||||||||||||
| Non-Cash Transactions | Adjustment to Profit | |||||||||||||
| Opening Balance | Net Cash (Used in) from Financing Activities | Net Cash Used in Operating Activities | Acquisition of Property, Plant & Equipment under New Agreements and Contractual Amendment | Transaction with Non-Controlling Shareholders and Sale/Transfer of Treasury Shares | Amortization with Linked Assets | Distribution of Interim Dividends | Exchange Rate Changes, Net | Provision for Interest and Cost Amortization | Unrealized Hedge Results | Closing Balance | ||||
| Loans and Financing | 9,976,966 | 939,729 | (378,944) | - | - | (198,270) | - | (373,966) | 453,449 | (124,954) | 10,294,010 | |||
| Leases to Pay | 7,584,192 | (524,898) | 17,794 | 478,107 | - | (8,126) | - | (296,202) | 445,062 | - | 7,695,929 | |||
| Dividends and ISE to Pay (1) | 23,139 | (260,131) | - | - | - | - | 236,992 | - | - | - | - | |||
| Share Capital | 3,009,436 | 423,061 | - | - | 606,839 | - | - | - | - | - | 4,039,336 | |||
| Shares to Issue | 1,180 | 908 | - | - | - | - | - | - | - | - | 2,088 | |||
| Treasury Shares | (62,215) | 588 | - | - | 20,113 | - | - | - | - | - | (41,514) | |||
| Capital Reserve | 207,246 | (744,450) | 8,547 | - | 724,337 | - | - | - | - | - | 195,680 | |||
| (1) | The amount is recorded in the Other liabilities group, in current liabilities |
| 65 |
SIGNATURE
Pursuant to the requirements of the Securities Exchange Act of 1934, the registrant has duly caused this report to be signed on its behalf by the undersigned, thereunto duly authorized.
Date: July 27, 2022
| GOL LINHAS AÉREAS INTELIGENTES S.A. | ||
| By: | /s/ Richard F. Lark, Jr. | |
Name: Richard F. Lark, Jr. Title: Investor Relations Officer | ||