Exhibit 99.1
GOLD KIST INC.
Review of Transitional Quarter and Four Quarters
Ended 10/2/04 vs Quarter and Four Quarters Ended 9/27/03
November 16, 2004
Cautionary Notes and Forward-Looking Statements
The statements contained in this presentation regarding our future financial and operating performance and results, business strategy, market prices, future commodity price risk management activities, plans and forecasts and other statements that are not historical facts are forward-looking statements, as defined in the federal securities laws. We have based these forward-looking statements on our current assumptions, expectations and projections about future events. You should read these statements carefully because they discuss future expectations, contain projections of results of operations or of our financial condition and/or state other “forward-looking” information. These statements may also involve risks and uncertainties that could cause our actual results of operations or financial condition to materially differ from our expectations, including, but not limited to the risks described under the caption “Risk Factors” in our Transition Report on Form 10-Q for the Transition Quarter ended October 2, 2004. Forward-looking statements are not a guarantee of future performance and actual results or developments may differ materially from expectations. We do not intend to update any forward-looking statements contained in this presentation.
The information included in this presentation should be read in conjunction with our Transition Report on Form 10-Q for the transition quarter ended October 2, 2004 and the Annual Report on Form 10-K of Gold Kist Inc., a Georgia cooperative marketing association, for the fiscal year ended June 26, 2004 and subsequent reports filed with the Securities and Exchange Commission.
The term “Pro Forma EPS” in this presentation refers to earnings per share, assuming for each period that our conversion from a cooperative marketing association to a for profit corporation had taken place as of the beginning of the period indicated and that approximately 50.7 million shares of our common stock were outstanding during such entire period.
We have included certain information regarding our results of operations and components thereof that have been adjusted to exclude (i) gains and losses attributable to the curtailment of certain post-retirement benefit plans, (ii) certain expenses relating to our conversion from a cooperative marketing association to a for profit corporation and (iii) the loss arising out of our abandonment of our investment in Southern States Cooperative, Inc. We have included this information as we believe that investors may be interested in our results excluding these items as this is how our management analyzes our results from continuing operations.
“EBITDA” is defined as the sum of net income (loss) before interest, taxes, depreciation and amortization. “EBITDA—Adjusted” is defined as EBITDA, excluding the effect of certain items that management expects will be non-recurring. EBITDA and EBITDA—Adjusted are presented because they are used by us, and we believe they are frequently used by securities analysts, investors and other interested parties, in addition to and not in lieu of results computed under Generally Accepted Accounting Principles (GAAP), to compare the performance of companies. EBITDA and EBITDA—Adjusted are not measurements of financial performance under GAAP and should not be considered as alternatives to cash flow from operating activities or as measures
of liquidity or as alternatives to net income as indicators of our operating performance or any other measures of performance derived in accordance with GAAP.
November 16, 2004 2
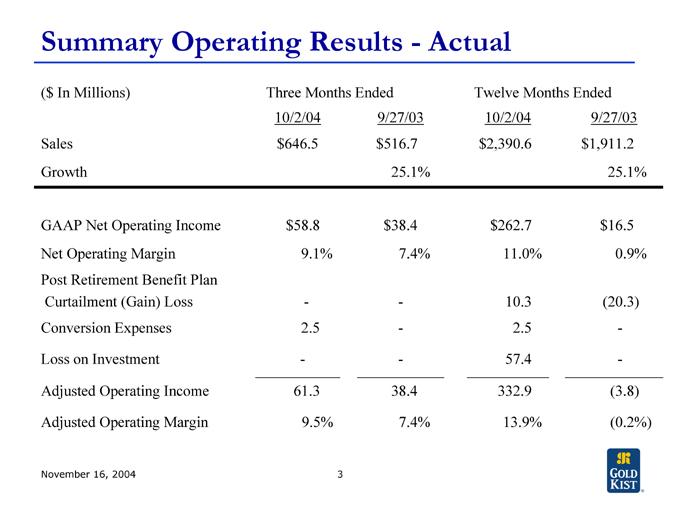
Summary Operating Results—Actual
($ In Millions) Three Months Ended Twelve Months Ended
10/2/04 9/27/03 10/2/04 9/27/03
Sales $646.5 $516.7 $2,390.6 $1,911.2
Growth 25.1% 25.1%
GAAP Net Operating Income $58.8 $38.4 $262.7 $16.5
Net Operating Margin 9.1% 7.4% 11.0% 0.9%
Post Retirement Benefit Plan
Curtailment (Gain) Loss - - 10.3 (20.3)
Conversion Expenses 2.5 - 2.5 -
Loss on Investment - - 57.4 -
Adjusted Operating Income 61.3 38.4 332.9 (3.8)
Adjusted Operating Margin 9.5% 7.4% 13.9% (0.2%)
November 16, 2004 3
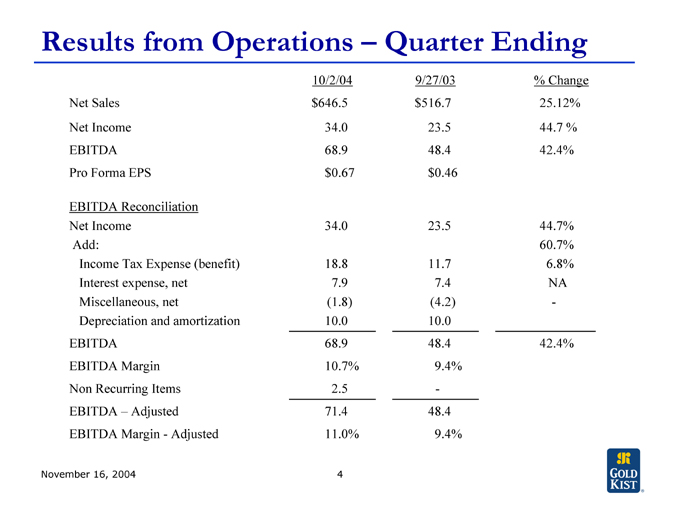
Results from Operations – Quarter Ending
10/2/04 9/27/03 % Change
Net Sales $646.5 $516.7 25.12%
Net Income 34.0 23.5 44.7 %
EBITDA 68.9 48.4 42.4%
Pro Forma EPS $0.67 $0.46
EBITDA Reconciliation
Net Income 34.0 23.5 44.7%
Add: 60.7%
Income Tax Expense (benefit) 18.8 11.7 6.8%
Interest expense, net 7.9 7.4 NA
Miscellaneous, net (1.8) (4.2) -
Depreciation and amortization 10.0 10.0
EBITDA 68.9 48.4 42.4%
EBITDA Margin 10.7% 9.4%
Non Recurring Items 2.5 -
EBITDA – Adjusted 71.4 48.4
EBITDA Margin - Adjusted 11.0% 9.4%
November 16, 2004 4
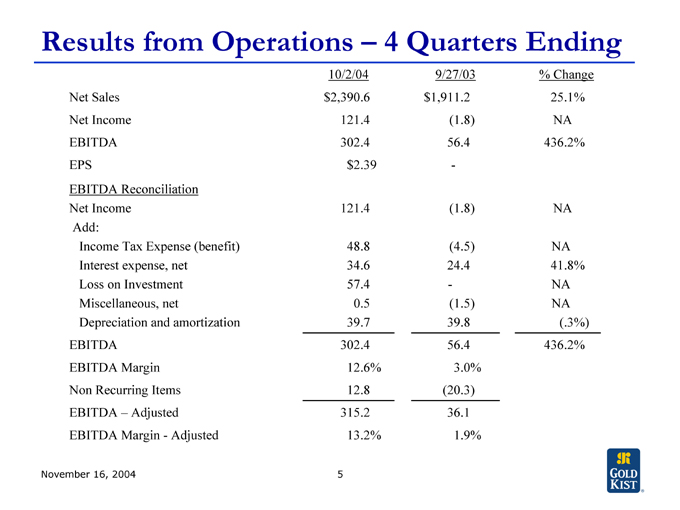
Results from Operations – 4 Quarters Ending
10/2/04 9/27/03 %Change
Net Sales $2,390.6 $1,911.2 25.1%
Net Income 121.4 (1.8) NA
EBITDA 302.4 56.4 436.2%
EPS $2.39 -
EBITDA Reconciliation
Net Income 121.4 (1.8) NA
Add:
Income Tax Expense (benefit) 48.8 (4.5) NA
Interest expense, net 34.6 24.4 41.8%
Loss on Investment 57.4 - NA
Miscellaneous, net 0.5 (1.5) NA
Depreciation and amortization 39.7 39.8 (.3%)
EBITDA 302.4 56.4 436.2%
EBITDA Margin 12.6% 3.0%
Non Recurring Items 12.8 (20.3)
EBITDA – Adjusted 315.2 36.1
EBITDA Margin - Adjusted 13.2% 1.9%
November 16, 2004 5
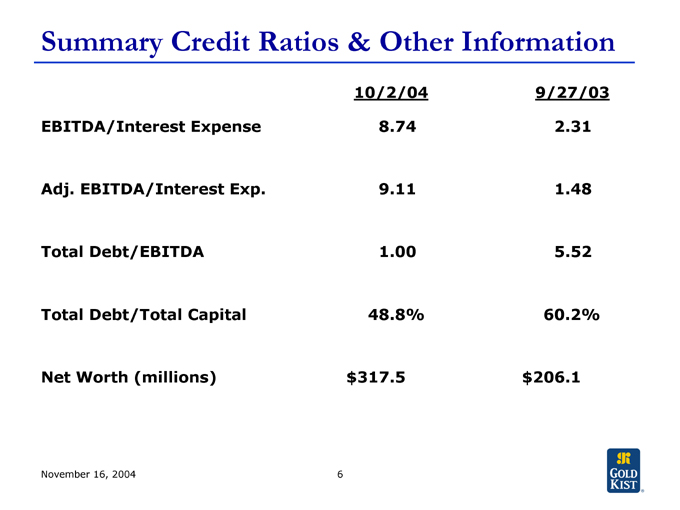
Summary Credit Ratios & Other Information
10/2/04 9/27/03
EBITDA/Interest Expense 8.74 2.31
Adj. EBITDA/Interest Exp. 9.11 1.48
Total Debt/EBITDA 1.00 5.52
Total Debt/Total Capital 48.8% 60.2%
Net Worth (millions) $ 317.5 $ 206.1
November 16, 2004 6