UNITED STATES
SECURITIES AND EXCHANGE COMMISSION
Washington, D. C.
FORM 10-K
| x | ANNUAL REPORT PURSUANT TO SECTION 13 OR 15(d) OF THE SECURITIES EXCHANGE ACT OF 1934 |
For the fiscal year ended October 1, 2005
OR
| ¨ | TRANSITION REPORT PURSUANT TO SECTION 13 OR 15(d) OF THE SECURITIES EXCHANGE ACT OF 1934 |
For the transition period from to
Commission File No. 000-50925
GOLD KIST INC.
(Exact name of registrant as specified in its charter)
| | |
| Delaware | | 20-1163666 |
| (State of Incorporation) | | (I.R.S. Employer Identification No.) |
| |
244 Perimeter Center Parkway, N. E. Atlanta, Georgia 30346 | | (770) 393-5000 |
| (Address of principal executive offices) | | (Telephone No.) |
| | |
| Securities registered pursuant to Section 12(b) of the Act: | | None |
| Securities registered pursuant to Section 12(g) of the Act: | | Common Stock, $0.01 par value (including rights to purchase shares of common stock or Series A Junior Participating Preferred Stock) |
Indicate by check mark if the registrant is a well-known seasoned issuer, as defined in Rule 405 of the Securities Act. Yes x No ¨
Indicate by check mark if the registrant is not required to file reports pursuant to Section 13 or Section 15(d) of the Exchange Act. Yes ¨ No x
Indicate by check mark whether the registrant (1) has filed all reports required to be filed by Section 13 or 15(d) of the Securities Exchange Act of l934 during the preceding 12 months (or for such shorter period that the registrant was required to file such reports), and (2) has been subject to such filing requirements for the past 90 days. Yes x No ¨
Indicate by check mark if disclosure of delinquent filers pursuant to Item 405 of Regulation S-K is not contained herein, and will not be contained to the best of Registrant’s knowledge in definitive proxy or information statements incorporated by reference in Part III of this Form 10-K or any amendment to this Form 10-K ¨.
Indicate by check mark whether the registrant is an accelerated filer (as defined in Rule 12b-2 of the Act). Yes x No ¨
Indicate by check mark if the registrant is a shell company (as defined in Rule 12b-2 of the Exchange Act). Yes ¨ No x
The aggregate market value of the outstanding common stock held by non-affiliates of the registrant as of April 2, 2005, the last business day of the registrant’s most recently completed second fiscal quarter (based on the closing price of $16.00 on April 1, 2005) was $803,338,368. There were 51,046,423 shares of voting common stock with a par value of $0.01 outstanding at December 6, 2005.
DOCUMENTS INCORPORATED BY REFERENCE
Portions of the Registrant’s Proxy Statement for the 2005 Annual Meeting of Stockholders are incorporated by reference into Part III thereof.
TABLE OF CONTENTS
i
CAUTIONARY STATEMENT REGARDING FORWARD-LOOKING STATEMENTS
The statements contained in this report regarding our future financial and operating performance and results, business strategy, market prices, future commodity price risk management activities, plans and forecasts and other statements that are not historical facts are forward-looking statements. We have based these forward-looking statements on our current assumptions, expectations and projections about future events.
We use the words “may,” “expect,” “anticipate,” “estimate,” “believe,” “continue,” “intend,” “should,” “would,” “could,” “plan” and other similar words to identify forward-looking statements. You should read statements that contain these words carefully because they discuss future expectations, contain projections of our results of operations or financial condition and/or state other “forward-looking” information. These statements may also involve risks and uncertainties that could cause our actual results of operations or financial condition to materially differ from our expectations in this report. A detailed discussion of these and other risks and uncertainties that could cause actual results and events to differ materially from such forward-looking statements is included in the section entitled “Risk Factors” beginning on page 8 of this report.
Any forward-looking statements in this report are based on certain assumptions and analyses made by us in light of our experience and perception of historical trends, current conditions, expected future developments and other factors that we believe are appropriate under the current circumstances. However, events may occur in the future that we are unable to accurately predict, or over which we have no control. Forward-looking statements are not a guarantee of future performance and actual results or developments may differ materially from expectations. You are therefore cautioned not to place undue reliance on such forward-looking statements. We do not intend to update any forward-looking statements contained in this report. When considering our forward-looking statements, also keep in mind the risk factors and other cautionary statements in this report.
PART I
Overview
We are the third largest integrated broiler company in the United States, accounting for over 9% of chicken, or broiler, meat produced in the United States in 2004. In addition, we believe we are the largest producer in terms of dollar volume of private label broiler products in the United States. We operate a fully-integrated broiler production, processing and marketing business. Our broiler production operations include nine broiler complexes located in Alabama, Florida, Georgia, North Carolina and South Carolina. Each complex operates in a different geographic region and includes pullet (young hens less than 26 weeks old grown as replacement hens for breeding) and breeder (hatching egg) flocks, broiler flocks, one or more hatcheries, one or more feed mills and one or more poultry processing plants. Three complexes also have rendering plants to process by-products.
For the fiscal year ended October 1, 2005, we produced and marketed approximately 3.3 billion pounds of ready-to-cook broiler products. Our broiler products include whole broilers, cut-up broilers, segregated broiler parts and further-processed products packaged in various forms, including fresh bulk ice pack, chill pack and frozen. We sell our products to over 3,000 customers in the retail, industrial, foodservice and export markets. Our registered trademarks include theGold Kist Farms,Young ‘n Tender,Early Bird,Dish in a Dash andMcEver’s brands. We are focusing our growth efforts on value added products, which include our further-processed products. Sales of our value added products represented approximately 52% of our sales in fiscal 2005. For the year ended October 1, 2005, our business generated total net sales of approximately $2.3 billion, net operating income of approximately $205.6 million and net income of approximately $112.2 million.
Industry
General
Prior to 1960, the U.S. poultry industry was highly fragmented with numerous small, independent breeders, growers and processors. The industry has consolidated during the last 40 years, resulting in a relatively small number of larger, more vertically integrated companies. In general, vertical integration of the U.S. poultry industry has led to increased operating cost efficiencies at each stage of the production process. We believe these cost efficiencies have had an adverse effect on less vertically integrated poultry producers, as they have been unable to realize the synergies benefiting their more integrated competitors.
U.S. Market Fundamentals
Broiler products currently are the most consumed meat in the United States, primarily due to growth in broiler consumption in the 1980s and 1990s. Such growth was primarily due to chicken’s distinctive attributes, including consistent quality, high versatility and perceived health benefits, which helped broiler meat gain a competitive edge over red meats and increase market share relative to beef and, to a lesser extent, pork.
Increased exports were also a key factor in the increased demand for chicken during recent decades. Broiler meat exports experienced an eight-fold increase from 1980 to 2000 and proved to be an important outlet for domestically undervalued chicken parts, specifically dark meat. Major export markets for U.S. broilers include Russia and other former Soviet republics, Hong Kong, Mexico, Japan and Canada. Total exports accounted for approximately 14% of overall U.S. broiler production in calendar 2004.
Industry Profitability
Profitability in the broiler industry is materially affected by the prices of feed ingredients and the prevailing market prices of broiler products. As a result, the broiler industry is subject to cyclical earnings fluctuations. For example, feed ingredient costs are dependent on a number of factors unrelated to the broiler industry. Small movements in feed ingredient costs may result in large changes in industry profits from fresh broiler products. By
comparison, feed costs are typically lower as a percentage of total costs in further-processed and prepared broiler products. As a result, increased sales of further-processed and prepared broiler products, as a percentage of total sales, by broiler producers should reduce to some extent the sensitivity of earnings to feed ingredient cost movements.
Chicken Products versus Other Meat Proteins
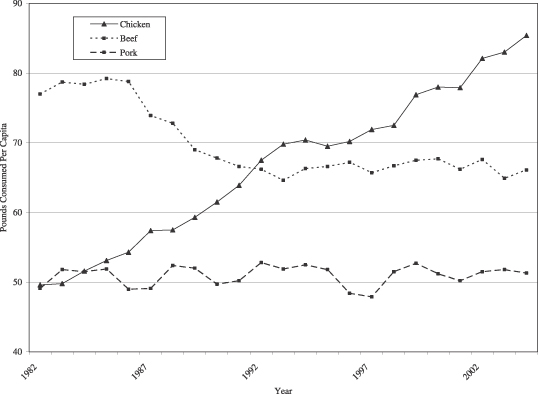
From 1982 to 2004, annual per capita consumption of chicken products in the United States increased approximately 67.3%, while annual per capita consumption of beef declined approximately 14.1% and annual per capita consumption of pork increased approximately 4.5%. The following chart illustrates, for the periods indicated, per capita consumption in pounds of chicken in the United States relative to beef and pork.
Consistent quality, high versatility and perceived health attributes have contributed to the rapid market penetration of chicken products in the last several decades, with marked improvements beginning in the 1980s. Chicken has significantly lower levels of fat and cholesterol in comparison with beef and pork. We believe U.S. consumers highly value these attributes and that they constitute an important factor guiding food purchasing decisions among health conscious consumers. This trend has also benefited from the shifting demographic mix as the U.S. population ages and becomes more health conscious.
Growth in chicken consumption has also been enhanced by new products and packaging which increase convenience and product versatility. These products include breast fillets, tenderloins and strips, formed nuggets and patties and bone-in parts, which are sold fresh, frozen and in various stages of preparation, including blanched, breaded and fully-cooked. Most of these products are targeted towards the foodservice market, which is comprised of chain restaurants, food processors, foodservice distributors and certain other institutions.
2
According to the National Chicken Council, an industry trade association, U.S. production of further-processed chicken products will increase from approximately 6.3 billion ready-to-cook pounds in 1992 to an estimated 18.1 billion ready-to-cook pounds in 2005. This product group is the fastest growing product group in the U.S. chicken industry, and the National Chicken Council estimates that the market share of this product group will increase from 30.0% of U.S. chicken production in 1992 to approximately 50% of such production in 2005.
Consumer preferences in the United States have become increasingly sophisticated, and include consistent quality, convenience and variety in the eating experience. Because of its intrinsic characteristics, mild flavor, ease of cooking and preparation and high versatility, we believe chicken is better suited to a host of applications, including both food manufacturing and foodservice, than competing meat proteins.
Chicken’s taste is well suited for marinating and makes broiler meat compatible with almost any kind of seasoning, sauce, taste-enhancer or flavor-modifier. In addition, chicken’s unique texture allows for considerable flexibility in the form of the final product. Furthermore, chicken cooks faster and more easily than beef and, especially, pork. We believe these distinctive characteristics have helped chicken gain a competitive advantage in terms of delivering innovative products in tune with consumers’ needs and expectations. Value-added and inventive chicken offerings include convenience-enhanced products, such as ready-to-eat and ready-to-cook entrees, flavor-improved items, such as marinated dishes, breaded products, such as nuggets, chicken fingers and popcorn chicken, Buffalo wings and patties.
General
Gold Kist, a Delaware corporation, is headquartered in Atlanta, Georgia. On October 13, 2004, we converted from a cooperative marketing association to a for-profit business corporation and completed our initial public offering of common stock. A substantial number of our former agricultural cooperative members continue to be contract growers for us.
Other Businesses
While 99% of our revenues for fiscal year 2005 were derived from our broiler production operations, we also have several smaller operations which account for less than 1% of our total net revenue in which we do business through subsidiaries and partnerships. Our pork group coordinates the production and marketing of hogs raised by contract growers in Alabama, Georgia and Mississippi. Our other operations include a captive insurance company to provide coverage for the retained losses within the deductibles of our auto liability, general liability and workers’ compensation coverage, an interest in a partnership that owns our headquarters building and a design, fabrication and installation firm primarily serving customers in the meat, poultry, chemical and wood products businesses with a focus on wastewater treatment systems.
Broiler Production
We are a vertically-integrated producer of fresh, frozen and further processed broiler products. Our broiler operation is organized into several divisions, each encompassing one or more of our broiler complexes. Each broiler complex operates within a separate geographical area and includes within that area broiler flocks, pullet and breeder (hatching egg) flocks, one or more hatcheries, a feed mill, poultry processing plant(s), management and accounting office(s) and transportation facilities. Through these complexes, we control the production of hatching eggs, hatching, feed manufacturing, growing, processing and packaging of our product lines.
Integration reduces costs by coordinating each stage of production. All stages are controlled to utilize resources and facilities at maximum efficiency. Integration practices not only improve cost efficiency but also permit the production of higher quality, more uniform birds. In addition, integration contracts are also desirable for growers, as the contracts shift market risk to the integrators. The integrator is also responsible for all processing and marketing activities. We believe these activities are crucial to the success of broiler production and require large scale and specialized expertise.
3
Breeding and Hatching
We maintain our own breeder flocks for the production of hatching eggs. Our breeder flocks are acquired as one-day old chicks (known as pullets) from primary breeding companies that specialize in the production of breeder stock. We maintain contracts with growers in connection with pullet farm operations for the grow-out of pullets (growing the pullet to the point at which it is capable of egg production, which takes approximately six months). Thereafter, we transport the mature breeder flocks to breeder farms that are operated and maintained by our contract growers. Eggs produced from these breeder flocks are transported to our hatcheries in our vehicles.
Growout
We place our chicks on growout farms, farms where broilers are grown to an age of approximately six to eight weeks. The farms provide us with sufficient housing capacity for our operations and are typically grower-owned farms operated under contract with us. The grower provides the housing and the growout equipment, such as feeders, waterers and brooders, as well as water, electricity, fuel, litter, management and labor. We provide the chicks, feed, necessary medication and technical advice and supervision to the growers. Our growers are compensated pursuant to an incentive formula designed to promote production cost efficiency. In addition, bonuses can be earned through lower mortality rates, the rate at which the broilers convert feed into body weight, or conversion rate, and/or through higher than average bird acceptance before processing. Conversely, payments to growers who perform worse than their peers on these measures are discounted.
Feed Mills
An important factor in the growout of broilers is the feed conversion rate. Principal raw materials used by us for the production of poultry include agricultural commodities such as corn and soybean meal utilized as feed ingredients. The quality and composition of the feed are critical to the conversion rate, and accordingly, we formulate and produce our own feed.
Feed grains are commodities subject to volatile price changes caused by weather, size of harvest, transportation and storage costs and the agricultural policies of the United States and foreign governments. Generally, we purchase our corn and other feed supplies at current prices from domestic suppliers, principally in the Midwestern United States. Feed grains are available from an adequate number of sources. Although we have not experienced, and do not anticipate problems in securing adequate supplies of feed grains, price fluctuations of feed grains will likely have a direct and material effect upon our profitability. The availability of feed ingredients at reasonable prices has been generally favorable for us because of the increased stocks of such commodities generated by large domestic crops in the last five years, although prices for such commodities increased in fiscal 2003 due to reduced domestic production. Soybean meal prices further significantly increased in fiscal 2004 due to stronger worldwide demand and reduced U.S. crops due to weather problems in grain producing areas. Increased worldwide corn and soybean production favorably impacted feed ingredient costs in fiscal 2005. Although we sometimes purchase grains in forward markets, such purchases do not eliminate the potentially adverse effect of feed grain price increases.
Processing
Once the chicks reach processing weight, they are transported to our processing plants. These plants use modern, highly automated equipment to process and package the broilers. We also have the capabilities to produce deboned and other further-processed products at some of our processing facilities.
Products
We produce an extensive line of chicken products as required by each of our customers in their respective markets. We have launched new and innovative value-added and further-processed products in close coordination with our retail and foodservice customers. All products not classified below as Value Added or Further-Processed Products are referred to as “fresh, frozen and minimally-processed” products.
4
The following table lists our chicken products:
| | | | |
Fresh, Frozen and Minimally Processed
| | Value Added
| | Further-Processed
|
| | |
• Fresh whole • Boneless • Leg quarters • Frozen • Other (edible parts for rendering) | | • Further-processed products • Portion controlled products • Marinated products • Chill pack products • Mechanically separated chicken | | • Fully-cooked products • Par-fried products • Individually quick frozen parts |
Our fresh, frozen and minimally processed products and certain of our value added products are produced at each of our plants. Our further-processed products are produced at our Sumter, South Carolina, Boaz, Alabama, and Russellville, Alabama plants.
The principal products we market are whole broilers, cut-up broilers, segregated broiler parts and further-processed products packaged in various forms, including fresh bulk ice pack, chill pack and frozen. Our ice pack chickens are packaged in ice or dry ice and sold primarily to distributors, grocery stores and quick serve chains. We produce and market our frozen chickens primarily to school systems, the U.S. military services, quick serve restaurant chains and foreign countries that participate in the U.S. export market. Our further-processed products, which include preformed breaded chicken nuggets and patties and deboned, skinless and marinated products are sold primarily to quick serve restaurant and grocery store chains. We produce and package chill pack chickens for retail sale and keep them chilled by mechanical refrigeration from the packing plant to the store counter. Our chill pack chicken is sold primarily under customers’ private labels and in certain localities under theGold Kist Farms andYoung ‘n Tender brand names. Most of our frozen chicken carries theGold Kist orEarly Bird brand names.
Sales and Marketing
Poultry products are marketed primarily from our corporate headquarters in Atlanta. Our products are sold nationally, although our sales are especially strong in the southeastern region of the United States. Our customers primarily consist of retail, foodservice, industrial and export customers.
Retail Customers
We are a major supplier to all but one of the top ten U.S. food retailers, as measured by fiscal 2005 sales. Our strengths in the retail market include our ability to serve any size customer, our southeastern U.S. location, which gives us access to a large portion of the U.S. population, and our ability to closely coordinate with our retail customers through our state-of-the-art warehouse management and inventory control system in Guntersville, Alabama.
Our retail products are sold to our customers under theGold Kist Farms brand name and under the private labels of certain U.S. supermarkets and other customers. Our retail sales consist principally of fresh and frozen whole and cut-up products, deboned products and further-processed products under theGold Kist Farms,Medallion,Big Value,Early Bird andMcEver’sbrand names.
Foodservice Customers
We are a major supplier to most major quick serve restaurant chains that use bone-in products. We provide a full line of fresh, frozen, partially- and fully-cooked products to meet the varied needs of our foodservice customers from quick serve restaurant chains to full service restaurants. We also sell our products to a diversified base of foodservice distributors and end-use customers, including the USDA School Lunch Program.
5
Industrial Customers
We are a major supplier to companies that further process chicken or use chicken as an ingredient in products that they manufacture. We believe our strengths in this “industrial” market include the breadth of our product line and our willingness to conduct research and development tailored to meet our customers’ specific needs.
Export Customers
We also export broiler products to Russia, Eastern Europe, Commonwealth of Independent States, Asia, the Pacific Rim, the Middle East, Africa, South and Central America, Mexico and the Caribbean Islands. Our product sales managers maintain sales networks overseas through contacts with independent dealers and customers. Our line of products for our export customers includes leg quarters, thighs, drum portions, large and jumbo paws, whole wings, mid-joints and tips, flippers/tips, drumettes, whole frozen chickens (with or without giblets), boneless items and cut-up chicken. Our export sales, which we define as sales other than to customers in the United States or Canada, were $137.6 million in fiscal 2005, $99.2 million in fiscal year 2004 and $56.4 million in fiscal year 2003.
Competition
The broiler industry is highly competitive and some of our competitors have greater financial and marketing resources than we do. In the United States, we compete principally with other vertically integrated broiler companies, but our broiler products compete with all meat proteins.
In general, the competitive factors in the U.S. poultry industry include price, product quality, product development, brand identification, breadth of product line and customer service. Competitive factors vary by major market. In the foodservice market, competition is based on consistent quality, product development, service and price. In the U.S. retail market, we believe that product quality, brand awareness, customer service and price are the primary bases of competition. In addition we compete with non-vertically integrated further processors in the U.S. prepared food business. However, we believe that we have significant, long-term cost and quality advantages over non-vertically integrated further processors.
We face competition for export sales from both domestic and foreign suppliers. In export poultry sales, we face competition from other major U.S. producers as well as companies in France, China, Thailand and Brazil. Tariff and non-tariff barriers to U.S. poultry established by the European Economic Community, or EEC, since 1962 have virtually excluded us and other U.S. poultry exporters from the EEC market. In addition, EEC exporters are aided in price competition with U.S. exporters in certain markets by subsidies from their governments. Continued restrictions placed by Russian authorities on the export of U.S. poultry to Russia beginning in March 2002 adversely impacted the export sales of domestic suppliers into fiscal 2003. In December 2003, Russia implemented import quotas on chicken and other meats that reduced U.S. broiler imports to approximately 70% of 2002 levels.
While the extent of the impacts of the elimination of tariffs and various bans and embargos are uncertain, we believe we are uniquely positioned to limit our relative exposure to fluctuating markets for two reasons. First, we have extensive export operations, yet we export proportionately fewer products than the industry overall. We exported approximately 12% by weight of our products in fiscal year 2005, while the industry as a whole exports approximately 15% by weight of its products. Second, our large size allows us to participate selectively in many international markets in order to limit exposure to any specific export market fluctuation.
Regulation and Environmental Matters
The poultry industry is subject to government regulation, particularly in the health and environmental areas, including provisions relating to the discharge of materials into the environment, by the USDA, the FDA and the
6
Environmental Protection Agency, or the EPA, in the United States and by similar governmental agencies in foreign countries to which we export our products. Our chicken processing facilities in the United States are subject to on-site examination, inspection and regulation by the USDA. The FDA inspects the production of our feed mills in the United States.
Processing plants, such as those we operate, are potential sources of emissions into the atmosphere and, in some cases, of effluent emissions into streams and rivers. On January 29, 1992, the EPA sent General Notice Letters designating us and several other companies as potentially responsible parties, or PRP’s, for alleged environmental contamination at an Albany, Georgia site we previously owned. We have responded to the General Notice Letter denying liability for the contamination. We are unable to estimate at this time our cost of compliance, if any, to be required for the location. We believe that our potential cost of compliance would not have a material effect on our financial condition or results of operations.
The Georgia Environmental Protection Division has listed the site of our former chemical blending facility in Cordele, Georgia on Georgia’s Hazardous Sites Inventory list under the state’s Hazardous Sites Response Act (“HSRA”) due to the presence of pesticide and other residue above regulatory standards. In 2004, the U.S. Environmental Protection Agency assumed control over the analysis and potential remediation of the Cordele property under the Resource Conservation and Recovery Act (“RCRA”). We sold this facility in 1985. Remediation may be required in the future to meet regulatory clean-up standards under RCRA or HSRA. Since the extent of the conditions at the site has not been completely defined at this time, we are unable to estimate cost of our compliance for this location. We believe that our potential cost of compliance will not have a material effect on our financial condition or results of operations.
In May of 2002, the EPA filed a lawsuit against a number of defunct former owners of an allegedly contaminated Superfund Site in Tifton, Georgia. In addition, the EPA has investigated several other parties, including us, with respect to the site. Settlement discussions with all parties began in April 2003. While we are unable to estimate our cost of settlement for this location, we believe that the potential cost of settlement or compliance would not have a material adverse effect on our financial condition or results of operations.
We anticipate increased regulation by the USDA concerning food safety, by the FDA concerning the use of medications in feed and by the EPA and various other state agencies concerning the disposal of chicken byproducts and wastewater discharges. Although we do not anticipate any regulations having a material adverse effect upon us, a material adverse effect may occur.
Avian Influenza
There has been much media attention recently regarding avian influenza (“AI”) that has occurred in certain parts of Asia and Eastern Europe. The version of AI that has received the media attention is the H5N1 high pathogenic Asian strain. There are currently no reported AI cases in commercial chicken in the United States, and the United States has never had an outbreak of the H5N1 high pathogenic Asian strain. There have been occurrences of low pathogenic AI in the United States in the past, but none of such low pathogenic AI strains are known to cause human illness.
Gold Kist chickens are raised in enclosed poultry houses that protect our chickens from contact with wild birds and other animals. As part of comprehensive biosecurity and disease prevention measures, poultry producers do not permit unauthorized visitors on their farms and take other appropriate precautions designed to prevent cross contamination between farms. If a confirmed case of any strain of AI were to occur, additional biosecurity measures would be implemented immediately as directed by USDA and by federal and state public health officials. To prevent these chickens from entering the food markets, Gold Kist would dispose of any infected flocks humanely and in an environmentally safe manner in total compliance with all governmental regulations. See “Risk Factors—Outbreaks of livestock diseases, particularly an outbreak of avian influenza among humans, could adversely affect our business.”
7
Employees
As of October 1, 2005, we had approximately 16,500 full-time employees. Our processing facilities operate year round without significant seasonal fluctuations in labor requirements. We have approximately 2,500 employees who are covered by collective bargaining agreements and approximately 575 employees who are members of unions. In our Live Oak, Florida processing plant, 214 employees are members of the United Food & Commercial Workers Union under a collective bargaining agreement that expires April 1, 2007. In our Athens, Georgia processing plant, 144 employees are members of the United Food & Commercial Workers Union with a current collective bargaining agreement expiring in October 2007. In our Carrollton, Georgia processing plant, 23 employees are members of the Bakery, Confectionary, Tobacco and Grain Millers Union with a current collective bargaining agreement expiring in September 2008. In our Guntersville, Alabama feed hauling facility, 35 employees are members of the International Brotherhood of Teamsters union with a current collective bargaining agreement expiring in February 2006. We consider our employee relations to be generally satisfactory.
Available Information
Our annual reports on Form 10-K, quarterly reports on Form 10-Q, current reports on Form 8-K, and amendments to those reports filed or furnished pursuant to Section 13(a) or 15(d) of the Exchange Act are available through our website,www.goldkist.com, free of charge as soon as reasonably practicable after electronically filing such material with the SEC. For more information, please visitwww.goldkist.com.
Industry cyclicality, especially fluctuations in the supply of broiler products, affects the prevailing market price of broiler products, our sales and our earnings.
Profitability in the broiler industry is materially affected by the prevailing price of broiler products, which is primarily determined by supply and demand factors in the market. In recent years, the profitability of companies in the broiler industry has been adversely affected from time to time by excess supplies of broiler products in the market. As a result of the efficiencies in the U.S. broiler market, even modest increases in the broiler supply in the United States can significantly decrease the market prices at which we can sell our broiler products. Such increases in domestic supply can arise as a result of unanticipated decreases in export demand, among other reasons. Given the perishable nature of broiler products, we are unable to manage inventories to address any short-term changes in market prices. As a result, from time to time we are forced to sell our broiler products at a loss. Because we sell a relatively small percentage of our products under fixed-price contracts, increases in the overall supply of broiler products and any related decrease in broiler prices adversely affect our operating results. This has resulted and will continue to result in fluctuations in our earnings. Market prices for broiler products reached their highest levels since 1999 during our 2004 fiscal year, but have declined during fiscal 2005.
Fluctuations in commodity prices of feed ingredients materially affect our earnings.
A significant portion of the cost of producing our broiler products consists of amounts spent in connection with purchasing corn and soybean meal, our primary feed ingredients. As a result, fluctuations in feed ingredient prices materially affect our earnings. While prices of these items increase from time to time, we may not be able to pass through any increase in the cost of feed ingredients to our customers. High feed ingredient prices have had a material adverse effect on our operating results in the past. We periodically seek, to the extent available, to enter into advance purchase commitments or commodity futures contracts for the purchase of a portion of our feed ingredients in an effort to manage our feed ingredient costs. However, the use of such instruments may not be successful in limiting our exposure to market fluctuations in the cost of feed and may limit our ability to benefit from favorable price movements.
Furthermore, the production of feed ingredients is positively or negatively affected by weather patterns throughout the world, the global level of supply inventories and demand for feed ingredients, the availability and
8
cost of transportation, as well as the agricultural policies of the United States and foreign governments. In particular, weather patterns often change agricultural conditions in an unpredictable manner. A sudden and significant change in weather patterns could affect the supply of feed ingredients, as well as both the industry’s and our ability to obtain feed ingredients, grow broilers and deliver products. Any such change would have a material negative impact on our business and results of operations. See “Management’s Discussion and Analysis of Consolidated Results of Operations and Financial Condition.”
Significant competition in the broiler industry with other vertically integrated broiler companies, especially companies with greater resources, may make us unable to compete successfully in this industry, which would adversely affect our business.
The broiler industry is highly competitive. Some of our competitors have greater financial and marketing resources than we do. In general, the competitive factors in the U.S. broiler industry include price, product quality, brand identification, breadth of product line and customer service. Competitive factors vary by major market. In the foodservice market, we believe competition is based on consistent quality, product development, customer service and price. In the U.S. retail market, we believe that competition is based on product quality, brand awareness, customer service and price. We also face competition from non-vertically integrated further processors with regard to our further-processed products. The highly competitive conditions in the broiler industry could force us to reduce prices for our products, which would adversely affect our results of operations and financial condition.
The loss of one of our large customers could have a material adverse effect on our results of operations.
Sales to our top ten customers represented approximately 37.73% of our net sales during fiscal 2005 and during such period, approximately 12.25% of our net sales were to our largest customer. We do not have long-term contracts with any of our major customers and, as a result, any of our major customers could significantly decrease or cease their business with us with limited or no notice. If we lost one or more of our major customers, or if one or more of our major customers significantly decreased its purchases from us, our business, sales and results of operations could be materially and adversely affected.
Foreign embargos, decreased export demand, oversupply of broiler products and competing products and bans on exported chicken and livestock would have an adverse effect on our business.
We are an exporter to Russia, Eastern Europe, Commonwealth of Independent States, Asia, the Pacific Rim, the Middle East, Africa, South and Central America, Mexico and the Caribbean Islands. Any decrease in exports to foreign countries based on embargos, decreased demand, oversupply of broiler products or competing products or bans on exported chicken may have an adverse effect on our ability to export chicken and other products. Such occurrences would also likely increase the supply of broilers and competing products in the United States, which would likely result in lower prices for broiler products and could adversely affect our business. For example, in 2002 and 2003, export sales to Russia declined due to an embargo on certain imported meats, leading to a domestic oversupply and a decrease in the market price of chicken. Russia has implemented import quotas on chicken and other meats that reduce U.S. broiler imports to approximately 70% of 2002 levels. In addition, for several months in 2004, China, Japan and several smaller chicken importing countries banned all imports of broiler products from the United States due to several chickens in Delaware and Texas testing positive for avian influenza. Also as a result of this event, Russia and Hong Kong banned the import of broiler products from Delaware and Texas for a period of time. Any implementation of similar bans in the future or the implementation of quotas or other import restrictions would adversely affect our domestic and export sales and our results of operations.
We have been, and may in the future be, subject to claims and liabilities under environmental, health, safety and other laws and regulations, which could be significant.
Our operations are subject to various federal, state, local and foreign environmental, health, safety and other laws and regulations, including those governing air emissions, wastewater discharges and the use, storage,
9
treatment and disposal of hazardous materials. The applicable requirements under these laws are subject to amendment, to the imposition of new or additional requirements and to changing interpretations by governmental agencies or courts. In addition, we anticipate increased regulation by various governmental agencies concerning food safety, the use of medication in feed formulations, the disposal of animal by-products and wastewater discharges. Furthermore, business operations currently conducted by us or previously conducted by others at real property owned or operated by us, business operations of others at real property formerly owned or operated by us and the disposal of waste at third party sites expose us to the risk of claims under environmental, health and safety laws and regulations. For example, we have received notice letters designating us as a potentially responsible party for alleged environmental contamination at a site that we previously owned. Other properties we own or owned in the past have been designated for cleanup under federal and state environmental remediation statutes, which could result in further liabilities to us. In addition, we are subject to potential claims for residual environmental liabilities arising out of our sale of our Agri-Services business in 1998. The agreements related to our disposition of certain properties require that we indemnify the buyer of such properties with regard to any associated environmental liabilities. We could incur material costs or liabilities in connection with claims related to any of the foregoing. The discovery of presently unknown environmental conditions, changes in environmental, health, safety and other laws and regulations, enforcement of existing or new laws and regulations and other unanticipated events could give rise to expenditures and liabilities, including fines or penalties, that could have a material adverse effect on our business, operating results and financial condition.
If our products become contaminated, we may be subject to product liability claims and product recalls.
Our products may be subject to contamination by disease producing organisms, or pathogens, such as Listeria monocytogenes, Salmonella and generic E. coli. These pathogens are found generally in the environment and, therefore, there is a risk that they, as a result of food processing, could be present in our processed products. These pathogens can also be introduced to our products as a result of improper handling at the further processing, foodservice or consumer level. These risks may be controlled, but may not be eliminated, by adherence to good manufacturing practices and finished product testing. We have little, if any, control over proper handling procedures once our products have been shipped for distribution. Even if a product is not contaminated when it leaves our facility, illness and death may result if the pathogens are not also eliminated at the further processing, foodservice or consumer level. Increased sales of further-processed products could lead to increased risks in this area. Even an inadvertent shipment of contaminated products is a violation of law and may lead to increased risk of exposure to product liability claims, product recalls (which may not entirely mitigate the risk of product liability claims) and increased scrutiny by federal and state regulatory agencies and may have a material adverse effect on our business, reputation and prospects.
Outbreaks of livestock diseases, particularly an outbreak of avian influenza among humans, could adversely affect our business.
Events beyond our control, such as the outbreak of disease, could significantly restrict our ability to conduct our operations and adversely affect our business. An outbreak of disease could result in governmental restrictions on the import and export of our fresh broiler products, pork or other products to or from our suppliers, facilities or customers, or require us to destroy one or more of our flocks. This could result in the cancellation of orders by our customers and create adverse publicity that may have a material adverse effect on our ability to market our products successfully and on our business, reputation and prospects. For example, because several chickens in Delaware and Texas tested positive for avian influenza in 2004, several countries imposed import bans and the infected flocks were destroyed. If a similar outbreak were to occur in areas where our contract growers are located, we may be forced to destroy our flocks, even if those flocks were not infected. See “—Foreign embargos, decreased export demand, oversupply of broiler products and competing products and bans on exported chicken and livestock would have an adverse effect on our business.”
These risks are particularly acute if an outbreak of a livestock disease, such as avian influenza, were to occur among humans. Although avian influenza is not spread through the consumption of chicken, increased media attention regarding the risks of avian influenza or consumer panic in the event of a serious outbreak of
10
avian influenza among humans could result in reduced demand for our products. In addition, the risk of an avian influenza outbreak among humans or the perceived risk of such an outbreak could result in aggressive action by the governments of the United States and the countries to which we export our products to limit the spread of such an outbreak. Government action in response to an avian influenza outbreak among humans could adversely affect our ability to export our products and impose burdensome regulations on our operations or those of our contract growers, which would in turn increase our costs of doing business.
Increased water, energy and gas costs would increase our expenses and reduce our profitability.
We require a substantial amount, and as we expand our business we will require additional amounts, of water, electricity and natural gas to produce and process our broiler products. The prices of water, electricity and natural gas fluctuate significantly over time, and prices for natural gas have recently been at historically high levels, partially due to supply disruptions caused by Hurricanes Katrina and Rita. One of the primary competitive factors in the U.S. broiler market is price, and we may not be able to pass on increased costs of production to our customers. As a result, increases in the cost of water, electricity or natural gas could substantially harm our business and results of operations.
Increased costs of transportation would negatively affect our profitability.
Our transportation costs are a material portion of the cost of our products. We primarily ship our products and receive our inputs via truck and rail and rely on third party transportation companies for the delivery of most of our products and inputs. The costs associated with the transportation of our products and inputs fluctuate with the price of fuel, the costs to our transportation providers of labor and the capacity of our transportation sources. Increases in costs of transportation would negatively affect our profitability.
We are exposed to risks relating to product liability, product recalls, property damage and injury to persons for which insurance coverage is expensive, limited and potentially inadequate.
Our business operations entail a number of risks, including risks relating to product liability claims, product recalls, property damage and injury to persons. Insurance for these risks is expensive and difficult to obtain, and we may not be able to maintain this insurance in the future on acceptable terms, in amounts sufficient to protect us against losses due to any such events or at all. Moreover, our insurance coverage may not adequately protect us from all of the liabilities and expenses that we incur in connection with such events. If we were to suffer a loss that is not adequately covered by insurance, our results of operations and financial condition would be adversely affected.
Any acquisition we make could disrupt our business and harm our financial condition.
We may seek to expand our business through the acquisition of companies, technologies, products and services from others. Acquisitions may involve a number of problems, including:
| | • | | difficulty integrating acquired technologies, operations and personnel with our existing business; |
| | • | | diversion of management attention in connection with negotiating acquisitions and integrating the businesses acquired; |
| | • | | exposure to unforeseen liabilities of acquired companies; and |
| | • | | the need to obtain additional debt financing for any acquisition. |
We may not be able to address these problems and successfully develop these acquired companies or businesses into profitable units of Gold Kist.
The loss of key members of our management may adversely affect our business.
We believe our continued success depends on the collective abilities and efforts of our senior management. We do not maintain key person life insurance policies on any of our employees. The loss of one or more key personnel
11
could have a material adverse effect on our results of operations. Additionally, if we are unable to find, hire and retain needed key personnel in the future, our results of operations could be materially and adversely affected.
The inability to maintain good relations with our employees could adversely affect our business.
As of October 1, 2005, we had approximately 16,500 employees, approximately 2,500 of which are covered by collective bargaining agreements and approximately 575 of which are members of labor unions. We may be unable to maintain good relationships with these labor unions or to successfully negotiate new collective bargaining agreements on satisfactory terms in the future. If we fail to maintain good relationships with our employees generally or with such labor unions or fail to negotiate satisfactory collective bargaining agreements, or if non-unionized operations were to become unionized, we could face labor strikes or work stoppages or other activity that could adversely affect our business and operations. Additionally, an employee has filed an action claiming violations of the Fair Labor Standards Act based upon our failure to pay employees for all hours worked by not including time spent donning and doffing specialized protective gear. The plaintiff has filed the lawsuit as an opt-in collective action under the Fair Labor Standards Act, claiming that an unspecified number of allegedly “similarly situated” employees and former employees should be permitted to join together with the employee to pursue this lawsuit as a collective action against us. Although we intend to defend this lawsuit vigorously, an adverse outcome could increase our cost of doing business.
The Public Health Security and Bioterrorism Preparedness and Response Act of 2002 could increase our costs of doing business.
The Public Health Security and Bioterrorism Preparedness and Response Act of 2002, which we refer to as the Bioterrorism Act, includes a number of provisions designed to help guard against the threat of bioterrorism, including new authority for the Secretary of Health and Human Services to take action to protect the nation’s food supply against intentional contamination. The U.S. Food and Drug Administration, or FDA, is responsible for developing and implementing these food safety measures. The FDA has been in the process of issuing new rules, and it is difficult for us to predict what impact they might have on our business. Compliance with these rules may increase our costs of doing business by increasing the amounts that we spend on plant security and product safety. If we are unable to pass these higher costs on to our customers, our results of operations and financial condition may be adversely affected.
| Item 1B. | Unresolved Staff Comments. |
None.
We operate poultry processing plants located in Boaz, Russellville and Guntersville, Alabama; Athens, Douglas, Ellijay and Carrollton, Georgia; Live Oak, Florida; Sumter, South Carolina; and Sanford and Siler City, North Carolina. These plants have an aggregate weekly processing capacity of approximately 14.4 million broilers. Our plants are supported by hatcheries located at Albertville, Crossville, Cullman, Curry, Ranburne, Russellville and Scottsboro, Alabama; Blaine, Bowdon, Calhoun, Commerce, Carrollton, Douglas and Talmo, Georgia; Live Oak, Florida; Siler City and Staley, North Carolina; and Sumter, South Carolina. These hatcheries have an aggregate weekly capacity (assuming 85% hatch) of approximately 15.3 million chicks. Additionally, we operate eleven feed mills to support our poultry operations. The mills have an aggregate annual capacity of approximately 4.7 million tons and are located in Guntersville and Pride, Alabama; Ambrose, Calhoun, Commerce, and Waco, Georgia; Live Oak, Florida; Sumter, South Carolina; and Bonlee and Staley, North Carolina.
We operate five separate distribution centers for the sale and distribution of our poultry products. These centers are located in Tampa, Pompano Beach and Crestview, Florida; Nashville, Tennessee; and Cincinnati, Ohio.
12
Our corporate headquarters building, completed in 1975 and containing approximately 260,000 square feet of office space, is located on fifteen acres of land at 244 Perimeter Center Parkway, N.E., Atlanta, Georgia. The land and building are owned by a partnership of which Cotton States Mutual Insurance Company, a subsidiary of Country Insurance and Financial Services, owns 46% of the equity and we own 54% of the equity. We lease approximately 95,000 square feet of the building from the partnership.
We own all of our facilities, except for our headquarters building, the lease on which expires in April 2010. We also lease our poultry distribution facilities in Tampa, Florida and Nashville, Tennessee under leases that expire in May 2010 and December 2006, respectively, and our poultry hatchery facility in Crossville, Alabama under a lease that expires in February 2088.
| Item 3. | Legal Proceedings. |
In addition to the matters set forth below, we are subject to various other legal proceedings and claims which arise in the ordinary course of business. In the opinion of management, the amount of ultimate liability with respect to these actions will not materially affect our financial position or results of operations.
Ronald Hughes Gaston v. Gold Kist Inc. On February 18, 2004, the plaintiff, who was terminated by Gold Kist as a hatching egg producer, filed a purported class action lawsuit against us in the U.S. District Court for the Northern District of Alabama (Case number CV-04-J-0326-NW). Plaintiff also named four additional chicken-processing firms as defendants. The plaintiff asserted that the defendants conspired to prevent competition for production contracts and sought to represent a putative class of all contract farmers and sellers of hatching eggs and live broilers who produced hatching eggs or live broilers in the United States since February 23, 1998. The plaintiff dismissed the action in July 2005.
Cody, et al v. Gold Kist et al.Four female employees of our Corporate Office Information Services Department, or Corporate I/S Department, filed a sex discrimination suit against Gold Kist in the United States District Court for the Northern District of Georgia asserting gender based claims about employment and promotion decisions in the Corporate I/S Department. The four complainants sought class certification for their claims of gender discrimination, unspecified monetary damages and injunctive relief. The U.S. District Court, in an order entered June 13, 2005, denied the motion of the plaintiffs to certify the litigation as a class action. The court’s ruling, for which the plaintiffs did not seek an interlocutory appeal, means that the litigation will not proceed as a class action and will be litigated as individual claims of the four named plaintiffs. We continue to intend to defend the litigation vigorously.
Nicholas Leech v. Gold Kist Inc.On November 3, 2005, an employee of the Company filed the case ofNicholas Leech v. Gold Kist Inc., in the United States District Court for the Northern District of Alabama claiming that we had violated certain provisions of the Fair Labor Standards Act, or FLSA. The suit alleges that we failed to pay the Plaintiff for time he has spent (i) waiting in line before each shift to receive certain clothing and equipment that he wears while working, (ii) putting on that clothing and equipment, and (iii) taking off the clothing and equipment, and turning it back in, after each shift ends. The plaintiff is seeking an unspecified amount of unpaid overtime wages allegedly earned, plus liquidated damages in the same amount, plus attorneys’ fees, costs and interest. The plaintiff has filed the lawsuit as an opt-in collective action under the FLSA, claiming that an unspecified number of allegedly “similarly situated” employees should be permitted to join together with him to pursue this lawsuit as a collective action against us. The proposed class would consist of any and all persons employed as hourly employees by us at any time during the three years preceding the filing of the plaintiff’s complaint. We believe we have substantial defenses to the claims made in theLeech lawsuit and intend to defend the case vigorously. At this point, however, neither the likelihood of the outcome nor the amount of ultimate liability, if any, can be determined.
| Item 4. | Submission of Matters to a Vote of Security Holders. |
No matter was submitted during the fourth quarter of the fiscal year covered by this report to a vote of security holders.
13
PART II
| Item 5. | Market for Registrant’s Common Equity, Related Stockholder Matters and Issuer Purchases of Equity Securities. |
Market Information
Our common stock, $0.01 par value per share (the “Common Stock”), is traded on the Nasdaq National Market under the symbol GKIS. The chart below sets forth the high and low closing prices for each quarter of our last completed fiscal year, during which time our Common Stock was traded on the Nasdaq National Market.
| | | | | | |
Quarter Ended
| | High
| | Low
|
October 7, 2004 (1) | | $ | 11.40 | | $ | 11.40 |
January 1, 2005 | | $ | 14.14 | | $ | 11.00 |
April 2, 2005 | | $ | 17.13 | | $ | 13.26 |
July 2, 2005 | | $ | 23.21 | | $ | 13.78 |
October 1, 2005 | | $ | 23.36 | | $ | 16.63 |
| (1) | First date on which our stock was traded. |
Dividend Policy
We have not declared any cash dividends on our common stock since our conversion to a corporation in October 2004, and our Board of Directors does not presently intend to pay cash dividends in the future on our common stock. We currently intend to retain all of our earnings in the foreseeable future to finance the operation and expansion of our business. Additionally, some of our indebtedness currently restricts our ability to declare or pay any dividends on our common stock. See “Management’s Discussion and Analysis of Financial Condition and Results of Operations—Liquidity and Capital Resources.” Our future dividend policy will also depend on the requirements of any future financing arrangements to which we may be a party and other factors considered relevant by our Board of Directors.
Stockholder Information
On December 8, 2005, there were approximately 1,775 holders of record of our common stock.
Issuer Purchases of Equity Securities.
None.
14
| Item 6. | Selected Financial Data |
SELECTED HISTORICAL CONSOLIDATED FINANCIAL DATA
The following table sets forth certain selected consolidated financial data as of and for the fiscal years ended June 30, 2001, June 29, 2002, June 28, 2003, June 26, 2004, the three month transition quarter ended October 2, 2004, and the fiscal year ended October 1, 2005. The selected consolidated financial data for the fiscal years ended June 28, 2003, June 26, 2004, the transition quarter ended October 2, 2004, and the fiscal year ended October 1, 2005 and as of June 26, 2004 and October 1, 2005 were derived from our audited consolidated financial statements included elsewhere in this report. The selected consolidated financial data for the fiscal years ended June 30, 2001 and June 29, 2002 and as of June 30, 2001, June 29, 2002 and June 28, 2003 were derived from our audited consolidated financial statements not included in this report. This selected financial data should be read in conjunction with, and is qualified in its entirety by reference to, “Management’s Discussion and Analysis of Financial Condition and Results of Operations,” and our consolidated financial statements and related notes included elsewhere in this report.
| | | | | | | | | | | | | | | | | | | | |
| | | Fiscal Years Ended
| | | Transition
Quarter
Ended
| | | Fiscal Year
Ended
| |
| | | June 30,
2001
| | | June 29,
2002
| | | June 28,
2003
| | | June 26,
2004
| | | October 2,
2004 (7)
| | | October 1,
2005 (7)
| |
| | | (in thousands) | |
Statement of Operations Data: | | | | | | | | | | | | | | | | | | | | |
Net sales | | $ | 1,810,755 | | | 1,863,828 | | | 1,855,126 | | | 2,260,728 | | | 646,511 | | | | 2,304,262 | |
Cost of sales | | | 1,690,437 | | | 1,706,582 | | | 1,813,106 | | | 1,899,395 | | | 554,142 | | | | 1,984,178 | |
| | |
|
|
| |
|
| |
|
| |
|
| |
|
| |
|
|
|
Gross profit | | | 120,318 | | | 157,246 | | | 42,020 | | | 361,333 | | | 92,369 | | | | 320,084 | |
Distribution, administrative and general expenses (including $9.8 million of share-based compensation expense for fiscal year 2005) | | | 88,507 | | | 87,486 | | | 81,859 | | | 108,772 | | | 31,011 | | | | 112,177 | |
Benefit plans curtailment (gains) (1) | | | (33,727 | ) | | — | | | (20,257 | ) | | — | | | — | | | | — | |
Pension plan settlement loss (1) | | | — | | | — | | | — | | | 10,288 | | | — | | | | 906 | |
Conversion expenses (6) | | | — | | | — | | | — | | | — | | | 2,522 | | | | 1,418 | |
| | |
|
|
| |
|
| |
|
| |
|
| |
|
| |
|
|
|
Net operating income (loss) | | | 65,538 | | | 69,760 | | | (19,582 | ) | | 242,273 | | | 58,836 | | | | 205,583 | |
Other income (expenses): | | | | | | | | | | | | | | | | | | | | |
Interest and dividend income | | | 11,328 | | | 9,426 | | | 2,283 | | | 1,550 | | | 635 | | | | 5,906 | |
Interest expense | | | (39,996 | ) | | (27,962 | ) | | (24,968 | ) | | (29,349 | ) | | (8,514 | ) | | | (23,619 | ) |
Gain on sale of marketable equity security and other investments (2) | | | — | | | 15,578 | | | — | | | — | | | — | | | | — | |
Debt prepayment interest and write-off of related fees and discount | | | — | | | — | | | — | | | (6,341 | ) | | — | | | | (16,186 | ) |
Loss on investments (3) | | | — | | | — | | | (24,064 | ) | | (57,364 | ) | | — | | | | (2,500 | ) |
Equity in earnings of affiliate (4) | | | 10,048 | | | — | | | — | | | — | | | — | | | | — | |
Miscellaneous, net | | | (241 | ) | | 2,882 | | | (2,428 | ) | | 1,942 | | | 1,833 | | | | 4,653 | |
| | |
|
|
| |
|
| |
|
| |
|
| |
|
| |
|
|
|
Total other expenses, net | | | (18,861 | ) | | (76 | ) | | (49,177 | ) | | (89,562 | ) | | (6,046 | ) | | | (31,746 | ) |
| | |
|
|
| |
|
| |
|
| |
|
| |
|
| |
|
|
|
Income (loss) from continuing operations before income taxes | | | 46,677 | | | 69,684 | | | (68,759 | ) | | 152,711 | | | 52,790 | | | | 173,837 | |
Income tax expense (benefit) | | | 13,397 | | | 22,055 | | | (17,307 | ) | | 41,817 | | | 18,772 | | | | 61,591 | |
| | |
|
|
| |
|
| |
|
| |
|
| |
|
| |
|
|
|
Income (loss) from continuing operations | | | 33,280 | | | 47,629 | | | (51,452 | ) | | 110,894 | | | 34,018 | | | | 112,246 | |
Loss on discontinued operations (5) | | | (214 | ) | | (13,543 | ) | | — | | | — | | | — | | | | — | |
| | |
|
|
| |
|
| |
|
| |
|
| |
|
| |
|
|
|
Net income (loss) | | $ | 33,066 | | | 34,086 | | | (51,452 | ) | | 110,894 | | | 34,018 | | | | 112,246 | |
| | |
|
|
| |
|
| |
|
| |
|
| |
|
| |
|
|
|
Basic net income per share (6) | | | — | | | — | | | — | | | — | | | — | | | $ | 2.24 | |
Diluted net income per share (6) | | | — | | | — | | | — | | | — | | | — | | | $ | 2.22 | |
Basic weighted average common shares outstanding (6) | | | — | | | — | | | — | | | — | | | — | | | | 49,999 | |
Diluted weighted average common shares outstanding (6) | | | — | | | — | | | — | | | — | | | — | | | | 50,636 | |
15
| | | | | | | | | | | | | | | | | | | |
| | | Fiscal Years Ended
| | | Transition
Quarter
Ended
| | | Fiscal Year
Ended
| |
| | | June 30,
2001
| | | June 29,
2002
| | | June 28,
2003
| | | June 26,
2004
| | | October 2,
2004 (7)
| | | October 1,
2005 (7)
| |
| | | (in thousands) | |
Other Data: | | | | | | | | | | | | | | | | | | | |
Net cash provided by (used in) operating activities | | $ | 71,940 | | | 68,000 | | | (35,275 | ) | | 218,681 | | | 75,692 | | | 177,642 | |
Net cash provided by (used in) investing activities | | | (32,782 | ) | | 45,229 | | | (27,040 | ) | | (37,563 | ) | | (23,814 | ) | | (70,677 | ) |
Net cash provided by (used in) financing activities | | | (36,490 | ) | | (115,571 | ) | | 64,344 | | | (55,445 | ) | | (13,288 | ) | | (128,693 | ) |
Depreciation and amortization (including amortization of share-based compensation) | | | 42,747 | | | 39,071 | | | 39,495 | | | 39,592 | | | 10,030 | | | 52,939 | |
Capital expenditures | | | 33,495 | | | 38,899 | | | 34,651 | | | 42,210 | | | 25,160 | | | 80,760 | |
Balance Sheet Data: | | | | | | | | | | | | | | | | | | | |
Cash and cash equivalents | | $ | 11,339 | | | 8,997 | | | 11,026 | | | 136,699 | | | 175,289 | | | 153,561 | |
Working capital | | | 121,087 | | | 159,959 | | | 210,227 | | | 345,245 | | | 347,904 | | | 324,301 | |
Working capital, excluding current maturities of debt | | | 242,220 | | | 185,585 | | | 232,389 | | | 366,412 | | | 368,779 | | | 325,819 | |
Total assets | | | 870,056 | | | 789,529 | | | 762,047 | | | 885,857 | | | 922,842 | | | 925,689 | |
Total debt | | | 387,418 | | | 276,270 | | | 346,173 | | | 304,121 | | | 302,283 | | | 145,232 | |
Total patrons’ and other equity/stockholders’ equity | | | 272,550 | | | 283,161 | | | 183,897 | | | 284,615 | | | 317,548 | | | 450,728 | |
| (1) | In January 2001, we substantially curtailed our postretirement medical benefit plan for current employees. In October 2002, we substantially curtailed our postretirement supplemental life insurance plan. In April 2003, we substantially curtailed our postretirement medical plan for existing retirees. Gold Kist recognized pension settlement expense in fiscal 2004 and fiscal 2005. The pension settlement expense resulted from lump sum distribution payments from the plans to electing retiring employees exceeding service and interest cost components of pension expense in the plan year. See Note 8 of Notes to Consolidated Financial Statements. |
| (2) | During fiscal 2002, we sold our marketable equity security, our investment in an interregional fertilizer cooperative and other investments realizing total proceeds of $64.6 million and a gain before income taxes of $15.6 million. |
| (3) | In October 1998, Gold Kist completed the sale of assets of the Agri-Services segment business to Southern States Cooperative, Inc., or SSC. In connection with the transaction, Gold Kist purchased from SSC $60.0 million principal amount of capital trust securities and $40.0 million principal amount of cumulative preferred securities for $98.6 million in October 1999. In October 2002, SSC notified Gold Kist that, pursuant to the provisions of the indenture under which Gold Kist purchased the capital trust securities, SSC would defer the capital trust securities’ quarterly interest payment due on October 5, 2002. Quarterly interest payments for subsequent quarters were also deferred. As a result of the deferral of the interest payments, Gold Kist reduced the carrying value of the capital trust securities by $24.1 million with a corresponding charge against the loss from continuing operations for fiscal 2003. |
As of December 31, 2003, SSC’s total stockholders’ and patrons’ equity fell below Gold Kist’s carrying value of the preferred stock investment, which Gold Kist believed was a triggering event indicating impairment. We recorded an “other-than-temporary” impairment charge of $18.5 million, which was reflected as a loss on investment within other expenses. In June 2004, Gold Kist notified SSC that it was abandoning the investment and returned the securities. As a result of the abandonment, the remaining investment balance of $38.9 million was written off and reflected as a loss on investment within other expenses in the consolidated statement of operations for fiscal 2004. The write down of an investment in fiscal 2005 represents an investment in a supply cooperative in which the Company is no longer a member. See Note 11 of Notes to Consolidated Financial Statements.
| (4) | We had a 25% equity interest in Golden Peanut Company, LLC and its subsidiaries, or Golden Peanut. Our investment in Golden Peanut was accounted for using the equity method. We liquidated our investment in Golden Peanut at its carrying value in August 2001. |
| (5) | In June 2002, we adopted a plan to withdraw from and discontinue participation in a pecan processing and marketing partnership. This withdrawal was completed in January 2003. Accordingly, the operating results of the partnership have been segregated from continuing operations and reported separately in the Consolidated Statements of Operations. Our continuing operations are principally comprised of our broiler production, processing and marketing operations. |
| (6) | The Company converted from an agricultural cooperative to a for-profit corporation and completed its initial public stock offering in October 2004. See Note 2 of Notes to Consolidated Financial Statements. Earnings per share are calculated for fiscal 2005, the initial period the Company operated as a for-profit publicly traded stock corporation. See Note 12 of Notes to Consolidated Financial Statements for the calculation of basic and diluted weighted average common shares outstanding. |
| (7) | On October 20, 2004, the Board of Directors of the Company approved changing the fiscal year-end of the Company from the Saturday after the last Thursday in June to the Saturday after the last Thursday in September. Fiscal 2005 was a 52-week year that began on October 3, 2004 and ended October 1, 2005. |
16
| Item 7. | Management’s Discussion and Analysis of Financial Condition and Results of Operations |
Summary
After two decades of rapid growth, the broiler industry is maturing and will be dependent on new and value-added product development, as well as expanded export opportunities, for continued revenue growth. Production and operating efficiencies will also be necessary for increased profitability. In addition, the industry is undergoing consolidation as a number of acquisitions and mergers have occurred in the last five years. The market share of the top five U.S. firms in terms of ready-to-cook broiler meat production has increased from approximately 49% in 1997 to 60% in 2004 and this trend is expected to continue. Gold Kist is the third largest producer of broilers and related products accounting for approximately 9% of the industry’s production in calendar 2004. We experienced our two best years in history in fiscal 2004 and fiscal 2005 in terms of operating income, net income, liquidity and financial condition.
We are focusing our growth efforts on value added products. The contracts for the sales of these products typically have longer terms than contracts for the sales of our minimally processed products and include fixed prices. As a result, we believe that increased sales of further-processed products will result in less volatility in the prices at which we sell our products. Sales of our value added products represented approximately 52% of our sales in fiscal 2005.
The industry has experienced volatility in results of operations over the last five years and expects the volatility to continue in the foreseeable future. Volatility in results of operations is generally attributable to fluctuations, which can be substantial, in broiler sales prices and cost of feed grains. Broiler sales prices tend to fluctuate due to changes in the supply of chicken, viability of export markets, supply and prices of competing meats and proteins, such as beef and pork, animal health factors in the global meat sector and general economic conditions.
According to the USDA World Agricultural Outlook Board (“WAOB”), calendar 2004 U.S. broiler meat production was approximately 33.7 billion pounds, ready-to-cook weight, 4.0% above the 32.4 billion pounds produced in calendar 2003. The WAOB October estimate for calendar 2005 broiler meat production is 34.8 billion pounds, which is a 3.3% increase from calendar 2004. The increases are principally due to heavier bird weights and to a lesser extent, projected increased chick placements. Broiler production forecasts for the remainder of calendar 2005 are lower than previous projections primarily because broiler hatchery and laying flock data indicate a slower pace of production. Broiler supply was temporarily impacted by Hurricane Katrina although we did not incur any significant losses from the effects of the storm. We do not have any operating facilities in Louisiana or Mississippi.
Our export sales, which we define as sales other than to customers in the United States or Canada, were $137.6 million for fiscal 2005 or approximately 6.0% of our net sales and 12.0% of our pounds sold. The U.S. poultry industry historically has exported approximately 15% to 20% of domestic production, principally dark meat products to Russia and other former Soviet Republics, Hong Kong, Mexico and China. Our poultry export sales have historically been less than 10% of net sales. Any disruption in the export markets can significantly impact domestic broiler sales prices by creating excess domestic supply. Although Hurricane Katrina has affected broiler exports, the disruptions are expected to be relatively short lived, as firms shift exports to other ports.
The cost of feed grains, primarily corn and soybean meal, averages approximately 55% to 60% of total live broiler production costs or approximately 30% to 35% of our cost of sales. Prices of feed grains fluctuate in response to worldwide supply and demand. Corn and soybean meal prices increased significantly in fiscal 2003 with soybean meal prices further increasing significantly in fiscal 2004, due to stronger worldwide demand and reduced U.S. crops due to weather problems in grain producing areas. Increased worldwide corn and soybean production favorably impacted feed ingredient costs in fiscal 2005. Our average feed ingredient costs were significantly lower in fiscal 2005 as compared to fiscal 2004, but were higher in the fourth quarter as compared to our third quarter of fiscal 2005.
17
Energy costs represent a significant component of product and delivery costs as such costs affect transportation costs, costs to operate poultry facilities and packaging costs. General price increases and recent spikes in energy prices due to the effects of the hurricanes increased our energy costs in fiscal 2005 as compared to fiscal 2004 by 27.5%. Although energy prices have moderated, it is expected that costs in the first half of fiscal 2006 will be higher than the first half of fiscal 2005.
General issues such as increased domestic and global competition in the meat industry, heightened concerns over the security of the U.S. food supply, volatility in feed grain commodity prices and export markets, increasing government regulation over animal production, animal welfare activism and animal disease (including additional outbreaks of avian influenza) continue as significant risks and challenges to profitability and growth, both for Gold Kist and the broiler industry in general. Although there are currently no reported avian influenza (“AI”) cases in commercial chicken in the United States and there has never been an outbreak of the H5N1 high pathogenic Asian strain of AI, confirmed cases in the U.S. commercial poultry industry could have an adverse effect on the supply of chicken, domestic and foreign product demand and sales prices for chicken products and our results of operations and financial position. See “Risk Factors—Outbreaks of livestock diseases, particularly an outbreak of avian influenza among humans, could adversely affect our business.”
References in this report to “fiscal 2005,” “fiscal 2004,” “fiscal 2003,” “fiscal 2002” and “fiscal 2001” refer to our fiscal years ending or ended October 1, 2005, June 26, 2004, June 28, 2003, June 29, 2002 and June 30, 2001, respectively. References in this report to “Transition Quarter” refer to the period from June 27, 2004 to October 2, 2004.
Results of Operations
The following table presents certain statement of operations items as a percentage of net sales for the periods indicated:
| | | | | | | | | | | | |
| | | Fiscal Years Ended
| | | Transition
Quarter
Ended
| | | Fiscal Year
Ended
| |
| | | June 28,
2003
| | | June 26,
2004
| | | October 2,
2004
| | | October 1,
2005
| |
Net sales | | 100.0 | % | | 100.0 | % | | 100.0 | % | | 100.0 | % |
Cost of sales | | 97.8 | | | 84.0 | | | 85.7 | | | 86.1 | |
| | |
|
| |
|
| |
|
| |
|
|
Gross profit | | 2.2 | | | 16.0 | | | 14.3 | | | 13.9 | |
Distribution, administrative and general expenses | | 4.4 | | | 4.8 | | | 4.8 | | | 4.9 | |
Other (gains) expenses | | (1.1 | ) | | .5 | | | .4 | | | .1 | |
| | |
|
| |
|
| |
|
| |
|
|
Net operating income (loss) | | (1.1 | ) | | 10.7 | | | 9.1 | | | 8.9 | |
Interest expense | | (1.3 | ) | | (1.6 | ) | | (1.3 | ) | | (1.7 | ) |
Other expenses, net (including income taxes) | | (.4 | ) | | (4.2 | ) | | (2.5 | ) | | (2.3 | ) |
| | |
|
| |
|
| |
|
| |
|
|
Net income (loss) | | (2.8 | )% | | 4.9 | % | | 5.3 | % | | 4.9 | % |
| | |
|
| |
|
| |
|
| |
|
|
Fiscal 2005 Compared to Fiscal 2004
Net Sales
Our net sales for fiscal 2005 increased 1.9% from $2.26 billion in fiscal 2004 to $2.30 billion in fiscal 2005. The increase in net sales was due primarily to a 7.3% increase in broiler pounds produced and sold for the year ended October 1, 2005, partially offset by a decline of 5.7% in average broiler sales prices during the same period. A 1.7% increase in processing yield and a 1.9% increase in the number of chickens processed were the principal factors leading to the increased pounds produced and sold in fiscal 2005 over fiscal 2004. Broiler sales prices weakened at the end of fiscal 2005 and are expected to weaken further during the first quarter of fiscal
18
2006 (final calendar quarter of 2005) due to seasonal factors historically experienced during the holiday season. In addition, volume declines at quick service restaurants in response to the rise in energy prices have contributed to the weakening of the boneless skinless breast meat market prices.
Our export sales of $137.6 million for fiscal 2005 were 38.7% higher than fiscal 2004, due to increased shipments to Russia and strong demand from other countries such as Mexico, China and Hong Kong. Prices for dark meat products strengthened during fiscal 2005. Our export sales to Russia increased 39.5% in dollar value and pounds shipped from fiscal 2004. Prices for dark meat export products declined, however, in the latter half of the fourth fiscal quarter of 2005 and have continued to decline in the beginning of fiscal 2006 primarily due to reduced demand brought about by general concerns regarding avian influenza occurrences in Asian countries.
Net Operating Income
We had net operating income of $205.6 million for fiscal 2005 compared to net operating income of $242.3 million in fiscal 2004. The decrease in net operating income in fiscal 2005 as compared to fiscal 2004 was due primarily to lower broiler selling prices and higher processing and other production costs in fiscal 2005. Processing costs increased in total due to an increase in pounds processed and on a per pound basis due to higher freight and packaging costs resulting primarily from higher fuel and other energy prices. During fiscal 2005, higher processing costs were somewhat offset by lower total feed costs. Total feed costs for fiscal 2005 were 5.6% lower than fiscal 2004 due to lower feed ingredient costs partially offset by the additional amounts of feed ingredients purchased relating to the increase in pounds produced. Average prices for corn and soybean meal for fiscal 2005 were 16.2% and 12.9% below fiscal 2004, respectively. Although cash market prices for both soybean meal and corn declined further in the quarter ended October 1, 2005, the Company was unable to fully benefit from these price declines due to priced forward purchase contracts that were entered into in order to secure a portion of our feed ingredient requirements. This was the result of cash market prices for both soybean meal and corn below the prices that were fixed on a portion of our forward purchase contracts. Feed costs for the quarter ended October 1, 2005 were 4% higher than in the quarter ended July 2, 2005.
We had distribution, administrative and general expenses of $112.2 million in fiscal 2005 as compared to $108.8 million for fiscal 2004. The 3.1% increase in fiscal 2005 compared to fiscal 2004 was principally due to the noncash share-based compensation expense of $9.8 million related to the stock grants and awards issued to employees in October 2004 and January 2005, partially offset by lower cash incentive compensation accruals. Approximately $5.3 million of the share-based compensation expense was recognized with respect to recipients aged 55 or older and eligible for early retirement at which time the share-based compensation awards would vest (see Note 9 of Notes to Consolidated Financial Statements).
Expenses of $1.4 million, principally advisory fees related to the conversion of Gold Kist from a cooperative marketing association to a for-profit corporation, were incurred in fiscal 2005. Pension settlement expense of $10.3 million and $0.9 million were recognized in fiscal 2004 and fiscal 2005, respectively, due to lump sum distribution payments from the plans to electing retiring employees exceeding service and interest cost components of pension expense in the plan year.
Other Income (Expense)
Other expenses, net totaled $31.7 million for fiscal 2005 as compared to $89.6 million for fiscal 2004.
Interest expense was $23.6 million for fiscal 2005, compared to $29.3 million for fiscal 2004, a decrease of 19.5%. Significantly lower average outstanding borrowings in fiscal 2005 were the principal factor leading to the decrease in interest expense. In fiscal 2004, we incurred a prepayment interest charge of $5.5 million and wrote off deferred financing fees of $0.8 million with respect to the payoff of a term loan with an insurance company with part of the proceeds from our issuance of $200 million in senior notes. During fiscal 2005, in connection with the repayment of $70.0 million principal amount of our senior notes with a portion of the proceeds from Gold Kist’s initial public offering, we incurred a $7.2 million prepayment interest charge. In addition, we wrote
19
off deferred financing costs of $1.8 million and 35% of the unamortized discount on the senior notes totaling $1.0 million. In September 2005, we incurred a $6.2 million prepayment interest charge in connection with the repayment of $35.3 million principal amounts of Series B and Series C senior exchange notes with an insurance company and $26.8 million principal amount of a term loan with an agricultural credit bank.
The $2.5 million loss on investments in 2005 was related to an investment in a supply cooperative in which we are no longer a member. The $57.4 million loss on investment for fiscal 2004 represented the write off of our investment in Southern States Cooperative, Inc. discussed under “Other Income (Expense)” within the “Fiscal 2004 Compared to Fiscal 2003” section below.
Miscellaneous, net was income of $4.7 million for fiscal 2005 compared to income of $1.9 million for fiscal 2004. Income from our hog production joint venture was $3.6 million for fiscal 2005 compared to $1.2 million for fiscal 2004 due to improved hog market prices brought about by increased demand. Interest and dividend income was $5.9 million in fiscal 2005 compared to $1.6 million for fiscal 2004. This increase was principally due to higher interest income from additional cash invested in short-term, interest bearing instruments, as well as higher interest rates in fiscal 2005.
Income Tax Expense
For fiscal 2005, our combined federal and state effective income tax rate used for purposes of calculating the tax expense on income before income taxes was 35.4%. Income tax expense for fiscal 2005 reflects income taxes at statutory rates adjusted principally for available tax credits including state tax credits from prior years that became available and were recorded in fiscal 2005. The effective tax rate of 27.4% in fiscal 2004 reflected the ordinary deduction for tax purposes for the abandonment of the SSC investment in June 2004. Previously, we had recorded an income tax valuation allowance for the majority of the unrealized losses resulting from the write-downs of the SSC investment.
Fiscal 2004 Compared to Fiscal 2003
Net Sales
For fiscal 2004, net sales increased 21.9% from $1.86 billion in fiscal 2003 to $2.26 billion in fiscal 2004. The increase in net sales volume was due primarily to an approximate 22% increase in average broiler sales prices for fiscal 2004, slightly offset by a decrease in broiler pounds produced and sold. An overall strengthening economy, favorable production levels, improved export demand and higher prices in the beef and pork meat sectors contributed to stronger demand and higher broiler sales prices in fiscal 2004. Diet trends emphasizing low fat proteins such as chicken also favorably impacted product demand.
Our export sales of $99.2 million for fiscal 2004 were 75.9% higher than fiscal 2003, due to substantially increased prices, the resumption of shipments to Russia and increased demand from other countries. An import quota system was negotiated and announced by Russian officials in December 2003. The U.S. share of the total quota was 771,900 tons or 73.5%. This is below the U.S. levels of imports prior to the embargo; however, increased demand from other countries partially offset this reduction. Our export sales to Russia increased 52.8% in pounds shipped and 157.4% in dollar value from $16.2 million in fiscal 2003 to $41.7 million in fiscal 2004.
Net Operating Income
We had net operating income of $242.3 million for fiscal 2004 compared to a net operating loss of $19.6 million in the prior fiscal year. The increase in net operating income in fiscal 2004 was due primarily to higher broiler selling prices partially offset by higher feed ingredient costs, principally soybean meal. Soybean meal prices were 29.2% higher per ton during fiscal 2004 compared to fiscal 2003, and the average per bushel corn price was up 5.2%. The increased feed grain costs were due primarily to adverse weather conditions experienced late in the 2003 growing season.
20
Cost of sales in fiscal 2004 included a $3.5 million charge to write down the carrying value of the assets and recognize other expenses, primarily employee severance amounts, related to the closing of a poultry processing facility announced in September 2003.
Our pork production operations had net operating income of $0.4 million for fiscal 2004 compared to a net operating loss of $3.1 million for fiscal 2003. The improvement was attributable to improved hog market prices brought about by lower beef supplies and increased demand for pork products.
The 32.9% year-to-date increase in distribution, administrative and general expenses was principally due to incentive compensation accruals associated with the net income for fiscal 2004 compared to the net losses in fiscal 2003. We also experienced higher benefit costs, principally pension expense and employee medical claims during fiscal 2004, which contributed to the increase. These costs were partially offset by benefit plan reductions and the impact of curtailments implemented in fiscal 2003 and 2004.
We recognized $10.3 million of pension settlement expense in fiscal 2004. The settlement expense resulted from lump sum distribution payments from the plans to electing retiring employees exceeding service and interest cost components of pension expense in the plan year.
Other Income (Expenses)
Other expenses, including loss on investments, interest expense and miscellaneous, totaled $89.6 million for fiscal 2004, compared to $49.2 million for fiscal 2003. In October 2002, Southern States Cooperative, Inc., or SSC, notified us that, pursuant to the provisions of the indenture under which we purchased the capital trust securities, SSC would defer the quarterly interest payment due on October 5, 2002. Interest payments for subsequent quarters were also deferred. As a result of the deferral of the interest payments, we reduced the carrying value of the capital trust securities by $24.1 million with a corresponding charge included in other deductions for fiscal 2003. As of December 31, 2003, SSC’s total stockholders’ and patrons’ equity fell below our carrying value of the preferred stock investment, which we believed was a triggering event indicating impairment and recorded an “other-than-temporary” impairment charge of $18.5 million. In June 2004, we notified SSC that we were abandoning the capital trust securities and returned them. As a result of the abandonment, we wrote off the remaining investment balance of $38.8 million in June 2004. See Note 11 of the Notes to Consolidated Financial Statements.
Interest expense was $29.3 million for fiscal 2004, compared to $25.0 million for the prior fiscal year. The 17.5% increase in the fiscal 2004 interest expense was due to the higher interest rate on the senior notes compared to the average rates on other indebtedness. Higher interest rate spreads over the London Interbank Offered Rate (LIBOR) and amortization of fees related to the February 2003 amendment to our senior credit facility and the arrangement of our temporary revolving credit facility that matured on September 30, 2003 also contributed to the increase. In addition, we incurred prepayment interest of $5.5 million associated with the March 2004 repayment of the $45.0 million term loan due to an insurance company with a portion of the proceeds from our March 2004 senior note offering.
Miscellaneous, net was income of $1.9 million for fiscal 2004 compared to expense of $2.4 million in the prior fiscal year. Gains from the sale of assets and from the settlement in August 2003 of notes receivable that exceeded their carrying value were the primary items resulting in the fiscal 2004 income. The notes receivable were acquired from the parent corporation of the other general partner of a pecan processing and marketing partnership that was dissolved in January 2003. The principal component of the expense we recorded in fiscal 2003 was a $4.1 million payment we made in December 2002 for our share of a legal settlement as a former partner of a peanut processing and marketing company. Income from a hog production joint venture with another regional cooperative was $1.2 million for fiscal 2004 as compared to a loss of $0.8 million for fiscal 2003 due to improved hog market prices brought about by increased demand for pork products.
21
Income Tax Expense
For fiscal 2004, our combined federal and state effective income tax rate used to calculate the tax expense on the income before income taxes was 27.4%. Our effective tax rate is lower than the federal and state statutory rates for fiscal 2004 due primarily to the recognition of an ordinary deduction for tax purposes resulting from the abandonment of the SSC investment in June 2004. Previously, we had recorded an income tax valuation allowance for the majority of the unrealized losses resulting from the write-downs of the SSC investment. Income tax expense (benefit) for the periods presented reflects income taxes at statutory rates adjusted for available tax credits and deductible nonqualified equity redemptions.
Transition Quarter Ended October 2, 2004 to Three Months Ended September 27, 2003
Net Sales
Our net sales for the transition quarter ended October 2, 2004 increased 25.1% compared to the quarter ended September 27, 2003. The increase in net sales volume was due primarily to an approximate 10.6% increase in average broiler sales prices and an approximate 13.3% increase in broiler pounds produced and sold for the transition quarter ended October 2, 2004. The extra week in the transition quarter contributed approximately two-thirds of the increase in broiler pounds sold for the transition quarter ended October 2, 2004. An overall strengthening economy, favorable production levels, improved export demand and higher prices in the beef and pork meat sectors contributed to stronger demand and higher broiler sales prices in the transition quarter ended October 2, 2004 as compared to the quarter ended September 27, 2003. Diet trends emphasizing low fat proteins such as chicken and new product introductions in fast food and quick service restaurants also favorably impacted product demand.
Our export sales of $25.8 million for the transition quarter ended October 2, 2004 were 40.5% higher than the September 2003 quarter, due to increased prices, the continuation of shipments to Russia and increased demand from other countries. In addition, the extra week in the transition quarter contributed to the increase. Our export sales to Russia increased 55.1% in pounds shipped and 57.4% in dollar value from $5.4 million for the quarter ended September 27, 2003 to $8.5 million for the transition quarter ended October 2, 2004.
Net Operating Income
We had net operating income of $58.8 million for the transition quarter ended October 2, 2004 compared to net operating income of $38.4 million for the quarter ended September 27, 2003. The increase in net operating income was due primarily to higher broiler selling prices and increased volume, partially offset by higher feed ingredient costs, principally soybean meal. Feed costs for the transition quarter ended October 2, 2004 were 23.9% higher than the quarter ended September 27, 2003. This increase was due primarily to a 38.1% increase in our average per ton price of soybean meal and a 12.5% increase in our average per bushel price of corn compared to prices in the comparable period in the prior year. The increased feed grain costs were due primarily to adverse weather conditions experienced late in the 2003 growing season. Feed costs for the transition quarter ended October 2, 2004 were 1.0% below feed costs for the quarter ended June 26, 2004. This decrease was due primarily to a 9.9% decrease in our average per bushel price of corn partially offset by a 4.8% increase in our average per ton price of soybean meal compared to prices in the quarter ended June 2004. Although cash market prices for both soybean meal and corn declined in the transition quarter ended October 2, 2004, our ability to benefit from these price declines was negated by priced forward purchase contracts that were entered into in order to secure a portion of our feed ingredient requirements. This was the result of cash market prices for both soybean meal and corn below the prices that were fixed on a portion of our forward purchase contracts.
The 27.8% increase in distribution, administrative and general expenses for the transition quarter ended October 2, 2004 was principally due to the additional week of expenses and increased incentive compensation accruals associated with the higher net income for the transition quarter ended October 2, 2004 compared to the quarter ended September 27, 2003. We also experienced higher benefit costs during the transition quarter ended October 2, 2004, which contributed to the increase.
22
Expenses of $2.5 million including legal, printing, distribution and accounting fees related to our conversion of Gold Kist from a cooperative marketing association to a for-profit corporation were deducted in determining net operating income. Also included were advisory fees and legal expenses related to unsolicited proposals to acquire Gold Kist.
Other Income (Expenses)
Other expenses, including interest expense and miscellaneous, totaled $6.0 million for the transition quarter ended October 2, 2004, compared to $3.2 million for the quarter ended September 27, 2003.
Interest expense was $8.5 million for the transition quarter ended October 2, 2004, compared to $7.6 million for the quarter ended September 27, 2003. The increase in interest expense was principally due to the higher interest rate on the senior notes as compared to the average rates on other indebtedness outstanding at September 27, 2003 that was repaid with the proceeds from the senior notes in March 2004.
Miscellaneous, net was income of $1.8 million for the transition quarter ended October 2, 2004 compared to $4.2 million for the quarter ended September 27, 2003. Gains from the sale of assets and from the settlement in August 2003 of notes receivable that exceeded their carrying value were the primary items resulting in the income amount in the quarter ended September 27, 2003. The notes receivable were acquired from the parent corporation of the other general partner of a pecan processing and marketing partnership dissolved in January 2003. Income from a hog production joint venture with another regional cooperative was $1.1 million for the transition quarter ended October 2, 2004 as compared to $0.3 million for the quarter ended September 27, 2003 due to improved hog market prices brought about by increased demand.
Income Tax Expense
For the transition quarter ended October 2, 2004, our combined federal and state effective income tax rate used to calculate the tax expense on the income before income taxes was 35.6%. Income tax expense for the transition quarter reflects income taxes at statutory rates adjusted principally for available tax credits and deductible nonqualified cash patronage refunds and equity redemptions.
Liquidity and Capital Resources
Our liquidity is dependent upon cash flow from operations and external sources of financing. Fiscal 2004 and 2005 were our best years in history in terms of earnings, liquidity and improvement in financial position.
In March 2004, we issued $200.0 million aggregate principal amount of senior notes that are due in 2014. The interest rate on the senior notes is 10.25%, with interest payable semi-annually on March 15 and September 15. The senior notes were issued at a price of 98.47% and are reflected net of the unamortized discount in the accompanying consolidated balance sheets. We repaid approximately $70.0 million of these notes, plus $7.2 million in prepayment interest charges, on November 12, 2004 with a portion of the proceeds from our initial public offering completed on October 13, 2004.
In connection with the offering of our senior notes, we amended the terms of our senior credit facility to provide for a revolving line of credit in an aggregate principal amount of $125.0 million, including a sub-facility of up to $60.0 million for letters of credit, for a term of three years. The facility is secured by a security interest in substantially all of our assets, including all of our present and future accounts receivable and inventory, property, plant and equipment and the stock of certain of our subsidiaries. Borrowings under the facility are limited to the lesser of $125.0 million and a borrowing base determined by reference to a percentage of the collateral value of the accounts receivable and inventories, including our broiler and breeder flocks, securing the facility. As of October 1, 2005, we had approximately $83.0 million available for borrowing under this facility. As of October 1, 2005, approximately $42.0 million of letters of credit were outstanding under the facility.
23
Our debt agreements place a limitation on capital expenditures, cash dividends, commodity hedging contracts and additional loans, advances or investments. The terms of our debt agreements (other than the senior notes) contain financial covenants, including those that specify minimum consolidated tangible net worth, current ratio and coverage ratio requirements. The agreements also include other financial covenants and events of default.
We and our subsidiaries are also subject to certain affirmative and negative covenants contained in our senior credit facility, including covenants that restrict, subject to specified exceptions, dividends and certain other restricted payments; the incurrence of additional indebtedness and other obligations and the granting of additional liens; loans; extension of credit and guarantees; mergers, acquisitions, investments, and disposition of assets or stock; capital expenditures; and use of proceeds from borrowings under the credit facility and excess cash flow. The exceptions provided in the credit facility could allow for transactions to occur outside the credit facility limitations as follows: incurrence of reimbursement obligations under letters of credit not to exceed $25.0 million; capital expenditures of $75.0 million during each fiscal year (subject to certain excess cash flow limitations), plus carry forward amounts. There are also covenants relating to compliance with certain laws, payments of taxes, maintenance of insurance and financial reporting. In addition, the credit facility requires us to maintain a minimum consolidated tangible net worth of at least the sum of $180.0 million and 50% of cumulative reported net income beginning with the third quarter of fiscal 2004, a ratio of consolidated current assets to consolidated current liabilities no less than 1.10 to 1.00, calculated on a quarterly basis; a fixed charge coverage ratio as of the last day of any fiscal quarter no less than 1.80 to 1.00, calculated on a quarterly basis; and a senior debt coverage ratio not to exceed 3.75 to 1.00 at the end of the fourth quarter of fiscal 2004, 3.50 to 1.00 at the end of the first quarter of fiscal 2005, and 3.25 to 1.00 at the end of the second quarter of fiscal 2005 and thereafter.
Events of default under the senior credit facility include, subject to grace periods and notice provisions in certain circumstances, non-payment of principal, interest or fees; default under or acceleration of certain other indebtedness; material inaccuracy of any representation or warranty; violation of covenants; bankruptcy and insolvency events; certain impairments of collateral; fraudulent conveyance; certain judgments and other liabilities; certain ERISA violations; changes of control; and certain management changes. If an event of default occurs, the lenders under the senior credit facility are entitled to take various actions, including accelerating amounts due under the credit facility and requiring that all such amounts be immediately paid in full.
The terms of our senior notes and senior credit facility also include an excess cash flow provision, which under certain conditions could require us to deposit funds in a restricted cash account to be used for future scheduled or mandatory principal payments of senior debt.
The foregoing description of the terms of our senior notes and senior credit facility are qualified by reference to the applicable indentures or agreements governing such arrangements, which are incorporated by reference to this report.
At October 1, 2005, we were in compliance with all applicable loan covenants under our senior notes and credit facilities.
For fiscal 2005, cash provided by operating activities was $177.6 million compared to cash provided from operating activities of $218.7 million for fiscal 2004. The lower fiscal 2005 operating cash flow was due principally to decreased operating income and the $16.1 million of pension plan contributions in excess of benefit plan expenses made in fiscal 2005, partially offset by net cash used in fiscal 2004 and net cash provided in fiscal 2005 by changes in operating assets and liabilities.
For fiscal 2005, cash used in investing activities was $70.7 million compared to $37.6 million in fiscal 2004. The increase was due principally to the $80.8 million in capital expenditures for fiscal 2005 compared to $42.2 million for fiscal 2004. This includes expenditures for expansion of further processing capacity, technological advances in our poultry production and processing operations and expanded chill pack capacity. In addition, capital expenditures included other asset improvements and necessary replacements. We have funded fiscal 2005
24
capital expenditures, including a portion of an ongoing $47.0 million expansion of our Live Oak, Florida facility that will continue over the next two years, and related working capital needs with existing cash balances and cash provided from operations.
Cash used in financing activities for fiscal 2005 was $128.7 million compared to $55.4 million for fiscal 2004. Pursuant to the conversion, approximately 36.4 million shares of common stock and $106.0 million in cash were issued and distributed in December 2004 to members and former member equity holders. We issued 12 million shares of our common stock in our initial public offering at a price of $11.00 per share and converted to a for-profit corporation on October 13, 2004. Including proceeds from the exercise, in November 2004, of the underwriters’ overallotment option to purchase an additional 1.6 million shares at the offering price of $11.00 per share, total proceeds, net of expenses, were $137.2 million. Part of the proceeds and funds from existing cash balances were used to repay $70 million of the senior notes, equaling 35% of the principal amount.
The payment of the $2.4 million cash portion of the nonqualified patronage refund for the period from June 27, 2004 to October 12, 2004 and patronage equity cashings of $0.8 million are also reflected in the net cash used in financing activities for fiscal 2005. In addition, we repaid the term loans with an agricultural credit bank totaling $34.0 million, our industrial revenue bond in the amount of $7.5 million and our Series B and Series C exchange notes with an insurance company in the amount of $35.0 million in September 2005. In connection with the repayment of this indebtedness, we paid prepayment interest of approximately $6.1 million. At October 1, 2005, we had cash of $135.6 million invested in short term interest-bearing instruments.
Working capital and patrons’ and other equity/stockholders’ equity were $324.3 million and $450.7 million, respectively, at October 1, 2005 compared to $345.2 million and $284.6 million, respectively, at June 26, 2004. Lower levels of current assets and higher levels of current liabilities, due principally to income taxes payable and lower current deferred tax assets, resulted in the lower working capital level at October 1, 2005. The increase in total equity resulted from the additional paid in capital in excess of the cash distributions to members and equity holders from the initial public offering in October 2004 and from our net income for fiscal 2005.
Effective January 1, 2004, we prospectively amended our qualified pension plan. For benefits earned in 2004 and future years, the basic pension formula was changed from 50% to 45% of final average earnings, early retirement benefits were reduced, and the lump sum distribution option is no longer available. The pension benefits earned by employees through 2003 were unchanged. We made qualified pension plan contributions of $15.0 million in August 2004, $8.0 million in November 2004 and $11.0 million in June 2005.
We believe cash on hand, cash equivalents and cash expected to be provided from operations, in addition to borrowings available under our amended senior credit facility, will be sufficient to maintain cash flows adequate for our operational objectives during fiscal 2006.
Contractual Obligations
Obligations under long-term debt, non-cancelable operating leases, feed ingredient purchase commitments and construction contracts at October 1, 2005 are as follows (in millions):
| | | | | | | | | | | |
| | | Payments Due by Period
|
| | | Total
| | Less than
1 year
| | 1-3
years
| | 3-5
years
| | After
5 years
|
Debt obligations: | | | | | | | | | | | |
Principal payments (a) | | $ | 145.2 | | 1.5 | | 6.2 | | 3.7 | | 133.8 |
Interest payments (b) | | | 129.7 | | 15.3 | | 30.1 | | 29.2 | | 55.1 |
Operating leases | | | 57.1 | | 16.2 | | 26.5 | | 12.6 | | 1.8 |
Feed ingredient purchase commitments (c) | | | 122.5 | | 122.5 | | — | | — | | — |
Construction contracts (d) | | | 38.2 | | 38.2 | | — | | — | | — |
| | |
|
| |
| |
| |
| |
|
Total (e) | | $ | 492.7 | | 193.7 | | 62.8 | | 45.5 | | 190.7 |
| | |
|
| |
| |
| |
| |
|
25
| (a) | Excludes $56.0 million in total letters of credit outstanding related to normal business transactions. |
| (b) | Interest payments include amounts for fixed rate debt as outlined in Note 5 of Notes to Consolidated Financial Statements based on the expected payment dates. |
| (c) | Feed ingredient purchase commitments include both priced and unpriced contracts in the ordinary course of business. Unpriced feed ingredient commitments are priced at market as of October 1, 2005 for the month of delivery. |
| (d) | Represents unexpended amounts on construction and related contracts. |
| (e) | We contract with broiler, breeder, pullet, layer, hog and nursery pig producers. Although these contracts are subject to acceptable grower performance on a flock-to-flock or herd-to-herd basis, the contracts contemplate grow out activity to continue through the periods covered by the grower contracts. Annual grower pay has averaged approximately $245.0 million per year over the past two years with the actual amounts determined by relative performance, fuel adjustments and other factors. Grower payments have not been included in the contractual obligations table due to the inherent uncertainty of the future amounts. |
Critical Accounting Policies
The preparation of our Consolidated Financial Statements requires the use of estimates and assumptions. These estimates and assumptions affect the reported amounts of assets and liabilities at the date of the financial statements and the reported amounts of revenues and expenses during the fiscal years presented. The following is a summary of certain accounting policies that we consider to be critical. Other significant accounting policies are disclosed in Note 1 of Notes to Consolidated Financial Statements.
Revenue Recognition. Substantially all of our revenue generating activities consist of the sale of poultry products to our customers. Substantially all sales are shipped by truck and the revenue is recognized upon passage of title and risk of loss to the customer. There are no additional services or processes to be performed following delivery of the product. Revenue is recorded net of amounts for any discounts, allowances or promotions. Estimates for any special pricing arrangements, promotions or other volume-based incentives are recorded upon shipment of the product in accordance with the terms of the promotion, allowance or pricing arrangements.
Inventories. Live poultry inventories consist of broilers and breeders. Broilers are stated at the lower of average cost or market and breeders are stated at average cost less accumulated amortization. Costs include live production costs (principally feed, chick cost, medications and other raw materials), labor and production overhead. Breeder costs include acquisition of chicks from parent stock breeders, feed, medication, labor and production costs that are accumulated up to the production stage and then amortized over their estimated useful life of thirty six weeks. Marketable product inventories and raw materials and supplies are stated on the basis of the lower of cost (first in, first out or average) or market. If market prices for inventories move below carrying value, adjustments to write down the carrying values of these inventories would be required.
Allowance for Doubtful Accounts. Our management estimates the allowance for doubtful accounts based on an analysis of the status of individual accounts. Factors such as current overall economic and industry conditions, historical customer performance and current financial condition, collateral position and delinquency trends are used in evaluating the adequacy of the allowance for doubtful accounts. Changes in the economy, industry and specific customer conditions may require us to adjust the allowance amount recorded. These estimates involve management judgment and could have a significant impact on our results of operations and financial position.
Accrued Insurance Costs. We retain for certain losses related to property, fleet, product and general liability, worker’s compensation and employee medical benefits. Stop loss coverage for claims exceeding the self-retention level is maintained with third party insurers to limit our total exposure. Estimates of the ultimate cost of claims incurred are accrued based on historical data and estimated future costs. While we believe these estimates are reasonable based on the information available, actual costs could differ and materially impact our results of operations and financial position.
26
Employee Benefits. We incur various employment-related benefit costs with respect to qualified and nonqualified pensions and deferred compensation plans. Assumptions are made related to discount rates used to value certain liabilities, assumed rates of return on assets in the plans, compensation increases, employee turnover and mortality rates. We utilize third party actuarial firms to assist management in determining these assumptions. Different assumptions could result in the recognition of differing amounts of expense over different periods of time.
Income Taxes. We account for income taxes in accordance with Statement of Financial Accounting Standards (SFAS) No. 109, “Accounting for Income Taxes,” which requires that deferred tax assets and liabilities be recognized for the tax effect of temporary differences between the financial statement and tax basis of recorded assets and liabilities at current tax rates. SFAS No. 109 also requires that deferred tax assets be reduced by a valuation allowance if it is more likely than not that some portion or all of the deferred tax asset will not be realized. The recoverability of the tax assets recorded on the balance sheet is based on both our historical and anticipated earnings levels and is reviewed to determine if any additional valuation allowance is necessary when it is more likely than not that amounts will not be recovered.
Share-based compensation. The Company adopted SFAS No. 123(r), “Share-Based Payment,” in January 2005. SFAS No. 123(r) requires the determination of share-based payments as equity or liability classified and measurement of the payment at fair value. Assumptions and judgments are made by management concerning the classification and valuation of the stock grants and awards, the requisite service periods, the assessment of the conditions imposed by the payment, employee turnover, volatility, the term of the awards and other factors used in determining the compensation expense. We expect to make additional share-based payments in the future and different assumptions and judgments could result in different costs that could have a material impact on the consolidated statements of operations. In addition, the resolution of implementation issues and further interpretations with regard to SFAS 123(r) could impact the assumptions and judgments used by us in earlier or future periods.
Effects of Inflation
The major factor affecting our net sales and cost of sales is the change in market prices for broilers, hogs and feed grains. The prices of these commodities are affected by world market conditions and are volatile in response to supply and demand, as well as political and economic events. The price fluctuations of these commodities do not necessarily correlate with the general inflation rate. Inflation can, however, adversely affect operating costs such as labor, energy and material costs.
New Accounting Pronouncements
In November 2004, the Financial Accounting Standards Board (FASB) issued Statement of Financial Accounting Standards (SFAS) No. 151, “Inventory Costs,” effective for fiscal years beginning after June 15, 2005. The Statement clarifies how to account for abnormal amounts of idle facility expense, freight, handling costs and spoilage. Companies will no longer be allowed to capitalize such “abnormal amounts” in inventory. In addition, fixed overhead allocated to inventories should be based on “normal capacity.” The implementation of SFAS No. 151 did not have a significant impact on our consolidated financial statements.
In December 2004, Statement of Financial Accounting Standards No. 123 (revised 2004), “Share-Based Payment” (SFAS No. 123(r)) was issued. The Statement is a revision of SFAS No. 123, “Accounting for Stock-Based Compensation.” This statement supersedes APB Opinion No. 25, “Accounting for Stock Issued to Employees,” and establishes standards for the accounting for transactions in which an entity exchanges its equity instruments for goods or services. It focuses primarily on accounting for transactions in which an entity obtains employee services in share-based payment transactions. Effective in January 2005, we adopted the provisions of SFAS 123(r). See Note 9 of Notes to Consolidated Financial Statements.
27
In October 2004, the American Jobs Creation Act (“AJCA”) was signed into law. The AJCA allows for a federal income tax deduction for a percentage of income generated from certain domestic production activities. Our production activities will qualify for the deduction. Based on the effective date of the AJCA, we became eligible for this deduction in the last quarter of fiscal 2005. Additionally, in December 2004, the FASB issued FASB Staff Position 109-1, “Application of SFAS No. 109,Accounting for Income Taxes, to the Tax Deduction on Qualified Production Activities Provided by the American Jobs Creation Act of 2004” (FSP 109-1). FSP 109-1, which was effective upon issuance, states the deduction under this provision of the AJCA should be accounted for as a special deduction in accordance with SFAS 109. The benefit realized from this provision was not significant in fiscal 2005.
In May 2005, the FASB issued SFAS No. 154, “Accounting Changes and Error Corrections—a replacement of APB Opinion No. 20 and FASB Statement No. 3.” This Statement applies to all voluntary changes in accounting principle and requires retrospective application to previously issued financial statements as if that principle had always been used, unless it is impracticable to do so. The requirements are effective for accounting changes made in fiscal years beginning after December 15, 2005 and are not expected to have a significant impact on our consolidated financial statements.
| Item 7A. | Quantitative and Qualitative Disclosures About Market Risks |
Quantitative and Qualitative Disclosures About Market Risks
Market Risk. Our principal market risks are exposure to changes in broiler and commodity prices and interest rates on borrowings. Although we have international sales and related accounts receivable from foreign customers, there is no foreign currency exchange risk as all sales are denominated in U.S. dollars.
Commodities Risk. We are a purchaser of certain agricultural commodities used for the manufacture of poultry feeds. We use commodity futures and options for economic hedging purposes to reduce the effect of changing commodity prices and to ensure supply of a portion of our commodity inventories and related purchase and sale contracts. Feed ingredient futures and option contracts, primarily corn and soybean meal, are accounted for at fair value. Changes in fair value on these commodity futures and options are recorded as a component of product cost in the consolidated statements of operations. Terms of our senior credit facility limit the use of forward purchase contracts and commodities futures and options transactions. As of October 1, 2005, the difference between the notional amounts and fair value of our outstanding commodity futures and options positions was not material.
Feed ingredient purchase commitments for corn and soybean meal in the ordinary course of business were $122.5 million at October 1, 2005. These commitments include both priced and unpriced contracts. Unpriced feed ingredient commitments are valued at market for the month of delivery as of October 1, 2005. Based on estimated annual feed usage, a 10% increase in the weighted average cost of feed ingredients would increase cost of sales by an estimated $60 - 70 million. The sensitivity analysis presented above is the measure of potential losses resulting from a hypothetical increase in market prices related to corn and soybean meal. Sensitivity analyses do not consider the actions management may take to mitigate exposure to changes, nor do they consider the effects that such hypothetical adverse changes may have on overall economic activity. In addition, actual changes in market prices may differ from hypothetical changes.
Interest Rate Risk. We have exposure to changes in interest rates on our revolving credit agreement, if utilized. The interest rates on our amended senior credit facilities fluctuate based on the London Interbank Offered Rate (LIBOR). Assuming our revolver, as amended from $125.0 million to $250.0 million in December 2005, was fully drawn, a 1% change in LIBOR would increase annual interest expense by approximately $2.5 million.
28
| Item 8. | Financial Statements and Supplementary Data |
Report of Independent Registered Public Accounting Firm
The Board of Directors and Stockholders
Gold Kist Inc.:
We have audited the accompanying consolidated balance sheets of Gold Kist Inc. (the “Company”) and its subsidiaries as of June 26, 2004 and October 1, 2005, and the related consolidated statements of operations, patrons’ and other equity/stockholders’ equity and comprehensive income (loss), and cash flows for the years ended June 28, 2003 and June 26, 2004, the transition quarter ended October 2, 2004 and the year ended October 1, 2005. In connection with our audits of the consolidated financial statements, we also have audited the financial statement schedule as listed in the accompanying index. These consolidated financial statements and financial statement schedule are the responsibility of the Company’s management. Our responsibility is to express an opinion on these consolidated financial statements and financial statement schedule based on our audits.
We conducted our audits in accordance with the standards of the Public Company Accounting Oversight Board (United States). Those standards require that we plan and perform the audit to obtain reasonable assurance about whether the financial statements are free of material misstatement. An audit includes examining, on a test basis, evidence supporting the amounts and disclosures in the financial statements. An audit also includes assessing the accounting principles used and significant estimates made by management, as well as evaluating the overall financial statement presentation. We believe that our audits provide a reasonable basis for our opinion.
In our opinion, the consolidated financial statements referred to above present fairly, in all material respects, the financial position of the Company and its subsidiaries as of June 26, 2004 and October 1, 2005, and the results of their operations and their cash flows for the years ended June 28, 2003 and June 26, 2004, the transition quarter ended October 2, 2004 and the year ended October 1, 2005, in conformity with U.S. generally accepted accounting principles. Also in our opinion, the related financial statement schedule, when considered in relation to the basic consolidated financial statements taken as a whole, presents fairly, in all material respects, the information set forth therein.
We also have audited, in accordance with the standards of the Public Company Accounting Oversight Board (United States), the effectiveness of the Company’s internal control over financial reporting as of October 1, 2005, based on criteria established inInternal Control—Integrated Framework issued by the Committee of Sponsoring Organizations of the Treadway Commission (COSO), and our report dated December 13, 2005 expressed an unqualified opinion on management’s assessment of, and the effective operation of, internal control over financial reporting.
KPMG LLP
Atlanta, Georgia
December 13, 2005
29
GOLD KIST INC.
CONSOLIDATED BALANCE SHEETS
(Dollar Amounts, Except Per Share Amounts, in Thousands)
| | | | | | | |
| | | June 26,
2004
| | | October 1,
2005
| |
| ASSETS | | | | | | | |
Current assets: | | | | | | | |
Cash and cash equivalents | | $ | 136,699 | | | 153,561 | |
Receivables, net | | | 137,654 | | | 125,389 | |
Inventories | | | 232,905 | | | 233,681 | |
Deferred income taxes, net | | | 20,482 | | | 11,506 | |
Other current assets | | | 31,564 | | | 26,873 | |
| | |
|
|
| |
|
|
Total current assets | | | 559,304 | | | 551,010 | |
Investments, at cost | | | 12,760 | | | 10,747 | |
Property, plant and equipment, net | | | 231,657 | | | 286,515 | |
Deferred income taxes, net | | | 20,060 | | | 25,133 | |
Other assets | | | 62,076 | | | 52,284 | |
| | |
|
|
| |
|
|
| | | $ | 885,857 | | | 925,689 | |
| | |
|
|
| |
|
|
| LIABILITIES AND EQUITY | | | | | | | |
Current liabilities: | | | | | | | |
Notes payable and current maturities of long-term debt | | $ | 21,167 | | | 1,518 | |
Accounts payable | | | 75,292 | | | 87,486 | |
Accrued compensation and related expenses | | | 41,278 | | | 27,292 | |
Income taxes payable | | | — | | | 34,850 | |
Accrued insurance costs | | | 37,864 | | | 39,458 | |
Other current liabilities | | | 38,458 | | | 36,105 | |
| | |
|
|
| |
|
|
Total current liabilities | | | 214,059 | | | 226,709 | |
Long-term debt, less current maturities | | | 282,954 | | | 143,714 | |
Accrued pension costs | | | 53,825 | | | 54,450 | |
Accrued postretirement benefit costs | | | 7,539 | | | 3,961 | |
Accrued insurance costs | | | 30,549 | | | 32,600 | |
Other liabilities | | | 12,316 | | | 13,527 | |
| | |
|
|
| |
|
|
Total liabilities | | | 601,242 | | | 474,961 | |
| | |
|
|
| |
|
|
Commitments and contingencies | | | — | | | — | |
| | |
Patrons’ and other equity/stockholders’ equity: | | | | | | | |
Preferred stock, authorized 100,000,000 shares | | | — | | | — | |
Common stock, $1.00 par value and authorized 500,000 shares as of June 26, 2004; $.01 par value and authorized 900,000,000 shares as of October 1, 2005; issued and outstanding 2,449 shares as of June 26, 2004 and 51,082,157 issued and 51,052,104 outstanding shares as of October 1, 2005, respectively | | | 2 | | | 511 | |
Additional paid-in capital | | | — | | | 399,619 | |
Patronage reserves | | | 219,964 | | | — | |
Accumulated other comprehensive loss | | | (44,422 | ) | | (61,265 | ) |
Retained earnings | | | 109,071 | | | 112,246 | |
Common stock held in treasury—30,053 shares | | | — | | | (383 | ) |
| | |
|
|
| |
|
|
Total patrons’ and other equity/stockholders’ equity | | | 284,615 | | | 450,728 | |
| | |
|
|
| |
|
|
| | | $ | 885,857 | | | 925,689 | |
| | |
|
|
| |
|
|
See Accompanying Notes to Consolidated Financial Statements.
30
GOLD KIST INC.
CONSOLIDATED STATEMENTS OF OPERATIONS
(Amounts in Thousands, Except Per Share Amounts)
| | | | | | | | | | | | | | |
| | | Fiscal Years Ended
| | | Transition
Quarter Ended
| | | Fiscal Year
Ended
| |
| | | June 28,
2003
| | | June 26,
2004
| | | October 2,
2004
| | | October 1,
2005
| |
Net sales | | $ | 1,855,126 | | | 2,260,728 | | | 646,511 | | | | 2,304,262 | |
Cost of sales | | | 1,813,106 | | | 1,899,395 | | | 554,142 | | | | 1,984,178 | |
| | |
|
|
| |
|
| |
|
| |
|
|
|
Gross profit | | | 42,020 | | | 361,333 | | | 92,369 | | | | 320,084 | |
Distribution, administrative and general expenses (including $9.8 million of share-based compensation expense for fiscal 2005) | | | 81,859 | | | 108,772 | | | 31,011 | | | | 112,177 | |
Benefit plans curtailment (gains) and pension plan settlement loss | | | (20,257 | ) | | 10,288 | | | — | | | | 906 | |
Conversion expenses | | | — | | | — | | | 2,522 | | | | 1,418 | |
| | |
|
|
| |
|
| |
|
| |
|
|
|
Net operating income (loss) | | | (19,582 | ) | | 242,273 | | | 58,836 | | | | 205,583 | |
Other income (expenses): | | | | | | | | | | | | | | |
Interest and dividend income | | | 2,283 | | | 1,550 | | | 635 | | | | 5,906 | |
Interest expense | | | (24,968 | ) | | (29,349 | ) | | (8,514 | ) | | | (23,619 | ) |
Debt prepayment interest and write-off of related fees and discount | | | — | | | (6,341 | ) | | — | | | | (16,186 | ) |
Loss on investments | | | (24,064 | ) | | (57,364 | ) | | — | | | | (2,500 | ) |
Miscellaneous, net | | | (2,428 | ) | | 1,942 | | | 1,833 | | | | 4,653 | |
| | |
|
|
| |
|
| |
|
| |
|
|
|
Total other expenses, net | | | (49,177 | ) | | (89,562 | ) | | (6,046 | ) | | | (31,746 | ) |
| | |
|
|
| |
|
| |
|
| |
|
|
|
Income (loss) before income taxes | | | (68,759 | ) | | 152,711 | | | 52,790 | | | | 173,837 | |
Income tax expense (benefit) | | | (17,307 | ) | | 41,817 | | | 18,772 | | | | 61,591 | |
| | |
|
|
| |
|
| |
|
| |
|
|
|
Net income (loss) | | $ | (51,452 | ) | | 110,894 | | | 34,018 | | | | 112,246 | |
| | |
|
|
| |
|
| |
|
| |
|
|
|
Net income per common share: | | | | | | | | | | | | | | |
Basic | | | — | | | — | | | — | | | $ | 2.24 | |
Diluted | | | — | | | — | | | — | | | $ | 2.22 | |
| | | | |
Weighted average common shares outstanding: | | | | | | | | | | | | | | |
Basic | | | — | | | — | | | — | | | | 49,999 | |
Diluted | | | — | | | — | | | — | | | | 50,636 | |
See Accompanying Notes to Consolidated Financial Statements.
31
GOLD KIST INC.
CONSOLIDATED STATEMENTS OF PATRONS’ AND OTHER EQUITY/STOCKHOLDERS’ EQUITY
AND COMPREHENSIVE INCOME (LOSS)
(Amounts in Thousands)
| | | | | | | | | | | | | | | | | | | | | | | | | |
| | | Outstanding
common stock
| | | Additional
paid-in
capital
| | | Patronage
reserves
| | | Accumulated
other
comprehensive loss
| | | Retained
earnings
| | | Common stock
held in
treasury
| | | Total
| |
| | | Shares
| | | Amount
| | | | | | | |
June 29, 2002 | | 18 | | | $ | 18 | | | — | | | 195,620 | | | (2,169 | ) | | 89,692 | | | — | | | 283,161 | |
Comprehensive loss: | | | | | | | | | | | | | | | | | | | | | | | | | |
Net loss | | — | | | | — | | | — | | | — | | | — | | | (51,452 | ) | | — | | | (51,452 | ) |
Additional minimum pension liability, net of tax | | — | | | | — | | | — | | | — | | | (41,279 | ) | | — | | | — | | | (41,279 | ) |
| | | | | | | | | | | | | | | | | | | | | | | | |
|
|
Total comprehensive loss | | | | | | | | | | | | | | | | | | | | | | | | (92,731 | ) |
| | | | | | | | | | | | | | | | | | | | | | | | |
|
|
Patronage equity redemptions and other changes | | (16 | ) | | | (16 | ) | | — | | | (10,000 | ) | | — | | | 3,483 | | | — | | | (6,533 | ) |
| | |
|
| |
|
|
| |
|
| |
|
| |
|
| |
|
| |
|
| |
|
|
June 28, 2003 | | 2 | | | $ | 2 | | | — | | | 185,620 | | | (43,448 | ) | | 41,723 | | | — | | | 183,897 | |
Comprehensive income: | | | | | | | | | | | | | | | | | | | | | | | | | |
Net income | | — | | | | — | | | — | | | 43,088 | | | — | | | 67,806 | | | — | | | 110,894 | |
Additional minimum pension liability, net of tax | | — | | | | — | | | — | | | — | | | (974 | ) | | — | | | — | | | (974 | ) |
| | | | | | | | | | | | | | | | | | | | | | | | |
|
|
Total comprehensive income | | | | | | | | | | | | | | | | | | | | | | | | 109,920 | |
| | | | | | | | | | | | | | | | | | | | | | | | |
|
|
Cash portion of nonqualified patronage refund | | — | | | | — | | | — | | | (5,894 | ) | | — | | | — | | | — | | | (5,894 | ) |
Patronage equity redemptions and other changes | | — | | | | — | | | — | | | (2,850 | ) | | — | | | (458 | ) | | — | | | (3,308 | ) |
| | |
|
| |
|
|
| |
|
| |
|
| |
|
| |
|
| |
|
| |
|
|
June 26, 2004 | | 2 | | | $ | 2 | | | — | | | 219,964 | | | (44,422 | ) | | 109,071 | | | — | | | 284,615 | |
Comprehensive income: | | | | | | | | | | | | | | | | | | | | | | | | | |
Net income | | — | | | | — | | | — | | | 15,548 | | | — | | | 18,470 | | | — | | | 34,018 | |
Decrease in minimum pension liability, net of tax | | — | | | | — | | | — | | | — | | | 2,104 | | | — | | | — | | | 2,104 | |
| | | | | | | | | | | | | | | | | | | | | | | | |
|
|
Total comprehensive income | | | | | | | | | | | | | | | | | | | | | | | | 36,122 | |
| | | | | | | | | | | | | | | | | | | | | | | | |
|
|
Cash portion of nonqualified patronage refund | | — | | | | — | | | — | | | (2,340 | ) | | — | | | — | | | — | | | (2,340 | ) |
Patronage equity redemptions and other changes | | — | | | | — | | | — | | | (603 | ) | | — | | | (246 | ) | | — | | | (849 | ) |
| | |
|
| |
|
|
| |
|
| |
|
| |
|
| |
|
| |
|
| |
|
|
October 2, 2004 | | 2 | | | $ | 2 | | | — | | | 232,569 | | | (42,318 | ) | | 127,295 | | | — | | | 317,548 | |
Comprehensive income: | | | | | | | | | | | | | | | | | | | | | | | | | |
Net income | | — | | | | — | | | — | | | — | | | — | | | 112,246 | | | — | | | 112,246 | |
Additional minimum pension liability, net of tax | | — | | | | — | | | — | | | — | | | (18,947 | ) | | — | | | — | | | (18,947 | ) |
| | | | | | | | | | | | | | | | | | | | | | | | |
|
|
Total comprehensive income | | | | | | | | | | | | | | | | | | | | | | | | 93,299 | |
| | | | | | | | | | | | | | | | | | | | | | | | |
|
|
Patronage equity redemptions and other changes | | — | | | | — | | | — | | | (825 | ) | | — | | | — | | | — | | | (825 | ) |
Common stock issued and cash distributions to members/equity holders related to conversion from cooperative association to for-profit corporation | | 36,394 | | | | 362 | | | 252,714 | | | (231,744 | ) | | — | | | (127,295 | ) | | — | | | (105,963 | ) |
Initial public offering of common stock, net of expenses | | 13,600 | | | | 136 | | | 137,056 | | | — | | | — | | | — | | | — | | | 137,192 | |
Share-based compensation programs | | 1,086 | | | | 11 | | | 10,009 | | | — | | | — | | | — | | | — | | | 10,020 | |
Treasury stock acquired | | (30 | ) | | | — | | | — | | | — | | | — | | | — | | | (383 | ) | | (383 | ) |
Other changes | | — | | | | — | | | (160 | ) | | — | | | — | | | — | | | — | | | (160 | ) |
| | |
|
| |
|
|
| |
|
| |
|
| |
|
| |
|
| |
|
| |
|
|
October 1, 2005 | | 51,052 | | | $ | 511 | | | 399,619 | | | — | | | (61,265 | ) | | 112,246 | | | (383 | ) | | 450,728 | |
| | |
|
| |
|
|
| |
|
| |
|
| |
|
| |
|
| |
|
| |
|
|
See Accompanying Notes to Consolidated Financial Statements.
32
GOLD KIST INC.
CONSOLIDATED STATEMENTS OF CASH FLOWS
(Dollar Amounts in Thousands)
| | | | | | | | | | | | | |
| | | Fiscal Years Ended
| | | Transition
Quarter
Ended
| | | Fiscal Year
Ended
| |
| | | June 28,
2003
| | | June 26,
2004
| | | October 2,
2004
| | | October 1,
2005
| |
Cash flows from operating activities: | | | | | | | | | | | | | |
Net income (loss) from continuing operations | | $ | (51,452 | ) | | 110,894 | | | 34,018 | | | 112,246 | |
Adjustments to reconcile net income (loss) to cash provided by operating activities of continuing operations: | | | | | | | | | | | | | |
Depreciation and amortization | | | 39,495 | | | 39,592 | | | 10,030 | | | 43,144 | |
Amortization of share-based compensation | | | — | | | — | | | — | | | 9,795 | |
Loss on investments | | | 24,064 | | | 57,364 | | | — | | | 2,500 | |
Benefit plans curtailment (gains) and settlement losses | | | (20,257 | ) | | 10,288 | | | — | | | 906 | |
Postretirement benefit plans expense in excess of (less than) funding | | | 1,422 | | | 2,527 | | | (12,763 | ) | | (16,068 | ) |
Deferred income tax expense (benefit) | | | (14,850 | ) | | 28,696 | | | 10,356 | | | 3,695 | |
Other | | | 999 | | | (1,491 | ) | | (1,215 | ) | | 791 | |
Changes in operating assets and liabilities: | | | | | | | | | | | | | |
Receivables | | | 5,771 | | | (32,972 | ) | | 22,639 | | | (10,374 | ) |
Inventories | | | (5,598 | ) | | (36,177 | ) | | (5,987 | ) | | 5,211 | |
Other current assets | | | 2,994 | | | (8,522 | ) | | (1,594 | ) | | 7,861 | |
Accounts payable, accrued expenses and other liabilities | | | 518 | | | 48,482 | | | 20,208 | | | 17,935 | |
| | |
|
|
| |
|
| |
|
| |
|
|
Net cash provided by (used in) operating activities of continuing operations | | | (16,894 | ) | | 218,681 | | | 75,692 | | | 177,642 | |
Net cash used in operating activities of discontinued operations | | | (18,381 | ) | | — | | | — | | | — | |
| | |
|
|
| |
|
| |
|
| |
|
|
Net cash provided by (used in) operating activities | | | (35,275 | ) | | 218,681 | | | 75,692 | | | 177,642 | |
| | |
|
|
| |
|
| |
|
| |
|
|
Cash flows from investing activities: | | | | | | | | | | | | | |
Acquisitions of property, plant and equipment | | | (34,651 | ) | | (42,210 | ) | | (25,160 | ) | | (80,760 | ) |
Dispositions of investments | | | 482 | | | 195 | | | 793 | | | 3,809 | |
Proceeds from termination of life insurance policies | | | 7,537 | | | — | | | — | | | 2,790 | |
Other | | | (408 | ) | | 4,452 | | | 553 | | | 3,484 | |
| | |
|
|
| |
|
| |
|
| |
|
|
Net cash used in investing activities | | | (27,040 | ) | | (37,563 | ) | | (23,814 | ) | | (70,677 | ) |
| | |
|
|
| |
|
| |
|
| |
|
|
Cash flows from financing activities: | | | | | | | | | | | | | |
Short-term debt repayments, net | | | (10,000 | ) | | — | | | — | | | — | |
Proceeds from long-term debt | | | 202,920 | | | 196,940 | | | — | | | — | |
Principal repayments of long-term debt | | | (123,017 | ) | | (240,485 | ) | | (1,914 | ) | | (158,266 | ) |
Payments of deferred financing costs | | | (3,007 | ) | | (7,965 | ) | | (444 | ) | | (1,017 | ) |
Patronage refunds and other equity paid in cash | | | (7,601 | ) | | (3,935 | ) | | (6,719 | ) | | (3,165 | ) |
Proceeds from initial public offering, net of expenses | | | — | | | — | | | — | | | 139,876 | |
Cash distributions to members and equity holders | | | — | | | — | | | — | | | (105,963 | ) |
Treasury stock acquired | | | — | | | — | | | — | | | (383 | ) |
Proceeds and (repayments) from life insurance policy borrowings | | | 5,049 | | | — | | | (4,211 | ) | | — | |
Other | | | — | | | — | | | — | | | 225 | |
| | |
|
|
| |
|
| |
|
| |
|
|
Net cash provided by (used in) financing activities | | | 64,344 | | | (55,445 | ) | | (13,288 | ) | | (128,693 | ) |
| | |
|
|
| |
|
| |
|
| |
|
|
Net change in cash and cash equivalents | | | 2,029 | | | 125,673 | | | 38,590 | | | (21,728 | ) |
Cash and cash equivalents at beginning of period | | | 8,997 | | | 11,026 | | | 136,699 | | | 175,289 | |
| | |
|
|
| |
|
| |
|
| |
|
|
Cash and cash equivalents at end of period | | $ | 11,026 | | | 136,699 | | | 175,289 | | | 153,561 | |
| | |
|
|
| |
|
| |
|
| |
|
|
Supplemental disclosure of cash flow information: | | | | | | | | | | | | | |
Cash paid (received) during the years for: | | | | | | | | | | | | | |
Interest (net of amounts capitalized) | | $ | 25,571 | | | 36,918 | | | 13,712 | | | 37,102 | |
| | |
|
|
| |
|
| |
|
| |
|
|
Income taxes, net | | $ | (5,855 | ) | | 20,177 | | | (10,663 | ) | | 31,404 | |
| | |
|
|
| |
|
| |
|
| |
|
|
See Accompanying Notes to Consolidated Financial Statements.
33
GOLD KIST INC.
NOTES TO CONSOLIDATED FINANCIAL STATEMENTS
June 28, 2003, June 26, 2004, October 2, 2004 and October 1, 2005
(Amounts in Thousands, Except Share Amounts)
(1) Description of Business and Summary of Significant Accounting Policies
Gold Kist Inc. operates a fully-integrated broiler production, processing and marketing business. Our broiler production operations include nine broiler complexes located in Alabama, Florida, Georgia, North Carolina and South Carolina. Each complex operates in a different geographic region and includes pullet and breeder flocks, broiler flocks, one or more hatcheries, one or more feed mills and one or more poultry processing plants. Three complexes also have rendering plants to process by-products. Our broiler products include whole broilers, cut-up broilers, segregated broiler parts and further-processed products packaged in various forms, including fresh bulk ice pack, chill pack and frozen. We sell our products to customers in the retail, industrial, foodservice and export markets.
The accompanying consolidated financial statements reflect the accounts of Gold Kist Inc. and its subsidiaries (“Gold Kist” or the “Company”) as of June 26, 2004 and October 1, 2005 and for the fiscal years ended June 28, 2003 and June 26, 2004, the period from June 27, 2004 to October 2, 2004 (the “transition quarter ended October 2, 2004”) and the fiscal year ended October 1, 2005. These consolidated financial statements have been prepared in accordance with U.S. generally accepted accounting principles and the instructions to Form 10-K. All significant intercompany balances and transactions have been eliminated in consolidation.
The Company employs a 52/53-week fiscal year. On October 20, 2004, the Board of Directors of the Company approved changing the fiscal year-end of the Company from the Saturday after the last Thursday in June to the Saturday after the last Thursday in September. Fiscal 2005 is a 52-week year that began October 3, 2004 and ended October 1, 2005.
The accounting and reporting policies of Gold Kist Inc. and subsidiaries conform to U.S. generally accepted accounting principles. The following is a summary of the significant accounting policies.
(a) Cash and Cash Equivalents
Gold Kist’s policy is to invest cash in excess of operating requirements in highly liquid interest bearing debt instruments, which include commercial paper and reverse repurchase agreements or money market funds that invest in such securities. These investments are stated at cost, which approximates market. For purposes of the consolidated statements of cash flows, Gold Kist considers all highly liquid debt instruments purchased with original maturities of three months or less to be cash equivalents.
The Company has classified checks issued but not yet presented for payment as accounts payable in the Company’s consolidated balance sheets.
(b) Receivables
Receivables are principally trade, and are stated net of an allowance for doubtful accounts of $1.4 million and $1.1 million as of June 26, 2004 and October 1, 2005, respectively.
(c) Inventories
Live poultry and hogs consist of broilers, market hogs and breeding stock. The broilers and market hogs are stated at the lower of average cost or market. The breeding stock is stated at average cost, less accumulated amortization.
34
GOLD KIST INC.
NOTES TO CONSOLIDATED FINANCIAL STATEMENTS—(Continued)
June 28, 2003, June 26, 2004, October 2, 2004 and October 1, 2005
(Amounts in Thousands)
Raw materials and supplies consist of feed ingredients, hatching eggs, packaging materials and operating supplies. These inventories are stated on the basis of the lower of cost (first-in, first-out or average) or market.
Gold Kist engages in commodity futures and options transactions to manage the risk of adverse price fluctuations with regard to its feed ingredient purchases. The Company’s derivatives include agricultural related forward purchase contracts, futures and options transactions. Changes in the fair value of these derivatives, except for forward purchase contracts on which the Company takes physical delivery, have been recorded through earnings.
Marketable products consist primarily of dressed and further processed poultry. The Company has historically accounted for marketable products inventory principally at selling prices less estimated brokerage, freight and certain other selling costs where applicable (estimated net realizable value). The Company has begun to focus its growth efforts and production on further-processed or value-added poultry products and anticipates that an increasing amount of its poultry sales will be from further-processed products. As such, the Company began accounting for its marketable products inventory at the lower of cost or market during fiscal 2004.
(d) Revenue Recognition
Revenue is recognized upon product shipment and transfer of title and risk of loss to the customer. Revenue is recorded net of any discounts, allowances or promotions. Estimates for any special pricing arrangements, promotions or other volume-based incentives are recorded upon shipment of the product in accordance with the terms of the promotion, allowance or pricing arrangements. Shipping and handling costs are included in cost of sales in the accompanying consolidated statements of operations.
One customer, a major grocery chain, accounted for 11.9% in fiscal 2003, 11.1% in fiscal 2004, 11.3% for the transition quarter ended October 2, 2004 and 12.3% in fiscal 2005 of net sales.
(e) Property, Plant and Equipment
Property, plant and equipment are recorded at cost. Depreciation of plant and equipment is calculated using the straight-line method over the estimated useful lives of the respective assets as follows.
| | |
Land improvements | | 5 – 10 Years |
Buildings | | 10 – 25 Years |
Machinery and equipment | | 3 – 10 Years |
(f) Income Taxes
Gold Kist operated as an agricultural cooperative not exempt from Federal income taxes through October 12, 2004. Aggregate income not refunded in cash to members or allocated in the form of qualified written notices was subject to income taxes.
The bylaws of Gold Kist provided for the issuance of either qualified or nonqualified patronage refunds (as defined for purposes of Subchapter T of the Internal Revenue Code). Gold Kist utilized nonqualified patronage refunds, which are deductible for income tax purposes only to the extent paid or redeemed in cash.
35
GOLD KIST INC.
NOTES TO CONSOLIDATED FINANCIAL STATEMENTS—(Continued)
June 28, 2003, June 26, 2004, October 2, 2004 and October 1, 2005
(Amounts in Thousands, Except Share Amounts)
Income taxes are accounted for under the asset and liability method. Deferred tax assets and liabilities are recognized for the future tax consequences attributable to differences between the financial statement carrying amounts of existing assets and liabilities and their respective tax bases and operating loss and tax credit carryforwards. Deferred tax assets and liabilities are measured using enacted tax rates expected to apply to taxable income in the years in which those temporary differences are expected to be recovered or settled. The effect on deferred tax assets and liabilities of a change in tax rates is recognized as income or expense in the period that includes the enactment date.
(g) Fair Value of Financial Instruments
Gold Kist’s financial instruments include cash and cash equivalents, receivables, accounts payable and accrued expenses, interest left on deposit, notes receivable and debt. Because of the short maturity of cash equivalents, receivables, accounts payable and accrued expenses, interest left on deposit, and certain short-term debt and certain long-term debt bearing variable interest rates, the carrying value of these financial instruments approximates fair value. All financial instruments are considered to have an estimated fair value, which approximates carrying value at June 26, 2004 and October 1, 2005 unless otherwise specified (see note 5).
(h) Impairment of Long-Lived Assets and Long-Lived Assets to Be Disposed Of
Gold Kist reviews long-lived assets and certain identifiable intangibles for impairment whenever events or changes in circumstances indicate that the carrying amount of an asset may not be recoverable. Recoverability of assets to be held and used is measured by a comparison of the carrying amount of an asset to future net undiscounted cash flows expected to be generated by the asset. If such assets are considered to be impaired, the impairment to be recognized is measured by the amount by which the carrying amount of the assets exceeds the fair value of the assets. Assets to be disposed of are reported at the lower of the carrying amount or fair value less costs to sell.
(i) Comprehensive Income (Loss)
Comprehensive income (loss) consists of net income (loss) and pension liability adjustments, net of tax, and is presented in the Consolidated Statements of Patrons’ and Other Equity/Stockholders’ Equity and Comprehensive Income (Loss).
(j) Goodwill
Goodwill represents the excess of costs over fair value of businesses acquired. The Company annually tests for impairment. Approximately $20 million of goodwill is included in other assets in the accompanying consolidated balance sheets at June 26, 2004 and October 1, 2005. Based upon its annual assessment, the Company has determined that the fair value of its assets exceeded their carrying value, including the goodwill.
(k) Accrued Insurance Costs
The Company retains for certain losses related to property, fleet, product and general liability, worker’s compensation and employee medical benefits. Stop loss coverage for claims exceeding the self-retention level is maintained with third party insurers. Estimates of the ultimate cost of claims incurred are accrued based on historical data and estimated future costs. Certain claim categories such as workers compensation and employee medical benefits are actuarially determined. While the Company believes these estimates are reasonable based on the information available, actual costs could differ and materially impact results of operations and financial position.
36
GOLD KIST INC.
NOTES TO CONSOLIDATED FINANCIAL STATEMENTS—(Continued)
June 28, 2003, June 26, 2004, October 2, 2004 and October 1, 2005
(Amounts in Thousands)
Certain fleet, product and general liability and workers compensation claims are insured and losses retained through GK Insurance Company, a wholly owned captive insurance company whose accounts are consolidated in the Company’s accompanying consolidated financial statements. GK Insurance Company purchases reinsurance through a reinsurance company. In conjunction with the reinsurance agreement, GK Insurance Company assumes a share of the insurance activity, which includes premiums, losses and other expenses, from other participants in the reinsurance company. Loss reserves associated with the reinsurance program are actuarially determined and are included within the accrued insurance cost balances on the accompanying consolidated balance sheets.
(l) Contingent Liabilities
The Company is subject to laws related to environmental, litigation, regulatory and other matters. The Company assesses these matters as to the likelihood of adverse outcomes and as to the range of possible losses. The recognition of any reserve is based upon a specific assessment of these matters and includes an estimate of legal and consulting expenses, if applicable. Contingent liabilities are recorded on an undiscounted basis and amounts recognized are subject to change dependent on changes in facts and assumptions related to the contingency.
(m) Share-Based Compensation
The Company adopted Statement of Financial Accounting Standards Number 123(r), “Share-Based Payment,” (SFAS No. 123(r)) in fiscal 2005. The Company determined its share-based payments to be equity classified with the measurement of payment at fair value. The share-based compensation is being amortized ratably over the requisite service periods.
(n) Fiscal Year
Gold Kist employs a 52/53-week fiscal year. The consolidated financial statements for fiscal years 2003, 2004 and 2005 each reflect 52 weeks. The transition quarter ended October 2, 2004 consisted of fourteen weeks. Fiscal 2006 will be a 52-week year.
(o) Use of Estimates
Management of Gold Kist has made a number of estimates and assumptions relating to the reporting of assets and liabilities and the disclosure of contingent assets and liabilities as of the balance sheet dates and the reporting of revenue and expenses during the periods to prepare these consolidated financial statements in conformity with U.S. generally accepted accounting principles. Actual results could differ materially from these estimates.
(2) Conversion and Initial Public Offering
On October 13, 2004, after completion of required approvals and conditions, the Plan of Conversion (the “Plan”) of Gold Kist Inc., a Georgia cooperative marketing association, became effective and Gold Kist converted from a cooperative marketing association to a for-profit business corporation through a merger into a wholly owned subsidiary, Gold Kist Holdings Inc., a Delaware corporation. In connection with the conversion, Gold Kist Holdings Inc. changed its name to Gold Kist Inc.
The conversion was accounted for using the historical carrying values of the assets and liabilities of Gold Kist. Immediately following the conversion and the initial public offering of common stock, Gold Kist’s
37
GOLD KIST INC.
NOTES TO CONSOLIDATED FINANCIAL STATEMENTS—(Continued)
June 28, 2003, June 26, 2004, October 2, 2004 and October 1, 2005
(Amounts in Thousands)
cooperative membership common stock and patronage reserves were reclassified to par value of common stock and additional paid-in capital.
On October 13, 2004, the date the conversion became effective, all patronage interests in Gold Kist were extinguished and the members and former member equity holders of Gold Kist became entitled to receive consideration in the form of Gold Kist common stock or cash, or both, as provided in the Plan. Patronage earnings from the end of the transition quarter ended October 2, 2004 to October 13, 2004, the date of the conversion, were not significant. Pursuant to the conversion, approximately 36.4 million shares of common stock and $106.0 million in cash were issued and distributed in December 2004 to members and former member equity holders. Costs of the conversion were expensed as incurred.
Also on October 13, 2004, Gold Kist completed an initial public offering of 12 million shares of common stock, par value $0.01 per share, at an initial public offering price of $11.00 per share. In November 2004, the underwriters exercised their overallotment option to purchase an additional 1.6 million shares at the offering price of $11.00 per share. After underwriting discounts and other expenses, net proceeds from the common stock offering were approximately $137.2 million.
(3) Inventories
Inventories are summarized as follows:
| | | | | |
| | | June 26,
2004
| | October 1,
2005
|
Live poultry and hogs | | $ | 110,535 | | 99,935 |
Raw materials and supplies | | | 52,749 | | 52,243 |
Marketable products | | | 69,621 | | 81,503 |
| | |
|
| |
|
| | | $ | 232,905 | | 233,681 |
| | |
|
| |
|
Live poultry and hogs consist of broilers, market hogs and breeding stock. Broilers are stated at the lower of cost or market and breeders are stated at cost less accumulated amortization. Costs include live production costs (principally feed, chick cost, medications and other raw materials), labor and production overhead. Breeder costs include acquisition of chicks from parent stock breeders, feed, medication, labor and production costs that are accumulated up to the production stage and then amortized over their estimated useful life of thirty-six weeks. Market hogs include costs of feed, medication, feeder pigs, labor and production overhead. Pork breeder herds include cost of breeder gilts acquired from parent stockbreeders, feed, medications and production costs that are accumulated up to production stage and then amortized over twenty-four months. The pork breeders are included in other assets—noncurrent in the consolidated balance sheets. If market prices for inventories move below carrying value, the Company records adjustments to write down the carrying values of these inventories.
Raw materials and supplies consist of feed ingredients, hatching eggs, packaging materials and operating supplies. These inventories are stated at the lower of cost (first-in, first-out or average) or market. Gold Kist engages in forward purchase contracts and commodity futures and options transactions to secure necessary feed ingredient requirements and manage the risk of adverse price fluctuations with regard to its feed ingredient purchases. Changes in the fair value of these derivatives, except for forward purchase contracts, have been recorded through net income.
Marketable products consist primarily of dressed and further processed poultry. The Company accounts for its marketable products inventory at the lower of cost or market.
38
GOLD KIST INC.
NOTES TO CONSOLIDATED FINANCIAL STATEMENTS—(Continued)
June 28, 2003, June 26, 2004, October 2, 2004 and October 1, 2005
(Amounts in Thousands)
(4) Property, Plant and Equipment
Property, plant and equipment is summarized as follows:
| | | | | |
| | | June 26,
2004
| | October 1,
2005
|
Land and land improvements | | $ | 32,105 | | 35,962 |
Buildings | | | 213,598 | | 243,263 |
Machinery and equipment | | | 436,807 | | 467,678 |
Construction in progress | | | 13,726 | | 23,913 |
| | |
|
| |
|
| | | | 696,236 | | 770,816 |
Less accumulated depreciation | | | 464,579 | | 484,301 |
| | |
|
| |
|
| | | $ | 231,657 | | 286,515 |
| | |
|
| |
|
Depreciation and amortization included in cost of goods sold in the accompanying consolidated statements of operations were $34.8 million, $33.7 million, $8.8 million and $34.2 million for fiscal 2003, fiscal 2004, the transition quarter ended October 2, 2004 and fiscal 2005, respectively. Interest capitalized into construction projects was $1.9 million for fiscal 2005, with amounts for other periods insignificant.
(5) Notes Payable and Long-Term Debt
In March 2004, the Company issued the senior notes due 2014 in a private offering pursuant to Rule 144A and Regulation S of the Securities Act of 1933 in the principal amount of $200 million and subsequently exchanged the senior notes for identical registered notes. The stated interest rate on the senior notes is 10.25%, with interest payable semi-annually on March 15 and September 15. The senior notes were issued at a price of 98.47% and are reflected net of discount in the accompanying consolidated balance sheets. The discount amount is being amortized to interest expense over the ten-year term of the senior notes under the interest method, yielding an effective interest rate of approximately 10.50%.
The Company repaid $70.0 million of principal of the senior notes, plus $7.2 million in prepayment interest, in November 2004 with a portion of the proceeds from Gold Kist’s initial public offering completed in October 2004 (see Note 2). In connection with this prepayment, $1.0 million of the discount and $1.8 million of deferred financing costs were written off and recognized in the consolidated statement of operations for fiscal 2005.
Concurrent with the issuance of the senior notes, the Company amended its Senior Secured Credit Facility to provide for a revolving line of credit in an aggregate principal amount of $125 million, including a sub-facility of up to $60 million for letters of credit, for a term of three years. The interest rate on the facility ranges from 1.00% to 2.00% over the prime rate for base rate advances or 2.25% to 3.25% over the London InterBank Offered Rate (LIBOR) for Eurodollar advances, adjusted quarterly based on the Company’s financial position. Borrowings under the facility will be limited to the lesser of $125 million and a borrowing base determined by reference to a percentage of the collateral value of the accounts receivable and inventories securing the facility. As of October 1, 2005, there was approximately $83.0 million available for borrowing under this facility. Approximately $42.0 million of letters of credit are outstanding under the facility.
During fiscal 2005, the Company repaid the term loans with an agricultural credit bank totaling $34.0 million, the industrial revenue bond of $7.5 million and the Series B and Series C exchange notes with an
39
GOLD KIST INC.
NOTES TO CONSOLIDATED FINANCIAL STATEMENTS—(Continued)
June 28, 2003, June 26, 2004, October 2, 2004 and October 1, 2005
(Amounts in Thousands)
insurance company in the amount of $35.0 million. In connection with the repayment of this indebtedness, approximately $6.2 million in prepayment interest was also paid.
The Company’s debt agreements place a limitation on capital expenditures, cash dividends, commodity hedging contracts and additional loans, advances or investments. The terms of debt agreements (other than the senior notes) contain financial covenants, including those that specify minimum consolidated tangible net worth, current ratio and coverage ratio requirements. At October 1, 2005, the Company was in compliance with all applicable loan covenants under its senior notes and credit facilities.
Notes payable and long-term debt is summarized as follows:
| | | | | |
| | | June 26,
2004
| | October 1,
2005
|
Senior notes, due 2014 | | $ | 197,016 | | 128,307 |
Series B senior exchange notes, repaid in September 2005 | | | 21,818 | | — |
Series C senior exchange notes, repaid in September 2005 | | | 18,182 | | — |
Term loan agreement with agricultural credit bank, repaid in September 2005 | | | 30,365 | | — |
Term loan agreement with agricultural credit bank, repaid in February 2005 | | | 9,000 | | — |
Subordinated capital certificates of interest with original fixed maturities ranging from seven to fifteen years, unsecured (weighted average interest rate of 8.14% at June 26, 2004 and 8.06% at October 1, 2005) | | | 17,764 | | 14,945 |
Tax exempt industrial revenue bond repaid in April 2005 | | | 7,500 | | — |
Mortgage loans, due in monthly installments to January 2010, secured by an office building (weighted average interest rate of 5.77% at June 26, 2004 and 5.06% at October 1, 2005) | | | 2,476 | | 1,980 |
| | |
|
| |
|
| | | | 304,121 | | 145,232 |
Less current maturities | | | 21,167 | | 1,518 |
| | |
|
| |
|
| | | $ | 282,954 | | 143,714 |
| | |
|
| |
|
Annual required principal repayments on notes payable and long-term debt for the five years subsequent to October 1, 2005 and thereafter are as follows:
| | | |
Fiscal year: | | | |
2006 | | $ | 1,518 |
2007 | | | 2,278 |
2008 | | | 3,875 |
2009 | | | 2,562 |
2010 | | | 1,171 |
Thereafter | | | 133,828 |
| | |
|
|
| | | $ | 145,232 |
| | |
|
|
Based upon discounted cash flows of future payments, assuming interest rates available to Gold Kist for issuance of debt with similar terms and remaining maturities, the estimated fair value of the senior notes due 2014 was $219.0 million at June 26, 2004 and $147.3 million at October 1, 2005.
40
GOLD KIST INC.
NOTES TO CONSOLIDATED FINANCIAL STATEMENTS—(Continued)
June 28, 2003, June 26, 2004, October 2, 2004 and October 1, 2005
(Amounts in Thousands, Except Share Amounts)
(6) Leases and Other Commitments
Gold Kist leases vehicles, transportation and processing equipment and certain facilities from third parties under operating leases, many of which contain renewal options. Rent expense for fiscal 2003, fiscal 2004, the transition quarter ended October 2, 2004 and fiscal 2005 was $27.4 million, $24.5 million, $6.9 million and $28.2 million, respectively. Commitments for minimum rentals under non-cancelable operating leases at October 1, 2005 are as follows:
| | | |
Fiscal year: | | | |
2006 | | $ | 16,152 |
2007 | | | 14,349 |
2008 | | | 12,163 |
2009 | | | 9,389 |
2010 | | | 3,250 |
Thereafter | | | 1,750 |
| | |
|
|
| | | $ | 57,053 |
| | |
|
|
Gold Kist contracts with broiler, breeder, pullet, layer, hog and nursery pig producers. Although these contracts are subject to acceptable grower performance on a flock-to-flock or herd-to-herd basis, the contracts contemplate the grow out activity to continue through the periods covered by the grower contracts. Annual grower pay averages approximately $245.0 million per year with the actual amounts determined by relative performance, fuel adjustments and other factors.
The Company has feed ingredient purchase commitments and construction contract commitments in the ordinary course of business amounting to $122.5 million and $38.2 million at October 1, 2005, respectively.
(7) Income Taxes
Total income tax expense (benefit) was allocated as follows:
| | | | | | | | | | | | |
| | | Fiscal Years Ended
| | | Transition
Quarter Ended
| | Fiscal
Year Ended
| |
| | | June 28,
2003
| | | June 26,
2004
| | | October 2,
2004
| | October 1,
2005
| |
Net income (loss) | | $ | (17,307 | ) | | 41,817 | | | 18,772 | | 61,591 | |
Other comprehensive income (loss)—pension liability adjustment | | | (24,599 | ) | | (581 | ) | | 1,253 | | (11,516 | ) |
| | |
|
|
| |
|
| |
| |
|
|
| | | $ | (41,906 | ) | | 41,236 | | | 20,025 | | 50,075 | |
| | |
|
|
| |
|
| |
| |
|
|
The provisions for income tax expense (benefit), principally Federal, related to net income (loss) consist of the following:
| | | | | | | | | | |
| | | Fiscal Years Ended
| | Transition
Quarter Ended
| | Fiscal
Year Ended
|
| | | June 28,
2003
| | | June 26,
2004
| | October 2,
2004
| | October 1,
2005
|
Current expense (benefit) | | $ | (2,457 | ) | | 13,121 | | 8,416 | | 57,896 |
Deferred expense (benefit) | | | (14,850 | ) | | 28,696 | | 10,356 | | 3,695 |
| | |
|
|
| |
| |
| |
|
| | | $ | (17,307 | ) | | 41,817 | | 18,772 | | 61,591 |
| | |
|
|
| |
| |
| |
|
41
GOLD KIST INC.
NOTES TO CONSOLIDATED FINANCIAL STATEMENTS—(Continued)
June 28, 2003, June 26, 2004, October 2, 2004 and October 1, 2005
(Amounts in Thousands)
Gold Kist’s combined Federal and state effective tax rate for fiscal 2003, fiscal 2004, the transition quarter ended October 2, 2004 and fiscal 2005 was 25%, 27%, 36% and 35%, respectively. A reconciliation of income tax expense (benefit) allocated to net income (loss) computed by applying the Federal corporate income tax rate of 35% in fiscal 2003, fiscal 2004, the transition quarter ended October 2, 2004 and fiscal 2005 to net income (loss) before income taxes for the applicable year follows:
| | | | | | | | | | | | | |
| | | Fiscal Years Ended
| | | Transition
Quarter Ended
| | | Fiscal
Year Ended
| |
| | | June 28,
2003
| | | June 26,
2004
| | | October 2,
2004
| | | October 1,
2005
| |
Computed expected income tax expense (benefit) | | $ | (24,066 | ) | | 53,449 | | | 18,477 | | | 60,843 | |
Differences resulting from: | | | | | | | | | | | | | |
Cash portion of nonqualified patronage refund | | | — | | | (2,063 | ) | | (819 | ) | | — | |
Change in deferred tax valuation allowance | | | 10,331 | | | (10,301 | ) | | 126 | | | 17 | |
Effect of state income taxes, net of Federal effect | | | 656 | | | 15 | | | 809 | | | 4,730 | |
Nonqualified equity redemptions | | | (1,644 | ) | | (1,092 | ) | | (219 | ) | | — | |
Employment credits | | | (312 | ) | | (404 | ) | | (13 | ) | | (2,586 | ) |
Other, net | | | (2,272 | ) | | 2,213 | | | 411 | | | (1,413 | ) |
| | |
|
|
| |
|
| |
|
| |
|
|
| | | $ | (17,307 | ) | | 41,817 | | | 18,772 | | | 61,591 | |
| | |
|
|
| |
|
| |
|
| |
|
|
The tax effects of temporary differences that give rise to significant portions of the deferred tax assets and deferred tax liabilities at June 26, 2004 and October 1, 2005 are as follows:
| | | | | | | |
| | | June 26, 2004
| | | October 1, 2005
| |
Deferred tax assets: | | | | | | | |
Postretirement benefits | | $ | 29,093 | | | 36,787 | |
Insurance accruals | | | 11,905 | | | 6,908 | |
Inventories | | | 4,961 | | | 1,049 | |
Allowance for doubtful accounts | | | 1,469 | | | 524 | |
State tax credits and operating loss carryforwards | | | 2,599 | | | 3,980 | |
Other assets | | | 4,599 | | | 2,334 | |
Share-based compensation | | | — | | | 3,342 | |
Other | | | 1,708 | | | 3,111 | |
| | |
|
|
| |
|
|
Total gross deferred tax assets | | | 56,334 | | | 58,035 | |
Less valuation allowance | | | (429 | ) | | (572 | ) |
| | |
|
|
| |
|
|
Total net deferred tax assets | | | 55,905 | | | 57,463 | |
| | |
|
|
| |
|
|
Deferred tax liabilities: | | | | | | | |
Accelerated depreciation | | | (4,997 | ) | | (7,130 | ) |
Deferred compensation | | | (10,366 | ) | | (13,694 | ) |
| | |
|
|
| |
|
|
Total deferred tax liabilities | | | (15,363 | ) | | (20,824 | ) |
| | |
|
|
| |
|
|
Net deferred tax assets | | $ | 40,542 | | | 36,639 | |
| | |
|
|
| |
|
|
The net change in the total valuation allowance for fiscal 2004 was a decrease of $10,301. In June 2004, the Company abandoned its entire interest in an investment in another cooperative and recognized an ordinary loss
42
GOLD KIST INC.
NOTES TO CONSOLIDATED FINANCIAL STATEMENTS—(Continued)
June 28, 2003, June 26, 2004, October 2, 2004 and October 1, 2005
(Amounts in Thousands)
deduction in the amount of its tax basis of $98.6 million. An $8.4 million valuation allowance on the deferred tax asset related to previous write downs of this investment was reversed in June 2004. The net change for the transition quarter ended October 2, 2004 and fiscal 2005 was an increase of $126 and $17, respectively. The Company’s management believes the existing net deductible temporary differences comprising the total net deferred tax assets will reverse during periods in which the Company generates net taxable income. Approximately $98.1 million of net taxable income would be required to fully utilize the net deferred tax assets. Taxable income in the past three years for income tax purposes totaled $214.6 million.
The Company’s income tax returns will reflect a tax benefit of approximately $26.1 million related to the cash distributions to former equityholders in redemption of nonqualified patronage equity prior to the conversion of the Company from a cooperative marketing association to a for-profit business corporation. Such benefit has not been reflected in the accompanying consolidated financial statements at October 1, 2005.
(8) Employee Benefits
Pension Plans
Gold Kist has noncontributory defined benefit pension plans covering substantially all of its employees, as well as former directors with ten years of service (participants). The plan provisions covering the salaried participants provide pension benefits that are based on the employees’ compensation and service before retirement or other termination of employment. The plan provisions covering the hourly participants provide pension benefits that are based on years of credited service. Gold Kist’s funding policy is to contribute within the guidelines prescribed by Federal regulations. Plan assets consist principally of corporate equities and bonds, and U.S. Government and Agency obligations.
Effective January 1, 2004, the Company’s pension plan was prospectively amended. For benefits earned in calendar 2004 and future years, the basic pension formula was changed from 50% to 45% of final average earnings, early retirement benefits were reduced and other changes were made. The pension benefits earned by employees through calendar 2003 were unchanged.
The Company recognized $10.3 million and $0.9 million of pension settlement accounting expense in fiscal 2004 and fiscal 2005, respectively. The settlement accounting expense is due to lump sum distribution payments from the plans to electing retiring employees exceeding service and interest cost components of pension expense in the plan year.
Medical and Life Insurance Plans
In October 2002, the Company substantially curtailed its postretirement life insurance plans and in April 2003, the Company substantially curtailed its postretirement medical plan for existing retirees. Retired employees eligible under the plan between the ages of 55 and 65 could continue their coverage at rates above the average cost of the medical insurance plan for active employees. Curtailment gains of $20.3 million are reflected in the accompanying consolidated statement of operations for fiscal 2003.
43
GOLD KIST INC.
NOTES TO CONSOLIDATED FINANCIAL STATEMENTS—(Continued)
June 28, 2003, June 26, 2004, October 2, 2004 and October 1, 2005
(Amounts in Thousands)
The following table sets forth the plans’ change in benefit obligation, change in plan assets and economic assumptions for the years ended June 26, 2004 and October 1, 2005. The measurement date for these plans is March 31, 2004 and June 30, 2005, respectively.
| | | | | | | | | | | | | | |
| | | Pension Benefits
| | | Medical & Life
Insurance Benefits
| |
| | | 2004
| | | 2005
| | | 2004
| | | 2005
| |
Change in benefit obligation: | | | | | | | | | | | | | | |
Benefit obligation at beginning of year | | $ | 170,354 | | | 165,924 | | | $ | 5,260 | | | 3,863 | |
Service cost | | | 6,000 | | | 4,679 | | | | — | | | — | |
Interest cost | | | 10,446 | | | 10,000 | | | | 312 | | | 218 | |
Actuarial losses | | | 17,023 | | | 35,492 | | | | 767 | | | (556 | ) |
Benefits paid (other than settlements) | | | (4,841 | ) | | (16,002 | ) | | | (2,229 | ) | | (248 | ) |
Plan amendments | | | (7,286 | ) | | — | | | | — | | | — | |
Settlements | | | (22,018 | ) | | — | | | | — | | | — | |
| | |
|
|
| |
|
| |
|
|
| |
|
|
Benefit obligation at end of year | | | 169,678 | | | 200,093 | | | | 4,110 | | | 3,277 | |
| | |
|
|
| |
|
| |
|
|
| |
|
|
Change in plan assets: | | | | | | | | | | | | | | |
Fair value of plan assets at beginning of year | | | 108,003 | | | 104,244 | | | | — | | | — | |
Actual return on plan assets | | | 24,011 | | | 7,706 | | | | — | | | — | |
Contributions by employer | | | 1,632 | | | 36,270 | | | | 2,229 | | | 248 | |
Benefits paid (other than settlements) | | | (4,841 | ) | | (16,002 | ) | | | (2,229 | ) | | (248 | ) |
Settlements | | | (22,018 | ) | | — | | | | — | | | — | |
| | |
|
|
| |
|
| |
|
|
| |
|
|
Fair value of plan assets at end of year | | | 106,787 | | | 132,218 | | | | — | | | — | |
| | |
|
|
| |
|
| |
|
|
| |
|
|
Funded status | | | (62,891 | ) | | (67,875 | ) | | | (4,110 | ) | | (3,277 | ) |
Unrecognized prior service cost (benefit) | | | 2,730 | | | 2,131 | | | | (23,253 | ) | | (10,319 | ) |
Unrecognized net actuarial loss | | | 80,573 | | | 111,767 | | | | 18,590 | | | 9,183 | |
Contributions after the measurement date | | | 249 | | | 165 | | | | 247 | | | 105 | |
| | |
|
|
| |
|
| |
|
|
| |
|
|
Net amount recognized | | $ | 20,661 | | | 46,188 | | | $ | (8,526 | ) | | (4,308 | ) |
| | |
|
|
| |
|
| |
|
|
| |
|
|
Amounts recognized in the balance sheet: | | | | | | | | | | | | | | |
Prepaid benefit cost | | $ | — | | | — | | | $ | — | | | — | |
Accrued benefit liability | | | (53,825 | ) | | (54,450 | ) | | | (8,526 | ) | | (4,308 | ) |
Intangible asset | | | 3,592 | | | 2,864 | | | | — | | | — | |
Accumulated other comprehensive loss | | | 70,894 | | | 97,774 | | | | — | | | — | |
| | |
|
|
| |
|
| |
|
|
| |
|
|
Net amount recognized | | $ | 20,661 | | | 46,188 | | | | (8,526 | ) | | (4,308 | ) |
| | |
|
|
| |
|
| |
|
|
| |
|
|
Less current portion | | | | | | | | | | 987 | | | 347 | |
| | | | | | | | | |
|
|
| |
|
|
| | | | | | | | | | $ | (7,539 | ) | | (3,961 | ) |
| | | | | | | | | |
|
|
| |
|
|
Projected benefit obligation | | $ | 169,678 | | | 200,093 | | | | | | | | |
Accumulated benefit obligation | | | 160,862 | | | 186,668 | | | | | | | | |
Fair value of plan assets | | | 106,787 | | | 132,218 | | | | | | | | |
| | | | |
Weighted-average assumptions used to determine benefit obligation: | | | | | | | | | | | | | | |
Discount rate | | | 6.00 | % | | 5.25 | % | | | 6.00 | % | | 5.25 | % |
Rate of increase in compensation levels | | | 4.01 | % | | 4.01 | % | | | — | | | — | |
44
GOLD KIST INC.
NOTES TO CONSOLIDATED FINANCIAL STATEMENTS—(Continued)
June 28, 2003, June 26, 2004, October 2, 2004 and October 1, 2005
(Amounts in Thousands)
The Company uses the Moody’s Investor Services Aa corporate bond rates and several discount rate models at the measurement date as the basis for establishing the discount rates used to determine the benefit obligation.
The health care cost trend rate used to determine the medical and life insurance benefit obligation at June 26, 2004 and October 1, 2005 was 9.5%, declining ratably to 5% by the year 2013 and remaining at that level thereafter. A 1% increase/decrease in the health care cost trend rate would have an insignificant impact on the medical and life insurance benefit obligation as of October 1, 2005.
| | | | | | | | | | | | | | | | | | | | | | | | | | |
| | | Pension Benefits
| | | Medical & Life Insurance Benefits
| |
| | | Fiscal Years Ended
| | | Transition
Quarter
Ended
| | | Fiscal
Year
Ended
| | | Fiscal Years Ended
| | | Transition
Quarter
Ended
| | | Fiscal
Year
Ended
| |
| | | June 28,
2003
| | | June 26,
2004
| | | October 2,
2004
| | | October 1,
2005
| | | June 28,
2003
| | | June 26,
2004
| | | October 2,
2004
| | | October 1,
2005
| |
Components of net periodic benefit cost (income): | | | | | | | | | | | | | | | | | | | | | | | | | | |
Service cost | | $ | 5,521 | | | 6,000 | | | 1,190 | | | 4,679 | | | $ | 64 | | | — | | | — | | | — | |
Interest cost | | | 10,193 | | | 10,446 | | | 2,459 | | | 10,000 | | | | 2,746 | | | 312 | | | 56 | | | 218 | |
Estimated return on plan assets | | | (15,290 | ) | | (13,429 | ) | | (2,582 | ) | | (11,490 | ) | | | — | | | — | | | — | | | — | |
Amortization of transition asset | | | (896 | ) | | (235 | ) | | — | | | — | | | | — | | | — | | | — | | | — | |
Amortization of prior service cost (gain) | | | 1,757 | | | 1,486 | | | 120 | | | 479 | | | | (1,609 | ) | | (10,347 | ) | | (2,587 | ) | | (10,347 | ) |
Amortization of net loss | | | 367 | | | 2,155 | | | 1,055 | | | 4,093 | | | | 1,432 | | | 8,354 | | | 1,759 | | | 7,036 | |
| | |
|
|
| |
|
| |
|
| |
|
| |
|
|
| |
|
| |
|
| |
|
|
| | | | 1,652 | | | 6,423 | | | 2,242 | | | 7,761 | | | | 2,633 | | | (1,681 | ) | | (772 | ) | | (3,093 | ) |
Curtailment gains | | | — | | | — | | | — | | | — | | | | (20,257 | ) | | — | | | — | | | — | |
Settlement accounting losses | | | — | | | 10,288 | | | — | | | 906 | | | | — | | | — | | | — | | | — | |
| | |
|
|
| |
|
| |
|
| |
|
| |
|
|
| |
|
| |
|
| |
|
|
Net periodic benefit cost (income) after curtailments and settlements | | $ | 1,652 | | | 16,711 | | | 2,242 | | | 8,667 | | | $ | (17,624 | ) | | (1,681 | ) | | (772 | ) | | (3,093 | ) |
| | |
|
|
| |
|
| |
|
| |
|
| |
|
|
| |
|
| |
|
| |
|
|
Weighted-average assumptions used to determine benefit cost: | | | | | | | | | | | | | | | | | | | | | | | | | | |
Discount rate | | | 7.50 | % | | 6.50 | % | | 6.00 | % | | 6.25 | % | | | 7.50 | % | | 6.50 | % | | 6.00 | % | | 6.25 | % |
Rate of increase in compensation levels | | | 5.01 | % | | 4.01 | % | | 4.01 | % | | 4.01 | % | | | 5.01 | % | | — | | | — | | | — | |
Expected return on plan assets | | | 9.50 | % | | 9.00 | % | | 8.25 | % | | 8.25 | % | | | — | | | — | | | — | | | — | |
To determine the expected long-term rate of return on plan assets, historical performance, investment community forecasts and current market conditions are analyzed to develop expected returns, taking into account the target asset class allocations of the plan. The expected long-term rate of return assumption that will be used to determine pension expense for fiscal 2006 is 8.25%.
A 1% increase/decrease in the health care cost trend rate would have an insignificant impact on the medical and life insurance service and interest cost components for 2005.
| | | | | | | | | |
| | | Pension Benefits
| | Medical & Life
Insurance Benefits
|
| | | June 26,
2004
| | October 1,
2005
| | June 26,
2004
| | October 1,
2005
|
Increase in minimum liability included in other
comprehensive income (loss) | | $ | 1,555 | | 30,237 | | N/A | | N/A |
| | |
|
| |
| |
| |
|
45
GOLD KIST INC.
NOTES TO CONSOLIDATED FINANCIAL STATEMENTS—(Continued)
June 28, 2003, June 26, 2004, October 2, 2004 and October 1, 2005
(Amounts in Thousands)
Pension plan asset allocations as of the March 31, 2004 and June 30, 2005 measurement dates, were as follows:
| | | | | | |
| | | Percentage of
Plan Assets as of
| |
| | | March 31,
2004
| | | June 30,
2005
| |
Asset category: | | | | | | |
Domestic Large Cap Equity | | 40.3 | % | | 40.2 | % |
Domestic Small Cap Equity | | 15.2 | % | | 15.4 | % |
International Equity | | 14.7 | % | | 15.5 | % |
Domestic Fixed Income | | 29.8 | % | | 28.9 | % |
| | |
|
| |
|
|
Total | | 100.0 | % | | 100.0 | % |
| | |
|
| |
|
|
The Company has developed guidelines for pension plan asset allocations. As of the June 30, 2005 measurement date, the target percentages were as follows:
| | | | | | |
| | | Pension Investment
Policy Guidelines as of
June 30, 2005
| |
| | | Minimum
| | | Maximum
| |
Asset category: | | | | | | |
Domestic Large Cap Equity | | 38 | % | | 45 | % |
Domestic Small Cap Equity | | 13 | % | | 18 | % |
International Equity | | 13 | % | | 18 | % |
Domestic Fixed Income | | 27 | % | | 32 | % |
The Company’s Pension Committee reviews its investment strategy on at least an annual basis.
The investment goal of the pension plan assets is to generate an above benchmark return on a diversified portfolio of common stocks, fixed income investments and cash equivalents, while meeting the cash requirements for a pension obligation that includes a traditional formula principally representing payments to annuitants and lump sum and annuity payments to future retirees. The pension plan risk management practices include guidelines for asset concentration, credit rating and liquidity. The pension plan does not invest in leveraged derivatives. Pension assets do not include any Gold Kist stock, certificates of interest or senior notes.
The expected benefit payments for the Company’s pension and postretirement plans for the fiscal years indicated are as follows:
| | | | | |
| | | Pension
| | Other
Postretirement
Benefits
|
Expected Benefit Payments for fiscal year: | | | | | |
2006 | | $ | 14,920 | | 545 |
2007 | | | 19,198 | | 456 |
2008 | | | 19,996 | | 384 |
2009 | | | 21,037 | | 246 |
2010 | | | 22,000 | | 198 |
2011-2015 | | | 122,723 | | 904 |
| | |
|
| |
|
Total | | $ | 219,874 | | 2,733 |
| | |
|
| |
|
46
GOLD KIST INC.
NOTES TO CONSOLIDATED FINANCIAL STATEMENTS—(Continued)
June 28, 2003, June 26, 2004, October 2, 2004 and October 1, 2005
(Amounts in Thousands, Except Share Amounts)
The expected benefits to be paid are based on the same assumptions used to measure the Company’s benefit obligation at June 30, 2005 and include estimated future employee service.
The Company made qualified pension plan contributions of $15.0 million in August 2004, $8.0 million in November 2004 and $11.0 million in June 2005. No qualified pension plan contributions are required or expected during the 2006 fiscal year.
Eligible employees participate in the Gold Kist 401(k) plan. During fiscal 2003, fiscal 2004, the transition quarter ended October 2, 2004 and fiscal 2005, the Company contributed approximately $1.7 million, $1.6 million, $0.9 million and $3.4 million, respectively, to the 401(k) plan to partially match employee contributions.
(9) Long-Term Incentive Plan
Effective in January 2005, the Company adopted SFAS No. 123(r) and has utilized the modified prospective method of adoption. Prior to January 2005, the Company accounted for its stock compensation grants in accordance with the SFAS No. 123 exception, which allowed it to utilize APB No. 25 to account for its stock-based compensation grants. There was no cumulative effect upon adoption of SFAS No. 123(r).
In connection with the conversion of the Company into a for-profit corporation and the completion of its initial public offering, the Company implemented the Gold Kist Long-Term Incentive Plan (LTIP). At the discretion of the Compensation Committee of the Board of Directors, which administers the plan, employees, consultants and non-employee directors may be granted awards in the form of stock options, stock appreciation rights, performance awards, nonvested or restricted stock, stock units, dividend equivalents or other stock based awards. The Company reserved up to 4.0 million shares for issuance upon the exercise of awards under the LTIP.
A grant of nonvested stock to employees was authorized by the Board of Directors and effective as of the closing of the initial public offering (“IPO”) on October 13, 2004 (“IPO stock grants”). In addition, on October 20, 2004, the Board of Directors authorized the issuance of the stock portion of their fiscal 2005 annual retainers in nonvested shares. Total grants of 705,197 and 24,456 shares were issued to employees and directors, respectively. The nonvested stock issued to employees will vest on the third anniversary of the date of grant. The stock issued to directors vested in July 2005. However, the shares will vest immediately upon (i) the employee’s termination of employment by reason of death, disability or retirement, or (ii) the occurrence of a change in control. Retirement is defined under the LTIP as voluntarily leaving employment after attaining any normal or early retirement age specified in the Company’s benefit plans.
Prior to the adoption of SFAS No. 123(r), the Company’s policy for recognizing compensation expense was to amortize the fair value of stock compensation grants over the stated vesting period, even though that stated vesting period may not be substantive. As a result, the Company recognized compensation expense of $3.2 million for IPO stock grants made during fiscal 2005. Had the Company applied SFAS No. 123(r) to the IPO stock grants, and as a result recognized the fair value of the grants over the requisite service period as opposed to the stated vesting period of three years, the additional compensation expense that would have been recognized in fiscal 2005 would have been approximately $3.0 million. The Company will continue to recognize the compensation expense for the IPO stock grants by amortizing the fair value over the stated three-year vesting period.
In January 2005, the Board of Directors approved replacement employment agreements with the Chief Executive Officer and the Chief Administrative Officer and replacement change in control (“CIC”) agreements
47
GOLD KIST INC.
NOTES TO CONSOLIDATED FINANCIAL STATEMENTS—(Continued)
June 28, 2003, June 26, 2004, October 2, 2004 and October 1, 2005
(Amounts in Thousands)
with the other officers. Equity grants to the Company’s officers under the Company’s LTIP, consisting of 355,722 shares of nonvested stock (“CIC stock grants”), stock-settled stock appreciation rights with respect to 173,860 shares (“stock-settled SARS”) and 96,558 performance share awards (“performance shares”), were also approved and awarded in January 2005. The CIC stock grants vest as to 25% of the shares on each anniversary of the date of grant, beginning January 24, 2006, provided, however, that the shares will vest immediately upon (i) the executive’s termination of employment by reason of death, disability or retirement, or (ii) the occurrence of a change in control.
The stock-settled SARS vest in two equal annual installments, beginning on January 24, 2008; provided, however, that the stock-settled SARS will vest and become immediately exercisable upon (i) the executive’s termination of employment by reason of death, disability or retirement, or (ii) the occurrence of a change in control.
The performance shares provide the holder the opportunity to earn a number of shares of common stock of the Company at the end of a three-year performance cycle. The performance condition is based upon the Company’s profitability in relation to a defined peer group within the broiler industry as measured by an independent benchmarking company.
Additional equity grants for other management participants, consisting of stock-settled SARS with respect to 86,954 shares and 88,553 performance shares, were also approved and awarded with the same vesting periods as outlined above. These grants will vest and become immediately exercisable upon the participant’s termination of employment by reason of death, disability or retirement.
Deferred stock units are issued to directors who elect to receive their quarterly compensation in stock units in lieu of cash. The stock units vest six months after the director’s service on the Board is terminated or at a later date as elected by the participating director.
The equity grants and awards are summarized as follows (share and dollar amounts in thousands):
| | | | | | | | | |
| | | Grant Date
| | Shares
| | Fair Value
| | Vesting Period
|
IPO stock grants | | October 2004 | | | | | | | |
Employees | | | | 705 | | $ | 7,757 | | 36 months |
Directors | | | | 25 | | | 280 | | 9 months |
| | | | |
CIC stock grants | | January 2005 | | 356 | | | 4,863 | | 48 months |
| | | | |
Stock-settled SARS | | January 2005 | | 261 | | | 1,795 | | 48 months |
| | | | |
Performance shares | | January 2005 | | 185 | | | 2,280 | | 33 months |
| | | | |
Director stock units | | Various 2005 | | 3 | | | 53 | | Various |
| | | | |
| |
|
| | |
Total | | | | 1,535 | | $ | 17,028 | | |
| | | | |
| |
|
| | |
The Company determined that all of the above grants were equity-classified awards under SFAS No. 123(r). As a result, the fair value of the awards has been measured at grant date and is being recognized as compensation expense over the vesting periods, except as noted below. The fair value of the IPO stock grants, CIC stock grants and performance shares was the quoted public market price of the shares on the date of the grant. The fair value of the stock-settled SARS was determined under the Black-Scholes-Merton valuation method with a term of 6.75
48
GOLD KIST INC.
NOTES TO CONSOLIDATED FINANCIAL STATEMENTS—(Continued)
June 28, 2003, June 26, 2004, October 2, 2004 and October 1, 2005
(Amounts in Thousands, Except Share Amounts)
years, as determined under the simplified method, a risk free rate of 3.93%, no expected dividends and a volatility of 45%, based on data from a peer group of similar profile companies. The contractual term of the stock-settled SARS is ten years.
IPO stock grants totaling 75,700 shares legally vested during fiscal 2005 with a fair value of $0.9 million. There are no additional restrictions on awards subsequent to vesting. Performance shares totaling 701 shares were forfeited during fiscal 2005.
The grants previously described, with the exception of the performance shares, vest fully at retirement, which was defined as attaining any normal or early retirement age (fifty-five) specified in the Company’s benefit plans. A significant number of grant recipients were fifty-five or older at the time of the grant and therefore have the option to retire early under the Company’s benefit plans, at which time the grants would vest. In accordance with SFAS 123(r), because the employee is eligible to retire at the grant date, the awards’ explicit service condition is nonsubstantive and the entire amount of compensation cost was recognized at the grant date.
The amount of the share-based compensation expense under the CIC stock grants issued in January 2005 and the stock-settled SARS granted in January 2005 related to those recipients aged 55 or over was $5.3 million at the grant date and represented 490,642 shares.
Total share-based compensation expense was $9.8 million for the year ended October 1, 2005 and is reflected within distribution, general and administrative expense in the accompanying consolidated statements of operations. The total income tax benefit recognized in the consolidated statement of operations related to the share-based compensation expense was $3.5 million for fiscal 2005.
At October 1, 2005, the total share-based compensation cost related to nonvested grants and awards not yet recognized is approximately $7.2 million. The weighted average period over which the remaining share-based compensation expense is to be recognized is approximately twenty-five months.
(10) Contingent Liabilities
Four female employees of the Company’s Corporate Office Information Services (I/S) Department filed an Equal Employment Opportunity Commission (“EEOC”) sex discrimination suit against the Company in the United States District Court for the Northern District of Georgia asserting gender based claims about employment and promotion decisions in the Corporate Office I/S Department. One of the employees continues to be employed by the Company. After its administrative consideration of the claims, the EEOC issued “Right to Sue” letters to the four complainants in these claims, meaning that the EEOC would not sue or participate in a suit against the Company on behalf of the parties in these actions nor would it pursue a systemic discrimination charge in this matter. The letter provided that the individuals could pursue their claims and litigation on their own should they so desire. The four complainants filed an action in federal district court on March 19, 2003, seeking class certification for their claims of gender discrimination, unspecified monetary damages and injunctive relief. The U.S. District Court, in an Order entered June 13, 2005, denied the motion of the plaintiffs to certify the litigation as a class action. The Court’s ruling, for which the plaintiffs did not seek an interlocutory appeal, means that the litigation will not proceed as a class action and will be litigated as individual claims of the four named plaintiffs. The Company intends to defend the litigation vigorously. The Company believes that this lawsuit will not have a material adverse effect on its financial condition or results of operations.
49
GOLD KIST INC.
NOTES TO CONSOLIDATED FINANCIAL STATEMENTS—(Continued)
June 28, 2003, June 26, 2004, October 2, 2004 and October 1, 2005
(Amounts in Thousands)
The Company was named as a defendant in a purported class action lawsuit filed in the U.S. District Court for the Northern District of Alabama, along with four additional chicken-processing firms. Plaintiffs alleged that the defendants conspired to prevent competition for production contracts and sought to represent a putative class of all contract farmers and sellers of hatching eggs and live broilers who produced hatching eggs or live broilers in the United States since February 23, 1998. This action was dismissed in July 2005.
The Company has been sued by one of the Company’s hourly workers in the U.S. District Court for the Northern District of Alabama. The complaint seeks injunctive relief and damages under the Fair Labor Standards Act (“FLSA”) and contends that the employee was not compensated appropriately for time spent donning and doffing certain clothing for his job. This is a private individual action, which seeks to invoke an “opt-in collective action” against the Company pursuant to the FLSA that is essentially the same as a claim for a class action. The proposed class would be composed of all Gold Kist hourly workers employed by Gold Kist within the last three years. The Company intends to defend the litigation vigorously. Based on the Company’s current assessment of probability regarding the plaintiff’s success in this case, no amounts have been accrued in the accompanying consolidated financial statements.
Gold Kist is a party to various other legal, environmental and administrative proceedings, which management believes constitute ordinary routine litigation incidental to the business conducted by Gold Kist. Potential liability with respect to such proceedings is either accrued or not expected to be significant.
(11) Investments
In October 1998, the Company completed the sale of assets of the Agri-Services business segment to Southern States Cooperative, Inc. (“SSC”). In connection with the transaction, the Company purchased from SSC $60 million principal amount of capital trust securities and $40 million principal amount of cumulative preferred securities for $98.6 million in October 1999.
In October 2002, SSC notified the Company that, pursuant to the provisions of the indenture under which the Company purchased the capital trust securities, SSC would defer the capital trust securities quarterly interest payment due on October 5, 2002. Quarterly interest payments for subsequent quarters were also deferred. As a result of the deferral of the interest payments, the Company reduced the carrying value of the capital trust securities by $24.1 million with a corresponding charge against the loss from continuing operations for fiscal 2003. The carrying value of the SSC securities was $57.4 million at June 28, 2003.
As of December 31, 2003, SSC’s total stockholders’ and patrons’ equity fell below the Company’s carrying value of the preferred stock investment, which the Company believed was a triggering event indicating impairment. In the second quarter of fiscal 2004, the Company recorded an “other-than-temporary” impairment charge of $18.5 million.
In June 2004, the Company notified SSC that it was abandoning the investment and returning the securities. As a result of the abandonment, the remaining investment balance of $38.9 million was written off and a total of $57.4 million was reflected as an other expense in the consolidated statement of operations for fiscal 2004.
The write down of an investment in fiscal 2005 of $2.5 million represents an investment in a supply cooperative in which the Company is no longer a member.
50
GOLD KIST INC.
NOTES TO CONSOLIDATED FINANCIAL STATEMENTS—(Continued)
June 28, 2003, June 26, 2004, October 2, 2004 and October 1, 2005
(Amounts in Thousands, Except Share Amounts)
(12) Earnings Per Share
The net income for both the basic and diluted earnings per share computations was $25.0 million and $112.2 million for the quarter and fiscal year ended October 1, 2005, respectively. Following is a reconciliation of weighted average common shares—basic to weighted average common shares—diluted (share amounts are in thousands).
| | | | |
| | | Quarter Ended
| | Fiscal Year Ended
|
| | | October 1, 2005
| | October 1, 2005
|
Weighted average common shares—basic | | 50,042 | | 49,999 |
Dilutive impact of share-based compensation grants | | 813 | | 637 |
| | |
| |
|
Weighted average common shares—diluted | | 50,855 | | 50,636 |
| | |
| |
|
(13) Quarterly Financial Data (Unaudited)
| | | | | | | | | |
| | | First
Quarter
| | Second
Quarter
| | Third
Quarter
| | Fourth
Quarter
|
Fiscal Year Ended October 1, 2005 | | | | | | | | | |
Net Sales | | $ | 551,958 | | 570,809 | | 598,835 | | 582,660 |
Gross profit | | | 47,836 | | 93,255 | | 101,795 | | 77,198 |
Net operating income | | | 21,452 | | 60,179 | | 72,943 | | 51,009 |
Net income | | | 4,193 | | 38,669 | | 44,413 | | 24,971 |
Basic net income per common share | | $ | .08 | | .77 | | .89 | | .50 |
Diluted net income per common share | | $ | .08 | | .77 | | .88 | | .49 |
| | | | |
Fiscal Year Ended June 26, 2004 | | | | | | | | | |
Net Sales | | $ | 516,688 | | 536,927 | | 575,589 | | 631,524 |
Gross profit | | | 62,690 | | 68,210 | | 95,461 | | 134,972 |
Net operating income | | | 38,419 | | 39,187 | | 58,353 | | 106,314 |
Net income | | | 23,485 | | 3,405 | | 29,862 | | 54,142 |
All quarters in fiscal 2004 and 2005 were 13-week periods. Earnings per share are only calculated for fiscal 2005, the initial period the Company operated as a publicly traded, stock corporation.
(14) Supplemental Combining Condensed Financial Statements
In March 2004, the Company issued senior notes in a private placement offering pursuant to Rule 144A and Regulation S of the Securities Act of 1933. The senior notes were issued at a price of 98.47%. Net proceeds from the sale were $191.2 million.
The Company’s senior notes, due 2014 are jointly and severally guaranteed by the Company’s domestic subsidiaries, which are 100% owned by Gold Kist Inc. (the “Parent”), except for GK Insurance Inc., a wholly owned captive insurance company domiciled in the State of Vermont.
The following is the supplemental combining condensed balance sheets as of June 26, 2004 and October 1, 2005, the supplemental combining condensed statements of operations for fiscal 2003, fiscal 2004, the transition quarter ended October 2, 2004 and fiscal 2005 and the supplemental combining condensed statements of cash flows for fiscal 2003, fiscal 2004, the transition quarter ended October 2, 2004 and fiscal 2005. The only intercompany eliminations are the normal intercompany revenues, borrowings and investments in wholly owned subsidiaries. Separate complete financial statements of the guarantor subsidiaries, which are 100% owned by the Parent, are not presented because the guarantors are jointly and severally, fully and unconditionally liable under the guarantees.
51
GOLD KIST INC.
NOTES TO CONSOLIDATED FINANCIAL STATEMENTS—(Continued)
June 28, 2003, June 26, 2004, October 2, 2004 and October 1, 2005
(Amounts in Thousands)
Balance Sheet:
| | | | | | | | | | | | | |
| | | As of June 26, 2004
|
| | | Parent
Only
| | Guarantor
Subsidiaries
| | | Non-Guarantor
Subsidiary
| | Eliminations
| | | Consolidated
|
ASSETS | | | | | | | | | | | | | |
Current assets: | | | | | | | | | | | | | |
Cash and cash equivalents | | $ | 134,035 | | 135 | | | 2,529 | | — | | | 136,699 |
Receivables, net | | | 135,939 | | 8,297 | | | 25,109 | | (31,691 | ) | | 137,654 |
Inventories | | | 232,509 | | 396 | | | — | | — | | | 232,905 |
Deferred income taxes, net and other current assets | | | 32,509 | | (351 | ) | | 19,888 | | — | | | 52,046 |
| | |
|
| |
|
| |
| |
|
| |
|
Total current assets | | | 534,992 | | 8,477 | | | 47,526 | | (31,691 | ) | | 559,304 |
Investments | | | 33,822 | | — | | | — | | (21,062 | ) | | 12,760 |
Property, plant and equipment, net | | | 231,368 | | 289 | | | — | | — | | | 231,657 |
Deferred income taxes, net and other assets | | | 63,419 | | 9,585 | | | 9,132 | | — | | | 82,136 |
| | |
|
| |
|
| |
| |
|
| |
|
| | | $ | 863,601 | | 18,351 | | | 56,658 | | (52,753 | ) | | 885,857 |
| | |
|
| |
|
| |
| |
|
| |
|
LIABILITIES AND EQUITY | | | | | | | | | | | | | |
Current liabilities: | | | | | | | | | | | | | |
Notes payable and current maturities of long-term debt | | $ | 21,167 | | — | | | — | | — | | | 21,167 |
Accounts payable | | | 106,728 | | 255 | | | — | | (31,691 | ) | | 75,292 |
Accrued compensation and related expenses | | | 41,263 | | 15 | | | — | | — | | | 41,278 |
Accrued insurance costs | | | 15,071 | | — | | | 22,793 | | — | | | 37,864 |
Other current liabilities | | | 38,448 | | 10 | | | — | | — | | | 38,458 |
| | |
|
| |
|
| |
| |
|
| |
|
Total current liabilities | | | 222,677 | | 280 | | | 22,793 | | (31,691 | ) | | 214,059 |
Long-term debt, less current maturities | | | 282,954 | | — | | | — | | — | | | 282,954 |
Accrued pension costs | | | 53,825 | | — | | | — | | — | | | 53,825 |
Accrued postretirement benefit costs | | | 7,539 | | — | | | — | | — | | | 7,539 |
Accrued insurance costs | | | — | | — | | | 30,549 | | — | | | 30,549 |
Other liabilities | | | 11,991 | | 325 | | | — | | — | | | 12,316 |
| | |
|
| |
|
| |
| |
|
| |
|
Total liabilities | | | 578,986 | | 605 | | | 53,342 | | (31,691 | ) | | 601,242 |
| | |
|
| |
|
| |
| |
|
| |
|
Patrons’ and other equity/stockholders’ equity | | | 284,615 | | 17,746 | | | 3,316 | | (21,062 | ) | | 284,615 |
| | |
|
| |
|
| |
| |
|
| |
|
| | | $ | 863,601 | | 18,351 | | | 56,658 | | (52,753 | ) | | 885,857 |
| | |
|
| |
|
| |
| |
|
| |
|
52
GOLD KIST INC.
NOTES TO CONSOLIDATED FINANCIAL STATEMENTS—(Continued)
June 28, 2003, June 26, 2004, October 2, 2004 and October 1, 2005
(Amounts in Thousands)
Balance Sheet:
| | | | | | | | | | | | | |
| | | As of October 1, 2005
|
| | | Parent
Only
| | Guarantor
Subsidiaries
| | | Non-Guarantor
Subsidiary
| | Eliminations
| | | Consolidated
|
ASSETS | | | | | | | | | | | | | |
Current assets: | | | | | | | | | | | | | |
Cash and cash equivalents | | $ | 150,331 | | 672 | | | 2,558 | | — | | | 153,561 |
Receivables, net | | | 125,200 | | 13,147 | | | 36,161 | | (49,119 | ) | | 125,389 |
Inventories | | | 233,415 | | 266 | | | — | | — | | | 233,681 |
Deferred income taxes, net and other current assets | | | 15,738 | | (683 | ) | | 23,324 | | — | | | 38,379 |
| | |
|
| |
|
| |
| |
|
| |
|
Total current assets | | | 524,684 | | 13,402 | | | 62,043 | | (49,119 | ) | | 551,010 |
Investments | | | 34,278 | | — | | | — | | (23,531 | ) | | 10,747 |
Property, plant and equipment, net | | | 286,259 | | 256 | | | — | | — | | | 286,515 |
Deferred income taxes, net and other assets | | | 65,877 | | 2,860 | | | 8,680 | | — | | | 77,417 |
| | |
|
| |
|
| |
| |
|
| |
|
| | | $ | 911,098 | | 16,518 | | | 70,723 | | (72,650 | ) | | 925,689 |
| | |
|
| |
|
| |
| |
|
| |
|
LIABILITIES AND EQUITY | | | | | | | | | | | | | |
Current liabilities: | | | | | | | | | | | | | |
Notes payable and current maturities of long-term debt | | $ | 1,518 | | — | | | — | | — | | | 1,518 |
Accounts payable | | | 135,482 | | 282 | | | 841 | | (49,119 | ) | | 87,486 |
Accrued compensation and related expenses | | | 27,277 | | 15 | | | — | | — | | | 27,292 |
Accrued insurance costs | | | 10,248 | | — | | | 29,210 | | — | | | 39,458 |
Other current liabilities | | | 70,518 | | (782 | ) | | 1,219 | | — | | | 70,955 |
| | |
|
| |
|
| |
| |
|
| |
|
Total current liabilities | | | 245,043 | | (485 | ) | | 31,270 | | (49,119 | ) | | 226,709 |
Long-term debt, less current maturities | | | 143,714 | | — | | | — | | — | | | 143,714 |
Accrued pension costs | | | 54,450 | | — | | | — | | — | | | 54,450 |
Accrued postretirement benefit costs | | | 3,961 | | — | | | — | | — | | | 3,961 |
Accrued insurance costs | | | — | | — | | | 32,600 | | — | | | 32,600 |
Other liabilities | | | 13,202 | | 325 | | | — | | — | | | 13,527 |
| | |
|
| |
|
| |
| |
|
| |
|
Total liabilities | | | 460,370 | | (160 | ) | | 63,870 | | (49,119 | ) | | 474,961 |
| | |
|
| |
|
| |
| |
|
| |
|
Stockholders’ equity | | | 450,728 | | 16,678 | | | 6,853 | | (23,531 | ) | | 450,728 |
| | |
|
| |
|
| |
| |
|
| |
|
| | | $ | 911,098 | | 16,518 | | | 70,723 | | (72,650 | ) | | 925,689 |
| | |
|
| |
|
| |
| |
|
| |
|
53
GOLD KIST INC.
NOTES TO CONSOLIDATED FINANCIAL STATEMENTS—(Continued)
June 28, 2003, June 26, 2004, October 2, 2004 and October 1, 2005
(Amounts in Thousands)
Statement of Operations:
| | | | | | | | | | | | | | | |
| | | For the fiscal year ended June 28, 2003
| |
| | | Parent
Only
| | | Guarantor
Subsidiaries
| | | Non-Guarantor
Subsidiary
| | Eliminations
| | | Consolidated
| |
Net sales | | $ | 1,850,474 | | | 2,211 | | | 11,581 | | (9,140 | ) | | 1,855,126 | |
Cost of sales | | | 1,808,691 | | | 2,208 | | | 11,347 | | (9,140 | ) | | 1,813,106 | |
| | |
|
|
| |
|
| |
| |
|
| |
|
|
Gross profit | | | 41,783 | | | 3 | | | 234 | | — | | | 42,020 | |
Distribution, administrative and general expenses | | | 79,919 | | | 1,860 | | | 80 | | — | | | 81,859 | |
Benefit plans curtailment (gains) | | | (20,257 | ) | | — | | | — | | — | | | (20,257 | ) |
| | |
|
|
| |
|
| |
| |
|
| |
|
|
Net operating income (loss) | | | (17,879 | ) | | (1,857 | ) | | 154 | | — | | | (19,582 | ) |
Interest, income taxes and other, net | | | (33,573 | ) | | 1,458 | | | 448 | | (203 | ) | | (31,870 | ) |
| | |
|
|
| |
|
| |
| |
|
| |
|
|
Net income (loss) | | $ | (51,452 | ) | | (399 | ) | | 602 | | (203 | ) | | (51,452 | ) |
| | |
|
|
| |
|
| |
| |
|
| |
|
|
Statement of Operations:
| | | | | | | | | | | | | | | | |
| | | For the fiscal year ended June 26, 2004
| |
| | | Parent
Only
| | | Guarantor
Subsidiaries
| | | Non-Guarantor
Subsidiary
| | | Eliminations
| | | Consolidated
| |
Net sales | | $ | 2,258,515 | | | 2,857 | | | 15,763 | | | (16,407 | ) | | 2,260,728 | |
Cost of sales | | | 1,896,024 | | | 2,708 | | | 17,070 | | | (16,407 | ) | | 1,899,395 | |
| | |
|
|
| |
|
| |
|
| |
|
| |
|
|
Gross profit (loss) | | | 362,491 | | | 149 | | | (1,307 | ) | | — | | | 361,333 | |
Distribution, administrative and general expenses | | | 107,444 | | | 1,248 | | | 80 | | | — | | | 108,772 | |
Pension plan settlement loss | | | 10,288 | | | — | | | — | | | — | | | 10,288 | |
| | |
|
|
| |
|
| |
|
| |
|
| |
|
|
Net operating income (loss) | | | 244,759 | | | (1,099 | ) | | (1,387 | ) | | — | | | 242,273 | |
Interest, income taxes and other, net | | | (133,865 | ) | | 2,537 | | | 1,578 | | | (1,629 | ) | | (131,379 | ) |
| | |
|
|
| |
|
| |
|
| |
|
| |
|
|
Net income | | $ | 110,894 | | | 1,438 | | | 191 | | | (1,629 | ) | | 110,894 | |
| | |
|
|
| |
|
| |
|
| |
|
| |
|
|
Statement of Operations:
| | | | | | | | | | | | | | | | |
| | | Transition quarter ended October 2, 2004
| |
| | | Parent
Only
| | | Guarantor
Subsidiaries
| | | Non-Guarantor
Subsidiary
| | | Eliminations
| | | Consolidated
| |
Net sales | | $ | 646,265 | | | 795 | | | 3,070 | | | (3,619 | ) | | 646,511 | |
Cost of sales | | | 555,214 | | | 725 | | | 1,822 | | | (3,619 | ) | | 554,142 | |
| | |
|
|
| |
|
| |
|
| |
|
| |
|
|
Gross profit | | | 91,051 | | | 70 | | | 1,248 | | | — | | | 92,369 | |
Distribution, administrative and general expenses | | | 33,286 | | | 215 | | | 32 | | | — | | | 33,533 | |
| | |
|
|
| |
|
| |
|
| |
|
| |
|
|
Net operating income (loss) | | | 57,765 | | | (145 | ) | | 1,216 | | | — | | | 58,836 | |
Interest, income taxes and other, net | | | (23,747 | ) | | 166 | | | (119 | ) | | (1,118 | ) | | (24,818 | ) |
| | |
|
|
| |
|
| |
|
| |
|
| |
|
|
Net income | | $ | 34,018 | | | 21 | | | 1,097 | | | (1,118 | ) | | 34,018 | |
| | |
|
|
| |
|
| |
|
| |
|
| |
|
|
54
GOLD KIST INC.
NOTES TO CONSOLIDATED FINANCIAL STATEMENTS—(Continued)
June 28, 2003, June 26, 2004, October 2, 2004 and October 1, 2005
(Amounts in Thousands)
Statement of Operations:
| | | | | | | | | | | | | | | |
| | | For the fiscal year ended October 1, 2005
| |
| | | Parent
Only
| | | Guarantor
Subsidiaries
| | | Non-Guarantor
Subsidiary
| | Eliminations
| | | Consolidated
| |
Net sales | | $ | 2,302,928 | | | 3,105 | | | 15,360 | | (17,131 | ) | | 2,304,262 | |
Cost of sales | | | 1,984,334 | | | 3,151 | | | 13,824 | | (17,131 | ) | | 1,984,178 | |
| | |
|
|
| |
|
| |
| |
|
| |
|
|
Gross profit (loss) | | | 318,594 | | | (46 | ) | | 1,536 | | — | | | 320,084 | |
Distribution, administrative and general expenses | | | 112,702 | | | 808 | | | 85 | | — | | | 113,595 | |
Pension plan settlement loss | | | 906 | | | — | | | — | | — | | | 906 | |
| | |
|
|
| |
|
| |
| |
|
| |
|
|
Net operating income (loss) | | | 204,986 | | | (854 | ) | | 1,451 | | — | | | 205,583 | |
Interest, income taxes and other, net | | | (92,740 | ) | | (234 | ) | | 989 | | (1,352 | ) | | (93,337 | ) |
| | |
|
|
| |
|
| |
| |
|
| |
|
|
Net income (loss) | | $ | 112,246 | | | (1,088 | ) | | 2,440 | | (1,352 | ) | | 112,246 | |
| | |
|
|
| |
|
| |
| |
|
| |
|
|
Statement of Cash Flows:
| | | | | | | | | | | | | | |
| | | For the fiscal year ended June 28, 2003
| |
| | | Parent
Only
| | | Guarantor
Subsidiaries
| | | Non-Guarantor
Subsidiary
| | Eliminations
| | Consolidated
| |
Net cash provided by (used in) operating activities | | $ | (36,656 | ) | | (877 | ) | | 2,258 | | — | | (35,275 | ) |
Cash flows from investing activities: | | | | | | | | | | | | | | |
Acquisitions of property, plant and equipment | | | (34,643 | ) | | (8 | ) | | — | | — | | (34,651 | ) |
Proceeds from employee life insurance policy surrenders | | | 7,537 | | | — | | | — | | — | | 7,537 | |
Other | | | (442 | ) | | 516 | | | — | | — | | 74 | |
| | |
|
|
| |
|
| |
| |
| |
|
|
Net cash provided by (used in) investing activities | | | (27,548 | ) | | 508 | | | — | | — | | (27,040 | ) |
| | |
|
|
| |
|
| |
| |
| |
|
|
Cash flows from financing activities: | | | | | | | | | | | | | | |
Short-term debt repayments, net | | | (10,000 | ) | | — | | | — | | — | | (10,000 | ) |
Proceeds from long-term debt | | | 202,920 | | | — | | | — | | — | | 202,920 | |
Principal repayments of long-term debt | | | (123,017 | ) | | — | | | — | | — | | (123,017 | ) |
Payments of deferred financing costs | | | (3,007 | ) | | — | | | — | | — | | (3,007 | ) |
Patronage refunds and other equity paid in cash | | | (7,601 | ) | | — | | | — | | — | | (7,601 | ) |
Proceeds from employee life insurance policy borrowings | | | 5,049 | | | — | | | — | | — | | 5,049 | |
| | |
|
|
| |
|
| |
| |
| |
|
|
Net cash provided by financing activities | | | 64,344 | | | — | | | — | | — | | 64,344 | |
| | |
|
|
| |
|
| |
| |
| |
|
|
Net change in cash and cash equivalents | | | 140 | | | (369 | ) | | 2,258 | | — | | 2,029 | |
Cash and cash equivalents at beginning of period | | | 8,213 | | | 533 | | | 251 | | — | | 8,997 | |
| | |
|
|
| |
|
| |
| |
| |
|
|
Cash and cash equivalents at end of period | | $ | 8,353 | | | 164 | | | 2,509 | | — | | 11,026 | |
| | |
|
|
| |
|
| |
| |
| |
|
|
55
GOLD KIST INC.
NOTES TO CONSOLIDATED FINANCIAL STATEMENTS—(Continued)
June 28, 2003, June 26, 2004, October 2, 2004 and October 1, 2005
(Amounts in Thousands)
Statement of Cash Flows:
| | | | | | | | | | | | | | |
| | | For the fiscal year ended June 26, 2004
| |
| | | Parent
Only
| | | Guarantor
Subsidiaries
| | | Non-Guarantor
Subsidiary
| | Eliminations
| | Consolidated
| |
Net cash provided by (used in) operating activities | | $ | 223,775 | | | (5,114 | ) | | 20 | | — | | 218,681 | |
Cash flows from investing activities: | | | | | | | | | | | | | | |
Acquisitions of property, plant and equipment | | | (42,206 | ) | | (4 | ) | | — | | — | | (42,210 | ) |
Other | | | (442 | ) | | 5,089 | | | — | | — | | 4,647 | |
| | |
|
|
| |
|
| |
| |
| |
|
|
Net cash provided by (used in) investing activities | | | (42,648 | ) | | 5,085 | | | — | | — | | (37,563 | ) |
| | |
|
|
| |
|
| |
| |
| |
|
|
Cash flows from financing activities: | | | | | | | | | | | | | | |
Proceeds from long-term debt | | | 196,940 | | | — | | | — | | — | | 196,940 | |
Principal repayments of long-term debt | | | (240,485 | ) | | — | | | — | | — | | (240,485 | ) |
Payments of deferred financing costs | | | (7,965 | ) | | — | | | — | | — | | (7,965 | ) |
Patronage refunds and other equity paid in cash | | | (3,935 | ) | | — | | | — | | — | | (3,935 | ) |
| | |
|
|
| |
|
| |
| |
| |
|
|
Net cash used in financing activities | | | (55,445 | ) | | — | | | — | | — | | (55,445 | ) |
| | |
|
|
| |
|
| |
| |
| |
|
|
Net change in cash and cash equivalents | | | 125,682 | | | (29 | ) | | 20 | | — | | 125,673 | |
Cash and cash equivalents at beginning of
period | | | 8,353 | | | 164 | | | 2,509 | | — | | 11,026 | |
| | |
|
|
| |
|
| |
| |
| |
|
|
Cash and cash equivalents at end of period | | $ | 134,035 | | | 135 | | | 2,529 | | — | | 136,699 | |
| | |
|
|
| |
|
| |
| |
| |
|
|
Statement of Cash Flows:
| | | | | | | | | | | | | | |
| | | Transition quarter ended October 2, 2004
| |
| | | Parent
Only
| | | Guarantor
Subsidiaries
| | | Non-Guarantor
Subsidiary
| | Eliminations
| | Consolidated
| |
Net cash provided by (used in) operating activities | | $ | 70,149 | | | (474 | ) | | 6,017 | | — | | 75,692 | |
Cash flows from investing activities: | | | | | | | | | | | | | | |
Acquisitions of property, plant and equipment | | | (25,160 | ) | | — | | | — | | — | | (25,160 | ) |
Other | | | 694 | | | 652 | | | — | | — | | 1,346 | |
| | |
|
|
| |
|
| |
| |
| |
|
|
Net cash provided by (used in) investing
activities | | | (24,466 | ) | | 652 | | | — | | — | | (23,814 | ) |
| | |
|
|
| |
|
| |
| |
| |
|
|
Cash flows from financing activities: | | | | | | | | | | | | | | |
Principal repayments of long-term debt | | | (1,914 | ) | | — | | | — | | — | | (1,914 | ) |
Payments of deferred financing costs | | | (444 | ) | | — | | | — | | | | (444 | ) |
Patronage refunds and other equity paid in cash | | | (6,719 | ) | | — | | | — | | — | | (6,719 | ) |
Repayments of life insurance policy borrowings | | | (4,211 | ) | | — | | | — | | — | | (4,211 | ) |
| | |
|
|
| |
|
| |
| |
| |
|
|
Net cash used in financing activities | | | (13,288 | ) | | — | | | — | | — | | (13,288 | ) |
| | |
|
|
| |
|
| |
| |
| |
|
|
Net change in cash and cash equivalents | | | 32,395 | | | 178 | | | 6,017 | | — | | 38,590 | |
Cash and cash equivalents at beginning of period | | | 134,035 | | | 135 | | | 2,529 | | — | | 136,699 | |
| | |
|
|
| |
|
| |
| |
| |
|
|
Cash and cash equivalents at end of period | | $ | 166,430 | | | 313 | | | 8,546 | | — | | 175,289 | |
| | |
|
|
| |
|
| |
| |
| |
|
|
56
GOLD KIST INC.
NOTES TO CONSOLIDATED FINANCIAL STATEMENTS—(Continued)
June 28, 2003, June 26, 2004, October 2, 2004 and October 1, 2005
(Amounts in Thousands)
Statement of Cash Flows:
| | | | | | | | | | | | | | | |
| | | For the fiscal year ended October 1, 2005
| |
| | | Parent
Only
| | | Guarantor
Subsidiaries
| | | Non-Guarantor
Subsidiary
| | | Eliminations
| | Consolidated
| |
Net cash provided by (used in) operating activities | | $ | 184,963 | | | (1,333 | ) | | (5,988 | ) | | — | | 177,642 | |
Cash flows from investing activities: | | | | | | | | | | | | | | | |
Acquisitions of property, plant and equipment | | | (80,748 | ) | | (12 | ) | | — | | | — | | (80,760 | ) |
Other | | | 8,379 | | | 1,704 | | | — | | | — | | 10,083 | |
| | |
|
|
| |
|
| |
|
| |
| |
|
|
Net cash provided by (used in) investing activities | | | (72,369 | ) | | 1,692 | | | — | | | — | | (70,677 | ) |
| | |
|
|
| |
|
| |
|
| |
| |
|
|
Cash flows from financing activities: | | | | | | | | | | | | | | | |
Principal repayments of long-term debt | | | (158,266 | ) | | — | | | — | | | — | | (158,266 | ) |
Payments of deferred financing costs | | | (1,017 | ) | | — | | | — | | | — | | (1,017 | ) |
Patronage refunds and other equity paid in cash | | | (3,165 | ) | | — | | | — | | | — | | (3,165 | ) |
Proceeds from initial public offering, net of expenses | | | 139,876 | | | — | | | — | | | — | | 139,876 | |
Cash distributions to members and equity holders | | | (105,963 | ) | | — | | | — | | | — | | (105,963 | ) |
Treasury stock acquired | | | (383 | ) | | — | | | — | | | — | | (383 | ) |
Other | | | 225 | | | — | | | — | | | — | | 225 | |
| | |
|
|
| |
|
| |
|
| |
| |
|
|
Net cash used in financing activities | | | (128,693 | ) | | — | | | — | | | — | | (128,693 | ) |
| | |
|
|
| |
|
| |
|
| |
| |
|
|
Net change in cash and cash equivalents | | | (16,099 | ) | | 359 | | | (5,988 | ) | | — | | (21,728 | ) |
Cash and cash equivalents at beginning of period | | | 166,430 | | | 313 | | | 8,546 | | | — | | 175,289 | |
| | |
|
|
| |
|
| |
|
| |
| |
|
|
Cash and cash equivalents at end of period | | $ | 150,331 | | | 672 | | | 2,558 | | | — | | 153,561 | |
| | |
|
|
| |
|
| |
|
| |
| |
|
|
57
| Item 9. | Changes in and Disagreements with Accountants on Accounting and Financial Disclosure. |
None.
| Item 9A. | Controls and Procedures |
Evaluation of Disclosure Controls and Procedures
We conducted an evaluation of the effectiveness of the design and operation of our “disclosure controls and procedures” (“Disclosure Controls”) as of the end of the period covered by this Form 10-K. The controls evaluation was conducted under the supervision and with the participation of management, including our CEO and CFO. Disclosure Controls are controls and procedures designed to reasonably assure that information required to be disclosed in our reports filed under the Exchange Act, such as this Form 10-K, is recorded, processed, summarized and reported within the time periods specified in the U.S. Securities and Exchange Commission’s (“SEC’s”) rules and forms. Disclosure Controls are also designed to reasonably assure that such information is accumulated and communicated to our management, including the CEO and CFO, as appropriate to allow timely decisions regarding required disclosure. Our quarterly evaluation of Disclosure Controls includes an evaluation of some components of our internal control over financial reporting, and internal control over financial reporting is also separately evaluated on an annual basis for purposes of providing the management report which is set forth below.
The evaluation of our Disclosure Controls included a review of the controls’ objectives and design, our implementation of the controls and the effect of the controls on the information generated for use in this Form 10-K. In the course of the controls evaluation, we reviewed identified data errors or control problems and sought to confirm that appropriate corrective actions, including process improvements, were being undertaken. This type of evaluation is performed on a quarterly basis so that the conclusions of management, including the CEO and CFO, concerning the effectiveness of the Disclosure Controls can be reported in our periodic reports on Form 10-Q and Form 10-K. Many of the components of our Disclosure Controls are also evaluated on an ongoing basis by our Internal Audit Department and by other personnel in our Accounting and Finance organization. The overall goals of these various evaluation activities are to monitor our Disclosure Controls, and to modify them as necessary. Our intent is to maintain the Disclosure Controls as dynamic systems that change as conditions warrant.
Based upon the controls evaluation, our CEO and CFO have concluded that, subject to the limitations noted in this Part II, Item 9A, as of the end of the period covered by this Form 10-K, our Disclosure Controls were effective to provide reasonable assurance that information required to be disclosed in our Exchange Act reports is recorded, processed, summarized and reported within the time periods specified by the SEC, and that material information relating to Gold Kist and its consolidated subsidiaries is made known to management, including the CEO and CFO, particularly during the period when our periodic reports are being prepared.
Changes in Internal Control Over Financial Reporting
There was no change in our internal control over financial reporting that occurred during our fourth fiscal quarter that has materially affected, or is reasonably likely to materially affect, our internal control over financial reporting.
Inherent Limitations on Effectiveness of Controls
Our management, including the CEO and CFO, does not expect that our Disclosure Controls or our internal control over financial reporting will prevent or detect all error and all fraud. A control system, no matter how well designed and operated, can provide only reasonable, not absolute, assurance that the control system’s objectives will be met. The design of a control system must reflect the fact that there are resource constraints, and the benefits of controls must be considered relative to their costs. Further, because of the inherent limitations in
58
all control systems, no evaluation of controls can provide absolute assurance that misstatements due to error or fraud will not occur or that all control issues and instances of fraud, if any, within the Company have been detected. These inherent limitations include the realities that judgments in decision-making can be faulty and that breakdowns can occur because of simple error or mistake. Controls can also be circumvented by the individual acts of some persons, by collusion of two or more people, or by management override of the controls. The design of any system of controls is based in part on certain assumptions about the likelihood of future events, and there can be no assurance that any design will succeed in achieving its stated goals under all potential future conditions. Projections of any evaluation of controls effectiveness to future periods are subject to risks. Over time, controls may become inadequate because of changes in conditions or deterioration in the degree of compliance with policies or procedures.
59
Management’s Report on Internal Control Over Financial Reporting
Management of Gold Kist Inc. (together with its consolidated subsidiaries, the “Company”) is responsible for establishing and maintaining adequate internal control over financial reporting as such term is defined in Exchange Act Rules 13(a) – 15(f). Management conducted an assessment of the effectiveness, as of October 1, 2005, of the Company’s internal control over financial reporting, based on the framework established inInternal Control-Integrated Framework issued by the Committee of Sponsoring Organizations of the Treadway Commission (COSO). Based on our assessment under that framework, management concluded that the Company’s internal control over financial reporting was effective as of October 1, 2005.
Management’s assessment of the effectiveness of the Company’s internal control over financial reporting as of October 1, 2005 has been audited by KPMG LLP, an independent registered public accounting firm, which also audited the consolidated financial statements of the Company included in this Annual Report on Form 10-K. KPMG LLP’s attestation report on management’s assessment and on the effectiveness of the Company’s internal control over financial reporting as of October 1, 2005 appears on the following page.
|
|
| /s/ JOHN BEKKERS |
| John Bekkers |
| Chief Executive Officer |
|
| /s/ STEPHEN O. WEST |
| Stephen O. West |
| Chief Financial Officer |
December 13, 2005
60
Report of Independent Registered Public Accounting Firm
The Board of Directors and Stockholders
Gold Kist Inc.:
We have audited management’s assessment, included in the accompanyingManagement’s Report on Internal Control Over Financial Reporting,that Gold Kist Inc. (the “Company”) maintained effective internal control over financial reporting as of October 1, 2005, based on criteria established inInternal Control—Integrated Framework issued by the Committee of Sponsoring Organizations of the Treadway Commission (“the COSO criteria”). The Company’s management is responsible for maintaining effective internal control over financial reporting and for its assessment of the effectiveness of internal control over financial reporting. Our responsibility is to express an opinion on management’s assessment and an opinion on the effectiveness of the Company’s internal control over financial reporting based on our audit.
We conducted our audit in accordance with the standards of the Public Company Accounting Oversight Board (United States). Those standards require that we plan and perform the audit to obtain reasonable assurance about whether effective internal control over financial reporting was maintained in all material respects. Our audit included obtaining an understanding of internal control over financial reporting, evaluating management’s assessment, testing and evaluating the design and operating effectiveness of internal control, and performing such other procedures as we considered necessary in the circumstances. We believe that our audit provides a reasonable basis for our opinion.
A company’s internal control over financial reporting is a process designed to provide reasonable assurance regarding the reliability of financial reporting and the preparation of financial statements for external purposes in accordance with generally accepted accounting principles. A company’s internal control over financial reporting includes those policies and procedures that (1) pertain to the maintenance of records that, in reasonable detail, accurately and fairly reflect the transactions and dispositions of the assets of the company; (2) provide reasonable assurance that transactions are recorded as necessary to permit preparation of financial statements in accordance with generally accepted accounting principles, and that receipts and expenditures of the company are being made only in accordance with authorizations of management and directors of the company; and (3) provide reasonable assurance regarding prevention or timely detection of unauthorized acquisition, use, or disposition of the company’s assets that could have a material effect on the financial statements.
Because of its inherent limitations, internal control over financial reporting may not prevent or detect misstatements. Also, projections of any evaluation of effectiveness to future periods are subject to the risk that controls may become inadequate because of changes in conditions, or that the degree of compliance with the policies or procedures may deteriorate.
In our opinion, management’s assessment that the Company maintained effective internal control over financial reporting as of October 1, 2005, is fairly stated, in all material respects, based on the COSO criteria. Also, in our opinion, the Company maintained, in all material respects, effective internal control over financial reporting as of October 1, 2005, based on the COSO criteria.
We also have audited, in accordance with the standards of the Public Company Accounting Oversight Board (United States), the consolidated balance sheets of the Company as of June 26, 2004 and October 1, 2005, and the related consolidated statements of operations, patrons’ and other equity/stockholders’ equity and comprehensive income (loss), and cash flows for the years ended June 28, 2003 and June 26, 2004, the transition quarter ended October 2, 2004 and the year ended October 1, 2005, and our report dated December 13, 2005 expressed an unqualified opinion on those consolidated financial statements.
KPMG LLP
Atlanta, Georgia
December 13, 2005
61
| Item 9B. | Other Information. |
None.
PART III
Certain information required by Part III is omitted from this Report in that the Registrant will file a definitive proxy statement pursuant to Regulation 14(a) (the “Proxy Statement”) not later that 120 days after the end of the fiscal year covered by this Report and certain information included therein is incorporated herein by reference. Only those sections of the Proxy Statement that specifically address the items set forth herein are incorporated by reference. Such incorporation does not include the Compensation Committee Report, the Audit Committee Report, or the Performance Graph included in the Proxy Statement.
| Item 10. | Directors and Executive Officers of the Registrant |
The information concerning the Company’s Directors required by this Item is incorporated by reference to the information contained under the captions “Election of Directors—Nominees for Director,” “—Our Senior Management and Directors,” and “Section 16(a) Beneficial Reporting Compliance” in the Proxy Statement. The information concerning our executive officers required by this Item is incorporated by reference to the information contained under the caption “Election of Directors—Our Senior Management and Directors” in our Proxy Statement.
We have adopted a Corporate Code of Business Conduct that applies to all of our directors, officers and employees. A copy of our Corporate Code of Business Conduct is available publicly on our website atwww.goldkist.com. We will also provide to any person, without charge, upon request, a copy of our Corporate Code of Business Conduct. Such requests should be made to Gold Kist Inc., 244 Perimeter Center Parkway, N.E., Atlanta, Georgia 30346. If we make any substantive amendment to the Code, or grant any waiver, including any implicit waiver, from a provision of the Code, that applies to our chief executive officer, chief financial officer or chief accounting officer, we will disclose the nature of the amendment or waiver on that website. We may elect to also disclose the amendment or waiver in a report on Form 8-K filed with the SEC.
| Item 11. | Executive Compensation |
The information concerning the Company’s Executive Officers required by this Item is incorporated by reference to the information contained under the captions “Corporate Governance Matters—Director Compensation” and “Executive Compensation” in the Proxy Statement.
| Item 12. | Security Ownership of Certain Beneficial Owners and Management and Related Stockholder Matters |
The information concerning security ownership required by this Item is incorporated by reference to the information contained under the caption “Principal Stockholders” and “Executive Compensation—Equity Compensation Plan Information” in the Proxy Statement.
| Item 13. | Certain Relationships and Related Transactions |
The information required by this item is incorporated by reference to the information contained under the caption “Certain Relationships and Related Transactions” in the Proxy Statement.
| Item 14. | Principal Accountant Fees and Services |
The information required by this item is incorporated by reference to the information contained under the caption “Proposal 2—Ratification of KPMG LLP as the Independent Registered Public Accounting Firm of the Company for Fiscal 2006” in the Proxy Statement.
62
PART IV
| Item 15. | Exhibits and Financial Statement Schedules |
(a) The following documents are filed as part of this report:
| | • | | Consolidated Balance Sheets as of June 26, 2004 and October 1, 2005 |
| | • | | Consolidated Statements of Operations for the years ended June 28, 2003 and June 26, 2004, the transition quarter ended October 2, 2004, and the year ended October 1, 2005 |
| | • | | Consolidated Statements of Patrons’ and Other Equity/Stockholders’ Equity and Comprehensive Income (Loss) for the years ended June 28, 2003 and June 26, 2004, the transition quarter ended October 2, 2004, and the year ended October 1, 2005 |
| | • | | Consolidated Statements of Cash Flows for the years ended June 28, 2003 and June 26, 2004, the transition quarter ended October 2, 2004, and the year ended October 1, 2005 |
| | • | | Notes to Consolidated Financial Statements |
| | • | | Report of Independent Registered Public Accounting Firm |
| 2. | Financial Statement Schedules: |
| | • | | Schedule II—Valuation Reserves and Qualifying Accounts |
All other schedules are omitted because they are neither applicable nor required.
The exhibits filed with this report are listed in the Exhibit Index at the end of this Item 15.
(b) Index of Exhibits
| | |
Exhibit No.
| | Description of Exhibit
|
| 2.1 | | Amended and Restated Agreement and Plan of Conversion, dated as of July 23, 2004, between Gold Kist Holdings Inc. and Gold Kist Inc. (1) |
| |
| 2.2 | | Supplement to Amended and Restated Plan of Conversion, dated September 23, 2004, between Gold Kist Holdings Inc. and Gold Kist Inc. (1) |
| |
| 3.1 | | Amended and Restated Certificate of Incorporation of Gold Kist Holdings Inc. (2) |
| |
| 3.2 | | By-Laws of Gold Kist Holdings Inc. (2) |
| |
| 4.1 | | Indenture, dated March 10, 2004, by and between the Company and U.S. Bank National Association, as Trustee (3) |
| |
| 4.2 | | Form of 10 1/4% Senior Note due 2014 (3) |
| |
| 4.3 | | Form of Common Stock Certificate of Gold Kist Holdings Inc. (4) |
| |
| 4.4 | | Stockholder Protection Rights Agreement, dated July 9, 2004, between Gold Kist Holdings Inc. and SunTrust Bank, as rights agent (5) |
| |
| 10.1 | | Fourth Amended and Restated Credit Agreement dated as of March 10, 2004, with various banks and lending institutions, as lenders and Cooperative Centrale Raiffeisen-Boerenleen Bank B.A., New York Branch, as agent (3) |
63
| | |
Exhibit No.
| | Description of Exhibit
|
| 10.2 | | Form of Deferred Compensation Agreement between Gold Kist Inc. and certain executive
officers. (6) |
| |
| 10.3 | | Form of Gold Kist Supplement Executive Retirement Income nonqualified deferred compensation agreement between Gold Kist and certain executive officers and Resolution of Gold Kist Board of Directors authorizing the Supplemental Executive Retirement Plan (7) |
| |
| 10.4 | | Form of Director Emeritus Life Benefits Agreement (8) |
| |
| 10.5 | | Form of Director Emeritus Agreement for Medical Benefits (8) |
| |
| 10.6 | | Gold Kist Executive Savings Plan, as amended (8) |
| |
| 10.7 | | Gold Kist Enhanced Defined Contribution Plan (9) |
| |
| 10.8 | | Gold Kist Holdings Inc. Long-Term Incentive Plan (5) |
| |
| 10.9 | | Form of Restricted Stock Certificate (10) |
| |
| 10.10 | | Form of Stock Appreciation Rights Certificate (10) |
| |
| 10.11 | | Form of Performance Share Certificate (10) |
| |
| 10.12 | | Gold Kist Holdings Inc. Executive Management Incentive Plan (5) |
| |
| 10.13 | | Gold Kist Inc. 2004 Non-Employee Directors Compensation Plan (11) |
| |
| 10.14 | | Amendment No. 1 to Gold Kist Inc. 2004 Non-Employee Directors Compensation Plan (12) |
| |
| 10.15 | | Form of Deferred Stock Unit Award for Directors under Gold Kist Inc. 2004 Non-Employee Directors Compensation Plan (13) |
| |
| 10.16 | | Form of Restricted Stock Agreement for Non-Employee Directors (11) |
| |
| 10.17 | | Form of Gold Kist Executive’s Change in Control Agreement between Gold Kist and certain officers (10) |
| |
| 10.18 | | Employment Agreement between the Company and John Bekkers (10) |
| |
| 10.19 | | Employment Agreement between the Company and Michael A. Stimpert (10) |
| |
| 10.20 | | Summary of Named Executive Officer Compensation Arrangements |
| |
| 10.21 | | General Partnership Agreement (GC Properties) between Gold Kist Inc. and Cotton States Mutual Insurance Company, dated as of July 1, 1984 (14) |
| |
| 10.22 | | Lease from GC Properties, dated December 11, 1984, for home office building space (14) |
| |
| 21 | | Subsidiaries of the Company |
| |
| 23 | | Consent of Independent Registered Public Accounting Firm. |
| |
| 24.1 | | Power of Attorney (included with signatures) |
| |
| 31 | | Section 302, Sarbanes-Oxley Act Certifications |
| |
| 32 | | Section 906, Sarbanes-Oxley Act Certifications |
| (1) | Incorporated by reference to the Company’s Registration Statement on Form S-4 (File No. 333-119393) filed on September 30, 2004. |
| (2) | Incorporated by reference to the Company’s Current Report on Form 8-K (File No. 000-50925) filed on October 13, 2004. |
| (3) | Incorporated by reference to the Current Report on Form 8-K (File No. 002-62681) of Gold Kist Inc, a Georgia cooperative marketing association (the “Predecessor Company”), filed on March 12, 2004. |
64
| (4) | Incorporated by reference to Amendment No. 2 to the Company’s Registration Statement on Form S-4 (File No. 333-116066) filed on August 6, 2004. |
| (5) | Incorporated by reference to Amendment No. 1 to the Company’s Registration Statement on Form S-4 (File No. 333-116066) filed on July 14, 2004. |
| (6) | Incorporated by reference to the Predecessor Company’s Registration Statement on Form S-2 (File No. 2-59958). |
| (7) | Incorporated by reference to the Predecessor Company’s Registration Statement on Form S-2 (File No. 233-9007). |
| (8) | Incorporated by reference to the Predecessor Company’s Registration Statement filed on Form S-2 (File No. 33-36938). |
| (9) | Incorporated by reference to the Predecessor Company’s Annual Report on Form 10-K filed on October 13, 2000 (File No. 002-62681). |
| (10) | Incorporated by reference to the Company’s Current Report on Form 8-K (File No. 000-50925) filed on January 28, 2005. |
| (11) | Incorporated by reference to the Company’s Current Report on Form 8-K (File No. 000-50925) filed on October 26, 2004. |
| (12) | Incorporated by reference to the Company’s Quarterly Report on Form 10-Q filed on August 16, 2005 (File No. 000-50925). |
| (13) | Incorporated by reference to the Company’s Quarterly Report on Form 10-Q filed on February 15, 2005 (File No. 000-50925). |
| (14) | Incorporated by reference to the Predecessor Company’s Registration Statement on Form S-2 (File No. 33-428). |
65
GOLD KIST INC.
Schedule II—Valuation Reserves and Qualifying Accounts
(Dollar Amounts in Thousands)
| | | | | | | | | | | | |
COLUMN A
| | COLUMN B
| | COLUMN C
| | COLUMN D
| | | COLUMN E
|
| | | | | Additions
| | | | | |
Description
| | Balance at
Beginning
Of Period
| | Charged to
Cost and
Expenses
| | Charged
To Other
Accounts
| | Deductions
| | | Balance
At End
Of Period
|
Deducted in the consolidated balance sheets from the asset to which it applies: | | | | | | | | | | | | |
| | | | | |
Allowance for doubtful accounts: | | | | | | | | | | | | |
| | | | | |
Year ended June 28, 2003 | | $ | 1,194 | | 1,030 | | — | | 222 | (A) | | 2,002 |
Year ended June 26, 2004 | | | 2,002 | | 588 | | — | | 1,161 | (A) | | 1,429 |
Transition quarter ended October 2, 2004 | | | 1,429 | | 58 | | — | | 6 | (A) | | 1,481 |
Year Ended October 1, 2005 | | | 1,481 | | 563 | | — | | 942 | (A) | | 1,102 |
| | | | | |
(A) Represents accounts written off. | | | | | | | | | | | | |
| | | | | |
Allowance for deferred tax assets valuation: | | | | | | | | | | | | |
| | | | | |
Year ended June 28, 2003 | | $ | 399 | | 10,331 | | — | | — | | | 10,730 |
Year ended June 26, 2004 | | | 10,730 | | — | | — | | 10,301 | (B) | | 429 |
Transition quarter ended October 2, 2004 | | | 429 | | 126 | | — | | — | | | 555 |
Year ended October 1, 2005 | | | 555 | | 17 | | — | | — | | | 572 |
| | | | | |
(B) Represents reversal of valuation allowance. | | | | | | | | | | | | |
66
Signatures
Pursuant to the requirements of Section 13 or 15(d) of the Securities Exchange Act of 1934, the registrant has duly caused this report to be signed on its behalf by the undersigned, thereunto duly authorized.
| | | | | | | | |
| | | | | GOLD KIST INC. |
| | | |
| Date: December 14, 2005 | | | | By: | | /s/ JOHN BEKKERS |
| | | | | | | | | John Bekkers, Chief Executive Officer |
| | | | | | | | | (Principal Executive Officer) |
Each of the undersigned directors and officers of Gold Kist Inc. hereby constitutes and appoints Stephen O. West and J. David Dyson and each of them, his true and lawful attorneys-in-fact and agents, with full power of substitution and resubstitution, for us and in our name, place and stead, in any and all capacities, to sign any and all amendments to this report and to file the same, with all exhibits thereto, and other documents in connection therewith, with the Securities and Exchange Commission, and each of the undersigned does hereby ratify and confirm all that said attorneys-in-fact and agents, or their substitutes, may lawfully do or cause to be done by virtue hereof.
Pursuant to the requirements of the Securities Exchange Act of 1934, this report has been signed below by the following persons on behalf of the registrant and in the capacities and on the dates indicated.
| | | | |
SIGNATURE
| | TITLE
| | DATE
|
| | |
/s/ JOHN BEKKERS
JOHN BEKKERS | | Chief Executive Officer
(Principal Executive Officer) | | December 14, 2005 |
| | |
/s/ STEPHEN O. WEST
STEPHEN O. WEST | | Chief Financial Officer
(Principal Financial Officer) | | December 14, 2005 |
| | |
/s/ W. F. POHL, JR.
W. F. POHL, JR. | | Controller
(Principal Accounting Officer) | | December 14, 2005 |
| | |
/s/ R. RANDOLPH DEVENING
R. RANDOLPH DEVENING | | Director | | December 14, 2005 |
| | |
/s/ A. D. FRAZIER
A. D. FRAZIER | | Director | | December 14, 2005 |
| | |
/s/ RAY GOLDBERG
RAY GOLDBERG | | Director | | December 14, 2005 |
| | |
/s/ JEFFERY A. HENDERSON
JEFFERY A. HENDERSON | | Director | | December 14, 2005 |
| | |
/s/ JOHN D. JOHNSON
JOHN D. JOHNSON | | Director | | December 14, 2005 |
| | |
/s/ DOUGLAS A. REEVES
DOUGLAS A. REEVES | | Director | | December 14, 2005 |
| | |
/s/ DAN SMALLEY
DAN SMALLEY | | Director | | December 14, 2005 |
| | |
/s/ WAYNE WOODY
WAYNE WOODY | | Director | | December 14, 2005 |
67