QuickLinks -- Click here to rapidly navigate through this document
UNITED STATES
SECURITIES AND EXCHANGE COMMISSION
Washington, DC 20549
Form 10-K
| (Mark One) | ||
ý | ANNUAL REPORT PURSUANT TO SECTION 13 OR 15(d) OF THE SECURITIES EXCHANGE ACT OF 1934 | |
For the fiscal year ended January 3, 2009 | ||
o | TRANSITION REPORT PURSUANT TO SECTION 13 OR 15(d) OF THE SECURITIES EXCHANGE ACT OF 1934 | |
For the transition period from to | ||
Commission File Number 1-32266
Polypore International, Inc.
(Exact Name of Registrant as Specified in Its Charter)
| Delaware (State or Other Jurisdiction of Incorporation or Organization) | 43-2049334 (IRS Employer Identification No.) | |
11430 North Community House Road, Suite 350 Charlotte, North Carolina (Address of Principal Executive Offices) | 28277 (Zip Code) |
Registrant's Telephone Number, Including Area Code
(704) 587-8409
Securities registered pursuant to Section 12(b) of the Act:
Title of each class: | Name of each exchange on which registered: | |
|---|---|---|
| Common stock, par value $0.01 per share | New York Stock Exchange |
Securities registered pursuant to Section 12(g) of the Act:None
Indicate by check mark if the registrant is a well-known seasoned issuer, as defined in Rule 405 of the Securities Act. o Yes ý No
Indicate by check mark if the registrant is not required to file reports pursuant to Section 13 or Section 15(d) of the Act. o Yes ý No
Indicate by check mark whether the registrant: (1) has filed all reports required to be filed by Section 13 or 15(d) of the Securities Exchange Act of 1934 during the preceding 12 months (or for such shorter period that the registrant was required to file such reports), and (2) has been subject to such filing requirements for the past 90 days. ý Yes o No
Indicate by check mark if disclosure of delinquent filers pursuant to Item 405 of Regulation S-K is not contained herein, and will not be contained, to the best of registrant's knowledge, in definitive proxy or information statements incorporated by reference in Part III of this Form 10-K or any amendment to this Form 10-K. ý
Indicate by check mark whether the registrant is a large accelerated filer, an accelerated filer, a non-accelerated filer or a smaller reporting company. See the definitions of "large accelerated filer", "accelerated filer" and "smaller reporting company" in Rule 12b-2 of the Exchange Act.
| Large accelerated filer o | Accelerated filer ý | Non-accelerated filer o (Do not check if a smaller reporting company) | Smaller reporting company o |
Indicate by checkmark whether the registrant is a shell company (as defined in Rule 12b-2 of the Exchange Act). o Yes ý No
The aggregate market value of the voting common stock of the Registrant held by non-affiliates of the registrant at June 28, 2008 was $517,598,000, as computed by reference to the closing price of such stock on such date. For purposes of this calculation, executive officers, directors and 5% shareholders are deemed to be affiliates of the registrant.
There were 44,377,560 shares of the registrant's common stock outstanding as of March 6, 2009.
DOCUMENTS INCORPORATED BY REFERENCE
Portions of the registrant's definitive proxy statement for the 2008 Annual Meeting of Stockholders, which will be filed within 120 days of January 3, 2009, are incorporated by reference into Part III.
Polypore International, Inc.
Index to Annual Report on Form 10-K
For the Fiscal Year Ended January 3, 2009
| | | Page | ||
|---|---|---|---|---|
Part I | ||||
Item 1. | Business | 5 | ||
Item 1A. | Risk Factors | 16 | ||
Item 1B. | Unresolved Staff Comments | 23 | ||
Item 2. | Properties | 23 | ||
Item 3. | Legal Proceedings | 23 | ||
Item 4. | Submission of Matters to a Vote of Security Holders | 24 | ||
Part II | ||||
Item 5. | Market for Registrant's Common Equity, Related Stockholder Matters and Issuer Purchases of Equity Securities | 24 | ||
Item 6. | Selected Financial Data | 26 | ||
Item 7. | Management's Discussion and Analysis of Financial Condition and Results of Operations | 28 | ||
Item 7A. | Quantitative and Qualitative Disclosures About Market Risk | 45 | ||
Item 8. | Financial Statements and Supplementary Data | 47 | ||
Item 9. | Changes in and Disagreements with Accountants on Accounting and Financial Disclosure | 93 | ||
Item 9A. | Controls and Procedures | 93 | ||
Item 9B. | Other Information | 93 | ||
Part III | ||||
Item 10. | Directors, Executive Officers and Corporate Governance | 94 | ||
Item 11. | Executive Compensation | 94 | ||
Item 12. | Security Ownership of Certain Beneficial Owners and Management and Related Stockholder Matters | 94 | ||
Item 13. | Certain Relationships and Related Transactions, and Director Independence | 94 | ||
Item 14. | Principal Accountant Fees and Services | 94 | ||
Part IV | ||||
Item 15. | Exhibits and Financial Statement Schedules | 94 | ||
Signatures | 98 | |||
In this Annual Report on Form 10-K, the words "Polypore International," "Company," "we," "us" and "our" refer to Polypore International, Inc. together with its subsidiaries, unless the context indicates otherwise. References to "fiscal year" mean the 52 or 53 week period ending on the Saturday that is closest to December 31. The fiscal year ended January 3, 2009, or "fiscal 2008," included 53 weeks. The fiscal years ended December 29, 2007, or "fiscal 2007," and December 30, 2006, or "fiscal 2006," each included 52 weeks.
2
This Annual Report on Form 10-K includes "forward-looking statements" within the meaning of Section 27A of the Securities Act of 1933, as amended (the "Securities Act") and Section 21E of the Securities Exchange Act of 1934, as amended (the "Exchange Act"), and the Private Securities Litigation Reform Act of 1995. All statements other than statements of historical facts included in this Annual Report on Form 10-K that address activities, events or developments that we expect, believe or anticipate will or may occur in the future are forward-looking statements, including, in particular, the statements about Polypore International's plans, objectives, strategies and prospects regarding, among other things, the financial condition, results of operations and business of Polypore International and its subsidiaries. We have identified some of these forward-looking statements with words like "believe," "may," "will," "should," "expect," "intend," "plan," "predict," "anticipate," "estimate" or "continue" and other words and terms of similar meaning. These forward-looking statements may be contained under the captions entitled "Business," "Properties," "Controls and Procedures," "Management's Discussion and Analysis of Financial Condition and Results of Operations" or "Risk Factors," or the Company's financial statements or the notes thereto.
These forward-looking statements are based on current expectations about future events affecting us and are subject to uncertainties and factors relating to our operations and business environment, all of which are difficult to predict and many of which are beyond our control. Many factors mentioned in our discussion in this Annual Report on Form 10-K, including the risks outlined under the caption below entitled "Item 1A. Risk Factors," will be important in determining future results. Although we believe that the expectations reflected in our forward-looking statements are reasonable, we do not know whether our expectations will prove correct. They can be affected by inaccurate assumptions we might make or by known or unknown risks and uncertainties, including with respect to Polypore International, the following, among other things:
- •
- the highly competitive nature of the markets in which we sell our products;
- •
- the failure to continue to develop innovative products;
- •
- the loss of our customers;
- •
- the vertical integration by our customers of the production of our products into their own manufacturing process;
- •
- increases in prices for raw materials or the loss of key supplier contracts;
- •
- our substantial indebtedness;
- •
- interest rate risk related to our variable rate indebtedness;
- •
- our inability to generate cash;
- •
- restrictions related to the senior secured credit facilities;
- •
- employee slowdowns, strikes or similar actions;
- •
- product liability claims exposure;
- •
- risks in connection with our operations outside the United States;
- •
- the incurrence of substantial costs to comply with, or as a result of violations of, or liabilities under environmental laws;
- •
- the failure to protect our intellectual property;
- •
- the loss of senior management;
3
- •
- the incurrence of additional debt, contingent liabilities and expenses in connection with future acquisitions;
- •
- the failure to effectively integrate newly acquired operations;
- •
- the adverse impact on our financial condition of past restructuring activities;
- •
- the absence of expected returns from the amount of intangible assets we have recorded;
- •
- the adverse impact from legal proceedings on our financial condition;
- •
- natural disasters, epidemics, terrorist acts and other events beyond our control; and
- •
- economic uncertainty and the current crisis in global credit and financial markets.
Because our actual results, performance or achievements could differ materially from those expressed in, or implied by, the forward-looking statements, we cannot give any assurance that any of the events anticipated by the forward-looking statements will occur or, if any of them do, what impact they will have on Polypore International's results of operations and financial condition. You are cautioned not to place undue reliance on these forward-looking statements, which speak only as of the date of this Annual Report on Form 10-K. We do not undertake any obligation to update these forward-looking statements or the factors set forth in the caption below entitled "Item 1A. Risk Factors" to reflect new information, future events or otherwise, except as may be required under federal securities laws.
We have filed this Annual Report on Form 10-K, Quarterly Reports on Form 10-Q and Current Reports on Form 8-K, and will file or furnish other reports pursuant to Section 13(a) or 15(d) under the Exchange Act, with the Securities and Exchange Commission ("Commission" or "SEC"). You may inspect a copy of any of our filings without charge at the Public Reference Room of the SEC at 100 F Street, NE, Washington, DC 20549. You may obtain copies of our filings from such office at prescribed rates. You may also obtain information on the operation of the Public Reference Room by calling the SEC at 1-800-SEC-0330. The SEC maintains an Internet site at http://www.sec.gov that contains reports, proxy and information statements and other information regarding issuers, including Polypore International, Inc., that file electronically with the SEC. Our reports are available on the SEC website as soon as reasonably practicable after we electronically file such materials with the SEC. The reports are also available in print to any stockholder who requests them by contacting our corporate secretary at the Company's principal executive offices: 11430 North Community House Road, Suite 350, Charlotte, NC 28277. Our website address ishttp://www.polypore.net.
4
General
Overview
Polypore International, Inc., a Delaware corporation, is a leading global high technology filtration company that develops, manufactures and markets specialized microporous membranes used in separation and filtration processes. The microporous membranes we produce are highly engineered polymeric structures that contain millions of pores per square inch, enabling the management of ions, gases and particles that range in size from the cellular to the nano or molecular level.
Our products and technologies are used in two primary segments, energy storage and separations media. The energy storage segment accounted for approximately 74% of our fiscal 2008 net sales. Primary applications for our membranes in this segment are lithium batteries and lead-acid batteries. Lithium batteries are the power source in a wide variety of electronics applications ranging from notebook computers and mobile phones to cordless power tools, and are emerging in applications such as electric and hybrid electric vehicles ("HEVs"). Lead-acid batteries are used in transportation and industrial applications. The separations media segment accounted for approximately 26% of our fiscal 2008 net sales. Primary applications for our membranes and membrane modules in this segment are hemodialysis, blood oxygenation, plasmapheresis and various high-performance microfiltration, ultrafiltration and gasification/degasification applications.
Information concerning segments and geographic information appears under "Note 20—Segment Information" in the Notes to Consolidated Financial Statements for the year ended January 3, 2009 included in Item 8 of this Report which is incorporated herein by reference.
Competitive strengths
Serve end-markets that have attractive long-term growth characteristics
We produce a variety of separation and filtration products for end-markets with attractive growth characteristics, which in many cases are supported by a growing recurring revenue base.
- •
- The lithium battery market is expected to grow at 10% annually, driven by continuing demand for consumer electronics and by the application of lithium battery technology in new markets. We believe that growth in membrane separator demand will exceed battery growth due to increasing demand for large-format lithium batteries used in new applications such as vehicle electrification.
- •
- In the motor vehicle battery market, the high proportion of aftermarket sales and the steady growth of the worldwide fleet of motor vehicles provide us with a growing, recurring revenue base in lead-acid battery membrane separators.
- •
- The hemodialysis membrane market, which we believe will increase in excess of 6% annually, provides a growing, recurring revenue base for our synthetic dialysis membranes.
- •
- The micro-, ultra-, and nanofiltration membrane element market is expected to grow in excess of 8% annually, driven by several factors including the superior performance of membrane filtration and the increasing need for purity in end-markets such as water treatment, food and beverage processing and pharmaceutical, semiconductor and flat panel display manufacturing.
5
Leading market positions
We believe that we are well positioned in each of the markets in which we compete. For example, in terms of market share (based on revenue and volume):
- •
- We believe, based on independent industry research, that we are one of the top three lithium battery membrane separator providers, serving the entire breadth of lithium battery applications.
- •
- We believe, based on internal company estimates, that we are the global market leader in the lead-acid battery separator market.
- •
- We believe, based on independent industry research, that we are the world's leading supplier of blood oxygenation membranes and that we are uniquely positioned as the leading independent supplier (i.e., not a supplier of dialyzers) of synthetic hemodialysis membranes.
- •
- We believe, based on internal company estimates, that in the industrial and specialty filtration market, we are the world leader in membrane gasification and degasification for liquids with our Liqui-Cel® membrane contactors. We also believe, based on internal company estimates and independent industry research, that we are the world's leading independent supplier of polyethersulfone flat sheet membranes.
We believe, based on the information above and other company estimates, that we are among the top three in terms of market share (based on revenue and volume) in products comprising a total of approximately 83% of our fiscal 2008 net sales. These products include lead-acid battery membrane separators, lithium battery membrane separators, blood oxygenation membranes, membrane contactors for gasification/degasification of liquids and plasmapheresis membranes.
Proven innovation through broad product and process technology
We have established our leading market positions through our ability to utilize core technical expertise and broad product and process capabilities to develop customized solutions that meet demanding requirements in specific applications. Over time, we have demonstrated a commitment to innovation, developing technical expertise and a high level of customer service. Our research and development effort is supported by approximately 75 engineers, scientists, PhDs and other personnel. These personnel work closely with our manufacturing and marketing groups to commercialize innovative products that address market needs. We also maintain technical centers strategically located in Asia, Europe and North America.
We have leveraged our established filtration and separation technology and membrane expertise to supply a broad portfolio of membranes based on flat sheet, hollow fiber, and tubular technology. We are able to draw upon our experiences across multiple end-markets and various membrane technologies to create innovative solutions in new niche applications in addition to our existing markets. For example, our Liqui-Cel® membrane contactor product line, which combines our blood oxygenation membrane technology with patented module design features, provides superior performance to conventional gasification/degasification methods in multiple applications such as semiconductor and flat panel display manufacturing. We believe that our capabilities in product innovation, which combine multiple technologies, a global technical infrastructure and extensive experience in microporous membrane development and manufacturing, are difficult to replicate.
Strong customer relationships with leading manufacturers
We have cultivated strong, collaborative relationships with a diverse base of customers worldwide who are among the leaders in their respective industries. Our research and development teams, technical service staff and application development groups work closely with our customers. We often enter into joint agreements in which we partner with our customers on product development and
6
end-use testing. As a result, many of our products have been customized to our customers' exacting manufacturing and end-use specifications. In addition, we are often selected as a customer's exclusive supplier for our microporous membrane products.
Global presence
As of January 3, 2009, we manufacture, market and service our products through 14 manufacturing sites and 13 sales and service locations throughout the Americas, Europe and Asia, with sales relatively balanced across these regions. In the energy storage segment, we remain focused on growth in the Asia Pacific region and on driving worldwide improvements in production efficiency. For example, to better serve our growing lithium battery customers in Asia, we moved some lithium battery membrane separator finishing capacity from our Charlotte, North Carolina plant to our Shanghai, China plant in 2005, and in 2008 we acquired a South Korean lithium battery membrane separator manufacturer. Our lead-acid battery membrane separator business has also focused on growth in the Asia Pacific region by increasing capacity at our Prachinburi, Thailand facility in 2006 and 2008, acquiring a 60% share in a lead-acid battery membrane separator production facility in Tianjin, China in 2007 and acquiring a finishing operation in Bangalore, India in 2008.
By strategically positioning our manufacturing, sales and marketing, and technical service personnel near our customers, we can respond to their needs more effectively, provide a higher level of service, reduce shipping costs and improve delivery and response times. In addition, our global presence enables us to participate in faster growth markets in developing regions of the world.
State-of-the-art manufacturing facilities
We believe we have state-of-the-art manufacturing facilities and capabilities. Our equipment, manufacturing techniques and process technologies have been developed over many years with significant intellectual property, know-how and capital investments. Our wide range of manufacturing processes enables us to produce specialized products that are difficult and costly to replicate in the market. We continually evaluate projects that will improve or enhance our global manufacturing capabilities.
Strong and experienced management team
Our senior management team has significant experience leading high technology companies, driving growth through development of new applications and technologies, and cultivating strong relationships with existing customers. Management has also demonstrated a track record of successfully leading companies larger in size and scope than ours. The team has an average of more than 20 years of management experience.
Business strategy
We intend to:
- •
- grow with our current customer and application base by capitalizing on our core capabilities in microporous membranes and modules;
- •
- leverage existing and developing product and process technologies to pursue new, high value-added markets and applications; and
- •
- maximize access to key customers and end-markets through strategic relationships and acquisitions.
7
Products and markets
Our business segments are energy storage and separations media. The following table describes our key products and end-markets served:
Segment | Applications | Major brands | End-markets | |||
|---|---|---|---|---|---|---|
Energy storage | Lead-acid batteries | Daramic® DARAK® FLEX-SIL® CellForce® ACE-SIL® | Transportation and industrial batteries | |||
Rechargeable and disposable lithium batteries | CELGARD® | Portable consumer electronics devices such as mobile phones, audio/video players, notebook computers and cameras. Also cordless power tools and hybrid/electric vehicles, such as bikes, scooters, cars, trucks, buses and industrial utility vehicles | ||||
Separations media | Hemodialysis | PUREMA® | Hemodialysis dialyzers which replicate function of healthy kidneys | |||
Blood oxygenation | CELGARD® | Heart-lung machine oxygenation unit for open-heart surgical procedures | ||||
Plasmapheresis | MicroPES® | Blood cell and plasma separation equipment | ||||
Industrial and specialty filtration applications | Liqui-Flux® | Potable water treatment, beverage filtration, and prefiltration for reverse osmosis | ||||
Accurel® | Specialty filtration applications including chemical filtration for microelectronics manufacturing, vent and process air, industrial wastewater treatment, and pharmaceutical processing | |||||
Liqui-Cel® | Liquid gasification/degasification for beverage processing and pharmaceutical, semiconductor and flat panel display manufacturing | |||||
MicroPES® | Specialty filtration applications including ultrapure water, cold sterile filtration of beverages and pharmaceutical processing | |||||
SuperPhobic® | Solvent/ink deaeration for ink jet printers and semiconductor manufacturing | |||||
MicroModule® | Liquid degasification in laboratory, biotechnology and analytical testing equipment, ink degasification for ink jet printers | |||||
P.E.T.® | Potable water treatment, beverage filtration, prefiltration for reverse osmosis and medical applications |
Energy storage
In the energy storage segment, our membrane separators are a critical performance component in lithium and lead-acid batteries, performing the core function of regulating ion exchange and thus
8
allowing the charge and discharge process to occur between a battery's positive and negative electrodes. These membrane separators require specialized technical engineering and must be manufactured to extremely demanding requirements and specifications including thickness, porosity, mechanical strength and chemical and electrical resistance. For example, membrane pores must be large enough to allow ions to pass through, but small enough to prevent contamination from conductive particles that cause short circuits. During fiscal 2008, fiscal 2007 and fiscal 2006, our energy storage businesses accounted for 74%, 71% and 71% of our net sales, respectively.
Electronics applications. We develop, manufacture and market a broad line of patented polypropylene and polyethylene monolayer and multilayer membrane separators for lithium batteries that are used in numerous applications such as personal electronic devices, cordless power tools and HEVs and other electric vehicles. According to the Institute of Information Technology, unit sales of lithium batteries are expected to experience average annual growth of 10% through 2013. Lithium batteries provide critical performance advantages relative to alternative battery technologies, such as faster charging rates, improved battery life and higher power density, which results in more compact, lightweight batteries. These advantages create the potential for expansion by lithium batteries into additional devices. Because many new applications are incorporating large-format batteries that require much greater membrane separator volume per battery, we believe that membrane separator growth will exceed battery unit sales growth.
We believe, based on independent industry research, that we are one of the top three lithium battery membrane separator providers, serving the entire breadth of lithium battery applications, and have been among the top three since the market's first development in the early 1990s. We believe the top three providers supply over 80% of the membrane separator requirements for the global lithium battery market. Major lithium battery manufacturers include A123 Systems, Amperex Technology Limited, BYD Company Limited, China BAK Battery, Inc., Energizer Holdings, Inc., Hitachi Maxell Limited, LG Chem Ltd., NEC Tokin Corporation, Panasonic Corporation—Energy Company (formerly known as Matsushita Battery Industrial Company Limited), Saft Groupe SA, Samsung SDI Co. Ltd., Sanyo Electric Company Limited, Sony Corporation, Tianjin Lishen Battery Joint Stock Co., Ltd. and Ultralife Batteries, Inc.
Transportation and industrial applications. We develop, manufacture and market a complete line of high-performance polymer-based membrane separators for lead-acid batteries. Approximately 80% of our lead-acid battery separators are used in batteries for automobiles and other motor vehicles. The remaining approximately 20% are used in industrial battery applications such as forklifts, submarines and uninterruptible power supply systems, which provide backup power for applications such as computers, mobile phone towers and hospitals. We believe that over 80% of lead-acid battery unit sales for motor vehicles are aftermarket batteries. Aftermarket sales are primarily driven by the size of the worldwide vehicle fleet rather than by new motor vehicle sales. According to WardsAuto.com, the worldwide fleet of motor vehicles has averaged 3% annual growth for over 20 years, providing us with a growing recurring revenue base. We believe another factor contributing to market growth is the worldwide conversion from alternative separator materials to the higher performance polyethylene-based membrane separators such as those we produce. Currently, membrane separator market growth is strongest in the Asia Pacific region due, we believe, to increasing per capita penetration of automobiles, growth in the industrial and manufacturing sectors, and a high rate of conversion to polyethylene-based membrane separators.
We believe, based on published industry data, we are the global market leader in the lead-acid battery separator market and the only supplier serving both the automotive and industrial segments. We supply most of the world's major lead-acid battery manufacturers including East Penn Manufacturing Co., Inc., EnerSys, Exide Technologies, GS Yuasa Corporation and Trojan Battery Company.
9
Separations media
In the separations media segment, our filtration membranes and modules are used in healthcare and high-performance industrial and specialty filtration applications. These membranes perform the critical function of removing sub-micron particulates from fluids and introducing or removing gases (gasification/degasification) within liquids. Both healthcare and specialty filtration applications require membranes with precisely controlled pore size, structure, distribution and uniformity. Our supply relationships with customers in healthcare and certain filtration applications such as pharmaceutical manufacturing are reinforced by the rigorous testing, clinical studies and/or regulatory approval that our membranes undergo prior to end-product commercialization. In some cases, several years of development and qualification are required. During fiscal 2008, fiscal 2007 and fiscal 2006, our separations media business accounted for 26%, 29% and 29% of our sales, respectively.
Healthcare Applications
We develop, manufacture and market a complete line of patented polyethersulfone membranes for the hemodialysis market. Hemodialysis is the artificial process that performs the function of a healthy kidney for patients with permanent kidney failure, a condition known as End Stage Renal Disease ("ESRD"). In a healthy person, the kidney carries out certain excretory and endocrine functions, including filtering toxins from the blood and controlling blood pressure. For an ESRD patient on dialysis, the dialyzer membrane performs these critical filtering functions. The membranes consist of thousands of fibers that resemble hollow straws slightly larger than a human hair. These fibers have nanopores in their walls at a density of millions of pores per square inch. The size and distribution of these nanopores are designed to separate harmful toxins from the healthy blood passing through the dialyzer. Growth in demand for dialyzers and dialyzer membranes is driven by several factors, including the aging population in developed countries, longer life-expectancy of treated ESRD patients, improving access to treatment in developing countries and the trend in the United States towards single-use rather than multiple-use dialyzers. According to the European Renal Association—European Dialysis and Transplant Association, the number of worldwide ESRD patients has historically grown by approximately 6% per year. We estimate that continued patient population growth combined with conversion to single-use dialyzers and increasing treatment frequency will result in overall annual dialyzer market growth in excess of 6%.
In 2006, we ceased production of cellulosic membranes and focused on growing our new PUREMA® synthetic membrane. We believe that PUREMA® is superior in performance compared to all other synthetic membranes on the market. Dialyzers containing PUREMA® have been classified in the highest level (category 5) of Japan's dialyzer reimbursement rate system, reflecting the efficacy of our PUREMA® membrane. We believe an example of the increasing customer acceptance of PUREMA® is our entry into several long-term supply agreements with customers in the United States, Japan and Europe. We are currently marketing PUREMA®'s performance advantages, such as by co-branding our customers' dialyzers with the PUREMA® logo.
We believe, based on independent industry research, that we are uniquely positioned as the leading independent supplier (i.e., not a supplier of dialyzers) of synthetic hemodialysis membranes. Major dialyzer manufacturers include Asahi Kasei Kuraray Medical Co., Ltd., Bellco S.r.l., Fresenius Medical Care AG, Gambro AG and Nipro Corp.
We develop, manufacture and market polypropylene and polymethylpentene membranes for the blood oxygenation market. As a component of heart-lung machines, blood oxygenators temporarily replace the functions of the lungs during on-pump open-heart surgery. The oxygenator contains highly specialized membranes which remove carbon dioxide from the blood while oxygen is diffused into the blood. We estimate that growth in the blood oxygenation market is modest as a result of the use of less-invasive alternative heart treatments. However, we believe that the market could grow as the
10
number of patients receiving on-pump open heart surgery increases due to the saturation of alternative heart treatments. Because blood oxygenators are designed to utilize a specific membrane technology and require regulatory approval, an oxygenator manufacturer's relationship with its membrane supplier is vital and switching costs can be substantial. We believe, based on independent industry research, that we are the world's leading supplier of membranes for blood oxygenation. Major blood oxygenator producers include Maquet Cardiopulmonary AG, Medtronic, Inc., Sorin Group S.r.l. and Terumo Medical Corp.
We develop, manufacture and market polypropylene and polyethersulfone membranes for the plasmapheresis market. In plasmapheresis, plasma is separated from the blood and either retained for the production of therapeutic proteins or filtered and returned to the blood as a treatment for various autoimmune disorders. We believe that the plasmapheresis market is growing and that new treatment methodologies based on blood filtration may lead to additional growth. We believe we are a leading supplier of extracorporeal therapeutic plasmapheresis membranes. Major manufacturers of plasmapheresis equipment include Asahi Kasei Kuraray Medical Co., Ltd., Fresenius Medical Care AG, Gambro AG and Sorin Group Italia S.r.l.
Industrial and specialty filtration applications.
We produce a wide range of membranes and membrane-based elements for micro- and ultrafiltration and gasification/degasification of liquids, covering a broad range of applications in the filtration market. According to Frost & Sullivan, the U.S. micro- and ultrafiltration membrane element market is approximately $1.3 billion and growing in excess of 8% annually. Market growth is being driven by several factors, including end-market growth in applications such as water treatment and pharmaceutical processing, displacement of conventional filtration media by membrane filtration due to membranes' superior cost and performance attributes and increasing purity requirements in industrial and other applications. We currently serve a variety of filtration end-markets, including water treatment, food and beverage processing and pharmaceutical, semiconductor and flat panel display manufacturing, and we are working closely with current and potential customers to develop innovative new products based on our technology and capabilities.
The following are descriptions of certain of our industrial and specialty filtration products:
- •
- MicroPES® and DuraPES® are patented sulphonated polyethersulfone flat sheet microfiltration membranes with very high flow rates, broad chemical resistance and low protein binding, properties which are attractive to end-users who desire minimal absorption of their product. These membranes are primarily used in specialty filtration applications such as ultrapure water, cold sterile filtration of beverages, ultrapure chemicals for the electronics industry and pharmaceutical processing.
- •
- Accurel® is a polypropylene membrane, available in flat sheet, hollow fiber, and tubular configurations, which can be used in a wide range of pH conditions. This membrane is an economical choice for many applications compared to certain higher priced products, and is primarily used for specialty filtration applications including ultrapure chemicals for the electronics industry, vent and process air, industrial wastewater treatment, and pharmaceutical processing.
- •
- Liqui-Flux® membrane modules, based on our hollow fiber, polypropylene microfiltration and patented polyethersulfone ultrafiltration membranes, are used for potable water filtration, beverage processing, and prefiltration for reverse osmosis systems.
- •
- Liqui-Cel® membrane contactors incorporate hydrophobic hollow fiber membranes into patented module designs and are used in a wide variety of industries including beverage
11
- •
- SuperPhobic® membrane contactors are a special type of membrane contactor which can treat liquids that otherwise penetrate the membrane pores of conventional Liqui-Cel® membrane contactors. Typical applications involve the elimination of microbubbles in liquids which, upon occurrence, negatively impact customer production processes, quality and yield. Some applications include the degassing of inks and paper coating solutions and photoemulsion.
- •
- MicroModule® and MiniModule® membrane contactors are very small in-line degassing devices used to eliminate microbubbles in water, inks and other liquids. Typical applications include degassing water and other solutions used in laboratory, biotechnology and analytical testing equipment. Additionally, they are used for point of use ink degassing for ink jet printers.
processing, pharmaceutical, semiconductor and flat panel display manufacturing and power generation.
We believe, based on internal company estimates, that we are the world leader in membrane gasification/degasification for liquids, and, based on internal company estimates and independent industry research, that we are uniquely positioned as the leading independent supplier of polyethersulfone flat sheet membranes.
New product development
We have focused our research and development efforts on developing products for new markets based on existing technologies and developing new process technologies to enhance existing businesses and allow entry into new businesses. We spent $18.2 million (3% of our net sales), $16.0 million (3% of our net sales) and $13.1 million (3% of our net sales) in fiscal 2008, fiscal 2007 and fiscal 2006, respectively, on research and development.
Our energy storage research and development is performed at technical centers at our facilities in Owensboro, Kentucky; Prachinburi, Thailand; Selestat, France; and Charlotte, North Carolina. Our separations media research and development is performed at technical centers at our facilities in Wuppertal, Germany and Charlotte, North Carolina. All of the products that we develop are subject to multiple levels of extensive and rigorous testing. The qualification of membrane separators for use in transportation and industrial applications, for instance, may require one or more years of testing by our staff and battery manufacturers.
Sales and marketing
We sell our products and services to customers in both the domestic and international marketplace. We sell primarily to manufacturers and converters that incorporate our products into their finished goods.
We employ a direct worldwide sales force and utilize approximately 76 experienced people who manage major customer relationships. Many of our sales representatives are engineers or similarly trained technical personnel who have advanced knowledge of our products and the applications for which they are used. Our sales representatives are active in new product development efforts and are strategically located in the major geographic regions in which our products are sold. In certain geographic areas, we use distributors or other agents.
We typically seek to enter into supply contracts with our major customers. These contracts typically describe the volume and selling price and can last up to ten years. In addition, these contracts reflect our close collaborative relationships with our customers, which are driven by our customers' need to develop new separators and membranes directly with us.
In fiscal 2008, net sales to our top five customers represented approximately 36% of our total net sales. Exide Technologies represented approximately 14% of our net sales in fiscal 2008.
12
Manufacturing and operations
General
We have manufacturing facilities in the major geographic markets of North America, Europe and Asia. We manufacture our lead-acid battery membrane separators at our facilities in Owensboro, Kentucky; Corydon, Indiana; Piney Flats, Tennessee; Selestat, France; Norderstedt, Germany; Feistritz, Austria; Prachinburi, Thailand; and Tianjin, China. We also have a finishing operation at our facility in Bangalore, India. We manufacture our lithium battery membrane separators at our facility in Charlotte, North Carolina, and have a finishing operation at our facility in Shanghai, China. In May 2008, we acquired a facility in South Korea that is scheduled to begin production of lithium battery separators in fiscal 2009 after we complete improvements to their manufacturing processes and products. We manufacture our healthcare membranes and industrial and specialty filtration membranes and membrane modules at facilities in Wuppertal and Obernberg, Germany and Charlotte, North Carolina.
In fiscal 2008, fiscal 2007 and fiscal 2006, we generated sales from customers outside the United States of approximately 77%, 83%, and 81%, respectively. We typically sell our products in the currency of the country in which the products are manufactured rather than the local currency of our customers.
Our manufacturing facilities in North America accounted for 38% of total sales for fiscal 2008, with facilities in Europe accounting for 48% and facilities in Asia accounting for 14%. Our foreign operations are subject to certain risks that could materially affect our sales, profits, cash flows and financial position. These risks include fluctuations in foreign currency exchange rates, inflation, economic or political instability, shipping delays, changes in applicable laws and regulatory policies and various trade restrictions, all of which could have a significant impact on our ability to deliver products on a competitive and timely basis. The future imposition of, or significant increases in the level of, customs duties, import quotas or other trade restrictions could also have a material adverse effect on our business, financial condition and results of operations.
Manufacturing processes
All of our membrane manufacturing processes involve an extrusion process. To produce our flat sheet and hollow fiber membranes, we use one of three basic membrane processes that begin with an extrusion step. These include phase separation (thermally-induced, solvent-induced, or reaction-induced), "dry stretch", and extrusion/extraction processes. Each process, and its resulting product properties, is well suited to the various membrane requirements for our target markets. To produce Liqui-Cel® membrane contactors and Liqui-Flux® membrane modules, hollow fibers are bonded together into a cartridge form by extruding either a polyolefin resin or using an epoxy or polyurethane adhesive before final assembly into a finished module.
Membrane separators for batteries. We manufacture Daramic®, our principal lead-acid battery separator used in industrial and automotive applications, using a composite extrusion/extraction process. The process stages are fully automated, although the process requires some handling as material is transferred from stage to stage. Initially, an ultra-high molecular weight polyethylene is mixed with porous silica and oil, which are heated and extruded into a film. The film is passed through an extraction bath to remove the excess oil from the silica pores to create the proper microporosity and film stiffness prior to drying. We manufacture our DARAK® industrial separator using a patented manufacturing process that begins by saturating a polyester fleece with a modified phenolic resin, which is then cross-linked, washed, dried, cured and cut into single pieces in a continuous one-step process. The reaction step produces the final microporous structure.
We manufacture our lithium battery separators using two processes, both of which begin with an extrusion step. Membrane porosity is created either during a thermal stretching process or during a chemical extrusion process. Some special coated and non-woven laminate products are also manufactured for specialty battery and other applications.
13
Hemodialysis, blood oxygenation, plasmapheresis and filtration membranes. Membranes for hemodialysis, blood oxygenation, plasmapheresis, and filtration are produced using phase separation processes. For these phase separation processes, the polymer spinning solution is prepared by dissolving the polymer in a solvent prior to extrusion. A porous membrane is formed by separating the solvent and polymer phases using temperature (thermally-induced), or a "non-solvent" (solvent-induced), and then the solvent phase is extracted and the porous polymer membrane is dried. For the blood oxygenation market and certain filtration markets, hollow fiber and flat sheet membranes are also produced using our "dry stretch" process. We rely on the molecular behavior of semi-crystalline polymers (polyolefins) to create the microporous structure. By controlling the extrusion process under which the film or fiber is formed, we create a crystalline structure that allows the formation of microvoids in a subsequent stretching step. Although we use different equipment for the flat sheet and fiber products, the operating conditions of temperature, stress, and line speed are similar for both. After extrusion, our products can be stored or immediately processed on annealing and stretching lines that create the final porous form.
Competition
Our markets are highly competitive. Within our energy storage segment, our primary competitors in the market for membrane separators used in lead-acid batteries for transportation and industrial applications are Entek International LLC ("Entek") in North America and Europe and Nippon Sheet Glass Co., Ltd. in Japan. In addition, we have a number of smaller competitors in South Korea, Indonesia, China, Taiwan and North America. We also compete with Asahi Kasei Chemicals Corporation, Tonen Chemical Corporation (a subsidiary of ExxonMobil) and Ube Industries Limited as well as a number of smaller competitors in the market for membrane separators used in lithium batteries.
Within our separations media segment, we compete primarily with Asahi Kasei Kuraray Medical Co., Ltd., Fresenius Medical Care, Gambro AG and Toyobo Co. Ltd. for membranes used in dialysis. In addition, we compete primarily with Terumo Medical Corp. in the blood oxygenation market and Asahi Kasei Kuraray Medical Co., Ltd. and Fresenius Medical Care in the plasmapheresis market. Also within our separations media segment, our industrial and specialty filtration business competes across multiple markets and applications; principal competitors include Dainippon Ink and Chemicals, Inc., Koch Membrane Systems (a division of Koch Industries), Norit B.V., Millipore Corporation and Pall Corporation. Product innovation and performance, quality, service, utility and cost are the primary competitive factors, with technical support being highly valued by our customers. We believe that we are well positioned in our end-markets for the reasons set forth under "—Competitive strengths" above.
Raw materials
We employ a global purchasing strategy to achieve pricing leverage on our purchases of major raw materials. The major polyethylene and polypropylene resins we use are specialized petroleum-based products that are less affected by commodity pricing cycles than other petroleum-based products. In the event of future price increases for these major raw materials, we believe that we will generally be able to pass these increases on to our customers. The primary raw materials we use to manufacture most of our products are polyethylene and polypropylene resins, silica, paper, and oil. Our major supplier of polyethylene resins is Ticona LLC and our major suppliers of polypropylene resins are Total Petrochemicals USA, Inc., Performance Polymers, Inc. and Bamberger Polymers, Inc. Our major suppliers of silica are PPG Industries, Inc. and Evonik Degussa GmbH, while our major suppliers of oil are Calumet Lubricants, Shell Chemical LP and Shell Company of Thailand (subsidiaries of Royal Dutch/Shell).
14
We believe that the loss of any one or more of our suppliers would not have a long-term material adverse effect on us because other manufacturers with whom we conduct business or have conducted business in the past would be able to fulfill our requirements. However, the loss of one of our key suppliers could, in the short term, adversely affect our business until we secure alternative supply arrangements. In addition, we cannot assure you that any new supply arrangements we enter into will have terms as favorable as those contained in current supply arrangements. We have never experienced any significant disruptions in supply as a result of shortages in raw materials.
Employees
At January 3, 2009, we had approximately 1,900 employees worldwide. Employees at six of our 14 facilities are unionized and account for approximately 40% of our total employees. The following summarizes those employees represented by unions as of January 3, 2009:
Location | Number of unionized employees | % of total | Date of contract renegotiation | ||||||
|---|---|---|---|---|---|---|---|---|---|
Corydon, Indiana | 85 | 78 | January 2010 | ||||||
Obernberg, Germany | 19 | 76 | Annual | ||||||
Owensboro, Kentucky | 131 | 74 | April 2012 | ||||||
Selestat, France | 138 | 77 | June 2010 | ||||||
Wuppertal, Germany | 346 | 87 | Annual | ||||||
Norderstedt, Germany | 47 | 84 | Annual | ||||||
Total | 766 | ||||||||
Environmental matters
We are subject to a broad range of federal, state, local and foreign environmental laws and regulations which govern, among other things, air emissions, wastewater discharges and the handling, storage disposal and release of wastes and hazardous substances. It is our policy to comply with applicable environmental requirements at all of our facilities. We are also subject to laws, such as the Comprehensive Environmental Response, Compensation and Liability Act ("CERCLA"), that may impose liability retroactively and without fault for releases or threatened releases of hazardous substances at on-site or off-site locations. From time to time, we have identified environmental compliance issues at our facilities. For more information, see "Item 3. Legal Proceedings" below.
We have conducted some cleanup of on-site releases at some facilities and we will be conducting additional cleanups of on-site contamination at other facilities under regulatory supervision or voluntarily. Costs for such work and related measures (such as eliminating sources of contamination) could be substantial, particularly at our Wuppertal, Germany and Potenza, Italy facilities. The Italian facility was closed in 2008 in connection with a restructuring. We have established reserves for environmental liabilities of $49.2 million as of January 3, 2009. However, we do not anticipate that the remediation activities will disrupt operations at our facilities or have a material adverse effect on our business, financial condition or results of operations. In addition, we have asserted claims under an indemnity from Akzo Nobel N.V., the prior owners of Membrana. The indemnity is expected to provide indemnification of a substantial percentage of anticipated environmental costs at Wuppertal. The amount receivable under the indemnification agreement at January 3, 2009 was $17.9 million. To date we have not had any significant disagreement with Akzo Nobel N.V. over its environmental indemnity obligations to us.
15
Intellectual property rights
We consider our patents and trademarks, in the aggregate, to be important to our business and seek to protect this proprietary know-how in part through United States and foreign patent and trademark registrations. However, no individual patent is material to our business, and the expiration or invalidation of any one patent would not have a material impact on our business. We own approximately 127 patents and patent applications relating to our membrane and module technologies. The term of each of our U.S. patents depends on when the patent application was filed. A patent will expire either 20 years from the date the application was filed, or 17 years from the date of issuance.
In general, trademarks are valid as long as they are in use and/or their registrations are properly maintained, and trademark registrations can generally be renewed indefinitely so long as the marks are in use. Some of our registered marks include CELGARD®, Liqui-Cel®, Daramic® and PUREMA®.
In addition, we maintain certain trade secrets for which, in order to maintain the confidentiality of such trade secrets, we have not sought patent protection. Our company policies require our employees to assign their intellectual property rights to us and to treat all technology as our confidential information.
We have granted security interests or liens on some of our patents to financial institutions, including to lenders under our senior secured credit facilities.
If we fail to adequately protect our intellectual property rights, competitors may manufacture and market products similar to ours. The loss of protection for our intellectual property could reduce the market value of our products, reduce product sales, and lower our profits or impair our financial condition. See "Item 1A. Risk factors—Risks relating to our business—if we are unable to adequately protect our intellectual property, we could lose a significant competitive advantage."
Our business faces many risks. As such, prospective investors and shareholders should carefully consider and evaluate all of the risk factors described below. These risk factors may change from time to time and may be amended, supplemented, or superseded by updates to the risk factors contained in periodic reports on Form 10-Q and Form 10-K that we file with the SEC in the future. These risks include the following:
Because the specialized markets in which we sell our products are highly competitive, we may have difficulty growing our business year after year.
The markets in which we sell our products are highly competitive. Many of these markets require highly specialized products that are time and cost intensive to design and develop. In addition, innovative products, quality, service, utility, cost and technical support are the primary competitive factors in the separation and filtration membrane industry. Some of our competitors are much larger companies that have greater financial, technological, manufacturing and marketing resources than we do. Many of these competitors are also better established as suppliers to the markets that we serve. As a result, a reduction in overall demand or increased costs to design and produce our products within these markets would likely further increase competition between us and other producers of membranes. This increased competition could cause us to reduce our prices, which could lower our profit margins and impair our ability to grow our business year after year.
We must continue to invest significant resources in developing innovative products in order to maintain a competitive edge in the highly specialized markets in which we operate.
Our continued success depends, in part, upon our ability to maintain our technological capabilities and to continue to identify, develop and commercialize innovative products for the separation and filtration membrane industry. For example, products for some consumer electronics applications have a
16
short lifecycle and require constant development. If we fail to continue to develop products for those markets or keep pace with technological developments by our competitors generally, we may lose market share which could result in reduced sales and impair our financial condition.
The loss of large volume customers could impact our sales and our profits.
Our products are often sold to a relatively small number of large volume customers. For example, one of our customers, Exide Technologies, represented approximately 14% of our net sales in fiscal 2008. As a result, a decrease in business from, or the loss of, large volume customers such as Exide could impact our sales and our profits.
Vertical integration by our customers of the production of our products into their own manufacturing processes could reduce our sales and our profits.
Our future sales and profits will depend to a significant extent upon whether our customers choose in the future to manufacture the separation and filtration membranes used in their products instead of purchasing these components from us. If any of our existing customers choose to vertically integrate the production of their products in such a manner, the loss of sales to these customers could reduce our sales and our profits.
Increases in prices for raw materials or the loss of key supplier contracts could reduce our profit margins.
The primary raw materials we use in the manufacture of most of our products are polyethylene and polypropylene resins, silica, paper and oil. In fiscal 2008, raw materials accounted for approximately 35% of our cost of sales. Although our major customer contracts generally allow us to pass increased costs on to our customers, we may not be able to pass on all raw material price increases to our customers in each case or without delay. The loss of any of our key suppliers could disrupt our business until we secure alternative supply arrangements. Furthermore, any new supply agreement we enter into may not have terms as favorable as those contained in our current supply arrangements.
Our substantial indebtedness could harm our ability to react to changes in our business or to market developments and prevent us from fulfilling our obligations under our indebtedness.
We have incurred a significant amount of indebtedness. As of January 3, 2009, our consolidated indebtedness, including our capital lease obligation, is $803.3 million. For fiscal 2008, our interest expense was $60.7 million.
Our substantial level of indebtedness, as well as any additional borrowings we may make under the unused portions of the senior secured credit facilities, increases the possibility that we may be unable to generate cash sufficient to pay, when due, the principal of, interest on or other amounts due in respect of our indebtedness. Our substantial debt could increase our vulnerability to general economic downturns and adverse competitive and industry conditions by limiting our flexibility to plan for, or to react to, changes in our business and in the industry in which we operate. This limitation could place us at a competitive disadvantage compared to competitors that have less debt and more cash to insulate their operations from market downturns and to finance new business opportunities.
Our variable rate indebtedness subjects us to interest rate risk, which could cause our debt service obligations to increase significantly.
At January 3, 2009, we had variable rate debt of $366.1 million. In January 2008, we entered into two interest rate swap agreements with notional principal amounts totaling $250.0 million. The swap agreement with a notional amount of $50.0 million effectively fixes the interest rate on that amount of debt at 5.58% and expires on June 30, 2009. The swap agreement with a notional amount of $200.0 million effectively fixes the interest rate on that amount of debt at 5.54% and expires on
17
December 31, 2009. An interest rate increase would result in an increase in interest expense. Our earnings may not be sufficient to allow us to meet any such increases in interest rate expense and to pay principal and interest on our debt and meet our other obligations. If we do not have sufficient earnings, we may be required to refinance all or part of our existing debt, sell assets, borrow more money or sell more securities, none of which we can guarantee we will be able to do.
To service our indebtedness, we will require a significant amount of cash. Our ability to generate cash depends on many factors beyond our control.
Our ability to make payments on and to refinance our indebtedness and to fund our operations will depend on our ability to generate cash in the future. However, our business may not generate sufficient cash flow from operations for a variety of reasons, including those mentioned elsewhere in this "Risk factors" section. Without sufficient cash flow, future borrowings may not be available to us under the senior secured credit facilities in amounts sufficient to enable us to service our indebtedness or to fund our other liquidity or capital needs. If we cannot generate sufficient cash to service our debt, we will have to take such actions as reducing or delaying capital investments, selling assets, restructuring or refinancing our debt or seeking additional equity capital. Any of these actions may not be effected on commercially reasonable terms, or at all. In addition, the indenture for the 83/4% senior subordinated notes and the credit agreement for the senior secured credit facilities may restrict us from adopting any of these alternatives.
The terms of the senior secured credit facilities and the indenture related to the 83/4% senior subordinated notes may restrict our current and future operations, particularly our ability to respond to market changes or to take certain actions.
The senior secured credit facilities and the indenture related to the 83/4% senior subordinated notes contain a number of restrictive covenants that impose significant operating and financial restrictions on us and may limit our ability to engage in acts that may be in our long-term best interests. For example, the senior secured credit facilities include covenants restricting, among other things, our ability to incur, assume or permit to exist additional indebtedness or guarantees; engage in mergers, acquisitions and other business combinations; or amend or otherwise alter terms of our indebtedness, including the 83/4% senior subordinated notes, and other material agreements. The senior secured credit facilities also include financial covenants requiring that we maintain a maximum senior leverage ratio at all times when loans or letters of credit are outstanding under the revolving credit facility.
The indenture related to the 83/4% senior subordinated notes also contains numerous negative covenants including, among other things, restrictions on our ability to: incur or guarantee additional debt; issue preferred stock of restricted subsidiaries; pay dividends or make other equity distributions; or purchase or redeem capital stock.
A breach of any of these covenants or the inability to comply with financial covenants could result in a default under the senior secured credit facilities or the 83/4% senior subordinated notes. If any such default occurs, the lenders and the holders of the 83/4% senior subordinated notes may elect to declare all outstanding borrowings, together with accrued interest and other amounts payable thereunder, to be immediately due and payable. The lenders also have the right in these circumstances to terminate any commitments they have to provide further borrowings and to proceed against all collateral granted to them to secure the debt. If collateral (such as available cash) is repossessed by the lenders or holders of the 83/4% senior subordinated notes, we will be unable to access the capital and other resources necessary to operate our business, and we could incur immediate and significant losses.
18
Some of our employees are represented under collective bargaining agreements. Any employee slowdowns, strikes or failure to renew our collective bargaining agreements could disrupt our business.
Approximately 40% of our employees are represented under collective bargaining agreements. A majority of those employees are located in France and Germany and are represented under industry-wide agreements that are subject to national and local government regulations. Many of these collective bargaining agreements must be renewed annually. Labor unions also represent our employees in Owensboro, Kentucky and Corydon, Indiana. The collective bargaining agreement covering the workers at the Corydon, Indiana facility expires in January 2010.
We may not be able to maintain constructive relationships with these labor unions. We may not be able to successfully negotiate new collective bargaining agreements on satisfactory terms in the future. The loss of a substantial number of these employees or a prolonged labor dispute could disrupt our business. Any such disruption could in turn reduce our sales, increase our costs to bring products to market and result in significant losses.
We generate most of our sales from manufacturing products that are used in a wide variety of industries and the potential for product liability exposure for our products could be significant.
We manufacture a wide variety of products that are used in healthcare and consumer applications. Several of these products are used in medical devices that some consumers require in order to sustain their lives. As a result, we may face exposure to product liability claims in the event that the failure of our products results, or is alleged to result, in bodily injury and/or death. In addition, if any of our products are, or are alleged to be, defective, we may be required to make warranty payments or to participate in a recall involving those products.
Consequently, end-users of our products may look to us for contribution when faced with product recalls, product liability or warranty claims. The future costs associated with defending product liability claims or providing product warranties could be material and we may experience material losses in the future as a result. A successful product liability claim brought against us in excess of available insurance coverage or a requirement to participate in any product recall could substantially reduce our available cash from operations. Reduced cash could in turn reduce our profits or impair our financial condition.
Our operations outside the United States pose risks to our business that are not present with our domestic business.
Our manufacturing facilities in North America accounted for 38% of total net sales for fiscal 2008, with facilities in Europe accounting for 48% and facilities in Asia accounting for 14%. Typically, we sell our products in the currency of the country where the manufacturing facility that produced the products is located. In addition, as part of our growth and acquisition strategy, we may expand our operations in these or other foreign countries. Our foreign operations are, and any future foreign operations will be, subject to certain risks that are unique to doing business in foreign countries. These risks include fluctuations in foreign currency exchange rates, inflation, economic or political instability, shipping delays, changes in applicable laws and regulatory policies and various trade restrictions. All of these risks could have a negative impact on our ability to deliver products to customers on a competitive and timely basis. This could reduce or impair our sales, profits, cash flows and financial position. The future imposition of, or significant increases in the level of, customs duties, import quotas or other trade restrictions could also increase our costs and reduce our profits.
We could incur substantial costs to comply with environmental laws and violations of such laws may increase our costs or require us to change certain business practices.
We use and generate a variety of chemicals and other hazardous by-products in our manufacturing operations. As a result, we are subject to a broad range of federal, state, local and foreign environmental laws and regulations. These environmental laws govern, among other things, air
19
emissions, wastewater discharges and the handling, storage and release of wastes and hazardous substances. Such laws and regulations can be complex and change often. We regularly incur costs to comply with environmental requirements, and such costs could increase significantly with changes in legal requirements or their interpretation or enforcement. Some of our manufacturing facilities have been the subject of actions to enforce environmental requirements. We could incur substantial costs, including clean-up costs, fines and sanctions and third-party property damage or personal injury claims, as a result of violations of environmental laws. Failure to comply with environmental requirements could also result in enforcement actions that materially limit or otherwise affect the operations of the facilities involved.
Under certain environmental laws, a current or previous owner or operator of an environmentally contaminated site may be held liable for the entire cost of investigation, removal or remediation of hazardous materials at such property. This liability could result whether or not the owner or operator knew of, or was responsible for, the presence of any hazardous materials.
Contaminants have been detected at some of our present facilities, principally in connection with historical operations. Investigations and/or clean-ups of these contaminants have been undertaken by us or by former owners of the sites. The costs of investigating and remediating environmental conditions at some of our facilities may be substantial. Although we believe we are entitled to contractual indemnification for a portion of these costs, if we do not receive expected indemnification payments, or if our remediation costs are higher than expected, our exposure to these costs would increase. This exposure could reduce our cash available for operations, consume valuable management time, and reduce our profits or impair our financial condition.
We anticipate additional investigations and clean-ups of on-site contamination under regulatory supervision or voluntarily at some of our sites. In addition, the imposition of more stringent clean-up requirements, the discovery of additional contaminants or the discovery of off-site contamination at or from one or more of our facilities could result in significant additional costs to us.
If we are unable to adequately protect our intellectual property, we could lose a significant competitive advantage.
Our success with our products depends, in part, on our ability to protect our unique technologies and products against competitive pressure and to defend our intellectual property rights. If we fail to adequately protect our intellectual property rights, competitors may manufacture and market products similar to ours.
Even though we have filed patent applications, we may not be granted patents for those applications. Moreover, even if we are granted a patent, that does not prove conclusively that the patent is valid and enforceable. Our existing or future patents that we receive or license may not provide competitive advantages for our products. Our competitors may invalidate, narrow or avoid the scope of any existing or future patents, trademarks, or other intellectual property rights that we receive or license. In addition, patent rights may not prevent our competitors from developing, using or selling products that are similar or functionally equivalent to our products. Patent rights are territorial; thus, the patent protection we do have will only extend to those countries in which we have issued patents. Even so, the laws of certain countries do not protect our intellectual property rights to the same extent as do the laws of the United States and various European countries. The loss of protection for our intellectual property could reduce the market value of our products, reduce product sales, and lower our profits or impair our financial condition.
We intend to enforce our intellectual property rights vigorously, and from time to time we may initiate claims against third parties that we believe are infringing our intellectual property rights if we are unable to resolve matters satisfactorily through negotiation or we may be required to participate in other administrative proceedings. Lawsuits brought to protect and enforce our intellectual property rights could be expensive, time-consuming and distracting to management and could result in the
20
impairment or loss of portions of our intellectual property. Our failure to secure, protect and enforce our intellectual property rights could seriously harm our business.
Security interests or liens have been granted to financial institutions on some of our patents. If we fail to satisfy our obligations, the financial institutions have rights to those patents.
Due to the unique products that we produce and the particular industry in which we operate, the loss of our senior management could disrupt our business.
Our senior management is important to the success of our business. There is significant competition for executive personnel with unique experience in the separation and filtration membrane industry. As a result of this unique need and the competition for a limited pool of industry-based executive experience, we may not be able to retain our existing senior management. In addition, we may not be able to fill new positions or vacancies created by expansion or turnover or attract additional senior management personnel. All of our executive officers are free to pursue other business opportunities (other than our chief executive officer, who is bound by a non-compete provision of his employment agreement), including those that may compete with us. The loss of any member of our senior management without retaining a suitable replacement (either from inside or outside our existing management team) could disrupt our business.
We may pursue future acquisitions. If we incur contingent liabilities and expenses or additional debt in connection with future acquisitions or if we cannot effectively integrate newly acquired operations, our business could be disrupted.
In 2008, we completed three acquisitions and we may enter into acquisitions in the future. Acquisitions involve risks that the businesses acquired will not perform in accordance with expectations and that business judgments concerning the value, strengths and weaknesses of businesses acquired will prove incorrect. Future acquisitions would likely result in the incurrence of debt and contingent liabilities. Such acquisitions could also increase our interest and amortization expenses as well as periodic impairment charges related to goodwill and other intangible assets. Acquisitions could also result in significant charges relating to integration costs. We may not be able to integrate successfully any business we acquire into our existing business. Any acquired businesses may not be profitable or as profitable as we had expected. The successful integration of new businesses depends on our ability to manage these new businesses and cut excess costs. The successful integration of future acquisitions may also require substantial attention from our senior management and the management of the acquired business. This could decrease the time that they have to service and attract customers and develop new products and services. In addition, because we may actively pursue a number of opportunities simultaneously, we may encounter unforeseen expenses, complications and delays. Such expenses and delays could include difficulties in employing sufficient staff and maintaining operational and management oversight. Our inability to complete the integration of new businesses in a timely and orderly manner could increase costs, reduce our profits and ultimately disrupt our business.
Our restructuring activities could have an adverse impact on our financial condition.
In response to the loss of a customer, in 2008 we implemented a restructuring plan in our energy storage segment to align lead-acid battery separator production capacity with demand, reduce costs and position ourselves to meet future growth opportunities. The initial plan includes closing our facility in Potenza, Italy, streamlining production at our facility in Owensboro, Kentucky and reducing selling, general and administrative resources associated with the lead-acid separator business. The total estimated cost of the plan is expected to be approximately $61.7 million, including cash charges of $32.8 million for severance, environmental, and other exit costs and a non-cash impairment charge of $28.9 million. We began implementing the restructuring plan during the fourth quarter and recorded a restructuring charge of $59.9 million.
21
In December 2006, our separations media segment exited the production of cellulosic membranes and realigned the cost structure at its Wuppertal, Germany facility. The total cost of the plan is expected to be approximately $33.8 million, consisting of a $17.5 million non-cash impairment charge for buildings and equipment, $10.5 million for employee layoffs and $5.8 million for other costs related to the shutdown of portions of the Wuppertal facility. The other costs included in the restructuring plan are related to local regulations surrounding complete or partial shutdowns of a facility.
The timing, scope and costs of any restructuring plans are subject to change. As a result, our restructuring activities could disrupt our business and have an adverse impact on our financial condition.
We have recorded a significant amount of intangible assets, which may never generate the returns we expect.
Our net identifiable intangible assets at January 3, 2009 were approximately 12% of our total assets. Such assets include trademarks and trade names, license agreements and technology acquired in acquisitions. Goodwill, which relates to the excess of cost over the fair value of the net assets of the businesses acquired, was approximately 40% of our total assets at January 3, 2009. Goodwill and identifiable intangible assets are recorded at fair value on the date of acquisition and, under FASB Statement No. 142,Goodwill and Other Intangible Assets, are reviewed at least annually for impairment. Impairment may result from, among other things, deterioration in the performance of the acquired business, adverse market conditions, and adverse changes in applicable laws or regulations. We may never realize the full value of our intangible assets. Any future determination requiring the write-off of a significant portion of intangible assets would reduce our profits for the fiscal period in which the write-off occurs.
Legal proceedings could have an adverse impact on our financial condition.
From time to time, we are party to legal proceedings including matters involving personnel and employment issues, personal injury, intellectual property, acquisitions and other proceedings arising in the ordinary course of business.
On September 9, 2008, the United States Federal Trade Commission ("FTC") issued an administrative complaint against us alleging that our actions and the acquisition of Microporous Holding Corporation, the parent company of Microporous Products L.P. ("Microporous") have substantially lessened competition in North American markets for lead-acid battery separators. We filed an answer to the complaint on October 15, 2008 denying the material allegations of the complaint. Proceedings will be held before an Administrative Law Judge of the FTC with an initial hearing currently scheduled to begin on May 12, 2009. The timing of a final resolution of this matter is uncertain.
It is not possible to predict with certainty whether we will be successful in this legal proceeding and the impact of its resolution. If the FTC and the courts were to reach a conclusion adverse to us, the FTC could seek remedies including divestiture of some or all of the assets acquired in the Microporous acquisition.
Our operations are vulnerable to interruption or loss due to natural disasters, epidemics, terrorist acts and other events beyond our control, which could adversely affect our business.
Our operations may be subject to significant interruption if any of our facilities is damaged or destroyed. For example, certain of our products are manufactured at a single facility location for which we do not maintain a backup manufacturing facility. A natural or other disaster, such as a fire or flood, could significantly disrupt our operations, delay or prevent product manufacture and shipment for the time required to repair, rebuild or replace our manufacturing facilities, which could be lengthy, and result in large expenses to repair or replace the facilities. In addition, concerns about terrorism or an outbreak of epidemic diseases such as avian influenza or severe acute respiratory syndrome, especially in our major markets of North America, Europe and Asia could have a negative effect on travel and our business operations, and result in adverse consequences on our sales and financial performance.
22
The economic uncertainty and current crisis in global credit and financial markets could materially and adversely affect our business and results of operations.
As has been widely reported, global credit and financial markets have been experiencing extreme disruptions in recent months, including severely diminished liquidity and credit availability, declines in consumer confidence, declines in economic growth, increases in unemployment rates, and uncertainty about economic stability. There can be no assurance that there will not be further deterioration in credit and financial markets and confidence in economic conditions. These economic uncertainties affect our business in a number of ways, making it difficult to accurately forecast and plan our future business activities. The current tightening of credit in financial markets and the general economic downturn has led consumers and businesses to postpone spending, which has caused our customers to delay orders with us. In addition, financial difficulties experienced by our suppliers or distributors could result in product delays, increased accounts receivable defaults and challenges associated with inventory management. We are unable to predict the likely duration and severity of the current disruptions in the credit and financial markets and adverse global economic conditions, and if the current uncertain economic conditions continue or further deteriorate, our business and results of operations could be materially and adversely affected.
Item 1B. Unresolved Staff Comments
None.
Our corporate headquarters are located in leased office space in Charlotte, North Carolina. Our manufacturing facilities are strategically located to serve our customers globally:
Location(1) | Floor area (sq. ft.) | Business segment | Certification | ||||
|---|---|---|---|---|---|---|---|
| Owensboro, Kentucky(2) | 277,000 | Energy Storage | ISO 14001, ISO 9001 | ||||
| Corydon, Indiana(2) | 161,000 | Energy Storage | ISO 14001, ISO 9001 | ||||
| Piney Flats, Tennessee(2) | 121,000 | Energy Storage | ISO 9001 | ||||
| Selestat, France | 113,000 | Energy Storage | ISO 14001, ISO 9001 | ||||
| Norderstedt, Germany | 124,000 | Energy Storage | ISO 14001, ISO 9001 | ||||
| Potenza, Italy(4) | 143,000 | Energy Storage | ISO 14001, ISO 9001 | ||||
| Feistritz, Austria | 52,000 | Energy Storage | — | ||||
| Prachinburi, Thailand | 166,000 | Energy Storage | ISO 14001, ISO 9001 | ||||
| Tianjin, China(5) | 47,000 | Energy Storage | ISO 9001 | ||||
| Shanghai, China(3) | 40,000 | Energy Storage | ISO 14001, ISO 9001 | ||||
| Bangalore, India(3) | 10,000 | Energy Storage | ISO 14001, ISO 9001 | ||||
| Ochang, South Korea | 105,000 | Energy Storage | — | ||||
| Charlotte, North Carolina(2) | 249,000 | Energy Storage and Separations Media | ISO 14001, ISO 9001 | ||||
| Wuppertal, Germany | 1,503,000 | Separations Media | ISO 14001, ISO 9001 | ||||
| Obernberg, Germany(3) | 23,000 | Separations Media | ISO 9001 | ||||
- (1)
- Excludes leased sales offices in Shenzhen, China; Tokyo, Japan; Seoul, Korea; and Sao Paulo, Brazil.
- (2)
- These domestic facilities serve as collateral under the senior secured credit facilities.
- (3)
- Polypore owns the equipment and leases the facility.
- (4)
- Manufacturing facility was closed in December 2008.
- (5)
- We own a 60% share of this facility.
On March 20, 2008 we received a letter from the Federal Trade Commission (the "FTC") requesting that the Company voluntarily provide certain documents and information to the FTC
23
regarding our acquisition of Microporous, which was completed on February 29, 2008. The letter stated that the FTC was conducting an investigation to determine whether the Microporous acquisition will substantially lessen competition in any relevant market and thereby violate federal antitrust laws. We voluntarily responded to the letter in writing and through supplemental telephone conversations and meetings.
On April 7, 2008, we and our wholly-owned subsidiary, Daramic LLC, each received from the FTC a subpoena and interrogatories requesting substantially similar documents and information as requested in the FTC's initial letter, as well as additional documents and information. We responded fully to this request and met on several occasions with various members of the FTC staff in an effort to answer their questions and resolve the investigation.
On September 9, 2008 the FTC issued an administrative complaint against us alleging that our actions and the acquisition of Microporous have substantially lessened competition in North American markets for lead-acid battery separators. We filed an answer to the complaint on October 15, 2008 denying the material allegations of the complaint. Proceedings will be held before an Administrative Law Judge of the FTC with an initial hearing currently scheduled to begin on May 12, 2009. The timing of a final resolution of this matter is uncertain.
We believe that the complaint is unfounded and that the Microporous acquisition is and will continue to be beneficial to our customers and the industry. Therefore, we intend to vigorously defend this action by the FTC. It is not possible, however, to predict with certainty whether we will be successful in the litigation or through a judicial appellate process. If the FTC and the courts were to reach a conclusion adverse to us, the FTC could seek remedies including divestiture of some or all of the assets acquired in the Microporous acquisition. We believe that a final judicial resolution to the challenge by the FTC to the Microporous acquisition could take several years.
We believe that the final resolution of this matter will not have a material adverse impact on our business, financial condition or results of operations.
Item 4. Submission of Matters to a Vote of Security Holders
None.
Item 5. Market for Registrant's Common Equity, Related Stockholder Matters and Issuer Purchases of Equity Securities
Our common stock is listed on the New York Stock Exchange ("NYSE") under the symbol "PPO" and has been traded on the NYSE since our initial public offering on June 28, 2007. Warburg Pincus, directly or indirectly, owns 47.8% of our common stock. As of February 6, 2009, there were approximately 4,750 holders of our common stock, representing primarily persons whose stock is held in nominee or "street name" accounts through brokers.
We did not declare or pay any dividends on our common stock in fiscal 2008, and we do not expect to pay any such dividends in 2009. The indenture relating to our 83/4% senior subordinated notes and our senior secured credit facility restrict or limit our ability to, among other things, declare dividends, make payments on or redeem or repurchase capital stock.
The low and high sales prices for the Company's common stock for each full quarterly period after our initial public offering on June 28, 2007 were as follows:
| | Fiscal 2008 | Fiscal 2007 | ||
|---|---|---|---|---|
First Quarter | $15.01–$22.33 | N/A | ||
Second Quarter | $19.90–$27.24 | N/A | ||
Third Quarter | $17.27–$29.26 | $12.15–$19.14 | ||
Fourth Quarter | $3.59–$23.67 | $13.67–$18.60 |
24
The following table summarizes information about the options under our equity compensation plans as of January 3, 2009.
Plan Category | Number of securities to be issued upon exercise of outstanding options (a) | Weighted- average exercise price of outstanding options (b) | Number of securities remaining available for future issuance under equity compensation plans (excluding securities reflected in column(a)) (c) | |||||||
|---|---|---|---|---|---|---|---|---|---|---|
Equity compensation plans approved by security holders | — | — | — | |||||||
Equity compensation plans not approved by security holders(1) | 2,136,979 | $ | 7.05 | 1,395,471 | ||||||
- (1)
- Includes options to purchase shares of our common stock under our 2004 Stock Option Plan, 2006 Stock Option Plan and 2007 Stock Incentive Plan, all of which were adopted prior to our initial public offering and were approved by our Board of Directors.
A description of the equity compensation plans described above appears under "Note 18—Stock-Based Compensation Plans" in the Notes to the Consolidated Financial Statements for the year ended January 3, 2009 included in Item 8 of this Report.
Performance Graph
The following graph compares the total shareholder return of our common stock for the periods indicated with the total return of the Russell 2000 Index and the Standard & Poor's Index of Industrial Machinery Companies ("S&P Industrial Machinery Index"). The graph assumes $100 invested on June 28, 2007 (the date of our initial public offering) in the Company, the Russell 2000 Index and the S&P Industrial Machinery Index. Total return represents stock price changes and assumes the reinvestment of dividends.
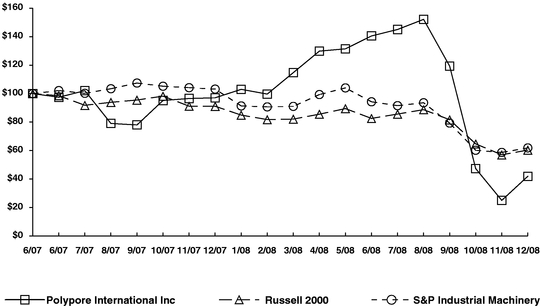
| | Jun-07 | Jun-07 | Jul-07 | Aug-07 | Sep-07 | Oct-07 | Nov-07 | Dec-07 | Jan-08 | Feb-08 | Mar-08 | Apr-08 | May-08 | Jun-08 | Jul-08 | Aug-08 | Sep-08 | Oct-08 | Nov-08 | Dec-08 | |||||||||||||||||||||||||||||||||||||||||
|---|---|---|---|---|---|---|---|---|---|---|---|---|---|---|---|---|---|---|---|---|---|---|---|---|---|---|---|---|---|---|---|---|---|---|---|---|---|---|---|---|---|---|---|---|---|---|---|---|---|---|---|---|---|---|---|---|---|---|---|---|---|
Polypore International Inc | 100.00 | 97.45 | 102.05 | 79.03 | 77.98 | 95.17 | 96.56 | 97.06 | 103.00 | 99.67 | 114.75 | 129.84 | 131.45 | 140.49 | 145.04 | 152.14 | 119.30 | 47.31 | 25.01 | 41.93 | |||||||||||||||||||||||||||||||||||||||||
Russell 2000 | 100.00 | 98.54 | 91.80 | 93.88 | 95.49 | 98.23 | 91.18 | 91.12 | 84.91 | 81.76 | 82.10 | 85.54 | 89.47 | 82.58 | 85.64 | 88.73 | 81.66 | 64.67 | 57.02 | 60.33 | |||||||||||||||||||||||||||||||||||||||||
S&P Industrial Machinery | 100.00 | 102.11 | 100.20 | 103.42 | 107.42 | 105.19 | 104.15 | 103.17 | 91.35 | 90.67 | 91.03 | 99.33 | 104.01 | 94.26 | 91.54 | 93.58 | 79.28 | 60.21 | 58.69 | 61.86 | |||||||||||||||||||||||||||||||||||||||||
25
Item 6. Selected Financial Data
The following table presents selected historical consolidated financial data of Polypore International for the years ended January 3, 2009, December 29, 2007, December 30, 2006 and December 31, 2005 (Successor), the period from May 2, 2004 through January 1, 2005 (Successor) and the period from January 4, 2004 through May 1, 2004 (Predecessor). The selected historical consolidated financial data has been derived from Polypore International's audited consolidated financial statements.
On May 13, 2004, Polypore International, Inc. acquired 100% of the outstanding common stock of PP Holding Corporation and its wholly-owned subsidiary, PP Acquisition Corporation. On May 13, 2004, Polypore, Inc. and its shareholders consummated a stock purchase agreement with PP Acquisition Corporation, our indirect, wholly-owned subsidiary, pursuant to which PP Acquisition Corporation purchased all of the outstanding shares of Polypore, Inc.'s capital stock. At the time of the closing of the acquisition, PP Acquisition merged with and into Polypore, Inc. with Polypore, Inc. as the surviving corporation.
26
The information presented below should be read together with "Item 7. Management's Discussion and Analysis of Financial Condition and Results of Operations" and the consolidated financial statements and the notes thereto included in "Item 8. Financial Statements and Supplementary Data."
| | Successor | Predecessor | ||||||||||||||||||
|---|---|---|---|---|---|---|---|---|---|---|---|---|---|---|---|---|---|---|---|---|
Statement of operations data (in millions, except share data): | Fiscal 2008 | Fiscal 2007 | Fiscal 2006 | Fiscal 2005 | Period from May 2, 2004 to January 1, 2005 | Period from January 4, 2004 to May 1, 2004 | ||||||||||||||
Net sales | $ | 610.5 | $ | 534.7 | $ | 478.2 | $ | 431.1 | $ | 311.1 | $ | 179.3 | ||||||||
Gross profit | 215.7 | 197.0 | 164.9 | 150.5 | 85.2 | 69.1 | ||||||||||||||
Selling, general and administrative expenses | 108.3 | 93.6 | 87.5 | 75.1 | 50.2 | 24.9 | ||||||||||||||
Business restructuring | 59.9 | (0.9 | ) | 37.0 | 8.7 | 13.9 | — | |||||||||||||
Change in accounting principle related to postemployment benefits | — | — | (2.6 | ) | — | — | — | |||||||||||||
In process research and development | — | — | — | — | 5.3 | — | ||||||||||||||
Other | — | — | — | — | — | (1.5 | ) | |||||||||||||
Operating income | 47.5 | 104.3 | 43.0 | 66.7 | 15.8 | 45.7 | ||||||||||||||
Interest expense, net | 60.7 | 81.0 | 92.3 | 82.0 | 42.1 | 6.0 | ||||||||||||||
Costs related to purchase of 10.50% senior discount notes | — | 30.1 | — | — | — | — | ||||||||||||||
Write-off of loan acquisition costs associated with refinancing of senior secured credit facilities | — | 7.2 | — | — | — | — | ||||||||||||||
Foreign currency and other | (2.5 | ) | 1.6 | 3.2 | (4.5 | ) | 1.7 | 0.5 | ||||||||||||
Unrealized gain on derivative instrument | — | — | — | — | — | (1.3 | ) | |||||||||||||
Income (loss) from continuing operations before income taxes | (10.7 | ) | (15.6 | ) | (52.5 | ) | (10.8 | ) | (28.0 | ) | 40.5 | |||||||||
Income taxes | 6.8 | (16.0 | ) | (22.9 | ) | (8.3 | ) | (8.7 | ) | 13.7 | ||||||||||
Income (loss) from continuing operations | (17.5 | ) | 0.4 | (29.6 | ) | (2.5 | ) | (19.3 | ) | 26.8 | ||||||||||
Income (loss) from discontinued operations, net of income taxes | 2.3 | 0.1 | (0.2 | ) | (0.4 | ) | — | — | ||||||||||||
Income (loss) before the cumulative effect of a change in accounting principle | (15.2 | ) | 0.5 | (29.8 | ) | (2.9 | ) | (19.3 | ) | 26.8 | ||||||||||
Cumulative effect of change in accounting principle, net of income taxes | — | — | 0.2 | — | — | — | ||||||||||||||
Net income (loss) | (15.2 | ) | 0.5 | (29.6 | ) | (2.9 | ) | (19.3 | ) | 26.8 | ||||||||||
Redeemable preferred stock dividends | — | — | — | — | — | (0.4 | ) | |||||||||||||
Net income (loss) applicable to common stock | $ | (15.2 | ) | $ | 0.5 | $ | (29.6 | ) | $ | (2.9 | ) | $ | (19.3 | ) | $ | 26.4 | ||||
Cash dividends declared per common share | $ | — | $ | — | $ | — | $ | — | $ | 1.87 | $ | — | ||||||||
Net income (loss) per common share— basic and diluted:(1)(2) | ||||||||||||||||||||
Continuing operations | $ | (0.41 | ) | $ | 0.02 | $ | (1.17 | ) | $ | (0.10 | ) | $ | (0.76 | ) | $ | 170.29 | ||||
Discontinued operations | 0.06 | — | (0.01 | ) | (0.02 | ) | — | — | ||||||||||||
Cumulative effect of change in accounting principle, net of income taxes | — | — | 0.01 | — | — | — | ||||||||||||||
Net income (loss) per share | $ | (0.36 | ) | $ | 0.02 | $ | (1.17 | ) | $ | (0.12 | ) | $ | (0.76 | ) | $ | 170.29 | ||||
Weighted average shares outstanding: | ||||||||||||||||||||
Basic(1)(2) | 42,777,531 | 32,942,214 | 25,313,130 | 25,271,252 | 25,250,613 | 155,086 | ||||||||||||||
Diluted(1)(2) | 42,777,531 | 33,237,230 | 25,313,130 | 25,271,252 | 25,250,613 | 155,086 | ||||||||||||||
- (1)
- For the predecessor periods, represents historical amounts of our predecessor and wholly-owned subsidiary, Polypore, Inc., without giving effect to the stock split in connection with our initial public offering.
- (2)
- For the successor periods, the weighted average shares outstanding have been adjusted to give effect for the stock split of 147.422-for-one on June 25, 2007.
27
Balance sheet data (at end of period) (in millions): | Fiscal 2008 | Fiscal 2007 | Fiscal 2006 | Fiscal 2005 | Fiscal 2004 | |||||||||||
|---|---|---|---|---|---|---|---|---|---|---|---|---|---|---|---|---|
Total assets | $ | 1,498.9 | $ | 1,429.0 | $ | 1,389.9 | $ | 1,364.6 | $ | 1,490.8 | ||||||
Total debt and capital lease obligations, including current portion | 803.3 | 822.8 | 1,048.9 | 1,002.8 | 1,065.3 | |||||||||||
Shareholders' equity | 392.9 | 335.3 | 69.7 | 93.3 | 105.9 | |||||||||||
| | Successor | Predecessor | ||||||||||||||||||
|---|---|---|---|---|---|---|---|---|---|---|---|---|---|---|---|---|---|---|---|---|
Other financial data (in millions): | Fiscal 2008 | Fiscal 2007 | Fiscal 2006 | Fiscal 2005 | Period from May 2, 2004 to January 1, 2005 | Period from January 4, 2004 to May 1, 2004 | ||||||||||||||
Depreciation and amortization | $ | 55.1 | $ | 48.9 | $ | 60.2 | $ | 54.1 | $ | 33.7 | $ | 15.2 | ||||||||
Capital expenditures | 48.0 | 29.8 | 24.0 | 13.0 | 9.9 | 5.5 | ||||||||||||||
Net cash provided by (used in): | ||||||||||||||||||||
Operating activities | 94.7 | 69.3 | 50.0 | 64.2 | 21.0 | 28.9 | ||||||||||||||
Investing activities | (129.8 | ) | (35.3 | ) | (23.9 | ) | (13.0 | ) | (877.2 | ) | (3.6 | ) | ||||||||
Financing activities | 65.7 | (40.4 | ) | (3.0 | ) | (52.8 | ) | 849.8 | (7.4 | ) | ||||||||||
Item 7. Management's Discussion and Analysis of Financial Condition and Results of Operations
The following discussion should be read in conjunction with our consolidated financial statements included elsewhere in this report. Some of the information contained in this discussion and analysis or included elsewhere in this report, including information with respect to our plans and strategy for our business, includes forward-looking statements that involve risks and uncertainties. Please see "Forward-looking statements" for more information. You should review the "Risk factors" for a discussion of important factors that could cause actual results to differ materially from the results described in or implied by the forward-looking statements.
Overview
We are a leading global high technology filtration company that develops, manufactures and markets specialized microporous membranes used in separation and filtration processes. In fiscal 2008, we generated total net sales of $610.5 million. We operate in two business segments: (i) the energy storage segment, which accounted for approximately 74% of our fiscal 2008 net sales; and (ii) the separations media segment, which accounted for approximately 26% of our fiscal 2008 net sales. We manufacture our products at facilities in North America, Europe and Asia. Net sales from foreign locations were $388.4 million for fiscal 2008.
Energy Storage Segment
In the energy storage segment, our membrane separators are a critical performance component in lithium batteries, which are primarily used in consumer electronic applications, and lead-acid batteries, which are used globally in transportation and industrial applications. Although the short-term economic outlook is uncertain, especially for the more economically sensitive consumer electronics portion of our business, we believe that the energy storage segment will continue to benefit from continued growth in demand by consumers for mobile power.
Lithium batteries are the power source in a wide variety of electronics applications ranging from notebook computers and mobile phones to cordless power tools. In addition, many new and developing applications such as electric and hybrid electric vehicles incorporate large-format batteries that will require much greater membrane separator volume per battery. As a result, we believe that membrane separator growth will exceed battery unit sales growth. In the third quarter of 2008, we completed a
28
lithium battery separator capacity expansion at our Charlotte, North Carolina facility and in the fourth quarter of 2008, began ramping up production.
In May 2008, we acquired Yurie-Wide Corporation, a South Korean company, which we subsequently renamed Celgard Korea, Inc. ("Celgard Korea"). The acquisition broadens our participation in the lithium battery separator market, adds to our membrane technology portfolio and product breadth and adds cost-effective production capacity. After the acquisition, we discontinued Celgard Korea sales and made significant operational changes to align Celgard Korea's operations with our global standards. Celgard Korea will not generate any revenues until their manufacturing processes and products meet our higher quality standards, which we expect to occur during 2009.
In the motor vehicle battery market, the high proportion of aftermarket sales and the steady growth of the worldwide fleet of motor vehicles provide us with a growing, recurring revenue base in lead-acid battery membrane separators. We believe we will also benefit from the worldwide conversion of alternative separator materials to the higher-performance polyethylene-based membrane separators such as those we produce. Growth is strongest in the Asia-Pacific region as a result of increasing per capita penetration of automobiles, growth in the industrial and manufacturing sectors, and a high rate of conversion to polyethylene-based membrane separators. We have positioned ourselves to benefit from this growth by expanding capacity at our Prachinburi, Thailand facility, acquiring a production facility in Tianjin, China and establishing an Asian Technical Center in Thailand.
In February 2008, we purchased 100% of the stock of Microporous Holding Corporation, the parent company of Microporous Products L.P. ("Microporous"). The acquisition of Microporous adds rubber-based battery separator technology to our product line. This acquisition broadens our participation in the deep-cycle industrial battery market (e.g., forklift and stationary batteries), adds to our membrane technology portfolio and product breadth, enhances service to common customers and adds cost-effective production capacity. On April 1, 2008, we acquired the battery separator manufacturing assets of Super-Tech Battery Components Pvt. Ltd., located in Bangalore, India.
A supply contract between our lead-acid battery separator business and Johnson Controls, Inc. ("JCI") expired on December 31, 2008. In response, we implemented a restructuring plan in our energy storage segment to align lead-acid battery separator production capacity with demand, reduce costs and position ourselves to meet future growth opportunities. The initial plan includes closing our facility in Potenza, Italy, streamlining production at our facility in Owensboro, Kentucky and reducing selling, general and administrative resources associated with the lead-acid separator business. The total estimated cost of the plan is expected to be approximately $61.7 million, including cash charges of $32.8 million for severance, environmental, and other exit costs and a non-cash impairment charge of $28.9 million. We began implementing the restructuring plan during the fourth quarter and recorded a restructuring charge of $59.9 million.
Separations Media Segment
In the separations media segment, our filtration membranes and modules are used in healthcare and high-performance filtration and specialty applications. The healthcare business and a portion of the filtration and specialty business have historically been relatively unaffected by the economy, and we believe that the separations media segment will continue to benefit from continued growth in demand for higher levels of purity in a growing number of applications.
Healthcare applications include hemodialysis, blood oxygenation, and plasmapheresis. Growth in demand for hemodialysis membranes is driven by the increasing worldwide population of end-stage renal disease patients. We estimate that conversion to single-use dialyzers and increasing treatment frequency will result in additional dialyzer market growth.
29
We produce a wide range of membranes and membrane-based elements for micro-, ultra- and nanofiltration and gasification/degasification of liquids. Micro-, ultra- and nanofiltration membrane element market growth is being driven by several factors, including end-market growth in applications such as water treatment and pharmaceutical processing, displacement of conventional filtration media by membrane filtration due to membranes' superior cost and performance attributes and increasing purity requirements in industrial and other applications.
Issuance of Common Stock
In May 2008, we completed a follow-on public offering of 8,031,000 shares of common stock at $24.00 per share, pursuant to which 3,750,000 shares were sold by us and 4,281,000 shares were sold by certain selling shareholders, including certain of our executive officers. We received net proceeds from the offering of $84.8 million, net of underwriting fees of $4.3 million and other offering related costs. The net proceeds were used to repay outstanding borrowings under our revolving credit facility and for general corporate purposes.
Critical accounting policies
Critical accounting policies are those accounting policies that can have a significant impact on the presentation of our financial condition and results of operations, and that require the use of complex and subjective estimates based on past experience and management's judgment. Because of uncertainty inherent in such estimates, actual results may differ from these estimates. Below are those policies that we believe are critical to the understanding of our operating results and financial condition. Management has discussed the development and selection of these critical accounting policies with the Audit Committee of our Board of Directors. For additional accounting policies, see Note 2 of the consolidated financial statements included elsewhere in this Annual Report on Form 10-K.
Allowance for doubtful accounts
Accounts receivable are primarily composed of amounts owed to us through our operating activities and are presented net of an allowance for doubtful accounts. We establish an allowance for doubtful accounts based upon factors surrounding the credit risk of specific customers, historical trends and other information. We charge accounts receivables off against our allowance for doubtful accounts when we deem them to be uncollectible on a specific identification basis. The determination of the amount of the allowance for doubtful accounts is subject to judgment and estimated by management. If circumstances or economic conditions deteriorate, we may need to increase the allowance for doubtful accounts.
Impairment of intangibles and goodwill
Identified intangible assets are reviewed for impairment whenever events or changes in circumstances indicate that the carrying amount may not be recoverable. In accordance with FASB Statement No. 142,Goodwill and Other Intangible Assets, goodwill and indefinite-lived intangible assets are not amortized, but are subject to an annual impairment test unless circumstances dictate more frequent assessments. Goodwill impairment testing is a two-step process performed at the reporting unit level. The Company's reporting units are at the operating segment level. Step one compares the fair value of the Company's reporting units to their carrying amount. The fair value of the reporting unit is determined using the income approach, corroborated by a comparison to market capitalization and key multiples of comparable companies. Under the income approach, the Company determines fair value based on estimated future cash flows of each reporting unit, discounted by an estimated weighted-average cost of capital. If the fair value of the reporting unit is greater than its carrying amount, there is no impairment. If the reporting unit's carrying amount exceeds its fair value, then the
30
second step must be completed to measure the amount of impairment, if any. Step two of the goodwill impairment test calculates the implied fair value of the reporting unit's goodwill with the carrying value of its goodwill. If the carrying amount of goodwill exceeds the implied fair value of goodwill, an impairment loss will be recognized in an amount equal to the excess.
Determining the fair value of a reporting unit is judgmental in nature and requires the use of significant estimates and assumptions, including revenue growth rates, operating margins, discount rates, strategic plans and future market conditions, among others. Given the current economic environment and the uncertainties regarding the impact on the Company's business, there can be no assurance that the Company's estimates and assumptions made for purposes of the Company's goodwill impairment testing will prove to be accurate predictions of the future. If the Company's assumptions regarding forecasted revenue or margin growth rates of certain reporting units are not achieved, or changes in strategy or market conditions occur, the Company may be required to record goodwill impairment charges in future periods. It is not possible at this time to determine if any such future impairment charge would result or, if it does, whether such charge would be material.
A 5% decrease in the estimated free cash flow assumptions would have resulted in a reduction in fair values of approximately $49.5 million for our energy storage segment and $20.1 million for our separations media segment, but would not have resulted in an impairment charge to goodwill or intangible assets. A 10% decrease in the estimated free cash flow assumptions would have resulted in a reduction in fair values of approximately $99.1 million for our energy storage segment and $40.2 million for our separations media segment. For the energy storage segment, the 10% decrease would have resulted in the carrying value of the lead-acid battery separator reporting unit exceeding its fair value by $26.1 million and would require a step two analysis to determine the amount of goodwill impairment, if any.
A 1% increase in the discount rate would have resulted in a reduction in fair values of $90.1 million for our energy storage segment and $37.6 million for our separations media segment. For the energy storage segment, the 1% increase in the discount rate would have resulted in the carrying value of the lead-acid battery separator reporting unit exceeding its fair value by $20.7 million and would require a step two analysis to determine the amount of goodwill impairment, if any.
Pension and other postretirement benefits
Certain assumptions are used in the calculation of the actuarial valuation of our defined benefit pension plans and other postretirement benefits. Two critical assumptions, discount rate and expected return on assets, are important elements of plan expense and/or liability measurement and differences between actual results and these two actuarial assumptions can materially affect our projected benefit obligation or the valuation of our plan assets. Other assumptions involve demographic factors such as retirement, expected increases in compensation, mortality and turnover. The discount rate enables us to state expected future cash flows at a present value on the measurement date. The discount rate assumptions are based on the market rate for high quality fixed income investments, and are thus subject to change each year. At January 3, 2009, a 1% decrease in the discount rate would increase our projected benefit obligations and the unfunded status of our pension plans by $12.8 million. The expected rates of return on our pension plans' assets are based on the asset allocation of each plan and the long-term projected return of those assets. At January 3, 2009, if the expected rate of return on pension plan assets were reduced by 1%, the result would have increased our net periodic benefit expense for fiscal 2008 by $0.2 million dollars. At January 3, 2009, if the actual plan assets were reduced by 1%, the unfunded status of our pension plans would increase by $0.2 million.
31
Environmental matters
We account for environmental liabilities in accordance with AICPA Statement of Position 96-1, "Environmental Remediation Liabilities." Environmental obligations are accrued when such expenditures are probable and reasonably estimable. The amount of liability recorded is based on currently available information, including the progress of remedial investigations, current status of discussions with regulatory authorities regarding the method and extent of remediation, presently enacted laws and existing technology. Accruals for estimated losses from environmental obligations are adjusted as further information develops or circumstances change. We do not currently anticipate any material loss in excess of the amounts accrued. Future remediation expenses may be affected by a number of uncertainties including, but not limited to, the difficulty in estimating the extent and method of remediation, the evolving nature of environmental regulations, and the availability and application of technology. If actual results are less favorable than those projected by management, we may be required to recognize additional expense and liabilities.
In connection with the acquisition of Membrana GmbH ("Membrana") in 2002, we recorded a reserve for costs to remediate known environmental issues and operational upgrades at the Wuppertal, Germany facility. In 2004, we identified and accrued for potential environmental contamination at our manufacturing facility in Potenza, Italy. In December 2008, we implemented a restructuring plan which included the closure of this manufacturing facility and increased the environmental reserve for the estimated additional costs of environmental remediation and monitoring activities that will be required after closing the facility.
We have indemnification agreements for certain environmental matters from Acordis A.G. ("Acordis") and Akzo Nobel N.V. ("Akzo"), the prior owners of Membrana. Recoveries of environmental costs from other parties are recognized as assets when their receipt is deemed probable. We have recorded a receivable with regard to the Akzo indemnification agreement. If indemnification claims cannot be enforced against Acordis and Akzo, we may be required to reduce the amount of indemnification receivable recorded.
Results of operations
The following table sets forth, for the fiscal years indicated, certain historical operating data of Polypore International in amount and as a percentage of net sales (in millions):
| | Fiscal Year | |||||||||
|---|---|---|---|---|---|---|---|---|---|---|
(in millions) | 2008 | 2007 | 2006 | |||||||
Net sales | $ | 610.5 | $ | 534.7 | $ | 478.2 | ||||
Gross profit | 215.7 | 197.0 | 164.9 | |||||||
Selling, general and administrative expenses | 108.3 | 93.6 | 87.5 | |||||||
Business restructuring | 59.9 | (0.9 | ) | 37.0 | ||||||
Change in accounting principle related to postemployment benefits | — | — | (2.6 | ) | ||||||
Operating income | 47.5 | 104.3 | 43.0 | |||||||
Interest expense, net | 60.7 | 81.0 | 92.3 | |||||||
Costs related to purchase of 10.50% senior discount notes | — | 30.1 | — | |||||||
Write-off of loan acquisition costs associated with refinancing of senior secured credit facilities | — | 7.2 | — | |||||||
Foreign currency and other | (2.5 | ) | 1.6 | 3.2 | ||||||
Loss from continuing operations before income taxes | (10.7 | ) | (15.6 | ) | (52.5 | ) | ||||
Income taxes | 6.8 | (16.0 | ) | (22.9 | ) | |||||
Income (loss) from continuing operations | $ | (17.5 | ) | $ | 0.4 | $ | (29.6 | ) | ||
32
| | Fiscal Year | |||||||||
|---|---|---|---|---|---|---|---|---|---|---|
(percent of sales) | 2008 | 2007 | 2006 | |||||||
Net sales | 100.0 | % | 100.0 | % | 100.0 | % | ||||
Gross profit | 35.3 | 36.8 | 34.5 | |||||||
Selling, general and administrative expenses | 17.7 | 17.5 | 18.3 | |||||||
Business restructuring | 9.8 | (0.1 | ) | 7.7 | ||||||
Change in accounting principle related to postemployment benefits | — | — | (0.5 | ) | ||||||
Operating income | 7.8 | 19.4 | 9.0 | |||||||
Interest expense, net | 9.9 | 15.1 | 19.3 | |||||||
Costs related to purchase of 10.50% senior discount notes | — | 5.6 | — | |||||||
Write-off of loan acquisition costs associated with refinancing of senior secured credit facilities | — | 1.3 | — | |||||||
Foreign currency and other | (0.4 | ) | 0.3 | 0.7 | ||||||
Loss from continuing operations before income taxes | (1.8 | ) | (2.9 | ) | (11.0 | ) | ||||
Income taxes | 1.1 | (3.0 | ) | (4.8 | ) | |||||
Income (loss) from continuing operations | (2.9 | )% | 0.1 | % | (6.2 | )% | ||||
Fiscal 2008 compared with fiscal 2007
Net sales. Net sales for fiscal 2008 were $610.5 million, an increase of $75.8 million, or 14.2%, from fiscal 2007. Energy storage sales for fiscal 2008 were $450.2 million, an increase of $70.8 million, or 18.7%. The increase in energy storage sales was due to higher lead-acid and lithium battery separator sales and the positive impact of dollar/euro exchange rate fluctuations of $11.8 million. Lead-acid battery separator sales increased by 19.5%, due primarily to the acquisition of Microporous, as well as the positive impact of dollar/euro exchange rate fluctuations and price increases earlier in 2008 to partially offset the escalation in raw material and energy costs. The expiration of a lead-acid separator supply contract with JCI will impact our sales for fiscal 2009. Sales of automotive lead-acid battery separators covered by the expired contract were approximately 9.0% of fiscal 2008 consolidated net sales. In response, we implemented a restructuring plan to align lead-acid battery separator production capacity with demand, reduce costs and position us to meet future growth opportunities. Lithium battery separator sales increased by 16.0% due to increasing demand for mobile power and the penetration of lithium-ion batteries in an increasing number of electronic devices and into new applications for large format cells.
Separations media sales for fiscal 2008 were $160.3 million, an increase of $5.0 million, or 3.2% from fiscal 2007. The increase in separations media sales was due to higher sales of industrial and filtration specialty products and the positive impact of dollar/euro exchange rate fluctuations of $8.7 million. Healthcare sales were consistent with the prior year as growth in sales of synthetic hemodialysis membranes and the positive impact of dollar/euro exchange rate fluctuations offset the impact of discontinued sales of cellulosic membranes. Industrial and filtration specialty product sales increased by 9.9%, driven by continued demand for high performance filtration applications and the positive impact of dollar/euro exchange rate fluctuations.
Gross Profit. Gross profit as a percent of net sales was 35.3% for fiscal 2008 as compared to 36.8% for fiscal 2007. Energy storage gross profit as a percent of net sales was 35.1% as compared to 38.8% for fiscal 2007. The decline was primarily attributable to the acquisition of Microporous, which has lower gross profit margins than our other lead-acid battery separator production facilities, increased raw material and energy costs, and costs associated with the strike at our Owensboro, Kentucky facility. Separations media gross profit as a percent of net sales increased to 36.5% for fiscal 2008 from 32.1% for fiscal 2007. The increase was due primarily to increased hemodialysis membrane production volumes and investments to enhance production efficiencies.
33
Selling, general and administrative expenses. Selling, general and administrative expenses as a percent of net sales were 17.7% for fiscal 2008, which is comparable to 17.5% for fiscal 2007.
Interest expense. Interest expense for fiscal 2008 decreased by $20.3 million from fiscal 2007. The decrease in interest expense was primarily driven by the purchase of our 10.50% senior discount notes in July 2007 and lower interest rates under our senior credit facilities.
Income taxes. Income taxes as a percentage of pre-tax income from continuing operations for fiscal 2008 were (63.6)% as compared to 102.9% for fiscal 2007. The income tax expense recorded in the financial statements fluctuates between years due to a variety of factors, including state income taxes, the mix of income between U.S. and foreign jurisdictions taxed at varying rates, changes in estimates of permanent differences and valuation allowances and the relative size of our consolidated income before income taxes.
The mix of earnings between the tax jurisdictions has a significant impact on our effective tax rate. Each tax jurisdiction has its own set of tax laws and tax rates and income earned by our subsidiaries is taxed independently by these various jurisdictions. Currently, the applicable statutory income tax rates in the jurisdictions in which we operate range from 0% to 39%. Therefore, the amount of income tax expense in each jurisdiction as compared to our consolidated income (loss) before income taxes has a significant impact on our annual effective tax rate.
In fiscal 2008, the effective tax rate was also impacted by the restructuring charge in Potenza, Italy. Net operating losses generated in Italy as a result of the restructuring charge were offset by a valuation allowance because the benefit of these net operating losses may never be realized since the Company will no longer have operations in Italy.
The effect of each of these items on our effective tax rate on continuing operations is quantified in the table below:
| | Fiscal 2008 | Fiscal 2007 | |||||
|---|---|---|---|---|---|---|---|
U.S. Federal statutory rate | 35.0 | % | 35.0 | % | |||
State income taxes | 0.7 | (2.5 | ) | ||||
Mix of income in taxing jurisdictions | (7.1 | ) | (20.0 | ) | |||
Other permanent differences and valuation allowances | 0.1 | 7.7 | |||||
Purchase of 10.50% senior discount notes and write-off of loan acquisition costs associated with refinancing of senior secured credit facility | — | 27.7 | |||||
Impact of 2008 restructuring | (91.0 | ) | — | ||||
Other | (1.3 | ) | — | ||||
Impact of Italian tax reform legislation | — | 10.0 | |||||
Impact of German tax reform legislation | — | 45.0 | |||||
Total effective tax rate on continuing operations | (63.6 | )% | 102.9 | % | |||
Fiscal 2007 compared with fiscal 2006
Net sales. Net sales for fiscal 2007 were $534.7 million, an increase of $56.5 million, or 11.8%, from fiscal 2006. Energy storage net sales for fiscal 2007 were $379.4 million, an increase of $37.9 million, or 11.1%, from fiscal 2006. The increase in energy storage sales was primarily due to higher lead-acid and lithium battery separator sales volume, higher average sales prices for lead-acid battery separators and the $11.9 million positive impact of dollar/euro exchange rate fluctuations. Lead-acid separator sales growth of 11.4% was driven by the increasing size of the automotive market and the trend of conversion from alternative separator materials to superior performing polyethylene-based separators, particularly in Asia. Average sales prices increased due to global price increases implemented to offset higher raw material and energy costs. Lithium battery separator sales increased
34
by 10.3% due to increased demand for consumer electronic products and expanding applications for lithium batteries.
Separations media net sales for fiscal 2007 were $155.3 million, an increase of $18.6 million, or 13.6%, from fiscal 2006 due to higher sales of industrial and specialty filtration products and hemodialysis membranes. Included in this increase was a $9.9 million positive impact of dollar/euro exchange rate fluctuations. Healthcare product sales increased by 9.7% due to strong growth in sales of synthetic hemodialysis membranes combined with the positive impact of dollar/euro exchange rate fluctuations, offset by the expected decline in sales of cellulosic hemodialysis membranes due to our exit of this product line. Filtration and specialty product sales increased by 22.3%, driven by continued strong demand for high performance filtration applications and the positive impact of dollar/euro exchange rate fluctuations.
Gross Profit. Gross profit as a percent of net sales was 36.8% for fiscal 2007, as compared to 34.5% for fiscal 2006. Energy storage gross profit as a percent of net sales was 38.8% for the fiscal 2007, which was comparable to the prior year percentage of 38.8%. Separations media gross profit as a percent of net sales increased to 32.1% for fiscal 2007 from 23.7% for fiscal 2006. The increase in separations media gross profit percentage is due primarily to the successful transformation of our hemodialysis membrane business from cellulosic to synthetic products, investments to enhance production efficiencies and growth in our high performance filtration business.
Selling, general and administrative expenses. Selling, general and administrative expenses as a percent of net sales were 17.5% for fiscal 2007, as compared to 18.3% for fiscal 2006. The increase in selling, general and administrative expenses is due to increased costs strategically aimed at driving growth, including selling and marketing costs and personnel costs.
Interest expense. Interest expense for fiscal 2007 decreased by $11.3 million from fiscal 2006. The decrease in interest expense was primarily driven by the purchase of our 10.50% senior discount notes in July 2007 and lower interest rates under our refinanced senior credit facilities.
Income taxes, net. Income taxes as a percentage of income before income taxes for fiscal 2007 were 102.9% as compared to 43.7% for fiscal 2006. The income tax expense recorded in the financial statements fluctuates between years due to a variety of factors, including state income taxes, the mix of income between U.S. and foreign jurisdictions taxed at varying rates, certain export sales which are excluded from taxable income, various changes in estimates of permanent differences and valuation allowances, and the relative size of our consolidated income or loss before income taxes.
The primary factor impacting our effective tax rate is the mix of earnings between the various tax jurisdictions in which we do business. Each tax jurisdiction has its own set of tax laws and tax rates. The income earned by our subsidiaries in each jurisdiction is taxed independently by these various jurisdictions. Currently, the applicable statutory income tax rates in the jurisdictions that we operate in range from 0% to 39%. Therefore, the amount of income tax expense in each jurisdiction as compared to our consolidated income (loss) before income taxes has a significant impact on our annual effective tax rate.
In 2007, our effective tax rate was also impacted by significant events related to financing activities and tax reforms that occurred during fiscal 2007. These events resulted in an increase in our income tax benefit of $20.5 million. In July 2007, we purchased the 10.50% senior discount notes and refinanced our senior secured credit facilities. The cost of these transactions was $37.2 million, consisting of redemption and tender premiums and the write-off of unamortized loan acquisition costs, and resulted in an income tax benefit of $12.0 million in fiscal 2007.
On August 17, 2007, the German government enacted the 2008 Tax Reform Act legislation. This comprehensive German tax reform legislation reduces corporate tax rates for 2008 and beyond and also
35
fundamentally changes the calculation of taxable income in Germany. While the corporate income tax and trade tax regime within Germany have remained, the Act reduces the maximum corporate income tax rate from 25% to 15% and the maximum trade tax rate from approximately 18% to 15.2%. Additional provisions of the legislation include the disallowance of deductions of the trade tax and certain interest expense from taxable income. As a result of the Act, our German deferred tax liabilities existing as of January 1, 2008 will reverse in future years at a lower effective tax rate. We recognized the effect of the new tax legislation, which resulted in an increase in the income tax benefit of $6.9 million in fiscal 2007.
On December 21, 2007, the Italian Parliament approved the 2008 Finance Bill, which affected taxation of corporations doing business in Italy. The most significant change was the reduction of the corporate income tax rate from 33% to 27.5% and a reduction of the local income tax rate from 4.25% to 3.9%. As a result, our Italian deferred tax liabilities existing as of January 1, 2008 will reverse in future years at a lower effective tax rate. We recognized the effect of the new tax legislation, which resulted in an increase in the income tax benefit of $1.6 million in fiscal 2007.
The effect of each of these items on our effective tax rate is quantified in the table below:
| | Fiscal 2007 | Fiscal 2006 | |||||
|---|---|---|---|---|---|---|---|
U.S. Federal statutory rate | 35.0 | % | 35.0 | % | |||
State income taxes | (2.5 | ) | 2.9 | ||||
Mix of income in taxing jurisdictions | (20.0 | ) | 10.9 | ||||
Export sales excluded from taxable income | — | 2.6 | |||||
Other permanent differences and valuation allowances | 7.7 | (7.7 | ) | ||||
Purchase of 10.50% senior discount notes and write-off of loan acquisition costs associated with refinancing of senior secured credit facility | 27.7 | — | |||||
Impact of Italian tax reform legislation | 10.0 | — | |||||
Impact of German tax reform legislation | 45.0 | — | |||||
Total effective tax rate on continuing operations | 102.9 | % | 43.7 | % | |||
Business restructuring
The pre-tax components of restructuring activity in 2008 were as follows:
(in millions) | Balance at December 29, 2007 | Restructuring charges | Asset Writedown | Cash Payments | Foreign currency translation | Balance at January 3, 2009 | ||||||||||||||
|---|---|---|---|---|---|---|---|---|---|---|---|---|---|---|---|---|---|---|---|---|
2008 Restructuring Plan: | ||||||||||||||||||||
Severance and benefit costs | $ | — | $ | 10.4 | $ | — | $ | (1.4 | ) | $ | 0.9 | $ | 9.9 | |||||||
Impairment | — | 28.9 | (28.9 | ) | — | — | — | |||||||||||||
Other | — | 2.0 | — | (1.3 | ) | 0.1 | 0.8 | |||||||||||||
| — | 41.3 | (28.9 | ) | (2.7 | ) | 1.0 | 10.7 | |||||||||||||
2006 Restructuring Plan: | ||||||||||||||||||||
Severance and benefit costs | 3.5 | — | — | (0.5 | ) | (0.1 | ) | 2.9 | ||||||||||||
Other | 1.3 | — | — | (0.8 | ) | — | 0.5 | |||||||||||||
| 4.8 | — | — | (1.3 | ) | (0.1 | ) | 3.4 | |||||||||||||
2005 Restructuring Plan: | ||||||||||||||||||||
Severance and benefit costs | 0.4 | — | — | (0.3 | ) | (0.1 | ) | — | ||||||||||||
Total | $ | 5.2 | $ | 41.3 | $ | (28.9 | ) | $ | (4.3 | ) | $ | 0.8 | $ | 14.1 | ||||||
36
In addition to the amounts in the table above, the 2008 restructuring charge included $18.6 million in environmental costs.
The business restructuring activity in 2007 was as follows:
(in millions) | Balance at December 30, 2006 | Restructuring charges | Cash payments | Foreign currency translation | Balance at December 29, 2007 | ||||||||||||
|---|---|---|---|---|---|---|---|---|---|---|---|---|---|---|---|---|---|
2006 Restructuring Plan: | |||||||||||||||||
Severance and benefit costs | $ | 11.5 | $ | (0.9 | ) | $ | (7.7 | ) | $ | 0.6 | $ | 3.5 | |||||
Other | 5.7 | 0.2 | (4.8 | ) | 0.2 | 1.3 | |||||||||||
| 17.2 | (0.7 | ) | (12.5 | ) | 0.8 | 4.8 | |||||||||||
2005 Restructuring Plan: | |||||||||||||||||
Severance and benefit costs | 0.9 | 0.1 | (0.7 | ) | 0.1 | 0.4 | |||||||||||
Other | — | 0.2 | (0.2 | ) | — | — | |||||||||||
| 0.9 | 0.3 | (0.9 | ) | 0.1 | 0.4 | ||||||||||||
2004 Restructuring Plan: | |||||||||||||||||
Severance and benefit costs | 1.2 | (0.5 | ) | (0.7 | ) | — | — | ||||||||||
Total | $ | 19.3 | $ | (0.9 | ) | $ | (14.1 | ) | $ | 0.9 | $ | 5.2 | |||||
All restructuring charges, except for the asset impairments, will result in cash outflows which will be funded by cash from operations. We expect to make payments against the restructuring reserve of $3.3 million in fiscal 2009.
2008 restructuring plan. A supply contract between our lead-acid battery separator business and JCI expired on December 31, 2008. In response, we implemented a restructuring plan in our energy storage segment to align lead-acid battery separator production capacity with demand, reduce costs and position ourselves to meet future growth opportunities. The initial plan includes closing our facility in Potenza, Italy, streamlining production at our facility in Owensboro, Kentucky and reducing selling, general and administrative resources associated with the lead-acid separator business. The total estimated cost of the plan is expected to be approximately $61.7 million, including cash charges of $32.8 million for severance, environmental, and other exit costs and a non-cash impairment charge of $28.9 million. We began implementing the restructuring plan during the fourth quarter and recorded a restructuring charge of $59.9 million. Cash payments for severance and other exit costs associated with the plan are expected to be paid over the next three years. The timing, scope and costs of these restructuring measures are subject to change we implement the plan and continue to evaluate our business needs and costs.
2006 restructuring plan. In December 2006, our separations media segment exited the production of cellulosic membranes and we realigned the cost structure at our Wuppertal, Germany facility. The total cost of the plan is expected to be approximately $33.8 million, consisting of a $17.5 million non-cash impairment charge for buildings and equipment, $10.5 million for employee layoffs and $5.8 million for other costs related to the shutdown of portions of the Wuppertal facility. The other costs included in the restructuring plan are related to local regulations surrounding complete or partial shutdowns of a facility. During fiscal 2007, the reserve for severance and benefit costs was reduced as a result of lower actual severance expenses than originally estimated.
2005 restructuring plan. In order to better accommodate customer growth and related demand for both lead-acid and lithium battery separators in the greater Asian market, our energy storage segment transferred certain assets from Europe and the United States to our facilities in Thailand and China. The total cost of the realignment plan was $9.1 million, including a non-cash impairment charge of $1.3 million.
37
Foreign Operations
At January 3, 2009, we manufacture our products at 14 strategically located facilities in North America, Europe and Asia. Net sales from the foreign locations were $388.4 million for fiscal 2008, $349.4 million for fiscal 2007 and $298.2 million for fiscal 2006. Typically, we sell our products in the currency of the country where the manufacturing facility that produces the product is located. Sales to foreign customers are subject to numerous additional risks, including the impact of foreign government regulations, currency fluctuations, political uncertainties and differences in business practices. There can be no assurance that foreign governments will not adopt regulations or take other action that would have a direct or indirect adverse impact on our business or market opportunities within such governments' countries. Furthermore, there can be no assurance that the political, cultural and economic climate outside the United States will be favorable to our operations and growth strategy.
Seasonality
Operations at our European production facilities are traditionally subject to shutdowns for approximately one month during the third quarter of each year for employee vacations. As a result, operating income during the third quarter of fiscal years 2008, 2007 and 2006 were, and during the third quarter of any fiscal year in the future may be, lower than operating income in other quarters during the same fiscal year. In view of the seasonal fluctuations, we believe that comparisons of our operating results for the third quarter of any fiscal year with those of the other quarters during the same fiscal year may be of limited relevance in predicting our future financial performance.
Liquidity and capital resources
Cash and cash equivalents increased to $83.0 million at January 3, 2009 from $54.9 million at December 29, 2007. The $28.1 million increase consists of cash flow from operations of $94.7 million and cash from financing activities of $65.7 million, offset by cash used in investing activities of $129.8 million and the negative impact of exchange rate changes on cash and cash equivalents of $2.5 million.
Operating activities. Net cash provided by operating activities was $94.7 million in fiscal 2008, as compared to $69.3 million in fiscal 2007. Cash provided by operating activities in fiscal 2008 consisted of cash flows from operations partially offset by an increase in working capital of $1.3 million, excluding the impact of foreign exchange rate fluctuations. Accounts receivable decreased by $20.1 million (excluding the $4.9 million decrease due to movements in foreign exchange rates) due to the normal fluctuations in the timing of sales in the quarter. Days sales outstanding at January 3, 2009 were comparable to the prior year. Inventories increased $5.4 million (excluding the $0.7 million decrease due to movements in foreign exchange rates) due to timing of sales and production. Accounts payable and accrued liabilities decreased by $18.6 million (excluding the $8.3 million decrease due to movements in foreign exchange rates) primarily due to timing of payments on accounts payable and accrued liabilities.
Net cash provided by operating activities was $69.3 million in fiscal 2007, as compared to $50.0 million in fiscal 2006. Cash provided by operating activities in fiscal 2007 consisted of cash flows from operations partially offset by an increase in working capital of $2.4 million, excluding the impact of foreign exchange rate fluctuations. Accounts receivable increased by $7.0 million (excluding the $6.5 million increase due to movements in foreign exchange rates) due to the increase in sales during the fourth quarter of 2007 as compared to the same period last year. Days sales outstanding decreased by approximately 3% at December 29, 2007 and were impacted by normal fluctuations in the mix of sales by country and customer. Inventories decreased $8.3 million (excluding the $4.9 million increase due to movements in foreign exchange rates) due to the reduction of cellulosic hemodialysis membrane inventories as we made final shipments out of inventory to our customers. Accounts payable and accrued liabilities decreased by $13.9 million (excluding the $10.7 million increase due to movements in foreign exchange rates) primarily due to restructuring payments.
38
Investing activities. Cash used in investing activities was $129.8 million, consisting of capital expenditures and acquisitions, partially offset by $4.0 million in proceeds from the sale of a non-core synthetic paper business. Capital expenditures in fiscal 2008 were $48.0 million. Included in this amount were expenditures for the completion of the lithium capacity expansion in Charlotte, North Carolina and the lead-acid capacity expansion in Prachinburi, Thailand. For 2009, we expect to spend approximately $15 million to $20 million to maintain our existing facilities. Because of current economic conditions, the timing and amounts of capital expenditures in excess of normal maintenance requirements will be intensely scrutinized and approved on a case-by-case basis.
In fiscal 2008, we completed three acquisitions in our energy storage segment for an aggregate purchase price of $85.8 million.
Financing activities. Cash provided by financing activities was $65.7 million in fiscal 2008. In May 2008, we completed a follow-on public offering with net proceeds of $84.8 million. The proceeds were used to repay outstanding borrowings under our revolving credit facility and for general corporate purposes. We made debt payments of $20.7 million, including the repayment of the $14.2 million of debt assumed in the Microporous acquisition.
We intend to fund our ongoing operations with cash on hand, cash generated by operations and availability under the senior secured credit facility.
On July 3, 2007, we refinanced Polypore's senior secured credit facility with a new senior secured credit facility that provides improved financial flexibility and lower interest rate spreads. The new credit facility provides for a $322.9 million term loan facility ($318.1 million outstanding at January 3, 2009) and a €35.0 million term loan facility ($48.0 million at January 3, 2009) and a $90.0 million revolving credit facility. At January 3, 2009, we had $87.3 million of borrowings available under the revolving credit facility ($90.0 million revolving credit facility less $2.7 million of undrawn standby letters of credit). The term loans mature in July 2014 and the revolving credit facility matures in July 2013. Interest rates under the senior secured credit facility are, at our option, equal to either an alternate base rate plus a 1.00% margin or the Eurocurrency base rate plus a 2.00% margin. At January 3, 2009, the interest rates on the U.S. dollar term loan and Eurodollar term loan were 2.45% and 4.73%, respectively.
When loans are outstanding under the revolving credit facility, we are required to maintain a senior leverage ratio of indebtedness to Adjusted EBITDA of less than 3.00 to 1.00. At January 3, 2009, our senior leverage ratio was 1.82, and the entire amount of the revolving credit facility was available for borrowing.
39
Adjusted EBITDA, as defined under the senior secured credit facility, for fiscal 2008 was as follows:
(in millions) | Fiscal 2008 | ||||
|---|---|---|---|---|---|
Net loss | $ | (15.2 | ) | ||
Add/Subtract: | |||||
Depreciation and amortization | 55.1 | ||||
Interest expense, net | 60.7 | ||||
Income taxes | 6.8 | ||||
Stock-based compensation expense | 1.3 | ||||
Foreign currency gain | (1.6 | ) | |||
Loss on disposal of property, plant, and equipment | 1.7 | ||||
Business restructuring | 59.9 | ||||
Pro forma results for acquisitions | 0.5 | ||||
Costs related to the strike at our Owensboro, Kentucky facility | 6.7 | ||||
Costs related to the FTC complaint | 1.1 | ||||
Discontinued operations | (2.4 | ) | |||
Other non-cash or non-recurring charges | 1.1 | ||||
Adjusted EBITDA | $ | 175.7 | |||
The calculation of the senior leverage ratio as defined under the senior credit facility as of January 3, 2009 is as follows:
(in millions) | Fiscal 2008 | |||
|---|---|---|---|---|
Indebtedness(1) | $ | 319.4 | ||
Adjusted EBITDA | 175.7 | |||
Actual leverage ratio | 1.82x | |||
- (1)
- Calculated as the sum of outstanding borrowings under the term loan facility plus the capital lease obligation, less the amount of cash on hand (not to exceed $50.0 million).
The senior secured credit agreement contains certain restrictive covenants which, among other things, limit capital spending, the incurrence of additional indebtedness, investments, dividends, transactions with affiliates, asset sales, acquisitions, mergers and consolidations, prepayments of other indebtedness, liens and encumbrances, and other matters customarily restricted in such agreements. The facilities also contain certain customary events of default, subject to grace periods, as appropriate. We believe that annual capital expenditure limitations imposed by the senior credit facilities will not significantly inhibit us from meeting our ongoing capital expenditure needs.
In January 2008, the Company entered into interest rate swap agreements that effectively fix the interest rate on $250.0 million of the Company's term loans. The interest rate swap agreement which terminates on June 30, 2009 fixes the interest rate on $50.0 million of the term loans at 5.58%. The interest rate swap agreement which terminates on December 31, 2009 fixes the interest rate on $200.0 million of the term loans at 5.54%.
Future principal debt payments are expected to be paid out of cash flows from operations, borrowings on our revolving credit facility and future refinancing of our debt. Our cash interest requirements for the next twelve months are estimated to be $55.7 million.
The 83/4% senior subordinated notes ($433.9 million outstanding at January 3, 2009) will mature in 2012 and are guaranteed by most of our existing and future domestic restricted subsidiaries, subject to certain exceptions. Except under certain circumstances, the 83/4% senior subordinated notes do not require principal payments prior to their maturity in 2012. Interest on the 83/4% senior subordinated notes is payable semi-annually in cash. The 83/4% senior subordinated notes contain customary
40
covenants and events of default, including covenants that limit our ability to incur debt, pay dividends and make investments.
As stated in the credit agreement, the term loans mature in July 2014 and the revolving credit facility matures in July 2013. The 8.75% senior subordinated notes mature on May 15, 2012. Because the senior subordinated notes are subordinated to the senior secured credit facility, if any amounts are outstanding under the senior subordinated notes at February 1, 2012, the maturity dates for the term loans and the revolving credit facility will be accelerated to February 1, 2012.
We believe we have sufficient liquidity to meet our cash requirements over both the short (next twelve months) and long term (in relation to our debt service requirements). In evaluating the sufficiency of our liquidity for both the shorter and longer term, we considered cash on hand, the expected cash flow to be generated by our operations and the available borrowings under our senior secured credit facility compared to our anticipated cash requirements for debt service, working capital, cash taxes and capital expenditures and funding requirements for long-term liabilities. We anticipate that our cash on hand and operating cash flow, together with borrowings under the revolving credit facility, will be sufficient to meet our anticipated future operating expenses, capital expenditures and debt service obligations as they become due for at least the next twelve months. However, our ability to make scheduled payments of principal, to pay interest on or to refinance our indebtedness and to satisfy our other debt obligations will depend upon our future operating performance, which will be affected by general economic, financial, competitive, legislative, regulatory, business and other factors beyond our control. See "Item 1A. Risk factors" in this Annual Report on Form 10-K.
From time to time, we may explore additional financing methods and other means to lower our cost of capital, which could include stock issuance or debt financing and the application of the proceeds therefrom to the repayment of bank debt or other indebtedness. In addition, in connection with any future acquisitions, we may require additional funding which may be provided in the form of additional debt or equity financing or a combination thereof. There can be no assurance that any additional financing will be available to us on acceptable terms.
Environmental matters
We account for environmental liabilities in accordance with AICPA Statement of Position 96-1, "Environmental Remediation Liabilities." Environmental obligations are accrued when such expenditures are probable and reasonably estimable. The amount of liability recorded is based on currently available information, including the progress of remedial investigations, current status of discussions with regulatory authorities regarding the method and extent of remediation, presently enacted laws and existing technology. Accruals for estimated losses from environmental obligations are adjusted as further information develops or circumstances change. Costs of future expenditures for environmental obligations are not discounted to their present value. We do not currently anticipate any material loss in excess of the amounts accrued. However, future remediation expenses may be affected by a number of uncertainties including, but not limited to, the difficulty in estimating the extent and method of remediation, the evolving nature of environmental regulations, and the availability and application of technology. We do not expect the resolution of such uncertainties to have a material adverse effect on our consolidated financial position or liquidity. Recoveries of environmental costs from other parties are recognized as assets when their receipt is deemed probable. Environmental reserves, which are predominately euro-denominated, were $49.2 million and $29.2 million as of January 3, 2009 and December 29, 2007, respectively.
In connection with the acquisition of Membrana in 2002, we recorded a reserve for environmental obligations. The reserve provides for costs to remediate known environmental issues and operational upgrades which are required in order for us to remain in compliance with local regulations. The initial estimate and subsequent finalization of the reserve was included in the allocation of purchase price at
41
the date of acquisition. At January 3, 2009, the environmental reserve for the Membrana facility was $22.6 million. We anticipate that expenditures will be made over the next seven to ten years.
We have indemnification agreements for certain environmental matters from Acordis A.G. ("Acordis") and Akzo Nobel N.V. ("Akzo"), the prior owners of Membrana. Akzo originally provided broad environmental protections to Acordis with the right to assign such indemnities to Acordis's successors. Akzo's indemnifications relate to conditions existing prior to December 1999, which is the date that Membrana was sold to Acordis. The Akzo agreement provides indemnification of claims through December 2007, with the indemnification percentage decreasing each year during the coverage period. Through December 2003, Akzo pays 75% of any approved claim. After that, Akzo pays 65% of claims reported through December 2006 and 50% of claims reported through December 2007. In addition to the Akzo indemnification, Acordis provides separate indemnification of claims incurred from December 1999 through February 2002, the acquisition date. We will receive indemnification payments under the indemnification agreements as expenditures are made against approved claims. At January 3, 2009 and December 29, 2007, amounts receivable under the indemnification agreements were $17.9 million and $20.0 million, respectively. The current portion of the indemnification receivable is included in "Prepaid and other" in the accompanying consolidated balance sheets.
In 2004, we identified potential environmental contamination at our manufacturing facility in Potenza, Italy. Based on environmental studies and the initial remediation plan presented to local authorities, we recorded a reserve for environmental obligations. In 2006, we further refined the remediation plan after consultations with local authorities. In December 2008, we implemented a restructuring plan which included the closure of this manufacturing facility. Based on discussions with local authorities, environmental consultants and internal personnel, we increased the environmental reserve at Potenza by $18.6 million for the estimated additional costs of environmental remediation and monitoring activities that will be required after closing the facility. Discussions with the local authorities regarding the required level of site clean-up and remediation are ongoing. The increase in the environmental reserve was included in "Business restructuring" in the accompanying consolidated statements of operations. At January 3, 2009, the environmental reserve for the Potenza, Italy facility was $23.5 million. We anticipate that expenditures will be made over the next seven to ten years.
In connection with the acquisition of Microporous on February 29, 2008, we identified potential environmental contamination at the manufacturing site in Piney Flats, Tennessee. Subsequent to the acquisition, we performed additional environmental studies and confirmed that environmental contamination was present. The estimated cost of remediation is $3.1 million. As part of the acquisition, the seller purchased an environmental insurance policy on behalf of the Company and also provided indemnification for a portion of the insurance policy deductible. Amounts due under the insurance policy and indemnification agreement are estimated to be $2.5 million. We recorded the estimated cost of remediation and the related receivables from the insurance company and indemnification agreement in applying purchase accounting for the acquisition. The current portion of the indemnification receivable is included in "Prepaid and other" in the accompanying consolidated balance sheets.
In 2006, we identified instances of potential non-compliance with environmental operating permits at our Corydon, Indiana and Owensboro, Kentucky facilities. We recorded our best estimate of potential penalties at that time. In March 2008, we reached agreement with the Indiana Department of Environmental Management and agreed to pay fines consistent with the our original estimate. We do not believe that additional fines or penalties will be assessed.
Contractual Obligations
The following table sets forth our contractual obligations at January 3, 2009. Some of the amounts included in this table are based on management's estimates and assumptions about these obligations,
42
including their duration, anticipated actions by third parties and other actions. Because these estimates and assumptions are necessarily subjective, the timing and amount of payments under these obligations may vary from those reflected in this table. For more information on these obligations, see the notes to consolidated financial statements included in "Item 8. Financial Statements and Supplementary Data."
| | Payment due by Period | |||||||||||||||
|---|---|---|---|---|---|---|---|---|---|---|---|---|---|---|---|---|
(in millions) | Total | 2009 | 2010–2011 | 2012–2013 | Thereafter | |||||||||||
Long-term debt(1) | $ | 366.1 | $ | 3.8 | $ | 7.4 | $ | 7.4 | $ | 347.5 | ||||||
83/4% senior subordinated notes(2) | 433.9 | — | — | 433.9 | — | |||||||||||
Cash interest payments(3) | 196.7 | 55.7 | 96.9 | 39.3 | 4.8 | |||||||||||
Capital lease obligation(4) | 3.5 | 1.6 | 1.9 | — | — | |||||||||||
Operating lease obligations(5) | 4.3 | 1.4 | 2.1 | 0.8 | — | |||||||||||
Business restructuring | 14.0 | 3.9 | 9.6 | 0.2 | 0.3 | |||||||||||
| $ | 1,018.5 | $ | 66.4 | $ | 117.9 | $ | 481.6 | $ | 352.6 | |||||||
- (1)
- Included in long-term debt are amounts owed under our term loan facilities and other debt. The term loan facilities include euro-denominated debt held by one of our international subsidiaries. The table assumes that the dollar/euro exchange rate is the rate at January 3, 2009 for all periods presented and that the debt is held to its stated maturity. As stated in the credit agreement, the term loans mature in July 2014 and the revolving credit facility matures in July 2013. The 83/4% senior subordinated notes mature on May 15, 2012. Because the senior subordinated notes are subordinated to the senior secured credit facility, if any amounts are outstanding under the senior subordinated notes at February 1, 2012, the maturity dates for the term loans and the revolving credit facility will be accelerated to February 1, 2012.
- (2)
- The 83/4% senior subordinated notes are due 2012. This senior subordinated debt includes €150.0 million euro denominated debt held in the U.S. The table assumes that the dollar/euro exchange rate is the rate at January 3, 2009 for all periods presented and that the debt is held to maturity.
- (3)
- Includes cash interest requirements on long-term debt and the 83/4% senior subordinated notes. Interest rates under the term loan facilities are variable and the table assumes that these rates are the same rates that were in effect at January 3, 2009. For the euro-denominated debt, the table assumes that the dollar/euro exchange rate is the rate at January 3, 2009 for all periods presented. Also includes the effects of the interest rate swap agreements entered into in January 2008 that effectively fix the interest rate on $250.0 million of our variable rate debt. The interest rate swap agreement covering $50.0 million of our variable rate debt terminates on June 30, 2009, and the other swap agreement covering $200.0 million of our variable rate debt terminates on December 31, 2009.
- (4)
- We lease manufacturing equipment under a capital lease agreement. The lease agreement expires in February 2011 and contains an early buyout option that is exercisable in October 2009. The capital lease payments include interest under the capital lease agreement.
- (5)
- We lease certain equipment and facilities under operating leases. Some lease agreements provide us with the option to renew the lease agreement. Our future operating lease obligations would change if we exercised these renewal options.
- (6)
- As discussed in the notes to our consolidated financial statements included in "Item 8. Financial Statements and Supplementary Data," we have long-term liabilities for pension, postretirement and postemployment benefits of $69.8 million as of January 3, 2009. Our contributions for these benefit plans are not included in the table above since the timing and amount of payments are dependent
43
upon many factors, including when an employee retires or leaves the Company, certain benefit elections by employees, return on plan assets, minimum funding requirements and foreign currency exchange rates. We estimate that contributions to the pension and postretirement plans in fiscal 2009 will be $4.8 million.
- (7)
- As discussed in the notes to the consolidated financial statements included in "Item 8. Financial Statements and Supplementary Data," we have environmental obligations and related indemnification receivables. Payments related to these obligations and the related amounts to be indemnified under indemnification agreements are not included in the table above since the timing of payments and indemnifications is not known. We estimate that we will make payments, net of indemnification amounts, of $5.1 million in fiscal 2009. Payments against environmental obligations in fiscal 2008 were $0.9 million, net of indemnification receipts of $1.0 million. We expect payments for environmental obligations and amounts received under indemnification agreements will occur over the next seven to ten years.
- (8)
- As discussed in the notes to the consolidated financial statements included in "Item 8. Financial Statements and Supplementary Data," we have recorded a liability of $8.0 million for uncertain tax positions. Payments related to this liability are not included in the table above since the timing of the payments is not known.
Off Balance Sheet Arrangements
We are not a party to any off-balance sheet arrangements that have, or are reasonably likely to have, a current or future effect on our financial condition, sales or expenses, results of operations, liquidity, capital expenditures or capital resources that is material to investors.
New Accounting Standards
In September 2006, the FASB issued Statement No. 157,Fair Value Measurement ("FAS 157"), which clarifies the definition of fair value whenever another standard requires or permits assets or liabilities to be measured at fair value, establishes a framework for measuring the fair value of assets and liabilities under generally accepted accounting principles and expands disclosure about fair value measurements. In February 2008, the FASB issued FSP 157-2,Effective Date of SFAS No. 157 ("FSP 157-2"), which delays the effective date of FAS 157 for nonfinancial assets and liabilities to fiscal years beginning after Nov. 15, 2008. In October 2008, the FASB issued FSP No. SFAS 157-3,Determining Fair Value of a Financial Asset in a Market That Is Not Active ("FSP 157-3"), which clarifies the application of FAS 157 when the market for a financial asset is not active. FAS 157-3 was effective upon issuance, including reporting for prior periods for which financial statements have not been issued. The partial adoption of FAS 157 in the first quarter of 2008 did not have a material impact on the consolidated financial statements. We are currently evaluating the impact on the consolidated financial statements of adopting the additional requirements of SFAS 157, which were deferred by FSP 157-2.
In September 2006, the FASB issued Statement No. 158,Employers' Accounting for Defined Benefit Pension and Other Postretirement Plans—an amendment of FASB Statements No. 87, 88, 106, and 132(R) ("FAS 158"). FAS 158 requires an employer to recognize the funded status of a defined benefit postretirement plan as an asset or liability in its balance sheet and to recognize changes in that funded status through comprehensive income in the year in which the changes occur. We adopted FAS 158 in fiscal 2007. As a result of the adoption, we increased our pension and postretirement benefits liabilities by $4.2 million and our accumulated other comprehensive loss by $2.9 million, net of applicable income taxes.
In February 2007, the FASB issued Statement No. 159,The Fair Value Option for Financial Assets and Financial Liabilities ("FAS 159"). FAS 159 permits entities to choose to measure eligible items at fair value at specified election dates and report unrealized gains and losses on items for which the fair value option has been elected in earnings at each subsequent reporting date. We adopted FAS 159 in
44
the first quarter of fiscal 2008. The adoption of FAS 159 did not have a material impact on the consolidated financial statements because we have not made any fair value measurement elections.
In December 2007, the FASB issued Statement No. 141(R),Business Combinations—a replacement of FASB Statement No. 141 ("FAS 141(R)"). FAS 141(R) changes the principles and requirements for how the acquirer of a business recognizes and measures in its financial statements the identifiable assets acquired, the liabilities assumed, and any noncontrolling interest in the acquiree. FAS 141(R) also provides guidance for recognizing and measuring the goodwill acquired in the business combination and determines what information to disclose to enable users of the financial statements to evaluate the nature and financial effects of the business combination. FAS 141(R) is effective prospectively for fiscal years beginning after December 15, 2008.
In December 2007, the FASB issued Statement No. 160,Noncontrolling Interests in Consolidated Financial Statements ("FAS 160"). FAS 160 establishes accounting and reporting standards for ownership interests in subsidiaries held by parties other than the parent, the amount of consolidated net income attributable to the parent and to the noncontrolling interest, changes in a parent's ownership interest and the valuation of retained noncontrolling equity investments when a subsidiary is deconsolidated. FAS 160 also establishes reporting requirements that provide sufficient disclosures that clearly identify and distinguish between the interests of the parent and the interests of the noncontrolling owners. This standard is effective for fiscal years beginning after December 15, 2008. We do not expect the adoption of FAS 160 to have a material impact on its consolidated financial statements.
In March 2008, the FASB issued Statement No. 161,Disclosures about Derivative Instruments and Hedging Activities ("FAS 161"). FAS 161 requires companies with derivative instruments to disclose information about how and why a company uses derivative instruments, how derivative instruments and related hedged items are accounted for under FAS 133 and how derivative instruments and related hedged items affect a company's financial position, financial performance and cash flows. FAS 161 is effective for financial statements issued for fiscal years beginning after November 15, 2008.
In May 2008, the FASB issued Statement No. 162,The Hierarchy of Generally Accepted Accounting Principles ("FAS 162"). FAS 162 identifies the sources of accounting principles and the framework for selecting the principles used in the preparation of financial statements. FAS No. 162 is effective November 15, 2008. We do not expect the adoption of FAS 162 to have a material impact on its consolidated financial statements.
Item 7A. Quantitative and Qualitative Disclosures About Market Risk
We are exposed to various market risks, which are potential losses arising from adverse changes in market rates and prices, such as interest rates and foreign exchange fluctuations. We do not enter into derivatives or other financial instruments for trading or speculative purposes.
Interest rate risk
At January 3, 2009, we had fixed rate debt of $433.9 million and variable rate debt of $366.1 million. In January 2008, we entered into interest rate swap agreements that effectively fix the interest rate on $250.0 million of our variable rate debt. The pre-tax earnings and cash flow impact resulting from a 100 basis point increase in interest rates on our variable rate debt, giving effect to the interest rate swap agreements and holding other variables constant, would be $1.2 million per year.
Currency risk
Outside of the United States, we maintain assets and operations in Europe and Asia. The results of operations and financial position of our foreign operations are principally measured in their respective currency and translated into U.S. dollars. As a result, exposure to foreign currency gains and losses exists. The reported income of these subsidiaries will be higher or lower depending on a
45
weakening or strengthening of the U.S. dollar against the respective foreign currency. Our subsidiaries and affiliates also purchase and sell products and services in various currencies. As a result, we may be exposed to cost increases relative to the local currencies in the markets in which we sell. Because a different percentage of our sales are in a foreign currency than our costs, a change in the relative value of the U.S. dollar could have a disproportionate impact on our sales compared to our costs, which could impact our margins. A portion of our assets are based in our foreign locations and are translated into U.S. dollars at foreign currency exchange rates in effect as of the end of each period, with the effect of such translation reflected in other comprehensive income (loss). We have a euro-denominated term loan and senior subordinated notes that effectively hedge our net investment in foreign subsidiaries. Therefore, foreign currency gains and losses resulting from the translation of the euro-denominated debt are included in accumulated other comprehensive income (loss). Accordingly, our consolidated shareholders' equity will fluctuate depending upon the weakening or strengthening of the U.S. dollar against the respective foreign currency, primarily the euro.
The dollar/euro exchange rates used in our financial statements for the fiscal years ended as set forth below were as follows:
| | 2008 | 2007 | 2006 | |||||||
|---|---|---|---|---|---|---|---|---|---|---|
Period end rate | 1.3925 | 1.4655 | 1.3170 | |||||||
Period average rate | 1.4715 | 1.3694 | 1.2552 | |||||||
Our strategy for management of currency risk relies primarily on conducting our operations in a country's respective currency and may, from time to time, involve foreign currency derivatives. As of January 3, 2009, we did not have any foreign currency derivatives outstanding.
46
Item 8. Financial Statements and Supplementary Data
The Company's report of independent registered public accounting firm and consolidated financial statements and related notes appear on the following pages of this Annual Report on Form 10-K.
Report of Independent Registered Public Accounting Firm
The Board of Directors and Shareholders
of Polypore International, Inc.
We have audited the accompanying consolidated balance sheets of Polypore International, Inc. as of January 3, 2009 and December 29, 2007, and the related consolidated statements of operations, shareholders' equity, and cash flows for each of the three years in the period ended January 3, 2009. Our audits also included the financial statement schedule listed in the Index at Item 15(a). These financial statements and schedule are the responsibility of the Company's management. Our responsibility is to express an opinion on these financial statements and schedule based on our audits.
We conducted our audits in accordance with the standards of the Public Company Accounting Oversight Board (United States). Those standards require that we plan and perform the audit to obtain reasonable assurance about whether the financial statements are free of material misstatement. An audit includes examining, on a test basis, evidence supporting the amounts and disclosures in the financial statements. An audit also includes assessing the accounting principles used and significant estimates made by management, as well as evaluating the overall financial statement presentation. We believe that our audits provide a reasonable basis for our opinion.
In our opinion, the financial statements referred to above present fairly, in all material respects, the consolidated financial position of Polypore International, Inc. at January 3, 2009 and December 29, 2007, and the consolidated results of its operations and its cash flows for each of the three years in the period ended January 3, 2009, in conformity with U.S. generally accepted accounting principles. Also, in our opinion, the related financial statement schedule, when considered in relation to the basic financial statements taken as a whole, presents fairly in all material respects the information set forth therein.
We also have audited, in accordance with the standards of the Public Company Accounting Oversight Board (United States), Polypore International, Inc.'s internal control over financial reporting as of January 3, 2009, based on criteria established in Internal Control-Integrated Framework issued by the Committee of Sponsoring Organizations of the Treadway Commission and our report dated March 6, 2009 expressed an unqualified opinion thereon.
/s/ ERNST & YOUNG LLP | ||
| Charlotte, North Carolina March 6, 2009 |
47
Report of Independent Registered Public Accounting Firm
The Board of Directors and Shareholders
of Polypore International, Inc.
We have audited Polypore International, Inc.'s internal control over financial reporting as of January 3, 2009, based on criteria established in Internal Control—Integrated Framework issued by the Committee of Sponsoring Organizations of the Treadway Commission (the COSO criteria). Polypore International, Inc.'s management is responsible for maintaining effective internal control over financial reporting, and for its assessment of the effectiveness of internal control over financial reporting included in the accompanying Management's Report on Internal Control Over Financial Reporting. Our responsibility is to express an opinion on the company's internal control over financial reporting based on our audit.
We conducted our audit in accordance with the standards of the Public Company Accounting Oversight Board (United States). Those standards require that we plan and perform the audit to obtain reasonable assurance about whether effective internal control over financial reporting was maintained in all material respects. Our audit included obtaining an understanding of internal control over financial reporting, assessing the risk that a material weakness exists, testing and evaluating the design and operating effectiveness of internal control based on the assessed risk, and performing such other procedures as we considered necessary in the circumstances. We believe that our audit provides a reasonable basis for our opinion.
A company's internal control over financial reporting is a process designed to provide reasonable assurance regarding the reliability of financial reporting and the preparation of financial statements for external purposes in accordance with generally accepted accounting principles. A company's internal control over financial reporting includes those policies and procedures that (1) pertain to the maintenance of records that, in reasonable detail, accurately and fairly reflect the transactions and dispositions of the assets of the company; (2) provide reasonable assurance that transactions are recorded as necessary to permit preparation of financial statements in accordance with generally accepted accounting principles, and that receipts and expenditures of the company are being made only in accordance with authorizations of management and directors of the company; and (3) provide reasonable assurance regarding prevention or timely detection of unauthorized acquisition, use or disposition of the company's assets that could have a material effect on the financial statements.
Because of its inherent limitations, internal control over financial reporting may not prevent or detect misstatements. Also, projections of any evaluation of effectiveness to future periods are subject to the risk that controls may become inadequate because of changes in conditions, or that the degree of compliance with the policies or procedures may deteriorate.
As indicated in the accompanying Management's Report on Internal Control over Financial Reporting, management's assessment of and conclusion on the effectiveness of internal control over financial reporting did not include the internal controls of Microporous Holding Corporation and Yurie-Wide Corporation which are included in the 2008 consolidated financial statements of Polypore International, Inc. and constituted approximately 5.3% and 0.9% of total assets at January 3, 2009, respectively. Our audit of internal control over financial reporting of Polypore International, Inc. also did not include an evaluation of the internal control over financial reporting of Microporous Holding Corporation and Yurie-Wide Corporation, excluded from the scope of Management's assessment.
48
In our opinion, Polypore International, Inc. maintained, in all material respects, effective internal control over financial reporting as of January 3, 2009, based on the COSO criteria.
We also have audited, in accordance with the standards of the Public Company Accounting Oversight Board (United States), the accompanying consolidated balance sheets of Polypore International, Inc. as of January 3, 2009 and December 29, 2007, and the related consolidated statement of operations, shareholders' equity, and cash flows for each of the three years in the period ended January 3, 2009, and our report dated March 6, 2009 expressed an unqualified opinion thereon.
/s/ ERNST & YOUNG LLP | ||
| Charlotte, North Carolina March 6, 2009 |
49
Polypore International, Inc.
Consolidated balance sheets
(in thousands, except share data) | January 3, 2009 | December 29, 2007 | ||||||
|---|---|---|---|---|---|---|---|---|
Assets | ||||||||
Current assets: | ||||||||
Cash and cash equivalents | $ | 83,021 | $ | 54,934 | ||||
Accounts receivable, net | 100,409 | 115,619 | ||||||
Inventories | 70,398 | 64,329 | ||||||
Refundable income taxes | 6,277 | — | ||||||
Deferred income taxes | 1,222 | 1,808 | ||||||
Prepaid and other | 14,275 | 12,665 | ||||||
Total current assets | 275,602 | 249,355 | ||||||
Property, plant and equipment, net | 416,796 | 401,284 | ||||||
Goodwill | 601,564 | 568,784 | ||||||
Intangibles and loan acquisition costs, net | 184,854 | 187,861 | ||||||
Environmental indemnification receivable | 17,389 | 15,640 | ||||||
Other | 2,649 | 6,119 | ||||||
Total assets | $ | 1,498,854 | $ | 1,429,043 | ||||
Liabilities and shareholders' equity | ||||||||
Current liabilities: | ||||||||
Accounts payable | $ | 23,806 | $ | 33,795 | ||||
Accrued liabilities | 58,777 | 50,759 | ||||||
Income taxes payable | — | 424 | ||||||
Current portion of debt | 3,780 | 4,549 | ||||||
Current portion of capital lease obligation | 1,495 | 1,435 | ||||||
Fair value of interest rate swap agreements | 5,477 | — | ||||||
Total current liabilities | 93,335 | 90,962 | ||||||
Debt, less current portion | 796,216 | 813,536 | ||||||
Capital lease obligation, less current portion | 1,824 | 3,319 | ||||||
Pension and postretirement benefits, less current portion | 66,266 | 65,779 | ||||||
Postemployment benefits | 2,425 | 3,673 | ||||||
Environmental reserve, less current portion | 40,484 | 22,627 | ||||||
Deferred income taxes | 78,815 | 74,833 | ||||||
Other | 26,626 | 18,983 | ||||||
Commitments and contingencies | ||||||||
Shareholders' equity: | ||||||||
Preferred stock—15,000,000 shares authorized, no shares issued and outstanding | — | — | ||||||
Common stock, $.01 par value—200,000,000 shares authorized, 44,377,560 and 40,326,537 issued and outstanding at January 3, 2009 and December 29, 2007, respectively | 444 | 403 | ||||||
Paid-in capital | 479,442 | 390,337 | ||||||
Retained deficit | (66,671 | ) | (51,484 | ) | ||||
Accumulated other comprehensive loss | (20,352 | ) | (3,925 | ) | ||||
| 392,863 | 335,331 | |||||||
Total liabilities and shareholders' equity | $ | 1,498,854 | $ | 1,429,043 | ||||
See notes to consolidated financial statements
50
Polypore International, Inc.
Consolidated statements of operations
(in thousands, except per share data) | Year ended January 3, 2009 | Year ended December 29, 2007 | Year ended December 30, 2006 | ||||||||
|---|---|---|---|---|---|---|---|---|---|---|---|
Net sales | $ | 610,530 | $ | 534,667 | $ | 478,156 | |||||
Cost of goods sold | 397,210 | 337,682 | 313,254 | ||||||||
Business interruption insurance recovery | (2,400 | ) | — | — | |||||||
Gross profit | 215,720 | 196,985 | 164,902 | ||||||||
Selling, general and administrative expenses | 108,304 | 93,624 | 87,473 | ||||||||
Business restructuring | 59,887 | (886 | ) | 37,027 | |||||||
Change in accounting principle related to postemployment benefits | — | — | (2,593 | ) | |||||||
Operating income | 47,529 | 104,247 | 42,995 | ||||||||
Other (income) expense: | |||||||||||
Interest expense, net | 60,740 | 80,998 | 92,287 | ||||||||
Costs related to purchase of 10.5% senior discount notes | — | 30,057 | — | ||||||||
Write-off of loan acquisition costs associated with refinancing of senior secured credit facilities | — | 7,173 | — | ||||||||
Foreign currency and other | (2,484 | ) | 1,621 | 3,207 | |||||||
| 58,256 | 119,849 | 95,494 | |||||||||
Loss from continuing operations before income taxes | (10,727 | ) | (15,602 | ) | (52,499 | ) | |||||
Income taxes | 6,820 | (16,049 | ) | (22,942 | ) | ||||||
Income (loss) from continuing operations | (17,547 | ) | 447 | (29,557 | ) | ||||||
Income (loss) from discontinued operations, net of income taxes | 2,360 | 99 | (243 | ) | |||||||
Income (loss) before the cumulative effect of a change in accounting principle | (15,187 | ) | 546 | (29,800 | ) | ||||||
Cumulative effect of a change in accounting principle related to stock compensation, net of income taxes | — | — | 231 | ||||||||
Net income (loss) | $ | (15,187 | ) | $ | 546 | $ | (29,569 | ) | |||
Net income (loss) per share—basic and diluted: | |||||||||||
Continuing operations | $ | (0.41 | ) | $ | 0.02 | $ | (1.17 | ) | |||
Discontinued operations | 0.06 | — | 0.01 | ||||||||
Cumulative effect of a change in accounting principle related to stock compensation, net of income taxes | — | — | 0.01 | ||||||||
Net income (loss) per share | $ | (0.36 | ) | $ | 0.02 | $ | (1.17 | ) | |||
Weighted average shares outstanding: | |||||||||||
Basic | 42,777,531 | 32,942,214 | 25,313,130 | ||||||||
Diluted | 42,777,531 | 33,237,230 | 25,313,130 | ||||||||
See notes to consolidated financial statements
51
Polypore International, Inc.
Consolidated statements of shareholders' equity
(In thousands, except share data) | Shares of Common Stock | Common Stock | Paid-in Capital | Retained Deficit | Accumulated Other Comprehensive Loss | Total | Comprehensive Income (Loss) | |||||||||||||||
|---|---|---|---|---|---|---|---|---|---|---|---|---|---|---|---|---|---|---|---|---|---|---|
Balance at December 31, 2005 | 25,271,252 | $ | 253 | $ | 124,673 | $ | (22,207 | ) | $ | (9,387 | ) | $ | 93,332 | |||||||||
Net loss for the year ended December 30, 2006 | — | — | — | (29,569 | ) | — | (29,569 | ) | $ | (29,569 | ) | |||||||||||
Stock-based compensation | — | — | 162 | — | — | 162 | — | |||||||||||||||
Issuance of common stock | 76,218 | — | 399 | — | — | 399 | — | |||||||||||||||
Foreign currency translation adjustment, net of income tax expense of $0 | — | — | — | — | 6,786 | 6,786 | 6,786 | |||||||||||||||
Additional minimum pension liability, net of income tax benefit of $956 | — | — | — | — | (1,448 | ) | (1,448 | ) | (1,448 | ) | ||||||||||||
Balance at December 30, 2006 | 25,347,470 | 253 | 125,234 | (51,776 | ) | (4,049 | ) | 69,662 | ||||||||||||||
Comprehensive loss for the year ended December 30, 2006 | $ | (24,231 | ) | |||||||||||||||||||
Net income for the year ended December 29, 2007 | — | — | — | 546 | — | 546 | $ | 546 | ||||||||||||||
Initial public offering, net of offering costs | 15,000,000 | 150 | 264,687 | — | — | 264,837 | — | |||||||||||||||
Stock-based compensation | — | — | 706 | — | — | 706 | — | |||||||||||||||
Repurchases of common stock, net of issuances | (20,933 | ) | — | (290 | ) | — | — | (290 | ) | — | ||||||||||||
Cumulative effect of adjustments from the adoption of FIN 48 | — | — | — | (254 | ) | — | (254 | ) | — | |||||||||||||
Adjustment to apply FAS 158, net of income tax benefit of $1,260 | — | — | — | — | (2,920 | ) | (2,920 | ) | — | |||||||||||||
Additional minimum pension liability, net of income tax expense of $2,954 | — | — | — | — | 4,197 | 4,197 | 4,197 | |||||||||||||||
Foreign currency translation adjustment, net of income tax expense of $6,910 | — | — | — | — | (1,153 | ) | (1,153 | ) | (1,153 | ) | ||||||||||||
Balance at December 29, 2007 | 40,326,537 | 403 | 390,337 | (51,484 | ) | (3,925 | ) | 335,331 | ||||||||||||||
Comprehensive income for the year ended December 29, 2007 | $ | 3,590 | ||||||||||||||||||||
Net loss for the year ended January 3, 2009 | — | — | — | (15,187 | ) | — | (15,187 | ) | $ | (15,187 | ) | |||||||||||
Follow-on offering, net of offering costs | 3,750,000 | 38 | 84,809 | — | — | 84,847 | — | |||||||||||||||
Stock-based compensation | — | — | 1,264 | — | — | 1,264 | — | |||||||||||||||
Stock option exercises, net of shares required to satisfy employee tax withholding obligations | 299,379 | 3 | 1,537 | — | — | 1,540 | — | |||||||||||||||
Restricted stock grants | 1,644 | — | — | — | — | — | — | |||||||||||||||
Tax benefit of stock option exercises | — | — | 1,495 | — | — | 1,495 | — | |||||||||||||||
Unrealized loss on interest rate swap, net of income tax benefit of $2,035 | — | — | — | — | (3,442 | ) | (3,442 | ) | (3,442 | ) | ||||||||||||
Change in net actuarial loss and prior service credit, net of income tax benefit of $330 | — | — | — | — | (663 | ) | (663 | ) | (663 | ) | ||||||||||||
Foreign currency translation adjustment, net of income tax benefit of $3,265 | — | — | — | — | (12,322 | ) | (12,322 | ) | (12,322 | ) | ||||||||||||
Balance at January 3, 2009 | 44,377,560 | $ | 444 | $ | 479,442 | $ | (66,671 | ) | $ | (20,352 | ) | $ | 392,863 | |||||||||
Comprehensive loss for the year ended January 3, 2009 | $ | (31,614 | ) | |||||||||||||||||||
See notes to consolidated financial statements
52
Polypore International, Inc.
Consolidated statements of cash flows
(in thousands) | Year ended January 3, 2009 | Year ended December 29, 2007 | Year ended December 30, 2006 | |||||||||
|---|---|---|---|---|---|---|---|---|---|---|---|---|
Operating activities: | ||||||||||||
Net income (loss) | $ | (15,187 | ) | $ | 546 | $ | (29,569 | ) | ||||
Adjustments to reconcile net income (loss) to net cash provided by operating activities: | ||||||||||||
Depreciation expense | 36,459 | 31,344 | 42,512 | |||||||||
Amortization expense | 18,585 | 17,509 | 17,700 | |||||||||
Amortization of loan acquisition costs | 2,587 | 2,793 | 2,994 | |||||||||
Amortization of debt discount | — | 13,297 | 24,336 | |||||||||
Stock compensation | 1,264 | 706 | 532 | |||||||||
Loss on disposal of property, plant and equipment | 1,725 | 1,236 | 1,297 | |||||||||
Foreign currency (gain) loss | (1,859 | ) | 189 | 1,678 | ||||||||
Deferred income taxes | (3,646 | ) | (32,236 | ) | (34,908 | ) | ||||||
Business restructuring | 59,887 | (886 | ) | 37,027 | ||||||||
Gain on sale of synthetic paper business | (3,774 | ) | — | — | ||||||||
Costs related to purchase of 10.50% senior discount notes | — | 30,057 | — | |||||||||
Write-off of loan acquisition costs associated with refinancing of senior secured credit facilities | — | 7,173 | — | |||||||||
Change in accounting principle related to postemployment benefits | — | — | (2,593 | ) | ||||||||
Cumulative effect of a change in accounting principle related to stock compensation | — | — | (370 | ) | ||||||||
Changes in operating assets and liabilities: | ||||||||||||
Accounts receivable | 20,065 | (7,010 | ) | (7,659 | ) | |||||||
Inventories | (5,361 | ) | 8,282 | (2,652 | ) | |||||||
Prepaid and other current assets | (556 | ) | 1,153 | (3,735 | ) | |||||||
Accounts payable and accrued liabilities | (18,562 | ) | (13,895 | ) | (20 | ) | ||||||
Income taxes payable | (885 | ) | 1,901 | (1,025 | ) | |||||||
Other, net | 3,944 | 7,147 | 4,420 | |||||||||
Net cash provided by operating activities | 94,686 | 69,306 | 49,965 | |||||||||
Investing activities: | ||||||||||||
Acquisitions, net of cash acquired | (85,795 | ) | (5,475 | ) | — | |||||||
Purchases of property, plant and equipment, net | (48,013 | ) | (29,775 | ) | (23,912 | ) | ||||||
Proceeds from sale of synthetic paper business | 4,000 | — | — | |||||||||
Net cash used in investing activities | (129,808 | ) | (35,250 | ) | (23,912 | ) | ||||||
Financing activities: | ||||||||||||
Proceeds from issuance of common stock, net of underwriting fees and other offering related costs | 84,847 | 264,837 | — | |||||||||
Proceeds from revolving credit facility | 46,000 | — | — | |||||||||
Payments on revolving credit facility | (46,000 | ) | — | — | ||||||||
Principal payments on debt | (20,670 | ) | (372,611 | ) | (3,433 | ) | ||||||
Proceeds from stock option exercises | 1,540 | — | — | |||||||||
Proceeds from the senior secured credit facility | — | 370,000 | — | |||||||||
Purchase of the 10.50% senior discount notes | — | (293,666 | ) | — | ||||||||
Loan acquisition costs | — | (8,672 | ) | (15 | ) | |||||||
Repurchase of common stock | — | (320 | ) | — | ||||||||
Issuance of common stock | — | 30 | 399 | |||||||||
Net cash provided by (used in) financing activities | 65,717 | (40,402 | ) | (3,049 | ) | |||||||
Effect of exchange rate changes on cash and cash equivalents | (2,508 | ) | 6,568 | 3,648 | ||||||||
Net increase in cash and cash equivalents | 28,087 | 222 | 26,652 | |||||||||
Cash and cash equivalents at beginning of year | 54,934 | 54,712 | 28,060 | |||||||||
Cash and cash equivalents at end of year | $ | 83,021 | $ | 54,934 | $ | 54,712 | ||||||
Supplemental cash flow information | ||||||||||||
Cash paid for interest | $ | 62,380 | $ | 65,444 | $ | 65,944 | ||||||
Cash paid for income taxes | 12,585 | 13,762 | 12,985 | |||||||||
Acquisitions | ||||||||||||
Fair value of assets acquired | $ | 126,380 | $ | 8,972 | $ | — | ||||||
Liabilities assumed and incurred | 40,585 | 3,497 | — | |||||||||
Cash paid | 85,795 | 5,475 | — | |||||||||
See notes to consolidated financial statement
53
Polypore International, Inc.
Notes to consolidated financial statements
1. Description of Business
Polypore International, Inc. (the "Company") is a leading global high technology filtration company that develops, manufactures and markets specialized microporous membranes used in separation and filtration processes. The Company has a global presence in the major geographic markets of North America, South America, Western Europe and Asia.
2. Accounting Policies
Basis of Presentation and Use of Estimates
The accompanying consolidated financial statements of the Company are prepared in accordance with U.S. generally accepted accounting principles and include the accounts of the Company and its subsidiaries. All material intercompany accounts are eliminated in consolidation. The preparation of financial statements in conformity with U.S. generally accepted accounting principles requires management to make estimates and assumptions that affect the amounts reported in the consolidated financial statements and accompanying notes. Actual results could differ from those estimates.
Accounting Period
The Company's fiscal year is the 52 or 53-week period ending the Saturday nearest to December 31. The fiscal year ended January 3, 2009 included 53 weeks. The fiscal years ended December 29, 2007 and December 30, 2006 included 52 weeks.
Revenue Recognition
Revenue from product sales is recognized when a firm sales agreement is in place, delivery of the product has occurred and collectability of the fixed and determinable sales price is reasonably assured. Amounts billed to customers for shipping and handling are recorded in "Net sales" in the accompanying consolidated statements of operations. Shipping and handling costs incurred by the Company for the delivery of goods to customers are included in "Cost of goods sold" in the accompanying consolidated statements of operations. Estimates for sales returns and allowances and product returns are recognized in the period in which the revenue is recorded. Product returns and warranty expenses were not material for all periods presented.
Cash Equivalents
The Company considers all highly liquid investments with a maturity of three months or less when purchased to be cash equivalents.
54
Polypore International, Inc.
Notes to consolidated financial statements (Continued)
2. Accounting Policies (Continued)
Inventories
Inventories are carried at the lower of cost or market using the first-in, first-out method of accounting and consist of:
(in thousands) | January 3, 2009 | December 29, 2007 | |||||
|---|---|---|---|---|---|---|---|
Raw materials | $ | 29,266 | $ | 23,545 | |||
Work-in-process | 12,100 | 11,544 | |||||
Finished goods | 29,032 | 29,240 | |||||
| $ | 70,398 | $ | 64,329 | ||||
Property, Plant and Equipment
Property, plant and equipment are stated at cost. Depreciation is computed for financial reporting purposes on the straight-line method over the estimated useful lives of the related assets. The estimated useful lives for buildings and land improvements range from 20 to 39.5 years and the estimated useful lives for machinery and equipment range from 5 to 15 years.
In accordance with FASB Statement No. 144,Accounting for the Impairment or Disposal of Long-Lived Assets, property, plant and equipment are reviewed for impairment whenever events or changes in circumstances indicate that the carrying amount may not be recoverable. If the sum of the expected undiscounted cash flows is less than the carrying value of the related asset or group of assets, a loss is recognized for the difference between the fair value and carrying value of the asset or group of assets.
Goodwill, Intangible Assets and Loan Acquisition Costs
In accordance with FASB Statement No. 142,Goodwill and Other Intangible Assets, goodwill and indefinite-lived intangible assets are not amortized, but are subject to annual impairment testing unless circumstances dictate more frequent assessments.
Goodwill impairment testing is a two-step process performed at the reporting unit level. The Company's reporting units are at the operating segment level. Step one compares the fair value of the Company's reporting units to their carrying amount. The fair value of the reporting unit is determined using the income approach, corroborated by comparison to market capitalization and key multiples of comparable companies. Under the income approach, the Company determines fair value based on estimated future cash flows of each reporting unit, discounted by an estimated weighted-average cost of capital. If the fair value of the reporting unit is greater than its carrying amount, there is no impairment. If the reporting unit's carrying amount exceeds its fair value, the second step must be completed to measure the amount of impairment, if any. Step two of the goodwill impairment test calculates the implied fair value of the reporting unit's goodwill with the carrying value of its goodwill. If the carrying amount of goodwill exceeds the implied fair value of goodwill, an impairment loss will be recognized in an amount equal to the excess.
The impairment test for indefinite-lived intangible assets consists of a comparison between their fair values and carrying values. If the carrying amounts of indefinite-lived intangible assets exceed their fair values, an impairment loss will be recognized in an amount equal to the sum of any such excesses.
55
Polypore International, Inc.
Notes to consolidated financial statements (Continued)
2. Accounting Policies (Continued)
In accordance with FAS 144, intangible assets with estimable lives are amortized over their respective estimated useful lives using the straight-line method. The useful life of customer relationships is based upon historical customer attrition rates and represents the estimated economic life of those relationships. Loan acquisition costs are amortized over the term of the related debt. Amortization expense for loan acquisition costs is classified as interest expense. Intangible assets with estimable lives are reviewed for impairment whenever events or circumstances indicate that the carrying amount may not be recoverable. If the sum of the expected undiscounted cash flows is less than the carrying value of the related asset or group of assets, a loss is recognized for the difference between the fair value and carrying value of the intangible asset.
Research and Development
The cost of research and development is charged to expense as incurred and is included in "Selling, general and administrative expenses" in the consolidated statements of operations. Research and development expense was $18,167,000, $16,048,000 and $13,135,000 in 2008, 2007 and 2006, respectively.
Stock Based Compensation
On January 1, 2006, the Company adopted FASB Statement No. 123(R),Share-Based Payment ("FAS 123(R)") using the modified prospective transition method, which does not require the restatement of prior periods. Prior to adopting FAS 123(R), the Company accounted for employee share-based compensation using the fair value method under FASB Statement No. 123,Accounting for Stock Based Compensation ("FAS 123"). FAS 123(R) requires forfeitures to be estimated at the time of grant with the estimate revised, if necessary, in subsequent periods if actual forfeitures differ materially from those estimates. Prior to the adoption of FAS 123(R), the Company accounted for forfeitures as they occurred as allowed under FAS 123. The change in accounting for forfeitures under FAS 123(R) resulted in an increase of $231,000 to net income, net of applicable income taxes of $139,000, that was recorded as a cumulative effect of a change in accounting principle in 2006.
Income Taxes
The provision for income taxes and corresponding balance sheet accounts are determined in accordance with FASB Statement No. 109,Accounting for Income Taxes ("FAS 109"). Under FAS 109, deferred tax assets and liabilities are based on temporary differences between the basis of certain assets and liabilities for income tax and financial reporting purposes. A valuation allowance is recognized if it is more likely than not that a portion of the deferred tax assets will not be realized in the future.
On the first day of fiscal 2007, the Company adopted FASB Interpretation No. 48,Accounting for Uncertainty in Income Taxes—an Interpretation of FASB Statement 109 ("FIN 48"), which clarifies the accounting for uncertain tax positions. FIN 48 allows the tax effects from an uncertain tax position to be recognized in the financial statements if the position is more likely than not to be sustained upon audit, based on the technical merits of the position. FIN 48 also provides guidance on derecognition, classification, interest and penalties, accounting in interim periods and disclosure. The Company recognized the cumulative effect of adopting FIN 48 by increasing the existing reserve for uncertain tax positions by $854,000, recording a deferred tax asset of $643,000, decreasing goodwill by $43,000 and decreasing retained earnings by $254,000.
56
Polypore International, Inc.
Notes to consolidated financial statements (Continued)
2. Accounting Policies (Continued)
Foreign Currency Translation
The local currencies of the Company's foreign subsidiaries are the functional currencies in accordance with FASB Statement No. 52,Foreign Currency Translation. Assets and liabilities of the Company's foreign subsidiaries are translated into United States dollars at current exchange rates and resulting translation adjustments are reported in accumulated other comprehensive loss. Income statement amounts are translated at weighted average exchange rates prevailing during the period. Transaction gains and losses are included in the determination of net income.
The Company has euro-denominated senior subordinated notes held in the U.S. that effectively hedge a portion of the Company's net investment in foreign subsidiaries. The translation of euro-denominated notes held in the U.S. resulted in foreign currency gains of $10,950,000 and losses of $22,275,000 recorded in "Accumulated other comprehensive loss" at January 3, 2009 and December 29, 2007, respectively.
Net Income (Loss) Per Share
Basic income (loss) per common share is based on the weighted-average number of common shares outstanding in each year. Diluted income (loss) per common share considers the impact of dilution from stock options and unvested restricted stock shares as measured under the treasury stock method. Potential common shares that would increase net income per share amounts or decrease net loss per share amounts are antidilutive and excluded from the diluted net income (loss) per common share computation.
Accounts Receivable and Concentrations of Credit Risk
Accounts receivable potentially expose the Company to concentrations of credit risk, as defined by FASB Statement No. 105,Disclosure of Information about Financial Instruments with Off-Balance Sheet Risk and Financial Instruments with Concentration of Credit Risk. The Company provides credit in the normal course of business and performs ongoing credit evaluations on certain of its customers' financial condition, but generally does not require collateral to support such receivables. Accounts receivable, net of allowance for doubtful accounts, are carried at cost, which approximates fair value. The Company establishes an allowance for doubtful accounts based upon factors surrounding the credit risk of specific customers, historical trends and other information. The allowance for doubtful accounts was $7,742,000 and $8,812,000 at January 3, 2009 and December 29, 2007, respectively. The Company believes that the allowance for doubtful accounts is adequate to provide for potential losses resulting from uncollectible accounts. The Company charges accounts receivables off against the allowance for doubtful accounts when it deems them to be uncollectible on a specific identification basis. Exide Corporation, a customer of the Company's energy storage segment, accounted for approximately 14%, 15% and 15% of the Company's sales in 2008, 2007 and 2006, respectively.
Derivatives
The Company accounts for derivative instruments in accordance with FASB Statement No. 133,Accounting for Derivatives and Hedging Activity ("FAS 133"). Under FAS 133, all derivative instruments are recorded at fair value on the balance sheet and all changes in fair value are recorded to earnings or to shareholders' equity through other comprehensive income, depending on whether a derivative is
57
Polypore International, Inc.
Notes to consolidated financial statements (Continued)
2. Accounting Policies (Continued)
designated as part of a hedge transaction and the type of hedge transaction. Ineffective portions of hedges, if any, are recognized in current earnings.
From time to time, the Company uses derivative financial instruments to manage interest rate risk and does not use derivatives for trading or speculative purposes. The Company enters into derivative instruments with high credit quality counterparties and has not experienced any credit losses on derivatives. The Company's interest rate derivatives are designated as cash flow hedges of variable rate debt obligations with derivative gains and losses recognized as "Interest expense, net" in the consolidated statements of operations.
Recent Accounting Pronouncements
In September 2006, the FASB issued Statement No. 157,Fair Value Measurement ("FAS 157"), which clarifies the definition of fair value whenever another standard requires or permits assets or liabilities to be measured at fair value, establishes a framework for measuring the fair value of assets and liabilities under generally accepted accounting principles and expands disclosure about fair value measurements. In February 2008, the FASB issued FSP 157-2,Effective Date of SFAS No. 157 ("FSP 157-2"), which delays the effective date of FAS 157 for nonfinancial assets and liabilities to fiscal years beginning after Nov. 15, 2008. In October 2008, the FASB issued FSP No. SFAS 157-3,Determining Fair Value of a Financial Asset in a Market That Is Not Active ("FSP 157-3"), which clarifies the application of FAS 157 when the market for a financial asset is not active. FAS 157-3 was effective upon issuance, including reporting for prior periods for which financial statements have not been issued. The partial adoption of FAS 157 in the first quarter of 2008 did not have a material impact on the consolidated financial statements. The Company is currently evaluating the impact on the consolidated financial statements of adopting the additional requirements of SFAS 157, which were deferred by FSP 157-2.
In September 2006, the FASB issued Statement No. 158,Employers' Accounting for Defined Benefit Pension and Other Postretirement Plans—an amendment of FASB Statements No. 87, 88, 106, and 132(R) ("FAS 158"). FAS 158 requires an employer to recognize the funded status of a defined benefit postretirement plan as an asset or liability in its balance sheet and to recognize changes in that funded status through comprehensive income in the year in which the changes occur. The Company adopted FAS 158 in fiscal 2007. As a result of the adoption, the Company increased its pension and postretirement benefits liabilities by $4,180,000 and its accumulated other comprehensive loss by $2,920,000, net of applicable income taxes.
In February 2007, the FASB issued Statement No. 159,The Fair Value Option for Financial Assets and Financial Liabilities ("FAS 159"). FAS 159 permits entities to choose to measure eligible items at fair value at specified election dates and report unrealized gains and losses on items for which the fair value option has been elected in earnings at each subsequent reporting date. The Company adopted FAS 159 in the first quarter of fiscal 2008. The adoption of FAS 159 did not have a material impact on the consolidated financial statements because the Company has not made any fair value measurement elections.
In December 2007, the FASB issued Statement No. 141(R),Business Combinations—a replacement of FASB Statement No. 141 ("FAS 141(R)"). FAS 141(R) changes the principles and requirements for how the acquirer of a business recognizes and measures in its financial statements the identifiable assets acquired, the liabilities assumed, and any noncontrolling interest in the acquiree. FAS 141(R) also provides guidance for recognizing and measuring the goodwill acquired in the business
58
Polypore International, Inc.
Notes to consolidated financial statements (Continued)
2. Accounting Policies (Continued)
combination and determines what information to disclose to enable users of the financial statements to evaluate the nature and financial effects of the business combination. FAS 141(R) is effective prospectively for fiscal years beginning after December 15, 2008.
In December 2007, the FASB issued Statement No. 160,Noncontrolling Interests in Consolidated Financial Statements ("FAS 160"). FAS 160 establishes accounting and reporting standards for ownership interests in subsidiaries held by parties other than the parent, the amount of consolidated net income attributable to the parent and to the noncontrolling interest, changes in a parent's ownership interest and the valuation of retained noncontrolling equity investments when a subsidiary is deconsolidated. FAS 160 also establishes reporting requirements that provide sufficient disclosures that clearly identify and distinguish between the interests of the parent and the interests of the noncontrolling owners. This standard is effective for fiscal years beginning after December 15, 2008. The Company does not expect the adoption of FAS 160 to have a material impact on its consolidated financial statements.
In March 2008, the FASB issued Statement No. 161,Disclosures about Derivative Instruments and Hedging Activities ("FAS 161"). FAS 161 requires companies with derivative instruments to disclose information about how and why a company uses derivative instruments, how derivative instruments and related hedged items are accounted for under FAS 133 and how derivative instruments and related hedged items affect a company's financial position, financial performance and cash flows. FAS 161 is effective for financial statements issued for fiscal years beginning after November 15, 2008.
In May 2008, the FASB issued Statement No. 162,The Hierarchy of Generally Accepted Accounting Principles ("FAS 162"). FAS 162 identifies the sources of accounting principles and the framework for selecting the principles used in the preparation of financial statements. FAS No. 162 is effective November 15, 2008. The Company does not expect the adoption of FAS 162 to have a material impact on its consolidated financial statements.
3. Issuance of Common Stock
On June 27, 2007, the Company priced its initial public offering of common stock and signed an underwriting agreement, pursuant to which the underwriters agreed to purchase 15,000,000 shares of its common stock on a firm commitment basis at a price of $19.00 per share. Public trading of the Company's common stock commenced on June 28, 2007. The Company received net proceeds from the offering of $264,837,000, net of underwriting fees of $17,100,000 and other offering related costs. The net proceeds from the offering and cash on hand were used to purchase and retire the 10.50% senior discount notes that were outstanding at that time.
In May 2008, the Company completed a follow-on public offering of 8,031,000 shares of common stock at $24.00 per share, pursuant to which 3,750,000 shares were sold by the Company and 4,281,000 shares were sold by certain selling shareholders, including certain of the Company's executive officers. The Company received net proceeds from the offering of $84,847,000, net of underwriting fees of $4,275,000 and other offering related costs. The net proceeds were used to repay outstanding borrowings under the Company's revolving credit facility and for general corporate purposes.
59
Polypore International, Inc.
Notes to consolidated financial statements (Continued)
4. Acquisitions
On February 29, 2008, the Company purchased 100% of the capital stock of Microporous Holding Corporation, the parent company of Microporous Products L.P. ("Microporous"). The acquisition broadens the Company's participation in the deep-cycle industrial battery market, adds to its membrane technology portfolio and product breadth, enhances service to common customers and adds cost-effective production capacity. The purchase price for Microporous stock, including acquisition-related costs, was $26,980,000. The Company also repaid $33,643,000 in indebtedness of Microporous and assumed $14,235,000 of debt. The assumed debt was repaid subsequent to the acquisition. The purchase agreement provides for additional cash payments of up to $1,500,000 in each of the two years following the acquisition and up to $750,000 in the third year following the acquisition, contingent upon the acquired business meeting defined earn-out provisions. The earn-out for fiscal 2008 was estimated to be $1,062,000 and was allocated to goodwill. The Company is currently engaged in discussions with the seller regarding acquisition-related matters that may influence the timing and/or amount of this payment.
On April 1, 2008, the Company acquired the battery separator manufacturing assets of Super-Tech Battery Components Pvt. Ltd., ("Super-Tech") located in Bangalore, India for $1,949,000.
On May 20, 2008, the Company purchased 100% of the capital stock of Yurie-Wide Corporation ("Yurie-Wide"), a South Korean company, for $23,223,000, including acquisition-related costs. The acquisition broadens the Company's participation in the lithium battery separator market, adds to its membrane technology portfolio and product breadth and adds cost-effective production capacity.
The results of operations from the acquisitions described above are included in the Company's energy storage segment from the date of acquisition. The Company accounts for acquisitions in conformity with FASB Statement No. 141,Business Combinations, and FASB Statement No. 142,Goodwill and Other Intangible Assets. The following table summarizes the aggregate preliminary purchase price allocations for these acquisitions based upon the fair values of the assets acquired and liabilities assumed at the date of acquisition.
(in thousands) | | ||||
|---|---|---|---|---|---|
Current assets | $ | 16,374 | |||
Property, plant and equipment | 58,807 | ||||
Intangible assets | 19,194 | ||||
Goodwill | 32,005 | ||||
Total assets acquired | 126,380 | ||||
Current liabilities | 8,767 | ||||
Debt assumed | 14,235 | ||||
Deferred taxes and other liabilities | 17,583 | ||||
Total liabilities assumed | 40,585 | ||||
Net assets acquired | $ | 85,795 | |||
The excess of the purchase price over the fair value of the net assets acquired was allocated to goodwill. The goodwill is not deductible for income tax purposes.
60
Polypore International, Inc.
Notes to consolidated financial statements (Continued)
4. Acquisitions (Continued)
Pro forma information is not presented because the impact of these acquisitions, either individually or in the aggregate, on the Company's consolidated results of operations for the year ended January 3, 2009 is not considered to be significant.
Effective January 1, 2007, the Company purchased from Nippon Sheet Glass Company, Limited ("NSG") a 60% share in Daramic NSG Tianjin PE Separator Co., LTD ("DNPET") for $5,475,000, including acquisition-related costs. DNPET is a lead-acid battery separator manufacturing facility located in Tianjin, China. The acquisition supports the Company's strategy of expanding capacity in the high growth Asia-Pacific region. The excess of the purchase price over the fair value of the net assets acquired was $1,240,000 and was allocated to goodwill. Beginning January 1, 2007, DNPET's assets, liabilities, results of operations and cash flows are consolidated with those of the Company and NSG's interest in DNPET is included in the Company's consolidated balance sheet as minority interest within other liabilities. The Company is entitled to all of the earnings and cash flow from DNPET for the first two years and beginning in fiscal 2009, earnings and cash flows will be allocated based on ownership percentages. Under the original terms of the agreement, on January 1, 2009 and January 1, 2012, the Company can exercise a call option and NSG can exercise a put option for the Company to purchase NSG's 40% ownership interest for $3,600,000. The Company and NSG agreed to extend the first option date to July 1, 2009. DNPET is included in the Company's energy storage segment.
5. Property, Plant and Equipment
Property, plant and equipment consist of:
(in thousands) | January 3, 2009 | December 29, 2007 | |||||
|---|---|---|---|---|---|---|---|
Land | $ | 18,689 | $ | 17,850 | |||
Buildings and land improvements | 123,799 | 114,843 | |||||
Machinery and equipment | 402,677 | 370,122 | |||||
Construction in progress | 14,733 | 20,869 | |||||
| 559,898 | 523,684 | ||||||
Less accumulated depreciation | 143,102 | 122,400 | |||||
| $ | 416,796 | $ | 401,284 | ||||
61
Polypore International, Inc.
Notes to consolidated financial statements (Continued)
6. Intangibles, Loan Acquisition and Other Costs
Intangibles, loan acquisition and other costs consist of:
| | | January 3, 2009 | December 29, 2007 | ||||||||||||||
|---|---|---|---|---|---|---|---|---|---|---|---|---|---|---|---|---|---|
(in thousands) | Weighted Average Life (years) | Gross Carrying Amount | Accumulated Amortization | Gross Carrying Amount | Accumulated Amortization | ||||||||||||
Intangible and other assets subject to amortization: | |||||||||||||||||
Customer relationships | 18 | $ | 194,187 | $ | 52,220 | $ | 181,236 | $ | 40,861 | ||||||||
Technology and patents | 9 | 42,371 | 22,798 | 38,828 | 18,188 | ||||||||||||
Loan acquisition costs | 7 | 19,087 | 8,133 | 19,087 | 5,546 | ||||||||||||
Supply agreement | 5 | 9,070 | 8,869 | 9,070 | 6,968 | ||||||||||||
Trade names | 15 | 978 | 22 | — | — | ||||||||||||
Intangible assets not subject to amortization: | |||||||||||||||||
Trade names | Indefinite | 11,203 | — | 11,203 | — | ||||||||||||
| $ | 276,896 | $ | 92,042 | $ | 259,424 | $ | 71,563 | ||||||||||
Amortization expense, including amortization of loan acquisition costs classified as interest expense, was $21,172,000 in 2008, $20,302,000 in 2007 and $20,694,000 in 2006. The Company's estimate of amortization expense for the five succeeding years is as follows:
(in thousands) | | |||
|---|---|---|---|---|
2009 | $ | 19,062 | ||
2010 | 18,817 | |||
2011 | 18,692 | |||
2012 | 14,561 | |||
2013 | 12,838 | |||
7. Goodwill
The changes in carrying amount of goodwill during were as follows:
(in thousands) | Energy Storage | Separations Media | Total | |||||||
|---|---|---|---|---|---|---|---|---|---|---|
Balance as of December 30, 2006 | $ | 356,173 | $ | 211,414 | $ | 567,587 | ||||
Acquisition | 1,240 | — | 1,240 | |||||||
Adoption of FIN 48 | (43 | ) | — | (43 | ) | |||||
Balance as of December 29, 2007 | 357,370 | 211,414 | 568,784 | |||||||
Acquisitions | 32,005 | — | 32,005 | |||||||
Income tax adjustments | (90 | ) | 865 | 775 | ||||||
Balance as of January 3, 2009 | $ | 389,285 | $ | 212,279 | $ | 601,564 | ||||
62
Notes to consolidated financial statements (Continued)
7. Goodwill (Continued)
The Company performs its annual impairment assessment as of the first day of the fourth quarter of each fiscal year. Based on the step one analysis performed, the Company determined that the fair value of its reporting units exceeded the carrying amount and there was no impairment of goodwill as of September 28, 2008.
During the fourth quarter of 2008, the Company experienced a significant decline in its stock price, resulting in a reduction in the market capitalization. At January 3, 2009, the Company's market capitalization approximated its book value. As a result of the decline in stock price, the Company updated its annual impairment test for goodwill as of January 3, 2009. In preparing the step one analysis, future cash flows were based on the Company's most recent budget and, for years beyond the budget, the Company's estimates based on assumed growth rates. The determination of the discount rate was based on a weighted average cost of capital using a risk-free rate adjusted by a stock-beta-adjusted risk premium and a size premium. Additionally, the aggregate estimated fair value of the reporting units, determined with the use of the income approach model, was compared with the Company's market capitalization and tested for reasonableness using the market approach, including key multiples of comparable companies. In considering Polypore's market capitalization, an estimated premium to reflect the fair value on a control basis was applied. This premium was estimated based on an evaluation of control premiums identifiable in comparable transactions. Based on the step one analysis performed, the Company determined that the fair value of its reporting units exceeded the carrying amount and there was no impairment of goodwill as of January 3, 2009.
Determining the fair value of a reporting unit is judgmental in nature and requires the use of significant estimates and assumptions, including revenue growth rates, operating margins, discount rates, strategic plans and future market conditions, among others. If the Company's assumptions regarding forecasted revenue or margin growth rates of certain reporting units are not achieved, or changes in strategy or market conditions occur, the Company may be required to record goodwill impairment charges in future periods. It is not possible at this time to determine if any such future impairment charge would result or, if it does, whether such charge would be material.
8. Accrued Liabilities
Accrued liabilities consist of:
(in thousands) | January 3, 2009 | December 29, 2007 | |||||
|---|---|---|---|---|---|---|---|
Compensation expense and other fringe benefits | $ | 21,447 | $ | 21,184 | |||
Current portion of environmental reserve | 8,736 | 6,526 | |||||
Accrued interest | 5,291 | 6,749 | |||||
Current portion of business restructuring | 3,932 | 2,060 | |||||
Taxes other than income | 2,374 | 1,500 | |||||
Other | 16,997 | 12,740 | |||||
| $ | 58,777 | $ | 50,759 | ||||
63
Polypore International, Inc.
Notes to consolidated financial statements (Continued)
9. Debt
Debt, in order of priority, consists of:
(in thousands) | January 3, 2009 | December 29, 2007 | ||||||
|---|---|---|---|---|---|---|---|---|
Senior credit facilities: | ||||||||
Revolving credit facility | $ | — | $ | — | ||||
Term loan facilities | 366,057 | 373,122 | ||||||
8.75% senior subordinated notes | 433,875 | 444,825 | ||||||
Other | 64 | 138 | ||||||
| 799,996 | 818,085 | |||||||
Less current maturities | 3,780 | 4,549 | ||||||
Long-term debt | $ | 796,216 | $ | 813,536 | ||||
On July 3, 2007, the Company refinanced the senior secured credit facility with a new senior secured credit facility. The new credit facility provides for a $322,894,000 term loan facility and a €35,000,000 term loan facility and a $90,000,000 revolving credit facility. At January 3, 2009, the Company had $87,349,000 of borrowings available under the revolving credit facility ($90,000,000 revolving credit facility less $2,651,000 of undrawn standby letters of credit). Interest rates under the senior secured credit facilities are, at the Company's option, equal to either an alternate base rate plus a 1.00% margin or the Eurocurrency base rate plus a 2.00% margin. The senior secured credit facility is subject to limitations on capital spending and, when loans are outstanding under the revolving credit facility, a maximum net senior leverage ratio. The Company capitalized loan acquisition costs of $8,672,000 in connection with the refinancing and wrote-off loan acquisition costs of $7,173,000 associated with the previous senior secured credit facility.
The Company's domestic subsidiaries guarantee indebtedness under the credit agreement. Substantially all assets of Polypore International, Inc. and its domestic subsidiaries and a first priority pledge of 66% of the voting capital stock of its foreign subsidiaries secure indebtedness under the credit agreement. The Company's ability to pay dividends on its common stock is limited under the terms of the credit agreement.
In 2004, the Company issued $225,000,000 8.75% senior subordinated dollar notes due 2012 and €150,000,000 8.75% senior subordinated euro notes due 2012. Interest is payable semi-annually on May 15 and November 15. The notes are subordinated to all of the Company's existing and future senior debt and will rank senior to any future subordinated debt. The Company's domestic subsidiaries, subject to certain exceptions, guarantee the notes.
In 2004, the Company issued 10.5% senior discount notes due 2012. In July 2007, the Company used the proceeds from the initial public offering and cash on hand to purchase and retire the 10.5% senior discount notes. The purchase of the notes was accomplished by a tender offer and subsequent redemption of the notes not tendered. The total purchase price for the notes was $293,666,000, consisting of principal of $264,144,000 and tender and redemption premiums of $29,522,000. As a result of the purchase of the notes, the Company incurred a $30,057,000 charge to income, consists of redemption and tender premiums of $29,522,000 and the write-off of unamortized loan acquisition costs of $535,000.
64
Polypore International, Inc.
Notes to consolidated financial statements (Continued)
9. Debt (Continued)
Minimum scheduled principal repayments of debt are as follows:
(in thousands) | | |||
|---|---|---|---|---|
2009 | $ | 3,780 | ||
2010 | 3,716 | |||
2011 | 3,716 | |||
2012 | 437,591 | |||
2013 | 3,716 | |||
Thereafter | 347,477 | |||
| $ | 799,996 | |||
As stated in the credit agreement, the term loans mature in July 2014 and the revolving credit facility matures in July 2013. The 8.75% senior subordinated notes mature on May 15, 2012. Because the senior subordinated notes are subordinated to the senior secured credit facility, if any amounts are outstanding under the senior subordinated notes at February 1, 2012, the maturity dates for the term loans and the revolving credit facility will be accelerated to February 1, 2012.
In January 2008, the Company entered into two interest rate swap agreements with notional principal amounts totaling $250,000,000. The swap agreement with a notional amount of $50,000,000 effectively fixes the interest rate on that amount of term debt at 5.58% and expires on June 30, 2009. The swap agreement with a notional amount of $200,000,000 effectively fixes the interest rate on that amount of term debt at 5.54% and expires on December 31, 2009.The swap agreements are accounted for under FAS 133. In accordance with FAS 133, the Company designated these swap agreements as cash flow hedges with changes in fair value, net of income taxes, recorded to "Accumulated other comprehensive loss" in the accompanying balance sheet. In fiscal 2008, the Company recognized additional interest expense of $1,015,000, representing the difference between the fixed interest rate on the swaps and the variable interest rate on the term debt.
10. Fair Value of Financial Instruments
The Company's financial instruments include cash and cash equivalents, accounts receivable, accounts payable, accrued liabilities, interest rate swaps and long-term debt. The carrying value of cash and cash equivalents, accounts receivable, accounts payable and accrued liabilities approximates their fair value due to the short-term maturities of these assets and liabilities. The carrying amount of borrowings under the senior secured credit facilities approximates fair value because the interest rate adjusts to market interest rates. The fair value of the 8.75% senior subordinated notes, based on a quoted market price, was $276,881,000 at January 3, 2009.
The Company measures the fair value of the interest rate swap agreements on a recurring basis. FAS 157 establishes a three-tier value hierarchy, which prioritizes the inputs used in measuring fair value as follows:
- •
- Level One: observable inputs such as quoted prices in active markets,
- •
- Level Two: inputs other than the quoted prices in active markets that are observable either directly or indirectly, and
- •
- Level Three: unobservable inputs in which there is little or no market data, which requires the Company to develop its own assumptions.
65
Polypore International, Inc.
Notes to consolidated financial statements (Continued)
10. Fair Value of Financial Instruments (Continued)
This hierarchy requires the Company to use observable market data, when available, and to minimize the use of unobservable inputs when determining fair value.
At January 3, 2009, the fair value of the interest rate swap agreements was $5,477,000. The fair value of the swap agreements was determined within level two of the fair value hierarchy under a market approach model using the notional amount of the interest rate swap agreements multiplied by the observable inputs of time to maturity, interest rates and credit spreads.
11. Commitments and Contingencies
Leases
The Company leases certain equipment and facilities under operating leases. Rent expense was $1,534,000, $1,262,000 and $1,877,000 in 2008, 2007 and 2006, respectively.
The Company leases certain machinery and equipment under a capital lease agreement. The capital lease agreement expires in February 2011 and has an early buyout option in October 2009. Assets recorded under the capital lease are included in property, plant and equipment. At January 3, 2009 and December 29, 2007, the cost of assets under the capital lease agreement was $8,823,000 and accumulated depreciation was $5,882,000 and $4,470,000, respectively. Amortization of assets under the capital lease is included in depreciation expense.
Future minimum capital and operating lease payments at January 3, 2009 are:
(in thousands) | Capital Leases | Operating Leases | |||||
|---|---|---|---|---|---|---|---|
2009 | $ | 1,604 | $ | 1,434 | |||
2010 | 1,604 | 1,125 | |||||
2011 | 268 | 981 | |||||
2012 | — | 443 | |||||
2013 | — | 361 | |||||
| 3,476 | $ | 4,344 | |||||
Less amounts representing interest | 157 | ||||||
Present value of minimum lease payments | 3,319 | ||||||
Less current portion | 1,495 | ||||||
Capital lease obligation, less current portion | $ | 1,824 | |||||
Raw Materials
The Company employs a global purchasing strategy to achieve pricing leverage on its purchases of major raw materials. Accordingly, the Company purchases the majority of each type of raw material from one primary supplier with additional suppliers having been qualified to supply the Company if an interruption in supply were to occur. The Company believes that alternative sources of raw materials are readily available and the loss of any particular supplier would not have a material impact on the results of operations. However, the loss of raw material supply sources could, in the short term, adversely affect the Company's business until alternative supply arrangements were secured.
66
Polypore International, Inc.
Notes to consolidated financial statements (Continued)
11. Commitments and Contingencies (Continued)
Collective Bargaining Agreements
Approximately 40% of the Company's employees are represented under collective bargaining agreements. A majority of those employees are located in Germany and France and are represented under industry-wide agreements that are subject to national and local government regulations. Labor unions also represent our employees in Owensboro, Kentucky and Corydon, Indiana. On August 6, 2008, the union at the Company's lead-acid battery separator facility in Owensboro, Kentucky initiated a strike. On September 26, 2008, the Company and the union agreed to an extension of the current labor contract and employees returned to work. On December 30, 2008 the Company and the union agreed to a new labor contract that expires on April 1, 2012.
FTC Complaint
On April 7, 2008, the Company and its wholly-owned subsidiary, Daramic LLC, received a document subpoena and interrogatories from the Federal Trade Commission (the "FTC") regarding the acquisition of Microporous. The Company responded fully to this request and met on several occasions with various members of the FTC staff in an effort to answer their questions and resolve the investigation. On September 9, 2008, the FTC issued an administrative complaint against the Company alleging that its actions and the acquisition of Microporous have substantially lessened competition in North American markets for lead-acid battery separators. The Company filed an answer to the complaint on October 15, 2008 denying the material allegations of the complaint. Proceedings will be held before an Administrative Law Judge of the FTC with an initial hearing currently scheduled to begin on May 12, 2009. The timing of a final resolution of this matter is uncertain. The Company cannot predict the outcome of the investigation at this time and does not believe that the final resolution of this matter will have a material adverse impact on the business, financial condition or results of operations of the Company. The costs associated with this complaint for fiscal 2008 were $2,646,000 and are included in selling, general and administrative costs.
Other
The Company is from time to time subject to various claims and other matters arising out of the normal conduct of business. The amount recorded for identified contingent liabilities is based on estimates. Amounts recorded are reviewed periodically and adjusted to reflect additional information that becomes available. Actual costs to be incurred in future periods may vary from the estimates, given the inherent uncertainties in evaluating certain exposures. Subject to the imprecision in estimating future contingent liability costs, the Company believes that based on present information, it is unlikely that a liability, if any, exists that would have a materially adverse effect on the consolidated operating results, financial position or cash flows of the Company.
67
Polypore International, Inc.
Notes to consolidated financial statements (Continued)
12. Income Taxes
Significant components of deferred tax assets and liabilities consist of:
(in thousands) | January 3, 2009 | December 29, 2007 | ||||||
|---|---|---|---|---|---|---|---|---|
Deferred tax assets: | ||||||||
Pension and postretirement benefits | $ | 18,414 | $ | 18,222 | ||||
Foreign tax credits | 1,850 | 1,850 | ||||||
State tax credits | 1,642 | 1,751 | ||||||
Net operating loss carryforwards | 41,171 | 44,211 | ||||||
Environmental reserve | 7,856 | 3,522 | ||||||
Other | 9,753 | 5,836 | ||||||
Total deferred tax assets | 80,686 | 75,392 | ||||||
Valuation allowance | (15,423 | ) | (6,050 | ) | ||||
Net deferred tax assets | 65,263 | 69,342 | ||||||
Deferred tax liabilities: | ||||||||
Property, plant and equipment | (75,849 | ) | (81,778 | ) | ||||
Goodwill and intangibles | (61,983 | ) | (54,003 | ) | ||||
Other | (5,024 | ) | (6,586 | ) | ||||
Total deferred tax liabilities | (142,856 | ) | (142,367 | ) | ||||
Net deferred taxes | $ | (77,593 | ) | $ | (73,025 | ) | ||
In 2008, the valuation allowance increased by $9,373,000. The increase is primarily attributable to the restructuring charge in Potenza, Italy, the benefit of which may never be realized since the Company will no longer have operations in Italy, partially offset by the reversal of a portion of the allowance relating to net operating losses in Austria which the Company believes it will realize as a result of the Microporous acquisition.
The Company had the following uncertain tax positions:
(in thousands) | January 3, 2009 | December 29, 2007 | |||||
|---|---|---|---|---|---|---|---|
Balance at beginning of the year | $ | 11,308 | $ | 8,703 | |||
Increase related to current year positions | 2,533 | 2,401 | |||||
Increase related to prior year positions | 97 | 71 | |||||
Decrease related to settlements with taxing authorities | (5,797 | ) | — | ||||
Other | (101 | ) | 133 | ||||
Balance at end of the year | $ | 8,040 | $ | 11,308 | |||
The Company recognizes accrued interest and penalties related to uncertain tax positions as a component of income tax expense in its financial statements. As of January 3, 2009 and December 29, 2007, the Company had accrued $336,000 and $485,000, respectively, for the potential payment of penalties and interest.
68
Polypore International, Inc.
Notes to consolidated financial statements (Continued)
12. Income Taxes (Continued)
The Company has operations in North America, Europe and Asia and files tax returns in numerous tax jurisdictions. The Company is not subject to income tax adjustments in the U.S. for tax years before 2005 and in foreign jurisdictions for tax years prior to 2000.
During 2008, the U.S. tax authority substantially completed its audit of the Company's Federal income tax returns for tax years 2003 and 2004. In accordance with FIN 48, the Company reclassified $5,484,000 from its FIN 48 reserve (included in "Other" non-current liabilities in the accompanying balance sheet) to non-current deferred income tax liabilities to reflect the effective settlement of tax issues in these tax years.
The German tax authority has informed the Company that they will audit the 2001, 2002 and 2003 tax years of one of the Company's German subsidiaries. In addition, audits are being conducted on the Company's subsidiaries in Austria and Italy for the 2005 and 2006 tax years, respectively. Although the outcome of tax audits is uncertain, management believes that adequate provisions for income taxes have been made for potential liabilities resulting from such matters. Because audit outcomes and the timing of audit settlements are subject to significant uncertainty, the Company cannot make a reasonable estimate of the impact on earnings in the next twelve months from these audits. Management is not aware of any issues for open tax years that upon final resolution will have a material adverse effect on the Company's consolidated results of operations, cash flows or financial position.
At January 3, 2009, the Company has net operating loss carryforwards in the United States of $91,986,000 that expire beginning in 2026. During 2008, the Company utilized $14,264,000 of the U.S. net operating loss carryforwards. The Company has total German net operating loss carryforwards of $18,124,000. During 2008 and 2007, the Company utilized $14,944,000 and $17,100,000, respectively, of the German net operating loss carryforwards. The carryforwards in Germany do not expire but are subject to certain limitations in their use. The Company has net operating loss carryforwards in Austria of $7,392,000 that do not expire but are subject to certain limitations in their use.
Deferred taxes are reflected in the consolidated balance sheet as follows:
(in thousands) | January 3, 2009 | December 29, 2007 | |||||
|---|---|---|---|---|---|---|---|
Current deferred tax asset | $ | 1,222 | $ | 1,808 | |||
Non-current deferred tax liability | (78,815 | ) | (74,833 | ) | |||
Net deferred taxes | $ | (77,593 | ) | $ | (73,025 | ) | |
Loss from continuing operations before income taxes includes the following components:
| | Year Ended | |||||||||
|---|---|---|---|---|---|---|---|---|---|---|
(in thousands) | January 3, 2009 | December 29, 2007 | December 30, 2006 | |||||||
United States | $ | 4,610 | $ | (59,902 | ) | $ | (39,247 | ) | ||
Foreign | (15,337 | ) | 44,300 | (13,252 | ) | |||||
| $ | (10,727 | ) | $ | (15,602 | ) | $ | (52,499 | ) | ||
69
Polypore International, Inc.
Notes to consolidated financial statements (Continued)
12. Income Taxes (Continued)
Income tax expense (benefit) from continuing operations consists of:
| | Year Ended | ||||||||||
|---|---|---|---|---|---|---|---|---|---|---|---|
(in thousands) | January 3, 2009 | December 29, 2007 | December 30, 2006 | ||||||||
Current: | |||||||||||
U.S. taxes on domestic income | $ | 850 | $ | 2,592 | $ | 1,631 | |||||
Foreign taxes | 11,010 | 13,615 | 10,329 | ||||||||
Total current | 11,860 | 16,207 | 11,960 | ||||||||
Deferred: | |||||||||||
U.S. taxes on domestic income | 1,813 | (22,232 | ) | (14,486 | ) | ||||||
Foreign taxes | (6,853 | ) | (10,024 | ) | (20,416 | ) | |||||
Total deferred | (5,040 | ) | (32,256 | ) | (34,902 | ) | |||||
| $ | 6,820 | $ | (16,049 | ) | $ | (22,942 | ) | ||||
Income taxes on continuing operations at the Company's effective tax rate differed from income taxes at the statutory rate as follows:
| | Year Ended | |||||||||
|---|---|---|---|---|---|---|---|---|---|---|
(in thousands) | January 3, 2009 | December 29, 2007 | December 30, 2006 | |||||||
Computed income taxes at the expected statutory rate | $ | (3,754 | ) | $ | (5,465 | ) | $ | (18,375 | ) | |
State and local taxes | 182 | (1,337 | ) | (1,525 | ) | |||||
Foreign taxes | (2,081 | ) | (3,439 | ) | (5,738 | ) | ||||
Changes in tax laws | — | (8,529 | ) | — | ||||||
Valuation allowance | 9,866 | (150 | ) | 2,163 | ||||||
Provision for uncertain tax positions | 2,407 | 2,605 | 1,235 | |||||||
Other | 200 | 266 | (702 | ) | ||||||
Income tax expense (benefit) | $ | 6,820 | $ | (16,049 | ) | $ | (22,942 | ) | ||
Taxes have been provided on earnings distributed and expected to be distributed by the Company's foreign subsidiaries. All other foreign earnings are undistributed and considered to be indefinitely reinvested and, accordingly, no provision for U.S. Federal and state income taxes has been provided thereon. Upon distribution of those earnings in the form of dividends or otherwise, the Company would be subject to both U.S. income taxes and withholding taxes payable to the various foreign countries. Determination of the amount of unrecognized deferred U.S. income tax liability is not practicable because of the complexities associated with its hypothetical calculations; however, unrecognized foreign tax credit carryforwards would be available to reduce some portion of the U.S. liability.
The Company has entered into an agreement with the Board of Investment in Thailand under which the Company's Thailand subsidiary is exempt from that country's corporate income tax on income derived from manufacturing activities. Subject to certain limitations, this agreement provides for 100% of the Company's income from manufacturing activities in Thailand to be tax-free through 2010 and portions of income to be tax-free for another five years. The income tax benefits recognized from this tax holiday were $1,969,000, $1,700,000 and $1,300,000 in 2008, 2007 and 2006, respectively.
70
Notes to consolidated financial statements (Continued)
13. Employee Benefit Plans
Pension and Other Postretirement Benefits
The Company and its subsidiaries sponsor multiple defined benefit pension plans and an other postretirement benefit plan. The Company's pension plans are based in subsidiaries located outside of the United States. The following table sets forth the funded status of the defined benefit pension plans and the postretirement plan.
| | Pension Plans | Other Postretirement Benefits | |||||||||||
|---|---|---|---|---|---|---|---|---|---|---|---|---|---|
(in thousands) | January 3, 2009 | December 29, 2007 | January 3, 2009 | December 29, 2007 | |||||||||
Change in Benefit Obligation | |||||||||||||
Benefit obligation at beginning of year | $ | (88,743 | ) | $ | (85,706 | ) | $ | (2,162 | ) | $ | (1,926 | ) | |
Service cost | (2,344 | ) | (2,171 | ) | (15 | ) | (67 | ) | |||||
Interest cost | (4,433 | ) | (3,865 | ) | (119 | ) | (135 | ) | |||||
Participant contributions | — | — | (37 | ) | (38 | ) | |||||||
Actuarial gain (loss) | 1,672 | 8,176 | (121 | ) | (359 | ) | |||||||
Benefit payments | 2,941 | 2,273 | 222 | 363 | |||||||||
Settlements | — | 59 | — | — | |||||||||
Curtailments | — | 635 | — | — | |||||||||
Plan amendments | (550 | ) | 1,067 | — | — | ||||||||
Foreign currency translation and other | 2,623 | (9,211 | ) | 51 | — | ||||||||
Benefit obligation at end of year | (88,834 | ) | (88,743 | ) | (2,181 | ) | (2,162 | ) | |||||
Change in Plan Assets | |||||||||||||
Fair value of plan assets at beginning of year | 23,915 | 21,401 | — | — | |||||||||
Actual return on plan assets | (1,817 | ) | 261 | — | — | ||||||||
Company contributions | 2,278 | 2,165 | 185 | 325 | |||||||||
Participant contributions | — | — | 37 | 38 | |||||||||
Benefit payments | (2,941 | ) | (2,273 | ) | (222 | ) | (363 | ) | |||||
Settlements | — | (59 | ) | — | — | ||||||||
Foreign currency translation and other | (265 | ) | 2,420 | — | — | ||||||||
Fair value of plan assets at end of year | 21,170 | 23,915 | — | — | |||||||||
Funded status at end of year | $ | (67,664 | ) | $ | (64,828 | ) | $ | (2,181 | ) | $ | (2,162 | ) | |
Amounts recognized in the consolidated balance sheet consist of: | |||||||||||||
Accrued liabilities | $ | (3,388 | ) | $ | (1,016 | ) | $ | (191 | ) | $ | (195 | ) | |
Pension and postretirement benefits liabilities | (64,276 | ) | (63,812 | ) | (1,990 | ) | (1,967 | ) | |||||
Net amount recognized | $ | (67,664 | ) | $ | (64,828 | ) | $ | (2,181 | ) | $ | (2,162 | ) | |
Amounts recognized in accumulated other comprehensive loss (pre-tax) consist of: | |||||||||||||
Net actuarial loss | $ | 6,450 | $ | 6,230 | $ | 142 | $ | 20 | |||||
Prior service credit | (409 | ) | (1,060 | ) | — | — | |||||||
Net amount recognized | $ | 6,041 | $ | 5,170 | $ | 142 | $ | 20 | |||||
The accumulated benefit obligation for all defined benefit pension plans was $85,997,000 and $81,942,000 at January 3, 2009 and December 29, 2007, respectively. Each of the Company's defined benefit pension plans had accumulated benefit obligations in excess of plan assets at January 3, 2009.
71
Polypore International, Inc.
Notes to consolidated financial statements (Continued)
13. Employee Benefit Plans (Continued)
The following table provides the components of net periodic benefit cost:
| | Pension Plans | |||||||||
|---|---|---|---|---|---|---|---|---|---|---|
| | Year ended | |||||||||
(in thousands) | January 3, 2009 | December 29, 2007 | December 30, 2006 | |||||||
Service cost | $ | 2,344 | $ | 2,171 | $ | 2,981 | ||||
Interest cost | 4,433 | 3,865 | 3,180 | |||||||
Expected return on plan assets | (993 | ) | (1,033 | ) | (75 | ) | ||||
Amortization of prior service cost | (82 | ) | (76 | ) | 16 | |||||
Recognized net actuarial loss | 851 | 404 | 343 | |||||||
Settlement gain, net | — | (59 | ) | (944 | ) | |||||
Curtailment gain | — | (461 | ) | — | ||||||
Net periodic benefit cost | $ | 6,553 | $ | 4,811 | $ | 5,501 | ||||
| | Other Postretirement Benefits | |||||||||
|---|---|---|---|---|---|---|---|---|---|---|
| | Year ended | |||||||||
(in thousands) | January 3, 2009 | December 29, 2007 | December 30, 2006 | |||||||
Service cost | $ | 15 | $ | 67 | $ | 34 | ||||
Interest cost | 119 | 135 | 111 | |||||||
Recognized net actuarial loss | — | 18 | — | |||||||
Net periodic benefit cost | $ | 134 | $ | 220 | $ | 145 | ||||
Weighted average assumptions used to determine the benefit obligation and net periodic benefit costs consist of:
| | Pension Plans | Other Postretirement Benefits | |||||||||||
|---|---|---|---|---|---|---|---|---|---|---|---|---|---|
Weighted average assumptions as of the end of year | January 3, 2009 | December 29, 2007 | January 3, 2009 | December 29, 2007 | |||||||||
Discount rate used to determine the benefit obligation | 5.70 | % | 5.25 | % | 6.25 | % | 6.00 | % | |||||
Discount rate used to determine the net periodic benefit costs | 5.26 | % | 4.40 | % | 6.00 | % | 5.75 | % | |||||
Expected return on plan assets | 4.97 | % | 5.00 | % | N/A | N/A | |||||||
Rate of compensation increase | 2.52 | % | 2.00 | % | N/A | N/A | |||||||
The Company's pension plan assets are invested to obtain a reasonable long-term rate of return at an acceptable level of investment risk. Risk tolerance is established through consideration of plan liabilities, plan funded status and corporate financial condition. Investment risk is measured and monitored on an ongoing basis through periodic investment portfolio reviews, liability measurements and asset/liability studies. The Company's expected return on plan assets is based on historical market data for each asset class. The assets in the pension plans are diversified across equity and fixed income investments, except for certain pension plans funded by insurance contracts. The investment portfolio has target allocations of approximately 23% equity and 77% fixed income (including insurance
72
Polypore International, Inc.
Notes to consolidated financial statements (Continued)
13. Employee Benefit Plans (Continued)
contracts). At January 3, 2009, the actual portfolio allocations were 17% equity, 62% bonds and 21% insurance contracts.
The estimated amounts that will be amortized from accumulated other comprehensive loss into net periodic benefit costs during 2009 are as follows:
(in thousands) | Pension Plans | |||
|---|---|---|---|---|
Net actuarial gain | $ | (15 | ) | |
Prior service credit | (54 | ) | ||
| $ | (69 | ) | ||
The weighted-average annual assumed rate of increase in the per capita cost of covered benefits (i.e., health care cost trend rate for the medical plan) is 9.0% for 2009, and is assumed to trend down to 4.5% by 2028 and thereafter. The health care cost trend rate assumption has a significant effect on the amount of the obligation and periodic cost reported. A one-percentage-point change in the health care trend rates would not have a material effect on the post-retirement benefit obligation.
In 2009, the Company expects to contribute $4,615,000 and $191,000 to its pension and postretirement benefit plans, respectively.
The estimated future benefit payments expected to be paid for each of the next five years and the sum of payments expected for the next five years thereafter are:
(in thousands) | Pension Plans | Other Postretirement Benefits | |||||
|---|---|---|---|---|---|---|---|
2009 | $ | 5,414 | $ | 191 | |||
2010 | 3,990 | 174 | |||||
2011 | 3,403 | 151 | |||||
2012 | 3,648 | 144 | |||||
2013 | 3,836 | 130 | |||||
2014-2018 | 22,685 | 731 | |||||
401(k) Plans
The Company sponsors a 401(k) plan for U.S. salaried employees. Salaried employees are eligible to participate in the plan on January 1, April 1, July 1 or October 1 after their date of employment. Under the plan, employer contributions are defined as 5% of a participant's base salary plus a matching of employee contributions allowing for a maximum matching contribution of 3% of a participant's earnings. The cost of the plan recognized as expense was $2,545,000, $2,273,000 and $1,550,000 in 2008, 2007 and 2006, respectively.
73
Notes to consolidated financial statements (Continued)
13. Employee Benefit Plans (Continued)
The Company sponsors a 401(k) plan for U.S. hourly employees subject to collective bargaining agreements. Depending on the applicable collective bargaining agreement, employer basic contributions are defined as 2% or 3.25% of a participant's base earnings plus a matching of employee contributions allowing for a maximum matching contribution of 2.25% or 2.50% of a participant's earnings. The Company also makes a separate contribution for employees hired prior to January 1, 2000 and who are not eligible for the postretirement benefit plan. The cost of the plan recognized as expense was $546,000, $707,000 and $613,000 in 2008, 2007 and 2006, respectively.
Postemployment Benefits
The Company provides postemployment benefits at its German subsidiary under the ATZ early retirement program. The ATZ program allows older workers to stop working before they reach retirement age and receive a reduced salary and certain benefits until they reach retirement age. The Company accounts for benefits provided under the ATZ program in accordance with FASB Statement No. 112,Employers' Accounting for Postemployment Benefits.
On January 1, 2006, the Company adopted EITF Issue No. 05-5,Accounting for Early Retirement or Postemployment Programs with Specific Features (Such As Terms Specified in Altersteilzeit Early Retirement Arrangements) ("EITF 05-5"). Under EITF 05-5, the salary components of Type I and Type II ATZ arrangements (excluding the bonus and additional contributions into the German government pension scheme) should be recognized over the period from the point at which the ATZ period begins until the end of the active service period. The bonus feature and the additional contributions into the German government pension scheme (collectively, the additional compensation) under a Type II ATZ arrangement should be accounted for as a postemployment benefit under FASB Statement No.112,Employers' Accounting for Postretirement Benefits. An entity should recognize the additional compensation over the period from the point at which the employee signs the ATZ contract until the end of the active service period. As a result of adopting this consensus, which was treated as a change in accounting estimate effected by a change in accounting principle, the Company reduced the accrual for postemployment benefits and recognized $2,593,000 in operating income for the year ended December 30, 2006. The reduction in the postemployment benefits accrual decreased the net loss in fiscal 2006 by $1,634,000, or $0.06 per share.
14. Environmental Matters
The Company accounts for environmental liabilities in accordance with AICPA Statement of Position 96-1, "Environmental Remediation Liabilities." Environmental obligations are accrued when such expenditures are probable and reasonably estimable. The amount of liability recorded is based on currently available information, including the progress of remedial investigations, current status of discussions with regulatory authorities regarding the method and extent of remediation, presently enacted laws and existing technology. Accruals for estimated losses from environmental obligations are adjusted as further information develops or circumstances change. Costs of future expenditures for environmental obligations are not discounted to their present value. The Company does not currently anticipate any material loss in excess of the amounts accrued. However, the Company's future remediation expenses may be affected by a number of uncertainties including, but not limited to, the difficulty in estimating the extent and method of remediation, the evolving nature of environmental
74
Polypore International, Inc.
Notes to consolidated financial statements (Continued)
14. Environmental Matters (Continued)
regulations, and the availability and application of technology. The Company does not expect the resolution of such uncertainties to have a material adverse effect on its consolidated financial position or liquidity. Recoveries of environmental costs from other parties are recognized as assets when their receipt is deemed probable. Environmental reserves, which are predominately euro-denominated, were $49,220,000 and $29,153,000 as of January 3, 2009 and December 29, 2007, respectively.
In connection with the acquisition of Membrana in 2002, the Company recorded a reserve for environmental obligations. The reserve provides for costs to remediate known environmental issues and operational upgrades which are required in order for the Company to remain in compliance with local regulations. The initial estimate and subsequent finalization of the reserve was included in the allocation of purchase price at the date of acquisition. At January 3, 2009, the environmental reserve for the Membrana facility was $22,627,000. The Company anticipates that expenditures will be made over the next seven to ten years.
The Company has indemnification agreements for certain environmental matters from Acordis A.G. ("Acordis") and Akzo Nobel N.V. ("Akzo"), the prior owners of Membrana. Akzo originally provided broad environmental protections to Acordis with the right to assign such indemnities to Acordis's successors. Akzo's indemnifications relate to conditions existing prior to December 1999, which is the date that Membrana was sold to Acordis. The Akzo agreement provides indemnification of claims through December 2007, with the indemnification percentage decreasing each year during the coverage period. Through December 2003, Akzo pays 75% of any approved claim. After that, Akzo pays 65% of claims reported through December 2006 and 50% of claims reported through December 2007. In addition to the Akzo indemnification, Acordis provides separate indemnification of claims incurred from December 1999 through February 2002, the acquisition date. The Company will receive indemnification payments under the indemnification agreements as expenditures are made against approved claims. At January 3, 2009 and December 29, 2007, amounts receivable under the indemnification agreements were $17,867,000 and $19,952,000, respectively. The current portion of the indemnification receivable is included in "Prepaid and other" in the accompanying consolidated balance sheets.
In 2004, the Company identified potential environmental contamination at its manufacturing facility in Potenza, Italy. Based on environmental studies and the initial remediation plan presented to local authorities, the Company recorded a reserve for environmental obligations. In 2006, the Company further refined the remediation plan after consultations with local authorities. In December 2008, the Company implemented a restructuring plan which included the closure of this manufacturing facility. Based on discussions with local authorities, environmental consultants and internal personnel, the Company increased the environmental reserve at Potenza by $18,560,000 for the estimated additional costs of environmental remediation and monitoring activities that will be required after closing the facility. Discussions with the local authorities regarding the required level of site clean-up and remediation are ongoing. The increase in the environmental reserve was included in "Business restructuring" in the accompanying consolidated statements of operations. At January 3, 2009, the environmental reserve for the Potenza, Italy facility was $23,502,000. The Company anticipates that expenditures will be made over the next seven to ten years.
In connection with the acquisition of Microporous on February 29, 2008, the Company identified potential environmental contamination at the manufacturing site in Piney Flats, Tennessee. Subsequent
75
Polypore International, Inc.
Notes to consolidated financial statements (Continued)
14. Environmental Matters (Continued)
to the acquisition, the Company performed additional environmental studies and confirmed that environmental contamination was present. The estimated cost of remediation is $3,076,000. As part of the acquisition, the seller purchased an environmental insurance policy on behalf of the Company and also provided indemnification for a portion of the insurance policy deductible. Amounts due under the insurance policy and indemnification agreement are estimated to be $2,522,000. The Company recorded the estimated cost of remediation and the related receivables from the insurance company and indemnification agreement in applying purchase accounting for the acquisition. The current portion of the indemnification receivable is included in "Prepaid and other" in the accompanying consolidated balance sheets.
In 2006, the Company identified instances of potential non-compliance with its environmental operating permits at its Corydon, Indiana and Owensboro, Kentucky facilities. The Company recorded its best estimate of potential penalties at that time. In March 2008, the Company reached agreement with the Indiana Department of Environmental Management and agreed to pay fines consistent with the Company's original estimate. The Company does not believe that additional fines or penalties will be assessed.
15. Business Restructuring
2008 Restructuring Plan
A supply contract between the Company's lead-acid battery separator business and Johnson Controls, Inc. ("JCI") expired on December 31, 2008. The contract was not renewed and the Company will not have a material supply position with JCI for automotive lead-acid battery separators in 2009. In response, the Company implemented a restructuring plan in its energy storage segment to align lead-acid battery separator production capacity with demand, reduce costs and position the Company to meet future growth opportunities.
The initial plan includes closing the Company's facility in Potenza, Italy, streamlining production at the Company's facility in Owensboro, Kentucky and reducing selling, general and administrative resources associated with the lead-acid separator business. The total estimated cost of the plan is expected to be approximately $61,718,000, including cash charges of $32,789,000 for severance, environmental, and other exit costs and a non-cash impairment charge of $28,929,000. The Company began implementing the restructuring plan during the fourth quarter and recorded a restructuring charge of $59,942,000. The timing, scope and costs of these restructuring measures are subject to change as the Company implements the plan and continues to evaluate its business needs and costs.
The restructuring plan includes the termination of approximately 175 employees, consisting of production employees at Potenza, Italy and Owensboro, Kentucky and certain selling, general and administrative employees. The total cost of severance and benefits was approximately $10,406,000. The restructuring plan includes a non-cash impairment charge of $28,929,000, consisting primarily of buildings and machinery and equipment that will no longer be used in Potenza, Italy. The Company estimates that other costs, consisting primarily of costs associated with closing the Potenza, Italy facility, are expected to be approximately $3,823,000, of which $2,047,000 was recognized in 2008 and the remainder will be recognized over the next three years. Cash payments for severance and other exit costs are expected to be paid over the next three years.
76
Polypore International, Inc.
Notes to consolidated financial statements (Continued)
15. Business Restructuring (Continued)
In connection with the closing of the Potenza, Italy facility, the Company increased the environmental reserve by $18,560,000 for the estimated environmental remediation and monitoring costs that will be required after closing the facility. The increase in the environmental reserve is included in "Business restructuring" in the accompanying consolidated statement of operations.
2006 Restructuring Plan
In December 2006, the Company's separations media segment exited the production of cellulosic membranes and realigned the cost structure at its Wuppertal, Germany facility. The total cost of the plan is expected to be approximately $33,753,000, consisting of a $17,492,000 non-cash impairment charge for buildings and equipment, $10,466,000 for employee layoffs and $5,795,000 for other costs related to the shutdown of portions of the Wuppertal facility. The other costs included in the restructuring plan are related to local regulations surrounding complete or partial shutdowns of a facility. During 2007, the reserve for severance and benefit costs was reduced as a result of lower actual severance expenses than originally estimated.
2005 Restructuring Plan
In order to better accommodate customer growth and related demand for both lead-acid and lithium battery separators in the greater Asian market, the Company's energy storage segment transferred certain assets from Europe and the United States to its facilities in Thailand and China. The total cost of the realignment plan was $9,062,000, including a non-cash impairment charge of $1,278,000.
Restructuring reserve activity during 2008, excluding restructuring charges for environmental costs, consists of:
(in thousands) | Balance at December 29, 2007 | Restructuring Charges | Non-Cash Charges | Cash Payments | Foreign Currency Translation | Balance at January 3, 2009 | ||||||||||||||
|---|---|---|---|---|---|---|---|---|---|---|---|---|---|---|---|---|---|---|---|---|
2008 Restructuring Plan: | ||||||||||||||||||||
Severance and benefit costs | $ | — | $ | 10,406 | $ | — | $ | (1,430 | ) | $ | 871 | $ | 9,847 | |||||||
Impairment | — | 28,929 | (28,929 | ) | — | — | — | |||||||||||||
Other | — | 2,047 | — | (1,255 | ) | 37 | 829 | |||||||||||||
| — | 41,382 | (28,929 | ) | (2,685 | ) | 908 | 10,676 | |||||||||||||
2006 Restructuring Plan: | ||||||||||||||||||||
Severance and benefit costs | 3,548 | — | — | (520 | ) | (144 | ) | 2,884 | ||||||||||||
Other | 1,288 | — | — | (761 | ) | (35 | ) | 492 | ||||||||||||
| 4,836 | — | — | (1,281 | ) | (179 | ) | 3,376 | |||||||||||||
2005 Restructuring Plan: | ||||||||||||||||||||
Severance and benefit costs | 404 | (55 | ) | — | (334 | ) | (15 | ) | — | |||||||||||
Total | $ | 5,240 | $ | 41,327 | $ | (28,929 | ) | $ | (4,300 | ) | $ | 714 | $ | 14,052 | ||||||
77
Polypore International, Inc.
Notes to consolidated financial statements (Continued)
15. Business Restructuring (Continued)
Restructuring reserve activity during 2007 consists of:
(in thousands) | Balance at December 30, 2006 | Restructuring Charges | Cash Payments | Foreign Currency Translation | Balance at December 29, 2007 | ||||||||||||
|---|---|---|---|---|---|---|---|---|---|---|---|---|---|---|---|---|---|
2006 Restructuring Plan: | |||||||||||||||||
Severance and benefit costs | $ | 11,559 | $ | (937 | ) | $ | (7,684 | ) | $ | 610 | $ | 3,548 | |||||
Other | 5,684 | 158 | (4,771 | ) | 217 | 1,288 | |||||||||||
| 17,243 | (779 | ) | (12,455 | ) | 827 | 4,836 | |||||||||||
2005 Restructuring Plan: | |||||||||||||||||
Severance and benefit costs | 876 | 161 | (690 | ) | 57 | 404 | |||||||||||
Other | — | 211 | (211 | ) | — | — | |||||||||||
| 876 | 372 | (901 | ) | 57 | 404 | ||||||||||||
2004 Restructuring Plan: | |||||||||||||||||
Severance and benefit costs | 1,152 | (479 | ) | (729 | ) | 56 | — | ||||||||||
Total | $ | 19,271 | $ | (886 | ) | $ | (14,085 | ) | $ | 940 | $ | 5,240 | |||||
In the consolidated balance sheets, the current portion of the reserve for business restructuring costs is recorded in "Accrued liabilities" and the non-current portion is recorded in "Other" non-current liabilities.
16. Business Interruption Insurance Recovery
On September 30, 2007, a customer in the Company's energy storage segment experienced a fire at one of their facilities. The Company filed a business interruption insurance claim with its insurance provider and recovered $2,400,000 in 2008 related to this claim.
17. Accumulated Other Comprehensive Loss
The components of accumulated other comprehensive loss were as follows:
(in thousands) | January 3, 2009 | December 29, 2007 | |||||
|---|---|---|---|---|---|---|---|
Foreign currency translation adjustment | $ | (12,623 | ) | $ | (301 | ) | |
Net actuarial loss and prior service credit | (4,287 | ) | (3,624 | ) | |||
Unrealized loss on interest rate swap agreements | (3,442 | ) | — | ||||
Accumulated other comprehensive loss | $ | (20,352 | ) | $ | (3,925 | ) | |
18. Stock-Based Compensation Plans
The Company offers stock option plans to attract, retain, motivate and reward key officers, non-employee directors and employees. Stock options are issued at a price not less than the fair market value on the grant date.
78
Polypore International, Inc.
Notes to consolidated financial statements (Continued)
18. Stock-Based Compensation Plans (Continued)
On June 28, 2007, the Company adopted the 2007 Stock Incentive Plan ("2007 Plan"). The 2007 Plan allows for the grant of stock options, restricted stock and other instruments for up to a total of 1,751,963 shares of common stock. Stock options granted under the 2007 Plan have 10-year terms and will be issued with an exercise price not less than the fair market value of the Company's stock on the grant date. Stock options granted under the 2007 Plan may vest based on satisfaction of certain annual performance criteria or may vest over time.
On June 15, 2006, the Company adopted the Polypore International, Inc. 2006 Stock Option Plan ("2006 Plan") and reserved 2,596,694 shares for issuance under the 2006 Plan. Options granted under the 2006 Plan have 10-year terms and vest based on satisfaction of certain annual and cumulative performance criteria over the four fiscal year period ended January 2, 2010. In addition, all or a portion of the options granted under the 2006 Plan will vest upon a change in control if equity investors receive predetermined rates of return on their investment.
In 2004, the Company adopted the Polypore International, Inc. 2004 Stock Option Plan ("2004 Plan"). Under the 2004 Plan, options granted have 10-year terms. As a condition to receiving stock option grants under the 2006 Plan, participants in the 2006 Plan agreed that all unvested stock options granted under the 2004 Plan would be forfeited. Additionally, the participants in the 2006 Plan agreed that all vested stock options granted under the 2004 Plan would be subject to the terms and conditions of the 2006 Plan and that the exercise price and expiration date of the previously vested options would remain unchanged.
Stock option compensation expense was $1,264,000, $706,000 and $532,000 in 2008, 2007 and 2006, respectively, and was included in "Selling, general and administrative expenses" in the accompanying consolidated statements of operations. As of January 3, 2009, the Company had $2,102,000 of total unrecognized stock option compensation expense, net of estimated forfeitures, which is expected to be recognized over a weighted average period of 1.4 years.
A summary of the status of the Company's stock option plans is as follows:
| | Options | Weighted- average exercise price | Weighted average remaining contractual term (years) | Aggregate intrinsic value (in thousands) | |||||||||
|---|---|---|---|---|---|---|---|---|---|---|---|---|---|
Outstanding at December 29, 2007 | 2,464,039 | $ | 6.89 | ||||||||||
Granted | 25,000 | 5.63 | |||||||||||
Exercised | (301,390 | ) | 5.25 | ||||||||||
Forfeited | (50,670 | ) | 9.56 | ||||||||||
Outstanding at January 3, 2009 | 2,136,979 | 7.05 | 7.7 | $ | 3,571 | ||||||||
Vested and exercisable at January 3, 2009 | 694,211 | 6.72 | 7.6 | 1,389 | |||||||||
Expected to vest | 1,309,302 | 7.21 | 7.8 | 1,937 | |||||||||
Exercise prices for options outstanding at January 3, 2009 ranged from $4.92 to $17.76. The total intrinsic value of options exercised during 2008 and 2007 amounted to $5,540,000 and $243,000, respectively.
79
Polypore International, Inc.
Notes to consolidated financial statements (Continued)
18. Stock-Based Compensation Plans (Continued)
The total fair values of options vested during 2008, 2007 and 2006 were $634,000, $374,000 and $309,000, respectively.
Under FAS 123(R), the Company is required to estimate the fair value of stock options on the date of the grant using an option-pricing model. The weighted average grant-date fair value of options granted during 2008, 2007 and 2006 amounted to $1.89, $6.91 and $1.32 per share, respectively. The fair value of each stock option granted was estimated on the date of grant based on the Black-Scholes option pricing model with the following weighted-average assumptions:
| | Weighted average assumptions | ||||||||
|---|---|---|---|---|---|---|---|---|---|
| | 2008 | 2007 | 2006 | ||||||
Weighted-average expected life (years) | 4.0 | 6.3 | 3.5 | ||||||
Risk-free interest rate | 1.3 | % | 3.6%–4.5% | 5.1 | % | ||||
Expected volatility | 40.9 | % | 23.0%–34.9% | 23.0 | % | ||||
Dividend yield | — | — | — | ||||||
The potential expected life of the stock options range from the vesting period of the options (three and a half years to five years) to the contractual life of the options of ten years. During 2008, 2007 and 2006, the Company determined the expected life of the options based primarily on the Company's historical experience, the vesting periods, the structure of the option plans and the contractual lives of the options.
The Company's risk-free interest rate is based on the interest rate of U.S. Treasury bills with a term approximating the expected life of the option and is measured at the date of the stock option grant. Since the Company's common stock has only been publicly traded since June 28, 2007, the expected volatility was estimated based on a mix of the historical volatility of certain publicly-traded peer companies and the Company's historical volatility since its initial public offering. The Company does not anticipate paying dividends.
Under the 2007 Plan, the Company awarded 1,644 and 1,848 restricted shares in 2008 and 2007, respectively, to members of its Board of Directors for the Board service to the Company. The cost associated with these restricted stock grants, which vest over periods of three years, was $16,000 and $2,000 for fiscal 2008 and 2007, respectively, and was included in "Selling, general and administrative expenses" in the accompanying consolidated statements of operations.
A summary of the status of the Company's unvested restricted stock grants as of January 3, 2009, and changes during the year then ended is as follows:
| | Restricted stock | Weighted-average grant-date fair value | |||||
|---|---|---|---|---|---|---|---|
Unvested at December 29, 2007 | 1,848 | $ | 16.23 | ||||
Granted | 1,644 | 24.31 | |||||
Vested | (616 | ) | 16.23 | ||||
Unvested at January 3, 2009 | 2,876 | 20.85 | |||||
80
Notes to consolidated financial statements (Continued)
19. Related Party Transactions
The Company's German subsidiary has equity investments in two companies that provide patent, trademark and research services for the Company. The investments represent approximately 25% ownership in each of the firms and are accounted for by the equity method of accounting. The Company's equity investment account balance was $413,000 and $278,000 at January 3, 2009 and December 29, 2007, respectively. Charges from the affiliates for work performed were $1,550,000, $1,266,000 and $961,000 in 2008, 2007 and 2006, respectively. The Company has amounts due to the affiliates of $98,000 and $112,000 at January 3, 2009 and December 29, 2007, respectively.
20. Segment Information
The Company's operations are principally managed on a products basis and are comprised of three operating segments that have been aggregated into two reportable segments: energy storage and separations media. The energy storage segment produces and markets membranes that provide the critical function of separating the cathode and anode in a variety of battery markets, including lithium, industrial and transportation applications. The separations media segment produces and markets membranes used as the high technology filtration element in various medical and industrial applications.
The Company evaluates the performance of segments and allocates resources to segments based on operating income before interest, income taxes, depreciation and amortization. In addition, it evaluates business segment performance before business restructuring charges and the impact of certain non-recurring costs including strike and costs associated with the FTC complaint. The accounting policies of the reportable segments are the same as those described in the summary of significant
81
Polypore International, Inc.
Notes to consolidated financial statements (Continued)
20. Segment Information (Continued)
accounting policies. Financial information relating to the reportable operating segments is presented below:
| | Year ended | |||||||||||
|---|---|---|---|---|---|---|---|---|---|---|---|---|
(in thousands) | January 3, 2009 | December 29, 2007 | December 30, 2006 | |||||||||
Net sales to external customers (by major product group): | ||||||||||||
Lead-acid battery separators | $ | 348,240 | $ | 291,473 | $ | 261,758 | ||||||
Lithium battery separators | 101,964 | 87,884 | 79,693 | |||||||||
Energy storage | 450,204 | 379,357 | 341,451 | |||||||||
Healthcare | 103,029 | 103,151 | 94,065 | |||||||||
Filtration and specialty | 57,297 | 52,159 | 42,640 | |||||||||
Separations media | 160,326 | 155,310 | 136,705 | |||||||||
Total net sales to external customers | $ | 610,530 | $ | 534,667 | $ | 478,156 | ||||||
Operating income: | ||||||||||||
Energy storage | $ | 89,737 | $ | 81,427 | $ | 72,469 | ||||||
Separations media | 27,251 | 22,205 | 5,218 | |||||||||
Corporate | (1,009 | ) | (271 | ) | (258 | ) | ||||||
Segment operating income | 115,979 | 103,361 | 77,429 | |||||||||
Business restructuring | 59,887 | (886 | ) | 37,027 | ||||||||
Non-recurring costs | 8,563 | — | — | |||||||||
Change in accounting principle related to postemployment benefits | — | — | (2,593 | ) | ||||||||
Total operating income | 47,529 | 104,247 | 42,995 | |||||||||
Reconciling items: | ||||||||||||
Interest expense | 60,740 | 80,998 | 92,287 | |||||||||
Costs related to purchase of 10.50% senior discount notes | — | 30,057 | — | |||||||||
Write-off of loan acquisition costs associated with refinancing of senior secured credit facilities | — | 7,173 | — | |||||||||
Foreign currency and other | (2,484 | ) | 1,621 | 3,207 | ||||||||
Loss from continuing operations before income taxes | $ | (10,727 | ) | $ | (15,602 | ) | $ | (52,499 | ) | |||
Depreciation and amortization: | ||||||||||||
Energy storage | $ | 37,121 | $ | 32,334 | $ | 31,453 | ||||||
Separations media | 17,923 | 16,519 | 28,759 | |||||||||
Total depreciation and amortization | $ | 55,044 | $ | 48,853 | $ | 60,212 | ||||||
Capital expenditures: | ||||||||||||
Energy storage | $ | 38,742 | $ | 18,219 | $ | 15,009 | ||||||
Separations media | 9,271 | 11,556 | 8,903 | |||||||||
Total capital expenditures | $ | 48,013 | $ | 29,775 | $ | 23,912 | ||||||
82
Polypore International, Inc.
Notes to consolidated financial statements (Continued)
20. Segment Information (Continued)
(in thousands) | January 3, 2009 | December 29, 2007 | ||||||
|---|---|---|---|---|---|---|---|---|
Assets: | ||||||||
Energy storage | $ | 938,400 | $ | 874,522 | ||||
Separations media | 484,108 | 516,828 | ||||||
Corporate assets | 76,346 | 37,693 | ||||||
Total assets | $ | 1,498,854 | $ | 1,429,043 | ||||
Net sales by geographic location, based on the country from which the product is shipped, were as follows:
| | Year ended | ||||||||||
|---|---|---|---|---|---|---|---|---|---|---|---|
(in thousands) | January 3, 2009 | December 29, 2007 | December 30, 2006 | ||||||||
Net sales to unaffiliated customers: | |||||||||||
United States | $ | 222,146 | $ | 185,315 | $ | 179,965 | |||||
Germany | 152,754 | 150,461 | 131,002 | ||||||||
France | 86,409 | 80,259 | 73,290 | ||||||||
Other | 149,221 | 118,632 | 93,899 | ||||||||
Total | $ | 610,530 | $ | 534,677 | $ | 478,156 | |||||
Property, plant and equipment by geographic location were as follows:
(in thousands) | January 3, 2009 | December 29, 2007 | ||||||
|---|---|---|---|---|---|---|---|---|
United States | $ | 155,444 | $ | 111,378 | ||||
Germany | 163,617 | 180,557 | ||||||
Thailand | 48,348 | 44,620 | ||||||
Other | 49,387 | 64,729 | ||||||
Total | $ | 416,796 | $ | 401,284 | ||||
21. Discontinued Operations
In January 2008, the Company sold a non-core synthetic paper business, a component of the energy storage segment, for $4,000,000, resulting in a gain on sale of $2,372,000, net of income taxes of $1,402,000. The results of operations and the gain on sale from the synthetic paper business are presented as discontinued operations for all periods presented in the Company's consolidated statements of operations.
83
Polypore International, Inc.
Notes to consolidated financial statements (Continued)
22. Quarterly Results of Operations (Unaudited)
(in thousands, except per share data) | First Quarter | Second Quarter | Third Quarter | Fourth Quarter | ||||||||||
|---|---|---|---|---|---|---|---|---|---|---|---|---|---|---|
Fiscal year ended January 3, 2009 | ||||||||||||||
Net sales | $ | 145,329 | $ | 164,665 | $ | 154,923 | $ | 145,613 | ||||||
Gross profit | 55,460 | 61,095 | 46,868 | 52,297 | ||||||||||
Income (loss) from continuing operations | 10,552 | 11,174 | 5,088 | (44,361 | ) | |||||||||
Income from discontinued operations, net of income taxes | 2,360 | — | — | — | ||||||||||
Net income (loss) | 12,912 | 11,174 | 5,088 | (44,361 | ) | |||||||||
Net income (loss) per common share—basic and diluted | ||||||||||||||
Continuing operations | $ | 0.26 | $ | 0.26 | $ | 0.11 | $ | (1.00 | ) | |||||
Discontinued operations | 0.06 | — | — | — | ||||||||||
Net income (loss) per common share | $ | 0.32 | $ | 0.26 | $ | 0.11 | $ | (1.00 | ) | |||||
(in thousands, except per share data) | First Quarter | Second Quarter | Third Quarter | Fourth Quarter | ||||||||||
|---|---|---|---|---|---|---|---|---|---|---|---|---|---|---|
Fiscal year ended December 29, 2007 | ||||||||||||||
Net sales | $ | 129,036 | $ | 131,063 | $ | 129,930 | $ | 144,638 | ||||||
Gross profit | 48,146 | 47,775 | 45,839 | 55,225 | ||||||||||
Income (loss) from continuing operations | 2,094 | (1,062 | ) | (14,622 | ) | 14,037 | ||||||||
Income (loss) from discontinued operations, net of income taxes | 16 | 11 | 42 | 30 | ||||||||||
Net income (loss) | 2,110 | (1,051 | ) | (14,580 | ) | 14,067 | ||||||||
Net income (loss) per common share—basic and diluted | ||||||||||||||
Continuing operations | $ | (0.08 | ) | $ | (0.04 | ) | $ | (0.36 | ) | $ | 0.35 | |||
Discontinued operations | — | — | — | — | ||||||||||
Net income (loss) per common share | $ | (0.08 | ) | $ | (0.04 | ) | $ | (0.36 | ) | $ | 0.35 | |||
During the fourth quarter of 2008, the Company implemented a restructuring plan and recorded total restructuring charges of $59,887,000.
During the third quarter of 2007, the Company used the proceeds from its initial public offering and cash on hand to purchase and retire its 10.50% senior discount notes. As a result of the purchase of the notes, the Company incurred a $30,057,000 charge to income, which is comprised of redemption and tender premiums of $29,522,000 and the write-off of unamortized loan acquisition costs of $535,000. The Company also refinanced Polypore's senior secured credit facility with a new senior secured credit facility. In connection with the refinancing, the Company wrote-off loan acquisition costs of $7,173,000 associated with the previous senior secured credit facility.
During the third quarter of 2007, the German government enacted the 2008 Tax Reform Act legislation which reduced corporate income tax rates and changed the calculation of taxable income in Germany. The Company recognized the effect of the new tax legislation during the third quarter of 2007, resulting in an increase in the income tax benefit of $6,140,000.
During the fourth quarter of 2007, the Italian Parliament approved the 2008 Finance Bill which reduced corporate income tax rates affected taxation of corporations doing business in Italy. As a result of the changes in the Italian and German tax laws, the Company recorded an additional tax benefit of $2,389,000 in the fourth quarter of 2007 to reflect the new legislation.
23. Financial Statements of Guarantors
On July 31, 2007, Polypore merged with and into the Company, and the Company assumed all of Polypore's obligations under the 8.75% senior subordinated notes. The senior subordinated notes are unconditionally guaranteed, jointly and severally, on a senior basis by certain of the Company's wholly-owned subsidiaries ("Guarantors"). Management has determined that separate complete financial statements of the Guarantors would not be material to users of the financial statements.
84
Polypore International, Inc.
Notes to consolidated financial statements (Continued)
23. Financial Statements of Guarantors (Continued)
The following sets forth condensed consolidating financial statements of the Guarantors and non-Guarantor subsidiaries.
Condensed Consolidating Balance Sheet
As of January 3, 2009
(in thousands) | Combined Guarantor Subsidiaries | Combined Non-Guarantor Subsidiaries | The Company | Reclassifications and Eliminations | Consolidated | ||||||||||||
|---|---|---|---|---|---|---|---|---|---|---|---|---|---|---|---|---|---|
Assets | |||||||||||||||||
Cash and cash equivalents | $ | — | $ | 25,657 | $ | 57,364 | $ | — | $ | 83,021 | |||||||
Accounts receivable, net | 36,383 | 64,026 | — | — | 100,409 | ||||||||||||
Inventories | 25,444 | 44,954 | — | — | 70,398 | ||||||||||||
Refundable income taxes | 617 | 14,492 | (8,832 | ) | — | 6,277 | |||||||||||
Deferred income taxes | — | — | 1,222 | — | 1,222 | ||||||||||||
Prepaid and other | 3,831 | 10,541 | (97 | ) | — | 14,275 | |||||||||||
Total current assets | 66,275 | 159,670 | 49,657 | — | 275,602 | ||||||||||||
Due from affiliates | 314,895 | 358,691 | 294,702 | (968,288 | ) | — | |||||||||||
Investment in subsidiaries | 250,996 | 282,531 | 297,196 | (830,723 | ) | — | |||||||||||
Property, plant and equipment, net | 155,444 | 261,352 | — | — | 416,796 | ||||||||||||
Goodwill | — | — | 601,564 | — | 601,564 | ||||||||||||
Intangibles and loan acquisition costs, net | 31 | — | 184,823 | — | 184,854 | ||||||||||||
Other | 3,260 | 16,778 | — | — | 20,038 | ||||||||||||
Total assets | $ | 790,901 | $ | 1,079,022 | $ | 1,427,942 | $ | (1,799,011 | ) | $ | 1,498,854 | ||||||
Liabilities and shareholders' equity | |||||||||||||||||
Accounts payable and accrued liabilities | $ | 31,577 | $ | 44,620 | $ | 6,386 | $ | — | $ | 82,583 | |||||||
Current portion of debt | — | 550 | 3,230 | — | 3,780 | ||||||||||||
Current portion of capital lease obligation | 1,495 | — | — | — | 1,495 | ||||||||||||
Fair value of interest rate swap agreements | — | — | 5,477 | — | 5,477 | ||||||||||||
Total current liabilities | 33,072 | 45,170 | 15,093 | — | 93,335 | ||||||||||||
Due to affiliates | 368,754 | 326,642 | 272,892 | (968,288 | ) | — | |||||||||||
Debt, less current portion | — | 47,520 | 748,696 | — | 796,216 | ||||||||||||
Capital lease obligation, less current portion | 1,824 | — | — | — | 1,824 | ||||||||||||
Pension and postretirement benefits, less current portion | 2,797 | 63,469 | — | — | 66,266 | ||||||||||||
Postemployment benefits | — | 2,425 | — | — | 2,425 | ||||||||||||
Environmental reserve, less current portion | 2,061 | 38,423 | — | — | 40,484 | ||||||||||||
Deferred income taxes and other | 67,749 | 39,294 | (1,602 | ) | — | 105,441 | |||||||||||
Shareholder's equity | 314,644 | 516,079 | 392,863 | (830,723 | ) | 392,863 | |||||||||||
Total liabilities and shareholders' equity | $ | 790,901 | $ | 1,079,022 | $ | 1,427,942 | $ | (1,799,011 | ) | $ | 1,498,854 | ||||||
85
Polypore International, Inc.
Notes to consolidated financial statements (Continued)
23. Financial Statements of Guarantors (Continued)
Condensed Consolidating Balance Sheet
As of December 29, 2007
(in thousands) | Combined Guarantor Subsidiaries | Combined Non-Guarantor Subsidiaries | The Company | Reclassifications and Eliminations | Consolidated | ||||||||||||
|---|---|---|---|---|---|---|---|---|---|---|---|---|---|---|---|---|---|
Assets | |||||||||||||||||
Cash and cash equivalents | $ | — | $ | 40,055 | $ | 14,879 | $ | — | $ | 54,934 | |||||||
Accounts receivable, net | 36,116 | 79,503 | — | — | 115,619 | ||||||||||||
Inventories | 20,360 | 43,969 | — | — | 64,329 | ||||||||||||
Deferred income taxes | — | — | 1,808 | — | 1,808 | ||||||||||||
Prepaid and other | 2,578 | 10,242 | (155 | ) | — | 12,665 | |||||||||||
Total current assets | 59,054 | 173,769 | 16,532 | — | 249,355 | ||||||||||||
Due from affiliates | 237,033 | 324,314 | 287,491 | (848,838 | ) | — | |||||||||||
Investment in subsidiaries | 224,443 | 283,721 | 270,952 | (779,116 | ) | — | |||||||||||
Property, plant and equipment, net | 111,379 | 289,905 | — | — | 401,284 | ||||||||||||
Goodwill | — | 1,240 | 567,544 | — | 568,784 | ||||||||||||
Intangibles and loan acquisition costs, net | 44 | — | 187,817 | — | 187,861 | ||||||||||||
Other | 1,552 | 17,659 | 2,548 | — | 21,759 | ||||||||||||
Total assets | $ | 633,505 | $ | 1,090,608 | $ | 1,332,884 | $ | (1,627,954 | ) | $ | 1,429,043 | ||||||
Liabilities and shareholders' equity | |||||||||||||||||
Accounts payable and accrued liabilities | $ | 30,548 | $ | 47,206 | $ | 6,800 | $ | — | $ | 84,554 | |||||||
Income taxes payable | — | — | 424 | — | 424 | ||||||||||||
Current portion of debt | — | 513 | 4,036 | — | 4,549 | ||||||||||||
Current portion of capital lease obligation | 1,435 | — | — | — | 1,435 | ||||||||||||
Total current liabilities | 31,983 | 47,719 | 11,260 | — | 90,962 | ||||||||||||
Due to affiliates | 315,847 | 310,017 | 222,974 | (848,838 | ) | — | |||||||||||
Debt, less current portion | — | 50,661 | 762,875 | — | 813,536 | ||||||||||||
Capital lease obligation, less current portion | 3,319 | — | — | — | 3,319 | ||||||||||||
Pension and postretirement benefits, less current portion | 2,343 | 63,436 | — | — | 65,779 | ||||||||||||
Postemployment benefits | — | 3,673 | — | — | 3,673 | ||||||||||||
Environmental reserve, less current portion | — | 22,627 | — | — | 22,627 | ||||||||||||
Deferred income taxes and other | 70,954 | 22,418 | 444 | — | 93,816 | ||||||||||||
Shareholder's equity | 209,059 | 570,057 | 335,331 | (779,116 | ) | 335,331 | |||||||||||
Total liabilities and shareholders' equity | $ | 633,505 | $ | 1,090,608 | $ | 1,332,884 | $ | (1,627,954 | ) | $ | 1,429,043 | ||||||
86
Polypore International, Inc.
Notes to consolidated financial statements (Continued)
23. Financial Statements of Guarantors (Continued)
Condensed Consolidating Statement of Operations
For the year ended January 3, 2009
(in thousands) | Combined Guarantor Subsidiaries | Combined Non-Guarantor Subsidiaries | The Company | Reclassifications and Eliminations | Consolidated | |||||||||||
|---|---|---|---|---|---|---|---|---|---|---|---|---|---|---|---|---|
Net sales | $ | 230,838 | $ | 379,692 | $ | — | $ | — | $ | 610,530 | ||||||
Cost of goods sold | 115,626 | 281,584 | — | — | 397,210 | |||||||||||
Business interruption proceeds | (2,400 | ) | — | — | — | (2,400 | ) | |||||||||
Gross profit | 117,612 | 98,108 | — | — | 215,720 | |||||||||||
Selling, general and administrative expenses | 69,656 | 37,637 | 1,011 | — | 108,304 | |||||||||||
Business restructuring | — | 59,887 | — | — | 59,887 | |||||||||||
Operating income (loss) | 47,956 | 584 | (1,011 | ) | — | 47,529 | ||||||||||
Interest expense and other | (7,872 | ) | 11,689 | 54,439 | — | 58,256 | ||||||||||
Equity in earnings of subsidiaries | — | — | (10,275 | ) | 10,275 | — | ||||||||||
Income (loss) before income taxes | 55,828 | (11,105 | ) | (45,175 | ) | (10,275 | ) | (10,727 | ) | |||||||
Income taxes | 28,695 | 5,753 | (27,628 | ) | — | 6,820 | ||||||||||
Income (loss) from continuing operations | $ | 27,133 | $ | (16,858 | ) | $ | (17,547 | ) | $ | (10,275 | ) | $ | (17,547 | ) | ||
87
Polypore International, Inc.
Notes to consolidated financial statements (Continued)
23. Financial Statements of Guarantors (Continued)
Condensed Consolidating Statement of Operations
For the year ended December 29, 2007
(in thousands) | Combined Guarantor Subsidiaries | Combined Non-Guarantor Subsidiaries | The Company | Reclassifications and Eliminations | Consolidated | |||||||||||
|---|---|---|---|---|---|---|---|---|---|---|---|---|---|---|---|---|
Net sales | $ | 185,315 | $ | 349,352 | $ | — | $ | — | $ | 534,667 | ||||||
Cost of goods sold | 80,013 | 257,669 | — | — | 337,682 | |||||||||||
Gross profit | 105,302 | 91,683 | — | — | 196,985 | |||||||||||
Selling, general and administrative expenses | 58,955 | 34,119 | 550 | — | 93,624 | |||||||||||
Business restructuring | — | (886 | ) | — | — | (886 | ) | |||||||||
Operating income (loss) | 46,347 | 58,450 | (550 | ) | — | 104,247 | ||||||||||
Costs related to purchase of 10.50% senior discount notes | — | — | 30,057 | — | 30,057 | |||||||||||
Write-off of loan acquisition costs associated with refinancing of senior secured credit facilities | — | — | 7,173 | — | 7,173 | |||||||||||
Interest expense and other | (7,276 | ) | 10,357 | 79,538 | — | 82,619 | ||||||||||
Equity in earnings of subsidiaries | — | — | (64,151 | ) | 64,151 | — | ||||||||||
Income (loss) before income taxes | 53,623 | 48,093 | (53,167 | ) | (64,151 | ) | (15,602 | ) | ||||||||
Income taxes | 29,432 | 8,133 | (53,614 | ) | — | (16,049 | ) | |||||||||
Income from continuing operations | $ | 24,191 | $ | 39,960 | $ | 447 | $ | (64,151 | ) | $ | 447 | |||||
88
Polypore International, Inc.
Notes to consolidated financial statements (Continued)
23. Financial Statements of Guarantors (Continued)
Condensed Consolidating Statement of Operations
For the year ended December 30, 2006
(in thousands) | Combined Guarantor Subsidiaries | Combined Non-Guarantor Subsidiaries | The Company | Reclassifications and Eliminations | Consolidated | |||||||||||
|---|---|---|---|---|---|---|---|---|---|---|---|---|---|---|---|---|
Net sales | $ | 179,621 | $ | 298,535 | $ | — | $ | — | $ | 478,156 | ||||||
Cost of goods sold | 80,145 | 233,109 | — | — | 313,254 | |||||||||||
Gross profit | 99,476 | 65,426 | — | — | 164,902 | |||||||||||
Selling, general and administrative expenses | 54,112 | 32,630 | 731 | — | 87,473 | |||||||||||
Business restructuring | — | 37,027 | — | — | 37,027 | |||||||||||
Change in accounting principle related to postemployment benefits | — | (2,593 | ) | — | — | (2,593 | ) | |||||||||
Operating income (loss) | 45,364 | (1,638 | ) | (731 | ) | — | 42,995 | |||||||||
Interest expense and other | (4,449 | ) | 7,534 | 92,409 | — | 95,494 | ||||||||||
Equity in earnings of subsidiaries | — | — | (21,579 | ) | 21,579 | — | ||||||||||
Income (loss) before income taxes | 49,813 | (9,172 | ) | (71,561 | ) | (21,579 | ) | (52,499 | ) | |||||||
Income taxes | 27,951 | (8,889 | ) | (42,004 | ) | — | (22,942 | ) | ||||||||
Income (loss) from continuing operations | $ | 21,862 | $ | (283 | ) | $ | (29,557 | ) | $ | (21,579 | ) | $ | (29,557 | ) | ||
89
Polypore International, Inc.
Notes to consolidated financial statements (Continued)
23. Financial Statements of Guarantors (Continued)
Condensed Consolidating Statement of Cash Flows
For the year ended January 3, 2009
(in thousands) | Combined Guarantor Subsidiaries | Combined Non-Guarantor Subsidiaries | The Company | Reclassifications and Eliminations | Consolidated | |||||||||||
|---|---|---|---|---|---|---|---|---|---|---|---|---|---|---|---|---|
Net cash provided by (used in) operating activities | $ | 60,271 | $ | 69,579 | $ | (14,892 | ) | $ | (20,272 | ) | $ | 94,686 | ||||
Investing activities: | ||||||||||||||||
Acquisitions, net of cash acquired | — | — | (85,795 | ) | — | (85,795 | ) | |||||||||
Purchases of property, plant and equipment | (23,128 | ) | (24,885 | ) | — | — | (48,013 | ) | ||||||||
Proceeds from sale of synthetic paper business | 4,000 | — | — | — | 4,000 | |||||||||||
Net cash provided by (used in) investing activities | (19,128 | ) | (24,885 | ) | (85,795 | ) | — | (129,808 | ) | |||||||
Financing activities: | ||||||||||||||||
Proceeds from issuance of common stock, net of underwriting fees and other offering related costs | — | — | 84,847 | — | 84,847 | |||||||||||
Principal payments on debt | (6,248 | ) | (10,391 | ) | (4,031 | ) | — | (20,670 | ) | |||||||
Proceeds from stock option issuances | — | — | 1,540 | — | 1,540 | |||||||||||
Intercompany transactions, net | (35,619 | ) | (45,469 | ) | 60,816 | 20,272 | — | |||||||||
Net cash provided by (used in) financing activities | (41,867 | ) | (55,860 | ) | 143,172 | 20,272 | 65,717 | |||||||||
Effect of exchange rate changes on cash and cash equivalents | 724 | (3,232 | ) | — | — | (2,508 | ) | |||||||||
Net increase (decrease) in cash and cash equivalents | — | (14,398 | ) | 42,485 | — | 28,087 | ||||||||||
Cash and cash equivalents at beginning of year | — | 40,055 | 14,879 | — | 54,934 | |||||||||||
Cash and cash equivalents at end of year | $ | — | $ | 25,657 | $ | 57,364 | $ | — | $ | 83,021 | ||||||
90
Polypore International, Inc.
Notes to consolidated financial statements (Continued)
23. Financial Statements of Guarantors (Continued)
Condensed Consolidating Statement of Cash Flows
For the year ended December 29, 2007
(in thousands) | Combined Guarantor Subsidiaries | Combined Non-Guarantor Subsidiaries | The Company | Reclassifications and Eliminations | Consolidated | |||||||||||
|---|---|---|---|---|---|---|---|---|---|---|---|---|---|---|---|---|
Net cash provided by (used in) operating activities | $ | 27,467 | $ | 50,013 | $ | 48,548 | $ | (56,722 | ) | $ | 69,306 | |||||
Investing activities: | ||||||||||||||||
Purchases of property, plant and equipment | (12,470 | ) | (17,305 | ) | — | — | (29,775 | ) | ||||||||
Acquisitions, net of cash acquired | — | (5,475 | ) | — | — | (5,475 | ) | |||||||||
Net cash provided by (used in) investing activities | (12,470 | ) | (22,780 | ) | — | — | (35,250 | ) | ||||||||
Financing activities: | ||||||||||||||||
Proceeds from the new senior secured credit facility | — | 42,551 | 327,449 | — | 370,000 | |||||||||||
Principal payments on debt | (1,377 | ) | (95 | ) | (371,139 | ) | — | (372,611 | ) | |||||||
Purchase of the 10.50% senior discount notes | — | — | (293,666 | ) | — | (293,666 | ) | |||||||||
Proceeds from initial public offering, net of underwriting fees and other offering related costs | — | — | 264,837 | — | 264,837 | |||||||||||
Loan acquisition costs | — | — | (8,672 | ) | — | (8,672 | ) | |||||||||
Repurchase of common stock | — | — | (320 | ) | — | (320 | ) | |||||||||
Issuance of common stock | — | — | 30 | — | 30 | |||||||||||
Intercompany transactions, net | (13,671 | ) | (66,958 | ) | 23,907 | 56,722 | — | |||||||||
Net cash provided by (used in) financing activities | (15,048 | ) | (24,502 | ) | (57,574 | ) | 56,722 | (40,402 | ) | |||||||
Effect of exchange rate changes on cash and cash equivalents | 51 | 6,517 | — | — | 6,568 | |||||||||||
Net increase (decrease) in cash and cash equivalents | — | 9,248 | (9,026 | ) | — | 222 | ||||||||||
Cash and cash equivalents at beginning of year | — | 30,807 | 23,905 | — | 54,712 | |||||||||||
Cash and cash equivalents at end of year | $ | — | $ | 40,055 | $ | 14,879 | $ | — | $ | 54,934 | ||||||
91
Polypore International, Inc.
Notes to consolidated financial statements (Continued)
23. Financial Statements of Guarantors (Continued)
Condensed Consolidating Statement of Cash Flows
For the year ended December 30, 2006
(in thousands) | Combined Guarantor Subsidiaries | Combined Non-Guarantor Subsidiaries | The Company | Reclassifications and Eliminations | Consolidated | |||||||||||
|---|---|---|---|---|---|---|---|---|---|---|---|---|---|---|---|---|
Net cash provided by (used in) operating activities | $ | 43,510 | $ | 47,782 | $ | (20,196 | ) | $ | (21,131 | ) | $ | 49,965 | ||||
Investing activities: | ||||||||||||||||
Purchases of property, plant and equipment | (9,933 | ) | (13,979 | ) | — | — | (23,912 | ) | ||||||||
Net cash provided by (used in) investing activities | (9,933 | ) | (13,979 | ) | — | — | (23,912 | ) | ||||||||
Financing activities: | ||||||||||||||||
Principal payments on debt | (1,299 | ) | (1,188 | ) | (946 | ) | — | (3,433 | ) | |||||||
Loan acquisition costs | — | — | (15 | ) | — | (15 | ) | |||||||||
Issuance of common stock | — | — | 399 | — | 399 | |||||||||||
Intercompany transactions, net | (32,250 | ) | (23,682 | ) | 34,801 | 21,131 | — | |||||||||
Net cash provided by (used in) financing activities | (33,549 | ) | (24,870 | ) | 34,239 | 21,131 | (3,049 | ) | ||||||||
Effect of exchange rate changes on cash and cash equivalents | (48 | ) | 3,701 | (5 | ) | — | 3,648 | |||||||||
Net increase (decrease) in cash and cash equivalents | (20 | ) | 12,634 | 14,038 | — | 26,652 | ||||||||||
Cash and cash equivalents at beginning of year | 20 | 18,173 | 9,867 | — | 28,060 | |||||||||||
Cash and cash equivalents at end of year | $ | — | $ | 30,807 | $ | 23,905 | $ | — | $ | 54,712 | ||||||
92
Item 9. Changes in and Disagreements With Accountants on Accounting and Financial Disclosure
None.
Item 9A. Controls and Procedures
Evaluation of Disclosure Controls and Procedures
An evaluation of the effectiveness of the Company's disclosure controls and procedures (as defined in Rule 13a-15(e) or 15d-15(e) promulgated under the Exchange Act) was performed under the supervision, and with the participation of, the Company's management, including the Chief Executive Officer and Chief Financial Officer. The Company's disclosure controls were designed to provide a reasonable assurance that information required to be disclosed in reports that we file or submit under the Exchange Act is recorded, processed, summarized and reported within the time periods specified in the rules and forms of the Securities and Exchange Commission. Based upon our evaluation, our Chief Executive Officer and Chief Financial Officer concluded that our disclosure controls and procedures were effective as of January 3, 2009 to provide reasonable assurance that information required to be disclosed in the reports that we file under the Exchange Act is recorded, processed, summarized and reported within the time periods specified in the Securities and Exchange Commission's rules and forms, and is accumulated and communicated to management, including our Chief Executive Officer and Chief Financial Officer, as appropriate, to allow timely decisions regarding required disclosure.
Management's Report on Internal Control over Financial Reporting
Management is responsible for establishing and maintaining adequate internal control over financial reporting. Management has conducted an assessment of the effectiveness of the Company's internal control over financial reporting using the criteria inInternal Control—Integrated Framework, issued by the Committee of Sponsoring Organizations of the Treadway Commission (COSO). The Company's internal control over financial reporting is designed to provide reasonable assurance regarding the reliability of financial reporting and the preparation of financial statements for external purposes in accordance with accounting principles generally accepted in the United States of America. Because of its inherent limitations, internal control over financial reporting may not prevent or detect misstatements. Also, projections of any evaluation of effectiveness to future periods are subject to the risk that controls may become inadequate because of changes in conditions, or that the degree of compliance with the policies or procedures may deteriorate.
For purposes of evaluating internal controls over financial reporting, management determined that the internal controls over financial reporting at Microporous Holding Corporation ("Microporous") and Yurie-Wide Corporation ("Yurie-Wide"), both acquired in 2008, would be excluded from the internal control assessment as of January 3, 2009, as permitted by the rules and regulations of the SEC. Microporous and Yurie-Wide accounted for approximately 5.3% and 0.9% of total assets at January 3, 2009, respectively.
Based on its assessment, management has concluded that the Company maintained effective internal control over financial reporting as of January 3, 2009, based on criteria inInternal Control—Integrated Framework issued by the COSO.
The effectiveness of the Company's internal control over financial reporting as of January 3, 2009 has been audited by Ernst & Young LLP, an independent registered public accounting firm. Ernst & Young LLP has issued an attestation report to the Company's internal control over financial reporting, which appears in Item 8 of Part II of this Annual Report on Form 10-K under the heading "Report of Independent Registered Public Accounting Firm."
Changes in Internal Control over Financial Reporting
During the Company's fourth fiscal quarter of fiscal year 2008, there has been no change in the Company's internal control over financial reporting (as defined in Rule 13a-15(f) or 15d-15(f) promulgated under the Exchange Act) that has materially affected, or is reasonably likely to materially affect, the Company's internal control over financial reporting.
None.
93
Item 10. Directors, Executive Officers and Corporate Governance
The information required by this Item is incorporated by reference from the information contained in our Proxy Statement to be filed with the Securities and Exchange Commission in connection with our 2009 Annual Meeting of Stockholders to be held on May 14, 2009.
Members of our Board of Directors and all of our employees, including our Chief Executive Officer and Chief Financial Officer, are required to abide by our Code of Business Conduct and Ethics to ensure that our business is conducted in a consistently legal and ethical manner. The full text of the Code of Business Conduct and Ethics is published on our website athttp://investor.polypore.net/governance.cfm. We will disclose any future amendments to, or waivers from, these ethical policies and standards for senior officers and directors on our website within four business days following the date of such amendment or waiver.
Item 11. Executive Compensation
The information required by this Item is incorporated by reference from the information contained in our Proxy Statement to be filed with the Securities and Exchange Commission in connection with our 2009 Annual Meeting of Stockholders to be held on May 14, 2009.
Item 12. Security Ownership of Certain Beneficial Owners and Management and Related Stockholder Matters
The information required by this Item is incorporated by reference from the information contained in our Proxy Statement to be filed with the Securities and Exchange Commission in connection with our 2009 Annual Meeting of Stockholders to be held on May 14, 2009.
Item 13. Certain Relationships and Related Transactions, and Director Independence
The information required by this Item is incorporated by reference from the information contained in our Proxy Statement to be filed with the Securities and Exchange Commission in connection with our 2009 Annual Meeting of Stockholders to be held on May 14, 2009.
Item 14. Principal Accountant Fees and Services
The information required by this Item is incorporated by reference from the information contained in our Proxy Statement to be filed with the Securities and Exchange Commission in connection with our 2009 Annual Meeting of Stockholders to be held on May 14, 2009.
Item 15. Exhibits and Financial Statement Schedules
- (a)
- Documents filed as part of this report:
1. Financial Statements. The following items, including Consolidated Financial Statements of the Company, are set forth in Item 8 of this Annual Report on Form 10-K:
- •
- Reports of Independent Registered Public Accounting Firm
- •
- Consolidated Balance Sheets as of January 3, 2009 and December 29, 2007
- •
- Consolidated Statements of Operations for the years ended January 3, 2009, December 29, 2007 and December 30, 2006
- •
- Consolidated Statements of Shareholders' Equity for the years ended January 3, 2009, December 29, 2007 and December 30, 2006
94
- •
- Consolidated Statements of Cash Flows for the years ended January 3, 2009, December 29, 2007 and December 30, 2006
- •
- Notes to Consolidated Financial Statements
2. Financial Statement Schedules. The following schedule is set forth on page S-1 of this Annual Report on Form 10-K.
- •
- Valuation and Qualifying Accounts for the years ended January 3, 2009, December 29, 2007 and December 30, 2006
Information required by other schedules has either been incorporated in the consolidated financial statements and accompanying notes or is not applicable to us.
3. Exhibits.
| Exhibit Number | Exhibit Description | ||
|---|---|---|---|
| 3.1 | Form of Amended and Restated Certificate of Incorporation of Polypore International, Inc. (incorporated by reference to Exhibit 3.1 to Amendment No. 4 to the Company's Registration Statement on Form S-1 (Registration No. 333-141273), filed with the SEC on June 15, 2007) | ||
3.2 | Form of Amended and Restated Bylaws of Polypore International, Inc. (incorporated by reference to Exhibit 3.1 to the Company's Current Report on Form 8-K , filed with the SEC on October 29, 2008) | ||
3.3 | Certificate of Amendment to the Certificate of Incorporation of Polypore International, Inc. (incorporated by reference to Exhibit 3.1 to the Company's Current Report on Form 8-K, filed on June 29, 2007) | ||
4.1 | Registration Rights Agreement, dated as of May 13, 2004, by and among Warburg Pincus Private Equity VIII, L.P., Warburg Pincus International Partners, L.P., PP Holding, LLC, Polypore International, Inc. and certain other persons a party thereto (incorporated by reference to Exhibit 10.8 to the Company's Registration Statement on Form S-4 filed on April 18, 2005 (Commission File No. 333-124142)) | ||
4.2 | Indenture, dated as of May 13, 2004, by and among PP Acquisition Corporation (merged with and into Polypore, Inc.), the Guarantors (as defined therein) and The Bank of New York, as Trustee (incorporated by reference to Exhibit 10.7 to the Company's Registration Statement on Form S-4 filed on April 18, 2005 (Commission File No. 333-124142)) (the "8.75% Indenture") | ||
4.3 | Form of 8.75% Senior Subordinated Dollar Notes Due 2012 (incorporated by reference to Exhibit C of the 8.75% Indenture) | ||
4.4 | Form of 8.75% Senior Subordinated Euro Notes Due 2012 (incorporated by reference to Exhibit D of the 8.75% Indenture) | ||
4.5 | Second Supplemental Indenture, dated as of July 31, 2007, between Polypore International, Inc., the Guarantors (as defined therein) and The Bank of New York (incorporated by reference to Exhibit 10.1 to the Company's Current Report on Form 8-K, filed on August 3, 2007) | ||
10.1 | Stock Purchase Agreement, dated as of January 30, 2004, by and among Polypore, Inc., PP Acquisition Corporation and the stockholders of Polypore, Inc. (incorporated by reference to Exhibit 10.1 to the Company's Registration Statement on Form S-4 filed on April 18, 2005 (Commission File No. 333-124142)) | ||
95
| Exhibit Number | Exhibit Description | ||
|---|---|---|---|
| 10.2 | Guarantee and Collateral Agreement, dated as of May 13, 2004, by and among PP Holding Corporation, PP Acquisition Corporation and the subsidiaries of PP Acquisition Corporation identified therein (incorporated by reference to Exhibit 10.4 to the Company's Registration Statement on Form S-4 filed on April 18, 2005 (Commission File No. 333-124142)) | ||
10.3 | Tax Sharing Agreement, dated as of May 13, 2004, by and among Polypore International, Inc., PP Holding Corporation and Polypore, Inc. (incorporated by reference to Exhibit 10.5 to the Company's Registration Statement on Form S-4 filed on April 18, 2005 (Commission File No. 333-124142)) | ||
10.4 | Stockholders' Agreement, dated as of May 13, 2004, by and among Warburg Pincus Private Equity VIII, L.P., Warburg Pincus International Partners, L.P., PP Holding, LLC and Polypore International, Inc. (incorporated by reference to Exhibit 10.6 to the Company's Registration Statement on Form S-4 filed on April 18, 2005 (Commission File No. 333-124142)) | ||
10.5* | Polypore International, Inc. 2004 Stock Option Plan (incorporated by reference to Exhibit 10.9 to the Company's Registration Statement on Form S-4 filed on April 18, 2005 (Commission File No. 333-124142)) | ||
10.6* | Form of Director and Officer Indemnification Agreement entered into between Polypore, Inc. and certain employees of Polypore, Inc. (incorporated by reference to Exhibit 10.12 to the Company's Registration Statement on Form S-4 filed on April 18, 2005 (Commission File No. 333-124142)) | ||
10.7* | Employment Agreement, dated as of April 28, 2008, by and between Polypore International, Inc. and Robert B. Toth (incorporated by reference to Exhibit 10.1 to the Company's Current Report on Form 8-K, filed with the SEC on May 1, 2008) | ||
10.8* | Amended Employment Agreement, dated as of December 18, 2008, by and between Polypore International, Inc. and Robert B. Toth | ||
10.9* | Employment Agreement, dated as of April 17, 2006, by and between Polypore, Inc. and Mitchell J. Pulwer (incorporated by reference to Exhibit 10.1 to the Company's Quarterly Report on Form 10-Q filed on August 15, 2006) | ||
10.10* | Amended Employment Agreement, dated as of December 18, 2008, by and between Polypore International, Inc. and Mitchell J. Pulwer | ||
10.11* | Employment Agreement, dated as of April 4, 2006, by and between Membrana GmbH, a subsidiary of Polypore, Inc. and Josef Sauer (incorporated by reference to Exhibit 10.3 to the Company's Quarterly Report on Form 10-Q filed on August 15, 2006) | ||
10.12* | Polypore International, Inc. 2006 Stock Option Plan (incorporated by reference to Exhibit 10.4 to the Company's Quarterly Report on Form 10-Q filed on August 15, 2006) | ||
10.13* | Form of Executive Severance Plan Policy | ||
10.14 | North American Supply Agreement, dated as of December 15, 1999, by and between Daramic, Inc. and Exide Corporation (incorporated by reference to Exhibit 10.20 to Amendment No. 5 to the Company's Registration Statement on Form S-1 (Registration No. 333-141273), filed with the SEC on June 26, 2007) | ||
10.15 | Automotive and Industrial Supply Agreement, dated as of July 31, 2001, by and between Daramic, Inc. and Exide Corporation (incorporated by reference to Exhibit 10.21 to Amendment No. 5 to the Company's Registration Statement on Form S-1 (Registration No. 333-141273), filed with the SEC on June 26, 2007) | ||
96
| Exhibit Number | Exhibit Description | ||
|---|---|---|---|
| 10.16 | Golf Cart Separator Supply Agreement, dated as of July 31, 2001, by and between Daramic, Inc. and Exide Corporation (incorporated by reference to Exhibit 10.22 to Amendment No. 5 to the Company's Registration Statement on Form S-1 (Registration No. 333-141273), filed with the SEC on June 26, 2007) | ||
10.17 | Amendment to Supply Contracts, dated July 31, 2001, by and between Daramic, Inc. and Exide Corporation (incorporated by reference to Exhibit 10.23 to Amendment No. 5 to the Company's Registration Statement on Form S-1 (Registration No. 333-141273), filed with the SEC on June 26, 2007) | ||
10.18 | Amendment No. 2 to Supply Contracts, dated as of July 11, 2002, by and between Daramic, Inc. and Exide Corporation (incorporated by reference to Exhibit 10.24 to Amendment No. 5 to the Company's Registration Statement on Form S-1 (Registration No. 333-141273), filed with the SEC on June 26, 2007) | ||
10.19 | Amendment to the Automotive and Industrial Supply Agreement, dated as of March, 2005, by and between Daramic, Inc. and Exide Corporation (incorporated by reference to Exhibit 10.25 to Amendment No. 5 to the Company's Registration Statement on Form S-1 (Registration No. 333-141273), filed with the SEC on June 26, 2007) | ||
10.20* | Polypore International, Inc. 2007 Stock Incentive Plan (incorporated by reference to Exhibit 10.26 to Amendment No. 4 to the Company's Registration Statement on Form S-1 (Registration No. 333-141273), filed with the SEC on June 15, 2007) | ||
10.21 | Form of Restricted Stock Grant Notice and Agreement under the Polypore International, Inc. 2007 Stock Incentive Plan (incorporated by reference to Exhibit 99.1 to the Company's Registration Statement on Form S-8 filed on July 25, 2007(Commission File No. 333-144846)) | ||
10.22 | Form of Option Grant Notice and Agreement under the Polypore International, Inc. 2007 Stock Incentive Plan (incorporated by reference to Exhibit 99.2 to the Company's Registration Statement on Form S-8 filed on July 25, 2007(Commission File No. 333-144846)) | ||
10.23 | Amended and Restated Credit Agreement, dated as of July 3, 2007, between PP Holding Corporation, Polypore, Inc., Daramic Holding S.A.S., JPMorgan Chase Bank, N.A., as Administrative Agent, and the other agents and lenders named therein (incorporated by reference to Exhibit 10.1 to the Company's Current Report on Form 8-K, filed on July 10, 2007) | ||
10.24 | First Amendment and Reaffirmation Agreement, dated as of July 3, 2007, between PP Holding Corporation, Polypore, Inc. and all of Polypore, Inc.'s domestic restricted subsidiaries (incorporated by reference to Exhibit 10.2 to the Company's Current Report on Form 8-K, filed on July 10, 2007) | ||
21.1 | Subsidiaries of Polypore International, Inc. | ||
23.1 | Consent of Independent Registered Public Accounting Firm | ||
31.1 | Certification of Chief Executive Officer pursuant to Section 302 of the Sarbanes-Oxley Act of 2002 | ||
31.2 | Certification of Chief Financial Officer pursuant to Section 302 of the Sarbanes-Oxley Act of 2002 | ||
32.1 | Certification of Chief Executive Officer pursuant to Section 906 of the Sarbanes-Oxley Act of 2002 | ||
32.2 | Certification of Chief Financial Officer pursuant to Section 906 of the Sarbanes-Oxley Act of 2002 | ||
- *
- Management contract or compensatory plan or arrangement
97
Pursuant to the requirements of Section 13 or 15(d) of the Securities Exchange Act of 1934, the registrant has duly caused this report to be signed on its behalf by the undersigned, thereunto duly authorized.
| POLYPORE INTERNATIONAL, INC. | ||||
By: | /s/ ROBERT B. TOTH Robert B. Toth President and Chief Executive Officer | |||
Date: March 10, 2009
Pursuant to the requirements of the Securities Exchange Act of 1934, this report has been signed below by the following persons on behalf of the registrant and in the capacity and on the dates indicated.
/s/ ROBERT B. TOTH Robert B. Toth | President, Chief Executive Officer | March 10, 2009 | ||
/s/ LYNN AMOS Lynn Amos | Chief Financial Officer | March 10, 2009 | ||
/s/ MICHAEL GRAFF Michael Graff | Chairman of the Board | March 10, 2009 | ||
/s/ DAVID BARR David Barr | Director | March 10, 2009 | ||
/s/ CHARLES L. COONEY Charles L. Cooney | Director | March 10, 2009 | ||
/s/ WILLIAM DRIES William Dries | Director | March 10, 2009 | ||
/s/ FREDERICK C. FLYNN, JR. Frederick C. Flynn, Jr. | Director | March 10, 2009 | ||
/s/ W. NICHOLAS HOWLEY W. Nicholas Howley | Director | March 10, 2009 | ||
/s/ KEVIN KRUSE Kevin Kruse | Director | March 10, 2009 |
98
Polypore International, Inc.
Financial statement schedule—Valuation and qualifying accounts
For the years ended January 3, 2009, December 29, 2007 and December 30, 2006
| | | Additions | | | |||||||||||||
|---|---|---|---|---|---|---|---|---|---|---|---|---|---|---|---|---|---|
(in thousands) | Balance at beginning of year | Charged to costs and expenses | Charged to other accounts | Deductions | Balance at end of year | ||||||||||||
Year ended January 3, 2009: | |||||||||||||||||
Allowance for doubtful accounts | $ | 8,812 | $ | (152 | ) | $ | (302 | )(1) | $ | (616 | )(2) | $ | 7,742 | ||||
Valuation allowance of deferred tax asset | 6,050 | 10,812 | (493 | ) | (946 | ) | 15,423 | ||||||||||
| $ | 14,862 | $ | 10,660 | $ | (795 | ) | $ | (1,562 | ) | $ | 23,165 | ||||||
Year ended December 29, 2007: | |||||||||||||||||
Allowance for doubtful accounts | $ | 8,610 | $ | 134 | $ | 775 | (1) | $ | (707 | )(2) | $ | 8,812 | |||||
Valuation allowance of deferred tax asset | 6,200 | — | (150 | ) | 6,050 | ||||||||||||
| $ | 14,810 | $ | 134 | $ | 775 | $ | (857 | ) | $ | 14,862 | |||||||
Year ended December 30, 2006: | |||||||||||||||||
Allowance for doubtful accounts | $ | 6,815 | $ | 1,887 | $ | 530 | (1) | $ | (622 | )(2) | $ | 8,610 | |||||
Valuation allowance of deferred tax asset | 4,037 | 2,163 | — | — | 6,200 | ||||||||||||
| $ | 10,852 | $ | 4,050 | $ | 530 | $ | (622 | ) | $ | 14,810 | |||||||
- (1)
- Foreign currency translation adjustment.
- (2)
- The amount represents charge-offs net of recoveries.
S-1
Polypore International, Inc. Index to Annual Report on Form 10-K For the Fiscal Year Ended January 3, 2009
Forward-looking Statements
- Item 1B. Unresolved Staff Comments
Item 2. Properties
Item 3. Legal Proceedings
Item 4. Submission of Matters to a Vote of Security Holders
- Item 5. Market for Registrant's Common Equity, Related Stockholder Matters and Issuer Purchases of Equity Securities
Item 6. Selected Financial Data
Report of Independent Registered Public Accounting Firm
Polypore International, Inc. Consolidated balance sheets
Polypore International, Inc. Consolidated statements of operations
Polypore International, Inc. Consolidated statements of shareholders' equity
Polypore International, Inc. Consolidated statements of cash flows
Polypore International, Inc. Notes to consolidated financial statements
Condensed Consolidating Balance Sheet As of January 3, 2009
Condensed Consolidating Balance Sheet As of December 29, 2007
Condensed Consolidating Statement of Operations For the year ended January 3, 2009
Condensed Consolidating Statement of Operations For the year ended December 29, 2007
Condensed Consolidating Statement of Operations For the year ended December 30, 2006
Condensed Consolidating Statement of Cash Flows For the year ended January 3, 2009
Condensed Consolidating Statement of Cash Flows For the year ended December 29, 2007
Condensed Consolidating Statement of Cash Flows For the year ended December 30, 2006
- Item 9. Changes in and Disagreements With Accountants on Accounting and Financial Disclosure
Item 9A. Controls and Procedures
Item 9B. Other Information
- Item 10. Directors, Executive Officers and Corporate Governance
Item 11. Executive Compensation
Item 12. Security Ownership of Certain Beneficial Owners and Management and Related Stockholder Matters
Item 13. Certain Relationships and Related Transactions, and Director Independence
Item 14. Principal Accountant Fees and Services
Signatures
Polypore International, Inc. Financial statement schedule—Valuation and qualifying accounts