Filed by Abington Community Bancorp, Inc.
Pursuant to Rule 425 under the
Securities Act of 1933 and deemed
filed pursuant to Rule 14a-12 of
the Securities Exchange Act of 1934
Subject Company: Abington Bancorp, Inc.
Commission File No.: 333-142543
EXPLANATORY NOTE
Attached are additional materials provided to certain
offerees in the syndicated community offering of
Abington Bancorp, Inc.
Abington Bancorp, Inc. has filed a registration statement (including a prospectus) with the SEC for the offering to which this communication relates. Before you invest, you should read the prospectus in that registration statement and other documents Abington Bancorp, Inc. has filed with the SEC for more complete information about the issuer and this offering. You may get these documents for free by visiting EDGAR on the SEC Web site at www.sec.gov. Alternatively, Abington Bancorp, Inc., any underwriter or any dealer participating in the offering will arrange to send you the prospectus if you request it by calling (215) 885-2987. Abington Bancorp, Inc. Syndicated Stock Offering NSADAQ: ABBC June 2007

2 DisclaimerThis presentation is for informational purposes only and does not constitute an offer to sell shares of common stock of Abington Bancorp, Inc. Please refer to the prospectus dated May 14, 2007. Certain comments made in the course of this presentation by Abington are forward-looking in nature. These include all statements about Abington’s operating results or financial position for periods ending or on dates occurring after March 31, 2007 and usually use words such as “expect”, “anticipate”, “believe”, and similar expressions. These comments represent management’s current beliefs, based upon information available to it at the time the statements are made with regard to the matters addressed. All forward looking statements are subject to risks and uncertainties that could cause Abington’s actual results or financial condition to differ materially from those expressed in or implied by such statements. Factors of particular importance to Abington include, but are not limited to: (1) changes in general economic conditions, including interest rates; (2) competition among providers of financial services; (3) potential improvements or deterioration in asset quality; (4) changes in accounting and regulatory guidance applicable to banks; (5) failure to effectively utilize the net proceeds of the offering; and (6) price levels and conditions in the public securities market generally. Please refer to the Prospectus for additional factors. Abington does not undertake any obligation to update or revise any forward-looking statements, whether as a result of new information, future events or otherwise.


4Our roots run deep…In 1867, a group of influential residents of Abington Township met at the Phoenix Hotel, then located at the southwest corner of Old York Road and West Avenue in Jenkintown. At this meeting, the first building and loan association in Jenkintown was founded. The most noteworthy member of the Association was the Bank’s 1st Treasurer, Abel Satterthwaite. Mr. Satterthwaite was born in 1822 to Susannah Claypooleand Abel Satterthwaite. Abel’s maternal grandmother (Susannah’s mother) was Elizabeth Griscom Ross Claypoole, who is more commonly known as Betsy Ross, the lady who sewed the first American Flag! More recently, we successfully completed our reorganization from a mutual savings bank to a stock savings bank in the mutual holding company form on December 16th, 2004 and our parent company, Abington Community Bancorp, Inc., was listed on the NASDAQ National Market System under the symbol ABBC. On April 4th, 2005, Abington Community Bancorp, Inc. rang the opening bell on NASDAQ’s Stock Market in Times Square.

5 Our roots run deep…In 2006, Abington Community Bancorp, Inc. was recognized in U.S. Banker’s annual performance ranking of the top 200 publicly-traded community banks, based on three-year average return on equity. On June 30th, 2006, ABBC was added to the Russell 3000 Index’s annual reconstitution of the top 3,000 U.S. public companies with the highest market capitalization. This summer, we expect to complete our second-step conversion and stock offering, through which we will concert from a mutual holding company structure to a fully-public ownership structure. We believe that this conversion and stock offering will increase liquidity in our common stock and provide additional capital to support our future growth. Abington Bank is seventeen branches strong and growing. As we celebrate our 140th anniversary and approach the $1 billion dollar mark, we continue to take great pride in the personal service and fast decision-making that has become synonymous with Abington Bank.

6Syndicated Offering Highlights • Shares sold in subscription and community offering:7,533,675 • Shares to be allocated to ESOP (at midpoint):1,195,200 • Anticipated shares to be sold in Syndicated Offering:7,271,125 • Price per share:$10.00 (5.5% gross spread)•Individual purchase limitation:$7,500,000 • In-concert limitation:$8,000,000•Offering Range expectation:Midpoint • Exchange ratio at midpoint:1.83308 • Expected annualized dividend:$.12 per share • Insider ownership at maximum:3% (benefit plans included) • Listing / Ticker:NASDAQ / ABBC (1)•Syndicated Offering lead manager:Keefe, Bruyette & Woods • Expected Pricing:Week of June 18th•Expected Trading: Week of June 25th(1) For a period of 20 trading days after closing of the offering Abington’s common stock will trade under the symbol “ABBCD”. Thereafter, Abington’s trading symbol will revert to ABBC.
7 Management Participants Robert W. White Chairman, President and CEO Jack Sandoski Chief Financial Officer
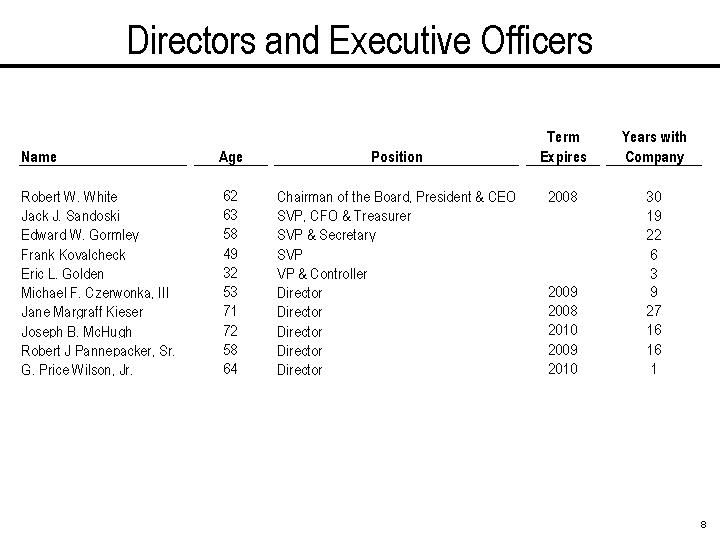
8Directors and Executive Officers Name Age Position Term Expires Years with Company Robert W. White 62 Chairman of the Board, President & CEO 2008 30 Jack J. Sandoski 63 SVP, CFO & Treasurer 19 Edward W. Gormley 58 SVP & Secretary 22 Frank Kovalcheck 49 SVP6Eric L. Golden 32 VP & Controller 3 Michael F. Czerwonka, III 53 Director 2009 9 Jane Margraff Kieser 71 Director 2008 27 Joseph B. McHugh 72 Director 2010 16 Robert J Pannepacker, Sr. 58 Director 2009 16 G. Price Wilson, Jr. 64 Director 2010 1
9Overview of Second Step Conversion CURRENT OWNERSHIP STRUCTURE Abington Bank100% of common stock Abington Community Bancorp, Inc.42.9% of common stock57.1% of common stock Public Stockholders Abington Mutual Holding Company OWNERSHIP STRUCTURE FOLLOWING THE OFFERING Abington Bank100% of common stock Abington Bancorp, Inc.100% of common stock Public Stockholders

10Investment Highlights • Experienced management team that prides itself on their ability to maintain financial stability through risk management, sound financial condition and consistent earnings. • Strong Asset Quality -bank does not have a collection department because they have not needed it. • Since its mutual holding company reorganization in 2004, the bank has added three additional full service and two limited service banking office. They plan to open two additional full service banking offices in 2007. They also plan to add two additional de novo full service branch offices in Montgomery and Bucks Counties in 2008 and two more in 2009 as well as two or three more limited service offices by the end of 2009.•Abington Community Bancorp, Inc. has paid quarterly cash dividends in each quarter since the second quarter of 2005.

11Pro Forma Summary Midpoint Shares Sold in Offering16,000,000Shares to be Exchanged 12,024,341 Pro Forma Shares Outstanding 28,024,341 Offering Price per Share $10.00 Gross Proceeds ($000s) $160,000 Pro Forma Tangible Stockholders’ Equity per Share $9.15 Price to Tangible Book 109.3% Price to Earnings 27.0x Exchange Ratio 1.83308 Capital Ratio 21.9%
12 Growth Highlights 2001 2002 2003 2004 2005 2006 Total Assets ($000) For the Year Ended Dec. 31CAGR: 14.2% -200,000 400,000 600,000 800,000 2001 2002 2003 2004 2005 2006 Loans, net ($000).For the Year Ended Dec. 31CAGR: 11.6% - 200,000 400,000 600,000 2001 2002 2003 2004 2005 2006 Deposits ($000).CAGR: 13.7% For the Year Ended Dec. 31
13 Loan Portfolio at 12/31/06 1-4 Family 57% Construction 21% Comm RE & Mult Fam 14% HELOC 5% Commercial 2% Consumer Non-RE Loans 1% Net Charge-Offs / Avg. Loans NPAs / Total Assets 0.00% 0.20% 0.40% 0.60% 2001 2002 2003 2004 2005 2006 Net Charge-Offs / Avg Loans Reserves / Loans 0.00% 0.08% 0.16% 0.24% 0.32% 0.40% 2001 2002 2003 2004 2005 2006 Total Loan Portfolio Yield 6.71%
 14
1414 Deposit Portfolio at 12/31/06 Non-Interest Bearing Checking8%Interest Bearing Checking 10% Savings & MMDAs 16% CD's 66% DEPOSIT GROWTH BY BRANCH Jun-06 Jun-05 Jun-04 Deposits Deposits Deposits 04 to '06 Branch Address City County, State ($000s) ($000s) ($000s)CAGR 1180 Old York Rd Jenkintown Montgomery, PA 182,389 153,446 93,507 39.7% 2273 Keswick Ave Glenside Montgomery, PA 80,349 79,294 76,406 2.5% 3275 Moreland Rd Willow Grove Montgomery, PA 73,011 69,603 63,109 7.6% 4990 Old York Rd Abington Montgomery, PA 55,76553,75756,051-0.3% 5Rt 611 & County Line Rd Horsham Montgomery, PA 36,887 24,222 23,658 24.9% 610000 Ann's Choice Way Warminster Bucks, PA33,10017,9378,026103.1%7667 Welsh Rd Huntingdon Valley Montgomery, PA27,81922,99118,68622.0%8521 Stump Rd North Wales Montgomery, PA27,75720,10518,05424.0%9101 Fort Washington Ave Fort Washington Montgomery, PA26,15222,08420,23413.7%101515 The Fairway Jenkintown Montgomery, PA10,0848,2296,45725.0%111001 Easton Rd Willow Grove Montgomery, PA5,3253,8502,34950.6%1212106 Centennial Rd Warminster Bucks, PA3,6882,9651,94537.7%131111 Easton Rd Warrington Bucks, PA1,740NANANATotals:564,066478,483388,482Source: FDIC website Total Deposit Portfolio Cost of Funds3.43%
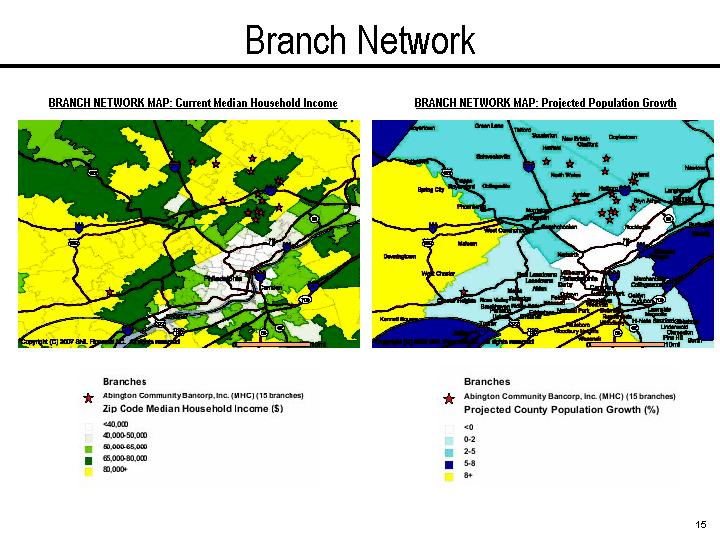
15 Branch Network BRANCH NETWORK MAP: Projected Population Growth BRANCH NETWORK MAP: Current Median Household Income
16 Dividend History Abington Community Bancorp, Inc.0.0000 0.0100 0.0200 0.0300 0.0400 0.0500 0.0600 0.0700 0.0800 6/22/2005 9/21/2005 12/21/2005 3/22/2006 6/21/2006 9/20/2006 12/27/2006 3/28/2007 6/20/2007 Pay Date Dividend Dividend Yield as of 6/15/07: 1.63%

17Historical Financial HighlightsYear to Date'02 - '0612/31/2002 12/31/2003 12/31/2004 12/31/2005 12/31/2006 3/31/2007 CAGR Balance Sheet Total Assets ($000s) 535,797 604,439 717,978 844,072 925,186 951,160 14.6% Total Net Loans ($000s) 371,024 364,620 412,656 529,487 605,063 628,953 13.0% Deposits ($000s) 344,336 362,666 405,290 501,183 587,002 615,854 14.3% Borrowings ($000s) 134,698 182,413 183,532 217,559 214,074 206,299 12.3% Total Equity ($000s)50,591 53,234 123,055 117,231 114,102 115,602 22.5% Profitability Net Income ($000s)4,377 4,090 4,555 6,302 6,802 1,462 11.7% ROAA (% )0.86 0.70 0.70 0.79 0.77 0.63 ROAE (% )9.11 7.85 7.52 5.27 5.94 5.09 Net Interest Margin (% )3.50 2.88 2.67 2.78 2.68 2.50 Efficiency Ratio (% )59.1 63.9 63.6 62.9 61.9 67.8 Noninterest Inc./Operating Rev (% )4.0 10.4 11.9 11.8 11.3 11.1 Balance Sheet RatiosLoans/Deposits (% )108.3 100.9 102.2 105.9 103.4 102.4 Equity/Assets (% )9.4 8.8 17.1 13.9 12.3 12.2 Tg. Equity/Tg. Assets (% )9.4 8.8 17.1 13.9 12.3 12.2 Per Share Information Shares Outstanding (Actual)NANA15,870,000 15,870,000 15,288,454 15,288,154 Book Value per Share ($)NANA7.75 7.39 7.46 7.56 Tg. Book Value per Share ($)NANA7.75 7.39 7.46 7.56 Earnings per Share ($)NANANA0.41 0.45 0.10 Cash Dividends per Share ($)NANA- 0.15 0.23 0.06 Market Multiple sPrice/Book (% )NANA172.4 175.6 257.0 262.6 Price/Tg. Book (% )NANA172.4 175.6 257.0 262.6 Price/EPS (% )NANANA31.6 42.6 49.7 Source: SNL Securites, LC At or for the year ended,

18Pro Forma Peer Group Comparison Financial DataValuation /Price Performance Asset Quality TangiblePrice/1-YearTotalEquity/Eff.Tang.LTMPrice NPLs/NPAs/AssetsAssetsROAAROAENIMRatioBookBookEPSChangeLoansAssetsNPLsLoansInstitution Name (Ticker)($MM)(%)(%)(%)(%)(%)(%)(%)(x)(%)(%)(%)(%)(%)1ESB Financial Corporation - (ESBF)1,905.1 4.7 0.517.841.5861.7 109.1 165.2 14.9 (7.1) 0.5 0.2 179.8 0.9 2Parkvale Financial Corporation - (PVSA)1,825.3 5.4 0.7110.582.1856.2 130.7 172.9 12.9 3.7 0.4 0.4 316.6 1.2 3Willow Financial Bancorp, Inc. - (WFBC)1,533.2 7.0 0.654.853.5268.5 90.9 191.3 19.1 (24.1) 0.7 0.6 188.5 1.3 4FMS Financial Corporation - (FMCO)1,169.3 6.7 0.416.282.9379.5 245.5 248.6 39.8 83.5 0.9 0.3 137.8 1.2 5Westfield Financial, Inc. - (WFD)1,014.1 28.9 0.623.333.1069.2 109.1 109.1 55.7 35.4 0.3 0.1 516.6 1.5 6Benjamin Franklin Bancorp, Inc. - (BFBC)891.2 8.5 0.453.722.9682.5 107.2 161.4 28.8 7.5 0.4 0.3 223.2 1.0 7Severn Bancorp, Inc. - (SVBI)912.3 9.8 1.6818.344.3536.1 195.8 196.5 11.4 (3.4) 0.7 0.8 168.6 1.1 8Great Lakes Bancorp, Inc. - (GLK)904.8 15.0 -0.16-1.111.99106.5 107.3 107.3 NM(26.3) 0.7 0.4 107.1 0.7 9MASSBANK Corp. - (MASB)828.2 13.0 0.866.962.4953.0 130.9 132.2 19.5 0.1 0.1 0.0 933.8 0.7 10Legacy Bancorp, Inc. - (LEGC)822.6 17.3 0.281.523.1078.9 105.3 107.6 61.9 (1.0) 0.4 0.3 197.0 0.8 11Carver Bancorp, Inc. - (CNY)735.6 6.2 0.375.243.4484.6 77.7 88.7 15.8 (5.3) NA0.6 NA0.9 12Harleysville Savings Financial Corporation - (HARL)763.6 6.4 0.477.491.6667.1 128.1 128.1 17.7 (8.9) 0.1 0.0 787.9 0.5 13Fidelity Bancorp, Inc. - (FSBI)728.2 6.0 0.569.412.1070.1 114.9 122.2 13.1 (1.6) 0.6 0.4 108.4 0.6 14Hingham Institution for Savings - (HIFS)699.4 7.5 0.648.352.3860.1 129.5 129.5 15.9 (11.5) 0.1 0.1 840.5 0.7 15New Hampshire Thrift Bancshares, Inc. - (NHTB)654.6 5.4 0.719.832.8270.7 124.4 167.7 13.2 (11.2) 0.1 0.1 699.5 0.8 16TF Financial Corporation - (THRD)661.6 9.6 0.868.783.5567.2 121.9 130.2 14.4 3.3 0.6 0.4 103.1 0.6 17Pamrapo Bancorp, Inc. - (PBCI)639.9 9.2 0.9310.023.3160.1 173.9 173.9 17.1 3.5 0.2 0.1 403.7 0.6 Average:980.0 9.9 0.637.062.7868.6 135.1 153.4 24.1 3.1 0.4 0.3 351.7 0.8 Median:859.7 8.0 0.637.232.8867.9 123.2 146.8 17.1 (1.3) 0.4 0.3 197.0 0.8 Abington Bancorp, Inc. (Pro Forma) At Min:1,061.2 22.2 0.883.952.68* 61.93* 101.2 101.2 23.8 0.4* 0.3* 68.3* 0.3* At Mid:1,085.2 23.6 0.903.79109.3 109.3 27.0 At Max:1,109.2 25.0 0.913.66116.1 116.1 29.4 At Supr:1,136.8 26.6 0.943.52122.9 122.9 32.3 * Historical NumbersROAE - Return on average equityEPS - Earnings per shareMHCs not includedROAA - Return on average assetsLTM - Last twelve monthsSource: SNL Financial, LCReserves toLTMPricing as of 6/12/07Thrifts in the Mid-Atlantic and Northeast Regions with Assets Between $600 Million and $2 Billion

19 Price Performance 12/17/04 -6/12/07 $8.00 $10.00 $12.00 $14.00 $16.00 $18.00 $20.00 $22.00 6/12/07 4/30/07 3/16/07 2/1/07 12/15/06 11/2/06 9/21/06 8/9/06 6/27/06 5/15/06 3/31/06 2/16/06 1/4/06 11/18/05 10/7/05 8/25/05 7/14/05 6/1/05 4/19/05 3/7/05 Price-25,000 50,000 75,000 100,000 125,000 150,000 175,000 200,000 225,000 250,000 275,000 300,000 325,000 350,000 375,000 400,000Volum ePrice Volume 11/30/2006: Announced 2nd Step 6/26/06: 809,272 shares traded on the announcment of being added to the Russell 3000 Index.12/17/04: 1.8 million shares traded Price/Volume Chart
20 Thank you! Syndicated Stock Offering NASDAQ: ABBC June 2007 Abington Bancorp, Inc.