Exhibit 99.1
Front Cover Theme
Sustainability is integrated into every facet of Vermilion’s business. This 25-hectare greenhouse is an example of how Vermilion reduces greenhouse emissions with geothermal energy. Byproduct water steam is piped into the greenhouse from Vermilion’s adjacent production facility in Parentis-en-Born, France. The result is an economically and ecologically viable greenhouse operation growing tomatoes with heat generated without carbon emissions.
Across the company, Vermilion has decreased our emissions intensity on a per unit of production basis. This isdue to our energy efficiency programs, emission reduction initiatives and an operational structure that maximizes production while reducing our footprint and energy consumption intensity.
Read more about Vermilion's renewable energy projects in our Sustainability Report online at www.vermilionenergy.com.
Disclaimer
Certain statements included or incorporated by reference in this document may constitute forward looking statements or financial outlooks under applicable securities legislation. Such forward looking statements or information typically contain statements with words such as "anticipate", "believe", "expect", "plan", "intend", "estimate", "propose", or similar words suggesting future outcomes or statements regarding an outlook. Forward looking statements or information in this document may include, but are not limited to: capital expenditures; business strategies and objectives; operational and financial performance; estimated reserve quantities and the discounted net present value of future net revenue from such reserves; petroleum and natural gas sales; future production levels (including the timing thereof) and rates of average annual production growth; exploration and development plans; acquisition and disposition plans and the timing thereof; operating and other expenses, including the payment and amount of future dividends; royalty and income tax rates; and the timing of regulatory proceedings and approvals.
Such forward looking statements or information are based on a number of assumptions, all or any of which may prove to be incorrect. In addition to any other assumptions identified in this document, assumptions have been made regarding, among other things: the ability of Vermilion to obtain equipment, services and supplies in a timely manner to carry out its activities in Canada and internationally; the ability of Vermilion to market crude oil, natural gas liquids, and natural gas successfully to current and new customers; the timing and costs of pipeline and storage facility construction and expansion and the ability to secure adequate product transportation; the timely receipt of required regulatory approvals; the ability of Vermilion to obtain financing on acceptable terms; foreign currency exchange rates and interest rates; future crude oil, natural gas liquids, and natural gas prices; and management’s expectations relating to the timing and results of exploration and development activities.
Although Vermilion believes that the expectations reflected in such forward looking statements or information are reasonable, undue reliance should not be placed on forward looking statements because Vermilion can give no assurance that such expectations will prove to be correct. Financial outlooks are provided for the purpose of understanding Vermilion’s financial position and business objectives, and the information may not be appropriate for other purposes. Forward looking statements or information are based on current expectations, estimates, and projections that involve a number of risks and uncertainties which could cause actual results to differ materially from those anticipated by Vermilion and described in the forward looking statements or information. These risks and uncertainties include, but are not limited to: the ability of management to execute its business plan; the risks of the oil and gas industry, both domestically and internationally, such as operational risks in exploring for, developing and producing crude oil, natural gas liquids, and natural gas; risks and uncertainties involving geology of crude oil, natural gas liquids, and natural gas deposits; risks inherent in Vermilion's marketing operations, including credit risk; the uncertainty of reserves estimates and reserves life and estimates of resources and associated expenditures; the uncertainty of estimates and projections relating to production and associated expenditures; potential delays or changes in plans with respect to exploration or development projects; Vermilion's ability to enter into or renew leases on acceptable terms; fluctuations in crude oil, natural gas liquids, and natural gas prices, foreign currency exchange rates and interest rates; health, safety, and environmental risks; uncertainties as to the availability and cost of financing; the ability of Vermilion to add production and reserves through exploration and development activities; the possibility that government policies or laws may change or governmental approvals may be delayed or withheld; uncertainty in amounts and timing of royalty payments; risks associated with existing and potential future law suits and regulatory actions against Vermilion; and other risks and uncertainties described elsewhere in this document or in Vermilion's other filings with Canadian securities regulatory authorities.
The forward looking statements or information contained in this document are made as of the date hereof and Vermilion undertakes no obligation to update publicly or revise any forward looking statements or information, whether as a result of new information, future events, or otherwise, unless required by applicable securities laws.
Natural gas volumes have been converted on the basis of six thousand cubic feet of natural gas to one barrel of oil equivalent. Barrels of oil equivalent (boe) may be misleading, particularly if used in isolation. A boe conversion ratio of six thousand cubic feet to one barrel of oil is based on an energy equivalency conversion method primarily applicable at the burner tip and does not represent a value equivalency at the wellhead.
Financial data contained within this document are reported in Canadian dollars, unless otherwise stated.
Vermilion Energy Inc. ■ Page 1 ■ 2018 First Quarter Report |
Highlights
| • | Subsequent to the end of the quarter, on April 16, 2018, we announced that we had entered into an arrangement agreement ("Arrangement") to acquire Spartan Energy Corp. (“Spartan”), a publicly traded southeast Saskatchewan oil and gas producer, for total consideration of approximately $1.40 billion (comprised of $1.23 billion in Vermilion common shares based on Vermilion's closing share price of $44.04 on April 13, 2018, plus the assumption of approximately $175.0 million in debt). The Arrangement is subject to customary closing conditions, including receipt of applicable court, Spartan shareholder, and other regulatory approvals and is expected to close on or about June 15, 2018. |
| • | Q1 2018 production decreased by 4% from the prior quarter to 70,167 boe/d. The decrease was primarily due to the planned shut-in of the Eesveen-02 well in the Netherlands following a 2-month in-line production test during Q4 2017, cold weather downtime and third party maintenance in Canada and the US, and the temporary shut-in of gas at a German site for instrumentation installation. |
| • | Without inclusion of the Spartan assets, we expect production to increase each quarter throughout 2018 and to achieve our previous full year production guidance of 75,000 to 77,500 boe/d. Including production for the Spartan acquisition after closing, our revised production guidance is 86,000 to 90,000 boe/d. |
| • | Fund flows from operations (“FFO”) for Q1 2018 was $157 million ($1.29/basic share(1)), a decrease of 13% from the prior quarter as the benefit of higher commodity pricing was more than offset by lower production volumes, higher realized losses on derivatives, a stronger Euro currency and the absence of a favourable tax adjustment in the Netherlands. Year-over-year, FFO increased 10% as compared to Q1 2017 on the strength of higher production and commodity prices. |
| • | During the quarter, our Board of Directors approved a 7% increase to the monthly dividend to $0.23 per share from $0.215 per share, effective with the April 2018 dividend to be paid on May 15, 2018. |
| • | In Ireland, production from Corrib averaged 61 mmcf/d (10,144 boe/d) in Q1 2018, an increase of 8% from Q4 2017. As reported in the Q3 2017 release, Corrib had an unplanned downtime period following a plant turnaround that commenced in early September and extended through October 10th. This downtime reduced Vermilion’s Q4 2017 production by approximately 1,200 boe/d. The absence of this downtime in Q1 2018 was partially offset by the initiation of decline from the Corrib gas field, as expected from our reservoir modeling. |
| • | In France, we drilled three (3.0 net) wells in the Champotran field, including a side-track from an existing well. Two of the new Champotran wells were brought on production late in the quarter at a combined rate of 780 boe/d over the final two weeks of March. The side-track well is scheduled to be brought on production mid-Q2 2018. |
| • | As reported as a subsequent event with our Q4 2017 release, we drilled and tested our first exploratory well (100% working interest) in Hungary on our South Battonya concession. The Mh-Ny-07 natural gas well tested at a rate of 5.8 mmcf/d(2) and is expected to be brought on production mid-2018. This marks the drilling of our first well in the Central and Eastern Europe Business Unit. |
| • | In Canada, production averaged 32,078 boe/d in Q1 2018, representing a 3% decrease from the previous quarter primarily due to cold weather downtime and planned maintenance on third party infrastructure. These events more than offset new well production as most wells drilled in the quarter were not completed and brought on production until late in the quarter or in early Q2 2018. During the quarter, we announced and closed an acquisition of a private company with light oil producing assets straddling the Saskatchewan and Manitoba border, near Vermilion's existing operations in southeast Saskatchewan. |
| • | Vermilion was recently ranked 11th by Corporate Knights on the Future 40 Responsible Corporate Leaders in Canada list. This marks the fifth year in a row that Vermilion has been recognized by Corporate Knights as one of Canada's top sustainability performers. Vermilion continues to be the highest rated oil and gas company on the list. |
| (1) | Non-GAAP Financial Measure. Please see the “Non-GAAP Financial Measures” section of Management’s Discussion and Analysis. |
| (2) | Mh-Ny-07 well tested gas at a rate of 5.8 mmcf/d over the final two hours of a 22 hour test period at a stabilized wellhead pressure of 1,065 psi on a 0.55 inch diameter choke and a shut-in wellhead pressure of 1,305 psi. No water production was observed during testing. The well logged 21 feet of net gas pay with an average porosity of 31% from an Upper Miocene Pannonian sandstone occurring within a gross measured depth interval of 3,438-3,465 feet. |
Vermilion Energy Inc. ■ Page 2 ■ 2018 First Quarter Report |
| ($M except as indicated) | Q1 2018 | Q4 2017 | Q1 2017 | ||||||
| Financial | |||||||||
| Petroleum and natural gas sales | 318,269 | 317,341 | 261,601 | ||||||
| Fund flows from operations | 157,480 | 181,253 | 143,434 | ||||||
| Fund flows from operations ($/basic share)(1) | 1.29 | 1.49 | 1.21 | ||||||
| Fund flows from operations ($/diluted share)(1) | 1.27 | 1.47 | 1.19 | ||||||
| Net earnings | 25,139 | 8,645 | 44,540 | ||||||
| Net earnings ($/basic share) | 0.21 | 0.07 | 0.38 | ||||||
| Capital expenditures | 128,618 | 74,303 | 95,889 | ||||||
| Acquisitions | 93,078 | 3,048 | 2,620 | ||||||
| Asset retirement obligations settled | 3,591 | 3,216 | 2,249 | ||||||
| Cash dividends ($/share) | 0.645 | 0.645 | 0.645 | ||||||
| Dividends declared | 79,005 | 78,653 | 76,593 | ||||||
| % of fund flows from operations | 50 | % | 43 | % | 53 | % | |||
| Net dividends(1) | 59,364 | 56,836 | 41,087 | ||||||
| % of fund flows from operations | 38 | % | 31 | % | 29 | % | |||
| Payout(1) | 191,573 | 134,355 | 139,225 | ||||||
| % of fund flows from operations | 122 | % | 74 | % | 97 | % | |||
| Net debt | 1,514,645 | 1,371,790 | 1,377,636 | ||||||
| Ratio of net debt to annualized fund flows from operations | 2.4 | 1.9 | 2.4 | ||||||
| Operational | |||||||||
| Production | |||||||||
| Crude oil and condensate (bbls/d) | 27,008 | 27,830 | 26,832 | ||||||
| NGLs (bbls/d) | 5,126 | 5,279 | 2,694 | ||||||
| Natural gas (mmcf/d) | 228.2 | 238.27 | 210.07 | ||||||
| Total (boe/d) | 70,167 | 72,821 | 64,537 | ||||||
| Average realized prices | |||||||||
| Crude oil and condensate ($/bbl) | 80.03 | 74.12 | 68.59 | ||||||
| NGLs ($/bbl) | 25.37 | 29.28 | 24.13 | ||||||
| Natural gas ($/mcf) | 5.81 | 5.23 | 5.62 | ||||||
| Production mix (% of production) | |||||||||
| % priced with reference to WTI | 21 | % | 21 | % | 17 | % | |||
| % priced with reference to AECO | 26 | % | 25 | % | 22 | % | |||
| % priced with reference to TTF and NBP | 29 | % | 30 | % | 32 | % | |||
| % priced with reference to Dated Brent | 24 | % | 24 | % | 29 | % | |||
| Netbacks ($/boe) | |||||||||
| Operating netback(1) | 31.05 | 30.77 | 31.62 | ||||||
| Fund flows from operations netback | 25.29 | 27.13 | 25.75 | ||||||
| Operating expenses | 10.99 | 9.76 | 9.35 | ||||||
| Average reference prices | |||||||||
| WTI (US $/bbl) | 62.87 | 55.40 | 51.92 | ||||||
| Edmonton Sweet index (US $/bbl) | 56.98 | 54.26 | 48.37 | ||||||
| Dated Brent (US $/bbl) | 66.76 | 61.39 | 53.78 | ||||||
| AECO ($/mmbtu) | 2.08 | 1.69 | 2.69 | ||||||
| NBP ($/mmbtu) | 9.96 | 8.70 | 7.96 | ||||||
| TTF ($/mmbtu) | 9.59 | 8.36 | 7.65 | ||||||
| Average foreign currency exchange rates | |||||||||
| CDN $/US $ | 1.26 | 1.27 | 1.32 | ||||||
| CDN $/Euro | 1.55 | 1.50 | 1.41 | ||||||
| Share information ('000s) | |||||||||
| Shares outstanding - basic | 122,769 | 122,119 | 119,046 | ||||||
| Shares outstanding - diluted(1) | 125,794 | 125,140 | 122,135 | ||||||
| Weighted average shares outstanding - basic | 122,390 | 121,858 | 118,632 | ||||||
| Weighted average shares outstanding - diluted | 124,304 | 123,450 | 120,722 | ||||||
(1)The above table includes non-GAAP financial measures which may not be comparable to other companies. Please see the “NON-GAAP FINANCIAL MEASURES” section of Management’s Discussion and Analysis.
Vermilion Energy Inc. ■ Page 3 ■ 2018 First Quarter Report |
Message to Shareholders
Our 2018 capital program is now well underway. We completed our planned 2018 drilling programs in France, Hungary, and the US, while initiating Canadian drilling and continuing to advance future projects for our other business units. Most of the wells drilled in Q1 2018 were completed and tied-in late in the first quarter or early in the second quarter and will provide meaningful contributions to our growth profile for the remainder of 2018. As previously reported, we drilled our first well in Hungary during the quarter, representing our first well in the Central and Eastern European Business Unit, and are pleased with the initial results. We are planning to drill several more wells in Hungary, Slovakia and Croatia over the coming years, and are optimistic about the future development prospects for this region. In Ireland, the transition of Corrib ownership continues to progress, with the transfer of operatorship to Vermilion expected to occur in the middle of 2018. Following the close of this transaction, we will operate approximately 90% of our production.
Subsequent to the end of the quarter, we announced the strategic acquisition of Spartan Energy Corp. (“Spartan”) for total consideration of $1.40 billion, comprised of $1.23 billion in Vermilion shares plus the assumption of approximately $175 million of Spartan’s debt. This acquisition is a value-adding investment which meets our disciplined M&A criteria and is accretive to all pertinent metrics, adding 7% to production per share, 15% to fund flows per share and 13% to total proved plus probable reserves per share. It significantly increases our position in southeast Saskatchewan, and aligns with our sustainable growth-and-income model by adding 23,000 boe/d (91% oil) of high-netback, low decline oil assets with free cash flow and strong capital efficiencies on future development. We believe that this business combination will significantly benefit both Vermilion’s existing shareholders and Spartan’s shareholders. In addition, we believe that both shareholder groups will benefit from increased scale in both our operations and in the capital markets. We look forward to integrating Spartan employees into our organization, and believe our combined enterprise will have the operating, technical and financial capability to maximize the value of these southeast Saskatchewan assets. Our news release from April 16, 2018 contains further discussion and details on the transaction.
Global commodity prices were strong during Q1 2018. With the exception of natural gas in western Canada, they have exhibited further strength in recent weeks as supply and demand fundamentals continue to improve. We continue to benefit from our exposure to global commodity benchmarks, including Brent oil which currently trades at an approximate US$5.00 per barrel premium over WTI, and European gas which is currently trading at approximately $9.00 Canadian equivalent per mmbtu. This exposure to higher global commodity prices, combined with our low cost structure, translates into strong netbacks and significant free cash flow, supporting our self-funded growth and income business model. As previously announced, we increased our monthly dividend by 7% to $0.23 per share effective with the April 2018 dividend payable May 15, 2018. This marks the fourth dividend/distribution increase since the company started paying a monthly distribution (as a trust) in 2003.
Vermilion's Q1 2018 production volumes decreased by 4% from the prior quarter to 70,167 boe/d. The decrease was primarily due to idling a well we drilled last year in the Netherlands while we await regulatory approval of our long-term production plan, cold weather related downtime and third party maintenance in North America, and the temporary shut-in of gas at a German site for instrumentation installation. Despite the expected quarter-over-quarter decrease in Q1 2018 production levels, we expect to increase production each quarter throughout 2018 to achieve our previous full year production guidance of 75,000 to 77,500 boe/d, without the inclusion of the Spartan assets. Including the Spartan acquisition, our revised production guidance is 86,000 to 90,000 boe/d.
Fund flows from operations for Q1 2018 was $157 million ($1.29/basic share(1)), a decrease of 13% from the prior quarter as the benefit of higher commodity pricing was more than offset by lower production volumes, higher realized losses on derivatives, a stronger Euro and the absence of a favourable tax adjustment in the Netherlands.
We also released our 2017 sustainability report during the quarter, highlighting the economic, environmental and social impacts of our operations, and how we integrate their associated opportunities and risks into our business strategies. One of Vermilion’s defining strengths is our belief that sharing our success is essential to being a success. We have embedded this philosophy in our mission, and we continue to live it today. Our objective is to ensure that our all of our stakeholders, including shareholders, employees, communities and partners, benefit from our achievements.
| Q1 2018 Operations Review |
Europe
In France, Q1 2018 production averaged 11,037 boe/d, a decrease of 2% from the prior quarter. The decrease was primarily due to production declines and higher than normal well downtime resulting from cold weather, which more than offset new well production. We drilled two (2.0 net) wells in the Neocomian field in Q1 2018, which were put on production at a combined initial rate of approximately 190 bbls/d. We also drilled three (3.0 net) wells in the Champotran field in Q1 2018, including a sidetrack well from an existing well. The two grassroots Champotran wells were brought on production late in the quarter and produced at a combined rate of 780 boe/d over the final two weeks of March. The side-track well is scheduled to be brought on production mid-Q2 2018.
Vermilion Energy Inc. ■ Page 4 ■ 2018 First Quarter Report |
Production in the Netherlands averaged 7,541 boe/d in Q1 2018, a decrease of 20% from the prior quarter. The decrease was primarily due to the shut-in of the Eesveen-02 test well near the end of Q4 2017 and a planned workover on a key well. The test rate from the Eesveen-02 well (60% working interest) was approximately 10 mmcf/d net over a two-month period during Q4 2017. The Eesveen-02 well is expected to be brought on production in mid-2018. Production in the first quarter was also impacted by downtime on one of our key wells for a successful workover to upsize the tubing to increase its production rate, resulting in approximately two weeks of downtime.
In Ireland, production from Corrib averaged 61 mmcf/d (10,144 boe/d) in Q1 2018, an 8% increase from Q4 2017 due to the absence of significant downtime during the quarter. Production in Q4 was impacted by an unplanned downtime period following a plant turnaround during September and October 2017. This downtime reduced Vermilion’s Q4 2017 production by approximately 1,200 boe/d, as previously reported. The increase in quarter-over-quarter production was partially offset by the initiation of decline on the Corrib gas field, which began in Q1 2018 as predicted from numerical reservoir simulation. We continue to work closely with Canada Pension Plan Investment Board (“CPPIB”) and Shell on the transition of ownership and operations from Shell to CPPIB and Vermilion, and anticipate closing the transaction in mid-2018.
In Germany, production in Q1 2018 averaged 3,777 boe/d, a decrease of 10% from the previous quarter. The decrease was primarily due to a temporary shut-in of one gas well for a SCADA installation in December, as previously reported. The well was brought back on production in mid-Q1 2018. In addition, higher than normal downtime at a non-operated gas processing plant in the quarter also negatively impacted production. Our capital activity in Germany continues to focus on well workover and optimization projects on our operated assets and planning activities related to the Burgmoor Z5 well to be drilled in early 2019.
In Hungary, we drilled and tested our first exploratory well (100% working interest) in the South Battonya concession, as previously reported. The Mh-Ny-07 natural gas well tested at a rate of 5.8 mmcf/d(2) during the test period and is expected to be brought on production mid-2018.
North America
In Canada, production averaged 32,078 boe/d in Q1 2018, representing a 3% decrease from the previous quarter primarily due to cold weather related downtime and planned maintenance on third party infrastructure. These events more than offset new well production because most wells drilled in the quarter were not completed and brought on production until late in the quarter or early Q2 2018. We drilled or participated in 18 (16.7 net) wells and brought on production nine (8.8 net) Mannville and five (5.0 net) southeast Saskatchewan wells in Q1 2018, with almost all coming on production late in the quarter. The Q1 2018 wells currently on production are performing in-line with our existing type curves. We also announced and closed an acquisition of a private company with light oil producing assets straddling the Saskatchewan and Manitoba border near Vermilion's existing southeast Saskatchewan operations.
In the United States, Q1 2018 production averaged 618 boe/d, a decrease of 18% from the prior quarter primarily due to planned downtime for workover activity and the previously disclosed force majeure event on a third-party gas gathering system. The third-party gas gathering system returned to service mid-Q1 2018. We drilled all five (5.0 net) of the planned wells in our 2018 drilling program and completed four of these wells late in the first quarter. We continue to optimize our drilling and completion methods, with lateral lengths ranging from 1,840 to 2,215 metres, and frac stages ranging from a low of 25 to a high of 62 stages per well. The remaining well is scheduled to be completed early in Q2 2018. Through well planning optimization efforts, drilling times were reduced by 22% on a per metre basis as compared to the 2017 drilling program.
Environmental, Social and Governance ("ESG")
Vermilion was recently ranked 11th by Corporate Knights on the Future 40 Responsible Corporate Leaders in Canada list. This marks the fifth year in a row that Vermilion has been recognized by Corporate Knights as one of Canada's top sustainability performers. Vermilion continues to be the highest rated oil and gas company on the list. This recognition reflects our commitment to sustainability, transparency and performance regarding ESG matters.
Vermilion Energy Inc. ■ Page 5 ■ 2018 First Quarter Report |
Commodity Hedging
Vermilion hedges to manage commodity price exposures and increase the stability of cash flows, providing additional certainty with regards to the execution of our dividend and capital programs. In aggregate, we currently have 44% of our expected net-of-royalty production hedged for 2018. These hedges include both swaps and collars. Our diversified commodity mix, including more than a one-third cash flow contribution from relatively high-priced European natural gas, gives us unique flexibility in managing our individual commodity exposures. Based on the current level and term structures in the oil, North American gas and European gas forward curves, we have elected to lock down a greater percentage of our gas exposures, particularly for European gas. We have currently hedged 59% of anticipated European natural gas volumes for 2018. In view of the compelling longer-term forward market for European gas we have also hedged 43% and 15% of our anticipated 2019 and 2020 volumes at prices which should provide for strong project economics and free cash flows. In addition, we have hedged 35% of anticipated North American gas volumes for 2018. In view of steep backwardation in the oil forward markets, we are keeping oil hedges shorter-term, with 50% hedged for the first half of 2018, and 30% in the second half of this year. At present, our philosophy is to maintain greater torque to longer-term oil prices, with only 1% of our expected oil production hedged for 2019. We will continue to add to our hedge positions in all products as suitable opportunities arise.
Board of Directors
Mr. William Madison and Ms. Sarah Raiss have decided not to stand for re-election in 2018, following thirteen and four years of valuable service to Vermilion respectively. We would like to thank Mr. Madison and Ms. Raiss for their numerous contributions, and we wish them the very best in their retirement from our Board.
(signed “Anthony Marino”)
Anthony Marino
President & Chief Executive Officer
April 26, 2018
| (1) | Non-GAAP Financial Measure. Please see the “Non-GAAP Financial Measures” section of Management’s Discussion and Analysis. |
| (2) | Mh-Ny-07 well tested gas at a rate of 5.8 mmcf/d over the final two hours of a 22 hour test period at a stabilized wellhead pressure of 1,065 psi on a 0.55 inch diameter choke and a shut-in wellhead pressure of 1,305 psi. No water production was observed during testing. The well logged 21 feet of net gas pay with an average porosity of 31% from an Upper Miocene Pannonian sandstone occurring within a gross measured depth interval of 3,438-3,465 feet. |
Vermilion Energy Inc. ■ Page 6 ■ 2018 First Quarter Report |
Management's Discussion and Analysis
The following is Management’s Discussion and Analysis (“MD&A”), dated April 26, 2018, of Vermilion Energy Inc.’s (“Vermilion”, “we”, “our”, “us” or the “Company”) operating and financial results as at and for the three months ended March 31, 2018 compared with the corresponding periods in the prior year.
This discussion should be read in conjunction with the unaudited condensed consolidated interim financial statements for the three months ended March 31, 2018 and the audited consolidated financial statements for the year ended December 31, 2017 and 2016, together with the accompanying notes. Additional information relating to Vermilion, including its Annual Information Form, is available on SEDAR at www.sedar.com or on Vermilion’s website at www.vermilionenergy.com.
The unaudited condensed consolidated interim financial statements for the three months ended March 31, 2018 and comparative information have been prepared in Canadian dollars, except where another currency has been indicated, and in accordance with IAS 31, "Interim Financial Reporting", as issued by the International Accounting Standards Board ("IASB").
This MD&A includes references to certain financial and performance measures which do not have standardized meanings prescribed by International Financial Reporting Standards ("IFRS"). These measures include:
| • | Fund flows from operations: Fund flows from operations is a measure of profit or loss in accordance with IFRS 8 “Operating Segments”. Please see "Segmented information" in the "Notes to the condensed consolidated interim financial statements" for a reconciliation of fund flows from operations to net earnings. We analyze fund flows from operations both on a consolidated basis and on a business unit basis in order to assess the contribution of each business unit to our ability to generate income necessary to pay dividends, repay debt, fund asset retirement obligations and make capital investments. |
| • | Netbacks: Netbacks are per boe and per mcf performance measures used in the analysis of operational activities. We assess netbacksboth on a consolidated basis and on a business unit basis in order to compare and assess the operational and financial performance of each business unit versus other business units and also versus third party crude oil and natural gas producers. |
In addition, this MD&A includes references to certain financial measures which are not specified, defined, or determined under IFRS and are therefore considered non-GAAP financial measures. These non-GAAP financial measures are unlikely to be comparable to similar financial measures presented by other issuers. For a full description of these non-GAAP financial measures and a reconciliation of these measures to their most directly comparable GAAP measures, please refer to “Non-GAAP Financial Measures”.
Condensate Presentation
We report our condensate production in Canada and the Netherlands business units within the crude oil and condensate production line. We believe that this presentation better reflects the historical and forecasted pricing for condensate, which is more closely correlated with crude oil pricing than with pricing for propane, butane and ethane (collectively “NGLs” for the purposes of this report).
2018 Guidance
On October 30, 2017, we released our 2018 capital expenditure guidance of $315 million and associated production guidance of between 74,500 to 76,500 boe/d. On January 15, 2018, we increased our capital expenditure guidance to $325 million and production guidance to between 75,000 to 77,500 boe/d to reflect the post-closing impact of the acquisition of a private southeast Saskatchewan and southwest Manitoba light oil producer. On April 16, 2018, we increased our capital expenditure guidance to $430 million and production guidance to between 86,000 to 90,000 boe/d to reflect the post-closing impact of the acquisition of Spartan Energy Corp.
The following table summarizes our guidance:
| Date | Capital Expenditures ($MM) | Production (boe/d) | ||||
| 2018 Guidance | ||||||
| 2018 Guidance | October 30, 2017 | 315 | 74,500 to 76,500 | |||
| 2018 Guidance | January 15, 2018 | 325 | 75,000 to 77,500 | |||
| 2018 Guidance | April 16, 2018 | 430 | 86,000 to 90,000 | |||
Vermilion Energy Inc. ■ Page 7 ■ 2018 First Quarter Report |
Vermilion's Business
Vermilion is a Calgary, Alberta based international oil and gas producer focused on the acquisition, exploration, development and optimization of producing properties in North America, Europe, and Australia. We manage our business through our Calgary head office and our international business unit offices. This MD&A separately discusses each of our business units in addition to our corporate segment.

Vermilion Energy Inc. ■ Page 8 ■ 2018 First Quarter Report |
Consolidated Results Overview
| Q1 2018 | Q4 2017 | Q1 2017 | Q1/18 vs. Q4/17 | Q1/18 vs. Q1/17 | |||||||||
| Production | |||||||||||||
| Crude oil and condensate (bbls/d) | 27,008 | 27,830 | 26,832 | (3)% | 1% | ||||||||
| NGLs (bbls/d) | 5,126 | 5,279 | 2,694 | (3)% | 90% | ||||||||
| Natural gas (mmcf/d) | 228.20 | 238.27 | 210.07 | (4)% | 9% | ||||||||
| Total (boe/d) | 70,167 | 72,821 | 64,537 | (4)% | 9% | ||||||||
| Sales | |||||||||||||
| Crude oil and condensate (bbls/d) | 26,001 | 27,638 | 24,218 | (6)% | 7% | ||||||||
| NGLs (bbls/d) | 5,126 | 5,279 | 2,694 | (3)% | 90% | ||||||||
| Natural gas (mmcf/d) | 228.20 | 238.27 | 210.07 | (4)% | 9% | ||||||||
| Total (boe/d) | 69,159 | 72,628 | 61,923 | (5)% | 12% | ||||||||
| Build (draw) in inventory (mbbls) | 90 | 18 | 235 | ||||||||||
| Financial metrics | |||||||||||||
| Fund flows from operations ($M) | 157,480 | 181,253 | 143,434 | (13)% | 10% | ||||||||
| Per share ($/basic share) | 1.29 | 1.49 | 1.21 | (13)% | 7% | ||||||||
| Net earnings | 25,139 | 8,645 | 44,540 | 191% | (44)% | ||||||||
| Per share ($/basic share) | 0.21 | 0.07 | 0.38 | 200% | (45)% | ||||||||
| Net debt ($M) | 1,514,645 | 1,371,790 | 1,377,636 | 10% | 10% | ||||||||
| Cash dividends ($/share) | 0.645 | 0.645 | 0.645 | - % | - % | ||||||||
| Activity | |||||||||||||
| Capital expenditures ($M) | 128,618 | 74,303 | 95,889 | 73% | 34% | ||||||||
| Acquisitions ($M) | 93,078 | 3,048 | 2,620 | ||||||||||
| Gross wells drilled | 29.00 | 8.00 | 29.00 | ||||||||||
| Net wells drilled | 27.69 | 6.00 | 25.41 | ||||||||||
Vermilion Energy Inc. ■ Page 9 ■ 2018 First Quarter Report |
| Financial performance review |
Q1 2018 vs. Q4 2017
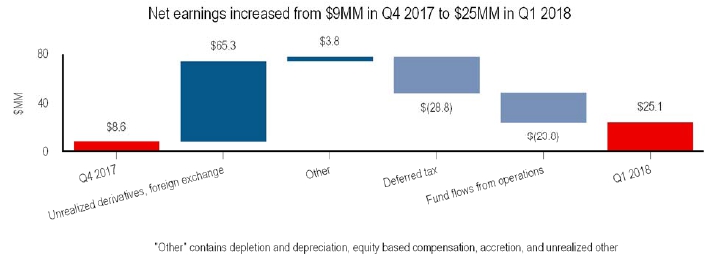
| • | Net earnings for Q1 2018 of $25.1 million ($0.21/basic share) compared to net earnings of $8.6 million ($0.07/basic share) in Q4 2017. The increase in net earnings in Q1 2018 largely resulted from an unrealized gain on derivative instruments of $17.3 million, compared to an unrealized loss of $80.0 million in Q4 2017. This unrealized gain was partially offset by lower fund flows from operations quarter-over-quarter and higher deferred tax expense. |
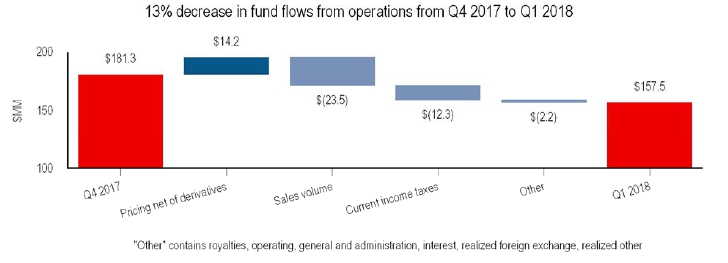
| • | Generated fund flows from operations of $157.5 million during Q1 2018, a decrease of 13% from Q4 2017. This quarter-over-quarter decrease was due to lower production volumes and higher current income taxes. The increase in current income taxes was primarily due to the absence of an increased tax deduction in the Netherlands for future asset retirement obligations recognized in Q4 2017. |
Vermilion Energy Inc. ■ Page 10 ■ 2018 First Quarter Report |
Q1 2018 vs. Q1 2017
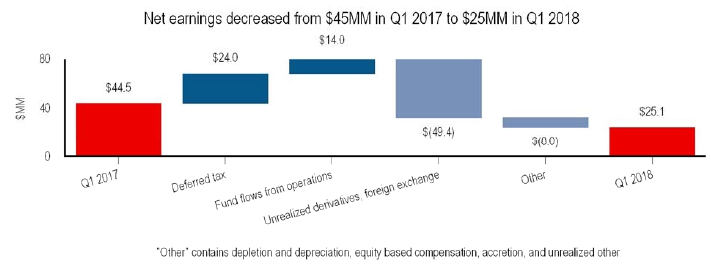
| • | Net earnings for Q1 2018 of $25.1 million ($0.21/basic share) compared to net earnings of $44.5 million ($0.38/basic share) in Q1 2017. The decrease in net earnings in the current period is primarily driven by a lower unrealized gain on derivative instruments, partially offset by an unrealized gain on foreign exchange in the current period, and higher fund flows from operations. |
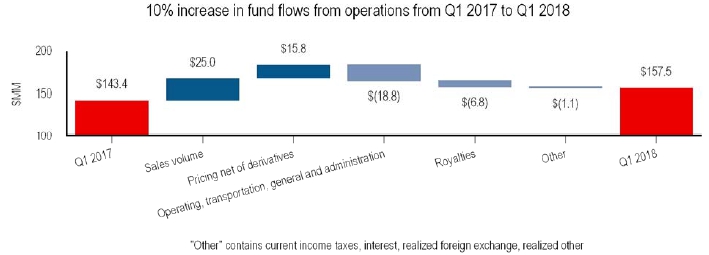
| • | Fund flows from operations increased by 10% in Q1 2018 versus Q1 2017 primarily due to higher sales volumes and higher crude oil and European natural gas prices. These increases were partially offset by higher operating expenses, driven by higher sales volumes and a stronger Euro relative to the Canadian dollar. |
Vermilion Energy Inc. ■ Page 11 ■ 2018 First Quarter Report |
| Production review |
Q1 2018 vs. Q4 2017
| • | Consolidated average production of 70,167 boe/d during Q1 2018 decreased 4% versus Q4 2017. This decrease in production was primarily attributable to the absence of test production volumes in the Netherlands that benefited Q4 2017, as well as temporary downtime in Canada and Germany. These decreases in production were partially offset by production growth in Ireland as a result of reduced downtime at Corrib. |
Q1 2018 vs. Q1 2017
| • | Consolidated average production of 70,167 boe/d in Q1 2018 represented an increase of 9% from Q1 2017. Year-over-year production increases were primarily attributable to continued organic production growth from our Mannville condensate-rich resource play in Canada and increased production in the Netherlands. These increases were partially offset by natural declines in Australia and Ireland, and downtime in Germany. |
| Activity review |
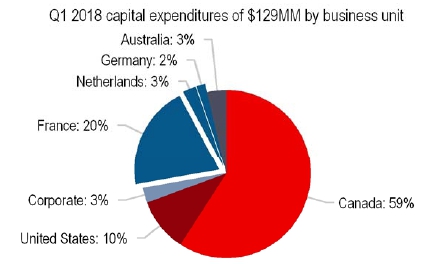
| • | For the three months ended March 31, 2018, capital expenditures of $128.6 million primarily related to activity in Canada and France. In Canada, capital expenditures of $69.2 million included the drilling of 18.0 (16.7 net) wells, primarily in the Mannville condensate-rich gas resource play and southeast Saskatchewan. In France, capital expenditures of $30.0 million included the drilling of 5.0 (5.0 net) wells, comprised of 3.0 (3.0 net) wells in the Champotran and 2.0 (2.0 net) wells in the Neocomian. |
| Sustainability review |
Dividends
| • | Declared dividends of $0.215 per common share per month during the three months ended March 31, 2018 ($0.65 per common share for the year). |
| • | Effective with the April 2018 dividend to be paid on May 15, 2018, we increased our monthly dividend by 7% from $0.215 to $0.23 percommon share. This will be our fourth dividend increase (previously Vermilion's distribution in the income trust era) since we began paying a distribution in 2003. |
Net debt
| • | Net debt increased to $1.51 billion as at March 31, 2018 from $1.37 billion at December 31, 2017, and was primarily due to our acquisitionof a private company with light oil producing assets straddling the Saskatchewan and Manitoba border for $90.0 million. |
Vermilion Energy Inc. ■ Page 12 ■ 2018 First Quarter Report |
Commodity Prices
| Q1 2018 | Q4 2017 | Q1 2017 | Q1/18 vs. Q4/17 | Q1/18 vs. Q1/17 | |||||||||
| Crude oil | |||||||||||||
| WTI ($/bbl) | 79.52 | 70.43 | 68.69 | 13% | 16% | ||||||||
| WTI (US $/bbl) | 62.87 | 55.40 | 51.92 | 13% | 21% | ||||||||
| Edmonton Sweet index ($/bbl) | 72.07 | 68.98 | 63.99 | 4% | 13% | ||||||||
| Edmonton Sweet index (US $/bbl) | 56.98 | 54.26 | 48.37 | 5% | 18% | ||||||||
| Dated Brent ($/bbl) | 84.44 | 78.05 | 71.15 | 8% | 19% | ||||||||
| Dated Brent (US $/bbl) | 66.76 | 61.39 | 53.78 | 9% | 24% | ||||||||
| Natural gas | |||||||||||||
| AECO ($/mmbtu) | 2.08 | 1.69 | 2.69 | 23% | (23)% | ||||||||
| NBP ($/mmbtu) | 9.96 | 8.70 | 7.96 | 14% | 25% | ||||||||
| NBP (€/mmbtu) | 6.41 | 5.81 | 5.64 | 10% | 14% | ||||||||
| TTF ($/mmbtu) | 9.59 | 8.36 | 7.65 | 15% | 25% | ||||||||
| TTF (€/mmbtu) | 6.17 | 5.58 | 5.43 | 11% | 14% | ||||||||
| Henry Hub ($/mmbtu) | 3.80 | 3.73 | 4.38 | 2% | (13)% | ||||||||
| Henry Hub (US $/mmbtu) | 3.00 | 2.93 | 3.31 | 2% | (9)% | ||||||||
| Average exchange rates | |||||||||||||
| CDN $/US $ | 1.26 | 1.27 | 1.32 | (1)% | (5)% | ||||||||
| CDN $/Euro | 1.55 | 1.50 | 1.41 | 3% | 10% | ||||||||
| Realized Prices | |||||||||||||
| Crude oil and condensate ($/bbl) | 80.03 | 74.12 | 68.59 | 8% | 17% | ||||||||
| NGLs ($/bbl) | 25.37 | 29.28 | 24.13 | (13)% | 5% | ||||||||
| Natural gas ($/mmbtu) | 5.81 | 5.23 | 5.62 | 11% | 3% | ||||||||
| Total ($/boe) | 51.13 | 47.49 | 46.94 | 8% | 9% | ||||||||
| Crude oil |

| • | Despite headwinds from seasonal refinery turnarounds and broader financial market volatility, crude oil pricing continued to increase in Q1 2018 with WTI and Dated Brent increasing 13% and 9% versus the previous quarter. On a year-over-year basis, WTI and Dated Brent increased by 21% and 24%, reflecting improving fundamentals on both the supply and demand side. |
| • | The increase in the Edmonton Sweet index was lower than the increase in WTI and Dated Brent as pipeline constraints had an impact on Edmonton Sweet. However, the Edmonton Sweet index increased 5% versus the previous quarter and 18% versus the same period in 2017 despite these constraints. |
| • | During Q1 2018, Dated Brent crude oil averaged a premium to WTI of US$3.89 and a premium to the Edmonton Sweet index of US$9.78. Approximately 62% of our Q1 2018 crude oil and condensate production benefited from this premium pricing. As a result, our Q1 2018 crude oil and condensate realized price of $80.03 was a 1% premium to WTI and an 11% premium to the Edmonton Sweet index. |
Vermilion Energy Inc. ■ Page 13 ■ 2018 First Quarter Report |
| Natural gas |
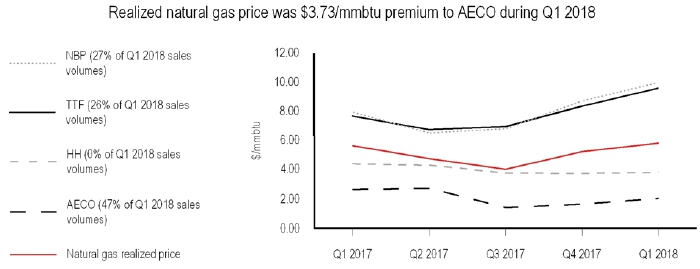
| • | European natural gas prices had a strong Q1 2018 due to a winter storm in Europe referred to as the "Beast from the East", which resulted in NBP and TTF increasing 10% and 11% quarter-over-quarter. The strong weather-driven demand caused the European gas market to tighten significantly, including a sharp withdrawal from gas-in-storage. In addition, simultaneous strong demand from Asia lead to an increase in competition for LNG. |
| • | NBP and TTF averaged $9.96/mmbtu and $9.59/mmbtu during Q1 2018 resulting in both key European natural gas hubs being 25% higher in Canadian dollar terms year-over-year. |
| • | North America’s winter weather was also supportive for natural gas prices, but production increases limited upside for both Henry Hub and AECO. For the three months ended March 31, 2018, Henry Hub was up by 2% while AECO posted a 23% gain quarter-over-quarter by averaging $2.08/mmbtu. |
| • | During Q1 2018, average European gas prices were a $7.70 premium to AECO and a $5.98 premium to Henry Hub pricing. Approximately 53% of our natural gas production in Q1 2018 benefited from this pricing. As a result, our Q1 2018 natural gas realized price of $5.81 was a $3.73 premium to AECO and a $2.01 premium to Henry Hub pricing. |
| Foreign exchange |
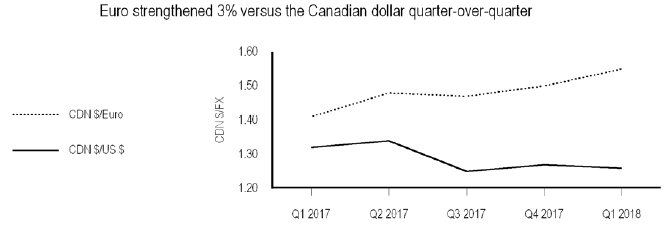
| • | While the quarter was volatile for the Canadian/US dollar pairing, the average for the three months ended March 31, 2018 was relatively unchanged from the previous quarter at 1.26 versus 1.27 for the three months ended December 31, 2017. |
| • | The Euro strengthened against the Canadian dollar throughout the quarter, averaging Q1 2018 at 1.55 versus 1.50 in Q4 2017 (3% increase) and 1.41 for Q1 2017 (10% increase). |
| • | The strengthening of the Euro increases the Canadian-equivalent expenses we incur in Europe as well as the Canadian-equivalent revenue we generate from European natural gas resulting in an increase to our fund flows from operations and an increase in our capital expenditures. |
Vermilion Energy Inc. ■ Page 14 ■ 2018 First Quarter Report |
Canada Business Unit
| Overview |
Production and assets focused in West Pembina near Drayton Valley, Alberta and Northgate in southeast Saskatchewan.
| • | Potential for three significant resource plays sharing the same surface infrastructure in the West Pembina region in Alberta: |
- Mannville condensate-rich gas (2,400 - 2,700m depth) - in development phase
- Cardium light oil (1,800m depth) - in development phase
- Duvernay condensate-rich gas (3,200 - 3,400m depth) - in appraisal phase with no investment at present
| • | Southeast Saskatchewan light oil development: |
- Primary targets of Mississippian Midale formation (1,400 - 1,700m depth) and Devonian Bakken/Three Forks (1,000 - 1,100m depth)
- Secondary targets of Mississippian Frobisher (1,400 - 1,700m depth) and Devonian Bakken/Three Forks (2,000 - 2,100m depth)
| Operational and financial review |
Canada business unit ($M except as indicated) | Q1 2018 | Q4 2017 | Q1 2017 | Q1/18 vs. Q4/17 | Q1/18 vs. Q1/17 | ||||||||
| Production and sales | |||||||||||||
| Crude oil and condensate (bbls/d) | 9,272 | 9,703 | 7,987 | (4)% | 16% | ||||||||
| NGLs (bbls/d) | 5,106 | 5,235 | 2,670 | (2)% | 91% | ||||||||
| Natural gas (mmcf/d) | 106.21 | 107.91 | 85.74 | (2)% | 24% | ||||||||
| Total (boe/d) | 32,078 | 32,923 | 24,947 | (3)% | 29% | ||||||||
| Production mix (% of total) | |||||||||||||
| Crude oil and condensate | 29 | % | 29 | % | 32 | % | |||||||
| NGLs | 16 | % | 16 | % | 11 | % | |||||||
| Natural gas | 55 | % | 55 | % | 56 | % | |||||||
| Activity | |||||||||||||
| Capital expenditures | 69,117 | 26,865 | 57,457 | 157% | 20% | ||||||||
| Acquisitions | 90,250 | 788 | 576 | ||||||||||
| Gross wells drilled | 18.00 | 6.00 | 22.00 | ||||||||||
| Net wells drilled | 16.69 | 4.00 | 18.41 | ||||||||||
| Financial results | |||||||||||||
| Sales | 92,933 | 94,522 | 75,500 | (2)% | 23% | ||||||||
| Royalties | (9,848 | ) | (9,301 | ) | (8,499 | ) | 6% | 16% | |||||
| Transportation | (4,540 | ) | (4,836 | ) | (4,103 | ) | (6)% | 11% | |||||
| Operating | (24,348 | ) | (22,356 | ) | (16,670 | ) | 9% | 46% | |||||
| General and administration | (1,867 | ) | (2,540 | ) | (1,698 | ) | (26)% | 10% | |||||
| Fund flows from operations | 52,330 | 55,489 | 44,530 | (6)% | 18% | ||||||||
| Netbacks ($/boe) | |||||||||||||
| Sales | 32.19 | 31.21 | 33.63 | 3% | (4)% | ||||||||
| Royalties | (3.41 | ) | (3.07 | ) | (3.79 | ) | 11% | (10)% | |||||
| Transportation | (1.57 | ) | (1.60 | ) | (1.83 | ) | (2)% | (14)% | |||||
| Operating | (8.43 | ) | (7.38 | ) | (7.42 | ) | 14% | 14% | |||||
| General and administration | (0.65 | ) | (0.84 | ) | (0.76 | ) | (23)% | (14)% | |||||
| Fund flows from operations netback | 18.13 | 18.32 | 19.83 | (1)% | (9)% | ||||||||
| Realized prices | |||||||||||||
| Crude oil and condensate ($/bbl) | 75.05 | 69.20 | 64.76 | 8% | 16% | ||||||||
| NGLs ($/bbl) | 25.33 | 29.18 | 24.12 | (13)% | 5% | ||||||||
| Natural gas ($/mmbtu) | 1.95 | 1.88 | 2.99 | 4% | (35)% | ||||||||
| Total ($/boe) | 32.19 | 31.21 | 33.63 | 3% | (4)% | ||||||||
| Reference prices | |||||||||||||
| WTI (US $/bbl) | 62.87 | 55.40 | 51.92 | 13% | 21% | ||||||||
| Edmonton Sweet index (US $/bbl) | 56.98 | 54.26 | 48.37 | 5% | 18% | ||||||||
| Edmonton Sweet index ($/bbl) | 72.07 | 68.98 | 63.99 | 4% | 13% | ||||||||
| AECO ($/mmbtu) | 2.08 | 1.69 | 2.69 | 23% | (23)% | ||||||||
Vermilion Energy Inc. ■ Page 15 ■ 2018 First Quarter Report |
Production
| • | Q1 2018 average production decreased 3% from Q4 2017 resulting from cold weather related downtime and planned maintenance on third party infrastructure. This more than offset new well production as most wells drilled in the quarter were not completed until late March, as expected. During the quarter, we announced and closed an acquisition of a private company with light oil producing assets straddling the Saskatchewan and Manitoba border near Vermilion's existing operations in southeast Saskatchewan. Year-over-year, production increased 29% primarily due to organic production growth in our Mannville condensate-rich gas resource play. |
| • | Mannville production averaged approximately 18,800 boe/d in Q1 2018, a decrease of 1% quarter-over-quarter. |
| • | Cardium production averaged approximately 5,100 boe/d in Q1 2018, a decrease of 6% quarter-over-quarter. |
| • | Production from southeast Saskatchewan averaged approximately 2,800 boe/d in Q1 2018, representing an increase of 12% quarter-over-quarter. |
Activity review
| • | Vermilion drilled 16 (16.0 net) operated wells and participated in the drilling of two (0.7 net) non-operated wells during Q1 2018. |
Mannville
- In Q1 2018, we drilled nine (9.0 net), completed 11 (11.0 net), and brought on production nine (8.8 net) operated wells. We also participated in the drilling of one (0.4 net) non-operated well.
- In 2018, we plan to drill or participate in 16 (13.1 net) wells.
Cardium
- In Q1 2018, we participated in the drilling of one (0.3 net) non-operated well.
- In 2018, we plan to drill or participate in four (2.5 net) wells.
Saskatchewan
- In Q1 2018, we drilled and completed seven (7.0 net) operated wells and brought five (5.0 net) wells on production.
- In 2018, we plan to drill or participate in 20 (19.5 net) wells.
| • | On April 16, 2018, Vermilion entered into an arrangement agreement ("Arrangement") to acquire Spartan Energy Corp., a publicly traded southeast Saskatchewan oil and gas producer, for total consideration of approximately $1.40 billion (comprised of $1.23 billion in Vermilion common shares based on Vermilion's closing share price of $44.04 on April 13, 2018, plus the assumption of approximately $175.0 million in debt). The Arrangement is subject to customary closing conditions, including receipt of applicable court, Spartan shareholder, and other regulatory approvals and is expected to close on or about June 15, 2018. |
Sales
| • | The realized price for our crude oil and condensate production in Canada is linked to WTI subject to market conditions in western Canada (as reflected by the Edmonton Sweet index price). The realized price of our natural gas in Canada is based on the AECO index in Canada. |
| • | Q1 2018 sales per boe increased versus Q4 2017, driven by higher crude oil and natural gas pricing. |
| • | Q1 2018 sales per boe decreased slightly versus Q1 2017 as higher crude oil pricing was more than offset by significantly weaker AECO pricing. |
Royalties
| • | In Q1 2018, royalties as a percentage of sales increased from 9.8% in Q4 2017 to 10.6% due to the impact of higher commodity prices on the sliding scale used to determine royalty rates. |
| • | For the three months ended March 31, 2018, royalties as a percentage of sales decreased to 10.6% from 11.3% in the prior year comparable period, primarily due to the addition of new wells on incentive royalty rates and the impact of lower natural gas pricing in the current quarter. |
Transportation
| • | Transportation expense relates to the delivery of crude oil and natural gas production to major pipelines where legal title transfers. |
| • | Q1 2018 transportation expense on a per unit basis was consistent with the prior quarter. On a dollar basis, Q1 2018 transportation expense decreased versus Q4 2017 due to lower production volumes in the current quarter. |
| • | Transportation expense on a per unit basis decreased versus Q1 2017 due to the impact a prior period adjustment recorded in Q1 2017. |
Operating
| • | Operating expense on a per unit and dollar basis increased in Q1 2018 relative to Q4 2017 due to the impact of higher gas processing costs, electricity charges, cold-weather related chemical usage, and the timing of maintenance activities. |
| • | Q1 2018 operating expense increased on a per unit and dollar basis as compared to Q1 2017 due to higher costs associated with gas processing, labour, electricity and chemical usage, as well as a third party plant equalization adjustment recorded in Q1 2018. On a per unit basis,these increases were partially offset by the impact of higher volumes on fixed costs. |
Vermilion Energy Inc. ■ Page 16 ■ 2018 First Quarter Report |
France Business Unit
| Overview |
| • | Entered France in 1997 and completed three subsequent acquisitions, including two in 2012. |
| • | Largest oil producer in France, constituting approximately three-quarters of domestic oil production. |
| • | Low base decline producing assets comprised of large conventional oil fields with high working interests located in the Aquitaine and Paris Basins. |
| • | Identified inventory of workover, infill drilling, and secondary recovery opportunities. |
| Operational and financial review |
| France business unit ($M except as indicated) | Q1 2018 | Q4 2017 | Q1 2017 | Q1/18 vs. Q4/17 | Q1/18 vs. Q1/17 | ||||||||
| Production | |||||||||||||
| Crude oil (bbls/d) | 11,037 | 11,215 | 10,834 | (2)% | 2% | ||||||||
| Natural gas (mmcf/d) | - | - | 0.01 | - % | (100)% | ||||||||
| Total (boe/d) | 11,037 | 11,215 | 10,836 | (2)% | 2% | ||||||||
| Sales | |||||||||||||
| Crude oil (bbls/d) | 9,893 | 11,397 | 9,760 | (13)% | 1% | ||||||||
| Natural gas (mmcf/d) | - | - | 0.01 | - % | (100)% | ||||||||
| Total (boe/d) | 9,893 | 11,397 | 9,761 | (13)% | 1% | ||||||||
| Inventory (mbbls) | |||||||||||||
| Opening crude oil inventory | 197 | 214 | 148 | ||||||||||
| Crude oil production | 993 | 1,032 | 975 | ||||||||||
| Crude oil sales | (890 | ) | (1,049 | ) | (878 | ) | |||||||
| Closing crude oil inventory | 300 | 197 | 245 | ||||||||||
| Activity | |||||||||||||
| Capital expenditures | 29,972 | 20,027 | 20,916 | 50% | 43% | ||||||||
| Gross wells drilled | 5.00 | 2.00 | 4.00 | ||||||||||
| Net wells drilled | 5.00 | 2.00 | 4.00 | ||||||||||
| Financial results | |||||||||||||
| Sales | 72,745 | 78,778 | 59,610 | (8)% | 22% | ||||||||
| Royalties | (9,438 | ) | (10,599 | ) | (5,320 | ) | (11)% | 77% | |||||
| Transportation | (3,195 | ) | (4,475 | ) | (3,032 | ) | (29)% | 5% | |||||
| Operating | (13,159 | ) | (14,332 | ) | (11,369 | ) | (8)% | 16% | |||||
| General and administration | (3,513 | ) | (4,259 | ) | (3,070 | ) | (18)% | 14% | |||||
| Current income taxes | (2,053 | ) | (2,348 | ) | (4,982 | ) | (13)% | (59)% | |||||
| Fund flows from operations | 41,387 | 42,765 | 31,837 | (3)% | 30% | ||||||||
| Netbacks ($/boe) | |||||||||||||
| Sales | 81.70 | 75.13 | 67.85 | 9% | 20% | ||||||||
| Royalties | (10.60 | ) | (10.11 | ) | (6.06 | ) | 5% | 75% | |||||
| Transportation | (3.59 | ) | (4.27 | ) | (3.45 | ) | (16)% | 4% | |||||
| Operating | (14.78 | ) | (13.67 | ) | (12.94 | ) | 8% | 14% | |||||
| General and administration | (3.95 | ) | (4.06 | ) | (3.49 | ) | (3)% | 13% | |||||
| Current income taxes | (2.31 | ) | (2.24 | ) | (5.67 | ) | 3% | (59)% | |||||
| Fund flows from operations netback | 46.47 | 40.78 | 36.24 | 14% | 28% | ||||||||
| Reference prices | |||||||||||||
| Dated Brent (US $/bbl) | 66.76 | 61.39 | 53.78 | 9% | 24% | ||||||||
| Dated Brent ($/bbl) | 84.44 | 78.05 | 71.15 | 8% | 19% | ||||||||
Vermilion Energy Inc. ■ Page 17 ■ 2018 First Quarter Report |
Production
| • | Q1 2018 production decreased 2% compared to the prior quarter primarily due to production declines and higher than normal well downtime resulting from cold weather, which more than offset new well production. Production increased 2% year-over-year primarily due to new well production from our 2018 drilling program, which we began in Q4 2017. |
Activity review
| • | During Q1 2018, we drilled two (2.0 net) Neocomian wells and three (3.0 net) Champotran wells. |
| • | In addition to the drilling and completion activity, we plan to continue our workover and optimization programs in the Aquitaine and Paris Basins throughout 2018. |
Sales
| • | Crude oil in France is priced with reference to Dated Brent. |
| • | Q1 2018 sales per boe increased versus all comparable periods, consistent with increases in the Dated Brent benchmark price. Quarter-over-quarter, this increase in price was offset by lower shipments. |
Royalties
| • | Royalties in France relate to two components: RCDM (levied on units of production and not subject to changes in commodity prices) and R31 (based on a percentage of sales). |
| • | Royalties as a percentage of sales of 13.0% in Q1 2018 was lower than 13.5% in Q4 2017 due to the absence of the revision to RCDM royalties recorded in the prior quarter and applied retroactively to January 1, 2017. This decrease was partially offset by a rate increase for R31 royalties effective January 1, 2018. |
| • | For the three months ended March 31, 2018, royalties as a percentage of sales of 13.0% increased from 8.9% in the comparable period in the prior year due to the impact of the aforementioned rate increase for RCDM and R31 royalties. |
Transportation
| • | Transportation expense decreased in Q1 2018 compared to Q4 2017 due to the impact of two vessel-based shipments in the current quarter compared to three shipments in the prior quarter. |
| • | Q1 2018 transportation expense increased slightly in Q1 2018 relative to Q1 2017, primarily due to the impact of a stronger Euro versus the Canadian dollar. Absent changes in foreign exchange rates, per unit transportation expense decreased 6% year-over-year. |
Operating
| • | Operating expense decreased in Q1 2018 versus Q4 2017 due to the timing of activity. On a per unit basis, operating expense increased due to the impact of lower sales volumes on fixed costs. |
| • | Operating expense in dollars and on a per unit basis increased in Q1 2018 relative to Q1 2017, primarily due to the impact of a stronger Euro versus the Canadian dollar. Absent changes in foreign exchange rates, per unit operating expense was relatively consistent year-over-year. |
General and administration
| • | Fluctuations in general and administration expense for all comparable periods were due to the timing of expenditures and allocations from our corporate segment. |
Current income taxes
| • | In France, current income taxes are applied to taxable income, after eligible deductions, at a statutory rate of 34.4%. |
| • | Full year effective tax rates are estimated each quarter based on forecasted commodity prices and operational results. The estimated full year effective tax rate is applied on a pro-rata basis to quarterly results. As such, fluctuations between the reporting periods occur due to changes in estimated tax rates. |
| • | For 2018, the effective rate on current taxes, inclusive of corporate allocations, is expected to be between 5% to 9% of pre-tax fund flows from operations. This is subject to change in response to production variations, commodity price fluctuations, the timing of capital expenditures, and other eligible in-country adjustments. |
| • | On December 21, 2017, the French Parliament approved the Finance Bill for 2018. The Finance Bill for 2018 provides for a progressive decrease of the French corporate income tax rate from 34.43% to 25.825% by 2022, with the first reduction planned for 2019 to 32.02%. |
Vermilion Energy Inc. ■ Page 18 ■ 2018 First Quarter Report |
Netherlands Business Unit
| Overview |
| • | Entered the Netherlands in 2004. |
| • | Second largest onshore operator. |
| • | Interests include 25 onshore licenses (all operated) and one offshore license (non-operated). |
| • | Licenses include more than 800,000 net acres of land, 95% of which is undeveloped. |
| Operational and financial review |
Netherlands business unit ($M except as indicated) | Q1 2018 | Q4 2017 | Q1 2017 | Q1/18 vs. Q4/17 | Q1/18 vs. Q1/17 | ||||||||
| Production and sales | |||||||||||||
| Condensate (bbls/d) | 77 | 105 | 76 | (27)% | 1% | ||||||||
| Natural gas (mmcf/d) | 44.79 | 55.66 | 39.92 | (20)% | 12% | ||||||||
| Total (boe/d) | 7,541 | 9,381 | 6,729 | (20)% | 12% | ||||||||
| Activity | |||||||||||||
| Capital expenditures | 3,278 | 12,300 | 1,712 | (73)% | 91% | ||||||||
| Acquisitions | 2,760 | (38 | ) | 16 | |||||||||
| Financial results | |||||||||||||
| Sales | 36,186 | 40,914 | 26,762 | (12)% | 35% | ||||||||
| Royalties | (850 | ) | (647 | ) | (419 | ) | 31% | 103% | |||||
| Operating | (7,757 | ) | (6,981 | ) | (4,841 | ) | 11% | 60% | |||||
| General and administration | (968 | ) | (546 | ) | (596 | ) | 77% | 62% | |||||
| Current income taxes | (5,805 | ) | 6,975 | (907 | ) | N/A | 540% | ||||||
| Fund flows from operations | 20,806 | 39,715 | 19,999 | (48)% | 4% | ||||||||
| Netbacks ($/boe) | |||||||||||||
| Sales | 53.31 | 47.41 | 44.19 | 12% | 21% | ||||||||
| Royalties | (1.25 | ) | (0.75 | ) | (0.69 | ) | 67% | 81% | |||||
| Operating | (11.43 | ) | (8.09 | ) | (7.99 | ) | 41% | 43% | |||||
| General and administration | (1.43 | ) | (0.63 | ) | (0.98 | ) | 127% | 46% | |||||
| Current income taxes | (8.55 | ) | 8.08 | (1.50 | ) | N/A | 470% | ||||||
| Fund flows from operations netback | 30.65 | 46.02 | 33.03 | (33)% | (7)% | ||||||||
| Realized prices | |||||||||||||
| Condensate ($/bbl) | 68.64 | 66.38 | 58.33 | 3% | 18% | ||||||||
| Natural gas ($/mmbtu) | 8.86 | 7.87 | 7.34 | 13% | 21% | ||||||||
| Total ($/boe) | 53.31 | 47.41 | 44.19 | 12% | 21% | ||||||||
| Reference prices | |||||||||||||
| TTF ($/mmbtu) | 9.59 | 8.36 | 7.65 | 15% | 25% | ||||||||
| TTF (€/mmbtu) | 6.17 | 5.58 | 5.43 | 11% | 14% | ||||||||
Vermilion Energy Inc. ■ Page 19 ■ 2018 First Quarter Report |
Production
| • | Q1 2018 production decreased 20% quarter-over-quarter due to the planned, temporary shut-in of the Eesveen-02 well near the end of Q4 2017 following an inline production test. The test rate from the Eesveen-02 well (60% working interest) was approximately 10 mmcf/d net during the test period, which lasted approximately two months. The well is expected to be brought on production mid-2018. Production in the quarter was also impacted by approximately two weeks of planned downtime on one of our key wells to complete a workover. Production increased 12% year-over-year as permitting delays restricted production early in 2017. |
Activity review
| • | In Q1 2018, we successfully completed a planned workover on one of our more significant wells, ahead of schedule and under budget, resulting in approximately two weeks of downtime. |
Sales
| • | The price of our natural gas in the Netherlands is based on the TTF index. |
| • | Q1 2018 sales per boe increased versus both Q4 2017 and Q1 2017, consistent with an increase in the TTF reference price. |
Royalties
| • | In the Netherlands, certain wells are subject to overriding royalties or royalties that take effect only when specified production levels are exceeded. As such, fluctuations in royalty expense in the periods presented primarily relates to the amount of production from those wells subject to overriding and production royalties. Royalties in Q1 2018 represented less than 3% of sales. |
Transportation
| • | Our production in the Netherlands is not subject to transportation expense as gas is sold at the plant gate. |
Operating
| • | Q1 2018 operating expense increased versus Q4 2017 and Q1 2017 due to higher electricity charges and the timing of activity. In Q1 2018, per unit operating expense further increased due to the impact of fixed costs on lower production volumes. |
General and administration
| • | Fluctuations in general and administration expense for all comparable periods were due to the timing of expenditures and allocations from our corporate segment. |
Current income taxes
| • | In the Netherlands, current income taxes are applied to taxable income, after eligible deductions and a 10% uplift deduction applied to operating expenses, eligible G&A and tax deductions for depletion and asset retirement obligations, at a tax rate of 50%. |
| • | Full year effective tax rates are estimated each quarter based on forecasted commodity prices and operational results. The estimated full year effective tax rate is applied on a pro-rata basis to quarterly results. As such, fluctuations between the reporting periods occur due to changes in estimated tax rates. |
| • | For 2018, the effective rate on current taxes, inclusive of corporate allocations, is expected to be between 19% to 23% of pre-tax fund flows from operations. This is subject to change in response to production variations, commodity price fluctuations, the timing of capital expenditures, and other eligible in-country adjustments. |
| • | Current income taxes increased in Q1 2018 versus Q4 2017 due to an increased tax deduction in 2017 for future asset retirement obligations resulting from a reduction in applicable discount rate assumptions. |
Vermilion Energy Inc. ■ Page 20 ■ 2018 First Quarter Report |
Germany Business Unit
| Overview |
| • | Entered Germany in February 2014 through the acquisition of a non-operated natural gas producing property. |
| • | Executed a significant exploration license farm-in agreement in 2015 and acquired operated producing properties in 2016. |
| • | Producing assets consist of seven gas and five oil producing fields with extensive infrastructure in place. |
| • | Significant land position of approximately 1.3 million net acres (97% undeveloped). |
| Operational and financial review |
Germany business unit ($M except as indicated) | Q1 2018 | Q4 2017 | Q1 2017 | Q1/18 vs. Q4/17 | Q1/18 vs. Q1/17 | ||||||||
| Production | |||||||||||||
| Crude oil (bbls/d) | 1,078 | 1,148 | 989 | (6)% | 9% | ||||||||
| Natural gas (mmcf/d) | 16.19 | 18.19 | 19.39 | (11)% | (17)% | ||||||||
| Total (boe/d) | 3,777 | 4,180 | 4,220 | (10)% | (10)% | ||||||||
| Sales | |||||||||||||
| Crude oil (bbls/d) | 1,307 | 1,059 | 989 | 23% | 32% | ||||||||
| Natural gas (mmcf/d) | 16.19 | 18.19 | 19.39 | (11)% | (17)% | ||||||||
| Total (boe/d) | 4,006 | 4,090 | 4,220 | (2)% | (5)% | ||||||||
| Production mix (% of total) | |||||||||||||
| Crude oil | 29 | % | 27 | % | 23 | % | |||||||
| Natural gas | 71 | % | 73 | % | 77 | % | |||||||
| Activity | |||||||||||||
| Capital expenditures | 2,415 | 5,279 | 906 | (54)% | 167% | ||||||||
| Financial results | |||||||||||||
| Sales | 20,501 | 18,898 | 17,968 | 8% | 14% | ||||||||
| Royalties | (1,737 | ) | (1,798 | ) | (1,368 | ) | (3)% | 27% | |||||
| Transportation | (1,998 | ) | (1,164 | ) | (1,485 | ) | 72% | 35% | |||||
| Operating | (6,186 | ) | (6,025 | ) | (4,921 | ) | 3% | 26% | |||||
| General and administration | (1,596 | ) | (2,080 | ) | (1,880 | ) | (23)% | (15)% | |||||
| Fund flows from operations | 8,984 | 7,831 | 8,314 | 15% | 8% | ||||||||
| Netbacks ($/boe) | |||||||||||||
| Sales | 56.86 | 50.22 | 47.30 | 13% | 20% | ||||||||
| Royalties | (4.82 | ) | (4.78 | ) | (3.60 | ) | 1% | 34% | |||||
| Transportation | (5.54 | ) | (3.09 | ) | (3.91 | ) | 79% | 42% | |||||
| Operating | (17.16 | ) | (16.01 | ) | (12.96 | ) | 7% | 32% | |||||
| General and administration | (4.43 | ) | (5.53 | ) | (4.95 | ) | (20)% | (11)% | |||||
| Fund flows from operations netback | 24.91 | 20.81 | 21.88 | 20% | 14% | ||||||||
| Realized prices | |||||||||||||
| Crude oil ($/bbl) | 79.04 | 72.58 | 65.62 | 9% | 20% | ||||||||
| Natural gas ($/mmbtu) | 7.69 | 7.07 | 6.95 | 9% | 11% | ||||||||
| Total ($/boe) | 56.86 | 50.22 | 47.30 | 13% | 20% | ||||||||
| Reference prices | |||||||||||||
| Dated Brent (US $/bbl) | 66.76 | 61.39 | 53.78 | 9% | 24% | ||||||||
| Dated Brent ($/bbl) | 84.44 | 78.05 | 71.15 | 8% | 19% | ||||||||
| TTF ($/mmbtu) | 9.59 | 8.36 | 7.65 | 15% | 25% | ||||||||
| TTF (€/mmbtu) | 6.17 | 5.58 | 5.43 | 11% | 14% | ||||||||
Vermilion Energy Inc. ■ Page 21 ■ 2018 First Quarter Report |
Production
| • | Q1 2018 production decreased 10% both quarter-over-quarter and year-over-year due to a temporary shut-in of one well for a SCADA installation in December. The well was brought back on production mid-Q1 2018. Higher than normal downtime at a non-operated gas processing plant in the quarter also impacted production. |
Activity review
| • | Q1 2018 activity focused on workover and optimization opportunities on the assets included in the Engie Acquisition. |
| • | In 2018, we plan to continue permitting and pre-drill activities associated with our first operated well in Germany, Burgmoor Z5 (45.8% working interest) in the Dümmersee-Uchte area, which we expect to drill in 2019. |
Sales
| • | The price of our natural gas in Germany is based on the NCG and GPL indexes, which are both highly correlated to the TTF benchmark. Crude oil in Germany is priced with reference to Dated Brent. |
| • | Sales per boe increased versus all comparable periods, consistent with increases in both crude oil and natural gas benchmark prices. |
Royalties
| • | Our production in Germany is subject to state and private royalties on sales after certain eligible deductions. |
| • | Royalties as a percentage of sales of 8.5% in Q1 2018 was lower than 9.5% in Q4 2017 due to a higher proportion of crude oil volumes, which incur a lower royalty rate. |
| • | Royalties as a percentage of sales of 8.5% in Q1 2018 was higher than 7.6% in Q1 2017 due to the impact of an adjustment recorded in the prior year. |
Transportation
| • | Transportation expense in Germany relates to costs incurred to deliver natural gas from the processing facility to the customer and deliver crude oil to the refinery. |
| • | Transportation expense in Q1 2018 was higher relative to Q4 2017 and Q1 2017 due to the timing of transportation cost adjustments. |
Operating
| • | Operating expense in Q1 2018 was relatively consistent with Q4 2017. |
| • | Q1 2018 operating expense increased compared to Q1 2017, primarily due to the impact of a stronger Euro relative to the Canadian dollar year-over-year and higher labour costs. Operating expense on a per unit basis further increased due to the impact of fixed costs on lower volumes. |
General and administration
| • | Fluctuations in general and administration expense for all comparable periods were due to the timing of expenditures and allocations from our corporate segment. |
Current income taxes
| • | As a result of our tax pools in Germany, we do not expect to incur current income taxes in the German Business Unit for the foreseeable future. |
Vermilion Energy Inc. ■ Page 22 ■ 2018 First Quarter Report |
Ireland Business Unit
| Overview |
| • | Entered Ireland in 2009 with an investment in the offshore Corrib gas field. |
| • | The Corrib gas field is located offshore northwest Ireland and comprises six offshore wells, offshore and onshore sales and transportation pipeline segments, as well as a natural gas processing facility. |
| • | Vermilion currently holds an 18.5% non-operated interest. |
| • | Vermilion has a strategic partnership with Canada Pension Plan Investment Board (“CPPIB”) that is expected to result in Vermilion increasing ownership in Corrib to 20% and assume operatorship. This is expected to occur in mid-2018. |
| Operational and financial review |
Ireland business unit ($M except as indicated) | Q1 2018 | Q4 2017 | Q1 2017 | Q1/18 vs. Q4/17 | Q1/18 vs. Q1/17 | ||||||||
| Production and sales | |||||||||||||
| Natural gas (mmcf/d) | 60.87 | 56.23 | 64.82 | 8% | (6)% | ||||||||
| Total (boe/d) | 10,144 | 9,372 | 10,803 | 8% | (6)% | ||||||||
| Activity | |||||||||||||
| Capital expenditures | 47 | 327 | (804 | ) | (86)% | N/A | |||||||
| Financial results | |||||||||||||
| Sales | 53,675 | 43,793 | 44,648 | 23% | 20% | ||||||||
| Transportation | (1,286 | ) | (1,496 | ) | (1,199 | ) | (14)% | 7% | |||||
| Operating | (3,209 | ) | (2,977 | ) | (3,999 | ) | 8% | (20)% | |||||
| General and administration | (1,309 | ) | (517 | ) | (438 | ) | 153% | 199% | |||||
| Fund flows from operations | 47,871 | 38,803 | 39,012 | 23% | 23% | ||||||||
| Netbacks ($/boe) | |||||||||||||
| Sales | 58.79 | 50.79 | 45.92 | 16% | 28% | ||||||||
| Transportation | (1.41 | ) | (1.74 | ) | (1.23 | ) | (19)% | 15% | |||||
| Operating | (3.51 | ) | (3.45 | ) | (4.11 | ) | 2% | (15)% | |||||
| General and administration | (1.43 | ) | (0.60 | ) | (0.45 | ) | 138% | 218% | |||||
| Fund flows from operations netback | 52.44 | 45.00 | 40.13 | 17% | 31% | ||||||||
| Reference prices | |||||||||||||
| NBP ($/mmbtu) | 9.96 | 8.70 | 7.96 | 14% | 25% | ||||||||
| NBP (€/mmbtu) | 6.41 | 5.81 | 5.64 | 10% | 14% | ||||||||
Vermilion Energy Inc. ■ Page 23 ■ 2018 First Quarter Report |
Production
| • | Q1 2018 production increased 8% quarter-over-quarter. As reported in the Q3 2017 release, Corrib had an unplanned downtime period following a plant turnaround that commenced in early September and extended through October 10th. This downtime reduced Vermilion’s Q4 2017 production by approximately 1,200 boe/d. The absence of this downtime in Q1 2018 was partially offset by the initiation of decline from the Corrib gas field, as expected based on numerical reservoir simulation. Production year-over-year decreased by 6% resulting from the initiation of a modest decline at Corrib. |
Activity review
| • | On July 12, 2017 Vermilion and CPPIB announced a strategic partnership in Corrib, whereby CPPIB will acquire Shell E&P Ireland Limited’s 45% interest in Corrib for total cash consideration of €830 million, subject to customary closing adjustments and future contingent value payments based on performance and realized pricing. At closing, Vermilion expects to assume operatorship of Corrib. In addition to operatorship, CPPIB plans to transfer a 1.5% working interest to Vermilion for €19.4 million ($28.4 million), before closing adjustments. Vermilion’s incremental 1.5% ownership of Corrib would represent approximately 850 boe/d (100% gas) based on current production expectations for Corrib. The acquisition has an effective date of January 1, 2017 and is anticipated to close in mid-2018. |
Sales
| • | The price of our natural gas in Ireland is based on the NBP index. |
| • | Q1 2018 sales per boe increased versus Q4 2017 and Q1 2017, consistent with an increase in the NBP reference price. |
Royalties
| • | Our production in Ireland is not subject to royalties. |
Transportation
| • | Transportation expense in Ireland relates to payments under a ship-or-pay agreement related to the Corrib project. |
| • | Q1 2018 transportation expense decreased relative to Q4 2017 due to the absence of an maintenance cost adjustment recorded in the prior quarter. |
| • | The increase in transportation expense in Q1 2018 relative to Q1 2017 was driven primarily by the impact of a stronger Euro relative to the Canadian dollar. On a per unit basis, transportation expense further increased due to the impact of lower volumes on the fixed obligation. |
Operating
| • | Fluctuations in operating expense on a per unit and dollar basis were due to the timing of maintenance work. |
General and administration
| • | Fluctuations in general and administration expense for all comparable periods were due to the timing of expenditures and allocations from our corporate segment. |
Current income taxes
| • | Given the significant level of investment in Corrib and the resulting tax pools, we do not expect to incur current income taxes in the Ireland Business Unit for the foreseeable future. |
Vermilion Energy Inc. ■ Page 24 ■ 2018 First Quarter Report |
Australia Business Unit
| Overview |
| • | Entered Australia in 2005. |
| • | Hold a 100% operated working interest in the Wandoo field, located approximately 80 km offshore on the northwest shelf of Australia. |
| • | Production is operated from two off-shore platforms, and originates from 18 well bores and five lateral sidetrack wells. |
| • | Wells that utilize horizontal legs (ranging in length from 500 to 3,000 plus metres) are located 600 metres below the seabed in approximately 55 metres of water depth. |
| Operational and financial review |
| Australia business unit ($M except as indicated) | Q1 2018 | Q4 2017 | Q1 2017 | Q1/18 vs. Q4/17 | Q1/18 vs. Q1/17 | ||||||||
| Production | |||||||||||||
| Crude oil (bbls/d) | 4,971 | 4,993 | 6,581 | - % | (24)% | ||||||||
| Sales | |||||||||||||
| Crude oil (bbls/d) | 4,878 | 4,707 | 5,041 | 4% | (3)% | ||||||||
| Inventory (mbbls) | |||||||||||||
| Opening crude oil inventory | 134 | 108 | 115 | ||||||||||
| Crude oil production | 447 | 459 | 592 | ||||||||||
| Crude oil sales | (439 | ) | (433 | ) | (454 | ) | |||||||
| Closing crude oil inventory | 142 | 134 | 253 | ||||||||||
| Activity | |||||||||||||
| Capital expenditures | 4,555 | 7,192 | 3,438 | (37)% | 32% | ||||||||
| Financial results | |||||||||||||
| Sales | 38,170 | 36,086 | 34,987 | 6% | 9% | ||||||||
| Operating | (13,150 | ) | (12,172 | ) | (10,036 | ) | 8% | 31% | |||||
| General and administration | (1,534 | ) | (3,193 | ) | (2,430 | ) | (52)% | (37)% | |||||
| Current income taxes | (5,518 | ) | (5,327 | ) | (6,830 | ) | 4% | (19)% | |||||
| Fund flows from operations | 17,968 | 15,394 | 15,691 | 17% | 15% | ||||||||
| Netbacks ($/boe) | |||||||||||||
| Sales | 86.94 | 83.32 | 77.11 | 4% | 13% | ||||||||
| Operating | (29.95 | ) | (28.11 | ) | (22.12 | ) | 7% | 35% | |||||
| General and administration | (3.49 | ) | (7.37 | ) | (5.35 | ) | (53)% | (35)% | |||||
| PRRT | (11.04 | ) | (8.25 | ) | (11.98 | ) | 34% | (8)% | |||||
| Corporate income taxes | (1.53 | ) | (4.05 | ) | (3.08 | ) | (62)% | (50)% | |||||
| Fund flows from operations netback | 40.93 | 35.54 | 34.58 | 15% | 18% | ||||||||
| Reference prices | |||||||||||||
| Dated Brent (US $/bbl) | 66.76 | 61.39 | 53.78 | 9% | 24% | ||||||||
| Dated Brent ($/bbl) | 84.44 | 78.05 | 71.15 | 8% | 19% | ||||||||
Vermilion Energy Inc. ■ Page 25 ■ 2018 First Quarter Report |
Production
| • | Q1 2018 production was relatively consistent quarter-over-quarter and decreased 24% year-over-year. |
| • | Production volumes are managed within corporate targets while meeting customer demands and the requirements of long-term supply agreements. |
| • | We continue to plan for long-term annual production levels of approximately 6,000 bbls/d. |
Activity review
| • | Q1 2018 efforts were largely focused on facility enhancements and work relating to platform life extension work. |
| • | 2018 activity will be focused on adding value through asset optimization and targeted proactive maintenance, in addition to preparing for our planned 2019 drilling campaign. |
Sales
| • | Crude oil in Australia is priced with reference to Dated Brent. |
| • | Q1 2018 sales per boe increased versus Q4 2017 and Q1 2017, consistent with an increase in the Dated Brent reference price. This increase in price was coupled with relatively consistent sales volumes in all periods presented, resulting in an increase in sales. |
Royalties and transportation
| • | Our production in Australia is not subject to royalties or transportation expense as crude oil is sold directly at the Wandoo B platform. |
Operating
| • | Operating expense increased in Q1 2018 versus Q4 2017 and Q1 2017 due to the timing of maintenance work and diesel usage. The increase in operating expense on a per unit basis year-over-year is also associated with the impact of fixed costs on lower sales volumes. |
General and administration
| • | Fluctuations in general and administration expense for all comparable periods are primarily due to the timing of expenditures and allocations from our corporate segment. |
Current income taxes
| • | In Australia, current income taxes include both PRRT and corporate income taxes. PRRT is a profit based tax applied at a rate of 40% on sales less eligible expenditures, including operating expenses and capital expenditures. Corporate income taxes are applied at a rate of 30% on taxable income after eligible deductions, which include PRRT paid. |
| • | Full year effective tax rates are estimated each quarter based on forecasted commodity prices and operational results. The estimated full year effective tax rate is applied on a pro-rata basis to quarterly results. As such, fluctuations between the reporting periods occur due to changes in estimated tax rates. |
| • | For 2018, the effective rate on current taxes, inclusive of corporate allocations, is expected to be between 23% to 28% of pre-tax fund flows from operations. This is subject to change in response to production variations, commodity price fluctuations, the timing of capital expenditures, andother eligible in-country adjustments. |
Vermilion Energy Inc. ■ Page 26 ■ 2018 First Quarter Report |
United States Business Unit
| Overview |
| • | Entered the United States in September 2014. |
| • | Interests include approximately 97,100 net acres of land (95% undeveloped) in the Powder River Basin of northeastern Wyoming. |
| • | Tight oil development targeting the Turner Sand at a depth of approximately 1,500 metres. |
| Operational and financial review |
United States business unit ($M except as indicated) | Q1 2018 | Q4 2017 | Q1 2017 | Q1/18 vs. Q4/17 | Q1/18 vs. Q1/17 | ||||||||
| Production and sales | |||||||||||||
| Crude oil (bbls/d) | 574 | 667 | 365 | (14)% | 57% | ||||||||
| NGLs (bbls/d) | 20 | 43 | 24 | (53)% | (17)% | ||||||||
| Natural gas (mmcf/d) | 0.15 | 0.29 | 0.20 | (48)% | (25)% | ||||||||
| Total (boe/d) | 618 | 758 | 422 | (18)% | 46% | ||||||||
| Activity | |||||||||||||
| Capital expenditures | 15,868 | 1,018 | 11,539 | 1,459% | 38% | ||||||||
| Acquisitions | 68 | 91 | 2,013 | ||||||||||
| Gross wells drilled | 5.00 | - | 3.00 | ||||||||||
| Net wells drilled | 5.00 | - | 3.00 | ||||||||||
| Financial results | |||||||||||||
| Sales | 4,059 | 4,350 | 2,126 | (7)% | 91% | ||||||||
| Royalties | (1,122 | ) | (1,196 | ) | (599 | ) | (6)% | 87% | |||||
| Transportation | - | (15 | ) | - | (100)% | - % | |||||||
| Operating | (566 | ) | (397 | ) | (285 | ) | 43% | 99% | |||||
| General and administration | (1,317 | ) | (1,274 | ) | (1,005 | ) | 3% | 31% | |||||
| Fund flows from operations | 1,054 | 1,468 | 237 | (28)% | 345% | ||||||||
| Netbacks ($/boe) | |||||||||||||
| Sales | 72.94 | 62.40 | 55.99 | 17% | 30% | ||||||||
| Royalties | (20.16 | ) | (17.16 | ) | (15.79 | ) | 17% | 28% | |||||
| Transportation | - | (0.21 | ) | - | (100)% | - % | |||||||
| Operating | (10.18 | ) | (5.70 | ) | (7.51 | ) | 79% | 36% | |||||
| General and administration | (23.67 | ) | (18.28 | ) | (26.46 | ) | 29% | (11)% | |||||
| Fund flows from operations netback | 18.93 | 21.05 | 6.23 | (10)% | 204% | ||||||||
| Realized prices | |||||||||||||
| Crude oil ($/bbl) | 76.56 | 67.15 | 61.68 | 14% | 24% | ||||||||
| NGLs ($/bbl) | 36.24 | 41.25 | 25.67 | (12)% | 41% | ||||||||
| Natural gas ($/mmbtu) | 3.00 | 2.48 | 2.48 | 21% | 21% | ||||||||
| Total ($/boe) | 72.94 | 62.40 | 55.99 | 17% | 30% | ||||||||
| Reference prices | |||||||||||||
| WTI (US $/bbl) | 62.87 | 55.40 | 51.92 | 13% | 21% | ||||||||
| WTI ($/bbl) | 79.52 | 70.43 | 68.69 | 13% | 16% | ||||||||
| Henry Hub (US $/mmbtu) | 3.00 | 2.93 | 3.31 | 2% | (9)% | ||||||||
| Henry Hub ($/mmbtu) | 3.80 | 3.73 | 4.38 | 2% | (13)% | ||||||||
Vermilion Energy Inc. ■ Page 27 ■ 2018 First Quarter Report |
Production
| • | Q1 2018 production decreased 18% from the prior quarter primarily due to planned downtime for workover activity and a force majeure event at a third-party gas plant. First quarter production increased 46% year-over-year as a result of the 2017 drilling program. |
Activity
| • | In Q1 2018, we drilled all five (5.0 net) of the planned wells in our 2018 drilling program and completed four of these wells late in the first quarter, with lateral lengths ranging from 1,840 to 2,215 metres and frac stages ranging from 25 to 62 stages per well. The remaining well is scheduled to be completed early in Q2 2018. Through well planning optimization efforts, drilling times were reduced by 22% on a per metre basis as compared to the 2017 drilling program. |
Sales
| • | The price of crude oil in the United States is directly linked to WTI, subject to local market differentials within the United States. |
| • | Q1 2018 sales per boe increased versus Q4 2017 and Q1 2017, consistent with an increase in the WTI reference price. |
Royalties
| • | Our production in the United States is subject to federal and private royalties, severance tax, and ad valorem tax. |
| • | Royalties (including severance and ad valorem taxes) as a percentage of sales are approximately 28%, and remained relatively consistent in all periods presented. |
Operating
| • | In Q1 2018, operating expense on a per unit and dollar basis increased versus Q4 2017 and Q1 2017 due to the timing of activity. In Q1 2018, operating expense on a per unit basis further increased versus Q4 2017 due to the impact of fixed operating costs on lower volumes. |
General and administration
| • | Fluctuations in general and administration expense for all comparable periods were due to the timing of expenditures and allocations from our corporate segment. |
Current income taxes
| • | As a result of ourtax pools in the United States, we do not expect to incur current income taxes in the US Business Unit for the foreseeable future. |
Vermilion Energy Inc. ■ Page 28 ■ 2018 First Quarter Report |
Corporate
| Overview |
| • | Our Corporate segment includes costs related to our global hedging program, financing expenses, and general and administration expenses that are primarily incurred in Canada and are not directly related to the operations of our business units. Expenditures relating to ouractivities in Central and Eastern Europe are also included in the Corporate segment. Gains or losses relating to Vermilion's global hedging program are allocated to Vermilion's business units for statutory reporting and income tax purposes. |
| Operational and financial review |
Corporate ($M) | Q1 2018 | Q4 2017 | Q1 2017 | |||||
| Activity | ||||||||
| Capital expenditures | 3,366 | 1,295 | 725 | |||||
| Acquisitions | - | 2,207 | 15 | |||||
| Gross wells drilled | 1.00 | - | - | |||||
| Net wells drilled | 1.00 | - | - | |||||
| Financial results | ||||||||
| General and administration expense | (2,440 | ) | (1,532 | ) | (2,034 | ) | ||
| Current income taxes | (186 | ) | (542 | ) | (194 | ) | ||
| Interest expense | (14,334 | ) | (13,710 | ) | (14,695 | ) | ||
| Realized loss on derivatives | (17,715 | ) | (7,493 | ) | (1,851 | ) | ||
| Realized foreign exchange gain | 1,554 | 2,899 | 2,546 | |||||
| Realized other income | 201 | 166 | 42 | |||||
| Fund flows from operations | (32,920 | ) | (20,212 | ) | (16,186 | ) | ||
Activity review
| • | In Q1 2018, we drilled and tested our first exploratory well (100% working interest) in the South Battonya concession, which is expected to be brought on production mid-2018. This marks the drilling of our first well in the Central and Eastern Europe Business Unit. |
General and administration
| • | Fluctuations in general and administration costs for the three months ended March 31, 2018 versus all comparable periods were due to allocations to the various business unit segments. |
Current income taxes
| • | Taxes in our corporate segment relate to holding companies that pay current taxes in foreign jurisdictions. |
Interest expense
| • | The increase in interest expense in Q1 2018 versus Q4 2017 was due to higher drawings on the revolving credit facility. Interest expense in Q1 2018 was relatively consistent with Q1 2017. |
Realized gain or loss on derivatives
| • | The realized loss on derivatives for the three months ended March 31, 2018 is related primarily to amounts paid on crude oil and European natural gas hedges. |
| • | A listing of derivative positions as at March 31, 2018 is included in “Supplemental Table 2” of this MD&A. |
Vermilion Energy Inc. ■ Page 29 ■ 2018 First Quarter Report |
Financial Performance Review
| ($M except per share) | Q1 2018 | Q4 2017 | Q3 2017 | Q2 2017 | Q1 2017 | Q4 2016 | Q3 2016 | Q2 2016 | |||||||||||||||
| Petroleum and natural gas sales | 318,269 | 317,341 | 248,505 | 271,391 | 261,601 | 259,891 | 232,660 | 212,855 | |||||||||||||||
| Net (loss) earnings | 25,139 | 8,645 | (39,191 | ) | 48,264 | 44,540 | (4,032 | ) | (14,475 | ) | (55,696 | ) | |||||||||||
| Net earnings (loss) per share | |||||||||||||||||||||||
| Basic | 0.21 | 0.07 | (0.32 | ) | 0.40 | 0.38 | (0.03 | ) | (0.12 | ) | (0.48 | ) | |||||||||||
| Diluted | 0.20 | 0.07 | (0.32 | ) | 0.39 | 0.37 | (0.03 | ) | (0.12 | ) | (0.48 | ) | |||||||||||
The following table shows the calculation of fund flows from operations:
| Q1 2018 | Q4 2017 | Q1 2017 | ||||||||||||||||
| $M | $/boe | $M | $/boe | $M | $/boe | |||||||||||||
| Petroleum and natural gas sales | 318,269 | 51.13 | 317,341 | 47.49 | 261,601 | 46.94 | ||||||||||||
| Royalties | (22,995 | ) | (3.69 | ) | (23,541 | ) | (3.52 | ) | (16,205 | ) | (2.91 | ) | ||||||
| Petroleum and natural gas revenues | 295,274 | 47.44 | 293,800 | 43.97 | 245,396 | 44.03 | ||||||||||||
| Transportation | (11,019 | ) | (1.77 | ) | (11,986 | ) | (1.79 | ) | (9,819 | ) | (1.76 | ) | ||||||
| Operating | (68,375 | ) | (10.99 | ) | (65,240 | ) | (9.76 | ) | (52,121 | ) | (9.35 | ) | ||||||
| General and administration | (14,544 | ) | (2.34 | ) | (15,941 | ) | (2.39 | ) | (13,151 | ) | (2.36 | ) | ||||||
| PRRT | (4,848 | ) | (0.78 | ) | (3,572 | ) | (0.53 | ) | (5,434 | ) | (0.97 | ) | ||||||
| Corporate income taxes | (8,714 | ) | (1.40 | ) | 2,330 | 0.35 | (7,479 | ) | (1.34 | ) | ||||||||
| Interest expense | (14,334 | ) | (2.30 | ) | (13,710 | ) | (2.05 | ) | (14,695 | ) | (2.64 | ) | ||||||
| Realized (loss) gain on derivative instruments | (17,715 | ) | (2.85 | ) | (7,493 | ) | (1.12 | ) | (1,851 | ) | (0.33 | ) | ||||||
| Realized foreign exchange gain | 1,554 | 0.25 | 2,899 | 0.43 | 2,546 | 0.46 | ||||||||||||
| Realized other income | 201 | 0.03 | 166 | 0.02 | 42 | 0.01 | ||||||||||||
| Fund flows from operations | 157,480 | 25.29 | 181,253 | 27.13 | 143,434 | 25.75 | ||||||||||||
Fluctuations in fund flows from operations may occur as a result of changes in commodity prices and costs to produce petroleum and natural gas. In addition, fund flows from operations may be affected by the timing of crude oil shipments in Australia and France. When crude oil inventory is built up, the related operating expense, royalties, and depletion expense are deferred and carried as inventory on the consolidated balance sheet. When the crude oil inventory is subsequently drawn down, the related expenses are recognized.
The following table shows a reconciliation from fund flows from operations to net earnings:
| Q1 2018 | Q4 2017 | Q1 2017 | ||||||
| Fund flows from operations | 157,480 | 181,253 | 143,434 | |||||
| Equity based compensation | (19,750 | ) | (16,087 | ) | (18,738 | ) | ||
| Unrealized gain (loss) on derivative instruments | 17,343 | (80,012 | ) | 79,865 | ||||
| Unrealized foreign exchange gain (loss) | 8,625 | 40,660 | (4,518 | ) | ||||
| Unrealized other expense | (195 | ) | (197 | ) | (30 | ) | ||
| Accretion | (7,154 | ) | (6,991 | ) | (6,382 | ) | ||
| Depletion and depreciation | (121,559 | ) | (129,179 | ) | (115,409 | ) | ||
| Deferred tax | (9,651 | ) | 19,198 | (33,682 | ) | |||
| Net earnings | 25,139 | 8,645 | 44,540 | |||||
Fluctuations in net income from period-to-period are caused by changes in both cash and non-cash based income and charges. Cash based items are reflected in fund flows from operations. Non-cash items include: equity based compensation expense, unrealized gains and losses on derivative instruments, unrealized foreign exchange gains and losses, accretion, depletion and depreciation expense, and deferred taxes. In addition, non-cash items may also include gains resulting from business combinations or charges resulting from impairment or impairment reversals.
Vermilion Energy Inc. ■ Page 30 ■ 2018 First Quarter Report |
| Equity based compensation |
Equity based compensation expense relates primarily to non-cash compensation expense attributable to long-term incentives granted to directors, officers, and employees under the Vermilion Incentive Plan (“VIP”).
Equity based compensation expense increased in Q1 2018 compared to Q4 2017 and Q1 2017 due to the settlement of bonuses in Q1 2018 under the employee bonus plan.
| Unrealized gain or loss on derivative instruments |
Unrealized gain or loss on derivative instruments arise as a result of changes in future commodity price forecasts. As Vermilion uses derivative instruments to manage the commodity price exposure of our future crude oil and natural gas production, we will normally recognize unrealized gains on derivative instruments when future commodity price forecasts decline and vice-versa. As derivative instruments are settled, the unrealized gain or loss previously recognized is reversed, and the settlement results in a realized gain or loss on derivative instruments.
For the three months ended March 31, 2018, we recognized an unrealized gain on derivative instruments of $17.3 million. This gain primarily related to the reversal of a portion of the net derivative liability position of $70.7 million on our balance sheet as at December 31, 2017.
| Unrealized foreign exchange gain or loss |
As a result of Vermilion’s international operations, Vermilion has monetary assets and liabilities denominated in currencies other than the Canadian dollar. These monetary assets and liabilities include cash, receivables, payables, long-term debt, derivative instruments and intercompany loans. These monetary assets primarily relate to Euro denominated intercompany loans from Vermilion Energy Inc. to our international subsidiaries. These monetary liabilities primarily relate to our US$300.0 million senior unsecured notes.
Unrealized foreign exchange gains and losses result from translating these monetary assets and liabilities from their underlying currency to the Canadian dollar. Unrealized foreign exchange primarily results from the translation of Euro denominated intercompany loans and US dollar denominated long-term debt. As such, an appreciation in the Euro against the Canadian dollar will result in an unrealized foreign exchange gain while an appreciation in the US dollar against the Canadian dollar will result in an unrealized foreign exchange loss (and vice-versa).
In Q1 2018, the impact of the Canadian dollar weakening against the Euro was more significant than the impact of the Canadian dollar weakening against the US dollar, resulting in an unrealized foreign exchange gain.
As at March 31, 2018, a $0.01 appreciation of the Euro against the Canadian dollar would result in a $4.1 million increase to net earnings. In contrast, a $0.01 appreciation of the US dollar against the Canadian dollar would result in a $2.3 million decrease to net earnings.
| Accretion |
Accretion expense is recognized to update the present value of the asset retirement obligation balance. The increase in accretion expense was primarily attributable to a weakening of the Canadian dollar versus the Euro and new obligations recognized on acquisitions.
| Depletion and depreciation |
Depletion and depreciation expense is recognized to allocate the cost of capital assets over the useful life of the respective assets. Depletion and depreciation expense per unit of production is determined for each depletion unit (which are groups of assets within a specific production area that have similar economic lives) by dividing the sum of the net book value of capital assets and future development costs by total proved plus probable reserves.
Fluctuations in depletion and depreciation expense are primarily the result of changes in produced crude oil and natural gas volumes and changes in depletion and depreciation per unit. Fluctuations in depletion and depreciation per unit are the result of changes in reserves, future development costs, and relative production mix.
Depletion and depreciation on a per boe basis for Q1 2018 of $19.53 was consistent with $19.33 in Q4 2017. Depletion and depreciation on a per boe basis of $19.53 in Q1 2018 was lower than $20.71 in Q1 2017 due to reduced depletion and depreciation rates as a result of increased reserves and lower estimated future development costs.
Vermilion Energy Inc. ■ Page 31 ■ 2018 First Quarter Report |
| Deferred tax |
On the balance sheet, deferred tax assets arise when the tax basis of an asset exceeds its accounting basis (known as a deductible temporary difference). Conversely, deferred tax liabilities arise when the tax basis of an asset is less than its accounting basis (known as a taxable temporary difference). Deferred tax assets are recognized only to the extent that it is probable that there are future taxable profits against which the deductible temporary difference can be utilized. Deferred tax assets and liabilities are measured at the enacted or substantively tax rate that is expected to apply when the asset is realized or the liability is settled.
As such, fluctuations in deferred tax expenses and recoveries primarily arise as a result of: changes in the accounting basis of an asset or liability without a corresponding tax basis change (e.g. when derivative assets and liabilities are marked-to-market or when accounting depletion differs from tax depletion), changes in available tax losses (e.g. if they are utilized to offset taxable income), changes in estimated future taxable profits resulting in a de-recognition or re-recognition of deferred tax assets, and changes in enacted or substantively enacted tax rates.
In Q1 2018, the $9.7 million deferred tax expense primarily resulted from unrealized gains on derivative instruments.
Vermilion Energy Inc. ■ Page 32 ■ 2018 First Quarter Report |
Financial Position Review
| Balance sheet strategy |
We believe that our balance sheet supports our defined growth initiatives and our focus is on managing and maintaining a conservative balance sheet. To ensure that our balance sheet continues to support our defined growth initiatives, we regularly review whether forecasted fund flows from operations is sufficient to finance planned capital expenditures, dividends, and abandonment and reclamation expenditures. To the extent that forecasted fund flows from operations is not expected to be sufficient to fulfill such expenditures, we will evaluate our ability to finance any shortfall with debt (including borrowing using the unutilized capacity of our existing revolving credit facility), issue equity, or by reducing some or all categories of expenditures to ensure that total expenditures do not exceed available funds.
To ensure that we maintain a conservative balance sheet, we monitor the ratio of net debt to fund flows from operations. As at March 31, 2018 our ratio of net debt to annualized fund flows from operations was 2.4 (2017 - 2.3) .
We remain focused on maintaining and strengthening our balance sheet by aligning our exploration and development capital budget with forecasted fund flows from operations to target a payout ratio (a non-GAAP financial measure) of at or less than 100%. We continually monitor for changes in forecasted fund flows from operations as a result of changes to forward commodity prices and as appropriate we will make adjustments to our exploration and development capital plans. As a result of our focus on this payout ratio target, we intend for the ratio of net debt to fund flows from operations to trend towards 1.5 over time.
| Net debt |
Net debt is reconciled to long-term debt, as follows:
| As at | |||||
| ($M) | Mar 31, 2018 | Dec 31, 2017 | |||
| Long-term debt | 1,363,502 | 1,270,330 | |||
| Current liabilities | 385,330 | 363,306 | |||
| Current assets | (234,187 | ) | (261,846 | ) | |
| Net debt | 1,514,645 | 1,371,790 | |||
| Ratio of net debt to annualized fund flows from operations | 2.4 | 1.9 | |||
| Ratio of net debt to trailing four quarter fund flows from operations | 2.5 | 2.3 | |||
As at March 31, 2018, long term debt increased to $1.36 billion (December 31, 2017 - $1.27 billion) due to the impact of the $90.0 million corporate acquisition of a private producer with assets in southeast Saskatchewan and southwest Manitoba that closed on February 15, 2018. This increase in long-term debt increased net debt from $1.37 billion at December 31, 2017 to $1.51 billion at March 31, 2018. This increase in net debt, combined with a slight decrease in fund flows from operations, resulted in the ratio of net debt to fund flows from operations increasing from 2.3 to 2.4.
| Long-term debt |
The balances recognized on our balance sheet are as follows:
| As at | |||||
| ($M) | Mar 31, 2018 | Dec 31, 2017 | |||
| Revolving credit facility | 982,253 | 899,595 | |||
| Senior unsecured notes | 381,249 | 370,735 | |||
| Long-term debt | 1,363,502 | 1,270,330 | |||
Vermilion Energy Inc. ■ Page 33 ■ 2018 First Quarter Report |
Revolving Credit Facility
As at March 31, 2018, Vermilion had in place a bank revolving credit facility maturing May 31, 2021 with the below terms, outstanding positions, and covenants.
| As at | |||||
| ($M) | Mar 31, 2018 | Dec 31, 2017 | |||
| Total facility amount | 1,400,000 | 1,400,000 | |||
| Amount drawn | (982,253 | ) | (899,595 | ) | |
| Letters of credit outstanding | (7,700 | ) | (7,400 | ) | |
| Unutilized capacity | 410,047 | 493,005 | |||
As at March 31, 2018, the revolving credit facility was subject to the following covenants:
| As at | ||||||||
| Financial covenant | Limit | Mar 31, 2018 | Dec 31, 2017 | |||||
| Consolidated total debt to consolidated EBITDA | 4.0 | 1.96 | 1.87 | |||||
Consolidated total senior debt to consolidated EBITDA
| 3.5 | 1.42 | 1.30 | |||||
| Consolidated total senior debt to total capitalization | 55 | % | 34 | % | 32 | % | ||
Our covenants include financial measures defined within our revolving credit facility agreement that are not defined under IFRS. These financial measures are defined by our revolving credit facility agreement as follows:
| • | Consolidated total debt: Includes all amounts classified as “Long-term debt”, “Current portion of long-term debt”, and “Finance lease obligation” (including the current portion included within "Accounts payable and accrued liabilities") on our balance sheet. |
| • | Consolidated total senior debt: Defined as consolidated total debt excluding unsecured and subordinated debt. |
| • | Consolidated EBITDA: Defined as consolidated net earnings before interest, income taxes, depreciation, accretion and certain other non-cash items. |
| • | Total capitalization: Includes all amounts on our balance sheet classified as “Shareholders’ equity” plus consolidated total debt as defined above. |
Senior Unsecured Notes
On March 13, 2017, Vermilion issued US$300 million of senior unsecured notes at par. The notes bear interest at a rate of 5.625% per annum, paid semi-annually on March 15 and September 15, and mature on March 15, 2025. As direct senior unsecured obligations of Vermilion, the notes rank equally in right of payment with existing and future senior indebtedness of the Company.
The senior unsecured notes were recognized at amortized cost and include the transaction costs directly related to the issuance.
Vermilion may, at its option, redeem the senior unsecured notes prior to maturity as follows:
| • | Prior to March 15, 2020, Vermilion may redeem up to 35% of the original principal amount of the senior unsecured notes with the proceeds of certain equity offerings by the Company at a redemption price of 105.625% of the principal amount, plus any accrued and unpaid interest to but excluding the applicable redemption date. |
| • | Prior to March 15, 2020, Vermilion may redeem some or all of the senior unsecured notes at a price equal to 100% of the principal amount of the senior unsecured notes, plus a “make-whole” premium and any accrued and unpaid interest. |
| • | On or after March 15, 2020, Vermilion may redeem some or all of the senior unsecured notes at the redemption prices set forth in the following table, plus any accrued and unpaid interest. |
| Year | Redemption price | ||
| 2020 | 104.219 | % | |
| 2021 | 102.813 | % | |
| 2022 | 101.406 | % | |
| 2023 and thereafter | 100.000 | % | |
| Shareholders' capital |
Beginning with the April 2018 dividend to be paid on May 15, 2018, we will increase our monthly dividend by 7%, to $0.23 per share from $0.215 per share.
During the three months ended March 31, 2018 we maintained monthly dividends at $0.215 per share. In total, dividends declared in 2018 were $79.0 million.
Vermilion Energy Inc. ■ Page 34 ■ 2018 First Quarter Report |
The following table outlines our dividend payment history:
| Date | Monthly dividend per unit or share | |
| January 2003 to December 2007 | $0.170 | |
| January 2008 to December 2012 | $0.190 | |
| January 2013 to December 2013 | $0.200 | |
| January 2014 to March 2018 | $0.215 | |
| April 2018 onwards | $0.230 | |
Our policy with respect to dividends is to be conservative and maintain a low ratio of dividends to fund flows from operations. During low commodity price cycles, we will initially maintain dividends and allow the ratio to rise. Should low commodity price cycles remain for an extended period of time, we will evaluate the necessity of changing the level of dividends, taking into consideration capital development requirements, debt levels, and acquisition opportunities.
Although we expect to be able to maintain our current dividend, fund flows from operations may not be sufficient to fund cash dividends, capital expenditures, and asset retirement obligations. We will evaluate our ability to finance any shortfall with debt, issuances of equity, or by reducing some or all categories of expenditures to ensure that total expenditures do not exceed available funds.
The following table reconciles the change in shareholders’ capital:
| Shareholders’ Capital | Number of Shares ('000s) | Amount ($M) | ||||
| Balance at December 31, 2017 | 122,119 | 2,650,706 | ||||
| Shares issued for the Dividend Reinvestment Plan | 466 | 19,641 | ||||
| Equity based compensation | 184 | 7,444 | ||||
| Balance as at March 31, 2018 | 122,769 | 2,677,791 | ||||
As at March 31, 2018, there were approximately 1.7 million VIP awards outstanding. As at April 26, 2018, there were approximately 124.1 million common shares issued and outstanding.
Asset Retirement Obligations
As at March 31, 2018, asset retirement obligations were $588.0 million compared to $517.2 million as at December 31, 2017.
The increase in asset retirement obligations is largely attributable to additional obligations recognized as a result of acquisitions and a weakening of the Canadian dollar against the Euro.
Off Balance Sheet Arrangements
We have certain lease agreements that are entered into in the normal course of operations, including operating leases for which no asset or liability value has been assigned to the consolidated balance sheet as at March 31, 2018.
We have not entered into any guarantee or off balance sheet arrangements that would materially impact our financial position or results of operations.
Risk Management
Vermilion is exposed to various market and operational risks. For a discussion of these risks, please see Vermilion's MD&A and Annual Information Form, each for the year ended December 31, 2017 available on SEDAR at www.sedar.com or on Vermilion’s website at www.vermilionenergy.com.
Vermilion Energy Inc. ■ Page 35 ■ 2018 First Quarter Report |
Critical Accounting Estimates
The preparation of financial statements in accordance with IFRS requires management to make estimates, judgments and assumptions that affect reported assets, liabilities, revenues and expenses, gains and losses, and disclosures of any possible contingencies. These estimates and assumptions are developed based on the best available information which management believed to be reasonable at the time such estimates and assumptions were made. As such, these assumptions are uncertain at the time estimates are made and could change, resulting in a material impact on Vermilion’s consolidated financial statements. Estimates are reviewed by management on an ongoing basis and as a result may change from period to period due to the availability of new information or changes in circumstances. Additionally, as a result of the unique circumstances of each jurisdiction that Vermilion operates in, the critical accounting estimates may affect one or more jurisdictions. There have been no material changes to our critical accounting estimates used in applying accounting policies for the three months ended March 31, 2018. Further information, including a discussion of critical accounting estimates, can be found in the notes to the Consolidated Financial Statements and annual MD&A for the year ended December 31, 2017, available on SEDAR at www.sedar.com or on Vermilion’s website at www.vermilionenergy.com.
Internal Control Over Financial Reporting
There was no change in Vermilion’s internal control over financial reporting during the period covered by this MD&A that materially affected, or is reasonably likely to materially affect, its internal control over financial reporting.
Accounting Pronouncements
| Recently adopted |
IFRS 9 “Financial instruments”
On January 1, 2018, Vermilion adopted IFRS 9"Financial Instruments" as issued by the IASB. IFRS 9 includes a new classification and measurement approach for financial assets and a forward-looking 'expected credit loss' model. The adoption of IFRS 9 did not have a material impact on Vermilion's consolidated financial statements.
IFRS 15 “Revenue from contracts with customers”
On January 1, 2018, Vermilion adopted IFRS 15 "Revenue from Contracts with Customers" IFRS 15 establishes a comprehensive framework for determining whether, how much, and when revenue from contracts with customers is recognized. Vermilion's revenue relates to the sale of petroleum and natural gas to customers at specified delivery points at benchmark prices.
Vermilion adopted IFRS 15 using the modified retrospective approach. Under this transitional provision, the cumulative effect of initially applying IFRS 15 is recognized on the date of initial application as an adjustment to retained earnings. No adjustment to retained earnings was required upon adoption of IFRS 15.
| Issued but not yet adopted |
IFRS 16 "Leases"
Vermilion is required to adopt IFRS 16 "Leases" by January 1, 2019. IFRS 16 requires lessees to recognize a lease obligation and right-of-use asset for the majority of leases. On adoption, non-current assets, current liabilities, and non-current liabilities on Vermilion's consolidated balance sheet will increase. Interest expense will be recognized on the lease obligation and lease payments will be applied against the lease obligation. This is expected to result in a decrease to operating expense and general and administration expense and an increase to interest expense and fund flows from operations. The quantitative impact of the adoption of IFRS 16 is currently being evaluated.
Vermilion Energy Inc. ■ Page 36 ■ 2018 First Quarter Report |
Supplemental Table 1: Netbacks
The following table includes financial statement information on a per unit basis by business unit. Liquids includes crude oil, condensate, and NGLs. Natural gas sales volumes have been converted on a basis of six thousand cubic feet of natural gas to one barrel of oil equivalent.
| Three Months Ended Mar 31, 2018 | Three Months Ended Mar 31, 2017 | ||||||||||
| Liquids | Natural Gas | Total | Liquids | Natural Gas | Total | ||||||
| $/bbl | $/mcf | $/boe | $/bbl | $/mcf | $/boe | ||||||
| Canada | |||||||||||
| Sales | 57.39 | 1.95 | 32.19 | 54.67 | 2.99 | 33.63 | |||||
| Royalties | (7.34) | (0.04) | (3.41) | (7.16) | (0.21) | (3.79) | |||||
| Transportation | (2.38) | (0.15) | (1.57) | (2.52) | (0.22) | (1.83) | |||||
| Operating | (9.03) | (1.32) | (8.43) | (8.07) | (1.16) | (7.42) | |||||
| Operating netback | 38.64 | 0.44 | 18.78 | 36.92 | 1.40 | 20.59 | |||||
| General and administration | (0.65) | (0.76) | |||||||||
| Fund flows from operations netback | 18.13 | 19.83 | |||||||||
| France | |||||||||||
| Sales | 81.70 | - | 81.70 | 67.86 | 1.52 | 67.85 | |||||
| Royalties | (10.60) | - | (10.60) | (6.06) | (0.44) | (6.06) | |||||
| Transportation | (3.59) | - | (3.59) | (3.45) | - | (3.45) | |||||
| Operating | (14.78) | - | (14.78) | (12.94) | (1.18) | (12.94) | |||||
| Operating netback | 52.73 | - | 52.73 | 45.41 | (0.10) | 45.40 | |||||
| General and administration | (3.95) | (3.49) | |||||||||
| Current income taxes | (2.31) | (5.67) | |||||||||
| Fund flows from operations netback | 46.47 | 36.24 | |||||||||
| Netherlands | |||||||||||
| Sales | 68.64 | 8.86 | 53.31 | 58.33 | 7.34 | 44.19 | |||||
| Royalties | - | (0.21) | (1.25) | - | (0.12) | (0.69) | |||||
| Operating | - | (1.92) | (11.43) | - | (1.35) | (7.99) | |||||
| Operating netback | 68.64 | 6.73 | 40.63 | 58.33 | 5.87 | 35.51 | |||||
| General and administration | (1.43) | (0.98) | |||||||||
| Current income taxes | (8.55) | (1.50) | |||||||||
| Fund flows from operations netback | 30.65 | 33.03 | |||||||||
| Germany | |||||||||||
| Sales | 79.04 | 7.69 | 56.86 | 65.62 | 6.95 | 47.30 | |||||
| Royalties | (2.53) | (0.99) | (4.82) | (3.67) | (0.60) | (3.60) | |||||
| Transportation | (9.80) | (0.58) | (5.54) | (8.11) | (0.44) | (3.91) | |||||
| Operating | (22.08) | (2.46) | (17.16) | (16.53) | (1.98) | (12.96) | |||||
| Operating netback | 44.63 | 3.66 | 29.34 | 37.31 | 3.93 | 26.83 | |||||
| General and administration | (4.43) | (4.95) | |||||||||
| Fund flows from operations netback | 24.91 | 21.88 | |||||||||
| Ireland | |||||||||||
| Sales | - | 9.80 | 58.79 | - | 7.65 | 45.92 | |||||
| Transportation | - | (0.23) | (1.41) | - | (0.21) | (1.23) | |||||
| Operating | - | (0.59) | (3.51) | - | (0.69) | (4.11) | |||||
| Operating netback | - | 8.98 | 53.87 | - | 6.75 | 40.58 | |||||
| General and administration | (1.43) | (0.45) | |||||||||
| Fund flows from operations netback | 52.44 | 40.13 | |||||||||
Vermilion Energy Inc. ■ Page 37 ■ 2018 First Quarter Report |
| Three Months Ended Mar 31, 2018 | Three Months Ended Mar 31, 2017 | ||||||||||
| Liquids | Natural Gas | Total | Liquids | Natural Gas | Total | ||||||
| $/bbl | $/mcf | $/boe | $/bbl | $/mcf | $/boe | ||||||
| Australia | |||||||||||
| Sales | 86.94 | - | 86.94 | 77.11 | - | 77.11 | |||||
| Operating | (29.95) | - | (29.95) | (22.12) | - | (22.12) | |||||
| PRRT(1) | (11.04) | - | (11.04) | (11.98) | - | (11.98) | |||||
| Operating netback | 45.95 | - | 45.95 | 43.01 | - | 43.01 | |||||
| General and administration | (3.49) | (5.35) | |||||||||
| Corporate income taxes | (1.53) | (3.08) | |||||||||
| Fund flows from operations netback | 40.93 | 34.58 | |||||||||
| United States | |||||||||||
| Sales | 75.20 | 3.00 | 72.94 | 59.45 | 2.48 | 55.99 | |||||
| Royalties | (20.72) | (1.08) | (20.16) | (16.60) | (1.03) | (15.79) | |||||
| Transportation | - | - | - | - | - | - | |||||
| Operating | (10.60) | - | (10.18) | (8.15) | - | (7.51) | |||||
| Operating netback | 43.88 | 1.92 | 42.60 | 34.70 | 1.45 | 32.69 | |||||
| General and administration | (23.67) | (26.46) | |||||||||
| Fund flows from operations netback | 18.93 | 6.23 | |||||||||
| Total Company | |||||||||||
| Sales | 71.03 | 5.81 | 51.13 | 64.14 | 5.62 | 46.94 | |||||
| Realized hedging gain | (3.24) | (0.42) | (2.85) | 0.39 | (0.15) | (0.33) | |||||
| Royalties | (7.26) | (0.13) | (3.69) | (5.41) | (0.16) | (2.91) | |||||
| Transportation | (2.65) | (0.17) | (1.77) | (2.55) | (0.19) | (1.76) | |||||
| Operating | (14.69) | (1.33) | (10.99) | (12.76) | (1.12) | (9.35) | |||||
| PRRT(1) | (1.73) | - | (0.78) | (2.24) | - | (0.97) | |||||
| Operating netback | 41.46 | 3.76 | 31.05 | 41.57 | 4.00 | 31.62 | |||||
| General and administration | (2.34) | (2.36) | |||||||||
| Interest expense | (2.30) | (2.64) | |||||||||
| Realized foreign exchange gain (loss) | 0.25 | 0.46 | |||||||||
| Other income | 0.03 | 0.01 | |||||||||
| Corporate income taxes | (1.40) | (1.34) | |||||||||
| Fund flows from operations netback | 25.29 | 25.75 | |||||||||
(1) Vermilion considers Australian PRRT to be an operating item and, accordingly, has included PRRT in the calculation of operating netbacks. Current income taxes presented above excludes PRRT.
Vermilion Energy Inc. ■ Page 38 ■ 2018 First Quarter Report |
Supplemental Table 2: Hedges
The prices in these tables may represent the weighted averages for several contracts. The weighted average price for the portfolio of options listed below may not have the same payoff profile as the individual contracts. As such, the presentation of the weighted average prices is purely for indicative purposes.
The following tables outline Vermilion’s outstanding risk management positions as at March 31, 2018:
| Bought Put Volume | Weighted Average Bought Put | Sold Call Volume | Weighted Average Sold Call | Sold Put Volume | Weighted Average Sold Put | Swap Volume | Weighted Average Swap | Additional Swap Volume | |||||||||||||||||||||||
| Crude Oil | Period | Exercise date(1) | Currency | (bbl/d) | Price / bbl | (bbl/d) | Price / bbl | (bbl/d) | Price / bbl | (bbl/d) | Price / bbl | (bbld) (2) | |||||||||||||||||||
| Dated Brent | |||||||||||||||||||||||||||||||
| Swap | Jan 2018 - Dec 2018 | CAD | - | - | - | - | - | - | 500 | 76.25 | - | ||||||||||||||||||||
| 3-Way Collar | Jul 2017 - Jun 2018 | USD | 2,000 | 55.00 | 2,000 | 64.06 | 2,000 | 45.00 | - | - | - | ||||||||||||||||||||
| 3-Way Collar | Jul 2017 - Dec 2018 | USD | 2,000 | 48.89 | 2,000 | 55.00 | 2,000 | 42.50 | - | - | - | ||||||||||||||||||||
| 3-Way Collar | Oct 2017 - Dec 2018 | USD | 2,000 | 50.50 | 2,000 | 55.75 | 2,000 | 43.00 | - | - | - | ||||||||||||||||||||
| 3-Way Collar | Jan 2018 - Jun 2018 | USD | 1,000 | 53.58 | 1,000 | 59.50 | 1,000 | 46.25 | - | - | - | ||||||||||||||||||||
| Collar | Jan 2018 - Dec 2018 | USD | 1,000 | 50.00 | 1,000 | 57.50 | - | - | - | - | - | ||||||||||||||||||||
| Swap | Jan 2018 - Dec 2018 | USD | - | - | - | - | - | - | 1,000 | 55.00 | - | ||||||||||||||||||||
| Swap | Apr 2018 - Mar 2019 | USD | - | - | - | - | - | - | 750 | 61.33 | - | ||||||||||||||||||||
| Swaption | Jul 2018 - Jun 2019 | Jun 29, 2018 | USD | - | - | - | - | - | - | 500 | 67.05 | - | |||||||||||||||||||
| WTI | |||||||||||||||||||||||||||||||
| Swap | Jan 2018 - Jun 2018 | CAD | - | - | - | - | - | - | 250 | 71.00 | - | ||||||||||||||||||||
| 3-Way Collar | Jan 2018 - Jun 2018 | USD | 500 | 48.50 | 500 | 56.00 | 500 | 42.50 | - | - | - | ||||||||||||||||||||
| Collar | Jan 2018 - Dec 2018 | USD | 500 | 50.00 | 500 | 55.00 | - | - | - | - | - | ||||||||||||||||||||
| Swap | Jan 2018 - Jun 2018 | USD | - | - | - | - | - | - | 500 | 54.00 | - | ||||||||||||||||||||
| Swap | Jan 2018 - Dec 2018 | USD | - | - | - | - | - | - | 1,000 | 54.00 | - | ||||||||||||||||||||
| Swap | Apr 2018 - Mar 2019 | USD | - | - | - | - | - | - | 250 | 54.00 | - | ||||||||||||||||||||
| Bought Put Volume | Weighted Average Bought Put | Sold Call Volume | Weighted Average Sold Call | Sold Put Volume | Weighted Average Sold Put | Swap Volume | Weighted Average Swap | Additional Swap Volume | |||||||||||||||||||||||
| North American Gas | Period | Exercise date(1) | Currency | (mmbtu/d) | Price / mmbtu | (mmbtu/d) | Price / mmbtu | (mmbtu/d) | Price / mmbtu | (mmbtu/d) | Price / mmbtu | (mmbtu/d) (2) | |||||||||||||||||||
| AECO | |||||||||||||||||||||||||||||||
| Swap | Jan 2018 - Dec 2018 | CAD | - | - | - | - | - | - | 9,478 | 2.80 | - | ||||||||||||||||||||
| AECO Basis (AECO less NYMEX HH) | |||||||||||||||||||||||||||||||
| Swap | Oct 2017 - Dec 2018 | USD | - | - | - | - | - | - | 10,000 | (1.03 | ) | - | |||||||||||||||||||
| Swap | Jan 2018 - Dec 2018 | USD | - | - | - | - | - | - | 20,000 | (0.95 | ) | - | |||||||||||||||||||
| Swap | Jan 2019 - Jun 2020 | USD | - | - | - | - | - | - | 2,500 | (0.93 | ) | - | |||||||||||||||||||
| NYMEX HH | |||||||||||||||||||||||||||||||
| 3-Way Collar | Oct 2017 - Dec 2018 | USD | 10,000 | 3.11 | 10,000 | 3.40 | 10,000 | 2.40 | - | - | - | ||||||||||||||||||||
| 3-Way Collar | Jan 2018 - Dec 2018 | USD | 10,000 | 3.06 | 10,000 | 3.40 | 10,000 | 2.40 | - | - | - | ||||||||||||||||||||
| Swap | Apr 2018 - Dec 2018 | USD | - | - | - | - | - | - | 10,000 | 3.10 | - | ||||||||||||||||||||
| (1) The sold swaption instrument allows the counterparty, at the specified date, to enter into a derivative instrument contract with Vermilion at the above detailed terms. | |||||||||||||||||||||||||||||||
| (2) On the last business day of each month, the counterparty has the option to increase the contracted volumes for the following month. | |||||||||||||||||||||||||||||||
Vermilion Energy Inc. ■ Page 39 ■ 2018 First Quarter Report |
| Bought Put Volume | Weighted Average Bought Put | Sold Call Volume | Weighted Average Sold Call | Sold Put Volume | Weighted Average Sold Put | Swap Volume | Weighted Average Swap | Additional Swap Volume | |||||||||||||||||||||||
| European Gas | Period | Exercise date(1) | Currency | (mmbtu/d) | Price / mmbtu | (mmbtu/d) | Price / mmbtu | (mmbtu/d) | Price /mmbtu | (mmbtu/d) | Price / mmbtu | (mmbtu/d) (2) | |||||||||||||||||||
| NBP | |||||||||||||||||||||||||||||||
| 3-Way Collar | Apr 2018 - Sep 2018 | EUR | 4,913 | 4.73 | 4,913 | 5.42 | 4,913 | 3.52 | - | - | - | ||||||||||||||||||||
| 3-Way Collar | Jan 2019 - Dec 2019 | EUR | 14,740 | 4.82 | 14,740 | 5.52 | 14,740 | 3.74 | - | - | - | ||||||||||||||||||||
| 3-Way Collar | Jan 2019 - Dec 2020 | EUR | 7,370 | 4.96 | 7,370 | 5.76 | 7,370 | 3.74 | - | - | - | ||||||||||||||||||||
| 3-Way Collar | Jan 2020 - Dec 2020 | EUR | 14,740 | 4.85 | 14,740 | 5.63 | 14,740 | 3.88 | - | - | - | ||||||||||||||||||||
| Call | Oct 2018 - Mar 2019 | EUR | - | - | 12,327 | 6.28 | - | - | - | - | - | ||||||||||||||||||||
| Put | Apr 2018 - Sep 2018 | EUR | - | - | - | - | 9,870 | 4.82 | - | - | - | ||||||||||||||||||||
| Put | Jul 2018 - Sep 2018 | EUR | - | - | - | - | 4,913 | 4.76 | - | - | - | ||||||||||||||||||||
| Swaption | Oct 2018 - Mar 2019 | Sep 28, 2018 | EUR | - | - | - | - | - | - | 4,913 | 5.86 | - | |||||||||||||||||||
| Swaption | Oct 2019 - Mar 2020 | Sep 28, 2018 | EUR | - | - | - | - | - | - | 4,913 | 5.86 | - | |||||||||||||||||||
| Swaption | Oct 2020 - Mar 2021 | Sep 28, 2018 | EUR | - | - | - | - | - | - | 4,913 | 5.86 | - | |||||||||||||||||||
| Collar | Jan 2018 - Dec 2018 | GBP | 2,500 | 3.15 | 2,500 | 3.82 | - | - | - | - | - | ||||||||||||||||||||
| Swap | Jan 2018 - Dec 2018 | GBP | - | - | - | - | - | - | 2,500 | 4.04 | 5,000 | ||||||||||||||||||||
| NBP Basis (NBP less NYMEX HH) | |||||||||||||||||||||||||||||||
| Collar | Jan 2018 - Dec 2018 | USD | 2,500 | 1.85 | 2,500 | 4.00 | - | - | - | - | - | ||||||||||||||||||||
| Collar | Jan 2019 - Sep 2020 | USD | 7,500 | 2.07 | 7,500 | 4.00 | - | - | - | - | - | ||||||||||||||||||||
| TTF | |||||||||||||||||||||||||||||||
| 3-Way Collar | Oct 2017 - Dec 2019 | EUR | 7,370 | 4.59 | 7,370 | 5.42 | 7,370 | 2.93 | - | - | - | ||||||||||||||||||||
| 3-Way Collar | Jan 2018 - Dec 2018 | EUR | 12,284 | 4.75 | 12,284 | 5.48 | 12,284 | 3.25 | - | - | - | ||||||||||||||||||||
| 3-Way Collar | Jan 2018 - Dec 2019 | EUR | 3,685 | 4.74 | 3,685 | 5.52 | 3,685 | 3.13 | - | - | - | ||||||||||||||||||||
| 3-Way Collar | Jan 2019 - Dec 2019 | EUR | 9,827 | 4.92 | 9,827 | 5.48 | 9,827 | 3.66 | - | - | - | ||||||||||||||||||||
| Collar | Jan 2018 - Dec 2018 | EUR | 4,913 | 4.40 | 4,913 | 5.31 | - | - | - | - | - | ||||||||||||||||||||
| Swap | Jul 2016 - Jun 2018 | EUR | - | - | - | - | - | - | 2,559 | 5.89 | - | ||||||||||||||||||||
| Swap | Apr 2017 - Jun 2018 | EUR | - | - | - | - | - | - | 4,299 | 4.50 | - | ||||||||||||||||||||
| Swap | Oct 2017 - Dec 2018 | EUR | - | - | - | - | - | - | 17,197 | 4.80 | - | ||||||||||||||||||||
| Swap | Oct 2017 - Dec 2019 | EUR | - | - | - | - | - | - | 7,370 | 4.87 | - | ||||||||||||||||||||
| Swap | Jan 2018 - Dec 2019 | EUR | - | - | - | - | - | - | 1,228 | 5.00 | - | ||||||||||||||||||||
| Swap | Jul 2018 - Dec 2019 | EUR | - | - | - | - | - | - | 4,913 | 4.98 | - | ||||||||||||||||||||
| Swap | Jan 2019 - Dec 2019 | EUR | - | - | - | - | - | - | 2,457 | 4.92 | - | ||||||||||||||||||||
| Swaption | Jan 2019 - Dec 2020 | April 30, 2018 | EUR | - | - | - | - | - | - | 9,827 | 5.28 | - | |||||||||||||||||||
| Cross Currency Interest Rate | Receive Notional Amount (USD) | Rate (LIBOR +) | Pay Notional Amount (CAD) | Rate (CDOR +) | |||||||||||||||||||||||||||
| Swap | Mar 29 - Apr 5, 2018 | 453,391,346 | 1.70 | % | 584,900,000 | 0.85 | % | ||||||||||||||||||||||||
| Swap | Apr 5 - May 2, 2018 | 740,144,241 | 1.70 | % | 954,900,000 | 0.80 | % | ||||||||||||||||||||||||
| Foreign Exchange | Receive Notional Amount (USD) | Pay Notional Amount (CAD) | |||||||||||||||||||||||||||||
| Swap | Mar 29 - Apr 5, 2018 | 309,897,440 | 400,000,000 | ||||||||||||||||||||||||||||
| (1) | The sold swaption instrument allows the counterparty, at the specified date, to enter into a swap with Vermilion at the above detailed terms. |
| (2) | On the last business day of each month, the counterparty has the option to increase the contracted volumes for the following month. |
Vermilion Energy Inc. ■ Page 40 ■ 2018 First Quarter Report |
Supplemental Table 3: Capital Expenditures and Acquisitions
By classification ($M)
| Q1 2018 | Q4 2017 | Q1 2017 | |||||
| Drilling and development | 124,811 | 61,911 | 95,164 | |||||
| Exploration and evaluation | 3,807 | 12,392 | 725 | |||||
| Capital expenditures | 128,618 | 74,303 | 95,889 | |||||
| Acquisitions | 56,355 | 3,048 | 2,620 | |||||
| Long-term debt net of working capital assumed | 36,723 | - | - | |||||
| Acquisitions | 93,078 | 3,048 | 2,620 | |||||
By category ($M) | Q1 2018 | Q4 2017 | Q1 2017 | |||||
| Drilling, completion, new well equip and tie-in, workovers and recompletions | 108,893 | 45,533 | 80,488 | |||||
| Production equipment and facilities | 16,142 | 18,109 | 10,575 | |||||
| Seismic, studies, land and other | 3,583 | 10,661 | 4,826 | |||||
| Capital expenditures | 128,618 | 74,303 | 95,889 | |||||
| Acquisitions | 93,078 | 3,048 | 2,620 | |||||
| Total capital expenditures and acquisitions | 221,696 | 77,351 | 98,509 | |||||
Capital expenditures by country ($M) | Q1 2018 | Q4 2017 | Q1 2017 | |||||
| Canada | 69,117 | 26,865 | 57,457 | |||||
| France | 29,972 | 20,027 | 20,916 | |||||
| Netherlands | 3,278 | 12,300 | 1,712 | |||||
| Germany | 2,415 | 5,279 | 906 | |||||
| Ireland | 47 | 327 | (804 | ) | ||||
| Australia | 4,555 | 7,192 | 3,438 | |||||
| United States | 15,868 | 1,018 | 11,539 | |||||
| Corporate | 3,366 | 1,295 | 725 | |||||
| Total capital expenditures | 128,618 | 74,303 | 95,889 | |||||
Acquisitions by country ($M) | Q1 2018 | Q4 2017 | Q1 2017 | |||||
| Canada | 90,250 | 788 | 576 | |||||
| Netherlands | 2,760 | (38 | ) | 16 | ||||
| United States | 68 | 91 | 2,013 | |||||
| Corporate | - | 2,207 | 15 | |||||
| Total acquisitions | 93,078 | 3,048 | 2,620 | |||||
Vermilion Energy Inc. ■ Page 41 ■ 2018 First Quarter Report |
Supplemental Table 4: Production
| Q1/18 | Q4/17 | Q3/17 | Q2/17 | Q1/17 | Q4/16 | Q3/16 | Q2/16 | Q1/16 | Q4/15 | Q3/15 | Q2/15 | ||||||||||||||||||||||||
| Canada | |||||||||||||||||||||||||||||||||||
| Crude oil & condensate (bbls/d) | 9,272 | 9,703 | 9,288 | 9,205 | 7,987 | 7,945 | 8,984 | 9,453 | 10,317 | 10,413 | 11,030 | 11,843 | |||||||||||||||||||||||
| NGLs (bbls/d) | 5,106 | 5,235 | 4,891 | 3,745 | 2,670 | 2,444 | 2,448 | 2,687 | 2,633 | 2,710 | 2,678 | 2,094 | |||||||||||||||||||||||
| Natural gas (mmcf/d) | 106.21 | 107.91 | 103.92 | 93.68 | 85.74 | 75.12 | 77.62 | 87.44 | 97.16 | 87.90 | 71.94 | 64.66 | |||||||||||||||||||||||
| Total (boe/d) | 32,078 | 32,923 | 31,499 | 28,563 | 24,947 | 22,910 | 24,368 | 26,713 | 29,141 | 27,773 | 25,698 | 24,713 | |||||||||||||||||||||||
| % of consolidated | 46 | % | 45 | % | 46 | % | 43 | % | 38 | % | 38 | % | 37 | % | 42 | % | 44 | % | 45 | % | 47 | % | 48 | % | |||||||||||
| France | |||||||||||||||||||||||||||||||||||
| Crude oil (bbls/d) | 11,037 | 11,215 | 10,918 | 11,368 | 10,834 | 11,220 | 11,827 | 12,326 | 12,220 | 12,537 | 12,310 | 12,746 | |||||||||||||||||||||||
| Natural gas (mmcf/d) | - | - | - | - | 0.01 | 0.38 | 0.42 | 0.54 | 0.44 | 1.36 | 1.47 | 1.03 | |||||||||||||||||||||||
| Total (boe/d) | 11,037 | 11,215 | 10,918 | 11,368 | 10,836 | 11,283 | 11,897 | 12,416 | 12,293 | 12,763 | 12,555 | 12,917 | |||||||||||||||||||||||
| % of consolidated | 16 | % | 15 | % | 16 | % | 17 | % | 17 | % | 19 | % | 19 | % | 19 | % | 19 | % | 21 | % | 22 | % | 25 | % | |||||||||||
| Netherlands | |||||||||||||||||||||||||||||||||||
| Condensate (bbls/d) | 77 | 105 | 74 | 104 | 76 | 57 | 86 | 96 | 114 | 110 | 109 | 112 | |||||||||||||||||||||||
| Natural gas (mmcf/d) | 44.79 | 55.66 | 34.90 | 31.58 | 39.92 | 41.15 | 47.62 | 49.18 | 53.40 | 56.34 | 53.56 | 32.43 | |||||||||||||||||||||||
| Total (boe/d) | 7,541 | 9,381 | 5,890 | 5,368 | 6,729 | 6,915 | 8,023 | 8,293 | 9,015 | 9,500 | 9,035 | 5,517 | |||||||||||||||||||||||
| % of consolidated | 11 | % | 13 | % | 9 | % | 8 | % | 10 | % | 11 | % | 13 | % | 13 | % | 14 | % | 16 | % | 16 | % | 11 | % | |||||||||||
| Germany | |||||||||||||||||||||||||||||||||||
| Crude oil (bbls/d) | 1,078 | 1,148 | 1,054 | 1,047 | 989 | - | - | - | - | - | - | - | |||||||||||||||||||||||
| Natural gas (mmcf/d) | 16.19 | 18.19 | 20.12 | 19.86 | 19.39 | 14.80 | 14.52 | 14.31 | 15.96 | 16.17 | 14.00 | 16.18 | |||||||||||||||||||||||
| Total (boe/d) | 3,777 | 4,180 | 4,407 | 4,357 | 4,220 | 2,467 | 2,420 | 2,385 | 2,660 | 2,695 | 2,333 | 2,696 | |||||||||||||||||||||||
| % of consolidated | 5 | % | 6 | % | 7 | % | 6 | % | 7 | % | 4 | % | 4 | % | 4 | % | 4 | % | 4 | % | 4 | % | 5 | % | |||||||||||
| Ireland | |||||||||||||||||||||||||||||||||||
| Natural gas (mmcf/d) | 60.87 | 56.23 | 49.04 | 63.81 | 64.82 | 62.92 | 59.28 | 47.26 | 33.90 | 0.12 | - | - | |||||||||||||||||||||||
| Total (boe/d) | 10,144 | 9,372 | 8,173 | 10,634 | 10,803 | 10,486 | 9,879 | 7,877 | 5,650 | 20 | - | - | |||||||||||||||||||||||
| % of consolidated | 14 | % | 13 | % | 12 | % | 16 | % | 17 | % | 17 | % | 16 | % | 12 | % | 9 | % | - | - | - | ||||||||||||||
| Australia | |||||||||||||||||||||||||||||||||||
| Crude oil (bbls/d) | 4,971 | 4,993 | 5,473 | 6,054 | 6,581 | 6,388 | 6,562 | 6,083 | 6,180 | 7,824 | 6,433 | 5,865 | |||||||||||||||||||||||
| % of consolidated | 7 | % | 7 | % | 8 | % | 9 | % | 10 | % | 10 | % | 10 | % | 9 | % | 9 | % | 13 | % | 11 | % | 11 | % | |||||||||||
| United States | |||||||||||||||||||||||||||||||||||
| Crude oil (bbls/d) | 574 | 667 | 880 | 747 | 365 | 362 | 383 | 458 | 368 | 420 | 226 | 123 | |||||||||||||||||||||||
| NGLs (bbls/d) | 20 | 43 | 56 | 76 | 24 | 23 | 30 | 26 | 39 | 29 | - | - | |||||||||||||||||||||||
| Natural gas (mmcf/d) | 0.15 | 0.29 | 0.64 | 0.44 | 0.20 | 0.18 | 0.20 | 0.20 | 0.26 | 0.20 | - | - | |||||||||||||||||||||||
| Total (boe/d) | 618 | 758 | 1,043 | 896 | 422 | 414 | 447 | 518 | 450 | 483 | 226 | 123 | |||||||||||||||||||||||
| % of consolidated | 1 | % | 1 | % | 2 | % | 1 | % | 1 | % | 1 | % | 1 | % | 1 | % | 1 | % | 1 | % | - | - | |||||||||||||
| Consolidated | |||||||||||||||||||||||||||||||||||
| Crude oil, condensate | |||||||||||||||||||||||||||||||||||
| & NGLs (bbls/d) | 32,134 | 33,109 | 32,634 | 32,346 | 29,526 | 28,439 | 30,320 | 31,129 | 31,871 | 34,043 | 32,786 | 32,783 | |||||||||||||||||||||||
| % of consolidated | 46 | % | 45 | % | 48 | % | 48 | % | 46 | % | 47 | % | 48 | % | 48 | % | 49 | % | 56 | % | 58 | % | 63 | % | |||||||||||
| Natural gas (mmcf/d) | 228.20 | 238.28 | 208.62 | 209.36 | 210.07 | 194.54 | 199.65 | 198.93 | 201.11 | 162.09 | 140.97 | 114.29 | |||||||||||||||||||||||
| % of consolidated | 54 | % | 55 | % | 52 | % | 52 | % | 54 | % | 53 | % | 52 | % | 52 | % | 51 | % | 44 | % | 42 | % | 37 | % | |||||||||||
| Total (boe/d) | 70,167 | 72,821 | 67,403 | 67,240 | 64,537 | 60,863 | 63,596 | 64,285 | 65,389 | 61,058 | 56,280 | 51,831 | |||||||||||||||||||||||
Vermilion Energy Inc. ■ Page 42 ■ 2018 First Quarter Report |
| YTD 2018 | 2017 | 2016 | 2015 | 2014 | 2013 | ||||||||||||||||||||||||
| Canada | |||||||||||||||||||||||||||||
| Crude oil & condensate (bbls/d) | 9,272 | 9,051 | 9,171 | 11,357 | 12,491 | 8,387 | |||||||||||||||||||||||
| NGLs (bbls/d) | 5,106 | 4,144 | 2,552 | 2,301 | 1,233 | 1,666 | |||||||||||||||||||||||
| Natural gas (mmcf/d) | 106.21 | 97.89 | 84.29 | 71.65 | 55.67 | 42.39 | |||||||||||||||||||||||
| Total (boe/d) | 32,078 | 29,510 | 25,771 | 25,598 | 23,001 | 17,117 | |||||||||||||||||||||||
| % of consolidated | 46 | % | 45 | % | 40 | % | 46 | % | 47 | % | 41 | % | |||||||||||||||||
| France | |||||||||||||||||||||||||||||
| Crude oil (bbls/d) | 11,037 | 11,084 | 11,896 | 12,267 | 11,011 | 10,873 | |||||||||||||||||||||||
| Natural gas (mmcf/d) | - | - | 0.44 | 0.97 | - | 3.40 | |||||||||||||||||||||||
| Total (boe/d) | 11,037 | 11,085 | 11,970 | 12,429 | 11,011 | 11,440 | |||||||||||||||||||||||
| % of consolidated | 16 | % | 16 | % | 19 | % | 23 | % | 22 | % | 28 | % | |||||||||||||||||
| Netherlands | |||||||||||||||||||||||||||||
| Condensate (bbls/d) | 77 | 90 | 88 | 99 | 77 | 64 | |||||||||||||||||||||||
| Natural gas (mmcf/d) | 44.79 | 40.54 | 47.82 | 44.76 | 38.20 | 35.42 | |||||||||||||||||||||||
| Total (boe/d) | 7,541 | 6,847 | 8,058 | 7,559 | 6,443 | 5,967 | |||||||||||||||||||||||
| % of consolidated | 11 | % | 10 | % | 13 | % | 14 | % | 13 | % | 15 | % | |||||||||||||||||
| Germany | |||||||||||||||||||||||||||||
| Crude oil (bbls/d) | 1,078 | 1,060 | - | - | - | - | |||||||||||||||||||||||
| Natural gas (mmcf/d) | 16.19 | 19.39 | 14.90 | 15.78 | 14.99 | - | |||||||||||||||||||||||
| Total (boe/d) | 3,777 | 4,291 | 2,483 | 2,630 | 2,498 | - | |||||||||||||||||||||||
| % of consolidated | 5 | % | 6 | % | 4 | % | 5 | % | 5 | % | - | ||||||||||||||||||
| Ireland | |||||||||||||||||||||||||||||
| Natural gas (mmcf/d) | 60.87 | 58.43 | 50.89 | 0.03 | - | - | |||||||||||||||||||||||
| Total (boe/d) | 10,144 | 9,737 | 8,482 | 5 | - | - | |||||||||||||||||||||||
| % of consolidated | 14 | % | 14 | % | 13 | % | - | - | - | ||||||||||||||||||||
| Australia | |||||||||||||||||||||||||||||
| Crude oil (bbls/d) | 4,971 | 5,770 | 6,304 | 6,454 | 6,571 | 6,481 | |||||||||||||||||||||||
| % of consolidated | 7 | % | 8 | % | 10 | % | 12 | % | 13 | % | 16 | % | |||||||||||||||||
| United States | |||||||||||||||||||||||||||||
| Crude oil (bbls/d) | 574 | 666 | 393 | 231 | 49 | - | |||||||||||||||||||||||
| NGLs (bbls/d) | 20 | 50 | 29 | 7 | - | - | |||||||||||||||||||||||
| Natural gas (mmcf/d) | �� | 0.15 | 0.39 | 0.21 | 0.05 | - | - | ||||||||||||||||||||||
| Total (boe/d) | 618 | 781 | 457 | 247 | 49 | - | |||||||||||||||||||||||
| % of consolidated | 1 | % | 1 | % | 1 | % | - | - | - | ||||||||||||||||||||
| Consolidated | |||||||||||||||||||||||||||||
| Crude oil, condensate & NGLs (bbls/d) | 32,134 | 31,915 | 30,433 | 32,716 | 31,432 | 27,471 | |||||||||||||||||||||||
| % of consolidated | 46 | % | 47 | % | 48 | % | 60 | % | 63 | % | 67 | % | |||||||||||||||||
| Natural gas (mmcf/d) | 228.20 | 216.64 | 198.55 | 133.24 | 108.85 | 81.21 | |||||||||||||||||||||||
| % of consolidated | 54 | % | 53 | % | 52 | % | 40 | % | 37 | % | 33 | % | |||||||||||||||||
| Total (boe/d) | 70,167 | 68,021 | 63,526 | 54,922 | 49,573 | 41,005 | |||||||||||||||||||||||
Vermilion Energy Inc. ■ Page 43 ■ 2018 First Quarter Report |
Non-GAAP Financial Measures
This MD&A includes references to certain financial measures which do not have standardized meanings and may not be comparable to similar measures presented by other issuers. These financial measures include fund flows from operations, a measure of profit or loss in accordance with IFRS 8 “Operating Segments” (please see SEGMENTED INFORMATION in the NOTES TO THE CONSOLIDATED FINANCIAL STATEMENTS) and net debt, a measure of capital in accordance with IAS 1 “Presentation of Financial Statements” (please see CAPITAL DISCLOSURES in the NOTES TO THE CONSOLIDATED FINANCIAL STATEMENTS).
In addition, this MD&A includes financial measures which are not specified, defined, or determined under IFRS and are therefore considered non-GAAP financial measures and may not be comparable to similar measures presented by other issuers. These non-GAAP financial measures include:
Acquisitions:The sum of acquisitions from the Consolidated Statement of Cash Flows plus the assumption of the acquiree's outstanding long-term debt net of acquired working capital (if any).
Capital expenditures:The sum of drilling and development and exploration and evaluation from the Consolidated Statement of Cash Flows. We consider capital expenditures to be a useful measure of our investment in our existing asset base. Capital expenditures are also referred to as E&D capital.
Cash dividends per share:Represents cash dividends declared per share and is a useful measure of the dividends a common shareholder was entitled to during the period.
Covenants:The financial covenants on our revolving credit facility contain non-GAAP measures. The definitions for these financial covenants are included in FINANCIAL POSITION REVIEW.
Diluted shares outstanding:The sum of shares outstanding at the period end plus outstanding awards under the VIP, based on current estimates of future performance factors and forfeiture rates.
Free cash flow:Represents fund flows from operations in excess of capital expenditures. We use free cash flow to determine the funding available for investing and financing activities, including payment of dividends, repayment of long-term debt, reallocation to existing business units, and deployment into new ventures. We also assess free cash flow as a percentage of fund flows from operations, which is a measure of the percentage of fund flows from operations that is retained for incremental investing and financing activities.
Fund flows from operations per basic and diluted share:Management assesses fund flows from operations on a per share basis as we believe this provides a measure of our operating performance after taking into account the issuance and potential future issuance of Vermilion common shares. Fund flows from operations per basic share is calculated by dividing fund flows from operations by the basic weighted average shares outstanding as defined under IFRS. Fund flows from operations per diluted share is calculated by dividing fund flows from operations by the sum of basic weighted average shares outstanding and incremental shares issuable under the VIP as determined using the treasury stock method.
Net dividends:We define net dividends as dividends declared less proceeds received for the issuance of shares pursuant to the Dividend Reinvestment Plan. Management monitors net dividends and net dividends as a percentage of fund flows from operations to assess our ability to pay dividends.
Operating netback:Sales less royalties, operating expense, transportation costs, PRRT, and realized hedging gains and losses presented on a per unit basis. Management assesses operating netback as a measure of the profitability and efficiency of our field operations. In contrast, fund flows from operations netback also includes general and administration expense, corporate income taxes and interest. Fund flows from operations netback is used by management to assess the profitability of our business units and Vermilion as a whole.
Payout:We define payout as net dividends plus drilling and development costs, exploration and evaluation costs, dispositions, and asset retirement obligations settled. Management uses payout and payout as a percentage of fund flows from operations (also referred to as thesustainability ratio) to assess the amount of cash distributed back to shareholders and re-invested in the business for maintaining production and organic growth.
Vermilion Energy Inc. ■ Page 44 ■ 2018 First Quarter Report |
The following tables reconcile net dividends, payout, and diluted shares outstanding from their most directly comparable GAAP measures as presented in our financial statements:
| ($M) | Q1 2018 | Q4 2017 | Q1 2017 | |||||
| Dividends declared | 79,005 | 78,653 | 76,593 | |||||
| Shares issued for the Dividend Reinvestment Plan | (19,641 | ) | (21,817 | ) | (35,506 | ) | ||
| Net dividends | 59,364 | 56,836 | 41,087 | |||||
| Drilling and development | 124,811 | 61,911 | 95,164 | |||||
| Exploration and evaluation | 3,807 | 12,392 | 725 | |||||
| Asset retirement obligations settled | 3,591 | 3,216 | 2,249 | |||||
| Payout | 191,573 | 134,355 | 139,225 | |||||
| % of fund flows from operations | 122 | % | 74 | % | 97 | % | ||
| ('000s of shares) | Q1 2018 | Q4 2017 | Q1 2017 | |||||
| Shares outstanding | 122,769 | 122,119 | 119,046 | |||||
| Potential shares issuable pursuant to the VIP | 3,025 | 3,021 | 3,089 | |||||
| Diluted shares outstanding | 125,794 | 125,140 | 122,135 | |||||
Vermilion Energy Inc. ■ Page 45 ■ 2018 First Quarter Report |
Consolidated Interim Financial Statements
Consolidated Balance Sheet
thousands of Canadian dollars, unaudited
| Note | March 31, 2018 | December 31, 2017 | |||||
| Assets | |||||||
| Current | |||||||
| Cash and cash equivalents | 19,299 | 46,561 | |||||
| Accounts receivable | 165,779 | 165,760 | |||||
| Crude oil inventory | 22,286 | 17,105 | |||||
| Derivative instruments | 16,581 | 17,988 | |||||
| Prepaid expenses | 10,242 | 14,432 | |||||
| Total current assets | 234,187 | 261,846 | |||||
| Derivative instruments | 2,205 | 2,552 | |||||
| Deferred taxes | 96,648 | 80,324 | |||||
| Exploration and evaluation assets | 6 | 297,616 | 292,278 | ||||
| Capital assets | 5 | 3,555,878 | 3,337,965 | ||||
| Total assets | 4,186,534 | 3,974,965 | |||||
| Liabilities | |||||||
| Current | |||||||
| Accounts payable and accrued liabilities | 241,840 | 219,084 | |||||
| Dividends payable | 9 | 26,395 | 26,256 | ||||
| Derivative instruments | 64,813 | 78,905 | |||||
| Income taxes payable | 52,281 | 39,061 | |||||
| Total current liabilities | 385,329 | 363,306 | |||||
| Derivative instruments | 7,617 | 12,348 | |||||
| Long-term debt | 8 | 1,363,502 | 1,270,330 | ||||
| Finance lease obligation | 14,420 | 15,807 | |||||
| Asset retirement obligations | 7 | 588,035 | 517,180 | ||||
| Deferred taxes | 260,411 | 253,108 | |||||
| Total liabilities | 2,619,314 | 2,432,079 | |||||
| Shareholders' equity | |||||||
| Shareholders’ capital | 9 | 2,677,791 | 2,650,706 | ||||
| Contributed surplus | 96,660 | 84,354 | |||||
| Accumulated other comprehensive income | 110,638 | 71,829 | |||||
| Deficit | (1,317,869 | ) | (1,264,003 | ) | |||
| Total shareholders' equity | 1,567,220 | 1,542,886 | |||||
| Total liabilities and shareholders' equity | 4,186,534 | 3,974,965 | |||||
Approved by the Board
| (Signed “Catherine L. Williams”) | (Signed “Anthony Marino”) | |
| Catherine L. Williams, Director | Anthony Marino, Director |
Vermilion Energy Inc. ■ Page 46 ■ 2018 First Quarter Report |
Consolidated Statements of Net Earnings and Comprehensive Income
thousands of Canadian dollars, except share and per share amounts, unaudited
| Three Months Ended | |||||||
| Note | March 31, 2018 | March 31, 2017 | |||||
| Revenue | |||||||
| Petroleum and natural gas sales | 318,269 | 261,601 | |||||
| Royalties | (22,995 | ) | (16,205 | ) | |||
| Petroleum and natural gas revenue | 295,274 | 245,396 | |||||
| Expenses | |||||||
| Operating | 68,375 | 52,121 | |||||
| Transportation | 11,019 | 9,819 | |||||
| Equity based compensation | 19,750 | 18,738 | |||||
| Loss (gain) on derivative instruments | 372 | (78,014 | ) | ||||
| Interest expense | 14,334 | 14,695 | |||||
| General and administration | 14,544 | 13,151 | |||||
| Foreign exchange (gain) loss | (10,179 | ) | 1,972 | ||||
| Other income | (6 | ) | (12 | ) | |||
| Accretion | 7 | 7,154 | 6,382 | ||||
| Depletion and depreciation | 5, 6 | 121,559 | 115,409 | ||||
| 246,922 | 154,261 | ||||||
| Earnings before income taxes | 48,352 | 91,135 | |||||
| Taxes | |||||||
| Deferred | 9,651 | 33,682 | |||||
| Current | 13,562 | 12,913 | |||||
| 23,213 | 46,595 | ||||||
| Net earnings | 25,139 | 44,540 | |||||
| Other comprehensive income | |||||||
| Currency translation adjustments | 38,809 | 11,178 | |||||
| Comprehensive income | 63,948 | 55,718 | |||||
| Net earnings per share | |||||||
| Basic | 0.21 | 0.38 | |||||
| Diluted | 0.20 | 0.37 | |||||
| Weighted average shares outstanding ('000s) | |||||||
| Basic | 122,390 | 118,632 | |||||
| Diluted | 124,304 | 120,722 | |||||
Vermilion Energy Inc. ■ Page 47 ■ 2018 First Quarter Report |
Consolidated Statements of Cash Flows
thousands of Canadian dollars, unaudited
| Three Months Ended | |||||||
| Note | March 31, 2018 | March 31, 2017 | |||||
| Operating | |||||||
| Net earnings | 25,139 | 44,540 | |||||
| Adjustments: | |||||||
| Accretion | 7 | 7,154 | 6,382 | ||||
| Depletion and depreciation | 5, 6 | 121,559 | 115,409 | ||||
| Unrealized gain on derivative instruments | (17,343 | ) | (79,865 | ) | |||
| Equity based compensation | 19,750 | 18,738 | |||||
| Unrealized foreign exchange (gain) loss | (8,625 | ) | 4,518 | ||||
| Unrealized other expense | 195 | 30 | |||||
| Deferred taxes | 9,651 | 33,682 | |||||
| Asset retirement obligations settled | 7 | (3,591 | ) | (2,249 | ) | ||
| Changes in non-cash operating working capital | 17,796 | 31,451 | |||||
| Cash flows from operating activities | 171,685 | 172,636 | |||||
| Investing | |||||||
| Drilling and development | 5 | (124,811 | ) | (95,164 | ) | ||
| Exploration and evaluation | 6 | (3,807 | ) | (725 | ) | ||
| Acquisitions | 4, 5 | (56,355 | ) | (2,620 | ) | ||
| Changes in non-cash investing working capital | 20,847 | 7,194 | |||||
| Cash flows used in investing activities | (164,126 | ) | (91,315 | ) | |||
| Financing | |||||||
| Borrowings (repayments) on the revolving credit facility | 8 | 23,909 | (494,028 | ) | |||
| Issuance of senior unsecured notes | 8 | - | 391,906 | ||||
| Decrease in finance lease obligation | (1,264 | ) | (1,231 | ) | |||
| Cash dividends | (59,225 | ) | (40,918 | ) | |||
| Cash flows used in financing activities | (36,580 | ) | (144,271 | ) | |||
| Foreign exchange gain on cash held in foreign currencies | 1,759 | 1,325 | |||||
| Net change in cash and cash equivalents | (27,262 | ) | (61,625 | ) | |||
| Cash and cash equivalents, beginning of period | 46,561 | 62,775 | |||||
| Cash and cash equivalents, end of period | 19,299 | 1,150 | |||||
| Supplementary information for cash flows from operating activities | |||||||
| Interest paid | 18,134 | 12,334 | |||||
| Income taxes paid | 342 | 5,008 | |||||
Vermilion Energy Inc. ■ Page 48 ■ 2018 First Quarter Report |
Consolidated Statements of Changes in Shareholders' Equity
thousands of Canadian dollars, unaudited
| Three Months Ended | ||||||
| March 31, 2018 | March 31, 2017 | |||||
| Shareholders' capital | ||||||
| Balance, beginning of period | 2,650,706 | 2,452,722 | ||||
| Shares issued for the Dividend Reinvestment Plan | 19,641 | 35,506 | ||||
| Equity based compensation | 7,444 | 4,894 | ||||
| Balance, end of period | 2,677,791 | 2,493,122 | ||||
| Contributed surplus | ||||||
| Balance, beginning of period | 84,354 | 101,788 | ||||
| Equity based compensation | 12,306 | 13,844 | ||||
| Balance, end of period | 96,660 | 115,632 | ||||
| Accumulated other comprehensive income | ||||||
| Balance, beginning of period | 71,829 | 30,339 | ||||
| Currency translation adjustments | 38,809 | 11,178 | ||||
| Balance, end of period | 110,638 | 41,517 | ||||
| Deficit | ||||||
| Balance, beginning of period | (1,264,003 | ) | (1,006,386 | ) | ||
| Net earnings | 25,139 | 44,540 | ||||
| Dividends declared | (79,005 | ) | (76,593 | ) | ||
| Balance, end of period | (1,317,869 | ) | (1,038,439 | ) | ||
| Total shareholders' equity | 1,567,220 | 1,611,832 | ||||
Please refer to Financial Statement Note 9 (Shareholders' capital) for additional information.
Vermilion Energy Inc. ■ Page 49 ■ 2018 First Quarter Report |
Notes to the Condensed Consolidated Interim Financial Statements for the three months ended March 31, 2018 and 2017
tabular amounts in thousands of Canadian dollars, except share and per share amounts, unaudited
| 1. Basis of presentation |
Vermilion Energy Inc. (the “Company” or “Vermilion”) is a corporation governed by the laws of the Province of Alberta and is actively engaged in the business of crude oil and natural gas exploration, development, acquisition and production.
These condensed consolidated interim financial statements are in compliance with International Accounting Standard (“IAS”) 34, “Interim financial reporting”. Except as described in Note 2, these condensed consolidated interim financial statements have been prepared using the same accounting policies and methods of computation as Vermilion’s consolidated financial statements for the year ended December 31, 2017.
These condensed consolidated interim financial statements should be read in conjunction with Vermilion’s consolidated financial statements for the year ended December 31, 2017, which are contained within Vermilion’s Annual Report for the year ended December 31, 2017 and are available on SEDAR atwww.sedar.com or on Vermilion’s website atwww.vermilionenergy.com.
These condensed consolidated interim financial statements were approved and authorized for issuance by the Board of Directors of Vermilion on April 26, 2018.
| 2. Changes in accounting pronouncements |
IFRS 9 "Financial instruments"
On January 1, 2018, Vermilion adopted IFRS 9"Financial Instruments" as issued by the IASB. IFRS 9 includes a new classification and measurement approach for financial assets and a forward-looking 'expected credit loss' model. The adoption of IFRS 9 did not have a material impact on Vermilion's consolidated financial statements. Vermilion has revised the description of its accounting policy for financial instruments to reflect the new classification approach as follows:
Financial instruments
On initial recognition, financial instruments are measured at fair value. Measurement in subsequent periods depends on the classification of the financial instrument as described below:
| • | Fair value through profit or loss: Financial instruments under this classification include cash and cash equivalents and derivative assets and liabilities. |
| • | Amortized cost: Financial instruments under this classification include accounts receivable, accounts payable and accrued liabilities, dividends payable, finance lease obligation, and long-term debt. |
IFRS 15 "Revenue from contracts with customers"
On January 1, 2018, Vermilion adopted IFRS 15 "Revenue from Contracts with Customers" IFRS 15 establishes a comprehensive framework for determining whether, how much, and when revenue from contracts with customers is recognized. Vermilion's revenue relates to the sale of petroleum and natural gas to customers at specified delivery points at benchmark prices.
Vermilion adopted IFRS 15 using the modified retrospective approach. Under this transitional provision, the cumulative effect of initially applying IFRS 15 is recognized on the date of initial application as an adjustment to retained earnings. No adjustment to retained earnings was required upon adoption of IFRS 15.
IFRS 15 requires additional disclosure relating to the disaggregation of revenue - this additional disclosure is included in Financial Statement Note 3 (Segmented Information). In addition, as a result of this adoption, Vermilion has revised the description of its accounting policy for revenue recognition as follows:
Revenue recognition
Revenue associated with the sale of crude oil, natural gas and natural gas liquids is measured based on the consideration specified in contracts with customers. Revenue from contracts with customers is recognized when or as Vermilion satisfies a performance obligation by transferring a promised good or service to a customer. A good or service is transferred when the customer obtains control of that good or service. The transfer of control of oil, natural gas, natural gas liquids usually coincides with title passing to the customer and the customer taking physical possession. Vermilion principally satisfies its performance obligations at a point in time and the amounts of revenue recognized relating to performance obligations satisfied over time are not significant.
Vermilion Energy Inc. ■ Page 50 ■ 2018 First Quarter Report |
IFRS 16 "Leases"
Vermilion is required to adopt IFRS 16 "Leases" by January 1, 2019. IFRS 16 requires lessees to recognize a lease obligation and right-of-use asset for the majority of leases. On adoption, non-current assets, current liabilities, and non-current liabilities on Vermilion's consolidated balance sheet will increase. Interest expense will be recognized on the lease obligation and lease payments will be applied against the lease obligation. This is expected to result in a decrease to operating expense and general and administration expense and an increase to interest expense and fund flows from operations. The quantitative impact of the adoption of IFRS 16 is currently being evaluated.
Vermilion Energy Inc. ■ Page 51 ■ 2018 First Quarter Report |
| 3. Segmented information |
Vermilion’s chief operating decision maker regularly reviews fund flows from operations generated by each of Vermilion’s operating segments. Fund flows from operations is a measure of profit or loss that provides the chief operating decision maker with the ability to assess the operating segments’ profitability and, correspondingly, the ability of each operating segment to fund its share of dividends, asset retirement obligations, and capital investments.
| Three Months Ended March 31, 2018 | ||||||||||||||||||||||||||
| ($M) | Canada | France | Netherlands | Germany | Ireland | Australia | United States | Corporate | Total | |||||||||||||||||
| Total assets | 1,649,339 | 893,181 | 242,703 | 305,103 | 665,450 | 227,375 | 90,508 | 112,875 | 4,186,534 | |||||||||||||||||
| Drilling and development | 69,117 | 29,938 | 3,245 | 1,954 | 47 | 4,555 | 15,868 | 87 | 124,811 | |||||||||||||||||
| Exploration and evaluation | - | 34 | 33 | 461 | - | - | - | 3,279 | 3,807 | |||||||||||||||||
| Crude oil and condensate sales | 62,623 | 72,745 | 475 | 9,299 | - | 38,170 | 3,953 | - | 187,265 | |||||||||||||||||
| NGL sales | 11,639 | - | - | - | - | - | 66 | - | 11,705 | |||||||||||||||||
| Natural gas sales | 18,671 | - | 35,711 | 11,202 | 53,675 | - | 40 | - | 119,299 | |||||||||||||||||
| Royalties | (9,848 | ) | (9,438 | ) | (850 | ) | (1,737 | ) | - | - | (1,122 | ) | - | (22,995 | ) | |||||||||||
| Revenue from external customers | 83,085 | 63,307 | 35,336 | 18,764 | 53,675 | 38,170 | 2,937 | - | 295,274 | |||||||||||||||||
| Transportation | (4,540 | ) | (3,195 | ) | - | (1,998 | ) | (1,286 | ) | - | - | - | (11,019 | ) | ||||||||||||
| Operating | (24,348 | ) | (13,159 | ) | (7,757 | ) | (6,186 | ) | (3,209 | ) | (13,150 | ) | (566 | ) | - | (68,375 | ) | |||||||||
| General and administration | (1,867 | ) | (3,513 | ) | (968 | ) | (1,596 | ) | (1,309 | ) | (1,534 | ) | (1,317 | ) | (2,440 | ) | (14,544 | ) | ||||||||
| PRRT | - | - | - | - | - | (4,848 | ) | - | - | (4,848 | ) | |||||||||||||||
| Corporate income taxes | - | (2,053 | ) | (5,805 | ) | - | - | (670 | ) | - | (186 | ) | (8,714 | ) | ||||||||||||
| Interest expense | - | - | - | - | - | - | - | (14,334 | ) | (14,334 | ) | |||||||||||||||
| Realized loss on derivative instruments | - | - | - | - | - | - | - | (17,715 | ) | (17,715 | ) | |||||||||||||||
| Realized foreign exchange gain | - | - | - | - | - | - | - | 1,554 | 1,554 | |||||||||||||||||
| Realized other income | - | - | - | - | - | - | - | 201 | 201 | |||||||||||||||||
| Fund flows from operations | 52,330 | 41,387 | 20,806 | 8,984 | 47,871 | 17,968 | 1,054 | (32,920 | ) | 157,480 | ||||||||||||||||
| Three Months Ended March 31, 2017 | ||||||||||||||||||||||||||
| ($M) | Canada | France | Netherlands | Germany | Ireland | Australia | United States | Corporate | Total | |||||||||||||||||
| Total assets | 1,552,230 | 806,099 | 202,477 | 292,225 | 719,761 | 272,149 | 73,195 | 65,397 | 3,983,533 | |||||||||||||||||
| Drilling and development | 57,457 | 20,916 | 1,712 | 906 | (804 | ) | 3,438 | 11,539 | - | 95,164 | ||||||||||||||||
| Exploration and evaluation | - | - | - | - | - | - | - | 725 | 725 | |||||||||||||||||
| Crude oil and condensate sales | 46,639 | 59,609 | 400 | 5,838 | - | 34,987 | 2,026 | - | 149,499 | |||||||||||||||||
| NGL sales | 5,795 | - | - | - | - | - | 56 | - | 5,851 | |||||||||||||||||
| Natural gas sales | 23,066 | 1 | 26,362 | 12,130 | 44,648 | - | 44 | - | 106,251 | |||||||||||||||||
| Royalties | (8,499 | ) | (5,320 | ) | (419 | ) | (1,368 | ) | - | - | (599 | ) | - | (16,205 | ) | |||||||||||
| Revenue from external customers | 67,001 | 54,290 | 26,343 | 16,600 | 44,648 | 34,987 | 1,527 | - | 245,396 | |||||||||||||||||
| Transportation | (4,103 | ) | (3,032 | ) | - | (1,485 | ) | (1,199 | ) | - | - | - | (9,819 | ) | ||||||||||||
| Operating | (16,670 | ) | (11,369 | ) | (4,841 | ) | (4,921 | ) | (3,999 | ) | (10,036 | ) | (285 | ) | - | (52,121 | ) | |||||||||
| General and administration | (1,698 | ) | (3,070 | ) | (596 | ) | (1,880 | ) | (438 | ) | (2,430 | ) | (1,005 | ) | (2,034 | ) | (13,151 | ) | ||||||||
| PRRT | - | - | - | - | - | (5,434 | ) | - | - | (5,434 | ) | |||||||||||||||
| Corporate income taxes | - | (4,982 | ) | (907 | ) | - | - | (1,396 | ) | - | (194 | ) | (7,479 | ) | ||||||||||||
| Interest expense | - | - | - | - | - | - | - | (14,695 | ) | (14,695 | ) | |||||||||||||||
| Realized loss on derivative instruments | - | - | - | - | - | - | - | (1,851 | ) | (1,851 | ) | |||||||||||||||
| Realized foreign exchange gain | - | - | - | - | - | - | - | 2,546 | 2,546 | |||||||||||||||||
| Realized other income | - | - | - | - | - | - | - | 42 | 42 | |||||||||||||||||
| Fund flows from operations | 44,530 | 31,837 | 19,999 | 8,314 | 39,012 | 15,691 | 237 | (16,186 | ) | 143,434 | ||||||||||||||||
Vermilion Energy Inc. ■ Page 52 ■ 2018 First Quarter Report |
Reconciliation of fund flows from operations to net earnings:
| Three Months Ended | |||||
| ($M) | Mar 31, 2018 | Mar 31, 2017 | |||
| Fund flows from operations | 157,480 | 143,434 | |||
| Accretion | (7,154 | ) | (6,382 | ) | |
| Depletion and depreciation | (121,559 | ) | (115,409 | ) | |
| Unrealized gain (loss) on derivative instruments | 17,343 | 79,865 | |||
| Equity based compensation | (19,750 | ) | (18,738 | ) | |
| Unrealized foreign exchange gain (loss) | 8,625 | (4,518 | ) | ||
| Unrealized other expense | (195 | ) | (30 | ) | |
| Deferred tax | (9,651 | ) | (33,682 | ) | |
| Net earnings | 25,139 | 44,540 | |||
| 4. Business combinations |
Corporate acquisition
On February 15, 2018, Vermilion acquired 100% of the issued and outstanding common shares of a private producer with assets in southeast Saskatchewan and southwest Manitoba. The acquisition comprised of light oil producing fields near Vermilion’s existing operations in southeast Saskatchewan. The acquisition complements Vermilion’s existing southeast Saskatchewan operations and aligns with the Company's sustainable growth-and-income model. The acquisition was funded through Vermilion’s revolving credit facility.
The total consideration paid and the provisional estimates of the fair value of the assets acquired and liabilities assumed at the date of acquisition are detailed in the table below. Subsequent amendments may be made to these amounts as estimates are finalized.
| ($M) | Consideration | ||
| Cash paid to vendor | 53,288 | ||
| Total consideration | 53,288 | ||
| ($M) | Allocation of consideration | ||
| Capital assets | 67,549 | ||
| Asset retirement obligations | (4,452 | ) | |
| Deferred tax assets | 26,914 | ||
| Acquired working capital | 1,577 | ||
| Long-term debt | (38,300 | ) | |
| Net assets acquired | 53,288 | ||
For the three months ended March 31, 2018, the acquisition contributed revenues of $2.8 million, fund flows from operations of $2.1 million, and net earnings of $1.0 million. Had the acquisition occurred on January 1, 2018, revenues would have increased by an additional $2.9 million, fund flows from operations would have increased by $2.2 million, and net earnings would be have increased by $1.0 million for the three months ended March 31, 2018.
Minor acquisitions
Vermilion completed minor acquisitions during the three months ended March 31, 2018 for total cash consideration of $2.8 million, in which $47.0 million of capital assets and $45.3 million of asset retirement obligations were recognized.
Vermilion Energy Inc. ■ Page 53 ■ 2018 First Quarter Report |
| 5. Capital assets |
The following table reconciles the change in Vermilion's capital assets:
| ($M) | 2018 | |
| Balance at January 1 | 3,337,965 | |
| Additions | 124,811 | |
| Acquisitions | 114,812 | |
| Changes in asset retirement obligations | (2,585 | ) |
| Depletion and depreciation | (120,462 | ) |
| Foreign exchange | 101,337 | |
| Balance at March 31 | 3,555,878 | |
| 6. Exploration and evaluation assets |
The following table reconciles the change in Vermilion's exploration and evaluation assets:
| ($M) | 2018 | |
| Balance at January 1 | 292,278 | |
| Additions | 3,807 | |
| Changes in asset retirement obligations | 431 | |
| Depreciation | (2,515 | ) |
| Foreign exchange | 3,615 | |
| Balance at March 31 | 297,616 | |
| 7. Asset retirement obligations |
The following table reconciles the change in Vermilion’s asset retirement obligations:
| ($M) | 2018 | |
| Balance at January 1 | 517,180 | |
| Additional obligations recognized | 51,606 | |
| Changes in estimates | (2,242 | ) |
| Obligations settled | (3,591 | ) |
| Accretion | 7,154 | |
| Changes in discount rates | (1,767 | ) |
| Foreign exchange | 19,695 | |
| Balance at March 31 | 588,035 | |
| 8. Long-term debt |
The following table summarizes Vermilion’s outstanding long-term debt:
| As at | |||||
| ($M) | Mar 31, 2018 | Dec 31, 2017 | |||
| Revolving credit facility | 982,253 | 899,595 | |||
| Senior unsecured notes | 381,249 | 370,735 | |||
| Long-term debt | 1,363,502 | 1,270,330 | |||
The fair value of the revolving credit facility is equal to its carrying value due to the use of short-term borrowing instruments at market rates of interest. The fair value of the senior unsecured notes as at March 31, 2018 was $380.0 million.
Vermilion Energy Inc. ■ Page 54 ■ 2018 First Quarter Report |
The following table reconciles the change in Vermilion’s long-term debt:
| ($M) | 2018 | |
| Balance at January 1 | 1,270,330 | |
| Borrowings on the revolving credit facility | 23,909 | |
| Assumed on acquisition(1) | 38,300 | |
| Amortization of transaction costs and prepaid interest | 1,469 | |
| Foreign exchange | 29,494 | |
| Balance at March 31 | 1,363,502 | |
(1) The acquired company's credit facility was assumed on acquisition and extinguished immediately following the acquisition using proceeds from Vermilion's revolving credit facility.
Revolving credit facility
At March 31, 2018, Vermilion had in place a bank revolving credit facility maturing May 31, 2021 with the following terms:
| As at | |||||
| ($M) | Mar 31, 2018 | Dec 31, 2017 | |||
| Total facility amount | 1,400,000 | 1,400,000 | |||
| Amount drawn | (982,253 | ) | (899,595 | ) | |
| Letters of credit outstanding | (7,700 | ) | (7,400 | ) | |
| Unutilized capacity | 410,047 | 493,005 | |||
The facility can be extended from time to time at the option of the lenders and upon notice from Vermilion. If no extension is granted by the lenders, the amounts owing pursuant to the facility are due at the maturity date. The facility is secured by various fixed and floating charges against the subsidiaries of Vermilion.
The facility bears interest at a rate applicable to demand loans plus applicable margins.
As at March 31, 2018, the revolving credit facility was subject to the following financial covenants:
| As at | |||||||
| Financial covenant | Limit | Mar 31, 2018 | Dec 31, 2017 | ||||
| Consolidated total debt to consolidated EBITDA | 4.0 | 1.96 | 1.87 | ||||
| Consolidated total senior debt to consolidated EBITDA | 3.5 | 1.42 | 1.30 | ||||
| Consolidated total senior debt to total capitalization | 55% | 34 | % | 32 | % | ||
The financial covenants include financial measures defined within the revolving credit facility agreement that are not defined under IFRS. These financial measures are defined by the revolving credit facility agreement as follows:
| • | Consolidated total debt: Includes all amounts classified as “Long-term debt”, “Current portion of long-term debt”, and “Finance lease obligation” (including the current portion included within "Accounts payable and accrued liabilities"). |
| • | Consolidated total senior debt: Defined as consolidated total debt excluding unsecured and subordinated debt. |
| • | Consolidated EBITDA: Defined as consolidated net earnings before interest, income taxes, depreciation, accretion and certain other non-cash items. |
| • | Total capitalization: Includes all amounts classified as “Shareholders’ equity” plus consolidated total debt as defined above. |
As at March 31, 2018 and 2017, Vermilion was in compliance with the above covenants.
Senior unsecured notes
On March 13, 2017, Vermilion issued US $300.0 million of senior unsecured notes at par. The notes bear interest at a rate of 5.625% per annum, to be paid semi-annually on March 15 and September 15. The notes mature on March 15, 2025. As direct senior unsecured obligations of Vermilion, the notes rank equally with existing and future senior unsecured indebtedness of the Company.
The senior unsecured notes were recognized at amortized cost and include the transaction costs directly related to the issuance.
Vermilion Energy Inc. ■ Page 55 ■ 2018 First Quarter Report |
Vermilion may, at its option, redeem the notes prior to maturity as follows:
| • | Prior to March 15, 2020, Vermilion may redeem up to 35% of the original principal amount of the senior unsecured notes with the proceeds of certain equity offerings by the Company at a redemption price of 105.625% of the principal amount plus any accrued and unpaid interest to the applicable redemption date. |
| • | Prior to March 15, 2020, Vermilion may redeem some or all of the senior unsecured notes at a price equal to 100% of the principal amount of the senior unsecured notes, plus an applicable premium and any accrued and unpaid interest. |
| • | On or after March 15, 2020, Vermilion may redeem some or all of the senior unsecured notes at the redemption prices set forth in the following table plus any accrued and unpaid interest. |
| Year | Redemption price | ||
| 2020 | 104.219 | % | |
| 2021 | 102.813 | % | |
| 2022 | 101.406 | % | |
| 2023 and thereafter | 100.000 | % | |
| 9. Shareholders' capital |
The following table reconciles the change in Vermilion’s shareholders’ capital:
| 2018 | |||||
| Shares | |||||
| Shareholders’ Capital | ('000s) | Amount ($M) | |||
| Balance at January 1 | 122,119 | 2,650,706 | |||
| Shares issued for the Dividend Reinvestment Plan | 466 | 19,641 | |||
| Shares issued for equity based compensation | 184 | 7,444 | |||
| Balance at March 31 | 122,769 | 2,677,791 | |||
Dividends declared to shareholders for the three months ended March 31, 2018 were $79.0 million (2017 - $76.6 million).
Subsequent to the end of the period and prior to the condensed consolidated interim financial statements being authorized for issue, Vermilion declared dividends of $28.5 million or $0.23 per share
| 10. Capital disclosures |
Vermilion defines capital as net debt (long-term debt plus net working capital) and shareholders’ capital.
In managing capital, Vermilion reviews whether fund flows from operations is sufficient to fund capital expenditures, dividends, and asset retirement obligations.
The following table calculates Vermilion’s ratio of net debt to fund flows from operations:
| Three Months Ended | |||||
| ($M except as indicated) | Mar 31, 2018 | Mar 31, 2017 | |||
| Long-term debt | 1,363,502 | 1,267,334 | |||
| Current liabilities | 385,330 | 268,282 | |||
| Current assets | (234,187 | ) | (157,980 | ) | |
| Net debt | 1,514,645 | 1,377,636 | |||
| Ratio of net debt to annualized fund flows from operations | 2.4 | 2.4 | |||
Vermilion Energy Inc. ■ Page 56 ■ 2018 First Quarter Report |
| 11. Financial instruments |
The following table summarizes the increase (positive values) or decrease (negative values) to net earnings before tax due to a change in the value of Vermilion’s financial instruments as a result of a change in the relevant market risk variable. This analysis does not attempt to reflect any interdependencies between the relevant risk variables.
| ($M) | Mar 31, 2018 | |
| Currency risk - Euro to Canadian dollar | ||
| $0.01 increase in strength of the Canadian dollar against the Euro | (4,129 | ) |
| $0.01 decrease in strength of the Canadian dollar against the Euro | 4,129 | |
| Currency risk - US dollar to Canadian dollar | ||
| $0.01 increase in strength of the Canadian dollar against the US $ | 2,294 | |
| $0.01 decrease in strength of the Canadian dollar against the US $ | (2,294 | ) |
| Commodity price risk - Crude oil | ||
| US $5.00/bbl increase in crude oil price used to determine the fair value of derivatives | (19,555 | ) |
| US $5.00/bbl decrease in crude oil price used to determine the fair value of derivatives | 13,318 | |
| Commodity price risk - European natural gas | ||
| € 0.5/GJ increase in European natural gas price used to determine the fair value of derivatives | (43,149 | ) |
€ 0.5/GJ decrease in European natural gas price used to determine the fair value of derivatives | 34,765 | |
| 12. Subsequent events |
On April 16, 2018, Vermilion entered into an arrangement agreement ("Arrangement") to acquire Spartan Energy Corp., a publicly traded southeast Saskatchewan oil and gas producer, for total consideration of approximately $1.40 billion (comprised of $1.23 billion in Vermilion common shares based the issuance of approximately 27.8 million Vermilion common shares at Vermilion's closing share price of $44.04 on April 13, 2018, plus the assumption of approximately $175.0 million in debt). The Arrangement is subject to customary closing conditions, including receipt of applicable court, Spartan Energy Corp. shareholder, and other regulatory approvals and is expected to close on or about June 15, 2018.
Vermilion Energy Inc. ■ Page 57 ■ 2018 First Quarter Report |
DIRECTORS
Lorenzo Donadeo1 Calgary, Alberta
Larry J. Macdonald2, 3, 4, 5 Chairman & CEO, Point Energy Ltd. Calgary, Alberta
Stephen P. Larke3, 4 Calgary, Alberta
Loren M. Leiker6 Houston, Texas
William F. Madison5, 6 Sugar Land, Texas
Timothy R. Marchant5, 6 Calgary, Alberta
Anthony Marino Calgary, Alberta
Robert Michaleski3, 4 Calgary, Alberta
Sarah E. Raiss4, 5 Calgary, Alberta
William Roby5, 6 Katy, Texas
Catherine L. Williams3, 4 Calgary, Alberta
1Chairman of the Board 2Lead Director 3Audit Committee 4Governance and Human Resources Committee 5Health, Safety and Environment Committee 6Independent Reserves Committee
ABBREVIATIONS $M thousand dollars $MM million dollars AECO the daily average benchmark price for natural gas at the AECO ‘C’ hub in Alberta bbl(s) barrel(s) bbls/d barrels per day boe barrel of oil equivalent, including: crude oil, condensate, natural gas liquids, and natural gas (converted on the basis of one boe for six mcf of natural gas) boe/d barrel of oil equivalent per day GJ gigajoules HH Henry Hub, a reference price paid for natural gas in US dollars at Erath, Louisiana mbbls thousand barrels mcf thousand cubic feet mmbtu million British thermal units mmcf/d million cubic feet per day MWh megawatt hour NBP the reference price paid for natural gas in the United Kingdom at the National Balancing Point Virtual Trading Point. NGLs natural gas liquids, which includes butane, propane, and ethane PRRT Petroleum Resource Rent Tax, a profit based tax levied on petroleum projects in Australia TTF the price for natural gas in the Netherlands at the Title Transfer Facility Virtual Trading Point. WTI West Texas Intermediate, the reference price paid for crude oil of standard grade in US dollars at Cushing, Oklahoma | OFFICERS AND KEY PERSONNEL CANADA Anthony Marino President & Chief Executive Officer Lars Glemser Vice President & Chief Financial Officer
Mona Jasinski Executive Vice President, People and Culture
Michael Kaluza Executive Vice President & Chief Operating Officer
Dion Hatcher Vice President Canada Business Unit
Terry Hergott Vice President Marketing
Jenson Tan Vice President Business Development
Daniel Goulet Director Corporate HSE
Jeremy Kalanuk Director Operations Accounting
Bryce Kremnica Director Field Operations - Canada Business Unit
Kyle Preston Director Investor Relations
Mike Prinz Director Information Technology & Information Systems
Robert (Bob) J. Engbloom Corporate Secretary
UNITED STATES Scott Seatter Managing Director - U.S. Business Unit
Timothy R. Morris Director U.S. Business Development - U.S. Business Unit
EUROPE Gerard Schut Vice President European Operations
Sylvain Nothhelfer Managing Director - France Business Unit
Sven Tummers Managing Director - Netherlands Business Unit
Albrecht Moehring Managing Director - Germany Business Unit
Darcy Kerwin Managing Director - Ireland Business Unit
Bryan Sralla Managing Director - Central & Eastern Europe Business Unit
AUSTRALIA Bruce D. Lake Managing Director - Australia Business Unit
| AUDITORS
Deloitte LLP Calgary, Alberta
BANKERS
The Toronto-Dominion Bank
Bank of Montreal
Canadian Imperial Bank of Commerce
National Bank of Canada
The Bank of Nova Scotia
Royal Bank of Canada
Alberta Treasury Branches
Bank of America N.A., Canada Branch
Citibank N.A., Canadian Branch - Citibank Canada
HSBC Bank Canada
JPMorgan Chase Bank, N.A., Toronto Branch
La Caisse Centrale Desjardins du Québec
Wells Fargo Bank N.A., Canadian Branch
Barclays Bank PLC
Canadian Western Bank
Goldman Sachs Lending Partners LLC
EVALUATION ENGINEERS
GLJ Petroleum Consultants Ltd. Calgary, Alberta
LEGAL COUNSEL
Norton Rose Fulbright Canada LLP Calgary, Alberta
TRANSFER AGENT
Computershare Trust Company of Canada
STOCK EXCHANGE LISTINGS
The Toronto Stock Exchange (“VET”) The New York Stock Exchange (“VET”)
INVESTOR RELATIONS Kyle Preston Director Investor Relations 403-476-8431 TEL 403-476-8100 FAX 1-866-895-8101 IR TOLL FREE investor_relations@vermilionenergy.com
|
Vermilion Energy Inc. ■ Page 58 ■ 2018 First Quarter Report |