Exhibit 99.1

Front Cover Theme
Sustainability is integrated into every facet of Vermilion’s business. This 15-hectare greenhouse is an example of how Vermilion reduces greenhouse emissions with geothermal energy. At Vermilion’s production facility in Parentis-en-Born, France, heat from our produced water is transferred to the heating system of the adjacent greenhouse. The result is an economically and ecologically viable greenhouse operation growing tomatoes with heat generated without carbon emissions.
Across the company, Vermilion has decreased our emissions intensity on a per unit of production basis. This is due to our energy efficiency programs, emission reduction initiatives and an operational structure that maximizes production while reducing our footprint and energy consumption intensity.
Read more about Vermilion's renewable energy projects in our Sustainability Report online at www.vermilionenergy.com.
Disclaimer
Certain statements included or incorporated by reference in this document may constitute forward looking statements or financial outlooks under applicable securities legislation. Such forward looking statements or information typically contain statements with words such as "anticipate", "believe", "expect", "plan", "intend", "estimate", "propose", or similar words suggesting future outcomes or statements regarding an outlook. Forward looking statements or information in this document may include, but are not limited to: cash flows and capital expenditures including, without limitation, statements regarding our 2019 budget; business strategies and objectives; future production and production levels (including the timing thereof); permitting, workover and maintenance, exploration and development plans; drilling plans and schedules; the timing of the anticipated closing of the transition of ownership and operatorship of assets from Shell E&P Ireland Limited and the expected impact of that closing; expected benefits of Vermilion's acquisition of assets in the Powder River Basin in Wyoming; acquisition and disposition plans (including the costs, timing and completion thereof); statements regarding our hedging activities and plans; the ability of Vermilion to maintain its current dividend; the incurrence and rate of income taxes; tax pools and future income taxes; statements regarding our ability to finance planned capital expenditures, dividends, and abandonment and reclamation expenditures; and the timing of regulatory proceedings and approvals.
Such forward looking statements or information are based on a number of assumptions, all or any of which may prove to be incorrect. In addition to any other assumptions identified in this document, assumptions have been made regarding, among other things: the ability of Vermilion to obtain equipment, services and supplies in a timely manner to carry out its activities in Canada and internationally; the ability of Vermilion to market crude oil, natural gas liquids, and natural gas successfully to current and new customers; the timing and costs of pipeline and storage facility construction and expansion and the ability to secure adequate product transportation; the timely receipt of required regulatory approvals; the ability of Vermilion to obtain financing on acceptable terms; foreign currency exchange rates and interest rates; future crude oil, natural gas liquids, and natural gas prices; and management’s expectations relating to the timing and results of exploration and development activities.
Although Vermilion believes that the expectations reflected in such forward looking statements or information are reasonable, undue reliance should not be placed on forward looking statements because Vermilion can give no assurance that such expectations will prove to be correct. Financial outlooks are provided for the purpose of understanding Vermilion’s financial position and business objectives, and the information may not be appropriate for other purposes. Forward looking statements or information are based on current expectations, estimates, and projections that involve a number of risks and uncertainties which could cause actual results to differ materially from those anticipated by Vermilion and described in the forward looking statements or information. These risks and uncertainties include, but are not limited to: the ability of management to execute its business plan; the risks of the oil and gas industry, both domestically and internationally, such as operational risks in exploring for, developing and producing crude oil, natural gas liquids, and natural gas; risks and uncertainties involving geology of crude oil, natural gas liquids, and natural gas deposits; risks inherent in Vermilion's marketing operations, including credit risk; the uncertainty of reserves estimates and reserves life and estimates of resources and associated expenditures; the uncertainty of estimates and projections relating to production and associated expenditures; potential delays or changes in plans with respect to exploration or development projects; Vermilion's ability to enter into or renew leases on acceptable terms; fluctuations in crude oil, natural gas liquids, and natural gas prices, foreign currency exchange rates and interest rates; health, safety, and environmental risks; uncertainties as to the availability and cost of financing; the ability of Vermilion to add production and reserves through exploration and development activities; the possibility that government policies or laws may change or governmental approvals may be delayed or withheld; uncertainty in amounts and timing of royalty payments; risks associated with existing and potential future law suits and regulatory actions against Vermilion; and other risks and uncertainties described elsewhere in this document or in Vermilion's other filings with Canadian securities regulatory authorities.
The forward looking statements or information contained in this document are made as of the date hereof and Vermilion undertakes no obligation to update publicly or revise any forward looking statements or information, whether as a result of new information, future events, or otherwise, unless required by applicable securities laws.
This document contains metrics commonly used in the oil and gas industry. These oil and gas metrics do not have any standardized meaning or standard methods of calculation and therefore may not be comparable to similar measures presented by other companies where similar terminology is used and should therefore not be used to make comparisons. Natural gas volumes have been converted on the basis of six thousand cubic feet of natural gas to one barrel of oil equivalent. Barrels of oil equivalent (boe) may be misleading, particularly if used in isolation. A boe conversion ratio of six thousand cubic feet to one barrel of oil is based on an energy equivalency conversion method primarily applicable at the burner tip and does not represent a value equivalency at the wellhead.
Financial data contained within this document are reported in Canadian dollars, unless otherwise stated.
Vermilion Energy Inc. | Page 1 |  2018 Third Quarter Report 2018 Third Quarter Report |
Highlights
| • | Fund flows from operations (“FFO”) for Q3 2018 was $261 million ($1.71/basic share(1)), an increase of 34% from the prior quarter (18% on a per share basis) driven by higher production volumes and higher commodity prices, partially offset by hedging losses. Year-over-year, FFO increased 99% as compared to Q3 2017 on higher production and commodity prices, partially offset by hedging losses. |
| • | Q3 2018 production increased by 19% from the prior quarter to 96,222 boe/d. The increase was primarily due to the full quarter contribution from the Spartan acquisition and new production added from our 2018 drilling program. |
| • | In Canada, production averaged 57,397 boe/d in Q3 2018, representing a 31% increase from the previous quarter primarily due to the Spartan acquisition. |
| • | In the United States, Q3 2018 production averaged 2,979 boe/d, an increase of 280% from the prior quarter, due to the production associated with an acquisition we completed during the quarter and the completion of our first half 2018 drilling program. The acquired assets are located in the Powder River Basin in Campbell County, Wyoming, approximately 40 miles (65 kilometres) northwest of Vermilion’s existing operations. The assets include approximately 55,700 net acres of land (approximately 96% working interest) and approximately 2,500 boe/d (63% oil and NGLs) of low decline production. Vermilion has identified 93 future drilling locations on this land targeting light oil in the Turner and Parkman tight sandstones. |
| • | In the Netherlands, Q3 2018 production averaged 7,479 boe/d, an increase of 2% from the prior quarter. In mid-September, we brought the Eesveen-02 well (60% working interest) on production. The well is currently flowing at a restricted rate of 10 mmcf/d net, pursuant to the conditions of the permit, and is expected to produce at this rate through 2019. We continue to advance future drilling permits in preparation for an accelerated drilling program in future years. |
| • | In Ireland, production from Corrib averaged 51 mmcf/d (8,563 boe/d) in Q3 2018, a 9% decrease from the prior quarter primarily due to a planned plant turnaround, which reduced production by approximately 450 boe/d net to Vermilion. Natural declines accounted for approximately 400 boe/d of the quarter-over-quarter decrease which is consistent with our numerical reservoir simulation, history-matched to production performance to-date. We continue to focus on activities associated with the transition of ownership and operatorship from Shell to Canada Pension Plan Investment Board (“CPPIB”) and Vermilion, and anticipate receiving final approvals from the necessary authorities and closing the transaction before the end of 2018. As noted in our Q2 2018 release, although the longer than anticipated closing timeline will have a modest impact on our booked production, Vermilion will still benefit from all interim period cash flows from January 1, 2017 to closing as a reduction of purchase price. |
| • | In Central and Eastern Europe, first gas production commenced from our Hungarian Mh-Ny-07 natural gas well (100% working interest) in the South Battonya concession. The well was brought on production mid-August, 2018 and contributed 195 boe/d to our Q3 2018 results, and is currently producing at a rate of 5.3 mmcf/d (880 boe/d). |
| • | In Australia, production averaged 4,704 bbl/d in Q3 2018, representing a 14% increase from the previous quarter primarily due to reinstatement of production following well workover activity that was successfully completed in Q2 2018. Another key well workover was completed at the end of Q3 2018, which should restore additional production during Q4 2018. We have secured all necessary third party contracts and regulatory permits associated with the Q4 2018 two-well drilling program and expect the rig to arrive by the end of October. Our planned two-well drilling program should be completed in early January 2019. |
| • | Our Board of Directors has approved a 2019 E&D capital budget of $530 million, with associated production guidance of 101,000 to 106,000 boe/d. The midpoint of our 2019 production guidance reflects year-over-year growth of approximately 18%, or 7% on a per share basis, as compared to 2018. The 2019 program reflects a full year of development on the Spartan assets acquired this year, additional capital associated with the recently acquired assets in the Powder River Basin, and a significantly expanded drilling program in Europe. |
| • | Vermilion received a top quartile ranking for 2018 for our industry sector in RobecoSAM’s annual Corporate Sustainability Assessment (“CSA”). The CSA analyzes sustainability performance across economic, environmental, governance and social criteria, and is the basis of the Dow Jones Sustainability Indices. Further demonstrating Vermilion’s commitment in this critical aspect of our business, our Board of Directors has established a Sustainability Committee to provide oversight with respect to sustainability policy and performance. |
| (1) | Non-GAAP Financial Measure. Please see the “Non-GAAP Financial Measures” section of Management’s Discussion and Analysis. |
| Vermilion Energy Inc. | Page 2 | 2018 Third Quarter Report |
| ($M except as indicated) | Q3 2018 | | | Q2 2018 | | | Q3 2017 | | | | YTD 2018 | | | YTD 2017 | |
| Financial | | | | | | | | | | |
| Petroleum and natural gas sales | 508,411 | | | 394,498 | | | 248,505 | | | | 1,221,178 | | | 781,497 | |
| Fund flows from operations | 260,705 | | | 195,190 | | | 130,755 | | | | 616,310 | | | 421,312 | |
| Fund flows from operations ($/basic share)(1) | 1.71 | | | 1.45 | | | 1.08 | | | | 4.51 | | | 3.51 | |
| Fund flows from operations ($/diluted share)(1) | 1.69 | | | 1.43 | | | 1.07 | | | | 4.46 | | | 3.45 | |
| Net (loss) earnings | (15,099 | ) | | (61,364 | ) | | (39,191 | ) | | | (51,723 | ) | | 53,613 | |
| Net (loss) earnings ($/basic share) | (0.10 | ) | | (0.46 | ) | | (0.32 | ) | | | (0.38 | ) | | 0.45 | |
| Capital expenditures | 146,185 | | | 79,984 | | | 91,382 | | | | 354,634 | | | 246,146 | |
| Acquisitions | 198,173 | | | 1,465,485 | | | 20,976 | | | | 1,756,736 | | | 24,589 | |
| Asset retirement obligations settled | 2,986 | | | 2,626 | | | 1,749 | | | | 9,203 | | | 6,118 | |
| Cash dividends ($/share) | 0.690 | | | 0.690 | | | 0.645 | | | | 2.025 | | | 1.935 | |
| Dividends declared | 105,192 | | | 98,604 | | | 78,293 | | | | 282,801 | | | 232,744 | |
| % of fund flows from operations | 40 | % | | 51 | % | | 60 | % | | | 46 | % | | 55 | % |
| Net dividends(1) | 100,872 | | | 78,629 | | | 54,364 | | | | 238,865 | | | 144,068 | |
| % of fund flows from operations | 39 | % | | 40 | % | | 42 | % | | | 39 | % | | 34 | % |
| Payout(1) | 250,043 | | | 161,239 | | | 147,495 | | | | 602,702 | | | 396,332 | |
| % of fund flows from operations | 96 | % | | 83 | % | | 113 | % | | | 98 | % | | 94 | % |
| Net debt | 2,034,086 | | | 1,796,807 | | | 1,370,995 | | | | 2,034,086 | | | 1,370,995 | |
| Ratio of net debt to annualized fund flows from operations | 1.95 | | | 2.30 | | | 2.62 | | | | 2.48 | | | 2.44 | |
| Operational |
| Production | | | | | | | | | | |
| Crude oil and condensate (bbls/d) | 47,152 | | | 34,574 | | | 27,687 | | | | 36,318 | | | 27,684 | |
| NGLs (bbls/d) | 6,839 | | | 5,651 | | | 4,947 | | | | 5,878 | | | 3,828 | |
| Natural gas (mmcf/d) | 253.38 | | | 242.40 | | | 208.63 | | | | 241.42 | | | 209.35 | |
| Total (boe/d) | 96,222 | | | 80,625 | | | 67,403 | | | | 82,433 | | | 66,404 | |
| Average realized prices | | | | | | | | | | |
| Crude oil and condensate ($/bbl) | 85.84 | | | 87.50 | | | 61.47 | | | | 84.98 | | | 64.58 | |
| NGLs ($/bbl) | 27.97 | | | 26.06 | | | 23.96 | | | | 26.61 | | | 23.01 | |
| Natural gas ($/mcf) | 5.35 | | | 4.77 | | | 4.01 | | | | 5.30 | | | 4.79 | |
| Production mix (% of production) | | | | | | | | | | |
| % priced with reference to WTI | 37 | % | | 29 | % | | 22 | % | | | 30 | % | | 20 | % |
| % priced with reference to Dated Brent | 18 | % | | 21 | % | | 26 | % | | | 21 | % | | 27 | % |
| % priced with reference to AECO | 26 | % | | 26 | % | | 26 | % | | | 26 | % | | 24 | % |
| % priced with reference to TTF and NBP | 19 | % | | 24 | % | | 26 | % | | | 23 | % | | 29 | % |
| Netbacks ($/boe) | | | | | | | | | | |
| Operating netback(1) | 34.85 | | | 33.03 | | | 26.06 | | | | 33.26 | | | 28.69 | |
| Fund flows from operations netback | 29.69 | | | 26.58 | | | 20.87 | | | | 27.59 | | | 23.34 | |
| Operating expenses | 11.13 | | | 10.75 | | | 9.87 | | | | 10.94 | | | 9.80 | |
| Average reference prices | | | | | | | | | | |
| WTI (US $/bbl) | 69.50 | | | 67.88 | | | 48.20 | | | | 66.75 | | | 49.47 | |
| Edmonton Sweet index (US $/bbl) | 62.68 | | | 62.43 | | | 45.32 | | | | 60.69 | | | 46.57 | |
| Saskatchewan LSB index (US $/bbl) | 63.35 | | | 61.84 | | | 44.91 | | | | 60.61 | | | 45.78 | |
| Dated Brent (US $/bbl) | 75.27 | | | 74.35 | | | 52.08 | | | | 72.13 | | | 51.90 | |
| AECO ($/mmbtu) | 1.19 | | | 1.18 | | | 1.45 | | | | 1.48 | | | 2.31 | |
| NBP ($/mmbtu) | 10.95 | | | 9.42 | | | 6.78 | | | | 10.12 | | | 7.10 | |
| TTF ($/mmbtu) | 10.92 | | | 9.50 | | | 6.93 | | | | 10.00 | | | 7.12 | |
| Average foreign currency exchange rates | | | | | | | | | | |
| CDN $/US $ | 1.31 | | | 1.29 | | | 1.25 | | | | 1.29 | | | 1.31 | |
| CDN $/Euro | 1.52 | | | 1.54 | | | 1.47 | | | | 1.54 | | | 1.45 | |
| Share information ('000s) |
| Shares outstanding - basic | 152,497 | | | 152,363 | | | 121,585 | | | | 152,497 | | | 121,585 | |
| Shares outstanding - diluted(1) | 155,747 | | | 155,355 | | | 124,453 | | | | 155,747 | | | 124,453 | |
| Weighted average shares outstanding - basic | 152,432 | | | 134,603 | | | 121,280 | | | | 136,585 | | | 120,152 | |
| Weighted average shares outstanding - diluted(1) | 153,839 | | | 136,559 | | | 122,485 | | | | 138,258 | | | 121,963 | |
(1)The above table includes non-GAAP financial measures which may not be comparable to other companies. Please see the “Non-GAAP Financial Measures” section of Management’s Discussion and Analysis.
| Vermilion Energy Inc. | Page 3 | 2018 Third Quarter Report |
Message to Shareholders
We delivered record quarterly production of 96,222 boe/d in Q3 2018, marking our first full quarter with the integration of the Spartan assets and our first quarter with production and cash flow contribution from our Central and Eastern European ("CEE") business unit. We also completed another acquisition in the quarter, expanding our land base in the Turner Sand fairway. We expect both of these acquisitions and ongoing development in our CEE business unit to contribute to our long-term growth profile, while generating free cash to support our growth-and-income capital markets model.
Our Q3 2018 FFO increased 34% quarter-over-quarter to $261 million, which is twice the amount we generated in Q3 2017. The Q3 2018 results included a $37 million realized hedging loss largely driven by the recent strength in global oil prices and European natural gas prices. On a year-to date basis, we have generated $616 million in FFO, which includes the impact of an $83 million realized hedging loss.
Our Board of Directors has approved a 2019 capital budget of $530 million with associated production guidance of 101,000 to 106,000 boe/d. The midpoint of this guidance range represents year-over-year production growth of 18%, or 7% on a per share basis. Including our projected 2018 results, Vermilion will have delivered compounded average production-per-share-growth of 9% over the past 5 years, coming primarily from high margin barrels, as the majority of our production receives premium or advantaged pricing relative to our peers. The oil and gas produced from our international assets is indexed to Brent oil and European gas benchmarks, both of which trade at significant premiums to their North American counterparts. In turn, the vast majority of our North American oil is produced in areas that have relative pricing advantages to most Canadian oil streams, enhancing netbacks and free cash flow generation.
With our growing production base, continued discipline in capital spending, and the current strength in commodity prices, our free cash flow profile has never been better. Based on the mid-point of our 2019 production guidance and the current commodity strip at October 15, 2018, we expect to more than fully fund our $530 million capital program and annual dividend, resulting in a total payout ratio of approximately 82% and over $200 million in surplus cash beyond our needs for our capital program and dividends.
As part of our annual budgeting process and ongoing strategic planning for the company, we continuously update our long-range development plans. On this note, we have recently updated the investor presentation on our website to reflect our longer-term drilling plans in the Netherlands and Germany. In Germany, we have identified several future exploration prospects (working interests from 46% to 100%) which we believe may range in size from 300 Bcf to over 1 Tcf of recoverable gas (unrisked) if successful. We plan to drill these prospects over the next five years. In the Netherlands, we have outlined a preliminary drilling schedule that calls for acceleration of our annual drilling activity to six or more wells by 2021. We continue to work to identify ways to streamline our permitting process in the Netherlands, and are increasingly confident that this accelerated drilling pace can be achieved over time. Our 2019 budget includes a ten (7.0 net) well drilling program in Central and Eastern Europe, which is an area in which we have recently initiated production and expect to continue to expand in the years ahead. In aggregate, our European drilling plan calls for 19 (13.7 net) wells next year, the largest drilling program we have conducted in our 21-year history in that region. We will discuss many of these future growth prospects in greater detail at our upcoming investor day in Toronto on November 27, 2018.
| Vermilion Energy Inc. | Page 4 | 2018 Third Quarter Report |
| Q3 2018 Operations Review |
Europe
In France, Q3 2018 production averaged 11,407 boe/d, a decrease of 2% from the prior quarter. The three (3.0 net) wells from our early 2018 drilling program in the Champotran field continue to outperform, contributing 750 boe/d in the third quarter, while other workover and maintenance activities continue to progress as planned.
In the Netherlands, Q3 2018 production averaged 7,479 boe/d, an increase of 2% from the prior quarter. In mid-September, we brought the Eesveen-02 well (60% working interest) on production. The well is currently flowing at a restricted rate of 10 mmcf/d net, pursuant to the conditions of the environmental permit. The well is expected to produce at this rate through 2019. Additional activity during the third quarter was focused on maintenance and well workovers, and planning for our 2019 drilling campaign. We were recently granted a positive decision on the EIA (Environmental Impact Assessment) judgment for the two wells included in our 2019 drilling plans and are now awaiting final approval of the drilling permits before proceeding. As mentioned above, we continue to work on advancing our future drilling permits, in part by reducing our surface footprint through long departure wells from existing well pads where feasible, in preparation for an accelerated drilling program in the years ahead. As previously noted, we intend to accelerate our annual drilling program to six or more wells per year by 2021.
In Ireland, production from Corrib averaged 51 mmcf/d (8,563 boe/d) in Q3 2018, a 9% decrease from the prior quarter, primarily due to a planned plant turnaround in September, which reduced production by approximately 450 boe/d net to Vermilion. Natural declines accounted for approximately 400 boe/d of the quarter-over-quarter decrease, which is consistent with our numerical simulation of reservoir performance. Our reservoir simulation model projects an average annual decline rate of approximately 15%, with a slightly higher decline rate in the early years and a slightly lower decline rate in the later years. Based on the model, we expect the field to decline at approximately 17% in 2019, decrease to 15% in 2020, and then level off to approximately 14% thereafter. We continue to focus on activities associated with the transition of ownership and operatorship from Shell to Canada Pension Plan Investment Board (“CPPIB”) and Vermilion. We anticipate receiving final approvals from the necessary authorities and closing the transaction before the end of 2018. As noted in our Q2 2018 release, although the longer than anticipated closing of this transaction will have a modest impact on our booked production from Ireland, Vermilion will still benefit from all interim period cash flows from January 1, 2017 to closing as a reduction of purchase price. We now anticipate the closing price for our incremental 1.5% working interest to be approximately €6 million, compared to €19.4 million as announced in July 2017.
In Germany, production in Q3 2018 averaged 3,498 boe/d, little changed from the prior quarter. Restoration of gas processing at a non-operated gas processing facility during the quarter was largely offset by other minor unplanned downtime events. Our capital activity in Germany continues to focus on well and facility maintenance and preparatory work related to the drilling of our first operated well in Germany, the Burgmoor Z5 well (46% working interest), which is expected to commence drilling in Q1 2019.
In Central and Eastern Europe, first gas production commenced from our Hungarian Mh-Ny-07 natural gas well (100% working interest) in the South Battonya concession. The well, which was drilled and tested in the first quarter of this year, was brought on production mid-August and contributed 195 boe/d to our Q3 2018 results. The production rate from this well has recently been increased to 5.3 mmcf/d (880 boe/d), which compares to our original test flow rate of approximately 5.8 mmcf/d (970 boe/d). Permitting activities have been initiated in preparation for our 2019 drilling campaign across Hungary, Slovakia and Croatia where we plan to drill ten (7.0 net) wells. The permitting process is progressing well as we work collaboratively with regulatory bodies in all three countries who continue to exhibit strong levels of support for our activities. In Hungary, further 3D seismic interpretation performed in the quarter revealed a new Pannonian gas prospect in our Ebes license, with seismic attributes analogous to our Mh-Ny-07 discovery in South Battonya. In Croatia, we initiated seismic permitting for a new 2D seismic data acquisition to be carried out in Q4 2018, following the positive results achieved on the first phase of our 2D seismic data acquisition in Q2 2018.
Australia
In Australia, production averaged 4,704 bbl/d in Q3 2018, representing a 14% increase from the previous quarter primarily due to reinstatement of production following well workover activity that was successfully completed in Q2 2018. Another key well workover, which is part of our electrical submersible pump/increased fluid handling project, was completed at the end of Q3 2018 and should restore additional production in Q4 2018. Subsequent to end of the third quarter, we successfully completed a planned platform turnaround. In addition to the workover activity in Q3 2018, we continued to focus on preparatory activities associated with our upcoming two (2.0 net) well drilling campaign in Q4 2018. We have secured all necessary third party contracts and regulatory permits to drill and have prepared the majority of the materials needed for the load-out offshore. The rig is scheduled to arrive by the end of October, which should enable us to complete the planned wells by early January. As stated in our Q2 release, the early drilling is not expected to contribute any production to our 2018 results, but will allow us to save approximately $12 million in capital compared to drilling in 2019.
North America
In Canada, production averaged 57,397 boe/d in Q3 2018, representing a 31% increase from the previous quarter, primarily due to a full quarter of contribution from the Spartan assets. Production was partially offset by downtime due to third party gas plant maintenance, rate restrictions on certain wells and weather-related project delays. We drilled or participated in 65 (59.0 net) wells and brought on production 53 (49.8 net) wells in Q3 2018. We successfully executed a five rig drilling program in Saskatchewan in the quarter, drilling or participating in 60 (54.6 net) wells across our combined land base. We also operated one rig in Alberta during the quarter which included the drilling of four (4.0 net) Mannville wells and one (0.4 net) Cardium well. Results from all programs have been in line with our expectations.
| Vermilion Energy Inc. | Page 5 | 2018 Third Quarter Report |
Canadian oil differentials widened towards the end of the quarter, which had a modestly negative impact on our realized pricing. The majority of our Canadian liquids production receives significantly advantaged pricing relative to Alberta-based light crude oil. We have no heavy crude (WCS) in our Canadian oil mix. Approximately 70% of our Canadian oil is produced in southeast Saskatchewan and receives a price referenced to LSB (Light Sour Blend). The remaining 30% of our Canadian oil production is comprised of a combination of condensate and light oil in west-central Alberta and the Kerrobert area of Saskatchewan which is price referenced to the C5+ and MSW (Mixed Sweet Blend) benchmarks respectively. In the forward market for the balance of the year, the discount on all Canadian oil products has widened significantly. However, LSB and C5+ have widened to a much lesser extent than WCS and MSW. For example, LSB in the current prompt market has strengthened by approximately US$11.00/bbl relative to MSW compared to the average for Q3 2018.
Although we do not actively target natural gas in our Canadian operations, we still produce gas from high margin condensate-rich and liquids-rich gas wells and associated gas from our light oil assets. Subsequent to the quarter, AECO gas prices have improved significantly, with the forward curve indicating a Q4 2018 price that is nearly double the Q3 2018 price, representing a potential $1.00/mcf quarter-over-quarter improvement should the forward curve be realized. For every $1.00/mcf increase in AECO gas prices, we estimate an additional annual FFO contribution of approximately $50 million.
In the United States, Q3 2018 production averaged 2,979 boe/d, an increase of 280% from the prior quarter, due to the production associated with the Powder River Basin acquisition and development activities during the quarter. Third quarter production also increased following the completion of our first half 2018 drilling program, as we brought the final two (2.0 net) wells of the five (5.0 net) well program on production.
| Powder River Basin Acquisition |
During the third quarter, we acquired mineral land and producing assets in the Powder River Basin in Wyoming (the “Acquisition”) for total cash consideration of approximately $186 million (the “Purchase Price”).
The Acquisition is comprised of low base decline, light oil-weighted production and high-quality mineral leasehold in the Powder River Basin in Campbell County, Wyoming (the “Assets”), approximately 40 miles (65 kilometres) northwest of Vermilion’s existing operations. The Assets include approximately 55,700 net acres of land (approximately 96% working interest) and approximately 2,500 boe/d (63% oil and NGLs) of production with an estimated annual base decline rate of 13%. Approximately half of the current production comes from three federal secondary recovery units in the Muddy formation, with the remainder coming from higher-netback production from Turner Sand horizontal producers.
Vermilion has identified 93 future drilling locations targeting light oil in the Turner and Parkman tight sandstones, which are expected to be developed using horizontal wells with multi-stage fracs. In these future development zones, the production and reserves are expected to be comprised of approximately 75% crude oil and NGLs. Significant infrastructure already exists in the area, including gas gathering and water source and disposal, which is expected to simplify future development. All of the production on the acquired land is operated and 93% is held-by-production (HBP), giving us control over the pace of development.
The Acquisition is accretive on a per share basis for all pertinent metrics including production, debt-adjusted cash flow(2) and reserves. Making no deduction for land value, transaction metrics equate to $5.40 per boe of proved plus probable (“2P”) reserves, and $74,400 per flowing barrel of production. Alternatively, ascribing zero value to the acquired production, the total Acquisition cost is approximately $3,400 per net acre or US$2,600 per net acre. Total 2P reserves attributed to the Assets at an effective date of December 31, 2017 are 34.4(3) mmboe (67% crude oil and NGL), based on an independent evaluation by GLJ Petroleum Consultants Ltd. Using WTI strip pricing of US$72.20/bbl for the remainder of 2018 at October 15, 2018, the operating netback for the current production is estimated at approximately $28.32(1) per boe. Using a 2P finding, development and acquisition cost (based on the reserves in the GLJ report) of $11.80 per boe (including future development capital), the Assets are expected to deliver a 2P after-tax fund flows recycle ratio(2) of 2.4 times. It is anticipated that future netbacks, cash flows and recycle ratios will be enhanced by more highly oil-weighted production additions from the Turner and Parkman Sands.
Using the same strip pricing assumptions as above, the cost of the Acquisition is approximately 6.4 times debt-adjusted cash flow(2) based on 2018 annualized cash flow. The transaction was financed by drawing on our revolving credit facility. Following the Acquisition, we have expanded our credit facility commitment level to $1.8 billion from $1.6 billion, maintaining unutilized revolver capacity at approximately $450 million. Pro-forma the acquisition, our projected year-end 2019 debt-to-fund flows from operations (“FFO”) ratio is forecast to be 1.43 times on October 15, 2018 strip pricing, as compared to 1.33 times prior to the acquisition.
| Vermilion Energy Inc. | Page 6 | 2018 Third Quarter Report |
The Acquisition expands our presence in a highly-prospective basin where we already operate and are familiar with the land, regulatory, reservoir and geologic characteristics. The Acquisition also increases scale in our US business unit, providing for operational synergies with our existing Turner Sand position, a significant inventory of semi-conventional locations in a well-delineated productive area, and potential for additional consolidation and organic growth in the region. Finally, the Acquisition aligns with our sustainable growth-and-income model by accretively adding low risk assets with strong free cash flow, high netbacks, low base decline rates and strong capital efficiencies on future development.
Our Board of Directors have approved an E&D capital budget of $530 million for 2019, with associated production guidance of 101,000 to 106,000 boe/d. The midpoint of our 2019 production guidance reflects year-over-year growth of 18%, or 7% on a per share basis, compared to 2018.
Our 2019 capital budget will fund additional activity in all countries except Australia, where we accelerated the originally planned 2019 two-well program into Q4 2018. The 2019 program reflects a full year of development on the Spartan assets, additional capital associated with the recently acquired assets in the Powder River Basin, and also incorporates a significantly expanded drilling program in Europe.
In Europe, we expect to resume drilling in the Netherlands, significantly expand our drilling program in Central and Eastern Europe, commence our inaugural drilling campaign in Germany, and continue with our low risk development plans in France. The majority of the new wells we plan to drill in Europe during 2019 will be targeting natural gas which continues to sell at a significant premium to North American gas prices. In total, we plan to drill 19 (13.7 net) wells in Europe in 2019, representing our most active drilling program in Europe over our 21-year history. This is more than three times the number of wells we drilled in 2018 and over 25% more than our previous high in Europe.
In North America, our activity will continue to focus on our three core areas of west-central Alberta (condensate-rich gas), southeast Saskatchewan (light oil) and the Powder River Basin in Wyoming (light oil), all of which are products with advantaged market access and resulting lower basis differentials. We plan to drill 19.0 (16.7 net) condensate-rich wells in west-central Alberta, 143 (129.0 net) light oil wells in southeast Saskatchewan, and eight (8.0 net) light oil wells in the Powder River Basin.
At October 15, 2018 strip prices, Vermilion expects to fully fund 2019 E&D capital expenditures and dividends from internally generated fund flows from operations. Excess cash generation above capital and dividend outflows is planned for further debt reduction, high-return bolt-on acquisitions, or returned to shareholders. Using the same strip prices as above, and assuming excess cash is used to paydown debt, we project a 2019 total payout of 82% with a year-end debt-to-FFO ratio of 1.43 times. Even at meaningfully lower commodity prices than the current strip, we project that we would remain self-funded for our uses of cash and that our capital program would provide high investment returns. Nonetheless, we have the flexibility to reduce our capital investment program in the event of a significant commodity downturn, and if required, we will prioritize the safety and reliability of our growth-and-income model above growth.
Europe
In France, our E&D budget of $78 million is relatively consistent with our 2018 budget. Following the success of our 2018 Champotran field drilling campaign, we plan to drill an additional four (4.0 net) Champotran wells in the Paris Basin in 2019. Following successful workover campaigns in the Lugos field in the Aquitaine Basin, Vermilion has identified additional infill-drilling opportunities. Vermilion plans to drill one (1.0 net) of these infill wells in the Lugos field in 2019.
In the Netherlands, our 2019 E&D capital budget of $26 million represents a 13% increase from 2018. We plan to drill two (0.9 net) wells in 2019. We were recently granted a positive decision on the EIA (Environmental Impact Assessment) judgement for the two wells included in our 2019 drilling plans and are now awaiting final approval of the drilling permits before proceeding. As part of our 2019 capital activities, we will also conduct permitting work to support our expanded drilling program for the coming years.
In Germany, our E&D capital budget of $24 million represents a 50% increase from our 2018 capital program. We expect to begin drilling our first operated well (0.5 net) in Q1 2019, the Burgmoor Z5 well, in which we own a 46% working interest. This semi-development well has been included as one of the commitment wells on our farm-in with ExxonMobil Production Deutschland GmbH (“EMPG”), and represents the first drilling on the EMPG farm-in. If successful, we anticipate bringing this well on production in early 2020. Additionally, we expect to drill two (2.0 net) sidetrack injector wells from existing well bores in a waterflood within our operated oil assets, along with participating in another sidetrack well on one (0.3 net) of our non-operated gas wells. We will also continue to advance our permitting and other activities associated with the farm-in agreement, with the next drilling following Burgmoor Z5 planned for 2020.
Our Central and Eastern Europe business unit is poised for significantly more activity in 2019, with a capital program of $18 million, up 50% from 2018. We expect to drill four (2.0 net) wells in Slovakia, three (2.5 net) wells in Hungary and three (2.5 net) wells in Croatia. All of these wells are targeting natural gas except for one light oil prospect in Croatia. While we expect production contributions from our Hungarian drilling in 2019, the initial drilling activity in Slovakia and Croatia is not expected to contribute any production in 2019.
| Vermilion Energy Inc. | Page 7 | 2018 Third Quarter Report |
In Ireland, we plan a limited capital program, primarily focused on facility maintenance. We expect to become operator of the Corrib gas field before the end of 2018, subject to regulatory approvals and completion of our acquisition, along with Canada Pension Plan Investment Board, of Shell E&P Ireland Limited. During our first year as operator, we will focus primarily on the continued integration and streamlining of the operations while identifying opportunities for future optimization and development projects.
North America
In Canada, we have approved an E&D budget of $319 million for 2019, representing a 23% increase from our post-Spartan capital budget for 2018. This will mark our most active capital program ever in Canada as we focus on our first full year operating the former Spartan assets. We plan to drill or participate in 143 (129.0 net) light oil wells in Saskatchewan and 20 (17.7 net) wells in Alberta including 19 (16.7 net) Mannville wells.
In the United States, our 2019 E&D capital budget of $51 million represents a 31% increase from our 2018 capital program. We plan to drill six (6.0 net) wells on our newly acquired lands, referred to as the Hilight assets, in addition to the drilling of two (2.0 net) wells in our legacy East Finn asset in the Powder River Basin in Wyoming.
Australia
Our 2019 E&D budget of $13 million in Australia will focus on facility maintenance following the acceleration of our originally planned 2019 drilling campaign into Q4 2018. Our intention is to manage production to an average level of approximately 6,000 bbl/d.
E&D Capital Investment by Country
| Country | 2019 Budget
($MM) | | 2018 Budget
($MM) | | 2019 vs. 2018
% Change | 2019
Net Wells | | 2018
Net Wells | |
| Canada | 319 | | 260 | | 23 | % | 146.7 | | 125.7 | |
| France | 78 | | 79 | | (1 | )% | 5.0 | | 5.0 | |
| Netherlands | 26 | | 23 | | 13 | % | 0.9 | | - | |
| Germany | 24 | | 16 | | 50 | % | 0.8 | | - | |
| Ireland | 1 | | 1 | | - | % | - | | - | |
| Australia | 13 | | 80 | | (84 | )% | - | | 2.0 | |
| USA | 51 | | 39 | | 31 | % | 8.0 | | 5.0 | |
| Central and Eastern Europe | 18 | | 12 | | 50 | % | 7.0 | | 1.0 | |
| Total E&D Capital Expenditures | 530 | | 510 | | 4 | % | 168.4 | | 138.7 | |
E&D Capital Investment by Category
| Category | 2019 Budget
($MM) | | 2018 Budget
($MM) | | 2019 vs. 2018
% Change |
| Drilling, completion, new well equipment and tie-in, workovers and recompletions | 390 | | 383 | | 2 | % |
| Production equipment and facilities | 100 | | 82 | | 22 | % |
| Seismic, studies, land and other | 40 | | 45 | | (11 | )% |
| Total E&D Capital Expenditures | 530 | | 510 | | 4 | % |
*2019 Budget reflects foreign exchange assumptions of CAD/USD 1.27, CAD/EUR 1.51 and CAD/AUD 0.92.
Our production plan by business unit can be found in our November 2018 investor presentation on our website.
Commodity Hedging
Vermilion hedges to manage commodity price exposures and increase the stability of cash flows, providing additional certainty with regards to the execution of our dividend and capital programs. In aggregate, we currently have 36% of our expected net-of-royalty production hedged for Q4 2018. Over half of the Q4 2018 corporate hedge position consists of two-way collars and three-way structures, which allow participation in price increases, up to contract ceilings.
| Vermilion Energy Inc. | Page 8 | 2018 Third Quarter Report |
We have currently hedged 62% of anticipated European natural gas volumes for Q4 2018. In view of the compelling longer-term forward market for European gas, we have also hedged 56% and 27% of our anticipated 2019 and 2020 volumes at prices which will provide for strong project economics and free cash flows. In addition, we have hedged 30% of anticipated North American gas volumes for Q4 2018. At present, our philosophy is to keep our oil hedges shorter-term, in view of the backwardation in the oil futures curve. As of October 23, 2018, 16% of our oil production is hedged for 2019. We will continue to add to our hedge positions in all products as suitable opportunities arise.
Environmental, Social and Governance ("ESG")
Vermilion received a top quartile ranking for 2018 for our industry sector in RobecoSAM’s annual Corporate Sustainability Assessment (“CSA”). The CSA analyzes sustainability performance across economic, environmental, governance and social criteria, and is the basis of the Dow Jones Sustainability Indices. We believe the integration of sustainability principles into our business is the right thing to do, increases shareholder returns, and reduces long-term risks to our business model. This rating demonstrates our commitment to maintaining leadership in sustainability and ESG performance.
Further demonstrating Vermilion’s commitment, our Board of Directors has established a Sustainability Committee to provide oversight with respect to sustainability policy and performance. Members of the committee include independent directors as follows: Tim Marchant (Chair), Carin Knickel, Steve Larke and Bill Roby.
(signed “Anthony Marino”)
Anthony Marino
President & Chief Executive Officer
October 24, 2018
| (1) | Non-GAAP Financial Measure. Please see the “Non-GAAP Financial Measures” section of Management’s Discussion and Analysis. |
| (2) | “Debt-adjusted cash flow” represents fund flows from operations prior to the impact of interest charges. Management considers debt-adjusted cash flow to be a useful measure to compare transaction metrics on an unlevered basis. “After-tax fund flows recycle ratio” represents the after-tax netback per boe divided by FD&A costs in dollars per boe. Management considers after-tax fund flows recycle ratio to be a useful measure of capital efficiency. |
| (3) | Estimated total proved and proved plus probable reserves attributable to the Assets as evaluated by GLJ Petroleum Consultants Ltd. in a report dated August 7, 2018 with an effective date of December 31, 2017, in accordance with National Instrument 51-101 - Standards of Disclosure For Oil and Gas Activities of the Canadian Securities Administrators, using the GLJ (2018-01) price forecast (the “GLJ Report”). |
| Vermilion Energy Inc. | Page 9 | 2018 Third Quarter Report |
Management's Discussion and Analysis
The following is Management’s Discussion and Analysis (“MD&A”), dated October 24, 2018, of Vermilion Energy Inc.’s (“Vermilion”, “we”, “our”, “us” or the “Company”) operating and financial results as at and for the three and nine months ended September 30, 2018 compared with the corresponding periods in the prior year.
This discussion should be read in conjunction with the unaudited condensed consolidated interim financial statements for the three and nine months ended September 30, 2018 and the audited consolidated financial statements for the year ended December 31, 2017 and 2016, together with the accompanying notes. Additional information relating to Vermilion, including its Annual Information Form, is available on SEDAR at www.sedar.com or on Vermilion’s website at www.vermilionenergy.com.
The unaudited condensed consolidated interim financial statements for the three and nine months ended September 30, 2018 and comparative information have been prepared in Canadian dollars, except where another currency has been indicated, and in accordance with IAS 31, "Interim Financial Reporting", as issued by the International Accounting Standards Board ("IASB").
This MD&A includes references to certain financial and performance measures which do not have standardized meanings prescribed by International Financial Reporting Standards ("IFRS"). These measures include:
| • | Fund flows from operations: Fund flows from operations is a measure of profit or loss in accordance with IFRS 8 “Operating Segments”. Please see "Segmented information" in the "Notes to the condensed consolidated interim financial statements" for a reconciliation of fund flows from operations to net earnings. We analyze fund flows from operations both on a consolidated basis and on a business unit basis in order to assess the contribution of each business unit to our ability to generate income necessary to pay dividends, repay debt, fund asset retirement obligations and make capital investments. |
| • | Netbacks: Netbacks are per boe and per mcf performance measures used in the analysis of operational activities. We assess netbacks both on a consolidated basis and on a business unit basis in order to compare and assess the operational and financial performance of each business unit versus other business units and also versus third party crude oil and natural gas producers. |
In addition, this MD&A includes references to certain financial measures which are not specified, defined, or determined under IFRS and are therefore considered non-GAAP financial measures. These non-GAAP financial measures are unlikely to be comparable to similar financial measures presented by other issuers. For a full description of these non-GAAP financial measures and a reconciliation of these measures to their most directly comparable GAAP measures, please refer to “Non-GAAP Financial Measures”.
Condensate Presentation
We report our condensate production in Canada and the Netherlands business units within the crude oil and condensate production line. We believe that this presentation better reflects the historical and forecasted pricing for condensate, which is more closely correlated with crude oil pricing than with pricing for propane, butane and ethane (collectively “NGLs” for the purposes of this report).
IFRS 16 Application
In Q3 2018, Vermilion began applying IFRS 16 "Leases" effective January 1, 2018. Q1 2018 and Q2 2018 results have been revised to reflect the impact of this new accounting pronouncement. Please refer to Recently Adopted Accounting Pronouncements for further information.
| Vermilion Energy Inc. | Page 10 | 2018 Third Quarter Report |
Guidance
On October 30, 2017, we released our 2018 capital expenditure guidance of $315 million and associated production guidance of between 74,500 to 76,500 boe/d. On January 15, 2018, we increased our capital expenditure guidance to $325 million and production guidance to between 75,000 to 77,500 boe/d to reflect the post-closing impact of the acquisition of a private southeast Saskatchewan and southwest Manitoba light oil producer. On April 16, 2018, we increased our capital expenditure guidance to $430 million and production guidance to between 86,000 to 90,000 boe/d to reflect the post-closing impact of the acquisition of Spartan Energy Corp. On July 30, 2018, we increased our capital expenditure guidance to $500 million to reflect the acceleration of our Australia drilling campaign into Q4 2018, and to a lesser extent to account for the impact of foreign exchange fluctuations on our Canadian dollar capital levels. As of October 25, 2018, we are increasing our capital expenditure guidance to $510 million to reflect additional capital activity associated with the assets acquired in the Powder River Basin in August of 2018.
We released our 2019 capital budget and related guidance concurrent with the release of our Q3 2018 results.
The following table summarizes our guidance:
| | Date | | Capital Expenditures ($MM) | | | Production (boe/d) |
| 2018 Guidance | | | | | |
| 2018 Guidance | October 30, 2017 | | 315 | | | 74,500 to 76,500 |
| 2018 Guidance | January 15, 2018 | | 325 | | | 75,000 to 77,500 |
| 2018 Guidance | April 16, 2018 | | 430 | | | 86,000 to 90,000 |
| 2018 Guidance | July 30, 2018 | | 500 | | | 86,000 to 90,000 |
| 2018 Guidance | October 25, 2018 | | 510 | | | 86,000 to 90,000 |
| 2019 Guidance | | | | | |
| 2019 Guidance | October 25, 2018 | | 530 | | | 101,000 to 106,000 |
| Vermilion Energy Inc. | Page 11 | 2018 Third Quarter Report |
Vermilion's Business
Vermilion is a Calgary, Alberta based international oil and gas producer focused on the acquisition, exploration, development and optimization of producing properties in North America, Europe, and Australia. We manage our business through our Calgary head office and our international business unit offices. This MD&A separately discusses each of our business units in addition to our corporate segment.

| Vermilion Energy Inc. | Page 12 | 2018 Third Quarter Report |
Consolidated Results Overview
| | Q3 2018 | | | Q2 2018 | | | Q3 2017 | | | Q3/18 vs. Q2/18 | | Q3/18 vs. Q3/17 | | | YTD 2018 | | | YTD 2017 | | | 2018 vs. 2017 |
| Production | | | | | | | | | | | | | | | | |
| Crude oil and condensate (bbls/d) | 47,152 | | | 34,574 | | | 27,687 | | | 36% | | 70% | | | 36,318 | | | 27,684 | | | 31% |
| NGLs (bbls/d) | 6,839 | | | 5,651 | | | 4,947 | | | 21% | | 38% | | | 5,878 | | | 3,828 | | | 54% |
| Natural gas (mmcf/d) | 253.38 | | | 242.40 | | | 208.63 | | | 5% | | 21% | | | 241.42 | | | 209.35 | | | 15% |
| Total (boe/d) | 96,222 | | | 80,625 | | | 67,403 | | | 19% | | 43% | | | 82,433 | | | 66,404 | | | 24% |
| Sales | | | | | | | | | | | | | | | | |
| Crude oil and condensate (bbls/d) | 46,368 | | | 34,655 | | | 28,391 | | | 34% | | 63% | | | 35,749 | | | 27,431 | | | 30% |
| NGLs (bbls/d) | 6,839 | | | 5,651 | | | 4,947 | | | 21% | | 38% | | | 5,878 | | | 3,828 | | | 54% |
| Natural gas (mmcf/d) | 253.38 | | | 242.40 | | | 208.63 | | | 5% | | 21% | | | 241.42 | | | 209.35 | | | 15% |
| Total (boe/d) | 95,437 | | | 80,706 | | | 68,107 | | | 18% | | 40% | | | 81,864 | | | 66,151 | | | 24% |
| Build (draw) in inventory (mbbls) | 73 | | | (7 | ) | | (64 | ) | | | | | | | 155 | | | 69 | | | |
| Financial metrics | | | | | | | | | | | | | | | | |
| Fund flows from operations ($M) | 260,705 | | 195,190 | | 130,755 | | 34% | | 99% | | | 616,310 | | 421,312 | | 46% |
| Per share ($/basic share) | 1.71 | | 1.45 | | 1.08 | | 18% | | 58% | | | 4.51 | | | 3.51 | | | 28% |
| Net (loss) earnings | (15,099 | ) | | (61,364 | ) | | (39,191 | ) | | (75)% | | (61)% | | | (51,723 | ) | | 53,613 | | | N/A |
| Per share ($/basic share) | (0.10 | ) | | (0.46 | ) | | (0.32 | ) | | (78)% | | (69)% | | | (0.38 | ) | | 0.45 | | | N/A |
| Net debt ($M) | 2,034,086 | | | 1,796,807 | | | 1,370,995 | | | 13% | | 48% | | | 2,034,086 | | | 1,370,995 | | | 48% |
| Cash dividends ($/share) | 0.690 | | | 0.690 | | | 0.645 | | | — % | | 7% | | | 2.025 | | | 1.935 | | | 5% |
| Activity | | | | | | | | | | | | | | | | |
| Capital expenditures ($M) | 146,185 | | | 79,984 | | | 91,382 | | | 83% | | 60% | | | 354,634 | | | 246,146 | | | 44% |
| Acquisitions ($M) | 198,173 | | | 1,465,485 | | | 20,976 | | | | | | | | 1,756,736 | | | 24,589 | | | |
| Gross wells drilled | 65.00 | | | 18.00 | | | 17.00 | | | | | | | | 112.00 | | | 48.00 | | | |
| Net wells drilled | 58.97 | | | 16.19 | | | 13.77 | | | | | | | | 102.85 | | | 40.58 | | | |
| Financial performance review |
Q3 2018 vs. Q2 2018

| • | We recorded a net loss for Q3 2018 of $15.1 million ($0.10/basic share) compared to a net loss of $61.4 million ($0.46/basic share) in Q2 2018. The net loss in Q3 2018 primarily resulted from a $75.8 million unrealized loss on derivative instruments and a $23.0 million unrealized loss on foreign exchange. The decrease in the net loss in Q3 2018 compared to Q2 2018 was primarily attributable to a $65.5 million increase in fund flows from operations and a $29.5 million decrease in the unrealized loss on derivative instruments. |
| Vermilion Energy Inc. | Page 13 | 2018 Third Quarter Report |

| • | Generated fund flows from operations of $260.7 million during Q3 2018, an increase of 34% from Q2 2018. This quarter-over-quarter increase was due to a full quarter of contribution from Spartan Energy Corp. ("Spartan") following the Q2 2018 acquisition and stronger European natural gas and North American crude oil pricing. |
Q3 2018 vs. Q3 2017
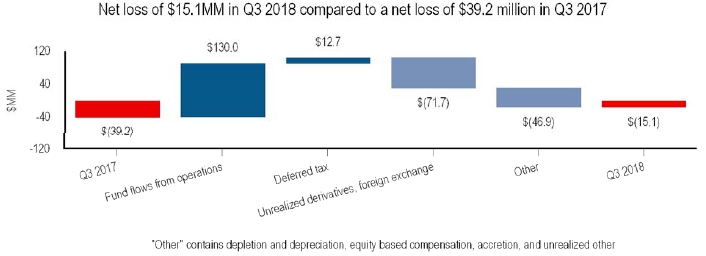
| • | We recorded a net loss for Q3 2018 of $15.1 million ($0.10/basic share) compared to a net loss of $39.2 million ($0.32/basic share) in Q3 2017 . This net loss occurred despite a doubling in fund flows from operations due to unrealized losses on derivatives and foreign exchange (approximately $68.8 million after-tax impact). |

| Vermilion Energy Inc. | Page 14 | 2018 Third Quarter Report |
| • | Fund flows from operations doubled in Q3 2018 versus Q3 2017 and increased by nearly 60% on a per share basis. This increase was due to an increase in our realized pricing and higher sales volumes. Our consolidated realized price increased by 46% from $39.66/boe to $57.90/boe due to an increase in our relative oil production and significantly stronger crude oil and European gas pricing while our sales volumes increased by 40% due to the Spartan acquisition and organic production growth. |
YTD 2018 vs. YTD 2017

| • | For the nine months ended September 30, 2018, the net loss of $51.7 million compared to net earnings of $53.6 million for the comparative year-to-date period in the prior year. The net loss primarily resulted from an unrealized loss on derivative instruments of $163.8 million (compared to an unrealized gain of $79.0 million in the prior year) and an unrealized loss on foreign exchange of $26.9 million (compared to an unrealized gain of $31.1 million in the prior year). These unrealized losses were partially offset by a year-over-year increase in fund flows from operations of $195.0 million. |

| • | Fund flows from operations increased 46% for the nine months ended September 30, 2018 versus the comparable period in the prior year due to higher realized pricing and increased sales volumes. Our consolidated realized price increased by 26% from $43.27/boe to $54.64/boe due to an increase in our relative oil production and significantly stronger crude oil and European gas pricing while our sales volumes increased by nearly 25% due to production increases in Canada, the Netherlands, and the United States. |
| • | On a per unit basis, fund flows from operations increased by 18% from $23.34/boe in the nine months ended September 30, 2017 to $27.59/boe in 2018. This increase reflects a significant improvement in our realized price per boe and includes an 18% decrease in per boe general and administration expenses as our overall expense increased by only 2% despite significant production growth. These decreases were partially offset by higher per unit costs for royalties (resulting from the stronger commodity price environment and higher royalty rates on the Spartan assets) and operating expenses. Per boe operating expenses increased by $1.14/boe from $9.80/boe in 2017 to $10.94/boe in 2018 due in part to a stronger Euro in the current year (approximately $0.22/boe increase) and increased expenses associated with higher value oil production in Canada. |
| Vermilion Energy Inc. | Page 15 | 2018 Third Quarter Report |
Q3 2018 vs. Q2 2018
| • | Consolidated average production of 96,222 boe/d during Q3 2018 increased 19% versus Q2 2018. The increase in production was primarily attributable to a full quarter of contribution from the Spartan assets acquired in May of 2018, growth in the United States, and well workovers in Australia. These production increases were partially offset by a 9% decrease in Ireland, including a 450 boe/d decrease due to planned downtime. |
Q3 2018 vs. Q3 2017
| • | Consolidated average production of 96,222 boe/d in Q3 2018 represented an increase of 43% from Q3 2017. Year-over-year production was higher due to growth in Canada, the United States, and the Netherlands. In Canada, year-over-year growth was the result of both acquisitions and continued development of our Mannville condensate-rich resource play. In the United States, production growth resulted from an acquisition in the current quarter and organic drilling activity. In the Netherlands, year-over-year growth occurred following the receipt of production permits (the absence of which restricted production from certain wells in the prior year). |
YTD 2018 vs. YTD 2017
| • | For the nine months ended September 30, 2018, consolidated average production of 82,433 boe/d represented an increase of 24% from the comparable period in 2017 due to production growth in Canada and the Netherlands. In Canada, production increased by 16,164 boe/d, largely due to contributions from acquisitions and continued development of our Mannville condensate-rich resource play. In the Netherlands, year-over-year production growth occurred following the receipt of production permits (the absence of which restricted production from certain wells in the comparable period in 2017). |

| • | For the three months ended September 30, 2018, capital expenditures of $146.2 million primarily related to activity in Canada, Australia, and France. In Canada, capital expenditures of $89.8 million included the drilling of 65.0 (59.0 net) wells, primarily in southeast Saskatchewan. In Australia, capital expenditures of $16.1 million primarily related to well workover activity and expenditures incurred in preparation for the Q4 2018 drilling program. In France, capital expenditures of $15.8 million primarily related to subsurface and workover programs. |
Dividends
| • | Declared dividends of $0.23 per common share per month for Q3 2018, resulting in total dividends declared of $2.025 per common share for the nine months ended September 30, 2018. |
| • | In Q2 2018, we increased our monthly dividend by 7% resulting in a year-over-year increase in cash dividends. The Q2 2018 increase was our fourth dividend increase (previously Vermilion's distribution in the income trust era) since we began paying a distribution in 2003. |
| Vermilion Energy Inc. | Page 16 | 2018 Third Quarter Report |
Net debt
| • | Net debt increased to $2.03 billion as at September 30, 2018 from $1.37 billion at December 31, 2017, and was primarily due to acquisition activity in 2018 and an increase in net current derivative liability to $161.1 million as at September 30, 2018 (compared to $60.9 million as at December 31, 2017). |
Commodity Prices
| | Q3 2018 | | | Q2 2018 | | | Q3 2017 | | | Q3/18 vs. Q2/18 | | Q3/18 vs. Q3/17 | | | YTD 2018 | | | YTD 2017 | | | 2018 vs. 2017 |
| Crude oil | | | | | | | | | | | | | | | | |
| WTI ($/bbl) | 90.83 | | | 87.63 | | | 60.37 | | | 4% | | 50% | | | 85.95 | | | 64.64 | | | 33% |
| WTI (US $/bbl) | 69.50 | | | 67.88 | | | 48.20 | | | 2% | | 44% | | | 66.75 | | | 49.47 | | | 35% |
| Edmonton Sweet index ($/bbl) | 81.92 | | | 80.60 | | | 56.76 | | | 2% | | 44% | | | 78.14 | | | 60.85 | | | 28% |
| Edmonton Sweet index (US $/bbl) | 62.68 | | | 62.43 | | | 45.32 | | | — % | | 38% | | | 60.69 | | | 46.57 | | | 30% |
| Saskatchewan LSB index ($/bbl) | 82.79 | | | 79.84 | | | 56.25 | | | 4% | | 47% | | | 78.04 | | | 59.82 | | | 30% |
| Saskatchewan LSB index (US $/bbl) | 63.35 | | | 61.84 | | | 44.91 | | | 2% | | 41% | | | 60.61 | | | 45.78 | | | 32% |
| Dated Brent ($/bbl) | 98.37 | | | 95.99 | | | 65.22 | | | 2% | | 51% | | | 92.87 | | | 67.82 | | | 37% |
| Dated Brent (US $/bbl) | 75.27 | | | 74.35 | | | 52.08 | | | 1% | | 45% | | | 72.13 | | | 51.90 | | | 39% |
| Hardisty Heavy ($/bbl) | 54.11 | | | 54.92 | | | 44.41 | | | (1)% | | 22% | | | 49.44 | | | 44.47 | | | 11% |
| Hardisty Heavy (US $/bbl) | 41.40 | | | 42.54 | | | 35.46 | | | (3)% | | 17% | | | 38.40 | | | 34.03 | | | 13% |
| Natural gas | | | | | | | | | | | | | | | | |
| AECO ($/mmbtu) | 1.19 | | | 1.18 | | | 1.45 | | | 1% | | (18)% | | | 1.48 | | | 2.31 | | | (36)% |
| NBP ($/mmbtu) | 10.95 | | | 9.42 | | | 6.78 | | | 16% | | 62% | | | 10.12 | | | 7.10 | | | 43% |
| NBP (€/mmbtu) | 7.20 | | | 6.12 | | | 4.61 | | | 18% | | 56% | | | 6.58 | | | 4.88 | | | 35% |
| TTF ($/mmbtu) | 10.92 | | | 9.50 | | | 6.93 | | | 15% | | 58% | | | 10.00 | | | 7.12 | | | 40% |
| TTF (€/mmbtu) | 7.18 | | | 6.17 | | | 4.71 | | | 16% | | 52% | | | 6.50 | | | 4.90 | | | 33% |
| Henry Hub ($/mmbtu) | 3.80 | | | 3.61 | | | 3.76 | | | 5% | | 1% | | | 3.74 | | | 4.14 | | | (10)% |
| Henry Hub (US $/mmbtu) | 2.90 | | | 2.80 | | | 3.00 | | | 4% | | (3)% | | | 2.90 | | | 3.17 | | | (9)% |
| Average exchange rates | | | | | | | | | | | | | | | | |
| CDN $/US $ | 1.31 | | | 1.29 | | | 1.25 | | | 2% | | 5% | | | 1.29 | | | 1.31 | | | (2)% |
| CDN $/Euro | 1.52 | | | 1.54 | | | 1.47 | | | (1)% | | 3% | | | 1.54 | | | 1.45 | | | 6% |
| Realized Prices | | | | | | | | | | | | | | | | |
| Crude oil and condensate ($/bbl) | 85.84 | | | 87.50 | | | 61.47 | | | (2)% | | 40% | | | 84.98 | | | 64.58 | | | 32% |
| NGLs ($/bbl) | 27.97 | | | 26.06 | | | 23.96 | | | 7% | | 17% | | | 26.61 | | | 23.01 | | | 16% |
| Natural gas ($/mmbtu) | 5.35 | | | 4.77 | | | 4.01 | | | 12% | | 33% | | | 5.30 | | | 4.79 | | | 11% |
| Total ($/boe) | 57.90 | | | 53.72 | | | 39.66 | | | 8% | | 46% | | | 54.64 | | | 43.27 | | | 26% |
| Vermilion Energy Inc. | Page 17 | 2018 Third Quarter Report |
| • | Although largely unchanged for the three months ending September 30, 2018 compared to the second quarter of 2018, crude oil prices were volatile during Q3 2018, with prices falling throughout the first half of the quarter before rallying higher into the second half of the quarter. The primary drivers of the price volatility were global macro concerns stemming from trade conflict and global supply uncertainty. |
| • | For the three months ending September 30, 2018, WTI in Canadian dollar terms increased 4% quarter-over-quarter and 50% year-over-year. Similarly, in Q3 2018, Dated Brent prices in Canadian dollar terms increased 2% quarter-over-quarter and 51% year-over year. |
| • | Western Canadian takeaway capacity constraints impacted heavy crude prices much more than Edmonton Sweet and Saskatchewan LSB prices, with Hardisty prices averaging 1% lower quarter-over-quarter versus the 2% and 4% quarter-over-quarter gains for Edmonton Sweet and Saskatchewan LSB, respectively. |
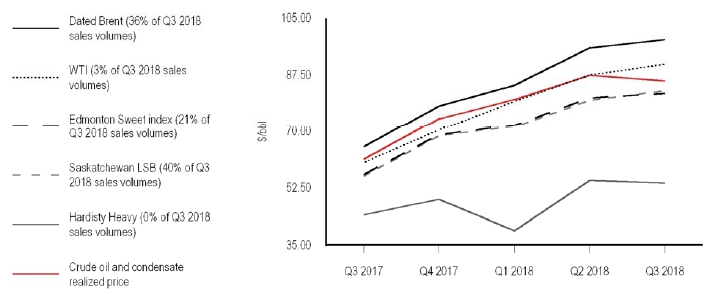
| • | Vermilion's crude oil production benefits from light oil pricing and no exposure to significantly discounted heavy crude oil. Approximately 36% of our Q3 2018 crude oil and condensate production was priced at the Dated Brent index (which averaged a premium to WTI of US$5.77) while the remainder of our crude oil and condensate production was priced at the Edmonton Sweet, Saskatchewan LSB, and WTI indices. As a result, our Q3 2018 crude oil and condensate realized price of $85.84 was a 59% premium to Hardisty Heavy. |
| Vermilion Energy Inc. | Page 18 | 2018 Third Quarter Report |

| • | European natural gas prices increased significantly in Q3 2018 versus all comparable periods, rising to multi-year highs as increasingly favourable supply and demand conditions were driven by growing competition from Asia for LNG supply, strong demand from storage, surging carbon prices in the European Union, and maintenance impacting Norwegian and Russian supplies. |
| • | As a result of favourable market conditions, TTF and NBP in Canadian dollar terms increased 15% and 16% quarter-over-quarter. Year-over-year, TTF and NBP increased 58% and 62% in Canadian dollar terms versus Q3 2017. |
| • | Natural gas prices at AECO increased 1% in Q3 2018 as compared to Q2 2018. While the AECO gas market continues to face egress challenges, access to storage and stronger domestic gas demand were able to mitigate some of the impact. |
| • | For Q3 2018, average European gas prices represented a $9.75/mmbtu premium to AECO and a $7.14/mmbtu premium to Henry Hub pricing. Approximately 44% of our natural gas production in Q3 2018 benefited from this premium European pricin |

| • | In the three months ended September 30, 2018, the Canadian dollar weakened slightly against the US dollar quarter-over-quarter. |
| • | Despite the Canadian dollar weakening against the US dollar in Q3 2018, the Canadian dollar strengthened slightly against the Euro as compared to Q2 2018. |
| Vermilion Energy Inc. | Page 19 | 2018 Third Quarter Report |
Canada Business Unit
Production and assets focused in West Pembina near Drayton Valley, Alberta and in southeast Saskatchewan and Manitoba.
| • | Potential for three significant resource plays sharing the same surface infrastructure in the West Pembina region in Alberta: |
| - | Mannville condensate-rich gas (2,400 - 2,700m depth) - in development phase |
| - | Cardium light oil (1,800m depth) - in development phase |
| - | Duvernay condensate-rich gas (3,200 - 3,400m depth) - no investment at present |
| • | Southeast Saskatchewan light oil development: |
| - | Targeting the Mississippian Midale (1,400 - 1,700m depth), Frobisher/Alida (1,200 - 1,400m depth) and Ratcliffe (1,800 - 1,900m) formations |
| Operational and financial review |
Canada business unit ($M except as indicated) | Q3 2018 | | | Q2 2018 | | | Q3 2017 | | | Q3/18 vs. Q2/18 | | Q3/18 vs. Q3/17 | | | YTD 2018 | | | YTD 2017 | | | 2018 vs. 2017 |
| Production and sales | | | | | | | | | | | | | | | | |
| Crude oil and condensate (bbls/d) | 28,477 | | | 17,009 | | | 9,288 | | | 67% | | 207% | | | 18,323 | | | 8,831 | | | 107% |
| NGLs (bbls/d) | 6,126 | | | 5,589 | | | 4,891 | | | 10% | | 25% | | | 5,611 | | | 3,776 | | | 49% |
| Natural gas (mmcf/d) | 136.77 | | | 127.32 | | | 103.92 | | | 7% | | 32% | | | 123.54 | | | 94.52 | | | 31% |
| Total (boe/d) | 57,397 | | | 43,817 | | | 31,499 | | | 31% | | 82% | | | 44,524 | | | 28,360 | | | 57% |
| Production mix (% of total) | | | | | | | | | | | | | | | | |
| Crude oil and condensate | 50 | % | | 39 | % | | 29 | % | | | | | | | 41 | % | | 31 | % | | |
| NGLs | 10 | % | | 13 | % | | 16 | % | | | | | | | 13 | % | | 13 | % | | |
| Natural gas | 40 | % | | 48 | % | | 55 | % | | | | | | | 46 | % | | 56 | % | | |
| Activity | | | | | | | | | | | | | | | | |
| Capital expenditures | 89,837 | | | 28,694 | | | 43,746 | | | 213% | | 105% | | | 187,646 | | | 121,802 | | | 54% |
| Acquisitions | 6,146 | | | 1,465,335 | | | 19,712 | | | | | | | | 1,561,731 | | | 21,223 | | | |
| Gross wells drilled | 65.00 | | | 18.00 | | | 15.00 | | | | | | | | 101.00 | | | 38.00 | | | |
| Net wells drilled | 58.97 | | | 16.19 | | | 12.75 | | | | | | | | 91.85 | | | 31.56 | | | |
| Financial results | | | | | | | | | | | | | | | | |
| Sales | 243,016 | | | 148,915 | | | 77,238 | | | 63% | | 215% | | | 484,864 | | | 236,381 | | | 105% |
| Royalties | (33,801 | ) | | (15,463 | ) | | (6,653 | ) | | 119% | | 408% | | | (59,112 | ) | | (23,957 | ) | | 147% |
| Transportation | (9,057 | ) | | (5,186 | ) | | (4,485 | ) | | 75% | | 102% | | | (18,783 | ) | | (12,532 | ) | | 50% |
| Operating | (55,577 | ) | | (35,762 | ) | | (22,071 | ) | | 55% | | 152% | | | (115,435 | ) | | (58,088 | ) | | 99% |
| General and administration | (1,316 | ) | | (1,891 | ) | | (2,239 | ) | | (30)% | | (41)% | | | (3,907 | ) | | (7,064 | ) | | (45)% |
| Fund flows from operations | 143,265 | | | 90,613 | | | 41,790 | | | 58% | | 243% | | | 287,627 | | | 134,740 | | | 113% |
| Netbacks ($/boe) | | | | | | | | | | | | | | | | |
| Sales | 46.02 | | | 37.35 | | | 26.65 | | | 23% | | 73% | | | 39.89 | | | 30.53 | | | 31% |
| Royalties | (6.40 | ) | | (3.88 | ) | | (2.30 | ) | | 65% | | 178% | | | (4.86 | ) | | (3.09 | ) | | 57% |
| Transportation | (1.72 | ) | | (1.30 | ) | | (1.55 | ) | | 32% | | 11% | | | (1.55 | ) | | (1.62 | ) | | (4)% |
| Operating | (10.52 | ) | | (8.97 | ) | | (7.62 | ) | | 17% | | 38% | | | (9.50 | ) | | (7.50 | ) | | 27% |
| General and administration | (0.25 | ) | | (0.47 | ) | | (0.77 | ) | | (47)% | | (68)% | | | (0.32 | ) | | (0.91 | ) | | (65)% |
| Fund flows from operations netback | 27.13 | | | 22.73 | | | 14.41 | | | 19% | | 88% | | | 23.66 | | | 17.41 | | | 36% |
| Realized prices | | | | | | | | | | | | | | | | |
| Crude oil and condensate ($/bbl) | 79.86 | | | 79.43 | | | 57.15 | | | 1% | | 40% | | | 78.92 | | | 61.26 | | | 29% |
| NGLs ($/bbl) | 27.82 | | | 26.00 | | | 23.93 | | | 7% | | 16% | | | 26.47 | | | 23.04 | | | 15% |
| Natural gas ($/mmbtu) | 1.44 | | | 1.09 | | | 1.84 | | | 32% | | (22)% | | | 1.47 | | | 2.51 | | | (41)% |
| Total ($/boe) | 46.02 | | | 37.35 | | | 26.65 | | | 23% | | 73% | | | 39.89 | | | 30.53 | | | 31% |
| Reference prices | | | | | | | | | | | | | | | | |
| WTI (US $/bbl) | 69.50 | | | 67.88 | | | 48.20 | | | 2% | | 44% | | | 66.75 | | | 49.47 | | | 35% |
| Edmonton Sweet index ($/bbl) | 81.92 | | | 80.60 | | | 56.76 | | | 2% | | 44% | | | 78.14 | | | 60.85 | | | 28% |
| Saskatchewan LSB index ($/bbl) | 82.79 | | | 79.84 | | | 56.25 | | | 4% | | 47% | | | 78.04 | | | 59.82 | | | 30% |
| AECO ($/mmbtu) | 1.19 | | | 1.18 | | | 1.45 | | | 1% | | (18)% | | | 1.48 | | | 2.31 | | | (36)% |
| Vermilion Energy Inc. | Page 20 | 2018 Third Quarter Report |
Production
| • | Q3 2018 average production increased 31% from the prior quarter and 82% year-over-year primarily due to a full quarter of production contribution from the assets acquired with Spartan. Production was partially offset by downtime due to third party gas plant maintenance, delayed regulatory approvals to produce certain wells at full capacity, and weather-related project delays. |
| • | Mannville production averaged approximately 21,000 boe/d in Q3 2018, a decrease of 3% quarter-over-quarter. |
| • | Cardium production averaged approximately 4,700 boe/d in Q3 2018, a decrease of 4% quarter-over-quarter. |
| • | Our southeast Saskatchewan assets produced an average of approximately 24,700 boe/d in Q3 2018 as compared to 11,000 boe/d in Q2 2018 primarily due to the Spartan acquisition. |
Activity review
| • | Vermilion drilled 60 (57.1 net) operated wells and participated in the drilling of five (1.9 net) non-operated wells in Canada during Q3 2018. |
Alberta
| - | In Q3 2018, we drilled or participated in four (4.0 net) operated and one (0.4 net) non-operated wells, completed three (3.0 net) operated and one (0.3 net) non-operated wells and brought on production five (5.0 net) operated Mannville wells. |
| - | In 2018, we plan to drill or participate in 18 (17.3 net) Mannville wells. |
Saskatchewan
| - | In Q3 2018, we drilled or participated in 56 (53.1 net) operated wells and four (1.5 net) non-operated wells, 46 (43.2 net) operated and four (1.5 net) non-operated of which were drilled from inventory acquired with Spartan. We also completed 58 (55.0 net) wells and brought 48 (44.8 net) wells on production. |
| - | In 2018, we plan to drill or participate in 117 (105.7 net) wells in Saskatchewan. |
| • | On May 28, 2018, Vermilion acquired 100% of the issued and outstanding common shares of Spartan, a publicly traded southeast Saskatchewan oil and gas producer. Consideration consisted of the issuance of 27.9 million Vermilion common shares valued at approximately $1.2 billion (based on the closing price per Vermilion common share of $44.30 on the Toronto Stock Exchange on May 28, 2018). Vermilion also assumed approximately $172 million of Spartan's outstanding debt at the time the transaction closed. |
Sales
| • | The realized price for our crude oil and condensate production in Canada is linked to WTI subject to market conditions in western Canada (as reflected by the Saskatchewan LSB index price in Saskatchewan and the Edmonton Sweet index price in Alberta). The realized price of our natural gas in Canada is based on the AECO index in Canada. |
| • | Q3 2018 sales per boe increased 23% compared to Q2 2018 despite relatively flat North American gas and crude oil prices due to an increase in our production weighting towards higher-priced crude oil and condensate production. Quarter-over-quarter, our crude oil and condensate production mix increased from 39% of Canadian production to 50% of Canadian production. |
| • | For the three and nine months ended September 30, 2018, sales per boe increased versus the comparable periods in the prior year due to increased Edmonton Sweet index and Saskatchewan LSB pricing coupled with an increased weighting towards higher-priced crude oil and condensate production. |
Royalties
| • | Royalties as a percentage of sales for the three and nine months ended September 30, 2018 of 13.9% and 12.2%, respectively, increased from the comparable periods in 2017 due to the impact of the Spartan assets, which have higher associated royalty rates, and also due to higher commodity prices on the sliding scale used to determine royalty rates. |
Transportation
| • | Q3 2018 transportation expense on a per unit basis increased versus Q2 2018 and Q3 2017 due to an increase in production that incurs higher transportation expense. |
| • | For the nine months ended September 30, 2018, transportation expense on a per unit basis was relatively consistent with the comparable period in 2017. |
Operating
| • | For the three and nine months ended September 30, 2018, operating expense increased on both a dollar and per unit basis versus all comparable periods. On a dollar basis, the increase in operating expense was driven by higher production volumes, but was partially offset by the impact of higher volumes on fixed costs. On a per unit basis, the increase in operating expense was primarily attributable to the impact of a full quarter of production from the Spartan assets, which have higher associated per unit operating expense than our legacy assets. |
| Vermilion Energy Inc. | Page 21 | 2018 Third Quarter Report |
France Business Unit
| • | Largest oil producer in France, constituting approximately three-quarters of domestic oil production. |
| • | Low base decline producing assets comprised of large conventional oil fields with high working interests located in the Aquitaine and Paris Basins. |
| • | Identified inventory of workover, infill drilling, and secondary recovery opportunities. |
| Operational and financial review |
France business unit
($M except as indicated) | Q3 2018 | | | Q2 2018 | | | Q3 2017 | | | Q3/18 vs.
Q2/18 | | Q3/18 vs.
Q3/17 | | | YTD 2018 | | | YTD 2017 | | | 2018 vs.
2017 |
| Production | | | | | | | | | | | | | | | | |
| Crude oil (bbls/d) | 11,407 | | | 11,683 | | | 10,918 | | | (2)% | | 4% | | | 11,377 | | | 11,040 | | | 3% |
| Sales | | | | | | | | | | | | | | | | |
| Crude oil (bbls/d) | 11,482 | | | 11,682 | | | 11,360 | | | (2)% | | 1% | | | 11,025 | | | 10,799 | | | 2% |
| Inventory (mbbls) | | | | | | | | | | | | | | | | |
| Opening crude oil inventory | 300 | | | 300 | | | 254 | | | | | | | | 197 | | | 148 | | | |
| Crude oil production | 1,049 | | | 1,063 | | | 1,004 | | | | | | | | 3,106 | | | 3,014 | | | |
| Crude oil sales | (1,056 | ) | | (1,063 | ) | | (1,044 | ) | | | | | | | (3,010 | ) | | (2,948 | ) | | |
| Closing crude oil inventory | 293 | | | 300 | | | 214 | | | | | | | | 293 | | | 214 | | | |
| Activity | | | | | | | | | | | | | | | | |
| Capital expenditures | 15,779 | | | 17,044 | | | 15,756 | | | (7)% | | — % | | | 62,750 | | | 53,354 | | | 18% |
| Gross wells drilled | — | | | — | | | — | | | | | | | | 5.00 | | | 5.00 | | | |
| Net wells drilled | — | | | — | | | — | | | | | | | | 5.00 | | | 5.00 | | | |
| Financial results | | | | | | | | | | | | | | | | |
| Sales | 100,840 | | | 101,128 | | | 66,100 | | | — % | | 53% | | | 274,713 | | | 189,325 | | | 45% |
| Royalties | (12,765 | ) | | (12,602 | ) | | (6,399 | ) | | 1% | | 99% | | | (34,805 | ) | | (17,966 | ) | | 94% |
| Transportation | (2,013 | ) | | (2,813 | ) | | (3,434 | ) | | (28)% | | (41)% | | | (7,184 | ) | | (10,152 | ) | | (29)% |
| Operating | (13,733 | ) | | (13,893 | ) | | (13,148 | ) | | (1)% | | 4% | | | (40,675 | ) | | (36,670 | ) | | 11% |
| General and administration | (3,365 | ) | | (3,500 | ) | | (2,543 | ) | | (4)% | | 32% | | | (10,378 | ) | | (9,326 | ) | | 11% |
| Current income taxes | (6,913 | ) | | (5,234 | ) | | (1,396 | ) | | 32% | | 395% | | | (14,200 | ) | | (8,208 | ) | | 73% |
| Fund flows from operations | 62,051 | | | 63,086 | | | 39,180 | | | (2)% | | 58% | | | 167,471 | | | 107,003 | | | 57% |
| Netbacks ($/boe) | | | | | | | | | | | | | | | | |
| Sales | 95.46 | | | 95.13 | | | 63.24 | | | — % | | 51% | | | 91.27 | | | 64.22 | | | 42% |
| Royalties | (12.08 | ) | | (11.85 | ) | | (6.12 | ) | | 2% | | 97% | | | (11.56 | ) | | (6.09 | ) | | 90% |
| Transportation | (1.91 | ) | | (2.65 | ) | | (3.29 | ) | | (28)% | | (42)% | | | (2.39 | ) | | (3.44 | ) | | (31)% |
| Operating | (13.00 | ) | | (13.07 | ) | | (12.58 | ) | | (1)% | | 3% | | | (13.51 | ) | | (12.44 | ) | | 9% |
| General and administration | (3.19 | ) | | (3.29 | ) | | (2.43 | ) | | (3)% | | 31% | | | (3.45 | ) | | (3.16 | ) | | 9% |
| Current income taxes | (6.54 | ) | | (4.92 | ) | | (1.34 | ) | | 33% | | 388% | | | (4.72 | ) | | (2.78 | ) | | 70% |
| Fund flows from operations netback | 58.74 | | | 59.35 | | | 37.48 | | | (1)% | | 57% | | | 55.64 | | | 36.31 | | | 53% |
| Reference prices | | | | | | | | | | | | | | | | |
| Dated Brent (US $/bbl) | 75.27 | | | 74.35 | | | 52.08 | | | 1% | | 45% | | | 72.13 | | | 51.90 | | | 39% |
| Dated Brent ($/bbl) | 98.37 | | | 95.99 | | | 65.22 | | | 2% | | 51% | | | 92.87 | | | 67.82 | | | 37% |
| Vermilion Energy Inc. | Page 22 | 2018 Third Quarter Report |
Production
| • | Q3 2018 production decreased 2% from the prior quarter due to natural declines and higher than anticipated well downtime. Production increased 4% year-over-year primarily due to production additions from our Q1 2018 drilling program. |
Activity review
| • | We have completed our 2018 drilling program, which included the drilling and completion of two (2.0 net) Neocomian wells and three (3.0 net) Champotran wells. |
| • | In addition to the drilling and completion activity, we plan to continue our workover and optimization programs in the Aquitaine and Paris Basins throughout 2018. |
Sales
| • | Crude oil in France is priced with reference to Dated Brent. |
| • | Q3 2018 sales per boe was relatively consistent with Q2 2018. |
| • | For the three and nine months ended September 30, 2018, the increase in sales per boe was consistent with increases in the Dated Brent benchmark price. |
Royalties
| • | Royalties in France relate to two components: RCDM (levied on units of production and not subject to changes in commodity prices) and R31 (based on a percentage of sales). |
| • | Royalties as a percentage of sales of 12.7% was relatively consistent with Q2 2018 (12.5%). |
| • | For the three and nine months ended September 30, 2018, royalties as a percentage of sales of 12.7% increased from 9.7% and 9.5% in the respective comparable periods in the prior year due to the impact of a royalty rate increase enacted in 2017. |
Transportation
| • | Transportation expense decreased in Q3 2018 compared to Q2 2018 due to the impact of a prior period adjustment recorded in the current quarter. |
| • | Transportation expense for the three and nine months ended September 30, 2018 decreased versus the comparable periods in the prior year, primarily due to the impact of IFRS 16 adoption in the current year. Please refer to "Recently Adopted Accounting Pronouncements" for additional information. |
Operating
| • | Operating expense in Q3 2018 was relatively consistent with Q2 2018 and Q3 2017 on both a dollar and per unit basis. |
| • | For the nine months ended September 30, 2018, the increase in operating expense on both a dollar and per unit basis was primarily due to the impact of a stronger Euro versus the Canadian dollar and the timing of field activities. |
General and administration
| • | Fluctuations in general and administration expense for all comparable periods were due to the timing of expenditures and allocations from our corporate segment. |
Current income taxes
| • | In France, current income taxes are applied to taxable income, after eligible deductions, at a statutory rate of 34.4%. |
| • | Full year effective tax rates are estimated each quarter based on forecasted commodity prices and operational results. The estimated full year effective tax rate is applied on a pro-rata basis to quarterly results. As such, fluctuations between the reporting periods occur due to changes in estimated tax rates. |
| • | For 2018, the effective rate on current taxes, inclusive of corporate allocations, is expected to be between 10% to 14% of pre-tax fund flows from operations. This is subject to change in response to production variations, commodity price fluctuations, the timing of capital expenditures, and other eligible in-country adjustments. |
| • | On December 21, 2017, the French Parliament approved the Finance Bill for 2018. The Finance Bill for 2018 provides for a progressive decrease of the French corporate income tax rate from 34.4% to 25.8% by 2022, with the first reduction planned for 2019 to 32.0%. |
| Vermilion Energy Inc. | Page 23 | 2018 Third Quarter Report |
Netherlands Business Unit
| • | Entered the Netherlands in 2004. |
| • | Second largest onshore operator. |
| • | Interests include 25 onshore licenses (all operated) and one offshore license (non-operated). |
| • | Licenses include more than 800,000 net acres of land, 95% of which is undeveloped. |
| Operational and financial review |
Netherlands business unit ($M except as indicated) | Q3 2018 | | | Q2 2018 | | | Q3 2017 | | | Q3/18 vs.
Q2/18 | | Q3/18 vs.
Q3/17 | | | YTD 2018 | | | YTD 2017 | | | 2018 vs.
2017 |
| Production and sales | | | | | | | | | | | | | | | | |
| Condensate (bbls/d) | 84 | | | 87 | | | 74 | | | (3)% | | 14% | | | 83 | | | 85 | | | (2)% |
| Natural gas (mmcf/d) | 44.37 | | | 43.49 | | | 34.90 | | | 2% | | 27% | | | 44.21 | | | 35.45 | | | 25% |
| Total (boe/d) | 7,479 | | | 7,335 | | | 5,890 | | | 2% | | 27% | | | 7,452 | | | 5,992 | | | 24% |
| Activity | | | | | | | | | | | | | | | | |
| Capital expenditures | 5,056 | | | 6,695 | | | 11,590 | | | (24)% | | (56)% | | | 15,029 | | | 19,275 | | | (22)% |
| Acquisitions | 2,874 | | | 139 | | | 14 | | | | | | | | 5,773 | | | 14 | | | |
| Gross wells drilled | — | | | — | | | 2.00 | | | | | | | | — | | | 2.00 | | | |
| Net wells drilled | — | | | — | | | 1.02 | | | | | | | | — | | | 1.02 | | | |
| Financial results | | | | | | | | | | | | | | | | |
| Sales | 41,793 | | | 35,000 | | | 21,258 | | | 19% | | 97% | | | 112,979 | | | 67,146 | | | 68% |
| Royalties | (1,049 | ) | | (745 | ) | | (360 | ) | | 41% | | 191% | | | (2,644 | ) | | (1,075 | ) | | 146% |
| Operating | (5,812 | ) | | (6,419 | ) | | (4,498 | ) | | (9)% | | 29% | | | (19,916 | ) | | (14,231 | ) | | 40% |
| General and administration | (320 | ) | | (145 | ) | | (510 | ) | | 121% | | (37)% | | | (1,238 | ) | | (1,666 | ) | | (26)% |
| Current income taxes | 1,729 | | | (4,993 | ) | | (1,983 | ) | | N/A | | N/A | | | (9,069 | ) | | (3,644 | ) | | 149% |
| Fund flows from operations | 36,341 | | | 22,698 | | | 13,907 | | | 60% | | 161% | | | 80,112 | | | 46,530 | | | 72% |
| Netbacks ($/boe) | | | | | | | | | | | | | | | | |
| Sales | 60.74 | | | 52.43 | | | 39.23 | | | 16% | | 55% | | | 55.54 | | | 41.04 | | | 35% |
| Royalties | (1.52 | ) | | (1.12 | ) | | (0.66 | ) | | 36% | | 130% | | | (1.30 | ) | | (0.66 | ) | | 97% |
| Operating | (8.45 | ) | | (9.62 | ) | | (8.30 | ) | | (12)% | | 2% | | | (9.79 | ) | | (8.70 | ) | | 13% |
| General and administration | (0.47 | ) | | (0.22 | ) | | (0.94 | ) | | 114% | | (50)% | | | (0.61 | ) | | (1.02 | ) | | (40)% |
| Current income taxes | 2.51 | | | (7.48 | ) | | (3.66 | ) | | N/A | | N/A | | | (4.46 | ) | | (2.23 | ) | | 100% |
| Fund flows from operations netback | 52.81 | | | 33.99 | | | 25.67 | | | 55% | | 106% | | | 39.38 | | | 28.43 | | | 39% |
| Realized prices | | | | | | | | | | | | | | | | |
| Condensate ($/bbl) | 82.32 | | | 79.40 | | | 52.10 | | | 4% | | 58% | | | 77.08 | | | 52.92 | | | 46% |
| Natural gas ($/mmbtu) | 10.08 | | | 8.68 | | | 6.51 | | | 16% | | 55% | | | 9.22 | | | 6.81 | | | 35% |
| Total ($/boe) | 60.74 | | | 52.43 | | | 39.23 | | | 16% | | 55% | | | 55.54 | | | 41.04 | | | 35% |
| Reference prices | | | | | | | | | | | | | | | | |
| TTF ($/mmbtu) | 10.92 | | | 9.50 | | | 6.93 | | | 15% | | 58% | | | 10.00 | | | 7.12 | | | 40% |
| TTF (€/mmbtu) | 7.18 | | | 6.17 | | | 4.71 | | | 16% | | 52% | | | 6.50 | | | 4.90 | | | 33% |
| Vermilion Energy Inc. | Page 24 | 2018 Third Quarter Report |
Production
| • | Q3 2018 production was relatively consistent with the prior quarter. During the quarter, we brought the Eesveen-02 well (60% working interest) on production and the well is currently flowing at a restricted rate of 10 mmcf/d net. Production increased 27% year-over-year as various permitting delays restricted production through the first nine months of 2017. |
Activity review
| • | Our Q3 2018 capital activity was primarily focused on bringing the Eesveen-02 well on production in addition to planned workovers and facilities maintenance. |
Sales
| • | The price of our natural gas in the Netherlands is based on the TTF index. |
| • | For the three and nine months ended September 30, 2018, sales per boe increased versus all comparable periods, consistent with increases in the TTF reference price. |
Royalties
| • | In the Netherlands, certain wells are subject to overriding royalties as well as royalties that take effect only when specified production levels are exceeded. As such, fluctuations in royalty expense in the periods presented result from the amount of production from those wells. Royalties in Q3 2018 represented less than 3% of sales. |
Transportation
| • | Our production in the Netherlands is not subject to transportation expense as gas is sold at the plant gate. |
Operating
| • | Q3 2018 operating expense decreased in both a dollar and per unit basis versus Q2 2018 due to due to lower activity levels in the current quarter and the implementation of various cost efficiencies. |
| • | For the three and nine months ended September 30, 2018, operating expense increased in a dollar basis versus the comparable periods in the prior year, consistent with higher production volumes. For the nine months ended September 30, 2018, the increase in operating expense on a per unit basis is due primarily to higher electricity costs in the current year. |
General and administration
| • | Fluctuations in general and administration expense for all comparable periods were due to the timing of expenditures and allocations from our corporate segment. |
Current income taxes
| • | In the Netherlands, current income taxes are applied to taxable income, after eligible deductions and a 10% uplift deduction applied to operating expenses, eligible G&A and tax deductions for depletion and asset retirement obligations, at a tax rate of 50%. |
| • | Full year effective tax rates are estimated each quarter based on forecasted commodity prices and operational results. The estimated full year effective tax rate is applied on a pro-rata basis to quarterly results. As such, fluctuations between the reporting periods occur due to changes in estimated tax rates. |
| • | For 2018, the effective rate on current taxes, inclusive of corporate allocations, is expected to be between 10% to 14% of pre-tax fund flows from operations. This is subject to change in response to production variations, commodity price fluctuations, the timing of capital expenditures, and other eligible in-country adjustments. |
| Vermilion Energy Inc. | Page 25 | 2018 Third Quarter Report |
Germany Business Unit
| • | Entered Germany in 2014 through the acquisition of a non-operated natural gas producing property. |
| • | Executed a significant exploration license farm-in agreement in 2015 and acquired operated producing properties in 2016. |
| • | Producing assets consist of seven gas and five oil producing fields with extensive infrastructure in place. |
| • | Significant land position of approximately 1.3 million net acres (97% undeveloped). |
| Operational and financial review |
Germany business unit ($M except as indicated) | Q3 2018 | | | Q2 2018 | | | Q3 2017 | | | Q3/18 vs.
Q2/18 | | Q3/18 vs.
Q3/17 | | | YTD 2018 | | | YTD 2017 | | | 2018 vs.
2017 |
| Production | | | | | | | | | | | | | | | | |
| Crude oil (bbls/d) | 1,019 | | | 1,008 | | | 1,054 | | | 1% | | (3)% | | | 1,035 | | | 1,030 | | | — % |
| Natural gas (mmcf/d) | 14.88 | | | 14.63 | | | 20.12 | | | 2% | | (26)% | | | 15.23 | | | 19.79 | | | (23)% |
| Total (boe/d) | 3,498 | | | 3,447 | | | 4,407 | | | 1% | | (21)% | | | 3,573 | | | 4,329 | | | (17)% |
| Sales | | | | | | | | | | | | | | | | |
| Crude oil (bbls/d) | 929 | | | 1,058 | | | 1,067 | | | (12)% | | (13)% | | | 1,097 | | | 993 | | | 10% |
| Natural gas (mmcf/d) | 14.88 | | | 14.63 | | | 20.12 | | | 2% | | (26)% | | | 15.23 | | | 19.79 | | | (23)% |
| Total (boe/d) | 3,408 | | | 3,497 | | | 4,420 | | | (3)% | | (23)% | | | 3,635 | | | 4,292 | | | (15)% |
| Production mix (% of total) | | | | | | | | | | | | | | | | |
| Crude oil | 29 | % | | 29 | % | | 24 | % | | | | | | | 29 | % | | 24 | % | | |
| Natural gas | 71 | % | | 71 | % | | 76 | % | | | | | | | 71 | % | | 76 | % | | |
| Activity | | | | | | | | | | | | | | | | |
| Capital expenditures | 6,497 | | | 2,314 | | | 3,020 | | | 181% | | 115% | | | 11,226 | | | 4,252 | | | 164% |
| Acquisitions | 959 | | | — | | | — | | | | | | | | 959 | | | — | | | |
| Financial results | | | | | | | | | | | | | | | | |
| Sales | 21,052 | | | 18,999 | | | 15,663 | | | 11% | | 34% | | | 60,552 | | | 49,798 | | | 22% |
| Royalties | (2,448 | ) | | (1,251 | ) | | (2,261 | ) | | 96% | | 8% | | | (5,436 | ) | | (4,857 | ) | | 12% |
| Transportation | (1,191 | ) | | (1,779 | ) | | (1,603 | ) | | (33)% | | (26)% | | | (4,968 | ) | | (5,043 | ) | | (1)% |
| Operating | (4,863 | ) | | (5,384 | ) | | (3,477 | ) | | (10)% | | 40% | | | (16,433 | ) | | (14,151 | ) | | 16% |
| General and administration | (2,073 | ) | | (1,462 | ) | | (1,708 | ) | | 42% | | 21% | | | (5,093 | ) | | (5,687 | ) | | (10)% |
| Fund flows from operations | 10,477 | | | 9,123 | | | 6,614 | | | 15% | | 58% | | | 28,622 | | | 20,060 | | | 43% |
| Netbacks ($/boe) | | | | | | | | | | | | | | | | |
| Sales | 67.15 | | | 59.69 | | | 38.52 | | | 12% | | 74% | | | 61.02 | | | 42.50 | | | 44% |
| Royalties | (7.81 | ) | | (3.93 | ) | | (5.56 | ) | | 99% | | 40% | | | (5.48 | ) | | (4.15 | ) | | 32% |
| Transportation | (3.80 | ) | | (5.59 | ) | | (3.94 | ) | | (32)% | | (4)% | | | (5.01 | ) | | (4.30 | ) | | 17% |
| Operating | (15.51 | ) | | (16.92 | ) | | (8.55 | ) | | (8)% | | 81% | | | (16.56 | ) | | (12.08 | ) | | 37% |
| General and administration | (6.61 | ) | | (4.59 | ) | | (4.20 | ) | | 44% | | 57% | | | (5.13 | ) | | (4.85 | ) | | 6% |
| Fund flows from operations netback | 33.42 | | | 28.66 | | | 16.27 | | | 17% | | 105% | | | 28.84 | | | 17.12 | | | 68% |
| Realized prices | | | | | | | | | | | | | | | | |
| Crude oil ($/bbl) | 92.45 | | | 91.00 | | | 55.95 | | | 2% | | 65% | | | 86.71 | | | 60.79 | | | 43% |
| Natural gas ($/mmbtu) | 9.61 | | | 7.68 | | | 5.50 | | | 25% | | 75% | | | 8.32 | | | 6.17 | | | 35% |
| Total ($/boe) | 67.15 | | | 59.69 | | | 38.52 | | | 12% | | 74% | | | 61.02 | | | 42.50 | | | 44% |
| Reference prices | | | | | | | | | | | | | | | | |
| Dated Brent (US $/bbl) | 75.27 | | | 74.35 | | | 52.08 | | | 1% | | 45% | | | 72.13 | | | 51.90 | | | 39% |
| Dated Brent ($/bbl) | 98.37 | | | 95.99 | | | 65.22 | | | 2% | | 51% | | | 92.87 | | | 67.82 | | | 37% |
| TTF ($/mmbtu) | 10.92 | | | 9.50 | | | 6.93 | | | 15% | | 58% | | | 10.00 | | | 7.12 | | | 40% |
| TTF (€/mmbtu) | 7.18 | | | 6.17 | | | 4.71 | | | 16% | | 52% | | | 6.50 | | | 4.90 | | | 33% |
| Vermilion Energy Inc. | Page 26 | 2018 Third Quarter Report |
Production
| • | Q3 2018 production was relatively consistent quarter-over-quarter as less downtime at a non-operated gas processing facility was offset by other minor unplanned downtime events. Production decreased 21% year-over-year due to downtime at a non-operated gas processing plant that began in the middle of Q2 2018 and continued through the middle of Q3 2018. |
Activity review
| • | Q3 2018 activity focused on permitting and other pre-drill activities associated with our first operated well in Germany, Burgmoor Z5 (46% working interest) in the Dümmersee-Uchte area, which we expect to drill in early 2019, in addition to performing workover opportunities and optimization reviews across our operated asset base. |
| • | During the remainder of 2018, we plan to continue preparations for the drilling of the Burgmoor Z5 well (46% working interest). |
Sales
| • | The price of our natural gas in Germany is based on the NCG and GPL indexes, which are both highly correlated to the TTF benchmark. Crude oil in Germany is priced with reference to Dated Brent. |
| • | Sales per boe for the three and nine months ended September 30, 2018 increased versus all comparable periods, consistent with increases in both crude oil and natural gas benchmark prices. |
Royalties
| • | Our production in Germany is subject to state and private royalties on sales after certain eligible deductions. |
| • | Royalties as a percentage of sales of 11.6% in Q3 2018 was higher than 6.6% in Q2 2018 and lower than 14.4% in Q3 2017 due to the impact of a prior period adjustment booked in the current quarter. |
| • | Royalties as a percentage of sales was relatively consistent for the nine months ended September 30, 2018 versus the comparable period in the prior year. |
Transportation
| • | Transportation expense in Germany relates to costs incurred to deliver natural gas from the processing facility to the customer and deliver crude oil to the refinery. |
| • | Transportation expense in Q3 2018 was lower than both Q2 2018 and Q3 2017 due to the timing of transportation cost adjustments. |
| • | Transportation expense for the nine months ended September 30, 2018 was consistent with the comparable period in the prior year. |
Operating
| • | Operating expense on a per unit basis in Q3 2018 was lower versus Q2 2018 due to lower activity levels at non-operated properties. |
| • | Operating expense on a per unit basis increased for the three and nine months ended September 30, 2018, versus the comparable periods in the prior year. The increase was primarily due to increased gas processing tariffs, the impact of a stronger Euro versus the Canadian dollar and the impact of fixed costs on lower volumes. |
General and administration
| • | Fluctuations in general and administration expense for all comparable periods were due to the timing of expenditures and allocations from our corporate segment. |
Current income taxes
| • | As a result of our tax pools in Germany, we do not expect to incur current income taxes for 2018 in the German Business Unit. |
| • | For 2019, we are not expecting significant cash taxes. This is subject to change in response to production variations, commodity price fluctuations, the timing of capital expenditures, and other eligible in-country adjustments. |
| Vermilion Energy Inc. | Page 27 | 2018 Third Quarter Report |
Ireland Business Unit
| • | Entered Ireland in 2009 with an investment in the offshore Corrib gas field. |
| • | The Corrib gas field is located offshore northwest Ireland and comprises six offshore wells, offshore and onshore sales and transportation pipeline segments, as well as a natural gas processing facility. |
| • | Vermilion currently holds an 18.5% non-operated interest. |
| • | Vermilion has a strategic partnership with Canada Pension Plan Investment Board (“CPPIB”) that is expected to result in Vermilion increasing ownership in Corrib to 20% and assuming operatorship. This is expected to occur before the end of 2018. |
| Operational and financial review |
Ireland business unit ($M except as indicated) | Q3 2018 | | | Q2 2018 | | | Q3 2017 | | | Q3/18 vs.
Q2/18 | | Q3/18 vs.
Q3/17 | | | YTD 2018 | | | YTD 2017 | | | 2018 vs.
2017 |
| Production and sales | | | | | | | | | | | | | | | | |
| Natural gas (mmcf/d) | 51.38 | | | 56.56 | | | 49.04 | | | (9)% | | 5% | | | 56.23 | | | 59.16 | | | (5)% |
| Total (boe/d) | 8,563 | | | 9,426 | | | 8,173 | | | (9)% | | 5% | | | 9,372 | | | 9,861 | | | (5)% |
| Activity | | | | | | | | | | | | | | | | |
| Capital expendituresu | (50 | ) | | 87 | | | 1,101 | | | N/A | | N/A | | | 84 | | | 224 | | | (63)% |
| Financial results | | | | | | | | | | | | | | | | |
| Sales | 50,228 | | | 47,862 | | | 28,218 | | | 5% | | 78% | | | 151,765 | | | 109,537 | | | 39% |
| Transportation | (1,460 | ) | | (1,268 | ) | | (1,252 | ) | | 15% | | 17% | | | (4,014 | ) | | (3,709 | ) | | 8% |
| Operating | (3,354 | ) | | (4,306 | ) | | (5,717 | ) | | (22)% | | (41)% | | | (10,869 | ) | | (14,619 | ) | | (26)% |
| General and administration | (3,597 | ) | | (1,443 | ) | | (670 | ) | | 149% | | 437% | | | (6,349 | ) | | (1,803 | ) | | 252% |
| Fund flows from operations | 41,817 | | | 40,845 | | | 20,579 | | | 2% | | 103% | | | 130,533 | | | 89,406 | | | 46% |
| Netbacks ($/boe) | | | | | | | | | | | | | | | | |
| Sales | 63.76 | | | 55.80 | | | 37.53 | | | 14% | | 70% | | | 59.32 | | | 40.69 | | | 46% |
| Transportation | (1.85 | ) | | (1.48 | ) | | (1.66 | ) | | 25% | | 11% | | | (1.57 | ) | | (1.38 | ) | | 14% |
| Operating | (4.26 | ) | | (5.02 | ) | | (7.60 | ) | | (15)% | | (44)% | | | (4.25 | ) | | (5.43 | ) | | (22)% |
| General and administration | (4.57 | ) | | (1.68 | ) | | (0.89 | ) | | 172% | | 413% | | | (2.48 | ) | | (0.67 | ) | | 270% |
| Fund flows from operations netback | 53.08 | | | 47.62 | | | 27.38 | | | 11% | | 94% | | | 51.02 | | | 33.21 | | | 54% |
| Reference prices | | | | | | | | | | | | | | | | |
| NBP ($/mmbtu) | 10.95 | | | 9.42 | | | 6.78 | | | 16% | | 62% | | | 10.12 | | | 7.10 | | | 43% |
| NBP (€/mmbtu) | 7.20 | | | 6.12 | | | 4.61 | | | 18% | | 56% | | | 6.58 | | | 4.88 | | | 35% |
| Vermilion Energy Inc. | Page 28 | 2018 Third Quarter Report |
Production
| • | Q3 2018 production decreased 9% quarter-over-quarter due to the impact of planned downtime in September to perform maintenance activities and natural declines. Production increased 5% year-over-year due to unplanned downtime following a plant turnaround in Q3 2017. |
Activity review
| • | On July 12, 2017 Vermilion and CPPIB announced a strategic partnership in Corrib, whereby CPPIB will acquire Shell E&P Ireland Limited’s 45% interest in Corrib for total cash consideration of €830 million, subject to customary closing adjustments and future contingent value payments based on performance and realized pricing. At closing, Vermilion expects to assume operatorship of Corrib. In addition to operatorship, CPPIB plans to transfer a 1.5% working interest to Vermilion for €19.4 million ($28.4 million), before closing adjustments. Vermilion’s incremental 1.5% ownership of Corrib would represent approximately 700 boe/d (100% gas) based on current production expectations for Corrib. The acquisition has an effective date of January 1, 2017 and is anticipated to close before the end of 2018. |
Sales
| • | The price of our natural gas in Ireland is based on the NBP index. |
| • | Sales per boe for the three and nine months ended September 30, 2018 increased versus all comparable periods consistent with increases in the NBP reference price. |
Royalties
| • | Our production in Ireland is not subject to royalties. |
Transportation
| • | Transportation expense in Ireland relates to payments under a ship-or-pay agreement related to the Corrib project. |
| • | Transportation expense for the three and nine months ended September 30, 2018 increased versus all comparable periods due to the impact of a prior period adjustment recorded in the current quarter. For the nine months ended September 30, 2018, this increase was partially offset by a decrease in tariff charges and reduced production volumes. |
Operating
| • | Q3 2018 operating expense was lower versus Q2 2018 and Q3 2017 due to a decrease in overhead allocations during the period, partially offset by an increase in maintenance activity as a result of pipeline inspections completed during the current quarter. |
| • | For the nine months ended September 30, 2018, operating expense was lower versus the comparable period in the prior year due to higher maintenance activities in the prior year. |
General and administration
| • | The increase in general and administration expense versus all comparable periods is primarily due to transition costs associated with the aforementioned strategic partnership in Corrib. |
Current income taxes
| • | Given the significant level of investment in Corrib and the resulting tax pools, we do not expect to incur current income taxes in the Ireland Business Unit for the foreseeable future. |
| Vermilion Energy Inc. | Page 29 | 2018 Third Quarter Report |
Australia Business Unit
| • | Entered Australia in 2005. |
| • | Hold a 100% operated working interest in the Wandoo field, located approximately 80 km offshore on the northwest shelf of Australia. |
| • | Production is operated from two off-shore platforms, and originates from 18 well bores and five lateral sidetrack wells. |
| • | Wells that utilize horizontal legs (ranging in length from 500 to 3,000 plus metres) are located 600 metres below the seabed in approximately 55 metres of water depth. |
| Operational and financial review |
Australia business unit
($M except as indicated) | Q3 2018 | | | Q2 2018 | | | Q3 2017 | | | Q3/18 vs.
Q2/18 | | Q3/18 vs.
Q3/17 | | | YTD 2018 | | | YTD 2017 | | | 2018 vs.
2017 |
| Production | | | | | | | | | | | | | | | | |
| Crude oil (bbls/d) | 4,704 | | | 4,132 | | | 5,473 | | | 14% | | (14)% | | | 4,601 | | | 6,032 | | | (24)% |
| Sales | | | | | | | | | | | | | | | | |
| Crude oil (bbls/d) | 3,935 | | | 4,164 | | | 5,722 | | | (5)% | | (31)% | | | 4,322 | | | 6,057 | | | (29)% |
| Inventory (mbbls) | | | | | | | | | | | | | | | | |
| Opening crude oil inventory | 139 | | | 142 | | | 131 | | | | | | | | 134 | | | 115 | | | |
| Crude oil production | 433 | | | 376 | | | 503 | | | | | | | | 1,256 | | | 1,647 | | | |
| Crude oil sales | (362 | ) | | (379 | ) | | (526 | ) | | | | | | | (1,180 | ) | | (1,654 | ) | | |
| Closing crude oil inventory | 210 | | | 139 | | | 108 | | | | | | | | 210 | | | 108 | | | |
| Activity | | | | | | | | | | | | | | | | |
| Capital expenditures | 16,061 | | | 11,368 | | | 10,154 | | | 41% | | 58% | | | 31,878 | | | 22,750 | | | 40% |
| Financial results | | | | | | | | | | | | | | | | |
| Sales | 35,848 | | | 37,364 | | | 35,257 | | | (4)% | | 2% | | | 111,382 | | | 118,305 | | | (6)% |
| Operating | (11,585 | ) | | (12,809 | ) | | (12,292 | ) | | (10)% | | (6)% | | | (37,442 | ) | | (37,967 | ) | | (1)% |
| General and administration | (1,020 | ) | | (982 | ) | | (1,675 | ) | | 4% | | (39)% | | | (3,527 | ) | | (5,001 | ) | | (29)% |
| Current income taxes | (3,101 | ) | | (5,006 | ) | | (4,538 | ) | | (38)% | | (32)% | | | (13,625 | ) | | (19,028 | ) | | (28)% |
| Fund flows from operations | 20,142 | | | 18,567 | | | 16,752 | | | 8% | | 20% | | | 56,788 | | | 56,309 | | | 1% |
| Netbacks ($/boe) | | | | | | | | | | | | | | | | |
| Sales | 99.01 | | | 98.61 | | | 66.97 | | | — % | | 48% | | | 94.39 | | | 71.55 | | | 32% |
| Operating | (32.00 | ) | | (33.81 | ) | | (23.35 | ) | | (5)% | | 37% | | | (31.73 | ) | | (22.96 | ) | | 38% |
| General and administration | (2.82 | ) | | (2.59 | ) | | (3.18 | ) | | 9% | | (11)% | | | (2.99 | ) | | (3.02 | ) | | (1)% |
| PRRT | 0.70 | | | (7.00 | ) | | (8.25 | ) | | N/A | | N/A | | | (6.14 | ) | | (9.83 | ) | | (38)% |
| Corporate income taxes | (9.27 | ) | | (6.21 | ) | | (0.37 | ) | | 49% | | 2,405% | | | (5.41 | ) | | (1.68 | ) | | 222% |
| Fund flows from operations netback | 55.62 | | | 49.00 | | | 31.82 | | | 14% | | 75% | | | 48.12 | | | 34.06 | | | 41% |
| Reference prices | | | | | | | | | | | | | | | | |
| Dated Brent (US $/bbl) | 75.27 | | | 74.35 | | | 52.08 | | | 1% | | 45% | | | 72.13 | | | 51.90 | | | 39% |
| Dated Brent ($/bbl) | 98.37 | | | 95.99 | | | 65.22 | | | 2% | | 51% | | | 92.87 | | | 67.82 | | | 37% |
| Vermilion Energy Inc. | Page 30 | 2018 Third Quarter Report |
Production
| • | Q3 2018 production increased 14% quarter-over-quarter due to the reinstatement of production from well workover activity that was successfully completed in Q2 2018. Production decreased 14% year-over-year due to natural declines. |
| • | Production volumes are managed within corporate targets while meeting customer demands and the requirements of long-term supply agreements. |
| • | We continue to plan for long-term annual production levels of approximately 6,000 bbls/d. |
Activity review
| • | We continued to prepare for our Q4 2018 two (2.0 net) well drilling campaign during the quarter. This entailed securing all necessary third party agreements and regulatory permits to drill, along with a significant portion of the materials. |
| • | During the remainder of 2018, activity will be focused on our planned two (2.0 net) well drilling campaign. |
Sales
| • | Crude oil in Australia is priced with reference to Dated Brent. |
| • | Q3 2018 sales per boe were consistent with Q2 2018, but lower sales volumes resulted in a slight decrease in sales quarter-over-quarter. |
| • | Sales per boe for the three and nine months ended September 30, 2018 increased versus the comparable periods in the prior year, consistent with increases in the Dated Brent reference price. |
Royalties and transportation
| • | Our production in Australia is not subject to royalties or transportation expense as crude oil is sold directly at the Wandoo B platform. |
Operating
| • | Q3 2018 operating expense decreased versus Q2 2018 due to lower chemical usage and lower maintenance activity in the current quarter related to a planned shutdown to clean out vessels. |
| • | For the three and nine months ended September 30, 2018, per unit operating expense increased versus the comparable periods in the prior year due to the impact of fixed costs on lower volumes, as well as higher diesel usage and helicopter costs. |
General and administration
| • | Fluctuations in general and administration expense for all comparable periods are primarily due to the timing of expenditures and allocations from our corporate segment. In addition, the decrease in general and administration expense for the three and nine months ended September 30, 2018 versus the comparable periods in 2017 is primarily due to the impact of IFRS 16 adoption in the current year. As a result of this new accounting pronouncement, certain payments associated with office space in Australia have been accounted for as leases. Please refer to "Recently Adopted Accounting Pronouncements" for additional information. |
Current income taxes
| • | In Australia, current income taxes include both PRRT and corporate income taxes. PRRT is a profit based tax applied at a rate of 40% on sales less eligible expenditures, including operating expenses and capital expenditures. Corporate income taxes are applied at a rate of 30% on taxable income after eligible deductions, which include PRRT paid. |
| • | Full year effective tax rates are estimated each quarter based on forecasted commodity prices and operational results. The estimated full year effective tax rate is applied on a pro-rata basis to quarterly results. As such, fluctuations between the reporting periods occur due to changes in estimated tax rates. |
| • | For 2018, the effective rate on current taxes, inclusive of corporate allocations, is expected to be between 14% to 18% of pre-tax fund flows from operations. This is subject to change in response to production variations, commodity price fluctuations, the timing of capital expenditures, and other eligible in-country adjustments. |
| Vermilion Energy Inc. | Page 31 | 2018 Third Quarter Report |
United States Business Unit
| • | Entered the United States in September 2014. |
| • | Interests include approximately 149,700 net acres of land (72% undeveloped) in the Powder River Basin of northeastern Wyoming. |
| • | Tight oil development targeting the Turner Sands at depths of approximately 1,500 metres (East Finn) and 2,600 metres (Hilight). |
| Operational and financial review |
United States business unit ($M except as indicated) | Q3 2018 | | | Q2 2018 | | | Q3 2017 | | | Q3/18 vs.
Q2/18 | | Q3/18 vs.
Q3/17 | | | YTD 2018 | | | YTD 2017 | | | 2018 vs.
2017 |
| Production and sales | | | | | | | | | | | | | | | | |
| Crude oil (bbls/d) | 1,461 | | | 655 | | | 880 | | | 123% | | 66% | | | 900 | | | 666 | | | 35% |
| NGLs (bbls/d) | 714 | | | 62 | | | 56 | | | 1,052% | | 1,175% | | | 268 | | | 52 | | | 415% |
| Natural gas (mmcf/d) | 4.82 | | | 0.40 | | | 0.64 | | | 1,105% | | 653% | | | 1.81 | | | 0.43 | | | 321% |
| Total (boe/d) | 2,979 | | | 784 | | | 1,043 | | | 280% | | 186% | | | 1,469 | | | 789 | | | 86% |
| Production mix (% of total) | | | | | | | | | | | | | | | | |
| Crude oil | 49 | % | | 84 | % | | 84 | % | | | | | | | 61 | % | | 84 | % | | |
| NGLs | 24 | % | | 8 | % | | 5 | % | | | | | | | 18 | % | | 7 | % | | |
| Natural gas | 27 | % | | 8 | % | | 11 | % | | | | | | | 21 | % | | 9 | % | | |
| Activity | | | | | | | | | | | | | | | | |
| Capital expenditures | 11,386 | | | 10,702 | | | 1,362 | | | 6% | | 736% | | | 37,956 | | | 18,056 | | | 110% |
| Acquisitions | 187,987 | | | 11 | | | 1,250 | | | | | | | | 188,066 | | | 3,312 | | | |
| Gross wells drilled | — | | | — | | | — | | | | | | | | 5.00 | | | 3.00 | | | |
| Net wells drilled | — | | | — | | | — | | | | | | | | 5.00 | | | 3.00 | | | |
| Financial results | | | | | | | | | | | | | | | | |
| Sales | 14,551 | | | 5,230 | | | 4,771 | | | 178% | | 205% | | | 23,840 | | | 11,005 | | | 117% |
| Royalties | (3,444 | ) | | (1,451 | ) | | (1,321 | ) | | 137% | | 161% | | | (6,017 | ) | | (3,080 | ) | | 95% |
| Transportation | — | | | — | | | (26 | ) | | — % | | (100)% | | | — | | | (26 | ) | | (100)% |
| Operating | (2,633 | ) | | (374 | ) | | (629 | ) | | 604% | | 319% | | | (3,573 | ) | | (1,301 | ) | | 175% |
| General and administration | (2,397 | ) | | (1,337 | ) | | (935 | ) | | 79% | | 156% | | | (4,910 | ) | | (3,067 | ) | | 60% |
| Fund flows from operations | 6,077 | | | 2,068 | | | 1,860 | | | 194% | | 227% | | | 9,340 | | | 3,531 | | | 165% |
| Netbacks ($/boe) | | | | | | | | | | | | | | | | |
| Sales | 53.10 | | | 73.30 | | | 49.72 | | | (28)% | | 7% | | | 59.45 | | | 51.07 | | | 16% |
| Royalties | (12.57 | ) | | (20.35 | ) | | (13.77 | ) | | (38)% | | (9)% | | | (15.00 | ) | | (14.29 | ) | | 5% |
| Transportation | — | | | — | | | (0.27 | ) | | — % | | (100)% | | | — | | | (0.12 | ) | | (100)% |
| Operating | (9.61 | ) | | (5.24 | ) | | (6.56 | ) | | 83% | | 46% | | | (8.91 | ) | | (6.04 | ) | | 48% |
| General and administration | (8.75 | ) | | (18.74 | ) | | (9.74 | ) | | (53)% | | (10)% | | | (12.24 | ) | | (14.23 | ) | | (14)% |
| Fund flows from operations netback | 22.17 | | | 28.97 | | | 19.38 | | | (23)% | | 14% | | | 23.30 | | | 16.39 | | | 42% |
| Realized prices | | | | | | | | | | | | | | | | |
| Crude oil ($/bbl) | 87.34 | | | 83.85 | | | 55.74 | | | 4% | | 57% | | | 84.23 | | | 57.68 | | | 46% |
| NGLs ($/bbl) | 29.22 | | | 30.93 | | | 26.35 | | | (6)% | | 11% | | | 29.53 | | | 20.58 | | | 43% |
| Natural gas ($/mmbtu) | 2.01 | | | 1.59 | | | 2.07 | | | 26% | | (3)% | | | 2.01 | | | 1.95 | | | 3% |
| Total ($/boe) | 53.10 | | | 73.30 | | | 49.72 | | | (28)% | | 7% | | | 59.45 | | | 51.07 | | | 16% |
| Reference prices | | | | | | | | | | | | | | | | |
| WTI (US $/bbl) | 69.50 | | | 67.88 | | | 48.20 | | | 2% | | 44% | | | 66.75 | | | 49.47 | | | 35% |
| WTI ($/bbl) | 90.83 | | | 87.63 | | | 60.37 | | | 4% | | 50% | | | 85.95 | | | 64.64 | | | 33% |
| Henry Hub (US $/mmbtu) | 2.90 | | | 2.80 | | | 3.00 | | | 4% | | (3)% | | | 2.90 | | | 3.17 | | | (9)% |
| Henry Hub ($/mmbtu) | 3.80 | | | 3.61 | | | 3.76 | | | 5% | | 1% | | | 3.74 | | | 4.14 | | | (10)% |
| Vermilion Energy Inc. | Page 32 | 2018 Third Quarter Report |
Production
| • | Q3 2018 production increased 280% from the prior quarter and 186% year-over-year due to the production associated with an acquisition we completed in August 2018, and the completion of our 2018 East Finn drilling campaign as we brought the final two (2.0 net) wells on production in the quarter. |
Activity
| • | In August 2018, we acquired all the assets of a private oil company in the Powder River Basin for total cash consideration of approximately $186 million. The assets are located in Campbell County, Wyoming, approximately 40 miles (65 kilometres) northwest of Vermilion’s existing operations. The assets include approximately 55,700 net acres of land (approximately 96% working interest) and approximately 2,500 boe/d (63% oil and NGLs) of production with an estimated annual base decline rate of 13%. |
| • | We also completed and brought on production the final two (2.0 net) wells of our five (5.0 net) well 2018 East Finn drilling program. |
Sales
| • | The price of crude oil in the United States is directly linked to WTI, subject to local market differentials within the United States. |
| • | Q3 2018 sales per boe decreased versus Q2 2018 due to increased relative gas production from the recently acquired assets. |
| • | For the three and nine months ended September 30, 2018, sales per boe increased versus the comparable periods in 2017. This was due to the significant increase in the WTI reference price in both of these periods. |
Royalties
| • | Our production in the United States is subject to federal and private royalties, severance tax, and ad valorem tax. |
| • | Royalties as a percentage of sales were lower versus all comparable periods due to the impact of a prior period adjustment recorded in the current period and lower royalty rate associated with the recently acquired assets. |
Operating
| • | Fluctuations in operating expense versus all comparable periods were due to the timing of maintenance activity and incremental costs from the recently acquired assets. |
General and administration
| • | Fluctuations in general and administration expense for all comparable periods were due to the incremental staffing of the United States corporate office, timing of expenditures and allocations from our corporate segment. |
Current income taxes
| • | As a result of our tax pools in the United States, we do not expect to incur current income taxes in the US Business Unit for the foreseeable future. |
| Vermilion Energy Inc. | Page 33 | 2018 Third Quarter Report |
Corporate
| • | Our Corporate segment includes costs related to our global hedging program, financing expenses, and general and administration expenses that are primarily incurred in Canada and are not directly related to the operations of our business units. Gains or losses relating to Vermilion's global hedging program are allocated to Vermilion's business units for statutory reporting and income tax purposes. |
| • | Results of our activities in Central and Eastern Europe are also included in the Corporate segment, including production, revenues, and expenditures relating to our first exploratory well in the South Battonya concession in Hungary. |
| Operational and financial review |
Corporate ($M) | Q3 2018 | | | Q2 2018 | | | Q3 2017 | | | | YTD 2018 | | | YTD 2017 | |
| Production and sales | | | | | | | | | | |
| Natural gas (mmcf/d) | 1.17 | | | — | | | — | | | | 0.39 | | | — | |
| Total (boe/d) | 195 | | | — | | | — | | | | 66 | | | — | |
| Activity | | | | | | | | | | |
| Capital expenditures | 1,619 | | | 3,080 | | | 4,653 | | | | 8,065 | | | 6,433 | |
| Acquisitions | 207 | | | — | | | — | | | | 207 | | | 40 | |
| Gross wells drilled | — | | | — | | | — | | | | 1.00 | | | — | |
| Net wells drilled | — | | | — | | | — | | | | 1.00 | | | — | |
| Financial results | | | | | | | | | | |
| Sales | 1,083 | | | — | | | — | | | | 1,083 | | | — | |
| Royalties | (279 | ) | | — | | | — | | | | (279 | ) | | — | |
| Operating | (201 | ) | | — | | | — | | | | (201 | ) | | — | |
| General and administration recovery (expense) | 854 | | | (3,393 | ) | | (1,834 | ) | | | (3,713 | ) | | (4,818 | ) |
| Current income taxes | (862 | ) | | (111 | ) | | 480 | | | | (1,159 | ) | | 15 | |
| Interest expense | (19,772 | ) | | (16,572 | ) | | (13,400 | ) | | | (51,932 | ) | | (43,603 | ) |
| Realized (loss) gain on derivatives | (37,365 | ) | | (27,859 | ) | | 8,723 | | | | (82,939 | ) | | 12,214 | |
| Realized foreign exchange loss | (3,100 | ) | | (4,105 | ) | | (4,110 | ) | | | (5,651 | ) | | (583 | ) |
| Realized other income | 177 | | | 230 | | | 214 | | | | 608 | | | 508 | |
| Fund flows from operations | (59,465 | ) | | (51,810 | ) | | (9,927 | ) | | | (144,183 | ) | | (36,267 | ) |
| Vermilion Energy Inc. | Page 34 | 2018 Third Quarter Report |
Production review
| • | Production in our Central and Eastern Europe business unit averaged 195 boe/d in Q3 2018, marking the first gas production for the business unit from our South Battonya concession in Hungary. The well was brought on production in mid-August and is producing in-line with our expectations at 5.3 mmcf/d (880 boe/d). |
Activity review
| • | In Q3 2018, we brought on production our first exploratory well (100% working interest) in the South Battonya concession, which we drilled and tested in the first quarter of this year. We have identified a new Pannonian gas prospect in our Ebes license in Hungary following further interpretation of 3D seismic data in the quarter. |
| • | During the remainder of 2018, activity will be focused on preparation for our 2019 drilling campaigns in Hungary, Slovakia and Croatia. A new 2D seismic acquisition campaign in Croatia is also expected to be carried out in Q4 2018. |
General and administration
| • | Fluctuations in general and administration expense for the three and nine months ended September 30, 2018 versus all comparable periods were due to allocations to the various business unit segments. |
| • | On a consolidated basis, general and administration expense decreased 19% quarter-over-quarter to $13.2 million in Q3 2018 (compared to $16.2 million in Q2 2018), primarily due to the absence of transaction costs incurred on our Spartan acquisition in the prior quarter. Acquisition-related costs of $1.3 million were incurred in the nine months ended September 30, 2018. |
Current income taxes
| • | Taxes in our corporate segment relate to holding companies that pay current taxes in foreign jurisdictions. |
Interest expense
| • | The increase in interest expense in Q3 2018 versus Q2 2018 was due to higher drawings on the revolving credit facility. |
| • | For the three and nine months ended September 30, 2018, interest expense increased versus the comparative periods in the prior year due to the impact of higher drawings on the revolving credit facility, as well as the impact of IFRS 16 adoption in the current year. Please refer to "Recently Adopted Accounting Pronouncements" for additional information regarding the adoption of IFRS 16. |
Realized gain or loss on derivatives
| • | The realized loss on derivatives for the three and nine months ended September 30, 2018 is related primarily to amounts paid on crude oil and European natural gas hedges. |
| • | A listing of derivative positions as at September 30, 2018 is included in “Supplemental Table 2” of this MD&A. |
| Vermilion Energy Inc. | Page 35 | 2018 Third Quarter Report |
Financial Performance Review
| ($M except per share) | Q3 2018 | | | Q2 2018 | | | Q1 2018 | | | Q4 2017 | | | Q3 2017 | | | Q2 2017 | | | Q1 2017 | | | Q4 2016 | |
| Petroleum and natural gas sales | 508,411 | | | 394,498 | | | 318,269 | | | 317,341 | | | 248,505 | | | 271,391 | | | 261,601 | | | 259,891 | |
| Net (loss) earnings | (15,099 | ) | | (61,364 | ) | | 24,740 | | | 8,645 | | | (39,191 | ) | | 48,264 | | | 44,540 | | | (4,032 | ) |
| Net earnings (loss) per share | | | | | | | | | | | | | | | |
| Basic | (0.10 | ) | | (0.46 | ) | | 0.20 | | | 0.07 | | | (0.32 | ) | | 0.40 | | | 0.38 | | | (0.03 | ) |
| Diluted | (0.10 | ) | | (0.46 | ) | | 0.20 | | | 0.07 | | | (0.32 | ) | | 0.39 | | | 0.37 | | | (0.03 | ) |
The following table shows the calculation of fund flows from operations:
| | Q3 2018 | | Q2 2018 | | Q3 2017 | | YTD 2018 | | YTD 2017 |
| | $M | | | $/boe | | | $M | | | $/boe | | | $M | | | $/boe | | | $M | | | $/boe | | | $M | | | $/boe | |
| Petroleum and natural gas sales | 508,411 | | | 57.90 | | | 394,498 | | | 53.72 | | | 248,505 | | | 39.66 | | | 1,221,178 | | | 54.64 | | | 781,497 | | | 43.27 | |
| Royalties | (53,786 | ) | | (6.13 | ) | | (31,512 | ) | | (4.29 | ) | | (16,994 | ) | | (2.71 | ) | | (108,293 | ) | | (4.85 | ) | | (50,935 | ) | | (2.82 | ) |
| Petroleum and natural gas revenues | 454,625 | | | 51.77 | | | 362,986 | | | 49.43 | | | 231,511 | | | 36.95 | | | 1,112,885 | | | 49.79 | | | 730,562 | | | 40.45 | |
| Transportation | (13,721 | ) | | (1.56 | ) | | (11,046 | ) | | (1.50 | ) | | (10,800 | ) | | (1.72 | ) | | (34,949 | ) | | (1.56 | ) | | (31,462 | ) | | (1.74 | ) |
| Operating | (97,758 | ) | | (11.13 | ) | | (78,947 | ) | | (10.75 | ) | | (61,832 | ) | | (9.87 | ) | | (244,544 | ) | | (10.94 | ) | | (177,027 | ) | | (9.80 | ) |
| General and administration | (13,234 | ) | | (1.51 | ) | | (14,153 | ) | | (1.93 | ) | | (12,114 | ) | | (1.93 | ) | | (39,115 | ) | | (1.75 | ) | | (38,432 | ) | | (2.13 | ) |
| PRRT | 254 | | | 0.03 | | | (2,652 | ) | | (0.36 | ) | | (4,345 | ) | | (0.69 | ) | | (7,246 | ) | | (0.32 | ) | | (16,247 | ) | | (0.90 | ) |
| Corporate income taxes | (9,401 | ) | | (1.07 | ) | | (12,692 | ) | | (1.73 | ) | | (3,092 | ) | | (0.49 | ) | | (30,807 | ) | | (1.38 | ) | | (14,618 | ) | | (0.81 | ) |
| Interest expense | (19,772 | ) | | (2.25 | ) | | (16,572 | ) | | (2.26 | ) | | (13,400 | ) | | (2.14 | ) | | (51,932 | ) | | (2.32 | ) | | (43,603 | ) | | (2.41 | ) |
| Realized (loss) gain on derivative instruments | (37,365 | ) | | (4.26 | ) | | (27,859 | ) | | (3.79 | ) | | 8,723 | | | 1.39 | | | (82,939 | ) | | (3.71 | ) | | 12,214 | | | 0.68 | |
| Realized foreign exchange loss | (3,100 | ) | | (0.35 | ) | | (4,105 | ) | | (0.56 | ) | | (4,110 | ) | | (0.66 | ) | | (5,651 | ) | | (0.25 | ) | | (583 | ) | | (0.03 | ) |
| Realized other income | 177 | | | 0.02 | | | 230 | | | 0.03 | | | 214 | | | 0.03 | | | 608 | | | 0.03 | | | 508 | | | 0.03 | |
| Fund flows from operations | 260,705 | | | 29.69 | | | 195,190 | | | 26.58 | | | 130,755 | | | 20.87 | | | 616,310 | | | 27.59 | | | 421,312 | | | 23.34 | |
Fluctuations in fund flows from operations may occur as a result of changes in commodity prices and costs to produce petroleum and natural gas. In addition, fund flows from operations may be affected by the timing of crude oil shipments in Australia and France. When crude oil inventory is built up, the related operating expense, royalties, and depletion expense are deferred and carried as inventory on the consolidated balance sheet. When the crude oil inventory is subsequently drawn down, the related expenses are recognized.
The following table shows a reconciliation from fund flows from operations to net (loss) earnings:
| | Q3 2018 | | | Q2 2018 | | | Q3 2017 | | | | YTD 2018 | | | YTD 2017 | |
| Fund flows from operations | 260,705 | | | 195,190 | | | 130,755 | | | | 616,310 | | | 421,312 | |
| Equity based compensation | (13,056 | ) | | (10,961 | ) | | (12,858 | ) | | | (43,767 | ) | | (45,492 | ) |
| Unrealized (loss) gain on derivative instruments | (75,829 | ) | | (105,284 | ) | | (24,198 | ) | | | (163,770 | ) | | 78,950 | |
| Unrealized foreign exchange (loss) gain | (23,044 | ) | | (12,458 | ) | | (3,016 | ) | | | (26,877 | ) | | 31,082 | |
| Unrealized other expense | (203 | ) | | (199 | ) | | (200 | ) | | | (597 | ) | | (440 | ) |
| Accretion | (8,041 | ) | | (7,819 | ) | | (6,850 | ) | | | (23,014 | ) | | (19,980 | ) |
| Depletion and depreciation | (166,343 | ) | | (143,385 | ) | | (120,826 | ) | | | (434,621 | ) | | (362,504 | ) |
| Deferred tax | 10,712 | | | 23,552 | | | (1,998 | ) | | | 24,613 | | | (49,315 | ) |
| Net (loss) earnings | (15,099 | ) | | (61,364 | ) | | (39,191 | ) | | | (51,723 | ) | | 53,613 | |
Fluctuations in net income from period-to-period are caused by changes in both cash and non-cash based income and charges. Cash based items are reflected in fund flows from operations. Non-cash items include: equity based compensation expense, unrealized gains and losses on derivative instruments, unrealized foreign exchange gains and losses, accretion, depletion and depreciation expense, and deferred taxes. In addition, non-cash items may also include gains resulting from business combinations or charges resulting from impairment or impairment reversals.
| Vermilion Energy Inc. | Page 36 | 2018 Third Quarter Report |
| Equity based compensation |
Equity based compensation expense relates primarily to non-cash compensation expense attributable to long-term incentives granted to directors, officers, and employees under the Vermilion Incentive Plan (“VIP”).
Equity based compensation expense increased in Q3 2018 compared to Q2 2018 and Q3 2017 due to a higher number of outstanding units in the current quarter.
| Unrealized gain or loss on derivative instruments |
Unrealized gain or loss on derivative instruments arise as a result of changes in future commodity price forecasts. As Vermilion uses derivative instruments to manage the commodity price exposure of our future crude oil and natural gas production, we will normally recognize unrealized gains on derivative instruments when future commodity price forecasts decline and vice-versa. As derivative instruments are settled, the unrealized gain or loss previously recognized is reversed, and the settlement results in a realized gain or loss on derivative instruments.
For the three and nine months ended September 30, 2018, we recognized unrealized losses on derivative instruments of $75.8 million and $163.8 million, respectively. The unrealized loss primarily related to European natural gas and crude oil derivative instruments for 2018 through 2020.
| Unrealized foreign exchange gain or loss |
As a result of Vermilion’s international operations, Vermilion has monetary assets and liabilities denominated in currencies other than the Canadian dollar. These monetary assets and liabilities include cash, receivables, payables, long-term debt, derivative instruments and intercompany loans. These monetary assets primarily relate to Euro denominated intercompany loans from Vermilion Energy Inc. to our international subsidiaries. These monetary liabilities primarily relate to our US$300.0 million senior unsecured notes.
Unrealized foreign exchange gains and losses result from translating these monetary assets and liabilities from their underlying currency to the Canadian dollar. Unrealized foreign exchange primarily results from the translation of Euro denominated intercompany loans and US dollar denominated long-term debt. As such, an appreciation in the Euro against the Canadian dollar will result in an unrealized foreign exchange gain while an appreciation in the US dollar against the Canadian dollar will result in an unrealized foreign exchange loss (and vice-versa).
For the three months ended September 30, 2018, the impact of the Canadian dollar strengthening against the Euro was more significant than the impact of the Canadian dollar weakening against the US dollar, resulting in an unrealized loss on foreign exchange of $23.0 million. For the nine months ended September 30, 2018, the unrealized loss on foreign exchange of $26.9 million was primarily driven by the impact of the Canadian dollar weakening against the US dollar.
As at September 30, 2018, a $0.01 appreciation of the Euro against the Canadian dollar would result in a $3.4 million increase to net earnings as a result of an unrealized gain on foreign exchange. In contrast, a $0.01 appreciation of the US dollar against the Canadian dollar would result in a $3.3 million decrease to net earnings as a result of an unrealized loss on foreign exchange.
Accretion expense is recognized to update the present value of the asset retirement obligation balance. The increase in accretion expense was primarily attributable to new obligations recognized following acquisitions in 2018.
| Depletion and depreciation |
Depletion and depreciation expense is recognized to allocate the cost of capital assets over the useful life of the respective assets. Depletion and depreciation expense per unit of production is determined for each depletion unit (which are groups of assets within a specific production area that have similar economic lives) by dividing the sum of the net book value of capital assets and future development costs by total proved plus probable reserves.
Fluctuations in depletion and depreciation expense are primarily the result of changes in produced crude oil and natural gas volumes and changes in depletion and depreciation per unit. Fluctuations in depletion and depreciation per unit are the result of changes in reserves, future development costs, and relative production mix.
Depletion and depreciation on a per boe basis for Q3 2018 of $18.95 was consistent with $19.52 in Q2 2018. For the three and nine months ended September 30, 2018, depletion and depreciation on a per boe basis of $18.95 and $19.45, respectively, were lower than $19.28 and $20.07 for the respective comparable periods in the prior year due to reduced depletion and depreciation rates as a result of increased reserves and lower estimated future development costs.
| Vermilion Energy Inc. | Page 37 | 2018 Third Quarter Report |
On the balance sheet, deferred tax assets arise when the tax basis of an asset exceeds its accounting basis (known as a deductible temporary difference). Conversely, deferred tax liabilities arise when the tax basis of an asset is less than its accounting basis (known as a taxable temporary difference). Deferred tax assets are recognized only to the extent that it is probable that there are future taxable profits against which the deductible temporary difference can be utilized. Deferred tax assets and liabilities are measured at the enacted or substantively enacted tax rate that is expected to apply when the asset is realized or the liability is settled.
As such, fluctuations in deferred tax expenses and recoveries primarily arise as a result of: changes in the accounting basis of an asset or liability without a corresponding tax basis change (e.g. when derivative assets and liabilities are marked-to-market or when accounting depletion differs from tax depletion), changes in available tax losses (e.g. if they are utilized to offset taxable income), changes in estimated future taxable profits resulting in a de-recognition or re-recognition of deferred tax assets, and changes in enacted or substantively enacted tax rates.
For the three and nine months ended September 30, 2018, deferred tax recoveries of $10.7 million and $24.6 million resulted from unrealized losses on derivative instruments.
| Vermilion Energy Inc. | Page 38 | 2018 Third Quarter Report |
Financial Position Review
We believe that our balance sheet supports our defined growth initiatives and our focus is on managing and maintaining a conservative balance sheet. To ensure that our balance sheet continues to support our defined growth initiatives, we regularly review whether forecasted fund flows from operations is sufficient to finance planned capital expenditures, dividends, and abandonment and reclamation expenditures. To the extent that forecasted fund flows from operations is not expected to be sufficient to fulfill such expenditures, we will evaluate our ability to finance any shortfall with debt (including borrowing using the unutilized capacity of our existing revolving credit facility), issue equity, or by reducing some or all categories of expenditures to ensure that total expenditures do not exceed available funds.
To ensure that we maintain a conservative balance sheet, we monitor the ratio of net debt to fund flows from operations.
We remain focused on maintaining and strengthening our balance sheet by aligning our exploration and development capital budget with forecasted fund flows from operations to target a payout ratio (a non-GAAP financial measure) of at or less than 100%. We continually monitor for changes in forecasted fund flows from operations as a result of changes to forward commodity prices and as appropriate we will adjust our exploration and development capital plans. As a result of our focus on this payout ratio target, we intend for the ratio of net debt to fund flows from operations to trend towards 1.5 over time.
Net debt is reconciled to long-term debt, as follows:
| | As at |
| ($M) | Sep 30, 2018 | | | Dec 31, 2017 | |
| Long-term debt | 1,728,889 | | | 1,270,330 | |
| Current liabilities | 629,893 | | | 363,306 | |
| Current assets | (324,696 | ) | | (261,846 | ) |
| Net debt | 2,034,086 | | | 1,371,790 | |
| | | | |
| Ratio of net debt to quarterly annualized fund flows from operations | 1.95 | | | 1.89 | |
As at September 30, 2018, net debt increased to $2.03 billion (December 31, 2017 - $1.37 billion) due to the impact of the acquisitions closed in the first nine months of 2018 and a $100.1 million increase in net current derivative liability. This increase in net debt was partially offset by an increase in fund flows from operations and resulted in a slight increase in the ratio of net debt to quarterly annualized fund flows from operations from 1.89 for 2017 to 1.95 for the current period.
The balances recognized on our balance sheet are as follows:
| | As at |
| ($M) | Sep 30, 2018 | | | Dec 31, 2017 | |
| Revolving credit facility | 1,345,730 | | | 899,595 | |
| Senior unsecured notes | 383,159 | | | 370,735 | |
| Long-term debt | 1,728,889 | | | 1,270,330 | |
| Vermilion Energy Inc. | Page 39 | 2018 Third Quarter Report |
Revolving Credit Facility
In Q2 2018, we negotiated an increase in our revolving credit facility from $1.4 billion to $1.6 billion and an extension of the maturity from May 31, 2021 to May 31, 2022. In Q3 2018, we negotiated a further increase in our revolving credit from $1.6 billion to $1.8 billion.
As at September 30, 2018, Vermilion had in place a bank revolving credit facility maturing May 31, 2022 with the below terms, outstanding positions, and covenants.
| | As at |
| ($M) | Sep 30, 2018 | | | Dec 31, 2017 | |
| Total facility amount | 1,800,000 | | | 1,400,000 | |
| Amount drawn | (1,345,730 | ) | | (899,595 | ) |
| Letters of credit outstanding | (8,800 | ) | | (7,400 | ) |
| Unutilized capacity | 445,470 | | | 493,005 | |
As at September 30, 2018, the revolving credit facility was subject to the following covenants:
| | | | As at |
| Financial covenant | Limit | | | Sep 30, 2018 | | | Dec 31, 2017 | |
| Consolidated total debt to consolidated EBITDA | 4.0 | | | 1.67 | | | 1.87 | |
Consolidated total senior debt to consolidated EBITDA | 3.5 | | | 1.30 | | | 1.30 | |
| Consolidated total senior debt to total capitalization | 55 | % | | 32 | % | | 32 | % |
Our covenants include financial measures defined within our revolving credit facility agreement that are not defined under IFRS. These financial measures are defined by our revolving credit facility agreement as follows:
| • | Consolidated total debt: Includes all amounts classified as “Long-term debt”, “Current portion of long-term debt”, and “Lease obligations” (including the current portion included within "Accounts payable and accrued liabilities" but excluding operating leases as defined under IAS 17) on our balance sheet. |
| • | Consolidated total senior debt: Defined as consolidated total debt excluding unsecured and subordinated debt. |
| • | Consolidated EBITDA: Defined as consolidated net earnings before interest, income taxes, depreciation, accretion and certain other non-cash items, adjusted for the impact of the acquisition of a material subsidiary. |
| • | Total capitalization: Includes all amounts on our balance sheet classified as “Shareholders’ equity” plus consolidated total debt as defined above. |
Senior Unsecured Notes
On March 13, 2017, Vermilion issued US$300 million of senior unsecured notes at par. The notes bear interest at a rate of 5.625% per annum, paid semi-annually on March 15 and September 15, and mature on March 15, 2025. As direct senior unsecured obligations of Vermilion, the notes rank equally in right of payment with existing and future senior indebtedness of the Company.
The senior unsecured notes were recognized at amortized cost and include the transaction costs directly related to the issuance.
Vermilion may, at its option, redeem the senior unsecured notes prior to maturity as follows:
| • | Prior to March 15, 2020, Vermilion may redeem up to 35% of the original principal amount of the senior unsecured notes with the proceeds of certain equity offerings by the Company at a redemption price of 105.625% of the principal amount, plus any accrued and unpaid interest to but excluding the applicable redemption date. |
| • | Prior to March 15, 2020, Vermilion may redeem some or all of the senior unsecured notes at a price equal to 100% of the principal amount of the senior unsecured notes, plus a “make-whole” premium and any accrued and unpaid interest. |
| • | On or after March 15, 2020, Vermilion may redeem some or all of the senior unsecured notes at the redemption prices set forth in the following table, plus any accrued and unpaid interest. |
| Year | | Redemption price |
| 2020 | | 104.219 | % |
| 2021 | | 102.813 | % |
| 2022 | | 101.406 | % |
| 2023 and thereafter | | 100.000 | % |
| Vermilion Energy Inc. | Page 40 | 2018 Third Quarter Report |
Beginning with the April 2018 dividend paid on May 15, 2018, we increased our monthly dividend by 7%, to $0.23 per share from $0.215 per share. The dividend increase in Q2 2018 was our fourth dividend increase (previously Vermilion's distribution in the income trust era) since we began paying a distribution in 2003.
In total, dividends declared in 2018 were $282.8 million.
The following table outlines our dividend payment history:
| Date | Monthly dividend per unit or share |
| January 2003 to December 2007 | | $0.170 |
| January 2008 to December 2012 | | $0.190 |
| January 2013 to December 2013 | | $0.200 |
| January 2014 to March 2018 | | $0.215 |
| April 2018 onwards | | $0.230 |
Our policy with respect to dividends is to be conservative and maintain a low ratio of dividends to fund flows from operations. During low commodity price cycles, we will initially maintain dividends and allow the ratio to rise. Should low commodity price cycles remain for an extended period of time, we will evaluate the necessity of changing the level of dividends, taking into consideration capital development requirements, debt levels, and acquisition opportunities.
Although we expect to be able to maintain our current dividend, fund flows from operations may not be sufficient to fund cash dividends, capital expenditures, and asset retirement obligations. We will evaluate our ability to finance any shortfall with debt, issuances of equity, or by reducing some or all categories of expenditures to ensure that total expenditures do not exceed available funds.
The following table reconciles the change in shareholders’ capital:
| Shareholders’ Capital | Number of Shares ('000s) | | Amount ($M) | |
| Balance at December 31, 2017 | | 122,119 | | | 2,650,706 | |
| Shares issued for corporate acquisition | | 27,883 | | | 1,234,676 | |
| Shares issued for the Dividend Reinvestment Plan | | 1,030 | | | 43,936 | |
| Vesting of equity based awards | | 1,025 | | | 54,057 | |
| Equity based compensation | | 256 | | | 10,626 | |
| Share-settled dividends on vested equity based awards | | 184 | | | 7,773 | |
| Balance as at September 30, 2018 | | 152,497 | | | 4,001,774 | |
As at September 30, 2018, there were approximately 1.9 million VIP awards outstanding. As at October 24, 2018, there were approximately 152.5 million common shares issued and outstanding.
Asset Retirement Obligations
As at September 30, 2018, asset retirement obligations were $598.1 million compared to $517.2 million as at December 31, 2017.
The increase in asset retirement obligations is largely attributable to additional obligations recognized as a result of acquisitions completed in 2018.
Off Balance Sheet Arrangements
We have not entered into any guarantee or off balance sheet arrangements that would materially impact our financial position or results of operations.
| Vermilion Energy Inc. | Page 41 | 2018 Third Quarter Report |
Risk Management
Vermilion is exposed to various market and operational risks. For a discussion of these risks, please see Vermilion's MD&A and Annual Information Form, each for the year ended December 31, 2017 available on SEDAR at www.sedar.com or on Vermilion’s website at www.vermilionenergy.com.
Critical Accounting Estimates
The preparation of financial statements in accordance with IFRS requires management to make estimates, judgments and assumptions that affect reported assets, liabilities, revenues and expenses, gains and losses, and disclosures of any possible contingencies. These estimates and assumptions are developed based on the best available information which management believed to be reasonable at the time such estimates and assumptions were made. As such, these assumptions are uncertain at the time estimates are made and could change, resulting in a material impact on Vermilion’s consolidated financial statements. Estimates are reviewed by management on an ongoing basis and as a result may change from period to period due to the availability of new information or changes in circumstances. Additionally, as a result of the unique circumstances of each jurisdiction that Vermilion operates in, the critical accounting estimates may affect one or more jurisdictions. With the exception of additional judgments, estimates, and assumptions related to the application of IFRS 16 (see notes to the Condensed Consolidated Financial Statements), there have been no material changes to our critical accounting estimates used in applying accounting policies for the three and nine months ended September 30, 2018. Further information, including a discussion of critical accounting estimates, can be found in the notes to the Consolidated Financial Statements and annual MD&A for the year ended December 31, 2017, available on SEDAR at www.sedar.com or on Vermilion’s website at www.vermilionenergy.com.
Internal Control Over Financial Reporting
There was no change in Vermilion’s internal control over financial reporting ("ICFR") during the period covered by this MD&A that materially affected, or is reasonably likely to materially affect, its internal control over financial reporting.
Vermilion has limited the scope of design controls and procedures ("DC&P") and internal controls over financial reporting to exclude controls, policies and procedures of Spartan Energy Corp, which was acquired on May 28, 2018. The scope limitation is in accordance with section 3.3(1)(b) of NI 52-109 which allows an issuer to limit the design of DC&P and ICFR to exclude controls, policies, and procedures of a business that the issuer acquired not more than 365 days before the end of the fiscal period.
The table below presents the summary financial information of Spartan included in Vermilion's financial statements as at and for the nine months ended September 30, 2018:
| ($MM) | | As at September 30, 2018 | |
| Non-current assets | | 1,540 | |
| Non-current liabilities | | 111 | |
| Net assets | | 1,394 | |
| | | |
| ($MM) | Nine months ended September 30, 2018 |
| Revenue | | 157 | |
| Net earnings | | 40 | |
Recently Adopted Accounting Pronouncements
| IFRS 9 "Financial instruments" |
On January 1, 2018, Vermilion adopted IFRS 9"Financial Instruments" as issued by the IASB. IFRS 9 includes a new classification and measurement approach for financial assets and a forward-looking 'expected credit loss' model. The adoption of IFRS 9 did not have a material impact on Vermilion's consolidated financial statements.
| IFRS 15 "Revenue from contracts with customers" |
On January 1, 2018, Vermilion adopted IFRS 15 "Revenue from Contracts with Customers" IFRS 15 establishes a comprehensive framework for determining whether, how much, and when revenue from contracts with customers is recognized. Vermilion's revenue relates to the sale of petroleum and natural gas to customers at specified delivery points at benchmark prices.
| Vermilion Energy Inc. | Page 42 | 2018 Third Quarter Report |
Vermilion adopted IFRS 15 using the modified retrospective approach. Under this transitional provision, the cumulative effect of initially applying IFRS 15 is recognized on the date of initial application as an adjustment to retained earnings. No adjustment to retained earnings was required upon adoption of IFRS 15.
In Q3 2018, Vermilion began applying IFRS 16 "Leases" effective January 1, 2018. The stated objective of IFRS 16 is to provide information that faithfully represents lease transactions and provides a basis for users of financial statements to assess the amount, timing and uncertainty of cash flows arising from leases. IFRS 16 accomplishes this by introducing a single lessee accounting model that requires lessees to recognize a lease obligation and right-of-use asset for the majority of leases. As the Company completed the assessment of the standard and applicable contracts during Q3 2018, Vermilion elected for earlier application of IFRS 16 to achieve the stated objectives of the standard and to increase comparability of results in future periods. Vermilion began applying the standard beginning effective January 1, 2018.
Effective January 1, 2018, Vermilion applied IFRS 16 retrospectively with the cumulative effect of initially applying the standard recognized as a $97.1 million increase to right-of-use assets (included in "Capital assets") and lease obligations ($86.1 million recorded in "Lease obligations" and $11.0 million recorded in "Accounts payable and accrued liabilities"). The right-of-use assets and lease obligations recognized largely relate to the Company's head office lease in Calgary and long-term leases for oil storage facilities in France.
Q1 and Q2 2018 results, which were previously released as prepared under IAS 17, have been revised to reflect the impact of this new accounting pronouncement.
The impact of applying IFRS 16 to Q1 and Q2 2018 on the statement of net earnings is summarized in the table below:
| ($M) | Notes | Q1 2018 as previously reported | Impact of
IFRS 16 | Q1 2018
revised | | Q2 2018 as previously reported | Impact of
IFRS 16 | Q2 2018
revised |
| Operating | A | 68,375 | | (536 | ) | 67,839 | | | 79,493 | | (546 | ) | 78,947 | |
| Transportation | B | 11,019 | | (837 | ) | 10,182 | | | 11,851 | | (805 | ) | 11,046 | |
| Interest expense | | 14,334 | | 1,254 | | 15,588 | | | 15,333 | | 1,239 | | 16,572 | |
| General and administration | C | 14,544 | | (2,816 | ) | 11,728 | | | 16,241 | | (2,088 | ) | 14,153 | |
| Depletion and depreciation | | 121,559 | | 3,334 | | 124,893 | | | 140,045 | | 3,340 | | 143,385 | |
| Net earnings | | 25,139 | | (399 | ) | 24,740 | | | (60,224 | ) | (1,140 | ) | (61,364 | ) |
| A. | The application of IFRS 16 reduced operating expenses in the following business units: Canada (Q1 2018 - $0.3MM; Q2 2018 - $0.3MM), France (Q1 2018 - $0.1MM; Q2 2018 - $0.1MM), Netherlands (Q1 2018 - $0.1MM; Q2 2018 - $0.1MM), and Australia (Q1 2018 - $0.1MM; Q2 2018 - $0.1MM). |
| B. | The application of IFRS 16 reduced transportation expense in the France business unit. |
| C. | The application of IFRS 16 primarily reduced general and administration expenses in the following business units: Canada (Q1 2018 - $1.2MM; Q2 2018 - $0.8MM), Netherlands (Q1 2018 - $0.2MM; Q2 2018 - $0.2MM), United States (Q1 2018 - $0.1MM; Q2 2018 - $0.1MM), and Corporate ($Q1 2018 - $1.3MM; Q2 2018 - $0.9MM). |
The impact of applying IFRS 16 to Q1 and Q2 2018 on the statement of cash flows is summarized in the table below:
| ($M) | | Q1 2018 as previously reported | Impact of
IFRS 16 | Q1 2018
revised | | Q2 2018 as previously reported | Impact of
IFRS 16 | Q2 2018
revised |
| Drilling and development | | 124,811 | | (153 | ) | 124,658 | | | 76,854 | | (145 | ) | 76,709 | |
| Payments on lease obligations | | 1,264 | | 3,086 | | 4,350 | | | 1,541 | | 2,347 | | 3,888 | |
Please refer to Supplemental Table 5 for Q1 and Q2 2018 netbacks after adjusting for the impact of IFRS 16.
| Vermilion Energy Inc. | Page 43 | 2018 Third Quarter Report |
Supplemental Table 1: Netbacks
The following table includes financial statement information on a per unit basis by business unit. Liquids includes crude oil, condensate, and NGLs. Natural gas sales volumes have been converted on a basis of six thousand cubic feet of natural gas to one barrel of oil equivalent.
| | Q3 2018 | | YTD 2018 | | Q3 2017 | | YTD 2017 |
| | Liquids | | Natural Gas | | Total | | Liquids | | Natural Gas | | Total | | Total | | Total |
| | $/bbl | | $/mcf | | $/boe | | $/bbl | | $/mcf | | $/boe | | $/boe | | $/boe |
| Canada | | | | | | | | | | | | | | | |
| Sales | 70.65 | | 1.44 | | 46.02 | | 66.64 | | 1.47 | | 39.89 | | 26.65 | | | 30.53 | |
| Royalties | (10.52) | | (0.02) | | (6.40) | | (9.37) | | 0.06 | | (4.86) | | (2.30 | ) | | (3.09 | ) |
| Transportation | (1.04) | | (0.46) | | (1.72) | | (1.30) | | (0.31) | | (1.55) | | (1.55 | ) | | (1.62 | ) |
| Operating | (11.76) | | (1.44) | | (10.52) | | (10.95) | | (1.30) | | (9.50) | | (7.62 | ) | | (7.50 | ) |
| Operating netback | 47.33 | | (0.48) | | 27.38 | | 45.02 | | (0.08) | | 23.98 | | 15.18 | | | 18.32 | |
| General and administration | | | | | (0.25) | | | | | | (0.32) | | (0.77 | ) | | (0.91 | ) |
| Fund flows from operations netback | | | | | 27.13 | | | | | | 23.66 | | 14.41 | | | 17.41 | |
| France | | | | | | | | | | | | | | | |
| Sales | 95.46 | | — | | 95.46 | | 91.27 | | — | | 91.27 | | 63.24 | | | 64.22 | |
| Royalties | (12.08) | | — | | (12.08) | | (11.56) | | — | | (11.56) | | (6.12 | ) | | (6.09 | ) |
| Transportation | (1.91) | | — | | (1.91) | | (2.39) | | — | | (2.39) | | (3.29 | ) | | (3.44 | ) |
| Operating | (13.00) | | — | | (13.00) | | (13.51) | | — | | (13.51) | | (12.58 | ) | | (12.44 | ) |
| Operating netback | 68.47 | | — | | 68.47 | | 63.81 | | — | | 63.81 | | 41.25 | | | 42.25 | |
| General and administration | | | | | (3.19) | | | | | | (3.45) | | (2.43 | ) | | (3.16 | ) |
| Current income taxes | | | | | (6.54) | | | | | | (4.72) | | (1.34 | ) | | (2.78 | ) |
| Fund flows from operations netback | | | | | 58.74 | | | | | | 55.64 | | 37.48 | | | 36.31 | |
| Netherlands | | | | | | | | | | | | | | | |
| Sales | 82.32 | | 10.08 | | 60.74 | | 77.08 | | 9.22 | | 55.54 | | 39.23 | | | 41.04 | |
| Royalties | — | | (0.26) | | (1.52) | | — | | (0.22) | | (1.30) | | (0.66 | ) | | (0.66 | ) |
| Operating | — | | (1.42) | | (8.45) | | — | | (1.65) | | (9.79) | | (8.30 | ) | | (8.70 | ) |
| Operating netback | 82.32 | | 8.40 | | 50.77 | | 77.08 | | 7.35 | | 44.45 | | 30.27 | | | 31.68 | |
| General and administration | | | | | (0.47) | | | | | | (0.61) | | (0.94 | ) | | (1.02 | ) |
| Current income taxes | | | | | 2.51 | | | | | | (4.46) | | (3.66 | ) | | (2.23 | ) |
| Fund flows from operations netback | | | | | 52.81 | | | | | | 39.38 | | 25.67 | | | 28.43 | |
| Germany | | | | | | | | | | | | | | | |
| Sales | 92.45 | | 9.61 | | 67.15 | | 86.71 | | 8.32 | | 61.02 | | 38.52 | | | 42.50 | |
| Royalties | (2.14) | | (1.66) | | (7.81) | | (2.32) | | (1.14) | | (5.48) | | (5.56 | ) | | (4.15 | ) |
| Transportation | (8.83) | | (0.32) | | (3.80) | | (9.64) | | (0.50) | | (5.01) | | (3.94 | ) | | (4.30 | ) |
| Operating | (21.41) | | (2.22) | | (15.51) | | (21.95) | | (2.37) | | (16.56) | | (8.55 | ) | | (12.08 | ) |
| Operating netback | 60.07 | | 5.41 | | 40.03 | | 52.80 | | 4.31 | | 33.97 | | 20.47 | | | 21.97 | |
| General and administration | | | | | (6.61) | | | | | | (5.13) | | (4.20 | ) | | (4.85 | ) |
| Fund flows from operations netback | | | | | 33.42 | | | | | | 28.84 | | 16.27 | | | 17.12 | |
| Ireland | | | | | | | | | | | | | | | |
| Sales | — | | 10.63 | | 63.76 | | — | | 9.89 | | 59.32 | | 37.53 | | | 40.69 | |
| Transportation | — | | (0.31) | | (1.85) | | — | | (0.26) | | (1.57) | | (1.66 | ) | | (1.38 | ) |
| Operating | — | | (0.71) | | (4.26) | | — | | (0.71) | | (4.25) | | (7.60 | ) | | (5.43 | ) |
| Operating netback | — | | 9.61 | | 57.65 | | — | | 8.92 | | 53.50 | | 28.27 | | | 33.88 | |
| General and administration | | | | | (4.57) | | | | | | (2.48) | | (0.89 | ) | | (0.67 | ) |
| Fund flows from operations netback | | | | | 53.08 | | | | | | 51.02 | | 27.38 | | | 33.21 | |
| Vermilion Energy Inc. | Page 44 | 2018 Third Quarter Report |
| | Q3 2018 | | YTD 2018 | | Q3 2017 | | YTD 2017 |
| | Liquids | | Natural Gas | | Total | | Liquids | | Natural Gas | | Total | | Total | | Total |
| | $/bbl | | $/mcf | | $/boe | | $/bbl | | $/mcf | | $/boe | | $/boe | | $/boe |
| Australia | | | | | | | | | | | | | | | |
| Sales | 99.01 | | — | | 99.01 | | 94.39 | | — | | 94.39 | | 66.97 | | | 71.55 | |
| Operating | (32.00) | | — | | (32.00) | | (31.73) | | — | | (31.73) | | (23.35 | ) | | (22.96 | ) |
| PRRT(1) | 0.70 | | — | | 0.70 | | (6.14) | | — | | (6.14) | | (8.25 | ) | | (9.83 | ) |
| Operating netback | 67.71 | | — | | 67.71 | | 56.52 | | — | | 56.52 | | 35.37 | | | 38.76 | |
| General and administration | | | | | (2.82) | | | | | | (2.99) | | (3.18 | ) | | (3.02 | ) |
| Corporate income taxes | | | | | (9.27) | | | | | | (5.41) | | (0.37 | ) | | (1.68 | ) |
| Fund flows from operations netback | | | | | 55.62 | | | | | | 48.12 | | 31.82 | | | 34.06 | |
| United States | | | | | | | | | | | | | | | |
| Sales | 68.27 | | 2.01 | | 53.10 | | 71.68 | | 2.01 | | 59.45 | | 49.72 | | | 51.07 | |
| Royalties | (16.03) | | (0.53) | | (12.57) | | (18.03) | | (0.55) | | (15.00) | | (13.77 | ) | | (14.29 | ) |
| Transportation | — | | — | | — | | — | | — | | — | | (0.27 | ) | | (0.12 | ) |
| Operating | (9.95) | | (1.45) | | (9.61) | | (9.19) | | (1.30) | | (8.91) | | (6.56 | ) | | (6.04 | ) |
| Operating netback | 42.29 | | 0.03 | | 30.92 | | 44.46 | | 0.16 | | 35.54 | | 29.12 | | | 30.62 | |
| General and administration | | | | | (8.75) | | | | | | (12.24) | | (9.74 | ) | | (14.23 | ) |
| Fund flows from operations netback | | | | | 22.17 | | | | | | 23.30 | | 19.38 | | | 16.39 | |
| Total Company | | | | | | | | | | | | | | | |
| Sales | 78.40 | | 5.35 | | 57.90 | | 76.74 | | 5.30 | | 54.64 | | 39.66 | | | 43.27 | |
| Realized hedging (loss) gain | (4.17) | | (0.73) | | (4.26) | | (4.56) | | (0.47) | | (3.71) | | 1.39 | | | 0.68 | |
| Royalties | (10.14) | | (0.18) | | (6.13) | | (9.02) | | (0.09) | | (4.85) | | (2.71 | ) | | (2.82 | ) |
| Transportation | (1.24) | | (0.33) | | (1.56) | | (1.63) | | (0.25) | | (1.56) | | (1.72 | ) | | (1.74 | ) |
| Operating | (13.60) | | (1.34) | | (11.13) | | (14.01) | | (1.30) | | (10.94) | | (9.87 | ) | | (9.80 | ) |
| PRRT(1) | 0.05 | | — | | 0.03 | | (0.64) | | — | | (0.32) | | (0.69 | ) | | (0.90 | ) |
| Operating netback | 49.30 | | 2.77 | | 34.85 | | 46.88 | | 3.19 | | 33.26 | | 26.06 | | | 28.69 | |
| General and administration | | | | | (1.51) | | | | | | (1.75) | | (1.93 | ) | | (2.13 | ) |
| Interest expense | | | | | (2.25) | | | | | | (2.32) | | (2.14 | ) | | (2.41 | ) |
| Realized foreign exchange loss | | | | | (0.35) | | | | | | (0.25) | | (0.66 | ) | | (0.03 | ) |
| Other income | | | | | 0.02 | | | | | | 0.03 | | 0.03 | | | 0.03 | |
| Corporate income taxes | | | | | (1.07) | | | | | | (1.38) | | (0.49 | ) | | (0.81 | ) |
| Fund flows from operations netback | | | | | 29.69 | | | | | | 27.59 | | 20.87 | | | 23.34 | |
(1) Vermilion considers Australian PRRT to be an operating item and, accordingly, has included PRRT in the calculation of operating netbacks. Current income taxes presented above excludes PRRT.
| Vermilion Energy Inc. | Page 45 | 2018 Third Quarter Report |
Supplemental Table 2: Hedges
The prices in these tables may represent the weighted averages for several contracts. The weighted average price for the portfolio of options listed below may not have the same payoff profile as the individual contracts. As such, the presentation of the weighted average prices is purely for indicative purposes.
The following tables outline Vermilion’s outstanding risk management positions as at September 30, 2018:
| | | | | | | | Bought Put
Volume | | Weighted
Average Bought Put | | Sold Call
Volume | | Weighted
Average Sold Call | | Sold Put
Volume | | Weighted Average Sold Put | | Swap
Volume | | Weighted
Average Swap | | Additional Swap
Volume |
| Crude Oil | Period | | | Exercise date(1) | | | Currency | | (bbl/d) | | Price / bbl | | (bbl/d) | | Price / bbl | | (bbl/d) | | Price / bbl | | (bbl/d) | | Price / bbl | | (bbl/d) (2) |
| Dated Brent | | | | | | | | | | | | | | | | | | | | | | | | | | | | | | | | | | | | | | | | | | | | | | |
| 3-Way Collar | Sep 2018 - Jun 2019 | | | | | | | | CAD | | | | 2,500 | | | | 91.20 | | | | 2,500 | | | | 98.63 | | | | 2,500 | | | | 76.00 | | | | — | | | | — | | | | — | |
| Swap | Jan 2018 - Dec 2018 | | | | | | | | CAD | | | | — | | | | — | | | | — | | | | — | | | | — | | | | — | | | | 500 | | | | 76.25 | | | | — | |
| Swap | Jan 2019 - Dec 2019 | | | | | | | | CAD | | | | — | | | | — | | | | — | | | | — | | | | — | | | | — | | | | 1,350 | | | | 91.76 | | | | — | |
| 3-Way Collar | Jul 2017 - Dec 2018 | | | | | | | | USD | | | | 2,000 | | | | 48.89 | | | | 2,000 | | | | 55.00 | | | | 2,000 | | | | 42.50 | | | | — | | | | — | | | | — | |
| 3-Way Collar | Oct 2017 - Dec 2018 | | | | | | | | USD | | | | 2,000 | | | | 50.50 | | | | 2,000 | | | | 55.75 | | | | 2,000 | | | | 43.00 | | | | — | | | | — | | | | — | |
| 3-Way Collar | Aug 2018 - Jun 2019 | | | | | | | | USD | | | | 500 | | | | 66.92 | | | | 500 | | | | 80.00 | | | | 500 | | | | 55.00 | | | | — | | | | — | | | | — | |
| 3-Way Collar | Jan 2019 - Dec 2019 | | | | | | | | USD | | | | 500 | | | | 70.00 | | | | 500 | | | | 80.00 | | | | 500 | | | | 60.00 | | | | — | | | | — | | | | — | |
| Collar | Jan 2018 - Dec 2018 | | | | | | | | USD | | | | 1,000 | | | | 50.00 | | | | 1,000 | | | | 57.50 | | | | — | | | | — | | | | — | | | | — | | | | — | |
| Swap | Jan 2018 - Dec 2018 | | | | | | | | USD | | | | — | | | | — | | | | — | | | | — | | | | — | | | | — | | | | 1,000 | | | | 55.00 | | | | — | |
| Swap | Apr 2018 - Mar 2019 | | | | | | | | USD | | | | — | | | | — | | | | — | | | | — | | | | — | | | | — | | | | 750 | | | | 61.33 | | | | — | |
| Swap | Jul 2018 - Jun 2019 | | | | | | | | USD | | | | — | | | | — | | | | — | | | | — | | | | — | | | | — | | | | 1,500 | | | | 68.52 | | | | — | |
| Swap | Jan 2019 - Dec 2019 | | | | | | | | USD | | | | — | | | | — | | | | — | | | | — | | | | — | | | | — | | | | 2,250 | | | | 73.17 | | | | — | |
| Swaption | Jan 2019 - Dec 2019 | | | | Oct 31, 2018 | | | | USD | | | | — | | | | — | | | | — | | | | — | | | | — | | | | — | | | | 500 | | | | 79.10 | | | | — | |
| WTI | | | | | | | | | | | | | | | | | | | | | | | | | | | | | | | | | | | | | | | | | | | | | | |
| Swap | Jul 2018 - Dec 2018 | | | | | | | | CAD | | | | — | | | | — | | | | — | | | | — | | | | — | | | | — | | | | 500 | | | | 83.45 | | | | — | |
| Swap | Jan 2019 - Dec 2019 | | | | | | | | CAD | | | | — | | | | — | | | | — | | | | — | | | | — | | | | — | | | | 1,050 | | | | 81.41 | | | | — | |
| Collar | Jan 2018 - Dec 2018 | | | | | | | | USD | | | | 500 | | | | 50.00 | | | | 500 | | | | 55.00 | | | | — | | | | — | | | | — | | | | — | | | | — | |
| Swap | Jan 2018 - Dec 2018 | | | | | | | | USD | | | | — | | | | — | | | | — | | | | — | | | | — | | | | — | | | | 1,000 | | | | 54.00 | | | | — | |
| Swap | Apr 2018 - Mar 2019 | | | | | | | | USD | | | | — | | | | — | | | | — | | | | — | | | | — | | | | — | | | | 250 | | | | 54.00 | | | | — | |
| Swaption | Jan 2019 - Dec 2019 | | | | Oct 31, 2018 | | | | USD | | | | — | | | | — | | | | — | | | | — | | | | — | | | | — | | | | 750 | | | | 69.50 | | | | — | |
| | | | | | | | | | | | | | | | | | | | | | | | | | | | | | | | | | | | | | | | | | | | | | | |
| | | | | | | | | | | | | | Bought Put
Volume | | | | Weighted
Average Bought Put | | | | Sold Call
Volume | | | | Weighted
Average Sold Call | | | | Sold Put
Volume | | | | Weighted
Average
Sold Put | | | | Swap
Volume | | | | Weighted
Average Swap | | | | Additional Swap
Volume | |
| North American Gas | Period | | | | Exercise date(1) | | | | Currency | | | | (mmbtu/d) | | | | Price / mmbtu | | | | (mmbtu/d) | | | | Price / mmbtu | | | | (mmbtu/d) | | | | Price / mmbtu | | | | (mmbtu/d) | | | | Price / mmbtu | | | | (mmbtu/d) (2) | |
| AECO | | | | | | | | | | | | | | | | | | | | | | | | | | | | | | | | | | | | | | | | | | | | | | |
| Swap | Jan 2018 - Dec 2018 | | | | | | | | CAD | | | | — | | | | — | | | | — | | | | — | | | | — | | | | — | | | | 9,478 | | | | 2.80 | | | | — | |
| AECO Basis (AECO less NYMEX HH) | | | | | | | | | | | | | | | | | | | | | | | | | | | | | | | | | | | | | | | | | | |
| Swap | Oct 2017 - Dec 2018 | | | | | | | | USD | | | | — | | | | — | | | | — | | | | — | | | | — | | | | — | | | | 10,000 | | | | (1.03 | ) | | | — | |
| Swap | Jan 2018 - Dec 2018 | | | | | | | | USD | | | | — | | | | — | | | | — | | | | — | | | | — | | | | — | | | | 20,000 | | | | (0.95 | ) | | | — | |
| Swap | Jan 2019 - Jun 2020 | | | | | | | | USD | | | | — | | | | — | | | | — | | | | — | | | | — | | | | — | | | | 2,500 | | | | (0.93 | ) | | | — | |
| AECO Basis (AECO less Chicago NGI) | | | | | | | | | | | | | | | | | | | | | | | | | | | | | | | | | | | | | | | | | | |
| Swap | Nov 2018 - Mar 2019 | | | | | | | | USD | | | | — | | | | — | | | | — | | | | — | | | | — | | | | — | | | | 5,000 | | | | (1.46 | ) | | | — | |
| NYMEX HH | | | | | | | | | | | | | | | | | | | | | | | | | | | | | | | | | | | | | | | | | | | | | | |
| 3-Way Collar | Oct 2017 - Dec 2018 | | | | | | | | USD | | | | 10,000 | | | | 3.11 | | | | 10,000 | | | | 3.40 | | | | 10,000 | | | | 2.40 | | | | — | | | | — | | | | — | |
| 3-Way Collar | Jan 2018 - Dec 2018 | | | | | | | | USD | | | | 10,000 | | | | 3.06 | | | | 10,000 | | | | 3.40 | | | | 10,000 | | | | 2.40 | | | | — | | | | — | | | | — | |
| Swap | Apr 2018 - Dec 2018 | | | | | | | | USD | | | | — | | | | — | | | | — | | | | — | | | | — | | | | — | | | | 10,000 | | | | 3.10 | | | | — | |
| (1) The sold swaption instrument allows the counterparty, at the specified date, to enter into a derivative instrument contract with Vermilion at the above detailed terms. |
| (2) On the last business day of each month, the counterparty has the option to increase the contracted volumes for the following month. |
| | | | | | | | | | | | | | | | | | | | | | | | | | | | | | | | | | | | | | | | | | | | | | | | | |
| Vermilion Energy Inc. | Page 46 | 2018 Third Quarter Report |
| | | | | | | | | Bought Put
Volume | | Weighted
Average Bought Put | | Sold Call
Volume | | Weighted
Average Sold Call | | Sold Put
Volume | | Weighted
Average
Sold Put | | Swap
Volume | | Weighted
Average Swap | | Additional Swap
Volume | | |
| European Gas | | Period | | Exercise date(1) | | Currency | | (mmbtu/d) | | Price / mmbtu | | (mmbtu/d) | | Price / mmbtu | | (mmbtu/d) | | Price /mmbtu | | (mmbtu/d) | | Price / mmbtu | | (mmbtu/d) (2) | | |
| NBP | | | | | | | | | | | | | | | | | | | | | | | | | | |
| 3-Way Collar | | | Jan 2019 - Dec 2019 | | | | | | | | EUR | | | | 17,197 | | | | 4.97 | | | | 17,197 | | | | 5.65 | | | | 17,197 | | | | 3.79 | | | | — | | | — | | — | | |
| 3-Way Collar | | | Jan 2019 - Dec 2020 | | | | | | | | EUR | | | | 7,370 | | | | 4.96 | | | | 7,370 | | | | 5.76 | | | | 7,370 | | | | 3.74 | | | | — | | | — | | — | | |
| 3-Way Collar | | | Jan 2020 - Dec 2020 | | | | | | | | EUR | | | | 17,197 | | | | 4.91 | | | | 17,197 | | | | 5.70 | | | | 17,197 | | | | 3.87 | | | | — | | | — | | — | | |
| Collar | | | Oct 2018 - Mar 2019 | | | | | | | | EUR | | | | 3,685 | | | | 6.40 | | | | 2,457 | | | | 7.62 | | | | — | | | | — | | | | — | | | — | | — | | |
| Call | | | Oct 2018 - Mar 2019 | | | | | | | | EUR | | | | — | | | | — | | | | 12,327 | | | | 6.28 | | | | — | | | | — | | | | — | | | — | | — | | |
| Swap | | | Oct 2018 - Mar 2019 | | | | | | | | EUR | | | | — | | | | — | | | | — | | | | — | | | | — | | | | — | | | | 4,913 | | | 7.92 | | — | | |
| Swaption | | | Jul 2019 - Jun 2021 | | | | Jun 28, 2019 | | | | EUR | | | | — | | | | — | | | | — | | | | — | | | | — | | | | — | | | | 9,827 | | | 5.64 | | — | | |
| Swaption | | | Oct 2019 - Mar 2020 | | | | Jun 28, 2019 | | | | EUR | | | | — | | | | — | | | | — | | | | — | | | | — | | | | — | | | | 7,370 | | | 5.86 | | — | | |
| Swaption | | | Oct 2020 - Mar 2021 | | | | Jun 28, 2019 | | | | EUR | | | | — | | | | — | | | | — | | | | — | | | | — | | | | — | | | | 7,370 | | | 5.86 | | — | | |
| Swaption | | | Oct 2021 - Mar 2022 | | | | Jun 28, 2019 | | | | EUR | | | | — | | | | — | | | | — | | | | — | | | | — | | | | — | | | | 7,370 | | | 5.86 | | — | | |
| Collar | | | Jan 2018 - Dec 2018 | | | | | | | | GBP | | | | 2,500 | | | | 3.15 | | | | 2,500 | | | | 3.82 | | | | — | | | | — | | | | — | | | — | | — | | |
| Swap | | | Jan 2018 - Dec 2018 | | | | | | | | GBP | | | | — | | | | — | | | | — | | | | — | | | | — | | | | — | | | | 2,500 | | | 4.04 | | 5,000 | | |
| NBP Basis (NBP less NYMEX HH) | | | | | | | | | | | | | | | | | | | | | | | | | | | | | | | | | | | | | | | | | |
| Collar | | | Jan 2018 - Dec 2018 | | | | | | | | USD | | | | 2,500 | | | | 1.85 | | | | 2,500 | | | | 4.00 | | | | — | | | | — | | | | — | | | — | | — | | |
| Collar | | | Jan 2019 - Sep 2020 | | | | | | | | USD | | | | 7,500 | | | | 2.07 | | | | 7,500 | | | | 4.00 | | | | — | | | | — | | | | — | | | — | | — | | |
| TTF | | | | | | | | | | | | | | | | | | | | | | | | | | | | | | | | | | | | | | | | | | | | | | |
| 3-Way Collar | | | Oct 2017 - Dec 2019 | | | | | | | | EUR | | | | 7,370 | | | | 4.59 | | | | 7,370 | | | | 5.42 | | | | 7,370 | | | | 2.93 | | | | — | | | — | | — | | |
| 3-Way Collar | | | Jan 2018 - Dec 2018 | | | | | | | | EUR | | | | 12,284 | | | | 4.75 | | | | 12,284 | | | | 5.48 | | | | 12,284 | | | | 3.25 | | | | — | | | — | | — | | |
| 3-Way Collar | | | Jan 2018 - Dec 2019 | | | | | | | | EUR | | | | 3,685 | | | | 4.74 | | | | 3,685 | | | | 5.52 | | | | 3,685 | | | | 3.13 | | | | — | | | — | | — | | |
| 3-Way Collar | | | Jan 2019 - Dec 2019 | | | | | | | | EUR | | | | 12,284 | | | | 5.05 | | | | 12,284 | | | | 5.72 | | | | 12,284 | | | | 3.69 | | | | — | | | — | | — | | |
| 3-Way Collar | | | Jan 2020 - Dec 2020 | | | | | | | | EUR | | | | 7,370 | | | | 5.37 | | | | 7,370 | | | | 6.25 | | | | 7,370 | | | | 3.81 | | | | — | | | — | | — | | |
| Collar | | | Jan 2018 - Dec 2018 | | | | | | | | EUR | | | | 4,913 | | | | 4.40 | | | | 4,913 | | | | 5.31 | | | | — | | | | — | | | | — | | | — | | — | | |
| Swap | | | Oct 2017 - Dec 2018 | | | | | | | | EUR | | | | — | | | | — | | | | — | | | | — | | | | — | | | | — | | | | 17,197 | | | 4.80 | | — | | |
| Swap | | | Oct 2017 - Dec 2019 | | | | | | | | EUR | | | | — | | | | — | | | | — | | | | — | | | | — | | | | — | | | | 7,370 | | | 4.87 | | — | | |
| Swap | | | Jan 2018 - Dec 2019 | | | | | | | | EUR | | | | — | | | | — | | | | — | | | | — | | | | — | | | | — | | | | 1,228 | | | 5.00 | | — | | |
| Swap | | | Jul 2018 - Dec 2019 | | | | | | | | EUR | | | | — | | | | — | | | | — | | | | — | | | | — | | | | — | | | | 4,913 | | | 4.98 | | — | | |
| Swap | | | Jan 2019 - Dec 2019 | | | | | | | | EUR | | | | — | | | | — | | | | — | | | | — | | | | — | | | | — | | | | 2,457 | | | 4.92 | | — | | |
| Cross Currency Interest Rate | | | | | | | | Receive Notional Amount (USD) | | | | | | | | Rate (LIBOR +) | | | | | | | | | | Pay Notional Amount (CAD) | | | | | | | Rate (CDOR +) |
| Swap | | | | | | | | | | | Oct 2018 | | | | | | | | 994,814,456 | | | | | | | | 1.70 | % | | | | | | | | | | | | 1,284,900,000 | | | | | | | 1.33 | % |
| (1) | The sold swaption instrument allows the counterparty, at the specified date, to enter into a swap with Vermilion at the above detailed terms. |
| (2) | On the last business day of each month, the counterparty has the option to increase the contracted volumes for the following month. |
| Vermilion Energy Inc. | Page 47 | 2018 Third Quarter Report |
Supplemental Table 3: Capital Expenditures and Acquisitions
By classification ($M) | Q3 2018 | | | Q2 2018 | | | Q3 2017 | | | YTD 2018 | | | YTD 2017 | |
| Drilling and development | 142,116 | | | 76,709 | | | 75,837 | | | 343,483 | | | 228,682 | |
| Exploration and evaluation | 4,069 | | | 3,275 | | | 15,545 | | | 11,151 | | | 17,464 | |
| Capital expenditures | 146,185 | | | 79,984 | | | 91,382 | | | 354,634 | | | 246,146 | |
| | | | | | | | | | |
| Acquisitions | 193,677 | | | 57,590 | | | 20,976 | | | 307,622 | | | 24,589 | |
| Shares issued for acquisition | — | | | 1,235,221 | | | — | | | 1,235,221 | | | — | |
| Long-term debt net of working capital assumed | 4,496 | | | 172,674 | | | — | | | 213,893 | | | — | |
| Acquisitions | 198,173 | | | 1,465,485 | | | 20,976 | | | 1,756,736 | | | 24,589 | |
| | | | | | | | | | |
| By category ($M) | Q3 2018 | | | Q2 2018 | | | Q3 2017 | | | YTD 2018 | | | YTD 2017 | |
| Drilling, completion, new well equip and tie-in, workovers and recompletions | 118,317 | | | 56,154 | | | 62,451 | | | 283,364 | | | 180,135 | |
| Production equipment and facilities | 26,964 | | | 10,224 | | | 16,982 | | | 53,330 | | | 41,520 | |
| Seismic, studies, land and other | 904 | | | 13,606 | | | 11,949 | | | 17,940 | | | 24,491 | |
| Capital expenditures | 146,185 | | | 79,984 | | | 91,382 | | | 354,634 | | | 246,146 | |
| Acquisitions | 198,173 | | | 1,465,485 | | | 20,976 | | | 1,756,736 | | | 24,589 | |
| Total capital expenditures and acquisitions | 344,358 | | | 1,545,469 | | | 112,358 | | | 2,111,370 | | | 270,735 | |
| | | | | | | | | | |
| Capital expenditures by country ($M) | Q3 2018 | | | Q2 2018 | | | Q3 2017 | | | YTD 2018 | | | YTD 2017 | |
| Canada | 89,837 | | | 28,694 | | | 43,746 | | | 187,646 | | | 121,802 | |
| France | 15,779 | | | 17,044 | | | 15,756 | | | 62,750 | | | 53,354 | |
| Netherlands | 5,056 | | | 6,695 | | | 11,590 | | | 15,029 | | | 19,275 | |
| Germany | 6,497 | | | 2,314 | | | 3,020 | | | 11,226 | | | 4,252 | |
| Ireland | (50 | ) | | 87 | | | 1,101 | | | 84 | | | 224 | |
| Australia | 16,061 | | | 11,368 | | | 10,154 | | | 31,878 | | | 22,750 | |
| United States | 11,386 | | | 10,702 | | | 1,362 | | | 37,956 | | | 18,056 | |
| Corporate | 1,619 | | | 3,080 | | | 4,653 | | | 8,065 | | | 6,433 | |
| Total capital expenditures | 146,185 | | | 79,984 | | | 91,382 | | | 354,634 | | | 246,146 | |
| | | | | | | | | | |
| Acquisitions by country ($M) | Q3 2018 | | | Q2 2018 | | | Q3 2017 | | | YTD 2018 | | | YTD 2017 | |
| Canada | 6,146 | | | 1,465,335 | | | 19,712 | | | 1,561,731 | | | 21,223 | |
| Netherlands | 2,874 | | | 139 | | | 14 | | | 5,773 | | | 14 | |
| Germany | 959 | | | — | | | — | | | 959 | | | — | |
| United States | 187,987 | | | 11 | | | 1,250 | | | 188,066 | | | 3,312 | |
| Corporate | 207 | | | — | | | — | | | 207 | | | 40 | |
| Total acquisitions | 198,173 | | | 1,465,485 | | | 20,976 | | | 1,756,736 | | | 24,589 | |
| Vermilion Energy Inc. | Page 48 | 2018 Third Quarter Report |
Supplemental Table 4: Production
| | | Q3/18 | | Q2/18 | | Q1/18 | | Q4/17 | | Q3/17 | | Q2/17 | | Q1/17 | | Q4/16 | | Q3/16 | | Q2/16 | | Q1/16 | | Q4/15 |
| Canada | | | | | | | | | | | | | | | | | | | | | | | | |
| Crude oil & condensate (bbls/d) | | | 28,477 | | | | 17,009 | | | | 9,272 | | | | 9,703 | | | | 9,288 | | | | 9,205 | | | | 7,987 | | | | 7,945 | | | | 8,984 | | | | 9,453 | | | | 10,317 | | | | 10,413 | |
| NGLs (bbls/d) | | | 6,126 | | | | 5,589 | | | | 5,106 | | | | 5,235 | | | | 4,891 | | | | 3,745 | | | | 2,670 | | | | 2,444 | | | | 2,448 | | | | 2,687 | | | | 2,633 | | | | 2,710 | |
| Natural gas (mmcf/d) | | | 136.77 | | | | 127.32 | | | | 106.21 | | | | 107.91 | | | | 103.92 | | | | 93.68 | | | | 85.74 | | | | 75.12 | | | | 77.62 | | | | 87.44 | | | | 97.16 | | | | 87.90 | |
| Total (boe/d) | | | 57,397 | | | | 43,817 | | | | 32,078 | | | | 32,923 | | | | 31,499 | | | | 28,563 | | | | 24,947 | | | | 22,910 | | | | 24,368 | | | | 26,713 | | | | 29,141 | | | | 27,773 | |
| % of consolidated | | | 59 | % | | | 55 | % | | | 46 | % | | | 45 | % | | | 46 | % | | | 43 | % | | | 38 | % | | | 38 | % | | | 37 | % | | | 42 | % | | | 44 | % | | | 45 | % |
| France | | | | | | | | | | | | | | | | | | | | | | | | | | | | | | | | | | | | | | | | | | | | | | | | |
| Crude oil (bbls/d) | | | 11,407 | | | | 11,683 | | | | 11,037 | | | | 11,215 | | | | 10,918 | | | | 11,368 | | | | 10,834 | | | | 11,220 | | | | 11,827 | | | | 12,326 | | | | 12,220 | | | | 12,537 | |
| Natural gas (mmcf/d) | | | — | | | | — | | | | — | | | | — | | | | — | | | | — | | | | 0.01 | | | | 0.38 | | | | 0.42 | | | | 0.54 | | | | 0.44 | | | | 1.36 | |
| Total (boe/d) | | | 11,407 | | | | 11,683 | | | | 11,037 | | | | 11,215 | | | | 10,918 | | | | 11,368 | | | | 10,836 | | | | 11,283 | | | | 11,897 | | | | 12,416 | | | | 12,293 | | | | 12,763 | |
| % of consolidated | | | 12 | % | | | 14 | % | | | 16 | % | | | 15 | % | | | 16 | % | | | 17 | % | | | 17 | % | | | 19 | % | | | 19 | % | | | 19 | % | | | 19 | % | | | 21 | % |
| Netherlands | | | | | | | | | | | | | | | | | | | | | | | | | | | | | | | | | | | | | | | | | | | | | | | | |
| Condensate (bbls/d) | | | 84 | | | | 87 | | | | 77 | | | | 105 | | | | 74 | | | | 104 | | | | 76 | | | | 57 | | | | 86 | | | | 96 | | | | 114 | | | | 110 | |
| Natural gas (mmcf/d) | | | 44.37 | | | | 43.49 | | | | 44.79 | | | | 55.66 | | | | 34.90 | | | | 31.58 | | | | 39.92 | | | | 41.15 | | | | 47.62 | | | | 49.18 | | | | 53.40 | | | | 56.34 | |
| Total (boe/d) | | | 7,479 | | | | 7,335 | | | | 7,541 | | | | 9,381 | | | | 5,890 | | | | 5,368 | | | | 6,729 | | | | 6,915 | | | | 8,023 | | | | 8,293 | | | | 9,015 | | | | 9,500 | |
| % of consolidated | | | 8 | % | | | 9 | % | | | 11 | % | | | 13 | % | | | 9 | % | | | 8 | % | | | 10 | % | | | 11 | % | | | 13 | % | | | 13 | % | | | 14 | % | | | 16 | % |
| Germany | | | | | | | | | | | | | | | | | | | | | | | | | | | | | | | | | | | | | | | | | | | | | | | | |
| Crude oil (bbls/d) | | | 1,019 | | | | 1,008 | | | | 1,078 | | | | 1,148 | | | | 1,054 | | | | 1,047 | | | | 989 | | | | — | | | | — | | | | — | | | | — | | | | — | |
| Natural gas (mmcf/d) | | | 14.88 | | | | 14.63 | | | | 16.19 | | | | 18.19 | | | | 20.12 | | | | 19.86 | | | | 19.39 | | | | 14.80 | | | | 14.52 | | | | 14.31 | | | | 15.96 | | | | 16.17 | |
| Total (boe/d) | | | 3,498 | | | | 3,447 | | | | 3,777 | | | | 4,180 | | | | 4,407 | | | | 4,357 | | | | 4,220 | | | | 2,467 | | | | 2,420 | | | | 2,385 | | | | 2,660 | | | | 2,695 | |
| % of consolidated | | | 4 | % | | | 4 | % | | | 5 | % | | | 6 | % | | | 7 | % | | | 6 | % | | | 7 | % | | | 4 | % | | | 4 | % | | | 4 | % | | | 4 | % | | | 4 | % |
| Ireland | | | | | | | | | | | | | | | | | | | | | | | | | | | | | | | | | | | | | | | | | | | | | | | | |
| Natural gas (mmcf/d) | | | 51.38 | | | | 56.56 | | | | 60.87 | | | | 56.23 | | | | 49.04 | | | | 63.81 | | | | 64.82 | | | | 62.92 | | | | 59.28 | | | | 47.26 | | | | 33.90 | | | | 0.12 | |
| Total (boe/d) | | | 8,563 | | | | 9,426 | | | | 10,144 | | | | 9,372 | | | | 8,173 | | | | 10,634 | | | | 10,803 | | | | 10,486 | | | | 9,879 | | | | 7,877 | | | | 5,650 | | | | 20 | |
| % of consolidated | | | 9 | % | | | 12 | % | | | 14 | % | | | 13 | % | | | 12 | % | | | 16 | % | | | 17 | % | | | 17 | % | | | 16 | % | | | 12 | % | | | 9 | % | | | — | |
| Australia | | | | | | | | | | | | | | | | | | | | | | | | | | | | | | | | | | | | | | | | | | | | | | | | |
| Crude oil (bbls/d) | | | 4,704 | | | | 4,132 | | | | 4,971 | | | | 4,993 | | | | 5,473 | | | | 6,054 | | | | 6,581 | | | | 6,388 | | | | 6,562 | | | | 6,083 | | | | 6,180 | | | | 7,824 | |
| % of consolidated | | | 5 | % | | | 5 | % | | | 7 | % | | | 7 | % | | | 8 | % | | | 9 | % | | | 10 | % | | | 10 | % | | | 10 | % | | | 9 | % | | | 9 | % | | | 13 | % |
| United States | | | | | | | | | | | | | | | | | | | | | | | | | | | | | | | | | | | | | | | | | | | | | | | | |
| Crude oil (bbls/d) | | | 1,461 | | | | 655 | | | | 574 | | | | 667 | | | | 880 | | | | 747 | | | | 365 | | | | 362 | | | | 383 | | | | 458 | | | | 368 | | | | 420 | |
| NGLs (bbls/d) | | | 714 | | | | 62 | | | | 20 | | | | 43 | | | | 56 | | | | 76 | | | | 24 | | | | 23 | | | | 30 | | | | 26 | | | | 39 | | | | 29 | |
| Natural gas (mmcf/d) | | | 4.82 | | | | 0.40 | | | | 0.15 | | | | 0.29 | | | | 0.64 | | | | 0.44 | | | | 0.20 | | | | 0.18 | | | | 0.20 | | | | 0.20 | | | | 0.26 | | | | 0.20 | |
| Total (boe/d) | | | 2,979 | | | | 784 | | | | 618 | | | | 758 | | | | 1,043 | | | | 896 | | | | 422 | | | | 414 | | | | 447 | | | | 518 | | | | 450 | | | | 483 | |
| % of consolidated | | | 3 | % | | | 1 | % | | | 1 | % | | | 1 | % | | | 2 | % | | | 1 | % | | | 1 | % | | | 1 | % | | | 1 | % | | | 1 | % | | | 1 | % | | | 1 | % |
| Corporate | | | | | | | | | | | | | | | | | | | | | | | | | | | | | | | | | | | | | | | | | | | | | | | | |
| Natural gas (mmcf/d) | | | 1.17 | | | | — | | | | — | | | | — | | | | — | | | | — | | | | — | | | | — | | | | — | | | | — | | | | — | | | | — | |
| Total (boe/d) | | | 195 | | | | — | | | | — | | | | — | | | | — | | | | — | | | | — | | | | — | | | | — | | | | — | | | | — | | | | — | |
| % of consolidated | | | — | | | | — | | | | — | | | | — | | | | — | | | | — | | | | — | | | | — | | | | — | | | | — | | | | — | | | | — | |
| Consolidated | | | | | | | | | | | | | | | | | | | | | | | | | | | | | | | | | | | | | | | | | | | | | | | | |
| Liquids (bbls/d) | | | 53,991 | | | | 40,225 | | | | 32,134 | | | | 33,109 | | | | 32,634 | | | | 32,346 | | | | 29,526 | | | | 28,439 | | | | 30,320 | | | | 31,129 | | | | 31,871 | | | | 34,043 | |
| % of consolidated | | | 56 | % | | | 50 | % | | | 46 | % | | | 45 | % | | | 48 | % | | | 48 | % | | | 46 | % | | | 47 | % | | | 48 | % | | | 48 | % | | | 49 | % | | | 56 | % |
| Natural gas (mmcf/d) | | | 253.38 | | | | 242.40 | | | | 228.20 | | | | 238.28 | | | | 208.62 | | | | 209.36 | | | | 210.07 | | | | 194.54 | | | | 199.65 | | | | 198.93 | | | | 201.11 | | | | 162.09 | |
| % of consolidated | | | 44 | % | | | 50 | % | | | 54 | % | | | 55 | % | | | 52 | % | | | 52 | % | | | 54 | % | | | 53 | % | | | 52 | % | | | 52 | % | | | 51 | % | | | 44 | % |
| Total (boe/d) | | | 96,222 | | | | 80,625 | | | | 70,167 | | | | 72,821 | | | | 67,403 | | | | 67,240 | | | | 64,537 | | | | 60,863 | | | | 63,596 | | | | 64,285 | | | | 65,389 | | | | 61,058 | |
| Vermilion Energy Inc. | Page 49 | 2018 Third Quarter Report |
| | | YTD 2018 | | 2017 | | 2016 | | 2015 | | 2014 | | 2013 |
| Canada | | | | | | | | | | | | |
| Crude oil & condensate (bbls/d) | | | 18,323 | | | | 9,051 | | | | 9,171 | | | | 11,357 | | | | 12,491 | | | | 8,387 | |
| NGLs (bbls/d) | | | 5,611 | | | | 4,144 | | | | 2,552 | | | | 2,301 | | | | 1,233 | | | | 1,666 | |
| Natural gas (mmcf/d) | | | 123.54 | | | | 97.89 | | | | 84.29 | | | | 71.65 | | | | 55.67 | | | | 42.39 | |
| Total (boe/d) | | | 44,524 | | | | 29,510 | | | | 25,771 | | | | 25,598 | | | | 23,001 | | | | 17,117 | |
| % of consolidated | | | 54 | % | | | 45 | % | | | 40 | % | | | 46 | % | | | 47 | % | | | 41 | % |
| France | | | | | | | | | | | | | | | | | | | | | | | | |
| Crude oil (bbls/d) | | | 11,377 | | | | 11,084 | | | | 11,896 | | | | 12,267 | | | | 11,011 | | | | 10,873 | |
| Natural gas (mmcf/d) | | | — | | | | — | | | | 0.44 | | | | 0.97 | | | | — | | | | 3.40 | |
| Total (boe/d) | | | 11,377 | | | | 11,085 | | | | 11,970 | | | | 12,429 | | | | 11,011 | | | | 11,440 | |
| % of consolidated | | | 14 | % | | | 16 | % | | | 19 | % | | | 23 | % | | | 22 | % | | | 28 | % |
| Netherlands | | | | | | | | | | | | | | | | | | | | | | | | |
| Condensate (bbls/d) | | | 83 | | | | 90 | | | | 88 | | | | 99 | | | | 77 | | | | 64 | |
| Natural gas (mmcf/d) | | | 44.21 | | | | 40.54 | | | | 47.82 | | | | 44.76 | | | | 38.20 | | | | 35.42 | |
| Total (boe/d) | | | 7,452 | | | | 6,847 | | | | 8,058 | | | | 7,559 | | | | 6,443 | | | | 5,967 | |
| % of consolidated | | | 9 | % | | | 10 | % | | | 13 | % | | | 14 | % | | | 13 | % | | | 15 | % |
| Germany | | | | | | | | | | | | | | | | | | | | | | | | |
| Crude oil (bbls/d) | | | 1,035 | | | | 1,060 | | | | — | | | | — | | | | — | | | | — | |
| Natural gas (mmcf/d) | | | 15.23 | | | | 19.39 | | | | 14.90 | | | | 15.78 | | | | 14.99 | | | | — | |
| Total (boe/d) | | | 3,573 | | | | 4,291 | | | | 2,483 | | | | 2,630 | | | | 2,498 | | | | — | |
| % of consolidated | | | 4 | % | | | 6 | % | | | 4 | % | | | 5 | % | | | 5 | % | | | — | |
| Ireland | | | | | | | | | | | | | | | | | | | | | | | | |
| Natural gas (mmcf/d) | | | 56.23 | | | | 58.43 | | | | 50.89 | | | | 0.03 | | | | — | | | | — | |
| Total (boe/d) | | | 9,372 | | | | 9,737 | | | | 8,482 | | | | 5 | | | | — | | | | — | |
| % of consolidated | | | 11 | % | | | 14 | % | | | 13 | % | | | — | | | | — | | | | — | |
| Australia | | | | | | | | | | | | | | | | | | | | | | | | |
| Crude oil (bbls/d) | | | 4,601 | | | | 5,770 | | | | 6,304 | | | | 6,454 | | | | 6,571 | | | | 6,481 | |
| % of consolidated | | | 6 | % | | | 8 | % | | | 10 | % | | | 12 | % | | | 13 | % | | | 16 | % |
| United States | | | | | | | | | | | | | | | | | | | | | | | | |
| Crude oil (bbls/d) | | | 900 | | | | 666 | | | | 393 | | | | 231 | | | | 49 | | | | — | |
| NGLs (bbls/d) | | | 268 | | | | 50 | | | | 29 | | | | 7 | | | | — | | | | — | |
| Natural gas (mmcf/d) | | | 1.81 | | | | 0.39 | | | | 0.21 | | | | 0.05 | | | | — | | | | — | |
| Total (boe/d) | | | 1,469 | | | | 781 | | | | 457 | | | | 247 | | | | 49 | | | | — | |
| % of consolidated | | | 2 | % | | | 1 | % | | | 1 | % | | | — | | | | — | | | | — | |
| Corporate | | | | | | | | | | | | | | | | | | | | | | | | |
| Natural gas (mmcf/d) | | | 0.39 | | | | — | | | | — | | | | — | | | | — | | | | — | |
| Total (boe/d) | | | 66 | | | | — | | | | — | | | | — | | | | — | | | | — | |
| % of consolidated | | | — | | | | — | | | | — | | | | — | | | | — | | | | — | |
| Consolidated | | | | | | | | | | | | | | | | | | | | | | | | |
| Liquids (bbls/d) | | | 42,196 | | | | 31,915 | | | | 30,433 | | | | 32,716 | | | | 31,432 | | | | 27,471 | |
| % of consolidated | | | 51 | % | | | 47 | % | | | 48 | % | | | 60 | % | | | 63 | % | | | 67 | % |
| Natural gas (mmcf/d) | | | 241.42 | | | | 216.64 | | | | 198.55 | | | | 133.24 | | | | 108.85 | | | | 81.21 | |
| % of consolidated | | | 49 | % | | | 53 | % | | | 52 | % | | | 40 | % | | | 37 | % | | | 33 | % |
| Total (boe/d) | | | 82,433 | | | | 68,021 | | | | 63,526 | | | | 54,922 | | | | 49,573 | | | | 41,005 | |
| Vermilion Energy Inc. | Page 50 | 2018 Third Quarter Report |
Supplemental Table 5: Q1 and Q2 2018 Netbacks Adjusted for IFRS 16
The following table includes financial statement information on a per unit basis by business unit for Q1 and Q2 2018 after adjusting for the impact of the application of IFRS 16. Please refer to "Recently Adopted Accounting Pronouncements" for further information. Liquids includes crude oil, condensate, and NGLs. Natural gas sales volumes have been converted on a basis of six thousand cubic feet of natural gas to one barrel of oil equivalent.
| | | Q1 2018 | | Q2 2018 |
| | | Liquids | | Natural Gas | | Total | | Liquids | | Natural Gas | | Total |
| | | $/bbl | | $/mcf | | $/boe | | $/bbl | | $/mcf | | $/boe |
| Canada | | | | | | | | | | | | |
| Sales | | | 57.39 | | | | 1.95 | | | | 32.19 | | | | 66.27 | | | | 1.09 | | | | 37.35 | |
| Royalties | | | (7.34 | ) | | | (0.04 | ) | | | (3.41 | ) | | | (8.86 | ) | | | 0.24 | | | | (3.88 | ) |
| Transportation | | | (2.38 | ) | | | (0.15 | ) | | | (1.57 | ) | | | (1.65 | ) | | | (0.16 | ) | | | (1.30 | ) |
| Operating | | | (8.94 | ) | | | (1.31 | ) | | | (8.35 | ) | | | (11.13 | ) | | | (1.11 | ) | | | (8.97 | ) |
| Operating netback | | | 38.73 | | | | 0.45 | | | | 18.86 | | | | 44.63 | | | | 0.06 | | | | 23.20 | |
| General and administration | | | | | | | | | | | (0.24 | ) | | | | | | | | | | | (0.47 | ) |
| Fund flows from operations netback | | | | | | | | | | | 18.62 | | | | | | | | | | | | 22.73 | |
| France | | | | | | | | | | | | | | | | | | | | | | | | |
| Sales | | | 81.70 | | | | — | | | | 81.70 | | | | 95.13 | | | | — | | | | 95.13 | |
| Royalties | | | (10.60 | ) | | | — | | | | (10.60 | ) | | | (11.85 | ) | | | — | | | | (11.85 | ) |
| Transportation | | | (2.65 | ) | | | — | | | | (2.65 | ) | | | (2.65 | ) | | | — | | | | (2.65 | ) |
| Operating | | | (14.66 | ) | | | — | | | | (14.66 | ) | | | (13.07 | ) | | | — | | | | (13.07 | ) |
| Operating netback | | | 53.79 | | | | — | | | | 53.79 | | | | 67.56 | | | | — | | | | 67.56 | |
| General and administration | | | | | | | | | | | (3.95 | ) | | | | | | | | | | | (3.29 | ) |
| Current income taxes | | | | | | | | | | | (2.31 | ) | | | | | | | | | | | (4.92 | ) |
| Fund flows from operations netback | | | | | | | | | | | 47.53 | | | | | | | | | | | | 59.35 | |
| Netherlands | | | | | | | | | | | | | | | | | | | | | | | | |
| Sales | | | 68.64 | | | | 8.86 | | | | 53.31 | | | | 79.40 | | | | 8.68 | | | | 52.43 | |
| Royalties | | | — | | | | (0.21 | ) | | | (1.25 | ) | | | — | | | | (0.19 | ) | | | (1.12 | ) |
| Operating | | | — | | | | (1.91 | ) | | | (11.32 | ) | | | — | | | | (1.62 | ) | | | (9.62 | ) |
| Operating netback | | | 68.64 | | | | 6.74 | | | | 40.74 | | | | 79.40 | | | | 6.87 | | | | 41.69 | |
| General and administration | | | | | | | | | | | (1.14 | ) | | | | | | | | | | | (0.22 | ) |
| Current income taxes | | | | | | | | | | | (8.55 | ) | | | | | | | | | | | (7.48 | ) |
| Fund flows from operations netback | | | | | | | | | | | 31.05 | | | | | | | | | | | | 33.99 | |
| Germany | | | | | | | | | | | | | | | | | | | | | | | | |
| Sales | | | 79.04 | | | | 7.69 | | | | 56.86 | | | | 91.00 | | | | 7.68 | | | | 59.69 | |
| Royalties | | | (2.53 | ) | | | (0.99 | ) | | | (4.82 | ) | | | (2.22 | ) | | | (0.78 | ) | | | (3.93 | ) |
| Transportation | | | (9.80 | ) | | | (0.58 | ) | | | (5.54 | ) | | | (10.17 | ) | | | (0.60 | ) | | | (5.59 | ) |
| Operating | | | (22.08 | ) | | | (2.46 | ) | | | (17.16 | ) | | | (22.36 | ) | | | (2.43 | ) | | | (16.92 | ) |
| Operating netback | | | 44.63 | | | | 3.66 | | | | 29.34 | | | | 56.25 | | | | 3.87 | | | | 33.25 | |
| General and administration | | | | | | | | | | | (4.32 | ) | | | | | | | | | | | (4.59 | ) |
| Fund flows from operations netback | | | | | | | | | | | 25.02 | | | | | | | | | | | | 28.66 | |
| Ireland | | | | | | | | | | | | | | | | | | | | | | | | |
| Sales | | | — | | | | 9.80 | | | | 58.79 | | | | — | | | | 9.30 | | | | 55.80 | |
| Transportation | | | — | | | | (0.23 | ) | | | (1.41 | ) | | | — | | | | (0.25 | ) | | | (1.48 | ) |
| Operating | | | — | | | | (0.59 | ) | | | (3.51 | ) | | | — | | | | (0.84 | ) | | | (5.02 | ) |
| Operating netback | | | — | | | | 8.98 | | | | 53.87 | | | | — | | | | 8.21 | | | | 49.30 | |
| General and administration | | | | | | | | | | | (1.43 | ) | | | | | | | | | | | (1.68 | ) |
| Fund flows from operations netback | | | | | | | | | | | 52.44 | | | | | | | | | | | | 47.62 | |
| Vermilion Energy Inc. | Page 51 | 2018 Third Quarter Report |
| | | Q1 2018 | | Q2 2018 |
| | | Liquids | | Natural Gas | | Total | | Liquids | | Natural Gas | | Total |
| | | $/bbl | | $/mcf | | $/boe | | $/bbl | | $/mcf | | $/boe |
| Australia | | | | | | | | | | | | |
| Sales | | | 86.94 | | | | — | | | | 86.94 | | | | 98.61 | | | | — | | | | 98.61 | |
| Operating | | | (29.72 | ) | | | — | | | | (29.72 | ) | | | (33.81 | ) | | | — | | | | (33.81 | ) |
| PRRT(1) | | | (11.04 | ) | | | — | | | | (11.04 | ) | | | (7.00 | ) | | | — | | | | (7.00 | ) |
| Operating netback | | | 46.18 | | | | — | | | | 46.18 | | | | 57.80 | | | | — | | | | 57.80 | |
| General and administration | | | | | | | | | | | (3.47 | ) | | | | | | | | | | | (2.59 | ) |
| Corporate income taxes | | | | | | | | | | | (1.53 | ) | | | | | | | | | | | (6.21 | ) |
| Fund flows from operations netback | | | | | | | | | | | 41.18 | | | | | | | | | | | | 49.00 | |
| United States | | | | | | | | | | | | | | | | | | | | | | | | |
| Sales | | | 75.20 | | | | 3.00 | | | | 72.94 | | | | 79.24 | | | | 1.59 | | | | 73.30 | |
| Royalties | | | (20.72 | ) | | | (1.08 | ) | | | (20.16 | ) | | | (21.92 | ) | | | (0.57 | ) | | | (20.35 | ) |
| Transportation | | | — | | | | — | | | | — | | | | — | | | | — | | | | — | |
| Operating | | | (10.60 | ) | | | — | | | | (10.18 | ) | | | (5.73 | ) | | | — | | | | (5.24 | ) |
| Operating netback | | | 43.88 | | | | 1.92 | | | | 42.60 | | | | 51.59 | | | | 1.02 | | | | 47.71 | |
| General and administration | | | | | | | | | | | (21.13 | ) | | | | | | | | | | | (18.74 | ) |
| Fund flows from operations netback | | | | | | | | | | | 21.47 | | | | | | | | | | | | 28.97 | |
| Total Company | | | | | | | | | | | | | | | | | | | | | | | | |
| Sales | | | 71.03 | | | | 5.81 | | | | 51.13 | | | | 78.89 | | | | 4.77 | | | | 53.72 | |
| Realized hedging loss | | | (3.24 | ) | | | (0.42 | ) | | | (2.85 | ) | | | (6.08 | ) | | | (0.25 | ) | | | (3.79 | ) |
| Royalties | | | (7.26 | ) | | | (0.13 | ) | | | (3.69 | ) | | | (8.85 | ) | | | 0.04 | | | | (4.29 | ) |
| Transportation | | | (2.35 | ) | | | (0.17 | ) | | | (1.64 | ) | | | (1.96 | ) | | | (0.18 | ) | | | (1.50 | ) |
| Operating | | | (14.57 | ) | | | (1.32 | ) | | | (10.90 | ) | | | (14.21 | ) | | | (1.22 | ) | | | (10.75 | ) |
| PRRT(1) | | | (1.73 | ) | | | — | | | | (0.78 | ) | | | (0.72 | ) | | | — | | | | (0.36 | ) |
| Operating netback | | | 41.88 | | | | 3.77 | | | | 31.27 | | | | 47.07 | | | | 3.16 | | | | 33.03 | |
| General and administration | | | | | | | | | | | (1.88 | ) | | | | | | | | | | | (1.93 | ) |
| Interest expense | | | | | | | | | | | (2.50 | ) | | | | | | | | | | | (2.26 | ) |
| Realized foreign exchange gain (loss) | | | | | | | | | | | 0.25 | | | | | | | | | | | | (0.56 | ) |
| Other income | | | | | | | | | | | 0.03 | | | | | | | | | | | | 0.03 | |
| Corporate income taxes | | | | | | | | | | | (1.40 | ) | | | | | | | | | | | (1.73 | ) |
| Fund flows from operations netback | | | | | | | | | | | 25.77 | | | | | | | | | | | | 26.58 | |
(1) Vermilion considers Australian PRRT to be an operating item and, accordingly, has included PRRT in the calculation of operating netbacks. Current income taxes presented above excludes PRRT.
Non-GAAP Financial Measures
This MD&A includes references to certain financial measures which do not have standardized meanings and may not be comparable to similar measures presented by other issuers. These financial measures include fund flows from operations, a measure of profit or loss in accordance with IFRS 8 “Operating Segments” (please see Segmented Information in the Notes to the Condensed Consolidated Financial Statements) and net debt, a measure of capital in accordance with IAS 1 “Presentation of Financial Statements” (please see Capital Disclosures in the Notes to the Condensed Consolidated Financial Statements).
In addition, this MD&A includes financial measures which are not specified, defined, or determined under IFRS and are therefore considered non-GAAP financial measures and may not be comparable to similar measures presented by other issuers. These non-GAAP financial measures include:
Acquisitions:The sum of acquisitions from the Consolidated Statement of Cash Flows plus the assumption of the acquiree's outstanding long-term debt plus or net of acquired working capital deficit or surplus.
Capital expenditures:The sum of drilling and development and exploration and evaluation from the Consolidated Statement of Cash Flows. We consider capital expenditures to be a useful measure of our investment in our existing asset base. Capital expenditures are also referred to as E&D capital.
Cash dividends per share:Represents cash dividends declared per share and is a useful measure of the dividends a common shareholder was entitled to during the period.
| Vermilion Energy Inc. | Page 52 | 2018 Third Quarter Report |
Covenants:The financial covenants on our revolving credit facility contain non-GAAP measures. The definitions for these financial covenants are included in Financial Position Review.
Diluted shares outstanding:The sum of shares outstanding at the period end plus outstanding awards under the VIP, based on current estimates of future performance factors and forfeiture rates.
Free cash flow:Represents fund flows from operations in excess of capital expenditures. We use free cash flow to determine the funding available for investing and financing activities, including payment of dividends, repayment of long-term debt, reallocation to existing business units, and deployment into new ventures. We also assess free cash flow as a percentage of fund flows from operations, which is a measure of the percentage of fund flows from operations that is retained for incremental investing and financing activities.
Fund flows from operations per basic and diluted share:Management assesses fund flows from operations on a per share basis as we believe this provides a measure of our operating performance after taking into account the issuance and potential future issuance of Vermilion common shares. Fund flows from operations per basic share is calculated by dividing fund flows from operations by the basic weighted average shares outstanding as defined under IFRS. Fund flows from operations per diluted share is calculated by dividing fund flows from operations by the sum of basic weighted average shares outstanding and incremental shares issuable under the VIP as determined using the treasury stock method.
Net dividends:We define net dividends as dividends declared less proceeds received for the issuance of shares pursuant to the Dividend Reinvestment Plan. Management monitors net dividends and net dividends as a percentage of fund flows from operations to assess our ability to pay dividends.
Operating netback:Sales less royalties, operating expense, transportation costs, PRRT, and realized hedging gains and losses presented on a per unit basis. Management assesses operating netback as a measure of the profitability and efficiency of our field operations. In contrast, fund flows from operations netback also includes general and administration expense, corporate income taxes and interest. Fund flows from operations netback is used by management to assess the profitability of our business units and Vermilion as a whole.
Payout:We define payout as net dividends plus drilling and development costs, exploration and evaluation costs and asset retirement obligations settled. Management uses payout and payout as a percentage of fund flows from operations (also referred to as thesustainability ratio) to assess the amount of cash distributed back to shareholders and re-invested in the business for maintaining production and organic growth.
The following tables reconcile net dividends, payout, and diluted shares outstanding from their most directly comparable GAAP measures as presented in our financial statements:
| ($M) | Q3 2018 | | | Q2 2018 | | | Q3 2017 | | | | YTD 2018 | | | YTD 2017 | |
| Dividends declared | 105,192 | | | 98,604 | | | 78,293 | | | | 282,801 | | | 232,744 | |
| Shares issued for the Dividend Reinvestment Plan | (4,320 | ) | | (19,975 | ) | | (23,929 | ) | | | (43,936 | ) | | (88,676 | ) |
| Net dividends | 100,872 | | | 78,629 | | | 54,364 | | | | 238,865 | | | 144,068 | |
| Drilling and development | 142,116 | | | 76,709 | | | 75,837 | | | | 343,483 | | | 228,682 | |
| Exploration and evaluation | 4,069 | | | 3,275 | | | 15,545 | | | | 11,151 | | | 17,464 | |
| Asset retirement obligations settled | 2,986 | | | 2,626 | | | 1,749 | | | | 9,203 | | | 6,118 | |
| Payout | 250,043 | | | 161,239 | | | 147,495 | | | | 602,702 | | | 396,332 | |
| % of fund flows from operations | 96 | % | | 83 | % | | 113 | % | | | 98 | % | | 94 | % |
| ('000s of shares) | Q3 2018 | | | Q2 2018 | | | Q3 2017 | |
| Shares outstanding | 152,497 | | | 152,363 | | | 121,585 | |
| Potential shares issuable pursuant to the VIP | 3,250 | | | 2,992 | | | 2,868 | |
| Diluted shares outstanding | 155,747 | | | 155,355 | | | 124,453 | |
| Vermilion Energy Inc. | Page 53 | 2018 Third Quarter Report |
Consolidated Interim Financial Statements
Consolidated Balance Sheet
thousands of Canadian dollars, unaudited
| | Note | | September 30, 2018 | | | December 31, 2017 | |
| Assets | | | | | |
| Current | | | | | |
| Cash and cash equivalents | | | 23,994 | | | 46,561 | |
| Accounts receivable | | | 247,596 | | | 165,760 | |
| Crude oil inventory | | | 27,751 | | | 17,105 | |
| Derivative instruments | | | 4,910 | | | 17,988 | |
| Prepaid expenses | | | 20,445 | | | 14,432 | |
| Total current assets | | | 324,696 | | | 261,846 | |
| | | | | | |
| Derivative instruments | | | 458 | | | 2,552 | |
| Deferred taxes | | | 257,743 | | | 80,324 | |
| Exploration and evaluation assets | 6 | | 298,510 | | | 292,278 | |
| Capital assets | 5 | | 5,037,223 | | | 3,337,965 | |
| Total assets | | | 5,918,630 | | | 3,974,965 | |
| | | | | | |
| Liabilities | | | | | |
| Current | | | | | |
| Accounts payable and accrued liabilities | | | 387,366 | | | 219,084 | |
| Dividends payable | 10 | | 35,074 | | | 26,256 | |
| Derivative instruments | | | 165,970 | | | 78,905 | |
| Income taxes payable | | | 41,483 | | | 39,061 | |
| Total current liabilities | | | 629,893 | | | 363,306 | |
| | | | | | |
| Derivative instruments | | | 74,155 | | | 12,348 | |
| Long-term debt | 9 | | 1,728,889 | | | 1,270,330 | |
| Lease obligations | 8 | | 110,719 | | | 15,807 | |
| Asset retirement obligations | 7 | | 598,083 | | | 517,180 | |
| Deferred taxes | | | 251,133 | | | 253,108 | |
| Total liabilities | | | 3,392,872 | | | 2,432,079 | |
| | | | | | |
| Shareholders' equity | | | | | |
| Shareholders’ capital | 10 | | 4,001,774 | | | 2,650,706 | |
| Contributed surplus | | | 63,438 | | | 84,354 | |
| Accumulated other comprehensive income | | | 66,846 | | | 71,829 | |
| Deficit | | | (1,606,300 | ) | | (1,264,003 | ) |
| Total shareholders' equity | | | 2,525,758 | | | 1,542,886 | |
| Total liabilities and shareholders' equity | | | 5,918,630 | | | 3,974,965 | |
Approved by the Board
| (Signed “Catherine L. Williams”) | | (Signed “Anthony Marino”) |
| | | |
| Catherine L. Williams, Director | | Anthony Marino, Director |
| Vermilion Energy Inc. | Page 54 | 2018 Third Quarter Report |
Consolidated Statements of Net (Loss) Earnings and Comprehensive (Loss) Income
thousands of Canadian dollars, except share and per share amounts, unaudited
| | | | Three Months Ended | | Nine Months Ended |
| | Note | | Sep 30, 2018 | | | Sep 30, 2017 | | | Sep 30, 2018 | | | Sep 30, 2017 | |
| Revenue | | | | | | | | | |
| Petroleum and natural gas sales | | | 508,411 | | | 248,505 | | | 1,221,178 | | | 781,497 | |
| Royalties | | | (53,786 | ) | | (16,994 | ) | | (108,293 | ) | | (50,935 | ) |
| Petroleum and natural gas revenue | | | 454,625 | | | 231,511 | | | 1,112,885 | | | 730,562 | |
| | | | | | | | | | |
| Expenses | | | | | | | | | |
| Operating | | | 97,758 | | | 61,832 | | | 244,544 | | | 177,027 | |
| Transportation | | | 13,721 | | | 10,800 | | | 34,949 | | | 31,462 | |
| Equity based compensation | | | 13,056 | | | 12,858 | | | 43,767 | | | 45,492 | |
| Loss (gain) on derivative instruments | | | 113,194 | | | 15,475 | | | 246,709 | | | (91,164 | ) |
| Interest expense | | | 19,772 | | | 13,400 | | | 51,932 | | | 43,603 | |
| General and administration | | | 13,234 | | | 12,114 | | | 39,115 | | | 38,432 | |
| Foreign exchange loss (gain) | | | 26,144 | | | 7,126 | | | 32,528 | | | (30,499 | ) |
| Other expense (income) | | | 26 | | | (14 | ) | | (11 | ) | | (68 | ) |
| Accretion | 7 | | 8,041 | | | 6,850 | | | 23,014 | | | 19,980 | |
| Depletion and depreciation | 5, 6 | | 166,343 | | | 120,826 | | | 434,621 | | | 362,504 | |
| | | | 471,289 | | | 261,267 | | | 1,151,168 | | | 596,769 | |
| (Loss) earnings before income taxes | | | (16,664 | ) | | (29,756 | ) | | (38,283 | ) | | 133,793 | |
| | | | | | | | | | |
| Taxes | | | | | | | | | |
| Deferred | | | (10,712 | ) | | 1,998 | | | (24,613 | ) | | 49,315 | |
| Current | | | 9,147 | | | 7,437 | | | 38,053 | | | 30,865 | |
| | | | (1,565 | ) | | 9,435 | | | 13,440 | | | 80,180 | |
| | | | | | | | | | |
| Net (loss) earnings | | | (15,099 | ) | | (39,191 | ) | | (51,723 | ) | | 53,613 | |
| | | | | | | | | | |
| Other comprehensive (loss) income | | | | | | | | | |
| Currency translation adjustments | | | (20,592 | ) | | (5,407 | ) | | (4,983 | ) | | 28,128 | |
| Comprehensive (loss) income | | | (35,691 | ) | | (44,598 | ) | | (56,706 | ) | | 81,741 | |
| | | | | | | | | | |
| Net (loss) earnings per share | | | | | | | | | |
| Basic | | | (0.10 | ) | | (0.32 | ) | | (0.38 | ) | | 0.45 | |
| Diluted | | | (0.10 | ) | | (0.32 | ) | | (0.38 | ) | | 0.44 | |
| | | | | | | | | | |
| Weighted average shares outstanding ('000s) | | | | | | | | | |
| Basic | | | 152,432 | | | 121,280 | | | 136,585 | | | 120,152 | |
| Diluted | | | 152,432 | | | 121,280 | | | 136,585 | | | 121,963 | |
| Vermilion Energy Inc. | Page 55 | 2018 Third Quarter Report |
Consolidated Statements of Cash Flows
thousands of Canadian dollars, unaudited
| | | | Three Months Ended | | Nine Months Ended |
| | Note | | Sep 30, 2018 | | Sep 30, 2017 | | Sep 30, 2018 | | Sep 30, 2017 |
| Operating | | | | | | | | | |
| Net (loss) earnings | | | (15,099 | ) | | (39,191 | ) | | (51,723 | ) | | 53,613 | |
| Adjustments: | | | | | | | | | |
| Accretion | 7 | | 8,041 | | | 6,850 | | | 23,014 | | | 19,980 | |
| Depletion and depreciation | 5, 6 | | 166,343 | | | 120,826 | | | 434,621 | | | 362,504 | |
| Unrealized loss (gain) on derivative instruments | | | 75,829 | | | 24,198 | | | 163,770 | | | (78,950 | ) |
| Equity based compensation | | | 13,056 | | | 12,858 | | | 43,767 | | | 45,492 | |
| Unrealized foreign exchange loss (gain) | | | 23,044 | | | 3,016 | | | 26,877 | | | (31,082 | ) |
| Unrealized other expense | | | 203 | | | 200 | | | 597 | | | 440 | |
| Deferred taxes | | | (10,712 | ) | | 1,998 | | | (24,613 | ) | | 49,315 | |
| Asset retirement obligations settled | 7 | | (2,986 | ) | | (1,749 | ) | | (9,203 | ) | | (6,118 | ) |
| Changes in non-cash operating working capital | | | 52,325 | | | 12,574 | | | 29,570 | | | 27,961 | |
| Cash flows from operating activities | | | 310,044 | | | 141,580 | | | 636,677 | | | 443,155 | |
| | | | | | | | | | |
| Investing | | | | | | | | | |
| Drilling and development | 5 | | (142,116 | ) | | (75,837 | ) | | (343,483 | ) | | (228,682 | ) |
| Exploration and evaluation | 6 | | (4,069 | ) | | (15,545 | ) | | (11,151 | ) | | (17,464 | ) |
| Acquisitions | 4, 5 | | (193,677 | ) | | (20,976 | ) | | (307,622 | ) | | (24,589 | ) |
| Changes in non-cash investing working capital | | | 8,122 | | | 11,341 | | | 9,158 | | | 6,496 | |
| Cash flows used in investing activities | | | (331,740 | ) | | (101,017 | ) | | (653,098 | ) | | (264,239 | ) |
| | | | | | | | | | |
| Financing | | | | | | | | | |
| Borrowings (repayments) on the revolving credit facility | 9 | | 113,895 | | | 43,829 | | | 237,061 | | | (444,930 | ) |
| Issuance of senior unsecured notes | 9 | | - | | | - | | | - | | | 391,906 | |
| Payments on lease obligations | 8 | | (5,441 | ) | | (1,246 | ) | | (13,679 | ) | | (3,627 | ) |
| Cash dividends | | | (100,841 | ) | | (54,227 | ) | | (230,047 | ) | | (143,353 | ) |
| Cash flows from (used in) financing activities | | | 7,613 | | | (11,644 | ) | | (6,665 | ) | | (200,004 | ) |
| Foreign exchange (loss) gain on cash held in foreign currencies | | | (1,027 | ) | | (2,444 | ) | | 519 | | | 512 | |
| | | | | | | | | | |
| Net change in cash and cash equivalents | | | (15,110 | ) | | 26,475 | | | (22,567 | ) | | (20,576 | ) |
| Cash and cash equivalents, beginning of period | | | 39,104 | | | 15,724 | | | 46,561 | | | 62,775 | |
| Cash and cash equivalents, end of period | | | 23,994 | | | 42,199 | | | 23,994 | | | 42,199 | |
| | | | | | | | | | |
| Supplementary information for cash flows from operating activities | | | | | | | | | |
| Interest paid | | | 24,914 | | | 18,057 | | | 56,084 | | | 41,234 | |
| Income taxes paid | | | 1,505 | | | 995 | | | 35,631 | | | 16,104 | |
| Vermilion Energy Inc. | Page 56 | 2018 Third Quarter Report |
Consolidated Statements of Changes in Shareholders' Equity
thousands of Canadian dollars, unaudited
| | | Nine Months Ended |
| | | Sep 30, 2018 | | | Sep 30, 2017 | |
| Shareholders' capital | | | | |
| Balance, beginning of period | | 2,650,706 | | | 2,452,722 | |
| Shares issued for acquisition | | 1,234,676 | | | — | |
| Shares issued for the Dividend Reinvestment Plan | | 43,936 | | | 88,676 | |
| Vesting of equity based awards | | 54,057 | | | 69,743 | |
| Equity based compensation | | 10,626 | | | 7,749 | |
| Share-settled dividends on vested equity based awards | | 7,773 | | | 8,478 | |
| Balance, end of period | | 4,001,774 | | | 2,627,368 | |
| Contributed surplus | | | | |
| Balance, beginning of period | | 84,354 | | | 101,788 | |
| Equity based compensation | | 33,141 | | | 37,743 | |
| Vesting of equity based awards | | (54,057 | ) | | (69,743 | ) |
| Balance, end of period | | 63,438 | | | 69,788 | |
| Accumulated other comprehensive income | | | | |
| Balance, beginning of period | | 71,829 | | | 30,339 | |
| Currency translation adjustments | | (4,983 | ) | | 28,128 | |
| Balance, end of period | | 66,846 | | | 58,467 | |
| Deficit | | | | |
| Balance, beginning of period | | (1,264,003 | ) | | (1,006,386 | ) |
| Net (loss) earnings | | (51,723 | ) | | 53,613 | |
| Dividends declared | | (282,801 | ) | | (232,744 | ) |
| Share-settled dividends on vested equity based awards | | (7,773 | ) | | (8,478 | ) |
| Balance, end of period | | (1,606,300 | ) | | (1,193,995 | ) |
| | | | | |
| Total shareholders' equity | | 2,525,758 | | | 1,561,628 | |
Please refer to Financial Statement Note 10 (Shareholders' capital) for additional information.
| Vermilion Energy Inc. | Page 57 | 2018 Third Quarter Report |
Notes to the Condensed Consolidated Interim Financial Statements for the three and nine months ended September 30, 2018 and 2017
tabular amounts in thousands of Canadian dollars, except share and per share amounts, unaudited
Vermilion Energy Inc. (the “Company” or “Vermilion”) is a corporation governed by the laws of the Province of Alberta and is actively engaged in the business of crude oil and natural gas exploration, development, acquisition and production.
These condensed consolidated interim financial statements are in compliance with International Accounting Standard (“IAS”) 34, “Interim financial reporting”. Except as described in Note 2, these condensed consolidated interim financial statements have been prepared using the same accounting policies and methods of computation as Vermilion’s consolidated financial statements for the year ended December 31, 2017.
These condensed consolidated interim financial statements should be read in conjunction with Vermilion’s consolidated financial statements for the year ended December 31, 2017, which are contained within Vermilion’s Annual Report for the year ended December 31, 2017 and are available on SEDAR atwww.sedar.com or on Vermilion’s website atwww.vermilionenergy.com.
These condensed consolidated interim financial statements were approved and authorized for issuance by the Board of Directors of Vermilion on October 24, 2018.
| 2. Changes in accounting pronouncements |
IFRS 9 "Financial instruments"
On January 1, 2018, Vermilion adopted IFRS 9"Financial Instruments" as issued by the IASB. IFRS 9 includes a new classification and measurement approach for financial assets and a forward-looking 'expected credit loss' model. The adoption of IFRS 9 did not have a material impact on Vermilion's consolidated financial statements. Vermilion has revised the description of its accounting policy for financial instruments to reflect the new classification approach as follows:
Financial instruments
On initial recognition, financial instruments are measured at fair value. Measurement in subsequent periods depends on the classification of the financial instrument as described below:
| • | Fair value through profit or loss: Financial instruments under this classification include cash and cash equivalents and derivative assets and liabilities. |
| • | Amortized cost: Financial instruments under this classification include accounts receivable, accounts payable and accrued liabilities, dividends payable, lease obligations, and long-term debt. |
IFRS 15 "Revenue from contracts with customers"
On January 1, 2018, Vermilion adopted IFRS 15 "Revenue from Contracts with Customers" IFRS 15 establishes a comprehensive framework for determining whether, how much, and when revenue from contracts with customers is recognized. Vermilion's revenue relates to the sale of petroleum and natural gas to customers at specified delivery points at benchmark prices.
Vermilion adopted IFRS 15 using the modified retrospective approach. Under this transitional provision, the cumulative effect of initially applying IFRS 15 is recognized on the date of initial application as an adjustment to retained earnings. No adjustment to retained earnings was required upon adoption of IFRS 15.
IFRS 15 requires additional disclosure relating to the disaggregation of revenue - this additional disclosure is included in Financial Statement Note 3 (Segmented Information). In addition, as a result of this adoption, Vermilion has revised the description of its accounting policy for revenue recognition as follows:
| Vermilion Energy Inc. | Page 58 | 2018 Third Quarter Report |
Revenue recognition
Revenue associated with the sale of crude oil and condensate, natural gas and natural gas liquids is measured based on the consideration specified in contracts with customers. Revenue from contracts with customers is recognized when or as Vermilion satisfies a performance obligation by transferring a promised good or service to a customer. A good or service is transferred when the customer obtains control of that good or service. The transfer of control of oil, natural gas, natural gas liquids usually coincides with title passing to the customer and the customer taking physical possession. Vermilion principally satisfies its performance obligations at a point in time and the amounts of revenue recognized relating to performance obligations satisfied over time are not significant. Vermilion generally invoices customers for delivered products monthly, and payment terms for commodity sales are shortly thereafter. Vermilion does not have any contracts where the period between the transfer of the promised goods or services to the customer and payment by the customer exceeds one year. As a result, Vermilion does not adjust its revenue transactions for the time value of money.
IFRS 16 "Leases"
Vermilion is required to adopt IFRS 16 “Leases” by January 1, 2019, however Vermilion has elected to early adopt IFRS 16 effective January 1, 2018. IFRS 16 introduces a single lease accounting model for lessees which requires a right-of-use asset and lease liability to be recognized on the balance sheet for contracts that are, or contain, a lease.
Vermilion adopted IFRS 16 using the modified retrospective approach, whereby the cumulative effect of initially applying the standard was recognized as a $97.1 million increase to right-of-use assets (included in "Capital assets") with a corresponding increase to lease obligations (the non-current portion of $86.1 million recorded in "lease obligations" and the current $11.0 million portion recorded in "Accounts payable and accrued liabilities"). The right-of-use assets recognized were measured at amounts equal to the lease obligations. The weighted average incremental borrowing rate used to determine the lease obligation at adoption was approximately 5.4%. The right-of-use assets and lease obligations recognized largely relate to the Company's head office lease in Calgary and long-term leases for oil storage facilities in France.
The adoption of IFRS 16 included the following elections:
| • | Vermilion elected to retain the classification of contracts previously identified as leases under IAS 17 and IFRIC 4. |
| • | Vermilion elected to use hindsight in determining lease term. |
The difference in operating lease commitments disclosed as at December 31, 2017 and lease liabilities recognised in the statement of financial position at January 1, 2018 is primarily due to the application of hindsight in determining lease terms, including the impact of extension options negotiated or exercised during the nine months ended September 30, 2018.
As a result of this adoption, Vermilion has revised the description of its accounting policy for leases as follows:
Leases
A contract is, or contains, a lease if the contract conveys the right to control the use of an identified asset for a period of time in exchange for consideration. A lease obligation is recognized at the commencement of the lease term at the present value of the lease payments that are not paid at that date. Interest expense is recognized on the lease obligations using the effective interest rate method and payments are applied against the lease obligation. At the commencement date, a corresponding right-of-use asset is recognized at the amount of the lease obligation, adjusted for lease incentives received and initial direct costs. Depreciation is recognized on the right-of-use asset over the lease term.
The preparation of the consolidated financial statements in accordance with IFRS requires management to make judgments, estimates, and assumptions that affect the reported amount of assets, liabilities, income, and expenses. Actual results could differ significantly from these estimates. Key areas where management has made judgments, estimates, and assumptions related to the application of IFRS 16 include:
| • | Incremental borrowing rate: The Incremental borrowing rates are based on judgments including economic environment, term, currency, and the underlying risk inherent to the asset. The carrying balance of the right-of-use assets, lease obligations, and the resulting interest and depletion and depreciation expense, may differ due to changes in the market conditions and lease term. |
| • | Lease term: Lease terms are based on assumptions regarding extension terms that allow for operational flexibility and future market conditions. |
| Vermilion Energy Inc. | Page 59 | 2018 Third Quarter Report |
Vermilion’s chief operating decision maker regularly reviews fund flows from operations generated by each of Vermilion’s operating segments. Fund flows from operations is a measure of profit or loss that provides the chief operating decision maker with the ability to assess the operating segments’ profitability and, correspondingly, the ability of each operating segment to fund its share of dividends, asset retirement obligations, and capital investments.
| | | Three Months Ended September 30, 2018 |
| ($M) | | Canada | | France | | Netherlands | | Germany | | Ireland | | Australia | | USA | | Corporate | | Total |
| Drilling and development | | | 89,837 | | | | 15,682 | | | | 5,148 | | | | 4,271 | | | | (50 | ) | | | 16,061 | | | | 11,386 | | | | (219 | ) | | | 142,116 | |
| Exploration and evaluation | | | — | | | | 97 | | | | (92 | ) | | | 2,226 | | | | — | | | | — | | | | — | | | | 1,838 | | | | 4,069 | |
| | | | | | | | | | | | | | | | | | | | | | | | | | | | | | | | | | | | | |
| Crude oil and condensate sales | | | 209,219 | | | | 100,840 | | | | 634 | | | | 7,898 | | | | — | | | | 35,848 | | | | 11,740 | | | | — | | | | 366,179 | |
| NGL sales | | | 15,680 | | | | — | | | | — | | | | — | | | | — | | | | — | | | | 1,919 | | | | — | | | | 17,599 | |
| Natural gas sales | | | 18,117 | | | | — | | | | 41,159 | | | | 13,154 | | | | 50,228 | | | | — | | | | 892 | | | | 1,083 | | | | 124,633 | |
| Royalties | | | (33,801 | ) | | | (12,765 | ) | | | (1,049 | ) | | | (2,448 | ) | | | — | | | | — | | | | (3,444 | ) | | | (279 | ) | | | (53,786 | ) |
| Revenue from external customers | | | 209,215 | | | | 88,075 | | | | 40,744 | | | | 18,604 | | | | 50,228 | | | | 35,848 | | | | 11,107 | | | | 804 | | | | 454,625 | |
| Transportation | | | (9,057 | ) | | | (2,013 | ) | | | — | | | | (1,191 | ) | | | (1,460 | ) | | | — | | | | — | | | | — | | | | (13,721 | ) |
| Operating | | | (55,577 | ) | | | (13,733 | ) | | | (5,812 | ) | | | (4,863 | ) | | | (3,354 | ) | | | (11,585 | ) | | | (2,633 | ) | | | (201 | ) | | | (97,758 | ) |
| General and administration | | | (1,316 | ) | | | (3,365 | ) | | | (320 | ) | | | (2,073 | ) | | | (3,597 | ) | | | (1,020 | ) | | | (2,397 | ) | | | 854 | | | | (13,234 | ) |
| PRRT | | | — | | | | — | | | | — | | | | — | | | | — | | | | 254 | | | | — | | | | — | | | | 254 | |
| Corporate income taxes | | | — | | | | (6,913 | ) | | | 1,729 | | | | — | | | | — | | | | (3,355 | ) | | | — | | | | (862 | ) | | | (9,401 | ) |
| Interest expense | | | — | | | | — | | | | — | | | | — | | | | — | | | | — | | | | — | | | | (19,772 | ) | | | (19,772 | ) |
| Realized loss on derivative instruments | | | — | | | | — | | | | — | | | | — | | | | — | | | | — | | | | — | | | | (37,365 | ) | | | (37,365 | ) |
| Realized foreign exchange loss | | | — | | | | — | | | | — | | | | — | | | | — | | | | — | | | | — | | | | (3,100 | ) | | | (3,100 | ) |
| Realized other income | | | — | | | | — | | | | — | | | | — | | | | — | | | | — | | | | — | | | | 177 | | | | 177 | |
| Fund flows from operations | | | 143,265 | | | | 62,051 | | | | 36,341 | | | | 10,477 | | | | 41,817 | | | | 20,142 | | | | 6,077 | | | | (59,465 | ) | | | 260,705 | |
| | | | Three Months Ended September 30, 2017 |
| ($M) | | | Canada | | | | France | | | | Netherlands | | | | Germany | | | | Ireland | | | | Australia | | | | USA | | | | Corporate | | | | Total | |
| Drilling and development | | | 43,746 | | | | 14,071 | | | | 4,548 | | | | 855 | | | | 1,101 | | | | 10,154 | | | | 1,362 | | | | — | | | | 75,837 | |
| Exploration and evaluation | | | — | | | | 1,685 | | | | 7,042 | | | | 2,165 | | | | — | | | | — | | | | — | | | | 4,653 | | | | 15,545 | |
| | | | | | | | | | | | | | | | | | | | | | | | | | | | | | | | | | | | | |
| Crude oil and condensate sales | | | 48,834 | | | | 66,100 | | | | 353 | | | | 5,491 | | | | — | | | | 35,257 | | | | 4,513 | | | | — | | | | 160,548 | |
| NGL sales | | | 10,767 | | | | — | | | | — | | | | — | | | | — | | | | — | | | | 136 | | | | — | | | | 10,903 | |
| Natural gas sales | | | 17,637 | | | | — | | | | 20,905 | | | | 10,172 | | | | 28,218 | | | | — | | | | 122 | | | | — | | | | 77,054 | |
| Royalties | | | (6,653 | ) | | | (6,399 | ) | | | (360 | ) | | | (2,261 | ) | | | — | | | | — | | | | (1,321 | ) | | | — | | | | (16,994 | ) |
| Revenue from external customers | | | 70,585 | | | | 59,701 | | | | 20,898 | | | | 13,402 | | | | 28,218 | | | | 35,257 | | | | 3,450 | | | | — | | | | 231,511 | |
| Transportation | | | (4,485 | ) | | | (3,434 | ) | | | — | | | | (1,603 | ) | | | (1,252 | ) | | | — | | | | (26 | ) | | | — | | | | (10,800 | ) |
| Operating | | | (22,071 | ) | | | (13,148 | ) | | | (4,498 | ) | | | (3,477 | ) | | | (5,717 | ) | | | (12,292 | ) | | | (629 | ) | | | — | | | | (61,832 | ) |
| General and administration | | | (2,239 | ) | | | (2,543 | ) | | | (510 | ) | | | (1,708 | ) | | | (670 | ) | | | (1,675 | ) | | | (935 | ) | | | (1,834 | ) | | | (12,114 | ) |
| PRRT | | | — | | | | — | | | | — | | | | — | | | | — | | | | (4,345 | ) | | | — | | | | — | | | | (4,345 | ) |
| Corporate income taxes | | | — | | | | (1,396 | ) | | | (1,983 | ) | | | — | | | | — | | | | (193 | ) | | | — | | | | 480 | | | | (3,092 | ) |
| Interest expense | | | — | | | | — | | | | — | | | | — | | | | — | | | | — | | | | — | | | | (13,400 | ) | | | (13,400 | ) |
| Realized gain on derivative instruments | | | — | | | | — | | | | — | | | | — | | | | — | | | | — | | | | — | | | | 8,723 | | | | 8,723 | |
| Realized foreign exchange loss | | | — | | | | — | | | | — | | | | ��� | | | | — | | | | — | | | | — | | | | (4,110 | ) | | | (4,110 | ) |
| Realized other income | | | — | | | | — | | | | — | | | | — | | | | — | | | | — | | | | — | | | | 214 | | | | 214 | |
| Fund flows from operations | | | 41,790 | | | | 39,180 | | | | 13,907 | | | | 6,614 | | | | 20,579 | | | | 16,752 | | | | 1,860 | | | | (9,927 | ) | | | 130,755 | |
| Vermilion Energy Inc. | Page 60 | 2018 Third Quarter Report |
| | | Nine Months Ended September 30, 2018 |
| ($M) | | Canada | | France | | Netherlands | | Germany | | Ireland | | Australia | | USA | | Corporate | | Total |
| Total assets | | | 3,107,387 | | | | 864,425 | | | | 199,212 | | | | 284,368 | | | | 575,195 | | | | 227,055 | | | | 327,353 | | | | 333,635 | | | | 5,918,630 | |
| Drilling and development | | | 187,646 | | | | 62,581 | | | | 15,671 | | | | 7,776 | | | | 84 | | | | 31,878 | | | | 37,956 | | | | (109 | ) | | | 343,483 | |
| Exploration and evaluation | | | — | | | | 169 | | | | (642 | ) | | | 3,450 | | | | — | | | | — | | | | — | | | | 8,174 | | | | 11,151 | |
| | | | | | | | | | | | | | | | | | | | | | | | | | | | | | | | | | | | | |
| Crude oil and condensate sales | | | 394,897 | | | | 274,713 | | | | 1,741 | | | | 25,962 | | | | — | | | | 111,382 | | | | 20,690 | | | | — | | | | 829,385 | |
| NGL sales | | | 40,544 | | | | — | | | | — | | | | — | | | | — | | | | — | | | | 2,160 | | | | — | | | | 42,704 | |
| Natural gas sales | | | 49,423 | | | | — | | | | 111,238 | | | | 34,590 | | | | 151,765 | | | | — | | | | 990 | | | | 1,083 | | | | 349,089 | |
| Royalties | | | (59,112 | ) | | | (34,805 | ) | | | (2,644 | ) | | | (5,436 | ) | | | — | | | | — | | | | (6,017 | ) | | | (279 | ) | | | (108,293 | ) |
| Revenue from external customers | | | 425,752 | | | | 239,908 | | | | 110,335 | | | | 55,116 | | | | 151,765 | | | | 111,382 | | | | 17,823 | | | | 804 | | | | 1,112,885 | |
| Transportation | | | (18,783 | ) | | | (7,184 | ) | | | — | | | | (4,968 | ) | | | (4,014 | ) | | | — | | | | — | | | | — | | | | (34,949 | ) |
| Operating | | | (115,435 | ) | | | (40,675 | ) | | | (19,916 | ) | | | (16,433 | ) | | | (10,869 | ) | | | (37,442 | ) | | | (3,573 | ) | | | (201 | ) | | | (244,544 | ) |
| General and administration | | | (3,907 | ) | | | (10,378 | ) | | | (1,238 | ) | | | (5,093 | ) | | | (6,349 | ) | | | (3,527 | ) | | | (4,910 | ) | | | (3,713 | ) | | | (39,115 | ) |
| PRRT | | | — | | | | — | | | | — | | | | — | | | | — | | | | (7,246 | ) | | | — | | | | — | | | | (7,246 | ) |
| Corporate income taxes | | | — | | | | (14,200 | ) | | | (9,069 | ) | | | — | | | | — | | | | (6,379 | ) | | | — | | | | (1,159 | ) | | | (30,807 | ) |
| Interest expense | | | — | | | | — | | | | — | | | | — | | | | — | | | | — | | | | — | | | | (51,932 | ) | | | (51,932 | ) |
| Realized loss on derivative instruments | | | — | | | | — | | | | — | | | | — | | | | — | | | | — | | | | — | | | | (82,939 | ) | | | (82,939 | ) |
| Realized foreign exchange loss | | | — | | | | — | | | | — | | | | — | | | | — | | | | — | | | | — | | | | (5,651 | ) | | | (5,651 | ) |
| Realized other income | | | — | | | | — | | | | — | | | | — | | | | — | | | | — | | | | — | | | | 608 | | | | 608 | |
| Fund flows from operations | | | 287,627 | | | | 167,471 | | | | 80,112 | | | | 28,622 | | | | 130,533 | | | | 56,788 | | | | 9,340 | | | | (144,183 | ) | | | 616,310 | |
| | | | | | | | | | | | | | | | | | | | | | | | | | | | | | | | | | | | | |
| | | | Nine Months Ended September 30, 2017 |
| ($M) | | | Canada | | | | France | | | | Netherlands | | | | Germany | | | | Ireland | | | | Australia | | | | USA | | | | Corporate | | | | Total | |
| Total assets | | | 1,546,888 | | | | 822,316 | | | | 207,330 | | | | 288,348 | | | | 667,006 | | | | 247,296 | | | | 75,166 | | | | 156,587 | | | | 4,010,937 | |
| Drilling and development | | | 121,802 | | | | 51,530 | | | | 12,233 | | | | 2,087 | | | | 224 | | | | 22,750 | | | | 18,056 | | | | — | | | | 228,682 | |
| Exploration and evaluation | | | — | | | | 1,824 | | | | 7,042 | | | | 2,165 | | | | — | | | | — | | | | — | | | | 6,433 | | | | 17,464 | |
| | | | | | | | | | | | | | | | | | | | | | | | | | | | | | | | | | | | | |
| Crude oil and condensate sales | | | 147,791 | | | | 189,325 | | | | 1,221 | | | | 16,484 | | | | — | | | | 118,305 | | | | 10,484 | | | | — | | | | 483,610 | |
| NGL sales | | | 23,756 | | | | — | | | | — | | | | — | | | | — | | | | — | | | | 292 | | | | — | | | | 24,048 | |
| Natural gas sales | | | 64,834 | | | | — | | | | 65,925 | | | | 33,314 | | | | 109,537 | | | | — | | | | 229 | | | | — | | | | 273,839 | |
| Royalties | | | (23,957 | ) | | | (17,966 | ) | | | (1,075 | ) | | | (4,857 | ) | | | — | | | | — | | | | (3,080 | ) | | | — | | | | (50,935 | ) |
| Revenue from external customers | | | 212,424 | | | | 171,359 | | | | 66,071 | | | | 44,941 | | | | 109,537 | | | | 118,305 | | | | 7,925 | | | | — | | | | 730,562 | |
| Transportation | | | (12,532 | ) | | | (10,152 | ) | | | — | | | | (5,043 | ) | | | (3,709 | ) | | | — | | | | (26 | ) | | | — | | | | (31,462 | ) |
| Operating | | | (58,088 | ) | | | (36,670 | ) | | | (14,231 | ) | | | (14,151 | ) | | | (14,619 | ) | | | (37,967 | ) | | | (1,301 | ) | | | — | | | | (177,027 | ) |
| General and administration | | | (7,064 | ) | | | (9,326 | ) | | | (1,666 | ) | | | (5,687 | ) | | | (1,803 | ) | | | (5,001 | ) | | | (3,067 | ) | | | (4,818 | ) | | | (38,432 | ) |
| PRRT | | | — | | | | — | | | | — | | | | — | | | | — | | | | (16,247 | ) | | | — | | | | — | | | | (16,247 | ) |
| Corporate income taxes | | | — | | | | (8,208 | ) | | | (3,644 | ) | | | — | | | | — | | | | (2,781 | ) | | | — | | | | 15 | | | | (14,618 | ) |
| Interest expense | | | — | | | | — | | | | — | | | | — | | | | — | | | | — | | | | — | | | | (43,603 | ) | | | (43,603 | ) |
| Realized gain on derivative instruments | | | — | | | | — | | | | — | | | | — | | | | — | | | | — | | | | — | | | | 12,214 | | | | 12,214 | |
| Realized foreign exchange loss | | | — | | | | — | | | | — | | | | — | | | | — | | | | — | | | | — | | | | (583 | ) | | | (583 | ) |
| Realized other income | | | — | | | | — | | | | — | | | | — | | | | — | | | | — | | | | — | | | | 508 | | | | 508 | |
| Fund flows from operations | | | 134,740 | | | | 107,003 | | | | 46,530 | | | | 20,060 | | | | 89,406 | | | | 56,309 | | | | 3,531 | | | | (36,267 | ) | | | 421,312 | |
Reconciliation of fund flows from operations to net (loss) earnings:
| | Three Months Ended | | Nine Months Ended |
| ($M) | Sep 30, 2018 | | | Sep 30, 2017 | | | Sep 30, 2018 | | | Sep 30, 2017 | |
| Fund flows from operations | 260,705 | | | 130,755 | | | 616,310 | | | 421,312 | |
| Accretion | (8,041 | ) | | (6,850 | ) | | (23,014 | ) | | (19,980 | ) |
| Depletion and depreciation | (166,343 | ) | | (120,826 | ) | | (434,621 | ) | | (362,504 | ) |
| Unrealized (loss) gain on derivative instruments | (75,829 | ) | | (24,198 | ) | | (163,770 | ) | | 78,950 | |
| Equity based compensation | (13,056 | ) | | (12,858 | ) | | (43,767 | ) | | (45,492 | ) |
| Unrealized foreign exchange (loss) gain | (23,044 | ) | | (3,016 | ) | | (26,877 | ) | | 31,082 | |
| Unrealized other expense | (203 | ) | | (200 | ) | | (597 | ) | | (440 | ) |
| Deferred tax | 10,712 | | | (1,998 | ) | | 24,613 | | | (49,315 | ) |
| Net (loss) earnings | (15,099 | ) | | (39,191 | ) | | (51,723 | ) | | 53,613 | |
| Vermilion Energy Inc. | Page61 | 2018 Third Quarter Report |
Private Producer in Southeast Saskatchewan and Southwest Manitoba
On February 15, 2018, Vermilion acquired 100% of the issued and outstanding common shares of a private producer with assets in southeast Saskatchewan and southwest Manitoba. The acquisition comprised of light oil producing fields near Vermilion’s existing operations in southeast Saskatchewan. The acquisition complements Vermilion’s existing southeast Saskatchewan operations and aligns with the Company's sustainable growth-and-income model. The acquisition was funded through Vermilion’s revolving credit facility.
The total consideration paid and the provisional estimates of the fair value of the assets acquired and liabilities assumed at the date of acquisition are detailed in the table below.
| ($M) | | Consideration | |
| Cash paid to vendor | | 53,288 | |
| Total consideration | | 53,288 | |
| | | |
| ($M) | Allocation of consideration |
| Acquired working capital | | 1,577 | |
| Deferred tax assets | | 26,914 | |
| Capital assets | | 67,549 | |
| Long-term debt | | (38,300 | ) |
| Asset retirement obligations | | (4,452 | ) |
| Net assets acquired | | 53,288 | |
For the nine months ended September 30, 2018, the acquisition contributed revenues of $14.4 million and net earnings of $5.5 million. Had the acquisition occurred on January 1, 2018, revenues would have increased by $2.9 million and net earnings would have increased by $1.0 million for the nine months ended September 30, 2018.
Spartan Energy Corp.
On May 28, 2018, Vermilion acquired 100% of the issued and outstanding common shares of Spartan Energy Corp., a publicly traded oil and gas producer with light oil producing properties in southeast Saskatchewan as well as other areas in Saskatchewan, Alberta, and Manitoba. The acquisition increases Vermilion’s position in southeast Saskatchewan and aligns with the Company's sustainable growth-and-income model.
Consideration consisted of the issuance of 27.9 million Vermilion common shares valued at approximately $1.2 billion (based on the closing price per Vermilion common share of $44.30 on the Toronto Stock Exchange on May 28, 2018). Acquisition-related costs of $1.3 million were incurred in the six months ended June 30, 2018.
The total consideration paid and provisional estimates of the fair value of the assets acquired and liabilities assumed as at the date of the acquisition are detailed in the table below. Subsequent amendments may be made to these amounts as estimates are finalized.
| ($M) | | Consideration | |
| Shares issued for acquisition | | 1,235,221 | |
| Total consideration | | 1,235,221 | |
| | | |
| ($M) | Allocation of consideration |
| Deferred tax assets | | 123,813 | |
| Capital assets | | 1,401,686 | |
| Assumed working capital deficit | | (22,478 | ) |
| Long-term debt | | (150,196 | ) |
| Lease obligations | | (25,455 | ) |
| Asset retirement obligations | | (92,149 | ) |
| Net assets acquired | | 1,235,221 | |
| Vermilion Energy Inc. | Page 62 | 2018 Third Quarter Report |
For the nine months ended September 30, 2018, the acquisition contributed revenues of $156.9 million and net earnings of $40.3 million. Had the acquisition occurred on January 1, 2018, revenues would have increased by $182.4 million and net earnings would have increased by $35.0 million for the nine months ended September 30, 2018.
Assets in Wyoming
In August 2018, Vermilion acquired oil and gas producing assets and mineral leasehold land from a private oil company for total cash consideration of approximately $186 million. The assets are located in Campbell County, Wyoming in the Powder River Basin, approximately 65 kilometres northwest of Vermilion’s existing operations. The acquired assets complement Vermilion's existing Powder River operations and align with the Company's sustainable growth-and-income model. The acquisition was funded through Vermilion’s revolving credit facility.
The total consideration paid and the provisional estimates of the fair value of the assets acquired and liabilities assumed at the date of acquisition are detailed in the table below. Subsequent amendments may be made to these amounts as estimates are finalized.
| ($M) | | Consideration | |
| Cash paid to vendor | | 186,356 | |
| Total consideration | | 186,356 | |
| | | |
| ($M) | | Allocation of consideration | |
| Capital assets | | 192,802 | |
| Acquired working capital deficit | | (1,623 | ) |
| Asset retirement obligations | | (4,823 | ) |
| Net assets acquired | | 186,356 | |
For the nine months ended September 30, 2018, the acquisition contributed revenues of $5.0 million and net earnings of $0.4 million. Had the acquisition occurred on January 1, 2018, revenues would have increased by $18.5 million and net earnings would have increased by $5.9 million for the nine months ended September 30, 2018.
Minor acquisitions
Vermilion completed minor acquisitions during the nine months ended September 30, 2018 for total cash consideration of $59.5 million, in which $117.1 million of capital assets and $55.9 million of asset retirement obligations were recognized.
The following table reconciles the change in Vermilion's capital assets:
| ($M) | 2018 | |
| Balance at January 1 | 3,337,965 | |
| Acquisitions | 1,787,655 | |
| Additions | 343,483 | |
| Increase in right-of-use assets | 98,042 | |
| Changes in asset retirement obligations | (83,362 | ) |
| Depletion and depreciation | (433,122 | ) |
| Foreign exchange | (13,438 | ) |
| Balance at September 30 | 5,037,223 | |
The following table discloses the carrying balance and depreciation charge relating to right-of-use assets by class of underlying asset as at and for the nine months ended September 30, 2018:
| ($M) | Depreciation | | | Balance | |
| Office space | 6,779 | | | 64,334 | |
| Gas processing facilities | 3,704 | | | 43,576 | |
| Oil storage facilities | 2,060 | | | 20,635 | |
| Vehicles and equipment | 1,237 | | | 3,410 | |
| | 13,780 | | | 131,955 | |
| Vermilion Energy Inc. | Page 63 | 2018 Third Quarter Report |
| 6. Exploration and evaluation assets |
The following table reconciles the change in Vermilion's exploration and evaluation assets:
| ($M) | 2018 | |
| Balance at January 1 | 292,278 | |
| Additions | 11,151 | |
| Changes in asset retirement obligations | 260 | |
| Depreciation | (4,785 | ) |
| Foreign exchange | (394 | ) |
| Balance at September 30 | 298,510 | |
| 7. Asset retirement obligations |
The following table reconciles the change in Vermilion’s asset retirement obligations:
| ($M) | 2018 | |
| Balance at January 1 | 517,180 | |
| Additional obligations recognized | 161,019 | |
| Changes in estimates | (68,995 | ) |
| Obligations settled | (9,203 | ) |
| Accretion | 23,014 | |
| Changes in discount rates | (17,833 | ) |
| Foreign exchange | (7,099 | ) |
| Balance at September 30 | 598,083 | |
Vermilion had the following future commitments associated with its lease obligations:
| | As at | |
| ($M) | Sep 30, 2018 | |
| Less than 1 year | 29,090 | |
| 1 - 3 years | 64,968 | |
| 4 - 5 years | 33,222 | |
| After 5 years | 28,506 | |
| Total lease payments | 155,786 | |
| Amounts representing interest | (21,835 | ) |
| Present value of net lease payments | 133,951 | |
| Current portion of lease obligations | 23,232 | |
| Non-current portion of lease obligations | 110,719 | |
For the nine months ended September 30, 2018, interest expense of $5.2 million and total cash outflow of $18.9 million were recognized relating to lease obligations.
| Vermilion Energy Inc. | Page64 | 2018 Third Quarter Report |
The following table summarizes Vermilion’s outstanding long-term debt:
| | As at |
| ($M) | Sep 30, 2018 | | | Dec 31, 2017 | |
| Revolving credit facility | 1,345,730 | | | 899,595 | |
| Senior unsecured notes | 383,159 | | | 370,735 | |
| Long-term debt | 1,728,889 | | | 1,270,330 | |
The fair value of the revolving credit facility is equal to its carrying value due to the use of short-term borrowing instruments at market rates of interest. The fair value of the senior unsecured notes as at September 30, 2018 was $386.0 million.
The following table reconciles the change in Vermilion’s long-term debt:
| ($M) | 2018 | |
| Balance at January 1 | 1,270,330 | |
| Borrowings on the revolving credit facility | 237,061 | |
| Assumed on acquisitions(1) | 188,496 | |
| Amortization of transaction costs and prepaid interest | 1,229 | |
| Foreign exchange | 31,773 | |
| Balance at September 30 | 1,728,889 | |
(1) Pursuant to the acquisitions described in Financial Statement Note 4 (Business Combinations), Vermilion assumed the credit facilities of the acquired companies and immediately extinguished them following the respective acquisitions using proceeds from Vermilion's revolving credit facility.
Revolving credit facility
At September 30, 2018, Vermilion had in place a bank revolving credit facility maturing May 31, 2022 with the following terms:
| | As at |
| ($M) | Sep 30, 2018 | | | Dec 31, 2017 | |
| Total facility amount | 1,800,000 | | | 1,400,000 | |
| Amount drawn | (1,345,730 | ) | | (899,595 | ) |
| Letters of credit outstanding | (8,800 | ) | | (7,400 | ) |
| Unutilized capacity | 445,470 | | | 493,005 | |
The facility can be extended from time to time at the option of the lenders and upon notice from Vermilion. If no extension is granted by the lenders, the amounts owing pursuant to the facility are due at the maturity date. The facility is secured by various fixed and floating charges against the subsidiaries of Vermilion.
The facility bears interest at a rate applicable to demand loans plus applicable margins.
As at September 30, 2018, the revolving credit facility was subject to the following financial covenants:
| | | | As at |
| Financial covenant | Limit | | Sep 30, 2018 | | | Dec 31, 2017 | |
| Consolidated total debt to consolidated EBITDA | 4.0 | | 1.67 | | | 1.87 | |
| Consolidated total senior debt to consolidated EBITDA | 3.5 | | 1.30 | | | 1.30 | |
| Consolidated total senior debt to total capitalization | 55% | | 32 | % | | 32 | % |
| Vermilion Energy Inc. | Page 65 | 2018 Third Quarter Report |
The financial covenants include financial measures defined within the revolving credit facility agreement that are not defined under IFRS. These financial measures are defined by the revolving credit facility agreement as follows:
| • | Consolidated total debt: Includes all amounts classified as “Long-term debt” and “Lease obligations” (including the current portion included within "Accounts payable and accrued liabilities" but excluding operating leases as defined under IAS 17) on the balance sheet. |
| • | Consolidated total senior debt: Defined as consolidated total debt excluding unsecured and subordinated debt. |
| • | Consolidated EBITDA: Defined as consolidated net earnings before interest, income taxes, depreciation, accretion and certain other non-cash items, adjusted for the impact of the acquisition of a material subsidiary. |
| • | Total capitalization: Includes all amounts classified as “Shareholders’ equity” plus consolidated total debt as defined above. |
As at September 30, 2018 and 2017, Vermilion was in compliance with the above covenants.
Senior unsecured notes
On March 13, 2017, Vermilion issued US $300.0 million of senior unsecured notes at par. The notes bear interest at a rate of 5.625% per annum, to be paid semi-annually on March 15 and September 15. The notes mature on March 15, 2025. As direct senior unsecured obligations of Vermilion, the notes rank equally with existing and future senior unsecured indebtedness of the Company.
The senior unsecured notes were recognized at amortized cost and include the transaction costs directly related to the issuance.
Vermilion may, at its option, redeem the notes prior to maturity as follows:
| • | Prior to March 15, 2020, Vermilion may redeem up to 35% of the original principal amount of the senior unsecured notes with the proceeds of certain equity offerings by the Company at a redemption price of 105.625% of the principal amount plus any accrued and unpaid interest to the applicable redemption date. |
| • | Prior to March 15, 2020, Vermilion may redeem some or all of the senior unsecured notes at a price equal to 100% of the principal amount of the senior unsecured notes, plus an applicable premium and any accrued and unpaid interest. |
| • | On or after March 15, 2020, Vermilion may redeem some or all of the senior unsecured notes at the redemption prices set forth in the following table plus any accrued and unpaid interest. |
| Year | | Redemption price | |
| 2020 | | 104.219 | % |
| 2021 | | 102.813 | % |
| 2022 | | 101.406 | % |
| 2023 and thereafter | | 100.000 | % |
| 10. Shareholders' capital |
The following table reconciles the change in Vermilion’s shareholders’ capital:
| | 2018 |
| Shareholders’ Capital | Shares ('000s) | | | Amount ($M) | |
| Balance at January 1 | 122,119 | | | 2,650,706 | |
| Shares issued for acquisition | 27,883 | | | 1,234,676 | |
| Shares issued for the Dividend Reinvestment Plan | 1,030 | | | 43,936 | |
| Vesting of equity based awards | 1,025 | | | 54,057 | |
| Shares issued for equity based compensation | 256 | | | 10,626 | |
| Share-settled dividends on vested equity based awards | 184 | | | 7,773 | |
| Balance at September 30 | 152,497 | | | 4,001,774 | |
Dividends declared to shareholders for the nine months ended September 30, 2018 were $282.8 million (2017 - $232.7 million).
Subsequent to the end of the period and prior to the condensed consolidated interim financial statements being authorized for issue, Vermilion declared dividends of $35.1 million or $0.23 per share
| Vermilion Energy Inc. | Page 66 | 2018 Third Quarter Report |
Vermilion defines capital as net debt (long-term debt plus net working capital) and shareholders’ capital. In managing capital, Vermilion reviews whether fund flows from operations is sufficient to fund capital expenditures, dividends, and asset retirement obligations.
The following table calculates Vermilion’s ratio of net debt to fund flows from operations:
| | Three Months Ended | | Nine Months Ended |
| ($M except as indicated) | Sep 30, 2018 | | | Sep 30, 2017 | | | Sep 30, 2018 | | | Sep 30, 2017 | |
| Long-term debt | 1,728,889 | | | 1,301,757 | | | 1,728,889 | | | 1,301,757 | |
| Current liabilities | 629,893 | | | 298,236 | | | 629,893 | | | 298,236 | |
| Current assets | (324,696 | ) | | (228,998 | ) | | (324,696 | ) | | (228,998 | ) |
| Net debt | 2,034,086 | | | 1,370,995 | | | 2,034,086 | | | 1,370,995 | |
| | | | | | | | |
| Ratio of net debt to annualized fund flows from operations | 1.95 | | | 2.62 | | | 2.48 | | | 2.44 | |
| 12. Financial instruments |
The following table summarizes the increase (positive values) or decrease (negative values) to net earnings before tax due to a change in the value of Vermilion’s financial instruments as a result of a change in the relevant market risk variable. This analysis does not attempt to reflect any interdependencies between the relevant risk variables.
| ($M) | Sep 30, 2018 | |
| Currency risk - Euro to Canadian dollar | |
| $0.01 increase in strength of the Canadian dollar against the Euro | (3,400 | ) |
| $0.01 decrease in strength of the Canadian dollar against the Euro | 3,400 | |
| | |
| Currency risk - US dollar to Canadian dollar | |
| $0.01 increase in strength of the Canadian dollar against the US $ | 3,281 | |
| $0.01 decrease in strength of the Canadian dollar against the US $ | (3,281 | ) |
| | |
| Commodity price risk - Crude oil | |
| US $5.00/bbl increase in crude oil price used to determine the fair value of derivatives | (30,961 | ) |
| US $5.00/bbl decrease in crude oil price used to determine the fair value of derivatives | 26,147 | |
| | |
| Commodity price risk - European natural gas | |
| € 0.5/GJ increase in European natural gas price used to determine the fair value of derivatives | (42,065 | ) |
€ 0.5/GJ decrease in European natural gas price used to determine the fair value of derivatives | 40,881 | |
| Vermilion Energy Inc. | Page 67 | 2018 Third Quarter Report |
DIRECTORS Lorenzo Donadeo1 Calgary, Alberta Larry J. Macdonald2, 4, 6, 8 Chairman & CEO, Point Energy Ltd. Calgary, Alberta Carin Knickel6, 8 Golden, Colorado Stephen P. Larke4, 6 Calgary, Alberta Loren M. Leiker10 Houston, Texas Timothy R. Marchant7, 10 Calgary, Alberta Anthony Marino Calgary, Alberta Robert Michaleski4, 5 Calgary, Alberta William Roby8, 9 Katy, Texas Catherine L. Williams3, 6 Calgary, Alberta 1Chairman of the Board 2Lead Director 3Audit Committee Chair (Independent) 4Audit Committee Member 5Governance and Human Resources Committee Chair (Independent) 6Governance and Human Resources Committee Member 7Health, Safety and Environment Committee Chair_(Independent) 8Health, Safety and Environment Committee Member 9Independent Reserves Committee Chair (Independent) 10Independent Reserves Committee Member ABBREVIATIONS $M thousand dollars $MM million dollars AECO the daily average benchmark price for natural gas at the AECO ‘C’ hub in Alberta bbl(s) barrel(s) bbls/d barrels per day boe barrel of oil equivalent, including: crude oil, condensate, natural gas liquids, and natural gas (converted on the basis of one boe for six mcf of natural gas) boe/d barrel of oil equivalent per day GJ gigajoules HH Henry Hub, a reference price paid for natural gas in US dollars at Erath, Louisiana LNG liquefied natural gas LSB light sour blend crude oil reference price mbbls thousand barrels mcf thousand cubic feet mmbtu million British thermal units mmcf/d million cubic feet per day NBP the reference price paid for natural gas in the United Kingdom at the National Balancing Point Virtual Trading Point. NGLs natural gas liquids, which includes butane, propane, and ethane PRRT Petroleum Resource Rent Tax, a profit based tax levied on petroleum projects in Australia TTF the price for natural gas in the Netherlands at the Title Transfer Facility Virtual Trading Point. WTI West Texas Intermediate, the reference price paid for crude oil of standard grade in US dollars at Cushing, Oklahoma | OFFICERS AND KEY PERSONNEL CANADA Anthony Marino President & Chief Executive Officer Lars Glemser Vice President & Chief Financial Officer Mona Jasinski Executive Vice President, People and Culture Michael Kaluza Executive Vice President & Chief Operating Officer Dion Hatcher Vice President Canada Business Unit Terry Hergott Vice President Marketing Jenson Tan Vice President Business Development Daniel Goulet Director Corporate HSE Jeremy Kalanuk Director Operations Accounting Bryce Kremnica Director Field Operations - Canada Business Unit Kyle Preston Director Investor Relations Mike Prinz Director Information Technology & Information Systems Robert (Bob) J. Engbloom Corporate Secretary UNITED STATES Scott Seatter Managing Director - U.S. Business Unit Timothy R. Morris Director U.S. Business Development - U.S. Business Unit EUROPE Gerard Schut Vice President European Operations Sylvain Nothhelfer Managing Director - France Business Unit Sven Tummers Managing Director - Netherlands Business Unit Bill Liutkus Managing Director - Germany Business Unit Darcy Kerwin Managing Director - Ireland Business Unit Bryan Sralla Managing Director - Central & Eastern Europe Business Unit AUSTRALIA Bruce D. Lake Managing Director - Australia Business Unit | AUDITORS Deloitte LLP Calgary, Alberta BANKERS The Toronto-Dominion Bank Bank of Montreal Canadian Imperial Bank of Commerce National Bank of Canada The Bank of Nova Scotia Royal Bank of Canada Alberta Treasury Branches Bank of America N.A., Canada Branch Citibank N.A., Canadian Branch - Citibank Canada HSBC Bank Canada JPMorgan Chase Bank, N.A., Toronto Branch La Caisse Centrale Desjardins du Québec Wells Fargo Bank N.A., Canadian Branch Barclays Bank PLC Canadian Western Bank Goldman Sachs Lending Partners LLC Export Development Canada EVALUATION ENGINEERS GLJ Petroleum Consultants Ltd. Calgary, Alberta LEGAL COUNSEL Norton Rose Fulbright Canada LLP Calgary, Alberta TRANSFER AGENT Computershare Trust Company of Canada STOCK EXCHANGE LISTINGS The Toronto Stock Exchange (“VET”) The New York Stock Exchange (“VET”) INVESTOR RELATIONS Kyle Preston Director Investor Relations 403-476-8431 TEL 403-476-8100 FAX 1-866-895-8101 IR TOLL FREE investor_relations@vermilionenergy.com |
| Vermilion Energy Inc. | Page 68 | 2018 Third Quarter Report |