Exhibit 99.2
Disclaimer
Certain statements included or incorporated by reference in this document may constitute forward looking statements or financial outlooks under applicable securities legislation. Such forward looking statements or information typically contain statements with words such as "anticipate", "believe", "expect", "plan", "intend", "estimate", "propose", or similar words suggesting future outcomes or statements regarding an outlook. Forward looking statements or information in this document may include, but are not limited to: capital expenditures and Vermilion’s ability to fund such expenditures; Vermilion’s additional debt capacity providing it with additional working capital; the flexibility of Vermilion’s capital program and operations; business strategies and objectives; operational and financial performance; estimated volumes of reserves and resources; petroleum and natural gas sales; future production levels and the timing thereof, including Vermilion’s 2019 guidance, and rates of average annual production growth; the effect of changes in crude oil and natural gas prices, changes in exchange rates and significant declines in production or sales volumes due to unforeseen circumstances; the effect of possible changes in critical accounting estimates; statements regarding the growth and size of Vermilion’s future project inventory, and the wells expected to be drilled in 2019; exploration and development plans and the timing thereof; Vermilion’s ability to reduce its debt, including its ability to redeem senior unsecured notes prior to maturity; statements regarding Vermilion’s hedging program, its plans to add to its hedging positions, and the anticipated impact of Vermilion’s hedging program on project economics and free cash flows; the potential financial impact of climate-related risks; acquisition and disposition plans and the timing thereof; operating and other expenses, including the payment and amount of future dividends; royalty and income tax rates and Vermilion’s expectations regarding future taxes and taxability; and the timing of regulatory proceedings and approvals.
Such forward looking statements or information are based on a number of assumptions, all or any of which may prove to be incorrect. In addition to any other assumptions identified in this document, assumptions have been made regarding, among other things: the ability of Vermilion to obtain equipment, services and supplies in a timely manner to carry out its activities in Canada and internationally; the ability of Vermilion to market crude oil, natural gas liquids, and natural gas successfully to current and new customers; the timing and costs of pipeline and storage facility construction and expansion and the ability to secure adequate product transportation; the timely receipt of required regulatory approvals; the ability of Vermilion to obtain financing on acceptable terms; foreign currency exchange rates and interest rates; future crude oil, natural gas liquids, and natural gas prices; and management’s expectations relating to the timing and results of exploration and development activities.
Although Vermilion believes that the expectations reflected in such forward looking statements or information are reasonable, undue reliance should not be placed on forward looking statements because Vermilion can give no assurance that such expectations will prove to be correct. Financial outlooks are provided for the purpose of understanding Vermilion’s financial position and business objectives, and the information may not be appropriate for other purposes. Forward looking statements or information are based on current expectations, estimates, and projections that involve a number of risks and uncertainties which could cause actual results to differ materially from those anticipated by Vermilion and described in the forward looking statements or information. These risks and uncertainties include, but are not limited to: the ability of management to execute its business plan; the risks of the oil and gas industry, both domestically and internationally, such as operational risks in exploring for, developing and producing crude oil, natural gas liquids, and natural gas; risks and uncertainties involving geology of crude oil, natural gas liquids, and natural gas deposits; risks inherent in Vermilion's marketing operations, including credit risk; the uncertainty of reserves estimates and reserves life and estimates of resources and associated expenditures; the uncertainty of estimates and projections relating to production and associated expenditures; potential delays or changes in plans with respect to exploration or development projects; Vermilion's ability to enter into or renew leases on acceptable terms; fluctuations in crude oil, natural gas liquids, and natural gas prices, foreign currency exchange rates and interest rates; health, safety, and environmental risks; uncertainties as to the availability and cost of financing; the ability of Vermilion to add production and reserves through exploration and development activities; the possibility that government policies or laws may change or governmental approvals may be delayed or withheld; uncertainty in amounts and timing of royalty payments; risks associated with existing and potential future law suits and regulatory actions against Vermilion; and other risks and uncertainties described elsewhere in this document or in Vermilion's other filings with Canadian securities regulatory authorities.
The forward looking statements or information contained in this document are made as of the date hereof and Vermilion undertakes no obligation to update publicly or revise any forward looking statements or information, whether as a result of new information, future events, or otherwise, unless required by applicable securities laws.
All crude oil and natural gas reserve and resource information contained in this document has been prepared and presented in accordance with National Instrument 51-101 Standards of Disclosure for Oil and Gas Activities and the Canadian Oil and Gas Evaluation Handbook. Reserves estimates have been made assuming that development of each property in respect of which the estimate is made will occur, without regard to the likely availability of funding required for such development. The actual crude oil and natural gas reserves and future production will be greater than or less than the estimates provided in this document.
Natural gas volumes have been converted on the basis of six thousand cubic feet of natural gas to one barrel of oil equivalent. Barrels of oil equivalent (boe) may be misleading, particularly if used in isolation. A boe conversion ratio of six thousand cubic feet to one barrel of oil is based on an energy equivalency conversion method primarily applicable at the burner tip and does not represent a value equivalency at the wellhead.
Financial data contained within this document are reported in Canadian dollars, unless otherwise stated.
Vermilion Energy Inc. ■ Page 1■ 2018 Management’s Discussion and Analysis
Abbreviations
| $M | thousand dollars |
| $MM | million dollars |
| AECO | the daily average benchmark price for natural gas at the AECO ‘C’ hub in Alberta |
| bbl(s) | barrel(s) |
| bbls/d | barrels per day |
| boe | barrel of oil equivalent, including: crude oil, condensate, natural gas liquids, and natural gas (converted on the basis of one boe for six mcf of natural gas) |
| boe/d | barrel of oil equivalent per day |
| GJ | gigajoules |
| LSB | light sour blend crude oil reference price |
| mbbls | thousand barrels |
| mcf | thousand cubic feet |
| mmcf/d | million cubic feet per day |
| NBP | the reference price paid for natural gas in the United Kingdom at the National Balancing Point Virtual Trading Point. |
| NGLs | natural gas liquids, which includes butane, propane, and ethane |
| PRRT | Petroleum Resource Rent Tax, a profit based tax levied on petroleum projects in Australia |
| tCO2e | tonnes of carbon dioxide equivalent |
| TTF | the price for natural gas in the Netherlands, quoted in megawatt hours of natural gas, at the Title Transfer Facility Virtual Trading Point |
| WTI | West Texas Intermediate, the reference price paid for crude oil of standard grade in US dollars at Cushing, Oklahoma |
Vermilion Energy Inc. ■ Page 2■ 2018 Management’s Discussion and Analysis
Management's Discussion and Analysis
The following is Management’s Discussion and Analysis (“MD&A”), dated February 27, 2019, of Vermilion Energy Inc.’s (“Vermilion”, “we”, “our”, “us” or the “Company”) operating and financial results as at and for the three months and year ended December 31, 2018 compared with the corresponding periods in the prior year.
This discussion should be read in conjunction with the audited consolidated financial statements for the year ended December 31, 2018 and 2017, together with the accompanying notes. Additional information relating to Vermilion, including its Annual Information Form, is available on SEDAR at www.sedar.com or on Vermilion’s website at www.vermilionenergy.com.
The audited consolidated financial statements for the year ended December 31, 2018 and comparative information have been prepared in Canadian dollars and in accordance with International Financial Reporting Standards (“IFRS” or, alternatively, “GAAP”) as issued by the International Accounting Standards Board ("IASB").
This MD&A includes references to certain financial and performance measures which do not have standardized meanings prescribed by IFRS. These measures include:
| • | Fund flows from operations: Fund flows from operations is a measure of profit or loss in accordance with IFRS 8 “Operating Segments”. Please see "Segmented Information" in the "Notes to the Consolidated Financial Statements" for a reconciliation of fund flows from operations to net earnings. We analyze fund flows from operations both on a consolidated basis and on a business unit basis in order to assess the contribution of each business unit to our ability to generate income necessary to pay dividends, repay debt, fund asset retirement obligations and make capital investments. |
| • | Net debt: Net debt is a capital management measure in accordance with IAS 1 "Presentation of Financial Statements". Net debt is comprised of long-term debt plus current liabilities less current assets and represents Vermilion's net financing obligations after adjusting for the timing of working capital fluctuations. Net debt excludes lease obligations which are secured by a corresponding right-of-use asset. Please see "Capital disclosures" in the "Notes to the Consolidated Financial Statements" for additional information. |
| • | Netbacks: Netbacks are per boe and per mcf performance measures used in the analysis of operational activities. We assess netbacks both on a consolidated basis and on a business unit basis in order to compare and assess the operational and financial performance of each business unit versus other business units and also versus third party crude oil and natural gas producers. |
In addition, this MD&A includes references to certain financial measures which are not specified, defined, or determined under IFRS and are therefore considered non-GAAP financial measures. These non-GAAP financial measures are unlikely to be comparable to similar financial measures presented by other issuers. For a full description of these non-GAAP financial measures and a reconciliation of these measures to their most directly comparable GAAP measures, please refer to “Non-GAAP Financial Measures”.
Condensate Presentation
We report our condensate production in Canada and the Netherlands business units within the crude oil and condensate production line. We believe that this presentation better reflects the historical and forecasted pricing for condensate, which is more closely correlated with crude oil pricing than with pricing for propane, butane and ethane (collectively “NGLs” for the purposes of this report).
Vermilion Energy Inc. ■ Page 3■ 2018 Management’s Discussion and Analysis
Guidance
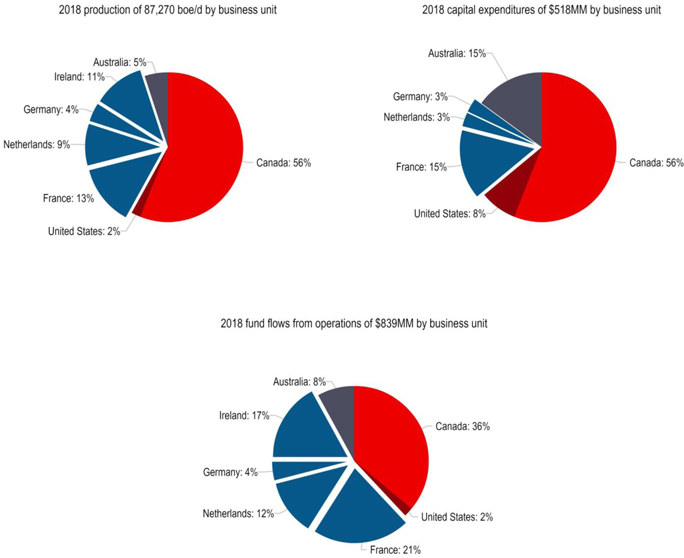
On October 30, 2017, we released our 2018 capital expenditure guidance of $315 million and associated production guidance of between 74,500 to 76,500 boe/d. On January 15, 2018, we increased our capital expenditure guidance to $325 million and production guidance to between 75,000 to 77,500 boe/d to reflect the post-closing impact of the acquisition of a private southeast Saskatchewan and southwest Manitoba light oil producer. On April 16, 2018, we increased our capital expenditure guidance to $430 million and production guidance to between 86,000 to 90,000 boe/d to reflect the post-closing impact of the acquisition of Spartan Energy Corp. On July 30, 2018, we increased our capital expenditure guidance to $500 million to reflect the acceleration of our Australia drilling campaign into Q4 2018, and to a lesser extent to account for the impact of foreign exchange fluctuations on our Canadian dollar capital levels. On October 25, 2018, we increased our capital expenditure guidance to $510 million to reflect additional capital activity associated with the assets acquired in the Powder River Basin in August of 2018. Actual 2018 capital spending of $518 million was within 2% of our guidance and 2018 average production of 87,270 boe/d was within 1% of the mid-point of our guidance range.
On October 25, 2018, we released our 2019 capital budget and related guidance. The 2019 total budget and production guidance remain unchanged, although we have deferred some activity to later in the year and reallocated capital between business units, the breakdown of which can be found in our corporate presentation located on our website.
The following table summarizes our guidance:
| | | Date | | Capital Expenditures ($MM) | | | Production (boe/d) | |
| 2018 Guidance | | | | | | | | | | |
| 2018 Guidance | | October 30, 2017 | | | 315 | | | | 74,500 to 76,500 | |
| 2018 Guidance | | January 15, 2018 | | | 325 | | | | 75,000 to 77,500 | |
| 2018 Guidance | | April 16, 2018 | | | 430 | | | | 86,000 to 90,000 | |
| 2018 Guidance | | July 30, 2018 | | | 500 | | | | 86,000 to 90,000 | |
| 2018 Guidance | | October 25, 2018 | | | 510 | | | | 86,000 to 90,000 | |
| 2018 Actual Results | | | | | 518 | | | | 87,270 | |
| 2019 Guidance | | | | | | | | | | |
| 2019 Guidance | | October 25, 2018 | | | 530 | | | | 101,000 to 106,000 | |
Vermilion Energy Inc. ■ Page 4■ 2018 Management’s Discussion and Analysis
Vermilion's Business
Vermilion is a Calgary, Alberta based international oil and gas producer focused on the acquisition, exploration, development, and optimization of producing properties in North America, Europe, and Australia. We manage our business through our Calgary head office and our international business unit offices. This MD&A separately discusses each of our business units in addition to our corporate segment.
Vermilion Energy Inc. ■ Page 5■ 2018 Management’s Discussion and Analysis
Consolidated Results Overview
| | | Q4 2018 | | | Q3 2018 | | | Q4 2017 | | | Q4/18 vs.
Q3/18 | | Q4/18 vs.
Q4/17 | | 2018 | | | 2017 | | | 2018 vs.
2017 |
| Production | | | | | | | | | | | | | | | | | | | | | | | | | | |
| Crude oil and condensate (bbls/d) | | | 47,678 | | | | 47,152 | | | | 27,830 | | | 1% | | 71% | | | 39,182 | | | | 27,721 | | | 41% |
| NGLs (bbls/d) | | | 7,815 | | | | 6,839 | | | | 5,279 | | | 14% | | 48% | | | 6,366 | | | | 4,194 | | | 52% |
| Natural gas (mmcf/d) | | | 276.77 | | | | 253.38 | | | | 238.27 | | | 9% | | 16% | | | 250.33 | | | | 216.64 | | | 16% |
| Total (boe/d) | | | 101,621 | | | | 96,222 | | | | 72,821 | | | 6% | | 40% | | | 87,270 | | | | 68,021 | | | 28% |
| Sales | | | | | | | | | | | | | | | | | | | | | | | | | | |
| Crude oil and condensate (bbls/d) | | | 47,620 | | | | 46,368 | | | | 27,638 | | | 3% | | 72% | | | 38,741 | | | | 27,483 | | | 41% |
| NGLs (bbls/d) | | | 7,815 | | | | 6,839 | | | | 5,279 | | | 14% | | 48% | | | 6,366 | | | | 4,194 | | | 52% |
| Natural gas (mmcf/d) | | | 276.77 | | | | 253.38 | | | | 238.27 | | | 9% | | 16% | | | 250.33 | | | | 216.64 | | | 16% |
| Total (boe/d) | | | 101,563 | | | | 95,437 | | | | 72,628 | | | 6% | | 40% | | | 86,829 | | | | 67,784 | | | 28% |
| Build in inventory (mbbls) | | | 5 | | | | 73 | | | | 18 | | | | | | | | 160 | | | | 87 | | | |
| Financial metrics | | | | | | | | | | | | | | | | | | | | | | | | | | |
| Fund flows from operations ($M) | | | 222,342 | | | | 260,705 | | | | 181,253 | | | (15)% | | 23% | | | 838,652 | | | | 602,565 | | | 39% |
| Per share ($/basic share) | | | 1.46 | | | | 1.71 | | | | 1.49 | | | (15)% | | (2)% | | | 5.96 | | | | 5.00 | | | 19% |
| Net earnings | | | 323,373 | | | | (15,099 | ) | | | 8,645 | | | N/A | | 3,641% | | | 271,650 | | | | 62,258 | | | 336% |
| Per share ($/basic share) | | | 2.12 | | | | (0.10 | ) | | | 0.07 | | | N/A | | 2,929% | | | 1.93 | | | | 0.52 | | | 271% |
| Net debt ($M) | | | 1,929,529 | | | | 2,034,086 | | | | 1,371,790 | | | (5)% | | 41% | | | 1,929,529 | | | | 1,371,790 | | | 41% |
| Cash dividends ($/share) | | | 0.690 | | | | 0.690 | | | | 0.645 | | | —% | | 7% | | | 2.715 | | | | 2.580 | | | 5% |
| Activity | | | | | | | | | | | | | | | | | | | | | | | | | | |
| Capital expenditures ($M) | | | 163,580 | | | | 146,185 | | | | 74,303 | | | 12% | | 120% | | | 518,214 | | | | 320,449 | | | 62% |
| Acquisitions ($M) | | | 2,689 | | | | 198,173 | | | | 3,048 | | | | | | | | 1,759,425 | | | | 27,637 | | | |
| Gross wells drilled | | | 73.00 | | | | 65.00 | | | | 8.00 | | | | | | | | 185.00 | | | | 56.00 | | | |
| Net wells drilled | | | 45.08 | | | | 58.97 | | | | 6.00 | | | | | | | | 147.93 | | | | 46.58 | | | |
| Financial performance review |
Q4 2018 vs. Q3 2018
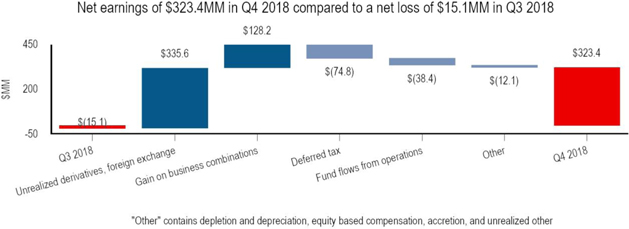
| • | We recorded net earnings for Q4 2018 of $323.4 million ($2.12/basic share) compared to a net loss of $15.1 million ($0.10/basic share) in Q3 2018. This net earnings growth was primarily attributable to a $348.9 million increase in unrealized gains on derivative instruments and a $128.2 million gain recorded on business combinations. These increases were partially offset by a $38.4 million decrease in fund flows from operations. |
Vermilion Energy Inc. ■ Page 6■ 2018 Management’s Discussion and Analysis
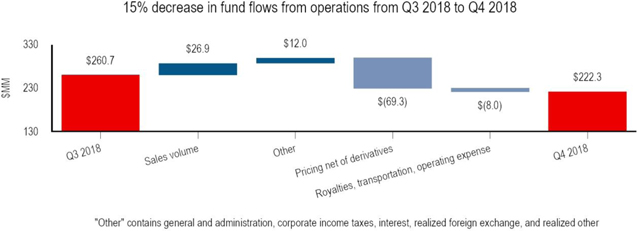
| • | We generated fund flows from operations of $222.3 million during Q4 2018, a decrease of 15% from Q3 2018. This quarter-over-quarter decrease was primarily due to weaker crude oil prices during the current period, including a 48% decrease in in the Edmonton sweet index. The diversified nature of our production somewhat mitigated this 48% decrease in the Edmonton sweet index as illustrated by an attenuated 23% decrease in our crude oil and condensate realized price and a 16% decrease in our consolidated realized price. |
Q4 2018 vs. Q4 2017
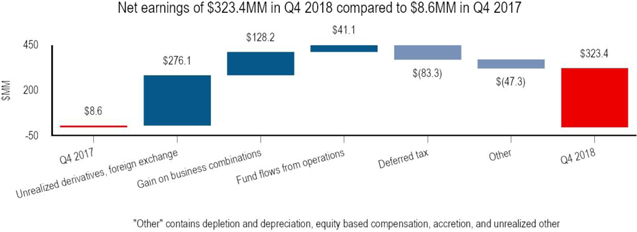
| • | We recorded net earnings for Q4 2018 of $323.4 million ($2.12/basic share) compared to net earnings of $8.6 million ($0.07/basic share) in Q4 2017. The net earnings growth was the result of a 23% increase in fund flows from operations driven by increased sales volumes in Q4 2018 as compared to Q4 2017, an increase in unrealized gain on derivative instruments ($193.1 million), and a $128.2 million gain on business combinations. |
Vermilion Energy Inc. ■ Page 7■ 2018 Management’s Discussion and Analysis
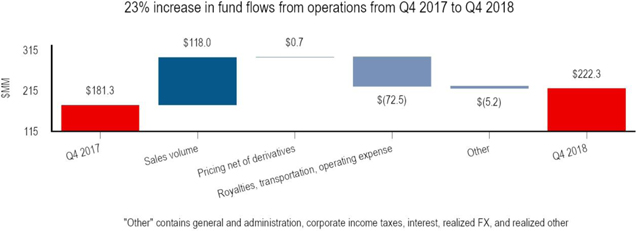
| • | Fund flows from operations increased 23% in Q4 2018 versus Q4 2017. This increase occurred due to higher sales volumes in Q4 2018 partially offset by increased royalties, transportation, and operating expense associated with these higher volumes. |
2018 vs. 2017
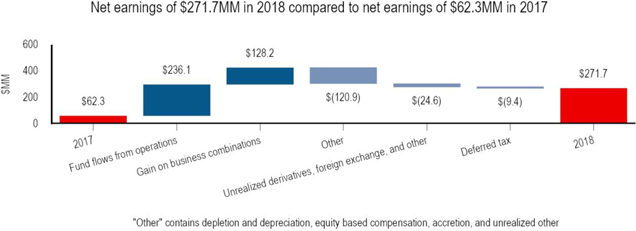
| • | For the year ended December 31, 2018, net earnings of $271.7 million compared to net earnings of $62.3 million in 2017. The increase in net earnings primarily resulted from a year-over-year increase in fund flows from operations of $236.1 million and a gain on business combinations of $128.2 million. These increases were partially offset by increased depletion and depreciation expense resulting from higher production volumes. |
Vermilion Energy Inc. ■ Page 8■ 2018 Management’s Discussion and Analysis
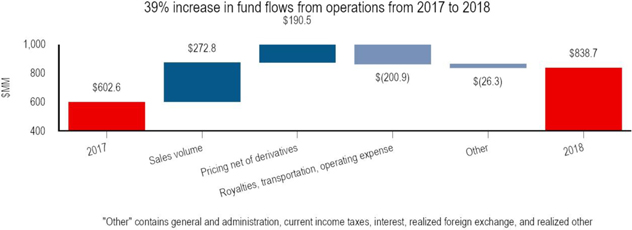
| • | Fund flows from operations increased 39% for the year ended December 31, 2018 versus 2017 due to increased sales volumes and higher realized pricing offset by an increase in royalties, transportation and operating expense. Our consolidated realized price increased by 19% from $44.41/boe to $52.95/boe due to an increase in our relative crude oil production and stronger crude oil and European gas pricing. Our sales volumes increased by 28% due to production increases in Canada, the Netherlands, and the United States. |
| • | On a per unit basis, fund flows from operations increased by 9% from $24.34/boe for the year ended December 31, 2017 to $26.47/boe in 2018. This increase reflects the improvement in our realized price per boe and includes a 25% decrease in per boe general and administration expenses as our overall expense decreased by 4% despite production growth. These decreases were partially offset by higher per unit costs for royalties (resulting from the stronger commodity price environment and higher royalty rates) and operating expenses. Per boe operating expenses increased by $1.47/boe from $9.79/boe in 2017 to $11.26/boe in 2018 due in part to a stronger Euro relative to the Canadian dollar in 2018 and increased expenses associated with higher value crude oil production in Canada. |
Q4 2018 vs. Q3 2018
| • | Consolidated average production of 101,621 boe/d during Q4 2018 increased 6% versus Q3 2018. The increase in production was primarily attributable to new wells brought on production in Canada, growth in the United States through an acquisition closed in Q3 2018, and a full quarter of production from wells brought on production in Q3 2018 in the Netherlands and Hungary. These production increases were partially offset by an 11% decrease in Australia resulting from a planned shutdown of the Wandoo field for maintenance and downtime associated with drilling. |
Q4 2018 vs. Q4 2017
| • | Consolidated average production of 101,621 boe/d in Q4 2018 represented an increase of 40% from Q4 2017 due to growth in Canada and the United States. In Canada, year-over-year growth was the result of both acquisitions and continued development of our Mannville condensate-rich resource play and southeast Saskatchewan light oil development. In the United States, production growth resulted from an acquisition in Q3 2018 and organic drilling activity. |
2018 vs. 2017
| • | For the year ended December 31, 2018, consolidated average production of 87,270 boe/d represented an increase of 28% from 2017 due to production growth in Canada, the United States, and the Netherlands. In Canada, production increased by 19,120 boe/d due to contributions from acquisitions and continued development of our Mannville condensate-rich resource play and southeast Saskatchewan light oil development. In the United States, production growth resulted from an acquisition in Q3 2018 and organic drilling activity. In the Netherlands, year-over-year production growth occurred following the receipt of production permits (the absence of which restricted production from certain wells in the comparable period in 2017). |
Vermilion Energy Inc. ■ Page 9■ 2018 Management’s Discussion and Analysis
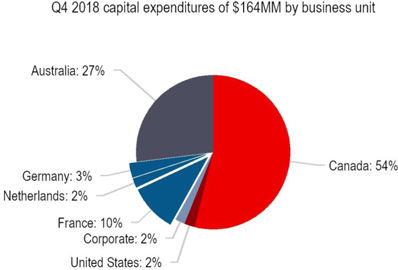
| • | For the three months ended December 31, 2018, capital expenditures of $163.6 million primarily related to activity in Canada and Australia. In Canada, capital expenditures of $90.2 million included the drilling of 72.0 (44.1 net) wells, primarily in southeast Saskatchewan. In Australia, capital expenditures of $43.8 million related to the two (2.0 net) well drilling program. |
Dividends
| • | Declared dividends of $0.23 per common share per month for Q4 2018, resulting in total dividends declared of $2.715 per common share for the year ended December 31, 2018. |
| • | In Q2 2018, we increased our monthly dividend by 7% resulting in a year-over-year increase in cash dividends. The Q2 2018 increase was our fourth dividend increase (previously Vermilion's distribution in the income trust era) since we began paying a distribution in 2003. |
Long-term debt and net debt
| • | Long-term debt increased from $1.3 billion as at December 31, 2017 to $1.8 billion as at December 31, 2018. This increase was primarily a result of increased borrowings on the revolving credit facility to fund acquisitions in 2018. These increases were coupled with the impact of the stronger US dollar on our US denominated Sr. Unsecured Notes. |
| • | Net debt increased to $1.9 billion as at December 31, 2018 from $1.4 billion at December 31, 2017, primarily due to acquisition activity in 2018, partially offset by a $115.6 million decrease in net current derivative liability at December 31, 2018 (from a net liability position of $60.9 million as at December 31, 2017 to a net asset position of $54.7 million). |
| • | The ratio of net debt to fund flows from operations remained consistent at 2.30 (2017 - 2.28) as the increase in net debt was offset by a partial year of contribution from the acquisitions that closed in 2018. |
Vermilion Energy Inc. ■ Page 10■ 2018 Management’s Discussion and Analysis
Commodity Prices
| | | Q4 2018 | | | Q3 2018 | | | Q4 2017 | | | Q4/18 vs.
Q3/18 | | Q4/18 vs.
Q4/17 | | 2018 | | | 2017 | | | 2018 vs.
2017 |
| Crude oil | | | | | | | | | | | | | | | | | | | | | | | | | | |
| WTI ($/bbl) | | | 77.71 | | | | 90.83 | | | | 70.43 | | | (14)% | | 10% | | | 83.94 | | | | 66.13 | | | 27% |
| WTI (US $/bbl) | | | 58.81 | | | | 69.50 | | | | 55.40 | | | (15)% | | 6% | | | 64.77 | | | | 50.95 | | | 27% |
| Edmonton Sweet index ($/bbl) | | | 42.96 | | | | 81.92 | | | | 68.98 | | | (48)% | | (38)% | | | 69.53 | | | | 62.94 | | | 10% |
| Edmonton Sweet index (US $/bbl) | | | 32.51 | | | | 62.68 | | | | 54.26 | | | (48)% | | (40)% | | | 53.65 | | | | 48.49 | | | 11% |
| Saskatchewan LSB index ($/bbl) | | | 58.18 | | | | 82.79 | | | | 68.70 | | | (30)% | | (15)% | | | 73.17 | | | | 62.10 | | | 18% |
| Saskatchewan LSB index (US $/bbl) | | | 44.03 | | | | 63.35 | | | | 54.04 | | | (30)% | | (19)% | | | 56.46 | | | | 47.85 | | | 18% |
| Dated Brent ($/bbl) | | | 89.54 | | | | 98.37 | | | | 78.05 | | | (9)% | | 15% | | | 92.07 | | | | 70.44 | | | 31% |
| Dated Brent (US $/bbl) | | | 67.76 | | | | 75.27 | | | | 61.39 | | | (10)% | | 10% | | | 71.04 | | | | 54.27 | | | 31% |
| Hardisty Heavy ($/bbl) | | | 15.28 | | | | 54.11 | | | | 49.19 | | | (72)% | | (69)% | | | 41.07 | | | | 45.67 | | | (10)% |
| Hardisty Heavy (US $/bbl) | | | 11.56 | | | | 41.40 | | | | 38.69 | | | (72)% | | (70)% | | | 31.69 | | | | 35.19 | | | (10)% |
| Natural gas | | | | | | | | | | | | | | | | | | | | | | | | | | |
| AECO ($/mcf) | | | 1.56 | | | | 1.19 | | | | 1.69 | | | 31% | | (8)% | | | 1.50 | | | | 2.16 | | | (31)% |
| NBP ($/mcf) | | | 11.03 | | | | 10.95 | | | | 8.70 | | | 1% | | 27% | | | 10.35 | | | | 7.49 | | | 38% |
| NBP (€/mcf) | | | 7.31 | | | | 7.20 | | | | 5.81 | | | 2% | | 26% | | | 6.76 | | | | 5.12 | | | 32% |
| TTF ($/mcf) | | | 10.91 | | | | 10.92 | | | | 8.36 | | | —% | | 31% | | | 10.23 | | | | 7.43 | | | 38% |
| TTF (€/mcf) | | | 7.23 | | | | 7.18 | | | | 5.58 | | | 1% | | 30% | | | 6.69 | | | | 5.07 | | | 32% |
| Henry Hub ($/mcf) | | | 4.82 | | | | 3.80 | | | | 3.73 | | | 27% | | 29% | | | 4.01 | | | | 4.04 | | | (1)% |
| Henry Hub (US $/mcf) | | | 3.65 | | | | 2.90 | | | | 2.93 | | | 26% | | 25% | | | 3.09 | | | | 3.11 | | | (1)% |
| Average exchange rates | | | | | | | | | | | | | | | | | | | | | | | | | | |
| CDN $/US $ | | | 1.32 | | | | 1.31 | | | | 1.27 | | | 1% | | 4% | | | 1.30 | | | | 1.30 | | | —% |
| CDN $/Euro | | | 1.51 | | | | 1.52 | | | | 1.50 | | | (1)% | | 1% | | | 1.53 | | | | 1.46 | | | 5% |
| Realized Prices | | | | | | | | | | | | | | | | | | | | | | | | | | |
| Crude oil and condensate ($/bbl) | | | 66.19 | | | | 85.84 | | | | 74.12 | | | (23)% | | (11)% | | | 79.16 | | | | 67.00 | | | 18% |
| NGLs ($/bbl) | | | 25.69 | | | | 27.97 | | | | 29.28 | | | (8)% | | (12)% | | | 26.33 | | | | 25.00 | | | 5% |
| Natural gas ($/mcf) | | | 5.83 | | | | 5.35 | | | | 5.23 | | | 9% | | 11% | | | 5.45 | | | | 4.91 | | | 11% |
| Total ($/boe) | | | 48.90 | | | | 57.90 | | | | 47.49 | | | (16)% | | 3% | | | 52.95 | | | | 44.41 | | | 19% |
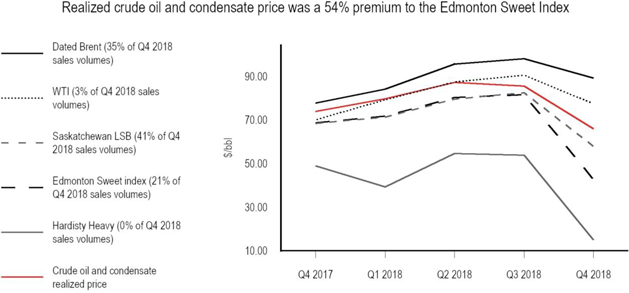
| • | Crude oil prices decreased throughout Q4 2018, driven by record global production levels and macroeconomic concerns. Quarter-over-quarter, WTI and Brent decreased by 14% and 9%, respectively, in Canadian dollar terms. Despite the end-of-year weakness in 2018, for the three months and year ended December 31, 2018, WTI increased 10% and 27%, respectively, in Canadian dollar terms versus the comparable periods in the prior year. Similarly, Brent increased 15% and 31%, respectively, in Canadian dollar terms for the three months and year ended December 31, 2018 versus the comparable periods in 2017. |
Vermilion Energy Inc. ■ Page 11■ 2018 Management’s Discussion and Analysis
| • | Western Canadian takeaway capacity constraints negatively impacted differentials in Q4 2018 versus Q3 2018; the Edmonton Sweet differential widened by $19.48/bbl, the Saskatchewan LSB differential widened by $14.78/bbl, and the Hardisty WCS differential widened by $19.15/bbl. |
| • | Vermilion's crude oil production benefits from light oil pricing and no exposure to significantly discounted heavy crude oil. Approximately 35% of our Q4 2018 crude oil and condensate production was priced at the Dated Brent index (which averaged a premium to WTI of US$8.95/bbl) while the remainder of our crude oil and condensate production was priced at the Saskatchewan LSB, Edmonton Sweet, and WTI indices. As a result, our Q4 2018 crude oil and condensate realized price of $66.19/bbl represented a 54% premium to the Edmonton Sweet index and a 333% premium to Hardisty Heavy. |
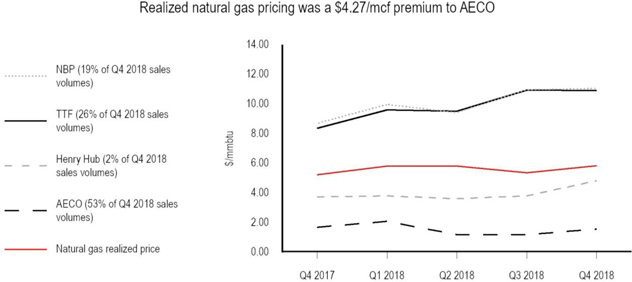
| • | European natural gas prices were relatively unchanged in Q4 2018 compared to Q3 2018. For the year ended December 31, 2018, TTF and NBP prices in Canadian dollar terms increased 38% compared to 2017. Competition from Asia for liquefied natural gas ("LNG") supply, strong demand from both the power sector and for storage injections, and surging carbon prices in the European Union, all played a role in 2018 price strength. |
| • | Natural gas prices at AECO increased by 31% in Q4 2018 as compared to Q3 2018. While the AECO gas market continues to face egress challenges, the seasonal shift from a summer quarter to a winter quarter drove stronger domestic gas demand. |
| • | For Q4 2018, average European natural gas prices represented a $9.41/mcf premium to AECO and a $6.15/mcf premium to Henry Hub pricing. Approximately 45% of our natural gas production in Q4 2018 benefited from this premium European pricing. As a result, our consolidated natural gas realized price was a $4.27/mcf premium to AECO and a $1.01/mcf premium to Henry Hub pricing. |
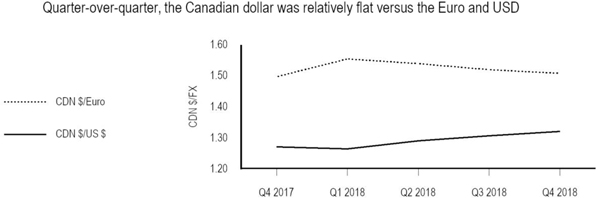
| • | For the three months ended December 31, 2018, the Canadian dollar weakened by 1% against the US dollar quarter-over-quarter. The annual average in 2018 was nearly unchanged versus 2017. |
| • | For the three months ended December 31, 2018, the Canadian dollar strengthened by 1% against the Euro quarter-over-quarter. The annual average in 2018 was 5% weaker versus 2017. |
Vermilion Energy Inc. ■ Page 12■ 2018 Management’s Discussion and Analysis
Canada Business Unit
Production and assets focused in West Pembina near Drayton Valley, Alberta and in southeast Saskatchewan and Manitoba.
| • | Potential for three significant resource plays sharing the same surface infrastructure in the West Pembina region in Alberta: |
| – | Mannville condensate-rich gas (2,400 - 2,700m depth) - in development phase |
| – | Cardium light oil (1,800m depth) - in development phase |
| – | Duvernay condensate-rich gas (3,200 - 3,400m depth) - no investment at present |
| • | Southeast Saskatchewan light oil development: |
| – | Targeting the Mississippian Midale (1,400 - 1,700m depth), Frobisher/Alida (1,200 - 1,400m depth) and Ratcliffe (1,800 - 1,900m) formations |
| Operational and financial review |
Canada business unit ($M except as indicated) | | Q4 2018 | | | Q3 2018 | | | Q4 2017 | | | Q4/18 vs.
Q3/18 | | Q4/18 vs.
Q4/17 | | 2018 | | | 2017 | | | 2018 vs.
2017 |
| Production and sales | | | | | | | | | | | | | | | | | | | | | | | | | | |
| Crude oil and condensate (bbls/d) | | | 29,557 | | | | 28,477 | | | | 9,703 | | | 4% | | 205% | | | 21,154 | | | | 9,051 | | | 134% |
| NGLs (bbls/d) | | | 6,816 | | | | 6,126 | | | | 5,235 | | | 11% | | 30% | | | 5,914 | | | | 4,144 | | | 43% |
| Natural gas (mmcf/d) | | | 146.65 | | | | 136.77 | | | | 107.91 | | | 7% | | 36% | | | 129.37 | | | | 97.89 | | | 32% |
| Total (boe/d) | | | 60,814 | | | | 57,397 | | | | 32,923 | | | 6% | | 85% | | | 48,630 | | | | 29,510 | | | 65% |
| Production mix (% of total) | | | | | | | | | | | | | | | | | | | | | | | | | | |
| Crude oil and condensate | | | 49 | % | | | 50 | % | | | 29 | % | | | | | | | 43 | % | | | 31 | % | | |
| NGLs | | | 11 | % | | | 10 | % | | | 16 | % | | | | | | | 13 | % | | | 14 | % | | |
| Natural gas | | | 40 | % | | | 40 | % | | | 55 | % | | | | | | | 44 | % | | | 55 | % | | |
| Activity | | | | | | | | | | | | | | | | | | | | | | | | | | |
| Capital expenditures | | | 90,211 | | | | 89,837 | | | | 26,865 | | | —% | | 236% | | | 277,857 | | | | 148,667 | | | 87% |
| Acquisitions | | | 12,233 | | | | 6,146 | | | | 788 | | | | | | | | 1,573,964 | | | | 22,011 | | | |
| Gross wells drilled | | | 72.00 | | | | 65.00 | | | | 6.00 | | | | | | | | 173.00 | | | | 44.00 | | | |
| Net wells drilled | | | 44.08 | | | | 58.97 | | | | 4.00 | | | | | | | | 135.93 | | | | 35.56 | | | |
| Financial results | | | | | | | | | | | | | | | | | | | | | | | | | | |
| Sales | | | 186,308 | | | | 243,016 | | | | 94,522 | | | (23)% | | 97% | | | 671,172 | | | | 330,903 | | | 103% |
| Royalties | | | (25,584 | ) | | | (33,801 | ) | | | (9,301 | ) | | (24)% | | 175% | | | (84,696 | ) | | | (33,258 | ) | | 155% |
| Transportation | | | (11,129 | ) | | | (9,057 | ) | | | (4,836 | ) | | 23% | | 130% | | | (29,912 | ) | | | (17,368 | ) | | 72% |
| Operating | | | (62,064 | ) | | | (55,577 | ) | | | (22,356 | ) | | 12% | | 178% | | | (177,499 | ) | | | (80,444 | ) | | 121% |
| General and administration | | | (2,150 | ) | | | (1,316 | ) | | | (2,540 | ) | | 63% | | (15)% | | | (6,057 | ) | | | (9,604 | ) | | (37)% |
| Fund flows from operations | | | 85,381 | | | | 143,265 | | | | 55,489 | | | (40)% | | 54% | | | 373,008 | | | | 190,229 | | | 96% |
| Netbacks ($/boe) | | | | | | | | | | | | | | | | | | | | | | | | | | |
| Sales | | | 33.30 | | | | 46.02 | | | | 31.21 | | | (28)% | | 7% | | | 37.81 | | | | 30.72 | | | 23% |
| Royalties | | | (4.57 | ) | | | (6.40 | ) | | | (3.07 | ) | | (29)% | | 49% | | | (4.77 | ) | | | (3.09 | ) | | 54% |
| Transportation | | | (1.99 | ) | | | (1.72 | ) | | | (1.60 | ) | | 16% | | 24% | | | (1.69 | ) | | | (1.61 | ) | | 5% |
| Operating | | | (11.09 | ) | | | (10.52 | ) | | | (7.38 | ) | | 5% | | 50% | | | (10.00 | ) | | | (7.47 | ) | | 34% |
| General and administration | | | (0.38 | ) | | | (0.25 | ) | | | (0.84 | ) | | 52% | | (55)% | | | (0.34 | ) | | | (0.89 | ) | | (62)% |
| Fund flows from operations netback | | | 15.27 | | | | 27.13 | | | | 18.32 | | | (44)% | | (17)% | | | 21.01 | | | | 17.66 | | | 19% |
| Realized prices | | | | | | | | | | | | | | | | | | | | | | | | | | |
| Crude oil and condensate ($/bbl) | | | 54.04 | | | | 79.86 | | | | 69.20 | | | (32)% | | (22)% | | | 70.16 | | | | 63.41 | | | 11% |
| NGLs ($/bbl) | | | 25.53 | | | | 27.82 | | | | 29.18 | | | (8)% | | (13)% | | | 26.20 | | | | 25.00 | | | 5% |
| Natural gas ($/mcf) | | | 1.73 | | | | 1.44 | | | | 1.88 | | | 20% | | (8)% | | | 1.54 | | | | 2.34 | | | (34)% |
| Total ($/boe) | | | 33.30 | | | | 46.02 | | | | 31.21 | | | (28)% | | 7% | | | 37.81 | | | | 30.72 | | | 23% |
| Reference prices | | | | | | | | | | | | | | | | | | | | | | | | | | |
| WTI (US $/bbl) | | | 58.81 | | | | 69.50 | | | | 55.40 | | | (15)% | | 6% | | | 64.77 | | | | 50.95 | | | 27% |
| Edmonton Sweet index ($/bbl) | | | 42.96 | | | | 81.92 | | | | 68.98 | | | (48)% | | (38)% | | | 69.53 | | | | 62.94 | | | 10% |
| Saskatchewan LSB index ($/bbl) | | | 58.18 | | | | 82.79 | | | | 68.70 | | | (30)% | | (15)% | | | 73.17 | | | | 62.10 | | | 18% |
| AECO ($/mcf) | | | 1.56 | | | | 1.19 | | | | 1.69 | | | 31% | | (8)% | | | 1.50 | | | | 2.16 | | | (31)% |
Vermilion Energy Inc. ■ Page 13■ 2018 Management’s Discussion and Analysis
Production
| • | Q4 2018 production increased 6% from the prior quarter due to strong operating performance and new well completions from our Saskatchewan and Alberta assets. Quarterly production increased 82% year-over-year primarily due to our acquisition of Spartan Energy Corp. in May 2018. |
| • | Production in Alberta averaged approximately 34,000 boe/d in Q4 2018, an increase of 4% quarter-over-quarter. |
| • | Production in Saskatchewan averaged approximately 26,800 boe/d in Q4 2018, an increase of 9% quarter-over-quarter. |
Activity review
| • | Vermilion drilled 43 (41.1 net) operated wells and participated in the drilling of 29 (2.9 net) non-operated wells in Canada during Q4 2018. |
Alberta
| – | In Q4 2018, we drilled or participated in nine (8.9 net) operated and two (0.4 net) non-operated wells, completed four (3.9 net) operated and three (0.8 net) non-operated wells, and brought on production four (4.0 net) operated and four (1.1 net) non-operated wells in Alberta. |
| – | In 2018, we drilled or participated in 27 (23.4 net) wells in Alberta, which included the drilling of 23 (20.7 net) Mannville wells. |
Saskatchewan
| – | In Q4 2018, we drilled or participated in 34 (32.3 net) operated wells and 27 (2.5 net) non-operated wells, completed 40 (37.3 net) operated and 26 (2.8 net) non-operated wells, and brought 51 (48.3 net) operated and 27 (3.2 net) non-operated wells on production. |
| – | In 2018, we drilled or participated in 146 (112.6 net) wells in Saskatchewan. |
| • | On May 28, 2018, Vermilion acquired 100% of the issued and outstanding common shares of Spartan, a publicly traded southeast Saskatchewan oil and gas producer. Consideration consisted of the issuance of 27.9 million Vermilion common shares valued at approximately $1.2 billion (based on the closing price per Vermilion common share of $44.30 on the Toronto Stock Exchange on May 28, 2018). Vermilion also assumed approximately $172 million of Spartan's outstanding debt at the time the transaction closed. |
Sales
| • | The realized price for our crude oil and condensate production in Canada is linked to WTI subject to market conditions in western Canada (as reflected by the Saskatchewan LSB index price in Saskatchewan and the Edmonton Sweet index price in Alberta). The realized price of our natural gas in Canada is based on the AECO index. |
| • | Q4 2018 sales per boe decreased 28% compared to Q3 2018 consistent with the decrease in crude oil and condensate pricing. Quarter-over-quarter, our crude oil and condensate production mix remained stable at approximately 50% of production. |
| • | For the year ended December 31, 2018, sales per boe increased versus 2017 due to increased Saskatchewan LSB and Edmonton Sweet index pricing coupled with an increased weighting towards higher-priced crude oil and condensate production. |
Royalties
| • | Royalties as a percentage of sales for the three months and year ended December 31, 2018 of 13.7% and 12.6%, respectively, increased from the comparable periods in 2017 due to the impact of the Spartan assets, which have higher associated royalty rates. |
Transportation
| • | Transportation expense for the three months and year ended December 31, 2018 increased on a per unit basis versus all comparable periods due to an increase in production that incurs higher transportation expense. |
Operating
| • | Operating expense increased in Q4 2018 versus Q3 2018 on both a dollar and per unit basis. On a dollar basis, this increase was due to higher production volumes and the per unit increase was caused by a favourable adjustment recorded in the prior quarter. |
| • | For the three months and year ended December 31, 2018, operating expense increased on both a dollar and per unit basis versus the comparable periods in 2017. On a dollar basis, the increase in operating expense was driven by higher production volumes during Q4 2018. On a per unit basis, the increase in operating expense was primarily attributable to the impact of production from the Spartan assets, which have higher associated per unit operating expense. |
Vermilion Energy Inc. ■ Page 14■ 2018 Management’s Discussion and Analysis
France Business Unit
| • | Largest oil producer in France, constituting approximately three-quarters of domestic oil production. |
| • | Low base decline producing assets comprised of large conventional oil fields with high working interests located in the Aquitaine and Paris Basins. |
| • | Identified inventory of workover, infill drilling, and secondary recovery opportunities. |
| Operational and financial review |
France business unit
($M except as indicated) | | Q4 2018 | | | Q3 2018 | | | Q4 2017 | | | Q4/18 vs.
Q3/18 | | Q4/18 vs.
Q4/17 | | 2018 | | | 2017 | | | 2018 vs.
2017 |
| Production | | | | | | | | | | | | | | | | | | | | | | | | | | |
| Crude oil (bbls/d) | | | 11,317 | | | | 11,407 | | | | 11,215 | | | (1)% | | 1% | | | 11,362 | | | | 11,084 | | | 3% |
| Natural gas (mmcf/d) | | | 0.82 | | | | — | | | | — | | | 100% | | 100% | | | 0.21 | | | | — | | | 100% |
| Total (boe/d) | | | 11,454 | | | | 11,407 | | | | 11,215 | | | —% | | 2% | | | 11,396 | | | | 11,085 | | | 3% |
| Sales | | | | | | | | | | | | | | | | | | | | | | | | | | |
| Crude oil (bbls/d) | | | 10,975 | | | | 11,482 | | | | 11,397 | | | (4)% | | (4)% | | | 11,012 | | | | 10,950 | | | 1% |
| Natural gas (mmcf/d) | | | 0.82 | | | | — | | | | — | | | 100% | | 100% | | | 0.21 | | | | — | | | 100% |
| Total (boe/d) | | | 11,111 | | | | 11,482 | | | | 11,397 | | | (3)% | | (3)% | | | 11,047 | | | | 10,950 | | | 1% |
| Inventory (mbbls) | | | | | | | | | | | | | | | | | | | | | | | | | | |
| Opening crude oil inventory | | | 293 | | | | 300 | | | | 214 | | | | | | | | 197 | | | | 148 | | | |
| Crude oil production | | | 1,041 | | | | 1,049 | | | | 1,032 | | | | | | | | 4,147 | | | | 4,046 | | | |
| Crude oil sales | | | (1,009 | ) | | | (1,056 | ) | | | (1,049 | ) | | | | | | | (4,019 | ) | | | (3,997 | ) | | |
| Closing crude oil inventory | | | 325 | | | | 293 | | | | 197 | | | | | | | | 325 | | | | 197 | | | |
| Activity | | | | | | | | | | | | | | | | | | | | | | | | | | |
| Capital expenditures | | | 17,008 | | | | 15,779 | | | | 20,027 | | | 8% | | (15)% | | | 79,758 | | | | 73,381 | | | 9% |
| Gross wells drilled | | | — | | | | — | | | | 2.00 | | | | | | | | 5.00 | | | | 7.00 | | | |
| Net wells drilled | | | — | | | | — | | | | 2.00 | | | | | | | | 5.00 | | | | 7.00 | | | |
| Financial results | | | | | | | | | | | | | | | | | | | | | | | | | | |
| Sales | | | 85,889 | | | | 100,840 | | | | 78,778 | | | (15)% | | 9% | | | 360,602 | | | | 268,103 | | | 35% |
| Royalties | | | (11,976 | ) | | | (12,765 | ) | | | (10,599 | ) | | (6)% | | 13% | | | (46,781 | ) | | | (28,565 | ) | | 64% |
| Transportation | | | (3,242 | ) | | | (2,013 | ) | | | (4,475 | ) | | 61% | | (28)% | | | (10,426 | ) | | | (14,627 | ) | | (29)% |
| Operating | | | (14,015 | ) | | | (13,733 | ) | | | (14,332 | ) | | 2% | | (2)% | | | (54,690 | ) | | | (51,002 | ) | | 7% |
| General and administration | | | (3,792 | ) | | | (3,365 | ) | | | (4,259 | ) | | 13% | | (11)% | | | (14,170 | ) | | | (13,585 | ) | | 4% |
| Current income taxes | | | (884 | ) | | | (6,913 | ) | | | (2,348 | ) | | (87)% | | (62)% | | | (15,084 | ) | | | (10,556 | ) | | 43% |
| Fund flows from operations | | | 51,980 | | | | 62,051 | | | | 42,765 | | | (16)% | | 22% | | | 219,451 | | | | 149,768 | | | 47% |
| Netbacks ($/boe) | | | | | | | | | | | | | | | | | | | | | | | | | | |
| Sales | | | 84.02 | | | | 95.46 | | | | 75.13 | | | (12)% | | 12% | | | 89.44 | | | | 67.08 | | | 33% |
| Royalties | | | (11.72 | ) | | | (12.08 | ) | | | (10.11 | ) | | (3)% | | 16% | | | (11.60 | ) | | | (7.15 | ) | | 62% |
| Transportation | | | (3.17 | ) | | | (1.91 | ) | | | (4.27 | ) | | 66% | | (26)% | | | (2.59 | ) | | | (3.66 | ) | | (29)% |
| Operating | | | (13.71 | ) | | | (13.00 | ) | | | (13.67 | ) | | 5% | | —% | | | (13.56 | ) | | | (12.76 | ) | | 6% |
| General and administration | | | (3.71 | ) | | | (3.19 | ) | | | (4.06 | ) | | 16% | | (9)% | | | (3.51 | ) | | | (3.40 | ) | | 3% |
| Current income taxes | | | (0.86 | ) | | | (6.54 | ) | | | (2.24 | ) | | (87)% | | (62)% | | | (3.74 | ) | | | (2.64 | ) | | 42% |
| Fund flows from operations netback | | | 50.85 | | | | 58.74 | | | | 40.78 | | | (13)% | | 25% | | | 54.44 | | | | 37.47 | | | 45% |
| Reference prices | | | | | | | | | | | | | | | | | | | | | | | | | | |
| Dated Brent (US $/bbl) | | | 67.76 | | | | 75.27 | | | | 61.39 | | | (10)% | | 10% | | | 71.04 | | | | 54.27 | | | 31% |
| Dated Brent ($/bbl) | | | 89.54 | | | | 98.37 | | | | 78.05 | | | (9)% | | 15% | | | 92.07 | | | | 70.44 | | | 31% |
Vermilion Energy Inc. ■ Page 15■ 2018 Management’s Discussion and Analysis
Production
| • | Q4 2018 production increased slightly from the prior quarter due continued strong performance from the 2018 Champotran wells and continued workover success in the Aquitaine Basin. Production increased 2% year-over-year primarily due to production additions from our 2018 drilling program. |
Activity review
| • | Our 2018 capital program included the drilling and completion of two (2.0 net) Neocomian wells and three (3.0 net) Champotran wells in the first quarter of 2018. In addition to the drilling and completion activity, we continued our workover and optimization programs in the Aquitaine and Paris Basins throughout 2018. |
Sales
| • | Crude oil in France is priced with reference to Dated Brent. |
| • | Q4 2018 sales per boe decreased versus Q3 2018, consistent with the weakening in the Dated Brent reference price. |
| • | For the three months and year ended December 31, 2018 versus the comparable periods in the prior year, the increase in sales per boe was consistent with increases in the Dated Brent benchmark price. |
Royalties
| • | Royalties in France relate to two components: RCDM (levied on units of production and not subject to changes in commodity prices) and R31 (based on a percentage of sales). |
| • | Royalties as a percentage of sales was 13.9% in Q4 2018 compared to 12.7% in Q3 2018. This increase was due the impact of fixed per-unit RCDM royalties relative to lower revenues resulting from weaker commodity prices. |
| • | For the three months and year ended December 31, 2018, royalties as a percentage of sales of 13.9% and 13.0% increased from 13.5% and 10.7%, respectively, in the comparable periods in the prior year. These increases were due to the impact of a royalty rate increase enacted in 2017. |
Transportation
| • | Transportation expense increased in Q4 2018 compared to Q3 2018 due to higher pipeline and terminal maintenance work performed in Q4 2018. |
| • | Transportation expense for the three months and year ended December 31, 2018 decreased versus the comparable periods in the prior year, primarily due to the impact of IFRS 16 adoption in 2018. Please refer to "Recently Adopted Accounting Pronouncements" for additional information. |
Operating
| • | Operating expense in Q4 2018 was relatively consistent with Q3 2018 and Q4 2017 on a dollar basis. On a per unit basis, operating expense increased in Q4 2018 versus Q3 2018 due to the impact of fixed costs on lower sales volumes, which was a result of shipment timing. |
| • | For the year ended December 31, 2018, operating expense increased versus 2017 on both a dollar and per unit basis. These increases were primarily due to the impact of a stronger Euro versus the Canadian dollar, increased cost and usage of electricity, and higher maintenance activity in 2018. |
General and administration
| • | Fluctuations in general and administration expense for all comparable periods were due to the timing of expenditures and allocations from our corporate segment. |
Current income taxes
| • | In France, current income taxes are applied to taxable income, after eligible deductions, at a statutory rate of 34.4%. |
| • | Current income taxes for the year ended December 31, 2018 versus the comparative period were higher mainly due to higher Dated Brent prices resulting in increased sales. |
| • | Current income taxes for Q4 2018 versus Q3 2018 and Q4 2017 were lower due to increased tax deductions for depletion. |
| • | On December 21, 2017, the French Parliament approved the Finance Bill for 2018. The Finance Bill for 2018 provides for a progressive decrease of the French corporate income tax rate from 34.4% to 25.8% by 2022, with the first reduction planned for 2019 to 32.0%. |
Vermilion Energy Inc. ■ Page 16■ 2018 Management’s Discussion and Analysis
Netherlands Business Unit
| • | Entered the Netherlands in 2004. |
| • | Second largest onshore operator. |
| • | Interests include 26 onshore licenses (all operated) and 17 offshore licenses (all non-operated). |
| • | Licenses include more than 930,000 net acres of land, 90% of which is undeveloped. |
| Operational and financial review |
Netherlands business unit ($M except as indicated) | | Q4 2018 | | | Q3 2018 | | | Q4 2017 | | | Q4/18 vs.
Q3/18 | | Q4/18 vs.
Q4/17 | | 2018 | | | 2017 | | | 2018 vs.
2017 |
| Production and sales | | | | | | | | | | | | | | | | | | | | | | | | | | |
| Condensate (bbls/d) | | | 112 | | | | 84 | | | | 105 | | | 33% | | 7% | | | 90 | | | | 90 | | | —% |
| Natural gas (mmcf/d) | | | 51.82 | | | | 44.37 | | | | 55.66 | | | 17% | | (7)% | | | 46.13 | | | | 40.54 | | | 14% |
| Total (boe/d) | | | 8,749 | | | | 7,479 | | | | 9,381 | | | 17% | | (7)% | | | 7,779 | | | | 6,847 | | | 14% |
| Activity | | | | | | | | | | | | | | | | | | | | | | | | | | |
| Capital expenditures | | | 2,454 | | | | 5,056 | | | | 12,300 | | | (51)% | | (80)% | | | 17,483 | | | | 31,575 | | | (45)% |
| Acquisitions | | | (7,860 | ) | | | 2,874 | | | | (38 | ) | | | | | | | (2,087 | ) | | | (24 | ) | | |
| Gross wells drilled | | | — | | | | — | | | | — | | | | | | | | — | | | | 2.00 | | | |
| Net wells drilled | | | — | | | | — | | | | — | | | | | | | | — | | | | 1.02 | | | |
| Financial results | | | | | | | | | | | | | | | | | | | | | | | | | | |
| Sales | | | 52,937 | | | | 41,793 | | | | 40,914 | | | 27% | | 29% | | | 165,916 | | | | 108,060 | | | 54% |
| Royalties | | | (537 | ) | | | (1,049 | ) | | | (647 | ) | | (49)% | | (17)% | | | (3,181 | ) | | | (1,722 | ) | | 85% |
| Operating | | | (6,765 | ) | | | (5,812 | ) | | | (6,981 | ) | | 16% | | (3)% | | | (26,681 | ) | | | (21,212 | ) | | 26% |
| General and administration | | | (709 | ) | | | (320 | ) | | | (546 | ) | | 122% | | 30% | | | (1,947 | ) | | | (2,212 | ) | | (12)% |
| Current income taxes | | | (7,492 | ) | | | 1,729 | | | | 6,975 | | | N/A | | N/A | | | (16,561 | ) | | | 3,331 | | | N/A |
| Fund flows from operations | | | 37,434 | | | | 36,341 | | | | 39,715 | | | 3% | | (6)% | | | 117,546 | | | | 86,245 | | | 36% |
| Netbacks ($/boe) | | | | | | | | | | | | | | | | | | | | | | | | | | |
| Sales | | | 65.77 | | | | 60.74 | | | | 47.41 | | | 8% | | 39% | | | 58.44 | | | | 43.24 | | | 35% |
| Royalties | | | (0.67 | ) | | | (1.52 | ) | | | (0.75 | ) | | (56)% | | (11)% | | | (1.12 | ) | | | (0.69 | ) | | 62% |
| Operating | | | (8.40 | ) | | | (8.45 | ) | | | (8.09 | ) | | (1)% | | 4% | | | (9.40 | ) | | | (8.49 | ) | | 11% |
| General and administration | | | (0.88 | ) | | | (0.47 | ) | | | (0.63 | ) | | 87% | | 40% | | | (0.69 | ) | | | (0.89 | ) | | (22)% |
| Current income taxes | | | (9.31 | ) | | | 2.51 | | | | 8.08 | | | N/A | | N/A | | | (5.83 | ) | | | 1.33 | | | N/A |
| Fund flows from operations netback | | | 46.51 | | | | 52.81 | | | | 46.02 | | | (12)% | | 1% | | | 41.40 | | | | 34.50 | | | 20% |
| Realized prices | | | | | | | | | | | | | | | | | | | | | | | | | | |
| Condensate ($/bbl) | | | 69.95 | | | | 82.32 | | | | 66.38 | | | (15)% | | 5% | | | 74.85 | | | | 56.90 | | | 32% |
| Natural gas ($/mcf) | | | 10.95 | | | | 10.08 | | | | 7.87 | | | 9% | | 39% | | | 9.71 | | | | 7.18 | | | 35% |
| Total ($/boe) | | | 65.77 | | | | 60.74 | | | | 47.41 | | | 8% | | 39% | | | 58.44 | | | | 43.24 | | | 35% |
| Reference prices | | | | | | | | | | | | | | | | | | | | | | | | | | |
| TTF ($/mcf) | | | 10.91 | | | | 10.92 | | | | 8.36 | | | —% | | 31% | | | 10.23 | | | | 7.43 | | | 38% |
| TTF (€/mcf) | | | 7.23 | | | | 7.18 | | | | 5.58 | | | 1% | | 30% | | | 6.69 | | | | 5.07 | | | 32% |
Vermilion Energy Inc. ■ Page 17■ 2018 Management’s Discussion and Analysis
Production
| • | Q4 2018 production increased 17% from the prior quarter due to the contribution of a full quarter of production from the Eesveen-02 well (60% working interest), which we brought on production at a restricted rate of 10 mmcf/d net late in the third quarter of 2018. Production decreased 7% year-over-year primarily due to natural declines and permitting delays of certain drilling and workover activities, which impacted 2018 full-year volumes. |
Activity review
| • | Our 2018 capital activity was primarily focused on planned workovers, facilities maintenance, and advancing our drilling permits ahead of our 2019 drilling campaign. |
| • | In September 2018 we brought the Eesveen-02 well on production at a restricted rate of 10 mmcf/d net. |
| • | In Q4 2018 we consolidated working interests on some of our existing assets and added minor working interest ownerships in several non-operated offshore licenses. The acquisition contributed approximately 200 boe/d to our Q4 2018 production results. Consideration for the acquisition required no cash payment but included the assumption of the full ARO associated with the incremental working interest. The ARO is estimated at a PV10 of €20 million. At closing we received a cash payment and positive working capital totaling €5.8 million due to the transaction having an effective date of January 1, 2018. |
Sales
| • | The price of our natural gas in the Netherlands is based on the TTF index. |
| • | Q4 2018 sales increased on a dollar basis versus Q3 2018 due to higher sales volumes coupled with increased TTF commodity pricing. Sales for the year ended December 31, 2018 increased versus the same period in the prior year due to the stronger TTF reference price in 2018, as well as an increase in sold volumes in 2018. |
| • | For the three months and year ended December 31, 2018, sales per boe increased versus all comparable periods, consistent with increases in the TTF reference price. |
Royalties
| • | In the Netherlands, certain wells are subject to overriding royalties while some wells are subject to royalties that take effect only when specified production levels are exceeded. As such, royalty expense may fluctuate from period to period depending on the amount of production from those wells. Royalties in the three months and year ended December 31, 2018 represented 1.0% and 1.9% of sales, respectively. |
Transportation
| • | Our production in the Netherlands is not subject to transportation expense as gas is sold at the plant gate. |
Operating
| • | Q4 2018 operating expense increased on a dollar basis versus Q3 2018 due to a prior period adjustment booked in Q4 2018 relating to power usage, as well as increased permitting costs. On a per boe basis, operating expense was relatively consistent with the prior quarter as higher costs were offset by an increase in sales volumes. Operating expense on a per unit basis increased Q4 2018 versus Q4 2017 due to the impact of fixed costs over lower sales volumes. |
| • | For the year ended December 31, 2018, operating expense increased on a dollar basis versus the comparable period in 2017 primarily due to increased maintenance activity coupled with an unfavourable foreign exchange impact. On a per unit basis, operating expense increased due to the strengthening of the Euro versus the Canadian Dollar. |
General and administration
| • | Fluctuations in general and administration expense for all comparable periods were due to the timing of expenditures and allocations from our corporate segment. |
Current income taxes
| • | In the Netherlands, current income taxes are applied to taxable income, after eligible deductions and a 10% uplift deduction applied to operating expenses, eligible general and administration and tax deductions for depletion and asset retirement obligations, at a tax rate of 50%. |
| • | Current income taxes in Q4 2018 and for the year ended December 31, 2018 versus the comparative periods were higher mainly due to higher TTF prices and volumes resulting in increased sales and an increased tax deduction taken in Q4 2017 for future asset retirement obligations resulting from a reduction in the applicable discount rate assumption. |
| • | On December 18, 2018, the Dutch government approved the 2019 Tax Plan. The Bill provides for reduced corporate tax rates from 25.0% to 20.5% by 2021, with the first reduction planned for 2020 to 22.55%. Due to the tax regime applicable to natural gas producers in the Netherlands, the reduction to the corporate tax rate is not expected to have a material impact to Vermilion taxes in the Netherlands. |
Vermilion Energy Inc. ■ Page 18■ 2018 Management’s Discussion and Analysis
Germany Business Unit
| • | Entered Germany in 2014 through the acquisition of a non-operated natural gas producing property. |
| • | Executed a significant exploration license farm-in agreement in 2015 and acquired operated producing properties in 2016. |
| • | Producing assets consist of seven gas and eight oil producing fields with extensive infrastructure in place. |
| • | Significant land position of approximately 1.2 million net acres (97% undeveloped). |
| Operational and financial review |
Germany business unit ($M except as indicated) | | Q4 2018 | | | Q3 2018 | | | Q4 2017 | | | Q4/18 vs.
Q3/18 | | Q4/18 vs.
Q4/17 | | 2018 | | | 2017 | | | 2018 vs.
2017 |
| Production | | | | | | | | | | | | | | | | | | | | | | | | | | |
| Crude oil (bbls/d) | | | 913 | | | | 1,019 | | | | 1,148 | | | (10)% | | (20)% | | | 1,004 | | | | 1,060 | | | (5)% |
| Natural gas (mmcf/d) | | | 16.94 | | | | 14.88 | | | | 18.19 | | | 14% | | (7)% | | | 15.66 | | | | 19.39 | | | (19)% |
| Total (boe/d) | | | 3,736 | | | | 3,498 | | | | 4,180 | | | 7% | | (11)% | | | 3,614 | | | | 4,291 | | | (16)% |
| Sales | | | | | | | | | | | | | | | | | | | | | | | | | | |
| Crude oil (bbls/d) | | | 970 | | | | 929 | | | | 1,067 | | | 4% | | (9)% | | | 1,065 | | | | 993 | | | 7% |
| Natural gas (mmcf/d) | | | 16.94 | | | | 14.88 | | | | 20.12 | | | 14% | | (16)% | | | 15.66 | | | | 19.79 | | | (21)% |
| Total (boe/d) | | | 3,794 | | | | 3,408 | | | | 4,420 | | | 11% | | (14)% | | | 3,675 | | | | 4,292 | | | (14)% |
| Production mix (% of total) | | | | | | | | | | | | | | | | | | | | | | | | | | |
| Crude oil | | | 24 | % | | | 29 | % | | | 27 | % | | | | | | | 28 | % | | | 25 | % | | |
| Natural gas | | | 76 | % | | | 71 | % | | | 73 | % | | | | | | | 72 | % | | | 75 | % | | |
| Activity | | | | | | | | | | | | | | | | | | | | | | | | | | |
| Capital expenditures | | | 4,580 | | | | 6,497 | | | | 5,279 | | | (30)% | | (13)% | | | 15,806 | | | | 9,531 | | | 66% |
| Acquisitions | | | 706 | | | | 959 | | | | — | | | | | | | | 1,665 | | | | — | | | |
| Financial results | | | | | | | | | | | | | | | | | | | | | | | | | | |
| Sales | | | 21,897 | | | | 21,052 | | | | 18,898 | | | 4% | | 16% | | | 82,449 | | | | 68,696 | | | 20% |
| Royalties | | | (1,190 | ) | | | (2,448 | ) | | | (1,798 | ) | | (51)% | | (34)% | | | (6,626 | ) | | | (6,655 | ) | | —% |
| Transportation | | | (1,452 | ) | | | (1,191 | ) | | | (1,164 | ) | | 22% | | 25% | | | (6,420 | ) | | | (6,207 | ) | | 3% |
| Operating | | | (6,615 | ) | | | (4,863 | ) | | | (6,025 | ) | | 36% | | 10% | | | (23,048 | ) | | | (20,176 | ) | | 14% |
| General and administration | | | (2,308 | ) | | | (2,073 | ) | | | (2,080 | ) | | 11% | | 11% | | | (7,401 | ) | | | (7,767 | ) | | (5)% |
| Fund flows from operations | | | 10,332 | | | | 10,477 | | | | 7,831 | | | (1)% | | 32% | | | 38,954 | | | | 27,891 | | | 40% |
| Netbacks ($/boe) | | | | | | | | | | | | | | | | | | | | | | | | | | |
| Sales | | | 62.74 | | | | 67.15 | | | | 50.22 | | | (7)% | | 25% | | | 61.47 | | | | 44.37 | | | 39% |
| Royalties | | | (3.41 | ) | | | (7.81 | ) | | | (4.78 | ) | | (56)% | | (29)% | | | (4.94 | ) | | | (4.30 | ) | | 15% |
| Transportation | | | (4.16 | ) | | | (3.80 | ) | | | (3.09 | ) | | 9% | | 35% | | | (4.79 | ) | | | (4.01 | ) | | 19% |
| Operating | | | (18.95 | ) | | | (15.51 | ) | | | (16.01 | ) | | 22% | | 18% | | | (17.18 | ) | | | (13.03 | ) | | 32% |
| General and administration | | | (6.61 | ) | | | (6.61 | ) | | | (5.53 | ) | | —% | | 20% | | | (5.52 | ) | | | (5.02 | ) | | 10% |
| Fund flows from operations netback | | | 29.61 | | | | 33.42 | | | | 20.81 | | | (11)% | | 42% | | | 29.04 | | | | 18.01 | | | 61% |
| Realized prices | | | | | | | | | | | | | | | | | | | | | | | | | | |
| Crude oil ($/bbl) | | | 75.53 | | | | 92.45 | | | | 72.58 | | | (18)% | | 4% | | | 84.14 | | | | 63.91 | | | 32% |
| Natural gas ($/mcf) | | | 9.72 | | | | 9.61 | | | | 7.07 | | | 1% | | 37% | | | 8.70 | | | | 6.38 | | | 36% |
| Total ($/boe) | | | 62.74 | | | | 67.15 | | | | 50.22 | | | (7)% | | 25% | | | 61.47 | | | | 44.37 | | | 39% |
| Reference prices | | | | | | | | | | | | | | | | | | | | | | | | | | |
| Dated Brent (US $/bbl) | | | 67.76 | | | | 75.27 | | | | 61.39 | | | (10)% | | 10% | | | 71.04 | | | | 54.27 | | | 31% |
| Dated Brent ($/bbl) | | | 89.54 | | | | 98.37 | | | | 78.05 | | | (9)% | | 15% | | | 92.07 | | | | 70.44 | | | 31% |
| TTF ($/mcf) | | | 10.91 | | | | 10.92 | | | | 8.36 | | | —% | | 31% | | | 10.23 | | | | 7.43 | | | 38% |
| TTF (€/mcf) | | | 7.23 | | | | 7.18 | | | | 5.58 | | | 1% | | 30% | | | 6.69 | | | | 5.07 | | | 32% |
Vermilion Energy Inc. ■ Page 19■ 2018 Management’s Discussion and Analysis
Production
| • | Q4 2018 production increased 7% from the prior quarter due to the restoration of a non-operated gas processing facility in the prior quarter, partially offset by other minor unplanned downtime events on our non-operated oil assets. Production decreased 11% year-over-year due to downtime at a non-operated gas processing plant that began in the middle of Q2 2018 and continued through the middle of Q3 2018. |
Activity review
| • | Our 2018 capital program focused on permitting and other pre-drill activities associated with our first operated well in Germany, Burgmoor Z5 (46% working interest) in the Dümmersee-Uchte area, which we expect to drill in 2019, in addition to performing workovers opportunities on our operated asset base. |
Sales
| • | The price of our natural gas in Germany is based on the NCG and GPL indexes, which are both highly correlated to the TTF benchmark. Crude oil in Germany is priced with reference to Dated Brent. |
| • | Sales per boe for Q4 2018 decreased versus Q3 2018, and increased versus the comparable periods in 2017, consistent with fluctuations in crude oil and natural gas benchmark prices. |
| • | Sales per boe for 2018 increased versus 2017 due to the increase in crude oil and natural gas benchmark prices. |
Royalties
| • | Our production in Germany is subject to state and private royalties on sales after certain eligible deductions. |
| • | Royalties as a percentage of sales were lower in Q4 2018 versus Q3 2018 and Q4 2017 due to an annual rate adjustment recorded in Q4 2018. Royalties as a percentage of sales for the year ended December 31, 2018 were lower than the comparable period in the prior year due to increased production of crude oil with lower associated royalty rates. |
Transportation
| • | Transportation expense in Germany relates to costs incurred to deliver natural gas from the processing facility to the customer and deliver crude oil to the refinery. |
| • | Transportation expense in Q4 2018 was higher than Q3 2018 due to the impact of a favourable prior period adjustment recorded in Q3 2018. Transportation expense increased versus Q4 2017 due to higher volumes of crude oil transported in Q4 2018. |
| • | Transportation expense for the year ended December 31, 2018 increased slightly versus the comparable period in the prior year due to higher tariffs on crude oil transport in 2018. |
Operating
| • | Operating expense on a per unit basis in Q4 2018 was higher versus Q3 2018 due to higher activity levels at non-operated properties and increased gas processing fees. |
| • | Operating expense on a per unit basis increased for the three months and year ended December 31, 2018, versus the comparable periods in the prior year. The increase was primarily due to increased gas processing tariffs, the impact of fixed costs on lower volumes and the impact of a stronger Euro versus the Canadian dollar. |
General and administration
| • | Fluctuations in general and administration expense for all comparable periods were due to the timing of expenditures and allocations from our corporate segment. |
Current income taxes
| • | As a result of our tax pools in Germany, we do not expect to incur current income taxes for 2019 in the German Business Unit. This is subject to change in response to production variations, commodity price fluctuations, the timing of capital expenditures, and other eligible in-country adjustments. |
Vermilion Energy Inc. ■ Page 20■ 2018 Management’s Discussion and Analysis
Ireland Business Unit
| • | Entered Ireland in 2009 with an investment in the offshore Corrib gas field. |
| • | The Corrib gas field is located offshore northwest Ireland and comprises six offshore wells, offshore and onshore sales and transportation pipeline segments, as well as a natural gas processing facility. |
| • | In Q4 2018, Vermilion assumed operatorship of the Corrib Natural Gas Project (the "Corrib Project") and increased its ownership stake by 1.5% to 20% following the completion of a strategic partnership with Canada Pension Plan Investment Board (“CPPIB”). |
| Operational and financial review |
Ireland business unit ($M except as indicated) | | Q4 2018 | | | Q3 2018 | | | Q4 2017 | | | Q4/18 vs.
Q3/18 | | Q4/18 vs.
Q4/17 | | 2018 | | | 2017 | | | 2018 vs.
2017 |
| Production and sales | | | | | | | | | | | | | | | | | | | | | | | | | | |
| Natural gas (mmcf/d) | | | 52.03 | | | | 51.38 | | | | 56.23 | | | 1% | | (7)% | | | 55.17 | | | | 58.43 | | | (6)% |
| Total (boe/d) | | | 8,672 | | | | 8,563 | | | | 9,372 | | | 1% | | (7)% | | | 9,195 | | | | 9,737 | | | (6)% |
| Activity | | | | | | | | | | | | | | | | | | | | | | | | | | |
| Capital expenditures | | | 140 | | | | (50 | ) | | | 327 | | | N/A | | (57)% | | | 224 | | | | 551 | | | (59)% |
| Acquisitions | | | (5,572 | ) | | | — | | | | — | | | | | | | | (5,572 | ) | | | — | | | |
| Financial results | | | | | | | | | | | | | | | | | | | | | | | | | | |
| Sales | | | 53,385 | | | | 50,228 | | | | 43,793 | | | 6% | | 22% | | | 205,150 | | | | 153,330 | | | 34% |
| Transportation | | | (1,115 | ) | | | (1,460 | ) | | | (1,496 | ) | | (24)% | | (25)% | | | (5,129 | ) | | | (5,205 | ) | | (1)% |
| Operating | | | (4,497 | ) | | | (3,354 | ) | | | (2,977 | ) | | 34% | | 51% | | | (15,366 | ) | | | (17,596 | ) | | (13)% |
| General and administration | | | (2,037 | ) | | | (3,597 | ) | | | (517 | ) | | (43)% | | 294% | | | (8,386 | ) | | | (2,320 | ) | | 261% |
| Fund flows from operations | | | 45,736 | | | | 41,817 | | | | 38,803 | | | 9% | | 18% | | | 176,269 | | | | 128,209 | | | 37% |
| Netbacks ($/boe) | | | | | | | | | | | | | | | | | | | | | | | | | | |
| Sales | | | 66.91 | | | | 63.76 | | | | 50.79 | | | 5% | | 32% | | | 61.12 | | | | 43.14 | | | 42% |
| Transportation | | | (1.40 | ) | | | (1.85 | ) | | | (1.74 | ) | | (24)% | | (20)% | | | (1.53 | ) | | | (1.46 | ) | | 5% |
| Operating | | | (5.64 | ) | | | (4.26 | ) | | | (3.45 | ) | | 32% | | 63% | | | (4.58 | ) | | | (4.95 | ) | | (7)% |
| General and administration | | | (2.55 | ) | | | (4.57 | ) | | | (0.60 | ) | | (44)% | | 325% | | | (2.50 | ) | | | (0.65 | ) | | 285% |
| Fund flows from operations netback | | | 57.32 | | | | 53.08 | | | | 45.00 | | | 8% | | 27% | | | 52.51 | | | | 36.08 | | | 46% |
| Reference prices | | | | | | | | | | | | | | | | | | | | | | | | | | |
| NBP ($/mcf) | | | 11.03 | | | | 10.95 | | | | 8.70 | | | 1% | | 27% | | | 10.35 | | | | 7.49 | | | 38% |
| NBP (€/mcf) | | | 7.31 | | | | 7.20 | | | | 5.81 | | | 2% | | 26% | | | 6.76 | | | | 5.12 | | | 32% |
Vermilion Energy Inc. ■ Page 21■ 2018 Management’s Discussion and Analysis
Production
| • | Q4 2018 production increased 1% from the prior quarter primarily due to the production contribution from the closing of our acquisition of an additional 1.5% working interest in the Corrib Project. Production also benefited from the absence of maintenance downtime that had occurred in Q3 2018, which was partially offset by natural decline. |
Activity review
| • | In December 2018, Vermilion acquired all of the issued and outstanding common shares of Shell E&P Ireland Limited, along with an incremental 1.5% working interest in the Corrib Project in Ireland from Nephin Energy Holdings Limited, a wholly owned subsidiary of CPPIB. The acquisition increased Vermilion's total ownership in Corrib to 20%. As part of this transaction, Vermilion assumed operatorship of the Corrib Project, providing us with day-to-day control over Corrib operations. |
Sales
| • | The price of our natural gas in Ireland is based on the NBP index. |
| • | Sales per boe for the three months and year ended December 31, 2018 increased versus all comparable periods consistent with increases in the NBP reference price. |
Royalties
| • | Our production in Ireland is not subject to royalties. |
Transportation
| • | Transportation expense in Ireland relates to payments under a ship-or-pay agreement related to the Corrib project. |
| • | Transportation expense for the three months ended December 31, 2018 decreased versus Q3 2018 and Q4 2017 due to a decrease in tariffs in Q4 2018. For the year ended December 31, 2018, transportation expense was consistent with the comparable period in 2017. |
Operating
| • | Q4 2018 operating expense was higher versus Q3 2018 and Q4 2017 due to an increase in offshore operations and terminal maintenance activity completed during Q4 2018. |
| • | For the year ended December 31, 2018, operating expense was lower versus the comparable period in 2017 due to higher offshore maintenance activities which occurred in 2017. |
General and administration
| • | The increase in general and administration expense versus all comparable periods is primarily due to transition costs associated with the aforementioned strategic partnership in Corrib. |
Current income taxes
| • | Given the significant level of investment in Corrib and the resulting tax pools, we do not expect to incur current income taxes in the Ireland Business Unit for the foreseeable future. |
Vermilion Energy Inc. ■ Page 22■ 2018 Management’s Discussion and Analysis
Australia Business Unit
| • | Entered Australia in 2005. |
| • | Hold a 100% operated working interest in the Wandoo field, located approximately 80 km offshore on the northwest shelf of Australia. |
| • | Production is operated from two off-shore platforms and originates from 20 producing wells including five dual lateral wells for a total of 25 producing laterals. |
| • | Wells that utilize horizontal legs (ranging in length from 500 to 3,000 plus metres) are located 600m below the seabed in approximately 55m of water depth. |
| Operational and financial review |
Australia business unit
($M except as indicated) | | Q4 2018 | | | Q3 2018 | | | Q4 2017 | | | Q4/18 vs.
Q3/18 | | Q4/18 vs.
Q4/17 | | 2018 | | | 2017 | | | 2018 vs.
2017 |
| Production | | | | | | | | | | | | | | | | | | | | | | | | | | |
| Crude oil (bbls/d) | | | 4,174 | | | | 4,704 | | | | 4,993 | | | (11)% | | (16)% | | | 4,494 | | | | 5,770 | | | (22)% |
| Sales | | | | | | | | | | | | | | | | | | | | | | | | | | |
| Crude oil (bbls/d) | | | 4,401 | | | | 3,935 | | | | 4,707 | | | 12% | | (7)% | | | 4,342 | | | | 5,717 | | | (24)% |
| Inventory (mbbls) | | | | | | | | | | | | | | | | | | | | | | | | | | |
| Opening crude oil inventory | | | 210 | | | | 139 | | | | 108 | | | | | | | | 134 | | | | 115 | | | |
| Crude oil production | | | 384 | | | | 433 | | | | 459 | | | | | | | | 1,640 | | | | 2,106 | | | |
| Crude oil sales | | | (405 | ) | | | (362 | ) | | | (433 | ) | | | | | | | (1,585 | ) | | | (2,087 | ) | | |
| Closing crude oil inventory | | | 189 | | | | 210 | | | | 134 | | | | | | | | 189 | | | | 134 | | | |
| Activity | | | | | | | | | | | | | | | | | | | | | | | | | | |
| Capital expenditures | | | 43,760 | | | | 16,061 | | | | 7,192 | | | 172% | | 508% | | | 75,638 | | | | 29,942 | | | 153% |
| Financial results | | | | | | | | | | | | | | | | | | | | | | | | | | |
| Sales | | | 39,351 | | | | 35,848 | | | | 36,086 | | | 10% | | 9% | | | 150,733 | | | | 154,391 | | | (2)% |
| Operating | | | (15,757 | ) | | | (11,585 | ) | | | (12,172 | ) | | 36% | | 29% | | | (53,199 | ) | | | (50,139 | ) | | 6% |
| General and administration | | | (1,391 | ) | | | (1,020 | ) | | | (3,193 | ) | | 36% | | (56)% | | | (4,918 | ) | | | (8,194 | ) | | (40)% |
| Current income taxes | | | 2,206 | | | | (3,101 | ) | | | (5,327 | ) | | N/A | | N/A | | | (11,419 | ) | | | (24,355 | ) | | (53)% |
| Fund flows from operations | | | 24,409 | | | | 20,142 | | | | 15,394 | | | 21% | | 59% | | | 81,197 | | | | 71,703 | | | 13% |
| Netbacks ($/boe) | | | | | | | | | | | | | | | | | | | | | | | | | | |
| Sales | | | 97.19 | | | | 99.01 | | | | 83.32 | | | (2)% | | 17% | | | 95.11 | | | | 73.99 | | | 29% |
| Operating | | | (38.92 | ) | | | (32.00 | ) | | | (28.11 | ) | | 22% | | 38% | | | (33.57 | ) | | | (24.03 | ) | | 40% |
| General and administration | | | (3.44 | ) | | | (2.82 | ) | | | (7.37 | ) | | 22% | | (53)% | | | (3.10 | ) | | | (3.93 | ) | | (21)% |
| PRRT | | | 5.98 | | | | 0.70 | | | | (8.25 | ) | | 754% | | N/A | | | (3.04 | ) | | | (9.50 | ) | | (68)% |
| Corporate income taxes | | | (0.53 | ) | | | (9.27 | ) | | | (4.05 | ) | | (94)% | | (87)% | | | (4.16 | ) | | | (2.17 | ) | | 92% |
| Fund flows from operations netback | | | 60.28 | | | | 55.62 | | | | 35.54 | | | 8% | | 70% | | | 51.24 | | | | 34.36 | | | 49% |
| Reference prices | | | | | | | | | | | | | | | | | | | | | | | | | | |
| Dated Brent (US $/bbl) | | | 67.76 | | | | 75.27 | | | | 61.39 | | | (10)% | | 10% | | | 71.04 | | | | 54.27 | | | 31% |
| Dated Brent ($/bbl) | | | 89.54 | | | | 98.37 | | | | 78.05 | | | (9)% | | 15% | | | 92.07 | | | | 70.44 | | | 31% |
Vermilion Energy Inc. ■ Page 23■ 2018 Management’s Discussion and Analysis
Production
| • | Q4 2018 production decreased 11% quarter-over-quarter and 16% year-over-year due to a planned shutdown of the Wandoo field for maintenance and other well downtime, including that which was associated with drilling two new wells. |
| • | Production volumes are managed within corporate targets while meeting customer demands and the requirements of long-term supply agreements. |
| • | We continue to plan for long-term annual production levels of approximately 6,000 bbls/d. |
Activity review
| • | In Q4 2018, we initiated our two (2.0 net) well drilling program, which was successfully completed in early 2019. The total cost of the program was $75 million, which was approximately $10 million over budget due to some minor drilling complications and weather-related delays. |
| • | We also continued to focus on adding value through asset optimization and proactive maintenance. |
Sales
| • | Crude oil in Australia is priced with reference to Dated Brent. |
| • | Q4 2018 sales per boe were consistent with Q3 2018, but higher sales volumes resulted in an increase in sales quarter-over-quarter. |
| • | Sales per boe for the three months and year ended December 31, 2018 increased versus the comparable periods in the prior year, consistent with increases in the Dated Brent reference price. |
Royalties and transportation
| • | Our production in Australia is not subject to royalties or transportation expense as crude oil is sold directly at the Wandoo B platform. |
Operating
| • | Q4 2018 operating expense increased versus Q3 2018 due to higher diesel usage and increased maintenance activity in Q4 2018. |
| • | For the three months and year ended December 31, 2018, per unit operating expense increased versus the comparable periods in the prior year due to increased diesel usage and helicopter costs, coupled with the impact of fixed costs on lower volumes. |
General and administration
| • | Fluctuations in general and administration expense for all comparable periods are primarily due to the timing of expenditures and allocations from our corporate segment. In addition, the decrease in general and administration expense for the three months and year ended December 31, 2018 versus the comparable periods in 2017 is primarily due to the impact of IFRS 16 adoption in 2018. As a result of this new accounting pronouncement, certain arrangements associated with office space in Australia have been accounted for as leases. Please refer to "Recently Adopted Accounting Pronouncements" for additional information. |
Current income taxes
| • | In Australia, current income taxes include both PRRT and corporate income taxes. PRRT is a profit based tax applied at a rate of 40% on sales less eligible expenditures, including operating expenses and capital expenditures. Corporate income taxes are applied at a rate of 30% on taxable income after eligible deductions, which include PRRT paid. |
| • | Current income taxes in Q4 2018 and for the year ended December 31, 2018 versus all comparative periods were lower mainly due to increased PRRT tax deductions for the Q4 2018 capital expenditures related to the drilling campaign. |
Vermilion Energy Inc. ■ Page 24■ 2018 Management’s Discussion and Analysis
United States Business Unit
| • | Entered the United States in September 2014. |
| • | Interests include approximately 148,700 net acres of land (71% undeveloped) in the Powder River Basin of northeastern Wyoming. |
| • | Tight oil development targeting the Turner Sands at depths of approximately 1,500m (East Finn) and 2,600m (Hilight). |
| Operational and financial review |
United States business unit ($M except as indicated) | | Q4 2018 | | | Q3 2018 | | | Q4 2017 | | | Q4/18 vs.
Q3/18 | | Q4/18 vs.
Q4/17 | | 2018 | | | 2017 | | | 2018 vs.
2017 |
| Production and sales | | | | | | | | | | | | | | | | | | | | | | | | | | |
| Crude oil (bbls/d) | | | 1,605 | | | | 1,461 | | | | 667 | | | 10% | | 141% | | | 1,078 | | | | 666 | | | 62% |
| NGLs (bbls/d) | | | 998 | | | | 714 | | | | 43 | | | 40% | | 2,221% | | | 452 | | | | 50 | | | 804% |
| Natural gas (mmcf/d) | | | 5.65 | | | | 4.82 | | | | 0.29 | | | 17% | | 1,848% | | | 2.78 | | | | 0.39 | | | 613% |
| Total (boe/d) | | | 3,545 | | | | 2,979 | | | | 758 | | | 19% | | 368% | | | 1,992 | | | | 781 | | | 155% |
| Production mix (% of total) | | | | | | | | | | | | | | | | | | | | | | | | | | |
| Crude oil | | | 45 | % | | | 49 | % | | | 88 | % | | | | | | | 54 | % | | | 85 | % | | |
| NGLs | | | 28 | % | | | 24 | % | | | 6 | % | | | | | | | 23 | % | | | 6 | % | | |
| Natural gas | | | 27 | % | | | 27 | % | | | 6 | % | | | | | | | 23 | % | | | 9 | % | | |
| Activity | | | | | | | | | | | | | | | | | | | | | | | | | | |
| Capital expenditures | | | 2,881 | | | | 11,386 | | | | 1,018 | | | (75)% | | 183% | | | 40,837 | | | | 19,074 | | | 114% |
| Acquisitions | | | 3,674 | | | | 187,987 | | | | 91 | | | | | | | | 191,740 | | | | 3,403 | | | |
| Gross wells drilled | | | 1.00 | | | | — | | | | — | | | | | | | | 6.00 | | | | 3.00 | | | |
| Net wells drilled | | | 1.00 | | | | — | | | | — | | | | | | | | 6.00 | | | | 3.00 | | | |
| Financial results | | | | | | | | | | | | | | | | | | | | | | | | | | |
| Sales | | | 14,625 | | | | 14,551 | | | | 4,350 | | | 1% | | 236% | | | 38,465 | | | | 15,355 | | | 151% |
| Royalties | | | (4,053 | ) | | | (3,444 | ) | | | (1,196 | ) | | 18% | | 239% | | | (10,070 | ) | | | (4,276 | ) | | 136% |
| Transportation | | | — | | | | — | | | | (15 | ) | | —% | | (100)% | | | — | | | | (41 | ) | | (100)% |
| Operating | | | (2,848 | ) | | | (2,633 | ) | | | (397 | ) | | 8% | | 617% | | | (6,421 | ) | | | (1,698 | ) | | 278% |
| General and administration | | | (1,396 | ) | | | (2,397 | ) | | | (1,274 | ) | | (42)% | | 10% | | | (6,306 | ) | | | (4,341 | ) | | 45% |
| Fund flows from operations | | | 6,328 | | | | 6,077 | | | | 1,468 | | | 4% | | 331% | | | 15,668 | | | | 4,999 | | | 213% |
| Netbacks ($/boe) | | | | | | | | | | | | | | | | | | | | | | | | | | |
| Sales | | | 44.85 | | | | 53.10 | | | | 62.40 | | | (16)% | | (28)% | | | 52.90 | | | | 53.84 | | | (2)% |
| Royalties | | | (12.43 | ) | | | (12.57 | ) | | | (17.16 | ) | | (1)% | | (28)% | | | (13.85 | ) | | | (14.99 | ) | | (8)% |
| Transportation | | | — | | | | — | | | | (0.21 | ) | | —% | | (100)% | | | — | | | | (0.14 | ) | | (100)% |
| Operating | | | (8.73 | ) | | | (9.61 | ) | | | (5.70 | ) | | (9)% | | 53% | | | (8.83 | ) | | | (5.95 | ) | | 48% |
| General and administration | | | (4.28 | ) | | | (8.75 | ) | | | (18.28 | ) | | (51)% | | (77)% | | | (8.67 | ) | | | (15.22 | ) | | (43)% |
| Fund flows from operations netback | | | 19.41 | | | | 22.17 | | | | 21.05 | | | (12)% | | (8)% | | | 21.55 | | | | 17.54 | | | 23% |
| Realized prices | | | | | | | | | | | | | | | | | | | | | | | | | | |
| Crude oil ($/bbl) | | | 70.78 | | | | 87.34 | | | | 67.15 | | | (19)% | | 5% | | | 79.18 | | | | 60.07 | | | 32% |
| NGLs ($/bbl) | | | 26.81 | | | | 29.22 | | | | 41.25 | | | (8)% | | (35)% | | | 28.02 | | | | 25.11 | | | 12% |
| Natural gas ($/mcf) | | | 3.29 | | | | 2.01 | | | | 2.48 | | | 64% | | 33% | | | 2.67 | | | | 2.05 | | | 30% |
| Total ($/boe) | | | 44.85 | | | | 53.10 | | | | 62.40 | | | (16)% | | (28)% | | | 52.90 | | | | 53.84 | | | (2)% |
| Reference prices | | | | | | | | | | | | | | | | | | | | | | | | | | |
| WTI (US $/bbl) | | | 58.81 | | | | 69.50 | | | | 55.40 | | | (15)% | | 6% | | | 64.77 | | | | 50.95 | | | 27% |
| WTI ($/bbl) | | | 77.71 | | | | 90.83 | | | | 70.43 | | | (14)% | | 10% | | | 83.94 | | | | 66.13 | | | 27% |
| Henry Hub (US $/mcf) | | | 3.65 | | | | 2.90 | | | | 2.93 | | | 26% | | 25% | | | 3.09 | | | | 3.11 | | | (1)% |
| Henry Hub ($/mcf) | | | 4.82 | | | | 3.80 | | | | 3.73 | | | 27% | | 29% | | | 4.01 | | | | 4.04 | | | (1)% |
Vermilion Energy Inc. ■ Page 25■ 2018 Management’s Discussion and Analysis
Production
| • | Q4 2018 production increased 19% from the prior quarter and 368% year-over-year primarily due to the production associated with an acquisition we completed in August 2018. |
Activity
| • | In August 2018, we acquired all of the assets of a private oil company in the Powder River Basin for total cash consideration of approximately $189 million. The assets are located in Campbell County, Wyoming, approximately 40 miles (65 kilometres) northwest of Vermilion’s existing operations. The assets included approximately 55,700 net acres of land (approximately 96% working interest) and approximately 2,500 boe/d (63% oil and NGLs) of production with an estimated annual base decline rate of 13%. |
| • | Our 2018 drilling program consisted of the drilling and completion of five (5.0 net) wells on our East Finn asset, along with the drilling and completion of one (1.0 net) well on our recently acquired Hilight asset, both located in the Powder River Basin. |
Sales
| • | The price of crude oil in the United States is directly linked to WTI, subject to local market differentials within the United States. |
| • | Q4 2018 sales per boe decreased versus Q3 2018 consistent with the decrease in crude oil pricing. |
| • | Q4 2018 sales per boe decreased versus Q4 2017 due to an increase in natural gas production from assets acquired in 2018. For the year ended December 31, 2018, sales per boe remained relatively stable versus the comparable period in 2017. This was due to the strengthening of WTI reference pricing offset by the increase in gas production from newly acquired assets. |
Royalties
| • | Our production in the United States is subject to federal and private royalties, severance tax, and ad valorem tax. |
| • | Royalties as a percentage of sales were higher in Q4 2018 versus Q3 2018 due to the impact of a favourable prior period adjustment recorded in Q3 2018, which also reduced royalties as a percentage of sales for 2018 versus 2017. |
Operating
| • | Fluctuations in operating expense versus all comparable periods were due to the timing of maintenance activity and incremental costs from the assets acquired in Q3 2018. |
General and administration
| • | Fluctuations in general and administration expense for all comparable periods were due to the incremental staffing of the United States corporate office, timing of expenditures and allocations from our corporate segment. |
Current income taxes
| • | As a result of our tax pools in the United States, we do not expect to incur current income taxes in the US Business Unit for the foreseeable future. |
Vermilion Energy Inc. ■ Page 26■ 2018 Management’s Discussion and Analysis
Corporate
| • | Our Corporate segment includes costs related to our global hedging program, financing expenses, and general and administration expenses that are primarily incurred in Canada and are not directly related to the operations of our business units. Gains or losses relating to Vermilion's global hedging program are allocated to Vermilion's business units for statutory reporting and income tax purposes. |
| • | Results of our activities in Central and Eastern Europe are also included in the Corporate segment, including production, revenues, and expenditures relating to our first exploratory well in the South Battonya concession in Hungary. |
| Operational and financial review |
Corporate ($M) | | Q4 2018 | | | Q3 2018 | | | Q4 2017 | | | 2018 | | | 2017 | |
| Production and sales | | | | | | | | | | | | | | | | | | | | |
| Natural gas (mmcf/d) | | | 2.86 | | | | 1.17 | | | | — | | | | 1.02 | | | | — | |
| Total (boe/d) | | | 477 | | | | 195 | | | | — | | | | 169 | | | | — | |
| Activity | | | | | | | | | | | | | | | | | | | | |
| Capital expenditures | | | 2,546 | | | | 1,619 | | | | 1,295 | | | | 10,611 | | | | 7,728 | |
| Acquisitions | | | (492 | ) | | | 207 | | | | 2,207 | | | | (285 | ) | | | 2,247 | |
| Gross wells drilled | | | — | | | | — | | | | — | | | | 1.00 | | | | — | |
| Net wells drilled | | | — | | | | — | | | | — | | | | 1.00 | | | | — | |
| Financial results | | | | | | | | | | | | | | | | | | | | |
| Sales | | | 2,547 | | | | 1,083 | | | | — | | | | 3,630 | | | | — | |
| Royalties | | | (534 | ) | | | (279 | ) | | | — | | | | (813 | ) | | | — | |
| Operating | | | — | | | | (201 | ) | | | — | | | | (110 | ) | | | — | |
| General and administration recovery (expense) | | | 969 | | | | 854 | | | | (1,532 | ) | | | (2,744 | ) | | | (6,350 | ) |
| Current income taxes | | | 646 | | | | (862 | ) | | | (542 | ) | | | (513 | ) | | | (527 | ) |
| Interest expense | | | (20,827 | ) | | | (19,772 | ) | | | (13,710 | ) | | | (72,759 | ) | | | (57,313 | ) |
| Realized (loss) gain on derivatives | | | (28,319 | ) | | | (37,365 | ) | | | (7,493 | ) | | | (111,258 | ) | | | 4,721 | |
| Realized foreign exchange gain (loss) | | | 5,894 | | | | (3,100 | ) | | | 2,899 | | | | 243 | | | | 2,316 | |
| Realized other income | | | 275 | | | | 177 | | | | 166 | | | | 883 | | | | 674 | |
| Fund flows from operations | | | (39,258 | ) | | | (59,465 | ) | | | (20,212 | ) | | | (183,441 | ) | | | (56,479 | ) |
Vermilion Energy Inc. ■ Page 27■ 2018 Management’s Discussion and Analysis
Production review
| • | Production in our Central and Eastern Europe business unit averaged 477 boe/d in Q4 2018 representing the first full quarter of gas production for the business unit from our South Battonya concession in Hungary. |
Activity review
| • | In 2018, we brought on production our first exploratory well (100% working interest) in the South Battonya concession of Hungary, which we drilled and tested in the first quarter of 2018. We also continued to prepare for our 2019 drilling campaigns in Hungary, Slovakia and Croatia. Other exploration activities performed through 2018 included the acquisition of 2D seismic data in Croatia, further interpretation of 3D seismic data in Hungary, and expanding our land position in Slovakia. |
General and administration
| • | Fluctuations in general and administration expense for the three months and year ended December 31, 2018 versus all comparable periods were due to allocations to the various business unit segments. |
Current income taxes
| • | Taxes in our corporate segment relate to holding companies that pay current taxes in foreign jurisdictions. |
Interest expense
| • | The increase in interest expense in Q4 2018 versus Q3 2018 was due to higher drawings on the revolving credit facility. |
| • | For the three months and year ended December 31, 2018, interest expense increased versus the comparative periods in 2017 due to the impact of higher drawings on the revolving credit facility, as well as the impact of IFRS 16 adoption in 2018. Please refer to "Recently Adopted Accounting Pronouncements" for additional information regarding the adoption of IFRS 16. |
Realized gain or loss on derivatives
| • | The realized loss on derivatives for the year ended December 31, 2018 is related primarily to amounts paid on crude oil and European natural gas hedges. |
| • | A listing of derivative positions as at December 31, 2018 is included in “Supplemental Table 2” of this MD&A. |
Vermilion Energy Inc. ■ Page 28■ 2018 Management’s Discussion and Analysis
Financial Performance Review
| ($M except per share) | | Dec 31, 2018 | | | Dec 31, 2017 | | | Dec 31, 2016 | |
| Total assets | | | 6,270,671 | | | | 3,974,965 | | | | 4,087,184 | |
| Long-term debt | | | 1,796,207 | | | | 1,270,330 | | | | 1,362,192 | |
| Petroleum and natural gas sales | | | 1,678,117 | | | | 1,098,838 | | | | 882,791 | |
| Net earnings (loss) | | | 271,650 | | | | 62,258 | | | | (160,051 | ) |
| Net earnings (loss) per share | | | | | | | | | | | | |
| Basic | | | 1.93 | | | | 0.52 | | | | (1.38 | ) |
| Diluted | | | 1.91 | | | | 0.51 | | | | (1.38 | ) |
| Cash dividends ($/share) | | | 2.72 | | | | 2.58 | | | | 2.58 | |
| ($M except per share) | | Q4 2018 | | | Q3 2018 | | | Q2 2018 | | | Q1 2018 | | | Q4 2017 | | | Q3 2017 | | | Q2 2017 | | | Q1 2017 | |
| Petroleum and natural gas sales | | | 456,939 | | | | 508,411 | | | | 394,498 | | | | 318,269 | | | | 317,341 | | | | 248,505 | | | | 271,391 | | | | 261,601 | |
| Net earnings (loss) | | | 323,373 | | | | (15,099 | ) | | | (61,364 | ) | | | 24,740 | | | | 8,645 | | | | (39,191 | ) | | | 48,264 | | | | 44,540 | |
| Net earnings (loss) per share | | | | | | | | | | | | | | | | | | | | | | | | | | | | | | | | |
| Basic | | | 2.12 | | | | (0.10 | ) | | | (0.46 | ) | | | 0.20 | | | | 0.07 | | | | (0.32 | ) | | | 0.40 | | | | 0.38 | |
| Diluted | | | 2.10 | | | | (0.10 | ) | | | (0.46 | ) | | | 0.20 | | | | 0.07 | | | | (0.32 | ) | | | 0.39 | | | | 0.37 | |
The following table shows the calculation of fund flows from operations:
| | | Q4 2018 | | | Q3 2018 | | | Q4 2017 | | | 2018 | | | 2017 | |
| | | $M | | | $/boe | | | $M | | | $/boe | | | $M | | | $/boe | | | $M | | | $/boe | | | $M | | | $/boe | |
| Petroleum and natural gas sales | | | 456,939 | | | | 48.90 | | | | 508,411 | | | | 57.90 | | | | 317,341 | | | | 47.49 | | | | 1,678,117 | | | | 52.95 | | | | 1,098,838 | | | | 44.41 | |
| Royalties | | | (43,874 | ) | | | (4.70 | ) | | | (53,786 | ) | | | (6.13 | ) | | | (23,541 | ) | | | (3.52 | ) | | | (152,167 | ) | | | (4.80 | ) | | | (74,476 | ) | | | (3.01 | ) |
| Petroleum and natural gas revenues | | | 413,065 | | | | 44.20 | | | | 454,625 | | | | 51.77 | | | | 293,800 | | | | 43.97 | | | | 1,525,950 | | | | 48.15 | | | | 1,024,362 | | | | 41.40 | |
| Transportation | | | (16,938 | ) | | | (1.81 | ) | | | (13,721 | ) | | | (1.56 | ) | | | (11,986 | ) | | | (1.79 | ) | | | (51,887 | ) | | | (1.64 | ) | | | (43,448 | ) | | | (1.76 | ) |
| Operating | | | (112,470 | ) | | | (12.04 | ) | | | (97,758 | ) | | | (11.13 | ) | | | (65,240 | ) | | | (9.76 | ) | | | (357,014 | ) | | | (11.26 | ) | | | (242,267 | ) | | | (9.79 | ) |
| General and administration | | | (12,814 | ) | | | (1.37 | ) | | | (13,234 | ) | | | (1.51 | ) | | | (15,941 | ) | | | (2.39 | ) | | | (51,929 | ) | | | (1.64 | ) | | | (54,373 | ) | | | (2.20 | ) |
| PRRT | | | 2,422 | | | | 0.26 | | | | 254 | | | | 0.03 | | | | (3,572 | ) | | | (0.53 | ) | | | (4,824 | ) | | | (0.15 | ) | | | (19,819 | ) | | | (0.80 | ) |
| Corporate income taxes | | | (7,946 | ) | | | (0.85 | ) | | | (9,401 | ) | | | (1.07 | ) | | | 2,330 | | | | 0.35 | | | | (38,753 | ) | | | (1.22 | ) | | | (12,288 | ) | | | (0.50 | ) |
| Interest expense | | | (20,827 | ) | | | (2.23 | ) | | | (19,772 | ) | | | (2.25 | ) | | | (13,710 | ) | | | (2.05 | ) | | | (72,759 | ) | | | (2.30 | ) | | | (57,313 | ) | | | (2.32 | ) |
| Realized (loss) gain on derivative instruments | | | (28,319 | ) | | | (3.03 | ) | | | (37,365 | ) | | | (4.26 | ) | | | (7,493 | ) | | | (1.12 | ) | | | (111,258 | ) | | | (3.51 | ) | | | 4,721 | | | | 0.19 | |
| Realized foreign exchange loss | | | 5,894 | | | | 0.63 | | | | (3,100 | ) | | | (0.35 | ) | | | 2,899 | | | | 0.43 | | | | 243 | | | | 0.01 | | | | 2,316 | | | | 0.09 | |
| Realized other income | | | 275 | | | | 0.03 | | | | 177 | | | | 0.02 | | | | 166 | | | | 0.02 | | | | 883 | | | | 0.03 | | | | 674 | | | | 0.03 | |
| Fund flows from operations | | | 222,342 | | | | 23.79 | | | | 260,705 | | | | 29.69 | | | | 181,253 | | | | 27.13 | | | | 838,652 | | | | 26.47 | | | | 602,565 | | | | 24.34 | |
Fluctuations in fund flows from operations may occur as a result of changes in production levels, commodity prices, and costs to produce petroleum and natural gas. In addition, fund flows from operations may be affected by the timing of crude oil shipments in Australia and France. When crude oil inventory is built up, the related operating expense, royalties, and depletion expense are deferred and carried as inventory on the consolidated balance sheet. When the crude oil inventory is subsequently drawn down, the related expenses are recognized.
The following table shows a reconciliation from fund flows from operations to net earnings:
| | | Q4 2018 | | | Q3 2018 | | | Q4 2017 | | | 2018 | | | 2017 | |
| Fund flows from operations | | | 222,342 | | | | 260,705 | | | | 181,253 | | | | 838,652 | | | | 602,565 | |
| Equity based compensation | | | (16,979 | ) | | | (13,056 | ) | | | (16,087 | ) | | | (60,746 | ) | | | (61,579 | ) |
| Unrealized gain (loss) on derivative instruments | | | 273,096 | | | | (75,829 | ) | | | (80,012 | ) | | | 109,326 | | | | (1,062 | ) |
| Unrealized foreign exchange (loss) gain | | | (36,366 | ) | | | (23,044 | ) | | | 40,660 | | | | (63,243 | ) | | | 71,742 | |
| Unrealized other expense | | | (204 | ) | | | (203 | ) | | | (197 | ) | | | (801 | ) | | | (637 | ) |
| Accretion | | | (8,205 | ) | | | (8,041 | ) | | | (6,991 | ) | | | (31,219 | ) | | | (26,971 | ) |
| Depletion and depreciation | | | (174,435 | ) | | | (166,343 | ) | | | (129,179 | ) | | | (609,056 | ) | | | (491,683 | ) |
| Deferred tax | | | (64,084 | ) | | | 10,712 | | | | 19,198 | | | | (39,471 | ) | | | (30,117 | ) |
| Gain on business combinations | | | 128,208 | | | | — | | | | — | | | | 128,208 | | | | — | |
| Net earnings | | | 323,373 | | | | (15,099 | ) | | | 8,645 | | | | 271,650 | | | | 62,258 | |
Vermilion Energy Inc. ■ Page 29■ 2018 Management’s Discussion and Analysis
Fluctuations in net income from period-to-period are caused by changes in both cash and non-cash based income and charges. Cash based items are reflected in fund flows from operations. Non-cash items include: equity based compensation expense, unrealized gains and losses on derivative instruments, unrealized foreign exchange gains and losses, accretion, depletion and depreciation expense, and deferred taxes. In addition, non-cash items may also include gains resulting from business combinations or charges resulting from impairment or impairment reversals.
Equity based compensation
Equity based compensation expense relates primarily to non-cash compensation expense attributable to long-term incentives granted to directors, officers, and employees under security-based arrangements, including the Vermilion Incentive Plan ("VIP") and a security-based compensation arrangement ("Five-Year Compensation Arrangement").
Equity based compensation expense increased in Q4 2018 compared to Q3 2018 and Q4 2017, primarily due to a higher number of outstanding share awards in Q4 2018. For the year ended December 31, 2018, equity based compensation was relatively consistent versus the comparable period in 2017.
Unrealized gain or loss on derivative instruments
Unrealized gain or loss on derivative instruments arise as a result of changes in future commodity price forecasts. As Vermilion uses derivative instruments to manage the commodity price exposure of our future crude oil and natural gas production, we will normally recognize unrealized gains on derivative instruments when future commodity price forecasts decline and vice-versa. As derivative instruments are settled, the unrealized gain or loss previously recognized is reversed, and the settlement results in a realized gain or loss on derivative instruments.
For the three months and year ended December 31, 2018, we recognized unrealized gains on derivative instruments of $273.1 million and $109.3 million, respectively. The unrealized gains primarily related to European natural gas and crude oil derivative instruments for 2019 through 2021.
Unrealized foreign exchange gains or losses
As a result of Vermilion’s international operations, Vermilion has monetary assets and liabilities denominated in currencies other than the Canadian dollar. These monetary assets and liabilities include cash, receivables, payables, long-term debt, derivative instruments and intercompany loans. These monetary assets primarily relate to Euro denominated intercompany loans from Vermilion Energy Inc. to our international subsidiaries. These monetary liabilities primarily relate to our US$300.0 million senior unsecured notes.
Unrealized foreign exchange gains and losses result from translating these monetary assets and liabilities from their underlying currency to the Canadian dollar. Unrealized foreign exchange gains and losses primarily results from the translation of Euro denominated intercompany loans and US dollar denominated long-term debt. As such, an appreciation in the Euro against the Canadian dollar will result in an unrealized foreign exchange gain while an appreciation in the US dollar against the Canadian dollar will result in an unrealized foreign exchange loss (and vice-versa).
For the three months and year ended December 31, 2018, the impact of the Canadian dollar weakening against the US dollar was more significant than the impact of the Canadian dollar weakening against the Euro, resulting in unrealized losses on foreign exchange of $36.4 million and $63.2 million, respectively.
As at December 31, 2018, a $0.01 appreciation of the Euro against the Canadian dollar would result in a $2.2 million increase to net earnings as a result of an unrealized gain on foreign exchange. In contrast, a $0.01 appreciation of the US dollar against the Canadian dollar would result in a $3.0 million decrease to net earnings as a result of an unrealized loss on foreign exchange.
Accretion
Accretion expense is recognized to update the present value of the asset retirement obligation balance. The increase in accretion expense for the three months and year ended December 31, 2018 versus the comparable periods in 2017 was primarily attributable to new obligations recognized following acquisitions in 2018. For the three months ended December 31, 2018, accretion expense was relatively consistent with the prior quarter.
Depletion and depreciation
Depletion and depreciation expense is recognized to allocate the cost of capital assets over the useful life of the respective assets. Depletion and depreciation expense per unit of production is determined for each depletion unit (which are groups of assets within a specific production area that have similar economic lives) by dividing the sum of the net book value of capital assets and future development costs by total proved plus probable reserves.
Fluctuations in depletion and depreciation expense are primarily the result of changes in produced crude oil and natural gas volumes and changes in depletion and depreciation per unit. Fluctuations in depletion and depreciation per unit are the result of changes in reserves, future development costs, and relative production mix.
Vermilion Energy Inc. ■ Page 30■ 2018 Management’s Discussion and Analysis
Depletion and depreciation on a per boe basis for the year ended December 31, 2018 of $19.22 was slightly lower than the $19.87 per boe rate in 2017, despite a significant increase in higher cost crude oil production and an increase in depreciation expense following the recognition of right-of-use assets under IFRS 16 due to continued increases in our proved plus probable reserves.
Deferred tax
Deferred tax assets arise when the tax basis of an asset exceeds its accounting basis (known as a deductible temporary difference). Conversely, deferred tax liabilities arise when the tax basis of an asset is less than its accounting basis (known as a taxable temporary difference). Deferred tax assets are recognized only to the extent that it is probable that there are future taxable profits against which the deductible temporary difference can be utilized. Deferred tax assets and liabilities are measured at the enacted or substantively enacted tax rate that is expected to apply when the asset is realized or the liability is settled.
As such, fluctuations in deferred tax expenses and recoveries primarily arise as a result of: changes in the accounting basis of an asset or liability without a corresponding tax basis change (e.g. when derivative assets and liabilities are marked-to-market or when accounting depletion differs from tax depletion), changes in available tax losses (e.g. if they are utilized to offset taxable income), changes in estimated future taxable profits resulting in a de-recognition or re-recognition of deferred tax assets, and changes in enacted or substantively enacted tax rates.
For the three months and year ended December 31, 2018, deferred tax expense of $64.1 million and $39.5 million were primarily attributable to unrealized gains on derivative instruments and the accelerated deduction of capital expenditures incurred on the drilling program in Australia for PRRT purposes (which decreased PRRT expense but correspondingly increased deferred tax expense). These taxable temporary differences were partially offset by the recognition of additional tax losses in Ireland that are expected to be utilized due to higher European natural gas pricing forecasts.
Vermilion Energy Inc. ■ Page 31�� 2018 Management’s Discussion and Analysis
Taxes
Vermilion pays corporate income taxes in France, the Netherlands, and Australia. In addition, Vermilion pays Petroleum Resource Rent Tax ("PRRT") in Australia. PRRT is a profit based tax applied at a rate of 40% on sales less operating expenses, capital expenditures, and other eligible expenditures. PRRT is deductible in the calculation of taxable income in Australia.
For 2018 and 2017, taxable income was subject to corporate income tax at the following rates:
| Jurisdiction | | 2018 | | | 2017 | |
| Canada | | | 27.0 | % | | | 27.0 | % |
| France | | | 34.4 | % | | | 34.4 | % |
| Netherlands (1) | | | 50.0 | % | | | 50.0 | % |
| Germany(2) | | | 30.2 | % | | | 26.3 | % |
| Ireland | | | 25.0 | % | | | 25.0 | % |
| Australia | | | 30.0 | % | | | 30.0 | % |
| United States | | | 21.0 | % | | | 35.0 | % |
(1) In the Netherlands, an additional 10% uplift deduction is allowed against taxable income that is applied to operating expenses, eligible general and administration expenses and tax deductions for depletion and abandonment retirement obligations.
(2) In 2018, the German Business Unit moved its central office to a new German municipality with a higher trade tax rate.
On December 22, 2017, the Tax Cuts and Jobs Act was signed into law in the United States. The Tax Cuts and Jobs Act reduces the U.S. federal corporate income tax rate to 21%.
On December 21, 2017, the French Parliament approved the Finance Bill for 2018. The Finance Bill for 2018 provides for a progressive decrease of the French corporate income tax rate from 34.43% to 25.825% by 2022, with the first reduction planned for 2019 to 32.02%.
On December 18, 2018, the Dutch government approved the 2019 Tax Plan. The Bill provides for reduced corporate tax rates from 25.0% to 20.5% by 2021, with the first reduction planned for 2020 to 22.55%. Due to the tax regime applicable to natural gas producers in the Netherlands, the reduction to the corporate tax rate is not expected to have a material impact to Vermilion taxes in the Netherlands.
As at December 31, 2018, we had the following tax pools:
| ($M) | | Oil & Gas Assets | | | Tax Losses | | | Other | | | Total | |
| Canada | | | 2,317,044 | (1) | | | 1,052,664 | (4) | | | 36,192 | | | | 3,405,900 | |
| France | | | 317,062 | (2) | | | 11,086 | (5) | | | — | | | | 328,148 | |
| Netherlands | | | 66,947 | (3) | | | — | | | | — | | | | 66,947 | |
| Germany | | | 175,756 | (3) | | | 98,787 | (6) | | | 11,932 | | | | 286,475 | |
| Ireland | | | — | | | | 1,301,395 | (4) | | | — | | | | 1,301,395 | |
| Australia | | | 298,054 | (1) | | | 10,486 | (4) | | | — | | | | 308,540 | |
| United States | | | 214,965 | (1) | | | 101,928 | (7) | | | 10,184 | | | | 327,077 | |
| Total | | | 3,389,828 | | | | 2,576,346 | | | | 58,308 | | | | 6,024,482 | |
| (1) | Deduction calculated using various declining balance rates |
| (2) | Deduction calculated using a combination of straight-line over the assets life and unit of production method |
| (3) | Deduction calculated using a unit of production method |
| (4) | Tax losses can be carried forward and applied at 100% against taxable income |
| (5) | Tax losses carried forward are available to offset the first €1 million of taxable income and 50% of taxable profits in excess each taxation year |
| (6) | Tax losses carried forward are available to offset the first €1 million of taxable income and 60% of taxable profits in excess each taxation year |
| (7) | Tax losses created prior to January 1, 2018 are carried forward and applied at 100% against taxable income, tax losses created after January 1, 2018 are carried forward and applied to 80% of taxable income in each taxation year |
Vermilion Energy Inc. ■ Page 32■ 2018 Management’s Discussion and Analysis
Financial Position Review
We believe that our balance sheet supports our defined growth initiatives and our focus is on managing and maintaining a conservative balance sheet. To ensure that our balance sheet continues to support our defined growth initiatives, we regularly review whether our forecast of fund flows from operations is sufficient to finance planned capital expenditures, dividends, and abandonment and reclamation expenditures. To the extent that forecasted fund flows from operations is not expected to be sufficient to fulfill such expenditures, we will evaluate our ability to finance any shortfall with debt (including borrowing using the unutilized capacity of our existing revolving credit facility), issue equity, or by reducing some or all categories of expenditures to ensure that total expenditures do not exceed available funds.
To ensure that we maintain a conservative balance sheet, we monitor the ratio of net debt to fund flows from operations.
We remain focused on maintaining and strengthening our balance sheet by aligning our exploration and development capital budget with forecasted fund flows from operations to target a payout ratio (a non-GAAP financial measure) of approximately 100%. We continually monitor for changes in forecasted fund flows from operations as a result of changes to forward commodity prices and as appropriate we will adjust our exploration and development capital plans. As a result of our focus on this payout ratio target, we intend for the ratio of net debt to fund flows from operations to trend towards 1.5 over time.
Due to the timing of payments on our fourth quarter drilling activity in Canada and Australia, we had a working capital deficit of $133.3 million as at December 31, 2018. Vermilion intends to fund this working capital deficiency through fund flows from operations generated in 2019 and unutilized capacity on our revolving credit facility.
Net debt is reconciled to long-term debt, as follows:
| | | As at | |
| ($M) | | Dec 31, 2018 | | | Dec 31, 2017 | |
| Long-term debt | | | 1,796,207 | | | | 1,270,330 | |
| Current liabilities | | | 563,199 | | | | 363,306 | |
| Current assets | | | (429,877 | ) | | | (261,846 | ) |
| Net debt | | | 1,929,529 | | | | 1,371,790 | |
| | | | | | | | | |
| Ratio of net debt to quarterly annualized fund flows from operations | | | 2.17 | | | | 1.89 | |
| Ratio of net debt to fund flows from operations | | | 2.30 | | | | 2.28 | |
As at December 31, 2018, net debt increased to $1.93 billion (December 31, 2017 - $1.37 billion) due to the impact of the acquisitions closed in 2018. This increase was partially offset by a $115.6 million decrease in net current derivative liability and an increase in fund flows from operations, which resulted in an increase in the ratio of net debt to fund flows from operations from 2.28 for 2017 to 2.30 for 2018.
Year-end net debt to fund flows from operations of 2.30 compares to our previous forecast of year end net debt to fund flows from operations of 1.7 times as announced in our press release on April 16, 2018 ("Vermilion Energy Inc. Announces Acquisition of Spartan Energy Corp."). The increase in the ratio of net debt to fund flows from operations from forecast resulted from a decrease in crude oil prices in Q4 2018 and incremental debt assumed on our acquisition in the United States in Q3 2018.
The balances recognized on our balance sheet are as follows:
| | | As at | |
| ($M) | | Dec 31, 2018 | | | Dec 31, 2017 | |
| Revolving credit facility | | | 1,392,206 | | | | 899,595 | |
| Senior unsecured notes | | | 404,001 | | | | 370,735 | |
| Long-term debt | | | 1,796,207 | | | | 1,270,330 | |
Vermilion Energy Inc. ■ Page 33■ 2018 Management’s Discussion and Analysis
Revolving Credit Facility
In Q2 2018, we negotiated an increase in our revolving credit facility from $1.4 billion to $1.6 billion and an extension of the maturity from May 31, 2021 to May 31, 2022. In Q3 2018, we negotiated a further increase in our revolving credit from $1.6 billion to $1.8 billion.
Subsequent to December 31, 2018, we negotiated an additional increase in our revolving credit facility from $1.8 billion to $2.1 billion. This additional debt capacity provides us with additional working capital and operational flexibility. There were no changes to the facility maturity date or applicable covenants as a result of this increase.
As at December 31, 2018, Vermilion had in place a bank revolving credit facility maturing May 31, 2022 with terms, outstanding positions, and covenants. as follows:
| | | As at | |
| ($M) | | Dec 31, 2018 | | | Dec 31, 2017 | |
| Total facility amount | | | 1,800,000 | | | | 1,400,000 | |
| Amount drawn | | | (1,392,206 | ) | | | (899,595 | ) |
| Letters of credit outstanding | | | (15,400 | ) | | | (7,400 | ) |
| Unutilized capacity | | | 392,394 | | | | 493,005 | |
As at December 31, 2018, the revolving credit facility was subject to the following covenants:
| | | | | | As at | |
| Financial covenant | | Limit | | | Dec 31, 2018 | | | Dec 31, 2017 | |
| Consolidated total debt to consolidated EBITDA | | | 4.0 | | | | 1.72 | | | | 1.87 | |
| Consolidated total senior debt to consolidated EBITDA | | | 3.5 | | | | 1.34 | | | | 1.30 | |
| Consolidated total senior debt to total capitalization | | | 55 | % | | | 30 | % | | | 32 | % |
Our covenants include financial measures defined within our revolving credit facility agreement that are not defined under IFRS. These financial measures are defined by our revolving credit facility agreement as follows:
| • | Consolidated total debt: Includes all amounts classified as “Long-term debt”, “Current portion of long-term debt”, and “Lease obligations” (including the current portion included within "Accounts payable and accrued liabilities" but excluding operating leases as defined under IAS 17) on our balance sheet. |
| • | Consolidated total senior debt: Defined as consolidated total debt excluding unsecured and subordinated debt. |
| • | Consolidated EBITDA: Defined as consolidated net earnings before interest, income taxes, depreciation, accretion and certain other non-cash items, adjusted for the impact of the acquisition of a material subsidiary. |
| • | Total capitalization: Includes all amounts on our balance sheet classified as “Shareholders’ equity” plus consolidated total debt as defined above. |
Senior Unsecured Notes
On March 13, 2017, Vermilion issued US$300 million of senior unsecured notes at par. The notes bear interest at a rate of 5.625% per annum, paid semi-annually on March 15 and September 15, and mature on March 15, 2025. As direct senior unsecured obligations of Vermilion, the notes rank equally in right of payment with existing and future senior indebtedness of the Company.
The senior unsecured notes were recognized at amortized cost and include the transaction costs directly related to the issuance.
Vermilion may, at its option, redeem the senior unsecured notes prior to maturity as follows:
| • | Prior to March 15, 2020, Vermilion may redeem up to 35% of the original principal amount of the senior unsecured notes with the proceeds of certain equity offerings by the Company at a redemption price of 105.625% of the principal amount, plus any accrued and unpaid interest to but excluding the applicable redemption date. |
| • | Prior to March 15, 2020, Vermilion may redeem some or all of the senior unsecured notes at a price equal to 100% of the principal amount of the senior unsecured notes, plus a “make-whole” premium and any accrued and unpaid interest. |
| • | On or after March 15, 2020, Vermilion may redeem some or all of the senior unsecured notes at the redemption prices set forth in the following table, plus any accrued and unpaid interest. |
| Year | | Redemption price | |
| 2020 | | | 104.219 | % |
| 2021 | | | 102.813 | % |
| 2022 | | | 101.406 | % |
| 2023 and thereafter | | | 100.000 | % |
Vermilion Energy Inc. ■ Page 34■ 2018 Management’s Discussion and Analysis
Beginning with the April 2018 dividend paid on May 15, 2018, we increased our monthly dividend by 7%, to $0.23 per share from $0.215 per share. The dividend increase in Q2 2018 was our fourth dividend increase (previously Vermilion's distribution in the income trust era) since we began paying a distribution in 2003.
In total, dividends declared in 2018 were $388.1 million.
The following table outlines our dividend payment history:
| Date | | Monthly dividend per unit or share | |
| January 2003 to December 2007 | | $ | 0.170 | |
| January 2008 to December 2012 | | $ | 0.190 | |
| January 2013 to December 2013 | | $ | 0.200 | |
| January 2014 to March 2018 | | $ | 0.215 | |
| April 2018 onwards | | $ | 0.230 | |
Our policy with respect to dividends is to be conservative and maintain a low ratio of dividends to fund flows from operations. During low commodity price cycles, we will initially maintain dividends and allow the ratio to rise. Should low commodity price cycles remain for an extended period of time, we will evaluate the necessity of changing the level of dividends, taking into consideration capital development requirements, debt levels, and acquisition opportunities.
Although we expect to be able to maintain our current dividend, fund flows from operations may not be sufficient to fund cash dividends, capital expenditures, and asset retirement obligations. We will evaluate our ability to finance any shortfall with debt, issuances of equity, or by reducing some or all categories of expenditures to ensure that total expenditures do not exceed available funds.
The following table reconciles the change in shareholders’ capital:
| Shareholders’ Capital | | Number of Shares ('000s) | | | Amount ($M) | |
| Balance at December 31, 2017 | | | 122,119 | | | | 2,650,706 | |
| Shares issued for corporate acquisition | | | 27,883 | | | | 1,234,676 | |
| Shares issued for the Dividend Reinvestment Plan | | | 1,179 | | | | 49,051 | |
| Vesting of equity based awards | | | 1,025 | | | | 54,057 | |
| Equity based compensation | | | 314 | | | | 12,565 | |
| Share-settled dividends on vested equity based awards | | | 184 | | | | 7,773 | |
| Balance as at December 31, 2018 | | | 152,704 | | | | 4,008,828 | |
As at December 31, 2018, there were approximately 1.9 million equity based compensation awards outstanding. As at February 27, 2019, there were approximately 152.8 million common shares issued and outstanding.
Contractual Obligations and Commitments
As at December 31, 2018, we had the following contractual obligations and commitments:
| ($M) | | Less than 1 year | | | 1 - 3 years | | | 3 - 5 years | | | After 5 years | | | Total | |
| Long-term debt(1) | | | 78,604 | | | | 157,208 | | | | 1,435,616 | | | | 443,791 | | | | 2,115,219 | |
| Lease obligations | | | 30,798 | | | | 49,743 | | | | 34,313 | | | | 42,739 | | | | 157,593 | |
| Processing and transportation agreements | | | 25,844 | | | | 24,835 | | | | 10,902 | | | | 34,371 | | | | 95,952 | |
| Purchase obligations | | | 33,223 | | | | 16,223 | | | | 1,379 | | | | — | | | | 50,825 | |
| Drilling and service agreements | | | 26,667 | | | | 28,933 | | | | 41,976 | | | | 5,301 | | | | 102,877 | |
| Total contractual obligations and commitments | | | 195,136 | | | | 276,942 | | | | 1,524,186 | | | | 526,202 | | | | 2,522,466 | |
(1) Interest on revolving credit facility calculated assuming an annual interest rate of 4%.
Vermilion Energy Inc. ■ Page 35■ 2018 Management’s Discussion and Analysis
Asset Retirement Obligations
As at December 31, 2018, asset retirement obligations were $650.2 million compared to $517.2 million as at December 31, 2017.
The increase in asset retirement obligations is largely attributable to additional obligations recognized as a result of acquisitions completed in 2018.
Risks and Uncertainties
Crude oil and natural gas exploration, production, acquisition and marketing operations involve a number of risks and uncertainties that have affected the financial statements and are reasonably likely to affect them in the future. These risks and uncertainties are discussed further below.
Commodity prices
Crude oil and natural gas prices have fluctuated significantly in recent years due to supply and demand factors. Changes in crude oil and natural gas prices affect the level of revenue we generate, the amount of proceeds we receive and payments we make on our commodity derivative instruments, and the level of taxes that we pay. In addition, lower crude oil and natural gas prices would reduce the recoverable amount of our capital assets and could result in impairments or impairment reversals.
Exchange rates
Exchange rate changes impact the Canadian dollar equivalent revenue and costs that we recognize. The majority of our crude oil and condensate revenue stream is priced in US dollars and as such an increase in the strength of the Canadian dollar relative to the US dollar would result in the receipt of fewer Canadian dollars for our revenue. We also incur expenses and capital costs in US dollars, Euros and Australian dollars and thus a decrease in strength of the Canadian dollar relative to those currencies may result in the payment of more Canadian dollars for our expenditures.
In addition, exchange rate changes impact the Canadian equivalent carrying balances for our assets and liabilities. For foreign currency denominated monetary assets (such as cash and cash equivalents, long-term debt, and intercompany loans), the impact of changes in exchange rates is recorded in net earnings as a foreign exchange gain or loss.
Production and sales volumes
Our production and sales volumes affect the level of revenue we generate and correspondingly the royalties and taxes that we pay. In addition, significant declines in production or sales volumes due to unforeseen circumstances, may also result in an indicator of impairment and potential impairment charges.
Interest rates
Changes in interest rates impact the amount of interest expense we pay on our variable rate debt and also our ability to obtain fixed rate financing in the future.
Tax and royalty rates
Changes in tax and royalty rates in the jurisdictions that we operate in would impact the amount of current taxes and royalties that we pay. In addition, changes to substantively enacted tax rates would impact the carrying balance of deferred tax assets and liabilities, potentially resulting in a deferred tax recovery or incremental deferred tax expense.
In addition to the above, we are exposed to risk factors that impact our company and business. For further information on these risk factors, please refer to our Annual Information Form, available on SEDAR at www.sedar.com or on our website at www.vermilionenergy.com.
Financial Risk Management
To mitigate the aforementioned risks whenever possible, we seek to hire personnel with experience in specific areas. In addition, we provide continued training and development to staff to further develop their skills. When appropriate, we use third party consultants with relevant experience to augment our internal capabilities with respect to certain risks.
We consider our commodity price risk management program as a form of insurance that protects our cash flow and rate of return. The primary objective of the risk management program is to support our dividends and our internal capital development program. The level of commodity price risk management that occurs is dependent on the amount of debt that is carried. When debt levels are higher, we will be more active in protecting our cash flow stream through our commodity price risk management strategy.
Vermilion Energy Inc. ■ Page 36■ 2018 Management’s Discussion and Analysis
When executing our commodity price risk management programs, we use derivative financial instruments encompassing over-the-counter financial structures as well as fixed and collar structures to economically hedge a part of our physical crude oil and natural gas production. We have strict controls and guidelines in relation to these activities and contract principally with counterparties that have investment grade credit ratings.
Critical Accounting Estimates
The preparation of financial statements in accordance with IFRS requires us to make estimates. Critical accounting estimates are those accounting estimates that require us to make assumptions about matters that are highly uncertain at the time the estimate is made and a different estimate could have been made in the current period or the estimate could change period-to-period.
The carrying amount of asset retirement obligations
The carrying amount of asset retirement obligations ($650.2 million as at December 31, 2018) is the present value of estimated future costs, discounted from the estimated abandonment date using a credit-adjusted risk-free rate. Estimated future costs are based on our assessment of regulatory requirements and the present condition of our assets. The estimated abandonment date is based on the reserve life of the associated assets. The credit-adjusted risk-free rate is based on prevailing interest rates for appropriate term, risk-free government bonds adjusted for our estimated credit spread (determined by reference to the trading prices for debt issued by similarly rated independent oil and gas producers, including our own senior unsecured notes). Changes in these estimates would result in a change in the carrying amount of asset retirement obligations and capital assets and, to a significantly lesser degree, future accretion and depletion expense.
The estimated abandonment date may change from period to period as the estimated abandonment date changes in response to new information, such as changes in reserve life assumptions or regulations. A one year increase or decrease in the estimated abandonment date would decrease or increase asset retirement obligations (with an offsetting increase to capital assets) by approximately $25.0 million.
The estimated credit-adjusted risk-free rate may change from period to period in response to market conditions in Canada and the international jurisdictions that we operate in. An 0.5% increase or decrease in the credit-adjusted risk-free rate would decrease or increase asset retirement obligations by approximately $55.0 million.
The recognition of deferred tax assets in Ireland
In Ireland, we have $0.5 billion of non-expiring tax loss pools where $127.9 million of deferred tax assets has not been recognized as there is uncertainty on our ability to fully use these losses based on estimated future taxable profits. Estimated future taxable profits are calculated using proved and probable reserves and forecast pricing for European natural gas.
As a result, the carrying value of deferred tax assets may change from period-to-period due to changes in forecast pricing for European natural gas. A 5% increase or decrease in proved and probable reserves in our Ireland segment would increase or decrease deferred tax assets (with a corresponding deferred tax recovery or expense) by approximately $17.0 million. A €0.50/GJ increase or decrease in forecast European natural gas prices would increase or decrease deferred tax assets (with a corresponding deferred tax recovery or expense) by approximately $26.0 million.
The amount of finance lease obligations recognized on adoption of IFRS 16
Effective January 1, 2018, Vermilion adopted IFRS 16 using the modified retrospective approach, whereby the cumulative effect of initially applying the standard was recognized as a $97.1 million increase to lease obligations with a corresponding increase to right-of-use assets. The amount of lease obligation (and therefore the amount of right-of-use assets) recognized was calculated as the present value of future lease payments, discounted using our estimated incremental borrowing rate. The estimated incremental borrowing rate reflects the interest rate we would estimate receiving to borrow funds for a similar term and security to acquire the right-of-use asset. Changes in the estimated incremental borrowing rate would change the amount of lease obligations and right-of-use assets recognized on initial adoption and, to a significantly lesser degree, would impact future interest expense and depreciation expense. Based on attributes of our identified leases (including the term of the lease and the country the asset is leased in), we applied a weighted average incremental borrowing rate of 5.4%. A 1% increase or decrease in the estimated incremental borrowing rate would have decreased or increased lease obligations and right-of-use assets recognized on initial adoption by approximately $4.0 million.
The fair value of capital assets acquired in business combinations
In preparing the purchase price allocations for the business combinations completed in 2018, we estimate the fair value of assets acquired. Assets acquired in an acquisition primarily relates to the crude oil and natural gas reserves. The estimated fair value of the crude oil and natural gas reserves acquired is based on the present value of proved plus probable reserves and forecast commodity prices. Changes in these assumptions would change the amount of capital assets recognized and as a result would also impact any goodwill or gain recognized on the acquisition and future depletion and depreciation expense.
Vermilion Energy Inc. ■ Page 37■ 2018 Management’s Discussion and Analysis
The estimated recoverable amount of cash generating units
Each reporting period, we assess our cash generating units for indicators of impairment or impairment reversal. If an indicator of impairment or impairment reversal is identified, we estimate the recoverable amount of the cash generating unit. During the years ended December 31, 2017 and 2018, no indicators of impairment were identified. As a result, the recoverable amount of cash generating units were not critical accounting estimates.
Off Balance Sheet Arrangements
We have not entered into any guarantee or off balance sheet arrangements that would materially impact our financial position or results of operations.
Recently Adopted Accounting Pronouncements
IFRS 9 "Financial Instruments"
On January 1, 2018, Vermilion adopted IFRS 9"Financial Instruments" as issued by the IASB. IFRS 9 includes a new classification and measurement approach for financial assets and a forward-looking 'expected credit loss' model. The adoption of IFRS 9 did not have a material impact on Vermilion's consolidated financial statements.
IFRS 15 "Revenue from contracts with customers"
On January 1, 2018, Vermilion adopted IFRS 15 "Revenue from Contracts with Customers" IFRS 15 establishes a comprehensive framework for determining whether, how much, and when revenue from contracts with customers is recognized. Vermilion's revenue relates to the sale of petroleum and natural gas to customers at specified delivery points at benchmark prices.
Vermilion adopted IFRS 15 using the modified retrospective approach. Under this transitional provision, the cumulative effect of initially applying IFRS 15 is recognized on the date of initial application as an adjustment to retained earnings. No adjustment to retained earnings was required upon adoption of IFRS 15.
IFRS 16 "Leases"
IFRS 16 "Leases" is required to be applied on or after January 1, 2019. The stated objective of IFRS 16 is to provide information that faithfully represents lease transactions and provides a basis for users of financial statements to assess the amount, timing and uncertainty of cash flows arising from leases. IFRS 16 accomplishes this by introducing a single lessee accounting model that requires lessees to recognize a lease obligation and right-of-use asset for the majority of leases. As the Company completed the assessment of the standard and applicable contracts during Q3 2018, Vermilion elected for earlier application of IFRS 16 to achieve the stated objectives of the standard and to increase comparability of results in future periods. Vermilion began applying the standard effective January 1, 2018.
Effective January 1, 2018, Vermilion applied IFRS 16 retrospectively with the cumulative effect of initially applying the standard recognized as a $97.1 million increase to right-of-use assets (included in "Capital assets") and lease obligations ($86.1 million recorded in "Lease obligations" and $11.0 million recorded in "Accounts payable and accrued liabilities"). The right-of-use assets and lease obligations recognized largely relate to the Company's head office lease in Calgary and long-term leases for oil storage facilities in France.
Health, Safety and Environment
We are committed to ensuring our activities are conducted in a manner that will protect the health and safety of our employees, contractors, and the public. Our health, safety, and environment (“HSE”) vision is to fully integrate health, safety, and environment into our business, where our culture is recognized as a model by industry and stakeholders, resulting in a safe and healthy workplace. Our mantra is HSE: Everywhere. Everyday. Everyone.
We maintain health, safety and environmental practices and procedures in compliance with or exceeding regulatory requirements and industry standards. All of our personnel are expected to work safely and in accordance with established regulations and procedures, and we seek to reduce impacts to land, water and air. During 2018 we:
| • | Maintained clear priorities around 5 key focus areas of HSE Culture, Communication and Knowledge Management, Technical Safety Management, Incident Prevention and Operational Stewardship & Sustainability; |
| • | Continued comprehensive investigations of our incidents and near misses to ensure root causes were identified and corrective actions effectively implemented; |
| • | Completed and gained regulatory acceptance of the Corrib Production Safety Case; |
| • | Completed maturity assessments of the HSE MS elements for each business unit; |
| • | Received ISO 5001 certification for the German Business Unit energy management program; |
Vermilion Energy Inc. ■ Page 38■ 2018 Management’s Discussion and Analysis
| • | Completed numerous corporate policy/standard audits/assessments related to operational risk management, contractor management, marine transportation and drug and alcohol; |
| • | Implemented “Vermilion High 5”, an individual safety awareness initiative aimed at keeping front line workers safe; |
| • | Further developed and validated critical procedures and implemented fit-for-purpose training and competency programs; |
| • | Implemented a comprehensive HSE integration plan for Vermilion’s new and emerging operations (includes Central and Eastern Europe, Germany, United States, Ireland and Canada expansion); |
| • | Reported our CO2e emissions to the CDP highlighting the implementation of 40 projects that reduced our gross emissions by 15,000 tonnes CO2e while increasing production; |
| • | Completed and published our Corporate Sustainability Report with emphasis on improving energy efficiency, greenhouse gas emissions reduction and water efficiency optimization; |
| • | Managed our waste products by reducing, recycling and recovering; |
| • | Reduced long-term environmental liabilities through decommissioning, abandoning and reclaiming well leases and facilities; |
| • | Further refined and expanded our enterprise wide corporate risk register; |
| • | Expanded our company-wide HSE leadership training program to improve hazard identification and risk reduction; |
| • | Continued the development of a robust hazard identification and risk mitigation program specific to environmentally sensitive areas; |
| • | Continued the development of our Corporate Process Safety Management System with emphasis on Process Hazards Analysis and risk reduction measures; |
| • | Performed auditing, management inspections and workforce observations to measure compliance and identify potential hazards and apply risk reduction measures; and |
| • | Developed, communicated and measured against leading and lagging HSE key performance indicators; |
We are a member of several organizations concerned with environment, health and safety, including numerous regional co-operatives and synergy groups. In the area of stakeholder relations, we work to build long-term relationships with environmental stakeholders and communities.
Environmental, Social and Governance (ESG)
Furthering our focus on sustainability (ESG) strategy, in 2018 we reviewed recommendations from the Task Force on Climate-related Financial Disclosures (TCFD). We subsequently updated our sustainability reporting in general to illustrate Vermilion’s alignment with these recommendations, focusing on climate, but also on sustainability issues and opportunities in a wider context. In 2018, our Board of Directors also established a Sustainability Committee to provide further support on issues related to sustainability, including climate. Our 2018 performance in sustainability rankings such as CDP, RobecoSAM and Sustainalytics continued to be top of our peer group.
Sustainability
As a responsible oil and gas producer, we consistently seek to deliver long-term shareholder value by operating in an economically, environmentally and socially sustainable manner that is recognized as a model in our industry.
Vermilion understands our stakeholders’ expectations that we deliver strong financial results in a responsible and ethical way. As a result, we align our strategic priorities in the following order:
| • | the safety and health of our staff and those involved directly or indirectly in our operations; |
| • | our responsibility to protect the environment. We follow the Precautionary Principle introduced in 1992 by the United Nations "Rio Declaration on Environment and Development" by using environmental risk as part of our development decision criteria, and by continually seeking improved environmental performance in our operations; and |
| • | economic success through a focus on operational excellence across our business, which includes technical and process excellence, efficiency, expertise, stakeholder relations, and respectful and fair treatment of staff, contractors, partners and suppliers. |
Reflecting these priorities, we have positioned Vermilion purposefully within the energy transition. Predictions differ about the manner and speed of the transition, but our own scenario analyses are clear that Vermilion can best contribute by focusing on producing energy responsibly: reliably, cost-effectively and safely. We also believe those stakeholders who are concerned about sustainability, including investors, governments, regulators, communities and citizens, should turn to best-in-class operators such as Vermilion. Our crude oil and natural gas assets are strategic resources that can, and should, be deployed in the service of the transition and, indeed, of the framework for the planet’s health and wellbeing represented by the United Nations Sustainable Development Goals (SDGs).
To support our strategy, we regularly communicate with our stakeholders, including via our sustainability reporting. In 2018, reflecting our review of TCFD recommendations, we updated our engagement to include a broader inclusion of sustainability in regulatory reporting.
Vermilion Energy Inc. ■ Page 39■ 2018 Management’s Discussion and Analysis
For more information, please see references to sustainability throughout this document, including the Climate Risk discussion. For additional context, our Sustainability Report is available online at www.vermilionenergy.com (under the heading “Our Responsibility”).
Vermilion’s sustainability performance and reporting have earned consistently strong recognition from external stakeholders:
| • | Vermilion was named to the CDP Climate Leadership Level (A-) for the second consecutive year in 2018. We were the only Canadian oil and gas company and one of only two North American oil and gas companies to receive this designation, ranking Vermilion in the top 5% of oil and gas companies globally. |
| • | The Company received a top quartile ranking for our industry sector in RobecoSAM's annual Corporate Sustainability Assessment ("CSA"). The CSA analyzes sustainability performance across economic, environmental, governance and social criteria, and is the basis of the Dow Jones Sustainability Indices. |
| • | Vermilion was ranked top of our peer group in the Sustainalytics ESG (environment, social, governance) rankings. |
| • | Vermilion's MSCI ESG rating continued at A for 2018, marking the second consecutive year Vermilion has scored at this level, and our Governance Metrics score ranked in the top decile globally. |
| • | We received ISS QualityScore decile ratings of 1 for Environmental and 2 for Social, which assess corporate disclosure and transparency practices in these areas, where 1 indicates lowest risk. |
| • | Vermilion has earned recognition on the Corporate Knights' Future 40 Responsible Corporate Leaders in Canada listing every year since the list's inception in 2014. In 2018, we ranked 11th, and were the highest rated oil and gas company on the list. |
| • | In February 2018, Vermilion received the Finance and Sustainability Initiative's ("FSI") award for Best Sustainability Report in the Non-Renewable Resources - Oil and Gas category. In 2019, we were a finalist for the same award. Based in Montreal, the FSI is a non-profit organization dedicated to promoting sustainable finance and, more specifically, responsible investment to financial institutions, companies, and universities. Sustainability reports were graded on a number of criteria, including transparency and balance, reliability and completeness, and the use of ESG materiality. |
Climate-related Disclosures
Vermilion has publicly released our identified climate risks and opportunities since our first annual CDP Climate Response in 2014. In alignment with recommendations from the Task Force on Climate-related Financial Disclosures, under the TCFD’s Strategy category, we are also including them in this document. For more information on our sustainability-related governance, strategy, risk management, and metrics and targets, including those related to climate, please see our 2019 Proxy Statement and Information Circular, and our online sustainability reporting, particularly the Performance Metrics section and our 2018 CDP Response.
Risk / Opportunity | | Description of Impacts1,2 - Risk Category - Risk Timeframe | | Potential Financial Impact | | Management Context |
Increased Pricing of GHG Emissions e.g. Carbon Tax | | - Policy and Legal - Short-term Vermilion's operations were subject to carbon taxation in Alberta, Canada starting in January 2017 and potentially in Saskatchewan as a result of a Canada-wide carbon tax in 2019, affecting the cost of operating in our Canada Business Unit. | | The current financial impact of taxation currently does not exceed $0.5MM per annum. We anticipate this to increase in the medium-term. | | The potential financial impact is based on proposed changes to carbon pricing in our operating regions out to 2023, resulting in expansion of emission sources covered. This estimate is based on the probable cost scenario identified in our Carbon Liability Assessment Tool. |
| Enhanced Emissions Reporting Obligations | | - Policy and Legal
- Short-term
Emissions reporting obligations are an ongoing risk and have the can change due to political and regulatory evolution. The impact to Vermilion would be a decreased netback on a per BOE basis, due to increased expenditures for personnel time and system development and implementation, to allow for more robust emissions quantification. | | Based on our current output in Alberta, France and the Netherlands, current regulated thresholds, and growth, we anticipate that cost associated with meeting emission reporting obligations will increase in the short-term, likely as a small increase in operational costs. | | Regulations in all of our business units are monitored on an ongoing basis, and assumptions/scenario planning is used annually to assess risk. Vermilion also engages stakeholders relating to emissions reporting obligations. Management of this risk is built into Vermilion's operations and our Enterprise Risk Matrix. |
| Mandates on and Regulation of Existing Products and Services | | - Policy and Legal; Technology - Short-term Vermilion's operations are subject to regional regulatory changes that result in changes to equipment requirements such as engineering and equipment modifications to reduce carbon emissions and / or emissions of criteria air contaminants. | | In Canada, operational modifications required to comply with Directive 039 are estimated to have cost $1MM by the end of implementation in 2018. The costs associated with the Netherlands MJA3 program are built into our operating costs and no significant expenditures are anticipated in the near term. | | Vermilion’s participation in the MJA3 program in the Netherlands since 2005, for example, has resulted in projects that have reduced our operations energy intensity by 76%. Such regulatory changes continue to lead Vermilion to complete engineering reviews and facility updates resulting in emission reductions beyond regulatory requirements. |
Vermilion Energy Inc. ■ Page 40■ 2018 Management’s Discussion and Analysis
Risk / Opportunity | | Description of Impacts1,2 - Risk Category - Risk Timeframe | | Potential Financial Impact | | Management Context |
| Changes in Emissions Regulations | | - Policy and Legal
- Medium-term
The risk associated with a change in emission regulations in one or more of our business units is accounted for by Vermilion's Enterprise Risk Matrix, with mitigation measures are reviewed, updated and implemented on an annual basis. A shift in international regulations may also result in an impact to Vermilion's supply chain, resulting in a limitation of market access or direct impact to the price of our products. As Vermilion maintains a diversified asset base, we believe the risk to the marketability of our products is low. | | Following the COP21 conference, the importance of sustainable development and reduction of emission levels was confirmed by the commitments made by national governments. Based on the anticipated changes in the various regulatory regimes under which Vermilion operates, the financial impact due to a regulatory change over the next 3 years is anticipated to be less than $2.5MM. This does not include the cost associated with emission reduction projects completed on an annual basis, or previous projects that have annual emissions reductions. | | The formalization of Integrated Sustainability as a strategic objective in Vermilion’s long-term strategic plan allows us to better understand, identify, proactively respond and manage the potential risk and uncertainty inherent in an evolving sustainability framework, both at a regional and corporate level. As an example, beginning in 2017, Vermilion added requirements to assess capital expenditures for potential sustainability-related impacts. |
| Changes in Temperature Extremes | | - Physical
- Long-term
A decrease in temperature extremes experienced in the winter months (i.e. lower seasonal lows) could increase the amount of fuel gas used by a variety of equipment essential for safe production. Additional equipment could also be required (e.g. building heaters, line heaters) to ensure safe and efficient operation, thus increasing our carbon footprint and costs. Temperature extremes could also increase capital costs associated with drilling, completion and workover operations due to increased timelines, decreased productivity, equipment breakdown, etc. For example, warmer winters would have a direct impact on Vermilion's more northern operations, through a decreased ability to access lands and increased construction capital requirements. | | The financial implications on an annual basis are difficult to quantify; however, based on Vermilion's experience, the most significant financial implications would result from shutdowns in drilling or completions locations. The estimated cost of this would be $0.5MM per day of delay. | | As extreme weather cannot be controlled, Vermilion uses our various Management Systems and processes to protect the health and safety of our workers, contractors and the public, and to protect the environment from adverse effect. As an example of how we have reduced the potential impact related to access in remote assets, we use multi-well pads wherever possible, with multiple horizontal wells drilled from a single location. This reduces the aerial impact of these activities on the environment, habitat fragmentation and carbon emissions associated with lease construction and equipment mobilization/demobilization. Using multi-well locations would significantly decrease capital considerations in the event that limited frost days were realized in the coming years. |
| Changes In Precipitation Patterns and Extreme Variability in Weather Patterns | | - Physical
- Long-term
Vermilion holds assets inland, in coastal regions, and offshore. A change in precipitation in any of these locations could have a negative impact on operations due to drought or flooding. Flooding could result in limited access to locations / facilities, and poses a risk to our corporate headquarters. Alternatively, drought conditions could impact the availability of surface and / or groundwater, which Vermilion, in part, relies on for drilling and completion activities. This could negatively impact forecasted growth by increasing the timelines and capital costs to bring new infrastructure onto production. | | The financial implications of a single time event (e.g. wildfire) and continued strain event (e.g. drought) have been assessed on a case-specific basis, and the financial implications of these events is believed to be manageable (impact under $10MM). Vermilion maintains insurance to mitigate the potential impact of precipitation extreme events (e.g. flooding). Insurance for locations that have been identified as potentially being impacted by drought-induced events (e.g. wildfire) is estimated at $0.45MM per annum. | | As these incidents are beyond Vermilion's control, we take measures to ensure effective emergency response to extreme weather events, to protect the health and safety of our workers, contractors and the public, to protect the environment, and to limit the financial impact of the event. In the case of a longer term extreme precipitation event or drought, Vermilion has implemented water management programs to reduce our reliance on fresh water sources. |
| Rising Sea Levels | | - Physical
- Long-term
Vermilion owns and operates assets in the Netherlands. We have identified and assessed the potential risk associated with rising sea levels here, as it has the potential to physically impact our operations due to issues such as flooding, transportation difficulties and supply chain interruptions. Rising sea levels also pose a threat related to the salinization of groundwater. | | Vermilion reviews the potential impact of rising sea levels annually as part of our Corporate Risk Matrix. We estimate the potential total financial implication to be $153MM, before mitigation measures, in our Netherland operations. | | There is no measure available to protect Vermilion's Netherlands assets in the event that water levels rise to a level that would impact facilities below sea level. Salinization of the groundwater regime would impact the entire region; similarly, no measures are currently available to protect against this. Based on Vermilion's assessment of the probability of these events occurring over the next 5 years being less than 0.5%, we have accepted this level of risk exposure. |
| Increased Severity of Extreme Weather Events such as Cyclones and Floods | | - Physical - Medium-term Vermilion owns and operates an offshore platform in the Wandoo field off northwestern Australia, and co-owns and operates the Corrib project off the Irish coast. Extreme weather events such as cyclones have the potential to directly impact our offshore operations resulting in down time or damage to infrastructure, and can impact the downstream handling capacity of our partners, resulting in a limitation to the distribution and sale of our products. | | Based on the value of the Wandoo Platform and a 1-in-2000 year cyclonic event, the financial implications associated with damage due to a severe weather event is estimated at $179MM (total impact before insurance). The third-party costs associated with potential damages from extreme weather events are not tracked by Vermilion. | | Vermilion maintains insurance as a mitigative measure to reduce the financial impact associated with damage to our assets due to severe weather events. We also have protocols for monitoring and preparing for cyclones, and have invested in our emergency response capabilities in the event of damage to our assets as a result of a cyclone or severe weather event. Operational changes are made as required to ensure (in order of priority) worker health and safety, protection of the environment, and protection of Vermilion’s assets. |
Vermilion Energy Inc. ■ Page 41■ 2018 Management’s Discussion and Analysis
Risk / Opportunity | | Description of Impacts1,2 - Risk Category - Risk Timeframe | | Potential Financial Impact | | Management Context |
| Changing Customer Behaviour | | - Market; Reputational - Long-term As consumers and governments become more socially aware of the sources of their energy, negative perceptions of organizations or production methods have the potential to impact energy sector companies through company valuations, restricted licensing and permitting, and stakeholder opposition. | | The impact of decreased consumer confidence and perception is not calculable. On a per share basis, the market impact of the loss of $1 per share would be approximately $152MM. The direct cost of Vermilion's operating excellence and risk management cannot be quantified on a single risk basis. | | Vermilion is positioned within the evolving energy transition, with an unwavering commitment to our priorities of health and safety, environmental protection, and economic prosperity. We believe that those commitments, and our contributions to the UN SDGs constitute qualitative advantages that set us apart from our competitors. Sustainable practices are ingrained into the way we operate, and we will continue to focus on our Integrated Sustainability strategic objective. We believe this advantage attracts investors to Vermilion and will continue to give Vermilion a competitive advantage in the future. |
| | | | | | | |
| Opportunity: Participation in Carbon Market | | - Financial
- Medium term
The European Union Emissions Trading Scheme (ETS) allows for the generation and movement of certified carbon credits from emissions-saving projects around the world. With the revisions pending in Phase 4, it is anticipated that there will be an active market and consumers for the offset credits generated at some of our sustainability initiatives around the world, likely providing opportunities for Vermilion to generate certified energy reduction and offset credits. | | Vermilion is not accounting for any short term financial impact. It is estimated that following the change to the EU ETS in Phase 4, the carbon price will stabilize at between approximately €15 and €30 per tCO2e. The financial impact to Vermilion annually is estimated to be up to $1MM. | | We are currently evaluating the benefit that certified offset credits from various emission reduction projects across our operations could provide. Examples of projects with this potential include our Tomato Greenhouse Cogeneration project in France, our partnerships for geothermal applications in residential neighborhoods in France, and our developing geothermal projects in the Netherlands. Vermilion's project assessment framework is applied to each identified opportunity, including considerations associated with emissions offset. |
| Opportunity: Development of New Products and Services through R&D and Innovation | | - Products
- Short-term
As Vermilion has developed our emissions quantification programs across the globe, we have developed more robust methods for sharing of technologies and techniques from across our operations, both internally and externally. Our increased focus on tracking emissions has supported the assessment of opportunities across business units and sharing of technical expertise. | | As this opportunity is in the early stage of assessment, it is difficult to quantify the financial impact, but it is estimated at up to $2MM per year. Potential also exists for significant cost adjustments, as assets slated for abandonment could be repurposed to generate geothermal energy. | | We have technical experts who provide input into potential geothermal projects as they are identified. These teams are supported by corporate sustainability staff in connecting internal and external stakeholders. These teams have responsibilities specific to geothermal opportunities as these projects move through their preliminary stages. To further support identification of opportunities, and engagement with stakeholders, Vermilion has appointed sustainability leads in all our business units. |
| Opportunity: Shift in Consumer Preferences | | - Products, Reputational
- Long-term
Under the Canadian Environmental Protection Act and based on commitments made by the Canadian and Alberta governments relating to COP21, there is a commitment to reduce emissions for coal-fired power generation. Based on this and with a number of power generating facilities in Alberta nearing the end of their service life, the demand for natural gas is likely to increase due to increased use of combined cycle gas turbine (CCGT) power generation. Alberta has also committed to significantly reducing its demand for coal for power generation by 2050. | | The short term impact on gas pricing is anticipated to be low, increasing to medium in the mid to long term. Once the regulations are implemented, there is a potential for an increase in the demand and pricing for natural gas, from which Vermilion would benefit. Based on current estimates, an increase in gas price of $1 per mcf would result in a positive impact to sales of approximately $35MM. | | As we move further into the energy transition, we foresee natural gas playing an impactful role as a less carbon intense fuel than other options (i.e. coal). Vermilion continues to focus on the identification of resources and assets where we have the opportunity to apply our industry leading expertise to optimize production while reducing emissions. An example of our strategy to realize this opportunity is our asset base in Alberta, which currently includes a large liquids rich gas play. Vermilion's marketing team is also actively pursuing options for our natural gas production that will enable Vermilion to achieve the best netbacks on production. |
| Opportunity: Ability to Diversify Business Activities | | - Products
- Long-term
Vermilion maintains a diverse, stable global portfolio of oil and gas assets. Our strong record of safe and socially conscious development of energy resources has provided opportunities to access and develop these resources. We see our commitment to sustainability as core to our business, which has provided important organizational focus on emissions quantification and management. As consumers become more aware of and involved in the selection of their energy sources and associated carbon intensity, we believe that Vermilion will continue to be a top quartile choice, providing us with opportunities not available to peer organizations. | | The financial impact of changing consumer preferences is difficult to quantify. We foresee opportunities in two distinct areas: first, in consumers selecting premium energy products (top quartile, low carbon intensity), with these products demanding a higher price than other energy sources on the market. Currently we estimate the potential impact of premium pricing in the long term to be $1-5 per boe (24.8MM based on $1 per boe). The second opportunity, which we are already receiving benefit from, is access to more stringent markets, supported by our environmental and sustainability performance, such as our entry into German, Hungarian and Croatian oil and gas operations in the last several years. | | Vermilion made the organizational change to established Integrated Sustainability as one of our strategic objectives in 2015. This provided important organizational focus on matters such as environmental performance, including climate change. Our strategy is to continue to support Integrated Sustainability, with personnel who are experts in their field, as well as financially supporting programs and projects that reduce emissions while optimizing production. An example of this is the addition of personnel who have specific responsibilities associated with sustainability in our business units, including study and feasibility assessment of green energy generation. |
| Opportunity: Shift Toward Decentralized Energy Generation | | - Products, Reputational
- Long-term
The carbon intensity of energy used around the world has a direct relationship to where the energy product was generated. Vermilion’s business unit structure supports production and distribution of energy products into local markets. This strategy results in the significant reduction of the carbon footprint of our energy when compared to non-local sources. | | On an operating netback (sales) basis, based on current estimates, the financial premium of our non-Canadian assets was $340.8MM. The potential future advantage is anticipated to increase as we expand production in markets outside North America and provide sources of energy to local markets. The costs associated with adjustment of our organizational structure are built into our costs across the company. | | Vermilion continues to assess where we can access local markets for our production, while exploring regions to expand our operations. The actions taken in the past several years to realize this opportunity include alterations to our structure, our strategic objectives and our operational development plans to support Vermilion as a distributed energy provider, and exploration and development programs in regions with relatively low energy production as compared to consumption (i.e. Hungary). |
Vermilion Energy Inc. ■ Page 42■ 2018 Management’s Discussion and Analysis
Note 1: Short term (0 to 3 years); Medium term (3 to 6 years); Long term (6 to 50 years)
Note 2: Risk summary is based on our fiscal year 2017 environmental reporting through CDP. Fiscal year 2018 environmental reporting will be available in mid-2019.
Vermilion Energy Inc. ■ Page 43■ 2018 Management’s Discussion and Analysis
Corporate Governance
We are committed to a high standard of corporate governance practices, a dedication that begins at the Board level and extends throughout the Company. We believe good corporate governance is in the best interest of our shareholders, and that successful companies are those that deliver growth and a competitive return along with a commitment to the environment, to the communities where they operate and to their employees.
We comply with the objectives and guidelines relating to corporate governance adopted by the Canadian Securities Administrators and the Toronto Stock Exchange ("TSX"). In addition, the Board monitors and considers the implementation of corporate governance standards proposed by various regulatory and non-regulatory authorities in Canada. A discussion of corporate governance policies is included each year in our proxy materials for our annual general meeting of shareholders, copies of which are available on SEDAR (www.sedar.com).
As a Canadian reporting issuer with securities listed on the TSX and the New York Stock Exchange (“NYSE”), Vermilion Energy Inc. (“Vermilion”) is required to comply with all applicable Canadian requirements adopted by the Canadian Securities Administrators and the TSX, and applicable rules for foreign private issuers adopted by the U.S. Securities and Exchange Commission that give effect to the provisions of theSarbanes-Oxley Act of 2002.
Our corporate governance practices also incorporate many “best practices” derived from those required to be followed by US domestic companies under the NYSE listing standards. We are required by Section 303A.11 of the NYSE Listed Company Manual to identify any significant ways in which our corporate governance practices differ from those required to be followed by US domestic companies under NYSE listing standards. We believe that there are no such significant differences in our corporate governance practices, except as follows:
| • | Shareholder Approval of Equity Compensation Plans. Section 303A.8 of the NYSE Listed Company Manual requires shareholder approval of all “equity compensation plans” and material revisions to those plans. The definition of “equity compensation plans” covers plans that provide for the delivery of newly issued securities, and also plans which rely on securities reacquired on the market by the issuing company for the purpose of redistribution to employees and directors. The TSX rules provide that equity compensation plans and material amendments thereto require shareholder approval only if they involve newly issued securities and the amendments are not otherwise addressed in the plan’s amendment procedures. In addition, the TSX rules require that every three years after institution, all unallocated options, rights or other entitlements under equity compensation plans which does not have a fixed maximum aggregate of securities issuable must be approved by shareholders. Vermilion follows the TSX rules with respect to shareholder approval of equity compensation plans and material revisions to those plans. |
Disclosure Controls and Procedures
Our officers have established and maintained disclosure controls and procedures and evaluated the effectiveness of these controls in conjunction with our filings.
As of December 31, 2018, we have evaluated the effectiveness of the design and operation of our disclosure controls and procedures. Based on this evaluation, the Chief Executive Officer and Chief Financial Officer have concluded and certified that our disclosure controls and procedures are effective.
Internal Control Over Financial Reporting
A company's internal control over financial reporting is a process to provide reasonable assurance regarding the reliability of financial reporting and the preparation of financial statements for external purposes in accordance with generally accepted accounting principles. A company's internal control over financial reporting includes those policies and procedures that (1) pertain to the maintenance of records that, in reasonable detail, accurately and fairly reflect the transactions of the company; (2) provide reasonable assurance that transactions are recorded as necessary to permit preparation of financial statements in accordance with generally accepted accounting principles, and that receipts and expenditures of the company are being made only in accordance with authorizations of management and directors of the company; and (3) provide reasonable assurance regarding prevention or timely detection of unauthorized acquisition, use, or disposition of the company's assets that could have a material effect on the financial statements.
The Chief Executive Officer and the Chief Financial Officer of Vermilion have assessed the effectiveness of Vermilion’s internal control over financial reporting as defined in Rule 13a-15 under the US Securities Exchange Act of 1934 and as defined in Canada by National Instrument 52-109, Certification of Disclosure in Issuers’ Annual and Interim Filings. The assessment was based on the framework in Internal Control – Integrated Framework (2013) issued by the Committee of Sponsoring Organizations of the Treadway Commission. The Chief Executive Officer and the Chief Financial Officer of Vermilion have concluded that Vermilion’s internal control over financial reporting was effective as of December 31, 2018. The effectiveness of Vermilion’s internal control over financial reporting as of December 31, 2018 has been audited by Deloitte LLP, as reflected in their report included in the 2018 audited annual financial statements filed with the US Securities and Exchange Commission. No changes were made to Vermilion’s internal control over financial reporting during the year ended December 31, 2018, that have materially affected, or are reasonably likely to materially affect, the internal controls over financial reporting.
Vermilion Energy Inc. ■ Page 44■ 2018 Management’s Discussion and Analysis
Vermilion has limited the scope of design controls and procedures ("DC&P") and internal controls over financial reporting to exclude the controls, policies, and procedures of Spartan Energy Corp (which was acquired in May of 2018) and Shell E&P Ireland Limited (which was acquired in December of 2018). The scope limitation is in accordance with section 3.3(1)(b) of NI 52-109 which allows an issuer to limit the design of DC&P and ICFR to exclude controls, policies, and procedures of a business that the issuer acquired not more than 365 days before the end of the fiscal period.
The table below presents the summary financial information of Spartan and Shell E&P Ireland Limited included in Vermilion's financial statements as at and for the year ended December 31, 2018:
| ($MM) | | As at December 31, 2018 | |
| Non-current assets | | | 1,556 | |
| Non-current liabilities | | | 69 | |
| Net assets | | | 1,422 | |
| ($MM) | | Year ended December 31, 2018 | |
| Revenue | | | 243 | |
| Net earnings | | | 45 | |
Vermilion Energy Inc. ■ Page 45■ 2018 Management’s Discussion and Analysis
Supplemental Table 1: Netbacks
The following table includes financial statement information on a per unit basis by business unit. Liquids includes crude oil, condensate, and NGLs. Natural gas sales volumes have been converted on a basis of six thousand cubic feet of natural gas to one barrel of oil equivalent.
| | | Q4 2018 | | 2018 | | Q4 2017 | | | 2017 | |
| | | Liquids | | Natural Gas | | Total | | Liquids | | Natural Gas | | Total | | Total | | | Total | |
| | | $/bbl | | $/mcf | | $/boe | | $/bbl | | $/mcf | | $/boe | | $/boe | | | $/boe | |
| Canada | | | | | | | | | | | | | | | | | | |
| Sales | | 48.70 | | 1.73 | | 33.30 | | 60.57 | | 1.54 | | 37.81 | | | 31.21 | | | | 30.72 | |
| Royalties | | (7.29) | | (0.09) | | (4.57) | | (8.67) | | 0.02 | | (4.77) | | | (3.07 | ) | | | (3.09 | ) |
| Transportation | | (2.62) | | (0.17) | | (1.99) | | (2.26) | | (0.16) | | (1.69) | | | (1.60 | ) | | | (1.61 | ) |
| Operating | | (13.09) | | (1.35) | | (11.09) | | (11.68) | | (1.32) | | (10.00) | | | (7.38 | ) | | | (7.47 | ) |
| Operating netback | | 25.70 | | 0.12 | | 15.65 | | 37.96 | | 0.08 | | 21.35 | | | 19.16 | | | | 18.55 | |
| General and administration | | | | | | (0.38) | | | | | | (0.34) | | | (0.84 | ) | | | (0.89 | ) |
| Fund flows from operations netback | | | | | | 15.27 | | | | | | 21.01 | | | 18.32 | | | | 17.66 | |
| France | | | | | | | | | | | | | | | | | | | | |
| Sales | | 84.94 | | 1.74 | | 84.02 | | 89.68 | | 1.74 | | 89.44 | | | 75.13 | | | | 67.08 | |
| Royalties | | (11.86) | | (0.03) | | (11.72) | | (11.64) | | (0.04) | | (11.60) | | | (10.11 | ) | | | (7.15 | ) |
| Transportation | | (3.21) | | — | | (3.17) | | (2.59) | | — | | (2.59) | | | (4.27 | ) | | | (3.66 | ) |
| Operating | | (13.88) | | — | | (13.71) | | (13.61) | | — | | (13.56) | | | (13.67 | ) | | | (12.76 | ) |
| Operating netback | | 55.99 | | 1.71 | | 55.42 | | 61.84 | | 1.70 | | 61.69 | | | 47.08 | | | | 43.51 | |
| General and administration | | | | | | (3.71) | | | | | | (3.51) | | | (4.06 | ) | | | (3.40 | ) |
| Current income taxes | | | | | | (0.86) | | | | | | (3.74) | | | (2.24 | ) | | | (2.64 | ) |
| Fund flows from operations netback | | | | | | 50.85 | | | | | | 54.44 | | | 40.78 | | | | 37.47 | |
| Netherlands | | | | | | | | | | | | | | | | | | | | |
| Sales | | 69.95 | | 10.95 | | 65.77 | | 74.85 | | 9.71 | | 58.44 | | | 47.41 | | | | 43.24 | |
| Royalties | | — | | (0.11) | | (0.67) | | — | | (0.19) | | (1.12) | | | (0.75 | ) | | | (0.69 | ) |
| Operating | | — | | (1.42) | | (8.40) | | — | | (1.58) | | (9.40) | | | (8.09 | ) | | | (8.49 | ) |
| Operating netback | | 69.95 | | 9.42 | | 56.70 | | 74.85 | | 7.94 | | 47.92 | | | 38.57 | | | | 34.06 | |
| General and administration | | | | | | (0.88) | | | | | | (0.69) | | | (0.63 | ) | | | (0.89 | ) |
| Current income taxes | | | | | | (9.31) | | | | | | (5.83) | | | 8.08 | | | | 1.33 | |
| Fund flows from operations netback | | | | | | 46.51 | | | | | | 41.40 | | | 46.02 | | | | 34.50 | |
| Germany | | | | | | | | | | | | | | | | | | | | |
| Sales | | 75.53 | | 9.72 | | 62.74 | | 84.14 | | 8.70 | | 61.47 | | | 50.22 | | | | 44.37 | |
| Royalties | | (3.32) | | (0.57) | | (3.41) | | (2.55) | | (0.99) | | (4.94) | | | (4.78 | ) | | | (4.30 | ) |
| Transportation | | (9.14) | | (0.41) | | (4.16) | | (9.53) | | (0.48) | | (4.79) | | | (3.09 | ) | | | (4.01 | ) |
| Operating | | (24.48) | | (2.84) | | (18.95) | | (22.53) | | (2.50) | | (17.18) | | | (16.01 | ) | | | (13.03 | ) |
| Operating netback | | 38.59 | | 5.90 | | 36.22 | | 49.53 | | 4.73 | | 34.56 | | | 26.34 | | | | 23.03 | |
| General and administration | | | | | | (6.61) | | | | | | (5.52) | | | (5.53 | ) | | | (5.02 | ) |
| Fund flows from operations netback | | | | | | 29.61 | | | | | | 29.04 | | | 20.81 | | | | 18.01 | |
| Ireland | | | | | | | | | | | | | | | | | | | | |
| Sales | | — | | 11.15 | | 66.91 | | — | | 10.19 | | 61.12 | | | 50.79 | | | | 43.14 | |
| Transportation | | — | | (0.23) | | (1.40) | | — | | (0.25) | | (1.53) | | | (1.74 | ) | | | (1.46 | ) |
| Operating | | — | | (0.94) | | (5.64) | | — | | (0.76) | | (4.58) | | | (3.45 | ) | | | (4.95 | ) |
| Operating netback | | — | | 9.98 | | 59.87 | | — | | 9.18 | | 55.01 | | | 45.60 | | | | 36.73 | |
| General and administration | | | | | | (2.55) | | | | | | (2.50) | | | (0.60 | ) | | | (0.65 | ) |
| Fund flows from operations netback | | | | | | 57.32 | | | | | | 52.51 | | | 45.00 | | | | 36.08 | |
Vermilion Energy Inc. ■ Page 46■ 2018 Management’s Discussion and Analysis
| | | Q4 2018 | | 2018 | | Q4 2017 | | | 2017 | |
| | | Liquids | | Natural Gas | | Total | | Liquids | | Natural Gas | | Total | | Total | | | Total | |
| | | $/bbl | | $/mcf | | $/boe | | $/bbl | | $/mcf | | $/boe | | $/boe | | | $/boe | |
| Australia | | | | | | | | | | | | | | | | | | |
| Sales | | 97.19 | | — | | 97.19 | | 95.11 | | — | | 95.11 | | | 83.32 | | | | 73.99 | |
| Operating | | (38.92) | | — | | (38.92) | | (33.57) | | — | | (33.57) | | | (28.11 | ) | | | (24.03 | ) |
| PRRT(1) | | 5.98 | | — | | 5.98 | | (3.04) | | — | | (3.04) | | | (8.25 | ) | | | (9.50 | ) |
| Operating netback | | 64.25 | | — | | 64.25 | | 58.50 | | — | | 58.50 | | | 46.96 | | | | 40.46 | |
| General and administration | | | | | | (3.44) | | | | | | (3.10) | | | (7.37 | ) | | | (3.93 | ) |
| Corporate income taxes | | | | | | (0.53) | | | | | | (4.16) | | | (4.05 | ) | | | (2.17 | ) |
| Fund flows from operations netback | | | | | | 60.28 | | | | | | 51.24 | | | 35.54 | | | | 34.36 | |
| United States | | | | | | | | | | | | | | | | | | | | |
| Sales | | 53.92 | | 3.29 | | 44.85 | | 64.06 | | 2.67 | | 52.90 | | | 62.40 | | | | 53.84 | |
| Royalties | | (14.96) | | (0.90) | | (12.43) | | (16.71) | | (0.73) | | (13.85) | | | (17.16 | ) | | | (14.99 | ) |
| Transportation | | — | | — | | — | | — | | — | | — | | | (0.21 | ) | | | (0.14 | ) |
| Operating | | (8.68) | | (1.48) | | (8.73) | | (8.97) | | (1.39) | | (8.83) | | | (5.70 | ) | | | (5.95 | ) |
| Operating netback | | 30.28 | | 0.91 | | 23.69 | | 38.38 | | 0.55 | | 30.22 | | | 39.33 | | | | 32.76 | |
| General and administration | | | | | | (4.28) | | | | | | (8.67) | | | (18.28 | ) | | | (15.22 | ) |
| Fund flows from operations netback | | | | | | 19.41 | | | | | | 21.55 | | | 21.05 | | | | 17.54 | |
| Total Company | | | | | | | | | | | | | | | | | | | | |
| Sales | | 60.48 | | 5.83 | | 48.90 | | 71.70 | | 5.45 | | 52.95 | | | 47.49 | | | | 44.41 | |
| Realized hedging (loss) gain | | (1.84) | | (0.74) | | (3.03) | | (3.72) | | (0.55) | | (3.51) | | | (1.12 | ) | | | 0.19 | |
| Royalties | | (7.89) | | (0.14) | | (4.70) | | (8.67) | | (0.10) | | (4.80) | | | (3.52 | ) | | | (3.01 | ) |
| Transportation | | (2.52) | | (0.16) | | (1.81) | | (2.22) | | (0.17) | | (1.64) | | | (1.79 | ) | | | (1.76 | ) |
| Operating | | (15.26) | | (1.36) | | (12.04) | | (14.40) | | (1.31) | | (11.26) | | | (9.76 | ) | | | (9.79 | ) |
| PRRT(1) | | 0.47 | | — | | 0.26 | | (0.29) | | — | | (0.15) | | | (0.53 | ) | | | (0.80 | ) |
| Operating netback | | 33.44 | | 3.43 | | 27.58 | | 42.40 | | 3.32 | | 31.59 | | | 30.77 | | | | 29.24 | |
| General and administration | | | | | | (1.37) | | | | | | (1.64) | | | (2.39 | ) | | | (2.20 | ) |
| Interest expense | | | | | | (2.23) | | | | | | (2.30) | | | (2.05 | ) | | | (2.32 | ) |
| Realized foreign exchange loss | | | | | | 0.63 | | | | | | 0.01 | | | 0.43 | | | | 0.09 | |
| Other income | | | | | | 0.03 | | | | | | 0.03 | | | 0.02 | | | | 0.03 | |
| Corporate income taxes | | | | | | (0.85) | | | | | | (1.22) | | | 0.35 | | | | (0.50 | ) |
| Fund flows from operations netback | | | | | | 23.79 | | | | | | 26.47 | | | 27.13 | | | | 24.34 | |
(1) Vermilion considers Australian PRRT to be an operating item and, accordingly, has included PRRT in the calculation of operating netbacks. Current income taxes presented above excludes PRRT.
Vermilion Energy Inc. ■ Page 47■ 2018 Management’s Discussion and Analysis
Supplemental Table 2: Hedges
The prices in these tables may represent the weighted averages for several contracts. The weighted average price for the portfolio of options listed below may not have the same payoff profile as the individual contracts. As such, the presentation of the weighted average prices is purely for indicative purposes.
The following tables outline Vermilion’s outstanding risk management positions as at December 31, 2018:
| | | | | | | | | Bought Put
Volume | | | Weighted
Average
Bought Put | | | Sold Call
Volume | | | Weighted
Average
Sold Call | | | Sold Put
Volume | | | Weighted
Average
Sold Put | | | Swap
Volume | | | Weighted
Average
Swap | |
| Crude Oil | | Period | | Exercise date(1) | | Currency | | (bbl/d) | | | Price / bbl | | | (bbl/d) | | | Price / bbl | | | (bbl/d) | | | Price / bbl | | | (bbl/d) | | | Price / bbl | |
| Dated Brent | | | | | | | | | | | | | | | | | | | | | | | | | | | | | | | | | | | | | | |
| 3-Way Collar | | Sep 2018 - Jun 2019 | | | | CAD | | | 2,500 | | | | 91.20 | | | | 2,500 | | | | 98.63 | | | | 2,500 | | | | 76.00 | | | | — | | | | — | |
| Swap | | Jan 2019 - Dec 2019 | | | | CAD | | | — | | | | — | | | | — | | | | — | | | | — | | | | — | | | | 1,350 | | | | 91.76 | |
| 3-Way Collar | | Aug 2018 - Jun 2019 | | | | USD | | | 500 | | | | 66.92 | | | | 500 | | | | 80.00 | | | | 500 | | | | 55.00 | | | | — | | | | — | |
| 3-Way Collar | | Jan 2019 - Dec 2019 | | | | USD | | | 500 | | | | 70.00 | | | | 500 | | | | 80.00 | | | | 500 | | | | 60.00 | | | | — | | | | — | |
| Swap | | Apr 2018 - Mar 2019 | | | | USD | | | — | | | | — | | | | — | | | | — | | | | — | | | | — | | | | 750 | | | | 61.33 | |
| Swap | | Jul 2018 - Jun 2019 | | | | USD | | | — | | | | — | | | | — | | | | — | | | | — | | | | — | | | | 1,500 | | | | 68.52 | |
| Swap | | Jan 2019 - Dec 2019 | | | | USD | | | — | | | | — | | | | — | | | | — | | | | — | | | | — | | | | 2,250 | | | | 73.17 | |
| WTI | | | | | | | | | | | | | | | | | | | | | | | | | | | | | | | | | | | | | | |
| Swap | | Jan 2019 - Dec 2019 | | | | CAD | | | — | | | | — | | | | — | | | | — | | | | — | | | | — | | | | 1,050 | | | | 81.41 | |
| 3-Way Collar | | Jan 2019 - Dec 2019 | | | | USD | | | 250 | | | | 70.00 | | | | 250 | | | | 80.25 | | | | 250 | | | | 60.00 | | | | — | | | | — | |
| Swap | | Apr 2018 - Mar 2019 | | | | USD | | | — | | | | — | | | | — | | | | — | | | | — | | | | — | | | | 250 | | | | 54.00 | |
| | | | | | | | | Bought Put
Volume | | | Weighted
Average
Bought Put | | | Sold Call
Volume | | | Weighted
Average
Sold Call | | | Sold Put
Volume | | | Weighted
Average
Sold Put | | | Swap
Volume | | | Weighted
Average
Swap | |
| North American Gas | | Period | | Exercise date(1) | | Currency | | (mcf/d) | | | Price / mcf | | | (mcf/d) | | | Price / mcf | | | (mcf/d) | | | Price /mcf | | | (mcf/d) | | | Price / mcf | |
| AECO | | | | | | | | | | | | | | | | | | | | | | | | | | | | | | |
| Swap | | Dec 2018 - Mar 2019 | | | | CAD | | | — | | | | — | | | | — | | | | — | | | | — | | | | — | | | | 2,500 | | | | 2.41 | |
| AECO Basis (AECO less NYMEX Henry Hub) | | | | | | | | | | | | | | | | | | | | | | | | | | | | | | | | | | |
| Swap | | Jan 2019 - Jun 2020 | | | | USD | | | — | | | | — | | | | — | | | | — | | | | — | | | | — | | | | 2,500 | | | | (0.93 | ) |
| AECO Basis (AECO less Chicago NGI) | | | | | | | | | | | | | | | | | | | | | | | | | | | | | | | | | | |
| Swap | | Nov 2018 - Mar 2019 | | | | USD | | | — | | | | — | | | | — | | | | — | | | | — | | | | — | | | | 5,000 | | | | (1.46 | ) |
| NYMEX Henry Hub | | | | | | | | | | | | | | | | | | | | | | | | | | | | | | | | | | |
| Swap | | Jan 2019 - Mar 2019 | | | | USD | | | — | | | | — | | | | — | | | | — | | | | — | | | | — | | | | 5,000 | | | | 4.00 | |
| Chicago NGI | | | | | | | | | | | | | | | | | | | | | | | | | | | | | | | | | | |
| Swap | | Dec 2018 - Mar 2019 | | | | USD | | | — | | | | — | | | | — | | | | — | | | | — | | | | — | | | | 5,000 | | | | 4.40 | |
| SOCAL Border | | | | | | | | | | | | | | | | | | | | | | | | | | | | | | | | | | |
| Swap(2) | | Jan 2019 | | | | USD | | | — | | | | — | | | | — | | | | — | | | | — | | | | — | | | | 10,000 | | | | 5.50 | |
| Swap(2) | | Feb 2019 | | | | USD | | | — | | | | — | | | | — | | | | — | | | | — | | | | — | | | | 10,000 | | | | 4.39 | |
| Swap(2) | | Mar 2019 | | | | USD | | | — | | | | — | | | | — | | | | — | | | | — | | | | — | | | | 10,000 | | | | 3.36 | |
(1) The sold swaption instrument allows the counterparty, at the specified date, to enter into a derivative instrument contract with Vermilion at the above detailed terms.
(2) These swaps hedge a physical sales agreement to sell Alberta natural gas production at SOCAL Border pricing less a fixed differential.
Vermilion Energy Inc. ■ Page 48■ 2018 Management’s Discussion and Analysis
| | | | | | | | | Bought Put
Volume | | | Weighted
Average
Bought Put | | | Sold Call
Volume | | | Weighted
Average
Sold Call | | | Sold Put
Volume | | | Weighted
Average
Sold Put | | | Swap
Volume | | | Weighted
Average
Swap | |
| European Gas | | Period | | Exercise date(1) | | Currency | | (mcf/d) | | | Price / mcf | | | (mcf/d) | | | Price / mcf | | | (mcf/d) | | | Price /mcf | | | (mcf/d) | | | Price / mcf | |
| NBP | | | | | | | | | | | | | | | | | | | | | | | | | | | | | | | | | | | | | | |
| 3-Way Collar | | Jan 2019 - Dec 2019 | | | | EUR | | | 17,197 | | | | 4.97 | | | | 17,197 | | | | 5.65 | | | | 17,197 | | | | 3.79 | | | | — | | | | — | |
| 3-Way Collar | | Jan 2019 - Dec 2020 | | | | EUR | | | 7,370 | | | | 4.96 | | | | 7,370 | | | | 5.76 | | | | 7,370 | | | | 3.74 | | | | — | | | | — | |
| 3-Way Collar | | Jan 2020 - Dec 2020 | | | | EUR | | | 19,654 | | | | 5.10 | | | | 19,654 | | | | 5.92 | | | | 19,654 | | | | 4.01 | | | | — | | | | — | |
| Collar | | Oct 2018 - Mar 2019 | | | | EUR | | | 3,685 | | | | 6.40 | | | | 2,457 | | | | 7.62 | | | | — | | | | — | | | | — | | | | — | |
| Call | | Oct 2018 - Mar 2019 | | | | EUR | | | — | | | | — | | | | 12,327 | | | | 6.28 | | | | — | | | | — | | | | — | | | | — | |
| Swap | | Oct 2018 - Mar 2019 | | | | EUR | | | — | | | | — | | | | — | | | | — | | | | — | | | | — | | | | 4,913 | | | | 7.92 | |
| Swaption | | Jul 2019 - Jun 2021 | | June 28, 2019 | | EUR | | | — | | | | — | | | | — | | | | — | | | | — | | | | — | | | | 9,827 | | | | 5.64 | |
| Swaption | | Oct 2019 - Mar 2020 | | June 28, 2019 | | EUR | | | — | | | | — | | | | — | | | | — | | | | — | | | | — | | | | 7,370 | | | | 5.86 | |
| Swaption | | Oct 2020 - Mar 2021 | | June 28, 2019 | | EUR | | | — | | | | — | | | | — | | | | — | | | | — | | | | — | | | | 7,370 | | | | 5.86 | |
| Swaption | | Oct 2021 - Mar 2022 | | June 28, 2019 | | EUR | | | — | | | | — | | | | — | | | | — | | | | — | | | | — | | | | 7,370 | | | | 5.86 | |
| NBP Basis (NBP less NYMEX HH) | | | | | | | | | | | | | | | | | | | | | | | | | | | | | | | | | | |
| Collar | | Jan 2019 - Sep 2020 | | | | USD | | | 7,500 | | | | 2.07 | | | | 7,500 | | | | 4.00 | | | | — | | | | — | | | | — | | | | — | |
| TTF | | | | | | | | | | | | | | | | | | | | | | | | | | | | | | | | | | | | | | |
| 3-Way Collar | | Oct 2017 - Dec 2019 | | | | EUR | | | 7,370 | | | | 4.59 | | | | 7,370 | | | | 5.42 | | | | 7,370 | | | | 2.93 | | | | — | | | | — | |
| 3-Way Collar | | Jan 2018 - Dec 2019 | | | | EUR | | | 3,685 | | | | 4.74 | | | | 3,685 | | | | 5.52 | | | | 3,685 | | | | 3.13 | | | | — | | | | — | |
| 3-Way Collar | | Jan 2019 - Dec 2019 | | | | EUR | | | 12,284 | | | | 5.05 | | | | 12,284 | | | | 5.72 | | | | 12,284 | | | | 3.69 | | | | — | | | | — | |
| 3-Way Collar | | Jan 2020 - Dec 2020 | | | | EUR | | | 7,370 | | | | 5.37 | | | | 7,370 | | | | 6.25 | | | | 7,370 | | | | 3.81 | | | | — | | | | — | |
| Swap | | Oct 2017 - Dec 2019 | | | | EUR | | | — | | | | — | | | | — | | | | — | | | | — | | | | — | | | | 7,370 | | | | 4.87 | |
| Swap | | Jan 2018 - Dec 2019 | | | | EUR | | | — | | | | — | | | | — | | | | — | | | | — | | | | — | | | | 1,228 | | | | 5.00 | |
| Swap | | Jul 2018 - Dec 2019 | | | | EUR | | | — | | | | — | | | | — | | | | — | | | | — | | | | — | | | | 4,913 | | | | 4.98 | |
| Swap | | Jan 2019 - Dec 2019 | | | | EUR | | | — | | | | — | | | | — | | | | — | | | | — | | | | — | | | | 2,457 | | | | 4.92 | |
| Cross Currency Interest Rate | | | | Receive Notional Amount (USD) | | | Rate (LIBOR +) | | | Pay Notional Amount (CAD) | | | Rate (CDOR +) | |
| Swap | | Jan 2019 | | | 1,018,563,000 | | | | 1.70 | % | | | 1,354,900,000 | | | | 1.02 | % |
| (1) | The sold swaption instrument allows the counterparty, at the specified date, to enter into a swap with Vermilion at the above detailed terms. |
Vermilion Energy Inc. ■ Page 49■ 2018 Management’s Discussion and Analysis
Supplemental Table 3: Capital Expenditures and Acquisitions
| By classification ($M) | | Q4 2018 | | | Q3 2018 | | | Q4 2017 | | | 2018 | | | 2017 | |
| Drilling and development | | | 160,359 | | | | 142,116 | | | | 61,911 | | | | 503,842 | | | | 290,593 | |
| Exploration and evaluation | | | 3,221 | | | | 4,069 | | | | 12,392 | | | | 14,372 | | | | 29,856 | |
| Capital expenditures | | | 163,580 | | | | 146,185 | | | | 74,303 | | | | 518,214 | | | | 320,449 | |
| | | | | | | | | | | | | | | | | | | | | |
| Acquisitions | | | (31,314 | ) | | | 193,677 | | | | 3,048 | | | | 276,308 | | | | 27,637 | |
| Shares issued for acquisition | | | — | | | | — | | | | — | | | | 1,235,221 | | | | — | |
| Contingent consideration | | | 2 | | | | — | | | | — | | | | 2 | | | | — | |
| Long-term debt net of working capital assumed | | | 34,005 | | | | 4,496 | | | | — | | | | 247,898 | | | | — | |
| Acquisitions | | | 2,689 | | | | 198,173 | | | | 3,048 | | | | 1,759,425 | | | | 27,637 | |
| By category ($M) | | Q4 2018 | | | Q3 2018 | | | Q4 2017 | | | 2018 | | | 2017 | |
| Drilling, completion, new well equip and tie-in, workovers and recompletions | | | 151,511 | | | | 118,317 | | | | 45,533 | | | | 434,875 | | | | 225,668 | |
| Production equipment and facilities | | | 9,166 | | | | 26,964 | | | | 18,109 | | | | 62,496 | | | | 59,629 | |
| Seismic, studies, land and other | | | 2,903 | | | | 904 | | | | 10,661 | | | | 20,843 | | | | 35,152 | |
| Capital expenditures | | | 163,580 | | | | 146,185 | | | | 74,303 | | | | 518,214 | | | | 320,449 | |
| Acquisitions | | | 2,689 | | | | 198,173 | | | | 3,048 | | | | 1,759,425 | | | | 27,637 | |
| Total capital expenditures and acquisitions | | | 166,269 | | | | 344,358 | | | | 77,351 | | | | 2,277,639 | | | | 348,086 | |
| Capital expenditures by country ($M) | | Q4 2018 | | | Q3 2018 | | | Q4 2017 | | | 2018 | | | 2017 | |
| Canada | | | 90,211 | | | | 89,837 | | | | 26,865 | | | | 277,857 | | | | 148,667 | |
| France | | | 17,008 | | | | 15,779 | | | | 20,027 | | | | 79,758 | | | | 73,381 | |
| Netherlands | | | 2,454 | | | | 5,056 | | | | 12,300 | | | | 17,483 | | | | 31,575 | |
| Germany | | | 4,580 | | | | 6,497 | | | | 5,279 | | | | 15,806 | | | | 9,531 | |
| Ireland | | | 140 | | | | (50 | ) | | | 327 | | | | 224 | | | | 551 | |
| Australia | | | 43,760 | | | | 16,061 | | | | 7,192 | | | | 75,638 | | | | 29,942 | |
| United States | | | 2,881 | | | | 11,386 | | | | 1,018 | | | | 40,837 | | | | 19,074 | |
| Corporate | | | 2,546 | | | | 1,619 | | | | 1,295 | | | | 10,611 | | | | 7,728 | |
| Total capital expenditures | | | 163,580 | | | | 146,185 | | | | 74,303 | | | | 518,214 | | | | 320,449 | |
| Acquisitions by country ($M) | | Q4 2018 | | | Q3 2018 | | | Q4 2017 | | | 2018 | | | 2017 | |
| Canada | | | 12,233 | | | | 6,146 | | | | 788 | | | | 1,573,964 | | | | 22,011 | |
| Netherlands | | | (7,860 | ) | | | 2,874 | | | | (38 | ) | | | (2,087 | ) | | | (24 | ) |
| Germany | | | 706 | | | | 959 | | | | — | | | | 1,665 | | | | — | |
| Ireland | | | (5,572 | ) | | | — | | | | — | | | | (5,572 | ) | | | — | |
| United States | | | 3,674 | | | | 187,987 | | | | 91 | | | | 191,740 | | | | 3,403 | |
| Corporate | | | (492 | ) | | | 207 | | | | 2,207 | | | | (285 | ) | | | 2,247 | |
| Total acquisitions | | | 2,689 | | | | 198,173 | | | | 3,048 | | | | 1,759,425 | | | | 27,637 | |
In 2018, included in cash expenditures on acquisitions of $276.3 million is: $257.8 million net paid to vendors in relation to business combinations ($339.9 million paid net of $82.1 million cash acquired); $9.9 million in asset improvements incurred subsequent to acquisitions for compliance with safety, environmental, and Vermilion's operating standards; $7.0 million paid to acquire land; and $1.6 million relating to the carry component of farm-in arrangements.
Vermilion Energy Inc. ■ Page 50■ 2018 Management’s Discussion and Analysis
Supplemental Table 4: Production
| | | Q4/18 | | | Q3/18 | | | Q2/18 | | | Q1/18 | | | Q4/17 | | | Q3/17 | | | Q2/17 | | | Q1/17 | | | Q4/16 | | | Q3/16 | | | Q2/16 | | | Q1/16 | |
| Canada | | | | | | | | | | | | | | | | | | | | | | | | | | | | | | | | | | | | | | | | | | | | | | | | |
| Crude oil & condensate (bbls/d) | | | 29,557 | | | | 28,477 | | | | 17,009 | | | | 9,272 | | | | 9,703 | | | | 9,288 | | | | 9,205 | | | | 7,987 | | | | 7,945 | | | | 8,984 | | | | 9,453 | | | | 10,317 | |
| NGLs (bbls/d) | | | 6,816 | | | | 6,126 | | | | 5,589 | | | | 5,106 | | | | 5,235 | | | | 4,891 | | | | 3,745 | | | | 2,670 | | | | 2,444 | | | | 2,448 | | | | 2,687 | | | | 2,633 | |
| Natural gas (mmcf/d) | | | 146.65 | | | | 136.77 | | | | 127.32 | | | | 106.21 | | | | 107.91 | | | | 103.92 | | | | 93.68 | | | | 85.74 | | | | 75.12 | | | | 77.62 | | | | 87.44 | | | | 97.16 | |
| Total (boe/d) | | | 60,814 | | | | 57,397 | | | | 43,817 | | | | 32,078 | | | | 32,923 | | | | 31,499 | | | | 28,563 | | | | 24,947 | | | | 22,910 | | | | 24,368 | | | | 26,713 | | | | 29,141 | |
| % of consolidated | | | 60 | % | | | 59 | % | | | 55 | % | | | 46 | % | | | 45 | % | | | 46 | % | | | 43 | % | | | 38 | % | | | 38 | % | | | 37 | % | | | 42 | % | | | 44 | % |
| France | | | | | | | | | | | | | | | | | | | | | | | | | | | | | | | | | | | | | | | | | | | | | | | | |
| Crude oil (bbls/d) | | | 11,317 | | | | 11,407 | | | | 11,683 | | | | 11,037 | | | | 11,215 | | | | 10,918 | | | | 11,368 | | | | 10,834 | | | | 11,220 | | | | 11,827 | | | | 12,326 | | | | 12,220 | |
| Natural gas (mmcf/d) | | | 0.82 | | | | — | | | | — | | | | — | | | | — | | | | — | | | | — | | | | 0.01 | | | | 0.38 | | | | 0.42 | | | | 0.54 | | | | 0.44 | |
| Total (boe/d) | | | 11,454 | | | | 11,407 | | | | 11,683 | | | | 11,037 | | | | 11,215 | | | | 10,918 | | | | 11,368 | | | | 10,836 | | | | 11,283 | | | | 11,897 | | | | 12,416 | | | | 12,293 | |
| % of consolidated | | | 11 | % | | | 12 | % | | | 14 | % | | | 16 | % | | | 15 | % | | | 16 | % | | | 17 | % | | | 17 | % | | | 19 | % | | | 19 | % | | | 19 | % | | | 19 | % |
| Netherlands | | | | | | | | | | | | | | | | | | | | | | | | | | | | | | | | | | | | | | | | | | | | | | | | |
| Condensate (bbls/d) | | | 112 | | | | 84 | | | | 87 | | | | 77 | | | | 105 | | | | 74 | | | | 104 | | | | 76 | | | | 57 | | | | 86 | | | | 96 | | | | 114 | |
| Natural gas (mmcf/d) | | | 51.82 | | | | 44.37 | | | | 43.49 | | | | 44.79 | | | | 55.66 | | | | 34.90 | | | | 31.58 | | | | 39.92 | | | | 41.15 | | | | 47.62 | | | | 49.18 | | | | 53.40 | |
| Total (boe/d) | | | 8,749 | | | | 7,479 | | | | 7,335 | | | | 7,541 | | | | 9,381 | | | | 5,890 | | | | 5,368 | | | | 6,729 | | | | 6,915 | | | | 8,023 | | | | 8,293 | | | | 9,015 | |
| % of consolidated | | | 9 | % | | | 8 | % | | | 9 | % | | | 11 | % | | | 13 | % | | | 9 | % | | | 8 | % | | | 10 | % | | | 11 | % | | | 13 | % | | | 13 | % | | | 14 | % |
| Germany | | | | | | | | | | | | | | | | | | | | | | | | | | | | | | | | | | | | | | | | | | | | | | | | |
| Crude oil (bbls/d) | | | 913 | | | | 1,019 | | | | 1,008 | | | | 1,078 | | | | 1,148 | | | | 1,054 | | | | 1,047 | | | | 989 | | | | — | | | | — | | | | — | | | | — | |
| Natural gas (mmcf/d) | | | 16.94 | | | | 14.88 | | | | 14.63 | | | | 16.19 | | | | 18.19 | | | | 20.12 | | | | 19.86 | | | | 19.39 | | | | 14.80 | | | | 14.52 | | | | 14.31 | | | | 15.96 | |
| Total (boe/d) | | | 3,736 | | | | 3,498 | | | | 3,447 | | | | 3,777 | | | | 4,180 | | | | 4,407 | | | | 4,357 | | | | 4,220 | | | | 2,467 | | | | 2,420 | | | | 2,385 | | | | 2,660 | |
| % of consolidated | | | 4 | % | | | 4 | % | | | 4 | % | | | 5 | % | | | 6 | % | | | 7 | % | | | 6 | % | | | 7 | % | | | 4 | % | | | 4 | % | | | 4 | % | | | 4 | % |
| Ireland | | | | | | | | | | | | | | | | | | | | | | | | | | | | | | | | | | | | | | | | | | | | | | | | |
| Natural gas (mmcf/d) | | | 52.03 | | | | 51.38 | | | | 56.56 | | | | 60.87 | | | | 56.23 | | | | 49.04 | | | | 63.81 | | | | 64.82 | | | | 62.92 | | | | 59.28 | | | | 47.26 | | | | 33.90 | |
| Total (boe/d) | | | 8,672 | | | | 8,563 | | | | 9,426 | | | | 10,144 | | | | 9,372 | | | | 8,173 | | | | 10,634 | | | | 10,803 | | | | 10,486 | | | | 9,879 | | | | 7,877 | | | | 5,650 | |
| % of consolidated | | | 9 | % | | | 9 | % | | | 12 | % | | | 14 | % | | | 13 | % | | | 12 | % | | | 16 | % | | | 17 | % | | | 17 | % | | | 16 | % | | | 12 | % | | | 9 | % |
| Australia | | | | | | | | | | | | | | | | | | | | | | | | | | | | | | | | | | | | | | | | | | | | | | | | |
| Crude oil (bbls/d) | | | 4,174 | | | | 4,704 | | | | 4,132 | | | | 4,971 | | | | 4,993 | | | | 5,473 | | | | 6,054 | | | | 6,581 | | | | 6,388 | | | | 6,562 | | | | 6,083 | | | | 6,180 | |
| % of consolidated | | | 4 | % | | | 5 | % | | | 5 | % | | | 7 | % | | | 7 | % | | | 8 | % | | | 9 | % | | | 10 | % | | | 10 | % | | | 10 | % | | | 9 | % | | | 9 | % |
| United States | | | | | | | | | | | | | | | | | | | | | | | | | | | | | | | | | | | | | | | | | | | | | | | | |
| Crude oil (bbls/d) | | | 1,605 | | | | 1,461 | | | | 655 | | | | 574 | | | | 667 | | | | 880 | | | | 747 | | | | 365 | | | | 362 | | | | 383 | | | | 458 | | | | 368 | |
| NGLs (bbls/d) | | | 998 | | | | 714 | | | | 62 | | | | 20 | | | | 43 | | | | 56 | | | | 76 | | | | 24 | | | | 23 | | | | 30 | | | | 26 | | | | 39 | |
| Natural gas (mmcf/d) | | | 5.65 | | | | 4.82 | | | | 0.40 | | | | 0.15 | | | | 0.29 | | | | 0.64 | | | | 0.44 | | | | 0.20 | | | | 0.18 | | | | 0.20 | | | | 0.20 | | | | 0.26 | |
| Total (boe/d) | | | 3,545 | | | | 2,979 | | | | 784 | | | | 618 | | | | 758 | | | | 1,043 | | | | 896 | | | | 422 | | | | 414 | | | | 447 | | | | 518 | | | | 450 | |
| % of consolidated | | | 3 | % | | | 3 | % | | | 1 | % | | | 1 | % | | | 1 | % | | | 2 | % | | | 1 | % | | | 1 | % | | | 1 | % | | | 1 | % | | | 1 | % | | | 1 | % |
| Corporate | | | | | | | | | | | | | | | | | | | | | | | | | | | | | | | | | | | | | | | | | | | | | | | | |
| Natural gas (mmcf/d) | | | 2.86 | | | | 1.17 | | | | — | | | | — | | | | — | | | | — | | | | — | | | | — | | | | — | | | | — | | | | — | | | | — | |
| Total (boe/d) | | | 477 | | | | 195 | | | | — | | | | — | | | | — | | | | — | | | | — | | | | — | | | | — | | | | — | | | | — | | | | — | |
| % of consolidated | | | — | | | | — | % | | | — | | | | — | | | | — | | | | — | | | | — | | | | — | | | | — | | | | — | | | | — | | | | — | |
| Consolidated | | | | | | | | | | | | | | | | | | | | | | | | | | | | | | | | | | | | | | | | | | | | | | | | |
| Liquids (bbls/d) | | | 55,493 | | | | 53,991 | | | | 40,225 | | | | 32,134 | | | | 33,109 | | | | 32,634 | | | | 32,346 | | | | 29,526 | | | | 28,439 | | | | 30,320 | | | | 31,129 | | | | 31,871 | |
| % of consolidated | | | 55 | % | | | 56 | % | | | 50 | % | | | 46 | % | | | 45 | % | | | 48 | % | | | 48 | % | | | 46 | % | | | 47 | % | | | 48 | % | | | 48 | % | | | 49 | % |
| Natural gas (mmcf/d) | | | 276.77 | | | | 253.38 | | | | 242.40 | | | | 228.20 | | | | 238.28 | | | | 208.62 | | | | 209.36 | | | | 210.07 | | | | 194.54 | | | | 199.65 | | | | 198.93 | | | | 201.11 | |
| % of consolidated | | | 45 | % | | | 44 | % | | | 50 | % | | | 54 | % | | | 55 | % | | | 52 | % | | | 52 | % | | | 54 | % | | | 53 | % | | | 52 | % | | | 52 | % | | | 51 | % |
| Total (boe/d) | | | 101,621 | | | | 96,222 | | | | 80,625 | | | | 70,167 | | | | 72,821 | | | | 67,403 | | | | 67,240 | | | | 64,537 | | | | 60,863 | | | | 63,596 | | | | 64,285 | | | | 65,389 | |
Vermilion Energy Inc. ■ Page 51■ 2018 Management’s Discussion and Analysis
| | | 2018 | | | 2017 | | | 2016 | | | 2015 | | | 2014 | | | 2013 | |
| Canada | | | | | | | | | | | | | | | | | | | | | | | | |
| Crude oil & condensate (bbls/d) | | | 21,154 | | | | 9,051 | | | | 9,171 | | | | 11,357 | | | | 12,491 | | | | 8,387 | |
| NGLs (bbls/d) | | | 5,914 | | | | 4,144 | | | | 2,552 | | | | 2,301 | | | | 1,233 | | | | 1,666 | |
| Natural gas (mmcf/d) | | | 129.37 | | | | 97.89 | | | | 84.29 | | | | 71.65 | | | | 55.67 | | | | 42.39 | |
| Total (boe/d) | | | 48,630 | | | | 29,510 | | | | 25,771 | | | | 25,598 | | | | 23,001 | | | | 17,117 | |
| % of consolidated | | | 56 | % | | | 45 | % | | | 40 | % | | | 46 | % | | | 47 | % | | | 41 | % |
| France | | | | | | | | | | | | | | | | | | | | | | | | |
| Crude oil (bbls/d) | | | 11,362 | | | | 11,084 | | | | 11,896 | | | | 12,267 | | | | 11,011 | | | | 10,873 | |
| Natural gas (mmcf/d) | | | 0.21 | | | | — | | | | 0.44 | | | | 0.97 | | | | — | | | | 3.40 | |
| Total (boe/d) | | | 11,396 | | | | 11,085 | | | | 11,970 | | | | 12,429 | | | | 11,011 | | | | 11,440 | |
| % of consolidated | | | 13 | % | | | 16 | % | | | 19 | % | | | 23 | % | | | 22 | % | | | 28 | % |
| Netherlands | | | | | | | | | | | | | | | | | | | | | | | | |
| Condensate (bbls/d) | | | 90 | | | | 90 | | | | 88 | | | | 99 | | | | 77 | | | | 64 | |
| Natural gas (mmcf/d) | | | 46.13 | | | | 40.54 | | | | 47.82 | | | | 44.76 | | | | 38.20 | | | | 35.42 | |
| Total (boe/d) | | | 7,779 | | | | 6,847 | | | | 8,058 | | | | 7,559 | | | | 6,443 | | | | 5,967 | |
| % of consolidated | | | 9 | % | | | 10 | % | | | 13 | % | | | 14 | % | | | 13 | % | | | 15 | % |
| Germany | | | | | | | | | | | | | | | | | | | | | | | | |
| Crude oil (bbls/d) | | | 1,004 | | | | 1,060 | | | | — | | | | — | | | | — | | | | — | |
| Natural gas (mmcf/d) | | | 15.66 | | | | 19.39 | | | | 14.90 | | | | 15.78 | | | | 14.99 | | | | — | |
| Total (boe/d) | | | 3,614 | | | | 4,291 | | | | 2,483 | | | | 2,630 | | | | 2,498 | | | | — | |
| % of consolidated | | | 4 | % | | | 6 | % | | | 4 | % | | | 5 | % | | | 5 | % | | | — | |
| Ireland | | | | | | | | | | | | | | | | | | | | | | | | |
| Natural gas (mmcf/d) | | | 55.17 | | | | 58.43 | | | | 50.89 | | | | 0.03 | | | | — | | | | — | |
| Total (boe/d) | | | 9,195 | | | | 9,737 | | | | 8,482 | | | | 5 | | | | — | | | | — | |
| % of consolidated | | | 11 | % | | | 14 | % | | | 13 | % | | | — | | | | — | | | | — | |
| Australia | | | | | | | | | | | | | | | | | | | | | | | | |
| Crude oil (bbls/d) | | | 4,494 | | | | 5,770 | | | | 6,304 | | | | 6,454 | | | | 6,571 | | | | 6,481 | |
| % of consolidated | | | 5 | % | | | 8 | % | | | 10 | % | | | 12 | % | | | 13 | % | | | 16 | % |
| United States | | | | | | | | | | | | | | | | | | | | | | | | |
| Crude oil (bbls/d) | | | 1,078 | | | | 666 | | | | 393 | | | | 231 | | | | 49 | | | | — | |
| NGLs (bbls/d) | | | 452 | | | | 50 | | | | 29 | | | | 7 | | | | — | | | | — | |
| Natural gas (mmcf/d) | | | 2.78 | | | | 0.39 | | | | 0.21 | | | | 0.05 | | | | — | | | | — | |
| Total (boe/d) | | | 1,992 | | | | 781 | | | | 457 | | | | 247 | | | | 49 | | | | — | |
| % of consolidated | | | 2 | % | | | 1 | % | | | 1 | % | | | — | | | | — | | | | — | |
| Corporate | | | | | | | | | | | | | | | | | | | | | | | | |
| Natural gas (mmcf/d) | | | 1.02 | | | | — | | | | — | | | | — | | | | — | | | | — | |
| Total (boe/d) | | | 169 | | | | — | | | | — | | | | — | | | | — | | | | — | |
| % of consolidated | | | — | | | | — | | | | — | | | | — | | | | — | | | | — | |
| Consolidated | | | | | | | | | | | | | | | | | | | | | | | | |
| Liquids (bbls/d) | | | 45,548 | | | | 31,915 | | | | 30,433 | | | | 32,716 | | | | 31,432 | | | | 27,471 | |
| % of consolidated | | | 52 | % | | | 47 | % | | | 48 | % | | | 60 | % | | | 63 | % | | | 67 | % |
| Natural gas (mmcf/d) | | | 250.33 | | | | 216.64 | | | | 198.55 | | | | 133.24 | | | | 108.85 | | | | 81.21 | |
| % of consolidated | | | 48 | % | | | 53 | % | | | 52 | % | | | 40 | % | | | 37 | % | | | 33 | % |
| Total (boe/d) | | | 87,270 | | | | 68,021 | | | | 63,526 | | | | 54,922 | | | | 49,573 | | | | 41,005 | |
Vermilion Energy Inc. ■ Page 52■ 2018 Management’s Discussion and Analysis
Supplemental Table 5: Segmented Financial Results
| | | Three Months Ended December 31, 2018 | |
| ($M) | | Canada | | | France | | | Netherlands | | | Germany | | | Ireland | | | Australia | | | USA | | | Corporate | | | Total | |
| Drilling and development | | | 90,211 | | | | 16,870 | | | | 2,292 | | | | 3,087 | | | | 140 | | | | 43,760 | | | | 2,881 | | | | 1,118 | | | | 160,359 | |
| Exploration and evaluation | | | — | | | | 138 | | | | 162 | | | | 1,493 | | | | — | | | | — | | | | — | | | | 1,428 | | | | 3,221 | |
| | | | | | | | | | | | | | | | | | | | | | | | | | | | | | | | | | | | | |
| Crude oil and condensate sales | | | 146,947 | | | | 85,758 | | | | 721 | | | | 6,742 | | | | — | | | | 39,351 | | | | 10,452 | | | | — | | | | 289,971 | |
| NGL sales | | | 16,010 | | | | — | | | | — | | | | — | | | | — | | | | — | | | | 2,462 | | | | — | | | | 18,472 | |
| Natural gas sales | | | 23,351 | | | | 131 | | | | 52,216 | | | | 15,155 | | | | 53,385 | | | | — | | | | 1,711 | | | | 2,547 | | | | 148,496 | |
| Royalties | | | (25,584 | ) | | | (11,976 | ) | | | (537 | ) | | | (1,190 | ) | | | — | | | | — | | | | (4,053 | ) | | | (534 | ) | | | (43,874 | ) |
| Revenue from external customers | | | 160,724 | | | | 73,913 | | | | 52,400 | | | | 20,707 | | | | 53,385 | | | | 39,351 | | | | 10,572 | | | | 2,013 | | | | 413,065 | |
| Transportation | | | (11,129 | ) | | | (3,242 | ) | | | — | | | | (1,452 | ) | | | (1,115 | ) | | | — | | | | — | | | | — | | | | (16,938 | ) |
| Operating | | | (62,064 | ) | | | (14,015 | ) | | | (6,765 | ) | | | (6,615 | ) | | | (4,497 | ) | | | (15,757 | ) | | | (2,848 | ) | | | 91 | | | | (112,470 | ) |
| General and administration | | | (2,150 | ) | | | (3,792 | ) | | | (709 | ) | | | (2,308 | ) | | | (2,037 | ) | | | (1,391 | ) | | | (1,396 | ) | | | 969 | | | | (12,814 | ) |
| PRRT | | | — | | | | — | | | | — | | | | — | | | | — | | | | 2,422 | | | | — | | | | — | | | | 2,422 | |
| Corporate income taxes | | | — | | | | (884 | ) | | | (7,492 | ) | | | — | | | | — | | | | (216 | ) | | | — | | | | 646 | | | | (7,946 | ) |
| Interest expense | | | — | | | | — | | | | — | | | | — | | | | — | | | | — | | | | — | | | | (20,827 | ) | | | (20,827 | ) |
| Realized loss on derivative instruments | | | — | | | | — | | | | — | | | | — | | | | — | | | | — | | | | — | | | | (28,319 | ) | | | (28,319 | ) |
| Realized foreign exchange gain | | | — | | | | — | | | | — | | | | — | | | | — | | | | — | | | | — | | | | 5,894 | | | | 5,894 | |
| Realized other income | | | — | | | | — | | | | — | | | | — | | | | — | | | | — | | | | — | | | | 275 | | | | 275 | |
| Fund flows from operations | | | 85,381 | | | | 51,980 | | | | 37,434 | | | | 10,332 | | | | 45,736 | | | | 24,409 | | | | 6,328 | | | | (39,258 | ) | | | 222,342 | |
| | | | | | | | | | | | | | | | | | | | | | | | | | | | | | | | | | | | | |
| | | Year Ended December 31, 2018 | |
| ($M) | | Canada | | | France | | | Netherlands | | | Germany | | | Ireland | | | Australia | | | USA | | | Corporate | | | Total | |
| Total assets | | | 3,060,291 | | | | 918,398 | | | | 277,348 | | | | 284,063 | | | | 709,585 | | | | 263,739 | | | | 407,323 | | | | 349,924 | | | | 6,270,671 | |
| Drilling and development | | | 277,857 | | | | 79,451 | | | | 17,963 | | | | 10,863 | | | | 224 | | | | 75,638 | | | | 40,837 | | | | 1,009 | | | | 503,842 | |
| Exploration and evaluation | | | — | | | | 307 | | | | (480 | ) | | | 4,943 | | | | — | | | | — | | | | — | | | | 9,602 | | | | 14,372 | |
| | | | | | | | | | | | | | | | | | | | | | | | | | | | | | | | | | | | | |
| Crude oil and condensate sales | | | 541,844 | | | | 360,471 | | | | 2,462 | | | | 32,704 | | | | — | | | | 150,733 | | | | 31,142 | | | | — | | | | 1,119,356 | |
| NGL sales | | | 56,554 | | | | — | | | | — | | | | — | | | | — | | | | — | | | | 4,622 | | | | — | | | | 61,176 | |
| Natural gas sales | | | 72,774 | | | | 131 | | | | 163,454 | | | | 49,745 | | | | 205,150 | | | | — | | | | 2,701 | | | | 3,630 | | | | 497,585 | |
| Royalties | | | (84,696 | ) | | | (46,781 | ) | | | (3,181 | ) | | | (6,626 | ) | | | — | | | | — | | | | (10,070 | ) | | | (813 | ) | | | (152,167 | ) |
| Revenue from external customers | | | 586,476 | | | | 313,821 | | | | 162,735 | | | | 75,823 | | | | 205,150 | | | | 150,733 | | | | 28,395 | | | | 2,817 | | | | 1,525,950 | |
| Transportation | | | (29,912 | ) | | | (10,426 | ) | | | — | | | | (6,420 | ) | | | (5,129 | ) | | | — | | | | — | | | | — | | | | (51,887 | ) |
| Operating | | | (177,499 | ) | | | (54,690 | ) | | | (26,681 | ) | | | (23,048 | ) | | | (15,366 | ) | | | (53,199 | ) | | | (6,421 | ) | | | (110 | ) | | | (357,014 | ) |
| General and administration | | | (6,057 | ) | | | (14,170 | ) | | | (1,947 | ) | | | (7,401 | ) | | | (8,386 | ) | | | (4,918 | ) | | | (6,306 | ) | | | (2,744 | ) | | | (51,929 | ) |
| PRRT | | | — | | | | — | | | | — | | | | — | | | | — | | | | (4,824 | ) | | | — | | | | — | | | | (4,824 | ) |
| Corporate income taxes | | | — | | | | (15,084 | ) | | | (16,561 | ) | | | — | | | | — | | | | (6,595 | ) | | | — | | | | (513 | ) | | | (38,753 | ) |
| Interest expense | | | — | | | | — | | | | — | | | | — | | | | — | | | | — | | | | — | | | | (72,759 | ) | | | (72,759 | ) |
| Realized loss on derivative instruments | | | — | | | | — | | | | — | | | | — | | | | — | | | | — | | | | — | | | | (111,258 | ) | | | (111,258 | ) |
| Realized foreign exchange gain | | | — | | | | — | | | | — | | | | — | | | | — | | | | — | | | | — | | | | 243 | | | | 243 | |
| Realized other income | | | — | | | | — | | | | — | | | | — | | | | — | | | | — | | | | — | | | | 883 | | | | 883 | |
| Fund flows from operations | | | 373,008 | | | | 219,451 | | | | 117,546 | | | | 38,954 | | | | 176,269 | | | | 81,197 | | | | 15,668 | | | | (183,441 | ) | | | 838,652 | |
Vermilion Energy Inc. ■ Page 53■ 2018 Management’s Discussion and Analysis
Non-GAAP Financial Measures
This MD&A includes references to certain financial measures which do not have standardized meanings and may not be comparable to similar measures presented by other issuers. These financial measures include fund flows from operations, a measure of profit or loss in accordance with IFRS 8 “Operating Segments” (please see Segmented Information in the Notes to the Consolidated Financial Statements) and net debt, a measure of capital in accordance with IAS 1 “Presentation of Financial Statements” (please see Capital Disclosures in the Notes to the Consolidated Financial Statements).
In addition, this MD&A includes financial measures which are not specified, defined, or determined under IFRS and are therefore considered non-GAAP financial measures and may not be comparable to similar measures presented by other issuers. These non-GAAP financial measures include:
Acquisitions:The sum of acquisitions from the Consolidated Statement of Cash Flows, Vermilion common shares issued as consideration, the estimated value of contingent consideration, the amount of acquiree's outstanding long-term debt assumed plus or net of acquired working capital deficit or surplus. We believe that including these components provides a useful measure of the economic investment associated with our acquisition activity.
Capital expenditures:The sum of drilling and development and exploration and evaluation from the Consolidated Statement of Cash Flows. We consider capital expenditures to be a useful measure of our investment in our existing asset base. Capital expenditures are also referred to as E&D capital.
Cash dividends per share:Represents cash dividends declared per share and is a useful measure of the dividends a common shareholder was entitled to during the period.
Covenants:The financial covenants on our revolving credit facility contain non-GAAP measures. The definitions for these financial covenants are included in Financial Position Review.
Diluted shares outstanding:The sum of shares outstanding at the period end plus outstanding awards under the VIP, based on current estimates of future performance factors and forfeiture rates.
Free cash flow:Represents fund flows from operations in excess of capital expenditures. We use free cash flow to determine the funding available for investing and financing activities, including payment of dividends, repayment of long-term debt, reallocation to existing business units, and deployment into new ventures. We also assess free cash flow as a percentage of fund flows from operations, which is a measure of the percentage of fund flows from operations that is retained for incremental investing and financing activities.
Fund flows from operations per basic and diluted share:Management assesses fund flows from operations on a per share basis as we believe this provides a measure of our operating performance after taking into account the issuance and potential future issuance of Vermilion common shares. Fund flows from operations per basic share is calculated by dividing fund flows from operations by the basic weighted average shares outstanding as defined under IFRS. Fund flows from operations per diluted share is calculated by dividing fund flows from operations by the sum of basic weighted average shares outstanding and incremental shares issuable under the equity based compensation plans as determined using the treasury stock method.
Net dividends:We define net dividends as dividends declared less proceeds received for the issuance of shares pursuant to the Dividend Reinvestment Plan. Management monitors net dividends and net dividends as a percentage of fund flows from operations to assess our ability to pay dividends.
Operating netback:Sales less royalties, operating expense, transportation costs, PRRT, and realized hedging gains and losses presented on a per unit basis. Management assesses operating netback as a measure of the profitability and efficiency of our field operations. In contrast, fund flows from operations netback also includes general and administration expense, corporate income taxes and interest. Fund flows from operations netback is used by management to assess the profitability of our business units and Vermilion as a whole.
Payout:We define payout as net dividends plus drilling and development costs, exploration and evaluation costs and asset retirement obligations settled. Management uses payout and payout as a percentage of fund flows from operations (also referred to as thesustainability ratio) to assess the amount of cash distributed back to shareholders and re-invested in the business for maintaining production and organic growth.
Return on capital employed (ROCE):ROCE is a measure that we use to analyze our profitability and the efficiency of our capital allocation process. ROCE is calculated by dividing net earnings before interest and taxes ("EBIT") by average capital employed over the preceding twelve months. Capital employed is calculated as total assets less current liabilities while average capital employed is calculated using the current period balance sheet and the previous year-end balance sheet.
Vermilion Energy Inc. ■ Page 54■ 2018 Management’s Discussion and Analysis
The following tables reconcile net dividends, payout, and diluted shares outstanding from their most directly comparable GAAP measures as presented in our financial statements:
| ($M) | | Q4 2018 | | | Q3 2018 | | | Q4 2017 | | | 2018 | | | 2017 | |
| Dividends declared | | | 105,310 | | | | 105,192 | | | | 78,653 | | | | 388,111 | | | | 311,397 | |
| Shares issued for the Dividend Reinvestment Plan | | | (5,115 | ) | | | (4,320 | ) | | | (21,817 | ) | | | (49,051 | ) | | | (110,493 | ) |
| Net dividends | | | 100,195 | | | | 100,872 | | | | 56,836 | | | | 339,060 | | | | 200,904 | |
| Drilling and development | | | 160,359 | | | | 142,116 | | | | 61,911 | | | | 503,842 | | | | 290,593 | |
| Exploration and evaluation | | | 3,221 | | | | 4,069 | | | | 12,392 | | | | 14,372 | | | | 29,856 | |
| Asset retirement obligations settled | | | 6,562 | | | | 2,986 | | | | 3,216 | | | | 15,765 | | | | 9,334 | |
| Payout | | | 270,337 | | | | 250,043 | | | | 134,355 | | | | 873,039 | | | | 530,687 | |
| % of fund flows from operations | | | 122 | % | | | 96 | % | | | 74 | % | | | 104 | % | | | 88 | % |
| ('000s of shares) | | Q4 2018 | | | Q3 2018 | | | Q4 2017 | |
| Shares outstanding | | | 152,704 | | | | 152,497 | | | | 122,119 | |
| Potential shares issuable pursuant to the VIP | | | 3,469 | | | | 3,250 | | | | 3,021 | |
| Diluted shares outstanding | | | 156,173 | | | | 155,747 | | | | 125,140 | |
The following tables reconciles the calculation of return on capital employed:
| ($M) | | 2018 | | | 2017 | |
| Net earnings | | | 271,650 | | | | 62,258 | |
| Taxes | | | 83,048 | | | | 62,224 | |
| Interest expense | | | 72,759 | | | | 57,313 | |
| EBIT | | | 427,457 | | | | 181,795 | |
| Average capital employed | | | 4,659,566 | | | | 3,703,991 | |
| Return on capital employed | | | 9 | % | | | 5 | % |
Vermilion Energy Inc. ■ Page 55■ 2018 Management’s Discussion and Analysis
DIRECTORS Lorenzo Donadeo1 Calgary, Alberta Larry J. Macdonald2, 4, 6, 8 Chairman & CEO, Point Energy Ltd. Calgary, Alberta Carin Knickel6, 8, 12 Golden, Colorado Stephen P. Larke4, 6, 12 Calgary, Alberta Loren M. Leiker10 McKinney, Texas Timothy R. Marchant7, 10, 11 Calgary, Alberta Anthony Marino Calgary, Alberta Robert Michaleski4, 5 Calgary, Alberta William Roby8, 9, 12 Katy, Texas Catherine L. Williams3, 6 Calgary, Alberta 1 Chairman of the Board 2 Lead Director 3 Audit Committee Chair (Independent) 4 Audit Committee Member 5 Governance and Human Resources Committee Chair (Independent) 6 Governance and Human Resources Committee Member 7 Health, Safety and Environment Committee Chair (Independent) 8 Health, Safety and Environment Committee Member 9 Independent Reserves Committee Chair (Independent) 10 Independent Reserves Committee Member 11 Sustainability Committee Chair (Independent) 12 Sustainability Committee Member | OFFICERS AND KEY PERSONNEL CANADA Anthony Marino President & Chief Executive Officer Lars Glemser Vice President & Chief Financial Officer Mona Jasinski Executive Vice President, People and Culture Michael Kaluza Executive Vice President & Chief Operating Officer Dion Hatcher Vice President Canada Business Unit Terry Hergott Vice President Marketing Jenson Tan Vice President Business Development Daniel Goulet Director Corporate HSE Jeremy Kalanuk Director Operations Accounting Bryce Kremnica Director Field Operations - Canada Business Unit Kyle Preston Director Investor Relations Robert (Bob) J. Engbloom Corporate Secretary UNITED STATES Scott Seatter Managing Director - U.S. Business Unit Timothy R. Morris Director U.S. Business Development - U.S. Business Unit EUROPE Gerard Schut Vice President European Operations Sylvain Nothhelfer Managing Director - France Business Unit Sven Tummers Managing Director - Netherlands Business Unit Bill Liutkus Managing Director - Germany Business Unit Darcy Kerwin Managing Director - Ireland Business Unit Bryan Sralla Managing Director - Central & Eastern Europe Business Unit AUSTRALIA Bruce D. Lake Managing Director - Australia Business Unit | AUDITORS Deloitte LLP Calgary, Alberta BANKERS The Toronto-Dominion Bank Bank of Montreal Canadian Imperial Bank of Commerce Export Development Canada National Bank of Canada Royal Bank of Canada The Bank of Nova Scotia Wells Fargo Bank N.A., Canadian Branch HSBC Bank Canada Bank of America N.A., Canada Branch Citibank N.A., Canadian Branch - Citibank Canada JPMorgan Chase Bank, N.A., Toronto Branch La Caisse Centrale Desjardins du Québec Alberta Treasury Branches Canadian Western Bank Goldman Sachs Lending Partners LLC Barclays Bank PLC EVALUATION ENGINEERS GLJ Petroleum Consultants Ltd. Calgary, Alberta LEGAL COUNSEL Norton Rose Fulbright Canada LLP Calgary, Alberta TRANSFER AGENT Computershare Trust Company of Canada STOCK EXCHANGE LISTINGS The Toronto Stock Exchange (“VET”) The New York Stock Exchange (“VET”) INVESTOR RELATIONS Kyle Preston Director Investor Relations 403-476-8431 TEL 403-476-8100 FAX 1-866-895-8101 IR TOLL FREE investor_relations@vermilionenergy.com |
Vermilion Energy Inc. ■ Page 56■ 2018 Management’s Discussion and Analysis