Exhibit 99.1
Disclaimer
Certain statements included or incorporated by reference in this document may constitute forward looking statements or financial outlooks under applicable securities legislation. Such forward looking statements or information typically contain statements with words such as "anticipate", "believe", "expect", "plan", "intend", "estimate", "propose", or similar words suggesting future outcomes or statements regarding an outlook. Forward looking statements or information in this document may include, but are not limited to: capital expenditures; business strategies and objectives; operational and financial performance; estimated reserve quantities and the discounted net present value of future net revenue from such reserves; petroleum and natural gas sales; future production levels (including the timing thereof) and rates of average annual production growth; exploration and development plans; acquisition and disposition plans and the timing thereof; operating and other expenses, including the payment and amount of future dividends; royalty and income tax rates; and the timing of regulatory proceedings and approvals.
Such forward looking statements or information are based on a number of assumptions, all or any of which may prove to be incorrect. In addition to any other assumptions identified in this document, assumptions have been made regarding, among other things: the ability of Vermilion to obtain equipment, services and supplies in a timely manner to carry out its activities in Canada and internationally; the ability of Vermilion to market crude oil, natural gas liquids, and natural gas successfully to current and new customers; the timing and costs of pipeline and storage facility construction and expansion and the ability to secure adequate product transportation; the timely receipt of required regulatory approvals; the ability of Vermilion to obtain financing on acceptable terms; foreign currency exchange rates and interest rates; future crude oil, natural gas liquids, and natural gas prices; and management’s expectations relating to the timing and results of exploration and development activities.
Although Vermilion believes that the expectations reflected in such forward looking statements or information are reasonable, undue reliance should not be placed on forward looking statements because Vermilion can give no assurance that such expectations will prove to be correct. Financial outlooks are provided for the purpose of understanding Vermilion’s financial position and business objectives, and the information may not be appropriate for other purposes. Forward looking statements or information are based on current expectations, estimates, and projections that involve a number of risks and uncertainties which could cause actual results to differ materially from those anticipated by Vermilion and described in the forward looking statements or information. These risks and uncertainties include, but are not limited to: the ability of management to execute its business plan; the risks of the oil and gas industry, both domestically and internationally, such as operational risks in exploring for, developing and producing crude oil, natural gas liquids, and natural gas; risks and uncertainties involving geology of crude oil, natural gas liquids, and natural gas deposits; risks inherent in Vermilion's marketing operations, including credit risk; the uncertainty of reserves estimates and reserves life and estimates of resources and associated expenditures; the uncertainty of estimates and projections relating to production and associated expenditures; potential delays or changes in plans with respect to exploration or development projects; Vermilion's ability to enter into or renew leases on acceptable terms; fluctuations in crude oil, natural gas liquids, and natural gas prices, foreign currency exchange rates and interest rates; health, safety, and environmental risks; uncertainties as to the availability and cost of financing; the ability of Vermilion to add production and reserves through exploration and development activities; the possibility that government policies or laws may change or governmental approvals may be delayed or withheld; uncertainty in amounts and timing of royalty payments; risks associated with existing and potential future law suits and regulatory actions against Vermilion; and other risks and uncertainties described elsewhere in this document or in Vermilion's other filings with Canadian securities regulatory authorities.
The forward looking statements or information contained in this document are made as of the date hereof and Vermilion undertakes no obligation to update publicly or revise any forward looking statements or information, whether as a result of new information, future events, or otherwise, unless required by applicable securities laws.
This document contains metrics commonly used in the oil and gas industry. These oil and gas metrics do not have any standardized meaning or standard methods of calculation and therefore may not be comparable to similar measures presented by other companies where similar terminology is used and should therefore not be used to make comparisons. Natural gas volumes have been converted on the basis of six thousand cubic feet of natural gas to one barrel of oil equivalent. Barrels of oil equivalent (boe) may be misleading, particularly if used in isolation. A boe conversion ratio of six thousand cubic feet to one barrel of oil is based on an energy equivalency conversion method primarily applicable at the burner tip and does not represent a value equivalency at the wellhead.
Financial data contained within this document are reported in Canadian dollars, unless otherwise stated.
Vermilion Energy Inc. ■ Page 1 ■ 2019 Second Quarter Report
Abbreviations
| $M | thousand dollars |
| $MM | million dollars |
| AECO | the daily average benchmark price for natural gas at the AECO ‘C’ hub in Alberta |
| bbl(s) | barrel(s) |
| bbls/d | barrels per day |
| boe | barrel of oil equivalent, including: crude oil, condensate, natural gas liquids, and natural gas (converted on the basis of one boe for six mcf of natural gas) |
| boe/d | barrel of oil equivalent per day |
| GJ | gigajoules |
| LSB | light sour blend crude oil reference price |
| mbbls | thousand barrels |
| mcf | thousand cubic feet |
| mmcf/d | million cubic feet per day |
| NBP | the reference price paid for natural gas in the United Kingdom at the National Balancing Point Virtual Trading Point. |
| NGLs | natural gas liquids, which includes butane, propane, and ethane |
| PRRT | Petroleum Resource Rent Tax, a profit based tax levied on petroleum projects in Australia |
| tCO2e | tonnes of carbon dioxide equivalent |
| TTF | the price for natural gas in the Netherlands, quoted in megawatt hours of natural gas, at the Title Transfer Facility Virtual Trading Point |
| WTI | West Texas Intermediate, the reference price paid for crude oil of standard grade in US dollars at Cushing, Oklahoma |
Vermilion Energy Inc. ■ Page 2 ■ 2019 Second Quarter Report
Highlights
| • | Q2 2019 production averaged 103,003 boe/d, down slightly from the prior quarter, as increases in the US and Australia were more than offset by lower production in France due to a refinery outage in the Paris Basin. |
| • | Fund flows from operations ("FFO") for Q2 2019 was $223 million ($1.44/basic share(1)) , a decrease of 12% from the previous quarter due to the refinery outage, timing of crude lifting in Australia, and lower natural gas prices. Despite lower year-over-year commodity prices, FFO for Q2 2019 was up 14% from the same quarter last year due to increased production. |
| • | In Germany, we finished drilling and completing our first exploratory well, which was tested subsequent to the end of the quarter. The well (46% working interest) encountered 125 feet of net pay and tested at a rate of 8.8mmcf/d(2), with the test rate limited by weather conditions. |
| • | In CEE, we drilled three (2.3 net) exploration wells in Hungary and one (1.0 net) exploration well in Croatia during Q2 2019. Subsequent to the end of the quarter, we drilled and completed a fourth (1.0 net) exploration well in Hungary. Three of the Hungarian wells and the Croatian well resulted in gas discoveries. The Hungarian wells tested at rates of 1.7 mmcfe/d(3) (81% gas), 2.0 mmcf/d(4) and 3.4 mmcf/d(5)respectively. The Croatian well tested at a rate of 15.0 mmcf/d(6). |
| • | Subsequent to the end of the second quarter, we were awarded two exploration licenses in Ukraine, subject to finalization of production sharing agreements, in partnership with Ukrgazvydobuvannya ("UGV", a Ukrainian state owned gas producer). The licenses cover approximately 585,000 gross acres in the Dnieper-Donets Basin, one of the most prolific natural gas regions in Europe. |
| • | In the United States, Q2 2019 production averaged 4,414 boe/d, an increase of 21% from the prior quarter, primarily driven by contributions from our first half 2019 Hilight drilling program. Production performance from the drilling program is above our type curves. |
| • | In Australia, production averaged 6,689 bbl/d in Q2 2019, an increase of 14% from the previous quarter, primarily due to contributions from the two (2.0 net) well drilling program completed at the end of January 2019. |
| • | In France, Q2 2019 production averaged 9,800 boe/d, a 15% decrease from the prior quarter. The decrease resulted from curtailment of our production in the Paris Basin as a result of an unplanned outage at the Grandpuits refinery, where all of our Paris Basin production is processed. The refinery was returned to service in late July and has now resumed accepting our oil deliveries. During the refinery outage, we utilized trucks and barges to ship a portion of our oil production to alternate delivery points in France and Germany. |
| • | On June 12, 2019, Vermilion entered into a series of cross currency interest rate swaps with a syndicate of banks, financially swapping the remaining term of our 5.625% US$300 million senior unsecured notes due March 15, 2025 into a €265 million obligation bearing interest at 3.275%. At current foreign exchange rates, this swap is expected to reduce our annual cash interest costs by approximately $9 million. |
| • | Our Board of Directors has authorized an application to the TSX to implement a normal course issuer bid ("NCIB") for a maximum amount of 5% of the issued and outstanding shares of Vermilion, which we plan to use as an additional means of returning capital to shareholders under appropriate market conditions. The NCIB is intended to augment our dividend, with excess free cash flow allocated to a combination of debt reduction and share buybacks. |
| • | Vermilion was recently rated "AA" in MSCI's annual ESG rankings for 2019, placing us in the top 19% of oil and gas companies worldwide. This rating is an improvement from "A" in the previous two years, and is driven by our determination to be the leader in ESG in the energy industry. |
| (1) | Non-GAAP Financial Measure. Please see the “Non-GAAP Financial Measures” section of the accompanying Management’s Discussion and Analysis. |
| (2) | Burgmoor Z5 well (46% working interest) tested at a final flow rate of 8.8 mmcf/d at a flowing wellhead pressure of 431 psi, with the rate limited by weather conditions during a 30 hour clean-up flow. The well produced at a final rate of 480 bbls/d of drilling and completion load fluid during clean-up operations, but is not expected to produce meaningful amounts of formation water under long-term producing conditions. The flowing wellhead pressure continued to increase during the clean-up period and was 431 psi immediately prior to being shut-in. The well encountered 125 feet of net pay in the Permian Zechstein Carbonate from 11,014-11,276 feet. Test results are not necessarily indicative of long-term performance or ultimate recovery. |
| (3) | Hajdubagos-01 well (100% working interest) tested at a flow rate of 1.4 mmcf/d of natural gas with 55 barrels per day of 60° API condensate with no formation water during a 12 hour flow test on a 0.374 inch choke with a stabilized flowing wellhead pressure of 590 psi. The well encountered 15 feet of net pay in an Upper Miocene Pannonian sandstone at depths from 6,517-6,550 feet. Test results are not necessarily indicative of long-term performance or ultimate recovery. |
Vermilion Energy Inc. ■ Page 3 ■ 2019 Second Quarter Report
| (4) | Mh-21 well (30% working interest) tested at a flow rate of 2.0 mmcf/d with no formation water during a six hour flow test with a stabilized flowing wellhead pressure of 543 psi on a 0.43 inch choke. The well encountered 26 feet of net pay in an Upper Miocene Pannonian sandstone at depths from 2,901-2,930 feet. Test results are not necessarily indicative of long-term performance or ultimate recovery. |
| (5) | Battonya E-09 well (100% working interest) tested at a flow rate of 3.4 mmcf/d with no formation water during an eight hour flow test with a stabilized flowing wellhead pressure of 739 psi on a 0.47 inch choke. The well encountered 17 feet of net pay in an Upper Miocene Pannonian sandstone from 2,448-2,476 feet. Test results are not necessarily indicative of long-term performance or ultimate recovery.
|
| (6) | Ceric-01 well (100% working interest) tested at a final flow rate of 15.0 mmcf/d at a stabilized flowing wellhead pressure of 851 psi on a 0.86 inch diameter choke during a one hour flow period following perforating. An additional 18 hour flow test was later conducted at reduced rates to limit flaring. During this test, the well flowed at a rate of 6.2 mmcf/d at a stabilized flowing pressure of 1,376 psi on a 0.37 inch choke. No formation water was produced during the tests. The well encountered 32 feet of net pay in two Upper Miocene Pannonian sandstones from 3,346-3,353 and 3,828-3,861 feet. Only the lower zone was tested. Test results are not necessarily indicative of long-term performance or ultimate recovery. |
Vermilion Energy Inc. ■ Page 4 ■ 2019 Second Quarter Report
| ($M except as indicated) | Q2 2019 | | Q1 2019 | | Q2 2018 | | | YTD 2019 | | YTD 2018 |
| Financial | | | | | | | | | | |
| Petroleum and natural gas sales | 428,043 | | | 481,083 | | | 394,498 | | | | 909,126 | | | 712,767 | |
| Fund flows from operations | 222,738 | | | 253,572 | | | 195,190 | | | | 476,310 | | | 355,605 | |
| Fund flows from operations ($/basic share)(1) | 1.44 | | | 1.66 | | | 1.45 | | | | 3.10 | | | 2.77 | |
| Fund flows from operations ($/diluted share)(1) | 1.42 | | | 1.64 | | | 1.43 | | | | 3.07 | | | 2.73 | |
| Net earnings (loss) | 2,004 | | | 39,547 | | | (61,364 | ) | | | 41,551 | | | (36,624 | ) |
| Net earnings (loss) ($/basic share) | 0.01 | | | 0.26 | | | (0.46 | ) | | | 0.27 | | | (0.28 | ) |
| Capital expenditures | 92,607 | | | 202,053 | | | 79,984 | | | | 294,660 | | | 208,449 | |
| Acquisitions | 8,623 | | | 16,027 | | | 1,465,485 | | | | 24,650 | | | 1,558,563 | |
| Asset retirement obligations settled | 4,907 | | | 3,597 | | | 2,626 | | | | 8,504 | | | 6,217 | |
| Cash dividends ($/share) | 0.690 | | | 0.690 | | | 0.690 | | | | 1.380 | | | 1.335 | |
| Dividends declared | 106,884 | | | 105,549 | | | 98,604 | | | | 212,433 | | | 177,609 | |
| % of fund flows from operations | 48 | % | | 42 | % | | 51 | % | | | 45 | % | | 50 | % |
| Net dividends(1) | 98,111 | | | 98,445 | | | 78,629 | | | | 196,556 | | | 137,993 | |
| % of fund flows from operations | 44 | % | | 39 | % | | 40 | % | | | 41 | % | | 39 | % |
| Payout(1) | 195,625 | | | 304,095 | | | 161,239 | | | | 499,720 | | | 352,659 | |
| % of fund flows from operations | 88 | % | | 120 | % | | 83 | % | | | 105 | % | | 99 | % |
| Net debt | 1,950,509 | | | 2,000,144 | | | 1,796,807 | | | | 1,950,509 | | | 1,796,807 | |
| Ratio of net debt to annualized fund flows from operations | 2.19 | | | 1.97 | | | 2.30 | | | | 2.05 | | | 2.53 | |
| Operational |
| Production | | | | | | | | | | |
| Crude oil and condensate (bbls/d) | 48,964 | | | 49,181 | | | 34,574 | | | | 49,072 | | | 30,812 | |
| NGLs (bbls/d) | 8,107 | | | 7,897 | | | 5,651 | | | | 8,002 | | | 5,390 | |
| Natural gas (mmcf/d) | 275.60 | | | 277.96 | | | 242.40 | | | | 276.77 | | | 235.34 | |
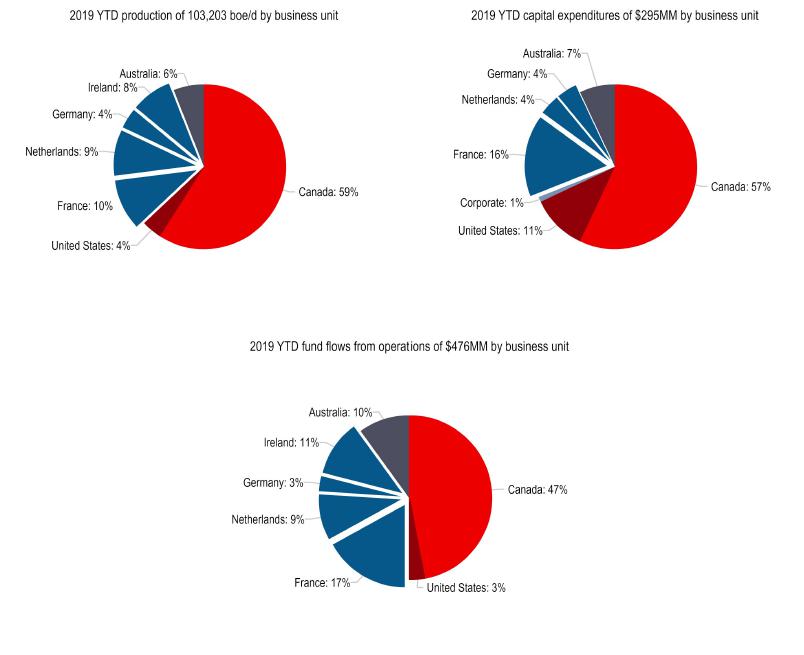
| Total (boe/d) | 103,003 | | | 103,404 | | | 80,625 | | | | 103,203 | | | 75,425 | |
| Average realized prices | | | | | | | | | | |
| Crude oil and condensate ($/bbl) | 79.46 | | | 73.45 | | | 87.50 | | | | 76.36 | | | 84.32 | |
| NGLs ($/bbl) | 11.25 | | | 22.49 | | | 26.06 | | | | 16.76 | | | 25.73 | |
| Natural gas ($/mcf) | 3.09 | | | 5.10 | | | 4.77 | | | | 4.09 | | | 5.27 | |
| Production mix (% of production) | | | | | | | | | | |
| % priced with reference to WTI | 38 | % | | 37 | % | | 29 | % | | | 37 | % | | 25 | % |
| % priced with reference to Dated Brent | 18 | % | | 18 | % | | 21 | % | | | 19 | % | | 23 | % |
| % priced with reference to AECO | 26 | % | | 26 | % | | 26 | % | | | 26 | % | | 26 | % |
| % priced with reference to TTF and NBP | 18 | % | | 19 | % | | 24 | % | | | 18 | % | | 26 | % |
| Netbacks ($/boe) | | | | | | | | | | |
| Operating netback(1) | 29.62 | | | 31.50 | | | 33.03 | | | | 30.57 | | | 32.22 | |
| Fund flows from operations netback | 24.15 | | | 26.76 | | | 26.58 | | | | 25.46 | | | 26.20 | |
| Operating expenses | 11.04 | | | 12.92 | | | 10.75 | | | | 11.99 | | | 10.82 | |
| General and administration expenses | 1.70 | | | 1.38 | | | 1.93 | | | | 1.54 | | | 1.91 | |
| Average reference prices | | | | | | | | | | |
| WTI (US $/bbl) | 59.81 | | | 54.90 | | | 67.88 | | | | 57.36 | | | 65.37 | |
| Edmonton Sweet index (US $/bbl) | 55.19 | | | 50.05 | | | 62.43 | | | | 52.62 | | | 59.70 | |
| Saskatchewan LSB index (US $/bbl) | 55.54 | | | 50.84 | | | 61.84 | | | | 53.19 | | | 59.23 | |
| Dated Brent (US $/bbl) | 68.82 | | | 63.20 | | | 74.35 | | | | 66.01 | | | 70.55 | |
| AECO ($/mcf) | 1.03 | | | 2.62 | | | 1.18 | | | | 1.83 | | | 1.63 | |
| NBP ($/mcf) | 5.44 | | | 8.33 | | | 9.42 | | | | 6.89 | | | 9.69 | |
| TTF ($/mcf) | 5.75 | | | 8.14 | | | 9.50 | | | | 6.94 | | | 9.54 | |
| Average foreign currency exchange rates | | | | | | | | | | |
| CDN $/US $ | 1.34 | | | 1.33 | | | 1.29 | | | | 1.33 | | | 1.28 | |
| CDN $/Euro | 1.50 | | | 1.51 | | | 1.54 | | | | 1.51 | | | 1.55 | |
| Share information ('000s) |
| Shares outstanding - basic | 155,032 | | | 153,213 | | | 152,363 | | | | 155,032 | | | 152,363 | |
| Shares outstanding - diluted(1) | 158,633 | | | 156,650 | | | 155,355 | | | | 158,633 | | | 155,355 | |
| Weighted average shares outstanding - basic | 154,795 | | | 152,904 | | | 134,603 | | | | 153,855 | | | 128,531 | |
| Weighted average shares outstanding - diluted(1) | 156,844 | | | 154,550 | | | 136,559 | | | | 155,335 | | | 130,224 | |
(1)The above table includes non-GAAP financial measures which may not be comparable to other companies. Please see the “Non-GAAP Financial Measures” section of the accompanying Management’s Discussion and Analysis.
Vermilion Energy Inc. ■ Page 5 ■ 2019 Second Quarter Report
Message to Shareholders
During the second quarter, we conducted our most active exploration drilling program in Europe in the history of the company. Over the past four months, we have drilled one exploration well in Germany and five exploration wells in our Central and Eastern European (“CEE”) business unit, with successes on all but one well in Hungary. This drilling campaign was preceded by several years of careful implementation of our new country entry strategy. We entered Germany in 2014 and initially focused on expanding our land position through various acquisitions, farm-ins and government concessions, and we now have approximately 1.2 million net acres of land, comprising about one-quarter of the prolific North German Basin. The first few years were focused on building our team and executing on low risk development opportunities on the existing producing assets while evaluating future exploration and development prospects. Following the successful completion of our first operated drilling in Germany this summer, we now plan to drill at least one exploration well in Germany each year over the next several years, targeting other sizable gas prospects in the basin.
We followed a similar approach when we entered Central and Eastern Europe later in 2014. We acquired land in the Pannonian Basin in Hungary, Croatia and Slovakia through various government concessions and deals with industry partners. Our initial focus was on building our knowledge of the basin and operating environment, while acquiring and evaluating seismic to identify future drilling prospects. This summer’s drilling program has yielded four conventional discoveries in Hungary and Croatia in five exploratory attempts. We look forward to executing the remainder of our Croatian program and to initiating our Slovakian program later this year.
Subsequent to the second quarter, we further expanded our CEE presence as we were awarded two exploration licenses in Ukraine in partnership with Ukrgazvydobuvannya ("UGV", a Ukrainian state owned gas producer) in the prolific Dnieper-Donets Basin. These two licenses are in close proximity to several multi-TCF gas fields with most of the basin (and awarded license areas) still not covered by 3D seismic. Entering Ukraine aligns with our strategy to capitalize on opportunities in under-exploited basins by using modern technologies to improve success rates and recovery.
In addition to our Germany and CEE exploration drilling programs, we are also currently preparing to drill the first well (0.5 net) of our two (1.0 net) well 2019 program in the Netherlands after having received permits for these wells in the second quarter. Netherlands continues to be a strong free cash flow generating business and we look forward to resuming drilling there after a two-year hiatus.
Our second quarter results were negatively impacted by a third-party refinery outage in France which reduced production and forced us to find alternate transportation methods and delivery points for our oil in the Paris Basin, which is the larger of our two producing regions in the country. Our French team did an exceptional job of contracting for alternate delivery points for most of our production, and conducting the required long-haul trucking and barging in a safe manner. Despite the refinery outage, which impacted quarterly production volumes by approximately 1,300 boe/d and FFO by approximately $11 million, we recorded corporate production of approximately 103,000 boe/d, little changed from the previous quarter.
We recorded FFO of $223 million in Q2 2019, down 12% from the prior quarter. In addition to the France refinery impact, the primary drivers for this lower FFO were the timing of crude lifting in Australia, which resulted in an inventory build and lower sales volumes ($8 million impact), and weaker natural gas prices in Europe and North America ($33 million impact).
We were able to mitigate a portion of this pricing variance through our hedging program, particularly in European gas, realizing a $14 million pre-tax gain during the quarter. European gas prices weakened this summer due to increased LNG deliveries. However, we have locked in pricing on approximately 70% of our summer European gas at significantly higher prices than the spot price. The forward price for European gas remains in strong contango compared to the front month price, with the calendar 2020 strip for NBP at approximately $8.50/mmbtu, and calendar year strips for the next three years are currently trading within approximately 1% of where they were one year ago. While our fundamental view on European gas is that the forward market realistically reflects supply and demand drivers, we are willing to lock in this curve and attendant strong levels of free cash flow and expected project economics. Accordingly, we have already hedged 65% of our expected 2020 European gas production, with hedges continuing at lower percentages on into 2022.
Since 2003, Vermilion has had a track record of returning capital to shareholders through our monthly dividend (previously a cash distribution during the trust era). This distribution and dividend stream has been increased four times and has never been reduced. We also recognize that other forms of returning capital to shareholders, such as share buybacks, may be appropriate to complement our dividend in certain market conditions. With this in mind, our Board of Directors has authorized an application to the TSX to implement a normal course issuer bid ("NCIB") for a maximum amount of 5% of the issued and outstanding shares of Vermilion. We intend to use the NCIB to return capital to our shareholders, augmenting our current return of cash through dividends. We will also continue to allocate a portion of excess free cash flow to debt reduction.
Vermilion Energy Inc. ■ Page 6 ■ 2019 Second Quarter Report
| Q2 2019 Operations Review |
Europe
In France, Q2 2019 production averaged 9,800 boe/d, a decrease of 15% from the prior quarter. Our production in the Paris Basin was temporarily curtailed as a result of a third party refinery outage due to a failure on the refinery's main feedstock line. The Grandpuits refinery, where all of our Paris Basin production is processed, returned to service in late July, and has resumed processing Vermilion deliveries. During the refinery outage, we made arrangements to ship most of our oil to alternate delivery points in France and Germany utilizing trucks and barges. The net impact from the refinery outage reduced our Q2 2019 production volumes by approximately 1,300 boe/d and after-tax FFO by approximately $11 million ($0.07/share) from reduced sales and higher transportation expense. In addition, approximately $2 million in capital investment was required to put truck and barge loading equipment in place.
In the Netherlands, Q2 2019 production averaged 8,917 boe/d, an increase of 3% from the prior quarter. The increase is primarily due to the successful completion of our first half 2019 workover and facility maintenance program, which was partially offset by minor downtime. During the second quarter we received the draft drilling permit for the Waalwijk South well (0.5 net), the second well in our planned 2019 drilling program. We recently began site construction for the first well of our 2019 program, the Weststellingwerf well (0.5 net), which is expected to commence drilling in August 2019. Drilling of the Waalwijk South well is expected to begin in Q4 2019.
In Ireland, production averaged 49 mmcf/d (8,201 boe/d) in Q2 2019, a decrease of 4.8% from the prior quarter. The decrease was due to natural decline and minor unplanned downtime at the Corrib natural gas processing facility. Since we took over as operator of the Corrib Project late in 2018, operating costs have decreased 14% over the comparative six-month period. At present, our efforts are focused on evaluating future facility and drilling projects, and optimizing our maintenance activities, including a scheduled plant turnaround in Q3 2019.
In Germany, production in Q2 2019 averaged 3,474 boe/d, a decrease of 8% from the prior quarter. The decrease is primarily due to unplanned downtime on several operated and non-operated assets, which was partially offset by a full quarter contribution from various well workovers performed on our operated oil assets earlier this year. During the quarter, we completed drilling our first exploratory well in Germany, the Burgmoor Z5 well (46% working interest). The well reached a measured depth of 11,480 feet and encountered 125 feet of net pay in the Zechstein carbonate. The well was tested at the end of July at a final flow rate of 8.8 mmcf/d(2)limited by weather conditions. The Burgmoor Z5 well has been turned over to ExxonMobil as operator during the testing and production phases. We also completed and brought on production a non-operated coil tubing sidetrack (0.25 net) during the quarter.
In Central and Eastern Europe, we drilled four (3.3 net) exploration wells during Q2 2019, and one (1.0 net) subsequent to the end of the quarter. Four of these wells resulted in new gas discoveries. In Hungary, we drilled four (3.3 net) exploration wells, the first (1.0 net) of which was dry. The second well (1.0 net) of our 2019 Hungary drilling program encountered 15 feet of net gas pay and tested at a rate of 1.4 mmcf/d and 55 bbls/d(3) of condensate. The third well (0.3 net) encountered 26 feet of net gas pay, and tested at a rate of 2.0 mmcf/d(4) in July. The fourth Hungarian well (1.0 net) was drilled and tested in July, encountering 17 feet of net gas pay and testing at 3.4 mmcf/d(5). In Croatia, we drilled our first natural gas exploration well (1.0 net) in the country which encountered 32 feet of net gas pay in two zones. Subsequent to the end of the quarter, it tested 15.0 mmcf/d(6) from the lower zone.
Subsequent to the end of the second quarter, we were awarded two exploration licenses in Ukraine, subject to a final production sharing agreement, in a 50/50 partnership with Ukrgazvydobuvannya ("UGV", a Ukrainian state owned gas producer). The licenses cover approximately 585,000 gross acres situated in one of Europe's most prolific natural gas regions (Dnieper-Donets Basin). The new licenses are in close proximity to several multi-TCF gas fields with most of the basin (and awarded license areas) still uncovered by 3D seismic. The terms of the licenses include a modest capital commitment, back-loaded over a five-year time frame.
North America
In Canada, production averaged 61,507 boe/d in Q2 2019, up slightly from the prior quarter. The increase was primarily due to the contribution from our first quarter drilling program in Saskatchewan and Alberta, partially offset by unplanned facility downtime and less drilling activity in the second quarter due to spring breakup. We drilled or participated in 28 (22.9 net) wells in the second quarter of 2019, including 27 (22.4 net) wells in Saskatchewan and one (0.5 net) Mannville well in Alberta. We brought six (6.0 net) wells on production in Saskatchewan and one (1.0 net) well in Alberta during the quarter. During the second half of the year, we plan to drill 73 (62.7 net) wells in Saskatchewan and six (4.2 net) wells in Alberta, in addition to completing several plant turnarounds in Alberta in Q3 2019. We are currently operating four drilling rigs in Saskatchewan, but have been delayed in resuming Alberta activity due to wet weather conditions.
Vermilion Energy Inc. ■ Page 7 ■ 2019 Second Quarter Report
In the United States, Q2 2019 production averaged 4,414 boe/d, representing an increase of 21% from the prior quarter. The increase was primarily driven by production contributions from our first half 2019 Hilight drilling campaign, in which four (4.0 net) wells were completed and brought on production during the quarter. The first two wells were equipped with rod pumps and brought on production in mid-April. These wells have performed ahead of our expectations, producing in excess of our rod-pump type curve through the end of the quarter, and achieving an average peak IP30 rate of approximately 325 boe/d to date, with production still on a modest incline in one of the wells. The two subsequent wells were equipped with electric submersible pumps ("ESP") and were brought on production in mid-May. These two wells have also performed ahead of our expectations by approximately 150 bbls/d on average, while achieving an average peak IP30 rate of approximately 635 boe/d per well. We recently mobilized a rig that we had been using on our Canadian operations to Wyoming for our remaining (4.0 net) Hilight wells planned for this year. The fifth well of the program was spud toward the end of Q2 2019 and was drilled in less than 12 days, representing a 28% improvement over the fastest H1 2019 well. Since taking over operatorship last year, we have achieved a 15% reduction in DCET costs, and expect another 10% improvement in the remaining wells this year.
Australia
In Australia, production averaged 6,689 bbl/d in Q2 2019, an increase of 14% from the previous quarter primarily due to contributions from the two (2.0 net) well drilling program completed at the end of January 2019. We continue to manage our Australian production to our annual production target of 6,000 bbl/d.
Cross Currency Interest Rate Swaps
On June 12, 2019, Vermilion entered into a series of cross currency interest rate swaps with a syndicate of banks, financially swapping the remaining term of our 5.625% US$300 million senior unsecured notes due March 2025 into a €265 million obligation bearing interest at 3.275%. At current foreign exchange rates, this swap is expected to reduce our annual cash interest costs by approximately $9 million.
Credit Rating
On July 26, 2019, Fitch Ratings initiated a credit rating for Vermilion. The corporate first-time Long-Term Issuer Default Rating was initiated at a BB- with a stable outlook and the BB- rating was assigned to the issued and outstanding senior unsecured notes due March 2025.
Normal Course Issuer Bid
Our Board of Directors has authorized an application to the TSX to implement a normal course issuer bid ("NCIB") for a maximum amount of 5% of the issued and outstanding shares of Vermilion, which we plan to use as an additional means of returning capital to shareholders under appropriate market conditions. The NCIB is intended to augment our ongoing return of capital via dividends. We plan to allocate excess free cash flow beyond our dividend stream to both debt reduction and buybacks.
Commodity Hedging
Vermilion hedges to manage commodity price exposures and increase the stability of our cash flows, providing additional certainty with regard to the execution of our dividend and capital programs. In aggregate, as of July 25, 2019, we currently have 40% of our expected net-of-royalty production hedged for Q3 2019. More than half of our Q3 2019 corporate hedge position consists of two-way collars and three-way structures, which allow participation in price increases up to contract ceilings. For 2020, approximately 70% of our hedge position is in participating structures.
We have currently hedged 71% of anticipated European natural gas volumes for Q3 2019. We have also hedged 69% and 65% of our anticipated full-year 2019 and 2020 European natural gas volumes, respectively, at prices which are expected to provide for strong project economics and free cash flows. At present, 33% of both our expected Q3 2019 and Q4 2019 oil production is hedged. For Q3 2019, 45% of our North American natural gas production is priced away from AECO, due to diversification hedges to financially sell at the SoCal Border and at Henry Hub for a portion of our Alberta natural gas production, and because 15% of our North American gas production is located in Saskatchewan and Wyoming.
Sustainability
Vermilion was recently rated "AA" in MSCI's annual ESG rankings for 2019, placing us in the top 19% of oil and gas companies worldwide. This rating is an improvement from "A" in the previous two years. MSCI ESG Research LLC is the world's largest provider of ESG ratings and research, rating over 13,000 equity and income issuers. Its research is used globally to help investors understand how ESG factors can impact the long-term risk and return profile of their investments. Our increased rating is the result of improving company ESG performance and enhanced disclosure on topics relevant to MSCI's detailed assessment process.
Vermilion Energy Inc. ■ Page 8 ■ 2019 Second Quarter Report
Organizational Update
Mr. Kyle Preston, previously our Director of Investor Relations, has been promoted to the position of Vice President of Investor Relations. He joined Vermilion in 2016 and has over 20 years of experience in oil and gas finance, including 13 years as an equity research analyst. Mr. Preston has played a key role in developing and executing our differentiated capital markets strategy. He holds the Chartered Financial Analyst® and Certified Management Accountant designations and earned a Bachelor of Commerce degree from the University of Manitoba.
(signed “Anthony Marino”)
Anthony Marino
President & Chief Executive Officer
July 25, 2019
| (1) | Non-GAAP Financial Measure. Please see the “Non-GAAP Financial Measures” section of Management’s Discussion and Analysis. |
| (2) | Burgmoor Z5 well (46% working interest) tested at a final flow rate of 8.8 mmcf/d at a flowing wellhead pressure of 431 psi, with the rate limited by weather conditions during a 30 hour clean-up flow. The well produced at a final rate of 480 bbls/d of drilling and completion load fluid during clean-up operations, but is not expected to produce meaningful amounts of formation water under long-term producing conditions. The flowing wellhead pressure continued to increase during the clean-up period and was 431 psi immediately prior to being shut-in. The well encountered 125 feet of net pay in the Permian Zechstein Carbonate from 11,014-11,276 feet. Test results are not necessarily indicative of long-term performance or ultimate recovery. |
| (3) | Hajdubagos-01 well (100% working interest) tested at a flow rate of 1.4 mmcf/d of natural gas with 55 barrels per day of 60° API condensate with no formation water during a 12 hour flow test on a 0.374 inch choke with a stabilized flowing wellhead pressure of 590 psi. The well encountered 15 feet of net pay in an Upper Miocene Pannonian sandstone at depths from 6,517-6,550 feet. Test results are not necessarily indicative of long-term performance or ultimate recovery. |
| (4) | Mh-21 well (30% working interest) tested at a flow rate of 2.0 mmcf/d with no formation water during a six hour flow test with a stabilized flowing wellhead pressure of 543 psi on a 0.43 inch choke. The well encountered 26 feet of net pay in an Upper Miocene Pannonian sandstone at depths from 2,901-2,930 feet. Test results are not necessarily indicative of long-term performance or ultimate recovery. |
| (5) | Battonya E-09 well (100% working interest) tested at a flow rate of 3.4 mmcf/d with no formation water during an eight hour flow test with a stabilized flowing wellhead pressure of 739 psi on a 0.47 inch choke. The well encountered 17 feet of net pay in an Upper Miocene Pannonian sandstone from 2,448-2,476 feet. Test results are not necessarily indicative of long-term performance or ultimate recovery. |
| (6) | Ceric-01 well (100% working interest) tested at a final flow rate of 15.0 mmcf/d at a stabilized flowing wellhead pressure of 851 psi on a 0.86 inch diameter choke during a one hour flow period following perforating. An additional 18 hour flow test was later conducted at reduced rates to limit flaring. During this test, the well flowed at a rate of 6.2 mmcf/d at a stabilized flowing pressure of 1,376 psi on a 0.37 inch choke. No formation water was produced during the tests. The well encountered 32 feet of net pay in two Upper Miocene Pannonian sandstones from 3,346-3,353 and 3,828-3,861 feet. Only the lower zone was tested. Test results are not necessarily indicative of long-term performance or ultimate recovery. |
Vermilion Energy Inc. ■ Page 9 ■ 2019 Second Quarter Report
Management's Discussion and Analysis
The following is Management’s Discussion and Analysis (“MD&A”), dated July 25, 2019, of Vermilion Energy Inc.’s (“Vermilion”, “we”, “our”, “us” or the “Company”) operating and financial results as at and for the three and six months ended June 30, 2019 compared with the corresponding periods in the prior year.
This discussion should be read in conjunction with the unaudited condensed consolidated interim financial statements for the three and six months ended June 30, 2019 and the audited consolidated financial statements for the years ended December 31, 2018 and 2017, together with the accompanying notes. Additional information relating to Vermilion, including its Annual Information Form, is available on SEDAR at www.sedar.com or on Vermilion’s website at www.vermilionenergy.com.
The unaudited condensed consolidated interim financial statements for the three and six months ended June 30, 2019 and comparative information have been prepared in Canadian dollars, except where another currency has been indicated, and in accordance with IAS 34, "Interim Financial Reporting", as issued by the International Accounting Standards Board ("IASB").
This MD&A includes references to certain financial and performance measures which do not have standardized meanings prescribed by International Financial Reporting Standards ("IFRS"). These measures include:
| • | Fund flows from operations: Fund flows from operations is a measure of profit or loss in accordance with IFRS 8 “Operating Segments”. Please see "Segmented Information" in the "Notes to the Condensed Consolidated Interim Financial Statements" for a reconciliation of fund flows from operations to net earnings. We analyze fund flows from operations both on a consolidated basis and on a business unit basis in order to assess the contribution of each business unit to our ability to generate income necessary to pay dividends, repay debt, fund asset retirement obligations and make capital investments. |
| • | Net debt: Net debt is a capital management measure in accordance with IAS 1 "Presentation of Financial Statements". Net debt is comprised of long-term debt plus current liabilities less current assets and represents Vermilion's net financing obligations after adjusting for the timing of working capital fluctuations. Net debt excludes lease obligations which are secured by a corresponding right-of-use asset. Please see "Capital disclosures" in the "Notes to the Condensed Consolidated Interim Financial Statements" for additional information. |
| • | Netbacks: Netbacks are per boe and per mcf performance measures used in the analysis of operational activities. We assess netbacks both on a consolidated basis and on a business unit basis in order to compare and assess the operational and financial performance of each business unit versus other business units and also versus third party crude oil and natural gas producers. |
In addition, this MD&A includes references to certain financial measures which are not specified, defined, or determined under IFRS and are therefore considered non-GAAP financial measures. These non-GAAP financial measures are unlikely to be comparable to similar financial measures presented by other issuers. For a full description of these non-GAAP financial measures and a reconciliation of these measures to their most directly comparable GAAP measures, please refer to “Non-GAAP Financial Measures”.
Condensate Presentation
We report our condensate production in Canada and the Netherlands business units within the crude oil and condensate production line. We believe that this presentation better reflects the historical and forecasted pricing for condensate, which is more closely correlated with crude oil pricing than with pricing for propane, butane and ethane (collectively “NGLs” for the purposes of this report).
Vermilion Energy Inc. ■ Page 10 ■ 2019 Second Quarter Report
Guidance
On October 25, 2018, we released our 2019 capital budget and related guidance. On February 27, 2019, we deferred some activity to later in the year and reallocated capital between business units, although the 2019 total budget and production guidance remained unchanged.
The following table summarizes our guidance:
| | Date | | Capital Expenditures ($MM) | | Production (boe/d) |
| 2019 Guidance | | | | | |
| 2019 Guidance | October 25, 2018 | | 530 | | | 101,000 to 106,000 |
| | | | | | | |
Vermilion Energy Inc. ■ Page 11 ■ 2019 Second Quarter Report
Vermilion's Business
Vermilion is a Calgary, Alberta based international oil and gas producer focused on the acquisition, exploration, development, and optimization of producing properties in North America, Europe, and Australia. We manage our business through our Calgary head office and our international business unit offices. This MD&A separately discusses each of our business units in addition to our corporate segment.
Vermilion Energy Inc. ■ Page 12 ■ 2019 Second Quarter Report
Consolidated Results Overview
| | Q2 2019 | | Q1 2019 | | Q2 2018 | | Q2/19 vs.
Q1/19 | | Q2/19 vs.
Q2/18 | | | YTD 2019 | | YTD 2018 | | 2019 vs.
2018 |
| Production | | | | | | | | | | | | | | | | |
| Crude oil and condensate (bbls/d) | 48,964 | | | 49,181 | | | 34,574 | | | (0.4)% | | 41.6% | | | 49,072 | | | 30,812 | | | 59.3% |
| NGLs (bbls/d) | 8,107 | | | 7,897 | | | 5,651 | | | 2.7% | | 43.5% | | | 8,002 | | | 5,390 | | | 48.5% |
| Natural gas (mmcf/d) | 275.60 | | | 277.96 | | | 242.40 | | | (0.8)% | | 13.7% | | | 276.77 | | | 235.34 | | | 17.6% |
| Total (boe/d) | 103,003 | | | 103,404 | | | 80,625 | | | (0.4)% | | 27.8% | | | 103,203 | | | 75,425 | | | 36.8% |
| Sales | | | | | | | | | | | | | | | | |
| Crude oil and condensate (bbls/d) | 47,337 | | | 51,068 | | | 34,655 | | | (7.3)% | | 36.6% | | | 49,192 | | | 30,352 | | | 62.1% |
| NGLs (bbls/d) | 8,107 | | | 7,897 | | | 5,651 | | | 2.7% | | 43.5% | | | 8,002 | | | 5,390 | | | 48.5% |
| Natural gas (mmcf/d) | 275.60 | | | 277.96 | | | 242.40 | | | (0.8)% | | 13.7% | | | 276.77 | | | 235.34 | | | 17.6% |
| Total (boe/d) | 101,377 | | | 105,291 | | | 80,706 | | | (3.7)% | | 25.6% | | | 103,323 | | | 74,965 | | | 37.8% |
| (Draw) build in inventory (mbbls) | 149 | | | (170 | ) | | (7 | ) | | | | | | | (21 | ) | | 83 | | | |
| Financial metrics | | | | | | | | | | | | | | | | |
| Fund flows from operations ($M) | 222,738 | | | 253,572 | | 195,190 | | (12.2)% | | 14.1% | | | 476,310 | | | 355,605 | | 33.9% |
| Per share ($/basic share) | 1.44 | | | 1.66 | | 1.45 | | (13.3)% | | (0.7)% | | | 3.10 | | | 2.77 | | | 11.9% |
| Net earnings (loss) ($M) | 2,004 | | | 39,547 | | | (61,364 | ) | | (94.9)% | | N/A | | | 41,551 | | | (36,624 | ) | | N/A |
| Per share ($/basic share) | 0.01 | | | 0.26 | | | (0.46 | ) | | (96.2)% | | N/A | | | 0.27 | | | (0.28 | ) | | N/A |
| Net debt ($M) | 1,950,509 | | | 2,000,144 | | | 1,796,807 | | | (2.5)% | | 8.6% | | | 1,950,509 | | | 1,796,807 | | | 8.6% |
| Cash dividends ($/share) | 0.690 | | | 0.690 | | | 0.690 | | | - % | | - % | | | 1.380 | | | 1.335 | | | 3.4% |
| Activity | | | | | | | | | | | | | | | | |
| Capital expenditures ($M) | 92,607 | | | 202,053 | | | 79,984 | | | (54.2)% | | 15.8% | | | 294,660 | | | 208,449 | | | 41.4% |
| Acquisitions ($M) | 8,623 | | | 16,027 | | | 1,465,485 | | | | | | | | 24,650 | | | 1,558,563 | | | |
| Gross wells drilled | 35.00 | | | 66.00 | | | 18.00 | | | | | | | | 101.00 | | | 47.00 | | | |
| Net wells drilled | 27.88 | | | 62.94 | | | 16.19 | | | | | | | | 90.82 | | | 43.88 | | | |
Financial performance review |
Q2 2019 vs. Q1 2019
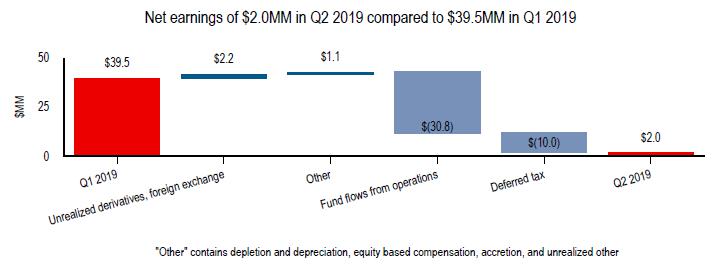
| • | We recorded net earnings for Q2 2019 of $2.0 million ($0.01/basic share) compared to net earnings of $39.5 million ($0.26/basic share) in Q1 2019. This quarter-over-quarter decrease in net earnings was primarily attributable to a decrease in fund flows from operations and a higher deferred tax expense of $25.0 million as deferred tax assets were reduced following the reduction of corporate tax rates in Alberta and reduced valuation of non-expiring Ireland tax pools. |
Vermilion Energy Inc. ■ Page 13 ■ 2019 Second Quarter Report

| • | We generated fund flows from operations of $222.7 million during Q2 2019, a decrease of 12% from Q1 2019. This quarter-over-quarter decrease was primarily due to the impact of a third party refinery outage in France, an inventory draw in Australia in Q1 2019 compared to an inventory build in Q2 2019, and lower realized natural gas prices during the current period. |
Q2 2019 vs. Q2 2018
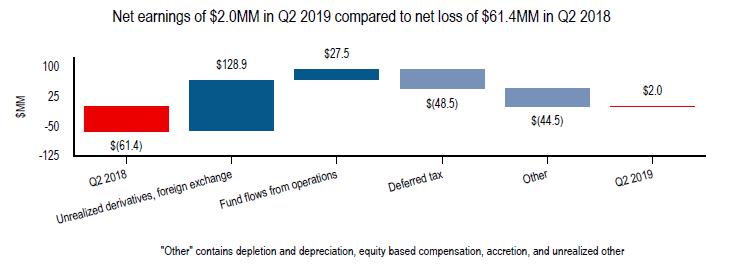
| • | We recorded net earnings for Q2 2019 of $2.0 million ($0.01/basic share) compared to a net loss of $61.4 million ($0.46/basic share) in Q2 2018. The increase is primarily driven by lower unrealized losses on derivative instruments in Q2 2019 of $30.6 million compared to unrealized losses of $105.3 million in Q2 2018. The increase is partially offset by an increase of $48.5 million in deferred tax expense. |
Vermilion Energy Inc. ■ Page 14 ■ 2019 Second Quarter Report
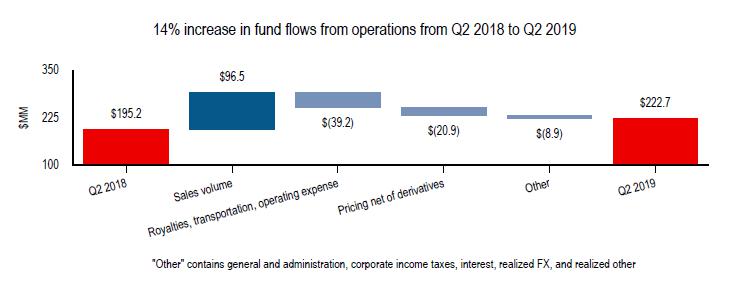
| • | Fund flows from operations increased 14% in Q2 2019 versus Q2 2018. This year-over-year increase was primarily the result of higher sales volumes, which were partially offset by lower commodity prices and incremental expenses associated with the increased volumes. |
YTD 2019 vs. YTD 2018

| • | For the six months ended June 30, 2019, net earnings of $41.6 million were recorded compared to a net loss of $36.6 million for the comparable period in 2018. The increase in net earnings resulted from a year-over-year increase in fund flows from operations of $120.7 million due to increased sales volumes offset by related incremental expenses associated with the increased volumes. The increase in net earnings also resulted from an unrealized loss on derivative instruments of $44.9 million (compared to an unrealized loss of $87.9 million for the comparable period in 2018) and an unrealized gain on foreign exchange of $65.1 million (compared to an unrealized loss of $3.8 million for the comparable period in 2018). These increases were partially offset by a $53.8 million increase in deferred tax expense. |
Vermilion Energy Inc. ■ Page 15 ■ 2019 Second Quarter Report
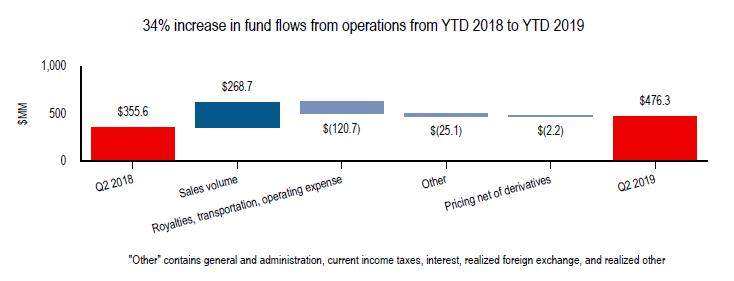
| • | Fund flows from operations increased 34% for the six months ended June 30, 2019 versus the same period in 2018 due to increased sales volumes offset by increases in royalties, transportation and operating expense. Sales volumes increased by 38% year-over-year primarily due to production increases in Canada, Australia, and the United States. Our consolidated realized price decreased by 8% from $52.53/boe to $48.61/boe due to weaker crude oil and gas pricing. |
Q2 2019 vs. Q1 2019
| • | Consolidated average production of 103,003 boe/d during Q2 2019 decreased slightly compared to Q1 2019 production of 103,404 boe/d. Production increases in the United States from organic growth and in Australia from the two wells that were brought on production in Q1 2019 were more than offset by lower production in France due to a refinery outage in the Paris Basin. |
Q2 2019 vs. Q2 2018
| • | Consolidated average production of 103,003 boe/d in Q2 2019 represented an increase of 28% from Q2 2018 due to growth in Canada, the Netherlands, the United States, and Australia. In Canada, year-over-year growth was the result of acquisitions in 2018 and continued development of our Mannville condensate-rich resource play and southeast Saskatchewan light oil development. Production in the Netherlands increased due to the Eesveen-02 well (60% working interest), which we brought on production in Q3 2018 and a successful workover program. In the United States, production growth resulted from an acquisition in Q3 2018 and organic drilling activity. Production in Australia increased due to the two-well drilling program brought on production in Q1 2019. |
YTD 2019 vs. YTD 2018
| • | For the six months ended June 30, 2019, consolidated average production of 103,203 boe/d represented an increase of 37% from the comparable period in 2018 due to growth in Canada, the United States, Australia, and the Netherlands. In Canada, production increased as a result of acquisitions in 2018 and continued development of our Mannville condensate-rich resource play and southeast Saskatchewan light oil development. In the United States, production growth resulted from an acquisition in Q3 2018 and organic drilling activity. Production in Australia increased due to the two-well drilling program brought on production in Q1 2019. In the Netherlands, production increased as a result of a new well brought on production in Q3 2018 and from a successful workover program in the first half of 2019. |
Vermilion Energy Inc. ■ Page 16 ■ 2019 Second Quarter Report
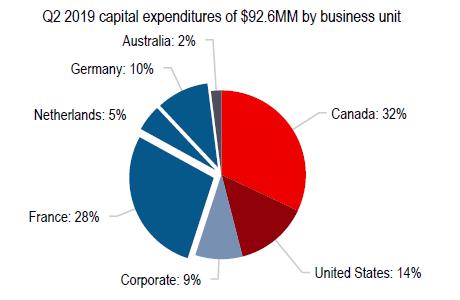
| • | For the three months ended June 30, 2019, capital expenditures of $92.6 million primarily related to activity in Canada, France, the United States, Germany and Central and Eastern Europe (included in the Corporate segment shown above). In Canada, capital expenditures of $29.1 million included the drilling of 28.0 (22.9 net) wells, including 27.0 (22.4 net) wells in Saskatchewan and one (0.5 net) Mannville well in Alberta. In France, capital expenditures of $25.7 million related to the drilling of one (1.0 net) Champotran well and our 2019 workover program. Capital expenditures of $13.0 million in the United States related to the drilling of one (1.0 net) Turner horizontal well in the Hilight field. In Germany, capital expenditures of $9.2 million related to drilling of the Burgmoor Z5 well (46% working interest). In Central and Eastern Europe (included in the Corporate segment), capital expenditures of $8.8 million primarily related to drilling activities in Hungary and Croatia. |
Dividends
| • | Declared dividends of $0.23 per common share per month throughout 2019, resulting in total dividends declared of $1.38 per common share for the six months ended June 30, 2019. |
Long-term debt and net debt
| • | Long-term debt increased from $1.8 billion as at December 31, 2018, to $1.9 billion as at June 30, 2019. This increase was primarily a result of increased borrowings on the revolving credit facility and was partially offset by the impact of the stronger Canadian dollar on our US-denominated Senior Unsecured Notes. |
| • | Net debt increased to $2.0 billion as at June 30, 2019, from $1.9 billion at December 31, 2018, primarily due to increased borrowings on our revolving credit facility. |
| • | The ratio of net debt to quarterly annualized fund flows from operations remained consistent at 2.19 (December 31, 2018 - 2.17) as the increase in net debt was partially offset by year-over-year increased annualized fund flows from operations. |
Vermilion Energy Inc. ■ Page 17 ■ 2019 Second Quarter Report
Commodity Prices
| | Q2 2019 | | Q1 2019 | | Q2 2018 | | Q2/19 vs.
Q1/19 | | Q2/19 vs.
Q2/18 | | | YTD 2019 | | YTD 2018 | | 2019 vs.
2018 |
| Crude oil | | | | | | | | | | | | | | | | |
| WTI ($/bbl) | 80.00 | | | 72.97 | | | 87.63 | | | 9.6% | | (8.7)% | | | 76.48 | | | 83.54 | | | (8.5)% |
| WTI (US $/bbl) | 59.81 | | | 54.90 | | | 67.88 | | | 8.9% | | (11.9)% | | | 57.36 | | | 65.37 | | | (12.3)% |
| Edmonton Sweet index ($/bbl) | 73.82 | | | 66.53 | | | 80.60 | | | 11.0% | | (8.4)% | | | 70.16 | | | 76.29 | | | (8.0)% |
| Edmonton Sweet index (US $/bbl) | 55.19 | | | 50.05 | | | 62.43 | | | 10.3% | | (11.6)% | | | 52.62 | | | 59.70 | | | (11.9)% |
| Saskatchewan LSB index ($/bbl) | 74.28 | | | 67.58 | | | 79.84 | | | 9.9% | | (7.0)% | | | 70.92 | | | 75.69 | | | (6.3)% |
| Saskatchewan LSB index (US $/bbl) | 55.54 | | | 50.84 | | | 61.84 | | | 9.2% | | (10.2)% | | | 53.19 | | | 59.23 | | | (10.2)% |
| Canadian C5+ Condensate index ($/bbl) | 74.70 | | | 67.20 | | | 88.86 | | | 11.2% | | (15.9)% | | | 70.94 | | | 84.25 | | | (15.8)% |
| Canadian C5+ Condensate index (US $/bbl) | 55.85 | | | 50.56 | | | 68.83 | | | 10.5% | | (18.9)% | | | 53.21 | | | 65.93 | | | (19.3)% |
| Dated Brent ($/bbl) | 92.05 | | | 84.01 | | | 95.99 | | | 9.6% | | (4.1)% | | | 88.01 | | | 90.16 | | | (2.4)% |
| Dated Brent (US $/bbl) | 68.82 | | | 63.20 | | | 74.35 | | | 8.9% | | (7.4)% | | | 66.01 | | | 70.55 | | | (6.4)% |
| Natural gas | | | | | | | | | | | | | | | | |
| AECO ($/mcf) | 1.03 | | | 2.62 | | | 1.18 | | | (60.7)% | | (12.7)% | | | 1.83 | | | 1.63 | | | 12.3% |
| NBP ($/mcf) | 5.44 | | | 8.33 | | | 9.42 | | | (34.7)% | | (42.3)% | | | 6.89 | | | 9.69 | | | (28.9)% |
| NBP (€/mcf) | 3.62 | | | 5.52 | | | 6.12 | | | (34.4)% | | (40.8)% | | | 4.57 | | | 6.27 | | | (27.1)% |
| TTF ($/mcf) | 5.75 | | | 8.14 | | | 9.50 | | | (29.4)% | | (39.5)% | | | 6.94 | | | 9.54 | | | (27.3)% |
| TTF (€/mcf) | 3.82 | | | 5.39 | | | 6.17 | | | (29.1)% | | (38.1)% | | | 4.61 | | | 6.17 | | | (25.3)% |
| Henry Hub ($/mcf) | 3.53 | | | 4.19 | | | 3.61 | | | (15.8)% | | (2.2)% | | | 3.86 | | | 3.70 | | | 4.3% |
| Henry Hub (US $/mcf) | 2.64 | | | 3.15 | | | 2.80 | | | (16.2)% | | (5.7)% | | | 2.89 | | | 2.90 | | | (0.3)% |
| Average exchange rates | | | | | | | | | | | | | | | | |
| CDN $/US $ | 1.34 | | | 1.33 | | | 1.29 | | | 0.8% | | 3.9% | | | 1.33 | | | 1.28 | | | 3.9% |
| CDN $/Euro | 1.50 | | | 1.51 | | | 1.54 | | | (0.7)% | | (2.6)% | | | 1.51 | | | 1.55 | | | (2.6)% |
| Realized Prices | | | | | | | | | | | | | | | | |
| Crude oil and condensate ($/bbl) | 79.46 | | | 73.45 | | | 87.50 | | | 8.2% | | (9.2)% | | | 76.36 | | | 84.32 | | | (9.4)% |
| NGLs ($/bbl) | 11.25 | | | 22.49 | | | 26.06 | | | (50.0)% | | (56.8)% | | | 16.76 | | | 25.73 | | | (34.9)% |
| Natural gas ($/mcf) | 3.09 | | | 5.10 | | | 4.77 | | | (39.4)% | | (35.2)% | | | 4.09 | | | 5.27 | | | (22.4)% |
| Total ($/boe) | 46.40 | | | 50.77 | | | 53.72 | | | (8.6)% | | (13.6)% | | | 48.61 | | | 52.53 | | | (7.5)% |
| • | Crude oil prices rose in Q2 2019 relative to Q1 2019, driven by a moderately improved global supply-demand balance and heightened geopolitical tensions. By the end of Q2 2019, quarter-over-quarter WTI and Brent each increased by 10% in Canadian dollar terms. For the three months ended June 30, 2019, WTI and Brent in Canadian dollar terms decreased by 9% and 4%, respectively, versus the comparable period in the prior year. |
Vermilion Energy Inc. ■ Page 18 ■ 2019 Second Quarter Report
| • | In Canadian dollar terms, quarter-over-quarter, the Edmonton Sweet differential narrowed by $0.26/bbl to a discount of $6.18/bbl against WTI, and the Saskatchewan LSB differential widened by $0.33/bbl to a discount of $5.72/bbl against WTI. |
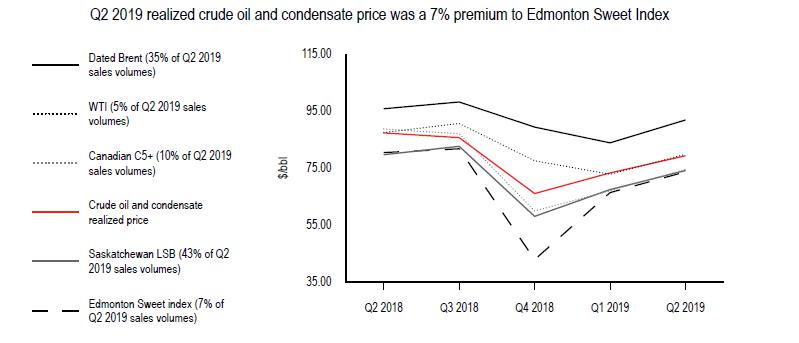
| • | Vermilion's crude oil production benefits from light oil pricing and no exposure to significantly discounted heavy crude oil. Approximately 35% of our Q2 2019 crude oil and condensate production was priced at the Dated Brent index (which averaged a premium to WTI of US$9.01/bbl), while the remainder of our crude oil and condensate production was priced at the Saskatchewan LSB, Canadian C5+, Edmonton Sweet, and WTI indices. Saskatchewan LSB and Canadian C5+ typically have lower differentials than the more significantly constrained WCS and MSW markers, making Vermilion's North American crude oil production price-advantaged relative to other North American benchmark prices. |

| • | In Canadian dollar terms, European natural gas prices (TTF and NBP) declined by 29% and 34% respectively in Q2 2019 compared to Q1 2019 primarily due to increased LNG deliveries into Europe. |
| • | Natural gas prices at AECO in Q2 2019 decreased by 61% compared to Q1 2019 as egress challenges resumed during the seasonal injection period. |
| • | For Q2 2019, average European natural gas prices represented a $4.57/mcf premium to AECO and a $2.07/mcf premium to Henry Hub pricing. Approximately 42% of our natural gas production in Q2 2019 benefited from this premium European pricing. As a result, our consolidated natural gas realized price was a $2.06/mcf premium to AECO. |
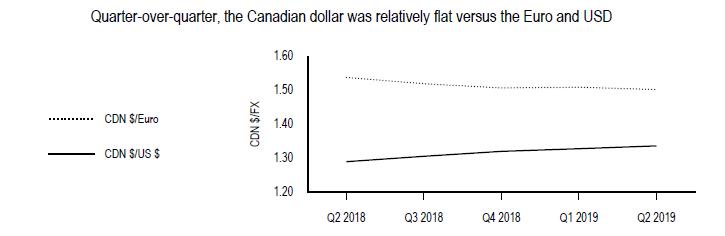
| • | For the three months ended June 30, 2019, the Canadian dollar weakened slightly against the US dollar quarter-over-quarter. |
| • | For the three months ended June 30, 2019, the Canadian dollar strengthened slightly against the Euro quarter-over-quarter. |
Vermilion Energy Inc. ■ Page 19 ■ 2019 Second Quarter Report
Canada Business Unit
Production and assets focused in West Pembina near Drayton Valley, Alberta and in southeast Saskatchewan and Manitoba.
| • | Potential for three significant resource plays sharing the same surface infrastructure in the West Pembina region in Alberta: |
| - | Mannville condensate-rich gas (2,400 - 2,700m depth) - in development phase |
| - | Cardium light oil (1,800m depth) - modest investment at present |
| - | Duvernay condensate-rich gas (3,200 - 3,400m depth) - no investment at present |
| • | Southeast Saskatchewan light oil development: |
| - | Targeting the Mississippian Midale (1,400 - 1,700m depth), Frobisher/Alida (1,200 - 1,400m depth) and Ratcliffe (1,800 - 1,900m) formations |
| Operational and financial review |
Canada business unit ($M except as indicated) | Q2 2019 | | Q1 2019 | | Q2 2018 | | Q2/19 vs.
Q1/19 | | Q2/19 vs.
Q2/18 | | | YTD 2019 | | YTD 2018 | | 2019 vs.
2018 |
| Production and sales | | | | | | | | | | | | | | | | |
| Crude oil and condensate (bbls/d) | 28,844 | | | 29,164 | | | 17,009 | | | (1.1)% | | 69.6% | | | 29,003 | | | 13,161 | | | 120.4% |
| NGLs (bbls/d) | 7,352 | | | 6,968 | | | 5,589 | | | 5.5% | | 31.5% | | | 7,161 | | | 5,349 | | | 33.9% |
| Natural gas (mmcf/d) | 151.87 | | | 151.37 | | | 127.32 | | | 0.3% | | 19.3% | | | 151.62 | | | 116.82 | | | 29.8% |
| Total (boe/d) | 61,507 | | | 61,360 | | | 43,817 | | | 0.2% | | 40.4% | | | 61,434 | | | 37,980 | | | 61.8% |
| Production mix (% of total) | | | | | | | | | | | | | | | | |
| Crude oil and condensate | 47 | % | | 48 | % | | 39 | % | | | | | | | 47 | % | | 35 | % | | |
| NGLs | 12 | % | | 11 | % | | 13 | % | | | | | | | 12 | % | | 14 | % | | |
| Natural gas | 41 | % | | 41 | % | | 48 | % | | | | | | | 41 | % | | 51 | % | | |
| Activity | | | | | | | | | | | | | | | | |
| Capital expenditures | 29,083 | | | 128,055 | | | 28,694 | | | (77.3)% | | 1.4% | | | 157,138 | | | 97,809 | | | 60.7% |
| Acquisitions | 2,655 | | | 14,660 | | | 1,465,335 | | | | | | | | 17,315 | | | 1,555,585 | | | |
| Gross wells drilled | 28.00 | | | 58.00 | | | 18.00 | | | | | | | | 86.00 | | | 36.00 | | | |
| Net wells drilled | 22.87 | | | 54.94 | | | 16.19 | | | | | | | | 77.81 | | | 32.88 | | | |
| Financial results | | | | | | | | | | | | | | | | |
| Sales | 212,944 | | | 220,156 | | | 148,915 | | | (3.3)% | | 43.0% | | | 433,100 | | | 241,848 | | | 79.1% |
| Royalties | (20,711 | ) | | (25,331 | ) | | (15,463 | ) | | (18.2)% | | 33.9% | | | (46,042 | ) | | (25,311 | ) | | 81.9% |
| Transportation | (9,781 | ) | | (10,692 | ) | | (5,186 | ) | | (8.5)% | | 88.6% | | | (20,473 | ) | | (9,726 | ) | | 110.5% |
| Operating | (60,404 | ) | | (63,604 | ) | | (35,762 | ) | | (5.0)% | | 68.9% | | | (124,008 | ) | | (59,858 | ) | | 107.2% |
| General and administration | (7,405 | ) | | (2,719 | ) | | (1,891 | ) | | 172.3% | | 291.6% | | | (10,124 | ) | | (2,591 | ) | | 290.7% |
| Fund flows from operations | 114,643 | | | 117,810 | | | 90,613 | | | (2.7)% | | 26.5% | | | 232,453 | | | 144,362 | | | 61.0% |
| Netbacks ($/boe) | | | | | | | | | | | | | | | | |
| Sales | 38.04 | | | 39.87 | | | 37.35 | | | (4.6)% | | 1.8% | | | 38.95 | | | 35.18 | | | 10.7% |
| Royalties | (3.70 | ) | | (4.59 | ) | | (3.88 | ) | | (19.4)% | | (4.6)% | | | (4.14 | ) | | (3.68 | ) | | 12.5% |
| Transportation | (1.75 | ) | | (1.94 | ) | | (1.30 | ) | | (9.8)% | | 34.6% | | | (1.84 | ) | | (1.41 | ) | | 30.5% |
| Operating | (10.79 | ) | | (11.52 | ) | | (8.97 | ) | | (6.3)% | | 20.3% | | | (11.15 | ) | | (8.71 | ) | | 28.0% |
| General and administration | (1.32 | ) | | (0.49 | ) | | (0.47 | ) | | 169.4% | | 180.9% | | | (0.91 | ) | | (0.38 | ) | | 139.5% |
| Fund flows from operations netback | 20.48 | | | 21.33 | | | 22.73 | | | (4.0)% | | (9.9)% | | | 20.91 | | | 21.00 | | | (0.4)% |
| Realized prices | | | | | | | | | | | | | | | | |
| Crude oil and condensate ($/bbl) | 72.52 | | | 65.47 | | | 79.43 | | | 10.8% | | (8.7)% | | | 68.99 | | | 77.89 | | | (11.4)% |
| NGLs ($/bbl) | 10.61 | | | 22.12 | | | 26.00 | | | (52.0)% | | (59.2)% | | | 16.18 | | | 25.68 | | | (37.0)% |
| Natural gas ($/mcf) | 1.12 | | | 2.47 | | | 1.09 | | | (54.7)% | | 2.8% | | | 1.79 | | | 1.48 | | | 20.9% |
| Total ($/boe) | 38.04 | | | 39.87 | | | 37.35 | | | (4.6)% | | 1.8% | | | 38.95 | | | 35.18 | | | 10.7% |
| Reference prices | | | | | | | | | | | | | | | | |
| WTI (US $/bbl) | 59.81 | | | 54.90 | | | 67.88 | | | 8.9% | | (11.9)% | | | 57.36 | | | 65.37 | | | (12.3)% |
| Edmonton Sweet index ($/bbl) | 73.82 | | | 66.53 | | | 80.60 | | | 11.0% | | (8.4)% | | | 70.16 | | | 76.29 | | | (8.0)% |
| Saskatchewan LSB index ($/bbl) | 74.28 | | | 67.58 | | | 79.84 | | | 9.9% | | (7.0)% | | | 70.92 | | | 75.69 | | | (6.3)% |
| Canadian C5+ Condensate index ($/bbl) | 74.70 | | | 67.20 | | | 88.86 | | | 11.2% | | (15.9)% | | | 70.94 | | | 84.25 | | | (15.8)% |
| AECO ($/mcf) | 1.03 | | | 2.62 | | | 1.18 | | | (60.7)% | | (12.7)% | | | 1.83 | | | 1.63 | | | 12.3% |
Vermilion Energy Inc. ■ Page 20 ■ 2019 Second Quarter Report
Production
| • | Q2 2019 production increased slightly from the prior quarter. Production contributions from our first quarter 2019 drilling program in Saskatchewan and Alberta were partially offset by unplanned facility downtime and less drilling activity in the second quarter of 2019 due to spring breakup. Quarterly production increased 40% year-over-year, primarily due to our acquisition of Spartan Energy Corp. in May 2018. |
Activity review
Vermilion drilled 23 (21.8 net) operated wells and participated in the drilling of five (1.1 net) non-operated wells in Canada during Q2 2019.
Alberta
| - | In Q2 2019, we participated in the drilling of one (0.5 net) non-operated well, completed one (1.0 net) operated and one (0.5 net) non-operated well, and brought on production one (1.0 net) operated well in Alberta. |
| - | In 2019, we plan to drill or participate in 20 (17.7 net) wells in Alberta. |
Saskatchewan
| - | In Q2 2019, we drilled or participated in 23 (21.8 net) operated wells and four (0.6 net) non-operated wells, completed 12 (11.1 net) operated wells, and brought six (6.0 net) operated wells on production in Saskatchewan. |
| - | In 2019, we plan to drill or participate in 140 (125.9 net) wells in Saskatchewan. |
Sales
| • | The realized price for our crude oil and condensate production in Canada is linked to WTI subject to market conditions in western Canada as reflected by the Saskatchewan LSB, Canadian Condensate C5+, and Edmonton Sweet index prices. The realized price of our natural gas in Canada is based on the AECO index. |
| • | Q2 2019 sales per boe decreased 5% compared to Q1 2019 as the increase in crude oil prices was more than offset by lower NGL and natural gas prices. |
| • | Q2 2019 sales per boe increased 2% versus Q2 2018 despite a decrease in all reference prices due to an increased weighting towards higher-priced crude oil and condensate production. |
| • | Year-to-date 2019 sales per boe increased 11% versus the same period in 2018 due the same factors listed above. |
Royalties
| • | Q2 2019 royalties as a percentage of sales of 9.7% decreased from 11.5% and 10.4% in Q1 2019 and Q2 2018, respectively, due to lower Alberta crude oil par pricing in Q2 2019 coupled with lower average royalty rates for new wells brought on production. |
| • | Royalties as a percentage of sales for the six months ended June 30, 2019 of 10.6% was relatively consistent with the same period in the prior year (10.5%). |
Transportation
| • | Q2 2019 transportation expense on a dollar and per unit basis decreased slightly versus Q1 2019 due to lower crude oil production volumes and transportation rates. |
| • | Transportation expense for the three and six months ended June 30, 2019 increased on a dollar and per unit basis versus the comparable period in 2018 due to an increase in crude oil production that incurs higher transportation expense. |
Operating
| • | Operating expense on both a dollar and per unit basis decreased in Q2 2019 relative to Q1 2019 due to lower activity levels. |
| • | For the three and six months ended June 30, 2019, operating expense increased on both a dollar and per unit basis versus the comparable periods in 2018. On a dollar basis, the increase in operating expense was driven by higher production volumes during 2019. On a per unit basis, the increase in operating expense was primarily attributable to the impact of increased crude oil production, which has higher associated per unit operating expense. |
Vermilion Energy Inc. ■ Page 21 ■ 2019 Second Quarter Report
France Business Unit
| • | Largest oil producer in France, constituting approximately three-quarters of domestic oil production. |
| • | Low base decline producing assets comprised of large conventional oil fields with high working interests located in the Aquitaine and Paris Basins. |
| • | Identified inventory of workover, waterflood, and infill drilling opportunities. |
| Operational and financial review |
France business unit
($M except as indicated) | Q2 2019 | | Q1 2019 | | Q2 2018 | | Q2/19 vs.
Q1/19 | | Q2/19 vs.
Q2/18 | | | YTD 2019 | | YTD 2018 | | 2019 vs.
2018 |
| Production | | | | | | | | | | | | | | | | |
| Crude oil (bbls/d) | 9,800 | | | 11,342 | | | 11,683 | | | (13.6)% | | (16.1)% | | | 10,567 | | | 11,362 | | | (7.0)% |
| Natural gas (mmcf/d) | - | | | 0.77 | | | - | | | (100.0)% | | - % | | | 0.38 | | | - | | | - % |
| Total (boe/d) | 9,800 | | | 11,470 | | | 11,683 | | | (14.6)% | | (16.1)% | | | 10,630 | | | 11,362 | | | (6.4)% |
| Sales | | | | | | | | | | | | | | | | |
| Crude oil (bbls/d) | 10,190 | | | 11,256 | | | 11,682 | | | (9.5)% | | (12.8)% | | | 10,720 | | | 10,792 | | | (0.7)% |
| Natural gas (mmcf/d) | - | | | 0.77 | | | - | | | (100.0)% | | - % | | | 0.38 | | | - | | | - % |
| Total (boe/d) | 10,190 | | | 11,384 | | | 11,682 | | | (10.5)% | | (12.8)% | | | 10,784 | | | 10,792 | | | (0.1)% |
| Inventory (mbbls) | | | | | | | | | | | | | | | | |
| Opening crude oil inventory | 332 | | | 325 | | | 300 | | | | | | | | 325 | | | 197 | | | |
| Crude oil production | 892 | | | 1,021 | | | 1,063 | | | | | | | | 1,913 | | | 2,056 | | | |
| Crude oil sales | (927 | ) | | (1,014 | ) | | (1,063 | ) | | | | | | | (1,941 | ) | | (1,953 | ) | | |
| Closing crude oil inventory | 297 | | | 332 | | | 300 | | | | | | | | 297 | | | 300 | | | |
| Activity | | | | | | | | | | | | | | | | |
| Capital expenditures | 25,671 | | | 22,086 | | | 17,044 | | | 16.2% | | 50.6% | | | 47,757 | | | 46,971 | | | 1.7% |
| Gross wells drilled | 1.00 | | | 3.00 | | | - | | | | | | | | 4.00 | | | 5.00 | | | |
| Net wells drilled | 1.00 | | | 3.00 | | | - | | | | | | | | 4.00 | | | 5.00 | | | |
| Financial results | | | | | | | | | | | | | | | | |
| Sales | 84,540 | | | 82,702 | | | 101,128 | | | 2.2% | | (16.4)% | | | 167,242 | | | 173,873 | | | (3.8)% |
| Royalties | (10,871 | ) | | (11,283 | ) | | (12,602 | ) | | (3.7)% | | (13.7)% | | | (22,154 | ) | | (22,040 | ) | | 0.5% |
| Transportation | (9,041 | ) | | (3,170 | ) | | (2,813 | ) | | 185.2% | | 221.4% | | | (12,211 | ) | | (5,171 | ) | | 136.1% |
| Operating | (14,305 | ) | | (15,736 | ) | | (13,893 | ) | | (9.1)% | | 3.0% | | | (30,041 | ) | | (26,942 | ) | | 11.5% |
| General and administration | (3,551 | ) | | (3,655 | ) | | (3,500 | ) | | (2.8)% | | 1.5% | | | (7,206 | ) | | (7,013 | ) | | 2.8% |
| Current income taxes | (5,346 | ) | | (7,700 | ) | | (5,234 | ) | | (30.6)% | | 2.1% | | | (13,046 | ) | | (7,287 | ) | | 79.0% |
| Fund flows from operations | 41,426 | | | 41,158 | | | 63,086 | | | 0.7% | | (34.3)% | | | 82,584 | | | 105,420 | | | (21.7)% |
| Netbacks ($/boe) | | | | | | | | | | | | | | | | |
| Sales | 91.17 | | | 80.72 | | | 95.13 | | | 12.9% | | (4.2)% | | | 85.68 | | | 89.01 | | | (3.7)% |
| Royalties | (11.72 | ) | | (11.01 | ) | | (11.85 | ) | | 6.4% | | (1.1)% | | | (11.35 | ) | | (11.28 | ) | | 0.6% |
| Transportation | (9.75 | ) | | (3.09 | ) | | (2.65 | ) | | 215.5% | | 267.9% | | | (6.26 | ) | | (2.65 | ) | | 136.2% |
| Operating | (15.43 | ) | | (15.36 | ) | | (13.07 | ) | | 0.5% | | 18.1% | | | (15.39 | ) | | (13.79 | ) | | 11.6% |
| General and administration | (3.83 | ) | | (3.57 | ) | | (3.29 | ) | | 7.3% | | 16.4% | | | (3.69 | ) | | (3.59 | ) | | 2.8% |
| Current income taxes | (5.77 | ) | | (7.52 | ) | | (4.92 | ) | | (23.3)% | | 17.3% | | | (6.68 | ) | | (3.73 | ) | | 79.1% |
| Fund flows from operations netback | 44.67 | | | 40.17 | | | 59.35 | | | 11.2% | | (24.7)% | | | 42.31 | | | 53.97 | | | (21.6)% |
| Reference prices | | | | | | | | | | | | | | | | |
| Dated Brent (US $/bbl) | 68.82 | | | 63.20 | | | 74.35 | | | 8.9% | | (7.4)% | | | 66.01 | | | 70.55 | | | (6.4)% |
| Dated Brent ($/bbl) | 92.05 | | | 84.01 | | | 95.99 | | | 9.6% | | (4.1)% | | | 88.01 | | | 90.16 | | | (2.4)% |
Vermilion Energy Inc. ■ Page 22 ■ 2019 Second Quarter Report
Production
| • | Q2 2019 production decreased 15% from the prior quarter and 16% year-over-year due to the temporary curtailment of our production in the Paris Basin as a result of a third party refinery shutdown following a failure on the refinery's main feedstock line. Production was also impacted to a lesser extent by unplanned downtime in the Aquitaine Basin. |
Activity review
| • | During Q2 2019, we completed the final well (1.0 net) of our 2019 Champotran drilling program. |
| • | We plan to continue our workover and optimization programs in the Aquitaine and Paris Basins throughout 2019. |
Sales
| • | Crude oil in France is priced with reference to Dated Brent. |
| • | Q2 2019 sales per boe increased versus Q1 2019, consistent with an increase in the Dated Brent reference price. On a dollar basis, sales were relatively consistent as the increase in pricing was offset by lower sales volumes. |
| • | For the three and six months ended June 30, 2019, sales per boe decreased versus the comparable periods in the prior year, consistent with decreases in the Dated Brent reference price. For the three months ended June 30, 2019, this decrease in price was coupled with lower sales volumes, resulting in a decrease in sales on a dollar basis. |
Royalties
| • | Royalties in France relate to two components: RCDM (levied on units of production and not subject to changes in commodity prices) and R31 (based on a percentage of sales). |
| • | For the three and six months ended June 30, 2019, royalties as a percentage of sales of 12.9% and 13.2%, respectively, were relatively consistent against all comparable periods. |
Transportation
| • | Transportation expense increased for the three and six months ended June 30, 2019 versus all comparable periods, due to the aforementioned refinery outage. During the refinery outage, we used alternate delivery points and transportation methods for our crude oil production in the basin, resulting in an increase to our transportation costs during the shutdown. |
Operating
| • | Q2 2019 operating expense per unit was relatively consistent compared to Q1 2019. On a dollar basis, operating expense decreased due to lower sales volumes. |
| • | For the three and six months ended June 30, 2019 compared to the same periods in the prior year, operating expense increased on both a dollar and per unit basis due primarily to higher electricity prices in the current year. |
General and administration
| • | Fluctuations in general and administration expense for all comparable periods were due to the timing of expenditures and allocations from our corporate segment. |
Current income taxes
| • | In France, current income taxes are applied to taxable income, after eligible deductions, at a statutory rate of 32.0%. |
| • | Full year effective tax rates are estimated each quarter based on forecasted commodity prices and operational results. The estimated full year effective tax rate is applied on a pro-rata basis to quarterly results. As such, fluctuations between the reporting periods occur due to changes in estimated tax rates. |
| • | For 2019, the effective rate on current taxes, inclusive of corporate allocations, is expected to be between 10% to 14% of pre-tax fund flows from operations. This is subject to change in response to production variations, commodity price fluctuations, the timing of capital expenditures, and other eligible in-country adjustments. |
| • | On December 21, 2017, the French Parliament approved the Finance Bill for 2018. The Finance Bill for 2018 provides for a progressive decrease of the French corporate income tax rate from 34.4% to 25.8% by 2022, with the first reduction in 2019 to 32.0%. |
Vermilion Energy Inc. ■ Page 23 ■ 2019 Second Quarter Report
Netherlands Business Unit
| • | Entered the Netherlands in 2004. |
| • | Second largest onshore operator. |
| • | Interests include 26 onshore licenses (all operated) and 17 offshore licenses (all non-operated). |
| • | Licenses include more than 930,000 net acres of land, 90% of which is undeveloped. |
| Operational and financial review |
Netherlands business unit ($M except as indicated) | Q2 2019 | | Q1 2019 | | Q2 2018 | | Q2/19 vs.
Q1/19 | | Q2/19 vs.
Q2/18 | | | YTD 2019 | | YTD 2018 | | 2019 vs.
2018 |
| Production and sales | | | | | | | | | | | | | | | | |
| Condensate (bbls/d) | 100 | | | 93 | | | 87 | | | 7.5% | | 14.9% | | | 96 | | | 82 | | | 17.1% |
| Natural gas (mmcf/d) | 52.90 | | | 51.51 | | | 43.49 | | | 2.7% | | 21.6% | | | 52.21 | | | 44.13 | | | 18.3% |
| Total (boe/d) | 8,917 | | | 8,677 | | | 7,335 | | | 2.8% | | 21.6% | | | 8,798 | | | 7,438 | | | 18.3% |
| Activity | | | | | | | | | | | | | | | | |
| Capital expenditures | 4,577 | | | 6,349 | | | 6,695 | | | (27.9)% | | (31.6)% | | | 10,926 | | | 9,973 | | | 9.6% |
| Acquisitions | - | | | 908 | | | 139 | | | | | | | | 908 | | | 2,899 | | | |
| Gross wells drilled | - | | | - | | | - | | | | | | | | - | | | - | | | |
| Net wells drilled | - | | | - | | | - | | | | | | | | - | | | - | | | |
| Financial results | | | | | | | | | | | | | | | | |
| Sales | 28,327 | | | 40,586 | | | 35,000 | | | (30.2)% | | (19.1)% | | | 68,913 | | | 71,186 | | | (3.2)% |
| Royalties | (446 | ) | | (614 | ) | | (745 | ) | | (27.4)% | | (40.1)% | | | (1,060 | ) | | (1,595 | ) | | (33.5)% |
| Operating | (7,686 | ) | | (8,285 | ) | | (6,419 | ) | | (7.2)% | | 19.7% | | | (15,971 | ) | | (14,104 | ) | | 13.2% |
| General and administration | (704 | ) | | (892 | ) | | (145 | ) | | (21.1)% | | 385.5% | | | (1,596 | ) | | (918 | ) | | 73.9% |
| Current income taxes | (2,575 | ) | | (4,200 | ) | | (4,993 | ) | | (38.7)% | | (48.4)% | | | (6,775 | ) | | (10,798 | ) | | (37.3)% |
| Fund flows from operations | 16,916 | | | 26,595 | | | 22,698 | | | (36.4)% | | (25.5)% | | | 43,511 | | | 43,771 | | | (0.6)% |
| Netbacks ($/boe) | | | | | | | | | | | | | | | | |
| Sales | 34.91 | | | 51.97 | | | 52.43 | | | (32.8)% | | (33.4)% | | | 43.28 | | | 52.88 | | | (18.2)% |
| Royalties | (0.55 | ) | | (0.79 | ) | | (1.12 | ) | | (30.4)% | | (50.9)% | | | (0.67 | ) | | (1.19 | ) | | (43.7)% |
| Operating | (9.47 | ) | | (10.61 | ) | | (9.62 | ) | | (10.7)% | | (1.6)% | | | (10.03 | ) | | (10.48 | ) | | (4.3)% |
| General and administration | (0.87 | ) | | (1.14 | ) | | (0.22 | ) | | (23.7)% | | 295.5% | | | (1.00 | ) | | (0.68 | ) | | 47.1% |
| Current income taxes | (3.17 | ) | | (5.38 | ) | | (7.48 | ) | | (41.1)% | | (57.6)% | | | (4.25 | ) | | (8.02 | ) | | (47.0)% |
| Fund flows from operations netback | 20.85 | | | 34.05 | | | 33.99 | | | (38.8)% | | (38.7)% | | | 27.33 | | | 32.51 | | | (15.9)% |
| Realized prices | | | | | | | | | | | | | | | | |
| Condensate ($/bbl) | 79.10 | | | 67.10 | | | 79.40 | | | 17.9% | | (0.4)% | | | 73.37 | | | 74.40 | | | (1.4)% |
| Natural gas ($/mcf) | 5.73 | | | 8.63 | | | 8.68 | | | (33.6)% | | (34.0)% | | | 7.16 | | | 8.77 | | | (18.4)% |
| Total ($/boe) | 34.91 | | | 51.97 | | | 52.43 | | | (32.8)% | | (33.4)% | | | 43.28 | | | 52.88 | | | (18.2)% |
| Reference prices | | | | | | | | | | | | | | | | |
| TTF ($/mcf) | 5.75 | | | 8.14 | | | 9.50 | | | (29.4)% | | (39.5)% | | | 6.94 | | | 9.54 | | | (27.3)% |
| TTF (€/mcf) | 3.82 | | | 5.39 | | | 6.17 | | | (29.1)% | | (38.1)% | | | 4.61 | | | 6.17 | | | (25.3)% |
Vermilion Energy Inc. ■ Page 24 ■ 2019 Second Quarter Report
Production
| • | Q2 2019 production increased 3% from the prior quarter due to the successful completion of our first half 2019 workover and facility maintenance program, partially offset by minor downtime. Quarterly production increased 22% year-over-year primarily due to the contribution from the Eesveen-02 well (60% working interest), which we brought on production in Q3 2018. |
Activity review
| • | In Q2 2019, we began site preparations for the drilling of the Weststellingwerf well (0.5 net) planned for Q3 2019. Drilling of the Waalwijk South well (0.5 net) is expected to commence in Q4 2019. |
Sales
| • | The price of our natural gas in the Netherlands is based on the TTF index. |
| • | For the three and six months ended June 30, 2019, sales on a per unit basis decreased versus all comparable periods, consistent with decreases in the TTF reference price. |
Royalties
| • | In the Netherlands, certain wells are subject to overriding royalties while some wells are subject to royalties that take effect only when specified production levels are exceeded. As such, royalty expense may fluctuate from period to period depending on the amount of production from those wells. Royalties in Q2 2019 represented 1.6% of sales. Effective March 1, 2019, certain royalty rights were acquired which resulted in lower royalties. |
Transportation
| • | Our production in the Netherlands is not subject to transportation expense as gas is sold at the plant gate. |
Operating
| • | Q2 2019 operating expense decreased on a dollar and per unit basis versus Q1 2019 due to increased maintenance activity and surface rights payments during the first quarter. |
| • | For the three and six months ended June 30, 2019, operating expense increased on a dollar basis versus the comparable periods in 2018 primarily due to incremental expense associated with the year-over-year production increase, in addition to increased maintenance activity during the first quarter of 2019. On a per unit basis, operating expense decreased due to the impact of fixed costs being spread over higher volumes. |
General and administration
| • | Fluctuations in general and administration expense for all comparable periods were due to the timing of expenditures and allocations from our corporate segment. |
Current income taxes
| • | In the Netherlands, current income taxes are applied to taxable income, after eligible deductions and a 10% uplift deduction applied to operating expenses, eligible general and administration and tax deductions for depletion and asset retirement obligations, at a tax rate of 50%. |
| • | Full year effective tax rates are estimated each quarter based on forecasted commodity prices and operational results. The estimated full year effective tax rate is applied on a pro-rata basis to quarterly results. As such, fluctuations between the reporting periods occur due to changes in estimated tax rates. |
| • | For 2019, the effective rate on current taxes, inclusive of corporate allocations, is expected to be between 8% to 12% of pre-tax fund flows from operations. This is subject to change in response to production variations, commodity price fluctuations, the timing of capital expenditures, and other eligible in-country adjustments. |
Vermilion Energy Inc. ■ Page 25 ■ 2019 Second Quarter Report
Germany Business Unit
| • | Entered Germany in 2014 through the acquisition of a non-operated natural gas producing property. |
| • | Executed a significant exploration license farm-in agreement in 2015 and acquired operated producing properties in 2016. |
| • | Producing assets consist of seven gas and eight oil producing fields with extensive infrastructure in place. |
| • | Significant land position of approximately 1.2 million net acres (97% undeveloped). |
| Operational and financial review |
Germany business unit ($M except as indicated) | Q2 2019 | | Q1 2019 | | Q2 2018 | | Q2/19 vs.
Q1/19 | | Q2/19 vs.
Q2/18 | | | YTD 2019 | | YTD 2018 | | 2019 vs.
2018 |
| Production | | | | | | | | | | | | | | | | |
| Crude oil (bbls/d) | 1,047 | | | 978 | | | 1,008 | | | 7.1% | | 3.9% | | | 1,013 | | | 1,043 | | | (2.9)% |
| Natural gas (mmcf/d) | 14.56 | | | 16.71 | | | 14.63 | | | (12.9)% | | (0.5)% | | | 15.63 | | | 15.41 | | | 1.4% |
| Total (boe/d) | 3,474 | | | 3,763 | | | 3,447 | | | (7.7)% | | 0.8% | | | 3,618 | | | 3,611 | | | 0.2% |
| Sales | | | | | | | | | | | | | | | | |
| Crude oil (bbls/d) | 982 | | | 1,052 | | | 1,058 | | | (6.7)% | | (7.2)% | | | 1,017 | | | 1,182 | | | (14.0)% |
| Natural gas (mmcf/d) | 14.56 | | | 16.71 | | | 14.63 | | | (12.9)% | | (0.5)% | | | 15.63 | | | 15.41 | | | 1.4% |
| Total (boe/d) | 3,409 | | | 3,837 | | | 3,497 | | | (11.2)% | | (2.5)% | | | 3,622 | | | 3,750 | | | (3.4)% |
| Production mix (% of total) | | | | | | | | | | | | | | | | |
| Crude oil | 30 | % | | 26 | % | | 29 | % | | | | | | | 28 | % | | 29 | % | | |
| Natural gas | 70 | % | | 74 | % | | 71 | % | | | | | | | 72 | % | | 71 | % | | |
| Activity | | | | | | | | | | | | | | | | |
| Capital expenditures | 9,234 | | | 3,044 | | | 2,314 | | | 203.4% | | 299.0% | | | 12,278 | | | 4,729 | | | 159.6% |
| Acquisitions | 4,751 | | | 416 | | | - | | | | | | | | 5,167 | | | - | | | |
| Gross wells drilled | 2.00 | | | - | | | - | | | | | | | | 2.00 | | | - | | | |
| Net wells drilled | 0.71 | | | - | | | - | | | | | | | | 0.71 | | | - | | | |
| Financial results | | | | | | | | | | | | | | | | |
| Sales | 15,093 | | | 19,368 | | | 18,999 | | | (22.1)% | | (20.6)% | | | 34,461 | | | 39,500 | | | (12.8)% |
| Royalties | (1,502 | ) | | (2,223 | ) | | (1,251 | ) | | (32.4)% | | 20.1% | | | (3,725 | ) | | (2,988 | ) | | 24.7% |
| Transportation | (773 | ) | | (1,672 | ) | | (1,779 | ) | | (53.8)% | | (56.5)% | | | (2,445 | ) | | (3,777 | ) | | (35.3)% |
| Operating | (5,212 | ) | | (5,920 | ) | | (5,384 | ) | | (12.0)% | | (3.2)% | | | (11,132 | ) | | (11,570 | ) | | (3.8)% |
| General and administration | (2,146 | ) | | (1,913 | ) | | (1,462 | ) | | 12.2% | | 46.8% | | | (4,059 | ) | | (3,020 | ) | | 34.4% |
| Fund flows from operations | 5,460 | | | 7,640 | | | 9,123 | | | (28.5)% | | (40.2)% | | | 13,100 | | | 18,145 | | | (27.8)% |
| Netbacks ($/boe) | | | | | | | | | | | | | | | | |
| Sales | 48.65 | | | 56.09 | | | 59.69 | | | (13.3)% | | (18.5)% | | | 52.57 | | | 58.19 | | | (9.7)% |
| Royalties | (4.84 | ) | | (6.44 | ) | | (3.93 | ) | | (24.8)% | | 23.2% | | | (5.68 | ) | | (4.40 | ) | | 29.1% |
| Transportation | (2.49 | ) | | (4.84 | ) | | (5.59 | ) | | (48.6)% | | (55.5)% | | | (3.73 | ) | | (5.56 | ) | | (32.9)% |
| Operating | (16.80 | ) | | (17.14 | ) | | (16.92 | ) | | (2.0)% | | (0.7)% | | | (16.98 | ) | | (17.04 | ) | | (0.4)% |
| General and administration | (6.92 | ) | | (5.54 | ) | | (4.59 | ) | | 24.9% | | 50.8% | | | (6.19 | ) | | (4.45 | ) | | 39.1% |
| Fund flows from operations netback | 17.60 | | | 22.13 | | | 28.66 | | | (20.5)% | | (38.6)% | | | 19.99 | | | 26.74 | | | (25.2)% |
| Realized prices | | | | | | | | | | | | | | | | |
| Crude oil ($/bbl) | 87.05 | | | 78.50 | | | 91.00 | | | 10.9% | | (4.3)% | | | 82.66 | | | 84.42 | | | (2.1)% |
| Natural gas ($/mcf) | 5.52 | | | 7.94 | | | 7.68 | | | (30.5)% | | (28.1)% | | | 6.80 | | | 7.69 | | | (11.6)% |
| Total ($/boe) | 48.65 | | | 56.09 | | | 59.69 | | | (13.3)% | | (18.5)% | | | 52.57 | | | 58.19 | | | (9.7)% |
| Reference prices | | | | | | | | | | | | | | | | |
| Dated Brent (US $/bbl) | 68.82 | | | 63.20 | | | 74.35 | | | 8.9% | | (7.4)% | | | 66.01 | | | 70.55 | | | (6.4)% |
| Dated Brent ($/bbl) | 92.05 | | | 84.01 | | | 95.99 | | | 9.6% | | (4.1)% | | | 88.01 | | | 90.16 | | | (2.4)% |
| TTF ($/mcf) | 5.75 | | | 8.14 | | | 9.50 | | | (29.4)% | | (39.5)% | | | 6.94 | | | 9.54 | | | (27.3)% |
| TTF (€/mcf) | 3.82 | | | 5.39 | | | 6.17 | | | (29.1)% | | (38.1)% | | | 4.61 | | | 6.17 | | | (25.3)% |
Vermilion Energy Inc. ■ Page 26 ■ 2019 Second Quarter Report
Production
| • | Q2 2019 production decreased 8% from the prior quarter due to unplanned downtime on several operated and non-operated assets, which was partially offset by a full quarter contribution from various well workovers performed on our operated oil assets in the prior quarter. Quarterly production was relatively consistent year-over-year. |
Activity review
| • | During the second quarter of 2019, we successfully completed the drilling of the Burgmoor Z5 well (46% working interest), marking the first operated drill by Vermilion in Germany. We also completed and brought on production a non-operated coil tubing sidetrack (0.25 net) during the quarter. |
| • | For the remainder of 2019, we plan to continue evaluating and performing workover opportunities on our operated asset base. |
Sales
| • | The price of our natural gas in Germany is based on the NCG and GPL indexes, which are both highly correlated to the TTF benchmark. Crude oil in Germany is priced with reference to Dated Brent. |
| • | Q2 2019 sales per boe decreased versus Q1 2019, consistent with the decrease in the natural gas benchmark price, but was partially offset by higher crude oil pricing. |
| • | For the three and six months ended June 30, 2019, sales per boe decreased versus the same periods in the previous year due to decreases in crude oil and natural gas reference prices. |
Royalties
| • | Our production in Germany is subject to state and private royalties on sales after certain eligible deductions. |
| • | Royalties as a percentage of sales were lower in Q2 2019 versus Q1 2019 due to an unfavourable prior period adjustment recorded in Q1 2019. |
| • | Royalties as a percentage of sales were higher for the three and six months ended June 30, 2019 versus the same periods in the prior year due to a favourable prior period adjustment recorded in Q2 2018. |
Transportation
| • | Transportation expense in Germany relates to costs incurred to deliver natural gas from the processing facility to the customer and deliver crude oil to the refinery. |
| • | Transportation expense in Q2 2019 was lower than Q1 2019 and Q2 2018 due to a favourable prior period adjustment recorded in Q2 2019. |
| • | Transportation expense for the six months ended June 30, 2019 was lower than the comparable period in the prior year, due to a favourable prior period adjustment recorded in 2019. |
Operating
| • | Operating expense on a per unit basis in Q2 2019 was relatively consistent with Q1 2019 and Q2 2018. |
| • | Operating expense on a per unit basis for the six months ended June 30, 2019 remained consistent versus the comparable period in the prior year. |
General and administration
| • | Fluctuations in general and administration expense for all comparable periods were due to the timing of expenditures and allocations from our corporate segment. |
Current income taxes
| • | As a result of our tax pools in Germany, we do not expect to incur current income taxes for 2019 in the Germany Business Unit. This is subject to change in response to production variations, commodity price fluctuations, the timing of capital expenditures, and other eligible in-country adjustments. |
Vermilion Energy Inc. ■ Page 27 ■ 2019 Second Quarter Report
Ireland Business Unit
| • | Entered Ireland in 2009 with an investment in the offshore Corrib gas field. |
| • | The Corrib gas field is located offshore northwest Ireland and comprises of six offshore wells, offshore and onshore sales and transportation pipeline segments, as well as a natural gas processing facility. |
| • | In Q4 2018, Vermilion assumed operatorship of the Corrib Natural Gas Project (the "Corrib Project") and increased its ownership stake by 1.5% to 20% following the completion of a strategic partnership with Canada Pension Plan Investment Board (“CPPIB”). |
| Operational and financial review |
Ireland business unit ($M except as indicated) | Q2 2019 | | Q1 2019 | | Q2 2018 | | Q2/19 vs.
Q1/19 | | Q2/19 vs.
Q2/18 | | | YTD 2019 | | YTD 2018 | | 2019 vs.
2018 |
| Production and sales | | | | | | | | | | | | | | | | |
| Natural gas (mmcf/d) | 49.21 | | | 51.71 | | | 56.56 | | | (4.8)% | | (13.0)% | | | 50.45 | | | 58.70 | | | (14.1)% |
| Total (boe/d) | 8,201 | | | 8,619 | | | 9,426 | | | (4.8)% | | (13.0)% | | | 8,409 | | | 9,783 | | | (14.1)% |
| Activity | | | | | | | | | | | | | | | | |
| Capital expenditures | 84 | | | 11 | | | 87 | | | 663.6% | | (3.4)% | | | 95 | | | 134 | | | (29.1)% |
| Acquisitions | - | | | - | | | - | | | | | | | | - | | | - | | | |
| Financial results | | | | | | | | | | | | | | | | |
| Sales | 25,936 | | | 39,792 | | | 47,862 | | | (34.8)% | | (45.8)% | | | 65,728 | | | 101,537 | | | (35.3)% |
| Transportation | (1,155 | ) | | (1,166 | ) | | (1,268 | ) | | (0.9)% | | (8.9)% | | | (2,321 | ) | | (2,554 | ) | | (9.1)% |
| Operating | (2,631 | ) | | (3,810 | ) | | (4,306 | ) | | (30.9)% | | (38.9)% | | | (6,441 | ) | | (7,515 | ) | | (14.3)% |
| General and administration | (242 | ) | | (329 | ) | | (1,443 | ) | | (26.4)% | | (83.2)% | | | (571 | ) | | (2,752 | ) | | (79.3)% |
| Fund flows from operations | 21,908 | | | 34,487 | | | 40,845 | | | (36.5)% | | (46.4)% | | | 56,395 | | | 88,716 | | | (36.4)% |
| Netbacks ($/boe) | | | | | | | | | | | | | | | | |
| Sales | 34.75 | | | 51.30 | | | 55.80 | | | (32.3)% | | (37.7)% | | | 43.19 | | | 57.34 | | | (24.7)% |
| Transportation | (1.55 | ) | | (1.50 | ) | | (1.48 | ) | | 3.3% | | 4.7% | | | (1.52 | ) | | (1.44 | ) | | 5.6% |
| Operating | (3.53 | ) | | (4.91 | ) | | (5.02 | ) | | (28.1)% | | (29.7)% | | | (4.23 | ) | | (4.24 | ) | | (0.2)% |
| General and administration | (0.32 | ) | | (0.42 | ) | | (1.68 | ) | | (23.8)% | | (81.0)% | | | (0.38 | ) | | (1.55 | ) | | (75.5)% |
| Fund flows from operations netback | 29.35 | | | 44.47 | | | 47.62 | | | (34.0)% | | (38.4)% | | | 37.06 | | | 50.11 | | | (26.0)% |
| Reference prices | | | | | | | | | | | | | | | | |
| NBP ($/mcf) | 5.44 | | | 8.33 | | | 9.42 | | | (34.7)% | | (42.3)% | | | 6.89 | | | 9.69 | | | (28.9)% |
| NBP (€/mcf) | 3.62 | | | 5.52 | | | 6.12 | | | (34.4)% | | (40.8)% | | | 4.57 | | | 6.27 | | | (27.1)% |
Vermilion Energy Inc. ■ Page 28 ■ 2019 Second Quarter Report
Production
| • | Q2 2019 production decreased 4.8% from the prior quarter due to natural decline and minor unplanned downtime at the Corrib natural gas processing facility. Quarterly production decreased 13% year-over-year due primarily to natural decline. |
Activity review
| • | During Q2 2019, we optimized our maintenance activities and began preparations for a planned plant turnaround, expected to occur in Q3 2019. |
| • | For the remainder of 2019, we will continue to evaluate further optimization opportunities as we progress through our first year as operator of the Corrib Project. |
Sales
| • | The price of our natural gas in Ireland is based on the NBP index. |
| • | Sales per boe for the three and six months ended June 30, 2019 decreased versus all comparable periods consistent with decreases in the NBP reference price. |
Royalties
| • | Our production in Ireland is not subject to royalties. |
Transportation
| • | Transportation expense in Ireland relates to payments under a ship-or-pay agreement related to the Corrib Project. |
| • | Transportation expense for the three and six months ended June 30, 2019 was relatively consistent versus all comparable periods. |
Operating
| • | Q2 2019 operating expense was lower versus Q1 2019 due to timing of terminal maintenance activity. |
| • | For the three and six months ended June 30, 2019, operating expense fluctuated versus the comparable periods in 2018 due to the timing of maintenance activity. |
General and administration
| • | Fluctuations in general and administration expense versus all comparable periods is primarily due to the timing of expenditures and allocations from our corporate segment. |
Current income taxes
| • | Given the significant level of investment in Corrib and the resulting tax pools, we do not expect to incur current income taxes in the Ireland Business Unit for the foreseeable future. |
Vermilion Energy Inc. ■ Page 29 ■ 2019 Second Quarter Report
Australia Business Unit
| • | Entered Australia in 2005. |
| • | Hold a 100% operated working interest in the Wandoo field, located approximately 80 km offshore on the northwest shelf of Australia. |
| • | Production is operated from two off-shore platforms and originates from 20 producing wells including five dual lateral wells for a total of 25 producing laterals. |
| • | Wells that utilize horizontal legs (ranging in length from 500 to 3,000 plus metres) are located 600m below the seabed in approximately 55m of water depth. |
| Operational and financial review |
Australia business unit
($M except as indicated) | Q2 2019 | | Q1 2019 | | Q2 2018 | | Q2/19 vs.
Q1/19 | | Q2/19 vs.
Q2/18 | | | YTD 2019 | | YTD 2018 | | 2019 vs.
2018 |
| Production | | | | | | | | | | | | | | | | |
| Crude oil (bbls/d) | 6,689 | | | 5,862 | | | 4,132 | | | 14.1% | | 61.9% | | | 6,278 | | | 4,549 | | | 38.0% |
| Sales | | | | | | | | | | | | | | | | |
| Crude oil (bbls/d) | 4,737 | | | 7,762 | | | 4,164 | | | (39.0)% | | 13.8% | | | 6,241 | | | 4,519 | | | 38.1% |
| Inventory (mbbls) | | | | | | | | | | | | | | | | |
| Opening crude oil inventory | 18 | | | 189 | | | 142 | | | | | | | | 189 | | | 134 | | | |
| Crude oil production | 609 | | | 528 | | | 376 | | | | | | | | 1,137 | | | 823 | | | |
| Crude oil sales | (431 | ) | | (699 | ) | | (379 | ) | | | | | | | (1,130 | ) | | (818 | ) | | |
| Closing crude oil inventory | 196 | | | 18 | | | 139 | | | | | | | | 196 | | | 139 | | | |
| Activity | | | | | | | | | | | | | | | | |
| Capital expenditures | 2,239 | | | 18,864 | | | 11,368 | | | (88.1)% | | (80.3)% | | | 21,103 | | | 15,817 | | | 33.4% |
| Gross wells drilled | - | | | 2.00 | | | - | | | | | | | | 2.00 | | | - | | | |
| Net wells drilled | - | | | 2.00 | | | - | | | | | | | | 2.00 | | | - | | | |
| Financial results | | | | | | | | | | | | | | | | |
| Sales | 42,848 | | | 63,582 | | | 37,364 | | | (32.6)% | | 14.7% | | | 106,430 | | | 75,534 | | | 40.9% |
| Operating | (8,092 | ) | | (21,404 | ) | | (12,809 | ) | | (62.2)% | | (36.8)% | | | (29,496 | ) | | (25,857 | ) | | 14.1% |
| General and administration | (1,164 | ) | | (1,039 | ) | | (982 | ) | | 12.0% | | 18.5% | | | (2,203 | ) | | (2,507 | ) | | (12.1)% |
| Current income taxes | (12,084 | ) | | (14,100 | ) | | (5,006 | ) | | (14.3)% | | 141.4% | | | (26,184 | ) | | (10,524 | ) | | 148.8% |
| Fund flows from operations | 21,508 | | | 27,039 | | | 18,567 | | | (20.5)% | | 15.8% | | | 48,547 | | | 36,646 | | | 32.5% |
| Netbacks ($/boe) | | | | | | | | | | | | | | | | |
| Sales | 99.39 | | | 91.02 | | | 98.61 | | | 9.2% | | 0.8% | | | 94.21 | | | 92.35 | | | 2.0% |
| Operating | (18.77 | ) | | (30.64 | ) | | (33.81 | ) | | (38.7)% | | (44.5)% | | | (26.11 | ) | | (31.61 | ) | | (17.4)% |
| General and administration | (2.70 | ) | | (1.49 | ) | | (2.59 | ) | | 81.2% | | 4.2% | | | (1.95 | ) | | (3.06 | ) | | (36.3)% |
| PRRT | (19.18 | ) | | (14.89 | ) | | (7.00 | ) | | 28.8% | | 174.0% | | | (16.53 | ) | | (9.17 | ) | | 80.3% |
| Corporate income taxes | (8.85 | ) | | (5.30 | ) | | (6.21 | ) | | 67.0% | | 42.5% | | | (6.65 | ) | | (3.70 | ) | | 79.7% |
| Fund flows from operations netback | 49.89 | | | 38.70 | | | 49.00 | | | 28.9% | | 1.8% | | | 42.97 | | | 44.81 | | | (4.1)% |
| Reference prices | | | | | | | | | | | | | | | | |
| Dated Brent (US $/bbl) | 68.82 | | | 63.20 | | | 74.35 | | | 8.9% | | (7.4)% | | | 66.01 | | | 70.55 | | | (6.4)% |
| Dated Brent ($/bbl) | 92.05 | | | 84.01 | | | 95.99 | | | 9.6% | | (4.1)% | | | 88.01 | | | 90.16 | | | (2.4)% |
Vermilion Energy Inc. ■ Page 30 ■ 2019 Second Quarter Report
Production
| • | Q2 2019 production increased 14% quarter-over-quarter and 62% year-over-year primarily due to the production contribution from the two (2.0 net) well drilling program we completed at the end of January 2019. |
| • | Production volumes are managed within corporate targets while meeting customer demands and the requirements of long-term supply agreements. |
| • | We continue to plan for long-term annual production levels of approximately 6,000 bbls/d. |
Activity review
| • | In 2019, we will continue to focus on adding value through asset optimization and proactive maintenance. |
Sales
| • | Crude oil in Australia is priced with reference to Dated Brent. |
| • | Q2 2019 sales decreased compared to Q1 2019 due to fewer crude liftings in the current quarter. Quarter-over-quarter, the decrease in sales volumes was partially offset by higher sales per boe due to an increase in the Dated Brent reference price. |
| • | For the three and six months ended June 30, 2019 compared to the same periods in the prior year, sales per boe increased slightly despite decreases in the Dated Brent reference pricing due to the timing of sales in the period. |
Royalties and transportation
| • | Our production in Australia is not subject to royalties or transportation expense as crude oil is sold directly at the Wandoo B platform. |
Operating
| • | Q2 2019 operating expense decreased compared to Q1 2019 due to lower sales volumes. |
| • | For the three and six months ended June 30, 2019 compared to the same periods in the prior year, per unit operating expense decreased due to timing of activity and lower diesel usage. |
General and administration
| • | Fluctuations in general and administration expense for all comparable periods are primarily due to the timing of expenditures and allocations from our corporate segment. |
Current income taxes
| • | In Australia, current income taxes include both PRRT and corporate income taxes. PRRT is a profit based tax applied at a rate of 40% on sales less eligible expenditures, including operating expenses and capital expenditures. Corporate income taxes are applied at a rate of 30% on taxable income after eligible deductions, which include PRRT paid. |
| • | Full year effective tax rates are estimated each quarter based on forecasted commodity prices and operational results. The estimated full year effective tax rate is applied on a pro-rata basis to quarterly results. As such, fluctuations between the reporting periods occur due to changes in estimated tax rates. |
| • | For 2019, the effective rate on current taxes, inclusive of corporate allocations, is expected to be between 32% to 36% of pre-tax fund flows from operations. This is subject to change in response to production variations, commodity price fluctuations, the timing of capital expenditures, and other eligible in-country adjustments. |
Vermilion Energy Inc. ■ Page 31 ■ 2019 Second Quarter Report
United States Business Unit
| • | Entered the United States in 2014 and acquired additional producing assets in the Hilight field in 2018. |
| • | Interests include approximately 147,800 net acres of land (70% undeveloped) in the Powder River Basin of northeastern Wyoming. |
| • | Tight oil development targeting the Turner Sands at depths of approximately 1,500m (East Finn) and 2,600m (Hilight). |
| Operational and financial review |
United States business unit ($M except as indicated) | Q2 2019 | | Q1 2019 | | Q2 2018 | | Q2/19 vs.
Q1/19 | | Q2/19 vs.
Q2/18 | | | YTD 2019 | | YTD 2018 | | 2019 vs.
2018 |
| Production and sales | | | | | | | | | | | | | | | | |
| Crude oil (bbls/d) | 2,483 | | | 1,742 | | | 655 | | | 42.5% | | 279.1% | | | 2,115 | | | 615 | | | 243.9% |
| NGLs (bbls/d) | 754 | | | 929 | | | 62 | | | (18.8)% | | 1,116.1% | | | 841 | | | 41 | | | 1,951.2% |
| Natural gas (mmcf/d) | 7.06 | | | 5.89 | | | 0.40 | | | 19.9% | | 1,665.0% | | | 6.48 | | | 0.28 | | | 2,214.3% |
| Total (boe/d) | 4,414 | | | 3,653 | | | 784 | | | 20.8% | | 463.0% | | | 4,036 | | | 702 | | | 474.9% |
| Production mix (% of total) | | | | | | | | | | | | | | | | |
| Crude oil | 56 | % | | 48 | % | | 84 | % | | | | | | | 52 | % | | 88 | % | | |
| NGLs | 17 | % | | 25 | % | | 8 | % | | | | | | | 21 | % | | 6 | % | | |
| Natural gas | 27 | % | | 27 | % | | 8 | % | | | | | | | 27 | % | | 6 | % | | |
| Activity | | | | | | | | | | | | | | | | |
| Capital expenditures | 12,964 | | | 20,036 | | | 10,702 | | | (35.3)% | | 21.1% | | | 33,000 | | | 26,570 | | | 24.2% |
| Acquisitions | 1,217 | | | 43 | | | 11 | | | | | | | | 1,260 | | | 79 | | | |
| Gross wells drilled | 1.00 | | | 3.00 | | | - | | | | | | | | 4.00 | | | 5.00 | | | |
| Net wells drilled | 1.00 | | | 3.00 | | | - | | | | | | | | 4.00 | | | 5.00 | | | |
| Financial results | | | | | | | | | | | | | | | | |
| Sales | 18,355 | | | 14,897 | | | 5,230 | | | 23.2% | | 251.0% | | | 33,252 | | | 9,289 | | | 258.0% |
| Royalties | (4,583 | ) | | (3,933 | ) | | (1,451 | ) | | 16.5% | | 215.9% | | | (8,516 | ) | | (2,573 | ) | | 231.0% |
| Operating | (3,542 | ) | | (3,432 | ) | | (374 | ) | | 3.2% | | 847.1% | | | (6,974 | ) | | (940 | ) | | 641.9% |
| General and administration | (1,571 | ) | | (1,891 | ) | | (1,337 | ) | | (16.9)% | | 17.5% | | | (3,462 | ) | | (2,513 | ) | | 37.8% |
| Fund flows from operations | 8,659 | | | 5,641 | | | 2,068 | | | 53.5% | | 318.7% | | | 14,300 | | | 3,263 | | | 338.2% |
| Netbacks ($/boe) | | | | | | | | | | | | | | | | |
| Sales | 45.69 | | | 45.31 | | | 73.30 | | | 0.8% | | (37.7)% | | | 45.52 | | | 73.14 | | | (37.8)% |
| Royalties | (11.41 | ) | | (11.96 | ) | | (20.35 | ) | | (4.6)% | | (43.9)% | | | (11.66 | ) | | (20.26 | ) | | (42.4)% |
| Operating | (8.82 | ) | | (10.44 | ) | | (5.24 | ) | | (15.5)% | | 68.3% | | | (9.55 | ) | | (7.41 | ) | | 28.9% |
| General and administration | (3.91 | ) | | (5.75 | ) | | (18.74 | ) | | (32.0)% | | (79.1)% | | | (4.74 | ) | | (19.79 | ) | | (76.0)% |
| Fund flows from operations netback | 21.55 | | | 17.16 | | | 28.97 | | | 25.6% | | (25.6)% | | | 19.57 | | | 25.68 | | | (23.8)% |
| Realized prices | | | | | | | | | | | | | | | | |
| Crude oil ($/bbl) | 70.98 | | | 68.72 | | | 83.85 | | | 3.3% | | (15.3)% | | | 70.05 | | | 80.47 | | | (12.9)% |
| NGLs ($/bbl) | 17.49 | | | 25.21 | | | 30.93 | | | (30.6)% | | (43.5)% | | | 21.73 | | | 32.21 | | | (32.5)% |
| Natural gas ($/mcf) | 1.74 | | | 3.80 | | | 1.56 | | | (54.2)% | | 11.5% | | | 2.67 | | | 1.94 | | | 37.6% |
| Total ($/boe) | 45.69 | | | 45.31 | | | 73.30 | | | 0.8% | | (37.7)% | | | 45.52 | | | 73.14 | | | (37.8)% |
| Reference prices | | | | | | | | | | | | | | | | |
| WTI (US $/bbl) | 59.81 | | | 54.90 | | | 67.88 | | | 8.9% | | (11.9)% | | | 57.36 | | | 65.37 | | | (12.3)% |
| WTI ($/bbl) | 80.00 | | | 72.97 | | | 87.63 | | | 9.6% | | (8.7)% | | | 76.48 | | | 83.54 | | | (8.5)% |
| Henry Hub (US $/mcf) | 2.64 | | | 3.15 | | | 2.80 | | | (16.2)% | | (5.7)% | | | 2.89 | | | 2.90 | | | (0.3)% |
| Henry Hub ($/mcf) | 3.53 | | | 4.19 | | | 3.61 | | | (15.8)% | | (2.2)% | | | 3.86 | | | 3.70 | | | 4.3% |
Vermilion Energy Inc. ■ Page 32 ■ 2019 Second Quarter Report
Production
| • | Q2 2019 production increased 21% from the prior quarter due to production contributions from our first half 2019 Hilight drilling campaign, as four (4.0 net) wells were completed and brought on production during the quarter. Quarterly production increased 463% year-over-year primarily due to the production associated with an acquisition we completed in August 2018 and our first half 2019 drilling program. |
Activity
| • | During Q2 2019, we drilled one (1.0 net) Turner horizontal well in the Hilight field and brought all four wells from our first half 2019 drilling program on production. |
| • | In 2019, we plan to drill eight (8.0 net) Hilight Turner horizontal wells. |
Sales
| • | The price of crude oil in the United States is directly linked to WTI, subject to local market differentials within the United States. The price of our natural gas in the United States is based on the Henry Hub index. |
| • | Q2 2019 sales per boe remained consistent versus Q1 2019 as stronger crude oil pricing was largely offset by weaker natural gas pricing. |
| • | For the three and six months ended June 30, 2019 compared to the same periods in the prior year, sales per boe decreased due to an increased weighting towards natural gas production from assets acquired in 2018 along with a decrease in the WTI reference price. |
Royalties
| • | Our production in the United States is subject to federal and private royalties, severance tax, and ad valorem tax. |
| • | For the three and six months ended June 30, 2019, royalties as a percentage of sales were relatively consistent versus all comparable periods. |
Operating
| • | Fluctuations in operating expense versus all comparable periods were due to the timing of activity. |
General and administration
| • | Fluctuations in general and administration expense for all comparable periods were due to the incremental staffing of the United States corporate office, timing of expenditures, and allocations from our corporate segment. |
Current income taxes
| • | As a result of our tax pools in the United States, we do not expect to incur current income taxes in the US Business Unit for the foreseeable future. |
Vermilion Energy Inc. ■ Page 33 ■ 2019 Second Quarter Report
Corporate
| • | Our Corporate segment includes costs related to our global hedging program, financing expenses, and general and administration expenses that are primarily incurred in Canada and are not directly related to the operations of our business units. Gains or losses relating to Vermilion's global hedging program are allocated to Vermilion's business units for statutory reporting and income tax purposes. |
| • | Results of our activities in Central and Eastern Europe are also included in the Corporate segment. |
| Operational and financial review |
Corporate ($M) | Q2 2019 | | Q1 2019 | | Q2 2018 | | | YTD 2019 | | YTD 2018 |
| Activity | | | | | | | | | | |
| Capital expenditures | 8,755 | | | 3,608 | | | 3,080 | | | | 12,363 | | | 6,446 | |
| Acquisitions | - | | | - | | | - | | | | - | | | - | |
| Gross wells drilled | 3.00 | | | - | | | - | | | | 3.00 | | | 1.00 | |
| Net wells drilled | 2.30 | | | - | | | - | | | | 2.30 | | | 1.00 | |
| Financial results | | | | | | | | | | |
| Sales | - | | | - | | | - | | | | - | | | - | |
| Royalties | - | | | - | | | - | | | | - | | | - | |
| Sales of purchased commodities | 75,335 | | | 29,539 | | | - | | | | 104,874 | | | - | |
| Purchased commodities | (75,335 | ) | | (29,539 | ) | | - | | | | (104,874 | ) | | - | |
| Operating | (9 | ) | | (231 | ) | | - | | | | (240 | ) | | - | |
| General and administration recovery (expense) | 1,086 | | | (620 | ) | | (3,393 | ) | | | 466 | | | (4,567 | ) |
| Current income taxes | (104 | ) | | (150 | ) | | (111 | ) | | | (254 | ) | | (297 | ) |
| Interest expense | (21,568 | ) | | (20,979 | ) | | (16,572 | ) | | | (42,547 | ) | | (32,160 | ) |
| Realized gain (loss) on derivatives | 14,191 | | | 10,348 | | | (27,859 | ) | | | 24,539 | | | (45,574 | ) |
| Realized foreign exchange loss | (1,569 | ) | | (2,050 | ) | | (4,105 | ) | | | (3,619 | ) | | (2,551 | ) |
| Realized other income | 191 | | | 6,884 | | | 230 | | | | 7,075 | | | 431 | |
| Fund flows from operations | (7,782 | ) | | (6,798 | ) | | (51,810 | ) | | | (14,580 | ) | | (84,718 | ) |
Vermilion Energy Inc. ■ Page 34 ■ 2019 Second Quarter Report
Production review
| • | There was no production from our CEE business unit during the second quarter of 2019. |
Activity review
| • | In Q2 2019, we drilled three (2.3 net) exploratory wells in Hungary and one (1.0 net) exploratory well in Croatia. Subsequent to the end of the quarter, we drilled an additional exploratory well (1.0 net) in Hungary. We also continued preparations for our remaining 2019 drills throughout Central and Eastern Europe. |
| • | Subsequent to the end of the second quarter of 2019, we entered into a 50/50 partnership with Ukrgazvydobuvannya (UGV, a Ukrainian state owned gas producer) and were awarded two exploration licenses in Ukraine, subject to a final production sharing agreement. |
Purchased commodities
| • | Purchased commodities and the associated sales relate to amounts purchased from third parties, primarily to manage positions on pipelines. There is no net impact on fund flows from operations. |
General and administration
| • | Fluctuations in general and administration expense for the three and six months ended June 30, 2019 versus all comparable periods were due to allocations to the various business unit segments. |
Current income taxes
| • | Taxes in our corporate segment relate to holding companies that pay current taxes in foreign jurisdictions. |
Interest expense
| • | Interest expense in Q2 2019 remained consistent versus Q1 2019. |
| • | For the three and six months ended June 30, 2019, interest expense increased versus the comparative periods in 2018 due to higher drawings on the revolving credit facility. |
Realized gain or loss on derivatives
| • | The realized gain on derivatives for the three and six months ended June 30, 2019 is related primarily to receipts for our European natural gas and crude oil hedges. |
| • | A listing of derivative positions as at June 30, 2019 is included in “Supplemental Table 2” of this MD&A. |
Realized other income
| • | Realized other income recognized in the six months ended June 30, 2019, relates primarily to amounts received pursuant to a negotiated settlement of a legal matter in Canada. |
Vermilion Energy Inc. ■ Page 35 ■ 2019 Second Quarter Report
Financial Performance Review
| ($M except per share) | Q2 2019 | | Q1 2019 | | Q4 2018 | | Q3 2018 | | Q2 2018 | | Q1 2018 | | Q4 2017 | | Q3 2017 |
| Petroleum and natural gas sales | 428,043 | | | 481,083 | | | 456,939 | | | 508,411 | | | 394,498 | | | 318,269 | | | 317,341 | | | 248,505 | |
| Net earnings (loss) | 2,004 | | | 39,547 | | | 323,373 | | | (15,099 | ) | | (61,364 | ) | | 24,740 | | | 8,645 | | | (39,191 | ) |
| Net earnings (loss) per share | | | | | | | | | | | | | | | |
| Basic | 0.01 | | | 0.26 | | | 2.12 | | | (0.10 | ) | | (0.46 | ) | | 0.20 | | | 0.07 | | | (0.32 | ) |
| Diluted | 0.01 | | | 0.26 | | | 2.10 | | | (0.10 | ) | | (0.46 | ) | | 0.20 | | | 0.07 | | | (0.32 | ) |
The following table shows the calculation of fund flows from operations:
| | Q2 2019 | | Q1 2019 | | Q2 2018 | | YTD 2019 | | YTD 2018 |
| | $M | | $/boe | | $M | | $/boe | | $M | | $/boe | | $M | | $/boe | | $M | | $/boe |
| Petroleum and natural gas sales | 428,043 | | | 46.40 | | | 481,083 | | | 50.77 | | | 394,498 | | | 53.72 | | | 909,126 | | | 48.61 | | | 712,767 | | | 52.53 | |
| Royalties | (38,113 | ) | | (4.13 | ) | | (43,384 | ) | | (4.58 | ) | | (31,512 | ) | | (4.29 | ) | | (81,497 | ) | | (4.36 | ) | | (54,507 | ) | | (4.02 | ) |
| Petroleum and natural gas revenues | 389,930 | | | 42.27 | | | 437,699 | | | 46.19 | | | 362,986 | | | 49.43 | | | 827,629 | | | 44.25 | | | 658,260 | | | 48.51 | |
| Transportation | (20,750 | ) | | (2.25 | ) | | (16,700 | ) | | (1.76 | ) | | (11,046 | ) | | (1.50 | ) | | (37,450 | ) | | (2.00 | ) | | (21,228 | ) | | (1.56 | ) |
| Operating | (101,881 | ) | | (11.04 | ) | | (122,422 | ) | | (12.92 | ) | | (78,947 | ) | | (10.75 | ) | | (224,303 | ) | | (11.99 | ) | | (146,786 | ) | | (10.82 | ) |
| General and administration | (15,697 | ) | | (1.70 | ) | | (13,058 | ) | | (1.38 | ) | | (14,153 | ) | | (1.93 | ) | | (28,755 | ) | | (1.54 | ) | | (25,881 | ) | | (1.91 | ) |
| PRRT | (8,268 | ) | | (0.90 | ) | | (10,400 | ) | | (1.10 | ) | | (2,652 | ) | | (0.36 | ) | | (18,668 | ) | | (1.00 | ) | | (7,500 | ) | | (0.55 | ) |
| Corporate income taxes | (11,841 | ) | | (1.28 | ) | | (15,750 | ) | | (1.66 | ) | | (12,692 | ) | | (1.73 | ) | | (27,591 | ) | | (1.48 | ) | | (21,406 | ) | | (1.58 | ) |
| Interest expense | (21,568 | ) | | (2.34 | ) | | (20,979 | ) | | (2.21 | ) | | (16,572 | ) | | (2.26 | ) | | (42,547 | ) | | (2.28 | ) | | (32,160 | ) | | (2.37 | ) |
| Realized gain (loss) on derivative instruments | 14,191 | | | 1.54 | | | 10,348 | | | 1.09 | | | (27,859 | ) | | (3.79 | ) | | 24,539 | | | 1.31 | | | (45,574 | ) | | (3.36 | ) |
| Realized foreign exchange loss | (1,569 | ) | | (0.17 | ) | | (2,050 | ) | | (0.22 | ) | | (4,105 | ) | | (0.56 | ) | | (3,619 | ) | | (0.19 | ) | | (2,551 | ) | | (0.19 | ) |
| Realized other income | 191 | | | 0.02 | | | 6,884 | | | 0.73 | | | 230 | | | 0.03 | | | 7,075 | | | 0.38 | | | 431 | | | 0.03 | |
| Fund flows from operations | 222,738 | | | 24.15 | | | 253,572 | | | 26.76 | | | 195,190 | | | 26.58 | | | 476,310 | | | 25.46 | | | 355,605 | | | 26.20 | |
Fluctuations in fund flows from operations may occur as a result of changes in production levels, commodity prices, and costs to produce petroleum and natural gas. In addition, fund flows from operations may be affected by the timing of crude oil shipments in Australia and France. When crude oil inventory is built up, the related operating expense, royalties, and depletion expense are deferred and carried as inventory on the consolidated balance sheet. When the crude oil inventory is subsequently drawn down, the related expenses are recognized.
The following table shows a reconciliation from fund flows from operations to net earnings (loss):
| | Q2 2019 | | Q1 2019 | | Q2 2018 | | | YTD 2019 | | YTD 2018 |
| Fund flows from operations | 222,738 | | | 253,572 | | | 195,190 | | | | 476,310 | | | 355,605 | |
| Equity based compensation | (14,593 | ) | | (22,843 | ) | | (10,961 | ) | | | (37,436 | ) | | (30,711 | ) |
| Unrealized loss on derivative instruments | (30,605 | ) | | (14,277 | ) | | (105,284 | ) | | | (44,882 | ) | | (87,941 | ) |
| Unrealized foreign exchange gain (loss) | 41,798 | | | 23,258 | | | (12,458 | ) | | | 65,056 | | | (3,833 | ) |
| Unrealized other expense | (69 | ) | | (205 | ) | | (199 | ) | | | (274 | ) | | (394 | ) |
| Accretion | (8,147 | ) | | (7,986 | ) | | (7,819 | ) | | | (16,133 | ) | | (14,973 | ) |
| Depletion and depreciation | (184,131 | ) | | (177,029 | ) | | (143,385 | ) | | | (361,160 | ) | | (268,278 | ) |
| Deferred tax | (24,987 | ) | | (14,943 | ) | | 23,552 | | | | (39,930 | ) | | 13,901 | |
| Net earnings (loss) | 2,004 | | | 39,547 | | | (61,364 | ) | | | 41,551 | | | (36,624 | ) |
Fluctuations in net income from period-to-period are caused by changes in both cash and non-cash based income and charges. Cash based items are reflected in fund flows from operations. Non-cash items include: equity based compensation expense, unrealized gains and losses on derivative instruments, unrealized foreign exchange gains and losses, accretion, depletion and depreciation expense, and deferred taxes. In addition, non-cash items may also include gains resulting from business combinations or charges resulting from impairment or impairment reversals.
Vermilion Energy Inc. ■ Page 36 ■ 2019 Second Quarter Report
Equity based compensation
Equity based compensation expense relates primarily to non-cash compensation expense attributable to long-term incentives granted to directors, officers, and employees under security-based arrangements, including the Vermilion Incentive Plan ("VIP") and a security-based compensation arrangement ("Five-Year Compensation Arrangement").
Equity based compensation expense decreased in Q2 2019 compared to Q1 2019 primarily due to the settlement of bonuses in Q1 2019 under the employee bonus plan. For the three and six months ended June 30, 2019, equity based compensation expense increased versus the comparable periods in 2018 primarily due to a higher value of outstanding share awards.
Unrealized gain or loss on derivative instruments
Unrealized gain or loss on derivative instruments arise as a result of changes in future commodity price forecasts. As Vermilion uses derivative instruments to manage the commodity price exposure of our future crude oil and natural gas production, we will normally recognize unrealized gains on derivative instruments when future commodity price forecasts decline and vice-versa. As derivative instruments are settled, the unrealized gain or loss previously recognized is reversed, and the settlement results in a realized gain or loss on derivative instruments.
For the three and six months ended June 30, 2019, we recognized an unrealized loss on derivative instruments of $30.6 million and $44.9 million respectively. The unrealized loss primarily related to cross-currency interest rate swap derivative instruments, which is offset with a corresponding foreign exchange gain. Unrealized losses associated with crude oil derivative contracts was more than offset by unrealized gains on European natural gas derivative instruments.
Unrealized foreign exchange gains or losses
As a result of Vermilion’s international operations, Vermilion has monetary assets and liabilities denominated in currencies other than the Canadian dollar. These monetary assets and liabilities include cash, receivables, payables, long-term debt, derivative instruments and intercompany loans. Unrealized foreign exchange gains and losses result from translating these monetary assets and liabilities from their underlying currency to the Canadian dollar.
Unrealized foreign exchange gains and losses primarily results from the translation of Euro denominated intercompany loans from Vermilion Energy Inc. to our international subsidiaries. As such, an appreciation in the Euro against the Canadian dollar will result in an unrealized foreign exchange gain (and vice-versa).
On June 12, 2019, Vermilion entered into a series of cross currency interest rate swaps with a syndicate of banks. Vermilion designated these derivative instruments as hedging instruments. As a result of a USD-to-CAD cross currency interest rate swap, Vermilion receives US dollar interest and principal amounts equal to the interest and principal payments required under Vermilion's US$300.0 million senior unsecured notes that bear interest at 5.625%. Due to this hedging designation, the translation of Vermilion's US$300.0 million senior unsecured notes does not result in unrealized foreign exchange gains or losses following this transaction. Prior to this transaction, an appreciation in the US dollar against the Canadian dollar would have resulted in a greater unrealized foreign exchange loss (and vice-versa).
For the three months ended June 30, 2019, the impact of the Canadian dollar strengthening against the Euro was more significant than the impact of the Canadian dollar weakening against the US dollar resulting in an unrealized gain on foreign exchange of $41.8 million. For the six months ended June 30, 2019, the impact of the Canadian dollar strengthening against the Euro and the US dollar resulted in an unrealized gain on foreign exchange of $65.1 million.
As at June 30, 2019, a $0.01 appreciation of the Euro against the Canadian dollar would result in a $2.2 million increase to net earnings as a result of an unrealized gain on foreign exchange. In contrast, a $0.01 appreciation of the US dollar against the Canadian dollar would result in a $0.1 million decrease to net earnings as a result of an unrealized loss on foreign exchange.
Accretion
Accretion expense is recognized to update the present value of the asset retirement obligation balance. Accretion expense in Q2 2019 was relatively consistent with Q1 2019 and Q2 2018. For the six months ended June 30, 2019, accretion expense increased versus the comparable period in 2018, primarily attributable to new obligations recognized following acquisition activity in 2018.
Depletion and depreciation
Depletion and depreciation expense is recognized to allocate the cost of capital assets over the useful life of the respective assets. Depletion and depreciation expense per unit of production is determined for each depletion unit (which are groups of assets within a specific production area that have similar economic lives) by dividing the sum of the net book value of capital assets and future development costs by total proved plus probable reserves.
Vermilion Energy Inc. ■ Page 37 ■ 2019 Second Quarter Report
Fluctuations in depletion and depreciation expense are primarily the result of changes in produced crude oil and natural gas volumes and changes in depletion and depreciation per unit. Fluctuations in depletion and depreciation per unit are the result of changes in reserves, future development costs, and relative production mix.
Depletion and depreciation on a per boe basis for Q2 2019 of $19.96 increased from $18.68 in Q1 2019 primarily due to sales mix. For the three and six months ended June 30, 2019, depletion and depreciation on a per boe basis of $19.96 and $19.31 respectively were relatively consistent with $19.52 and $19.77 in the respective comparable periods in the prior year.
Deferred tax
Deferred tax assets arise when the tax basis of an asset exceeds its accounting basis (known as a deductible temporary difference). Conversely, deferred tax liabilities arise when the tax basis of an asset is less than its accounting basis (known as a taxable temporary difference). Deferred tax assets are recognized only to the extent that it is probable that there are future taxable profits against which the deductible temporary difference can be utilized. Deferred tax assets and liabilities are measured at the enacted or substantively enacted tax rate that is expected to apply when the asset is realized or the liability is settled.
As such, fluctuations in deferred tax expenses and recoveries primarily arise as a result of: changes in the accounting basis of an asset or liability without a corresponding tax basis change (e.g. when derivative assets and liabilities are marked-to-market or when accounting depletion differs from tax depletion), changes in available tax losses (e.g. if they are utilized to offset taxable income), changes in estimated future taxable profits resulting in a de-recognition or re-recognition of deferred tax assets, and changes in enacted or substantively enacted tax rates.
For the three and six months ended June 30, 2019, deferred tax expense of $25.0 million and $39.9 million, respectively, was recognized. The expense primarily related to the impact of reductions to Alberta's corporate tax rate from 12% to 8% over four years, as well as the de-recognition of a portion of non-expiring tax loss pools in Ireland as there is uncertainty as to Vermilion's ability to fully utilize such losses based on forecasted commodity prices in effect as at June 30, 2019.
Vermilion Energy Inc. ■ Page 38 ■ 2019 Second Quarter Report
Financial Position Review
We believe that our balance sheet supports our defined growth initiatives and our focus is on managing and maintaining a conservative balance sheet. To ensure that our balance sheet continues to support our defined growth initiatives, we regularly review whether our forecast of fund flows from operations is sufficient to finance planned capital expenditures, dividends, and abandonment and reclamation expenditures. To the extent that forecasted fund flows from operations is not expected to be sufficient to fulfill such expenditures, we will evaluate our ability to finance any shortfall with debt (including borrowing using the unutilized capacity of our existing revolving credit facility), issue equity, or by reducing some or all categories of expenditures to ensure that total expenditures do not exceed available funds.
To ensure that we maintain a conservative balance sheet, we monitor the ratio of net debt to fund flows from operations.
We remain focused on maintaining and strengthening our balance sheet by aligning our exploration and development capital budget with forecasted fund flows from operations to target a payout ratio (a non-GAAP financial measure) of approximately 100%. We continually monitor for changes in forecasted fund flows from operations as a result of changes to forward commodity prices and as appropriate we will adjust our exploration and development capital plans. As a result of our focus on this payout ratio target, we intend for the ratio of net debt to fund flows from operations to trend towards 1.5 over time.
Net debt is reconciled to long-term debt, as follows:
| | As at |
| ($M) | Jun 30, 2019 | | Dec 31, 2018 |
| Long-term debt | 1,893,135 | | | 1,796,207 | |
| Current liabilities | 375,944 | | | 563,199 | |
| Current assets | (318,570 | ) | | (429,877 | ) |
| Net debt | 1,950,509 | | | 1,929,529 | |
| | | | |
| Ratio of net debt to quarterly annualized fund flows from operations | 2.19 | | | 2.17 | |
As at June 30, 2019, net debt increased to $2.0 billion (December 31, 2018 - $1.9 billion) primarily due to the impact of increased borrowings on the revolving credit facility to fund the capital expenditure program, which is heavily weighted towards Q1 2019, coupled with a $50.2 million decrease in net current derivative asset. These increases were partially offset by an increase in fund flows from operations, resulting in a slight increase in the ratio of net debt to quarterly annualized fund flows from operations from 2.17 for 2018 to 2.19 for the current period.
The balances recognized on our balance sheet are as follows:
| | As at |
| ($M) | Jun 30, 2019 | | Dec 31, 2018 |
| Revolving credit facility | 1,505,164 | | | 1,392,206 | |
| Senior unsecured notes | 387,971 | | | 404,001 | |
| Long-term debt | 1,893,135 | | | 1,796,207 | |
Vermilion Energy Inc. ■ Page 39 ■ 2019 Second Quarter Report
Revolving Credit Facility
In Q2 2019, we negotiated an amendment to our $2.1 billion revolving credit facility to extend the maturity to May 31, 2023. The amendment included changes to the financial covenants, as described below.
As at June 30, 2019, Vermilion had in place a bank revolving credit facility maturing May 31, 2023 with terms and outstanding positions as follows:
| | As at |
| ($M) | Jun 30, 2019 | | Dec 31, 2018 |
| Total facility amount | 2,100,000 | | | 1,800,000 | |
| Amount drawn | (1,505,164 | ) | | (1,392,206 | ) |
| Letters of credit outstanding | (22,500 | ) | | (15,400 | ) |
| Unutilized capacity | 572,336 | | | 392,394 | |
As at June 30, 2019, the revolving credit facility was subject to the following financial covenants:
| | | | As at |
| Financial covenant | Limit | | Jun 30, 2019 | | Dec 31, 2018 |
| Consolidated total debt to consolidated EBITDA | Less than 4.0 | | 1.81 | | | 1.72 | |
Consolidated total senior debt to consolidated EBITDA | Less than 3.5 | | 1.45 | | | 1.34 | |
| Consolidated EBITDA to consolidated interest expense | Greater than 2.5 | | 13.91 | | 14.57 |
Our financial covenants were updated to replace the consolidated total senior debt to total capitalization covenant with an interest coverage covenant (calculated as consolidated EBITDA to consolidated interest expense) and to add provisions relating to our liability management ratings in Alberta and Saskatchewan. If our security adjusted liability management ratings fall below specified limits in a province, a portion of the asset retirement obligations are included in the definitions of consolidated total debt and consolidated total senior debt. An event of default occurs if our security adjusted liability management ratings breach additional lower limits for a period greater than 90 days. As of June 30, 2019, Vermilion's liability management ratings were higher than the specified levels and as such no amounts relating to asset retirement obligations were included in the calculation of consolidated total debt and consolidated total senior debt.
Our financial covenants include financial measures defined within our revolving credit facility agreement that are not defined under IFRS. These financial measures are defined by our revolving credit facility agreement as follows:
| • | Consolidated total debt: Includes all amounts classified as “Long-term debt”, “Current portion of long-term debt”, and “Lease obligations” (including the current portion included within "Accounts payable and accrued liabilities" but excluding operating leases as defined under IAS 17) on our balance sheet. |
| • | Consolidated total senior debt: Defined as consolidated total debt excluding unsecured and subordinated debt. |
| • | Consolidated EBITDA: Defined as consolidated net earnings before interest, income taxes, depreciation, accretion and certain other non-cash items, adjusted for the impact of the acquisition of a material subsidiary. |
| • | Total interest expense: Includes all amounts classified as "Interest expense", but excluding interest on operating leases as defined under IAS 17. |
Senior Unsecured Notes
On March 13, 2017, Vermilion issued US$300 million of senior unsecured notes at par. The notes bear interest at a rate of 5.625% per annum, paid semi-annually on March 15 and September 15, and mature on March 15, 2025. As direct senior unsecured obligations of Vermilion, the notes rank equally in right of payment with existing and future senior indebtedness of the Company.
The senior unsecured notes were recognized at amortized cost and include the transaction costs directly related to the issuance.
Vermilion may, at its option, redeem the senior unsecured notes prior to maturity as follows:
| • | Prior to March 15, 2020, Vermilion may redeem up to 35% of the original principal amount of the senior unsecured notes with the proceeds of certain equity offerings by the Company at a redemption price of 105.625% of the principal amount, plus any accrued and unpaid interest to but excluding the applicable redemption date. |
| • | Prior to March 15, 2020, Vermilion may redeem some or all of the senior unsecured notes at a price equal to 100% of the principal amount of the senior unsecured notes, plus a “make-whole” premium and any accrued and unpaid interest. |
| • | On or after March 15, 2020, Vermilion may redeem some or all of the senior unsecured notes at the redemption prices set forth in the following table, plus any accrued and unpaid interest. |
Vermilion Energy Inc. ■ Page 40 ■ 2019 Second Quarter Report
| Year | | Redemption price |
| 2020 | | 104.219 | % |
| 2021 | | 102.813 | % |
| 2022 | | 101.406 | % |
| 2023 and thereafter | | 100.000 | % |
Cross currency interest rate swaps
On June 12, 2019, Vermilion entered into a series of cross currency interest rate swaps with a syndicate of banks. The cross currency interest rate swaps mature March 15, 2025 and include regular cash receipts and payments on March 15 and September 15 of each year. On a net basis, the cross currency interest swaps result in Vermilion receiving US dollar interest and principal amounts equal to the interest and principal payments under the US $300.0 million of senior unsecured notes. In exchange, Vermilion will make interest and principal payments equal to €265.0 million at a rate of 3.275%.
The cross currency interest rate swaps were executed as two separate sets of instruments, wherein Vermilion:
| • | Receives US dollar interest and principal amounts equal to US$300.0 million of debt at 5.625% interest and pays Canadian dollar interest and principal amounts equal to $398.5 million of debt at 5.40% interest. |
| • | Receives Canadian dollar interest and principal amounts equal to $398.5 million of debt at 5.40% interest and pays Euro interest and principal amounts equal to €265.0 million at a rate of 3.275%. |
Beginning with the April 2018 dividend paid on May 15, 2018, we increased our monthly dividend by 7%, to $0.23 per share from $0.215 per share. The dividend increase in Q2 2018 was our fourth dividend increase (previously Vermilion's distribution in the income trust era) since we began paying a distribution in 2003.
In total, dividends declared to June 30, 2019 were $212.4 million.
The following table outlines our dividend payment history:
| Date | Monthly dividend per unit or share |
| January 2003 to December 2007 | | $0.170 |
| January 2008 to December 2012 | | $0.190 |
| January 2013 to December 2013 | | $0.200 |
| January 2014 to March 2018 | | $0.215 |
| April 2018 onwards | | $0.230 |
Our policy with respect to dividends is to be conservative and maintain a low ratio of dividends to fund flows from operations. During low commodity price cycles, we will initially maintain dividends and allow the ratio to rise. Should low commodity price cycles remain for an extended period of time, we will evaluate the necessity of changing the level of dividends, taking into consideration capital development requirements, debt levels, and acquisition opportunities.
Although we expect to be able to maintain our current dividend, fund flows from operations may not be sufficient to fund cash dividends, capital expenditures, and asset retirement obligations. We will evaluate our ability to finance any shortfall with debt, issuances of equity, or by reducing some or all categories of expenditures to ensure that total expenditures do not exceed available funds.
The following table reconciles the change in shareholders’ capital:
| Shareholders’ Capital | Number of Shares ('000s) | | Amount ($M) |
| Balance at December 31, 2018 | | 152,704 | | | 4,008,828 | |
| Shares issued for the Dividend Reinvestment Plan | | 508 | | | 15,877 | |
| Vesting of equity based awards | | 1,223 | | | 45,636 | |
| Equity based compensation | | 354 | | | 11,696 | |
| Share-settled dividends on vested equity based awards | | 243 | | | 7,987 | |
| Balance as at June 30, 2019 | | 155,032 | | | 4,090,024 | |
As at June 30, 2019, there were approximately 2.2 million equity based compensation awards outstanding. As at July 25, 2019, there were approximately 155.1 million common shares issued and outstanding.
Vermilion Energy Inc. ■ Page 41 ■ 2019 Second Quarter Report
Asset Retirement Obligations
As at June 30, 2019, asset retirement obligations were $670.1 million compared to $650.2 million as at December 31, 2018.
The increase in asset retirement obligations is largely attributable to an overall decrease in the discount rates applied to the abandonment obligation and accretion expense. Vermilion calculated the present value of the obligations using a credit-adjusted risk-free rate, calculated using a credit spread of 4.3% (2018 - 4.0%). The risk-free rates used as inputs to discount the obligations were as follows:
| | Jun 30, 2019 | | Dec 31, 2018 |
| Canada | 1.7 | % | | 2.2 | % |
| France | 1.0 | % | | 1.6 | % |
| Netherlands | (0.2 | )% | | 0.4 | % |
| Germany | 0.3 | % | | 0.9 | % |
| Ireland | 0.9 | % | | 1.6 | % |
| Australia | 1.6 | % | | 2.6 | % |
| USA | 2.6 | % | | 2.7 | % |
Off Balance Sheet Arrangements
We have not entered into any guarantee or off balance sheet arrangements that would materially impact our financial position or results of operations.
Risk Management
Vermilion is exposed to various market and operational risks. For a discussion of these risks, please see Vermilion's MD&A and Annual Information Form, each for the year ended December 31, 2018 available on SEDAR at www.sedar.com or on Vermilion’s website at www.vermilionenergy.com.
Critical Accounting Estimates
The preparation of financial statements in accordance with IFRS requires management to make estimates, judgments and assumptions that affect reported assets, liabilities, revenues and expenses, gains and losses, and disclosures of any possible contingencies. These estimates and assumptions are developed based on the best available information which management believed to be reasonable at the time such estimates and assumptions were made. As such, these assumptions are uncertain at the time estimates are made and could change, resulting in a material impact on Vermilion’s consolidated financial statements. Estimates are reviewed by management on an ongoing basis and as a result may change from period to period due to the availability of new information or changes in circumstances. Additionally, as a result of the unique circumstances of each jurisdiction that Vermilion operates in, the critical accounting estimates may affect one or more jurisdictions. There have been no material changes to our critical accounting estimates used in applying accounting policies for the three and six months ended June 30, 2019. Further information, including a discussion of critical accounting estimates, can be found in the notes to the Consolidated Financial Statements and annual MD&A for the year ended December 31, 2018, available on SEDAR at www.sedar.com or on Vermilion’s website at www.vermilionenergy.com.
Internal Control Over Financial Reporting
There was no change in Vermilion’s internal control over financial reporting ("ICFR") during the period covered by this MD&A that materially affected, or is reasonably likely to materially affect, its internal control over financial reporting.
Vermilion has limited the scope of design controls and procedures ("DC&P") and internal controls over financial reporting to exclude controls, policies and procedures of Vermilion E&P Ireland Limited (which was acquired in December 2018). The scope limitation is in accordance with section 3.3(1)(b) of NI 52-109 which allows an issuer to limit the design of DC&P and ICFR to exclude controls, policies, and procedures of a business that the issuer acquired not more than 365 days before the end of the fiscal period.
Vermilion Energy Inc. ■ Page 42 ■ 2019 Second Quarter Report
The table below presents the summary financial information of Vermilion E&P Ireland Limited included in Vermilion's financial statements as at and for the six months ended June 30, 2019:
| ($MM) | | As at June 30, 2019 |
| Non-current assets | | 42 | |
| Non-current liabilities | | (4 | ) |
| Net assets | | 135 | |
| | | |
| ($MM) | Six months ended June 30, 2019 |
| Revenue | | 5 | |
| Net earnings | | 1 | |
Recently Adopted Accounting Pronouncements
Definition of a Business - Amendments to IFRS 3 "Business Combinations"
Vermilion elected to early adopt the amendments to IFRS 3 "Business Combinations" effective January 1, 2019, which will be applied prospectively to acquisitions that occur on or after January 1, 2019. The amendments introduce an optional concentration test, narrow the definitions of a business and outputs, and clarify that an acquired set of activities and assets must include an input and a substantive process that together significantly contribute to the ability to create outputs. These amendments did not result in changes to Vermilion's accounting policies for applying the acquisition method.
Disclosure Controls and Procedures
Our officers have established and maintained disclosure controls and procedures and evaluated the effectiveness of these controls in conjunction with our filings.
As of June 30, 2019, we have evaluated the effectiveness of the design and operation of our disclosure controls and procedures. Based on this evaluation, the Chief Executive Officer and Chief Financial Officer have concluded and certified that our disclosure controls and procedures are effective.
Vermilion Energy Inc. ■ Page 43 ■ 2019 Second Quarter Report
Supplemental Table 1: Netbacks
The following table includes financial statement information on a per unit basis by business unit. Liquids includes crude oil, condensate, and NGLs. Natural gas sales volumes have been converted on a basis of six thousand cubic feet of natural gas to one barrel of oil equivalent.
| | Q2 2019 | | YTD 2019 | | Q2 2018 | | YTD 2018 |
| | Liquids | | Natural Gas | | Total | | Liquids | | Natural Gas | | Total | | Total | | Total |
| | $/bbl | | $/mcf | | $/boe | | $/bbl | | $/mcf | | $/boe | | $/boe | | $/boe |
| Canada | | | | | | | | | | | | | | | |
| Sales | 59.94 | | 1.12 | | 38.04 | | 58.66 | | 1.79 | | 38.95 | | 37.35 | | | 35.18 | |
| Royalties | (7.74) | | 0.35 | | (3.70) | | (7.49) | | 0.11 | | (4.14) | | (3.88 | ) | | (3.68 | ) |
| Transportation | (2.21) | | (0.18) | | (1.75) | | (2.36) | | (0.18) | | (1.84) | | (1.30 | ) | | (1.41 | ) |
| Operating | (12.85) | | (1.31) | | (10.79) | | (13.07) | | (1.40) | | (11.15) | | (8.97 | ) | | (8.71 | ) |
| Operating netback | 37.14 | | (0.02) | | 21.80 | | 35.74 | | 0.32 | | 21.82 | | 23.20 | | | 21.38 | |
| General and administration | | | | | (1.32) | | | | | | (0.91) | | (0.47 | ) | | (0.38 | ) |
| Fund flows from operations netback | | | | | 20.48 | | | | | | 20.91 | | 22.73 | | | 21.00 | |
| France | | | | | | | | | | | | | | | |
| Sales | 91.17 | | - | | 91.17 | | 86.13 | | 1.76 | | 85.68 | | 95.13 | | | 89.01 | |
| Royalties | (11.72) | | - | | (11.72) | | (11.42) | | (0.03) | | (11.35) | | (11.85 | ) | | (11.28 | ) |
| Transportation | (9.75) | | - | | (9.75) | | (6.29) | | - | | (6.26) | | (2.65 | ) | | (2.65 | ) |
| Operating | (15.43) | | - | | (15.43) | | (15.48) | | - | | (15.39) | | (13.07 | ) | | (13.79 | ) |
| Operating netback | 54.27 | | - | | 54.27 | | 52.94 | | 1.73 | | 52.68 | | 67.56 | | | 61.29 | |
| General and administration | | | | | (3.83) | | | | | | (3.69) | | (3.29 | ) | | (3.59 | ) |
| Current income taxes | | | | | (5.77) | | | | | | (6.68) | | (4.92 | ) | | (3.73 | ) |
| Fund flows from operations netback | | | | | 44.67 | | | | | | 42.31 | | 59.35 | | | 53.97 | |
| Netherlands | | | | | | | | | | | | | | | |
| Sales | 79.10 | | 5.73 | | 34.91 | | 73.37 | | 7.16 | | 43.28 | | 52.43 | | | 52.88 | |
| Royalties | - | | (0.09) | | (0.55) | | - | | (0.11) | | (0.67) | | (1.12 | ) | | (1.19 | ) |
| Operating | - | | (1.60) | | (9.47) | | - | | (1.69) | | (10.03) | | (9.62 | ) | | (10.48 | ) |
| Operating netback | 79.10 | | 4.04 | | 24.89 | | 73.37 | | 5.36 | | 32.58 | | 41.69 | | | 41.21 | |
| General and administration | | | | | (0.87) | | | | | | (1.00) | | (0.22 | ) | | (0.68 | ) |
| Current income taxes | | | | | (3.17) | | | | | | (4.25) | | (7.48 | ) | | (8.02 | ) |
| Fund flows from operations netback | | | | | 20.85 | | | | | | 27.33 | | 33.99 | | | 32.51 | |
| Germany | | | | | | | | | | | | | | | |
| Sales | 87.05 | | 5.52 | | 48.65 | | 82.66 | | 6.80 | | 52.57 | | 59.69 | | | 58.19 | |
| Royalties | (3.64) | | (0.89) | | (4.84) | | (4.77) | | (1.01) | | (5.68) | | (3.93 | ) | | (4.40 | ) |
| Transportation | (9.07) | | 0.03 | | (2.49) | | (9.99) | | (0.21) | | (3.73) | | (5.59 | ) | | (5.56 | ) |
| Operating | (20.67) | | (2.54) | | (16.80) | | (24.19) | | (2.36) | | (16.98) | | (16.92 | ) | | (17.04 | ) |
| Operating netback | 53.67 | | 2.12 | | 24.52 | | 43.71 | | 3.22 | | 26.18 | | 33.25 | | | 31.19 | |
| General and administration | | | | | (6.92) | | | | | | (6.19) | | (4.59 | ) | | (4.45 | ) |
| Fund flows from operations netback | | | | | 17.60 | | | | | | 19.99 | | 28.66 | | | 26.74 | |
| Ireland | | | | | | | | | | | | | | | |
| Sales | - | | 5.79 | | 34.75 | | - | | 7.20 | | 43.19 | | 55.80 | | | 57.34 | |
| Transportation | - | | (0.26) | | (1.55) | | - | | (0.25) | | (1.52) | | (1.48 | ) | | (1.44 | ) |
| Operating | - | | (0.59) | | (3.53) | | - | | (0.71) | | (4.23) | | (5.02 | ) | | (4.24 | ) |
| Operating netback | - | | 4.94 | | 29.67 | | - | | 6.24 | | 37.44 | | 49.30 | | | 51.66 | |
| General and administration | | | | | (0.32) | | | | | | (0.38) | | (1.68 | ) | | (1.55 | ) |
| Fund flows from operations netback | | | | | 29.35 | | | | | | 37.06 | | 47.62 | | | 50.11 | |
| | | | | | | | | | | | | | | | |
| | | | | | | | | | | | | | | | |
| | | | | | | | | | | | | | | | |
Vermilion Energy Inc. ■ Page 44 ■ 2019 Second Quarter Report
| | | | | | | | | | | | | | | | |
| | Q2 2019 | | YTD 2019 | | Q2 2018 | | YTD 2018 |
| | Liquids | | Natural Gas | | Total | | Liquids | | Natural Gas | | Total | | Total | | Total |
| | $/bbl | | $/mcf | | $/boe | | $/bbl | | $/mcf | | $/boe | | $/boe | | $/boe |
| Australia | | | | | | | | | | | | | | | |
| Sales | 99.39 | | - | | 99.39 | | 94.21 | | - | | 94.21 | | 98.61 | | | 92.35 | |
| Operating | (18.77) | | - | | (18.77) | | (26.11) | | - | | (26.11) | | (33.81 | ) | | (31.61 | ) |
| PRRT(1) | (19.18) | | - | | (19.18) | | (16.53) | | - | | (16.53) | | (7.00 | ) | | (9.17 | ) |
| Operating netback | 61.44 | | - | | 61.44 | | 51.57 | | - | | 51.57 | | 57.80 | | | 51.57 | |
| General and administration | | | | | (2.70) | | | | | | (1.95) | | (2.59 | ) | | (3.06 | ) |
| Corporate income taxes | | | | | (8.85) | | | | | | (6.65) | | (6.21 | ) | | (3.70 | ) |
| Fund flows from operations netback | | | | | 49.89 | | | | | | 42.97 | | 49.00 | | | 44.81 | |
| United States | | | | | | | | | | | | | | | |
| Sales | 58.51 | | 1.74 | | 45.69 | | 56.30 | | 2.67 | | 45.52 | | 73.30 | | | 73.14 | |
| Royalties | (14.68) | | (0.40) | | (11.41) | | (14.35) | | (0.71) | | (11.66) | | (20.35 | ) | | (20.26 | ) |
| Operating | (8.90) | | (1.43) | | (8.82) | | (9.78) | | (1.49) | | (9.55) | | (5.24 | ) | | (7.41 | ) |
| Operating netback | 34.93 | | (0.09) | | 25.46 | | 32.17 | | 0.47 | | 24.31 | | 47.71 | | | 45.47 | |
| General and administration | | | | | (3.91) | | | | | | (4.74) | | (18.74 | ) | | (19.79 | ) |
| Fund flows from operations netback | | | | | 21.55 | | | | | | 19.57 | | 28.97 | | | 25.68 | |
| | | | | | | | | | | | | | | | |
| Total Company | | | | | | | | | | | | | | | |
| Sales | 69.49 | | 3.09 | | 46.40 | | 68.02 | | 4.09 | | 48.61 | | 53.72 | | | 52.53 | |
| Realized hedging (loss) gain | 0.49 | | 0.47 | | 1.54 | | 1.10 | | 0.26 | | 1.31 | | (3.79 | ) | | (3.36 | ) |
| Royalties | (8.13) | | 0.12 | | (4.13) | | (7.70) | | (0.03) | | (4.36) | | (4.29 | ) | | (4.02 | ) |
| Transportation | (3.39) | | (0.14) | | (2.25) | | (2.85) | | (0.16) | | (2.00) | | (1.50 | ) | | (1.56 | ) |
| Operating | (13.71) | | (1.30) | | (11.04) | | (14.95) | | (1.39) | | (11.99) | | (10.75 | ) | | (10.82 | ) |
| PRRT(1) | (1.64) | | - | | (0.90) | | (1.80) | | - | | (1.00) | | (0.36 | ) | | (0.55 | ) |
| Operating netback | 43.11 | | 2.24 | | 29.62 | | 41.82 | | 2.77 | | 30.57 | | 33.03 | | | 32.22 | |
| General and administration | | | | | (1.70) | | | | | | (1.54) | | (1.93 | ) | | (1.91 | ) |
| Interest expense | | | | | (2.34) | | | | | | (2.28) | | (2.26 | ) | | (2.37 | ) |
| Realized foreign exchange loss | | | | | (0.17) | | | | | | (0.19) | | (0.56 | ) | | (0.19 | ) |
| Other income | | | | | 0.02 | | | | | | 0.38 | | 0.03 | | | 0.03 | |
| Corporate income taxes | | | | | (1.28) | | | | | | (1.48) | | (1.73 | ) | | (1.58 | ) |
| Fund flows from operations netback | | | | | 24.15 | | | | | | 25.46 | | 26.58 | | | 26.20 | |
(1) Vermilion considers Australian PRRT to be an operating item and, accordingly, has included PRRT in the calculation of operating netbacks. Current income taxes presented above excludes PRRT.
Vermilion Energy Inc. ■ Page 45 ■ 2019 Second Quarter Report
Supplemental Table 2: Hedges
The prices in these tables may represent the weighted averages for several contracts. The weighted average price for the portfolio of options listed below may not have the same payoff profile as the individual contracts. As such, the presentation of the weighted average prices is purely for indicative purposes.
The following tables outline Vermilion’s outstanding risk management positions as at June 30, 2019:
| | | | | | | Bought Put
Volume | | Weighted
Average
Bought Put | | Sold Call
Volume | | Weighted
Average
Sold Call | | Sold Put
Volume | | Weighted Average Sold Put | | Swap
Volume | | Weighted
Average
Swap |
| Crude Oil | Period | Exercise date(1) | | Currency | | (bbl/d) | | Price / bbl | | (bbl/d) | | Price / bbl | | (bbl/d) | | Price / bbl | | (bbl/d) | | Price / bbl |
| Dated Brent | | | | | | | | | | | | | | | | | | | | |
| Swap | Jan 2019 - Dec 2019 | | | CAD | | - | | | - | | | - | | | - | | | - | | | - | | | 1,350 | | | 91.76 | |
| 3-Way Collar | Jan 2019 - Dec 2019 | | | USD | | 500 | | | 70.00 | | | 500 | | | 80.00 | | | 500 | | | 60.00 | | | - | | | - | |
| 3-Way Collar | Feb 2019 - Dec 2019 | | | USD | | 1,000 | | | 59.55 | | | 1,000 | | | 67.50 | | | 1,000 | | | 52.50 | | | - | | | - | |
| 3-Way Collar | Jul 2019 - Jun 2020 | | | USD | | 1,000 | | | 65.00 | | | 1,000 | | | 72.50 | | | 1,000 | | | 55.00 | | | - | | | - | |
| Swap | Jan 2019 - Dec 2019 | | | USD | | - | | | - | | | - | | | - | | | - | | | - | | | 2,250 | | | 73.17 | |
| Swaption | Jul 2019 - Jun 2020 | Jun 28, 2019 | | USD | | - | | | - | | | - | | | - | | | - | | | - | | | 1,000 | | | 70.00 | |
| Swaption | Oct 2019 - Dec 2020 | Jul 31, 2019 | | USD | | - | | | - | | | - | | | - | | | - | | | - | | | 500 | | | 72.00 | |
| WTI | | | | | | | | | | | | | | | | | | | | |
| Swap | Jan 2019 - Dec 2019 | | | CAD | | - | | | - | | | - | | | - | | | - | | | - | | | 1,050 | | | 81.41 | |
| 3-Way Collar | Jan 2019 - Dec 2019 | | | USD | | 250 | | | 70.00 | | | 250 | | | 80.25 | | | 250 | | | 60.00 | | | - | | | - | |
| 3-Way Collar | Feb 2019 - Dec 2019 | | | USD | | 1,000 | | | 51.50 | | | 1,000 | | | 60.00 | | | 1,000 | | | 42.50 | | | - | | | - | |
| 3-Way Collar | Jul 2019 - Jun 2020 | | | USD | | 3,000 | | | 50.00 | | | 1,000 | | | 60.00 | | | 3,000 | | | 43.50 | | | - | | | - | |
| 3-Way Collar | Oct 2019 - Mar 2020 | | | USD | | 1,000 | | | 56.50 | | | 1,000 | | | 62.50 | | | 1,000 | | | 47.50 | | | - | | | - | |
| Swap | Apr 2019 - Mar 2020 | | | USD | | - | | | - | | | - | | | - | | | - | | | - | | | 1,500 | | | 59.17 | |
| Swap | Jun 2019 - Sep 2019 | | | USD | | - | | | - | | | - | | | - | | | - | | | - | | | 500 | | | 65.25 | |
| Swaption | Jul 2019 - Jun 2020 | May 31, 2019 | | USD | | - | | | - | | | - | | | - | | | - | | | - | | | 500 | | | 61.00 | |
| Swaption | Jul 2019 - Jun 2020 | Jun 28, 2019 | | USD | | - | | | - | | | - | | | - | | | - | | | - | | | 500 | | | 60.50 | |
| | | | | | | | | | | | | | | | | | | | | |
| | | | | | | Bought Put
Volume | | Weighted
Average
Bought Put | | Sold Call
Volume | | Weighted
Average Sold Call | | Sold Put
Volume | | Weighted
Average
Sold Put | | Swap
Volume | | Weighted
Average
Swap |
| North American Gas | Period | Exercise date(1) | | Currency | | (mmbtu/d) | | Price / mmbtu | | (mmbtu/d) | | Price / mmbtu | | (mmbtu/d) | | Price / mmbtu | | (mmbtu/d) | | Price / mmbtu |
| AECO Basis (AECO less NYMEX Henry Hub) | | | | | | | | | | | | | | | | | | | |
| Swap | Jun 2019 - Oct 2019 | | | USD | | 5,000 | | | (1.70 | ) | | 5,000 | | | (1.70 | ) | | - | | | - | | | - | | | - | |
| Swap | Jul 2019 - Dec 2028 | | | USD | | 2,500 | | | (1.15 | ) | | 2,500 | | | (1.15 | ) | | - | | | - | | | - | | | - | |
| Swap | Jan 2020 - Dec 2028 | | | USD | | 5,000 | | | (1.20 | ) | | 5,000 | | | (1.20 | ) | | - | | | - | | | - | | | - | |
| Swap | Jan 2019 - Jun 2020 | | | USD | | - | | | - | | | - | | | - | | | - | | | - | | | 2,500 | | | (0.93 | ) |
| Swap | Apr 2019 - Oct 2019 | | | USD | | - | | | - | | | - | | | - | | | - | | | - | | | 5,000 | | | (1.61 | ) |
| (1) The sold swaption instrument allows the counterparty, at the specified date, to enter into a derivative instrument contract with Vermilion at the above detailed terms. |
| | | | | | | | | | | | | | | | | | | | | |
| | | | | | | | | | | | | | | | | | | | | |
| | | | | | | | | | | | | | | | | | | | | |
| | | | | | | | | | | | | | | | | | | | | |
| | | | | | | | | | | | | | | | | | | | | |
| | | | | | | | | | | | | | | | | | | | | |
| | | | | | | | | | | | | | | | | | | | | |
Vermilion Energy Inc. ■ Page 46 ■ 2019 Second Quarter Report
| | | | | | | | | | | | | | | | | | | | | |
| | | | | | | Bought Put
Volume | | Weighted
Average
Bought Put | | Sold Call
Volume | | Weighted
Average
Sold Call | | Sold Put
Volume | | Weighted
Average
Sold Put | | Swap
Volume | | Weighted
Average
Swap |
| European Gas | Period | Exercise date(1) | | Currency | | (mmbtu/d) | | Price / mmbtu | | (mmbtu/d) | | Price / mmbtu | | (mmbtu/d) | | Price /mmbtu | | (mmbtu/d) | | Price / mmbtu |
| NBP | | | | | | | | | | | | | | | | | | | | |
| 3-Way Collar | Jan 2019 - Dec 2019 | | | EUR | | 17,197 | | | 4.97 | | | 17,197 | | | 5.65 | | | 17,197 | | | 3.79 | | | - | | | - | |
| 3-Way Collar | Jan 2019 - Dec 2020 | | | EUR | | 7,370 | | | 4.96 | | | 7,370 | | | 5.76 | | | 7,370 | | | 3.74 | | | - | | | - | |
| 3-Way Collar | Jan 2020 - Dec 2020 | | | EUR | | 22,111 | | | 5.19 | | | 22,111 | | | 5.98 | | | 22,111 | | | 4.05 | | | - | | | - | |
| 3-Way Collar | Jan 2020 - Dec 2021 | | | EUR | | 7,073 | | | 9.39 | | | 7,073 | | | 11.25 | | | 7,073 | | | 6.78 | | | - | | | - | |
| 3-Way Collar | Jan 2021 - Dec 2021 | | | EUR | | 9,827 | | | 5.71 | | | 9,827 | | - | | 6.39 | | | 9,827 | | | 4.54 | | | - | | | - | |
| Swap | Apr 2019 - Sep 2019 | | | EUR | | - | | | - | | | - | | | - | | | - | | | - | | | 2,457 | | | 5.86 | |
| Swaption | Jul 2019 - Jun 2021 | June 28, 2019 | | EUR | | - | | | - | | | - | | | - | | | - | | | - | | | 9,827 | | | 5.64 | |
| Swaption | Oct 2019 - Mar 2020 | June 28, 2019 | | EUR | | - | | | - | | | - | | | - | | | - | | | - | | | 7,370 | | | 5.86 | |
| Swaption | Jan 2020 - Mar 2020 | Dec 31, 2019 | | EUR | | - | | | - | | | - | | | - | | | - | | | - | | | 2,047 | | | 7.33 | |
| Swaption | Oct 2020 - Mar 2021 | June 28, 2019 | | EUR | | - | | | - | | | - | | | - | | | - | | | - | | | 7,370 | | | 5.86 | |
| Swaption | Oct 2020 - Jun 2022 | | | EUR | | - | | | - | | | - | | | - | | | - | | | - | | | 720 | | | 21.00 | |
| Swaption | Oct 2021 - Mar 2022 | June 28, 2019 | | EUR | | - | | | - | | | - | | | - | | | - | | | - | | | 7,370 | | | 5.86 | |
| NBP Basis (NBP less NYMEX Henry Hub) | | | | | | | | | | | | | | | | | | | |
| Collar | Jan 2019 - Sep 2020 | | | USD | | 7,500 | | | 2.07 | | | 7,500 | | | 4.00 | | | - | | | - | | | - | | | - | |
| Collar | Jul 2019 | | | USD | | 7,500 | | | 3.80 | | | 7,500 | | | 2.62 | | | - | | | - | | | - | | | - | |
| Collar | Jan 2020 - Mar 2020 | | | USD | | 2,500 | | | 3.50 | | | 2,500 | | | 4.00 | | | - | | | - | | | - | | | - | |
| Collar | Jan 2020 - Dec 2020 | | | USD | | 7,500 | | | 3.15 | | | 7,500 | | | 3.97 | | | - | | | - | | | - | | | - | |
| Collar | Oct 2020 - Dec 2020 | | | USD | | 2,500 | | | 3.50 | | | 2,500 | | | 4.00 | | | - | | | - | | | - | | | - | |
| TTF | | | | | | | | | | | | | | | | | | | | |
| 3-Way Collar | Oct 2017 - Dec 2019 | | | EUR | | 7,370 | | | 4.59 | | | 7,370 | | | 5.42 | | | 7,370 | | | 2.93 | | | - | | | - | |
| 3-Way Collar | Jan 2018 - Dec 2019 | | | EUR | | 3,685 | | | 4.74 | | | 3,685 | | | 5.52 | | | 3,685 | | | 3.13 | | | - | | | - | |
| 3-Way Collar | Jan 2019 - Dec 2019 | | | EUR | | 12,284 | | | 5.05 | | | 12,284 | | | 5.72 | | | 12,284 | | | 3.69 | | | - | | | - | |
| 3-Way Collar | Jan 2020 - Dec 2020 | | | EUR | | 7,370 | | | 5.37 | | | 7,370 | | | 6.25 | | | 7,370 | | | 3.81 | | | - | | | - | |
| 3-Way Collar | Apr 2020 - Sep 2020 | | | EUR | | 2,457 | | | 5.33 | | | 2,457 | | | 5.86 | | | 2,457 | | | 3.81 | | | - | | | - | |
| Collar | Jul 2019 - Sep 2019 | | | EUR | | 1,228 | | | 5.35 | | | 1,228 | | | 6.01 | | | - | | | - | | | - | | | - | |
| Swap | Oct 2017 - Dec 2019 | | | EUR | | - | | | - | | | - | | | - | | | - | | | - | | | 7,370 | | | 4.87 | |
| Swap | Jan 2018 - Dec 2019 | | | EUR | | - | | | - | | | - | | | - | | | - | | | - | | | 1,228 | | | 5.00 | |
| Swap | Jul 2018 - Dec 2019 | | | EUR | | - | | | - | | | - | | | - | | | - | | | - | | | 4,913 | | | 4.98 | |
| Swap | Jan 2019 - Dec 2019 | | | EUR | | - | | | - | | | - | | | - | | | - | | | - | | | 2,457 | | | 4.92 | |
| Swap | Apr 2019 - Sep 2019 | | | EUR | | - | | | - | | | - | | | - | | | - | | | - | | | 2,457 | | | 5.90 | |
| Swap | Apr 2020 - Jun 2020 | | | EUR | | - | | | - | | | - | | | - | | | - | | | - | | | 4,913 | | | 5.54 | |
| Swap | Jul 2020 | | | EUR | | - | | | - | | | - | | | - | | | - | | | - | | | 4,913 | | | 5.36 | |
| Swap | Sep 2020 | | | EUR | | - | | | - | | | - | | | - | | | - | | | - | | | 4,913 | | | 5.54 | |
| TTF Basis (TTF less NYMEX Henry Hub) | | | | | | | | | | | | | | | | | | | |
| Collar | Apr 2020 - Sep 2020 | | | USD | | 2,500 | | | 3.50 | | | 2,500 | | | 4.00 | | | - | | | - | | | - | | | - | |
| Swap | Apr 2020 - Sep 2020 | | | USD | | - | | | - | | | - | | | - | | | - | | | - | | | 5,000 | | | 3.21 | |
| | | | | | | | | | | | | | | | | | | | | |
| Cross Currency Interest Rate | | | | | Receive Notional Amount | | Receive Rate | | Pay Notional Amount | | Pay Rate |
| Swap | Jun 2019 - Jul 2019 | | | | | 1,085,292,608 | | | USD | | LIBOR + 1.70% | | 1,454,900,000 | | | CAD | | CDOR + 1.31% |
| Swap | Jun 2019 - Mar 2025 | | | | | 300,000,000 | | | USD | | 5.625% | | 265,048,910 | | | EUR | | 3.275% |
(1) The sold swaption instrument allows the counterparty, at the specified date, to enter into a derivative instrument contract with Vermilion at the above detailed terms. |
| | | | | | | | | | | | | | | | | | | | | |
| | | | | | | | | | | | | | | | | | | | | | | | | | | | | | |
Vermilion Energy Inc. ■ Page 47 ■ 2019 Second Quarter Report
Supplemental Table 3: Capital Expenditures and Acquisitions
By classification ($M) | Q2 2019 | | Q1 2019 | | Q2 2018 | | YTD 2019 | | YTD 2018 |
| Drilling and development | 75,149 | | | 197,291 | | | 76,709 | | | 272,440 | | | 201,367 | |
| Exploration and evaluation | 17,458 | | | 4,762 | | | 3,275 | | | 22,220 | | | 7,082 | |
| Capital expenditures | 92,607 | | | 202,053 | | | 79,984 | | | 294,660 | | | 208,449 | |
| | | | | | | | | | |
| Acquisitions | 8,623 | | | 16,027 | | | 57,590 | | | 24,650 | | | 113,945 | |
| Shares issued for acquisition | - | | | - | | | 1,235,221 | | | - | | | 1,235,221 | |
| Long-term debt net of working capital assumed | - | | | - | | | 172,674 | | | - | | | 209,397 | |
| Acquisitions | 8,623 | | | 16,027 | | | 1,465,485 | | | 24,650 | | | 1,558,563 | |
| | | | | | | | | | |
| By category ($M) | Q2 2019 | | Q1 2019 | | Q2 2018 | | YTD 2019 | | YTD 2018 |
| Drilling, completion, new well equip and tie-in, workovers and recompletions | 70,636 | | | 174,558 | | | 56,154 | | | 245,194 | | | 165,047 | |
| Production equipment and facilities | 12,323 | | | 17,445 | | | 10,224 | | | 29,768 | | | 26,366 | |
| Seismic, studies, land and other | 9,648 | | | 10,050 | | | 13,606 | | | 19,698 | | | 17,036 | |
| Capital expenditures | 92,607 | | | 202,053 | | | 79,984 | | | 294,660 | | | 208,449 | |
| Acquisitions | 8,623 | | | 16,027 | | | 1,465,485 | | | 24,650 | | | 1,558,563 | |
| Total capital expenditures and acquisitions | 101,230 | | | 218,080 | | | 1,545,469 | | | 319,310 | | | 1,767,012 | |
| | | | | | | | | | |
| Capital expenditures by country ($M) | Q2 2019 | | Q1 2019 | | Q2 2018 | | YTD 2019 | | YTD 2018 |
| Canada | 29,083 | | | 128,055 | | | 28,694 | | | 157,138 | | | 97,809 | |
| France | 25,671 | | | 22,086 | | | 17,044 | | | 47,757 | | | 46,971 | |
| Netherlands | 4,577 | | | 6,349 | | | 6,695 | | | 10,926 | | | 9,973 | |
| Germany | 9,234 | | | 3,044 | | | 2,314 | | | 12,278 | | | 4,729 | |
| Ireland | 84 | | | 11 | | | 87 | | | 95 | | | 134 | |
| Australia | 2,239 | | | 18,864 | | | 11,368 | | | 21,103 | | | 15,817 | |
| United States | 12,964 | | | 20,036 | | | 10,702 | | | 33,000 | | | 26,570 | |
| Corporate | 8,755 | | | 3,608 | | | 3,080 | | | 12,363 | | | 6,446 | |
| Total capital expenditures | 92,607 | | | 202,053 | | | 79,984 | | | 294,660 | | | 208,449 | |
| | | | | | | | | | |
| Acquisitions by country ($M) | Q2 2019 | | Q1 2019 | | Q2 2018 | | YTD 2019 | | YTD 2018 |
| Canada | 2,655 | | | 14,660 | | | 1,465,335 | | | 17,315 | | | 1,555,585 | |
| Netherlands | - | | | 908 | | | 139 | | | 908 | | | 2,899 | |
| Germany | 4,751 | | | 416 | | | - | | | 5,167 | | | - | |
| United States | 1,217 | | | 43 | | | 11 | | | 1,260 | | | 79 | |
| Total acquisitions | 8,623 | | | 16,027 | | | 1,465,485 | | | 24,650 | | | 1,558,563 | |
In 2019, included in cash expenditures on acquisitions of $24.7 million is: $12.1 million net paid to vendors in relation to the purchase of assets from other oil and gas producers; $4.1 million in asset improvements incurred subsequent to acquisitions for compliance with safety, environmental, and Vermilion's operating standards; $2.4 million paid to acquire land; $0.9 million paid to acquire royalty interests, and $5.2 million relating to the carry component of farm-in arrangements.
Vermilion Energy Inc. ■ Page 48 ■ 2019 Second Quarter Report
Supplemental Table 4: Production
| | Q2/19 | | Q1/19 | | Q4/18 | | Q3/18 | | Q2/18 | | Q1/18 | | Q4/17 | | Q3/17 | | Q2/17 | | Q1/17 | | Q4/16 | | Q3/16 |
| Canada | | | | | | | | | | | | | | | | | | | | | | | |
| Crude oil & condensate (bbls/d) | 28,844 | | | 29,164 | | | 29,557 | | | 28,477 | | | 17,009 | | | 9,272 | | | 9,703 | | | 9,288 | | | 9,205 | | | 7,987 | | | 7,945 | | | 8,984 | |
| NGLs (bbls/d) | 7,352 | | | 6,968 | | | 6,816 | | | 6,126 | | | 5,589 | | | 5,106 | | | 5,235 | | | 4,891 | | | 3,745 | | | 2,670 | | | 2,444 | | | 2,448 | |
| Natural gas (mmcf/d) | 151.87 | | | 151.37 | | | 146.65 | | | 136.77 | | | 127.32 | | | 106.21 | | | 107.91 | | | 103.92 | | | 93.68 | | | 85.74 | | | 75.12 | | | 77.62 | |
| Total (boe/d) | 61,507 | | | 61,360 | | | 60,814 | | | 57,397 | | | 43,817 | | | 32,078 | | | 32,923 | | | 31,499 | | | 28,563 | | | 24,947 | | | 22,910 | | | 24,368 | |
| % of consolidated | 60 | % | | 59 | % | | 60 | % | | 59 | % | | 55 | % | | 46 | % | | 45 | % | | 46 | % | | 43 | % | | 38 | % | | 38 | % | | 37 | % |
| France | | | | | | | | | | | | | | | | | | | | | | | |
| Crude oil (bbls/d) | 9,800 | | | 11,342 | | | 11,317 | | | 11,407 | | | 11,683 | | | 11,037 | | | 11,215 | | | 10,918 | | | 11,368 | | | 10,834 | | | 11,220 | | | 11,827 | |
| Natural gas (mmcf/d) | - | | | 0.77 | | | 0.82 | | | - | | | - | | | - | | | - | | | - | | | - | | | 0.01 | | | 0.38 | | | 0.42 | |
| Total (boe/d) | 9,800 | | | 11,470 | | | 11,454 | | | 11,407 | | | 11,683 | | | 11,037 | | | 11,215 | | | 10,918 | | | 11,368 | | | 10,836 | | | 11,283 | | | 11,897 | |
| % of consolidated | 10 | % | | 11 | % | | 11 | % | | 12 | % | | 14 | % | | 16 | % | | 15 | % | | 16 | % | | 17 | % | | 17 | % | | 19 | % | | 19 | % |
| Netherlands | | | | | | | | | | | | | | | | | | | | | | | |
| Condensate (bbls/d) | 100 | | | 93 | | | 112 | | | 84 | | | 87 | | | 77 | | | 105 | | | 74 | | | 104 | | | 76 | | | 57 | | | 86 | |
| Natural gas (mmcf/d) | 52.90 | | | 51.51 | | | 51.82 | | | 44.37 | | | 43.49 | | | 44.79 | | | 55.66 | | | 34.90 | | | 31.58 | | | 39.92 | | | 41.15 | | | 47.62 | |
| Total (boe/d) | 8,917 | | | 8,677 | | | 8,749 | | | 7,479 | | | 7,335 | | | 7,541 | | | 9,381 | | | 5,890 | | | 5,368 | | | 6,729 | | | 6,915 | | | 8,023 | |
| % of consolidated | 9 | % | | 8 | % | | 9 | % | | 8 | % | | 9 | % | | 11 | % | | 13 | % | | 9 | % | | 8 | % | | 10 | % | | 11 | % | | 13 | % |
| Germany | | | | | | | | | | | | | | | | | | | | | | | |
| Crude oil (bbls/d) | 1,047 | | | 978 | | | 913 | | | 1,019 | | | 1,008 | | | 1,078 | | | 1,148 | | | 1,054 | | | 1,047 | | | 989 | | | - | | | - | |
| Natural gas (mmcf/d) | 14.56 | | | 16.71 | | | 16.94 | | | 14.88 | | | 14.63 | | | 16.19 | | | 18.19 | | | 20.12 | | | 19.86 | | | 19.39 | | | 14.80 | | | 14.52 | |
| Total (boe/d) | 3,474 | | | 3,763 | | | 3,736 | | | 3,498 | | | 3,447 | | | 3,777 | | | 4,180 | | | 4,407 | | | 4,357 | | | 4,220 | | | 2,467 | | | 2,420 | |
| % of consolidated | 3 | % | | 4 | % | | 4 | % | | 4 | % | | 4 | % | | 5 | % | | 6 | % | | 7 | % | | 6 | % | | 7 | % | | 4 | % | | 4 | % |
| Ireland | | | | | | | | | | | | | | | | | | | | | | | |
| Natural gas (mmcf/d) | 49.21 | | | 51.71 | | | 52.03 | | | 51.38 | | | 56.56 | | | 60.87 | | | 56.23 | | | 49.04 | | | 63.81 | | | 64.82 | | | 62.92 | | | 59.28 | |
| Total (boe/d) | 8,201 | | | 8,619 | | | 8,672 | | | 8,563 | | | 9,426 | | | 10,144 | | | 9,372 | | | 8,173 | | | 10,634 | | | 10,803 | | | 10,486 | | | 9,879 | |
| % of consolidated | 8 | % | | 8 | % | | 9 | % | | 9 | % | | 12 | % | | 14 | % | | 13 | % | | 12 | % | | 16 | % | | 17 | % | | 17 | % | | 16 | % |
| Australia | | | | | | | | | | | | | | | | | | | | | | | |
| Crude oil (bbls/d) | 6,689 | | | 5,862 | | | 4,174 | | | 4,704 | | | 4,132 | | | 4,971 | | | 4,993 | | | 5,473 | | | 6,054 | | | 6,581 | | | 6,388 | | | 6,562 | |
| % of consolidated | 6 | % | | 6 | % | | 4 | % | | 5 | % | | 5 | % | | 7 | % | | 7 | % | | 8 | % | | 9 | % | | 10 | % | | 10 | % | | 10 | % |
| United States | | | | | | | | | | | | | | | | | | | | | | | |
| Crude oil (bbls/d) | 2,483 | | | 1,742 | | | 1,605 | | | 1,461 | | | 655 | | | 574 | | | 667 | | | 880 | | | 747 | | | 365 | | | 362 | | | 383 | |
| NGLs (bbls/d) | 754 | | | 929 | | | 998 | | | 714 | | | 62 | | | 20 | | | 43 | | | 56 | | | 76 | | | 24 | | | 23 | | | 30 | |
| Natural gas (mmcf/d) | 7.06 | | | 5.89 | | | 5.65 | | | 4.82 | | | 0.40 | | | 0.15 | | | 0.29 | | | 0.64 | | | 0.44 | | | 0.20 | | | 0.18 | | | 0.20 | |
| Total (boe/d) | 4,414 | | | 3,653 | | | 3,545 | | | 2,979 | | | 784 | | | 618 | | | 758 | | | 1,043 | | | 896 | | | 422 | | | 414 | | | 447 | |
| % of consolidated | 4 | % | | 4 | % | | 3 | % | | 3 | % | | 1 | % | | 1 | % | | 1 | % | | 2 | % | | 1 | % | | 1 | % | | 1 | % | | 1 | % |
| Corporate | | | | | | | | | | | | | | | | | | | | | | | |
| Natural gas (mmcf/d) | - | | | - | | | 2.86 | | | 1.17 | | | - | | | - | | | - | | | - | | | - | | | - | | | - | | | - | |
| Total (boe/d) | - | | | - | | | 477 | | | 195 | | | - | | | - | | | - | | | - | | | - | | | - | | | - | | | - | |
| % of consolidated | - | | | - | | | - | | | - | | | - | | | - | | | - | | | - | | | - | | | - | | | - | | | - | |
| Consolidated | | | | | | | | | | | | | | | | | | | | | | | |
| Liquids (bbls/d) | 57,071 | | | 57,078 | | | 55,493 | | | 53,991 | | | 40,225 | | | 32,134 | | | 33,109 | | | 32,634 | | | 32,346 | | | 29,526 | | | 28,439 | | | 30,320 | |
| % of consolidated | 55 | % | | 55 | % | | 55 | % | | 56 | % | | 50 | % | | 46 | % | | 45 | % | | 48 | % | | 48 | % | | 46 | % | | 47 | % | | 48 | % |
| Natural gas (mmcf/d) | 275.60 | | | 277.96 | | | 276.77 | | | 253.38 | | | 242.40 | | | 228.20 | | | 238.28 | | | 208.62 | | | 209.36 | | | 210.07 | | | 194.54 | | | 199.65 | |
| % of consolidated | 45 | % | | 45 | % | | 45 | % | | 44 | % | | 50 | % | | 54 | % | | 55 | % | | 52 | % | | 52 | % | | 54 | % | | 53 | % | | 52 | % |
| Total (boe/d) | 103,003 | | | 103,404 | | | 101,621 | | | 96,222 | | | 80,625 | | | 70,167 | | | 72,821 | | | 67,403 | | | 67,240 | | | 64,537 | | | 60,863 | | | 63,596 | |
| | | | | | | | | | | | | | | | | | | | | | | | |
| | | | | | | | | | | | | | | | | | | | | | | | |
| | | | | | | | | | | | | | | | | | | | | | | | |
| | | | | | | | | | | | | | | | | | | | | | | | |
| | | | | | | | | | | | | | | | | | | | | | | | |
Vermilion Energy Inc. ■ Page 49 ■ 2019 Second Quarter Report
| | | | | | | | | | | | | | | | | | | | | | | | |
| | | | | | | | | | | | | | | | | | | | | | | | |
| | | | | | | | | | | | YTD 2019 | | 2018 | | 2017 | | 2016 | | 2015 | | 2014 |
| Canada | | | | | | | | | | | | | | | | | | | | | | | |
| Crude oil & condensate (bbls/d) | | | | | | | | | | | | | 29,003 | | | 21,154 | | | 9,051 | | | 9,171 | | | 11,357 | | | 12,491 | |
| NGLs (bbls/d) | | | | | | | | | | | | | 7,161 | | | 5,914 | | | 4,144 | | | 2,552 | | | 2,301 | | | 1,233 | |
| Natural gas (mmcf/d) | | | | | | | | | | | | | 151.62 | | | 129.37 | | | 97.89 | | | 84.29 | | | 71.65 | | | 55.67 | |
| Total (boe/d) | | | | | | | | | | | | | 61,434 | | | 48,630 | | | 29,510 | | | 25,771 | | | 25,598 | | | 23,001 | |
| % of consolidated | | | | | | | | | | | | | 59 | % | | 56 | % | | 45 | % | | 40 | % | | 46 | % | | 47 | % |
| France | | | | | | | | | | | | | | | | | | | | | | | |
| Crude oil (bbls/d) | | | | | | | | | | | | | 10,567 | | | 11,362 | | | 11,084 | | | 11,896 | | | 12,267 | | | 11,011 | |
| Natural gas (mmcf/d) | | | | | | | | | | | | | 0.38 | | | 0.21 | | | - | | | 0.44 | | | 0.97 | | | - | |
| Total (boe/d) | | | | | | | | | | | | | 10,630 | | | 11,396 | | | 11,085 | | | 11,970 | | | 12,429 | | | 11,011 | |
| % of consolidated | | | | | | | | | | | | | 10 | % | | 13 | % | | 16 | % | | 19 | % | | 23 | % | | 22 | % |
| Netherlands | | | | | | | | | | | | | | | | | | | | | | | |
| Condensate (bbls/d) | | | | | | | | | | | | | 96 | | | 90 | | | 90 | | | 88 | | | 99 | | | 77 | |
| Natural gas (mmcf/d) | | | | | | | | | | | | | 52.21 | | | 46.13 | | | 40.54 | | | 47.82 | | | 44.76 | | | 38.20 | |
| Total (boe/d) | | | | | | | | | | | | | 8,798 | | | 7,779 | | | 6,847 | | | 8,058 | | | 7,559 | | | 6,443 | |
| % of consolidated | | | | | | | | | | | | | 9 | % | | 9 | % | | 10 | % | | 13 | % | | 14 | % | | 13 | % |
| Germany | | | | | | | | | | | | | | | | | | | | | | | |
| Crude oil (bbls/d) | | | | | | | | | | | | | 1,013 | | | 1,004 | | | 1,060 | | | - | | | - | | | - | |
| Natural gas (mmcf/d) | | | | | | | | | | | | | 15.63 | | | 15.66 | | | 19.39 | | | 14.90 | | | 15.78 | | | 14.99 | |
| Total (boe/d) | | | | | | | | | | | | | 3,618 | | | 3,614 | | | 4,291 | | | 2,483 | | | 2,630 | | | 2,498 | |
| % of consolidated | | | | | | | | | | | | | 4 | % | | 4 | % | | 6 | % | | 4 | % | | 5 | % | | 5 | % |
| Ireland | | | | | | | | | | | | | | | | | | | | | | | |
| Natural gas (mmcf/d) | | | | | | | | | | | | | 50.45 | | | 55.17 | | | 58.43 | | | 50.89 | | | 0.03 | | | - | |
| Total (boe/d) | | | | | | | | | | | | | 8,409 | | | 9,195 | | | 9,737 | | | 8,482 | | | 5 | | | - | |
| % of consolidated | | | | | | | | | | | | | 8 | % | | 11 | % | | 14 | % | | 13 | % | | - | | | - | |
| Australia | | | | | | | | | | | | | | | | | | | | | | | |
| Crude oil (bbls/d) | | | | | | | | | | | | | 6,278 | | | 4,494 | | | 5,770 | | | 6,304 | | | 6,454 | | | 6,571 | |
| % of consolidated | | | | | | | | | | | | | 6 | % | | 5 | % | | 8 | % | | 10 | % | | 12 | % | | 13 | % |
| United States | | | | | | | | | | | | | | | | | | | | | | | |
| Crude oil (bbls/d) | | | | | | | | | | | | | 2,115 | | | 1,078 | | | 666 | | | 393 | | | 231 | | | 49 | |
| NGLs (bbls/d) | | | | | | | | | | | | | 841 | | | 452 | | | 50 | | | 29 | | | 7 | | | - | |
| Natural gas (mmcf/d) | | | | | | | | | | | | | 6.48 | | | 2.78 | | | 0.39 | | | 0.21 | | | 0.05 | | | - | |
| Total (boe/d) | | | | | | | | | | | | | 4,036 | | | 1,992 | | | 781 | | | 457 | | | 247 | | | 49 | |
| % of consolidated | | | | | | | | | | | | | 4 | % | | 2 | % | | 1 | % | | 1 | % | | - | | | - | |
| Corporate | | | | | | | | | | | | | | | | | | | | | | | |
| Natural gas (mmcf/d) | | | | | | | | | | | | | - | | | 1.02 | | | - | | | - | | | - | | | - | |
| Total (boe/d) | | | | | | | | | | | | | - | | | 169 | | | - | | | - | | | - | | | - | |
| % of consolidated | | | | | | | | | | | | | - | | | - | | | - | | | - | | | - | | | - | |
| Consolidated | | | | | | | | | | | | | | | | | | | | | | | |
| Liquids (bbls/d) | | | | | | | | | | | | | 57,074 | | | 45,548 | | | 31,915 | | | 30,433 | | | 32,716 | | | 31,432 | |
| % of consolidated | | | | | | | | | | | | | 55 | % | | 52 | % | | 47 | % | | 48 | % | | 60 | % | | 63 | % |
| Natural gas (mmcf/d) | | | | | | | | | | | | | 276.77 | | | 250.33 | | | 216.64 | | | 198.55 | | | 133.24 | | | 108.85 | |
| % of consolidated | | | | | | | | | | | | | 45 | % | | 48 | % | | 53 | % | | 52 | % | | 40 | % | | 37 | % |
| Total (boe/d) | | | | | | | | | | | | | 103,203 | | | 87,270 | | | 68,021 | | | 63,526 | | | 54,922 | | | 49,573 | |
Vermilion Energy Inc. ■ Page 50 ■ 2019 Second Quarter Report
Non-GAAP Financial Measures
This MD&A includes references to certain financial measures which do not have standardized meanings and may not be comparable to similar measures presented by other issuers. These financial measures include fund flows from operations, a measure of profit or loss in accordance with IFRS 8 “Operating Segments” (please see Segmented Information in the Notes to the Condensed Consolidated Interim Financial Statements) and net debt, a measure of capital in accordance with IAS 1 “Presentation of Financial Statements” (please see Capital Disclosures in the Notes to the Condensed Consolidated Interim Financial Statements).
In addition, this MD&A includes financial measures which are not specified, defined, or determined under IFRS and are therefore considered non-GAAP financial measures and may not be comparable to similar measures presented by other issuers. These non-GAAP financial measures include:
Acquisitions:The sum of acquisitions from the Consolidated Statements of Cash Flows, Vermilion common shares issued as consideration, the estimated value of contingent consideration, the amount of acquiree's outstanding long-term debt assumed plus or net of acquired working capital deficit or surplus. We believe that including these components provides a useful measure of the economic investment associated with our acquisition activity.
Capital expenditures:The sum of drilling and development and exploration and evaluation from the Consolidated Statements of Cash Flows. We consider capital expenditures to be a useful measure of our investment in our existing asset base. Capital expenditures are also referred to as E&D capital.
Cash dividends per share:Represents cash dividends declared per share and is a useful measure of the dividends a common shareholder was entitled to during the period.
Covenants:The financial covenants on our revolving credit facility contain non-GAAP measures. The definitions for these financial covenants are included in Financial Position Review.
Diluted shares outstanding:The sum of shares outstanding at the period end plus outstanding awards under the VIP, based on current estimates of future performance factors and forfeiture rates.
Free cash flow:Represents fund flows from operations in excess of capital expenditures. We use free cash flow to determine the funding available for investing and financing activities, including payment of dividends, repayment of long-term debt, reallocation to existing business units, and deployment into new ventures. We also assess free cash flow as a percentage of fund flows from operations, which is a measure of the percentage of fund flows from operations that is retained for incremental investing and financing activities.
Fund flows from operations per basic and diluted share:Management assesses fund flows from operations on a per share basis as we believe this provides a measure of our operating performance after taking into account the issuance and potential future issuance of Vermilion common shares. Fund flows from operations per basic share is calculated by dividing fund flows from operations by the basic weighted average shares outstanding as defined under IFRS. Fund flows from operations per diluted share is calculated by dividing fund flows from operations by the sum of basic weighted average shares outstanding and incremental shares issuable under the equity based compensation plans as determined using the treasury stock method.
Net dividends:We define net dividends as dividends declared less proceeds received for the issuance of shares pursuant to the Dividend Reinvestment Plan. Management monitors net dividends and net dividends as a percentage of fund flows from operations to assess our ability to pay dividends.
Operating netback:Sales less royalties, operating expense, transportation costs, PRRT, and realized hedging gains and losses presented on a per unit basis. Management assesses operating netback as a measure of the profitability and efficiency of our field operations. In contrast, fund flows from operations netback also includes general and administration expense, corporate income taxes and interest. Fund flows from operations netback is used by management to assess the profitability of our business units and Vermilion as a whole.
Payout:We define payout as net dividends plus drilling and development costs, exploration and evaluation costs and asset retirement obligations settled. Management uses payout and payout as a percentage of fund flows from operations (also referred to as thesustainability ratio) to assess the amount of cash distributed back to shareholders and re-invested in the business for maintaining production and organic growth.
Return on capital employed (ROCE):ROCE is a measure that we use to analyze our profitability and the efficiency of our capital allocation process. ROCE is calculated by dividing net earnings before interest and taxes ("EBIT") by average capital employed over the preceding twelve months. Capital employed is calculated as total assets less current liabilities while average capital employed is calculated using the current period balance sheet and the previous year-end balance sheet.
Vermilion Energy Inc. ■ Page 51 ■ 2019 Second Quarter Report
The following tables reconcile net dividends, payout, and diluted shares outstanding from their most directly comparable GAAP measures as presented in our financial statements:
| ($M) | Q2 2019 | | Q1 2019 | | Q2 2018 | | | YTD 2019 | | YTD 2018 |
| Dividends declared | 106,884 | | | 105,549 | | | 98,604 | | | | 212,433 | | | 177,609 | |
| Shares issued for the Dividend Reinvestment Plan | (8,773 | ) | | (7,104 | ) | | (19,975 | ) | | | (15,877 | ) | | (39,616 | ) |
| Net dividends | 98,111 | | | 98,445 | | | 78,629 | | | | 196,556 | | | 137,993 | |
| Drilling and development | 75,149 | | | 197,290 | | | 76,709 | | | | 272,440 | | | 201,367 | |
| Exploration and evaluation | 17,458 | | | 4,763 | | | 3,275 | | | | 22,220 | | | 7,082 | |
| Asset retirement obligations settled | 4,907 | | | 3,597 | | | 2,626 | | | | 8,504 | | | 6,217 | |
| Payout | 195,625 | | | 304,095 | | | 161,239 | | | | 499,720 | | | 352,659 | |
| % of fund flows from operations | 88 | % | | 120 | % | | 83 | % | | | 105 | % | | 99 | % |
| ('000s of shares) | Q2 2019 | | Q1 2019 | | Q2 2018 |
| Shares outstanding | 155,032 | | | 153,213 | | | 152,363 | |
| Potential shares issuable pursuant to the VIP | 3,601 | | | 3,437 | | | 2,992 | |
| Diluted shares outstanding | 158,633 | | | 156,650 | | | 155,355 | |
The following tables reconciles the calculation of return on capital employed:
| | | | | | | | | Twelve Months Ended |
| ($M) | | | | | | | | Jun 30, 2019 | | Jun 30, 2018 |
| Net earnings (loss) | | | | | | | | 349,825 | | | (67,170 | ) |
| Taxes | | | | | | | | 154,232 | | | 6,484 | |
| Interest expense | | | | | | | | 83,146 | | | 59,270 | |
| EBIT | | | | | | | | 587,203 | | | (1,416 | ) |
| Average capital employed | | | | | | | | 5,461,184 | | | 4,514,373 | |
| Return on capital employed | | | | | | | | 11 | % | | - | % |
Vermilion Energy Inc. ■ Page 52 ■ 2019 Second Quarter Report
Consolidated Interim Financial Statements
Consolidated Balance Sheet
thousands of Canadian dollars, unaudited
| | Note | | June 30, 2019 | | December 31, 2018 |
| Assets | | | | | |
| Current | | | | | |
| Cash and cash equivalents | | | 35,064 | | | 26,809 | |
| Accounts receivable | | | 197,151 | | | 260,322 | |
| Crude oil inventory | | | 22,898 | | | 27,751 | |
| Derivative instruments | | | 41,971 | | | 95,667 | |
| Prepaid expenses | | | 21,486 | | | 19,328 | |
| Total current assets | | | 318,570 | | | 429,877 | |
| | | | | | |
| Derivative instruments | | | 3,588 | | | 1,215 | |
| Deferred taxes | | | 204,982 | | | 219,411 | |
| Exploration and evaluation assets | 6 | | 310,458 | | | 303,295 | |
| Capital assets | 5 | | 5,197,131 | | | 5,316,873 | |
| Total assets | | | 6,034,729 | | | 6,270,671 | |
| | | | | | |
| Liabilities | | | | | |
| Current | | | | | |
| Accounts payable and accrued liabilities | | | 265,710 | | | 449,651 | |
| Dividends payable | 9 | | 35,657 | | | 35,122 | |
| Derivative instruments | | | 37,480 | | | 41,016 | |
| Income taxes payable | | | 37,097 | | | 37,410 | |
| Total current liabilities | | | 375,944 | | | 563,199 | |
| | | | | | |
| Derivative instruments | | | 20,283 | | | 17,527 | |
| Long-term debt | 8 | | 1,893,135 | | | 1,796,207 | |
| Lease obligations | | | 104,100 | | | 108,189 | |
| Asset retirement obligations | 7 | | 670,096 | | | 650,164 | |
| Deferred taxes | | | 329,926 | | | 318,134 | |
| Total liabilities | | | 3,393,484 | | | 3,453,420 | |
| | | | | | |
| Shareholders' equity | | | | | |
| Shareholders’ capital | 9 | | 4,090,024 | | | 4,008,828 | |
| Contributed surplus | | | 58,582 | | | 78,478 | |
| Accumulated other comprehensive income | | | 59,745 | | | 118,182 | |
| Deficit | | | (1,567,106 | ) | | (1,388,237 | ) |
| Total shareholders' equity | | | 2,641,245 | | | 2,817,251 | |
| Total liabilities and shareholders' equity | | | 6,034,729 | | | 6,270,671 | |
Approved by the Board
| (Signed “Catherine L. Williams”) | | (Signed “Anthony Marino”) |
| | | |
| Catherine L. Williams, Director | | Anthony Marino, Director |
Vermilion Energy Inc. ■ Page 53 ■ 2019 Second Quarter Report
Consolidated Statements of Net Earnings (Loss) and Comprehensive Loss
thousands of Canadian dollars, except share and per share amounts, unaudited
| | | | Three Months Ended | | Six Months Ended |
| | Note | | Jun 30, 2019 | | Jun 30, 2018 | | Jun 30, 2019 | | Jun 30, 2018 |
| Revenue | | | | | | | | | |
| Petroleum and natural gas sales | | | 428,043 | | | 394,498 | | | 909,126 | | | 712,767 | |
| Royalties | | | (38,113 | ) | | (31,512 | ) | | (81,497 | ) | | (54,507 | ) |
| Sales of purchased commodities | | | 75,335 | | | - | | | 104,874 | | | - | |
| Petroleum and natural gas revenue | | | 465,265 | | | 362,986 | | | 932,503 | | | 658,260 | |
| | | | | | | | | | |
| Expenses | | | | | | | | | |
| Purchased commodities | | | 75,335 | | | - | | | 104,874 | | | - | |
| Operating | | | 101,881 | | | 78,947 | | | 224,303 | | | 146,786 | |
| Transportation | | | 20,750 | | | 11,046 | | | 37,450 | | | 21,228 | |
| Equity based compensation | | | 14,593 | | | 10,961 | | | 37,436 | | | 30,711 | |
| Loss on derivative instruments | | | 16,414 | | | 133,143 | | | 20,343 | | | 133,515 | |
| Interest expense | | | 21,568 | | | 16,572 | | | 42,547 | | | 32,160 | |
| General and administration | | | 15,697 | | | 14,153 | | | 28,755 | | | 25,881 | |
| Foreign exchange (gain) loss | | | (40,229 | ) | | 16,563 | | | (61,437 | ) | | 6,384 | |
| Other income | | | (122 | ) | | (31 | ) | | (6,801 | ) | | (37 | ) |
| Accretion | 7 | | 8,147 | | | 7,819 | | | 16,133 | | | 14,973 | |
| Depletion and depreciation | 5, 6 | | 184,131 | | | 143,385 | | | 361,160 | | | 268,278 | |
| | | | 418,165 | | | 432,558 | | | 804,763 | | | 679,879 | |
| Earnings (loss) before income taxes | | | 47,100 | | | (69,572 | ) | | 127,740 | | | (21,619 | ) |
| | | | | | | | | | |
| Taxes | | | | | | | | | |
| Deferred | | | 24,987 | | | (23,552 | ) | | 39,930 | | | (13,901 | ) |
| Current | | | 20,109 | | | 15,344 | | | 46,259 | | | 28,906 | |
| | | | 45,096 | | | (8,208 | ) | | 86,189 | | | 15,005 | |
| | | | | | | | | | |
| Net earnings (loss) | | | 2,004 | | | (61,364 | ) | | 41,551 | | | (36,624 | ) |
| | | | | | | | | | |
| Other comprehensive loss | | | | | | | | | |
| Currency translation adjustments | | | (15,671 | ) | | (23,348 | ) | | (59,605 | ) | | 15,609 | |
| Unrealized gains on derivatives designated as cash flow hedges | 8 | | 1,376 | | | - | | | 1,376 | | | - | |
| Unrealized losses on derivatives designated as net investment hedges | 8 | | (208 | ) | | - | | | (208 | ) | | - | |
| Comprehensive loss | | | (12,499 | ) | | (84,712 | ) | | (16,886 | ) | | (21,015 | ) |
| | | | | | | | | | |
| Net earnings (loss) per share | | | | | | | | | |
| Basic | | | 0.01 | | | (0.46 | ) | | 0.27 | | | (0.28 | ) |
| Diluted | | | 0.01 | | | (0.46 | ) | | 0.27 | | | (0.28 | ) |
| | | | | | | | | | |
| Weighted average shares outstanding ('000s) | | | | | | | | | |
| Basic | | | 154,795 | | | 134,603 | | | 153,855 | | | 128,531 | |
| Diluted | | | 156,844 | | | 134,603 | | | 155,335 | | | 128,531 | |
Vermilion Energy Inc. ■ Page 54 ■ 2019 Second Quarter Report
Consolidated Statements of Cash Flows
thousands of Canadian dollars, unaudited
| | | | Three Months Ended | | Six Months Ended |
| | Note | | Jun 30, 2019 | | Jun 30, 2018 | | Jun 30, 2019 | | Jun 30, 2018 |
| Operating | | | | | | | | | |
| Net earnings (loss) | | | 2,004 | | | (61,364 | ) | | 41,551 | | | (36,624 | ) |
| Adjustments: | | | | | | | | | |
| Accretion | 7 | | 8,147 | | | 7,819 | | | 16,133 | | | 14,973 | |
| Depletion and depreciation | 5, 6 | | 184,131 | | | 143,385 | | | 361,160 | | | 268,278 | |
| Unrealized loss on derivative instruments | | | 30,605 | | | 105,284 | | | 44,882 | | | 87,941 | |
| Equity based compensation | | | 14,593 | | | 10,961 | | | 37,436 | | | 30,711 | |
| Unrealized foreign exchange (gain) loss | | | (41,798 | ) | | 12,458 | | | (65,056 | ) | | 3,833 | |
| Unrealized other expense | | | 69 | | | 199 | | | 274 | | | 394 | |
| Deferred taxes | | | 24,987 | | | (23,552 | ) | | 39,930 | | | (13,901 | ) |
| Asset retirement obligations settled | 7 | | (4,907 | ) | | (2,626 | ) | | (8,504 | ) | | (6,217 | ) |
| Changes in non-cash operating working capital | | | (47,741 | ) | | (40,549 | ) | | (93,488 | ) | | (22,755 | ) |
| Cash flows from operating activities | | | 170,090 | | | 152,015 | | | 374,318 | | | 326,633 | |
| | | | | | | | | | |
| Investing | | | | | | | | | |
| Drilling and development | 5 | | (75,149 | ) | | (76,709 | ) | | (272,440 | ) | | (201,367 | ) |
| Exploration and evaluation | 6 | | (17,458 | ) | | (3,275 | ) | | (22,220 | ) | | (7,082 | ) |
| Acquisitions | 5 | | (8,623 | ) | | (57,590 | ) | | (24,650 | ) | | (113,945 | ) |
| Changes in non-cash investing working capital | | | (15,485 | ) | | (19,811 | ) | | (18,370 | ) | | 1,036 | |
| Cash flows used in investing activities | | | (116,715 | ) | | (157,385 | ) | | (337,680 | ) | | (321,358 | ) |
| | | | | | | | | | |
| Financing | | | | | | | | | |
| Borrowings on the revolving credit facility | 8 | | 79,501 | | | 99,257 | | | 179,411 | | | 123,166 | |
| Payments on lease obligations | | | (4,720 | ) | | (3,888 | ) | | (11,188 | ) | | (8,238 | ) |
| Cash dividends | | | (97,693 | ) | | (69,981 | ) | | (196,021 | ) | | (129,206 | ) |
| Cash flows (used in) from financing activities | | | (22,912 | ) | | 25,388 | | | (27,798 | ) | | (14,278 | ) |
| Foreign exchange (loss) gain on cash held in foreign currencies | | | (615 | ) | | (213 | ) | | (585 | ) | | 1,546 | |
| | | | | | | | | | |
| Net change in cash and cash equivalents | | | 29,848 | | | 19,805 | | | 8,255 | | | (7,457 | ) |
| Cash and cash equivalents, beginning of period | | | 5,216 | | | 19,299 | | | 26,809 | | | 46,561 | |
| Cash and cash equivalents, end of period | | | 35,064 | | | 39,104 | | | 35,064 | | | 39,104 | |
| | | | | | | | | | |
| Supplementary information for cash flows from operating activities | | | | | | | | | |
| Interest paid | | | 16,404 | | | 13,036 | | | 42,955 | | | 31,170 | |
| Income taxes paid | | | 41,077 | | | 33,784 | | | 46,572 | | | 34,126 | |
Vermilion Energy Inc. ■ Page 55 ■ 2019 Second Quarter Report
Consolidated Statements of Changes in Shareholders' Equity
thousands of Canadian dollars, unaudited
| | | | Six Months Ended |
| | Note | | June 30, 2019 | | June 30, 2018 |
| Shareholders' capital | 9 | | | | |
| Balance, beginning of period | | | 4,008,828 | | | 2,650,706 | |
| Shares issued for acquisition | | | - | | | 1,234,676 | |
| Shares issued for the Dividend Reinvestment Plan | | | 15,877 | | | 39,616 | |
| Vesting of equity based awards | | | 45,636 | | | 54,057 | |
| Equity based compensation | | | 11,696 | | | 9,044 | |
| Share-settled dividends on vested equity based awards | | | 7,987 | | | 7,773 | |
| Balance, end of period | | | 4,090,024 | | | 3,995,872 | |
| Contributed surplus | | | | | |
| Balance, beginning of period | | | 78,478 | | | 84,354 | |
| Equity based compensation | | | 25,740 | | | 21,667 | |
| Vesting of equity based awards | | | (45,636 | ) | | (54,057 | ) |
| Balance, end of period | | | 58,582 | | | 51,964 | |
| Accumulated other comprehensive income | | | | | |
| Balance, beginning of period | | | 118,182 | | | 71,829 | |
| Currency translation adjustments | | | (59,605 | ) | | 15,609 | |
| Cash flow hedges | 8 | | 7,222 | | | - | |
| Amount reclassified from cash flow hedge reserve to net earnings (loss) | | | (5,846 | ) | | - | |
| Net investment hedges | 8 | | (583 | ) | | - | |
| Amount reclassified from net investment hedge reserve to net earnings (loss) | | | 375 | | | - | |
| Balance, end of period | | | 59,745 | | | 87,438 | |
| Deficit | | | | | |
| Balance, beginning of period | | | (1,388,237 | ) | | (1,264,003 | ) |
| Net earnings (loss) | | | 41,551 | | | (36,624 | ) |
| Dividends declared | 9 | | (212,433 | ) | | (177,609 | ) |
| Share-settled dividends on vested equity based awards | | | (7,987 | ) | | (7,773 | ) |
| Balance, end of period | | | (1,567,106 | ) | | (1,486,009 | ) |
| | | | | | |
| Total shareholders' equity | | | 2,641,245 | | | 2,649,265 | |
Vermilion Energy Inc. ■ Page 56 ■ 2019 Second Quarter Report
Notes to the Condensed Consolidated Interim Financial Statements for the three and six months ended June 30, 2019 and 2018
tabular amounts in thousands of Canadian dollars, except share and per share amounts, unaudited
Vermilion Energy Inc. (the “Company” or “Vermilion”) is a corporation governed by the laws of the Province of Alberta and is actively engaged in the business of crude oil and natural gas exploration, development, acquisition and production.
These condensed consolidated interim financial statements are in compliance with International Accounting Standard (“IAS”) 34, “Interim Financial Reporting”. Except as described in Notes 2 and 3, these condensed consolidated interim financial statements have been prepared using the same accounting policies and methods of computation as Vermilion’s consolidated financial statements for the year ended December 31, 2018.
These condensed consolidated interim financial statements should be read in conjunction with Vermilion’s consolidated financial statements for the year ended December 31, 2018, which are contained within Vermilion’s Annual Report for the year ended December 31, 2018 and are available on SEDAR atwww.sedar.com or on Vermilion’s website atwww.vermilionenergy.com.
These condensed consolidated interim financial statements were approved and authorized for issuance by the Board of Directors of Vermilion on July 25, 2019.
| 2. Significant accounting policies |
On June 12, 2019, Vermilion entered into a series of cross currency interest rate swaps with a syndicate of banks. The details of these derivative instruments are disclosed in Note 8 (Long-term debt). Vermilion designated these derivative instruments as hedging instruments in qualifying hedging relationships. As such, effective June 12, 2019, Vermilion has adopted the following policies relating to hedge accounting.
Hedge Accounting
Hedge accounting is applied to certain financial instruments designated as hedging instruments in qualifying hedging relationships. Qualifying hedge relationships may include cash flow hedges, fair value hedges, and hedges of net investments in foreign operations. The purpose of hedge accounting is to represent the effect of Vermilion's risk management activities that use financial instruments to manage exposures arising from particular risks that affect net earnings.
In order to apply hedge accounting, the eligible hedging instrument must be highly effective in offsetting the exposure to changes in the eligible hedged item. This effectiveness is assessed at inception and at the end of each reporting period thereafter. At the inception of the hedge, formal designation and documentation is required of the hedging relationship and Vermilion's risk management objective and strategy for undertaking the hedge.
For cash flow hedges and net investment hedges, gains and losses on the hedging instrument are recognized in the consolidated statement of earnings in the same period in which the transaction associated with the hedged item occurs. Where the hedging instrument is a derivative instrument, a derivative asset or liability is recognized on the balance sheet at fair value (included in "Derivative instruments") with the effective portion of the gain or loss recorded to other comprehensive income. Any gain or loss associated with the ineffective portion of a hedging relationship, which is expected to be immaterial, is immediately recognized in the consolidated statement of net earnings as other income or expense.
If a hedging relationship no longer qualifies for hedge accounting, any gain or loss resulting from the discontinuation of hedge accounting is deferred in other comprehensive income until the forecasted transaction date. If the forecasted transaction is no longer expected to occur, any gain or loss resulting from the discontinuation of hedge accounting is immediately recognized in the consolidated statement of net earnings.
| 3. Changes in accounting pronouncements |
Definition of a Business - Amendments to IFRS 3 "Business Combinations"
Vermilion elected to early adopt the amendments to IFRS 3 "Business Combinations" effective January 1, 2019, which will be applied prospectively to acquisitions that occur on or after January 1, 2019. The amendments introduce an optional concentration test, narrow the definitions of a business and outputs, and clarify that an acquired set of activities and assets must include an input and a substantive process that together significantly contribute to the ability to create outputs. These amendments did not result in changes to Vermilion's accounting policies for applying the acquisition method.
Vermilion Energy Inc. ■ Page 57 ■ 2019 Second Quarter Report
| | Three Months Ended June 30, 2019 |
| | Canada | | France | | Netherlands | | Germany | | Ireland | | Australia | | USA | | Corporate | | Total |
| Drilling and development | 29,083 | | | 25,671 | | | 4,235 | | | 551 | | | 84 | | | 2,239 | | | 12,964 | | | 322 | | | 75,149 | |
| Exploration and evaluation | - | | | - | | | 342 | | | 8,683 | | | - | | | - | | | - | | | 8,433 | | | 17,458 | |
| | | | | | | | | | | | | | | | | | |
| Crude oil and condensate sales | 190,349 | | | 84,540 | | | 721 | | | 7,781 | | | 4 | | | 42,848 | | | 16,040 | | | - | | | 342,283 | |
| NGL sales | 7,100 | | | - | | | - | | | - | | | - | | | - | | | 1,200 | | | - | | | 8,300 | |
| Natural gas sales | 15,495 | | | - | | | 27,606 | | | 7,312 | | | 25,932 | | | - | | | 1,115 | | | - | | | 77,460 | |
| Sales of purchased commodities | - | | | - | | | - | | | - | | | - | | | - | | | - | | | 75,335 | | | 75,335 | |
| Royalties | (20,711 | ) | | (10,871 | ) | | (446 | ) | | (1,502 | ) | | - | | | - | | | (4,583 | ) | | - | | | (38,113 | ) |
| Revenue from external customers | 192,233 | | | 73,669 | | | 27,881 | | | 13,591 | | | 25,936 | | | 42,848 | | | 13,772 | | | 75,335 | | | 465,265 | |
| Purchased commodities | - | | | - | | | - | | | - | | | - | | | - | | | - | | | (75,335 | ) | | (75,335 | ) |
| Transportation | (9,781 | ) | | (9,041 | ) | | - | | | (773 | ) | | (1,155 | ) | | - | | | - | | | - | | | (20,750 | ) |
| Operating | (60,404 | ) | | (14,305 | ) | | (7,686 | ) | | (5,212 | ) | | (2,631 | ) | | (8,092 | ) | | (3,542 | ) | | (9 | ) | | (101,881 | ) |
| General and administration | (7,405 | ) | | (3,551 | ) | | (704 | ) | | (2,146 | ) | | (242 | ) | | (1,164 | ) | | (1,571 | ) | | 1,086 | | | (15,697 | ) |
| PRRT | - | | | - | | | - | | | - | | | - | | | (8,268 | ) | | - | | | - | | | (8,268 | ) |
| Corporate income taxes | - | | | (5,346 | ) | | (2,575 | ) | | - | | | - | | | (3,816 | ) | | - | | | (104 | ) | | (11,841 | ) |
| Interest expense | - | | | - | | | - | | | - | | | - | | | - | | | - | | | (21,568 | ) | | (21,568 | ) |
| Realized gain on derivative instruments | - | | | - | | | - | | | - | | | - | | | - | | | - | | | 14,191 | | | 14,191 | |
| Realized foreign exchange loss | - | | | - | | | - | | | - | | | - | | | - | | | - | | | (1,569 | ) | | (1,569 | ) |
| Realized other income | - | | | - | | | - | | | - | | | - | | | - | | | - | | | 191 | | | 191 | |
| Fund flows from operations | 114,643 | | | 41,426 | | | 16,916 | | | 5,460 | | | 21,908 | | | 21,508 | | | 8,659 | | | (7,782 | ) | | 222,738 | |
| | | | | | | | | | | | | | | | | | |
| | Three Months Ended June 30, 2018 |
| | Canada | | France | | Netherlands | | Germany | | Ireland | | Australia | | USA | | Corporate | | Total |
| Drilling and development | 28,694 | | | 17,006 | | | 7,278 | | | 1,551 | | | 87 | | | 11,368 | | | 10,702 | | | 23 | | | 76,709 | |
| Exploration and evaluation | - | | | 38 | | | (583 | ) | | 763 | | | - | | | - | | | - | | | 3,057 | | | 3,275 | |
| | | | | | | | | | | | | | | | | | |
| Crude oil and condensate sales | 123,055 | | | 101,128 | | | 632 | | | 8,765 | | | - | | | 37,364 | | | 4,997 | | | - | | | 275,941 | |
| NGL sales | 13,225 | | | - | | | - | | | - | | | - | | | - | | | 175 | | | - | | | 13,400 | |
| Natural gas sales | 12,635 | | | - | | | 34,368 | | | 10,234 | | | 47,862 | | | - | | | 58 | | | - | | | 105,157 | |
| Royalties | (15,463 | ) | | (12,602 | ) | | (745 | ) | | (1,251 | ) | | - | | | - | | | (1,451 | ) | | - | | | (31,512 | ) |
| Revenue from external customers | 133,452 | | | 88,526 | | | 34,255 | | | 17,748 | | | 47,862 | | | 37,364 | | | 3,779 | | | - | | | 362,986 | |
| Transportation | (5,186 | ) | | (2,813 | ) | | - | | | (1,779 | ) | | (1,268 | ) | | - | | | - | | | - | | | (11,046 | ) |
| Operating | (35,762 | ) | | (13,893 | ) | | (6,419 | ) | | (5,384 | ) | | (4,306 | ) | | (12,809 | ) | | (374 | ) | | - | | | (78,947 | ) |
| General and administration | (1,891 | ) | | (3,500 | ) | | (145 | ) | | (1,462 | ) | | (1,443 | ) | | (982 | ) | | (1,337 | ) | | (3,393 | ) | | (14,153 | ) |
| PRRT | - | | | - | | | - | | | - | | | - | | | (2,652 | ) | | - | | | - | | | (2,652 | ) |
| Corporate income taxes | - | | | (5,234 | ) | | (4,993 | ) | | - | | | - | | | (2,354 | ) | | - | | | (111 | ) | | (12,692 | ) |
| Interest expense | - | | | - | | | - | | | - | | | - | | | - | | | - | | | (16,572 | ) | | (16,572 | ) |
| Realized loss on derivative instruments | - | | | - | | | - | | | - | | | - | | | - | | | - | | | (27,859 | ) | | (27,859 | ) |
| Realized foreign exchange loss | - | | | - | | | - | | | - | | | - | | | - | | | - | | | (4,105 | ) | | (4,105 | ) |
| Realized other income | - | | | - | | | - | | | - | | | - | | | - | | | - | | | 230 | | | 230 | |
| Fund flows from operations | 90,613 | | | 63,086 | | | 22,698 | | | 9,123 | | | 40,845 | | | 18,567 | | | 2,068 | | | (51,810 | ) | | 195,190 | |
Vermilion Energy Inc. ■ Page 58 ■ 2019 Second Quarter Report
| | Six Months Ended June 30, 2019 |
| | Canada | | France | | Netherlands | | Germany | | Ireland | | Australia | | USA | | Corporate | | Total |
| Total assets | 3,037,471 | | | 879,636 | | | 247,868 | | | 279,496 | | | 581,058 | | | 248,716 | | | 412,678 | | | 347,806 | | | 6,034,729 | |
| Drilling and development | 157,138 | | | 47,755 | | | 10,565 | | | 2,428 | | | 95 | | | 21,103 | | | 33,000 | | | 356 | | | 272,440 | |
| Exploration and evaluation | - | | | 2 | | | 361 | | | 9,850 | | | - | | | - | | | - | | | 12,007 | | | 22,220 | |
| | | | | | | | | | | | | | | | | | |
| Crude oil and condensate sales | 363,008 | | | 167,121 | | | 1,280 | | | 15,212 | | | 4 | | | 106,430 | | | 26,814 | | | - | | | 679,869 | |
| NGL sales | 20,974 | | | - | | | - | | | - | | | - | | | - | | | 3,309 | | | - | | | 24,283 | |
| Natural gas sales | 49,118 | | | 121 | | | 67,633 | | | 19,249 | | | 65,724 | | | - | | | 3,129 | | | - | | | 204,974 | |
| Sales of purchased commodities | - | | | - | | | - | | | - | | | - | | | - | | | - | | | 104,874 | | | 104,874 | |
| Royalties | (46,042 | ) | | (22,154 | ) | | (1,060 | ) | | (3,725 | ) | | - | | | - | | | (8,516 | ) | | - | | | (81,497 | ) |
| Revenue from external customers | 387,058 | | | 145,088 | | | 67,853 | | | 30,736 | | | 65,728 | | | 106,430 | | | 24,736 | | | 104,874 | | | 932,503 | |
| Purchased commodities | - | | | - | | | - | | | - | | | - | | | - | | | - | | | (104,874 | ) | | (104,874 | ) |
| Transportation | (20,473 | ) | | (12,211 | ) | | - | | | (2,445 | ) | | (2,321 | ) | | - | | | - | | | - | | | (37,450 | ) |
| Operating | (124,008 | ) | | (30,041 | ) | | (15,971 | ) | | (11,132 | ) | | (6,441 | ) | | (29,496 | ) | | (6,974 | ) | | (240 | ) | | (224,303 | ) |
| General and administration | (10,124 | ) | | (7,206 | ) | | (1,596 | ) | | (4,059 | ) | | (571 | ) | | (2,203 | ) | | (3,462 | ) | | 466 | | | (28,755 | ) |
| PRRT | - | | | - | | | - | | | - | | | - | | | (18,668 | ) | | - | | | - | | | (18,668 | ) |
| Corporate income taxes | - | | | (13,046 | ) | | (6,775 | ) | | - | | | - | | | (7,516 | ) | | - | | | (254 | ) | | (27,591 | ) |
| Interest expense | - | | | - | | | - | | | - | | | - | | | - | | | - | | | (42,547 | ) | | (42,547 | ) |
| Realized gain on derivative instruments | - | | | - | | | - | | | - | | | - | | | - | | | - | | | 24,539 | | | 24,539 | |
| Realized foreign exchange loss | - | | | - | | | - | | | - | | | - | | | - | | | - | | | (3,619 | ) | | (3,619 | ) |
| Realized other income | - | | | - | | | - | | | - | | | - | | | - | | | - | | | 7,075 | | | 7,075 | |
| Fund flows from operations | 232,453 | | | 82,584 | | | 43,511 | | | 13,100 | | | 56,395 | | | 48,547 | | | 14,300 | | | (14,580 | ) | | 476,310 | |
| | | | | | | | | | | | | | | | | | |
| | Six Months Ended June 30, 2018 |
| | Canada | | France | | Netherlands | | Germany | | Ireland | | Australia | | USA | | Corporate | | Total |
| Total assets | 3,089,182 | | | 881,228 | | | 198,296 | | | 287,286 | | | 603,845 | | | 224,485 | | | 124,564 | | | 365,505 | | | 5,774,391 | |
| Drilling and development | 97,809 | | | 46,899 | | | 10,523 | | | 3,505 | | | 134 | | | 15,817 | | | 26,570 | | | 110 | | | 201,367 | |
| Exploration and evaluation | - | | | 72 | | | (550 | ) | | 1,224 | | | - | | | - | | | - | | | 6,336 | | | 7,082 | |
| | | | | | | | | | | | | | | | | | |
| Crude oil and condensate sales | 185,678 | | | 173,873 | | | 1,107 | | | 18,064 | | | - | | | 75,534 | | | 8,950 | | | - | | | 463,206 | |
| NGL sales | 24,864 | | | - | | | - | | | - | | | - | | | - | | | 241 | | | - | | | 25,105 | |
| Natural gas sales | 31,306 | | | - | | | 70,079 | | | 21,436 | | | 101,537 | | | - | | | 98 | | | - | | | 224,456 | |
| Sales of purchased commodities | - | | | - | | | - | | | - | | | - | | | - | | | - | | | - | | | - | |
| Royalties | (25,311 | ) | | (22,040 | ) | | (1,595 | ) | | (2,988 | ) | | - | | | - | | | (2,573 | ) | | - | | | (54,507 | ) |
| Revenue from external customers | 216,537 | | | 151,833 | | | 69,591 | | | 36,512 | | | 101,537 | | | 75,534 | | | 6,716 | | | - | | | 658,260 | |
| Purchased commodities | - | | | - | | | - | | | - | | | - | | | - | | | - | | | - | | | - | |
| Transportation | (9,726 | ) | | (5,171 | ) | | - | | | (3,777 | ) | | (2,554 | ) | | - | | | - | | | - | | | (21,228 | ) |
| Operating | (59,858 | ) | | (26,942 | ) | | (14,104 | ) | | (11,570 | ) | | (7,515 | ) | | (25,857 | ) | | (940 | ) | | - | | | (146,786 | ) |
| General and administration | (2,591 | ) | | (7,013 | ) | | (918 | ) | | (3,020 | ) | | (2,752 | ) | | (2,507 | ) | | (2,513 | ) | | (4,567 | ) | | (25,881 | ) |
| PRRT | - | | | - | | | - | | | - | | | - | | | (7,500 | ) | | - | | | - | | | (7,500 | ) |
| Corporate income taxes | - | | | (7,287 | ) | | (10,798 | ) | | - | | | - | | | (3,024 | ) | | - | | | (297 | ) | | (21,406 | ) |
| Interest expense | - | | | - | | | - | | | - | | | - | | | - | | | - | | | (32,160 | ) | | (32,160 | ) |
| Realized loss on derivative instruments | - | | | - | | | - | | | - | | | - | | | - | | | - | | | (45,574 | ) | | (45,574 | ) |
| Realized foreign exchange loss | - | | | - | | | - | | | - | | | - | | | - | | | - | | | (2,551 | ) | | (2,551 | ) |
| Realized other income | - | | | - | | | - | | | - | | | - | | | - | | | - | | | 431 | | | 431 | |
| Fund flows from operations | 144,362 | | | 105,420 | | | 43,771 | | | 18,145 | | | 88,716 | | | 36,646 | | | 3,263 | | | (84,718 | ) | | 355,605 | |
Vermilion Energy Inc. ■ Page 59 ■ 2019 Second Quarter Report
Reconciliation of fund flows from operations to net earnings:
| | Three Months Ended | | Six Months Ended |
| | Jun 30, 2019 | | Jun 30, 2018 | | Jun 30, 2019 | | Jun 30, 2018 |
| Fund flows from operations | 222,738 | | | 195,190 | | | 476,310 | | | 355,605 | |
| Accretion | (8,147 | ) | | (7,819 | ) | | (16,133 | ) | | (14,973 | ) |
| Depletion and depreciation | (184,131 | ) | | (143,385 | ) | | (361,160 | ) | | (268,278 | ) |
| Unrealized loss on derivative instruments | (30,605 | ) | | (105,284 | ) | | (44,882 | ) | | (87,941 | ) |
| Equity based compensation | (14,593 | ) | | (10,961 | ) | | (37,436 | ) | | (30,711 | ) |
| Unrealized foreign exchange gain (loss) | 41,798 | | | (12,458 | ) | | 65,056 | | | (3,833 | ) |
| Unrealized other expense | (69 | ) | | (199 | ) | | (274 | ) | | (394 | ) |
| Deferred tax | (24,987 | ) | | 23,552 | | | (39,930 | ) | | 13,901 | |
| Net earnings (loss) | 2,004 | | | (61,364 | ) | | 41,551 | | | (36,624 | ) |
The following table reconciles the change in Vermilion's capital assets:
| | 2019 |
| Balance at January 1 | 5,316,873 | |
| Acquisitions | 24,650 | |
| Additions | 272,440 | |
| Increase in right-of-use assets | 11,073 | |
| Transfers from exploration and evaluation assets | 1,039 | |
| Depletion and depreciation | (352,457 | ) |
| Changes in asset retirement obligations | 37,553 | |
| Foreign exchange | (114,040 | ) |
| Balance at June 30 | 5,197,131 | |
| 6. Exploration and evaluation assets |
The following table reconciles the change in Vermilion's exploration and evaluation assets:
| | 2019 |
| Balance at January 1 | 303,295 | |
| Additions | 22,220 | |
| Changes in asset retirement obligations | 60 | |
| Transfers to capital assets | (1,039 | ) |
| Depreciation | (9,267 | ) |
| Foreign exchange | (4,811 | ) |
| Balance at June 30 | 310,458 | |
| 7. Asset retirement obligations |
The following table reconciles the change in Vermilion’s asset retirement obligations:
| | 2019 |
| Balance at January 1 | 650,164 | |
| Additional obligations recognized | 5,338 | |
| Obligations settled | (8,504 | ) |
| Accretion | 16,133 | |
| Changes in discount rates | 32,275 | |
| Foreign exchange | (25,310 | ) |
| Balance at June 30 | 670,096 | |
Vermilion Energy Inc. ■ Page 60 ■ 2019 Second Quarter Report
The following table summarizes Vermilion’s outstanding long-term debt:
| | As at |
| | Jun 30, 2019 | | Dec 31, 2018 |
| Revolving credit facility | 1,505,164 | | | 1,392,206 | |
| Senior unsecured notes | 387,971 | | | 404,001 | |
| Long-term debt | 1,893,135 | | | 1,796,207 | |
The fair value of the revolving credit facility is equal to its carrying value due to the use of short-term borrowing instruments at market rates of interest. The fair value of the senior unsecured notes as at June 30, 2019 was $385.0 million.
The following table reconciles the change in Vermilion’s long-term debt:
| | 2019 |
| Balance at January 1 | 1,796,207 | |
| Borrowings on the revolving credit facility | 179,411 | |
| Amortization of transaction costs and prepaid interest | (686 | ) |
| Foreign exchange | (81,797 | ) |
| Balance at June 30 | 1,893,135 | |
Revolving credit facility
At June 30, 2019, Vermilion had in place a bank revolving credit facility maturing May 31, 2023 with the following terms:
| | As at |
| | Jun 30, 2019 | | Dec 31, 2018 |
| Total facility amount | 2,100,000 | | | 1,800,000 | |
| Amount drawn | (1,505,164 | ) | | (1,392,206 | ) |
| Letters of credit outstanding | (22,500 | ) | | (15,400 | ) |
| Unutilized capacity | 572,336 | | | 392,394 | |
The facility can be extended from time to time at the option of the lenders and upon notice from Vermilion. If no extension is granted by the lenders, the amounts owing pursuant to the facility are due at the maturity date. The facility is secured by various fixed and floating charges against the subsidiaries of Vermilion.
The facility bears interest at a rate applicable to demand loans plus applicable margins.
As at June 30, 2019, the revolving credit facility was subject to the following financial covenants:
| | | | As at |
| Financial covenant | Limit | | Jun 30, 2019 | | Dec 31, 2018 |
| Consolidated total debt to consolidated EBITDA | Less than 4.0 | | 1.81 | | | 1.72 | |
| Consolidated total senior debt to consolidated EBITDA | Less than 3.5 | | 1.45 | | | 1.34 | |
| Consolidated EBITDA to consolidated interest expense | Greater than 2.5 | | 13.91 | | 14.57 |
The financial covenants include financial measures defined within the revolving credit facility agreement that are not defined under IFRS. These financial measures are defined by the revolving credit facility agreement as follows:
| • | Consolidated total debt: Includes all amounts classified as “Long-term debt” and “Lease obligations” (including the current portion included within "Accounts payable and accrued liabilities" but excluding operating leases as defined under IAS 17) on the balance sheet. |
| • | Consolidated total senior debt: Defined as consolidated total debt excluding unsecured and subordinated debt. |
| • | Consolidated EBITDA: Defined as consolidated net earnings before interest, income taxes, depreciation, accretion and certain other non-cash items, adjusted for the impact of the acquisition of a material subsidiary. |
| • | Consolidated total interest expense: Includes all amounts classified as "Interest expense", but excluding interest on operating leases as defined under IAS 17. |
Vermilion Energy Inc. ■ Page 61 ■ 2019 Second Quarter Report
As at June 30, 2019 and 2018, Vermilion was in compliance with the above covenants.
Senior unsecured notes
On March 13, 2017, Vermilion issued US $300.0 million of senior unsecured notes at par (the "Senior Unsecured Notes"). The notes bear interest at a rate of 5.625% per annum, to be paid semi-annually on March 15 and September 15. The notes mature on March 15, 2025. As direct senior unsecured obligations of Vermilion, the notes rank equally with existing and future senior unsecured indebtedness of the Company.
The senior unsecured notes were recognized at amortized cost and include the transaction costs directly related to the issuance.
Vermilion may, at its option, redeem the notes prior to maturity as follows:
| • | Prior to March 15, 2020, Vermilion may redeem up to 35% of the original principal amount of the senior unsecured notes with the proceeds of certain equity offerings by the Company at a redemption price of 105.625% of the principal amount plus any accrued and unpaid interest to the applicable redemption date. |
| • | Prior to March 15, 2020, Vermilion may redeem some or all of the senior unsecured notes at a price equal to 100% of the principal amount of the senior unsecured notes, plus an applicable premium and any accrued and unpaid interest. |
| • | On or after March 15, 2020, Vermilion may redeem some or all of the senior unsecured notes at the redemption prices set forth in the following table plus any accrued and unpaid interest. |
| Year | | Redemption price |
| 2020 | | 104.219 | % |
| 2021 | | 102.813 | % |
| 2022 | | 101.406 | % |
| 2023 and thereafter | | 100.000 | % |
Cross currency interest rate swaps
On June 12, 2019, Vermilion entered into a series of cross currency interest rate swaps with a syndicate of banks. As further described below, Vermilion applied hedge accounting to these derivative instruments. The cross currency interest rate swaps mature March 15, 2025 and include regular cash receipts and payments on March 15 and September 15 of each year. On a net basis, the cross currency interest swaps result in Vermilion receiving US dollar interest and principal amounts equal to the interest and principal payments under the US $300.0 million of senior unsecured notes. In exchange, Vermilion will make interest and principal payments equal to €265.0 million at a rate of 3.275%.
The cross currency interest rate swaps were executed as two separate sets of instruments:
| • | US dollar to Canadian dollar ("USD-to-CAD") cross currency interest rate swaps: Vermilion receives cross receives US dollar interest and principal amounts equal to US$300.0 million of debt at 5.625% interest and pays Canadian dollar interest and principal amounts equal to $398.5 million of debt at 5.40% interest. |
| • | Canadian dollar to Euro ("CAD-to-EUR") cross currency interest rate swaps: Vermilion receives Canadian dollar interest and principal amounts equal to $398.5 million of debt at 5.40% interest and pays Euro interest and principal amounts equal to €265.0 million at a rate of 3.275%. |
The USD-to-CAD cross currency interest swaps have been designated as the hedging instrument in a cash flow hedge to mitigate the risk of the fluctuation of interest and principal cash flows due to changes in foreign currency rates related to the Senior Unsecured Notes described above. The forward element of the swap contract is treated as the excluded component and is initially recognized within other comprehensive income. The excluded component is amortized to net earnings in interest expense on a systematic basis. As the timing and amount of the cash flows received on the USD-to-CAD cross currency interest rate swaps offset the timing and amount of the cash flows paid on the Senior Unsecured Notes, the economic relationship is expected to be highly effective. The change in the value of the hedged item associated with a change in spot foreign exchange rates is initially recognized in other comprehensive income. This change is reclassified from other comprehensive income to net earnings (and recorded as an foreign exchange gain or loss) to offset the associated foreign exchange gain or loss recognized on the Senior Unsecured Notes.
The CAD-to-EUR cross currency interest rate swaps have been designated as the hedging instrument in a net investment hedge to mitigate the effective change in exchange rates on our net investments in Euro denominated foreign subsidiaries. The change in the value of the hedged item associated with a change in spot foreign exchange rates is initially recognized in other comprehensive income. This change is reclassified from other comprehensive income to net earnings (and recorded as a foreign exchange gain or loss) only if the net investment is disposed of by sale. The forward element of the swap contract is treated as the excluded component and is initially recognized within other comprehensive income. The excluded component is amortized to net earnings in interest expense on a systematic basis.
Vermilion Energy Inc. ■ Page 62 ■ 2019 Second Quarter Report
The following table reconciles the change in Vermilion’s shareholders’ capital:
| | 2019 |
| Shareholders’ Capital | Shares ('000s) | | Amount |
| Balance at January 1 | 152,704 | | | 4,008,828 | |
| Shares issued for the Dividend Reinvestment Plan | 508 | | | 15,877 | |
| Vesting of equity based awards | 1,223 | | | 45,636 | |
| Shares issued for equity based compensation | 354 | | | 11,696 | |
| Share-settled dividends on vested equity based awards | 243 | | | 7,987 | |
| Balance at June 30 | 155,032 | | | 4,090,024 | |
Dividends declared to shareholders for the six months ended June 30, 2019 were $212.4 million (2018 - $177.6 million).
Subsequent to the end of the period and prior to the condensed consolidated interim financial statements being authorized for issue, Vermilion declared dividends of $35.7 million or $0.23 per share.
Vermilion defines capital as net debt (long-term debt plus net working capital) and shareholders’ capital. In managing capital, Vermilion reviews whether fund flows from operations is sufficient to fund capital expenditures, dividends, and asset retirement obligations.
The following table calculates Vermilion’s ratio of net debt to annualized fund flows from operations:
| | Three Months Ended | | Six Months Ended |
| | Jun 30, 2019 | | Jun 30, 2018 | | Jun 30, 2019 | | Jun 30, 2018 |
| Long-term debt | 1,893,135 | | | 1,605,561 | | | 1,893,135 | | | 1,605,561 | |
| Current liabilities | 375,944 | | | 510,808 | | | 375,944 | | | 510,808 | |
| Current assets | (318,570 | ) | | (319,562 | ) | | (318,570 | ) | | (319,562 | ) |
| Net debt | 1,950,509 | | | 1,796,807 | | | 1,950,509 | | | 1,796,807 | |
| | | | | | | | |
| Ratio of net debt to annualized fund flows from operations | 2.19 | | | 2.30 | | | 2.05 | | | 2.53 | |
Vermilion Energy Inc. ■ Page 63 ■ 2019 Second Quarter Report
| 11. Financial instruments |
The following table summarizes the increase (positive values) or decrease (negative values) to net earnings before tax due to a change in the value of Vermilion’s financial instruments as a result of a change in the relevant market risk variable. This analysis does not attempt to reflect any interdependencies between the relevant risk variables.
| | Jun 30, 2019 |
| Currency risk - Euro to Canadian dollar | |
| $0.01 increase in strength of the Canadian dollar against the Euro | (2,219 | ) |
| $0.01 decrease in strength of the Canadian dollar against the Euro | 2,219 | |
| | |
| Currency risk - US dollar to Canadian dollar | |
| $0.01 increase in strength of the Canadian dollar against the US $ | 100 | |
| $0.01 decrease in strength of the Canadian dollar against the US $ | (100 | ) |
| | |
| Commodity price risk - Crude oil | |
| US $5.00/bbl increase in crude oil price used to determine the fair value of derivatives | (14,437 | ) |
| US $5.00/bbl decrease in crude oil price used to determine the fair value of derivatives | 23,730 | |
| | |
| Commodity price risk - European natural gas | |
| €0.5/GJ increase in European natural gas price used to determine the fair value of derivatives | (25,590 | ) |
€0.5/GJ decrease in European natural gas price used to determine the fair value of derivatives | 23,685 | |
Vermilion Energy Inc. ■ Page 64 ■ 2019 Second Quarter Report
DIRECTORS Lorenzo Donadeo1 Calgary, Alberta Larry J. Macdonald2, 4, 6, 8 Chairman & CEO, Point Energy Ltd. Calgary, Alberta Carin Knickel6, 8, 12 Golden, Colorado Stephen P. Larke4, 6, 12 Calgary, Alberta Loren M. Leiker10 McKinney, Texas Timothy R. Marchant7, 10, 11 Calgary, Alberta Anthony Marino Calgary, Alberta Robert Michaleski4, 5 Calgary, Alberta William Roby8, 9, 12 Katy, Texas Catherine L. Williams3, 6 Calgary, Alberta 1Chairman of the Board 2Lead Director 3Audit Committee Chair (Independent) 4Audit Committee Member 5Governance and Human Resources Committee Chair__(Independent) 6Governance and Human Resources Committee Member 7Health, Safety and Environment Committee Chair__(Independent) 8Health, Safety and Environment Committee Member 9Independent Reserves Committee Chair (Independent) 10Independent Reserves Committee Member 11 Sustainability Committee Chair (Independent) 12 Sustainability Committee Member | OFFICERS AND KEY PERSONNEL CANADA Anthony Marino President & Chief Executive Officer Lars Glemser Vice President & Chief Financial Officer Mona Jasinski Executive Vice President, People and Culture Michael Kaluza Executive Vice President & Chief Operating Officer Dion Hatcher Vice President Canada Business Unit Terry Hergott Vice President Marketing Kyle Preston Vice President Investor Relations Jenson Tan Vice President Business Development Daniel Goulet Director Corporate HSE Jeremy Kalanuk Director Operations Accounting Bryce Kremnica Director Field Operations - Canada Business Unit Steve Reece Director Information Technology & Information Systems Tom Rafter Director Land - Canada Business Unit Robert (Bob) J. Engbloom Corporate Secretary UNITED STATES Scott Seatter Managing Director - U.S. Business Unit Timothy R. Morris Director U.S. Business Development - U.S. Business Unit EUROPE Gerard Schut Vice President European Operations Sylvain Nothhelfer Managing Director - France Business Unit Sven Tummers Managing Director - Netherlands Business Unit Bill Liutkus Managing Director - Germany Business Unit Darcy Kerwin Managing Director - Ireland Business Unit Bryan Sralla Managing Director - Central & Eastern Europe Business Unit AUSTRALIA Bruce D. Lake Managing Director - Australia Business Unit | AUDITORS Deloitte LLP Calgary, Alberta BANKERS The Toronto-Dominion Bank Bank of Montreal Canadian Imperial Bank of Commerce Export Development Canada National Bank of Canada Royal Bank of Canada The Bank of Nova Scotia Wells Fargo Bank N.A., Canadian Branch HSBC Bank Canada Bank of America N.A., Canada Branch Citibank N.A., Canadian Branch - Citibank Canada JPMorgan Chase Bank, N.A., Toronto Branch La Caisse Centrale Desjardins du Québec Alberta Treasury Branches Canadian Western Bank Goldman Sachs Lending Partners LLC Barclays Bank PLC EVALUATION ENGINEERS GLJ Petroleum Consultants Ltd. Calgary, Alberta LEGAL COUNSEL Norton Rose Fulbright Canada LLP Calgary, Alberta TRANSFER AGENT Computershare Trust Company of Canada STOCK EXCHANGE LISTINGS The Toronto Stock Exchange (“VET”) The New York Stock Exchange (“VET”) INVESTOR RELATIONS Kyle Preston Vice President Investor Relations 403-476-8431 TEL 403-476-8100 FAX 1-866-895-8101 IR TOLL FREE investor_relations@vermilionenergy.com |
Vermilion Energy Inc. ■ Page 65 ■ 2019 Second Quarter Report