Exhibit 99.1

Front Cover Theme
As illustrated by the front cover photo, we give together through our Days of Caring. Throughout the company, our staff volunteer to support social and environmental agencies we’ve partnered with in the communities where we operate.
Here, Vermilion has partnered with the Nature Conservancy of Canada (NCC), one of Canada's leading national conservation organizations. In 2016 and 2019, a group of Vermilion volunteers from our Canada Business Unit tackled projects like trail clearing and sign installation at the Coyote Lake Nature Sanctuary, which is a popular hiking destination near our operations in Drayton Valley, Alberta. This work helped to ensure a safe and enjoyable experience for visitors, and contributed to the safety of local wildlife.
NCC focuses on protecting the natural areas that sustain Canada's plants and wildlife by securing properties, and managing them for the long term. To date, NCC and its partners have helped to conserve more than 35 million acres of ecologically significant land from coast to coast.
Through programs like this, Vermilion is proud to have invested over $7.4 million and 10,800 hours of volunteer time in strategic community partnerships over the past five years.
Disclaimer
Certain statements included or incorporated by reference in this document may constitute forward looking statements or financial outlooks under applicable securities legislation. Such forward looking statements or information typically contain statements with words such as "anticipate", "believe", "expect", "plan", "intend", "estimate", "propose", "project", or similar words suggesting future outcomes or statements regarding an outlook. Forward looking statements or information in this document may include, but are not limited to: capital expenditures; business strategies and objectives; operational and financial performance; estimated reserve quantities and the discounted net present value of future net revenue from such reserves; petroleum and natural gas sales; future production levels (including the timing thereof) and rates of average annual production growth; exploration and development plans; acquisition and disposition plans and the timing thereof; operating and other expenses, including the payment and amount of future dividends; royalty and income tax rates; and the timing of regulatory proceedings and approvals.
Such forward looking statements or information are based on a number of assumptions, all or any of which may prove to be incorrect. In addition to any other assumptions identified in this document, assumptions have been made regarding, among other things: the ability of Vermilion to obtain equipment, services and supplies in a timely manner to carry out its activities in Canada and internationally; the ability of Vermilion to market crude oil, natural gas liquids, and natural gas successfully to current and new customers; the timing and costs of pipeline and storage facility construction and expansion and the ability to secure adequate product transportation; the timely receipt of required regulatory approvals; the ability of Vermilion to obtain financing on acceptable terms; foreign currency exchange rates and interest rates; future crude oil, natural gas liquids, and natural gas prices; and management’s expectations relating to the timing and results of exploration and development activities.
Although Vermilion believes that the expectations reflected in such forward looking statements or information are reasonable, undue reliance should not be placed on forward looking statements because Vermilion can give no assurance that such expectations will prove to be correct. Financial outlooks are provided for the purpose of understanding Vermilion’s financial position and business objectives, and the information may not be appropriate for other purposes. Forward looking statements or information are based on current expectations, estimates, and projections that involve a number of risks and uncertainties which could cause actual results to differ materially from those anticipated by Vermilion and described in the forward looking statements or information. These risks and uncertainties include, but are not limited to: the ability of management to execute its business plan; the risks of the oil and gas industry, both domestically and internationally, such as operational risks in exploring for, developing and producing crude oil, natural gas liquids, and natural gas; risks and uncertainties involving geology of crude oil, natural gas liquids, and natural gas deposits; risks inherent in Vermilion's marketing operations, including credit risk; the uncertainty of reserves estimates and reserves life and estimates of resources and associated expenditures; the uncertainty of estimates and projections relating to production and associated expenditures; potential delays or changes in plans with respect to exploration or development projects; Vermilion's ability to enter into or renew leases on acceptable terms; fluctuations in crude oil, natural gas liquids, and natural gas prices, foreign currency exchange rates and interest rates; health, safety, and environmental risks; uncertainties as to the availability and cost of financing; the ability of Vermilion to add production and reserves through exploration and development activities; the possibility that government policies or laws may change or governmental approvals may be delayed or withheld; uncertainty in amounts and timing of royalty payments; risks associated with existing and potential future law suits and regulatory actions against Vermilion; and other risks and uncertainties described elsewhere in this document or in Vermilion's other filings with Canadian securities regulatory authorities.
The forward looking statements or information contained in this document are made as of the date hereof and Vermilion undertakes no obligation to update publicly or revise any forward looking statements or information, whether as a result of new information, future events, or otherwise, unless required by applicable securities laws.
This document contains metrics commonly used in the oil and gas industry. These oil and gas metrics do not have any standardized meaning or standard methods of calculation and therefore may not be comparable to similar measures presented by other companies where similar terminology is used and should therefore not be used to make comparisons. Natural gas volumes have been converted on the basis of six thousand cubic feet of natural gas to one barrel of oil equivalent. Barrels of oil equivalent (boe) may be misleading, particularly if used in isolation. A boe conversion ratio of six thousand cubic feet to one barrel of oil is based on an energy equivalency conversion method primarily applicable at the burner tip and does not represent a value equivalency at the wellhead.
Financial data contained within this document are reported in Canadian dollars, unless otherwise stated.
| Vermilion Energy Inc. ■ Page 1 ■ 2020 Second Quarter Report |
Abbreviations
| $M | thousand dollars |
| $MM | million dollars |
| AECO | the daily average benchmark price for natural gas at the AECO ‘C’ hub in Alberta |
| bbl(s) | barrel(s) |
| bbls/d | barrels per day |
| boe | barrel of oil equivalent, including: crude oil, condensate, natural gas liquids, and natural gas (converted on the basis of one boe for six mcf of natural gas) |
| boe/d | barrel of oil equivalent per day |
| GJ | gigajoules |
| LSB | light sour blend crude oil reference price |
| mbbls | thousand barrels |
| mcf | thousand cubic feet |
| mmcf/d | million cubic feet per day |
| NBP | the reference price paid for natural gas in the United Kingdom at the National Balancing Point Virtual Trading Point.
|
| NGLs | natural gas liquids, which includes butane, propane, and ethane |
| PRRT | Petroleum Resource Rent Tax, a profit based tax levied on petroleum projects in Australia |
| tCO2e | tonnes of carbon dioxide equivalent |
| TTF | the price for natural gas in the Netherlands, quoted in megawatt hours of natural gas, at the Title Transfer Facility Virtual Trading Point |
| WTI | West Texas Intermediate, the reference price paid for crude oil of standard grade in US dollars at Cushing, Oklahoma |
| Vermilion Energy Inc. ■ Page 2 ■ 2020 Second Quarter Report |
Highlights
| • | Fund flows from operations ("FFO") in Q2 2020 was $82 million ($0.52/basic share(1)), a decrease of 52% from the prior quarter. The decrease is primarily due to significantly lower commodity prices as a result of the impact of the COVID-19 pandemic combined with the OPEC+ oil price war that ensued in early March. Lower commodity price impacts were partially offset by higher production and hedging gains, including a $25 million gain from unwinding our USD-to-EUR cross currency interest rate swap. |
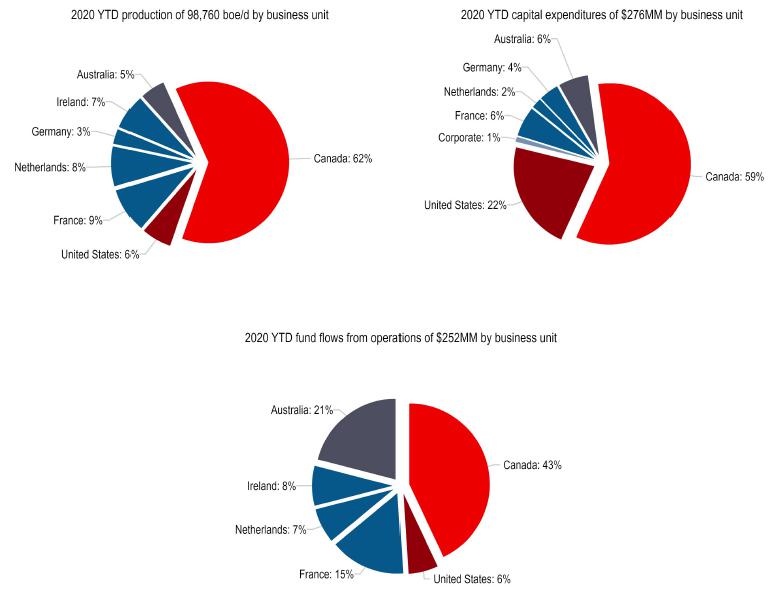
| • | Q2 2020 production averaged 100,366 boe/d, representing a 3% increase from the prior quarter. The increase was driven by production growth in Canada, the United States and Australia, partially offset by lower production in France due to COVID-19-related curtailments. |
| • | Production from our European business units averaged 25,173 boe/d in Q2 2020, a decrease of 13% or approximately 3,700 boe/d from the prior quarter. The decrease was primarily due to the curtailment of approximately 3,000 bbl/d of oil production in France due to the temporary shutdown of the Total-operated Grandpuits refinery during the COVID-19 confinement period. |
| • | Production from our North American business units averaged 69,895 boe/d in Q2 2020, an increase of 9% or approximately 5,700 boe/d from the prior quarter. The increase was driven by new well contributions from our active Q1 2020 drilling programs in Canada and the United States. Both our Canadian and United States business units achieved record quarterly production during Q2 2020. Despite highly volatile North American oil pricing in Q2 2020, we did not experience any material shut-ins due to uneconomic production. |
| • | In Australia, production averaged 5,299 bbl/d in Q2 2020, an increase of 31% quarter-over-quarter as production was fully restored on two wells that were temporarily offline in the prior quarter to install electric submersible pumps. |
| • | On May 25, 2020, Vermilion's Board of Directors appointed Lorenzo Donadeo as Executive Chairman and Curtis Hicks as President following the departure of Anthony Marino as President and Chief Executive Officer. Mr. Donadeo is one of the co-founders of Vermilion and has served as Chairman of the Board since March 1, 2016. Prior to this Mr. Donadeo was the Chief Executive Officer of Vermilion from 2003 to 2016. Mr. Hicks was previously the CFO of Vermilion from 2003 to 2018. |
| • | In lieu of filling the role of Chief Executive Officer, Vermilion re-established an Executive Committee consisting of a minimum of five senior executives from within the Company with a mandate to review and approve key organizational, financial, operational and strategic decisions. |
| • | In June 2020, Vermilion received a rating of "AA" on a scale of AAA (leader) to CCC (laggard) in the MSCI ESG Ratings(2) assessment, which reflects exposure to industry-specific ESG risks and the ability to manage those risks. This consistent rating from 2019 continues to reflect Vermilion's commitment to improving company ESG performance and enhanced disclosure on topics relevant to MSCI's detailed assessment process. |
| (1) | Non-GAAP Financial Measure. Please see the “Non-GAAP Financial Measures” section of the accompanying Management’s Discussion and Analysis. |
| (2) | The use by Vermilion Energy Inc of any MSCI ESG Research LLC or its affiliates (“MSCI”) data, and the use of MSCI logos, trademarks, service marks or index names herein, do not constitute a sponsorship, endorsement, recommendation, or promotion of Vermilion by MSCI. MSCI services and data are the property of MSCI or its information providers, and are provided ‘as-is’ and without warranty. MSCI names and logos are trademarks or service marks of MSCI. |
| Vermilion Energy Inc. ■ Page 3 ■ 2020 Second Quarter Report |
| ($M except as indicated) | Q2 2020 | Q1 2020 | Q2 2019 | YTD 2020 | YTD 2019 | |||||
| Financial | ||||||||||
| Petroleum and natural gas sales | 193,013 | 328,314 | 428,043 | 521,327 | 909,126 | |||||
| Fund flows from operations | 81,852 | 170,225 | 222,738 | 252,077 | 476,310 | |||||
| Fund flows from operations ($/basic share) (1) | 0.52 | 1.09 | 1.44 | 1.60 | 3.10 | |||||
| Fund flows from operations ($/diluted share) (1) | 0.52 | 1.09 | 1.42 | 1.60 | 3.07 | |||||
| Net earnings (loss) | (71,290 | ) | (1,318,504 | ) | 2,004 | (1,389,794 | ) | 41,551 | ||
| Net earnings (loss) ($/basic share) | (0.45 | ) | (8.42 | ) | 0.01 | (8.83 | ) | 0.27 | ||
| Capital expenditures | 42,274 | 233,704 | 92,607 | 275,978 | 294,660 | |||||
| Acquisitions | 2,932 | 11,337 | 8,623 | 14,269 | 24,650 | |||||
| Asset retirement obligations settled | 970 | 3,732 | 4,907 | 4,702 | 8,504 | |||||
| Cash dividends ($/share) | — | 0.575 | 0.690 | 0.575 | 1.380 | |||||
| Dividends declared | — | 90,067 | 106,884 | 90,067 | 212,433 | |||||
| % of fund flows from operations | — | % | 53 | % | 48 | % | 36 | % | 45 | % |
| Net dividends (1) | — | 82,422 | 98,111 | 81,790 | 196,556 | |||||
| % of fund flows from operations | — | % | 48 | % | 44 | % | 32 | % | 41 | % |
| Payout (1) | 42,612 | 319,858 | 195,625 | 362,470 | 499,720 | |||||
| % of fund flows from operations | 52 | % | 188 | % | 88 | % | 144 | % | 105 | % |
| Net debt | 2,161,442 | 2,155,623 | 1,950,509 | 2,161,442 | 1,950,509 | |||||
| Net debt to four quarter trailing fund flows from operations | 3.16 | 2.61 | 1.91 | 3.16 | 1.91 | |||||
| Operational | ||||||||||
| Production | ||||||||||
| Crude oil and condensate (bbls/d) | 45,041 | 44,881 | 48,964 | 44,961 | 49,072 | |||||
| NGLs (bbls/d) | 9,588 | 8,022 | 8,107 | 8,805 | 8,002 | |||||
| Natural gas (mmcf/d) | 274.42 | 265.51 | 275.60 | 269.96 | 276.77 | |||||
| Total (boe/d) | 100,366 | 97,154 | 103,003 | 98,760 | 103,203 | |||||
| Average realized prices | ||||||||||
| Crude oil and condensate ($/bbl) | 34.90 | 58.66 | 79.46 | 47.20 | 76.36 | |||||
| NGLs ($/bbl) | 8.94 | 8.92 | 11.25 | 8.94 | 16.76 | |||||
| Natural gas ($/mcf) | 1.85 | 2.94 | 3.09 | 2.39 | 4.09 | |||||
| Production mix (% of production) | ||||||||||
| % priced with reference to WTI | 41 | % | 39 | % | 38 | % | 40 | % | 37 | % |
| % priced with reference to Dated Brent | 14 | % | 17 | % | 18 | % | 16 | % | 19 | % |
| % priced with reference to AECO | 29 | % | 27 | % | 26 | % | 28 | % | 26 | % |
| % priced with reference to TTF and NBP | 16 | % | 17 | % | 18 | % | 16 | % | 18 | % |
| Netbacks ($/boe) | ||||||||||
| Operating netback (1) | 12.49 | 22.02 | 29.62 | 17.25 | 30.57 | |||||
| Fund flows from operations netback | 9.08 | 18.85 | 24.15 | 13.96 | 25.46 | |||||
| Operating expenses | 11.00 | 13.41 | 11.04 | 12.21 | 11.99 | |||||
| General and administration expenses | 1.88 | 1.47 | 1.70 | 1.67 | 1.54 | |||||
| Average reference prices | ||||||||||
| WTI (US $/bbl) | 27.85 | 46.17 | 59.81 | 37.01 | 57.36 | |||||
| Edmonton Sweet index (US $/bbl) | 21.71 | 38.59 | 55.19 | 30.15 | 52.62 | |||||
| Saskatchewan LSB index (US $/bbl) | 21.60 | 38.41 | 55.54 | 30.01 | 53.19 | |||||
| Dated Brent (US $/bbl) | 29.20 | 50.26 | 68.82 | 39.73 | 66.01 | |||||
| AECO ($/mcf) | 1.99 | 2.03 | 1.03 | 2.01 | 1.83 | |||||
| NBP ($/mcf) | 2.26 | 4.32 | 5.44 | 3.31 | 6.89 | |||||
| TTF ($/mcf) | 2.39 | 4.23 | 5.75 | 3.32 | 6.94 | |||||
| Average foreign currency exchange rates | ||||||||||
| CDN $/US $ | 1.39 | 1.34 | 1.34 | 1.37 | 1.33 | |||||
| CDN $/Euro | 1.53 | 1.48 | 1.50 | 1.50 | 1.51 | |||||
| Share information ('000s) | ||||||||||
| Shares outstanding - basic | 158,307 | 157,020 | 155,032 | 158,307 | 155,032 | |||||
| Shares outstanding - diluted (1) | 164,090 | 160,425 | 158,633 | 164,090 | 158,633 | |||||
| Weighted average shares outstanding - basic | 158,189 | 156,562 | 154,795 | 157,375 | 153,855 | |||||
| Weighted average shares outstanding - diluted (1) | 158,189 | 156,562 | 156,844 | 157,375 | 155,335 | |||||
| (1) | The above table includes non-GAAP financial measures which may not be comparable to other companies. Please see the “Non-GAAP Financial Measures” section of the accompanying Management’s Discussion and Analysis. |
| Vermilion Energy Inc. ■ Page 4 ■ 2020 Second Quarter Report |
Message to Shareholders
The second quarter of 2020 was an extremely challenging period for the oil and gas sector. Demand destruction caused by the COVID-19 pandemic resulted in unprecedented negative oil prices for the WTI benchmark as global inventories swelled. Despite these challenges, we were able to manage our business effectively through this cycle, with relatively little operational impact from COVID-19. We successfully adapted our work procedures to ensure operational safety and business continuity in all of our operating regions, and to-date we have not had any confirmed cases of COVID-19 amongst our staff, with only minor production impacts related to the pandemic. We believe this is a reflection of the commitment to Vermilion of our skilled and dedicated staff.
We delivered strong operational results in Q2 2020. Production averaged 100,366 boe/d representing a 3% increase from the prior quarter. Most of this increase came from our North American business units where we benefited from new production coming online following an active and successful Q1 2020 drilling program. Both our Canadian and United States business units achieved record quarterly production during Q2 2020. This growth in North American production volumes more than offset approximately 3,000 bbl/d of curtailed oil production in France that was temporarily shut-in due to a local refinery being offline during the COVID-19 confinement period. The refinery has recently restarted and we are in the process of restoring our production in France.
As a result of the lower commodity prices during Q2 2020, FFO decreased 52% quarter-over-quarter to $82 million ($0.52/basic share(1)). However, with minimal capital investment of $42 million, we generated approximately $40 million of free cash flow and achieved a total payout ratio of 52%, including reclamation and abandonment spending. We ended the second quarter with net debt of $2.2 billion and approximately $350 million of liquidity on our covenant-based credit facility. Our facility is termed out until May 2024 and we remain in compliance on all debt covenants. Capital activity for the balance of the year will be minimal and focused predominantly on maintenance activity.
During the quarter, we also made several leadership changes in an effort to realign the Company with Vermilion’s long-standing core business principles, which are based on a conservative, long-term focus on balance sheet strength and capital discipline to generate strong returns. The five core principles include: maintaining a strong balance sheet with low leverage; managing a total payout ratio of less than 100%; consistently delivering results that meet or exceed expectations, protecting equity to minimize dilution; and maintaining a strong corporate culture. These principles were implemented when Vermilion started paying a distribution as an energy trust in 2003 and have served the Company well over its history.
Along with the change in leadership we have also re-established an Executive Committee, which is a management structure that was successfully utilized by Vermilion in the past. This management structure has proved to be a highly collaborative decision-making model that draws upon the collective knowledge, experience, business acumen and skills of the senior management team.
As we move forward, our first priority will be to ensure the continued health and safety of our employees and business continuity as we navigate through COVID-19. With the cost reductions we have made to-date, our business is free cash flow positive in the current commodity price environment. Our top financial priority at this time is debt reduction with an ultimate target of achieving a debt-to-cash flow ratio of less than 1.5x. Achieving this target will not happen overnight, and we will take a long-term, patient approach to managing the business and improving the balance sheet.
We recently kicked-off our 2021 capital budget process with this long-term view in the fore. Our plans for the rest of this year and next will be guided by our core business principles, focusing on free cash flow generation and debt reduction rather than top-line production growth. In due course, we will review our shareholder return policy to determine the appropriate time to reinstate a dividend and/or buyback shares. We are proud to have delivered over $40 per share in dividends to our shareholders over the past 17 years and we believe returning capital to shareholders is a key component in generating long-term shareholder returns. Although we do not expect the road ahead to be without challenges, we believe our renewed focus on these core business principles will help guide Vermilion through these difficult times and position the Company for long-term value creation.
| Q2 2020 Operations Review |
Europe
Production from our European business units averaged 25,173 boe/d in Q2 2020, a decrease of 13% or approximately 3,700 boe/d from the prior quarter. The decrease was primarily due to the curtailment of approximately 3,000 bbl/d of oil production in France due to the temporary shutdown of the Total-operated Grandpuits refinery during the COVID-19 confinement period. Natural decline and minor unplanned downtime in Ireland accounted for the balance of the decrease.
The Grandpuits refinery resumed operations in mid-June and we are in the process of restoring our curtailed production in France, along with resuming our 2020 workover program which was put on hold during the COVID-19 confinement period. In the Netherlands, we recently received the final production permit for the Weststellingwerf (0.5 net) well and expect to bring this well on production during the second half of 2020. During the second quarter we deferred a planned turnaround in Ireland due to the COVID-19 restrictions and now plan to complete this turnaround in Q3 2020, which will result in the Corrib project being offline for approximately three weeks.
| Vermilion Energy Inc. ■ Page 5 ■ 2020 Second Quarter Report |
North America
Production from our North American business units averaged 69,895 boe/d in Q2 2020, an increase of 9% or approximately 5,700 boe/d from the prior quarter. The increase was due to new well contributions from our active Q1 2020 drilling programs in Canada and the United States. In Canada, we brought five (5.0 net) wells on production in Alberta and eleven (5.5 net) wells on production in Saskatchewan during the second quarter. In the United States, we completed and brought on production the remaining six (6.0 net) wells of our nine (8.9 net) well program. Despite highly volatile North American oil pricing in Q2 2020, we did not experience any material shut-ins of uneconomic production.
During the quarter, we focused on various cost-saving initiatives across the Canadian and United States business units and have identified many capital, operating and general and administrative efficiencies to-date. In the United States, we were able to reduce completion costs of the final six wells by approximately 15% from the first three (2.9 net) wells due to increased operational efficiencies, as well as the utilization of multi-well pads. We have completed our North American drilling program for 2020 and will focus on maintenance activities for the balance of the year. As a result, we expect production from both business units to decline over the second half of the year as no new well drilling activity is planned.
Australia
In Australia, production averaged 5,299 bbl/d in Q2 2020, an increase of 31% quarter-over-quarter as production was fully restored on two wells that were temporarily offline in the prior quarter to install electric submersible pumps. Production also benefited from the absence of cyclone activity in the quarter, which caused several days of unplanned downtime in Q1 2020. We continued to realize strong pricing for our Wandoo crude due to its low sulphur content, averaging a premium of C$21 per barrel above Dated Brent during Q2 2020. The demand for this blend of crude has increased under the new IMO 2020 regulations, which require marine vessels to either install sulphur scrubbers or run low sulphur fuel oil.
Commodity Hedging
Vermilion hedges to manage commodity price exposures and increase the stability of our cash flows. In aggregate, as of July 24, 2020, we have 50% of our expected net-of-royalty production hedged for the second half of 2020. With respect to individual commodity products, we have hedged 87% of our European natural gas production, 27% of our oil production, and 69% of our North American natural gas volumes for the second half of 2020, respectively. Please refer to the Hedging section of our website under Invest With Us for further details.
Sustainability
In June 2020, Vermilion received a rating of "AA" on a scale of AAA (leader) to CCC (laggard) in the MSCI ESG Ratings(2) assessment, which reflects exposure to industry-specific ESG risks and the ability to manage those risks. MSCI ESG Research provides in-depth research, ratings and analysis of the ESG-related business practices of thousands of companies worldwide. This consistent rating from 2019 continues to reflect Vermilion's commitment to improving company ESG performance and enhanced disclosure on topics relevant to MSCI's detailed assessment process.
Organizational Update
On May 25, 2020, Vermilion announced that Anthony Marino stepped down as President and Chief Executive Officer and as a director of the Company, effective immediately. In conjunction with Mr. Marino's departure, the Board also announced the appointments of Lorenzo Donadeo as Executive Chairman and the Curtis Hicks as President.
Mr. Donadeo has 39 years of experience in the oil and gas industry. He was a co-founder of Vermilion in 1994 and has served as Chairman of the Board since March 1, 2016. From 2014 to 2016, Mr. Donadeo served as the Chief Executive Officer. From 2003 to 2014, he served as President and Chief Executive Officer and from 1996 to 2003 he served as Vermilion’s Executive Vice President and Chief Operating Officer. Mr. Donadeo has a Bachelor of Science degree in Mechanical Engineering (with distinction) from the University of Alberta.
Mr. Hicks has 37 years of experience in the oil and gas industry. Most recently, he was Executive Vice-President and Chief Financial Officer of Vermilion from 2003 to 2018 and was a key contributor to Vermilion's success and culture during his tenure. Mr. Hicks is a Chartered Professional Accountant and has a Bachelor of Commerce degree (with distinction) from the University of Saskatchewan.
Vermilion has a philosophy of staff development and internal promotion. In line with this approach, we are pleased to announce that Darcy Kerwin, currently Managing Director for our Ireland Business Unit (IBU), will be returning to Canada to take the role of Vice President, Strategic Planning, effective September 1, 2020. Mr. Kerwin has over 23 years of industry experience, with a focus on engineering and production operations in North America, West Africa, Australia, and Europe. Prior to joining Vermilion, Mr. Kerwin held a variety of engineering and project management roles with Chevron in Canada, Houston and Nigeria. In 2005, Mr. Kerwin joined Vermilion as the Interim General Manager of our Australia Business Unit (ABU). After his assignment in Australia, he spent five years in the France Business Unit (FBU), leading facilities engineering and asset integrity functions before returning to Canada in 2011 as the Facilities Engineering Manager. Mr. Kerwin returned to France in March 2014 as the Managing Director, FBU and for the last two and a half years, he has been successfully leading the IBU as Managing Director.
| Vermilion Energy Inc. ■ Page 6 ■ 2020 Second Quarter Report |
Ryan Carty, currently Operations Manager, Australia Business Unit, has been promoted to the position of Managing Director, IBU, also effective September 1, 2020. Mr. Carty has over 18 years of engineering and operations experience, working in positions with increasing leadership responsibility at BHP, ENI, Chevron and Origin Energy, prior to joining Vermilion in 2014. As Operations Manager in Australia, Mr. Carty has been responsible for the management of the Wandoo operation, including production, health, safety and environment, and overseeing all aspects of capital and operating activity. We look forward to Mr. Carty's leadership in further advancing Vermilion's track record as a community partner and responsible operator of essential domestic natural gas production in Ireland.
| (Signed “Lorenzo Donadeo”) | (Signed “Curtis Hicks”) | |
| Lorenzo Donadeo | Curtis Hicks | |
| Executive Chairman | President | |
| July 24, 2020 | July 24, 2020 |
| (1) | Non-GAAP Financial Measure. Please see the “Non-GAAP Financial Measures” section of the accompanying Management’s Discussion and Analysis. |
| (2) | The use by Vermilion Energy Inc of any MSCI ESG Research LLC or its affiliates (“MSCI”) data, and the use of MSCI logos, trademarks, service marks or index names herein, do not constitute a sponsorship, endorsement, recommendation, or promotion of Vermilion by MSCI. MSCI services and data are the property of MSCI or its information providers, and are provided ‘as-is’ and without warranty. MSCI names and logos are trademarks or service marks of MSCI. |
| Vermilion Energy Inc. ■ Page 7 ■ 2020 Second Quarter Report |
Management's Discussion and Analysis
The following is Management’s Discussion and Analysis (“MD&A”), dated July 24, 2020, of Vermilion Energy Inc.’s (“Vermilion”, “we”, “our”, “us” or the “Company”) operating and financial results as at and for the three and six months ended June 30, 2020 compared with the corresponding periods in the prior year.
This discussion should be read in conjunction with the unaudited condensed consolidated interim financial statements for the three and six months ended June 30, 2020 and the audited consolidated financial statements for the years ended December 31, 2019 and 2018, together with the accompanying notes. Additional information relating to Vermilion, including its Annual Information Form, is available on SEDAR at www.sedar.com or on Vermilion’s website at www.vermilionenergy.com.
The unaudited condensed consolidated interim financial statements for the three and six months ended June 30, 2020 and comparative information have been prepared in Canadian dollars, except where another currency has been indicated, and in accordance with IAS 34, "Interim Financial Reporting", as issued by the International Accounting Standards Board ("IASB").
This MD&A includes references to certain financial and performance measures which do not have standardized meanings prescribed by International Financial Reporting Standards ("IFRS"). These measures include:
| • | Fund flows from operations: Fund flows from operations is a measure of profit or loss in accordance with IFRS 8 “Operating Segments”. Please see "Segmented Information" in the "Notes to the Condensed Consolidated Interim Financial Statements" for a reconciliation of fund flows from operations to net earnings. We analyze fund flows from operations both on a consolidated basis and on a business unit basis in order to assess the contribution of each business unit to our ability to generate income necessary to pay dividends, repay debt, fund asset retirement obligations and make capital investments. |
| • | Net debt: Net debt is a capital management measure in accordance with IAS 1 "Presentation of Financial Statements". Net debt is comprised of long-term debt plus current liabilities less current assets and represents Vermilion's net financing obligations after adjusting for the timing of working capital fluctuations. Net debt excludes non-current lease obligations which are secured by a corresponding right-of-use asset. Please see "Capital disclosures" in the "Notes to the Condensed Consolidated Interim Financial Statements" for additional information. |
| • | Netbacks: Netbacks are per boe and per mcf performance measures used in the analysis of operational activities. We assess netbacks both on a consolidated basis and on a business unit basis in order to compare and assess the operational and financial performance of each business unit versus other business units and also versus third party crude oil and natural gas producers. |
In addition, this MD&A includes references to certain financial measures which are not specified, defined, or determined under IFRS and are therefore considered non-GAAP financial measures. These non-GAAP financial measures are unlikely to be comparable to similar financial measures presented by other issuers. For a full description of these non-GAAP financial measures and a reconciliation of these measures to their most directly comparable GAAP measures, please refer to “Non-GAAP Financial Measures”.
Condensate Presentation
We report our condensate production in Canada and the Netherlands business units within the crude oil and condensate production line. We believe that this presentation better reflects the historical and forecasted pricing for condensate, which is more closely correlated with crude oil pricing than with pricing for propane, butane, and ethane (collectively “NGLs” for the purposes of this report).
| Vermilion Energy Inc. ■ Page 8 ■ 2020 Second Quarter Report |
Guidance
On October 31, 2019, we released our 2020 capital budget and associated production guidance. On March 16, 2020, we announced a reduction of our 2020 capital budget and associated production guidance in response to a decrease in oil prices as a result of the novel coronavirus ("COVID-19") pandemic and the ensuing oil price war between OPEC+ members.
The following table summarizes our guidance:
| Date | Capital Expenditures ($MM) | Production (boe/d) | ||
| 2020 Guidance | ||||
| 2020 Guidance | October 31, 2019 | 450 | 100,000 to 103,000 | |
| 2020 Guidance | March 16, 2020 | 350 to 370 | 94,000 to 98,000 | |
| Vermilion Energy Inc. ■ Page 9 ■ 2020 Second Quarter Report |
Vermilion's Business
Vermilion is a Calgary, Alberta based international oil and gas producer focused on the acquisition, exploration, development, and optimization of producing properties in North America, Europe, and Australia. We manage our business through our Calgary head office and our international business unit offices. This MD&A separately discusses each of our business units in addition to our corporate segment.
| Vermilion Energy Inc. ■ Page 10 ■ 2020 Second Quarter Report |
Consolidated Results Overview
| Q2 2020 | Q1 2020 | Q2 2019 | Q2/20 vs. Q1/20 | Q2/20 vs. Q2/19 | YTD 2020 | YTD 2019 | 2020 vs. 2019 | ||||||
| Production | |||||||||||||
| Crude oil and condensate (bbls/d) | 45,041 | 44,881 | 48,964 | 0.4% | (8.0)% | 44,961 | 49,072 | (8.4)% | |||||
| NGLs (bbls/d) | 9,588 | 8,022 | 8,107 | 19.5% | 18.3% | 8,805 | 8,002 | 10.0% | |||||
| Natural gas (mmcf/d) | 274.42 | 265.51 | 275.60 | 3.4% | (0.4)% | 269.96 | 276.77 | (2.5)% | |||||
| Total (boe/d) | 100,366 | 97,154 | 103,003 | 3.3% | (2.6)% | 98,760 | 103,203 | (4.3)% | |||||
| Sales | |||||||||||||
| Crude oil and condensate (bbls/d) | 43,771 | 46,977 | 47,337 | (6.8)% | (7.5)% | 45,374 | 49,192 | (7.8)% | |||||
| NGLs (bbls/d) | 9,588 | 8,022 | 8,107 | 19.5% | 18.3% | 8,805 | 8,002 | 10.0% | |||||
| Natural gas (mmcf/d) | 274.42 | 265.51 | 275.60 | 3.4% | (0.4)% | 269.96 | 276.77 | (2.5)% | |||||
| Total (boe/d) | 99,096 | 99,250 | 101,377 | (0.2)% | (2.3)% | 99,173 | 103,323 | (4.0)% | |||||
| Build (draw) in inventory (mbbls) | 115 | (191 | ) | 149 | (76 | ) | (21 | ) | |||||
| Financial metrics | |||||||||||||
| Fund flows from operations ($M) | 81,852 | 170,225 | 222,738 | (51.9)% | (63.3)% | 252,077 | 476,310 | (47.1)% | |||||
| Per share ($/basic share) | 0.52 | 1.09 | 1.44 | (52.3)% | (63.9)% | 1.60 | 3.10 | (48.4)% | |||||
| Net (loss) earnings ($M) | (71,290 | ) | (1,318,504 | ) | 2,004 | (94.6)% | N/A | (1,389,794 | ) | 41,551 | N/A | ||
| Per share ($/basic share) | (0.45 | ) | (8.42 | ) | 0.01 | (94.7)% | N/A | (8.83 | ) | 0.27 | N/A | ||
| Net debt ($M) | 2,161,442 | 2,155,623 | 1,950,509 | 0.3% | 10.8% | 2,161,442 | 1,950,509 | 10.8% | |||||
| Cash dividends ($/share) | — | 0.575 | 0.690 | (100.0)% | (100.0)% | 0.575 | 1.380 | (58.3)% | |||||
| Activity | |||||||||||||
| Capital expenditures ($M) | 42,274 | 233,704 | 92,607 | (81.9)% | (54.4)% | 275,978 | 294,660 | (6.3)% | |||||
| Acquisitions ($M) | 2,932 | 11,337 | 8,623 | 14,269 | 24,650 | ||||||||
| Gross wells drilled | 2.00 | 87.00 | 35.00 | 89.00 | 101.00 | ||||||||
| Net wells drilled | 0.12 | 77.30 | 27.88 | 77.42 | 90.82 | ||||||||
Financial performance review
|
Q2 2020 vs. Q1 2020
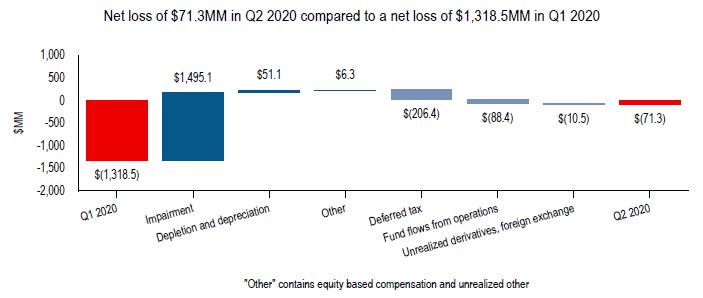
| • | We recorded a net loss in Q2 2020 of $71.3 million ($0.45/basic share) compared to a net loss of $1,318.5 million ($8.42/basic share) in Q1 2020. This quarter-over-quarter decrease in net loss was primarily driven by lower impairment charges. We recorded $53.1 million of impairment (net of $16.6 million income tax recovery) in Q2 2020 and $1.2 billion of impairment (net of $0.4 billion income tax recovery) in Q1 2020. |
| Vermilion Energy Inc. ■ Page 11 ■ 2020 Second Quarter Report |
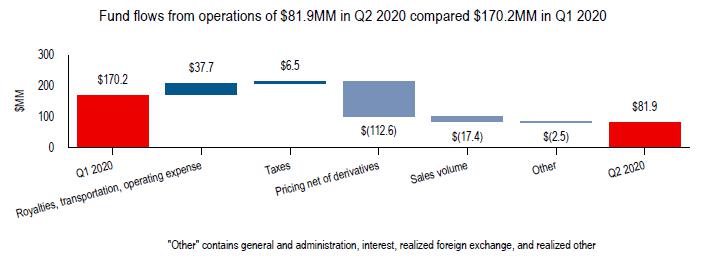
| • | Fund flows from operations during Q2 2020 decreased versus Q1 2020 to $81.9 million primarily driven by decreases in realized prices due to the impact of COVID-19 and the OPEC+ price war, and decreased sales volumes. Lower sales volumes were a result of lower Australian inventory draws during the current quarter and lower produced volumes in France as a result of COVID-19 confinement measures and the temporary shutdown of the Grandpuits refinery offset by production increases in Canada and the United States. These decreases were partially offset by our focus on cost-savings initiatives resulting in reductions to operating expenses in Q2 2020. |
Q2 2020 vs. Q2 2019
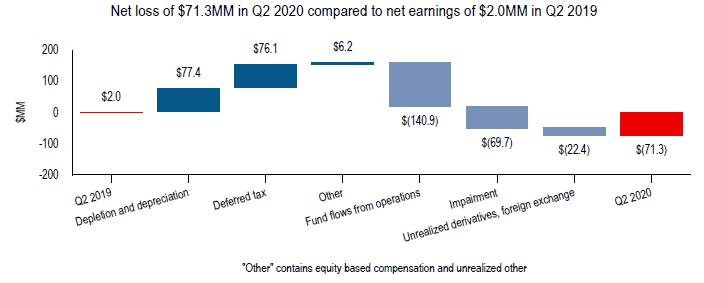
| • | We recorded a net loss for Q2 2020 of $71.3 million ($0.45/basic share) compared to net earnings of $2.0 million ($0.01/basic share) in Q2 2019. The decrease in net earnings was primarily driven by lower fund flows from operations of $140.9 million on lower realized prices due to the impact of COVID-19 and the OPEC+ price war, and impairment charges of $53.1 million (net of $16.6 million income tax recovery) in Q2 2020. |
| Vermilion Energy Inc. ■ Page 12 ■ 2020 Second Quarter Report |
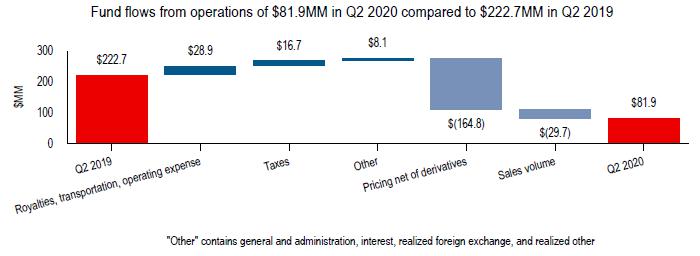
| • | We generated fund flows from operations of $81.9 million in Q2 2020, a decrease from $222.7 million in Q2 2019 primarily on lower realized prices due to the impact of COVID-19 and the OPEC+ price war and lower sales volumes. Our consolidated realized price per boe decreased from |
$46.40/boe in Q2 2019 to $21.40/boe in Q2 2020.
YTD 2020 vs. YTD 2019
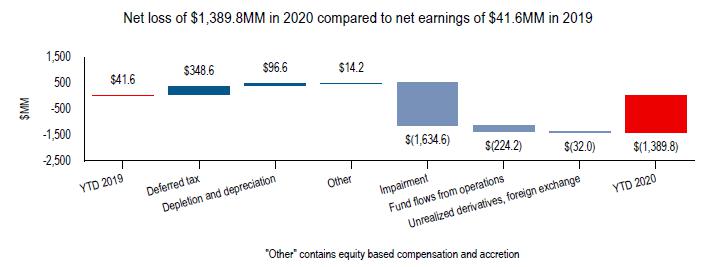
| • | For the six months ended June 30, 2020, a net loss of $1,389.8 million was recorded compared to net earnings of $41.6 million for the comparable period in 2019. The decrease in net earnings was primarily due to impairment charges as we recorded $1.3 billion of impairment in 2020 (net of $0.4 billion income tax recovery). The decrease in net earnings was also a result of lower fund flows from operations driven by decreases in realized prices due to the impact of COVID-19 and the OPEC+ price war. |
| Vermilion Energy Inc. ■ Page 13 ■ 2020 Second Quarter Report |

| • | Fund flows from operations decreased by 47% for the six months ended June 30, 2020 versus the same period in 2019 primarily driven by a decrease in our consolidated realized price by 41% from $48.61/boe to $28.88/boe due to the impact of COVID-19 and the OPEC+ price war. Sales volumes decreased year-over-year primarily due to production decreases in France, Ireland and Australia. |
| Production review |
Q2 2020 vs. Q1 2020
| • | Consolidated average production of 100,366 boe/d during Q2 2020 represented an increase of 3% from Q1 2020 production of 97,154 boe/d. Production increases are primarily in Canada and the United States from new well completions. Production also increased in Australia due to restoration of two wells in Q2 2020 and an absence of cyclone activity experienced in Q1 2020. These increases were partially offset by lower production in France as a result of COVID-19 confinement measures and a temporary shutdown of the Total Grandpuits refinery due to low product demand. |
Q2 2020 vs. Q2 2019
| • | Consolidated average production of 100,366 boe/d in Q2 2020 represented a decrease of 3% from Q2 2019 production of 103,003 boe/d. The decrease was primarily driven by lower production in France due to the refinery shutdown and natural declines in Ireland and Australia. These decreases were partially offset by year-over-year growth in Canada and the United States from new well completions following our active drilling program in Q1 2020. |
YTD 2020 vs. YTD 2019
| • | Consolidated average production of 98,760 boe/d for the six months ended June 30, 2020 represented a decrease of 4% from the comparable period in 2019 of 103,203 boe/d. Production decreases are primarily in France due to the refinery shutdown, Ireland due to natural declines and Australia due to planned downtime and cyclone activity in Q1 2020. These decreases were partially offset by production increases in the United States due to new wells brought online in 2019 and 2020. |
| Vermilion Energy Inc. ■ Page 14 ■ 2020 Second Quarter Report |
| Activity review |

| • | For the three months ended June 30, 2020, capital expenditures of $42.3 million were primarily related to activity in Canada and the United States. In Canada, capital expenditures of $9.8 million primarily related to facility work and new well completion and tie-in activity. In the United States, capital expenditures of $14.2 million related to completion of the remaining six wells from our drilling program. In France, capital expenditures of $5.6 million primarily related to spending for items received for future maintenance work as activity resumes. In Australia, capital expenditures of $4.2 million related to our workover program. |
| Sustainability review |
Dividends
| • | On March 6, 2020, in response to weakness in commodity prices and reduced global economic prospects following the outbreak of COVID-19, Vermilion's board of directors approved a 50% reduction to the March dividend, payable April 15, 2020, to $0.115 per share. On April 15, due to further deterioration of economic prospects and commodity prices from the impact of COVID-19, the board of directors suspended the monthly dividend as a further measure to strengthen the financial position of the Company. |
| • | Total dividends of $0.575 per common share were declared for the six months ended June 30, 2020. |
Long-term debt and net debt
| • | Long-term debt increased to $2.1 billion as at June 30, 2020 from $1.9 billion as at December 31, 2019. This increase was primarily a result of higher borrowings on the revolving credit facility in 2020. |
| • | Net debt increased to $2.2 billion as at June 30, 2020, from $2.0 billion as at December 31, 2019, primarily due to an increase in long-term debt. |
| • | The ratio of net debt to four quarter trailing fund flows from operations increased to 3.16 as at June 30, 2020 (December 31, 2019 - 2.20) due to the increase in net debt combined with lower four quarter trailing fund flows from operations. |
| Vermilion Energy Inc. ■ Page 15 ■ 2020 Second Quarter Report |
Benchmark Commodity Prices
| Q2 2020 | Q1 2020 | Q2 2019 | Q2/20 vs. Q1/20 | Q2/20 vs. Q2/19 | YTD 2020 | YTD 2019 | 2020 vs. 2019 | ||||||
| Crude oil | |||||||||||||
| WTI ($/bbl) | 38.62 | 62.06 | 80.00 | (37.8)% | (51.7)% | 50.54 | 76.48 | (33.9)% | |||||
| WTI (US $/bbl) | 27.85 | 46.17 | 59.81 | (39.7)% | (53.4)% | 37.01 | 57.36 | (35.5)% | |||||
| Edmonton Sweet index ($/bbl) | 30.11 | 51.87 | 73.82 | (42.0)% | (59.2)% | 41.17 | 70.16 | (41.3)% | |||||
| Edmonton Sweet index (US $/bbl) | 21.71 | 38.59 | 55.19 | (43.7)% | (60.7)% | 30.15 | 52.62 | (42.7)% | |||||
| Saskatchewan LSB index ($/bbl) | 29.95 | 51.63 | 74.28 | (42.0)% | (59.7)% | 40.98 | 70.92 | (42.2)% | |||||
| Saskatchewan LSB index (US $/bbl) | 21.60 | 38.41 | 55.54 | (43.8)% | (61.1)% | 30.01 | 53.19 | (43.6)% | |||||
| Canadian C5+ Condensate index ($/bbl) | 30.92 | 62.21 | 74.70 | (50.3)% | (58.6)% | 46.82 | 70.94 | (34.0)% | |||||
| Canadian C5+ Condensate index (US $/bbl) | 22.30 | 46.28 | 55.85 | (51.8)% | (60.1)% | 34.29 | 53.21 | (35.6)% | |||||
| Dated Brent ($/bbl) | 40.49 | 67.56 | 92.05 | (40.1)% | (56.0)% | 54.25 | 88.01 | (38.4)% | |||||
| Dated Brent (US $/bbl) | 29.20 | 50.26 | 68.82 | (41.9)% | (57.6)% | 39.73 | 66.01 | (39.8)% | |||||
| Natural gas | |||||||||||||
| AECO ($/mcf) | 1.99 | 2.03 | 1.03 | (2.0)% | 93.2% | 2.01 | 1.83 | 9.8% | |||||
| NBP ($/mcf) | 2.26 | 4.32 | 5.44 | (47.7)% | (58.5)% | 3.31 | 6.89 | (52.0)% | |||||
| NBP (€/mcf) | 1.48 | 2.92 | 3.62 | (49.3)% | (59.1)% | 2.20 | 4.57 | (51.9)% | |||||
| TTF ($/mcf) | 2.39 | 4.23 | 5.75 | (43.5)% | (58.4)% | 3.32 | 6.94 | (52.2)% | |||||
| TTF (€/mcf) | 1.56 | 2.85 | 3.82 | (45.3)% | (59.2)% | 2.21 | 4.61 | (52.1)% | |||||
| Henry Hub ($/mcf) | 2.38 | 2.62 | 3.53 | (9.2)% | (32.6)% | 2.50 | 3.86 | (35.2)% | |||||
| Henry Hub (US $/mcf) | 1.72 | 1.95 | 2.64 | (11.8)% | (34.8)% | 1.83 | 2.89 | (36.7)% | |||||
| Average exchange rates | |||||||||||||
| CDN $/US $ | 1.39 | 1.34 | 1.34 | 3.7% | 3.7% | 1.37 | 1.33 | 3.0% | |||||
| CDN $/Euro | 1.53 | 1.48 | 1.50 | 3.4% | 2.0% | 1.50 | 1.51 | (0.7)% | |||||
| Realized prices | |||||||||||||
| Crude oil and condensate ($/bbl) | 34.90 | 58.66 | 79.46 | (40.5)% | (56.1)% | 47.20 | 76.36 | (38.2)% | |||||
| NGLs ($/bbl) | 8.94 | 8.92 | 11.25 | 0.2% | (20.5)% | 8.94 | 16.76 | (46.7)% | |||||
| Natural gas ($/mcf) | 1.85 | 2.94 | 3.09 | (37.1)% | (40.1)% | 2.39 | 4.09 | (41.6)% | |||||
| Total ($/boe) | 21.40 | 36.35 | 46.40 | (41.1)% | (53.9)% | 28.88 | 48.61 | (40.6)% | |||||
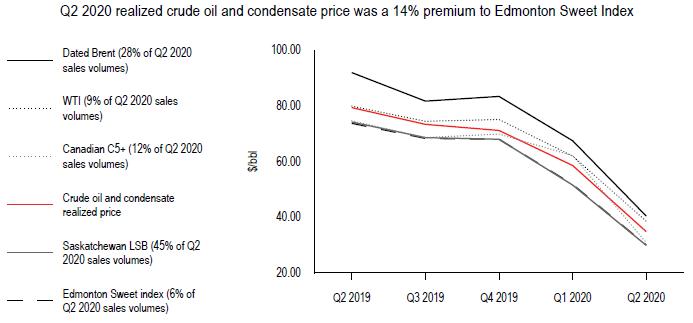
| • | Crude oil prices declined in Q2 2020 relative to Q1 2020 as a result of significant global demand destruction relating to COVID-19. By the end of Q2 2020, quarter-over-quarter WTI and Brent prices fell by 38% and 40% respectively. For the three months ended June 30, 2020, WTI and Brent prices decreased by 52% and 56%, respectively, versus the comparable period in the prior year. |
| Vermilion Energy Inc. ■ Page 16 ■ 2020 Second Quarter Report |
| • | In Canadian dollar terms, quarter-over-quarter, the Edmonton Sweet differential improved by $1.68/bbl to a discount of $8.51/bbl against WTI, and the Saskatchewan LSB differential improved by $1.76/bbl to a discount of $8.67/bbl against WTI. This was driven by Canadian and U.S. production curtailments in response to low prices, and a demand recovery. |
| • | Approximately 28% of Vermilion’s Q2 2020 crude oil and condensate production was priced at the Dated Brent index (which averaged a premium to WTI of US$1.35/bbl), while the remainder of our crude oil and condensate production was priced at the Saskatchewan LSB, Canadian C5+, Edmonton Sweet, and WTI indices. |
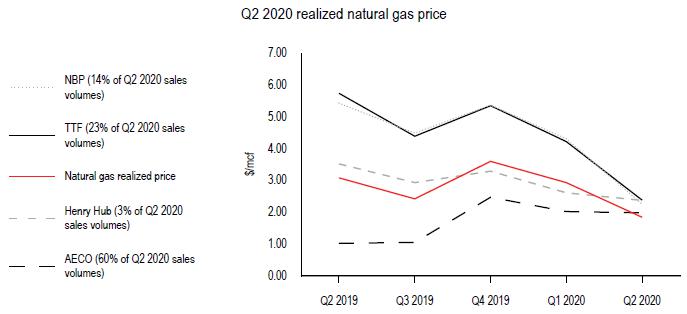
| • | In Canadian dollar terms, market prices for European natural gas (TTF and NBP) decreased by 44% and 48%, respectively, in Q2 2020 compared to Q1 2020 due to an oversupplied European gas market that faced COVID-19 demand loss. |
| • | Natural gas prices at AECO in Q2 2020 decreased by 2% compared to Q1 2020, reflecting a change in seasonality. |
| • | For Q2 2020, average European natural gas prices represented a $0.34/mcf premium to AECO. Approximately 37% of our natural gas production in Q2 2020 benefited from this premium European pricing. |

| • | For the three months ended June 30, 2020, the Canadian dollar weakened 4% against the US dollar quarter-over-quarter. |
| • | For the three months ended June 30, 2020, the Canadian dollar weakened 3% against the Euro quarter-over-quarter. |
| Vermilion Energy Inc. ■ Page 17 ■ 2020 Second Quarter Report |
Canada Business Unit
| Overview |
Production and assets focused in West Pembina near Drayton Valley, Alberta and southeast Saskatchewan and Manitoba.
| • | Significant resource plays sharing the same surface infrastructure in the West Pembina region in Alberta: |
| – | Mannville condensate-rich gas (2,400 - 2,700m depth) - in development phase |
| – | Cardium light oil (1,800m depth) - modest investment at present |
| • | Southeast Saskatchewan light oil development: |
| – | Targeting the Mississippian Midale (1,400 - 1,700m depth), Frobisher/Alida (1,200 - 1,400m depth) and Ratcliffe (1,800 - 1,900m) formations |
| Operational and financial review |
Canada business unit ($M except as indicated) | Q2 2020 | Q1 2020 | Q2 2019 | Q2/20 vs. Q1/20 | Q2/20 vs. Q2/19 | YTD 2020 | YTD 2019 | 2020 vs. 2019 | |||||
| Production and sales | |||||||||||||
| Crude oil and condensate (bbls/d) | 27,592 | 27,401 | 28,844 | 0.7% | (4.3)% | 27,496 | 29,003 | (5.2)% | |||||
| NGLs (bbls/d) | 8,248 | 6,943 | 7,352 | 18.8% | 12.2% | 7,596 | 7,161 | 6.1% | |||||
| Natural gas (mmcf/d) | 164.08 | 151.16 | 151.87 | 8.5% | 8.0% | 157.62 | 151.62 | 4.0% | |||||
| Total (boe/d) | 63,187 | 59,537 | 61,507 | 6.1% | 2.7% | 61,362 | 61,434 | (0.1)% | |||||
| Production mix (% of total) | |||||||||||||
| Crude oil and condensate | 44 | % | 46 | % | 47 | % | 45 | % | 47 | % | |||
| NGLs | 13 | % | 12 | % | 12 | % | 12 | % | 12 | % | |||
| Natural gas | 43 | % | 42 | % | 41 | % | 43 | % | 41 | % | |||
| Activity | |||||||||||||
| Capital expenditures | 9,785 | 152,577 | 29,083 | (93.6)% | (66.4)% | 162,362 | 157,138 | 3.3% | |||||
| Acquisitions | 260 | 5,439 | 2,655 | 5,699 | 17,315 | ||||||||
| Gross wells drilled | 2.00 | 77.00 | 28.00 | 79.00 | 86.00 | ||||||||
| Net wells drilled | 0.12 | 67.40 | 22.87 | 67.52 | 77.81 | ||||||||
| Financial results | |||||||||||||
| Sales | 100,135 | 154,963 | 212,944 | (35.4)% | (53.0)% | 255,098 | 433,100 | (41.1)% | |||||
| Royalties | (6,777 | ) | (16,685 | ) | (20,711 | ) | (59.4)% | (67.3)% | (23,462 | ) | (46,042 | ) | (49.0)% |
| Transportation | (10,465 | ) | (11,138 | ) | (9,781 | ) | (6.0)% | 7.0% | (21,603 | ) | (20,473 | ) | 5.5% |
| Operating | (57,281 | ) | (64,185 | ) | (60,404 | ) | (10.8)% | (5.2)% | (121,466 | ) | (124,008 | ) | (2.0)% |
| General and administration | (8,705 | ) | (2,843 | ) | (7,405 | ) | 206.2% | 17.6% | (11,548 | ) | (10,124 | ) | 14.1% |
| Fund flows from operations | 16,907 | 60,112 | 114,643 | (71.9)% | (85.3)% | 77,019 | 232,453 | (66.9)% | |||||
| Netbacks ($/boe) | |||||||||||||
| Sales | 17.41 | 28.60 | 38.04 | (39.1)% | (54.2)% | 22.84 | 38.95 | (41.4)% | |||||
| Royalties | (1.18 | ) | (3.08 | ) | (3.70 | ) | (61.7)% | (68.1)% | (2.10 | ) | (4.14 | ) | (49.3)% |
| Transportation | (1.82 | ) | (2.06 | ) | (1.75 | ) | (11.7)% | 4.0% | (1.93 | ) | (1.84 | ) | 4.9% |
| Operating | (9.96 | ) | (11.85 | ) | (10.79 | ) | (15.9)% | (7.7)% | (10.88 | ) | (11.15 | ) | (2.4)% |
| General and administration | (1.51 | ) | (0.52 | ) | (1.32 | ) | 190.4% | 14.4% | (1.03 | ) | (0.91 | ) | 13.2% |
| Fund flows from operations netback | 2.94 | 11.09 | 20.48 | (73.5)% | (85.6)% | 6.90 | 20.91 | (67.0)% | |||||
| Realized prices | |||||||||||||
| Crude oil and condensate ($/bbl) | 27.32 | 50.06 | 72.52 | (45.4)% | (62.3)% | 38.65 | 68.99 | (44.0)% | |||||
| NGLs ($/bbl) | 9.62 | 6.98 | 10.61 | 37.8% | (9.3)% | 8.41 | 16.18 | (48.0)% | |||||
| Natural gas ($/mcf) | 1.63 | 1.90 | 1.12 | (14.2)% | 45.5% | 1.76 | 1.79 | (1.7)% | |||||
| Total ($/boe) | 17.41 | 28.60 | 38.04 | (39.1)% | (54.2)% | 22.84 | 38.95 | (41.4)% | |||||
| Reference prices | |||||||||||||
| WTI (US $/bbl) | 27.85 | 46.17 | 59.81 | (39.7)% | (53.4)% | 37.01 | 57.36 | (35.5)% | |||||
| Edmonton Sweet index ($/bbl) | 30.11 | 51.87 | 73.82 | (42.0)% | (59.2)% | 41.17 | 70.16 | (41.3)% | |||||
| Saskatchewan LSB index ($/bbl) | 29.95 | 51.63 | 74.28 | (42.0)% | (59.7)% | 40.98 | 70.92 | (42.2)% | |||||
| Canadian C5+ Condensate index ($/bbl) | 30.92 | 62.21 | 74.70 | (50.3)% | (58.6)% | 46.82 | 70.94 | (34.0)% | |||||
| AECO ($/mcf) | 1.99 | 2.03 | 1.03 | (2.0)% | 93.2% | 2.01 | 1.83 | 9.8% | |||||
| Vermilion Energy Inc. ■ Page 18 ■ 2020 Second Quarter Report |
Production
| • | Q2 2020 production increased 6% from the prior quarter and 3% year-over-year primarily due to production contributions from new well completions partially offset by natural decline. |
Activity
Vermilion participated in the drilling of two (0.1 net) non-operated wells in Canada during Q2 2020.
Alberta
| – | In Q2 2020, we completed six (6.0 net) operated wells, and brought on production five (5.0 net) operated wells in Alberta. |
Saskatchewan
| – | In Q2 2020, we participated in the drilling of two (0.1 net) non-operated wells, completed one (1.0 net) operated wells and six (0.4 net) non-operated wells, and brought five (5.0 net) operated wells and six (0.6 net) non-operated wells on production in Saskatchewan. |
Sales
| • | The realized price for our crude oil and condensate production in Canada is linked to WTI and is subject to market conditions in western Canada as reflected by the Saskatchewan LSB, Canadian Condensate C5+, and Edmonton Sweet index prices. The realized price of our natural gas in Canada is based on the AECO index. |
| • | Sales decreased for the three and six months ended June 30, 2020 versus all comparable periods primarily due to lower realized oil and condensate prices. This was partially offset by increased production in Q2 2020 compared to Q1 2020 and Q2 2019. |
| • | Quarter-over-quarter, our crude oil and condensate production mix remained stable at approximately 45% of production. |
Royalties
| • | Q2 2020 royalties as a percentage of sales of 6.8% decreased from 10.8% in Q1 2020 and 9.7% Q2 2019. This decrease is primarily due to the effect of lower commodity prices on sliding scale royalties and gas cost allowance credits received in Q2 2020. |
| • | For the six months ended June 30, 2020, royalties as a percentage of sales of 9.2% decreased from 10.6% in the 2019 comparable period. This is primarily due to the effect of lower commodity prices on sliding scale royalties. |
Transportation
| • | Transportation expense in Q2 2020 compared to Q1 2020 decreased slightly on a dollar basis. |
| • | For the three and six months ended June 30, 2020, transportation expense on a dollar and per unit basis remained relatively consistent versus the comparable periods in 2019. |
Operating
| • | For the three and six months ended June 30, 2020, operating expense on a dollar and per unit basis decreased versus all comparable periods primarily due to lower activity and cost reduction initiatives in Q2 2020. |
General and administration
| • | For the three and six months ended June 30, 2020, general and administrative expenses were higher versus all comparable periods primarily due to a decrease in allocations from our Corporate segment combined with lower recoveries in Q2 2020. |
| Vermilion Energy Inc. ■ Page 19 ■ 2020 Second Quarter Report |
France Business Unit
| Overview |
| • | Largest oil producer in France, constituting approximately two-thirds of domestic oil production. |
| • | Low base decline producing assets comprised of large conventional oil fields with high working interests located in the Aquitaine and Paris Basins. |
| • | Identified inventory of workover, waterflood, and infill drilling opportunities. |
| Operational and financial review |
| France business unit ($M except as indicated) | Q2 2020 | Q1 2020 | Q2 2019 | Q2/20 vs. Q1/20 | Q2/20 vs. Q2/19 | YTD 2020 | YTD 2019 | 2020 vs. 2019 | |||||
| Production | |||||||||||||
| Crude oil (bbls/d) | 7,046 | 9,957 | 9,800 | (29.2)% | (28.1)% | 8,501 | 10,567 | (19.6)% | |||||
| Natural gas (mmcf/d) | — | — | — | —% | —% | — | 0.38 | —% | |||||
| Total (boe/d) | 7,046 | 9,957 | 9,800 | (29.2)% | (28.1)% | 8,501 | 10,630 | (20.0)% | |||||
| Sales | |||||||||||||
| Crude oil (bbls/d) | 5,835 | 10,217 | 10,190 | (42.9)% | (42.7)% | 8,026 | 10,720 | (25.1)% | |||||
| Natural gas (mmcf/d) | — | — | — | —% | —% | — | 0.38 | —% | |||||
| Total (boe/d) | 5,835 | 10,217 | 10,190 | (42.9)% | (42.7)% | 8,026 | 10,784 | (25.6)% | |||||
| Inventory (mbbls) | |||||||||||||
| Opening crude oil inventory | 185 | 209 | 332 | 209 | 325 | ||||||||
| Crude oil production | 641 | 906 | 892 | 1,547 | 1,913 | ||||||||
| Crude oil sales | (530 | ) | (930 | ) | (927 | ) | (1,460 | ) | (1,941 | ) | |||
| Closing crude oil inventory | 296 | 185 | 297 | 296 | 297 | ||||||||
| Activity | |||||||||||||
| Capital expenditures | 5,603 | 11,257 | 25,671 | (50.2)% | (78.2)% | 16,860 | 47,757 | (64.7)% | |||||
| Gross wells drilled | — | — | 1.00 | — | 4.00 | ||||||||
| Net wells drilled | — | — | 1.00 | — | 4.00 | ||||||||
| Financial results | |||||||||||||
| Sales | 23,329 | 56,789 | 84,540 | (58.9)% | (72.4)% | 80,118 | 167,242 | (52.1)% | |||||
| Royalties | (4,711 | ) | (9,040 | ) | (10,871 | ) | (47.9)% | (56.7)% | (13,751 | ) | (22,154 | ) | (37.9)% |
| Transportation | (2,747 | ) | (3,725 | ) | (9,041 | ) | (26.3)% | (69.6)% | (6,472 | ) | (12,211 | ) | (47.0)% |
| Operating | (10,016 | ) | (15,899 | ) | (14,305 | ) | (37.0)% | (30.0)% | (25,915 | ) | (30,041 | ) | (13.7)% |
| General and administration | (3,499 | ) | (3,448 | ) | (3,551 | ) | 1.5% | (1.5)% | (6,947 | ) | (7,206 | ) | (3.6)% |
| Current income taxes | — | — | (5,346 | ) | N/A | (100.0)% | — | (13,046 | ) | (100.0)% | |||
| Fund flows from operations | 2,356 | 24,677 | 41,426 | (90.5)% | (94.3)% | 27,033 | 82,584 | (67.3)% | |||||
| Netbacks ($/boe) | |||||||||||||
| Sales | 43.94 | 61.08 | 91.17 | (28.1)% | (51.8)% | 54.85 | 85.68 | (36.0)% | |||||
| Royalties | (8.87 | ) | (9.72 | ) | (11.72 | ) | (8.7)% | (24.3)% | (9.41 | ) | (11.35 | ) | (17.1)% |
| Transportation | (5.17 | ) | (4.01 | ) | (9.75 | ) | 28.9% | (47.0)% | (4.43 | ) | (6.26 | ) | (29.2)% |
| Operating | (18.86 | ) | (17.10 | ) | (15.43 | ) | 10.3% | 22.2% | (17.74 | ) | (15.39 | ) | 15.3% |
| General and administration | (6.59 | ) | (3.71 | ) | (3.83 | ) | 77.6% | 72.1% | (4.76 | ) | (3.69 | ) | 29.0% |
| Current income taxes | — | — | (5.77 | ) | N/A | (100.0)% | — | (6.68 | ) | (100.0)% | |||
| Fund flows from operations netback | 4.45 | 26.54 | 44.67 | (83.2)% | (90.0)% | 18.51 | 42.31 | (56.3)% | |||||
| Reference prices | |||||||||||||
| Dated Brent (US $/bbl) | 29.20 | 50.26 | 68.82 | (41.9)% | (57.6)% | 39.73 | 66.01 | (39.8)% | |||||
| Dated Brent ($/bbl) | 40.49 | 67.56 | 92.05 | (40.1)% | (56.0)% | 54.25 | 88.01 | (38.4)% | |||||
| Vermilion Energy Inc. ■ Page 20 ■ 2020 Second Quarter Report |
Production
| • | Q2 2020 production decreased 29% from the prior quarter and 28% year-over-year. We temporarily reduced our production by about one-third during the quarter as a result of COVID-19 confinement measures put in place by the French government in mid-March, which reduced field activity and resulted in the temporary shutdown of the Total-operated Grandpuits refinery due to low product demand. |
Activity
| • | During Q2 2020, capital activity was reduced due to COVID-19 confinement measures put in place by the French government in mid-March. We recently resumed field activity and plan to focus on maintenance and asset optimization projects for the remainder of the year. |
Sales
| • | Crude oil in France is priced with reference to Dated Brent. |
| • | For the three and six months ended June 30, 2020, sales per boe and on a dollar basis decreased versus all comparable periods due to a decrease in the Dated Brent reference price combined with lower production volumes. |
Royalties
| • | Royalties in France relate to two components: RCDM (levied on units of production and not subject to changes in commodity prices) and R31 (based on a percentage of sales). |
| • | For the three and six months ended June 30, 2020, royalties decreased versus the comparable periods due to lower R31 royalties on lower sales combined with lower RCDM royalties on lower production. |
| • | Royalties as a percentage of sales for the three and six months ended June 30, 2020 of 20.2% and 17.2% increased versus all comparable periods primarily as a result of lower sales. |
Transportation
| • | Transportation expense decreased for the three and six months ended June 30, 2020 versus the comparable periods due to decreased production and sales volumes, as well as increased costs during the three and six months ended June 30, 2019 due to the Grandpuits refinery outage where we arranged alternate delivery points and transportation methods during the shutdown. |
Operating
| • | Operating expense on dollar basis decreased for the three and six months ended June 30, 2020 versus the comparable periods due to cost reduction measures and lower activity during the COVID-19 confinement period. |
General and administration
| • | Fluctuations in general and administration expense for all comparable periods were due to the timing of expenditures and allocations from our corporate segment. |
Current income taxes
| • | In France, current income taxes are applied to taxable income, after eligible deductions, at a statutory rate of 28.9%. |
| • | Full year effective tax rates are estimated each quarter based on forecasted commodity prices and operational results. The estimated full year effective tax rate is applied on a pro-rata basis to quarterly results. As such, fluctuations between the reporting periods occur due to changes in estimated tax rates. |
| • | For 2020, there are no expected current income taxes to be reported. This is subject to change in response to production variations, commodity price fluctuations, the timing of capital expenditures, and other eligible in-country adjustments. |
| • | On December 28, 2019, the French Parliament approved the Finance Bill for 2020. The Finance Bill for 2020 provides for a progressive decrease of the French corporate income tax rate for companies with sales below €250 million from 28.9% in 2020 to 25.8% by 2022. |
| Vermilion Energy Inc. ■ Page 21 ■ 2020 Second Quarter Report |
Netherlands Business Unit
| Overview |
| • | Second largest onshore operator. |
| • | Interests include 26 onshore licenses (all operated) and 17 offshore licenses (all non-operated). |
| • | Licenses include more than 930,000 net acres of land, 90% of which is undeveloped. |
| Operational and financial review |
Netherlands business unit ($M except as indicated) | Q2 2020 | Q1 2020 | Q2 2019 | Q2/20 vs. Q1/20 | Q2/20 vs. Q2/19 | YTD 2020 | YTD 2019 | 2020 vs. 2019 | |||||
| Production and sales | |||||||||||||
| Condensate (bbls/d) | 87 | 87 | 100 | —% | (13.0)% | 87 | 96 | (9.4)% | |||||
| Natural gas (mmcf/d) | 47.31 | 48.33 | 52.90 | (2.1)% | (10.6)% | 47.82 | 52.21 | (8.4)% | |||||
| Total (boe/d) | 7,972 | 8,143 | 8,917 | (2.1)% | (10.6)% | 8,057 | 8,798 | (8.4)% | |||||
| Activity | |||||||||||||
| Capital expenditures | 2,638 | 2,497 | 4,577 | 5.6% | (42.4)% | 5,135 | 10,926 | (53.0)% | |||||
| Acquisitions | — | — | — | — | 908 | ||||||||
| Gross wells drilled | — | — | — | — | — | ||||||||
| Net wells drilled | — | — | — | — | — | ||||||||
| Financial results | |||||||||||||
| Sales | 10,654 | 19,603 | 28,327 | (45.7)% | (62.4)% | 30,257 | 68,913 | (56.1)% | |||||
| Royalties | (55 | ) | (143 | ) | (446 | ) | (61.5)% | (87.7)% | (198 | ) | (1,060 | ) | (81.3)% |
| Operating | (7,526 | ) | (8,915 | ) | (7,686 | ) | (15.6)% | (2.1)% | (16,441 | ) | (15,971 | ) | 2.9% |
| General and administration | (212 | ) | (555 | ) | (704 | ) | (61.8)% | (69.9)% | (767 | ) | (1,596 | ) | (51.9)% |
| Current income taxes | 257 | — | (2,575 | ) | N/A | N/A | 257 | (6,775 | ) | N/A | |||
| Fund flows from operations | 3,118 | 9,990 | 16,916 | (68.8)% | (81.6)% | 13,108 | 43,511 | (69.9)% | |||||
| Netbacks ($/boe) | |||||||||||||
| Sales | 14.69 | 26.45 | 34.91 | (44.5)% | (57.9)% | 20.63 | 43.28 | (52.3)% | |||||
| Royalties | (0.08 | ) | (0.19 | ) | (0.55 | ) | (57.9)% | (85.5)% | (0.14 | ) | (0.67 | ) | (79.1)% |
| Operating | (10.37 | ) | (12.03 | ) | (9.47 | ) | (13.8)% | 9.5% | (11.21 | ) | (10.03 | ) | 11.8% |
| General and administration | (0.29 | ) | (0.75 | ) | (0.87 | ) | (61.3)% | (66.7)% | (0.52 | ) | (1.00 | ) | (48.0)% |
| Current income taxes | 0.35 | — | (3.17 | ) | N/A | N/A | 0.18 | (4.25 | ) | N/A | |||
| Fund flows from operations netback | 4.30 | 13.48 | 20.85 | (68.1)% | (79.4)% | 8.94 | 27.33 | (67.3)% | |||||
| Realized prices | |||||||||||||
| Condensate ($/bbl) | 14.32 | 64.32 | 79.10 | (77.7)% | (81.9)% | 39.40 | 73.37 | (46.3)% | |||||
| Natural gas ($/mcf) | 2.45 | 4.34 | 5.73 | (43.5)% | (57.2)% | 3.40 | 7.16 | (52.5)% | |||||
| Total ($/boe) | 14.69 | 26.45 | 34.91 | (44.5)% | (57.9)% | 20.63 | 43.28 | (52.3)% | |||||
| Reference prices | |||||||||||||
| TTF ($/mcf) | 2.39 | 4.23 | 5.75 | (43.5)% | (58.4)% | 3.32 | 6.94 | (52.2)% | |||||
| TTF (€/mcf) | 1.56 | 2.85 | 3.82 | (45.3)% | (59.2)% | 2.21 | 4.61 | (52.1)% | |||||
| Vermilion Energy Inc. ■ Page 22 ■ 2020 Second Quarter Report |
Production
| • | Q2 2020 production decreased 2% from the prior quarter primarily due to planned and unplanned downtime. Quarterly production decreased 11% year-over-year primarily due to natural decline. |
Activity
| • | We recently received the final production permit for the Weststellingwerf well (0.5 net) and expect to bring this well on production during the second half of 2020. We also advanced permitting for future planned wells during Q2 2020. |
Sales
| • | The price of our natural gas in the Netherlands is based on the TTF index. |
| • | For the three and six months ended June 30, 2020, sales on a per unit and dollar basis decreased versus all comparable periods, consistent with decreases in the TTF reference price. |
Royalties
| • | In the Netherlands, certain wells are subject to overriding royalties while some wells are subject to royalties that take effect only when specified production levels are exceeded. As such, royalty expense may fluctuate from period to period depending on the amount of production from those wells. |
| • | Royalties in Q2 2020 remained consistent compared to Q1 2020. |
| • | Royalties in Q2 2020 represented 0.5% of sales, a decrease from 1.6% in Q2 2019 due to the acquisition of certain royalty rights with an effective date of March 1, 2019 which resulted in lower royalty rates in subsequent periods. |
Transportation
| • | Our production in the Netherlands is not subject to transportation expense as gas is sold at the plant gate. |
Operating
| • | Operating expense on a dollar and per unit basis decreased in Q2 2020 compared to Q1 2020 primarily as a result of lower electricity costs and lower maintenance activity in the current quarter. |
| • | For the three and six months ended June 30, 2020, operating expense per unit increased versus comparable periods in the prior year due to fixed costs being spread over lower volumes. Over the same periods, operating expense on a dollar basis remained consistent. |
General and administration
| • | Fluctuations in general and administration expense for all comparable periods were due to the timing of expenditures and allocations from our corporate segment. |
Current income taxes
| • | In the Netherlands, current income taxes are applied to taxable income, after eligible deductions and a 10% uplift deduction applied to operating expenses, eligible general and administration expenses, and tax deductions for depletion and asset retirement obligations, at a tax rate of 50%. |
| • | Full year effective tax rates are estimated each quarter based on forecasted commodity prices and operational results. The estimated full year effective tax rate is applied on a pro-rata basis to quarterly results. As such, fluctuations between the reporting periods occur due to changes in estimated tax rates. |
| • | For 2020, current income tax losses will be carried back and applied to recover prior year current income taxes with the effective tax recovery rate, inclusive of corporate allocations, expected to be between 7% and 11% of pre-tax fund flows from operations. This is subject to change in response to production variations, commodity price fluctuations, the timing of capital expenditures, and other eligible in-country adjustments. |
| • | On December 17, 2019, the Dutch government approved the 2020 Tax Plan. The Bill provides for reduced corporate tax rates from 25.0% in 2020 to 21.7% by 2021. Due to the tax regime applicable to natural gas producers in the Netherlands, the reduction to the corporate tax rate is not expected to have a material impact on Vermilion taxes in the Netherlands. |
| Vermilion Energy Inc. ■ Page 23 ■ 2020 Second Quarter Report |
Germany Business Unit
| Overview |
| • | Entered Germany in 2014 through the acquisition of a non-operated natural gas producing property. |
| • | Executed a significant exploration license farm-in agreement in 2015 and acquired operated producing properties in 2016. |
| • | Producing assets consist of seven gas and eight oil-producing fields with extensive infrastructure in place. |
| • | Significant land position of approximately 1.1 million net acres (97% undeveloped). |
| Operational and financial review |
Germany business unit ($M except as indicated) | Q2 2020 | Q1 2020 | Q2 2019 | Q2/20 vs. Q1/20 | Q2/20 vs. Q2/19 | YTD 2020 | YTD 2019 | 2020 vs. 2019 | |||||
| Production | |||||||||||||
| Crude oil (bbls/d) | 1,039 | 909 | 1,047 | 14.3% | (0.8)% | 974 | 1,013 | (3.8)% | |||||
| Natural gas (mmcf/d)u | 13.23 | 14.64 | 14.56 | (9.6)% | (9.1)% | 13.94 | 15.63 | (10.8)% | |||||
| Total (boe/d) | 3,244 | 3,349 | 3,474 | (3.1)% | (6.6)% | 3,297 | 3,618 | (8.9)% | |||||
| Sales | |||||||||||||
| Crude oil (bbls/d) | 1,172 | 875 | 982 | 33.9% | 19.3% | 1,023 | 1,017 | 0.6% | |||||
| Natural gas (mmcf/d) | 13.23 | 14.64 | 14.56 | (9.6)% | (9.1)% | 13.94 | 15.63 | (10.8)% | |||||
| Total (boe/d) | 3,376 | 3,315 | 3,409 | 1.8% | (1.0)% | 3,346 | 3,622 | (7.6)% | |||||
| Production mix (% of total) | |||||||||||||
| Crude oil | 32 | % | 27 | % | 30 | % | 30 | % | 28 | % | |||
| Natural gas | 68 | % | 73 | % | 70 | % | 70 | % | 72 | % | |||
| Activity | |||||||||||||
| Capital expenditures | 3,345 | 7,789 | 9,234 | (57.1)% | (63.8)% | 11,134 | 12,278 | (9.3)% | |||||
| Acquisitions | 564 | 19 | 4,751 | 583 | 5,167 | ||||||||
| Gross wells drilled | — | 1.00 | 2.00 | 1.00 | 2.00 | ||||||||
| Net wells drilled | — | 1.00 | 0.71 | 1.00 | 0.71 | ||||||||
| Financial results | |||||||||||||
| Sales | 6,553 | 10,469 | 15,093 | (37.4)% | (56.6)% | 17,022 | 34,461 | (50.6)% | |||||
| Royalties | (795 | ) | (942 | ) | (1,502 | ) | (15.6)% | (47.1)% | (1,737 | ) | (3,725 | ) | (53.4)% |
| Transportation | (1,505 | ) | (1,322 | ) | (773 | ) | 13.8% | 94.7% | (2,827 | ) | (2,445 | ) | 15.6% |
| Operating | (5,912 | ) | (4,915 | ) | (5,212 | ) | 20.3% | 13.4% | (10,827 | ) | (11,132 | ) | (2.7)% |
| General and administration | (1,314 | ) | (1,741 | ) | (2,146 | ) | (24.5)% | (38.8)% | (3,055 | ) | (4,059 | ) | (24.7)% |
| Fund flows from operations | (2,973 | ) | 1,549 | 5,460 | N/A | N/A | (1,424 | ) | 13,100 | N/A | |||
| Netbacks ($/boe) | |||||||||||||
| Sales | 21.33 | 34.70 | 48.65 | (38.5)% | (56.2)% | 27.95 | 52.57 | (46.8)% | |||||
| Royalties | (2.59 | ) | (3.12 | ) | (4.84 | ) | (17.0)% | (46.5)% | (2.85 | ) | (5.68 | ) | (49.8)% |
| Transportation | (4.90 | ) | (4.38 | ) | (2.49 | ) | 11.9% | 96.8% | (4.64 | ) | (3.73 | ) | 24.4% |
| Operating | (19.24 | ) | (16.29 | ) | (16.80 | ) | 18.1% | 14.5% | (17.78 | ) | (16.98 | ) | 4.7% |
| General and administration | (4.28 | ) | (5.77 | ) | (6.92 | ) | (25.8)% | (38.2)% | (5.02 | ) | (6.19 | ) | (18.9)% |
| Fund flows from operations netback | (9.68 | ) | 5.14 | 17.60 | N/A | N/A | (2.34 | ) | 19.99 | N/A | |||
| Realized prices | |||||||||||||
| Crude oil ($/bbl) | 34.32 | 59.72 | 87.05 | (42.5)% | (60.6)% | 45.18 | 82.66 | (45.3)% | |||||
| Natural gas ($/mcf) | 2.40 | 4.29 | 5.52 | (44.1)% | (56.5)% | 3.39 | 6.80 | (50.1)% | |||||
| Total ($/boe) | 21.33 | 34.70 | 48.65 | (38.5)% | (56.2)% | 27.95 | 52.57 | (46.8)% | |||||
| Reference prices | |||||||||||||
| Dated Brent (US $/bbl) | 29.20 | 50.26 | 68.82 | (41.9)% | (57.6)% | 39.73 | 66.01 | (39.8)% | |||||
| Dated Brent ($/bbl) | 40.49 | 67.56 | 92.05 | (40.1)% | (56.0)% | 54.25 | 88.01 | (38.4)% | |||||
| TTF ($/mcf) | 2.39 | 4.23 | 5.75 | (43.5)% | (58.4)% | 3.32 | 6.94 | (52.2)% | |||||
| TTF (€/mcf) | 1.56 | 2.85 | 3.82 | (45.3)% | (59.2)% | 2.21 | 4.61 | (52.1)% | |||||
| Vermilion Energy Inc. ■ Page 24 ■ 2020 Second Quarter Report |
Production
| • | Q2 2020 production decreased 3% from the prior quarter primarily due to unplanned downtime, which was partially offset by strong performance from well workovers completed in the previous quarter. Quarterly production decreased 7% year-over-year due to planned and unplanned downtime, along with natural decline on our operated and non-operated oil and natural gas assets. |
Activity
| • | Our Q2 2020 capital activity was focused on maintenance activities and asset optimization opportunities. We expect production from the Burgmoor Z5 (46% working interest) well, which was tested early in the third quarter of 2019, to begin in 2021. |
Sales
| • | The price of our natural gas in Germany is based on the NCG and GPL indexes, which are both highly correlated to the TTF benchmark. Crude oil in Germany is priced with reference to Dated Brent. |
| • | For the three and six months ended June 30, 2020 versus all comparable periods, sales decreased on a per unit and dollar basis primarily due to lower reference pricing in the current quarter. |
Royalties
| • | Our production in Germany is subject to state and private royalties on sales after certain eligible deductions. |
| • | Royalty expense for the three and six months ended June 30, 2020 decreased versus all comparable periods consistent with decreases in sales. Royalties as a percentage of sales remained relatively consistent for all comparable periods. |
Transportation
| • | Transportation expense in Germany relates to costs incurred to deliver natural gas from the processing facility to the customer and deliver crude oil to the refinery. |
| • | Transportation expense increased quarter-over-quarter primarily due to a favourable prior period adjustment recorded in Q1 2020. |
| • | Transportation expense for the three and six months ended June 30, 2020, increased versus comparable periods in the prior year due to favourable prior period adjustments received in Q2 2019. |
Operating
| • | Operating expense for the three months ended June 30, 2020 increased versus comparable periods primarily due to the timing of activity on |
non-operated assets.
| • | Operating expense for the six months ended June 30, 2020 was relatively consistent with the comparable period in the prior year. |
General and administration
| • | Fluctuations in general and administration expense for all comparable periods were due to the timing of expenditures and allocations from our corporate segment. |
Current income taxes
| • | As a result of our tax pools in Germany, we do not expect to incur current income taxes for 2020 in the Germany Business Unit. This is subject to change in response to production variations, commodity price fluctuations, the timing of capital expenditures, and other eligible in-country adjustments. |
| Vermilion Energy Inc. ■ Page 25 ■ 2020 Second Quarter Report |
Ireland Business Unit
| Overview |
| • | Entered Ireland in 2009 with an investment in the offshore Corrib gas field. |
| • | The Corrib gas field is located offshore northwest Ireland and comprises of six offshore wells, offshore and onshore sales and transportation pipeline segments, as well as a natural gas processing facility. |
| • | In Q4 2018, Vermilion assumed operatorship of the Corrib Natural Gas Project (the "Corrib Project") and increased its ownership stake by 1.5% to 20% following the completion of a strategic partnership with Canada Pension Plan Investment Board (“CPPIB”). |
| Operational and financial review |
Ireland business unit ($M except as indicated) | Q2 2020 | Q1 2020 | Q2 2019 | Q2/20 vs. Q1/20 | Q2/20 vs. Q2/19 | YTD 2020 | YTD 2019 | 2020 vs. 2019 | |||||
| Production and sales | |||||||||||||
| Natural gas (mmcf/d) | 38.57 | 41.38 | 49.21 | (6.8)% | (21.6)% | 39.97 | 50.45 | (20.8)% | |||||
| Total (boe/d) | 6,428 | 6,896 | 8,201 | (6.8)% | (21.6)% | 6,662 | 8,409 | (20.8)% | |||||
| Activity | |||||||||||||
| Capital expenditures | 704 | (20 | ) | 84 | N/A | 738.1% | 684 | 95 | 620.0% | ||||
| Acquisitions | — | — | — | — | — | ||||||||
| Financial results | |||||||||||||
| Sales | 7,268 | 17,588 | 25,936 | (58.7)% | (72.0)% | 24,856 | 65,728 | (62.2)% | |||||
| Transportation | (1,179 | ) | (1,145 | ) | (1,155 | ) | 3.0% | 2.1% | (2,324 | ) | (2,321 | ) | 0.1% |
| Operating | (3,852 | ) | (4,212 | ) | (2,631 | ) | (8.5)% | 46.4% | (8,064 | ) | (6,441 | ) | 25.2% |
| General and administration | 106 | (390 | ) | (242 | ) | N/A | N/A | (284 | ) | (571 | ) | (50.3)% | |
| Fund flows from operations | 2,343 | 11,841 | 21,908 | (80.2)% | (89.3)% | 14,184 | 56,395 | (74.8)% | |||||
| Netbacks ($/boe) | |||||||||||||
| Sales | 12.43 | 28.03 | 34.75 | (55.7)% | (64.2)% | 20.50 | 43.19 | (52.5)% | |||||
| Transportation | (2.02 | ) | (1.82 | ) | (1.55 | ) | 11.0% | 30.3% | (1.92 | ) | (1.52 | ) | 26.3% |
| Operating | (6.59 | ) | (6.71 | ) | (3.53 | ) | (1.8)% | 86.7% | (6.65 | ) | (4.23 | ) | 57.2% |
| General and administration | 0.18 | (0.62 | ) | (0.32 | ) | N/A | N/A | (0.23 | ) | (0.38 | ) | (39.5)% | |
| Fund flows from operations netback | 4.00 | 18.88 | 29.35 | (78.8)% | (86.4)% | 11.70 | 37.06 | (68.4)% | |||||
| Reference prices | |||||||||||||
| NBP ($/mcf) | 2.26 | 4.32 | 5.44 | (47.7)% | (58.5)% | 3.31 | 6.89 | (52.0)% | |||||
| NBP (€/mcf) | 1.48 | 2.92 | 3.62 | (49.3)% | (59.1)% | 2.20 | 4.57 | (51.9)% | |||||
| Vermilion Energy Inc. ■ Page 26 ■ 2020 Second Quarter Report |
Production
| • | Q2 2020 production decreased 7% from the prior quarter primarily due to natural decline and unplanned downtime. The natural decline profile of Corrib continues to be in line with our expectations. Quarterly production decreased 22% year-over-year primarily due to natural decline, as well as higher unplanned downtime. |
Activity
| • | Our 2020 capital program is focused on turnarounds and optimization opportunities at the Corrib natural gas processing facility. |
Sales
| • | The price of our natural gas in Ireland is based on the NBP index. |
| • | Sales for the three and six months ended June 30, 2020 decreased versus the comparable periods due to decreases in realized prices and natural decline of production volumes. |
Royalties
| • | Our production in Ireland is not subject to royalties. |
Transportation
| • | Transportation expense in Ireland relates to payments under a ship-or-pay agreement. |
| • | Transportation expense for the three and six months ended June 30, 2020 remained relatively consistent versus all comparable periods. |
Operating
| • | Operating expense decreased on a per unit and dollar basis quarter-over-quarter primarily due to the timing of expenditures. |
| • | For the three and six months ended June 30, 2020, operating expense increased on both a per unit and dollar basis versus comparable periods in the prior year primarily due to maintenance activities conducted in the current year. |
General and administration
| • | Fluctuations in general and administration expense versus all comparable periods is primarily due to the timing of expenditures and allocations from our corporate segment. |
Current income taxes
| • | Given the significant level of investment in Corrib and the resulting tax pools, we do not expect to incur current income taxes in the Ireland Business Unit for the foreseeable future. |
| Vermilion Energy Inc. ■ Page 27 ■ 2020 Second Quarter Report |
Australia Business Unit
| Overview |
| • | Hold a 100% operated working interest in the Wandoo field, located approximately 80 km offshore on the northwest shelf of Australia. |
| • | Production is operated from two off-shore platforms and originates from 20 producing wells including five dual lateral wells for a total of 25 producing laterals. |
| • | Wells that utilize horizontal legs (ranging in length from 500 to 3,000 plus metres) are located 600m below the seabed in approximately 55m of water depth. |
| Operational and financial review |
| Australia business unit ($M except as indicated) | Q2 2020 | Q1 2020 | Q2 2019 | Q2/20 vs. Q1/20 | Q2/20 vs. Q2/19 | YTD 2020 | YTD 2019 | 2020 vs. 2019 | |||||
| Production | |||||||||||||
| Crude oil (bbls/d) | 5,299 | 4,041 | 6,689 | 31.1% | (20.8)% | 4,670 | 6,278 | (25.6)% | |||||
| Sales | |||||||||||||
| Crude oil (bbls/d) | 5,107 | 5,911 | 4,737 | (13.6)% | 7.8% | 5,509 | 6,241 | (11.7)% | |||||
| Inventory (mbbls) | |||||||||||||
| Opening crude oil inventory | 109 | 279 | 18 | 279 | 189 | ||||||||
| Crude oil production | 482 | 368 | 609 | 850 | 1,137 | ||||||||
| Crude oil sales | (465 | ) | (538 | ) | (431 | ) | (1,003 | ) | (1,130 | ) | |||
| Closing crude oil inventory | 126 | 109 | 196 | 126 | 196 | ||||||||
| Activity | |||||||||||||
| Capital expenditures | 4,200 | 12,002 | 2,239 | (65.0)% | 87.6% | 16,202 | 21,103 | (23.2)% | |||||
| Gross wells drilled | — | — | — | — | 2.00 | ||||||||
| Net wells drilled | — | — | — | — | 2.00 | ||||||||
| Financial results | |||||||||||||
| Sales | 28,772 | 51,995 | 42,848 | (44.7)% | (32.9)% | 80,767 | 106,430 | (24.1)% | |||||
| Operating | (10,659 | ) | (17,373 | ) | (8,092 | ) | (38.6)% | 31.7% | (28,032 | ) | (29,496 | ) | (5.0)% |
| General and administration | (888 | ) | (875 | ) | (1,164 | ) | 1.5% | (23.7)% | (1,763 | ) | (2,203 | ) | (20.0)% |
| Current income taxes | (3,532 | ) | (9,597 | ) | (12,084 | ) | (63.2)% | (70.8)% | (13,129 | ) | (26,184 | ) | (49.9)% |
| Fund flows from operations | 13,693 | 24,150 | 21,508 | (43.3)% | (36.3)% | 37,843 | 48,547 | (22.0)% | |||||
| Netbacks ($/boe) | |||||||||||||
| Sales | 61.91 | 96.66 | 99.39 | (36.0)% | (37.7)% | 80.55 | 94.21 | (14.5)% | |||||
| Operating | (22.93 | ) | (32.30 | ) | (18.77 | ) | (29.0)% | 22.2% | (27.96 | ) | (26.11 | ) | 7.1% |
| General and administration | (1.91 | ) | (1.63 | ) | (2.70 | ) | 17.2% | (29.3)% | (1.76 | ) | (1.95 | ) | (9.7)% |
| PRRT | (6.93 | ) | (17.21 | ) | (19.18 | ) | (59.7)% | (63.9)% | (12.44 | ) | (16.53 | ) | (24.7)% |
| Corporate income taxes | (0.67 | ) | (0.63 | ) | (8.85 | ) | 6.3% | (92.4)% | (0.65 | ) | (6.65 | ) | (90.2)% |
| Fund flows from operations netback | 29.47 | 44.89 | 49.89 | (34.4)% | (40.9)% | 37.74 | 42.97 | (12.2)% | |||||
| Reference prices | |||||||||||||
| Dated Brent (US $/bbl) | 29.20 | 50.26 | 68.82 | (41.9)% | (57.6)% | 39.73 | 66.01 | (39.8)% | |||||
| Dated Brent ($/bbl) | 40.49 | 67.56 | 92.05 | (40.1)% | (56.0)% | 54.25 | 88.01 | (38.4)% | |||||
| Vermilion Energy Inc. ■ Page 28 ■ 2020 Second Quarter Report |
Production
| • | Q2 2020 production increased 31% quarter-over-quarter primarily due to the restoration of production on two wells that were temporarily offline in the prior quarter to install electric submersible pumps. Production also benefited from the absence of cyclone activity in the quarter, which caused several days of unplanned downtime in Q1 2020. Quarterly production decreased 21% year-over-year primarily due to the production contribution from the two (2.0 net) well drilling program completed at the end of January 2019. |
| • | Production volumes are managed to targets while meeting long-term supply requirements of our customers. |
Activity
| • | During Q2 2020, we performed various asset optimization projects and proactive maintenance, and plan to continue this activity through the remainder of the year. |
Sales
| • | Crude oil in Australia is priced with reference to Dated Brent. During the quarter, we realized a $21.42 premium to average Dated Brent prices. |
| • | Quarter-over-quarter sales decreased due to lower sales volumes resulting from fewer liftings in the current quarter, combined with a decrease in Dated Brent pricing. |
| • | For the three and six months ended 2020 compared to the same periods in the prior year, sales decreased on a per unit and dollar basis due to the timing of liftings combined with a decrease in Dated Brent pricing. |
Royalties and transportation
| • | Our production in Australia is not subject to royalties or transportation expense as crude oil is sold directly at the Wandoo B platform. |
Operating
| • | Operating expenses are deferred on the balance sheet until oil is sold at which point the related expenses are recognized into income. |
| • | Q2 2020 operating expense decreased compared to Q1 2020 and increased compared to Q2 2019 primarily due to the timing of maintenance activity. |
| • | Operating expense for the six months ended June 30, 2020 remained relatively consistent with the comparable period in the prior year. |
General and administration
| • | Fluctuations in general and administration expense for all comparable periods are primarily due to the timing of expenditures and allocations from our corporate segment. |
Current income taxes
| • | In Australia, current income taxes include both Petroleum Resource Rent Tax ("PRRT") and corporate income taxes. PRRT is a profit based tax applied at a rate of 40% on sales less eligible expenditures, including operating expenses and capital expenditures. Corporate income taxes are applied at a rate of 30% on taxable income after eligible deductions, which includes PRRT paid. |
| • | Full year effective tax rates are estimated each quarter based on forecasted commodity prices and operational results. The estimated full year effective tax rate is applied on a pro-rata basis to quarterly results. As such, fluctuations between the reporting periods occur due to changes in estimated tax rates. |
| • | For 2020, the effective rate on current taxes, inclusive of corporate allocations, is expected to be between 23% and 27% of pre-tax fund flows from operations. This is subject to change in response to production variations, commodity price fluctuations, the timing of capital expenditures, and other eligible in-country adjustments. |
| Vermilion Energy Inc. ■ Page 29 ■ 2020 Second Quarter Report |
United States Business Unit
| Overview |
| • | Entered the United States in 2014 and acquired additional producing assets in the Hilight field in 2018. |
| • | Interests include approximately 134,400 net acres of land (66% undeveloped) in the Powder River Basin of northeastern Wyoming. |
| • | Tight oil development targeting the Turner Sands at depths of approximately 1,500m (East Finn) and 2,600m (Hilight). |
| Operational and financial review |
United States business unit ($M except as indicated) | Q2 2020 | Q1 2020 | Q2 2019 | Q2/20 vs. Q1/20 | Q2/20 vs. Q2/19 | YTD 2020 | YTD 2019 | 2020 vs. 2019 | |||||
| Production and sales | |||||||||||||
| Crude oil (bbls/d) | 3,977 | 2,487 | 2,483 | 59.9% | 60.2% | 3,232 | 2,115 | 52.8% | |||||
| NGLs (bbls/d) | 1,340 | 1,079 | 754 | 24.2% | 77.7% | 1,209 | 841 | 43.8% | |||||
| Natural gas (mmcf/d) | 8.35 | 6.72 | 7.06 | 24.3% | 18.3% | 7.53 | 6.48 | 16.2% | |||||
| Total (boe/d) | 6,708 | 4,685 | 4,414 | 43.2% | 52.0% | 5,697 | 4,036 | 41.2% | |||||
| Production mix (% of total) | |||||||||||||
| Crude oil | 59 | % | 53 | % | 56 | % | 57 | % | 52 | % | |||
| NGLs | 20 | % | 23 | % | 17 | % | 21 | % | 21 | % | |||
| Natural gas | 21 | % | 24 | % | 27 | % | 22 | % | 27 | % | |||
| Activity | |||||||||||||
| Capital expenditures | 14,194 | 45,349 | 12,964 | (68.7)% | 9.5% | 59,543 | 33,000 | 80.4% | |||||
| Acquisitions | 749 | 5,858 | 1,217 | 6,607 | 1,260 | ||||||||
| Gross wells drilled | — | 9.00 | 1.00 | 9.00 | 4.00 | ||||||||
| Net wells drilled | — | 8.90 | 1.00 | 8.90 | 4.00 | ||||||||
| Financial results | |||||||||||||
| Sales | 15,874 | 15,828 | 18,355 | 0.3% | (13.5)% | 31,702 | 33,252 | (4.7)% | |||||
| Royalties | (3,836 | ) | (4,016 | ) | (4,583 | ) | (4.5)% | (16.3)% | (7,852 | ) | (8,516 | ) | (7.8)% |
| Operating | (3,765 | ) | (5,549 | ) | (3,542 | ) | (32.1)% | 6.3% | (9,314 | ) | (6,974 | ) | 33.6% |
| General and administration | (1,796 | ) | (1,970 | ) | (1,571 | ) | (8.8)% | 14.3% | (3,766 | ) | (3,462 | ) | 8.8% |
| Fund flows from operations | 6,008 | 4,293 | 8,659 | 39.9% | (30.6)% | 10,301 | 14,300 | (28.0)% | |||||
| Netbacks ($/boe) | |||||||||||||
| Sales | 26.00 | 37.12 | 45.69 | (30.0)% | (43.1)% | 30.58 | 45.52 | (32.8)% | |||||
| Royalties | (6.28 | ) | (9.42 | ) | (11.41 | ) | (33.3)% | (45.0)% | (7.57 | ) | (11.66 | ) | (35.1)% |
| Operating | (6.17 | ) | (13.01 | ) | (8.82 | ) | (52.6)% | (30.0)% | (8.98 | ) | (9.55 | ) | (6.0)% |
| General and administration | (2.94 | ) | (4.62 | ) | (3.91 | ) | (36.4)% | (24.8)% | (3.63 | ) | (4.74 | ) | (23.4)% |
| Fund flows from operations netback | 9.84 | 10.07 | 21.55 | (2.3)% | (54.3)% | 9.95 | 19.57 | (49.2)% | |||||
| Realized prices | |||||||||||||
| Crude oil ($/bbl) | 40.20 | 53.92 | 70.98 | (25.4)% | (43.4)% | 45.48 | 70.05 | (35.1)% | |||||
| NGLs ($/bbl) | 4.78 | 21.45 | 17.49 | (77.7)% | (72.7)% | 12.22 | 21.73 | (43.8)% | |||||
| Natural gas ($/mcf) | 0.98 | 2.49 | 1.74 | (60.6)% | (43.7)% | 1.65 | 2.67 | (38.2)% | |||||
| Total ($/boe) | 26.00 | 37.12 | 45.69 | (30.0)% | (43.1)% | 30.58 | 45.52 | (32.8)% | |||||
| Reference prices | |||||||||||||
| WTI (US $/bbl) | 27.85 | 46.17 | 59.81 | (39.7)% | (53.4)% | 37.01 | 57.36 | (35.5)% | |||||
| WTI ($/bbl) | 38.62 | 62.06 | 80.00 | (37.8)% | (51.7)% | 50.54 | 76.48 | (33.9)% | |||||
| Henry Hub (US $/mcf) | 1.72 | 1.95 | 2.64 | (11.8)% | (34.8)% | 1.83 | 2.89 | (36.7)% | |||||
| Henry Hub ($/mcf) | 2.38 | 2.62 | 3.53 | (9.2)% | (32.6)% | 2.50 | 3.86 | (35.2)% | |||||
| Vermilion Energy Inc. ■ Page 30 ■ 2020 Second Quarter Report |
Production
| • | Q2 2020 production increased 43% from the prior quarter and 52% year-over-year. The increase was due to production contributions from our Q1 2020 drilling campaign as the remaining six (6.0 net) wells of our nine (8.9 net) well program were completed in the second quarter and brought on production. The increase was partially offset by natural decline. |
Activity
| • | During Q2 2020, we completed and brought on production six (6.0 net) wells. This constitutes the completion of our planned drilling and completion activities for 2020 in the United States. |
Sales
| • | The price of our crude oil in the United States is directly linked to WTI and subject to local market differentials within the United States. The price of our natural gas in the United States is based on the Henry Hub index. |
| • | Q2 2020 sales remained relatively consistent compared to Q1 2020 as a result of higher production which was offset by lower realized prices. |
| • | For the three and six months ended June 30, 2020 versus the prior year comparable periods, sales decreased primarily due to lower realized prices which were partially offset by higher production. |
Royalties
| • | Our production in the United States is subject to federal and private royalties, severance tax, and ad valorem tax. In Hilight, approximately 65% of the current production is subject to Fee royalties, 30% to Federal royalties and the remainder to State royalties. In East Finn, approximately 70% of the current production is subject to Federal royalties with the remainder split between State and Fee royalties. |
| • | For the three and six months ended June 30, 2020, royalties as a percentage of sales remained relatively consistent versus comparable periods. |
Operating
| • | Operating expense decreased in Q2 2020 compared to Q1 2020 on a dollar and per unit basis primarily due to higher maintenance activity in |
Q1 2020.
| • | Operating expense remained relatively consistent in Q2 2020 versus Q2 2019. |
| • | Operating expense increased for the six months ended June 30, 2020 versus the comparable period in 2019 due to higher maintenance activity in Q1 2020. |
General and administration
| • | Fluctuations in general and administration expense for all comparable periods are primarily due to the timing of expenditures and allocations from our corporate segment. |
Current income taxes
| • | As a result of our tax pools in the United States, we do not expect to incur current income taxes in the United States Business Unit for the foreseeable future. |
| Vermilion Energy Inc. ■ Page 31 ■ 2020 Second Quarter Report |
Corporate
| Overview |
| • | Our Corporate segment includes costs related to our global hedging program, financing expenses, and general and administration expenses that are primarily incurred in Canada and are not directly related to the operations of our business units. Gains or losses relating to Vermilion's global hedging program are allocated to Vermilion's business units for statutory reporting and income tax purposes. |
| • | Results of our activities in Central and Eastern Europe are also included in the Corporate segment. |
| Operational and financial review |
Corporate ($M) | Q2 2020 | Q1 2020 | Q2 2019 | YTD 2020 | YTD 2019 | |||||
| Production and sales | ||||||||||
| Condensate (bbls/d) | 1 | — | — | 1 | — | |||||
| Natural gas (mmcf/d) | 2.89 | 3.27 | — | 3.08 | — | |||||
| Total (boe/d) | 483 | 546 | — | 514 | — | |||||
| Activity | ||||||||||
| Capital expenditures | 1,805 | 2,253 | 8,755 | 4,058 | 12,363 | |||||
| Acquisitions | 1,359 | 21 | — | 1,380 | — | |||||
| Gross wells drilled | — | — | 3.00 | — | 3.00 | |||||
| Net wells drilled | — | — | 2.30 | — | 2.30 | |||||
| Financial results | ||||||||||
| Sales | 428 | 1,079 | — | 1,507 | — | |||||
| Royalties | (178 | ) | (299 | ) | — | (477 | ) | — | ||
| Sales of purchased commodities | 16,118 | 56,108 | 75,335 | 72,226 | 104,874 | |||||
| Purchased commodities | (16,118 | ) | (56,108 | ) | (75,335 | ) | (72,226 | ) | (104,874 | ) |
| Operating | (164 | ) | (90 | ) | (9 | ) | (254 | ) | (240 | ) |
| General and administration recovery | (604 | ) | (1,495 | ) | 1,086 | (2,099 | ) | 466 | ||
| Current income taxes | (102 | ) | (233 | ) | (104 | ) | (335 | ) | (254 | ) |
| Interest expense | (17,887 | ) | (19,982 | ) | (21,568 | ) | (37,869 | ) | (42,547 | ) |
| Realized gain on derivatives | 54,704 | 49,419 | 14,191 | 104,123 | 24,539 | |||||
| Realized foreign exchange gain (loss) | 3,972 | 8,523 | (1,569 | ) | 12,495 | (3,619 | ) | |||
| Realized other income (expense) | 231 | (3,309 | ) | 191 | (3,078 | ) | 7,075 | |||
| Fund flows from operations | 40,400 | 33,613 | (7,782 | ) | 74,013 | (14,580 | ) | |||
| Vermilion Energy Inc. ■ Page 32 ■ 2020 Second Quarter Report |
Production
| • | Q2 2020 production averaged 483 boe/d, representing a slight decrease from the prior quarter, primarily due to unplanned downtime. |
Activity
| • | During Q2 2020, we continued to progress our permitting and regulatory efforts for future drilling locations across Central and Eastern Europe, in addition to performing various maintenance activities in Hungary. |
Sales, royalties, and operating expense
| • | Sales, royalties, and operating expense in the corporate segment relate to natural gas production in Hungary. |
| • | Sales of natural gas in Hungary are priced with reference to the TTF index less adjustments for processing. During the quarter we realized a price of $1.60/mcf versus the $2.39/mcf benchmark price. |
| • | The calculation for royalties on natural gas in Hungary incorporates the Dated Brent benchmark prices and as a result the quarterly realized royalty percentage will fluctuate depending on the relative pricing for TTF as compared to Dated Brent. From Q1 2020 to Q2 2020, TTF decreased by a higher rate compared to Dated Brent benchmark prices, as such royalties as a percentage of sales increased for this same period. |
| • | Operating expense relates to contract operating costs, which equated to $3.73/boe during Q2 2020. |
Purchased commodities
| • | Purchased commodities and the associated sales relate to amounts purchased from third parties, primarily to manage positions on pipelines in North America. There is no net impact on fund flows from operations. |
General and administration
| • | Fluctuations in general and administration expense for the three and six months ended June 30, 2020 versus all comparable periods were due to allocations to the various business unit segments. |
Current income taxes
| • | Taxes in our corporate segment relate to holding companies that pay current taxes in foreign jurisdictions. |
Interest expense
| • | Interest expense in Q2 2020 decreased compared to Q1 2020 due to declining market interest rates in response to COVID-19. |
| • | Interest expense decreased for the three and six months ended June 30, 2020 versus the same prior year comparable periods due to the impact of the USD-to-EUR cross-currency interest rate swaps entered into in Q2 2019. These cross-currency interest rate swaps were terminated during June 2020. |
Realized gain on derivatives
| • | The realized gain on derivatives for the three and six months ended June 30, 2020 is related to receipts for European natural gas and crude oil hedges, the receipt of $16.8 million (US $12.7 million) due to the reset the Euro principal amount of the CAD-to-EUR cross currency interest rate swap in Q1 2020, and the receipt of $25.5 million (US $18.2 million) as a result of a number of transactions that resulted in the termination of the USD-to-CAD and CAD-to-EUR cross currency interest swaps in Q2 2020. |
| • | A listing of derivative positions as at June 30, 2020 is included in “Supplemental Table 2” of this MD&A. |
Realized other income (expense)
| • | Realized other income (expense) for the six months ended June 30, 2020, relates primarily to amounts uncertain to be received pursuant to a negotiated settlement of a legal matter. |
| Vermilion Energy Inc. ■ Page 33 ■ 2020 Second Quarter Report |
Financial Performance Review
| ($M except per share) | Q2 2020 | Q1 2020 | Q4 2019 | Q3 2019 | Q2 2019 | Q1 2019 | Q4 2018 | Q3 2018 | ||||||||
| Petroleum and natural gas sales | 193,013 | 328,314 | 388,802 | 391,935 | 428,043 | 481,083 | 456,939 | 508,411 | ||||||||
| Net earnings (loss) | (71,290 | ) | (1,318,504 | ) | 1,477 | (10,229 | ) | 2,004 | 39,547 | 323,373 | (15,099 | ) | ||||
| Net earnings (loss) per share | ||||||||||||||||
| Basic | (0.45 | ) | (8.42 | ) | 0.01 | (0.07 | ) | 0.01 | 0.26 | 2.12 | (0.10 | ) | ||||
| Diluted | (0.45 | ) | (8.42 | ) | 0.01 | (0.07 | ) | 0.01 | 0.26 | 2.10 | (0.10 | ) | ||||
The following table shows the calculation of fund flows from operations:
| Q2 2020 | Q1 2020 | Q2 2019 | YTD 2020 | YTD 2019 | ||||||||||||||||
| $M | $/boe | $M | $/boe | $M | $/boe | $M | $/boe | $M | $/boe | |||||||||||
| Petroleum and natural gas sales | 193,013 | 21.40 | 328,314 | 36.35 | 428,043 | 46.40 | 521,327 | 28.88 | 909,126 | 48.61 | ||||||||||
| Royalties | (16,352 | ) | (1.81 | ) | (31,125 | ) | (3.45 | ) | (38,113 | ) | (4.13 | ) | (47,477 | ) | (2.63 | ) | (81,497 | ) | (4.36 | ) |
| Petroleum and natural gas revenues | 176,661 | 19.59 | 297,189 | 32.90 | 389,930 | 42.27 | 473,850 | 26.25 | 827,629 | 44.25 | ||||||||||
| Transportation | (16,365 | ) | (1.81 | ) | (17,330 | ) | (1.92 | ) | (20,750 | ) | (2.25 | ) | (33,695 | ) | (1.87 | ) | (37,450 | ) | (2.00 | ) |
| Operating | (99,175 | ) | (11.00 | ) | (121,138 | ) | (13.41 | ) | (101,881 | ) | (11.04 | ) | (220,313 | ) | (12.21 | ) | (224,303 | ) | (11.99 | ) |
| General and administration | (16,912 | ) | (1.88 | ) | (13,317 | ) | (1.47 | ) | (15,697 | ) | (1.70 | ) | (30,229 | ) | (1.67 | ) | (28,755 | ) | (1.54 | ) |
| PRRT | (3,219 | ) | (0.36 | ) | (9,256 | ) | (1.02 | ) | (8,268 | ) | (0.90 | ) | (12,475 | ) | (0.69 | ) | (18,668 | ) | (1.00 | ) |
| Corporate income taxes | (158 | ) | (0.02 | ) | (574 | ) | (0.06 | ) | (11,841 | ) | (1.28 | ) | (732 | ) | (0.04 | ) | (27,591 | ) | (1.48 | ) |
| Interest expense | (17,887 | ) | (1.98 | ) | (19,982 | ) | (2.21 | ) | (21,568 | ) | (2.34 | ) | (37,869 | ) | (2.10 | ) | (42,547 | ) | (2.28 | ) |
| Realized gain on derivative instruments | 54,704 | 6.07 | 49,419 | 5.47 | 14,191 | 1.54 | 104,123 | 5.77 | 24,539 | 1.31 | ||||||||||
| Realized foreign exchange gain (loss) | 3,972 | 0.44 | 8,523 | 0.94 | (1,569 | ) | (0.17 | ) | 12,495 | 0.69 | (3,619 | ) | (0.19 | ) | ||||||
| Realized other income (expense) | 231 | 0.03 | (3,309 | ) | (0.37 | ) | 191 | 0.02 | (3,078 | ) | (0.17 | ) | 7,075 | 0.38 | ||||||
| Fund flows from operations | 81,852 | 9.08 | 170,225 | 18.85 | 222,738 | 24.15 | 252,077 | 13.96 | 476,310 | 25.46 | ||||||||||
Fluctuations in fund flows from operations may occur as a result of changes in production levels, commodity prices, and costs to produce petroleum and natural gas. In addition, fund flows from operations may be affected by the timing of crude oil shipments in Australia and France. When crude oil inventory is built up, the related operating expense, royalties, and depletion expense are deferred and carried as inventory on the consolidated balance sheet. When the crude oil inventory is subsequently drawn down, the related expenses are recognized.
The following table shows a reconciliation from fund flows from operations to net (loss) earnings:
| ($M) | Q2 2020 | Q1 2020 | Q2 2019 | YTD 2020 | YTD 2019 | |||||
| Fund flows from operations | 81,852 | 170,225 | 222,738 | 252,077 | 476,310 | |||||
| Equity based compensation | (9,164 | ) | (12,997 | ) | (14,593 | ) | (22,161 | ) | (37,436 | ) |
| Unrealized (loss) gain on derivative instruments | (3,771 | ) | 9,316 | (30,605 | ) | 5,545 | (44,882 | ) | ||
| Unrealized foreign exchange (loss) gain | (7,410 | ) | (9,982 | ) | 41,798 | (17,392 | ) | 65,056 | ||
| Unrealized other expense | (215 | ) | (209 | ) | (69 | ) | (424 | ) | (274 | ) |
| Accretion | (7,288 | ) | (9,738 | ) | (8,147 | ) | (17,026 | ) | (16,133 | ) |
| Depletion and depreciation | (106,707 | ) | (157,807 | ) | (184,131 | ) | (264,514 | ) | (361,160 | ) |
| Deferred tax | 51,126 | 257,542 | (24,987 | ) | 308,668 | (39,930 | ) | |||
| Impairment | (69,713 | ) | (1,564,854 | ) | — | (1,634,567 | ) | — | ||
| Net (loss) earnings | (71,290 | ) | (1,318,504 | ) | 2,004 | (1,389,794 | ) | 41,551 | ||
Fluctuations in net income from period-to-period are caused by changes in both cash and non-cash based income and charges. Cash based items are reflected in fund flows from operations. Non-cash items include: equity based compensation expense, unrealized gains and losses on derivative instruments, unrealized foreign exchange gains and losses, accretion, depletion and depreciation expense, and deferred taxes. In addition, non-cash items may also include gains resulting from business combinations or charges resulting from impairment or impairment reversals.
Equity based compensation
Equity based compensation expense relates primarily to non-cash compensation expense attributable to long-term incentives granted to directors, officers, and employees under security-based arrangements.
| Vermilion Energy Inc. ■ Page 34 ■ 2020 Second Quarter Report |
Equity based compensation expense in the three and six months ended June 30, 2020 decreased due to the lower value of VIP awards outstanding in the current periods.
Unrealized gain or loss on derivative instruments
Unrealized gain or loss on derivative instruments arise as a result of changes in forecasts for future prices and rates. As Vermilion uses derivative instruments to manage the commodity price exposure of our future crude oil and natural gas production, we will normally recognize unrealized gains on derivative instruments when future commodity price forecasts decline and vice-versa. As derivative instruments are settled, the unrealized gain or loss previously recognized is reversed, and the settlement results in a realized gain or loss on derivative instruments.
USD-to-CAD cross currency interest rate swaps are entered into on a monthly basis to hedge the foreign exchange movements on USD borrowings on our revolving credit facility. As such, unrealized gains and losses on our cross currency interest swaps are offset by unrealized losses and gains on foreign exchange relating to the underlying USD borrowings from our revolving credit facility.
For the three months ended June 30, 2020, we recognized a net unrealized loss on derivative instruments of $3.8 million. This primarily consists of a $56.8 million unrealized loss due to crude oil and European natural gas commodity derivative instruments partially offset by unrealized gains of $23.1 million from our USD-to-CAD cross currency interest rate and foreign exchange swaps, $6.0 million from our equity swaps and $21.6 million due to the settlement of the CAD-to-EUR cross currency interest rate swaps.
For the six months ended June 30, 2020, we recognized a net unrealized gain on derivative instruments of $5.5 million. This primarily consists of unrealized gains of $19.6 million due to our crude oil and European natural gas commodity derivative instruments and $43.3 million from our
USD-to-CAD cross currency interest rate and foreign exchange swaps, offset by unrealized losses of $57.8 million from our equity swaps.
Unrealized foreign exchange gains or losses
As a result of Vermilion’s international operations, Vermilion has monetary assets and liabilities denominated in currencies other than the Canadian dollar. These monetary assets and liabilities include cash, receivables, payables, long-term debt, derivative instruments and intercompany loans. Unrealized foreign exchange gains and losses result from translating these monetary assets and liabilities from their underlying currency to the Canadian dollar.
In 2020, unrealized foreign exchange gains and losses primarily resulted from:
| • | The translation of Euro denominated intercompany loans from Vermilion Energy Inc. to our international subsidiaries. An appreciation in the Euro against the Canadian dollar will result in an unrealized foreign exchange gain (and vice-versa). Under IFRS, the offsetting foreign exchange loss or gain is recorded as a currency translation adjustment within other comprehensive income. As a result, consolidated comprehensive income reflects the offsetting of these translation adjustments while net earnings reflects only the parent company's side of the translation. |
| • | The translation of USD borrowings on our revolving credit facility. The unrealized foreign exchange gains or losses on these borrowings are offset by unrealized derivative gains or losses on associated USD-to-CAD cross currency interest rate swaps (discussed further below). |
| • | The translation of our USD denominated senior unsecured notes for the period from December 31, 2018 to June 12, 2019. Effective |
June 12, 2019, the USD senior notes were hedged by a USD-to-CAD cross currency interest rate swap which was terminated in Q2 2020.
For the three months ended June 30, 2020, we recognized a net unrealized foreign exchange loss of $7.4 million. The impact of the Euro weakening 1.8% against the Canadian dollar resulted in a $6.2 million unrealized loss on our intercompany loans and an unrealized loss of $15.3 million on our USD borrowings from our revolving credit facility. These losses were offset by an unrealized gain on our senior unsecured notes of $14.1 million.
For the six months ended June 30, 2020, we recognized a net unrealized foreign exchange loss of $17.4 million. This was due to an unrealized loss of $44.0 million on our USD borrowings from our revolving credit facility. This was offset by the impact of the Euro strengthening 5.0% against the Canadian dollar which resulted in a $12.5 million unrealized gain on our intercompany loans and an unrealized gain on our senior unsecured notes of $14.1 million.
As at June 30, 2020, a $0.01 appreciation of the Euro against the Canadian dollar would result in a $1.3 million increase to net earnings as a result of an unrealized gain on foreign exchange. In contrast, a $0.01 appreciation of the US dollar against the Canadian dollar would result in a $3.4 million decrease to net earnings as a result of an unrealized loss on foreign exchange.
| Vermilion Energy Inc. ■ Page 35 ■ 2020 Second Quarter Report |
Accretion
Accretion expense is recognized to update the present value of the asset retirement obligation balance. Accretion expense in Q2 2020 decreased compared to Q1 2020 and Q2 2019 primarily due to a strengthening Canadian dollar versus the Euro. For the six months ended June 30, 2020, accretion expense remained relatively consistent versus comparable periods.
Depletion and depreciation
Depletion and depreciation expense is recognized to allocate the cost of capital assets over the useful life of the respective assets. Depletion and depreciation expense per unit of production is determined for each depletion unit (which are groups of assets within a specific production area that have similar economic lives) by dividing the sum of the net book value of capital assets and future development costs by total proved plus probable reserves.
Fluctuations in depletion and depreciation expense are primarily the result of changes in produced crude oil and natural gas volumes and changes in depletion and depreciation per unit. Fluctuations in depletion and depreciation per unit are the result of changes in reserves, depletable base (net book value of capital assets and future development costs), and relative production mix.
Depletion and depreciation on a per boe basis for Q2 2020 of $11.83 decreased from $17.47 in Q1 2020 primarily due to impairment charges taken in the first quarter of 2020. For the three and six months ended June 30, 2020, depletion and depreciation on a per boe basis of $11.83 decreased from $19.96 in the respective comparable period in 2019 primarily due to impairment charges taken in the first quarter of 2020.
Deferred tax
Deferred tax assets arise when the tax basis of an asset exceeds its accounting basis (known as a deductible temporary difference). Conversely, deferred tax liabilities arise when the tax basis of an asset is less than its accounting basis (known as a taxable temporary difference). Deferred tax assets are recognized only to the extent that it is probable that there are future taxable profits against which the deductible temporary difference can be utilized. Deferred tax assets and liabilities are measured at the enacted or substantively enacted tax rate that is expected to apply when the asset is realized, or the liability is settled.
As such, fluctuations in deferred tax expenses and recoveries primarily arise as a result of: changes in the accounting basis of an asset or liability without a corresponding tax basis change (e.g. when derivative assets and liabilities are marked-to-market or when accounting depletion differs from tax depletion), changes in available tax losses (e.g. if they are utilized to offset taxable income), changes in estimated future taxable profits resulting in a derecognition or recognition of deferred tax assets, and changes in enacted or substantively enacted tax rates.
For the three and six months ended June 30, 2020, a deferred tax recovery was recognized of $51.1 million and $308.7 million respectively. The recovery for the three months ended June 30, 2020 primarily related to the buildup of non-expiring tax losses. The recovery for the six months ended primarily related to the impairment losses recognized in Q1 2020 and the buildup of non-expiring tax losses, partially offset by derecognition of a portion of non-expiring tax loss pools in Canada ($18.9 million), Ireland ($80.4 million), and Australia ($38.8 million) as there is uncertainty as to Vermilion's ability to fully utilize such losses based on commodity price forecasts as at June 30, 2020.
Impairment
Impairment losses are recognized when indicators of impairment arise and the carrying amount of a cash generating unit ("CGU") exceeds its recoverable amount, determined as the higher of fair value less costs of disposal or value-in-use.
In the first quarter of 2020, indicators of impairment were present due to global commodity price forecasts deteriorating from a decrease in demand and an increase of supply around the world. As a result of the indicators of impairment, the Company performed an impairment test on all CGUs whereby the recoverable amount of each CGU was compared against its carrying amount. The recoverable amounts were determined using fair value less costs to sell, which considered future after-tax cash flows from proved plus probable reserves and an after-tax discount rate of 11.5%. Based on the results of the impairment tests completed, the Company recognized non-cash impairment charges of $1.2 billion (net of $0.4 billion income tax recovery).
In the second quarter of 2020, indicators of impairment were present due to the Company’s market capitalization falling below the carrying value of its net assets as at June 30, 2020. As a result of the indicators of impairment, the Company performed an impairment test. The recoverable amount was determined using fair value less costs to sell, which considered future after-tax cash flows from proved plus probable reserves and an after-tax discount rate of 11.5%. Based on the results of the impairment tests completed, the Company recognized non-cash impairment charges of $53.1 million (net of $16.6 million income tax recovery).
| Vermilion Energy Inc. ■ Page 36 ■ 2020 Second Quarter Report |
Financial Position Review
| Balance sheet strategy |
We regularly review whether our forecast of fund flows from operations is sufficient to finance planned capital expenditures, dividends, and abandonment and reclamation expenditures. To the extent that fund flows from operations forecasts are not expected to be sufficient to fulfill such expenditures, we will evaluate our ability to finance any shortfall by reducing some or all categories of expenditures, reducing or eliminating dividends, with issuances of equity, or with debt (including borrowing using the unutilized capacity of our existing revolving credit facility). We have a long-term goal of maintaining a ratio of net debt to fund flows from operations of 1.5.
Due to the significant decline in commodity prices following the outbreak of COVID-19 and the ensuing OPEC+ price war, our ratio of net debt to fund flows from operations continues to remain beyond our target of 1.5 and was 3.16 at June 30, 2020. We responded to this rapid change in market conditions by significantly reducing our cost structure, including by suspending our monthly dividend payment, reducing our capital expenditures by $90 million (based on the mid-point of our $350 to $370 million guidance), and identified in excess of $35 million in expense savings to be executed in 2020. Going forward, we will continue to monitor for changes in forecasted fund flows from operations and as appropriate will adjust our exploration and development capital plans (and associated growth targets) to minimize any further increase to debt. As commodity prices improve, we intend to strengthen our balance sheet through the reduction of debt and will continue to target a ratio of net debt to fund flows from operations of less than 1.5.
| Net debt |
Net debt is reconciled to long-term debt, as follows:
| As at | ||||
| ($M) | Jun 30, 2020 | Dec 31, 2019 | ||
| Long-term debt | 2,135,443 | 1,924,665 | ||
| Current liabilities | 368,382 | 416,210 | ||
| Current assets | (342,383 | ) | (347,681 | ) |
| Net debt | 2,161,442 | 1,993,194 | ||
| Ratio of net debt to four quarter trailing fund flows from operations | 3.16 | 2.20 | ||
As at June 30, 2020, net debt increased to $2.2 billion (December 31, 2019 - $2.0 billion) primarily due to the impact of increased borrowings on
long-term debt. The ratio of net debt to four quarter trailing fund flows from operations increased to 3.16 (December 31, 2019 - 2.20) due to the increase in net debt combined with lower four quarter trailing fund flows from operations.
| Long-term debt |
The balances recognized on our balance sheet are as follows:
| As at | ||||
| ($M) | Jun 30, 2020 | Dec 31, 2019 | ||
| Revolving credit facility | 1,730,082 | 1,539,225 | ||
| Senior unsecured notes | 405,361 | 385,440 | ||
| Long-term debt | 2,135,443 | 1,924,665 | ||
| Vermilion Energy Inc. ■ Page 37 ■ 2020 Second Quarter Report |
Revolving Credit Facility
In Q1 2020, we negotiated an extension to our $2.1 billion revolving credit facility to extend the maturity to May 31, 2024. All other terms within the facility remained the same.
As at June 30, 2020, Vermilion had in place a bank revolving credit facility maturing May 31, 2024 with terms and outstanding positions as follows:
| As at | ||||
| ($M) | Jun 30, 2020 | Dec 31, 2019 | ||
| Total facility amount | 2,100,000 | 2,100,000 | ||
| Amount drawn | (1,730,082 | ) | (1,539,225 | ) |
| Letters of credit outstanding | (21,975 | ) | (10,230 | ) |
| Unutilized capacity | 347,943 | 550,545 | ||
As at June 30, 2020, the revolving credit facility was subject to the following financial covenants:
| As at | |||||
| Financial covenant | Limit | Jun 30, 2020 | Dec 31, 2019 | ||
| Consolidated total debt to consolidated EBITDA | Less than 4.0 | 2.83 | 1.94 | ||
Consolidated total senior debt to consolidated EBITDA | Less than 3.5 | 2.30 | 1.56 | ||
| Consolidated EBITDA to consolidated interest expense | Greater than 2.5 | 10.57 | 13.40 | ||
Our financial covenants include financial measures defined within our revolving credit facility agreement that are not defined under IFRS. These financial measures are defined by our revolving credit facility agreement as follows:
| • | Consolidated total debt: Includes all amounts classified as “Long-term debt”, “Current portion of long-term debt”, and “Lease obligations” (including the current portion included within "Accounts payable and accrued liabilities" but excluding operating leases as defined under IAS 17) on our balance sheet. |
| • | Consolidated total senior debt: Defined as consolidated total debt excluding unsecured and subordinated debt. |
| • | Consolidated EBITDA: Defined as consolidated net earnings before interest, income taxes, depreciation, accretion and certain other non-cash items, adjusted for the impact of the acquisition of a material subsidiary. |
| • | Total interest expense: Includes all amounts classified as "Interest expense", but excluding interest on operating leases as defined under IAS 17. |
In addition, our revolving credit facility has provisions relating to our liability management ratings in Alberta and Saskatchewan whereby if our security adjusted liability management ratings fall below specified limits in a province, a portion of the asset retirement obligations are included in the definitions of consolidated total debt and consolidated total senior debt. An event of default occurs if our security adjusted liability management ratings breach additional lower limits for a period greater than 90 days. As of June 30, 2020, Vermilion's liability management ratings were higher than the specified levels, and as such, no amounts relating to asset retirement obligations were included in the calculation of consolidated total debt and consolidated total senior debt.
Due to the OPEC+ price war in the first quarter of 2020 and the ongoing COVID-19 pandemic, worldwide oil and natural gas prices have significantly declined. The impacts of these decreases has had an impact on the Company's financial position for the six months ended June 30, 2020 and is expected to have a significant impact on our forecasted cash flows and earnings. The Company is currently in compliance with all financial covenants related to its revolving credit facility, but is at risk of breaching one or more of the financial covenants if the depressed worldwide oil and natural gas prices persist. If we believe we are at risk of being in non-compliance with our financial covenants, we will approach our lending syndicate and request temporary covenant relief or other measures to ensure the credit facility remains available. There is no certainty that discussions surrounding covenant relief or other measures would be successful.
Senior Unsecured Notes
On March 13, 2017, Vermilion issued US $300.0 million of senior unsecured notes at par. The notes bear interest at a rate of 5.625% per annum, paid semi-annually on March 15 and September 15, and mature on March 15, 2025. As direct senior unsecured obligations of Vermilion, the notes rank equally in right of payment with existing and future senior indebtedness of the Company.
The senior unsecured notes were recognized at amortized cost and include the transaction costs directly related to the issuance.
Vermilion may, at its option, redeem the senior unsecured notes prior to maturity as follows:
| • | On or after March 15, 2020, Vermilion may redeem some or all of the senior unsecured notes at the redemption prices set forth in the following table, plus any accrued and unpaid interest. |
| Vermilion Energy Inc. ■ Page 38 ■ 2020 Second Quarter Report |
| Year | Redemption price | |
| 2020 | 104.219 | % |
| 2021 | 102.813 | % |
| 2022 | 101.406 | % |
| 2023 and thereafter | 100.000 | % |
Cross currency interest rate swaps
On June 12, 2019, Vermilion entered into a series of cross currency interest rate swaps with a syndicate of banks. Vermilion applied hedge accounting to these derivative instruments. The cross currency interest rate swaps had an original maturity of March 15, 2025.
The USD-to-CAD cross currency interest swaps were designated as the hedging instrument in a cash flow hedge while the CAD-to-EUR cross currency interest rate swaps were designated as the hedging instrument in a net investment hedge.
During the quarter ended June 30, 2020, Vermilion executed a number of transactions that resulted in a termination of the cross currency interest rate swaps in exchange for $42.3 million ($16.8 million received in the three months ended March 30, 2020 and $25.5 million received in the three months ended June 30, 2020). As a result of the termination, Vermilion has discontinued hedge accounting and amounts previously recognized for the hedge reserve within accumulated other comprehensive income will be reclassified in to net income over the remaining life of the senior unsecured notes.
| Shareholders' capital |
In total, dividends declared for the six months ended June 30, 2020 were $90.1 million.
The following table outlines our dividend payment history:
| Date | Monthly dividend per unit or share |
| January 2003 to December 2007 | $0.170 |
| January 2008 to December 2012 | $0.190 |
| January 2013 to December 2013 | $0.200 |
| January 2014 to March 2018 | $0.215 |
| April 2018 to February 2020 | $0.230 |
| March 2020 | $0.115 |
In the current economic and commodity outlook following the outbreak of COVID-19, there was uncertainty regarding our ability to achieve a 100% payout ratio at a reasonable level of capital expenditures. Therefore, in the first quarter of 2020, we reduced our 2020 capital budget by $80 to $100 million and reduced our March dividend to $0.115. Subsequent to the first quarter of 2020, the board of directors suspended the monthly dividend as a further measure to strengthen the financial position of the Company during this period of weak commodity prices. We will evaluate our ability to finance any shortfall by reducing some or all categories of expenditures, reducing or eliminating dividends, with issuances of equity, or with debt (including borrowing using the unutilized capacity of our existing revolving credit facility). Our ability to restore a dividend will be dependent upon stronger commodity prices combined with a balance sheet that reflects the Company's ability to sustain such dividend over the long-term.
The following table reconciles the change in shareholders’ capital:
| Shareholders’ Capital | Number of Shares ('000s) | Amount ($M) | ||
| Balance at December 31, 2019 | 156,290 | 4,119,031 | ||
| Shares issued for the Dividend Reinvestment Plan | 619 | 8,277 | ||
| Vesting of equity based awards | 905 | 43,474 | ||
| Equity based compensation | 226 | 2,118 | ||
| Share-settled dividends on vested equity based awards | 267 | 1,360 | ||
| Balance as at June 30, 2020 | 158,307 | 4,174,260 | ||
As at June 30, 2020, there were approximately 4.4 million equity based compensation awards outstanding. As at July 24, 2020, there were approximately 158.3 million common shares issued and outstanding.
We have a normal course issuer bid ("NCIB") approved by the Toronto Stock Exchange ("TSX") that allows us to purchase up to 7,750,000 common shares (representing approximately 5% of shares outstanding common shares) beginning August 9, 2019 and ending August 8, 2020. Any common shares that are purchased under the NCIB will be canceled upon their purchase. As at June 30, 2020, no shares have been purchased pursuant to the NCIB.
| Vermilion Energy Inc. ■ Page 39 ■ 2020 Second Quarter Report |
At Vermilion's Annual General and Special Meeting held on April 28, 2020 shareholders of the Company approved a $3.7 billion reduction in the stated capital of Vermilion's common shares, with the $3.7 billion reduction deducted from the stated capital account maintained for the common shares of Vermilion and an offsetting increase to the contributed surplus account of Vermilion. The transaction did not result in an adjustment to the financial statements under IFRS.
Asset Retirement Obligations
As at June 30, 2020, asset retirement obligations were $395.9 million compared to $618.2 million as at December 31, 2019. The decrease in asset retirement obligations is primarily attributable to an increase in the credit spread from December 31, 2019 to June 30, 2020.
The present value of the obligation is calculated using a credit-adjusted risk-free rate, calculated using a credit spread added to risk-free rates based on long-term, risk-free government bonds. Vermilion's credit spread is determined as the yield to maturity on its senior unsecured notes as at the reporting period.
The risk-free rates and credit spread used as inputs to discount the obligations were as follows:
| Jun 30, 2020 | Dec 31, 2019 | Change | ||||
| Country specific risk-free rate | ||||||
| Canada | 1.0 | % | 1.7 | % | (0.7 | )% |
| France | 0.5 | % | 0.9 | % | (0.4 | )% |
| Netherlands | (0.4 | )% | (0.1 | )% | (0.3 | )% |
| Germany | 0.0% | 0.3 | % | (0.3 | )% | |
| Ireland | 0.3 | % | 0.6 | % | (0.3 | )% |
| Australia | 1.2 | % | 1.6 | % | (0.4 | )% |
| United States | 1.4 | % | 2.4 | % | (1.0 | )% |
| Credit spread added to above noted risk-free rates | 9.1 | % | 5.3 | % | 3.8 | % |
| Vermilion Energy Inc. ■ Page 40 ■ 2020 Second Quarter Report |
Risks and Uncertainties
Vermilion is exposed to various market and operational risks. For a discussion of these risks, please see Vermilion's MD&A and Annual Information Form, each for the year ended December 31, 2019 available on SEDAR at www.sedar.com or on Vermilion’s website at www.vermilionenergy.com.
| COVID-19 |
The emergence of COVID-19 has resulted in emergency actions by governments worldwide, which has had an effect in all of our operating jurisdictions. The actions taken by these governments have typically included, but is not limited to travel bans, mandatory and self-imposed quarantines and isolations, social distancing, and the closing of non-essential businesses which has had significant negative effects on economies, including a substantial decline in crude oil and natural gas demand.
The full extent of the risks surrounding the severity and timing of the COVID-19 pandemic is continually evolving and is not fully known at this time; therefore, there is significant risk and uncertainty which may have a material and adverse effect on our operations. The following risks disclosed in our Annual Information Form for the year ended December 31, 2019 may be exacerbated as a result of the COVID-19 pandemic: market risks related to the volatility of oil and gas prices, volatility of foreign exchange rates, volatility of the market price of common shares, and hedging arrangements; operational risks related to increasing operating costs or declines in production levels, operator performance and payment delays, and government regulations; financing risks related to declaration and payment of dividends, ability to obtain additional financing, ability to service debt, and variations in interest rates and foreign exchanges rates; and other risks related to cyber-security as our workforce moves to remote connections, accounting adjustments, effectiveness of internal controls, and reliance on key personnel, management, and labour.
Off Balance Sheet Arrangements
We have not entered into any guarantee or off balance sheet arrangements that would materially impact our financial position or results of operations.
Critical Accounting Estimates
The preparation of financial statements in accordance with IFRS requires us to make estimates. Critical accounting estimates are those accounting estimates that require us to make assumptions about matters that are highly uncertain at the time the estimate is made and a different estimate could have been made in the current period or the estimate could change period-to-period.
The carrying amount of asset retirement obligations
The carrying amount of asset retirement obligations ($395.9 million as at June 30, 2020) is the present value of estimated future costs, discounted from the estimated abandonment date using a credit-adjusted risk-free rate. Estimated future costs are based on our assessment of regulatory requirements and the present condition of our assets. The estimated abandonment date is based on the reserve life of the associated assets. The credit-adjusted risk-free rate is based on prevailing interest rates for the appropriate term, risk-free government bonds adjusted for our estimated credit spread (determined by reference to the trading prices for debt issued by similarly rated independent oil and gas producers, including our own senior unsecured notes). Changes in these estimates would result in a change in the carrying amount of asset retirement obligations and capital assets and, to a significantly lesser degree, future accretion and depletion expense.
The estimated credit-adjusted risk-free rate may change from period to period in response to market conditions in Canada and the international jurisdictions that we operate in. A 0.5% increase or decrease in the credit-adjusted risk-free rate would decrease or increase asset retirement obligations by approximately $26.4 million.
The recognition of deferred tax assets
In Ireland, we have $1.0 billion of non-expiring tax loss pools where no deferred tax assets have been recognized ($247.8 million of deferred tax assets if fully recognized) as there is uncertainty on our ability to fully use these losses based on estimated future taxable profits. Estimated future taxable profits are calculated using proved and probable reserves and forecast pricing for European natural gas. The carrying value of deferred tax assets may change from period-to-period due to changes in forecast pricing. A 5% increase in forecast sales would increase deferred tax assets (with a corresponding deferred tax recovery) by approximately $15.7 million.
In Canada, we have $103.2 million of tax pools where $25.5 million of deferred tax assets has not been recognized as there is uncertainty on our ability to fully use these losses based on estimated future taxable profits. Estimated future taxable profits are calculated using proved and probable reserves and forecast pricing applicable to our Canadian operations. A 5% increase or decrease in forecast sales would increase or decrease deferred tax assets (with a corresponding deferred tax recovery or expense) by approximately $11.6 million or $17.3 million, respectively.
| Vermilion Energy Inc. ■ Page 41 ■ 2020 Second Quarter Report |
The estimated recoverable amount of cash generating units
Each reporting period, we assess our cash generating units for indicators of impairment or impairment reversal. If an indicator of impairment or impairment reversal is identified, we estimate the recoverable amount of the cash generating unit.
In the first quarter of 2020, indicators of impairment were present due to global commodity price forecasts deteriorating from a decrease in demand and an increase of supply around the world. As a result of the indicators of impairment, the Company performed an impairment test on all CGUs whereby the recoverable amount of each CGU was compared against its carrying amount. The recoverable amounts were determined using fair value less costs to sell, which considered future after-tax cash flows from proved plus probable reserves and an after-tax discount rate of 11.5%. Based on the results of the impairment tests completed, the Company recognized non-cash impairment charges of $1.2 billion (net of $0.4 billion income tax recovery). Changes in any of the key judgments, such as a revision in reserves, changes in forecast commodity prices, foreign exchange rates, capital or operating costs would impact the estimated recoverable amount. For impairment charges recorded in the first quarter of 2020, a 1% increase in the assumed after-tax discount rate would reduce the estimated recoverable amount by $147.5 million (resulting in a $1.7 billion impairment) while a 5% decrease in revenues (due to a decrease in commodity price forecasts or reserve estimates) would reduce the estimated recoverable amount by $310.4 million (resulting in a $1.9 billion impairment).
In the second quarter of 2020, indicators of impairment were present due to the Company’s market capitalization falling below the carrying value of its net assets as at June 30, 2020. As a result of the indicators of impairment, the Company performed an impairment test. The recoverable amount was determined using fair value less costs to sell, which considered future after-tax cash flows from proved plus probable reserves and an after-tax discount rate of 11.5%. Based on the results of the impairment tests completed, the Company recognized non-cash impairment charges of $53.1 million (net of $16.6 million income tax recovery). For impairment charges recorded in the second quarter of 2020, a 1% increase in the assumed after-tax discount rate would reduce the estimated recoverable amount by $14.0 million (resulting in a $83.7 million impairment) while a 5% decrease in revenues (due to a decrease in commodity price forecasts or reserve estimates) would reduce the estimated recoverable amount by $37.5 million (resulting in a $107.2 million impairment).
Internal Control Over Financial Reporting
Other than Vermilion's response to COVID-19, there has been no change in Vermilion’s internal control over financial reporting ("ICFR") during the period covered by this MD&A that materially affected, or is reasonably likely to materially affect, its internal control over financial reporting.
Due to the COVID-19 pandemic, Vermilion has implemented social distancing measures which require deemed non-critical employees to work remotely and has encouraged critical staff to do the same. These measures may have an effect on the design and performance of internal controls throughout the Company and will be continually monitored to mitigate any risks associated with changes in its control environment.
Recently Adopted Accounting Pronouncements
Vermilion did not adopt any new accounting pronouncements as at June 30, 2020.
Disclosure Controls and Procedures
Our officers have established and maintained disclosure controls and procedures and evaluated the effectiveness of these controls in conjunction with our filings.
As of June 30, 2020, we have evaluated the effectiveness of the design and operation of our disclosure controls and procedures. Based on this evaluation, the President, for this specific purpose of acting in the capacity of Chief Executive Officer, and Chief Financial Officer have concluded and certified that our disclosure controls and procedures are effective.
| Vermilion Energy Inc. ■ Page 42 ■ 2020 Second Quarter Report |
Supplemental Table 1: Netbacks
The following table includes financial statement information on a per unit basis by business unit. Liquids includes crude oil, condensate, and NGLs. Natural gas sales volumes have been converted on a basis of six thousand cubic feet of natural gas to one barrel of oil equivalent.
| Q2 2020 | YTD 2020 | Q2 2019 | YTD 2019 | |||||||
| Liquids | Natural Gas | Total | Liquids | Natural Gas | Total | Total | Total | |||
| $/bbl | $/mcf | $/boe | $/bbl | $/mcf | $/boe | $/boe | $/boe | |||
| Canada | ||||||||||
| Sales | 23.24 | 1.63 | 17.41 | 32.05 | 1.76 | 22.84 | 38.04 | 38.95 | ||
| Royalties | (2.05) | (0.01) | (1.18) | (3.55) | (0.03) | (2.10) | (3.70 | ) | (4.14 | ) |
| Transportation | (2.41) | (0.17) | (1.82) | (2.52) | (0.19) | (1.93) | (1.75 | ) | (1.84 | ) |
| Operating | (11.73) | (1.28) | (9.96) | (13.12) | (1.31) | (10.88) | (10.79 | ) | (11.15 | ) |
| Operating netback | 7.05 | 0.17 | 4.45 | 12.86 | 0.23 | 7.93 | 21.80 | 21.82 | ||
| General and administration | (1.51) | (1.03) | (1.32 | ) | (0.91 | ) | ||||
| Fund flows from operations netback | 2.94 | 6.90 | 20.48 | 20.91 | ||||||
| France | ||||||||||
| Sales | 43.94 | — | 43.94 | 54.85 | — | 54.85 | 91.17 | 85.68 | ||
| Royalties | (8.87) | — | (8.87) | (9.41) | — | (9.41) | (11.72 | ) | (11.35 | ) |
| Transportation | (5.17) | — | (5.17) | (4.43) | — | (4.43) | (9.75 | ) | (6.26 | ) |
| Operating | (18.86) | — | (18.86) | (17.74) | — | (17.74) | (15.43 | ) | (15.39 | ) |
| Operating netback | 11.04 | — | 11.04 | 23.27 | — | 23.27 | 54.27 | 52.68 | ||
| General and administration | (6.59) | (4.76) | (3.83 | ) | (3.69 | ) | ||||
| Current income taxes | — | — | (5.77 | ) | (6.68 | ) | ||||
| Fund flows from operations netback | 4.45 | 18.51 | 44.67 | 42.31 | ||||||
| Netherlands | ||||||||||
| Sales | 14.32 | 2.45 | 14.69 | 39.40 | 3.40 | 20.63 | 34.91 | 43.28 | ||
| Royalties | — | (0.01) | (0.08) | — | (0.02) | (0.14) | (0.55 | ) | (0.67 | ) |
| Operating | — | (1.75) | (10.37) | — | (1.89) | (11.21) | (9.47 | ) | (10.03 | ) |
| Operating netback | 14.32 | 0.69 | 4.24 | 39.40 | 1.49 | 9.28 | 24.89 | 32.58 | ||
| General and administration | (0.29) | (0.52) | (0.87 | ) | (1.00 | ) | ||||
| Current income taxes | 0.35 | 0.18 | (3.17 | ) | (4.25 | ) | ||||
| Fund flows from operations netback | 4.30 | 8.94 | 20.85 | 27.33 | ||||||
| Germany | ||||||||||
| Sales | 34.32 | 2.40 | 21.33 | 45.18 | 3.39 | 27.95 | 48.65 | 52.57 | ||
| Royalties | (2.47) | (0.44) | (2.59) | (2.61) | (0.49) | (2.85) | (4.84 | ) | (5.68 | ) |
| Transportation | (8.60) | (0.49) | (4.90) | (10.03) | (0.38) | (4.64) | (2.49 | ) | (3.73 | ) |
| Operating | (20.51) | (3.09) | (19.24) | (21.51) | (2.69) | (17.78) | (16.80 | ) | (16.98 | ) |
| Operating netback | 2.74 | (1.62) | (5.40) | 11.03 | (0.17) | 2.68 | 24.52 | 26.18 | ||
| General and administration | (4.28) | (5.02) | (6.92 | ) | (6.19 | ) | ||||
| Fund flows from operations netback | (9.68) | (2.34) | 17.60 | 19.99 | ||||||
| Ireland | ||||||||||
| Sales | — | 2.08 | 12.43 | — | 3.42 | 20.50 | 34.75 | 43.19 | ||
| Transportation | — | (0.34) | (2.02) | — | (0.32) | (1.92) | (1.55 | ) | (1.52 | ) |
| Operating | — | (1.10) | (6.59) | — | (1.11) | (6.65) | (3.53 | ) | (4.23 | ) |
| Operating netback | — | 0.64 | 3.82 | — | 1.99 | 11.93 | 29.67 | 37.44 | ||
| General and administration | 0.18 | (0.23) | (0.32 | ) | (0.38 | ) | ||||
| Fund flows from operations netback | 4.00 | 11.70 | 29.35 | 37.06 | ||||||
| Vermilion Energy Inc. ■ Page 43 ■ 2020 Second Quarter Report |
| Q2 2020 | YTD 2020 | Q2 2019 | YTD 2019 | |||||||
| Liquids | Natural Gas | Total | Liquids | Natural Gas | Total | Total | Total | |||
| $/bbl | $/mcf | $/boe | $/bbl | $/mcf | $/boe | $/boe | $/boe | |||
| Australia | ||||||||||
| Sales | 61.91 | — | 61.91 | 80.55 | — | 80.55 | 99.39 | 94.21 | ||
| Operating | (22.93) | — | (22.93) | (27.96) | — | (27.96) | (18.77 | ) | (26.11 | ) |
| PRRT (1) | (6.93) | — | (6.93) | (12.44) | — | (12.44) | (19.18 | ) | (16.53 | ) |
| Operating netback | 32.05 | — | 32.05 | 40.15 | — | 40.15 | 61.44 | 51.57 | ||
| General and administration | (1.91) | (1.76) | (2.70 | ) | (1.95 | ) | ||||
| Current income taxes | (0.67) | (0.65) | (8.85 | ) | (6.65 | ) | ||||
| Fund flows from operations netback | 29.47 | 37.74 | 49.89 | 42.97 | ||||||
| United States | ||||||||||
| Sales | 31.28 | 0.98 | 26.00 | 36.42 | 1.65 | 30.58 | 45.69 | 45.52 | ||
| Royalties | (7.54) | (0.25) | (6.28) | (8.98) | (0.43) | (7.57) | (11.41 | ) | (11.66 | ) |
| Transportation | (0.97) | — | (0.77) | (0.58) | — | (0.45) | — | — | ||
| Operating | (6.38) | (0.90) | (6.17) | (9.10) | (1.43) | (8.98) | (8.82 | ) | (9.55 | ) |
| Operating netback | 16.39 | (0.17) | 12.78 | 17.76 | (0.21) | 13.58 | 25.46 | 24.31 | ||
| General and administration | (2.94) | (3.63) | (3.91 | ) | (4.74 | ) | ||||
| Fund flows from operations netback | 9.84 | 9.95 | 21.55 | 19.57 | ||||||
| Total Company | ||||||||||
| Sales | 30.22 | 1.85 | 21.40 | 40.97 | 2.39 | 28.88 | 46.40 | 48.61 | ||
| Realized hedging gain (loss) | 8.53 | 0.53 | 6.07 | 8.14 | 0.48 | 5.77 | 1.54 | 1.31 | ||
| Royalties | (3.15) | (0.04) | (1.81) | (4.48) | (0.07) | (2.63) | (4.13 | ) | (4.36 | ) |
| Transportation | (2.47) | (0.17) | (1.81) | (2.53) | (0.18) | (1.87) | (2.25 | ) | (2.00 | ) |
| Operating | (13.22) | (1.40) | (11.00) | (15.12) | (1.45) | (12.21) | (11.04 | ) | (11.99 | ) |
| PRRT (1) | (0.66) | — | (0.36) | (1.27) | — | (0.69) | (0.90 | ) | (1.00 | ) |
| Operating netback | 19.25 | 0.77 | 12.49 | 25.71 | 1.17 | 17.25 | 29.62 | 30.57 | ||
| General and administration | (1.88) | (1.67) | (1.70 | ) | (1.54 | ) | ||||
| Interest expense | (1.98) | (2.10) | (2.34 | ) | (2.28 | ) | ||||
| Realized foreign exchange loss | 0.44 | 0.69 | (0.17 | ) | (0.19 | ) | ||||
| Other income | 0.03 | (0.17) | 0.02 | 0.38 | ||||||
| Corporate income taxes | (0.02) | (0.04) | (1.28 | ) | (1.48 | ) | ||||
| Fund flows from operations netback | 9.08 | 13.96 | 24.15 | 25.46 | ||||||
| (1) | Vermilion considers Australian PRRT to be an operating item and, accordingly, has included PRRT in the calculation of operating netbacks. Current income taxes presented above excludes PRRT. |
| Vermilion Energy Inc. ■ Page 44 ■ 2020 Second Quarter Report |
Supplemental Table 2: Hedges
The prices in these tables may represent the weighted averages for several contracts with foreign currency amounts translated to the disclosure currency using forward rates as at the month-end date. The weighted average price for the portfolio of options listed below may not have the same payoff profile as the individual contracts. As such, the presentation of the weighted average prices is purely for indicative purposes.
The following tables outline Vermilion’s outstanding risk management positions as at June 30, 2020:
| Unit | Currency | Bought Put Volume | Weighted Average Bought Put Price | Sold Call Volume | Weighted Average Sold Call Price | Sold Put Volume | Weighted Average Sold Put Price | Sold Swap Volume | Weighted Average Sold Swap Price | Bought Swap Volume | Weighted Average Bought Swap Price | |||||||||||
| Dated Brent | ||||||||||||||||||||||
| Q3 2020 | bbl | USD | 5,500 | 30.25 | 5,500 | 36.91 | 5,500 | 22.20 | 2,118 | 29.64 | — | — | ||||||||||
| Q4 2020 | bbl | USD | 5,000 | 29.90 | 5,000 | 36.60 | 5,000 | 21.93 | 2,000 | 29.55 | — | — | ||||||||||
| Q1 2021 | bbl | USD | 1,000 | 28.00 | 1,000 | 32.50 | 1,000 | 18.00 | — | — | — | — | ||||||||||
| Q2 2021 | bbl | USD | 1,000 | 28.00 | 1,000 | 32.50 | 1,000 | 18.00 | — | — | — | — | ||||||||||
| Q3 2021 | bbl | USD | 1,000 | 28.00 | 1,000 | 32.50 | 1,000 | 18.00 | — | — | — | — | ||||||||||
| Q4 2021 | bbl | USD | 1,000 | 28.00 | 1,000 | 32.50 | 1,000 | 18.00 | — | — | — | — | ||||||||||
| Q1 2022 | bbl | USD | 1,000 | 28.00 | 1,000 | 32.50 | 1,000 | 18.00 | — | — | — | — | ||||||||||
| Q2 2022 | bbl | USD | 1,000 | 28.00 | 1,000 | 32.50 | 1,000 | 18.00 | — | — | — | — | ||||||||||
| WTI | ||||||||||||||||||||||
| Q3 2020 | bbl | USD | 7,000 | 39.32 | 7,000 | 45.20 | 7,000 | 32.52 | — | — | — | — | ||||||||||
| Q4 2020 | bbl | USD | 5,000 | 44.15 | 5,000 | 49.68 | 5,000 | 37.53 | — | — | — | — | ||||||||||
| 1-month WTI Calendar Spread | ||||||||||||||||||||||
| Q3 2020 | bbl | USD | 7,500 | (1.30 | ) | — | — | — | — | — | — | — | — | |||||||||
| AECO | ||||||||||||||||||||||
| Q3 2020 | mcf | CAD | — | — | — | — | — | — | 19,904 | 1.60 | — | — | ||||||||||
| Q4 2020 | mcf | CAD | — | — | — | — | — | — | 6,707 | 1.60 | — | — | ||||||||||
| Q2 2021 | mcf | CAD | — | — | — | — | — | — | 9,478 | 2.12 | — | — | ||||||||||
| Q3 2021 | mcf | CAD | — | — | — | — | — | — | 9,478 | 2.12 | — | — | ||||||||||
| Q4 2021 | mcf | CAD | — | — | — | — | — | — | 3,194 | 2.12 | — | — | ||||||||||
| AECO Basis (AECO less NYMEX Henry Hub) | ||||||||||||||||||||||
| Q3 2020 | mcf | USD | — | — | — | — | — | — | 50,000 | (1.12 | ) | — | — | |||||||||
| Q4 2020 | mcf | USD | — | — | — | — | — | — | 36,739 | (1.11 | ) | — | — | |||||||||
| Q1 2021 | mcf | USD | — | — | — | — | — | — | 30,000 | (1.11 | ) | — | — | |||||||||
| Q2 2021 | mcf | USD | — | — | — | — | — | — | 45,000 | (1.08 | ) | — | — | |||||||||
| Q3 2021 | mcf | USD | — | — | — | — | — | — | 45,000 | (1.08 | ) | — | — | |||||||||
| Q4 2021 | mcf | USD | — | — | — | — | — | — | 35,054 | (1.09 | ) | — | — | |||||||||
| Q1 2022 | mcf | USD | — | — | — | — | — | — | 30,000 | (1.10 | ) | — | — | |||||||||
| Q2 2022 | mcf | USD | — | — | — | — | — | — | 35,000 | (1.09 | ) | — | — | |||||||||
| Q3 2022 | mcf | USD | — | — | — | — | — | — | 35,000 | (1.09 | ) | — | — | |||||||||
| Q4 2022 | mcf | USD | — | — | — | — | — | — | 11,793 | (1.09 | ) | — | — | |||||||||
| NYMEX Henry Hub | ||||||||||||||||||||||
| Q3 2020 | mcf | USD | 125,000 | 1.73 | 20,000 | 2.15 | — | — | 30,000 | 2.13 | — | — | ||||||||||
| Q4 2020 | mcf | USD | 45,435 | 1.82 | 10,054 | 2.48 | — | — | 13,424 | 2.34 | — | — | ||||||||||
| Q1 2021 | mcf | USD | 5,000 | 2.90 | 5,000 | 3.15 | — | — | 5,000 | 3.00 | — | — | ||||||||||
| SoCal Border | ||||||||||||||||||||||
| Q4 2020 | bbl | USD | — | — | — | — | — | — | 3,315 | 3.40 | — | — | ||||||||||
| Q1 2021 | bbl | USD | — | — | — | — | — | — | 5,000 | 3.40 | — | — | ||||||||||
| Conway Propane | ||||||||||||||||||||||
| Q3 2020 | bbl | USD | — | — | — | — | — | — | 500 | 56% WTI | — | — | ||||||||||
| Q4 2020 | bbl | USD | — | — | — | — | — | — | 500 | 56% WTI | — | — | ||||||||||
| Q1 2021 | bbl | USD | — | — | — | — | — | — | 500 | 56% WTI | — | — | ||||||||||
| Vermilion Energy Inc. ■ Page 45 ■ 2020 Second Quarter Report |
| Unit | Currency | Bought Put Volume | Weighted Average Bought Put Price | Sold Call Volume | Weighted Average Sold Call Price | Sold Put Volume | Weighted Average Sold Put Price | Sold Swap Volume | Weighted Average Sold Swap Price | Bought Swap Volume | Weighted Average Bought Swap Price | |||||||||||
| NBP | ||||||||||||||||||||||
| Q3 2020 | mcf | EUR | 41,765 | 5.21 | 41,765 | 5.54 | 41,765 | 3.83 | — | — | — | — | ||||||||||
| Q4 2020 | mcf | EUR | 61,419 | 5.28 | 63,875 | 5.80 | 61,419 | 3.90 | — | — | — | — | ||||||||||
| Q1 2021 | mcf | EUR | 58,962 | 5.37 | 61,419 | 5.86 | 58,962 | 3.88 | — | — | — | — | ||||||||||
| Q2 2021 | mcf | EUR | 49,135 | 5.37 | 49,135 | 5.85 | 49,135 | 3.87 | — | — | — | — | ||||||||||
| Q3 2021 | mcf | EUR | 49,135 | 5.37 | 49,135 | 5.84 | 49,135 | 3.87 | — | — | — | — | ||||||||||
| Q4 2021 | mcf | EUR | 58,962 | 5.37 | 58,962 | 5.78 | 58,962 | 3.88 | — | — | — | — | ||||||||||
| Q1 2022 | mcf | EUR | 29,481 | 5.21 | 29,481 | 6.03 | 29,481 | 3.65 | 4,913 | 5.86 | — | — | ||||||||||
| Q2 2022 | mcf | EUR | 22,111 | 5.09 | 22,111 | 5.79 | 22,111 | 3.50 | 4,913 | 5.86 | — | — | ||||||||||
| Q3 2022 | mcf | EUR | 9,827 | 4.80 | 9,827 | 5.40 | 9,827 | 3.37 | 4,913 | 5.86 | — | — | ||||||||||
| Q4 2022 | mcf | EUR | 9,827 | 4.80 | 9,827 | 5.39 | 9,827 | 3.37 | 4,913 | 5.86 | — | — | ||||||||||
| Q1 2023 | mcf | EUR | 7,370 | 4.74 | 7,370 | 5.22 | 7,370 | 3.32 | — | — | — | — | ||||||||||
| NBP Basis (NBP less NYMEX Henry Hub) | ||||||||||||||||||||||
| Q3 2020 | mcf | USD | 15,000 | 2.61 | 15,000 | 3.98 | — | — | — | — | 15,000 | 2.02 | ||||||||||
| Q4 2020 | mcf | USD | 10,000 | 3.24 | 10,000 | 3.98 | — | — | — | — | — | — | ||||||||||
| TTF | ||||||||||||||||||||||
| Q3 2020 | mcf | EUR | 13,512 | 5.36 | 9,827 | 6.15 | 13,512 | 3.73 | 3,258 | 5.45 | — | — | ||||||||||
| Q4 2020 | mcf | EUR | 7,370 | 5.37 | 7,370 | 6.25 | 7,370 | 3.81 | — | — | — | — | ||||||||||
| Q2 2021 | mcf | EUR | 2,457 | 4.25 | 2,457 | 4.27 | 2,457 | 2.93 | — | — | — | — | ||||||||||
| Q3 2021 | mcf | EUR | 2,457 | 4.25 | 2,457 | 4.26 | 2,457 | 2.93 | — | — | — | — | ||||||||||
| Q1 2022 | mcf | EUR | 2,457 | 4.84 | 2,457 | 5.64 | 2,457 | 3.52 | — | — | — | — | ||||||||||
| Q2 2022 | mcf | EUR | 2,457 | 4.84 | 2,457 | 5.64 | 2,457 | 3.52 | — | — | — | — | ||||||||||
| Q3 2022 | mcf | EUR | 2,457 | 4.84 | 2,457 | 5.64 | 2,457 | 3.52 | — | — | — | — | ||||||||||
| Q4 2022 | mcf | EUR | 2,457 | 4.84 | 2,457 | 5.64 | 2,457 | 3.52 | — | — | — | — | ||||||||||
| Q1 2023 | mcf | EUR | 2,457 | 4.84 | 2,457 | 5.64 | 2,457 | 3.52 | — | — | — | — | ||||||||||
| TTF Basis (TTF less NYMEX Henry Hub) | ||||||||||||||||||||||
| Q3 2020 | mcf | USD | 2,500 | 3.50 | 2,500 | 4.00 | — | — | 5,000 | 3.21 | 7,500 | 2.02 | ||||||||||
| Cross Currency Interest Rate | Receive Notional Amount | Receive Rate | Pay Notional Amount | Pay Rate | |||||
| Swap | July 2020 | 704,196,350 | USD | LIBOR + 1.70% | 954,900,000 | CAD | CDOR + 1.40% | ||
| Foreign Currency Swaps | Average Rate | ||||||||
| Swap | July 2020 | 516,318,300 | USD | 700,000,000 | CAD | 1.36 | |||
| VET Equity Swaps | Initial Share Price | Share Volume | |||||||
| Swap | Jan 2020 - Sep 2021 | 20.9788 | CAD | 2,250,000 | |||||
| Swap | Jan 2020 - Oct 2021 | 22.4587 | CAD | 1,500,000 | |||||
The following sold option instruments allow the counterparties, at the specified date, to enter into a derivative instrument contract with Vermilion at the detailed terms:
| Period if Option Exercised | Unit | Currency | Option Expiration Date | Bought Put Volume | Weighted Average Bought Put Price | Sold Call Volume | Weighted Average Sold Call Price | Sold Put Volume | Weighted Average Sold Put Price | Swap Volume | Weighted Average Swap Price | ||||||||
| NYMEX (Henry Hub) | |||||||||||||||||||
| Nov 2020 - Oct 2021 | mcf | USD | 23-Oct-20 | — | — | — | — | — | — | 10,000 | 3.00 | ||||||||
| NBP | |||||||||||||||||||
| Oct 2020 - Jun 2022 | mcf | EUR | 30-Sep-20 | — | — | — | — | — | — | 2,457 | 6.15 | ||||||||
| Jan 2021 - Dec 2022 | mcf | EUR | 31-Dec-20 | — | — | — | — | — | — | 2,457 | 4.69 | ||||||||
| Vermilion Energy Inc. ■ Page 46 ■ 2020 Second Quarter Report |
Supplemental Table 3: Capital Expenditures and Acquisitions
By classification ($M) | Q2 2020 | Q1 2020 | Q2 2019 | YTD 2020 | YTD 2019 | |||||
| Drilling and development | 42,383 | 227,433 | 75,149 | 269,816 | 272,440 | |||||
| Exploration and evaluation | (109 | ) | 6,271 | 17,458 | 6,162 | 22,220 | ||||
| Capital expenditures | 42,274 | 233,704 | 92,607 | 275,978 | 294,660 | |||||
| Acquisitions | 2,932 | 11,337 | 8,623 | 14,269 | 24,650 | |||||
| Acquisitions | 2,932 | 11,337 | 8,623 | 14,269 | 24,650 | |||||
| By category ($M) | Q2 2020 | Q1 2020 | Q2 2019 | YTD 2020 | YTD 2019 | |||||
| Drilling, completion, new well equip and tie-in, workovers and recompletions | 21,954 | 208,164 | 70,636 | 230,118 | 245,194 | |||||
| Production equipment and facilities | 15,190 | 17,627 | 12,323 | 32,817 | 29,768 | |||||
| Seismic, studies, land and other | 5,130 | 7,913 | 9,648 | 13,043 | 19,698 | |||||
| Capital expenditures | 42,274 | 233,704 | 92,607 | 275,978 | 294,660 | |||||
| Acquisitions | 2,932 | 11,337 | 8,623 | 14,269 | 24,650 | |||||
| Total capital expenditures and acquisitions | 45,206 | 245,041 | 101,230 | 290,247 | 319,310 | |||||
| Capital expenditures by country ($M) | Q2 2020 | Q1 2020 | Q2 2019 | YTD 2020 | YTD 2019 | |||||
| Canada | 9,785 | 152,577 | 29,083 | 162,362 | 157,138 | |||||
| France | 5,603 | 11,257 | 25,671 | 16,860 | 47,757 | |||||
| Netherlands | 2,638 | 2,497 | 4,577 | 5,135 | 10,926 | |||||
| Germany | 3,345 | 7,789 | 9,234 | 11,134 | 12,278 | |||||
| Ireland | 704 | (20 | ) | 84 | 684 | 95 | ||||
| Australia | 4,200 | 12,002 | 2,239 | 16,202 | 21,103 | |||||
| United States | 14,194 | 45,349 | 12,964 | 59,543 | 33,000 | |||||
| Corporate | 1,805 | 2,253 | 8,755 | 4,058 | 12,363 | |||||
| Total capital expenditures | 42,274 | 233,704 | 92,607 | 275,978 | 294,660 | |||||
| Acquisitions by country ($M) | Q2 2020 | Q1 2020 | Q2 2019 | YTD 2020 | YTD 2019 | |||||
| Canada | 260 | 5,439 | 2,655 | 5,699 | 17,315 | |||||
| Netherlands | — | — | — | — | 908 | |||||
| Germany | 564 | 19 | 4,751 | 583 | 5,167 | |||||
| United States | 749 | 5,858 | 1,217 | 6,607 | 1,260 | |||||
| Corporate | 1,359 | 21 | — | 1,380 | — | |||||
| Total acquisitions | 2,932 | 11,337 | 8,623 | 14,269 | 24,650 | |||||
In 2020, included in cash expenditures on acquisitions of $14.3 million is: $0.9 million net received to vendors in relation to the purchase of assets from other oil and gas producers; $0.4 million in asset improvements incurred subsequent to acquisitions for compliance with safety, environmental, and Vermilion's operating standards; $8.3 million paid to acquire land; and $6.5 million relating to the carry component of farm-in arrangements.
| Vermilion Energy Inc. ■ Page 47 ■ 2020 Second Quarter Report |
Supplemental Table 4: Production
| Q2/20 | Q1/20 | Q4/19 | Q3/19 | Q2/19 | Q1/19 | Q4/18 | Q3/18 | Q2/18 | Q1/18 | Q4/17 | Q3/17 | |||||||||||||
| Canada | ||||||||||||||||||||||||
| Crude oil & condensate (bbls/d) | 27,592 | 27,401 | 27,399 | 27,682 | 28,844 | 29,164 | 29,557 | 28,477 | 17,009 | 9,272 | 9,703 | 9,288 | ||||||||||||
| NGLs (bbls/d) | 8,248 | 6,943 | 7,005 | 6,632 | 7,352 | 6,968 | 6,816 | 6,126 | 5,589 | 5,106 | 5,235 | 4,891 | ||||||||||||
| Natural gas (mmcf/d) | 164.08 | 151.16 | 145.14 | 145.14 | 151.87 | 151.37 | 146.65 | 136.77 | 127.32 | 106.21 | 107.91 | 103.92 | ||||||||||||
| Total (boe/d) | 63,187 | 59,537 | 58,593 | 58,504 | 61,507 | 61,360 | 60,814 | 57,397 | 43,817 | 32,078 | 32,923 | 31,499 | ||||||||||||
| % of consolidated | 64 | % | 63 | % | 61 | % | 60 | % | 60 | % | 59 | % | 60 | % | 59 | % | 55 | % | 46 | % | 45 | % | 46 | % |
| France | ||||||||||||||||||||||||
| Crude oil (bbls/d) | 7,046 | 9,957 | 10,264 | 10,347 | 9,800 | 11,342 | 11,317 | 11,407 | 11,683 | 11,037 | 11,215 | 10,918 | ||||||||||||
| Natural gas (mmcf/d) | — | — | — | — | — | 0.77 | 0.82 | — | — | — | — | — | ||||||||||||
| Total (boe/d) | 7,046 | 9,957 | 10,264 | 10,347 | 9,800 | 11,470 | 11,454 | 11,407 | 11,683 | 11,037 | 11,215 | 10,918 | ||||||||||||
| % of consolidated | 7 | % | 10 | % | 10 | % | 11 | % | 10 | % | 11 | % | 11 | % | 12 | % | 14 | % | 16 | % | 15 | % | 16 | % |
| Netherlands | ||||||||||||||||||||||||
| Condensate (bbls/d) | 87 | 87 | 90 | 82 | 100 | 93 | 112 | 84 | 87 | 77 | 105 | 74 | ||||||||||||
| Natural gas (mmcf/d) | 47.31 | 48.33 | 47.99 | 44.08 | 52.90 | 51.51 | 51.82 | 44.37 | 43.49 | 44.79 | 55.66 | 34.90 | ||||||||||||
| Total (boe/d) | 7,972 | 8,143 | 8,088 | 7,429 | 8,917 | 8,677 | 8,749 | 7,479 | 7,335 | 7,541 | 9,381 | 5,890 | ||||||||||||
| % of consolidated | 8 | % | 8 | % | 8 | % | 8 | % | 9 | % | 8 | % | 9 | % | 8 | % | 9 | % | 11 | % | 13 | % | 9 | % |
| Germany | ||||||||||||||||||||||||
| Crude oil (bbls/d) | 1,039 | 909 | 800 | 845 | 1,047 | 978 | 913 | 1,019 | 1,008 | 1,078 | 1,148 | 1,054 | ||||||||||||
| Natural gas (mmcf/d) | 13.23 | 14.64 | 15.44 | 14.54 | 14.56 | 16.71 | 16.94 | 14.88 | 14.63 | 16.19 | 18.19 | 20.12 | ||||||||||||
| Total (boe/d) | 3,244 | 3,349 | 3,373 | 3,269 | 3,474 | 3,763 | 3,736 | 3,498 | 3,447 | 3,777 | 4,180 | 4,407 | ||||||||||||
| % of consolidated | 3 | % | 3 | % | 3 | % | 3 | % | 3 | % | 4 | % | 4 | % | 4 | % | 4 | % | 5 | % | 6 | % | 7 | % |
| Ireland | ||||||||||||||||||||||||
| Natural gas (mmcf/d) | 38.57 | 41.38 | 42.30 | 43.21 | 49.21 | 51.71 | 52.03 | 51.38 | 56.56 | 60.87 | 56.23 | 49.04 | ||||||||||||
| Total (boe/d) | 6,428 | 6,896 | 7,049 | 7,202 | 8,201 | 8,619 | 8,672 | 8,563 | 9,426 | 10,144 | 9,372 | 8,173 | ||||||||||||
| % of consolidated | 6 | % | 7 | % | 7 | % | 7 | % | 8 | % | 8 | % | 9 | % | 9 | % | 12 | % | 14 | % | 13 | % | 12 | % |
| Australia | ||||||||||||||||||||||||
| Crude oil (bbls/d) | 5,299 | 4,041 | 4,548 | 5,564 | 6,689 | 5,862 | 4,174 | 4,704 | 4,132 | 4,971 | 4,993 | 5,473 | ||||||||||||
| % of consolidated | 5 | % | 4 | % | 5 | % | 6 | % | 6 | % | 6 | % | 4 | % | 5 | % | 5 | % | 7 | % | 7 | % | 8 | % |
| United States | ||||||||||||||||||||||||
| Crude oil (bbls/d) | 3,977 | 2,487 | 3,161 | 2,722 | 2,483 | 1,742 | 1,605 | 1,461 | 655 | 574 | 667 | 880 | ||||||||||||
| NGLs (bbls/d) | 1,340 | 1,079 | 1,156 | 1,140 | 754 | 929 | 998 | 714 | 62 | 20 | 43 | 56 | ||||||||||||
| Natural gas (mmcf/d) | 8.35 | 6.72 | 8.20 | 6.38 | 7.06 | 5.89 | 5.65 | 4.82 | 0.40 | 0.15 | 0.29 | 0.64 | ||||||||||||
| Total (boe/d) | 6,708 | 4,685 | 5,683 | 4,925 | 4,414 | 3,653 | 3,545 | 2,979 | 784 | 618 | 758 | 1,043 | ||||||||||||
| % of consolidated | 7 | % | 5 | % | 6 | % | 5 | % | 4 | % | 4 | % | 3 | % | 3 | % | 1 | % | 1 | % | 1 | % | 2 | % |
| Corporate | ||||||||||||||||||||||||
| Natural gas (mmcf/d) | 2.89 | 3.27 | 1.66 | — | — | — | 2.86 | 1.17 | — | — | — | — | ||||||||||||
| Total (boe/d) | 483 | 546 | 276 | — | — | — | 477 | 195 | — | — | — | — | ||||||||||||
| % of consolidated | — | — | — | — | — | — | — | — | — | — | — | — | ||||||||||||
| Consolidated | ||||||||||||||||||||||||
| Liquids (bbls/d) | 54,629 | 52,903 | 54,421 | 55,014 | 57,071 | 57,078 | 55,493 | 53,991 | 40,225 | 32,134 | 33,109 | 32,634 | ||||||||||||
| % of consolidated | 54 | % | 54 | % | 56 | % | 57 | % | 55 | % | 55 | % | 55 | % | 56 | % | 50 | % | 46 | % | 45 | % | 48 | % |
| Natural gas (mmcf/d) | 274.42 | 265.51 | 260.72 | 253.36 | 275.60 | 277.96 | 276.77 | 253.38 | 242.40 | 228.20 | 238.28 | 208.62 | ||||||||||||
| % of consolidated | 46 | % | 46 | % | 44 | % | 43 | % | 45 | % | 45 | % | 45 | % | 44 | % | 50 | % | 54 | % | 55 | % | 52 | % |
| Total (boe/d) | 100,366 | 97,154 | 97,875 | 97,239 | 103,003 | 103,404 | 101,621 | 96,222 | 80,625 | 70,167 | 72,821 | 67,403 | ||||||||||||
| Vermilion Energy Inc. ■ Page 48 ■ 2020 Second Quarter Report |
| YTD 2020 | 2019 | 2018 | 2017 | 2016 | 2015 | |||||||||||||
| Canada | ||||||||||||||||||
| Crude oil & condensate (bbls/d) | 27,496 | 28,266 | 21,154 | 9,051 | 9,171 | 11,357 | ||||||||||||
| NGLs (bbls/d) | 7,596 | 6,988 | 5,914 | 4,144 | 2,552 | 2,301 | ||||||||||||
| Natural gas (mmcf/d) | 157.62 | 148.35 | 129.37 | 97.89 | 84.29 | 71.65 | ||||||||||||
| Total (boe/d) | 61,362 | 59,979 | 48,630 | 29,510 | 25,771 | 25,598 | ||||||||||||
| % of consolidated | 62 | % | 60 | % | 56 | % | 45 | % | 40 | % | 46 | % | ||||||
| France | ||||||||||||||||||
| Crude oil (bbls/d) | 8,501 | 10,435 | 11,362 | 11,084 | 11,896 | 12,267 | ||||||||||||
| Natural gas (mmcf/d) | — | 0.19 | 0.21 | — | 0.44 | 0.97 | ||||||||||||
| Total (boe/d) | 8,501 | 10,467 | 11,396 | 11,085 | 11,970 | 12,429 | ||||||||||||
| % of consolidated | 9 | % | 10 | % | 13 | % | 16 | % | 19 | % | 23 | % | ||||||
| Netherlands | ||||||||||||||||||
| Condensate (bbls/d) | 87 | 91 | 90 | 90 | 88 | 99 | ||||||||||||
| Natural gas (mmcf/d) | 47.82 | 49.10 | 46.13 | 40.54 | 47.82 | 44.76 | ||||||||||||
| Total (boe/d) | 8,057 | 8,274 | 7,779 | 6,847 | 8,058 | 7,559 | ||||||||||||
| % of consolidated | 8 | % | 8 | % | 9 | % | 10 | % | 13 | % | 14 | % | ||||||
| Germany | ||||||||||||||||||
| Crude oil (bbls/d) | 974 | 917 | 1,004 | 1,060 | — | — | ||||||||||||
| Natural gas (mmcf/d) | 13.94 | 15.31 | 15.66 | 19.39 | 14.90 | 15.78 | ||||||||||||
| Total (boe/d) | 3,297 | 3,468 | 3,614 | 4,291 | 2,483 | 2,630 | ||||||||||||
| % of consolidated | 3 | % | 3 | % | 4 | % | 6 | % | 4 | % | 5 | % | ||||||
| Ireland | ||||||||||||||||||
| Natural gas (mmcf/d) | 39.97 | 46.57 | 55.17 | 58.43 | 50.89 | 0.03 | ||||||||||||
| Total (boe/d) | 6,662 | 7,762 | 9,195 | 9,737 | 8,482 | 5 | ||||||||||||
| % of consolidated | 7 | % | 8 | % | 11 | % | 14 | % | 13 | % | — | |||||||
| Australia | ||||||||||||||||||
| Crude oil (bbls/d) | 4,670 | 5,662 | 4,494 | 5,770 | 6,304 | 6,454 | ||||||||||||
| % of consolidated | 5 | % | 6 | % | 5 | % | 8 | % | 10 | % | 12 | % | ||||||
| United States | ||||||||||||||||||
| Crude oil (bbls/d) | 3,232 | 2,531 | 1,078 | 666 | 393 | 231 | ||||||||||||
| NGLs (bbls/d) | 1,209 | 996 | 452 | 50 | 29 | 7 | ||||||||||||
| Natural gas (mmcf/d) | 7.53 | 6.89 | 2.78 | 0.39 | 0.21 | 0.05 | ||||||||||||
| Total (boe/d) | 5,697 | 4,675 | 1,992 | 781 | 457 | 247 | ||||||||||||
| % of consolidated | 6 | % | 5 | % | 2 | % | 1 | % | 1 | % | — | |||||||
| Corporate | ||||||||||||||||||
| Natural gas (mmcf/d) | 3.08 | 0.42 | 1.02 | — | — | — | ||||||||||||
| Total (boe/d) | 514 | 70 | 169 | — | — | — | ||||||||||||
| % of consolidated | — | — | — | — | — | — | ||||||||||||
| Consolidated | ||||||||||||||||||
| Liquids (bbls/d) | 53,766 | 55,886 | 45,548 | 31,915 | 30,433 | 32,716 | ||||||||||||
| % of consolidated | 54 | % | 56 | % | 52 | % | 47 | % | 48 | % | 60 | % | ||||||
| Natural gas (mmcf/d) | 269.96 | 266.82 | 250.33 | 216.64 | 198.55 | 133.24 | ||||||||||||
| % of consolidated | 46 | % | 44 | % | 48 | % | 53 | % | 52 | % | 40 | % | ||||||
| Total (boe/d) | 98,760 | 100,357 | 87,270 | 68,021 | 63,526 | 54,922 | ||||||||||||
| Vermilion Energy Inc. ■ Page 49 ■ 2020 Second Quarter Report |
Non-GAAP Financial Measures
This MD&A includes references to certain financial measures which do not have standardized meanings and may not be comparable to similar measures presented by other issuers. These financial measures include fund flows from operations, a measure of profit or loss in accordance with IFRS 8 “Operating Segments” (please see Segmented Information in the Notes to the Consolidated Interim Financial Statements) and net debt, a measure of capital in accordance with IAS 1 “Presentation of Financial Statements” (please see Capital Disclosures in the Notes to the Consolidated Interim Financial Statements).
In addition, this MD&A includes financial measures which are not specified, defined, or determined under IFRS and are therefore considered non-GAAP financial measures and may not be comparable to similar measures presented by other issuers. These non-GAAP financial measures include:
Acquisitions: The sum of acquisitions from the Consolidated Statements of Cash Flows, Vermilion common shares issued as consideration, the estimated value of contingent consideration, the amount of acquiree's outstanding long-term debt assumed plus or net of acquired working capital deficit or surplus. We believe that including these components provides a useful measure of the economic investment associated with our acquisition activity.
Capital expenditures: The sum of drilling and development and exploration and evaluation from the Consolidated Statements of Cash Flows. We consider capital expenditures to be a useful measure of our investment in our existing asset base. Capital expenditures are also referred to as E&D capital.
Cash dividends per share: Represents cash dividends declared per share and is a useful measure of the dividends a common shareholder was entitled to during the period.
Covenants: The financial covenants on our revolving credit facility contain non-GAAP measures. The definitions for these financial covenants are included in Financial Position Review.
Diluted shares outstanding: The sum of shares outstanding at the period end plus outstanding awards under the VIP, based on current estimates of future performance factors and forfeiture rates.
Free cash flow: Represents fund flows from operations in excess of capital expenditures. We use free cash flow to determine the funding available for investing and financing activities, including payment of dividends, repayment of long-term debt, reallocation to existing business units, and deployment into new ventures. We also assess free cash flow as a percentage of fund flows from operations, which is a measure of the percentage of fund flows from operations that is retained for incremental investing and financing activities.
Fund flows from operations per basic and diluted share: Management assesses fund flows from operations on a per share basis as we believe this provides a measure of our operating performance after taking into account the issuance and potential future issuance of Vermilion common shares. Fund flows from operations per basic share is calculated by dividing fund flows from operations by the basic weighted average shares outstanding as defined under IFRS. Fund flows from operations per diluted share is calculated by dividing fund flows from operations by the sum of basic weighted average shares outstanding and incremental shares issuable under the equity based compensation plans as determined using the treasury stock method.
Net dividends: We define net dividends as dividends declared less proceeds received for the issuance of shares pursuant to the Dividend Reinvestment Plan. Management monitors net dividends and net dividends as a percentage of fund flows from operations to assess our ability to pay dividends.
Operating netback: Sales less royalties, operating expense, transportation costs, PRRT, and realized hedging gains and losses presented on a per unit basis. Management assesses operating netback as a measure of the profitability and efficiency of our field operations. In contrast, fund flows from operations netback also includes general and administration expense, corporate income taxes, and interest. Fund flows from operations netback is used by management to assess the profitability of our business units and Vermilion as a whole.
Payout: We define payout as net dividends plus drilling and development costs, exploration and evaluation costs, and asset retirement obligations settled. Management uses payout and payout as a percentage of fund flows from operations (also referred to as the payout or sustainability ratio) to assess the amount of cash distributed back to shareholders and re-invested in the business for maintaining production and organic growth.
Return on capital employed (ROCE): ROCE is a measure that we use to analyze our profitability and the efficiency of our capital allocation process. ROCE is calculated by dividing net earnings before interest and taxes ("EBIT") by average capital employed over the preceding twelve months. Capital employed is calculated as total assets less current liabilities while average capital employed is calculated using the balance sheets at the beginning and end of the twelve-month period.
| Vermilion Energy Inc. ■ Page 50 ■ 2020 Second Quarter Report |
The following tables reconcile net dividends, payout, and diluted shares outstanding from their most directly comparable GAAP measures as presented in our financial statements:
| ($M) | Q2 2020 | Q1 2020 | Q2 2019 | YTD 2020 | YTD 2019 | |||||
| Dividends declared | — | 90,067 | 106,884 | 90,067 | 212,433 | |||||
| Shares issued for the Dividend Reinvestment Plan | (632 | ) | (7,645 | ) | (8,773 | ) | (8,277 | ) | (15,877 | ) |
| Net dividends | — | 82,422 | 98,111 | 81,790 | 196,556 | |||||
| Drilling and development | 42,383 | 227,433 | 75,149 | 269,816 | 272,440 | |||||
| Exploration and evaluation | (109 | ) | 6,271 | 17,458 | 6,162 | 22,220 | ||||
| Asset retirement obligations settled | 970 | 3,732 | 4,907 | 4,702 | 8,504 | |||||
| Payout | 42,612 | 319,858 | 195,625 | 362,470 | 499,720 | |||||
| % of fund flows from operations | 52 | % | 188 | % | 88 | % | 144 | % | 105 | % |
| ('000s of shares) | Q2 2020 | Q1 2020 | Q2 2019 | |||
| Shares outstanding | 158,307 | 157,020 | 155,032 | |||
| Potential shares issuable pursuant to the VIP | 5,783 | 3,405 | 3,601 | |||
| Diluted shares outstanding | 164,090 | 160,425 | 158,633 | |||
The following tables reconciles the calculation of return on capital employed:
| Twelve Months Ended | ||||
| ($M) | Jun 30, 2020 | Jun 30, 2019 | ||
| Net (loss) earnings | (1,398,546 | ) | 349,825 | |
| Taxes | (273,324 | ) | 154,232 | |
| Interest expense | 76,699 | 83,146 | ||
| EBIT | (1,595,171 | ) | 587,203 | |
| Average capital employed | 4,826,230 | 5,461,184 | ||
| Return on capital employed | (33 | )% | 11 | % |
| Vermilion Energy Inc. ■ Page 51 ■ 2020 Second Quarter Report |
Consolidated Interim Financial Statements
Consolidated Balance Sheet
thousands of Canadian dollars, unaudited
| Note | June 30, 2020 | December 31, 2019 | |||
| Assets | |||||
| Current | |||||
| Cash and cash equivalents | 4,786 | 29,028 | |||
| Accounts receivable | 233,013 | 211,409 | |||
| Crude oil inventory | 21,510 | 29,389 | |||
| Derivative instruments | 63,788 | 55,645 | |||
| Prepaid expenses | 19,286 | 22,210 | |||
| Total current assets | 342,383 | 347,681 | |||
| Derivative instruments | 25,562 | 20,127 | |||
| Deferred taxes | 3, 6 | 441,133 | 196,543 | ||
| Exploration and evaluation assets | 4 | 289,290 | 286,149 | ||
| Capital assets | 3 | 3,263,688 | 5,015,620 | ||
| Total assets | 4,362,056 | 5,866,120 | |||
| Liabilities | |||||
| Current | |||||
| Accounts payable and accrued liabilities | 309,594 | 312,442 | |||
| Dividends payable | 8 | — | 35,947 | ||
| Derivative instruments | 35,037 | 62,405 | |||
| Income taxes payable | 23,751 | 5,416 | |||
| Total current liabilities | 368,382 | 416,210 | |||
| Derivative instruments | 67,584 | 24,358 | |||
| Long-term debt | 7 | 2,135,443 | 1,924,665 | ||
| Lease obligations | 85,284 | 93,072 | |||
| Asset retirement obligations | 5 | 395,873 | 618,201 | ||
| Deferred taxes | 6 | 278,807 | 336,309 | ||
| Total liabilities | 3,331,373 | 3,412,815 | |||
| Shareholders' Equity | |||||
| Shareholders' capital | 8 | 4,174,260 | 4,119,031 | ||
| Contributed surplus | 52,304 | 75,735 | |||
| Accumulated other comprehensive income | 76,379 | 49,578 | |||
| Deficit | (3,272,260 | ) | (1,791,039 | ) | |
| Total shareholders' equity | 1,030,683 | 2,453,305 | |||
| Total liabilities and shareholders' equity | 4,362,056 | 5,866,120 | |||
Approved by the Board
| (Signed "Robert Michaleski”) | (Signed “Lorenzo Donadeo”) | |
| Robert Michaleski, Director | Lorenzo Donadeo, Director |
| Vermilion Energy Inc. ■ Page 52 ■ 2020 Second Quarter Report |
Consolidated Statements of Net (Loss) Earnings and Comprehensive Loss
thousands of Canadian dollars, except share and per share amounts, unaudited
| Three Months Ended | Six Months Ended | ||||||||
| Note | Jun 30, 2020 | Jun 30, 2019 | Jun 30, 2020 | Jun 30, 2019 | |||||
| Revenue | |||||||||
| Petroleum and natural gas sales | 193,013 | 428,043 | 521,327 | 909,126 | |||||
| Royalties | (16,352 | ) | (38,113 | ) | (47,477 | ) | (81,497 | ) | |
| Sales of purchased commodities | 16,118 | 75,335 | 72,226 | 104,874 | |||||
| Petroleum and natural gas revenue | 192,779 | 465,265 | 546,076 | 932,503 | |||||
| Expenses | |||||||||
| Purchased commodities | 16,118 | 75,335 | 72,226 | 104,874 | |||||
| Operating | 99,175 | 101,881 | 220,313 | 224,303 | |||||
| Transportation | 16,365 | 20,750 | 33,695 | 37,450 | |||||
| Equity based compensation | 9,164 | 14,593 | 22,161 | 37,436 | |||||
| (Gain) loss on derivative instruments | (50,933 | ) | 16,414 | (109,668 | ) | 20,343 | |||
| Interest expense | 17,887 | 21,568 | 37,869 | 42,547 | |||||
| General and administration | 16,912 | 15,697 | 30,229 | 28,755 | |||||
| Foreign exchange loss (gain) | 3,438 | (40,229 | ) | 4,897 | (61,437 | ) | |||
| Other (income) expense | (16 | ) | (122 | ) | 3,502 | (6,801 | ) | ||
| Accretion | 5 | 7,288 | 8,147 | 17,026 | 16,133 | ||||
| Depletion and depreciation | 3, 4 | 106,707 | 184,131 | 264,514 | 361,160 | ||||
| Impairment | 3 | 69,713 | — | 1,634,567 | — | ||||
| 311,818 | 418,165 | 2,231,331 | 804,763 | ||||||
| (Loss) earnings before income taxes | (119,039 | ) | 47,100 | (1,685,255 | ) | 127,740 | |||
| Income tax (recovery) expense | 3, 6 | ||||||||
| Deferred | (51,126 | ) | 24,987 | (308,668 | ) | 39,930 | |||
| Current | 3,377 | 20,109 | 13,207 | 46,259 | |||||
| (47,749 | ) | 45,096 | (295,461 | ) | 86,189 | ||||
| Net (loss) earnings | (71,290 | ) | 2,004 | (1,389,794 | ) | 41,551 | |||
| Other comprehensive loss | |||||||||
| Currency translation adjustments | (22,989 | ) | (15,671 | ) | 66,422 | (59,605 | ) | ||
| Unrealized (loss) gain on hedges | (37,178 | ) | 1,168 | (39,621 | ) | 1,168 | |||
| Other comprehensive loss | (131,457 | ) | (12,499 | ) | (1,362,993 | ) | (16,886 | ) | |
| Net (loss) earnings per share | |||||||||
| Basic | (0.45 | ) | 0.01 | (8.83 | ) | 0.27 | |||
| Diluted | (0.45 | ) | 0.01 | (8.83 | ) | 0.27 | |||
| Weighted average shares outstanding ('000s) | |||||||||
| Basic | 158,189 | 154,795 | 157,375 | 153,855 | |||||
| Diluted | 158,189 | 156,844 | 157,375 | 155,335 | |||||
| Vermilion Energy Inc. ■ Page 53 ■ 2020 Second Quarter Report |
Consolidated Statements of Cash Flows
thousands of Canadian dollars, unaudited
| Three Months Ended | Six Months Ended | ||||||||
| Note | Jun 30, 2020 | Jun 30, 2019 | Jun 30, 2020 | Jun 30, 2019 | |||||
| Operating | |||||||||
| Net (loss) earnings | (71,290 | ) | 2,004 | (1,389,794 | ) | 41,551 | |||
| Adjustments: | |||||||||
| Accretion | 5 | 7,288 | 8,147 | 17,026 | 16,133 | ||||
| Depletion and depreciation | 3, 4 | 106,707 | 184,131 | 264,514 | 361,160 | ||||
| Impairment | 3 | 69,713 | — | 1,634,567 | — | ||||
| Unrealized loss (gain) on derivative instruments | 3,771 | 30,605 | (5,545 | ) | 44,882 | ||||
| Equity based compensation | 9,164 | 14,593 | 22,161 | 37,436 | |||||
| Unrealized foreign exchange loss (gain) | 7,410 | (41,798 | ) | 17,392 | (65,056 | ) | |||
| Unrealized other expense | 215 | 69 | 424 | 274 | |||||
| Deferred taxes | 6 | (51,126 | ) | 24,987 | (308,668 | ) | 39,930 | ||
| Asset retirement obligations settled | 5 | (970 | ) | (4,907 | ) | (4,702 | ) | (8,504 | ) |
| Changes in non-cash operating working capital | (88,050 | ) | (47,741 | ) | 23,896 | (93,488 | ) | ||
| Cash flows (used in) from operating activities | (7,168 | ) | 170,090 | 271,271 | 374,318 | ||||
| Investing | |||||||||
| Drilling and development | 3 | (42,383 | ) | (75,149 | ) | (269,816 | ) | (272,440 | ) |
| Exploration and evaluation | 4 | 109 | (17,458 | ) | (6,162 | ) | (22,220 | ) | |
| Acquisitions | (2,932 | ) | (8,623 | ) | (14,269 | ) | (24,650 | ) | |
| Changes in non-cash investing working capital | (76,782 | ) | (15,485 | ) | (18,744 | ) | (18,370 | ) | |
| Cash flows used in investing activities | (121,988 | ) | (116,715 | ) | (308,991 | ) | (337,680 | ) | |
| Financing | |||||||||
| Borrowings on the revolving credit facility | 7 | 141,842 | 79,501 | 144,955 | 179,411 | ||||
| Payments on lease obligations | (6,224 | ) | (4,720 | ) | (13,450 | ) | (11,188 | ) | |
| Cash dividends | 8 | (17,425 | ) | (97,693 | ) | (117,737 | ) | (196,021 | ) |
| Cash flows from (used in) financing activities | 118,193 | (22,912 | ) | 13,768 | (27,798 | ) | |||
| Foreign exchange (loss) gain on cash held in foreign currencies | (886 | ) | (615 | ) | (290 | ) | (585 | ) | |
| Net change in cash and cash equivalents | (11,849 | ) | 29,848 | (24,242 | ) | 8,255 | |||
| Cash and cash equivalents, beginning of period | 16,635 | 5,216 | 29,028 | 26,809 | |||||
| Cash and cash equivalents, end of period | 4,786 | 35,064 | 4,786 | 35,064 | |||||
| Supplementary information for cash flows from operating activities | |||||||||
| Interest paid | 18,475 | 16,404 | 38,155 | 42,955 | |||||
| Income taxes (refunded) paid | (15,075 | ) | 41,077 | (5,128 | ) | 46,572 | |||
| Vermilion Energy Inc. ■ Page 54 ■ 2020 Second Quarter Report |
Consolidated Statements of Changes in Shareholders' Equity
thousands of Canadian dollars, unaudited
| Six Months Ended | |||||
| Note | Jun 30, 2020 | Jun 30, 2019 | |||
| Shareholders' capital | 8 | ||||
| Balance, beginning of period | 4,119,031 | 4,008,828 | |||
| Shares issued for the Dividend Reinvestment Plan | 8,277 | 15,877 | |||
| Vesting of equity based awards | 43,474 | 45,636 | |||
| Equity based compensation | 2,118 | 11,696 | |||
| Share-settled dividends on vested equity based awards | 1,360 | 7,987 | |||
| Balance, end of period | 4,174,260 | 4,090,024 | |||
| Contributed surplus | |||||
| Balance, beginning of period | 75,735 | 78,478 | |||
| Equity based compensation | 20,043 | 25,740 | |||
| Vesting of equity based awards | (43,474 | ) | (45,636 | ) | |
| Balance, end of period | 52,304 | 58,582 | |||
| Accumulated other comprehensive income | |||||
| Balance, beginning of period | 49,578 | 118,182 | |||
| Currency translation adjustments | 66,422 | (59,605 | ) | ||
| Hedge accounting reserve | (39,621 | ) | 1,168 | ||
| Balance, end of period | 76,379 | 59,745 | |||
| Deficit | |||||
| Balance, beginning of period | (1,791,039 | ) | (1,388,237 | ) | |
| Net (loss) earnings | (1,389,794 | ) | 41,551 | ||
| Dividends declared | 8 | (90,067 | ) | (212,433 | ) |
| Share-settled dividends on vested equity based awards | (1,360 | ) | (7,987 | ) | |
| Balance, end of period | (3,272,260 | ) | (1,567,106 | ) | |
| Total shareholders' equity | 1,030,683 | 2,641,245 | |||
Description of equity reserves
Shareholders’ capital
Represents the recognized amount for common shares when issued, net of equity issuance costs and deferred taxes.
Contributed surplus
Represents the recognized value of unvested equity based awards that will be settled in shares. Once vested, the value of the awards are transferred to shareholders’ capital.
Accumulated other comprehensive income
Represents currency translation adjustments and changes in the fair value of derivative financial instruments in designated hedging relationships.
Currency translation adjustments result from translating the balance sheets of subsidiaries with a foreign functional currency to Canadian dollars at period-end rates. These amounts may be reclassified to net earnings if there is a disposal or partial disposal of a subsidiary.
The hedge accounting reserve represents the effective portion of the change in fair value related to cash flow and net investment hedges recognized in other comprehensive income, net of tax and reclassified to the consolidated statement of net earnings in the same period in which the transaction associated with the hedged item occurs. For the six months ended June 30, 2020, losses of $31,922 and $7,699 were recognized on the cash flow hedges and net investment hedges respectively. As at June 30, 2020, amounts recognized in accumulated other comprehensive income will be recognized in net earnings over the period of the hedged cash flows.
Deficit
Represents the cumulative net earnings less distributed earnings of Vermilion Energy Inc.
| Vermilion Energy Inc. ■ Page 55 ■ 2020 Second Quarter Report |
Notes to the Condensed Consolidated Interim Financial Statements for the three and six months ended June 30, 2020 and 2019
tabular amounts in thousands of Canadian dollars, except share and per share amounts, unaudited
| 1. Basis of presentation |
Vermilion Energy Inc. (the “Company” or “Vermilion”) is a corporation governed by the laws of the Province of Alberta and is actively engaged in the business of crude oil and natural gas exploration, development, acquisition, and production.
These condensed consolidated interim financial statements are in compliance with International Accounting Standard (“IAS”) 34, “Interim Financial Reporting”. These condensed consolidated interim financial statements have been prepared using the same accounting policies and methods of computation as Vermilion’s consolidated financial statements for the year ended December 31, 2019.
These condensed consolidated interim financial statements should be read in conjunction with Vermilion’s consolidated financial statements for the year ended December 31, 2019, which are contained within Vermilion’s Annual Report for the year ended December 31, 2019 and are available on SEDAR at www.sedar.com or on Vermilion’s website at www.vermilionenergy.com.
These condensed consolidated interim financial statements were approved and authorized for issuance by the Board of Directors of Vermilion on
July 24, 2020.
| Vermilion Energy Inc. ■ Page 56 ■ 2020 Second Quarter Report |
| 2. Segmented information |
| Three Months Ended June 30, 2020 | ||||||||||||||||||
| Canada | France | Netherlands | Germany | Ireland | Australia | USA | Corporate | Total | ||||||||||
| Drilling and development | 9,785 | 5,563 | 6,417 | 1,402 | 704 | 4,200 | 14,194 | 118 | 42,383 | |||||||||
| Exploration and evaluation | — | 40 | (3,779 | ) | 1,943 | — | — | — | 1,687 | (109 | ) | |||||||
| Crude oil and condensate sales | 68,587 | 23,329 | 113 | 3,659 | (16 | ) | 28,772 | 14,550 | (41 | ) | 138,953 | |||||||
| NGL sales | 7,222 | — | — | — | — | — | 582 | — | 7,804 | |||||||||
| Natural gas sales | 24,326 | — | 10,541 | 2,894 | 7,284 | — | 742 | 469 | 46,256 | |||||||||
| Sales of purchased commodities | — | — | — | — | — | — | — | 16,118 | 16,118 | |||||||||
| Royalties | (6,777 | ) | (4,711 | ) | (55 | ) | (795 | ) | — | — | (3,836 | ) | (178 | ) | (16,352 | ) | ||
| Revenue from external customers | 93,358 | 18,618 | 10,599 | 5,758 | 7,268 | 28,772 | 12,038 | 16,368 | 192,779 | |||||||||
| Purchased commodities | — | — | — | — | — | — | — | (16,118 | ) | (16,118 | ) | |||||||
| Transportation | (10,465 | ) | (2,747 | ) | — | (1,505 | ) | (1,179 | ) | — | (469 | ) | — | (16,365 | ) | |||
| Operating | (57,281 | ) | (10,016 | ) | (7,526 | ) | (5,912 | ) | (3,852 | ) | (10,659 | ) | (3,765 | ) | (164 | ) | (99,175 | ) |
| General and administration | (8,705 | ) | (3,499 | ) | (212 | ) | (1,314 | ) | 106 | (888 | ) | (1,796 | ) | (604 | ) | (16,912 | ) | |
| PRRT | — | — | — | — | — | (3,219 | ) | — | — | (3,219 | ) | |||||||
| Corporate income taxes | — | — | 257 | — | — | (313 | ) | — | (102 | ) | (158 | ) | ||||||
| Interest expense | — | — | — | — | — | — | — | (17,887 | ) | (17,887 | ) | |||||||
| Realized gain on derivative instruments | — | — | — | — | — | — | — | 54,704 | 54,704 | |||||||||
| Realized foreign exchange gain | — | — | — | — | — | — | — | 3,972 | 3,972 | |||||||||
| Realized other income | — | — | — | — | — | — | — | 231 | 231 | |||||||||
| Fund flows from operations | 16,907 | 2,356 | 3,118 | (2,973 | ) | 2,343 | 13,693 | 6,008 | 40,400 | 81,852 | ||||||||
| Three Months Ended June 30, 2019 | ||||||||||||||||||
| Canada | France | Netherlands | Germany | Ireland | Australia | USA | Corporate | Total | ||||||||||
| Drilling and development | 29,083 | 25,671 | 4,235 | 551 | 84 | 2,239 | 12,964 | 322 | 75,149 | |||||||||
| Exploration and evaluation | — | — | 342 | 8,683 | — | — | — | 8,433 | 17,458 | |||||||||
| Crude oil and condensate sales | 190,349 | 84,540 | 721 | 7,781 | 4 | 42,848 | 16,040 | — | 342,283 | |||||||||
| NGL sales | 7,100 | — | — | — | — | — | 1,200 | — | 8,300 | |||||||||
| Natural gas sales | 15,495 | — | 27,606 | 7,312 | 25,932 | — | 1,115 | — | 77,460 | |||||||||
| Sales of purchased commodities | — | — | — | — | — | — | — | 75,335 | 75,335 | |||||||||
| Royalties | (20,711 | ) | (10,871 | ) | (446 | ) | (1,502 | ) | — | — | (4,583 | ) | — | (38,113 | ) | |||
| Revenue from external customers | 192,233 | 73,669 | 27,881 | 13,591 | 25,936 | 42,848 | 13,772 | 75,335 | 465,265 | |||||||||
| Purchased commodities | — | — | — | — | — | — | — | (75,335 | ) | (75,335 | ) | |||||||
| Transportation | (9,781 | ) | (9,041 | ) | — | (773 | ) | (1,155 | ) | — | — | — | (20,750 | ) | ||||
| Operating | (60,404 | ) | (14,305 | ) | (7,686 | ) | (5,212 | ) | (2,631 | ) | (8,092 | ) | (3,542 | ) | (9 | ) | (101,881 | ) |
| General and administration | (7,405 | ) | (3,551 | ) | (704 | ) | (2,146 | ) | (242 | ) | (1,164 | ) | (1,571 | ) | 1,086 | (15,697 | ) | |
| PRRT | — | — | — | — | — | (8,268 | ) | — | — | (8,268 | ) | |||||||
| Corporate income taxes | — | (5,346 | ) | (2,575 | ) | — | — | (3,816 | ) | — | (104 | ) | (11,841 | ) | ||||
| Interest expense | — | — | — | — | — | — | — | (21,568 | ) | (21,568 | ) | |||||||
| Realized gain on derivative instruments | — | — | — | — | — | — | — | 14,191 | 14,191 | |||||||||
| Realized foreign exchange loss | — | — | — | — | — | — | — | (1,569 | ) | (1,569 | ) | |||||||
| Realized other income | — | — | — | — | — | — | — | 191 | 191 | |||||||||
| Fund flows from operations | 114,643 | 41,426 | 16,916 | 5,460 | 21,908 | 21,508 | 8,659 | (7,782 | ) | 222,738 | ||||||||
| Vermilion Energy Inc. ■ Page 57 ■ 2020 Second Quarter Report |
| Six Months Ended June 30, 2020 | ||||||||||||||||||
| Canada | France | Netherlands | Germany | Ireland | Australia | USA | Corporate | Total | ||||||||||
| Total assets | 1,831,717 | 766,720 | 157,914 | 200,634 | 271,410 | 108,043 | 350,001 | 675,617 | 4,362,056 | |||||||||
| Drilling and development | 162,362 | 16,795 | 5,381 | 8,692 | 684 | 16,202 | 59,543 | 157 | 269,816 | |||||||||
| Exploration and evaluation | — | 65 | (246 | ) | 2,442 | — | — | — | 3,901 | 6,162 | ||||||||
| Crude oil and condensate sales | 193,056 | 80,118 | 624 | 8,414 | 12 | 80,767 | 26,750 | (41 | ) | 389,700 | ||||||||
| NGL sales | 11,630 | — | — | — | — | — | 2,689 | — | 14,319 | |||||||||
| Natural gas sales | 50,412 | — | 29,633 | 8,608 | 24,844 | — | 2,263 | 1,548 | 117,308 | |||||||||
| Sales of purchased commodities | — | — | — | — | — | — | — | 72,226 | 72,226 | |||||||||
| Royalties | (23,462 | ) | (13,751 | ) | (198 | ) | (1,737 | ) | — | — | (7,852 | ) | (477 | ) | (47,477 | ) | ||
| Revenue from external customers | 231,636 | 66,367 | 30,059 | 15,285 | 24,856 | 80,767 | 23,850 | 73,256 | 546,076 | |||||||||
| Purchased commodities | — | — | — | — | — | — | — | (72,226 | ) | (72,226 | ) | |||||||
| Transportation | (21,603 | ) | (6,472 | ) | — | (2,827 | ) | (2,324 | ) | — | (469 | ) | — | (33,695 | ) | |||
| Operating | (121,466 | ) | (25,915 | ) | (16,441 | ) | (10,827 | ) | (8,064 | ) | (28,032 | ) | (9,314 | ) | (254 | ) | (220,313 | ) |
| General and administration | (11,548 | ) | (6,947 | ) | (767 | ) | (3,055 | ) | (284 | ) | (1,763 | ) | (3,766 | ) | (2,099 | ) | (30,229 | ) |
| PRRT | — | — | — | — | — | (12,475 | ) | — | — | (12,475 | ) | |||||||
| Corporate income taxes | — | — | 257 | — | — | (654 | ) | — | (335 | ) | (732 | ) | ||||||
| Interest expense | — | — | — | — | — | — | — | (37,869 | ) | (37,869 | ) | |||||||
| Realized gain on derivative instruments | — | — | — | — | — | — | — | 104,123 | 104,123 | |||||||||
| Realized foreign exchange gain | — | — | — | — | — | — | — | 12,495 | 12,495 | |||||||||
| Realized other expense | — | — | — | — | — | — | — | (3,078 | ) | (3,078 | ) | |||||||
| Fund flows from operations | 77,019 | 27,033 | 13,108 | (1,424 | ) | 14,184 | 37,843 | 10,301 | 74,013 | 252,077 | ||||||||
| Six Months Ended June 30, 2019 | ||||||||||||||||||
| Canada | France | Netherlands | Germany | Ireland | Australia | USA | Corporate | Total | ||||||||||
| Total assets | 3,037,471 | 879,636 | 247,868 | 279,496 | 581,058 | 248,716 | 412,678 | 347,806 | 6,034,729 | |||||||||
| Drilling and development | 157,138 | 47,755 | 10,565 | 2,428 | 95 | 21,103 | 33,000 | 356 | 272,440 | |||||||||
| Exploration and evaluation | — | 2 | 361 | 9,850 | — | — | — | 12,007 | 22,220 | |||||||||
| Crude oil and condensate sales | 363,008 | 167,121 | 1,280 | 15,212 | 4 | 106,430 | 26,814 | — | 679,869 | |||||||||
| NGL sales | 20,974 | — | — | — | — | — | 3,309 | — | 24,283 | |||||||||
| Natural gas sales | 49,118 | 121 | 67,633 | 19,249 | 65,724 | — | 3,129 | — | 204,974 | |||||||||
| Sales of purchased commodities | — | — | — | — | — | — | — | 104,874 | 104,874 | |||||||||
| Royalties | (46,042 | ) | (22,154 | ) | (1,060 | ) | (3,725 | ) | — | — | (8,516 | ) | — | (81,497 | ) | |||
| Revenue from external customers | 387,058 | 145,088 | 67,853 | 30,736 | 65,728 | 106,430 | 24,736 | 104,874 | 932,503 | |||||||||
| Purchased commodities | — | — | — | — | — | — | — | (104,874 | ) | (104,874 | ) | |||||||
| Transportation | (20,473 | ) | (12,211 | ) | — | (2,445 | ) | (2,321 | ) | — | — | — | (37,450 | ) | ||||
| Operating | (124,008 | ) | (30,041 | ) | (15,971 | ) | (11,132 | ) | (6,441 | ) | (29,496 | ) | (6,974 | ) | (240 | ) | (224,303 | ) |
| General and administration | (10,124 | ) | (7,206 | ) | (1,596 | ) | (4,059 | ) | (571 | ) | (2,203 | ) | (3,462 | ) | 466 | (28,755 | ) | |
| PRRT | — | — | — | — | — | (18,668 | ) | — | — | (18,668 | ) | |||||||
| Corporate income taxes | — | (13,046 | ) | (6,775 | ) | — | — | (7,516 | ) | — | (254 | ) | (27,591 | ) | ||||
| Interest expense | — | — | — | — | — | — | — | (42,547 | ) | (42,547 | ) | |||||||
| Realized gain on derivative instruments | — | — | — | — | — | — | — | 24,539 | 24,539 | |||||||||
| Realized foreign exchange loss | — | — | — | — | — | — | — | (3,619 | ) | (3,619 | ) | |||||||
| Realized other income | — | — | — | — | — | — | — | 7,075 | 7,075 | |||||||||
| Fund flows from operations | 232,453 | 82,584 | 43,511 | 13,100 | 56,395 | 48,547 | 14,300 | (14,580 | ) | 476,310 | ||||||||
| Vermilion Energy Inc. ■ Page 58 ■ 2020 Second Quarter Report |
Reconciliation of fund flows from operations to net earnings:
| Three Months Ended | Six Months Ended | |||||||
| Jun 30, 2020 | Jun 30, 2019 | Jun 30, 2020 | Jun 30, 2019 | |||||
| Fund flows from operations | 81,852 | 222,738 | 252,077 | 476,310 | ||||
| Accretion | (7,288 | ) | (8,147 | ) | (17,026 | ) | (16,133 | ) |
| Depletion and depreciation | (106,707 | ) | (184,131 | ) | (264,514 | ) | (361,160 | ) |
| Impairment | (69,713 | ) | — | (1,634,567 | ) | — | ||
| Unrealized (loss) gain on derivative instruments | (3,771 | ) | (30,605 | ) | 5,545 | (44,882 | ) | |
| Equity based compensation | (9,164 | ) | (14,593 | ) | (22,161 | ) | (37,436 | ) |
| Unrealized foreign exchange (loss) gain | (7,410 | ) | 41,798 | (17,392 | ) | 65,056 | ||
| Unrealized other expense | (215 | ) | (69 | ) | (424 | ) | (274 | ) |
| Deferred tax | 51,126 | (24,987 | ) | 308,668 | (39,930 | ) | ||
| Net (loss) earnings | (71,290 | ) | 2,004 | (1,389,794 | ) | 41,551 | ||
| 3. Capital assets |
The following table reconciles the change in Vermilion's capital assets:
| 2020 | ||
| Balance at January 1 | 5,015,620 | |
| Acquisitions | 12,889 | |
| Additions | 269,816 | |
| Increase in right-of-use assets | 3,243 | |
| Impairment | (1,634,567 | ) |
| Depletion and depreciation | (252,348 | ) |
| Changes in asset retirement obligations | (255,821 | ) |
| Foreign exchange | 104,856 | |
| Balance at June 30 | 3,263,688 | |
2020 impairment
In the first quarter of 2020, indicators of impairment were present due to global commodity price forecasts deteriorating from decreases in demand and an increase of supply around the world. As a result of the indicators of impairment, the Company performed an impairment test on all cash-generating units ("CGU") whereby the recoverable amount of each CGU was compared against its carrying amount. The recoverable amounts were determined using fair value less costs to sell, which considered future after-tax cash flows from proved plus probable reserves and an after-tax discount rate of 11.5%. Based on the results of the impairment tests completed, the Company recognized non-cash impairment charges of $1.2 billion (net of
$0.4 billion income tax recovery).
The following benchmark price forecasts were used to calculate the recoverable amounts:
| 2020 | 2021 | 2022 | 2023 | 2024 | 2025 | 2026 | 2027 | 2028 | 2029 (2) | |||||||||||
| Brent Crude ($ US/bbl) (1) | 34.00 | 45.50 | 52.50 | 57.50 | 62.50 | 62.95 | 64.13 | 65.33 | 66.56 | 67.81 | ||||||||||
| WTI Crude ($ US/bbl) (1) | 30.00 | 41.00 | 47.50 | 52.50 | 57.50 | 58.95 | 60.13 | 61.33 | 62.56 | 63.81 | ||||||||||
| NBP (€/mmbtu) (1) | 3.33 | 4.25 | 5.00 | 5.50 | 6.00 | 6.25 | 6.50 | 6.75 | 7.00 | 7.25 | ||||||||||
| AECO Spot Gas ($/mmbtu) (1) | 1.95 | 2.25 | 2.35 | 2.45 | 2.55 | 2.65 | 2.70 | 2.76 | 2.81 | 2.87 | ||||||||||
| Exchange rate (CAD/USD) | 0.72 | 0.73 | 0.74 | 0.74 | 0.75 | 0.75 | 0.75 | 0.75 | 0.75 | 0.75 | ||||||||||
(1) The forecast benchmark commodity prices listed are adjusted for quality differentials, heat content, transportation and marketing costs and other factors specific to the Company’s operations.
(2) In 2030 and beyond, commodity price forecasts are inflated at a rate of 2.0% per annum. In 2030 and beyond there is no escalation of exchange rates.
| Vermilion Energy Inc. ■ Page 59 ■ 2020 Second Quarter Report |
The following are the results of the impairment tests completed and sensitivity impacts of a 1% increase in after-tax discount rate and a 5% decrease in pricing on the impairment tests completed:
| CGU | Operating Segment | Impairment | 1% increase discount rate | 5% decrease pricing |
| Saskatchewan | Canada | 815,909 | 70,737 | 141,015 |
| Drayton Valley Oil | Canada | 364,879 | 13,204 | 23,582 |
| Drayton Valley Gas | Canada | — | 9,864 | 38,158 |
| Neocomian | France | 22,758 | 8,576 | 13,609 |
| Germany Gas | Germany | 39,738 | 3,545 | 7,084 |
| Ireland | Ireland | 119,634 | 10,333 | 20,793 |
| Australia | Australia | 55,583 | 3,227 | 13,582 |
| United States | United States | 146,353 | 28,051 | 52,613 |
| Total | 1,564,854 | 147,537 | 310,436 |
In the second quarter of 2020, indicators of impairment were present due to the Company’s market capitalization falling below the carrying value of its net assets as at June 30, 2020. As a result of the indicators of impairment, the Company performed an impairment test. The recoverable amount was determined using fair value less costs to sell, which considered future after-tax cash flows from proved plus probable reserves and an after-tax discount rate of 11.5%. Based on the results of the impairment tests completed, the Company recognized non-cash impairment charges of $53.1 million (net of $16.6 million income tax recovery).
The following benchmark price forecasts were used to calculate the recoverable amounts:
| 2020 | 2021 | 2022 | 2023 | 2024 | 2025 | 2026 | 2027 | 2028 | 2029 (2) | |||||||||||
| Brent Crude ($ US/bbl) (1) | 43.50 | 48.00 | 51.50 | 56.50 | 60.00 | 62.95 | 64.13 | 65.33 | 66.56 | 67.81 | ||||||||||
| WTI Crude ($ US/bbl) (1) | 41.00 | 44.00 | 47.50 | 52.50 | 56.00 | 58.95 | 60.13 | 61.33 | 62.56 | 63.81 | ||||||||||
| NBP (€/mmbtu) (1) | 2.75 | 4.25 | 4.75 | 5.25 | 5.75 | 6.00 | 6.25 | 6.50 | 6.75 | 7.00 | ||||||||||
| AECO Spot Gas ($/mmbtu) (1) | 2.10 | 2.35 | 2.40 | 2.45 | 2.55 | 2.65 | 2.70 | 2.76 | 2.81 | 2.87 | ||||||||||
| Exchange rate (CAD/USD) | 0.74 | 0.74 | 0.75 | 0.75 | 0.75 | 0.75 | 0.75 | 0.75 | 0.75 | 0.75 | ||||||||||
(1) The forecast benchmark commodity prices listed are adjusted for quality differentials, heat content, transportation and marketing costs and other factors specific to the Company’s operations.
(2) In 2030 and beyond, commodity price forecasts are inflated at a rate of 2.0% per annum. In 2030 and beyond there is no escalation of exchange rates.
The following are the results of the impairment tests completed and sensitivity impacts of a 1% increase in after-tax discount rate and a 5% decrease in pricing on the impairment tests completed:
| CGU | Operating Segment | Impairment | 1% increase discount rate | 5% decrease pricing |
| Germany Gas | Germany | 10,177 | 1,370 | 2,818 |
| Ireland | Ireland | 26,061 | 9,198 | 19,208 |
| Australia | Australia | 33,475 | 3,435 | 15,470 |
| Total | 69,713 | 14,003 | 37,496 |
2019 impairment
In the fourth quarter of 2019, an indicator of impairment was present in the Ireland CGU due to declining natural gas price forecasts. As a result of the indicator of impairment, the Company performed an impairment test on its Ireland CGU whereby the recoverable amount was compared against its carrying amount. The recoverable amount was determined using fair value less costs to sell, which considered future after-tax cash flows from proved plus probable reserves and an after-tax discount rate of 9.0%. Based on the results of the impairment test completed, the Company recognized a
non-cash impairment charge of $34.6 million (net of $11.5 million income tax recovery).
The following benchmark price forecast was used to calculate the recoverable amount:
| 2020 | 2021 | 2022 | 2023 | 2024 | 2025 | 2026 | 2027 | 2028 | 2029 (2) | |
| NBP (€/mmbtu) (1) | 5.58 | 5.51 | 5.54 | 5.65 | 5.77 | 5.88 | 6.00 | 6.12 | 6.24 | 6.37 |
(1) The forecast benchmark commodity prices listed are adjusted for quality differentials, heat content, transportation and marketing costs and other factors specific to the Company’s operations.
(2) In 2030 and beyond, commodity price forecasts are inflated at a rate of 2.0% per annum.
| Vermilion Energy Inc. ■ Page 60 ■ 2020 Second Quarter Report |
The following is the result of the impairment test completed and sensitivity impacts of a 1% increase in after-tax discount rate and a 5% decrease in pricing on the impairment test completed:
| CGU | Operating Segment | Impairment | 1% increase discount rate | 5% decrease pricing |
| Ireland | Ireland | 46,055 | 14,749 | 28,598 |
Changes in any of the key judgments, such as a revision in reserves, changes in forecast commodity prices, foreign exchange rates, capital or operating costs would impact the estimated recoverable amount.
| 4. Exploration and evaluation assets |
The following table reconciles the change in Vermilion's exploration and evaluation assets:
| 2020 | ||
| Balance at January 1 | 286,149 | |
| Acquisitions | 1,380 | |
| Additions | 6,162 | |
| Changes in asset retirement obligations | (93 | ) |
| Depreciation | (9,359 | ) |
| Foreign exchange | 5,051 | |
| Balance at June 30 | 289,290 | |
| 5. Asset retirement obligations |
The following table reconciles the change in Vermilion’s asset retirement obligations:
| 2020 | ||
| Balance at January 1 | 618,201 | |
| Additional obligations recognized | 1,291 | |
| Changes in estimated abandonment timing and costs | (8,358 | ) |
| Obligations settled | (4,702 | ) |
| Accretion | 17,026 | |
| Changes in discount rates | (248,847 | ) |
| Foreign exchange | 21,262 | |
| Balance at June 30 | 395,873 | |
Vermilion calculated the present value of the obligations using a credit-adjusted risk-free rate, calculated using a credit spread of 9.1% (as at
December 31, 2019 - 5.3%) added to risk-free rates based on long-term, risk-free government bonds. Vermilion's credit spread is determined as the yield to maturity on its senior unsecured notes as at the reporting period.
The country specific risk-free rates used as inputs to discount the obligations were as follows:
| Jun 30, 2020 | Dec 31, 2019 | |||
| Canada | 1.0 | % | 1.7 | % |
| France | 0.5 | % | 0.9 | % |
| Netherlands | (0.4 | )% | (0.1 | )% |
| Germany | 0.0% | 0.3 | % | |
| Ireland | 0.3 | % | 0.6 | % |
| Australia | 1.2 | % | 1.6 | % |
| United States | 1.4 | % | 2.4 | % |
| Vermilion Energy Inc. ■ Page 61 ■ 2020 Second Quarter Report |
| 6. Taxes |
As at June 30, 2020, Vermilion derecognized $138.1 million (December 31, 2019 - $65.5 million) of deferred income tax assets relating to non-expiring tax losses in Canada, Ireland and Australia as there is uncertainty as to the Company's ability to fully utilize such losses based on forecasted commodity prices in effect as at June 30, 2020.
| 7. Long-term debt |
The following table summarizes Vermilion’s outstanding long-term debt:
| As at | ||||
| Jun 30, 2020 | Dec 31, 2019 | |||
| Revolving credit facility | 1,730,082 | 1,539,225 | ||
| Senior unsecured notes | 405,361 | 385,440 | ||
| Long-term debt | 2,135,443 | 1,924,665 | ||
The fair value of the revolving credit facility is equal to its carrying value due to the use of short-term borrowing instruments at market rates of interest. The fair value of the senior unsecured notes as at June 30, 2020 was $354.2 million.
The following table reconciles the change in Vermilion’s long-term debt:
| 2020 | ||
| Balance at January 1 | 1,924,665 | |
| Borrowings on the revolving credit facility | 144,955 | |
| Amortization of transaction costs | (418 | ) |
| Foreign exchange | 66,241 | |
| Balance at June 30 | 2,135,443 | |
Revolving credit facility
As at June 30, 2020, Vermilion had in place a bank revolving credit facility maturing May 31, 2024 with the following terms:
| As at | ||||
| Jun 30, 2020 | Dec 31, 2019 | |||
| Total facility amount | 2,100,000 | 2,100,000 | ||
| Amount drawn | (1,730,082 | ) | (1,539,225 | ) |
| Letters of credit outstanding | (21,975 | ) | (10,230 | ) |
| Unutilized capacity | 347,943 | 550,545 | ||
The facility can be extended from time to time at the option of the lenders and upon notice from Vermilion. If no extension is granted by the lenders, the amounts owing pursuant to the facility are due at the maturity date. The facility is secured by various fixed and floating charges against the subsidiaries of Vermilion.
The facility bears interest at a rate applicable to demand loans plus applicable margins.
As at June 30, 2020, the revolving credit facility was subject to the following financial covenants:
| As at | |||||
| Financial covenant | Limit | Jun 30, 2020 | Dec 31, 2019 | ||
| Consolidated total debt to consolidated EBITDA | Less than 4.0 | 2.83 | 1.94 | ||
| Consolidated total senior debt to consolidated EBITDA | Less than 3.5 | 2.30 | 1.56 | ||
| Consolidated EBITDA to consolidated interest expense | Greater than 2.5 | 10.57 | 13.40 | ||
The financial covenants include financial measures defined within the revolving credit facility agreement that are not defined under IFRS. These financial measures are defined by the revolving credit facility agreement as follows:
| • | Consolidated total debt: Includes all amounts classified as “Long-term debt” and “Lease obligations” (including the current portion included within "Accounts payable and accrued liabilities" but excluding operating leases as defined under IAS 17) on the balance sheet. |
| Vermilion Energy Inc. ■ Page 62 ■ 2020 Second Quarter Report |
| • | Consolidated total senior debt: Defined as consolidated total debt excluding unsecured and subordinated debt. |
| • | Consolidated EBITDA: Defined as consolidated net earnings before interest, income taxes, depreciation, accretion and certain other non-cash items, adjusted for the impact of the acquisition of a material subsidiary. |
| • | Consolidated total interest expense: Includes all amounts classified as "Interest expense", but excluding interest on operating leases as defined under IAS 17. |
As at June 30, 2020 and 2019, Vermilion was in compliance with the above covenants.
Senior unsecured notes
On March 13, 2017, Vermilion issued US $300.0 million of senior unsecured notes at par. The notes bear interest at a rate of 5.625% per annum, to be paid semi-annually on March 15 and September 15. The notes mature on March 15, 2025. As direct senior unsecured obligations of Vermilion, the notes rank equally with existing and future senior unsecured indebtedness of the Company.
The senior unsecured notes were recognized at amortized cost and include the transaction costs directly related to the issuance.
On or after March 15, 2020, Vermilion may redeem some or all of the senior unsecured notes at the redemption prices set forth in the following table plus any accrued and unpaid interest.
| Year | Redemption price | |
| 2020 | 104.219 | % |
| 2021 | 102.813 | % |
| 2022 | 101.406 | % |
| 2023 and thereafter | 100.000 | % |
Cross currency interest rate swaps
On June 12, 2019, Vermilion entered into a series of cross currency interest rate swaps with a syndicate of banks. Vermilion applied hedge accounting to these derivative instruments. The cross currency interest rate swaps had an original maturity of March 15, 2025.
The USD-to-CAD cross currency interest swaps were designated as the hedging instrument in a cash flow hedge while the CAD-to-EUR cross currency interest rate swaps were designated as the hedging instrument in a net investment hedge.
During the quarter ended June 30, 2020, Vermilion executed a number of transactions that resulted in a termination of the cross currency interest rate swaps in exchange for $42.3 million ($16.8 million received in the three months ended March 30, 2020 and $25.5 million received in the three months ended June 30, 2020). As a result of the termination, Vermilion has discontinued hedge accounting and amounts previously recognized for the hedge reserve within accumulated other comprehensive income will be reclassified in to net income over the remaining life of the senior unsecured notes.
| 8. Shareholders' capital |
The following table reconciles the change in Vermilion’s shareholders’ capital:
| 2020 | ||||
| Shareholders’ Capital | Shares ('000s) | Amount | ||
| Balance at January 1 | 156,290 | 4,119,031 | ||
| Shares issued for the Dividend Reinvestment Plan | 619 | 8,277 | ||
| Vesting of equity based awards | 905 | 43,474 | ||
| Shares issued for equity based compensation | 226 | 2,118 | ||
| Share-settled dividends on vested equity based awards | 267 | 1,360 | ||
| Balance at June 30 | 158,307 | 4,174,260 | ||
Dividends declared to shareholders for the six months ended June 30, 2020 were $90.1 million (2019 - $212.4 million).
At Vermilion's Annual General and Special Meeting held on April 28, 2020 shareholders of the Company approved a $3.7 billion reduction in the stated capital of Vermilion's common shares, with the $3.7 billion reduction deducted from the stated capital account maintained for the common shares of Vermilion and an offsetting increase to the contributed surplus account of Vermilion. The transaction did not result in an adjustment to the financial statements under IFRS.
| Vermilion Energy Inc. ■ Page 63 ■ 2020 Second Quarter Report |
| 9. Capital disclosures |
Vermilion defines capital as net debt (long-term debt plus net working capital) and shareholders’ capital. In managing capital, Vermilion reviews whether fund flows from operations is sufficient to fund capital expenditures, dividends, and asset retirement obligations.
The following table calculates Vermilion’s ratio of net debt to four quarter trailing fund flows from operations:
| Jun 30, 2020 | Dec 31, 2019 | |||
| Long-term debt | 2,135,443 | 1,924,665 | ||
| Current liabilities | 368,382 | 416,210 | ||
| Current assets | (342,383 | ) | (347,681 | ) |
| Net debt | 2,161,442 | 1,993,194 | ||
| Ratio of net debt to four quarter trailing fund flows from operations | 3.16 | 2.20 | ||
| 10. Financial instruments |
Commodity risk
Vermilion is exposed to commodity price risk on its derivative assets and liabilities which are used as part of the Company’s risk management program
to mitigate the effects of changes in commodity prices on future cash flows. While transactions of this nature relate to future petroleum and natural gas
production, Vermilion does not designate these derivative assets and liabilities as accounting hedges. As such, changes in commodity prices impact
the fair value of derivative instruments and the corresponding gains or losses recognized on derivative instruments. During the three and six months ended June 30, 2020, Vermilion continued to use derivative instruments to mitigate the effects of changes in commodity prices.
Currency risk
Vermilion is exposed to currency risk on its financial instruments denominated in foreign currencies. These financial instruments include cash and cash equivalents, accounts receivables, accounts payables, lease obligations, long-term debt, derivative assets and derivative liabilities. These financial instruments are primarily denominated in the US dollar and the Euro. Vermilion monitors its exposure to currency risk and reviews whether the use of derivative financial instruments is appropriate to manage potential fluctuations in foreign exchange rates. During the three and six months ended
June 30, 2020, Vermilion has not entered into new derivative instruments for the purposes of managing fluctuations in foreign exchange rates.
Interest rate risk
Vermilion is exposed to interest rate risk on its revolving credit facility, which consists of short-term borrowing instruments that bear interest at market rates. Thus, changes in interest rates could result in an increase or decrease in the amount paid by Vermilion to service this debt. As a result of the outbreak of COVID-19 and ensuing monetary response, short-term interest rates have generally decreased. However, the impact of these decreases could be offset by increased credit spread as a result of decreased financial performance resulting from lower commodity prices.
| Vermilion Energy Inc. ■ Page 64 ■ 2020 Second Quarter Report |
The following table summarizes the increase (positive values) or decrease (negative values) to net earnings before tax due to a change in the value of Vermilion’s financial instruments as a result of a change in the relevant market risk variable. This analysis does not attempt to reflect any interdependencies between the relevant risk variables.
| Jun 30, 2020 | ||
| Currency risk - Euro to Canadian dollar | ||
| $0.01 increase in strength of the Canadian dollar against the Euro | (1,278 | ) |
| $0.01 decrease in strength of the Canadian dollar against the Euro | 1,278 | |
| Currency risk - US dollar to Canadian dollar | ||
| $0.01 increase in strength of the Canadian dollar against the US $ | 3,421 | |
| $0.01 decrease in strength of the Canadian dollar against the US $ | (3,421 | ) |
| Commodity price risk - Crude oil | ||
| US $5.00/bbl increase in crude oil price used to determine the fair value of derivatives | (15,035 | ) |
| US $5.00/bbl decrease in crude oil price used to determine the fair value of derivatives | 18,191 | |
| Commodity price risk - European natural gas | ||
| €0.5/GJ increase in European natural gas price used to determine the fair value of derivatives | (21,560 | ) |
€0.5/GJ decrease in European natural gas price used to determine the fair value of derivatives
| 15,944 | |
| Share price risk - Equity swaps | ||
| $1.00 increase from initial share price of the equity swap | 3,750 | |
| $1.00 decrease from initial share price of the equity swap | (3,750 | ) |
Credit risk
Vermilion is exposed to credit risk on accounts receivable and derivative assets in the event that customers, joint operation partners, or counterparties fail to discharge their contractual obligations. As at June 30, 2020, Vermilion’s maximum exposure to receivable credit risk was $322.4 million (December 31, 2019 - $287.2 million) which is the value of accounts receivable and derivative assets on the balance sheet. Vermilion’s accounts receivable primarily relates to customers and joint operations partners in the petroleum and natural gas industry. These amounts are subject to normal industry payment terms and credit risks. Vermilion manages these risks by monitoring the creditworthiness of customers and joint operations partners and, where appropriate, obtaining assurances such as parental guarantees and letters of credit. Vermilion’s derivative assets primarily relates to the fair value of financial instruments used as part of the Company’s risk management program to mitigate the effects of changes in commodity prices on future cash flows. Vermilion manages this risk by monitoring the creditworthiness of counterparties, transacting primarily with counterparties that have investment grade third party credit ratings, and by limiting the concentration of financial exposure to individual counterparties. As a result, Vermilion has not obtained collateral or other security to support its financial derivatives. Vermilion’s cash deposited in financial institutions and guaranteed investment certificates are also subject to counterparty credit risk. Vermilion mitigates this risk by transacting with financial institutions with high third party credit ratings.
The decrease in commodity prices as a result of the COVID-19 pandemic has increased the value of derivative assets on the balance sheet and can potentially increase the credit risk associated with the Company’s customers and joint venture partners. Vermilion continues to monitor the creditworthiness of customers and joint operations to limit exposure to this risk. As at June 30, 2020, approximately 1.5% (December 31, 2019 - 3.6%) of the accounts receivable balance was outstanding for more than 90 days. Vermilion considers the balance of accounts receivable to be collectible.
Liquidity risk
Liquidity risk is the risk that Vermilion will encounter difficulty in meeting obligations associated with its financial liabilities. While the decrease in commodity prices as a result of the COVID-19 pandemic will negatively impact Vermilion’s financial performance and position, Vermilion continues to retain available committed borrowing capacity that provides the Company with financial flexibility and the ability to meet obligations as they become due.
Vermilion’s undiscounted non-derivative financial liabilities due within 1 month to 1 year have decreased since December 31, 2019 as a result of lower dividends payable as at June 30, 2020. The Company had $347.9 million of unutilized capacity on its revolving credit facility as at June 30, 2020 ($550.5 million as at December 31, 2019), which matures on May 31, 2024.
| Vermilion Energy Inc. ■ Page 65 ■ 2020 Second Quarter Report |
The following table summarizes Vermilion’s undiscounted non-derivative financial liabilities and their contractual maturities:
| 1 month to | 3 months to | 1 year to | ||||||
| 1 month | 3 months | 1 year | 5 years | |||||
| June 30, 2020 | 87,017 | 201,175 | 21,400 | 2,213,196 | ||||
| December 31, 2019 | 134,502 | 208,752 | 5,136 | 1,608,435 | ||||
| Vermilion Energy Inc. ■ Page 66 ■ 2020 Second Quarter Report |
DIRECTORS
Lorenzo Donadeo 1 Calgary, Alberta
Larry J. Macdonald 2, 4, 6, 8 Calgary, Alberta
Carin Knickel 5, 8, 12 Golden, Colorado
Stephen P. Larke 4, 6, 12 Calgary, Alberta
Loren M. Leiker 10 McKinney, Texas
Timothy R. Marchant 7, 10, 11 Calgary, Alberta
Robert Michaleski 3, 6 Calgary, Alberta
William Roby 8, 9, 12 Katy, Texas
Catherine L. Williams 4, 6 Calgary, Alberta
1 Executive Chairman 2 Lead Director (Independent) 3 Audit Committee Chair (Independent) 4 Audit Committee Member 5 Governance and Human Resources Committee Chair (Independent) 6 Governance and Human Resources Committee Member 7 Health, Safety and Environment Committee Chair (Independent) 8 Health, Safety and Environment Committee Member 9 Independent Reserves Committee Chair (Independent) 10 Independent Reserves Committee Member 11 Sustainability Committee Chair (Independent) 12 Sustainability Committee Member
| OFFICERS AND KEY PERSONNEL CANADA Lorenzo Donadeo Executive Chairman Curtis Hicks President Lars Glemser Vice President & Chief Financial Officer
Mona Jasinski Executive Vice President, People and Culture
Michael Kaluza Executive Vice President & Chief Operating Officer
Dion Hatcher Vice President Canada Business Unit
Terry Hergott Vice President Marketing
Kyle Preston Vice President Investor Relations
Jenson Tan Vice President Business Development
Daniel Goulet Director Corporate HSE
Jeremy Kalanuk Director Operations Accounting
Bryce Kremnica Director Field Operations - Canada Business Unit
Steve Reece Director Information Technology & Information Systems
Tom Rafter Director Land - Canada Business Unit
Adam Iwanicki Director Marketing
Robert (Bob) J. Engbloom Corporate Secretary
UNITED STATES Scott Seatter Managing Director - U.S. Business Unit
EUROPE Gerard Schut Vice President European Operations
Sylvain Nothhelfer Managing Director - France Business Unit
Sven Tummers Managing Director - Netherlands Business Unit
Bill Liutkus Managing Director - Germany Business Unit
Darcy Kerwin Managing Director - Ireland Business Unit
Bryan Sralla Managing Director - Central & Eastern Europe Business Unit
AUSTRALIA Bruce D. Lake Managing Director - Australia Business Unit | AUDITORS
Deloitte LLP Calgary, Alberta
BANKERS
The Toronto-Dominion Bank
Bank of Montreal
Canadian Imperial Bank of Commerce
Export Development Canada
National Bank of Canada
Royal Bank of Canada
The Bank of Nova Scotia
Wells Fargo Bank N.A., Canadian Branch
HSBC Bank Canada
Bank of America N.A., Canada Branch
Citibank N.A., Canadian Branch - Citibank Canada
JPMorgan Chase Bank, N.A., Toronto Branch
La Caisse Centrale Desjardins du Québec
Alberta Treasury Branches
Canadian Western Bank
Goldman Sachs Lending Partners LLC
Barclays Bank PLC
EVALUATION ENGINEERS
GLJ Petroleum Consultants Ltd. Calgary, Alberta
LEGAL COUNSEL
Norton Rose Fulbright Canada LLP Calgary, Alberta
TRANSFER AGENT
Computershare Trust Company of Canada
STOCK EXCHANGE LISTINGS
The Toronto Stock Exchange (“VET”) The New York Stock Exchange (“VET”)
INVESTOR RELATIONS Kyle Preston Vice President Investor Relations 403-476-8431 TEL 403-476-8100 FAX 1-866-895-8101 IR TOLL FREE investor_relations@vermilionenergy.com
|
| Vermilion Energy Inc. ■ Page 67 ■ 2020 Second Quarter Report |
