Exhibit 99.1

Disclaimer
Certain statements included or incorporated by reference in this document may constitute forward-looking statements or financial outlooks under applicable securities legislation. Such forward-looking statements or information typically contain statements with words such as "anticipate", "believe", "expect", "plan", "intend", "estimate", "propose", or similar words suggesting future outcomes or statements regarding an outlook. Forward looking statements or information in this document may include, but are not limited to: capital expenditures and Vermilion’s ability to fund such expenditures; Vermilion’s additional debt capacity providing it with additional working capital; the return of capital; the flexibility of Vermilion’s capital program and operations; business strategies and objectives; operational and financial performance; sustainability (Environment, Social, and Governance or ESG) data and performance; estimated volumes of reserves and resources; petroleum and natural gas sales; future production levels and the timing thereof, including Vermilion’s 2022 guidance, and rates of average annual production growth; the effect of changes in crude oil and natural gas prices, changes in exchange rates and significant declines in production or sales volumes due to unforeseen circumstances; the effect of possible changes in critical accounting estimates; statements regarding the growth and size of Vermilion’s future project inventory, and the wells expected to be drilled in 2022; exploration and development plans and the timing thereof; Vermilion’s ability to reduce its debt; statements regarding Vermilion’s hedging program, its plans to add to its hedging positions, and the anticipated impact of Vermilion’s hedging program on project economics and free cash flows; the potential financial impact of climate-related risks; acquisition and disposition plans and activities and the timing thereof; operating and other expenses, including the payment and amount of future dividends; matters relating to energy security and inflation including the European Union solidarity contribution; royalty and income tax rates and Vermilion’s expectations regarding future taxes and taxability; and the timing of regulatory proceedings and approvals.
Such forward looking statements or information are based on a number of assumptions, all or any of which may prove to be incorrect. In addition to any other assumptions identified in this document, assumptions have been made regarding, among other things: the ability of Vermilion to obtain equipment, services and supplies in a timely manner to carry out its activities in Canada and internationally; the ability of Vermilion to market crude oil, natural gas liquids, and natural gas successfully to current and new customers; the timing and costs of pipeline and storage facility construction and expansion and the ability to secure adequate product transportation; the timely receipt of required regulatory approvals; the ability of Vermilion to obtain financing on acceptable terms; foreign currency exchange rates and interest rates; future crude oil, natural gas liquids, and natural gas prices; and management’s expectations relating to the timing and results of exploration and development activities and acquisition activities.
Although Vermilion believes that the expectations reflected in such forward looking statements or information are reasonable, undue reliance should not be placed on forward looking statements because Vermilion can give no assurance that such expectations will prove to be correct. Financial outlooks are provided for the purpose of understanding Vermilion’s financial position and business objectives, and the information may not be appropriate for other purposes. Forward looking statements or information are based on current expectations, estimates, and projections that involve a number of risks and uncertainties which could cause actual results to differ materially from those anticipated by Vermilion and described in the forward looking statements or information. These risks and uncertainties include, but are not limited to: the ability of management to execute its business plan; the risks of the oil and gas industry, both domestically and internationally, such as operational risks in exploring for, developing and producing crude oil, natural gas liquids, and natural gas; risks and uncertainties involving geology of crude oil, natural gas liquids, and natural gas deposits; risks inherent in Vermilion's marketing operations, including credit risk; the uncertainty of reserves estimates and reserves life and estimates of resources and associated expenditures; the uncertainty of estimates and projections relating to production and associated expenditures; potential delays or changes in plans with respect to exploration or development projects; the timing, and results, of acquisition activities; Vermilion's ability to enter into or renew leases on acceptable terms; fluctuations in crude oil, natural gas liquids, and natural gas prices, foreign currency exchange rates and interest rates; health, safety, and environmental risks; uncertainties as to the availability and cost of financing; the ability of Vermilion to add production and reserves through exploration and development activities; the possibility that government policies or laws may change or governmental approvals may be delayed or withheld; uncertainty and current evolutions with relation to sustainability/ESG reporting methodologies; uncertainty in amounts and timing of royalty payments; risks associated with existing and potential future law suits and regulatory actions against Vermilion; and other risks and uncertainties described elsewhere in this document or in Vermilion's other filings with Canadian securities regulatory authorities.
The forward looking statements or information contained in this document are made as of the date hereof and Vermilion undertakes no obligation to update publicly or revise any forward looking statements or information, whether as a result of new information, future events, or otherwise, unless required by applicable securities laws.
This document contains metrics commonly used in the oil and gas industry. These oil and gas metrics do not have any standardized meaning or standard methods of calculation and therefore may not be comparable to similar measures presented by other companies where similar terminology is used and should therefore not be used to make comparisons. Natural gas volumes have been converted on the basis of six thousand cubic feet of natural gas to one barrel of oil equivalent. Barrels of oil equivalent (boe) may be misleading, particularly if used in isolation. A boe conversion ratio of six thousand cubic feet to one barrel of oil is based on an energy equivalency conversion method primarily applicable at the burner tip and does not represent a value equivalency at the wellhead.
Vermilion Energy Inc. ■ Page 1 ■ 2022 Third Quarter Report |
This document may contain references to sustainability/ESG data and performance that reflect metrics and concepts that are commonly used in such frameworks as the Global Reporting Initiative, the Task Force on Climate-related Financial Disclosures, and the Value Reporting Foundation (Sustainability Accounting Standards Board). Vermilion has used best efforts to align with the most commonly accepted methodologies for ESG reporting, including with respect to climate data and information on potential future risks and opportunities, in order to provide a fuller context for our current and future operations. However, these methodologies are not yet standardized, are frequently based on calculation factors that change over time, and continue to evolve rapidly. Readers are particularly cautioned to evaluate the underlying definitions and measures used by other companies, as these may not be comparable to Vermilion’s. While Vermilion will continue to monitor and adapt its reporting accordingly, the Company is not under any duty to update or revise the related sustainability/ESG data or statements except as required by applicable securities laws.
Financial data contained within this document are reported in Canadian dollars, unless otherwise stated.
Vermilion Energy Inc. ■ Page 2 ■ 2022 Third Quarter Report |
Abbreviations
| $M | thousand dollars |
| $MM | million dollars |
| AECO | the daily average benchmark price for natural gas at the AECO ‘C’ hub in Alberta |
| bbl(s) | barrel(s) |
| bbls/d | barrels per day |
| boe | barrel of oil equivalent, including: crude oil, condensate, natural gas liquids, and natural gas (converted on the basis of one boe for six mcf of natural gas) |
| boe/d | barrel of oil equivalent per day |
| GJ | gigajoules |
| LSB | light sour blend crude oil reference price |
| mbbls | thousand barrels |
| mcf | thousand cubic feet |
| mmcf/d | million cubic feet per day |
| NBP | the reference price paid for natural gas in the United Kingdom at the National Balancing Point Virtual Trading Point |
| NGLs | natural gas liquids, which includes butane, propane, and ethane |
| PRRT | Petroleum Resource Rent Tax, a profit based tax levied on petroleum projects in Australia |
| tCO2e | tonnes of carbon dioxide equivalent |
| TTF | the price for natural gas in the Netherlands, quoted in megawatt hours of natural gas, at the Title Transfer Facility Virtual Trading Point |
| WTI | West Texas Intermediate, the reference price paid for crude oil of standard grade in US dollars at Cushing, Oklahoma |
Vermilion Energy Inc. ■ Page 3 ■ 2022 Third Quarter Report |
Highlights
| • | Q3 2022 fund flows from operations (“FFO”)(1) was $508 million ($3.10/basic share)(2), an increase of 12% from the prior quarter, driven by higher European natural gas prices. |
| • | Free cash flow (“FCF”)(3) was $324 million ($1.98/basic share)(4), a decrease of 5%, due to higher capital expenditures primarily related to the offshore drilling campaign in Australia. Cash flow from operating activities was $448 million in Q3 2022, including the impact from asset retirement obligations settled and changes in non-cash operating working capital. |
| • | Pro forma Q3 2022 FFO and FCF incorporating the incremental 36.5% ownership in Corrib was $611 million ($3.73/basic share) and $426 million ($2.60/basic share), respectively. As a reminder, all FCF from the Corrib acquisition accrues to Vermilion as at January 1, 2022 and will be netted off the final purchase price at the time of closing, which we now expect to occur in Q1 2023 due to administrative delays. |
| • | Net earnings were $271 million ($1.65/basic share) for the quarter ended September 30, 2022. |
| • | Long-term debt and net debt(5) were $1.4 billion at September 30, 2022, resulting in a net debt to trailing FFO ratio(6) of 0.8 times, which is at the lowest level in over ten years. |
| • | Cash flow used in investing activities totaled $168 million in the third quarter of 2022, including exploration and development (“E&D”) capital expenditures(7) of $184 million. |
| • | In early July 2022, we announced the approval of a normal course issuer bid ("NCIB") for the purchase of up to 16 million common shares, representing approximately 10% of Vermilion’s public float as at June 22, 2022. To date, we have repurchased 2.3 million common shares for $72 million. |
| • | In conjunction with our Q3 2022 release, we announced a quarterly cash dividend of $0.08 CDN per share, payable on January 16, 2023 to shareholders of record on December 30, 2022. Including dividends and share buybacks, we returned $85 million to shareholders in Q3 2022, representing 26% of Q3 2022 FCF. |
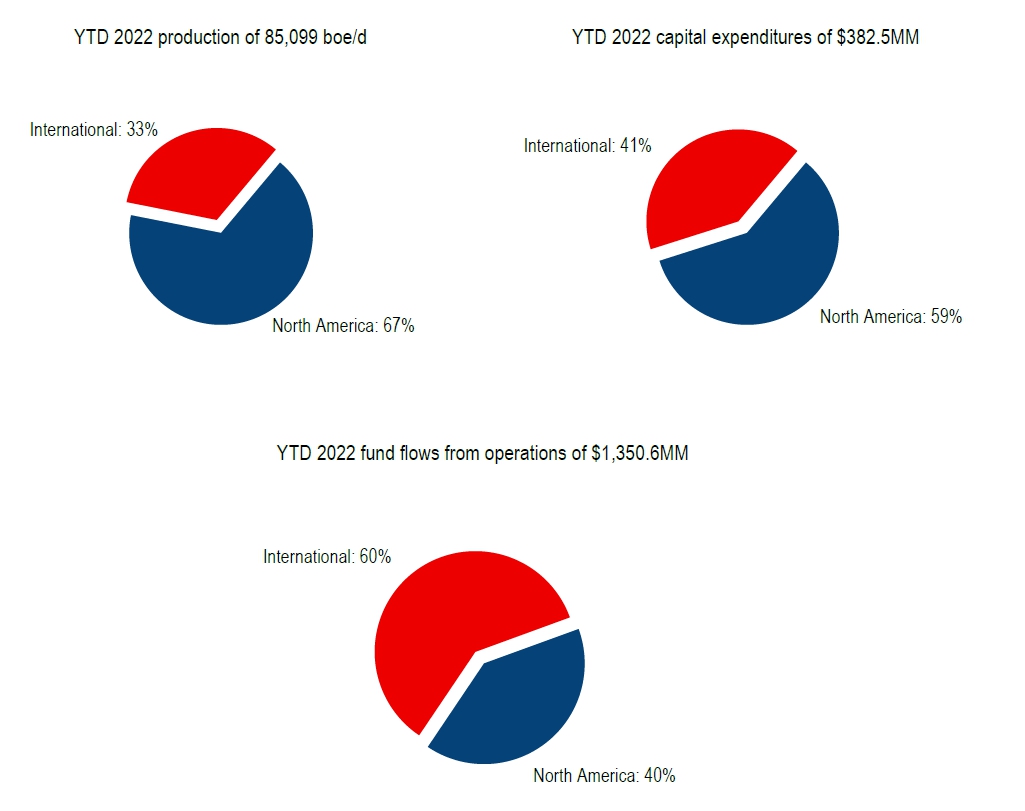
| • | Production in Q3 2022 averaged 84,237 boe/d(8) a decrease of 1% from the previous quarter, primarily due to fire-related downtime in France and third-party downtime in Canada. |
| • | Production from our International operations averaged 27,095 boe/d(8) in Q3 2022, an increase of 1% from the prior quarter, primarily due to higher production in Australia and Germany, which more than offset fire-related downtime in France and natural decline in the other jurisdictions. |
| • | In Australia, we successfully drilled the B17 and B18 wells into oil-bearing formations in the Wandoo field. The wells have produced over 300,000 barrels cumulative to date and generated approximately $30 million of operating cash flow, recovering 40% of the invested capital in the first two months on production. |
| • | Production from our North American operations averaged 57,142 boe/d(8) in Q3 2022, a decrease of 2% from the prior quarter, primarily due to third-party downtime in Canada and delayed start-up of our Turner wells in the United States. |
| • | During the quarter, we completed the 6-well Montney pad that was drilled in Q2 2022 and are in the process of finishing construction of the initial build-out of the facility and bringing these wells on production. |
| • | Late in the third quarter, the European Union (“EU”) announced the approval of a temporary windfall tax measure aimed at EU companies with activities in the hydrocarbon sector. Based on preliminary information currently available, we estimate Vermilion's exposure to the EU windfall tax could be in the range of $250 to $350 million for 2022. |
Vermilion Energy Inc. ■ Page 4 ■ 2022 Third Quarter Report |
| ($M except as indicated) | | Q3 2022 | | Q2 2022 | | Q3 2021 | | YTD 2022 | | YTD 2021 |
| Financial | | | | | | | | | | |
| Petroleum and natural gas sales | | | 964,678 | | | | 858,844 | | | | 538,530 | | | | 2,633,701 | | | | 1,313,846 | |
| Cash flows from operating activities | | | 447,608 | | | | 530,364 | | | | 211,548 | | | | 1,319,025 | | | | 584,101 | |
| Fund flows from operations (1) | | | 507,876 | | | | 452,901 | | | | 262,696 | | | | 1,350,645 | | | | 597,689 | |
| Fund flows from operations ($/basic share) (2) | | | 3.10 | | | | 2.75 | | | | 1.62 | | | | 8.25 | | | | 3.72 | |
| Fund flows from operations ($/diluted share) (2) | | | 3.01 | | | | 2.68 | | | | 1.59 | | | | 8.01 | | | | 3.65 | |
| Net earnings (loss) | | | 271,079 | | | | 362,621 | | | | (147,130 | ) | | | 917,654 | | | | 804,108 | |
| Net (loss) earnings ($/basic share) | | | 1.65 | | | | 2.20 | | | | (0.91 | ) | | | 5.61 | | | | 5.00 | |
| Cash flows used in investing activities | | | 168,275 | | | | 612,634 | | | | 162,930 | | | | 891,239 | | | | 334,827 | |
| Capital expenditures (7) | | | 184,015 | | | | 113,153 | | | | 66,450 | | | | 382,512 | | | | 228,989 | |
| Acquisitions | | | 6,220 | | | | 522,223 | | | | 94,420 | | | | 535,155 | | | | 107,332 | |
| Asset retirement obligations settled | | | 10,386 | | | | 4,300 | | | | 5,142 | | | | 21,006 | | | | 15,486 | |
| Cash dividends ($/share) | | | 0.08 | | | | 0.06 | | | | — | | | | 0.20 | | | | — | |
| Dividends declared | | | 13,031 | | | | 9,913 | | | | — | | | | 32,711 | | | | — | |
| % of fund flows from operations (9) | | | 3 | % | | | 2 | % | | | — | % | | | 2 | % | | | — | % |
| Payout (10) | | | 207,432 | | | | 127,366 | | | | 71,592 | | | | 436,229 | | | | 244,475 | |
| % of fund flows from operations (10) | | | 41 | % | | | 28 | % | | | 27 | % | | | 32 | % | | | 41 | % |
| Free cash flow (3) | | | 323,861 | | | | 339,748 | | | | 196,246 | | | | 968,133 | | | | 368,700 | |
| Long-term debt | | | 1,409,507 | | | | 1,527,217 | | | | 1,760,342 | | | | 1,409,507 | | | | 1,760,342 | |
| Net debt (5) | | | 1,412,052 | | | | 1,588,668 | | | | 1,778,052 | | | | 1,412,052 | | | | 1,778,052 | |
| Net debt to four quarter trailing fund flows from operations (6) | | | 0.8 | | | | 1.1 | | | | 2.4 | | | | 0.8 | | | | 2.4 | |
| Operational |
| Production (8) | | | | | | | | | | | | | | | | | | | | |
| Crude oil and condensate (bbls/d) | | | 37,315 | | | | 36,783 | | | | 38,777 | | | | 37,064 | | | | 38,777 | |
| NGLs (bbls/d) | | | 7,901 | | | | 8,113 | | | | 8,068 | | | | 8,117 | | | | 8,279 | |
| Natural gas (mmcf/d) | | | 234.12 | | | | 239.83 | | | | 226.73 | | | | 239.51 | | | | 232.12 | |
| Total (boe/d) | | | 84,237 | | | | 84,868 | | | | 84,633 | | | | 85,099 | | | | 85,742 | |
| Average realized prices | | | | | | | | | | | | | | | | | | | | |
| Crude oil and condensate ($/bbl) | | | 123.02 | | | | 138.55 | | | | 87.05 | | | | 127.34 | | | | 79.40 | |
| NGLs ($/bbl) | | | 44.64 | | | | 51.86 | | | | 35.55 | | | | 47.82 | | | | 30.03 | |
| Natural gas ($/mcf) | | | 24.68 | | | | 16.50 | | | | 9.20 | | | | 19.50 | | | | 6.63 | |
| Production mix (% of production) | | | | | | | | | | | | | | | | | | | | |
| % priced with reference to WTI | | | 38 | % | | | 39 | % | | | 39 | % | | | 38 | % | | | 38 | % |
| % priced with reference to Dated Brent | | | 17 | % | | | 16 | % | | | 18 | % | | | 17 | % | | | 18 | % |
| % priced with reference to AECO | | | 30 | % | | | 29 | % | | | 28 | % | | | 29 | % | | | 29 | % |
| % priced with reference to TTF and NBP | | | 15 | % | | | 16 | % | | | 15 | % | | | 16 | % | | | 15 | % |
| Netbacks ($/boe) | | | | | | | | | | | | | | | | | | | | |
| Operating netback (11) | | | 78.42 | | | | 72.57 | | | | 36.17 | | | | 70.20 | | | | 29.30 | |
| Fund flows from operations ($/boe) (12) | | | 67.07 | | | | 58.82 | | | | 33.27 | | | | 58.86 | | | | 25.75 | |
| Operating expenses | | | 16.64 | | | | 14.89 | | | | 13.21 | | | | 15.37 | | | | 12.93 | |
| General and administration expenses | | | 1.90 | | | | 2.04 | | | | 1.56 | | | | 1.93 | | | | 1.53 | |
| Average reference prices | | | | | | | | | | | | | | | | | | | | |
| WTI (US $/bbl) | | | 91.56 | | | | 108.41 | | | | 70.56 | | | | 98.09 | | | | 64.82 | |
| Dated Brent (US $/bbl) | | | 100.85 | | | | 113.78 | | | | 73.47 | | | | 105.35 | | | | 67.73 | |
| AECO ($/mcf) | | | 4.16 | | | | 7.24 | | | | 3.60 | | | | 5.38 | | | | 3.28 | |
| TTF ($/mcf) | | | 75.56 | | | | 38.08 | | | | 20.65 | | | | 51.64 | | | | 13.27 | |
| Share information ('000s) |
| Shares outstanding - basic | | | 162,883 | | | | 165,222 | | | | 161,985 | | | | 162,883 | | | | 161,985 | |
| Shares outstanding - diluted (13) | | | 168,574 | | | | 170,969 | | | | 169,012 | | | | 168,574 | | | | 169,012 | |
| Weighted average shares outstanding - basic | | | 163,947 | | | | 164,518 | | | | 161,957 | | | | 163,619 | | | | 160,809 | |
| Weighted average shares outstanding - diluted (13) | | | 168,494 | | | | 169,169 | | | | 164,991 | | | | 168,658 | | | | 163,693 | |
|
(1) | Fund flows from operations (FFO) is a total of segments measure comparable to net earnings that is comprised of sales excluding royalties, transportation, operating, G&A, corporate income tax, PRRT, interest expense, realized loss on derivatives, realized foreign exchange gain (loss), and realized other income. The measure is used to assess the contribution of each business unit to Vermilion's ability to generate income necessary to pay dividends, repay debt, fund asset retirement obligations, and make capital investments. FFO does not have a standardized meaning under IFRS and therefore may not be comparable to similar measures provided by other issuers. More information and a reconciliation to primary financial statement measures can be found in the “Non-GAAP and Other Specified Financial Measures” section of this document. |
Vermilion Energy Inc. ■ Page 5 ■ 2022 Third Quarter Report |
| (2) | Fund flows from operations per share (basic and diluted) are supplementary financial measures and are not a standardized financial measures under IFRS, and therefore may not be comparable to similar measures disclosed by other issuers. They are calculated using FFO (a total of segments measure) and basic/diluted shares outstanding. The measure is used to assess the contribution per share of each business unit. More information and a reconciliation to primary financial statement measures can be found in the “Non-GAAP and Other Specified Financial Measures” section of this document. |
| (3) | Free cash flow (FCF) is a non-GAAP financial measure comparable to cash flows from operating activities and is comprised of FFO less drilling and development and exploration and evaluation expenditures. More information and a reconciliation to primary financial statement measures can be found in the “Non-GAAP and Other Specified Financial Measures” section of this document. |
| (4) | Free cash flow per basic share is a non-GAAP supplementary financial measure and is not a standardized financial measure under IFRS and may not be comparable to similar measures disclosed by other issuers. It is calculated using FCF and basic shares outstanding. |
| (5) | Net debt is a capital management measure comparable to long-term debt and is comprised of long-term debt (excluding unrealized foreign exchange on swapped USD borrowings) plus adjusted working capital (defined as current assets less current liabilities, excluding current derivatives and current lease liabilities). More information and a reconciliation to primary financial statement measures can be found in the “Non-GAAP and Other Specified Financial Measures” section of this document. |
| (6) | Net debt to trailing FFO is a supplementary financial measure and is not a standardized financial measure under IFRS. It may not be comparable to similar measures disclosed by other issuers and is calculated using net debt (capital management measure) and FFO (total of segment measure). The measure is used to assess the ability to repay debt. Information in this document is included by reference; refer to the "Non-GAAP and Other Specified Financial Measures" section of this document. |
| (7) | Capital expenditures is a non-GAAP financial measure that is the sum of drilling and development costs and exploration and evaluation costs from the Consolidated Statements of Cash Flows. More information and a reconciliation to primary financial statement measures can be found in the “Non-GAAP and Other Specified Financial Measures” section of this document. |
| (8) | Please refer to Supplemental Table 4 "Production" of the accompanying Management's Discussion and Analysis for disclosure by product type. |
| (9) | Dividends % of FFO is a supplementary financial measure that is not standardized under IFRS and may not be comparable to similar measures disclosed by other issuers, calculated as dividends divided by FFO. The ratio is used by management as a metric to assess the cash distributed to shareholders. Reconciliation to primary financial statement measures can be found in the “Non-GAAP and Other Specified Financial Measures” section of this document. |
| (10) | Payout and payout % of FFO are a non-GAAP financial measure and a non-GAAP ratio respectively that are not standardized under IFRS and may not be comparable to similar measures disclosed by other issuers. Payout is comparable to dividends declared and is comprised of dividends declared plus drilling and development costs, exploration and evaluation costs, and asset retirement obligations settled, while the ratio is calculated as payout divided by FFO. More information and a reconciliation to primary financial statement measures can be found in the “Non-GAAP and Other Specified Financial Measures” section of this document. |
| (11) | Operating netback is a non-GAAP financial measure comparable to net earnings and is comprised of sales less royalties, operating expense, transportation costs, PRRT, and realized hedging gains and losses. More information and a reconciliation to primary financial statement measures can be found in the “Non-GAAP and Other Specified Financial Measures” section of this document. |
| (12) | Fund flows from operations per boe is a supplementary financial measure that is not standardized under IFRS and may not be comparable to similar measures disclosed by other issuers, calculated as FFO by boe production. Fund flows from operations per boe is used by management to assess the profitability of our business units and Vermilion as a whole. More information and a reconciliation to primary financial statement measures can be found in the “Non-GAAP and Other Specified Financial Measures” section of this document. |
| (13) | Diluted shares outstanding represent the sum of shares outstanding at the period end plus outstanding awards under the VIP, based on current estimates of future performance factors and forfeiture rates. |
Vermilion Energy Inc. ■ Page 6 ■ 2022 Third Quarter Report |
Message to Shareholders
Energy security and inflation have become focal points for many countries and citizens around the world, especially in Europe, where the energy security situation is a result of policy decisions over multiple years and has been exacerbated by the ongoing and unfortunate conflict in Ukraine. During the third quarter, European natural gas prices reached an all-time high in excess of $120/mmbtu (TTF) in late August following various supply disruptions and growing concerns regarding Europe's ability to meet winter energy demand. Prior to 2022, Europe relied on Russia for approximately 40% of its gas supply, but Russian imports have significantly decreased in recent months as key infrastructure was taken off-line. Damage to the Nord Stream 1 gas pipeline in the Baltic Sea in late September removed approximately 6 Bcf/d of capacity, in addition to other supply losses throughout the year.
Despite various supply challenges, Europe managed to source enough gas over the summer months to essentially fill storage ahead of the winter heating season, albeit at very high prices and with less global competition due to lower LNG demand from Asia as a result of COVID lockdown policies in China. With storage essentially full, Europe is expected to have enough gas to meet demand this winter, assuming average weather conditions; however, refilling storage next year will be more difficult with Nord Stream 1 offline and Chinese demand potentially returning to pre-COVID levels. Looking further out, we expect Europe to become increasingly dependent on LNG to meet its natural gas needs, which will require direct competition with Asia, where LNG demand is expected to increase substantially over the coming decade. There is very limited new LNG supply coming online over the next few years, and new projects require significant capital underpinned by long-term contracts. Given this global LNG backdrop and the underlying supply and demand fundamentals in Europe, we expect LNG and European natural gas prices to remain elevated for the foreseeable future.
The prospect for higher energy costs and the resulting impact on European households and the economy has become a front and centre concern for all stakeholders in Europe. Over the past several months there have been various policy ideas debated on how to contain energy prices in Europe, ranging from voluntary demand reduction to price caps to windfall taxes. Vermilion has been actively engaged with government officials in the countries where we operate to identify opportunities where we can contribute to domestic gas needs. Vermilion has been operating in Europe for over 25 years and we are a reliable and responsible producer of indigenous natural gas in the region. We believe natural gas is an important energy source that should be produced locally where possible to ensure security of supply. Producing countries that provide predictable and reliable fiscal and regulatory frameworks can benefit from the direct and indirect employment, tax and royalty revenues, lower full-cycle emissions, and added energy security that comes with domestic production. With approximately 3.8 million net acres of undeveloped land in prospective basins across Europe, and the ability to accelerate drilling, we believe there is an opportunity to increase gas production with government support and the appropriate regulatory frameworks in place.
Late in the third quarter, the European Union (“EU”) announced several proposals in an attempt to address high energy costs. One of the proposals, which was subsequently approved, is a temporary windfall tax measure aimed at EU companies with activities in the hydrocarbon sector. This windfall tax, which is referred to as a solidarity contribution in the EU regulation, is calculated as a percentage of earnings above a baseline level of 120% of the average of taxable earnings of a subject company between 2018 and 2021. Certain implementation details are the responsibility of EU Member States (countries), including the applicable tax rate (the EU regulation specifies a minimum rate of 33%) and whether this windfall tax will apply retroactively to 2022, prospectively to 2023, or to both 2022 and 2023. We do not believe a windfall tax is an appropriate solution as it will not incentivize new domestic supply nor reduce consumption, and it may ultimately result in higher natural gas prices in Europe. We are working with government officials in the countries where we operate to express our concerns and work collaboratively to achieve an equitable implementation under the relevant circumstances. Based on preliminary information currently available, we estimate Vermilion's exposure to the EU windfall tax could be in the range of $250 to $350 million for 2022. As the windfall tax legislation was not substantively enacted by September 30, 2022 and there is significant uncertainty on associated implementation details, no provisions for this measure are included in our Q3 2022 results.
Despite political headwinds during the quarter, we delivered another quarter with strong financial results. Q3 2022 production of 84,237 boe/d was in line with the prior quarter. Oil prices weakened in the third quarter, however European gas prices nearly doubled in Q3 2022 compared to the prior quarter which contributed to record quarterly FFO of $508 million, a 12% increase over the prior quarter. Capital spending increased to $184 million in the third quarter primarily related to the offshore Australia drilling campaign which was delayed from the previous quarter, resulting in FCF of $324 million. Pro forma Q3 2022 FFO and FCF incorporating the incremental 36.5% ownership in Corrib was $611 million and $426 million, respectively.
The majority of Q3 2022 free cash was allocated to debt reduction, with net debt decreasing by approximately 11% to $1.4 billion, representing a debt to trailing 12-month FFO ratio of 0.8x - the lowest level in over ten years. We have made significant debt reduction progress in 2022, which allowed us to increase the amount of capital returned to shareholders in the third quarter. Vermilion declared a quarterly cash dividend of $0.08 CDN per share in Q3 2022 which was paid on October 17, 2022. This represented a 33% increase over the Q2 2022 dividend and aligns with our dividend policy of providing ratable increases while ensuring the annual dividend amount is sustainable at mid-cycle pricing. In addition, we repurchased 2.3 million shares under our NCIB for $72 million in Q3 2022, representing 14% of the 16 million shares approved for purchase under our current NCIB. Including dividends and share buybacks, we returned $85 million to shareholders in Q3 2022, representing 26% of Q3 2022 FCF.
Vermilion Energy Inc. ■ Page 7 ■ 2022 Third Quarter Report |
Outlook
With the potential funding of a windfall tax in Q4 2022 and a weaker Canadian dollar relative to the US dollar, we expect our year-end 2022 debt will exceed our previous target of $1.2 billion, however we anticipate we will remain below our leverage target. Following the EU approval of the windfall tax, we elected to suspend share repurchases under our NCIB for Q4 2022 as we continue to prioritize financial discipline and assess the impact of the windfall tax on our debt targets. We will evaluate the reinstatement of share repurchases under our NCIB once we have more clarity on the amount of windfall tax to be incurred in 2022 and the potential impact on 2023.
Closing of the Corrib acquisition is nearing the final stages, and we now anticipate the acquisition to close in Q1 2023 due to administrative delays. As previously noted, all free cash flow generated by the acquired interest in Corrib from January 1, 2022 until close will accrue to Vermilion and be netted off the final purchase price. Our 2022 capital budget of $550 million and annual production guidance of 86,000 to 88,000 boe/d remain unchanged, however, we expect annual production to be at the lower end of this range as a result of fire-related downtime in France and delayed onstream timing of the Australia and United States wells.
We plan to announce our 2023 budget in early January as we take additional time to assess the impact of the windfall tax, work with regulators in Europe to facilitate additional drilling, and confirm timing of the Corrib acquisition close. We will remain disciplined in 2023 as we continue to focus on debt reduction. At this time, we anticipate a capital budget similar to 2022 investment levels, with potentially a greater proportion allocated to European gas. We have the ability and desire to drill more wells in Europe, and, if ongoing discussions with regulators are productive, we will look to allocate additional capital to the region in 2023.
Q3 2022 Operations Review
North America
Production from our North American operations averaged 57,142 boe/d(1) in Q3 2022, a decrease of 2% from the prior quarter primarily due to third-party downtime in Canada and delayed start-up of our Turner wells in the United States. During the third quarter, we drilled 20 (15.0 net) wells, completed 18 (14.6 net) wells, and brought on production 14 (13.5 net) wells in south-east Saskatchewan. In Alberta, we drilled two (1.1 net) Mannville liquids rich gas wells and completed the six (6.0 net) wells on our first Montney pad at Mica which were drilled in Q2 2022. We successfully completed the Montney wells with over 1,000 fracs placed over six wells with no material downtime. Natural gas powered frac equipment was used during the completions, replacing 1 million litres of diesel and saving approximately $1.4 million. Construction of the initial build-out of the facility is nearing completion and these wells will be brought on production shortly. The performance of this pad will provide information on the reservoir deliverability and assist us with planning for future development as we await resolution on the Blueberry River First Nations permitting for our British Columbia lands.
In the United States, we drilled the remaining one (1.0 net) well of our planned six (5.8 net) well operated Turner program, and completed and brought on production the remaining five (4.8 net) wells of the six (5.8 net) well Turner program during the third quarter. As part of our ongoing efforts to optimize the development of the Turner play, three of the wells were drilled with extended reach (two-mile) laterals and we executed smaller fracs across all the wells, which resulted in approximately $2.7 million of total cost savings. While the initial production from these wells is lower than higher intensity completions, we are monitoring performance to determine the impact on the longer-term decline profile, well recovery, and overall capital efficiency. During the quarter, two (0.4 net) non-operated commitment Parkman wells were completed and brought on production as part of a farmout agreement. The performance of both wells has exceeded our internal type curves, which we will continue to monitor while assessing the potential of this play on our lands.
International
Production from our International operations averaged 27,095 boe/d(1) in Q3 2022, an increase of 1% from the prior quarter. Production increased in Australia and Germany, which more than offset fire-related downtime in France and natural decline in the other jurisdictions. In Australia, we successfully drilled the B17 and B18 wells into oil bearing formations in the Wandoo field, with a total of 6,500 metres of horizontal well length drilled between the two wells. The wells have produced over 300,000 barrels cumulative to date. Our Wandoo crude oil currently sells at an approximate US$14/bbl premium to Brent, resulting in a Q3 2022 Australian operating netback of $96/boe. At current pricing, these two new wells have generated approximately $30 million of operating cash flow, recovering 40% of the invested capital in the first two months on production.
Production increased in Germany due to the successful results from our 1H 2022 drilling program and various workovers completed during the third quarter. In France, we have made progress in restoring production impacted by recent forest fires, including repairing and rebuilding damaged electrical infrastructure and facilities, and pressure testing the gathering system in affected areas. We expect most of the remaining shut-in production to be restored by the end of the year. During the quarter, three wells were drilled in Hungary, but none of the wells encountered commercial hydrocarbons. The capital spend on this program was minimal, while the findings will further enhance our knowledge and understanding of the geology in this region. Elsewhere in Europe, we continued with support work for our Q4 2022 drilling campaign which will include one (0.5 net) well in Netherlands, one (1.0 net) well in Germany, and two (2.0 net) wells in Croatia.
Vermilion Energy Inc. ■ Page 8 ■ 2022 Third Quarter Report |
Commodity Hedging
Vermilion hedges to manage commodity price exposures and increase the stability of our cash flows. In aggregate, as of November 9, 2022, we have 26% of our expected net-of-royalty production hedged for the remainder of 2022. With respect to individual commodity products, we have hedged 57% of our European natural gas production, 17% of our oil production, and 37% of our North American natural gas volumes for the remainder of 2022, respectively. Please refer to the Hedging section of our website under Invest With Us for further details using the following link:
https://www.vermilionenergy.com/invest-with-us/hedging.cfm.
| (Signed “Dion Hatcher”) | |
| | |
| Dion Hatcher | |
| President | |
| November 9, 2022 | |
| (1) | Please refer to Supplemental Table 4 "Production" of the accompanying Management's Discussion and Analysis for disclosure by product type. |
Vermilion Energy Inc. ■ Page 9 ■ 2022 Third Quarter Report |
Non-GAAP and Other Specified Financial Measures
This earnings release and other materials release by Vermilion includes financial measures that are not standardized, specified, defined, or determined under IFRS and are therefore considered non-GAAP or other specified financial measures and may not be comparable to similar measures presented by other issuers. These financial measures include:
Fund flows from operations (FFO): A total of segments measure most directly comparable to net earnings. FFO is comprised of sales excluding royalties, transportation, operating, G&A, corporate income tax, PRRT, interest expense, realized loss on derivatives, realized foreign exchange gain (loss), and realized other income. The measure is used to assess the contribution of each business unit to Vermilion's ability to generate income necessary to pay dividends, repay debt, fund asset retirement obligations and make capital investments.
| | | Q3 2022 | | Q3 2021 | | YTD 2022 | | YTD 2021 |
| | | $M | | $/boe | | $M | | $/boe | | $M | | $/boe | | $M | | $/boe |
| Sales | | | 964,678 | | | | 127.39 | | | | 538,530 | | | | 68.19 | | | | 2,633,701 | | | | 114.76 | | | | 1,313,846 | | | | 56.58 | |
| Royalties | | | (82,854 | ) | | | (10.94 | ) | | | (49,435 | ) | | | (6.26 | ) | | | (237,714 | ) | | | (10.36 | ) | | | (127,337 | ) | | | (5.48 | ) |
| Transportation | | | (19,498 | ) | | | (2.57 | ) | | | (19,273 | ) | | | (2.44 | ) | | | (56,920 | ) | | | (2.48 | ) | | | (58,128 | ) | | | (2.50 | ) |
| Operating | | | (125,987 | ) | | | (16.64 | ) | | | (104,355 | ) | | | (13.21 | ) | | | (352,787 | ) | | | (15.37 | ) | | | (300,333 | ) | | | (12.93 | ) |
| General and administration | | | (14,422 | ) | | | (1.90 | ) | | | (12,341 | ) | | | (1.56 | ) | | | (44,333 | ) | | | (1.93 | ) | | | (35,503 | ) | | | (1.53 | ) |
| Corporate income tax (expense) recovery | | | (51,022 | ) | | | (6.74 | ) | | | 1,414 | | | | 0.18 | | | | (166,195 | ) | | | (7.24 | ) | | | 2,068 | | | | 0.09 | |
| PRRT | | | (4,545 | ) | | | (0.60 | ) | | | (7,271 | ) | | | (0.92 | ) | | | (13,273 | ) | | | (0.58 | ) | | | (10,144 | ) | | | (0.44 | ) |
| Interest expense | | | (24,455 | ) | | | (3.23 | ) | | | (18,699 | ) | | | (2.37 | ) | | | (60,352 | ) | | | (2.63 | ) | | | (56,796 | ) | | | (2.45 | ) |
| Realized loss on derivatives | | | (137,953 | ) | | | (18.22 | ) | | | (72,579 | ) | | | (9.19 | ) | | | (361,954 | ) | | | (15.77 | ) | | | (137,786 | ) | | | (5.93 | ) |
| Realized foreign exchange (loss) gain | | | (2,103 | ) | | | (0.28 | ) | | | 2,921 | | | | 0.37 | | | | (3,650 | ) | | | (0.16 | ) | | | (4,218 | ) | | | (0.18 | ) |
| Realized other income | | | 6,037 | | | | 0.80 | | | | 3,784 | | | | 0.48 | | | | 14,122 | | | | 0.62 | | | | 12,020 | | | | 0.52 | |
| Fund flows from operations | | | 507,876 | | | | 67.07 | | | | 262,696 | | | | 33.27 | | | | 1,350,645 | | | | 58.86 | | | | 597,689 | | | | 25.75 | |
| Equity based compensation | | | (6,145 | ) | | | | | | | (7,823 | ) | | | | | | | (39,013 | ) | | | | | | | (34,899 | ) | | | | |
| Unrealized gain (loss) on derivative instruments (1) | | | 43,844 | | | | | | | | (279,393 | ) | | | | | | | (8,892 | ) | | | | | | | (353,359 | ) | | | | |
| Unrealized foreign exchange loss (1) | | | (44,929 | ) | | | | | | | (27,877 | ) | | | | | | | (37,059 | ) | | | | | | | (72,085 | ) | | | | |
| Accretion | | | (14,285 | ) | | | | | | | (11,199 | ) | | | | | | | (41,669 | ) | | | | | | | (32,569 | ) | | | | |
| Depletion and depreciation | | | (130,205 | ) | | | | | | | (167,808 | ) | | | | | | | (405,208 | ) | | | | | | | (423,472 | ) | | | | |
| Deferred tax (expense) recovery | | | (84,570 | ) | | | | | | | 62,245 | | | | | | | | (91,974 | ) | | | | | | | (172,509 | ) | | | | |
| Gain on business combinations | | | — | | | | | | | | — | | | | | | | | — | | | | | | | | 17,198 | | | | | |
| Impairment reversal | | | — | | | | | | | | 22,225 | | | | | | | | 192,094 | | | | | | | | 1,278,697 | | | | | |
| Unrealized other expense | | | (507 | ) | | | | | | | (196 | ) | | | | | | | (1,270 | ) | | | | | | | (583 | ) | | | | |
| Net earnings (loss) | | | 271,079 | | | | | | | | (147,130 | ) | | | | | | | 917,654 | | | | | | | | 804,108 | | | | | |
| (1) | Unrealized gain (loss) on derivative instruments, Unrealized foreign exchange loss, and Unrealized other expense are line items from the respective Consolidated Statements of Cash Flows. |
Free cash flow (FCF): A non-GAAP financial measure most directly comparable to cash flows from operating activities. FCF is comprised of fund flows from operations less drilling and development costs and exploration and evaluation costs. The measure is used to determine the funding available for investing and financing activities including payment of dividends, repayment of long-term debt, reallocation into existing business units and deployment into new ventures.
| ($M) | | Q3 2022 | | Q3 2021 | | 2022 | | 2021 |
| Cash flows from operating activities | | | 447,608 | | | | 211,548 | | | | 1,319,025 | | | | 584,101 | |
| Changes in non-cash operating working capital | | | 49,882 | | | | 46,006 | | | | 10,614 | | | | (1,898 | ) |
| Asset retirement obligations settled | | | 10,386 | | | | 5,142 | | | | 21,006 | | | | 15,486 | |
| Fund flows from operations | | | 507,876 | | | | 262,696 | | | | 1,350,645 | | | | 597,689 | |
| Drilling and development | | | (177,878 | ) | | | (63,173 | ) | | | (370,207 | ) | | | (220,388 | ) |
| Exploration and evaluation | | | (6,137 | ) | | | (3,277 | ) | | | (12,305 | ) | | | (8,601 | ) |
| Free cash flow | | | 323,861 | | | | 196,246 | | | | 968,133 | | | | 368,700 | |
2023+ FFO and FCF: A forward-looking total of segments measure and a forward-looking non-GAAP measure; the equivalent historical measures FFO and FCF have been disclosed above.
Vermilion Energy Inc. ■ Page 10 ■ 2022 Third Quarter Report |
Capital expenditures: A non-GAAP financial measure that is calculated as the sum of drilling and development costs and exploration and evaluation costs from the Consolidated Statements of Cash Flows and is most directly comparable to cash flows used in investing activities. We consider capital expenditures to be a useful measure of our investment in our existing asset base. Capital expenditures are also referred to as E&D capital.
| ($M) | Q3 2022 | Q3 2021 | 2022 | 2021 |
| Drilling and development | 177,878 | 63,173 | 370,207 | 220,388 |
| Exploration and evaluation | 6,137 | 3,277 | 12,305 | 8,601 |
| Capital expenditures | 184,015 | 66,450 | 382,512 | 228,989 |
Net debt: A capital management measure in accordance with IAS 1 "Presentation of Financial Statements" that is most directly comparable to long-term debt. Net debt is comprised of long-term debt (excluding unrealized foreign exchange on swapped USD borrowings) plus adjusted working, capital and represents Vermilion's net financing obligations after adjusting for the timing of working capital fluctuations.
Net debt to four quarter trailing fund flows from operations: A supplementary financial measure that is calculated as net debt (capital management measure) over the FFO (total of segments measure) from the preceding four quarters. The measure is used to assess the ability to repay debt.
| | As at |
| ($M) | Sep 30, 2022 | Dec 31, 2021 |
| Long-term debt | 1,409,507 | 1,651,569 |
| Adjusted working capital | 22,212 | 9,284 |
| Unrealized FX on swapped USD borrowings | (19,667) | (16,067) |
| Net debt | 1,412,052 | 1,644,786 |
| | | |
| Ratio of net debt to four quarter trailing fund flows from operations | 0.8 | 1.8 |
Adjusted working capital: A non-GAAP financial measure defined as current assets less current liabilities, excluding current derivatives and current lease liabilities. The measure is used to calculate net debt, a capital measure disclosed above.
| | As at |
| ($M) | Sep 30, 2022 | Dec 31, 2021 |
| Current assets | 598,541 | 472,845 |
| Current derivative asset | (46,185) | (19,321) |
| Current liabilities | (987,070) | (746,813) |
| Current lease liability | 17,774 | 15,032 |
| Current derivative liability | 394,728 | 268,973 |
| Adjusted working capital | (22,212) | (9,284) |
Payout and payout % of FFO: A non-GAAP financial measure and non-GAAP ratio respectively most directly comparable to dividends declared. Payout is comprised of dividends declared plus drilling and development costs, exploration and evaluation costs, and asset retirement obligations settled. The measure is used to assess the amount of cash distributed back to shareholders and reinvested in the business for maintaining production and organic growth. The reconciliation of the measure to primary financial statement measure can be found below. Management uses payout and payout as a percentage of FFO (also referred to as the payout or sustainability ratio).
Dividends % of FFO: A supplementary financial measure that is calculated as dividends declared divided by FFO (total of segments measure). The measure is used by management as a metric to assess the cash distributed to shareholders.
Vermilion Energy Inc. ■ Page 11 ■ 2022 Third Quarter Report |
| ($M) | Q3 2022 | Q3 2021 | YTD 2022 | YTD 2021 |
| Dividends declared | 13,031 | - | 32,711 | - |
| % of fund flows from operations | 3 % | - % | 2 % | - % |
| Drilling and development | 177,878 | 63,173 | 370,207 | 220,388 |
| Exploration and evaluation | 6,137 | 3,277 | 12,305 | 8,601 |
| Asset retirement obligations settled | 10,386 | 5,142 | 21,006 | 15,486 |
| Payout | 207,432 | 71,592 | 436,229 | 244,475 |
| % of fund flows from operations | 41 % | 27 % | 32 % | 41 % |
Operating netback: Is a non-GAAP financial measure most comparable to net earnings and is calculated as sales less royalties, operating expense, transportation costs, PRRT, and realized hedging gains and losses presented on a per unit basis. Management assesses operating netback as a measure of the profitability and efficiency of our field operations.
Fund flows from operations per boe: A supplementary financial measure that is calculated as FFO (total of segments measure) by boe production. Fund flows from operations per boe is used by management to assess the profitability of our business units and Vermilion as a whole.
Vermilion Energy Inc. ■ Page 12 ■ 2022 Third Quarter Report |
Management's Discussion and Analysis
The following is Management’s Discussion and Analysis (“MD&A”), dated November 9, 2022, of Vermilion Energy Inc.’s (“Vermilion”, “we”, “our”, “us” or the “Company”) operating and financial results as at and for the three and nine months ended September 30, 2022 compared with the corresponding periods in the prior year.
This discussion should be read in conjunction with the unaudited condensed consolidated interim financial statements for the three and nine months ended September 30, 2022 and the audited consolidated financial statements for the years ended December 31, 2021 and 2020, together with the accompanying notes. Additional information relating to Vermilion, including its Annual Information Form, is available on SEDAR at www.sedar.com or on Vermilion’s website at www.vermilionenergy.com.
The unaudited condensed consolidated interim financial statements for the three and nine months ended September 30, 2022 and comparative information have been prepared in Canadian dollars, except where another currency has been indicated, and in accordance with IAS 34, "Interim Financial Reporting", as issued by the International Accounting Standards Board ("IASB").
This MD&A includes references to certain financial and performance measures which do not have standardized meanings prescribed by International Financial Reporting Standards ("IFRS"). These measures include:
| • | Fund flows from operations: Fund flows from operations (FFO) is a total of segments measure most directly comparable to net earnings and is comprised of sales excluding royalties, transportation, operating, G&A, corporate income tax, PRRT, interest expense, realized loss on derivatives, realized foreign exchange gain (loss), and realized other income. The measure is used to assess the contribution of each business unit to Vermilion's ability to generate income necessary to pay dividends, repay debt, fund asset retirement obligations and make capital investments. A reconciliation to Net Earnings can be found within the "Non-GAAP and Other Specified Financial Measures" section of this MD&A. |
| • | Free cash flow: Free cash flow (FCF) is a non-GAAP financial measure most directly comparable to Cash flows used in investing activities and is comprised of FFO less drilling and development costs and exploration and evaluation costs. The measure is used to determine the funding available for investing and financing activities including payment of dividends, repayment of long-term debt, reallocation into existing business units and deployment into new ventures. A reconciliation to Cash flows used in investing activities can be found within the "Non-GAAP and Other Specified Financial Measures" section of this MD&A. |
| • | Net debt: Net debt is a capital management measure in accordance with IAS 1 "Presentation of Financial Statements" and is most directly comparable to long-term debt. Net debt is comprised of long-term debt (excluding unrealized foreign exchange on swapped USD borrowings) plus adjusted working capital (defined as current assets less current liabilities, excluding current derivatives and current lease liabilities), and represents Vermilion's net financing obligations after adjusting for the timing of working capital fluctuations. Net debt excludes lease obligations which are secured by a corresponding right-of-use asset. A reconciliation to long term-debt can be found within the "Financial Position Review" section of this MD&A. |
| • | Operating Netbacks: Operating Netbacks is a non-GAAP financial measure most directly comparable to net earnings and is calculated as sales less royalties, operating expense, transportation costs, PRRT, and realized hedging gains and losses presented on a per unit basis. Management assesses operating netback as a measure of the profitability and efficiency of our field operations. A reconciliation to the primary financial statement measures can be found within "Supplemental Table 1: Netbacks" of this MD&A. |
| • | Fund flows from operations per boe: Fund flows from operations per boe includes general and administration expense. Fund flows from operations netback is used by management to assess the profitability of our business units and Vermilion as a whole. A reconciliation to the primary financial statement measures can be found within "Supplemental Table 1: Netbacks" of this MD&A. |
In addition, this MD&A includes references to certain financial measures which are not specified, defined, or determined under IFRS and are therefore considered non-GAAP financial measures. These non-GAAP financial measures are unlikely to be comparable to similar financial measures presented by other issuers. For a full description of these non-GAAP financial measures and a reconciliation of these measures to their most directly comparable GAAP measures, please refer to the “Non-GAAP and Other Specified Financial Measures” section of this MD&A.
Product Type Disclosure
Under National Instrument 51-101 "Standards of Disclosure for Oil and Gas Activities", disclosure of production volumes should include segmentation by product type as defined in the instrument. In this report, references to "crude oil" and "light and medium crude oil" mean "light crude oil and medium crude oil" and references to "natural gas" mean "conventional natural gas".
In addition, in Supplemental Table 4 "Production", Vermilion provides a reconciliation from total production volumes to product type and also a reconciliation of "crude oil and condensate" and "NGLs" to the product types "light crude oil and medium crude oil" and "natural gas liquids".
Production volumes reported are based on quantities as measured at the first point of sale.
Vermilion Energy Inc. ■ Page 13 ■ 2022 Third Quarter Report |
Guidance
On November 29, 2021, we released our 2022 capital budget and associated production guidance. On March 28, 2022, we increased our 2022 capital expenditure guidance to $500 million and our 2022 annual production guidance to 86,000 to 88,000 boe/d to reflect the post-closing impact of the acquisition of Leucrotta Exploration Inc. On August 11, 2022, as a result of forest fire related downtime in France, offshore drilling delays in Australia, combined with inflationary pressure, we increased our 2022 budget by $50 million to $550 million.
The following table summarizes our guidance:
| | Date | Capital Expenditures ($MM) | Production (boe/d) |
| 2022 Guidance | | | |
| 2022 Guidance | November 29, 2021 | 425 | 83,000 to 85,000 |
| 2022 Guidance | March 28, 2022 | 500 | 86,000 to 88,000 |
| 2022 Guidance | August 11, 2022 | 550 | 86,000 to 88,000 |
Vermilion Energy Inc. ■ Page 14 ■ 2022 Third Quarter Report |
Vermilion's Business
Vermilion is a Calgary, Alberta-based international oil and gas producer focused on the acquisition, exploration, development, and optimization of producing properties in North America, Europe, and Australia. We manage our business through our Calgary head office and our international business unit offices.
Vermilion Energy Inc. ■ Page 15 ■ 2022 Third Quarter Report |
Consolidated Results Overview
| | Q3 2022 | Q3 2021 | Q3/22 vs. Q3/21 | YTD 2022 | YTD 2021 | 2022 vs. 2021 |
| Production (1) | | | | | | |
| Crude oil and condensate (bbls/d) | 37,315 | 38,777 | (4)% | 37,064 | 38,777 | (4)% |
| NGLs (bbls/d) | 7,901 | 8,068 | (2)% | 8,117 | 8,279 | (2)% |
| Natural gas (mmcf/d) | 234.12 | 226.73 | 3% | 239.51 | 232.12 | 3% |
| Total (boe/d) | 84,237 | 84,633 | (1)% | 85,099 | 85,742 | (1)% |
| Build (draw) in inventory (mbbls) | 176 | (112) | | 282 | 187 | |
| Financial metrics | | | | | | |
| Fund flows from operations ($M) (2) | 507,876 | 262,696 | 93% | 1,350,645 | 597,689 | 126% |
| Per share ($/basic share) | 3.10 | 1.62 | 91% | 8.25 | 3.72 | 122% |
| Net earnings (loss) ($M) | 271,079 | (147,130) | N/A | 917,654 | 804,108 | 14% |
| Per share ($/basic share) | 1.65 | (0.91) | N/A | 5.61 | 5.00 | 12% |
| Cash flows from operating activities ($M) | 447,608 | 211,548 | 112% | 1,319,025 | 584,101 | 126% |
| Free cash flow ($M) (3) | 323,861 | 196,246 | 65% | 968,133 | 368,700 | 163% |
| Long-term debt ($M) | 1,409,507 | 1,760,342 | (20)% | 1,409,507 | 1,760,342 | (20)% |
| Net debt ($M) (4) | 1,412,052 | 1,778,052 | (21)% | 1,412,052 | 1,778,052 | (21)% |
| Activity | | | | | | |
| Capital expenditures ($M) (5) | 184,015 | 66,450 | 177% | 382,512 | 228,989 | 67% |
| Acquisitions ($M) (6) | 6,220 | 94,420 | | 535,155 | 107,332 | |
| (1) | Please refer to Supplemental Table 4 "Production" for disclosure by product type. |
| (2) | Fund flows from operations (FFO) and FFO per share are a total of segments measure and supplementary financial measure respectively most directly comparable to net earnings and net earnings per share, respectively. The measures do not have a standardized meaning under IFRS and therefore may not be comparable to similar measures presented by other issuers. FFO is comprised of sales excluding royalties, transportation, operating, G&A, corporate income tax, PRRT, interest expense, and realized loss (gain) on derivatives, plus realized gain (loss) on foreign exchange and realized other income. The measure is used to assess the contribution of each business unit to Vermilion's ability to generate income necessary to pay dividends, repay debt, fund asset retirement obligations and make capital investments. A reconciliation to the primary financial statement measures can be found within the "Non-GAAP and Other Specified Financial Measures" section of this MD&A. |
| (3) | Free cash flow (FCF) is a non-GAAP financial measure most directly comparable to cash flows from operating activities; it does not have a standardized meaning under IFRS and therefore may not be comparable to similar measures presented by other issuers. FCF is comprised of fund flows from operations less drilling and development costs and exploration and evaluation costs. The measure is used to determine the funding available for investing and financing activities including payment of dividends, repayment of long-term debt, reallocation into existing business units and deployment into new ventures. A reconciliation to primary financial statement measures can be found within the "Non-GAAP and Other Specified Financial Measures" section of this MD&A. |
| (4) | Net debt is a capital management measure in accordance with IAS 1 "Presentation of Financial Statements" and is most directly comparable to long-term debt. Net debt is comprised of long-term debt (excluding unrealized foreign exchange on swapped USD borrowings) plus adjusted working capital (defined as current assets less current liabilities, excluding current derivatives and current lease liabilities), and represents Vermilion's net financing obligations after adjusting for the timing of working capital fluctuations. Net debt excludes lease obligations which are secured by a corresponding right-of-use asset. A reconciliation to the primary financial statement measures can be found within the "Financial Position Review" section of this MD&A. |
| (5) | Capital expenditures is a non-GAAP financial measure that does not have a standardized meaning under IFRS and therefore may not be comparable to similar measures presented by other issuers. The measure is calculated as the sum of drilling and development costs and exploration and evaluation costs from the Consolidated Statements of Cash Flows. We consider capital expenditures to be a useful measure of our investment in our existing asset base. Capital expenditures are also referred to as E&D capital. A reconciliation to the primary financial statement measures can be found within the "Non-GAAP and Other Specified Financial Measures" section of this MD&A. |
| (6) | Acquisitions is a non-GAAP financial measure that does not have a standardized meaning under IFRS and therefore may not be comparable to similar measures presented by other issuers. The measure is calculated as the sum of acquisitions from the Consolidated Statements of Cash Flows, Vermilion common shares issued as consideration, the estimated value of contingent consideration, the amount of acquiree's outstanding long-term debt assumed plus or net of acquired working capital deficit or surplus. We believe that including these components provides a useful measure of the economic investment associated with our acquisition activity. A reconciliation to the acquisitions line item in the Consolidated Statements of Cash Flows can be found in "Supplemental Table 3: Capital Expenditures and Acquisitions" section of this MD&A. |
Vermilion Energy Inc. ■ Page 16 ■ 2022 Third Quarter Report |
| Financial performance review |
Q3 2022 vs. Q3 2021
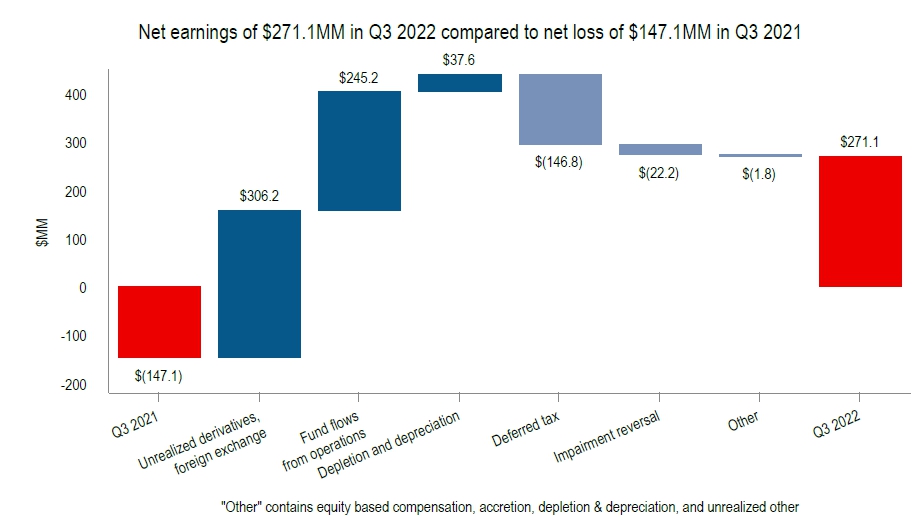
| • | We recorded net earnings of $271.1 million ($1.65/basic share) for Q3 2022 compared to a net loss of $147.1 million ($0.91/basic share) in Q3 2021. The increase in net earnings was due to comparatively lower unrealized derivative loss in Q3 2022 by $323.2 million and incrased FFO driven by higher revenue on strong commodity prices. |

Vermilion Energy Inc. ■ Page 17 ■ 2022 Third Quarter Report |
| • | We generated cash flows from operating activities of $447.6 million in Q3 2022 compared to $211.5 million in Q3 2021 and fund flows from operations of $507.9 million in Q3 2022 compared to $262.7 million in Q3 2021. The increases were primarily due to higher commodity prices, which is reflected in our consolidated realized price per boe increasing from $68.19/boe in Q3 2021 to $127.39/boe in Q3 2022. This was partially offset by decreased sales volume, and increased current taxes and royalties driven by increased pricing. Variances between cash flows from operating activities and fund flows from operations are primarily driven by working capital timing differences. |
YTD 2022 vs. YTD 2021
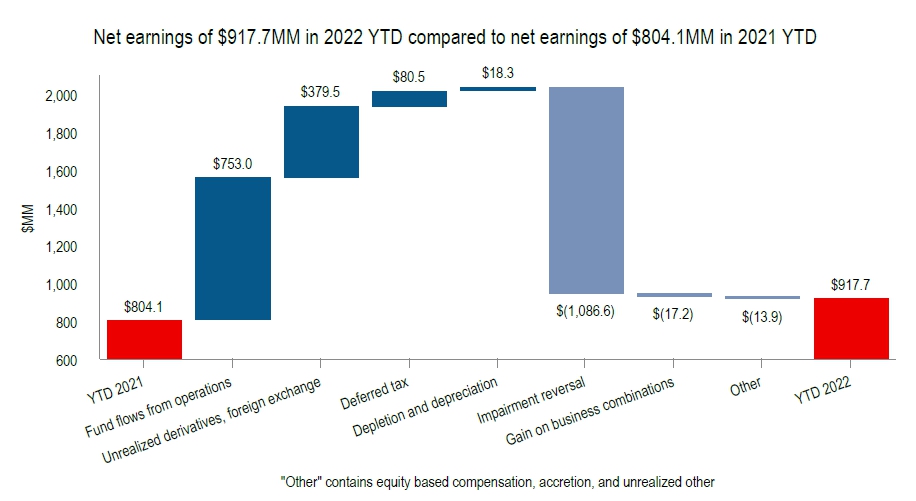
| • | For the nine months ended September 30, 2022, we recorded net earnings of $917.7 million compared to net earnings of $804.1 million for the comparable period in 2021. The increase in net earnings was primarily due higher fund flows from operations driven by increased consolidated realized pricing, reduced unrealized derivative losses of $344.5 million driven by the settlement of 2022 contracts (recognized in realized derivative losses), and deferred tax recoveries primarily due to increased forecast commodity prices resulting in the recognition of non-expiring tax loss pools in Ireland. This was partially offset by lower impairment reversals recorded in 2022 of $144.4 million (net of $47.7 million deferred income tax expense), compared to impairment reversals recorded in 2021 of $969.3 million (net of $309.4 million deferred income tax expense). |
Vermilion Energy Inc. ■ Page 18 ■ 2022 Third Quarter Report |
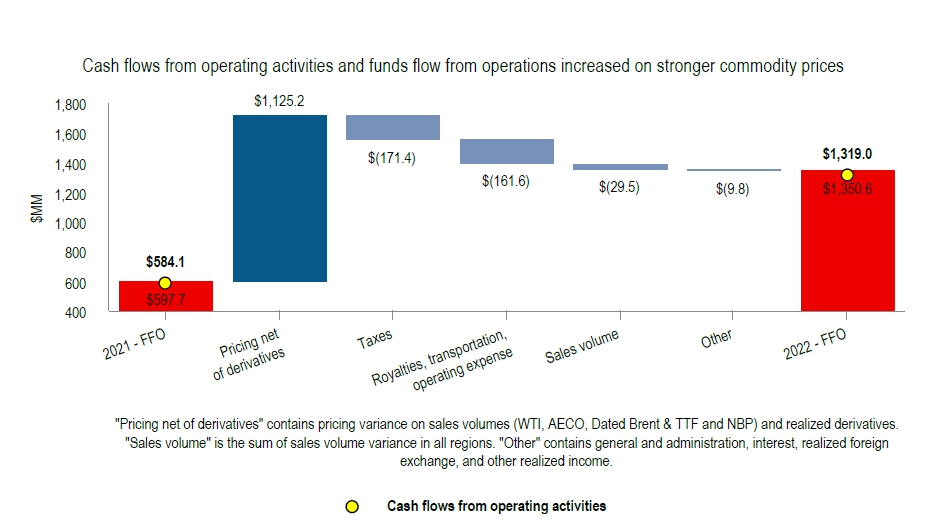
| • | Cash flows from operating activities increased by $734.9 million to $1,319.0 million for the nine months ended September 30, 2022, and fund flows from operations increased by $753.0 million to $1,350.6 million for the nine months ended September 30, 2022 versus the same period in 2021. These increases were primarily driven by a 103% increase in our consolidated realized price from $56.58/boe to $114.76/boe. This was partially offset by an increase in taxes on higher income and sliding scale royalties on higher pricing. Variances between cash flows from operating activities and fund flows from operations are primarily driven by working capital timing differences. |
Q3 2022 vs. Q3 2021
| • | Consolidated average production of 84,237 boe/d in Q3 2022 decreased slightly compared to Q3 2021 production of 84,633 boe/d. Production decreased in the Netherlands, France, and the United States due to natural decline. This was partially offset by an increase in Germany and Canada due to acquisitions in 2021 and 2022, respectively, as well as Australia primarily due to new wells coming online in September 2022. |
YTD 2022 vs. YTD 2021
| • | Consolidated average production of 85,099 boe/d in the nine months ended September 30, 2022 decreased slightly from 85,742 boe/d in the prior year comparative period. Production decreased in the Netherlands, Canada, Australia, and Ireland primarily due to natural decline and was partially offset by an increase in Germany and the United States primarily due to 2021 acquisition activity. |
| • | For the three months ended September 30, 2022, capital expenditures of $184.0 million were incurred. |
| • | In our North America core region, we incurred capital expenditures of $112.2 million. In Canada, capital expenditures totaled $83.3 million as we drilled 20 (15.0 net) wells, completed 18 (14.6 net) wells, and brought on production 14 (13.5 net) wells in south-east Saskatchewan, and drilled two (1.1 net) Mannville liquids-rich gas wells and completed the wells on our first 6.0 (6.0 net) well Montney pad in Alberta. In the United States, $28.9 million was incurred primarily related to drilling and completing the remaining Turner locations as part of our planned six well program. |
| • | In our International core region, capital expenditures of $71.8 million were incurred during Q3 2022. Our activities included $44.1 million incurred in Australia primarily related to our 2022 two-well drilling campaign and $9.6 million incurred in France on facilities and subsurface maintenance activities, along with various other costs associated with support work for our Q4 2022 drilling campaign in Europe. |
Vermilion Energy Inc. ■ Page 19 ■ 2022 Third Quarter Report |
| Financial sustainability review |
Cash flows from operating activities and free cash flow
| • | Cash flows from operating activities increased by $734.9 million to $1,319.0 million for the nine months ended September 30, 2022 compared to the prior year period which was primarily driven by a 103% increase in consolidated realized prices. |
| • | Free cash flow of $968.1 million increased by $599.4 million for the nine months ended September 30, 2022 compared to the prior year period which was primarily driven by an increase of fund flows from operations on higher realized prices, partially offset by higher expenditure on drilling and development activities. |
Long-term debt and net debt
| • | Long-term debt decreased to $1.4 billion as at September 30, 2022 from $1.7 billion as at December 31, 2021 as a result of net repayments of $320.9 million, partially offset by borrowings made to fund the Leucrotta acquisition, as well as unrealized foreign exchange losses of $77.6 million due the US dollar strengthening. |
| • | Net debt at September 30, 2022 decreased to $1.4 billion from $1.6 billion at December 31, 2021 primarily due to net decreases in long-term debt, partially offset by timing of working capital movements. |
| • | The ratio of net debt to four quarter trailing fund flows from operations(1) decreased to 0.8 as at September 30, 2022 (December 31, 2021 - 1.8) primarily due to higher four quarter trailing fund flows from operations. |
| (1) | Net debt to four quarter trailing fund flows from operations is a supplementary financial measure that does not have a standardized meaning under IFRS and therefore may not be comparable to similar measures presented by other issuers. It is calculated as net debt (capital measure) over the FFO from the preceding 4 quarters (total of segments measure). The measure is used to assess our ability to repay debt. |
Vermilion Energy Inc. ■ Page 20 ■ 2022 Third Quarter Report |
Benchmark Commodity Prices
| | Q3 2022 | Q3 2021 | Q3/22 vs. Q3/21 | YTD 2022 | YTD 2021 | 2022 vs. 2021 |
| Crude oil | | | | | | |
| WTI ($/bbl) | 119.59 | 88.90 | 35% | 125.83 | 81.14 | 55% |
| WTI (US $/bbl) | 91.56 | 70.56 | 30% | 98.09 | 64.82 | 51% |
| Edmonton Sweet index ($/bbl) | 116.92 | 83.77 | 40% | 123.47 | 75.95 | 63% |
| Edmonton Sweet index (US $/bbl) | 89.52 | 66.49 | 35% | 96.25 | 60.68 | 59% |
| Saskatchewan LSB index ($/bbl) | 115.02 | 83.59 | 38% | 122.01 | 75.89 | 61% |
| Saskatchewan LSB index (US $/bbl) | 88.06 | 66.35 | 33% | 95.11 | 60.63 | 57% |
| Canadian C5+ Condensate index ($/bbl) | 113.75 | 87.25 | 30% | 124.65 | 80.81 | 54% |
| Canadian C5+ Condensate index (US $/bbl) | 87.09 | 69.25 | 26% | 97.17 | 64.56 | 51% |
| Dated Brent ($/bbl) | 131.72 | 92.56 | 42% | 135.14 | 84.78 | 59% |
| Dated Brent (US $/bbl) | 100.85 | 73.47 | 37% | 105.35 | 67.73 | 56% |
| Natural gas | | | | | | |
| North America | | | | | | |
| AECO 5A ($/mcf) | 4.16 | 3.60 | 16% | 5.38 | 3.28 | 64% |
| Henry Hub ($/mcf) | 10.72 | 5.05 | 112% | 8.72 | 3.98 | 119% |
| Henry Hub (US $/mcf) | 8.21 | 4.01 | 105% | 6.80 | 3.18 | 114% |
| Europe(1) | | | | | | |
| NBP Day Ahead ($/mmbtu) | 42.28 | 20.21 | 109% | 33.65 | 13.32 | 153% |
| NBP Month Ahead ($/mmbtu) | 53.91 | 21.20 | 154% | 40.76 | 13.54 | 201% |
| NBP Day Ahead (#eu#/mmbtu) | 32.18 | 13.61 | 136% | 24.67 | 8.89 | 178% |
| NBP Month Ahead (#eu#/mmbtu) | 41.02 | 14.27 | 188% | 29.88 | 9.04 | 231% |
| TTF Day Ahead ($/mmbtu) | 75.56 | 20.65 | 266% | 51.64 | 13.27 | 289% |
| TTF Month Ahead ($/mmbtu) | 77.79 | 21.17 | 268% | 53.46 | 13.45 | 298% |
| TTF Day Ahead (#eu#/mmbtu) | 57.50 | 13.91 | 313% | 37.85 | 8.86 | 327% |
| TTF Month Ahead (#eu#/mmbtu) | 59.20 | 14.26 | 315% | 39.18 | 8.98 | 336% |
| Average exchange rates | | | | | | |
| CDN $/US $ | 1.31 | 1.26 | 4% | 1.28 | 1.25 | 2% |
| CDN $/Euro | 1.31 | 1.49 | (12)% | 1.36 | 1.50 | (9)% |
| Realized prices | | | | | | |
| Crude oil and condensate ($/bbl) | 123.02 | 87.05 | 41% | 127.34 | 79.40 | 60% |
| NGLs ($/bbl) | 44.64 | 35.55 | 26% | 47.82 | 30.03 | 59% |
| Natural gas ($/mcf) | 24.68 | 9.20 | 168% | 19.50 | 6.63 | 194% |
| Total ($/boe) | 127.39 | 68.19 | 87% | 114.76 | 56.58 | 103% |
(1) NBP and TTF pricing can occur on a day-ahead ("DA") or month-ahead ("MA") basis. DA prices in a period reflect the average current day settled price on the next days' delivery and MA prices in a period represent daily one month futures contract prices which are determined at the end of each month. In a rising price environment, the DA price will tend to be greater than the MA price and vice versa. Natural gas in the Netherlands and Germany is benchmarked to the TTF and production is generally equally split between DA and MA contracts. Natural gas in Ireland is benchmarked to the NBP and is sold on DA contracts.
As an internationally diversified producer, we are exposed to a range of commodity prices. In our North America core region, our crude oil is sold at benchmarks linked to WTI (including the Edmonton Sweet index, the Saskatchewan LSB index, and the Canadian C5+ index) and our natural gas is sold at benchmarks linked to the AECO index (in Canada) or the Henry Hub index (in the United States). In our International core region, our crude oil is sold with reference to Dated Brent and our natural gas is sold with reference to NBP, TTF, or indices highly correlated to TTF.
Vermilion Energy Inc. ■ Page 21 ■ 2022 Third Quarter Report |
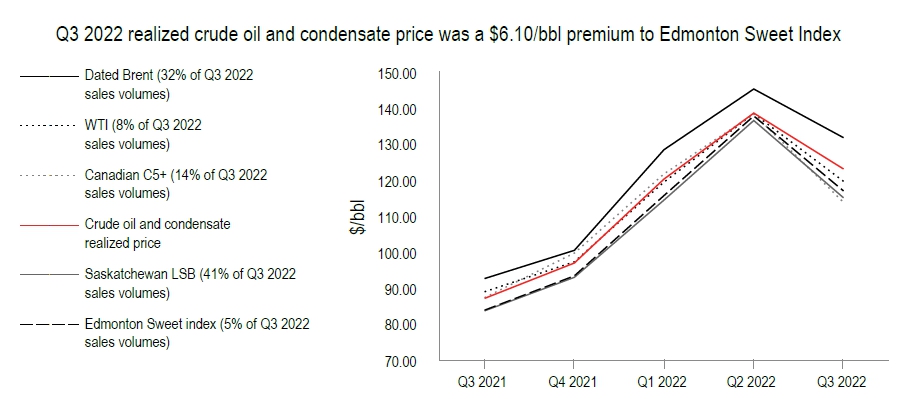
| • | Crude oil prices increased in Q3 2022 relative to Q3 2021. Global crude fundamentals continued to signal a tight physical market with limited spare capacity and continued geopolitical supply risks and disruptions. Year-over-year, Canadian dollar WTI and Brent prices rose 35% and 42%, respectively. |
| • | In Canadian dollar terms, year-over-year, the Edmonton Sweet differential narrowed by $2.46/bbl to a discount of $2.67/bbl against WTI, and the Saskatchewan LSB differential narrowed by $0.74/bbl to a discount of $4.57/bbl against WTI. |
| • | Approximately 32% of Vermilion’s Q3 2022 crude oil and condensate production was priced at the Dated Brent index (which averaged a premium to WTI of US$9.29/bbl), while the remainder of our crude oil and condensate production was priced at the Saskatchewan LSB, Canadian C5+, Edmonton Sweet, and WTI indices. |
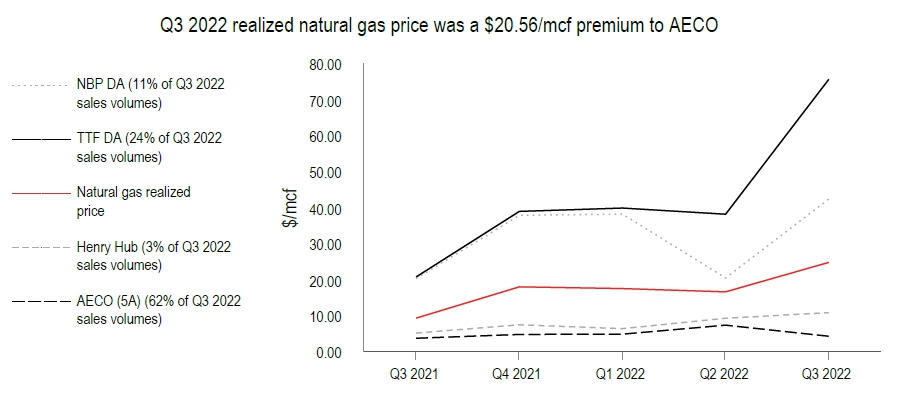
| • | In Canadian dollar terms, year-over-year, prices for European natural gas linked to NBP and TTF rose by 109% and 266%, respectively on a day-ahead basis and 154% and 268% respectively on a month-ahead basis. Further Russian pipeline supply decreases combined with strong natural gas power demand, and elevated European power and coal prices supported higher European gas prices. |
| • | Natural gas prices in Canadian dollar terms at AECO and NYMEX HH increased by 14% and 112%, respectively, in Q3 2022 compared to Q3 2021. NYMEX prices benefited from below average inventories driven by strong LNG export demand, record power demand from above average cooling degree days, and limited production growth in Q3 2022. AECO year-over-year price increase was limited compared to NYMEX as basis widened on high WCSB production growth and NGTL maintenance impacts which helped to bring storage levels back to within their 5 year range levels. |
| • | For Q3 2022, average European natural gas prices represented a $58.23/mcf premium to AECO. Approximately 35% of our natural gas production in Q3 2022 benefited from this premium European pricing. |
Vermilion Energy Inc. ■ Page 22 ■ 2022 Third Quarter Report |
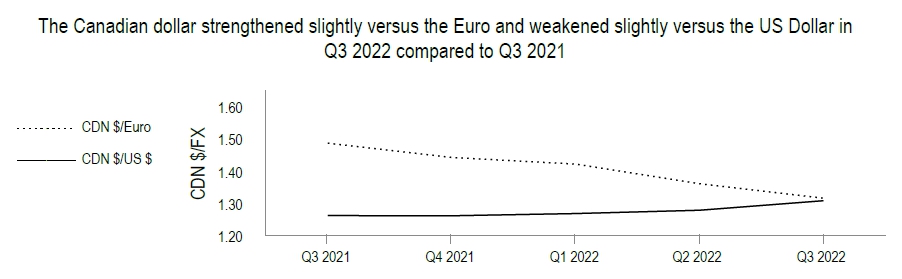
| • | For the three months ended September 30, 2022, the Canadian dollar strengthened 12% against the Euro compared to Q3 2021. |
| • | For the three months ended September 30, 2022, the Canadian dollar weakened 4% against the US Dollar compared to Q3 2021. |
Vermilion Energy Inc. ■ Page 23 ■ 2022 Third Quarter Report |
North America
| | Q3 2022 | Q3 2021 | YTD 2022 | | YTD 2021 |
| Production (1) | | | | | | | | |
| Crude oil and condensate (bbls/d) | 23,898 | | 24,757 | | 24,091 | | 24,573 | |
| NGLs (bbls/d) | 7,901 | | 8,068 | | 8,117 | | 8,279 | |
| Natural gas (mmcf/d) | 152.07 | | 145.18 | | 150.30 | | 147.20 | |
| Total production volume (boe/d) | 57,142 | | 57,022 | | 57,259 | | 57,386 | |
| (1) | Please refer to Supplemental Table 4 "Production" for disclosure by product type. |
| | Q3 2022 | Q3 2021 | YTD 2022 | YTD 2021 |
| | $M | $/boe | $M | $/boe | $M | $/boe | $M | $/boe |
| Sales | 374,533 | 71.24 | 264,393 | 50.40 | 1,150,222 | 73.58 | 709,136 | 45.26 |
| Royalties | (66,149) | (12.58) | (37,444) | (7.14) | (189,487) | (12.12) | (97,279) | (6.21) |
| Transportation | (11,372) | (2.16) | (10,085) | (1.92) | (32,453) | (2.08) | (30,653) | (1.96) |
| Operating | (73,583) | (14.00) | (57,834) | (11.02) | (195,577) | (12.51) | (172,945) | (11.04) |
| General and administration (1) | (6,696) | (1.27) | (5,990) | (1.14) | (21,164) | (1.35) | (17,663) | (1.13) |
| Corporate income tax expense (1) | (154) | (0.03) | (276) | (0.05) | (299) | (0.02) | (689) | (0.04) |
| Fund flows from operations | 216,579 | 41.20 | 152,764 | 29.13 | 711,242 | 45.50 | 389,907 | 24.88 |
| Drilling and development | (112,238) | | (35,179) | | (224,664) | | (133,139) | |
| Free cash flow | 104,341 | | 117,585 | | 486,578 | | 256,768 | |
| (1) | Includes amounts from Corporate segment. |
Production from our North American operations averaged 57,142 boe/d in Q3 2022, a decrease of 2% from the prior quarter primarily due to third-party downtime in Canada and delayed start-up of our Turner wells in the United States. During the third quarter, we drilled 20 (15.0 net) wells, completed 18 (14.6 net) wells, and brought on production 14 (13.5 net) wells in south-east Saskatchewan. In Alberta, we drilled two (1.1 net) Mannville liquids rich gas wells and completed the six (6.0 net) wells on our first Montney pad at Mica which were drilled in Q2 2022.
In the United States, we drilled the remaining one (1.0 net) well of our planned six (5.8 net) operated Turner program, and completed and brought on production the remaining five (4.8 net) wells of the six (5.8 net) well Turner program during the third quarter. In addition, two (0.4 net) non-operated commitment Parkman wells were drilled and brought on production as part of a farmout agreement.
| | Q3 2022 | Q3 2021 | YTD 2022 | YTD 2021 |
| | $M | $/boe | $M | $/boe | $M | $/boe | $M | $/boe |
| Canada | 332,918 | 69.48 | 228,519 | 48.54 | 1,028,387 | 72.10 | 631,175 | 43.85 |
| United States | 41,615 | 89.36 | 35,874 | 66.61 | 121,835 | 89.00 | 77,961 | 61.29 |
| North America | 374,533 | 71.24 | 264,393 | 50.40 | 1,150,222 | 73.58 | 709,136 | 45.26 |
Sales in North America increased on a dollar and per unit basis for the three and nine months ended September 30, 2022 versus the comparable prior periods due to significantly higher realized prices across all products offset by a slight decline in production volumes.
Vermilion Energy Inc. ■ Page 24 ■ 2022 Third Quarter Report |
| | Q3 2022 | Q3 2021 | YTD 2022 | YTD 2021 |
| | $M | $/boe | $M | $/boe | $M | $/boe | $M | $/boe |
| Canada | (54,919) | (11.46) | (27,812) | (5.91) | (157,258) | (11.03) | (76,587) | (5.32) |
| United States | (11,230) | (24.11) | (9,632) | (17.89) | (32,229) | (23.54) | (20,692) | (16.27) |
| North America | (66,149) | (12.58) | (37,444) | (7.14) | (189,487) | (12.12) | (97,279) | (6.21) |
Royalties in North America increased on a dollar and per unit basis for the three and nine months ended September 30, 2022 versus the comparable prior periods primarily due to increased sliding scale royalties driven by higher commodity prices. Royalties as a percentage of sales for the three and nine months ended September 30, 2022 of 17.7% and 16.5%, respectively, increased versus the comparable prior periods primarily due to the effect of higher commodity prices on sliding scale royalties.
| | Q3 2022 | Q3 2021 | YTD 2022 | YTD 2021 |
| | $M | $/boe | $M | $/boe | $M | $/boe | $M | $/boe |
| Canada | (11,299) | (2.36) | (9,526) | (2.02) | (31,930) | (2.24) | (29,630) | (2.06) |
| United States | (73) | (0.16) | (559) | (1.04) | (523) | (0.38) | (1,023) | (0.80) |
| North America | (11,372) | (2.16) | (10,085) | (1.92) | (32,453) | (2.08) | (30,653) | (1.96) |
Transportation expense in North America increased on a dollar and per boe basis for the three and nine months ended September 30, 2022 versus the comparable prior period primarily due to increased tariffs in Saskatchewan beginning in mid-2022.
| | Q3 2022 | Q3 2021 | YTD 2022 | YTD 2021 |
| | $M | $/boe | $M | $/boe | $M | $/boe | $M | $/boe |
| Canada | (66,245) | (13.83) | (53,076) | (11.27) | (177,594) | (12.45) | (160,683) | (11.16) |
| United States | (7,338) | (15.76) | (4,758) | (8.84) | (17,983) | (13.14) | (12,262) | (9.64) |
| North America | (73,583) | (14.00) | (57,834) | (11.02) | (195,577) | (12.51) | (172,945) | (11.04) |
Operating expenses in North America for the three and nine months ended September 30, 2022 increased on a dollar basis and per boe basis versus the comparable periods. In Canada, increases in the three months ended September 30, 2022 were primarily the result of an increase in processing fees due to the addition of Mica assets and higher plant rates in Saskatchewan. Increases in the nine months ended September 30, 2022 were primarily the result of acquisition activity, planned maintenance, and inflationary pressure. In the United States, increases in the three months ended September 30, 2022 were primarily timing of maintenance and inflationary pressures. Increases in the nine months ended September 30, 2022 were primarily due to increased downhole costs and maintenance activities.
Vermilion Energy Inc. ■ Page 25 ■ 2022 Third Quarter Report |
International
| | Q3 2022 | Q3 2021 | YTD 2022 | YTD 2021 |
| Production (1) | | | | | | | | |
| Crude oil and condensate (bbls/d) | 13,419 | | 14,020 | | 12,973 | | 14,203 | |
| Natural gas (mmcf/d) | 82.05 | | 81.55 | | 89.21 | | 84.92 | |
| Total production volume (boe/d) | 27,095 | | 27,612 | | 27,840 | | 28,356 | |
| Total sales volume (boe/d) | 25,169 | | 28,820 | | 26,807 | | 27,669 | |
| (1) | Please refer to Supplemental Table 4 "Production" for disclosure by product type. |
| | Q3 2022 | Q3 2021 | YTD 2022 | YTD 2021 |
| | $M | $/boe | $M | $/boe | $M | $/boe | $M | $/boe |
| Sales | 590,145 | 254.86 | 274,137 | 103.39 | 1,483,479 | 202.71 | 604,710 | 80.06 |
| Royalties | (16,705) | (7.21) | (11,991) | (4.52) | (48,227) | (6.59) | (30,058) | (3.98) |
| Transportation | (8,126) | (3.51) | (9,188) | (3.47) | (24,467) | (3.34) | (27,475) | (3.64) |
| Operating | (52,404) | (22.63) | (46,521) | (17.55) | (157,210) | (21.48) | (127,388) | (16.86) |
| General and administration | (7,726) | (3.34) | (6,351) | (2.40) | (23,169) | (3.17) | (17,840) | (2.36) |
| Corporate income tax (expense) recovery | (50,868) | (21.97) | 1,690 | 0.64 | (165,896) | (22.67) | 2,757 | 0.36 |
| PRRT | (4,545) | (1.96) | (7,271) | (2.74) | (13,273) | (1.81) | (10,144) | (1.34) |
| Fund flows from operations | 449,771 | 194.24 | 194,505 | 73.35 | 1,051,237 | 143.65 | 394,562 | 52.24 |
| Drilling and development | (65,640) | | (27,994) | | (145,543) | | (87,249) | |
| Exploration and evaluation | (6,137) | | (3,277) | | (12,305) | | (8,601) | |
| Free cash flow | 377,994 | | 163,234 | | 893,389 | | 298,712 | |
Production from our International operations averaged 27,095 boe/d in Q3 2022, an increase of 1% from the prior quarter. Production increased in Australia following the completion of our two-well drilling program in the third quarter, and in Germany, due to the successful results from our 1H 2022 drilling program and various workovers completed during the third quarter. During the quarter, three wells were drilled in Hungary, but none of the wells encountered commercial hydrocarbons. Elsewhere in Europe, we continued with support work for our Q4 2022 drilling campaign which will include one (0.5 net) well in Netherlands, one (1.0 net) well in Germany, and two (2.0 net) wells in Croatia.
| | Q3 2022 | Q3 2021 | YTD 2022 | YTD 2021 |
| | $M | $/boe | $M | $/boe | $M | $/boe | $M | $/boe |
| Australia | 39,220 | 155.29 | 44,044 | 105.17 | 125,767 | 155.05 | 102,682 | 99.77 |
| France | 90,825 | 135.49 | 79,817 | 91.60 | 287,521 | 137.00 | 199,454 | 84.11 |
| Netherlands | 185,296 | 408.30 | 69,247 | 104.68 | 443,189 | 279.36 | 130,353 | 69.67 |
| Germany | 168,812 | 315.78 | 32,943 | 94.41 | 360,249 | 236.15 | 66,312 | 69.97 |
| Ireland | 102,286 | 259.18 | 47,817 | 137.58 | 259,592 | 204.06 | 105,073 | 79.75 |
| Central and Eastern Europe | 3,706 | 387.33 | 269 | 81.22 | 7,161 | 294.73 | 836 | 49.39 |
| International | 590,145 | 254.86 | 274,137 | 103.39 | 1,483,479 | 202.71 | 604,710 | 80.06 |
As a result of changes in inventory levels, our sales volumes for crude oil in Australia, France, and Germany may differ from our production volumes in those business units. The following table provides the crude oil sales volumes (consisting entirely of "light crude oil and medium crude oil") for those jurisdictions.
| Crude oil sales volumes (bbls/d) | Q3 2022 | Q3 2021 | YTD 2022 | YTD 2021 |
| Australia | 2,745 | | 4,552 | | 2,971 | | 3,770 | |
| France | 7,286 | | 9,471 | | 7,688 | | 8,687 | |
| Germany | 1,388 | | 1,094 | | 1,208 | | 959 | |
| International | 11,419 | | 15,117 | | 11,867 | | 13,416 | |
Sales increased on a dollar and per boe basis for the three and nine months ended September 30, 2022 versus the prior year comparable periods due to higher realized prices across all business units. These increases were partially offset by lower sales volumes across multiple business units due to natural decline combined with the timing of liftings in Australia and France.
Vermilion Energy Inc. ■ Page 26 ■ 2022 Third Quarter Report |
| | Q3 2022 | Q3 2021 | YTD 2022 | YTD 2021 |
| | $M | $/boe | $M | $/boe | $M | $/boe | $M | $/boe |
| France | (10,402) | (15.52) | (11,089) | (12.73) | (31,059) | (14.80) | (27,492) | (11.59) |
| Netherlands | - | - | (229) | (0.35) | - | - | (454) | (0.24) |
| Germany | (4,713) | (8.82) | (616) | (1.77) | (14,829) | (9.72) | (1,938) | (2.05) |
| Central and Eastern Europe | (1,590) | (166.18) | (57) | (17.21) | (2,339) | (96.27) | (174) | (10.28) |
| International | (16,705) | (7.21) | (11,991) | (4.52) | (48,227) | (6.59) | (30,058) | (3.98) |
Royalties in our International core region are primarily incurred in France, where royalties include charges based on a percentage of sales and fixed per boe charges. Our production in Australia and Ireland is not subject to royalties.
Royalties increased on a dollar and per unit basis for the three and nine months ended September 30, 2022 versus the comparable prior year periods primarily due to higher sales prices combined with an increase in royalty rates in Germany and Central and Eastern Europe, partially offset by lower sales volumes in France.
Royalties as a percentage of sales for the three and nine months ended September 30, 2022 of 2.8% and 3.3% decreased versus the prior year comparable periods of 4.4% and 5.0% primarily due to higher sales in business units that are not subject to royalties combined with the impact of RCDM royalties in France, which are levied on units of production and not subject to changes in commodity prices. This was partially offset by an increase in royalty rates in Germany and Central and Eastern Europe.
| | Q3 2022 | Q3 2021 | YTD 2022 | YTD 2021 |
| | $M | $/boe | $M | $/boe | $M | $/boe | $M | $/boe |
| France | (4,877) | (7.28) | (6,400) | (7.34) | (15,511) | (7.39) | (19,923) | (8.40) |
| Germany | (2,342) | (4.38) | (1,708) | (4.89) | (6,130) | (4.02) | (4,283) | (4.52) |
| Ireland | (907) | (2.30) | (1,080) | (3.11) | (2,826) | (2.22) | (3,269) | (2.48) |
| International | (8,126) | (3.51) | (9,188) | (3.47) | (24,467) | (3.34) | (27,475) | (3.64) |
Transportation expense decreased for the three and nine months ended September 30, 2022 versus the comparable prior year periods primarily due to the volume of liftings in France, partially offset by 2021 acquisition activity in Germany resulting in higher volumes produced and sold requiring transportation in this region. On a per unit basis, transportation expense remained relatively flat versus prior year comparable periods.
Our production in Australia, Netherlands and Central and Eastern Europe is not subject to transportation expense.
| | Q3 2022 | Q3 2021 | YTD 2022 | YTD 2021 |
| | $M | $/boe | $M | $/boe | $M | $/boe | $M | $/boe |
| Australia | (10,349) | (40.98) | (14,684) | (35.06) | (36,187) | (44.61) | (34,830) | (33.84) |
| France | (14,461) | (21.57) | (13,523) | (15.52) | (44,950) | (21.42) | (37,905) | (15.98) |
| Netherlands | (13,200) | (29.09) | (8,514) | (12.87) | (34,674) | (21.86) | (23,820) | (12.73) |
| Germany | (9,188) | (17.19) | (6,717) | (19.25) | (28,231) | (18.51) | (19,826) | (20.92) |
| Ireland | (4,715) | (11.95) | (2,968) | (8.54) | (11,893) | (9.35) | (10,782) | (8.18) |
| Central and Eastern Europe | (491) | (51.32) | (115) | (34.72) | (1,275) | (52.48) | (225) | (13.29) |
| International | (52,404) | (22.63) | (46,521) | (17.55) | (157,210) | (21.48) | (127,388) | (16.86) |
For the three months ended September 30, 2022 versus the prior year comparable period, operating expense increased on a dollar and per boe basis primarily due to the impact of higher fuel and electricity prices in Europe, partially offset by a deferral of costs in Australia due to an inventory build. Operating expense increased on a dollar and per boe basis for the nine months ended September 30, 2022 versus the prior year comparable period primarily due to the impact of higher fuel and electricity prices in Europe.
Vermilion Energy Inc. ■ Page 27 ■ 2022 Third Quarter Report |
Consolidated Financial Performance Review
| | Q3 2022 | Q3 2021 | YTD 2022 | YTD 2021 |
| | $M | $/boe | $M | $/boe | $M | $/boe | $M | $/boe |
| Sales | 964,678 | 127.39 | 538,530 | 68.19 | 2,633,701 | 114.76 | 1,313,846 | 56.58 |
| Royalties | (82,854) | (10.94) | (49,435) | (6.26) | (237,714) | (10.36) | (127,337) | (5.48) |
| Transportation | (19,498) | (2.57) | (19,273) | (2.44) | (56,920) | (2.48) | (58,128) | (2.50) |
| Operating | (125,987) | (16.64) | (104,355) | (13.21) | (352,787) | (15.37) | (300,333) | (12.93) |
| General and administration | (14,422) | (1.90) | (12,341) | (1.56) | (44,333) | (1.93) | (35,503) | (1.53) |
| Corporate income tax (expense) recovery | (51,022) | (6.74) | 1,414 | 0.18 | (166,195) | (7.24) | 2,068 | 0.09 |
| PRRT | (4,545) | (0.60) | (7,271) | (0.92) | (13,273) | (0.58) | (10,144) | (0.44) |
| Interest expense | (24,455) | (3.23) | (18,699) | (2.37) | (60,352) | (2.63) | (56,796) | (2.45) |
| Realized loss on derivatives | (137,953) | (18.22) | (72,579) | (9.19) | (361,954) | (15.77) | (137,786) | (5.93) |
| Realized foreign exchange (loss) gain | (2,103) | (0.28) | 2,921 | 0.37 | (3,650) | (0.16) | (4,218) | (0.18) |
| Realized other income | 6,037 | 0.80 | 3,784 | 0.48 | 14,122 | 0.62 | 12,020 | 0.52 |
| Fund flows from operations | 507,876 | 67.07 | 262,696 | 33.27 | 1,350,645 | 58.86 | 597,689 | 25.75 |
| Equity based compensation | (6,145) | | (7,823) | | (39,013) | | (34,899) | |
| Unrealized gain (loss) on derivative instruments (1) | 43,844 | | (279,393) | | (8,892) | | (353,359) | |
| Unrealized foreign exchange loss (1) | (44,929) | | (27,877) | | (37,059) | | (72,085) | |
| Accretion | (14,285) | | (11,199) | | (41,669) | | (32,569) | |
| Depletion and depreciation | (130,205) | | (167,808) | | (405,208) | | (423,472) | |
| Deferred tax (expense) recovery | (84,570) | | 62,245 | | (91,974) | | (172,509) | |
| Gain on business combinations | - | | - | | - | | 17,198 | |
| Impairment reversal | - | | 22,225 | | 192,094 | | 1,278,697 | |
| Unrealized other expense (1) | (507) | | (196) | | (1,270) | | (583) | |
| Net earnings (loss) | 271,079 | | (147,130) | | 917,654 | | 804,108 | |
| (1) | Unrealized gain (loss) on derivative instruments, Unrealized foreign exchange loss, and Unrealized other expense are line items from the respective Consolidated Statements of Cash Flows. |
Fluctuations in fund flows from operations may occur as a result of changes in production levels, commodity prices, and costs to produce petroleum and natural gas. In addition, fund flows from operations may be affected by the timing of crude oil shipments in Australia and France. When crude oil inventory is built up, the related operating expense, royalties, and depletion expense are deferred and carried as inventory on the consolidated balance sheet. When the crude oil inventory is subsequently drawn down, the related expenses are recognized within profit or loss.
General and administration
| • | General and administration expense increased for the three and nine months ended September 30, 2022 versus the prior year comparable periods primarily due to higher legal, tax, and financial advisory costs. |
PRRT and corporate income taxes
| • | PRRT decreased for the three months ended September 30, 2022 versus the prior year comparable period primarily due to lower sales combined with higher capital expenditures in the current period. PRRT increased for the nine months ended September 30, 2022 versus the prior year comparable period due to higher sales partially offset by higher capital expenditures in the current period. |
| • | Corporate income taxes for the three and nine months ended September 30, 2022 increased versus the prior year comparable period primarily due to higher taxable income as a result of increased commodity prices in 2022. |
Interest expense
| • | Interest expense increased for the three and nine months ended September 30, 2022 compared to the prior year despite lower debt levels. This was due to higher variable interest rates and an increase in the percentage of our debt with fixed interest rates following the issuance of the 2030 senior unsecured notes. |
Vermilion Energy Inc. ■ Page 28 ■ 2022 Third Quarter Report |
Realized gain or loss on derivatives
| • | For the three and nine months ended September 30, 2022, we recorded realized losses on our crude oil and natural gas hedges due to higher commodity pricing compared to the strike prices on our hedges. |
| • | A listing of derivative positions as at September 30, 2022 is included in “Supplemental Table 2” of this MD&A. |
Realized other income
| • | Realized other income for the three and nine months ended September 30, 2022 primarily relates to amounts for funding under the Saskatchewan Accelerated Site Closure program to complete abandonment and reclamation on inactive oil and gas wells and facilities. |
Fluctuations in net earnings from period-to-period are caused by changes in both cash and non-cash based income and charges. Cash based items are reflected in fund flows from operations. Non-cash items include: equity based compensation expense, unrealized gains and losses on derivative instruments, unrealized foreign exchange gains and losses, accretion, depletion and depreciation expense, and deferred taxes. In addition, non-cash items may also include gains resulting from business combinations or charges resulting from impairment or impairment reversals.
Equity based compensation
Equity based compensation expense relates primarily to non-cash compensation expense attributable to long-term incentives granted to directors, officers, and employees under security-based arrangements. Equity based compensation expense decreased for the three months ended September 30, 2022 versus the prior year comparable period primarily due to the lower value of VIP awards outstanding in the current period. For the nine months ended September 30, 2022, equity based compensation expense increased primarily due to higher bonuses under the employee bonus plan in the current year.
Unrealized gain or loss on derivative instruments
Unrealized gain or loss on derivative instruments arises as a result of changes in forecasts for future prices and rates. As Vermilion uses derivative instruments to manage the commodity price exposure of our future crude oil and natural gas production, we will normally recognize unrealized gains on derivative instruments when future commodity price forecasts decline and vice-versa. As derivative instruments are settled, the unrealized gain or loss previously recognized is reversed, and the settlement results in a realized gain or loss on derivative instruments.
USD-to-CAD cross currency interest rate swaps and foreign exchange swaps may be entered into to hedge the foreign exchange movements on USD borrowings on our revolving credit facility. As such, unrealized gains and losses on our cross currency interest swaps are offset by unrealized losses and gains on foreign exchange relating to the underlying USD borrowings from our revolving credit facility.
For the three months ended September 30, 2022, we recognized a net unrealized gain on derivative instruments of $43.8 million. This consists of unrealized gains of $37.5 million on our crude oil commodity derivative instruments, $19.0 million on our equity swaps, $15.7 million on our USD-to-CAD foreign exchange swaps, and $2.8 million on our North American natural gas commodity derivative instruments, partially offset by unrealized losses of $31.2 million on our European natural gas commodity derivative instruments .
For the nine months ended September 30, 2022, we recognized a net unrealized loss on derivative instruments of $8.9 million. This consists of unrealized losses of $64.3 million on our European natural gas commodity derivative instruments and $5.3 million on our North American natural gas commodity derivative instruments, partially offset by unrealized gains of $51.4 million on our equity swaps, $5.7 million on our crude oil commodity derivative instruments, and $3.6 million on our USD-to-CAD foreign exchange swaps.
Unrealized foreign exchange gains or losses
As a result of Vermilion’s international operations, Vermilion has monetary assets and liabilities denominated in currencies other than the Canadian dollar. These monetary assets and liabilities include cash, receivables, payables, long-term debt, derivative instruments and intercompany loans. Unrealized foreign exchange gains and losses result from translating these monetary assets and liabilities from their underlying currency to the Canadian dollar.
In 2022, unrealized foreign exchange gains and losses primarily resulted from:
| • | The translation of Euro denominated intercompany loans from our international subsidiaries to Vermilion Energy Inc.. An appreciation in the Euro against the Canadian dollar will result in an unrealized foreign exchange loss (and vice-versa). Under IFRS, the offsetting foreign exchange loss or gain is recorded as a currency translation adjustment within other comprehensive income. As a result, consolidated comprehensive income reflects the offsetting of these translation adjustments while net earnings reflects only the parent company's side of the translation. |
Vermilion Energy Inc. ■ Page 29 ■ 2022 Third Quarter Report |
| • | The translation of USD borrowings on our revolving credit facility. The unrealized foreign exchange gains or losses on these borrowings are offset by unrealized derivative gains or losses on associated USD-to-CAD cross currency interest rate swaps (discussed further below). |
| • | The translation of our USD denominated senior unsecured notes prior to June 12, 2019 and from May 5, 2020 onward. During the period between June 12, 2019 and May 5, 2020 the USD senior notes were hedged by a USD-to-CAD cross currency interest rate swap. Subsequent to the termination of these instruments, amounts previously recognized in the hedge accounting reserve will be recognized into earnings through unrealized foreign exchange loss over the period of the hedged cash flows. |
For the three months ended September 30, 2022, we recognized a net unrealized foreign exchange loss of $44.9 million, driven by an unrealized loss of $56.6 million on our senior unsecured notes resulting from the US dollar strengthening 6.4% against the Canadian dollar in Q3 2022, as well as unrealized losses of $12.0 million on our USD borrowings from our revolving credit facility. This was partially offset by an unrealized gain of $23.3 million on intercompany loans due to the Euro weakening 0.6% against the Canadian dollar in Q3 2022.
For the nine months ended September 30, 2022, we recognized a net unrealized foreign exchange loss of $37.1 million, driven by an unrealized loss of $66.2 million on our senior unsecured notes resulting from the US dollar strengthening 8.1% against the Canadian dollar in 2022, as well as unrealized losses of $11.3 million on our USD borrowings from our revolving credit facility. This was partially offset by unrealized gains of $46.4 million on intercompany loans due to the Euro weakening 7.0% against the Canadian dollar in 2022.
As at September 30, 2022, a $0.01 appreciation of the Euro against the Canadian dollar would result in a $7.3 million decrease to net earnings as a result of an unrealized loss on foreign exchange, while a $0.01 appreciation of the US dollar against the Canadian dollar would result in a $5.6 million decrease to net earnings as a result of an unrealized loss on foreign exchange.
Accretion
Accretion expense is recognized to update the present value of the asset retirement obligation balance. For the three and nine months ended September 30, 2022, accretion expense increased versus the comparable period primarily due to the impact of a higher asset retirement obligation balance at the end of 2021 compared to 2020, partially offset by the weakening of the Euro against the Canadian dollar.
Depletion and depreciation
Depletion and depreciation expense is recognized to allocate the cost of capital assets over the useful life of the respective assets. Depletion and depreciation expense per unit of production is determined for each depletion unit (which are groups of assets within a specific production area that have similar economic lives) by dividing the sum of the net book value of capital assets and future development costs by total proved plus probable reserves.
Fluctuations in depletion and depreciation expense are primarily the result of changes in produced crude oil and natural gas volumes, and changes in depletion and depreciation per unit. Fluctuations in depletion and depreciation per unit are the result of changes in reserves, depletable base (net book value of capital assets and future development costs), and relative production mix.
Depletion and depreciation on a per boe basis for the three months ended September 30, 2022 of $17.19 decreased from $21.25 in the comparable prior year period primarily due to lower downhole depreciation and inventory movement, as well as the weakening of the Euro against the Canadian dollar.
Depletion and depreciation on a per boe basis for the nine months ended September 30, 2022 of $17.66 decreased from $18.24 in the comparable prior year period primarily due to lower downhole depreciation and exploration and evaluation write-offs, as well as the weakening of the Euro against the Canadian dollar. This was partially offset by a higher depletable base due to impairment reversals in Q1 2022 and throughout 2021, as well net increases in asset retirement obligation assets recorded in 2021 and 2022.
Deferred tax
Deferred tax assets arise when the tax basis of an asset exceeds its accounting basis (known as a deductible temporary difference). Conversely, deferred tax liabilities arise when the tax basis of an asset is less than its accounting basis (known as a taxable temporary difference). Deferred tax assets are recognized only to the extent that it is probable that there are future taxable profits against which the deductible temporary difference can be utilized. Deferred tax assets and liabilities are measured at the enacted or substantively enacted tax rate that is expected to apply when the asset is realized, or the liability is settled.
As such, fluctuations in deferred tax expenses and recoveries primarily arise as a result of: changes in the accounting basis of an asset or liability without a corresponding tax basis change (e.g. when derivative assets and liabilities are marked-to-market or when accounting depletion differs from tax depletion), changes in available tax losses (e.g. if they are utilized to offset taxable income), changes in estimated future taxable profits resulting in a derecognition or recognition of deferred tax assets, and changes in enacted or substantively enacted tax rates.
Vermilion Energy Inc. ■ Page 30 ■ 2022 Third Quarter Report |
For the three and nine months ended September 30, 2022, the Company recorded a deferred tax expense of $84.6 million and $92.0 million compared to a deferred tax recovery of $62.2 million and deferred tax expense $172.5 million for the prior year comparable periods. The deferred tax expense for the three months ended September 30, 2022 is primarily due to loss utilization on increased taxable income in Ireland, Germany and Canada, as well as the tax impact on unrealized derivative movement. The deferred tax expense for the nine months ended September 30, 2022 is primarily due to loss utilization on increased taxable income in Ireland, Germany and Canada, and partially offset by the recognition of tax assets in Ireland in the first quarter of 2022.
Impairment
Impairment losses or reversals of losses are recognized when indicators of impairment or impairment reversal arise and the carrying amount of a cash generating unit ("CGU") is greater than (impairment) or less than (impairment reversal) its recoverable amount, determined as the higher of fair value less costs of disposal or value-in-use. In the third quarter of 2022 there were no indicators of impairment and no amounts relating to previous impairments remaining to be reversed.
In the first quarter of 2022, indicators of impairment reversal were present in our Canada - Saskatchewan and France - Neocomian CGUs due to an increase in forecast oil prices. As a result of the indicators of impairment reversal, the Company performed impairment reversal calculations on the identified CGUs and the recoverable amounts were determined using fair value less costs to sell, which considered future after-tax cash flows from proved plus probable reserves and an after-tax discount rate of 12.0%. Based on the results of the impairment reversal calculations completed, recoverable amounts were determined to be greater than the carrying values of the CGUs tested and $144.4 million (net of $47.7 million deferred income tax expense) of impairment reversal was recorded.
Inputs used in the measurement of capital assets are not based on observable market data and fall within level 3 of the fair value hierarchy.
Vermilion Energy Inc. ■ Page 31 ■ 2022 Third Quarter Report |
Financial Position Review
We regularly review whether our forecast of fund flows from operations is sufficient to finance planned capital expenditures, dividends, share buy-backs, and abandonment and reclamation expenditures. To the extent that fund flows from operations forecasts are not expected to be sufficient to fulfill such expenditures, we will evaluate our ability to finance any shortfall by reducing some or all categories of expenditures, with issuances of equity, and/or with debt (including borrowing using the unutilized capacity of our existing revolving credit facility). We have a long-term goal of achieving and maintaining a ratio of net debt to fund flows from operations of approximately 1.0.
As at September 30, 2022, we have a ratio of net debt to fund flows from operations of 0.8. We will continue to monitor for changes in forecasted fund flows from operations and, as appropriate, will adjust our exploration, development capital plans (and associated production targets), and return of capital plans to target optimal debt levels.
Maintaining a strong balance sheet is a core principle of Vermilion and will remain a focus going forward. As debt reduction continues, we will plan to increase the amount of free cash flow that is available for the return of capital, while taking into account other capital requirements.
Net debt is reconciled to long-term debt, as follows:
| | As at |
| ($M) | Sep 30, 2022 | Dec 31, 2021 |
| Long-term debt | 1,409,507 | 1,651,569 |
| Adjusted working capital deficit (1) | 22,212 | 9,284 |
| Unrealized FX on swapped USD borrowings | (19,667) | (16,067) |
| Net debt | 1,412,052 | 1,644,786 |
| | | |
| Ratio of net debt to four quarter trailing fund flows from operations | 0.8 | 1.8 |
| (1) | Adjusted working capital is a non-GAAP financial measure that is not standardized under IFRS and may not be comparable to similar measures disclosed by other issuers. It is defined as current assets less current liabilities, excluding current derivatives and current lease liabilities. The measure is used to calculate net debt, a capital measure disclosed above. Reconciliation to the primary financial statement measures can be found in the “Non-GAAP and Other Specified Financial Measures” section of this document. |
As at September 30, 2022, net debt decreased to $1.4 billion (December 31, 2021 - $1.6 billion), primarily as a result of debt repayments of $819.9 million, funded by the $968.1 million of free cash flow generated during 2022. This was partially offset by borrowings made to fund the Leucrotta acquisition, unrealized foreign exchange losses of $77.6 million on our senior unsecured notes due to the US dollar strengthening, and working capital movements. The ratio of net debt to four quarter trailing fund flows from operations decreased to 0.8 (December 31, 2021 - 1.8) due to higher four quarter trailing fund flows from operations, driven by strong commodity prices.
The balances recognized on our balance sheet are as follows:
| | As at |
| | Sep 30, 2022 | Dec 31, 2021 |
| Revolving credit facility | 465,153 | 1,273,755 |
| 2025 senior unsecured notes | 409,118 | 377,814 |
| 2030 senior unsecured notes | 535,236 | - |
| Long-term debt | 1,409,507 | 1,651,569 |
Vermilion Energy Inc. ■ Page 32 ■ 2022 Third Quarter Report |
Revolving Credit Facility
As at September 30, 2022, Vermilion had in place a bank revolving credit facility maturing May 29, 2026 with terms and outstanding positions as follows:
| | As at |
| ($M) | Sep 30, 2022 | Dec 31, 2021 |
| Total facility amount | 1,600,000 | 2,100,000 |
| Amount drawn | (465,153) | (1,273,755) |
| Letters of credit outstanding | (13,352) | (11,035) |
| Unutilized capacity | 1,121,495 | 815,210 |
On April 26, 2022, contemporaneous with the issuance of the 2030 senior unsecured notes and at Vermilion's election, the maturity date of the facility was extended to May 29, 2026 (previously May 31, 2024) and the total facility amount was reduced to $1.6 billion (previously $2.1 billion).
As at September 30, 2022, the revolving credit facility was subject to the following financial covenants:
| | | As at |
| Financial covenant | Limit | Sep 30, 2022 | Dec 31, 2021 |
| Consolidated total debt to consolidated EBITDA | Less than 4.0 | 0.72 | 1.61 |
| Consolidated total senior debt to consolidated EBITDA | Less than 3.5 | 0.23 | 1.24 |
| Consolidated EBITDA to consolidated interest expense | Greater than 2.5 | 26.65 | 14.78 |
Our financial covenants include financial measures defined within our revolving credit facility agreement that are not defined under IFRS. These financial measures are defined by our revolving credit facility agreement as follows:
| • | Consolidated total debt: Includes all amounts classified as “Long-term debt”, “Current portion of long-term debt”, and “Lease obligations” (including the current portion included within "Accounts payable and accrued liabilities" but excluding operating leases as defined under IAS 17) on our consolidated balance sheet. |
| • | Consolidated total senior debt: Consolidated total debt excluding unsecured and subordinated debt. |
| • | Consolidated EBITDA: Consolidated net earnings before interest, income taxes, depreciation, accretion and certain other non-cash items, adjusted for the impact of the acquisition of a material subsidiary. |
| • | Total interest expense: Includes all amounts classified as "Interest expense", but excludes interest on operating leases as defined under IAS 17. |
In addition, our revolving credit facility has provisions relating to our liability management ratings in Alberta and Saskatchewan whereby if our security adjusted liability management ratings fall below specified limits in a province, a portion of the asset retirement obligations are included in the definitions of consolidated total debt and consolidated total senior debt. An event of default occurs if our security adjusted liability management ratings breach additional lower limits for a period greater than 90 days. As of September 30, 2022, Vermilion's liability management ratings were higher than the specified levels, and as such, no amounts relating to asset retirement obligations were included in the calculation of consolidated total debt and consolidated total senior debt.
As at September 30, 2022 and December 31, 2021, Vermilion was in compliance with the above covenants.
2025 senior unsecured notes
On March 13, 2017, Vermilion issued US $300.0 million of senior unsecured notes at par. The notes bear interest at a rate of 5.625% per annum, paid semi-annually on March 15 and September 15, and mature on March 15, 2025. As direct senior unsecured obligations of Vermilion, the notes rank equally in right of payment with existing and future senior indebtedness of the Company.
The senior unsecured notes were recognized at amortized cost and include the transaction costs directly related to the issuance.
Vermilion may redeem some or all of the senior unsecured notes at the redemption prices set forth in the following table plus any accrued and unpaid interest, if redeemed during the twelve-month period beginning on March 15 of each of the years indicated below:
| Year | Redemption price |
| 2022 | 101.406 % |
| 2023 and thereafter | 100.000 % |
Vermilion Energy Inc. ■ Page 33 ■ 2022 Third Quarter Report |
2030 senior unsecured notes
On April 26, 2022, Vermilion closed a private offering of US $400.0 million 8-year senior unsecured notes. The notes were priced at 99.241% of par, mature on May 1, 2030, and bear interest at a rate of 6.875% per annum. Interest is to be paid semi-annually on May 1 and November 1, commencing on November 1, 2022. The notes are senior unsecured obligations of Vermilion and rank equally with existing and future senior unsecured indebtedness.
The senior unsecured notes were recognized at amortized cost and include the transaction costs directly related to the issuance.
Vermilion may, at its option, redeem the notes prior to maturity as follows:
| • | On or after May 1, 2025, Vermilion may redeem some or all of the senior unsecured notes at the redemption prices set forth below, together with accrued and unpaid interest. |
| • | Prior to May 1, 2025, Vermilion may redeem up to 35% of the original principal amount of the notes with an amount of cash not greater than the net cash proceeds of certain equity offerings at a redemption price of 106.875% of the principal amount of the notes, together with accrued and unpaid interest. |
| • | Prior to May 1, 2025, Vermilion may also redeem some or all of the notes at a price equal to 100% of the principal amount of the notes, plus a “make-whole premium,” together with applicable premium, accrued and unpaid interest. |
| Year | Redemption price |
| 2025 | 103.438 % |
| 2026 | 102.292 % |
| 2027 | 101.146 % |
| 2028 and thereafter | 100.000 % |
The following table outlines our dividend payment history:
| Date | Frequency | Dividend per unit or share |
| January 2003 to December 2007 | Monthly | $0.170 |
| January 2008 to December 2012 | Monthly | $0.190 |
| January 2013 to December 2013 | Monthly | $0.200 |
| January 2014 to March 2018 | Monthly | $0.215 |
| April 2018 to February 2020 | Monthly | $0.230 |
| March 2020 | Monthly | $0.115 |
| April 2022 to July 2022 | Quarterly | $0.060 |
| August 2022 onwards | Quarterly | $0.080 |
In the first quarter of 2022, we announced our plan to distribute a fixed quarterly dividend due to stronger commodity prices and a strengthened balance sheet. In August 2022, we announced a 33% increase to our quarterly cash dividend effective for the Q3 2022 distribution.
The following table reconciles the change in shareholders’ capital:
| Shareholders’ Capital | Shares ('000s) | Amount |
| Balance at January 1 | 162,261 | 4,241,773 |
| Vesting of equity based awards | 2,270 | 41,193 |
| Shares issued for equity based compensation | 526 | 13,123 |
| Share-settled dividends on vested equity based awards | 165 | 4,185 |
| Repurchase of shares | (2,339) | (60,866) |
| Balance at September 30 | 162,883 | 4,239,408 |
As at September 30, 2022, there were approximately 5.7 million equity based compensation awards outstanding. As at November 9, 2022, there were approximately 163.2 million common shares issued and outstanding.
On July 4, 2022, the Toronto Stock Exchange approved our notice of intention to commence a normal course issuer bid ("the NCIB"). The NCIB allows Vermilion to purchase up to 16,076,666 common shares (representing approximately 10% of outstanding common shares) beginning July 6, 2022 and ending July 5, 2023. Common shares purchased under the NCIB will be cancelled.
In the third quarter of 2022, Vermilion purchased 2.34 million common shares under the NCIB for total consideration of $71.7 million. The common shares purchased under the NCIB were cancelled.
Vermilion Energy Inc. ■ Page 34 ■ 2022 Third Quarter Report |
Asset Retirement Obligations
As at September 30, 2022, asset retirement obligations were $855.2 million compared to $1,000.6 million as at December 31, 2021. The decrease in asset retirement obligations is primarily attributable to increases in country-specific risk-free rates and the Euro weakening against the Canadian dollar.
The present value of the obligation is calculated using a credit-adjusted risk-free rate, calculated using a credit spread added to risk-free rates based on long-term, risk-free government bonds. Vermilion's credit spread is determined using the Company's expected cost of borrowing at the end of the reporting period.
The risk-free rates and credit spread used as inputs to discount the obligations were as follows:
| | Sep 30, 2022 | Dec 31, 2021 | Change |
| Credit spread added to below noted risk-free rates | 4.5 % | 4.9 % | (0.4) % |
| Country specific risk-free rate | | | |
| Canada | 3.1 % | 1.8 % | 1.3 % |
| United States | 3.9 % | 1.9 % | 2.0 % |
| France | 3.0 % | 0.8 % | 2.2 % |
| Netherlands | 2.2 % | (0.3) % | 2.5 % |
| Germany | 2.1 % | 0.1 % | 2.0 % |
| Ireland | 2.9 % | 0.5 % | 2.4 % |
| Australia | 4.0 % | 1.9 % | 2.1 % |
Current cost estimates are inflated to the estimated time of abandonment using inflation rates of between 1.5% and 4.2% (as at December 31, 2021 - between 1.1% and 3.1%).
Vermilion Energy Inc. ■ Page 35 ■ 2022 Third Quarter Report |
Risks and Uncertainties
Vermilion is exposed to various market and operational risks. For a discussion of these risks, please see Vermilion's MD&A and Annual Information Form, each for the year ended December 31, 2021 available on SEDAR at www.sedar.com or on Vermilion’s website at www.vermilionenergy.com.
In addition to those risks noted above, on September 30, 2022, European Union energy ministers reached a political agreement on a proposal for a Council Regulation resulting in an agreed upon mandatory temporary solidarity contribution on certain businesses, including oil and gas producers like Vermilion. This Regulation was formally adopted by Member States by written procedure. The minimum 33% solidarity contribution would be calculated on taxable profits, as determined under national tax rules in the fiscal year starting in 2022 and/or in 2023, which are above a 20% increase in the average yearly taxable profits for the previous four fiscal years. The solidarity contribution will apply in addition to regular taxes and levies applicable in member states. As at September 30, 2022, the European Union member states that Vermilion operate in had not substantively enacted legislation to effect this solidarity contribution and, as such, no amount have been recorded for solidarity contributions in the nine months ended September 30, 2022. There is risk and uncertainty regarding the timing and amounts that may be levied.
Critical Accounting Estimates
The preparation of financial statements in accordance with IFRS requires management to make estimates, judgments and assumptions that affect reported assets, liabilities, revenues and expenses, gains and losses, and disclosures of any possible contingencies. These estimates and assumptions are developed based on the best available information which management believed to be reasonable at the time such estimates and assumptions were made. As such, these assumptions are uncertain at the time estimates are made and could change, resulting in a material impact on Vermilion’s consolidated financial statements. Estimates are reviewed by management on an ongoing basis and as a result may change from period to period due to the availability of new information or changes in circumstances. Additionally, as a result of the unique circumstances of each jurisdiction that Vermilion operates in, the critical accounting estimates may affect one or more jurisdictions. There have been no material changes to our critical accounting estimates used in applying accounting policies for the nine months ended September 30, 2022. Further information, including a discussion of critical accounting estimates, can be found in the notes to the Consolidated Financial Statements and annual MD&A for the year ended December 31, 2021, available on SEDAR at www.sedar.com or on Vermilion’s website at www.vermilionenergy.com.
Off Balance Sheet Arrangements
We have not entered into any guarantee or off balance sheet arrangements that would materially impact our financial position or results of operations.
Internal Control Over Financial Reporting
There has been no change in Vermilion’s internal control over financial reporting ("ICFR") during the period covered by this MD&A that materially affected, or is reasonably likely to materially affect, our internal control over financial reporting.
Vermilion has limited the scope of design controls and procedures ("DC&P") and internal controls over financial reporting to exclude controls, policies
and procedures of Leucrotta Exploration Inc., which was acquired on May 31, 2022. The scope limitation is in accordance with section 3.3(1)(b) of NI 52-109 which allows an issuer to limit the design of DC&P and ICFR to exclude controls, policies, and procedures of a business that the issuer acquired not more than 365 days before the end of the fiscal period.
The table below presents the summary financial information of Leucrotta Exploration Inc. included in Vermilion's financial statements as at and for the nine months ended September 30, 2022:
| ($M) | As at Sep 30, 2022 |
| Non-current assets | 634,862 |
| Non-current liabilities | 99,683 |
| Net assets | 535,179 |
| ($M) | Nine Months Ended Sep 30, 2022 |
| Revenue | 26,853 |
| Net earnings | 8,200 |
Vermilion Energy Inc. ■ Page 36 ■ 2022 Third Quarter Report |
Cybersecurity
Vermilion has an information security training and compliance program that is completed at least annually. We have not experienced a cybersecurity breach in the last three years.
Recently Adopted Accounting Pronouncements
Vermilion did not adopt any new accounting pronouncements as at September 30, 2022.
Disclosure Controls and Procedures
Our officers have established and maintained disclosure controls and procedures and evaluated the effectiveness of these controls in conjunction with our filings.
As of September 30, 2022, we have evaluated the effectiveness of the design and operation of our disclosure controls and procedures. Based on this evaluation, the President, for this specific purpose of acting in the capacity of Chief Executive Officer, and Chief Financial Officer have concluded and certified that our disclosure controls and procedures are effective.
Vermilion Energy Inc. ■ Page 37 ■ 2022 Third Quarter Report |
Supplemental Table 1: Netbacks
The following table includes financial statement information on a per unit basis by business unit. Liquids includes crude oil, condensate, and NGLs. Natural gas sales volumes have been converted on a basis of six thousand cubic feet of natural gas to one barrel of oil equivalent.
| | Q3 2022 | YTD 2022 | Q3 2021 | YTD 2021 |
| | Liquids | Natural Gas | Total | Liquids | Natural Gas | Total | Total | Total |
| | $/bbl | $/mcf | $/boe | $/bbl | $/mcf | $/boe | $/boe | $/boe |
| Canada | | | | | | | | |
| Sales | 96.85 | 6.31 | 69.48 | 101.92 | 6.11 | 72.10 | 48.54 | 43.85 |
| Royalties | (17.71) | (0.71) | (11.46) | (17.38) | (0.58) | (11.03) | (5.91) | (5.32) |
| Transportation | (2.88) | (0.29) | (2.36) | (2.86) | (0.25) | (2.24) | (2.02) | (2.06) |
| Operating | (17.19) | (1.66) | (13.83) | (16.05) | (1.36) | (12.45) | (11.27) | (11.16) |
| Operating netback | 59.07 | 3.65 | 41.83 | 65.63 | 3.92 | 46.38 | 29.34 | 25.31 |
| General and administration | | | (1.40) | | | (1.54) | (1.01) | (1.05) |
| Fund flows from operations ($/boe) | | | 40.43 | | | 44.84 | 28.33 | 24.26 |
| United States | | | | | | | | |
| Sales | 101.22 | 8.33 | 89.36 | 104.50 | 6.48 | 89.00 | 66.61 | 61.29 |
| Royalties | (27.01) | (2.42) | (24.11) | (27.33) | (1.88) | (23.54) | (17.89) | (16.27) |
| Transportation | (0.20) | - | (0.16) | (0.50) | - | (0.38) | (1.04) | (0.80) |
| Operating | (15.79) | (2.61) | (15.76) | (13.24) | (2.13) | (13.14) | (8.84) | (9.64) |
| Operating netback | 58.22 | 3.30 | 49.33 | 63.43 | 2.47 | 51.94 | 38.84 | 34.58 |
| General and administration | | | (2.49) | | | (2.62) | (2.51) | (2.34) |
| Fund flows from operations ($/boe) | | | 46.84 | | | 49.32 | 36.33 | 32.24 |
| France | | | | | | | | |
| Sales | 135.49 | - | 135.49 | 137.00 | - | 137.00 | 91.60 | 84.11 |
| Royalties | (15.51) | - | (15.52) | (14.80) | - | (14.80) | (12.73) | (11.59) |
| Transportation | (7.28) | - | (7.28) | (7.39) | - | (7.39) | (7.34) | (8.40) |
| Operating | (21.57) | - | (21.57) | (21.42) | - | (21.42) | (15.52) | (15.98) |
| Operating netback | 91.13 | - | 91.12 | 93.39 | - | 93.39 | 56.01 | 48.14 |
| General and administration | | | (5.72) | | | (5.44) | (3.35) | (3.60) |
| Current income taxes | | | (12.22) | | | (11.86) | 14.23 | 5.23 |
| Fund flows from operations ($/boe) | | | 73.18 | | | 76.09 | 66.89 | 49.77 |
| Netherlands | | | | | | | | |
| Sales | 139.28 | 68.73 | 408.30 | 108.27 | 46.92 | 279.36 | 104.68 | 69.67 |
| Royalties | - | - | - | - | - | - | (0.35) | (0.24) |
| Operating | - | (4.92) | (29.09) | - | (3.69) | (21.86) | (12.87) | (12.73) |
| Operating netback | 139.28 | 63.81 | 379.21 | 108.27 | 43.23 | 257.50 | 91.46 | 56.70 |
| General and administration | | | (1.24) | | | (1.41) | (0.23) | (0.28) |
| Current income taxes | | | (59.27) | | | (71.93) | (16.06) | (6.94) |
| Fund flows from operations ($/boe) | | | 318.70 | | | 184.16 | 75.17 | 49.48 |
| Germany | | | | | | | | |
| Sales | 134.17 | 62.13 | 315.78 | 134.40 | 44.03 | 236.15 | 94.41 | 69.97 |
| Royalties | (2.65) | (1.79) | (8.82) | (2.67) | (1.94) | (9.72) | (1.77) | (2.05) |
| Transportation | (8.25) | (0.53) | (4.38) | (9.26) | (0.43) | (4.02) | (4.89) | (4.52) |
| Operating | (15.77) | (2.94) | (17.19) | (20.55) | (2.99) | (18.51) | (19.25) | (20.92) |
| Operating netback | 107.50 | 56.87 | 285.39 | 101.92 | 38.67 | 203.90 | 68.50 | 42.48 |
| General and administration | | | (2.59) | | | (2.61) | (3.33) | (3.95) |
| Current income taxes | | | (34.88) | | | (19.37) | - | |
| Fund flows from operations ($/boe) | | | 247.92 | | | 181.92 | 65.17 | 38.53 |
| Ireland | | | | | | | | |
| Sales | - | 43.20 | 259.18 | - | 34.01 | 204.06 | 137.58 | 79.75 |
| Transportation | - | (0.38) | (2.30) | - | (0.37) | (2.22) | (3.11) | (2.48) |
| Operating | - | (1.99) | (11.95) | - | (1.56) | (9.35) | (8.54) | (8.18) |
| Operating netback | - | 40.83 | 244.93 | - | 32.08 | 192.49 | 125.93 | 69.09 |
| General and administration | | | 0.17 | | | 0.34 | (0.88) | 0.29 |
| Fund flows from operations ($/boe) | | | 245.10 | | | 192.83 | 125.05 | 69.38 |
Vermilion Energy Inc. ■ Page 38 ■ 2022 Third Quarter Report |
| | Q3 2022 | YTD 2022 | Q3 2021 | YTD 2021 |
| | Liquids | Natural Gas | Total | Liquids | Natural Gas | Total | Total | Total |
| | $/bbl | $/mcf | $/boe | $/bbl | $/mcf | $/boe | $/boe | $/boe |
| Australia | | | | | | | | |
| Sales | 155.29 | - | 155.29 | 155.05 | - | 155.05 | 105.17 | 99.77 |
| Operating | (40.98) | - | (40.98) | (44.61) | - | (44.61) | (35.06) | (33.84) |
| PRRT (1) | (18.00) | - | (18.00) | (16.36) | - | (16.36) | (17.36) | (9.86) |
| Operating netback | 96.31 | - | 96.31 | 94.08 | - | 94.08 | 52.75 | 56.07 |
| General and administration | | | (4.21) | | | (3.65) | (2.09) | (2.29) |
| Current income taxes | | | 11.34 | | | 3.27 | (0.21) | 3.25 |
| Fund flows from operations ($/boe) | | | 103.44 | | | 93.70 | 50.45 | 57.03 |
| | | | | | | | | |
| Total Company | | | | | | | | |
| Sales | 108.72 | 24.68 | 127.39 | 112.72 | 19.50 | 114.76 | 68.19 | 56.58 |
| Realized hedging (loss) gain | (2.56) | (5.93) | (18.22) | (7.74) | (4.11) | (15.77) | (9.19) | (5.93) |
| Royalties | (16.54) | (0.79) | (10.94) | (16.20) | (0.65) | (10.36) | (6.26) | (5.48) |
| Transportation | (3.36) | (0.28) | (2.57) | (3.42) | (0.24) | (2.48) | (2.44) | (2.50) |
| Operating | (19.24) | (2.29) | (16.64) | (18.76) | (1.94) | (15.37) | (13.21) | (12.93) |
| PRRT (1) | (1.14) | - | (0.60) | (1.10) | - | (0.58) | (0.92) | (0.44) |
| Operating netback | 65.88 | 15.39 | 78.42 | 65.50 | 12.56 | 70.20 | 36.17 | 29.30 |
| General and administration | | | (1.90) | | | (1.93) | (1.56) | (1.53) |
| Interest expense | | | (3.23) | | | (2.63) | (2.37) | (2.45) |
| Realized foreign exchange | | | (0.28) | | | (0.16) | 0.37 | (0.18) |
| Other income | | | 0.80 | | | 0.62 | 0.48 | 0.52 |
| Corporate income taxes | | | (6.74) | | | (7.24) | 0.18 | 0.09 |
| Fund flows from operations ($/boe) | | | 67.07 | | | 58.86 | 33.27 | 25.75 |
| (1) | Vermilion considers Australian PRRT to be an operating item and, accordingly, has included PRRT in the calculation of operating netbacks. Current income taxes presented above excludes PRRT. |
Vermilion Energy Inc. ■ Page 39 ■ 2022 Third Quarter Report |
Supplemental Table 2: Hedges
The prices in these tables may represent the weighted averages for several contracts with foreign currency amounts translated to the disclosure currency using forward rates as at the month-end date. The weighted average price for the portfolio of options listed below may not have the same payoff profile as the individual contracts. As such, the presentation of the weighted average prices is purely for indicative purposes.
The following tables outline Vermilion’s outstanding risk management positions as at September 30, 2022:
| | Unit | Currency | Bought Put Volume | Weighted Average Bought Put Price | Sold Call Volume | Weighted Average Sold Call Price | Sold Put Volume | Weighted Average Sold Put Price | Sold Swap Volume | Weighted Average Sold Swap Price | Bought Swap Volume | Weighted Average Bought Swap Price |
| Dated Brent | | |
| Q4 2022 | bbl | USD | 2,600 | 63.94 | 2,600 | 84.35 | 2,600 | 47.50 | - | - | - | - |
| WTI | | |
| Q4 2022 | bbl | USD | 4,500 | 60.82 | 4,500 | 82.92 | 4,500 | 45.00 | - | - | - | - |
| AECO | | |
| Q4 2022 | mcf | CAD | 3,142 | 3.69 | 3,142 | 7.70 | - | - | 18,853 | 4.95 | - | - |
| Q1 2023 | mcf | CAD | 4,739 | 3.69 | 4,739 | 7.70 | - | - | 28,435 | 4.95 | - | - |
| AECO Basis (AECO less NYMEX Henry Hub) | | |
| Q4 2022 | mcf | USD | - | - | - | - | - | - | 11,793 | (1.09) | - | - |
| Q2 2023 | mcf | USD | - | - | - | - | - | - | 23,000 | (1.13) | - | - |
| Q3 2023 | mcf | USD | - | - | - | - | - | - | 23,000 | (1.13) | - | - |
| Q4 2023 | mcf | USD | - | - | - | - | - | - | 7,750 | (1.13) | - | - |
| NYMEX Henry Hub | | |
| Q4 2022 | mcf | USD | 35,793 | 3.68 | 35,793 | 6.62 | - | - | - | - | - | - |
| Q1 2023 | mcf | USD | 24,000 | 4.00 | 24,000 | 8.44 | - | - | - | - | - | - |
| Q2 2023 | mcf | USD | 5,000 | 4.00 | 5,000 | 8.75 | - | - | - | - | - | - |
| Q3 2023 | mcf | USD | 5,000 | 4.00 | 5,000 | 8.75 | - | - | - | - | - | - |
| Q4 2023 | mcf | USD | 1,685 | 4.00 | 1,685 | 8.75 | - | - | - | - | - | - |
| NBP | | |
| Q4 2022 | mcf | EUR | 23,339 | 8.85 | 23,339 | 12.75 | 19,654 | 3.66 | 4,913 | 4.91 | - | - |
| Q1 2023 | mcf | EUR | 18,426 | 11.76 | 18,426 | 19.65 | 14,740 | 4.10 | - | - | - | - |
| Q2 2023 | mcf | EUR | 7,370 | 11.48 | 7,370 | 17.46 | 4,913 | 4.40 | - | - | - | - |
| Q3 2023 | mcf | EUR | 2,457 | 22.71 | 2,457 | 35.90 | - | - | - | - | - | - |
| Q1 2024 | mcf | EUR | 4,913 | 41.03 | 4,913 | 84.26 | - | - | - | - | - | - |
| TTF | | |
| Q4 2022 | mcf | EUR | 14,740 | 24.01 | 14,740 | 46.12 | 2,457 | 3.52 | - | - | - | - |
| Q1 2023 | mcf | EUR | 14,740 | 24.01 | 14,740 | 46.12 | 2,457 | 3.52 | - | - | - | - |
| Q2 2023 | mcf | EUR | 19,654 | 34.53 | 19,654 | 53.21 | - | - | - | - | - | - |
| Q3 2023 | mcf | EUR | 19,654 | 34.53 | 19,654 | 53.21 | - | - | - | - | - | - |
| Q4 2023 | mcf | EUR | 12,284 | 44.84 | 12,284 | 84.99 | - | - | 3,685 | 67.41 | - | - |
| Q1 2024 | mcf | EUR | 31,938 | 40.69 | 31,938 | 78.00 | - | - | 3,685 | 67.41 | - | - |
| Q2 2024 | mcf | EUR | 3,593 | 37.56 | 3,593 | 74.66 | - | - | - | - | - | - |
| Q3 2024 | mcf | EUR | 3,593 | 37.56 | 3,593 | 74.66 | - | - | - | - | - | - |
| VET Equity Swaps | | | Initial Share Price | Share Volume |
| Swap | Jan 2020 - Apr 2023 | | | | 20.9788 | CAD | 2,250,000 |
| Swap | Jan 2020 - Jul 2024 | | | | 22.4587 | CAD | 1,500,000 |
| Cross Currency Interest Rate | Receive Notional Amount | Receive Rate | Pay Notional Amount | Pay Rate |
| Swap | October 2022 | 304,018,089 | USD | SOFR + 1.35% | 400,000,000 | CAD | CDOR + 0.88% |
| | | | | | | | |
Vermilion Energy Inc. ■ Page 40 ■ 2022 Third Quarter Report |
Supplemental Table 3: Capital Expenditures and Acquisitions
| By classification ($M) | Q3 2022 | Q3 2021 | YTD 2022 | YTD 2021 |
| Drilling and development | 177,878 | 63,173 | 370,207 | 220,388 |
| Exploration and evaluation | 6,137 | 3,277 | 12,305 | 8,601 |
| Capital expenditures | 184,015 | 66,450 | 382,512 | 228,989 |
| | | | | |
| Acquisitions | 2,203 | 92,191 | 506,715 | 104,780 |
| Acquisition of securities | 4,017 | - | 22,318 | - |
| Contingent consideration | - | - | - | 330 |
| Working capital assumed | - | 2,229 | 6,122 | 2,222 |
| Acquisitions | 6,220 | 94,420 | 535,155 | 107,332 |
| | | | | |
| By category ($M) | Q3 2022 | Q3 2021 | YTD 2022 | YTD 2021 |
| Drilling, completion, new well equip and tie-in, workovers and recompletions | 153,641 | 38,666 | 305,529 | 154,901 |
| Production equipment and facilities | 21,441 | 26,092 | 56,436 | 62,982 |
| Seismic, studies, land and other | 8,933 | 1,692 | 20,547 | 11,106 |
| Capital expenditures | 184,015 | 66,450 | 382,512 | 228,989 |
| Acquisitions | 6,220 | 94,420 | 535,155 | 107,332 |
| Total capital expenditures and acquisitions | 190,235 | 160,870 | 917,667 | 336,321 |
| | | | | |
| Capital expenditures by country ($M) | Q3 2022 | Q3 2021 | YTD 2022 | YTD 2021 |
| Canada | 83,343 | 29,660 | 163,720 | 104,191 |
| United States | 28,895 | 5,519 | 60,944 | 28,948 |
| France | 9,624 | 8,886 | 28,548 | 24,678 |
| Netherlands | 5,547 | 2,789 | 7,420 | 14,605 |
| Germany | 3,334 | 3,318 | 16,068 | 9,424 |
| Ireland | 735 | 918 | 1,707 | 1,156 |
| Australia | 44,068 | 6,073 | 89,420 | 26,030 |
| Central and Eastern Europe | 8,469 | 9,287 | 14,685 | 19,957 |
| Total capital expenditures | 184,015 | 66,450 | 382,512 | 228,989 |
| | | | | |
| Acquisitions by country ($M) | Q3 2022 | Q3 2021 | YTD 2022 | YTD 2021 |
| Canada | 4,304 | 150 | 529,363 | 508 |
| United States | - | 94,170 | 1,075 | 94,170 |
| Netherlands | 707 | - | 707 | - |
| Germany | 1,209 | 100 | 3,868 | 12,654 |
| Ireland | - | - | 142 | - |
| Total acquisitions | 6,220 | 94,420 | 535,155 | 107,332 |
Vermilion Energy Inc. ■ Page 41 ■ 2022 Third Quarter Report |
Supplemental Table 4: Production
| | Q3/22 | Q2/22 | Q1/22 | Q4/21 | Q3/21 | Q2/21 | Q1/21 | Q4/20 | Q3/20 | Q2/20 | Q1/20 | Q4/19 |
| Canada | | | | | | | | | | | | |
| Light and medium crude oil (bbls/d) | 16,835 | 17,042 | 15,980 | 16,388 | 16,809 | 16,868 | 17,767 | 19,301 | 19,847 | 22,545 | 22,767 | 23,259 |
| Condensate (1) (bbls/d) | 4,204 | 4,873 | 4,892 | 4,785 | 4,426 | 5,558 | 4,556 | 4,662 | 5,200 | 5,047 | 4,634 | 4,140 |
| Other NGLs (1) (bbls/d) | 6,870 | 7,155 | 7,286 | 7,073 | 6,862 | 7,767 | 7,016 | 7,334 | 8,350 | 8,248 | 6,943 | 7,005 |
| NGLs (bbls/d) | 11,074 | 12,028 | 12,178 | 11,858 | 11,288 | 13,325 | 11,572 | 11,996 | 13,550 | 13,295 | 11,577 | 11,145 |
| Conventional natural gas (mmcf/d) | 145.04 | 143.94 | 140.55 | 128.85 | 138.42 | 146.55 | 138.41 | 135.27 | 155.15 | 164.08 | 151.16 | 145.14 |
| Total (boe/d) | 52,080 | 53,060 | 51,584 | 49,720 | 51,168 | 54,618 | 52,407 | 53,840 | 59,256 | 63,187 | 59,537 | 58,593 |
| United States | | | | | | | | | | | | |
| Light and medium crude oil (bbls/d) | 2,824 | 2,846 | 2,675 | 2,647 | 3,520 | 1,888 | 2,322 | 2,495 | 3,243 | 3,971 | 2,481 | 3,149 |
| Condensate (1) (bbls/d) | 35 | 40 | 24 | 26 | 2 | 2 | - | 1 | 6 | 6 | 6 | 12 |
| Other NGLs (1) (bbls/d) | 1,031 | 958 | 1,056 | 1,388 | 1,206 | 928 | 1,058 | 1,294 | 1,158 | 1,340 | 1,079 | 1,156 |
| NGLs (bbls/d) | 1,066 | 998 | 1,080 | 1,414 | 1,208 | 930 | 1,058 | 1,295 | 1,164 | 1,346 | 1,085 | 1,168 |
| Conventional natural gas (mmcf/d) | 7.03 | 6.74 | 7.56 | 9.09 | 6.75 | 5.51 | 5.95 | 6.87 | 7.94 | 8.35 | 6.72 | 8.20 |
| Total (boe/d) | 5,062 | 4,967 | 5,014 | 5,575 | 5,854 | 3,736 | 4,373 | 4,934 | 5,730 | 6,708 | 4,685 | 5,683 |
| France | | | | | | | | | | | | |
| Light and medium crude oil (bbls/d) | 6,818 | 8,126 | 8,389 | 8,453 | 8,677 | 9,013 | 9,062 | 9,255 | 9,347 | 7,046 | 9,957 | 10,264 |
| Conventional natural gas (mmcf/d) | - | - | - | - | - | - | - | - | - | - | - | - |
| Total (boe/d) | 6,818 | 8,126 | 8,389 | 8,453 | 8,677 | 9,013 | 9,062 | 9,255 | 9,347 | 7,046 | 9,957 | 10,264 |
| Netherlands | | | | | | | | | | | | |
| Light and medium crude oil (bbls/d) | - | 1 | 1 | - | 6 | 1 | 6 | 1 | - | 1 | 3 | 4 |
| Condensate (1) (bbls/d) | 74 | 60 | 83 | 97 | 104 | 95 | 92 | 99 | 83 | 86 | 84 | 86 |
| NGLs (bbls/d) | 74 | 60 | 83 | 97 | 104 | 95 | 92 | 99 | 83 | 86 | 84 | 86 |
| Conventional natural gas (mmcf/d) | 29.15 | 35.22 | 39.03 | 51.98 | 42.48 | 37.59 | 41.45 | 42.95 | 46.09 | 47.31 | 48.33 | 47.99 |
| Total (boe/d) | 4,933 | 5,930 | 6,589 | 8,761 | 7,190 | 6,362 | 7,006 | 7,257 | 7,764 | 7,972 | 8,143 | 8,088 |
| Germany | | | | | | | | | | | | |
| Light and medium crude oil (bbls/d) | 1,764 | 1,331 | 1,158 | 1,127 | 1,043 | 1,093 | 911 | 960 | 964 | 1,039 | 909 | 800 |
| Conventional natural gas (mmcf/d) | 26.54 | 25.36 | 26.95 | 18.00 | 16.19 | 15.60 | 13.40 | 11.50 | 11.25 | 13.23 | 14.64 | 15.44 |
| Total (boe/d) | 6,187 | 5,558 | 5,650 | 4,127 | 3,741 | 3,694 | 3,144 | 2,876 | 2,839 | 3,244 | 3,349 | 3,373 |
| Ireland | | | | | | | | | | | | |
| Conventional natural gas (mmcf/d) | 25.74 | 27.93 | 30.26 | 30.12 | 22.67 | 30.19 | 34.14 | 34.76 | 35.12 | 38.57 | 41.38 | 42.30 |
| Total (boe/d) | 4,290 | 4,655 | 5,043 | 5,020 | 3,778 | 5,031 | 5,690 | 5,793 | 5,853 | 6,428 | 6,896 | 7,049 |
| Australia | | | | | | | | | | | | |
| Light and medium crude oil (bbls/d) | 4,763 | 2,465 | 3,888 | 2,742 | 4,190 | 3,835 | 4,489 | 3,781 | 4,549 | 5,299 | 4,041 | 4,548 |
| Total (boe/d) | 4,763 | 2,465 | 3,888 | 2,742 | 4,190 | 3,835 | 4,489 | 3,781 | 4,549 | 5,299 | 4,041 | 4,548 |
| Central and Eastern Europe | | | | | | | | | | | | |
| Conventional natural gas (mmcf/d) | 0.63 | 0.64 | 0.34 | 0.12 | 0.22 | 0.28 | 0.63 | 0.67 | 0.80 | 2.89 | 3.27 | 1.66 |
| Total (boe/d) | 104 | 106 | 57 | 20 | 36 | 46 | 104 | 111 | 132 | 483 | 546 | 276 |
| Consolidated | | | | | | | | | | | | |
| Light and medium crude oil (bbls/d) | 33,003 | 31,811 | 32,091 | 31,356 | 34,245 | 32,698 | 34,556 | 35,793 | 37,951 | 39,899 | 40,157 | 42,024 |
| Condensate (1) (bbls/d) | 4,312 | 4,973 | 4,999 | 4,908 | 4,532 | 5,656 | 4,648 | 4,762 | 5,289 | 5,142 | 4,724 | 4,237 |
| Other NGLs (1) (bbls/d) | 7,901 | 8,113 | 8,342 | 8,461 | 8,068 | 8,695 | 8,074 | 8,627 | 9,509 | 9,588 | 8,022 | 8,160 |
| NGLs (bbls/d) | 12,213 | 13,086 | 13,341 | 13,369 | 12,600 | 14,351 | 12,722 | 13,389 | 14,798 | 14,730 | 12,746 | 12,397 |
| Conventional natural gas (mmcf/d) | 234.12 | 239.83 | 244.69 | 238.16 | 226.73 | 235.72 | 233.98 | 232.00 | 256.34 | 274.42 | 265.51 | 260.72 |
| Total (boe/d) | 84,237 | 84,868 | 86,213 | 84,417 | 84,633 | 86,335 | 86,276 | 87,848 | 95,471 | 100,366 | 97,154 | 97,875 |
Vermilion Energy Inc. ■ Page 42 ■ 2022 Third Quarter Report |
| | | | | | | YTD 2022 | 2021 | 2020 | 2019 | 2018 | 2017 |
| Canada | | | | | | | | | | | | |
| Light and medium crude oil (bbls/d) | | | | | | | 16,622 | 16,954 | 21,106 | 23,971 | 17,400 | 6,015 |
| Condensate (1) (bbls/d) | | | | | | | 4,654 | 4,831 | 4,886 | 4,295 | 3,754 | 3,036 |
| Other NGLs (1) (bbls/d) | | | | | | | 7,102 | 7,179 | 7,719 | 6,988 | 5,914 | 4,144 |
| NGLs (bbls/d) | | | | | | | 11,756 | 12,010 | 12,605 | 11,283 | 9,668 | 7,180 |
| Conventional natural gas (mmcf/d) | | | | | | | 143.19 | 138.03 | 151.38 | 148.35 | 129.37 | 97.89 |
| Total (boe/d) | | | | | | | 52,244 | 51,968 | 58,942 | 59,979 | 48,630 | 29,510 |
| United States | | | | | | | | | | | | |
| Light and medium crude oil (bbls/d) | | | | | | | 2,782 | 2,597 | 3,046 | 2,514 | 1,069 | 662 |
| Condensate (1) (bbls/d) | | | | | | | 33 | 8 | 5 | 18 | 8 | 4 |
| Other NGLs (1) (bbls/d) | | | | | | | 1,015 | 1,146 | 1,218 | 996 | 452 | 50 |
| NGLs (bbls/d) | | | | | | | 1,048 | 1,154 | 1,223 | 1,014 | 460 | 54 |
| Conventional natural gas (mmcf/d) | | | | | | | 7.11 | 6.84 | 7.47 | 6.89 | 2.78 | 0.39 |
| Total (boe/d) | | | | | | | 5,015 | 4,890 | 5,514 | 4,675 | 1,992 | 781 |
| France | | | | | | | | | | | | |
| Light and medium crude oil (bbls/d) | | | | | | | 7,772 | 8,799 | 8,903 | 10,435 | 11,362 | 11,084 |
| Conventional natural gas (mmcf/d) | | | | | | | - | - | - | 0.19 | 0.21 | - |
| Total (boe/d) | | | | | | | 7,772 | 8,799 | 8,903 | 10,467 | 11,396 | 11,084 |
| Netherlands | | | | | | | | | | | | |
| Light and medium crude oil (bbls/d) | | | | | | | 1 | 3 | 1 | 3 | - | - |
| Condensate (1) (bbls/d) | | | | | | | 72 | 97 | 88 | 88 | 90 | 90 |
| NGLs (bbls/d) | | | | | | | 72 | 97 | 88 | 88 | 90 | 90 |
| Conventional natural gas (mmcf/d) | | | | | | | 34.43 | 43.40 | 46.16 | 49.10 | 46.13 | 40.54 |
| Total (boe/d) | | | | | | | 5,811 | 7,334 | 7,782 | 8,274 | 7,779 | 6,847 |
| Germany | | | | | | | | | | | | |
| Light and medium crude oil (bbls/d) | | | | | | | 1,420 | 1,044 | 968 | 917 | 1,004 | 1,060 |
| Conventional natural gas (mmcf/d) | | | | | | | 26.28 | 15.81 | 12.65 | 15.31 | 15.66 | 19.39 |
| Total (boe/d) | | | | | | | 5,800 | 3,679 | 3,076 | 3,468 | 3,614 | 4,291 |
| Ireland | | | | | | | | | | | | |
| Conventional natural gas (mmcf/d) | | | | | | | 27.96 | 29.25 | 37.44 | 46.57 | 55.17 | 58.43 |
| Total (boe/d) | | | | | | | 4,660 | 4,875 | 6,240 | 7,762 | 9,195 | 9,737 |
| Australia | | | | | | | | | | | | |
| Light and medium crude oil (bbls/d) | | | | | | | 3,708 | 3,810 | 4,416 | 5,662 | 4,494 | 5,770 |
| Total (boe/d) | | | | | | | 3,708 | 3,810 | 4,416 | 5,662 | 4,494 | 5,770 |
| Central and Eastern Europe | | | | | | | | | | | | |
| Conventional natural gas (mmcf/d) | | | | | | | 0.54 | 0.31 | 1.90 | 0.42 | 1.02 | - |
| Total (boe/d) | | | | | | | 89 | 51 | 317 | 70 | 169 | - |
| Consolidated | | | | | | | | | | | | |
| Light and medium crude oil (bbls/d) | | | | | | | 32,305 | 33,208 | 38,441 | 43,502 | 35,329 | 24,591 |
| Condensate (1) (bbls/d) | | | | | | | 4,759 | 4,936 | 4,980 | 4,400 | 3,853 | 3,130 |
| Other NGLs (1) (bbls/d) | | | | | | | 8,117 | 8,325 | 8,937 | 7,984 | 6,366 | 4,194 |
| NGLs (bbls/d) | | | | | | | 12,876 | 13,261 | 13,917 | 12,384 | 10,219 | 7,324 |
| Conventional natural gas (mmcf/d) | | | | | | | 239.51 | 233.64 | 256.99 | 266.82 | 250.33 | 216.64 |
| Total (boe/d) | | | | | | | 85,099 | 85,408 | 95,190 | 100,357 | 87,270 | 68,021 |
| (1) | Under National Instrument 51-101 "Standards of Disclosure for Oil and Gas Activities", disclosure of production volumes should include segmentation by product type as defined in the instrument. This table provides a reconciliation from "crude oil and condensate", "NGLs" and "natural gas" to the product types. In this report, references to "crude oil" and "light and medium crude oil" mean "light crude oil and medium crude oil" and references to "natural gas" mean "conventional natural gas". Production volumes reported are based on quantities as measured at the first point of sale. |
Vermilion Energy Inc. ■ Page 43 ■ 2022 Third Quarter Report |
Supplemental Table 5: Operational and Financial Data by Core Region
Production volumes (1)
| | Q3/22 | Q2/22 | Q1/22 | Q4/21 | Q3/21 | Q2/21 | Q1/21 | Q4/20 | Q3/20 | Q2/20 | Q1/20 | Q4/19 |
| North America | | | | | | | | | | | | |
| Crude oil and condensate (bbls/d) | 23,898 | 24,801 | 23,571 | 23,846 | 24,757 | 24,316 | 24,645 | 26,459 | 28,296 | 31,569 | 29,888 | 30,560 |
| NGLs (bbls/d) | 7,901 | 8,113 | 8,342 | 8,461 | 8,068 | 8,695 | 8,074 | 8,628 | 9,508 | 9,588 | 8,022 | 8,161 |
| Natural gas (mmcf/d) | 152.07 | 150.68 | 148.11 | 137.93 | 145.18 | 152.06 | 144.36 | 142.13 | 163.09 | 172.43 | 157.88 | 153.34 |
| Total (boe/d) | 57,142 | 58,027 | 56,598 | 55,295 | 57,022 | 58,354 | 56,780 | 58,774 | 64,986 | 69,895 | 64,222 | 64,276 |
| | | | | | | | | | | | | |
| International | | | | | | | | | | | | |
| Crude oil and condensate (bbls/d) | 13,419 | 11,983 | 13,519 | 12,419 | 14,020 | 14,037 | 14,560 | 14,096 | 14,943 | 13,471 | 14,994 | 15,702 |
| Natural gas (mmcf/d) | 82.05 | 89.15 | 96.58 | 100.22 | 81.55 | 83.66 | 89.62 | 89.86 | 93.25 | 101.99 | 107.63 | 107.38 |
| Total (boe/d) | 27,095 | 26,840 | 29,616 | 29,123 | 27,612 | 27,981 | 29,495 | 29,073 | 30,484 | 30,472 | 32,932 | 33,598 |
| | | | | | | | | | | | | |
| Consolidated | | | | | | | | | | | | |
| Crude oil and condensate (bbls/d) | 37,315 | 36,784 | 37,090 | 36,264 | 38,777 | 38,354 | 39,204 | 40,555 | 43,240 | 45,041 | 44,881 | 46,261 |
| NGLs (bbls/d) | 7,901 | 8,113 | 8,342 | 8,461 | 8,068 | 8,695 | 8,074 | 8,627 | 9,509 | 9,588 | 8,022 | 8,160 |
| Natural gas (mmcf/d) | 234.12 | 239.83 | 244.69 | 238.16 | 226.73 | 235.72 | 233.98 | 232.00 | 256.34 | 274.42 | 265.51 | 260.72 |
| Total (boe/d) | 84,237 | 84,868 | 86,213 | 84,417 | 84,633 | 86,335 | 86,276 | 87,848 | 95,471 | 100,366 | 97,154 | 97,875 |
| (1) | Please refer to Supplemental Table 4 "Production" for disclosure by product type. |
Sales volumes
| | Q3/22 | Q2/22 | Q1/22 | Q4/21 | Q3/21 | Q2/21 | Q1/21 | Q4/20 | Q3/20 | Q2/20 | Q1/20 | Q4/19 |
| North America | | | | | | | | | | | | |
| Crude oil and condensate (bbls/d) | 23,897 | 24,801 | 23,571 | 23,845 | 24,757 | 24,316 | 24,645 | 26,459 | 28,297 | 31,569 | 29,888 | 30,560 |
| NGLs (bbls/d) | 7,901 | 8,113 | 8,342 | 8,461 | 8,068 | 8,695 | 8,074 | 8,628 | 9,508 | 9,588 | 8,022 | 8,161 |
| Natural gas (mmcf/d) | 152.07 | 150.68 | 148.11 | 137.93 | 145.18 | 152.06 | 144.36 | 142.13 | 163.09 | 172.43 | 157.88 | 153.34 |
| Total (boe/d) | 57,142 | 58,027 | 56,598 | 55,295 | 57,022 | 58,354 | 56,780 | 58,774 | 64,986 | 69,895 | 64,222 | 64,276 |
| | | | | | | | | | | | | |
| International | | | | | | | | | | | | |
| Crude oil and condensate (bbls/d) | 11,493 | 11,720 | 12,615 | 13,985 | 15,227 | 13,859 | 11,421 | 15,359 | 15,689 | 12,202 | 17,090 | 13,864 |
| Natural gas (mmcf/d) | 82.05 | 89.15 | 96.58 | 100.22 | 81.55 | 83.66 | 89.62 | 89.86 | 93.25 | 101.99 | 107.63 | 107.38 |
| Total (boe/d) | 25,169 | 26,578 | 28,712 | 30,689 | 28,820 | 27,802 | 26,357 | 30,336 | 31,229 | 29,201 | 35,028 | 31,760 |
| | | | | | | | | | | | | |
| Consolidated | | | | | | | | | | | | |
| Crude oil and condensate (bbls/d) | 35,391 | 36,522 | 36,186 | 37,830 | 39,985 | 38,174 | 36,066 | 41,818 | 43,985 | 43,771 | 46,977 | 44,423 |
| NGLs (bbls/d) | 7,901 | 8,113 | 8,342 | 8,461 | 8,068 | 8,695 | 8,074 | 8,627 | 9,509 | 9,588 | 8,022 | 8,160 |
| Natural gas (mmcf/d) | 234.12 | 239.83 | 244.69 | 238.16 | 226.73 | 235.72 | 233.98 | 232.00 | 256.34 | 274.42 | 265.51 | 260.72 |
| Total (boe/d) | 82,312 | 84,607 | 85,310 | 85,984 | 85,841 | 86,156 | 83,138 | 89,111 | 96,217 | 99,096 | 99,250 | 96,037 |
Vermilion Energy Inc. ■ Page 44 ■ 2022 Third Quarter Report |
Financial results
| | Q3/22 | Q2/22 | Q1/22 | Q4/21 | Q3/21 | Q2/21 | Q1/21 | Q4/20 | Q3/20 | Q2/20 | Q1/20 | Q4/19 |
| North America | | | | | | | | | | | | |
| Crude oil and condensate sales ($/bbl) | 114.82 | 134.72 | 111.42 | 92.99 | 82.23 | 75.43 | 66.31 | 51.06 | 49.79 | 28.94 | 50.25 | 66.31 |
| NGL sales ($/bbl) | 44.64 | 51.86 | 46.94 | 47.26 | 35.55 | 25.43 | 29.39 | 19.20 | 15.04 | 8.94 | 8.92 | 14.63 |
| Natural gas sales ($/mcf) | 6.41 | 7.13 | 4.80 | 5.07 | 3.80 | 2.72 | 3.98 | 2.77 | 2.02 | 1.60 | 1.92 | 2.29 |
| Sales ($/boe) | 71.24 | 83.34 | 65.88 | 59.97 | 50.40 | 42.30 | 43.08 | 32.51 | 28.94 | 18.24 | 29.22 | 38.86 |
| Royalties ($/boe) | (12.58) | (12.51) | (11.24) | (9.26) | (7.14) | (5.98) | (5.49) | (3.64) | (3.58) | (1.67) | (3.54) | (4.98) |
| Transportation ($/boe) | (2.16) | (2.15) | (1.91) | (1.86) | (1.92) | (1.90) | (2.05) | (1.92) | (1.74) | (1.72) | (1.91) | (1.76) |
| Operating ($/boe) | (14.00) | (11.58) | (11.95) | (11.68) | (11.02) | (10.89) | (11.21) | (10.94) | (7.82) | (9.60) | (11.93) | (11.15) |
| General and administration ($/boe) | (1.27) | (1.52) | (1.26) | (2.01) | (1.14) | (0.91) | (1.34) | (1.94) | (0.78) | (1.52) | (0.84) | (0.97) |
| Corporate income taxes ($/boe) | (0.03) | - | (0.02) | 0.42 | (0.05) | (0.04) | (0.04) | 0.04 | (0.02) | (0.02) | (0.04) | (0.11) |
| Fund flows from operations ($/boe) | 41.20 | 55.58 | 39.51 | 35.58 | 29.13 | 22.57 | 22.95 | 14.11 | 14.99 | 3.72 | 10.96 | 19.89 |
| | | | | | | | | | | | | |
| Fund flows from operations | 216,579 | 293,470 | 201,193 | 180,979 | 152,764 | 119,916 | 117,227 | 76,375 | 89,635 | 23,639 | 64,048 | 117,623 |
| Drilling and development | (112,238) | (54,913) | (57,513) | (89,643) | (35,179) | (38,847) | (59,113) | (33,781) | (9,575) | (23,979) | (197,926) | (69,775) |
| Exploration and evaluation | - | - | - | - | - | - | - | - | - | - | - | - |
| Free cash flow | 104,341 | 238,557 | 143,680 | 91,336 | 117,585 | 81,069 | 58,114 | 42,594 | 80,060 | (340) | (133,878) | 47,848 |
| | | | | | | | | | | | | |
| International | | | | | | | | | | | | |
| Crude oil and condensate sales ($/bbl) | 140.09 | 146.67 | 136.69 | 103.53 | 94.91 | 85.41 | 81.40 | 62.65 | 58.19 | 50.27 | 73.35 | 82.14 |
| Natural gas sales ($/mcf) | 58.55 | 32.33 | 36.75 | 35.54 | 18.82 | 9.83 | 7.98 | 6.27 | 2.91 | 2.28 | 4.44 | 5.49 |
| Sales ($/boe) | 254.86 | 173.14 | 183.66 | 163.23 | 103.39 | 72.16 | 62.39 | 50.30 | 37.94 | 28.98 | 49.42 | 54.42 |
| Royalties ($/boe) | (7.21) | (7.23) | (5.43) | (4.13) | (4.52) | (3.83) | (3.53) | (3.02) | (3.32) | (2.16) | (3.27) | (3.85) |
| Transportation ($/boe) | (3.51) | (3.64) | (2.91) | (3.40) | (3.47) | (4.64) | (2.76) | (2.40) | (2.28) | (2.04) | (1.94) | (1.77) |
| Operating ($/boe) | (22.63) | (22.11) | (19.86) | (18.86) | (17.55) | (16.56) | (16.42) | (16.99) | (15.18) | (14.35) | (16.13) | (15.28) |
| General and administration ($/boe) | (3.34) | (3.16) | (3.02) | (2.53) | (2.40) | (2.61) | (2.06) | (2.92) | (2.53) | (2.72) | (2.63) | (3.70) |
| Corporate income taxes ($/boe) | (21.97) | (28.73) | (17.63) | (12.17) | 0.64 | (0.19) | 0.66 | 2.25 | 0.04 | (0.02) | (0.11) | 2.22 |
| PRRT ($/boe) | (1.96) | (0.83) | (2.60) | (1.96) | (2.74) | (0.58) | (0.60) | (1.45) | (1.27) | (1.21) | (2.90) | (0.50) |
| Fund flows from operations ($/boe) | 194.24 | 107.44 | 132.19 | 120.18 | 73.35 | 43.74 | 37.69 | 25.78 | 13.40 | 6.47 | 22.43 | 31.54 |
| | | | | | | | | | | | | |
| Fund flows from operations | 449,771 | 259,840 | 341,626 | 339,286 | 194,505 | 110,654 | 89,403 | 71,934 | 38,498 | 17,193 | 71,526 | 92,160 |
| Drilling and development | (65,640) | (54,575) | (25,328) | (29,359) | (27,994) | (38,856) | (20,399) | (19,122) | (20,187) | (18,404) | (29,507) | (27,339) |
| Exploration and evaluation | (6,137) | (3,665) | (2,503) | (26,805) | (3,277) | (1,473) | (3,851) | (6,991) | (1,568) | 109 | (6,271) | (3,511) |
| Free cash flow | 377,994 | 201,600 | 313,795 | 283,122 | 163,234 | 70,325 | 65,153 | 45,821 | 16,743 | (1,102) | 35,748 | 61,310 |
| | | | | | | | | | | | | |
| | Q3/22 | Q2/22 | Q1/22 | Q4/21 | Q3/21 | Q2/21 | Q1/21 | Q4/20 | Q3/20 | Q2/20 | Q1/20 | Q4/19 |
| Consolidated | | | | | | | | | | | | |
| Crude oil and condensate sales ($/bbl) | 123.02 | 138.55 | 120.23 | 96.88 | 87.05 | 79.06 | 71.09 | 55.31 | 52.79 | 34.89 | 58.66 | 71.25 |
| NGL sales ($/bbl) | 44.64 | 51.86 | 46.94 | 47.26 | 35.55 | 25.43 | 29.39 | 19.20 | 15.04 | 8.94 | 8.92 | 14.63 |
| Natural gas sales ($/mcf) | 24.68 | 16.50 | 17.41 | 17.89 | 9.20 | 5.24 | 5.51 | 4.13 | 2.34 | 1.85 | 2.94 | 3.61 |
| Sales ($/boe) | 127.39 | 111.55 | 105.52 | 96.82 | 68.19 | 51.93 | 49.20 | 38.57 | 31.86 | 21.40 | 36.35 | 44.01 |
| Royalties ($/boe) | (10.94) | (10.85) | (9.29) | (7.43) | (6.26) | (5.29) | (4.87) | (3.43) | (3.50) | (1.81) | (3.45) | (4.60) |
| Transportation ($/boe) | (2.57) | (2.62) | (2.25) | (2.41) | (2.44) | (2.78) | (2.27) | (2.08) | (1.92) | (1.81) | (1.92) | (1.76) |
| Operating ($/boe) | (16.64) | (14.89) | (14.61) | (14.24) | (13.21) | (12.72) | (12.86) | (13.00) | (10.21) | (11.00) | (13.41) | (12.52) |
| General and administration ($/boe) | (1.90) | (2.04) | (1.85) | (2.20) | (1.56) | (1.46) | (1.57) | (2.27) | (1.35) | (1.88) | (1.47) | (1.88) |
| Corporate income taxes ($/boe) | (6.74) | (9.03) | (5.95) | (4.07) | 0.18 | (0.09) | 0.18 | 0.80 | - | (0.02) | (0.06) | 0.66 |
| PRRT ($/boe) | (0.60) | (0.26) | (0.87) | (0.70) | (0.92) | (0.19) | (0.19) | (0.49) | (0.41) | (0.36) | (1.02) | (0.16) |
| Interest ($/boe) | (3.23) | (2.74) | (1.93) | (2.06) | (2.37) | (2.41) | (2.57) | (2.42) | (1.97) | (1.98) | (2.21) | (2.17) |
| Realized derivatives ($/boe) | (18.22) | (10.36) | (18.78) | (23.97) | (9.19) | (5.05) | (3.43) | 0.10 | 0.47 | 6.07 | 5.47 | 2.57 |
| Realized foreign exchange ($/boe) | (0.28) | (0.30) | 0.10 | (0.30) | 0.37 | (0.25) | (0.69) | 0.16 | (0.31) | 0.44 | 0.94 | 0.23 |
| Realized other ($/boe) | 0.80 | 0.36 | 0.70 | 1.29 | 0.48 | 0.35 | 0.73 | 0.56 | 0.29 | 0.03 | (0.37) | 0.03 |
| Fund flows from operations ($/boe) | 67.08 | 58.82 | 50.79 | 40.71 | 33.26 | 22.07 | 21.64 | 16.49 | 12.97 | 9.09 | 18.84 | 24.41 |
| | | | | | | | | | | | | |
| Fund flows from operations | 507,876 | 452,901 | 389,868 | 322,173 | 262,696 | 172,942 | 162,051 | 135,212 | 114,776 | 81,852 | 170,225 | 215,592 |
| Drilling and development | (177,878) | (109,488) | (82,841) | (119,002) | (63,173) | (77,703) | (79,512) | (52,903) | (29,762) | (42,383) | (227,433) | (97,114) |
| Exploration and evaluation | (6,137) | (3,665) | (2,503) | (26,805) | (3,277) | (1,473) | (3,851) | (6,991) | (1,568) | 109 | (6,271) | (3,511) |
| Free cash flow | 323,861 | 339,748 | 304,524 | 176,366 | 196,246 | 93,766 | 78,688 | 75,318 | 83,446 | 39,578 | (63,479) | 114,967 |
Vermilion Energy Inc. ■ Page 45 ■ 2022 Third Quarter Report |
Non-GAAP and Other Specified Financial Measures
This MD&A includes references to certain financial measures which do not have standardized meanings and may not be comparable to similar measures presented by other issuers. These financial measures include fund flows from operations, a total of segments measure of profit or loss in accordance with IFRS 8 “Operating Segments” (please see Segmented Information in the Notes to the condensed Consolidated Interim Financial Statements) and net debt, a capital management measure in accordance with IAS 1 “Presentation of Financial Statements” (please see Capital Disclosures in the Notes to the condensed Consolidated Interim Financial Statements).
In addition, this MD&A includes financial measures which are not specified, defined, or determined under IFRS and are therefore considered non-GAAP financial measures and may not be comparable to similar measures presented by other issuers. These non-GAAP financial measures include:
Acquisitions: The sum of acquisitions from the Consolidated Statements of Cash Flows, Vermilion common shares issued as consideration, the estimated value of contingent consideration, the amount of acquiree's outstanding long-term debt assumed plus or net of acquired working capital deficit or surplus. We believe that including these components provides a useful measure of the economic investment associated with our acquisition activity. A reconciliation to the acquisitions line item in the Consolidated Statements of Cash Flows can be found in Supplemental Table 3 of this MD&A.
Capital expenditures: A non-GAAP financial measure calculated as the sum of drilling and development costs and exploration and evaluation costs from the Consolidated Statements of Cash Flows that is most directly comparable to cash flows used in investing activities. We consider capital expenditures to be a useful measure of our investment in our existing asset base. Capital expenditures are also referred to as E&D capital. Reconciliation to the primary financial statement measures can be found below.
| ($M) | Q3 2022 | Q3 2021 | 2022 | 2021 |
| Drilling and development | 177,878 | 63,173 | 370,207 | 220,388 |
| Exploration and evaluation | 6,137 | 3,277 | 12,305 | 8,601 |
| Capital expenditures | 184,015 | 66,450 | 382,512 | 228,989 |
Cash dividends per share: A supplementary financial measure that represents cash dividends declared per share that is a useful measure of the dividends a common shareholder was entitled to during the period.
Covenants: The financial covenants on our revolving credit facility contain non-GAAP measures. The definitions for these financial covenants are included in Financial Position Review.
Diluted shares outstanding: The sum of shares outstanding at the period end plus outstanding awards under the VIP, based on current estimates of future performance factors and forfeiture rates.
| ('000s of shares) | Q3 2022 | Q3 2021 |
| Shares outstanding | 162,883 | 161,985 |
| Potential shares issuable pursuant to the VIP | 5,691 | 7,027 |
| Diluted shares outstanding | 168,574 | 169,012 |
Fund flows from operations: A total of segments measure most directly comparable to net earnings. FFO is comprised of sales excluding royalties, transportation, operating, G&A, corporate income tax, PRRT, interest expense, realized loss on derivatives, realized foreign exchange gain (loss), and realized other income. The measure is used to assess the contribution of each business unit to Vermilion's ability to generate income necessary to pay dividends, repay debt, fund asset retirement obligations and make capital investments. Reconciliation to the primary financial statement measures can be found below.
Vermilion Energy Inc. ■ Page 46 ■ 2022 Third Quarter Report |
| | Q3 2022 | Q3 2021 | YTD 2022 | YTD 2021 |
| | $M | $/boe | $M | $/boe | $M | $/boe | $M | $/boe |
| Sales | 964,678 | 127.39 | 538,530 | 68.19 | 2,633,701 | 114.76 | 1,313,846 | 56.58 |
| Royalties | (82,854) | (10.94) | (49,435) | (6.26) | (237,714) | (10.36) | (127,337) | (5.48) |
| Transportation | (19,498) | (2.57) | (19,273) | (2.44) | (56,920) | (2.48) | (58,128) | (2.50) |
| Operating | (125,987) | (16.64) | (104,355) | (13.21) | (352,787) | (15.37) | (300,333) | (12.93) |
| General and administration | (14,422) | (1.90) | (12,341) | (1.56) | (44,333) | (1.93) | (35,503) | (1.53) |
| Corporate income tax (expense) recovery | (51,022) | (6.74) | 1,414 | 0.18 | (166,195) | (7.24) | 2,068 | 0.09 |
| PRRT | (4,545) | (0.60) | (7,271) | (0.92) | (13,273) | (0.58) | (10,144) | (0.44) |
| Interest expense | (24,455) | (3.23) | (18,699) | (2.37) | (60,352) | (2.63) | (56,796) | (2.45) |
| Realized loss on derivatives | (137,953) | (18.22) | (72,579) | (9.19) | (361,954) | (15.77) | (137,786) | (5.93) |
| Realized foreign exchange (loss) gain | (2,103) | (0.28) | 2,921 | 0.37 | (3,650) | (0.16) | (4,218) | (0.18) |
| Realized other income | 6,037 | 0.80 | 3,784 | 0.48 | 14,122 | 0.62 | 12,020 | 0.52 |
| Fund flows from operations | 507,876 | 67.07 | 262,696 | 33.27 | 1,350,645 | 58.86 | 597,689 | 25.75 |
| Equity based compensation | (6,145) | | (7,823) | | (39,013) | | (34,899) | |
| Unrealized gain (loss) on derivative instruments (1) | 43,844 | | (279,393) | | (8,892) | | (353,359) | |
| Unrealized foreign exchange loss (1) | (44,929) | | (27,877) | | (37,059) | | (72,085) | |
| Accretion | (14,285) | | (11,199) | | (41,669) | | (32,569) | |
| Depletion and depreciation | (130,205) | | (167,808) | | (405,208) | | (423,472) | |
| Deferred tax (expense) recovery | (84,570) | | 62,245 | | (91,974) | | (172,509) | |
| Gain on business combinations | - | | - | | - | | 17,198 | |
| Impairment reversal | - | | 22,225 | | 192,094 | | 1,278,697 | |
| Unrealized other expense (1) | (507) | | (196) | | (1,270) | | (583) | |
| Net earnings (loss) | 271,079 | | (147,130) | | 917,654 | | 804,108 | |
| (1) | Unrealized gain (loss) on derivative instruments, Unrealized foreign exchange loss, and Unrealized other expense are line items from the respective Consolidated Statements of Cash Flows. |
Free cash flow: A non-GAAP financial measure comparable to cash flows from operating activities that is comprised of fund flows from operations less drilling and development costs and exploration and evaluation costs. The measure is used to determine the funding available for investing and financing activities including payment of dividends, repayment of long-term debt, reallocation into existing business units and deployment into new ventures. Reconciliation to the primary financial statement measures can be found below.
| ($M) | Q3 2022 | Q3 2021 | YTD 2022 | YTD 2021 |
| Cash flows from operating activities | 447,608 | 211,548 | 1,319,025 | 584,101 |
| Changes in non-cash operating working capital | 49,882 | 46,006 | 10,614 | (1,898) |
| Asset retirement obligations settled | 10,386 | 5,142 | 21,006 | 15,486 |
| Fund flows from operations | 507,876 | 262,696 | 1,350,645 | 597,689 |
| Drilling and development | (177,878) | (63,173) | (370,207) | (220,388) |
| Exploration and evaluation | (6,137) | (3,277) | (12,305) | (8,601) |
| Free cash flow | 323,861 | 196,246 | 968,133 | 368,700 |
Fund flows from operations per basic and diluted share: A supplementary financial measure, management assesses fund flows from operations on a per share basis as we believe this provides a measure of our operating performance after taking into account the issuance and potential future issuance of Vermilion common shares. Fund flows from operations per basic share is calculated by dividing fund flows from operations (total of segments measure) by the basic weighted average shares outstanding as defined under IFRS. Fund flows from operations per diluted share is calculated by dividing fund flows from operations by the sum of basic weighted average shares outstanding and incremental shares issuable under the equity based compensation plans as determined using the treasury stock method.
Net debt: A capital management measure in accordance with IAS 1 "Presentation of Financial Statements" that is most directly comparable to long-term debt. Net debt is comprised of long-term debt (excluding unrealized foreign exchange on swapped USD borrowings) plus adjusted working capital (defined as current assets less current liabilities, excluding current derivatives and current lease liabilities), and represents Vermilion's net financing obligations after adjusting for the timing of working capital fluctuations. Net debt excludes lease obligations which are secured by a corresponding right-of-use asset.
Vermilion Energy Inc. ■ Page 47 ■ 2022 Third Quarter Report |
Net debt to four quarter trailing fund flows from operations: A supplementary financial measure that is calculated as net debt (capital management measure) over the FFO (total of segments measure) from the preceding four quarters. The measure is used to assess the ability to repay debt.
Adjusted working capital: A non-GAAP financial measure defined as current assets less current liabilities, excluding current derivatives and current lease liabilities. The measure is used to calculate net debt, a capital management measure disclosed above.
| | As at |
| ($M) | Sep 30, 2022 | Dec 31, 2021 |
| Current assets | 598,541 | 472,845 |
| Current derivative asset | (46,185) | (19,321) |
| Current liabilities | (987,070) | (746,813) |
| Current lease liability | 17,774 | 15,032 |
| Current derivative liability | 394,728 | 268,973 |
| Adjusted working capital | (22,212) | (9,284) |
Operating netback: A supplementary financial measure most directly comparable to net earnings that is calculated as sales less royalties, operating expense, transportation costs, PRRT, and realized hedging gains and losses presented on a per unit basis. Management assesses operating netback as a measure of the profitability and efficiency of our field operations.
Fund flows from operations per boe: A supplementary financial measure calculated as FFO (total of segments measure) by boe production. Fund flows from operations netback is used by management to assess the profitability of our business units and Vermilion as a whole.
Payout and payout % of FFO: A non-GAAP financial measure and non-GAAP ratio respectively, most directly comparable to dividends declared. Payout is comprised of dividends declared plus drilling and development costs, exploration and evaluation costs, and asset retirement obligations settled, and payout % of FFO is calculated as payout over FFO (total of segments measure) . The measure is used to assess the amount of cash distributed back to shareholders and reinvested in the business for maintaining production and organic growth. The reconciliation of the measure to the primary financial statement measure can be found below.
| ($M) | Q3 2022 | Q3 2021 | YTD 2022 | YTD 2021 |
| Dividends declared | 13,031 | - | 32,711 | - |
| Drilling and development | 177,878 | 63,173 | 370,207 | 220,388 |
| Exploration and evaluation | 6,137 | 3,277 | 12,305 | 8,601 |
| Asset retirement obligations settled | 10,386 | 5,142 | 21,006 | 15,486 |
| Payout | 207,432 | 71,592 | 436,229 | 244,475 |
| % of fund flows from operations | 41 % | 27 % | 32 % | 41 % |
Return on capital employed (ROCE): A non-GAAP ratio, ROCE is a measure that we use to analyze our profitability and the efficiency of our capital allocation process; the comparable primary financial statement measure is earnings before income taxes. ROCE is calculated by dividing net earnings before interest and taxes ("EBIT") by average capital employed over the preceding twelve months. Capital employed is calculated as total assets less current liabilities while average capital employed is calculated using the balance sheets at the beginning and end of the twelve-month period.
| | Twelve Months Ended |
| ($M) | Sep 30, 2022 | Sep 30, 2021 |
| Net earnings | 1,262,242 | 746,401 |
| Taxes | 324,054 | 186,099 |
| Interest expense | 76,631 | 76,604 |
| EBIT | 1,662,927 | 1,009,104 |
| Average capital employed | 5,237,576 | 4,324,592 |
| Return on capital employed | 32 % | 23 % |
Vermilion Energy Inc. ■ Page 48 ■ 2022 Third Quarter Report |
Consolidated Interim Financial Statements
Consolidated Balance Sheet
thousands of Canadian dollars, unaudited
| | Note | September 30, 2022 | December 31, 2021 |
| Assets | | | |
| Current | | | |
| Cash and cash equivalents | | 7,813 | 6,028 |
| Accounts receivable | | 391,221 | 328,584 |
| Crude oil inventory | | 30,774 | 20,070 |
| Derivative instruments | | 46,185 | 19,321 |
| Prepaid expenses | | 122,548 | 98,842 |
| Total current assets | | 598,541 | 472,845 |
| | | | |
| Derivative instruments | | 60,314 | - |
| Investment in securities | 4 | 47,764 | - |
| Deferred taxes | | 255,973 | 374,993 |
| Exploration and evaluation assets | 3, 6 | 269,574 | 233,290 |
| Capital assets | 3, 5 | 5,376,400 | 4,824,195 |
| Total assets | | 6,608,566 | 5,905,323 |
| | | | |
| Liabilities | | | |
| Current | | | |
| Accounts payable and accrued liabilities | | 444,737 | 440,658 |
| Dividends payable | 10 | 13,031 | - |
| Derivative instruments | | 394,728 | 268,973 |
| Income taxes payable | | 134,574 | 37,182 |
| Total current liabilities | | 987,070 | 746,813 |
| | | | |
| Derivative instruments | | 21,867 | 51,213 |
| Long-term debt | 9 | 1,409,507 | 1,651,569 |
| Lease obligations | | 53,915 | 60,190 |
| Asset retirement obligations | 7 | 855,215 | 1,000,554 |
| Deferred taxes | | 391,061 | 328,839 |
| Total liabilities | | 3,718,635 | 3,839,178 |
| | | | |
| Shareholders' Equity | | | |
| Shareholders' capital | 10 | 4,239,408 | 4,241,773 |
| Contributed surplus | | 34,226 | 49,529 |
| Accumulated other comprehensive (loss) income | | (44) | 28,467 |
| Deficit | | (1,383,659) | (2,253,624) |
| Total shareholders' equity | | 2,889,931 | 2,066,145 |
| Total liabilities and shareholders' equity | | 6,608,566 | 5,905,323 |
Approved by the Board
| (Signed "Robert Michaleski”) | | (Signed “Manjit Sharma”) |
| | | |
| Robert Michaleski, Director | | Manjit Sharma, Director |
Vermilion Energy Inc. ■ Page 49 ■ 2022 Third Quarter Report |
Consolidated Statements of Net Earnings (Loss) and Comprehensive Income (Loss)
thousands of Canadian dollars, except share and per share amounts, unaudited
| | | Three Months Ended | Nine Months Ended |
| | Note | Sep 30, 2022 | Sep 30, 2021 | Sep 30, 2022 | Sep 30, 2021 |
| Revenue | | | | | |
| Petroleum and natural gas sales | | 964,678 | 538,530 | 2,633,701 | 1,313,846 |
| Royalties | | (82,854) | (49,435) | (237,714) | (127,337) |
| Sales of purchased commodities | | 83,460 | 35,540 | 194,619 | 109,155 |
| Petroleum and natural gas revenue | | 965,284 | 524,635 | 2,590,606 | 1,295,664 |
| | | | | | |
| Expenses | | | | | |
| Purchased commodities | | 83,460 | 35,540 | 194,619 | 109,155 |
| Operating | | 125,987 | 104,355 | 352,787 | 300,333 |
| Transportation | | 19,498 | 19,273 | 56,920 | 58,128 |
| Equity based compensation | | 6,145 | 7,823 | 39,013 | 34,899 |
| Loss on derivative instruments | | 94,109 | 351,972 | 370,846 | 491,145 |
| Interest expense | | 24,455 | 18,699 | 60,352 | 56,796 |
| General and administration | | 14,422 | 12,341 | 44,333 | 35,503 |
| Foreign exchange loss | | 47,032 | 24,956 | 40,709 | 76,303 |
| Other income | | (5,530) | (3,588) | (12,852) | (11,437) |
| Accretion | 7 | 14,285 | 11,199 | 41,669 | 32,569 |
| Depletion and depreciation | 5, 6 | 130,205 | 167,808 | 405,208 | 423,472 |
| Impairment reversal | 5 | - | (22,225) | (192,094) | (1,278,697) |
| Gain on business combinations | | - | - | - | (17,198) |
| | | 554,068 | 728,153 | 1,401,510 | 310,971 |
| Earnings (loss) before income taxes | | 411,216 | (203,518) | 1,189,096 | 984,693 |
| | | | | | |
| Income tax expense (recovery) | | | | | |
| Deferred | | 84,570 | (62,245) | 91,974 | 172,509 |
| Current | | 55,567 | 5,857 | 179,468 | 8,076 |
| | | 140,137 | (56,388) | 271,442 | 180,585 |
| | | | | | |
| Net earnings (loss) | | 271,079 | (147,130) | 917,654 | 804,108 |
| | | | | | |
| Other comprehensive income (loss) | | | | | |
| Currency translation adjustments | | 10,896 | 11,244 | (55,723) | (33,936) |
| Hedge accounting reserve | | 1,633 | 1,632 | 4,897 | 4,896 |
| Fair value adjustment on investment in securities, net of tax | 4 | 3,371 | - | 22,315 | - |
| Comprehensive income (loss) | | 286,979 | (134,254) | 889,143 | 775,068 |
| | | | | | |
| Net earnings (loss) per share | | | | | |
| Basic | | 1.65 | (0.91) | 5.61 | 5.00 |
| Diluted | | 1.61 | (0.91) | 5.44 | 4.91 |
| | | | | | |
| Weighted average shares outstanding ('000s) | | | | | |
| Basic | | 163,947 | 161,957 | 163,619 | 160,809 |
| Diluted | | 168,494 | 161,957 | 168,658 | 163,693 |
Vermilion Energy Inc. ■ Page 50 ■ 2022 Third Quarter Report |
Consolidated Statements of Cash Flows
thousands of Canadian dollars, unaudited
| | | Three Months Ended | Nine Months Ended |
| | Note | Sep 30, 2022 | Sep 30, 2021 | Sep 30, 2022 | Sep 30, 2021 |
| Operating | | | | | |
| Net earnings (loss) | | 271,079 | (147,130) | 917,654 | 804,108 |
| Adjustments: | | | | | |
| Accretion | 7 | 14,285 | 11,199 | 41,669 | 32,569 |
| Depletion and depreciation | 5, 6 | 130,205 | 167,808 | 405,208 | 423,472 |
| Impairment reversal | 5 | - | (22,225) | (192,094) | (1,278,697) |
| Gain on business combinations | | - | - | - | (17,198) |
| Unrealized (gain) loss on derivative instruments | | (43,844) | 279,393 | 8,892 | 353,359 |
| Equity based compensation | | 6,145 | 7,823 | 39,013 | 34,899 |
| Unrealized foreign exchange loss | | 44,929 | 27,877 | 37,059 | 72,085 |
| Unrealized other expense | | 507 | 196 | 1,270 | 583 |
| Deferred tax expense (recovery) | | 84,570 | (62,245) | 91,974 | 172,509 |
| Asset retirement obligations settled | 7 | (10,386) | (5,142) | (21,006) | (15,486) |
| Changes in non-cash operating working capital | | (49,882) | (46,006) | (10,614) | 1,898 |
| Cash flows from operating activities | | 447,608 | 211,548 | 1,319,025 | 584,101 |
| | | | | | |
| Investing | | | | | |
| Drilling and development | 5 | (177,878) | (63,173) | (370,207) | (220,388) |
| Exploration and evaluation | 6 | (6,137) | (3,277) | (12,305) | (8,601) |
| Acquisitions, net of cash acquired | 3, 5 | (2,203) | (92,191) | (506,715) | (104,780) |
| Acquisition of securities | 4 | (4,017) | - | (22,318) | - |
| Changes in non-cash investing working capital | | 21,960 | (4,289) | 20,306 | (1,058) |
| Cash flows used in investing activities | | (168,275) | (162,930) | (891,239) | (334,827) |
| | | | | | |
| Financing | | | | | |
| Repayments on the revolving credit facility | 9 | (186,822) | (42,646) | (819,922) | (238,137) |
| Issuance of senior unsecured notes | 9 | - | - | 499,037 | - |
| Payments on lease obligations | | (4,068) | (5,712) | (13,149) | (17,279) |
| Repurchase of shares | 10 | (71,659) | - | (71,659) | - |
| Cash dividends | 10 | (9,953) | - | (19,680) | - |
| Cash flows used in financing activities | | (272,502) | (48,358) | (425,373) | (255,416) |
| Foreign exchange gain (loss) on cash held in foreign currencies | | 307 | (260) | (628) | (762) |
| | | | | | |
| Net change in cash and cash equivalents | | 7,138 | - | 1,785 | (6,904) |
| Cash and cash equivalents, beginning of period | | 675 | - | 6,028 | 6,904 |
| Cash and cash equivalents, end of period | | 7,813 | - | 7,813 | - |
| | | | | | |
| Supplementary information for cash flows from operating activities | | | | | |
| Interest paid | | 19,432 | 24,479 | 49,457 | 61,405 |
| Income taxes paid (refunded) | | 57,885 | (2,291) | 82,076 | (9,025) |
Vermilion Energy Inc. ■ Page 51 ■ 2022 Third Quarter Report |
Consolidated Statements of Changes in Shareholders' Equity
thousands of Canadian dollars, unaudited
| | | Nine Months Ended |
| | Note | Sep 30, 2022 | Sep 30, 2021 |
| Shareholders' capital | 10 | | |
| Balance, beginning of period | | 4,241,773 | 4,181,160 |
| Vesting of equity based awards | | 41,193 | 45,051 |
| Equity based compensation | | 13,123 | 8,364 |
| Share-settled dividends on vested equity based awards | | 4,185 | 1,926 |
| Repurchase of shares | | (60,866) | - |
| Balance, end of period | | 4,239,408 | 4,236,501 |
| Contributed surplus | 10 | | |
| Balance, beginning of period | | 49,529 | 66,250 |
| Equity based compensation | | 25,890 | 26,535 |
| Vesting of equity based awards | | (41,193) | (45,051) |
| Balance, end of period | | 34,226 | 47,734 |
| Accumulated other comprehensive income | | | |
| Balance, beginning of period | | 28,467 | 77,986 |
| Currency translation adjustments | | (55,723) | (33,936) |
| Hedge accounting reserve | | 4,897 | 4,896 |
| Fair value adjustment on investment in securities, net of tax | 4 | 22,315 | - |
| Balance, end of period | | (44) | 48,946 |
| Deficit | | | |
| Balance, beginning of period | | (2,253,624) | (3,399,994) |
| Net earnings | | 917,654 | 804,108 |
| Dividends declared | | (32,711) | - |
| Share-settled dividends on vested equity based awards | | (4,185) | (1,926) |
| Repurchase of shares | 10 | (10,793) | - |
| Balance, end of period | | (1,383,659) | (2,597,812) |
| Total shareholders' equity | | 2,889,931 | 1,735,369 |
Vermilion Energy Inc. ■ Page 52 ■ 2022 Third Quarter Report |
Description of equity reserves
Shareholders’ capital
Represents the recognized amount for common shares issued (net of equity issuance costs and deferred taxes) less the weighted-average carrying value of shares repurchased. If the price paid to repurchase common shares is less than the carrying value of the shares repurchased, the difference is recorded to contributed surplus. If the price paid to repurchase common shares exceeds the carrying value of the shares repurchased, the difference is recorded as an increase to deficit.
Contributed surplus
Represents the recognized value of unvested equity based awards that will be settled in shares. Once vested, the value of the awards are transferred to shareholders’ capital.
Accumulated other comprehensive income
Represents currency translation adjustments, hedge accounting reserve and fair value adjustments on investments.
Currency translation adjustments result from translating the balance sheets of subsidiaries with a foreign functional currency to Canadian dollars at period-end rates. These amounts may be reclassified to net earnings if there is a disposal or partial disposal of a subsidiary.
The hedge accounting reserve represents the effective portion of the change in fair value related to cash flow and net investment hedges recognized in other comprehensive income, net of tax and reclassified to the consolidated statement of net earnings in the same period in which the transaction associated with the hedged item occurs. For the nine months ended September 30, 2022, accumulated losses of $3.7 million and $1.2 million were recognized in the consolidated statement of net earnings on the cash flow hedges and net investment hedges, respectively, and will be recognized in net earnings through 2025 when the senior unsecured notes mature.
Fair value adjustment on investment in securities, net of tax, are a result of changes in the fair value of investments that have been elected to be subsequently measured at fair value through other comprehensive income.
Deficit
Represents the cumulative net earnings less distributed earnings and surplus of the price paid to repurchase common shares of Vermilion Energy Inc. over the weighted-average carrying value of the shares repurchased.
Vermilion Energy Inc. ■ Page 53 ■ 2022 Third Quarter Report |
Notes to the Condensed Consolidated Interim Financial Statements for the three and nine months ended September 30, 2022 and 2021
tabular amounts in thousands of Canadian dollars, except share and per share amounts, unaudited
Vermilion Energy Inc. (the “Company” or “Vermilion”) is a corporation governed by the laws of the Province of Alberta and is actively engaged in the business of crude oil and natural gas exploration, development, acquisition, and production.
These condensed consolidated interim financial statements are in compliance with International Accounting Standard (“IAS”) 34, “Interim Financial Reporting”. These condensed consolidated interim financial statements have been prepared using the same accounting policies and methods of computation as Vermilion’s consolidated financial statements for the year ended December 31, 2021.
These condensed consolidated interim financial statements should be read in conjunction with Vermilion’s consolidated financial statements for the year ended December 31, 2021, which are contained within Vermilion’s Annual Report for the year ended December 31, 2021 and are available on SEDAR at www.sedar.com or on Vermilion’s website at www.vermilionenergy.com.
These condensed consolidated interim financial statements were approved and authorized for issuance by the Board of Directors of Vermilion on
November 9, 2022.
Vermilion Energy Inc. ■ Page 54 ■ 2022 Third Quarter Report |
| | Three Months Ended September 30, 2022 |
| | Canada | USA | France | Netherlands | Germany | Ireland | Australia | Corporate | Total |
| Drilling and development | 83,343 | 28,895 | 9,624 | 5,515 | 3,105 | 735 | 44,068 | 2,593 | 177,878 |
| Exploration and evaluation | - | - | - | 32 | 229 | - | - | 5,876 | 6,137 |
| | | | | | | | | | |
| Crude oil and condensate sales | 220,983 | 31,450 | 90,825 | 945 | 17,135 | - | 39,220 | - | 400,558 |
| NGL sales | 27,673 | 4,775 | - | - | - | - | - | - | 32,448 |
| Natural gas sales | 84,262 | 5,390 | - | 184,351 | 151,677 | 102,286 | - | 3,706 | 531,672 |
| Sales of purchased commodities | - | - | - | - | - | - | - | 83,460 | 83,460 |
| Royalties | (54,919) | (11,230) | (10,402) | - | (4,713) | - | - | (1,590) | (82,854) |
| Revenue from external customers | 277,999 | 30,385 | 80,423 | 185,296 | 164,099 | 102,286 | 39,220 | 85,576 | 965,284 |
| Purchased commodities | - | - | - | - | - | - | - | (83,460) | (83,460) |
| Transportation | (11,299) | (73) | (4,877) | - | (2,342) | (907) | - | - | (19,498) |
| Operating | (66,245) | (7,338) | (14,461) | (13,200) | (9,188) | (4,715) | (10,349) | (491) | (125,987) |
| General and administration | (6,719) | (1,159) | (3,837) | (564) | (1,386) | 68 | (1,063) | 238 | (14,422) |
| PRRT | - | - | - | - | - | - | (4,545) | - | (4,545) |
| Corporate income taxes | - | - | (8,190) | (26,897) | (18,646) | - | 2,865 | (154) | (51,022) |
| Interest expense | - | - | - | - | - | - | - | (24,455) | (24,455) |
| Realized loss on derivative instruments | - | - | - | - | - | - | - | (137,953) | (137,953) |
| Realized foreign exchange loss | - | - | - | - | - | - | - | (2,103) | (2,103) |
| Realized other income | - | - | - | - | - | - | - | 6,037 | 6,037 |
| Fund flows from operations | 193,736 | 21,815 | 49,058 | 144,635 | 132,537 | 96,732 | 26,128 | (156,765) | 507,876 |
| | | | | | | | | | |
| | Three Months Ended September 30, 2021 |
| | Canada | USA | France | Netherlands | Germany | Ireland | Australia | Corporate | Total |
| Drilling and development | 29,660 | 5,519 | 8,796 | 2,663 | 3,187 | 918 | 6,073 | 6,357 | 63,173 |
| Exploration and evaluation | - | - | 90 | 126 | 131 | - | - | 2,930 | 3,277 |
| | | | | | | | | | |
| Crude oil and condensate sales | 158,844 | 28,441 | 79,817 | 809 | 8,285 | - | 44,044 | - | 320,240 |
| NGL sales | 21,664 | 4,726 | - | - | - | - | - | - | 26,390 |
| Natural gas sales | 48,011 | 2,707 | - | 68,438 | 24,658 | 47,817 | - | 269 | 191,900 |
| Sales of purchased commodities | - | - | - | - | - | - | - | 35,540 | 35,540 |
| Royalties | (27,812) | (9,632) | (11,089) | (229) | (616) | - | - | (57) | (49,435) |
| Revenue from external customers | 200,707 | 26,242 | 68,728 | 69,018 | 32,327 | 47,817 | 44,044 | 35,752 | 524,635 |
| Purchased commodities | - | - | - | - | - | - | - | (35,540) | (35,540) |
| Transportation | (9,526) | (559) | (6,400) | - | (1,708) | (1,080) | - | - | (19,273) |
| Operating | (53,076) | (4,758) | (13,523) | (8,514) | (6,717) | (2,968) | (14,684) | (115) | (104,355) |
| General and administration | (4,735) | (1,351) | (2,917) | (155) | (1,163) | (306) | (875) | (839) | (12,341) |
| PRRT | - | - | - | - | - | - | (7,271) | - | (7,271) |
| Corporate income taxes | - | - | 12,403 | (10,624) | - | - | (89) | (276) | 1,414 |
| Interest expense | - | - | - | - | - | - | - | (18,699) | (18,699) |
| Realized loss on derivative instruments | - | - | - | - | - | - | - | (72,579) | (72,579) |
| Realized foreign exchange gain | - | - | - | - | - | - | - | 2,921 | 2,921 |
| Realized other income | - | - | - | - | - | - | - | 3,784 | 3,784 |
| Fund flows from operations | 133,370 | 19,574 | 58,291 | 49,725 | 22,739 | 43,463 | 21,125 | (85,591) | 262,696 |
Vermilion Energy Inc. ■ Page 55 ■ 2022 Third Quarter Report |
| | Nine Months Ended September 30, 2022 |
| | Canada | USA | France | Netherlands | Germany | Ireland | Australia | Corporate | Total |
| Total assets | 3,618,554 | 634,039 | 702,328 | 188,308 | 383,918 | 448,565 | 266,947 | 365,907 | 6,608,566 |
| Drilling and development | 163,720 | 60,944 | 28,546 | 7,732 | 15,243 | 1,707 | 89,420 | 2,895 | 370,207 |
| Exploration and evaluation | - | - | 2 | (312) | 825 | - | - | 11,790 | 12,305 |
| | | | | | | | | | |
| Crude oil and condensate sales | 697,481 | 95,364 | 287,521 | 2,148 | 44,311 | - | 125,767 | - | 1,252,592 |
| NGL sales | 92,085 | 13,889 | - | - | - | - | - | - | 105,974 |
| Natural gas sales | 238,821 | 12,582 | - | 441,041 | 315,938 | 259,592 | - | 7,161 | 1,275,135 |
| Sales of purchased commodities | - | - | - | - | - | - | - | 194,619 | 194,619 |
| Royalties | (157,258) | (32,229) | (31,059) | - | (14,829) | - | - | (2,339) | (237,714) |
| Revenue from external customers | 871,129 | 89,606 | 256,462 | 443,189 | 345,420 | 259,592 | 125,767 | 199,441 | 2,590,606 |
| Purchased commodities | - | - | - | - | - | - | - | (194,619) | (194,619) |
| Transportation | (31,930) | (523) | (15,511) | - | (6,130) | (2,826) | - | - | (56,920) |
| Operating | (177,594) | (17,983) | (44,950) | (34,674) | (28,231) | (11,893) | (36,187) | (1,275) | (352,787) |
| General and administration | (21,982) | (3,589) | (11,411) | (2,239) | (3,977) | 435 | (2,964) | 1,394 | (44,333) |
| PRRT | - | - | - | - | - | - | (13,273) | - | (13,273) |
| Corporate income taxes | - | - | (24,881) | (114,111) | (29,554) | - | 2,650 | (299) | (166,195) |
| Interest expense | - | - | - | - | - | - | - | (60,352) | (60,352) |
| Realized loss on derivative instruments | - | - | - | - | - | - | - | (361,954) | (361,954) |
| Realized foreign exchange loss | - | - | - | - | - | - | - | (3,650) | (3,650) |
| Realized other income | - | - | - | - | - | - | - | 14,122 | 14,122 |
| Fund flows from operations | 639,623 | 67,511 | 159,709 | 292,165 | 277,528 | 245,308 | 75,993 | (407,192) | 1,350,645 |
| | | | | | | | | | |
| | Nine Months Ended September 30, 2021 |
| | Canada | USA | France | Netherlands | Germany | Ireland | Australia | Corporate | Total |
| Total assets | 2,465,914 | 549,544 | 729,967 | 222,391 | 340,784 | 441,573 | 229,155 | 770,305 | 5,749,633 |
| Drilling and development | 104,191 | 28,948 | 24,566 | 14,535 | 8,608 | 1,156 | 26,030 | 12,354 | 220,388 |
| Exploration and evaluation | - | - | 112 | 70 | 816 | - | - | 7,603 | 8,601 |
| | | | | | | | | | |
| Crude oil and condensate sales | 444,677 | 56,597 | 199,454 | 1,729 | 20,461 | 23 | 102,682 | - | 825,623 |
| NGL sales | 57,120 | 10,744 | - | - | - | - | - | - | 67,864 |
| Natural gas sales | 129,378 | 10,620 | - | 128,624 | 45,851 | 105,050 | - | 836 | 420,359 |
| Sales of purchased commodities | - | - | - | - | - | - | - | 109,155 | 109,155 |
| Royalties | (76,587) | (20,692) | (27,492) | (454) | (1,938) | - | - | (174) | (127,337) |
| Revenue from external customers | 554,588 | 57,269 | 171,962 | 129,899 | 64,374 | 105,073 | 102,682 | 109,817 | 1,295,664 |
| Purchased commodities | - | - | - | - | - | - | - | (109,155) | (109,155) |
| Transportation | (29,630) | (1,023) | (19,923) | - | (4,283) | (3,269) | - | - | (58,128) |
| Operating | (160,683) | (12,262) | (37,905) | (23,820) | (19,826) | (10,782) | (34,830) | (225) | (300,333) |
| General and administration | (15,147) | (2,974) | (8,547) | (532) | (3,744) | 381 | (2,354) | (2,586) | (35,503) |
| PRRT | - | - | - | - | - | - | (10,144) | - | (10,144) |
| Corporate income taxes | - | - | 12,402 | (12,986) | - | - | 3,341 | (689) | 2,068 |
| Interest expense | - | - | - | - | - | - | - | (56,796) | (56,796) |
| Realized loss on derivative instruments | - | - | - | - | - | - | - | (137,786) | (137,786) |
| Realized foreign exchange loss | - | - | - | - | - | - | - | (4,218) | (4,218) |
| Realized other income | - | - | - | - | - | - | - | 12,020 | 12,020 |
| Fund flows from operations | 349,128 | 41,010 | 117,989 | 92,561 | 36,521 | 91,403 | 58,695 | (189,618) | 597,689 |
Vermilion Energy Inc. ■ Page 56 ■ 2022 Third Quarter Report |
Reconciliation of fund flows from operations to net earnings (loss):
| | Three Months Ended | Nine Months Ended |
| | Sep 30, 2022 | Sep 30, 2021 | Sep 30, 2022 | Sep 30, 2021 |
| Fund flows from operations | 507,876 | 262,696 | 1,350,645 | 597,689 |
| Equity based compensation | (6,145) | (7,823) | (39,013) | (34,899) |
| Unrealized gain (loss) on derivative instruments | 43,844 | (279,393) | (8,892) | (353,359) |
| Unrealized foreign exchange loss | (44,929) | (27,877) | (37,059) | (72,085) |
| Accretion | (14,285) | (11,199) | (41,669) | (32,569) |
| Depletion and depreciation | (130,205) | (167,808) | (405,208) | (423,472) |
| Deferred tax (expense) recovery | (84,570) | 62,245 | (91,974) | (172,509) |
| Gain on business combinations | - | - | - | 17,198 |
| Impairment reversal | - | 22,225 | 192,094 | 1,278,697 |
| Unrealized other expense | (507) | (196) | (1,270) | (583) |
| Net earnings (loss) | 271,079 | (147,130) | 917,654 | 804,108 |
Leucrotta Exploration Inc.
On May 31, 2022, Vermilion closed the acquisition of all outstanding common shares of Leucrotta Exploration Inc. (“Leucrotta”), a Canadian publicly listed, Montney-focused oil and natural gas exploration and development company. The primary asset acquired is the Mica property, comprised of 81,000 gross (77,000 net) contiguous acres of Montney mineral rights in the Peace River Arch straddling the Alberta and British Columbia borders.
Prior to May 31, 2022, Vermilion controlled 7,536,800 common shares of Leucrotta. On May 31, 2022, Vermilion transferred consideration and assumed ownership of all remaining outstanding common shares of Leucrotta. The acquisition was funded through Vermilion’s revolving credit facility.
The total consideration and the fair value of the assets acquired and liabilities assumed at the date of acquisition are detailed in the table below:
| | Consideration |
| Cash consideration paid | 486,488 |
| Fair value of previously held equity interest | 13,039 |
| Total consideration | 499,527 |
| | |
| | Allocation of consideration |
| Cash acquired | 2,659 |
| Capital assets | 559,094 |
| Exploration and evaluation assets | 43,227 |
| Deferred tax liabilities | (97,891) |
| Asset retirement obligations | (1,440) |
| Derivative liability | (339) |
| Acquired working capital deficiency | (5,783) |
| Net assets acquired | 499,527 |
The results of operations from the assets acquired and liabilities assumed have been included in Vermilion’s consolidated financial statements beginning May 31, 2022 and have contributed revenues of $26.9 million and net earnings of $8.2 million. Had the acquisition occurred on January 1, 2022, consolidated petroleum and natural gas revenue would have been $2,605.6 million and consolidated net earnings would have been $926.6 million for the nine months ended September 30, 2022.
Vermilion Energy Inc. ■ Page 57 ■ 2022 Third Quarter Report |
| 4. Investment in securities |
Vermilion holds investments in Coelacanth Energy Inc., a Montney-focused oil and natural gas exploration and development company listed on the TSX Venture exchange. Vermilion has acquired shares via a private placement concurrent with the closing of the purchase of Leucrotta and via open market purchases. Vermilion has made an optional election to subsequently measure the investment at fair value through other comprehensive income. The investment is classified as a level 1 instrument on the fair value hierarchy and therefore uses observable inputs when making fair value adjustments.
The total consideration paid and the fair value of the investment acquired are detailed in the table below:
| | Amount |
| Balance at January 1 | - |
| Acquisition of securities | 22,318 |
| Fair value adjustment | 25,446 |
| Balance at September 30 | 47,764 |
The following table reconciles the change in Vermilion's capital assets:
| | 2022 |
| Balance at January 1 | 4,824,195 |
| Acquisitions | 568,941 |
| Additions | 370,207 |
| Increase in right-of-use assets | 11,098 |
| Impairment reversal | 192,094 |
| Depletion and depreciation | (399,078) |
| Changes in asset retirement obligations | (124,180) |
| Foreign exchange | (66,877) |
| Balance at September 30 | 5,376,400 |
In the first quarter of 2022, indicators of impairment reversal were present in our Canada - Saskatchewan and France - Neocomian cash generating units ("CGUs") due to an increase and stabilization in forecast oil prices. As a result of the indicators of impairment reversal, the Company performed impairment reversal calculations on the identified CGUs and the recoverable amounts were determined using fair value less costs to sell, which considered future after-tax cash flows from proved plus probable reserves and an after-tax discount rate of 12.0%. Based on the results of the impairment reversal calculations completed, recoverable amounts were determined to be greater than the carrying values of the CGUs tested and $144.4 million (net of $47.7 million deferred income tax expense) of impairment reversal was recorded. Inputs used in the measurement of capital assets are not based on observable market data and fall within level 3 of the fair value hierarchy.
The following benchmark price forecasts were used to calculate the recoverable amounts:
| | 2022 | 2023 | 2024 | 2025 | 2026 | 2027 | 2028 | 2029 | 2030 | 2031 (2) |
| Brent Crude ($ US/bbl) (1) | 100.50 | 89.50 | 79.64 | 81.23 | 82.86 | 84.51 | 86.21 | 87.94 | 89.69 | 91.48 |
| WTI Crude ($ US/bbl) (1) | 95.00 | 85.00 | 75.64 | 77.15 | 78.70 | 80.27 | 81.88 | 83.52 | 85.19 | 86.89 |
| Exchange rate (CAD/USD) | 0.80 | 0.80 | 0.80 | 0.80 | 0.80 | 0.80 | 0.80 | 0.80 | 0.80 | 0.80 |
(1) The forecast benchmark prices listed are adjusted for quality differentials, heat content, transportation and marketing costs and other factors specific to the Company’s operations when determining recoverable amounts.
(2) In 2032 and beyond, commodity price forecasts are inflated at a rate of 2.0% per annum. In 2032 and beyond there is no escalation of exchange rates.
Vermilion Energy Inc. ■ Page 58 ■ 2022 Third Quarter Report |
The following are the results of tests completed, recoverable amounts, and sensitivity impacts which would decrease impairment reversals taken:
| Operating Segment | CGU | Impairment Reversal (1) | Recoverable Amount | 1% increase in discount rate | 5% decrease in pricing |
| Canada | Saskatchewan | 159,985 | 2,150,936 | - | - |
| France | Neocomian | 32,109 | 166,818 | - | - |
| Total | | 192,094 | 2,317,754 | - | - |
(1) Impairment reversals are subject to the lower of the recoverable amount and the carrying value, which includes depletion and depreciation of the CGU had no impairment charges been previously taken.
6. Exploration and evaluation assets |
The following table reconciles the change in Vermilion's exploration and evaluation assets:
| | 2022 |
| Balance at January 1 | 233,290 |
| Acquisitions | 43,227 |
| Additions | 12,305 |
| Changes in asset retirement obligations | (2) |
| Depreciation | (11,099) |
| Foreign exchange | (8,147) |
| Balance at September 30 | 269,574 |
| 7. Asset retirement obligations |
The following table reconciles the change in Vermilion’s asset retirement obligations:
| | 2022 |
| Balance at January 1 | 1,000,554 |
| Additional obligations recognized | 4,536 |
| Obligations settled | (21,006) |
| Accretion | 41,669 |
| Changes in rates | (127,278) |
| Foreign exchange | (43,260) |
| Balance at September 30 | 855,215 |
Vermilion calculated the present value of the obligations using a credit-adjusted risk-free rate, calculated using a credit spread of 4.5% as at September 30, 2022 (December 31, 2021 - 4.9%) added to risk-free rates based on long-term, risk-free government bonds. Vermilion's credit spread is determined using the Company's expected cost of borrowing at the end of the reporting period.
The country-specific risk-free rates used as inputs to discount the obligations were as follows:
| | Sep 30, 2022 | Dec 31, 2021 |
| Canada | 3.1 % | 1.8 % |
| United States | 3.9 % | 1.9 % |
| France | 3.0 % | 0.8 % |
| Netherlands | 2.2 % | (0.3) % |
| Germany | 2.1 % | 0.1 % |
| Ireland | 2.9 % | 0.5 % |
| Australia | 4.0 % | 1.9 % |
Current cost estimates are inflated to the estimated time of abandonment using inflation rates of between 1.5% and 4.2% (as at December 31, 2021 - between 1.1% and 3.1%).
Vermilion Energy Inc. ■ Page 59 ■ 2022 Third Quarter Report |
Vermilion defines capital as net debt and shareholders' capital. Net debt consists of long-term debt (excluding unrealized foreign exchange on swapped USD borrowings) plus adjusted working capital (defined as current assets less current liabilities, excluding current derivatives and current lease liabilities). In managing capital, Vermilion reviews whether fund flows from operations is sufficient to fund capital expenditures, dividends, and asset retirement obligations.
The following table calculates Vermilion’s ratio of net debt to four quarter trailing fund flows from operations:
| | Sep 30, 2022 | Dec 31, 2021 |
| Long-term debt | 1,409,507 | 1,651,569 |
| Adjusted working capital deficit (1) | 22,212 | 9,284 |
| Unrealized FX on swapped USD borrowings | (19,667) | (16,067) |
| Net debt | 1,412,052 | 1,644,786 |
| | | |
| Ratio of net debt to four quarter trailing fund flows from operations | 0.8 | 1.8 |
(1) Adjusted working capital is defined as current assets (excluding current derivatives), less current liabilities (excluding current derivatives and current lease liabilities)
The following table summarizes Vermilion’s outstanding long-term debt:
| | As at |
| | Sep 30, 2022 | Dec 31, 2021 |
| Revolving credit facility | 465,153 | 1,273,755 |
| 2025 senior unsecured notes | 409,118 | 377,814 |
| 2030 senior unsecured notes | 535,236 | - |
| Long-term debt | 1,409,507 | 1,651,569 |
The fair value of the revolving credit facility is equal to its carrying value due to the use of short-term borrowing instruments at market rates of interest. The fair value of the 2025 senior unsecured notes as at September 30, 2022 was $388.5 million (December 31, 2021 - $387.0 million). The fair value of the 2030 senior unsecured notes as at September 30, 2022 was $502.8 million (December 31, 2021 - nil).
The following table reconciles the change in Vermilion’s long-term debt:
| | 2022 |
| Balance at January 1 | 1,651,569 |
| Repayments on the revolving credit facility | (819,922) |
| Issuance of 2030 senior unsecured notes | 499,037 |
| Amortization of transaction costs | 1,270 |
| Foreign exchange | 77,553 |
| Balance at September 30 | 1,409,507 |
Revolving credit facility
As at September 30, 2022, Vermilion had in place a bank revolving credit facility maturing May 29, 2026 with the following terms:
| | As at |
| | Sep 30, 2022 | Dec 31, 2021 |
| Total facility amount | 1,600,000 | 2,100,000 |
| Amount drawn | (465,153) | (1,273,755) |
| Letters of credit outstanding | (13,352) | (11,035) |
| Unutilized capacity | 1,121,495 | 815,210 |
Vermilion Energy Inc. ■ Page 60 ■ 2022 Third Quarter Report |
The facility can be extended from time to time at the option of the lenders and upon notice from Vermilion. If no extension is granted by the lenders, the amounts owing pursuant to the facility are due at the maturity date. The facility is secured by various fixed and floating charges against the subsidiaries of Vermilion. On April 26, 2022, contemporaneous with the issuance of the 2030 senior unsecured notes and at Vermilion's election, the maturity date of the facility was extended to May 29, 2026 (previously May 31, 2024) and the total facility amount was reduced to $1.6 billion (previously $2.1 billion).
The facility bears interest at a rate applicable to demand loans plus applicable margins.
As at September 30, 2022, the revolving credit facility was subject to the following financial covenants:
| | | As at |
| Financial covenant | Limit | Sep 30, 2022 | Dec 31, 2021 |
| Consolidated total debt to consolidated EBITDA | Less than 4.0 | 0.72 | 1.61 |
| Consolidated total senior debt to consolidated EBITDA | Less than 3.5 | 0.23 | 1.24 |
| Consolidated EBITDA to consolidated interest expense | Greater than 2.5 | 26.65 | 14.78 |
The financial covenants include financial measures defined within the revolving credit facility agreement that are not defined under IFRS. These financial measures are defined by the revolving credit facility agreement as follows:
| • | Consolidated total debt: Includes all amounts classified as “Long-term debt” and “Lease obligations” (including the current portion included within "Accounts payable and accrued liabilities" but excluding operating leases as defined under IAS 17) on the consolidated balance sheet. |
| • | Consolidated total senior debt: Consolidated total debt excluding unsecured and subordinated debt. |
| • | Consolidated EBITDA: Consolidated net earnings before interest, income taxes, depreciation, accretion and certain other non-cash items, adjusted for the impact of the acquisition of a material subsidiary. |
| • | Consolidated total interest expense: Includes all amounts classified as "Interest expense", but excludes interest on operating leases as defined under IAS 17. |
In addition, our revolving credit facility has provisions relating to our liability management ratings in Alberta and Saskatchewan whereby if our security adjusted liability management ratings fall below specified limits in a province, a portion of the asset retirement obligations are included in the definitions of consolidated total debt and consolidated total senior debt. An event of default occurs if our security adjusted liability management ratings breach additional lower limits for a period greater than 90 days. As of September 30, 2022, Vermilion's liability management ratings were higher than the specified levels, and as such, no amounts relating to asset retirement obligations were included in the calculation of consolidated total debt and consolidated total senior debt.
As at September 30, 2022 and December 31, 2021, Vermilion was in compliance with the above covenants.
2025 senior unsecured notes
On March 13, 2017, Vermilion issued US $300.0 million of senior unsecured notes at par. The notes bear interest at a rate of 5.625% per annum, to be paid semi-annually on March 15 and September 15. The notes mature on March 15, 2025. As direct senior unsecured obligations of Vermilion, the notes rank equally with existing and future senior unsecured indebtedness of the Company.
The senior unsecured notes were recognized at amortized cost and include the transaction costs directly related to the issuance.
Vermilion may redeem some or all of the senior unsecured notes at the redemption prices set forth in the following table plus any accrued and unpaid interest, if redeemed during the twelve-month period beginning on March 15 of each of the years indicated below:
| Year | Redemption price |
| 2022 | 101.406 % |
| 2023 and thereafter | 100.000 % |
Vermilion Energy Inc. ■ Page 61 ■ 2022 Third Quarter Report |
2030 senior unsecured notes
On April 26, 2022, Vermilion closed a private offering of US $400.0 million 8-year senior unsecured notes. The notes were priced at 99.241% of par, mature on May 1, 2030, and bear interest at a rate of 6.875% per annum. Interest is to be paid semi-annually on May 1 and November 1, commencing on November 1, 2022. The notes are senior unsecured obligations of Vermilion and rank equally with existing and future senior unsecured indebtedness.
The senior unsecured notes were recognized at amortized cost and include the transaction costs directly related to the issuance.
Vermilion may, at its option, redeem the notes prior to maturity as follows:
| • | On or after May 1, 2025, Vermilion may redeem some or all of the senior unsecured notes at the redemption prices set forth below, together with accrued and unpaid interest. |
| • | Prior to May 1, 2025, Vermilion may redeem up to 35% of the original principal amount of the notes with an amount of cash not greater than the net cash proceeds of certain equity offerings at a redemption price of 106.875% of the principal amount of the notes, together with accrued and unpaid interest. |
| • | Prior to May 1, 2025, Vermilion may also redeem some or all of the notes at a price equal to 100% of the principal amount of the notes, plus a “make-whole premium,” together with applicable premium, accrued and unpaid interest. |
| Year | Redemption price |
| 2025 | 103.438 % |
| 2026 | 102.292 % |
| 2027 | 101.146 % |
| 2028 and thereafter | 100.000 % |
| 10. Shareholders' capital |
The following table reconciles the change in Vermilion’s shareholders’ capital:
| | 2022 |
| Shareholders’ Capital | Shares ('000s) | Amount |
| Balance at January 1 | 162,261 | 4,241,773 |
| Vesting of equity based awards | 2,270 | 41,193 |
| Shares issued for equity based compensation | 526 | 13,123 |
| Share-settled dividends on vested equity based awards | 165 | 4,185 |
| Repurchase of shares | (2,339) | (60,866) |
| Balance at September 30 | 162,883 | 4,239,408 |
Dividends are approved by the Board of Directors and are paid quarterly. Dividends declared to shareholders for the nine months ended September 30, 2022 were $32.7 million or $0.20 per common share (2021 - nil).
On July 4, 2022, the Toronto Stock Exchange approved our notice of intention to commence a normal course issuer bid ("the NCIB"). The NCIB allows Vermilion to purchase up to 16,076,666 common shares (representing approximately 10% of outstanding common shares) beginning July 6, 2022 and ending July 5, 2023. Common shares purchased under the NCIB will be cancelled.
In the third quarter of 2022, Vermilion purchased 2.34 million common shares under the NCIB for total consideration of $71.7 million. The common shares purchased under the NCIB were cancelled. The surplus between the total consideration and the carrying value of the shares repurchased was recorded as an increase to deficit.
Vermilion Energy Inc. ■ Page 62 ■ 2022 Third Quarter Report |
| 11. Financial instruments |
The following table summarizes the increase (positive values) or decrease (negative values) to net earnings before tax due to a change in the value of Vermilion’s financial instruments as a result of a change in the relevant market risk variable. This analysis does not attempt to reflect any interdependencies between the relevant risk variables.
| | Sep 30, 2022 |
| Currency risk - Euro to Canadian dollar | |
| $0.01 increase in strength of the Canadian dollar against the Euro | 7,294 |
| $0.01 decrease in strength of the Canadian dollar against the Euro | (7,294) |
| | |
| Currency risk - US dollar to Canadian dollar | |
| $0.01 increase in strength of the Canadian dollar against the US $ | 5,571 |
| $0.01 decrease in strength of the Canadian dollar against the US $ | (5,571) |
| | |
| Commodity price risk - Crude oil | |
| US $5.00/bbl increase in crude oil price used to determine the fair value of derivatives | (3,807) |
| US $5.00/bbl decrease in crude oil price used to determine the fair value of derivatives | 1,189 |
| | |
| Commodity price risk - European natural gas | |
| #eu#5.0/GJ increase in European natural gas price used to determine the fair value of derivatives | (54,061) |
| #eu#5.0/GJ decrease in European natural gas price used to determine the fair value of derivatives | 53,808 |
Vermilion Energy Inc. ■ Page 63 ■ 2022 Third Quarter Report |
DIRECTORS Robert Michaleski 1,3,5 Calgary, Alberta James J. Kleckner Jr. 7,9 Edwards, Colorado Carin Knickel 4,7,11 Golden, Colorado Stephen P. Larke 3,5,10 Calgary, Alberta Timothy R. Marchant 6,9,11 Calgary, Alberta William Roby 7,8,11 Katy, Texas Manjit Sharma 2,5 Toronto, Ontario Myron Stadnyk 7,9 Calgary, Alberta Judy Steele 3,5,11 Halifax, Nova Scotia 1 Chairman 2 Audit Committee Chair (Independent) 3 Audit Committee Member 4 Governance and Human Resources Committee Chair __(Independent) 5 Governance and Human Resources Committee Member 6 Health, Safety and Environment Committee Chair __(Independent) 7 Health, Safety and Environment Committee Member 8 Independent Reserves Committee Chair (Independent) 9 Independent Reserves Committee Member 10 Sustainability Committee Chair (Independent) 11 Sustainability Committee Member | OFFICERS / CORPORATE SECRETARY Dion Hatcher * President Lars Glemser * Vice President & Chief Financial Officer Terry Hergott Vice President Marketing Yvonne Jeffery Vice President Sustainability Darcy Kerwin * Vice President International & HSE Bryce Kremnica * Vice President North America Geoff MacDonald Vice President Geosciences Kyle Preston Vice President Investor Relations Averyl Schraven Vice President People and Culture Jenson Tan * Vice President Business Development Gerard Schut * Vice President European Operations Robert (Bob) J. Engbloom Corporate Secretary * Executive Committee | AUDITORS Deloitte LLP Calgary, Alberta BANKERS The Toronto-Dominion Bank Alberta Treasury Branches Bank of America N.A., Canada Branch Canadian Imperial Bank of Commerce Export Development Canada National Bank of Canada Royal Bank of Canada The Bank of Nova Scotia Wells Fargo Bank N.A., Canadian Branch La Caisse Centrale Desjardins du Québec Citibank N.A., Canadian Branch - Citibank Canada Canadian Western Bank JPMorgan Chase Bank, N.A., Toronto Branch Goldman Sachs Lending Partners LLC EVALUATION ENGINEERS GLJ Petroleum Consultants Ltd. Calgary, Alberta LEGAL COUNSEL Norton Rose Fulbright Canada LLP Calgary, Alberta TRANSFER AGENT Odyssey Trust Company STOCK EXCHANGE LISTINGS The Toronto Stock Exchange (“VET”) The New York Stock Exchange (“VET”) INVESTOR RELATIONS Kyle Preston Vice President Investor Relations 403-476-8431 TEL 403-476-8100 FAX 1-866-895-8101 IR TOLL FREE investor_relations@vermilionenergy.com |
Vermilion Energy Inc. ■ Page 64 ■ 2022 Third Quarter Report |