Exhibit 99.1
Disclaimer
Certain statements included or incorporated by reference in this document may constitute forward-looking statements or information under applicable securities legislation. Such forward-looking statements or information typically contain statements with words such as "anticipate", "believe", "expect", "plan", "intend", "estimate", "propose", or similar words suggesting future outcomes or statements regarding an outlook. Forward looking statements or information in this document may include, but are not limited to: capital expenditures and Vermilion’s ability to fund such expenditures; Vermilion’s additional debt capacity providing it with additional working capital; statements regarding the return of capital; the flexibility of Vermilion’s capital program and operations; business strategies and objectives; operational and financial performance; petroleum and natural gas sales; future production levels and the timing thereof, including Vermilion’s 2023 guidance, and rates of average annual production growth; the effect of changes in crude oil and natural gas prices, changes in exchange and inflation rates; significant declines in production or sales volumes due to unforeseen circumstances; the effect of possible changes in critical accounting estimates; statements regarding the growth and size of Vermilion’s future project inventory, wells expected to be drilled in 2023; exploration and development plans and the timing thereof; Vermilion’s ability to reduce its debt; statements regarding Vermilion’s hedging program, its plans to add to its hedging positions, and the anticipated impact of Vermilion’s hedging program on project economics and free cash flows; the potential financial impact of climate-related risks; acquisition and disposition plans and the timing thereof; operating and other expenses, including the payment and amount of future dividends; royalty and income tax rates and Vermilion’s expectations regarding future taxes and taxability; and the timing of regulatory proceedings and approvals.
Such forward looking statements or information are based on a number of assumptions, all or any of which may prove to be incorrect. In addition to any other assumptions identified in this document, assumptions have been made regarding, among other things: the ability of Vermilion to obtain equipment, services and supplies in a timely manner to carry out its activities in Canada and internationally; the ability of Vermilion to market crude oil, natural gas liquids, and natural gas successfully to current and new customers; the timing and costs of pipeline and storage facility construction and expansion and the ability to secure adequate product transportation; the timely receipt of required regulatory approvals; the ability of Vermilion to obtain financing on acceptable terms; foreign currency exchange rates and interest rates; future crude oil, natural gas liquids, and natural gas prices; and management’s expectations relating to the timing and results of exploration and development activities.
Although Vermilion believes that the expectations reflected in such forward looking statements or information are reasonable, undue reliance should not be placed on forward looking statements because Vermilion can give no assurance that such expectations will prove to be correct. Financial outlooks are provided for the purpose of understanding Vermilion’s financial position and business objectives, and the information may not be appropriate for other purposes. Forward looking statements or information are based on current expectations, estimates, and projections that involve a number of risks and uncertainties which could cause actual results to differ materially from those anticipated by Vermilion and described in the forward looking statements or information. These risks and uncertainties include, but are not limited to: the ability of management to execute its business plan; the risks of the oil and gas industry, both domestically and internationally, such as operational risks in exploring for, developing and producing crude oil, natural gas liquids, and natural gas; risks and uncertainties involving geology of crude oil, natural gas liquids, and natural gas deposits; risks inherent in Vermilion's marketing operations, including credit risk; the uncertainty of reserves estimates and reserves life and estimates of resources and associated expenditures; the uncertainty of estimates and projections relating to production and associated expenditures; potential delays or changes in plans with respect to exploration or development projects; Vermilion's ability to enter into or renew leases on acceptable terms; fluctuations in crude oil, natural gas liquids, and natural gas prices, foreign currency exchange rates, interest rates and inflation; health, safety, and environmental risks; uncertainties as to the availability and cost of financing; the ability of Vermilion to add production and reserves through exploration and development activities; the possibility that government policies or laws may change or governmental approvals may be delayed or withheld; uncertainty in amounts and timing of royalty payments; risks associated with existing and potential future law suits and regulatory actions against or involving Vermilion; and other risks and uncertainties described elsewhere in this document or in Vermilion's other filings with Canadian securities regulatory authorities.
This document contains references to sustainability/ESG data and performance that reflect metrics and concepts that are commonly used in such frameworks as the Global Reporting Initiative, the Task Force on Climate-related Financial Disclosures, and the Sustainability Accounting Standards Board. Vermilion has used best efforts to align with the most commonly accepted methodologies for ESG reporting, including with respect to climate data and information on potential future risks and opportunities, in order to provide a fuller context for our current and future operations. However, these methodologies are not yet standardized, are frequently based on calculation factors that change over time, and continue to evolve rapidly. Readers are particularly cautioned to evaluate the underlying definitions and measures used by other companies, as these may not be comparable to Vermilion’s. While Vermilion will continue to monitor and adapt its reporting accordingly, the Company is not under any duty to update or revise the related sustainability/ESG data or statements except as required by applicable securities laws.
The forward looking statements or information contained in this document are made as of the date hereof and Vermilion undertakes no obligation to update publicly or revise any forward looking statements or information, whether as a result of new information, future events, or otherwise, unless required by applicable securities laws.
| | | |
| | Vermilion Energy Inc. ■ Page 1 ■ 2023 Second Quarter Report | |
This document contains metrics commonly used in the oil and gas industry. These oil and gas metrics do not have any standardized meaning or standard methods of calculation and therefore may not be comparable to similar measures presented by other companies where similar terminology is used and should therefore not be used to make comparisons. Natural gas volumes have been converted on the basis of six thousand cubic feet of natural gas to one barrel of oil equivalent. Barrels of oil equivalent (boe) may be misleading, particularly if used in isolation. A boe conversion ratio of six thousand cubic feet to one barrel of oil is based on an energy equivalency conversion method primarily applicable at the burner tip and does not represent a value equivalency at the wellhead.
Financial data contained within this document are reported in Canadian dollars, unless otherwise stated.
| | | |
| | Vermilion Energy Inc. ■ Page 2 ■ 2023 Second Quarter Report | |
Abbreviations
| $M | thousand dollars |
| $MM | million dollars |
| AECO | the daily average benchmark price for natural gas at the AECO ‘C’ hub in Alberta |
| bbl(s) | barrel(s) |
| bbls/d | barrels per day |
| boe | barrel of oil equivalent, including: crude oil, condensate, natural gas liquids, and natural gas (converted on the basis of one boe for six mcf of natural gas) |
| boe/d | barrel of oil equivalent per day |
| GJ | gigajoules |
| LSB | light sour blend crude oil reference price |
| mbbls | thousand barrels |
| mcf | thousand cubic feet |
| mmcf/d | million cubic feet per day |
| NBP | the reference price paid for natural gas in the United Kingdom at the National Balancing Point Virtual Trading Point |
| NCIB | normal-course issuer bid |
| NGLs | natural gas liquids, which includes butane, propane, and ethane |
| PRRT | Petroleum Resource Rent Tax, a profit based tax levied on petroleum projects in Australia |
| tCO2e | tonnes of carbon dioxide equivalent |
| TTF | the price for natural gas in the Netherlands, quoted in megawatt hours of natural gas, at the Title Transfer Facility Virtual Trading Point |
| WTI | West Texas Intermediate, the reference price paid for crude oil of standard grade in US dollars at Cushing, Oklahoma |
| | | |
| | Vermilion Energy Inc. ■ Page 3 ■ 2023 Second Quarter Report | |
Highlights
| • | Q2 2023 fund flows from operations (“FFO”)(1) was $247 million ($1.51/basic share)(2) and exploration and development (“E&D”) capital expenditures(3) were $167 million, resulting in free cash flow (“FCF”)(4) of $80 million ($0.49/basic share)(5). |
| • | Net earnings were $128 million ($0.78/basic share) for Q2 2023, primarily driven by strong price realization. |
| • | The TTF natural gas benchmark price in Europe averaged $15.04 per mcf in Q2 2023, which was six times higher than the average AECO benchmark index price for the quarter. Approximately 41% of Vermilion’s Q2 2023 gas production had direct exposure to European gas pricing. |
| • | Repurchased 1.5 million common shares for $24 million and paid cash dividends of $16 million, for a total of $40 million returned to shareholders in the quarter. In conjunction with our Q2 2023 release, we announced a quarterly cash dividend of $0.10 per share, payable on October 16, 2023 to shareholders of record on September 29, 2023. |
| • | In early July 2023, we announced the renewal of our normal course issuer bid ("NCIB") with approval to purchase of up to 16,308,587 common shares, representing approximately 10% of Vermilion’s public float as at June 28, 2023. |
| • | Net debt(6) decreased to $1.3 billion, representing a trailing net debt-to-FFO ratio(7) of 1.0 times. We were undrawn on our $1.6 billion covenant-based revolving credit facility at the end of Q2 2023 and extended the maturity date of this facility to May 2027 during the quarter. |
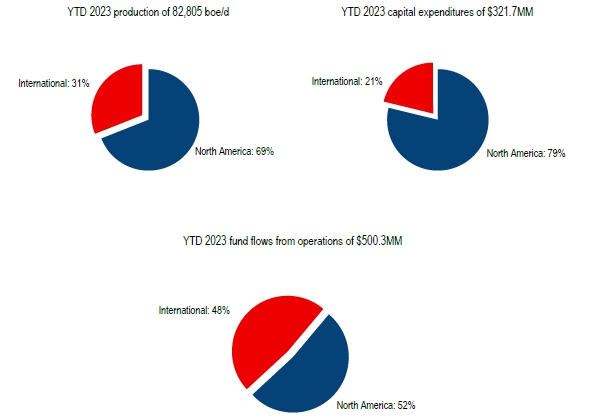
| • | Q2 2023 production averaged 83,152 boe/d(8) an increase of 1% from the previous quarter due to the acquisition of additional working interest in the Corrib Natural Gas Project ("Corrib") in Ireland and new production from our Mica Montney, United States, and southeast Saskatchewan assets, partially offset by the disposition of higher-cost assets in southeast Saskatchewan and fire-related downtime in West Central Alberta. |
| • | All production that was temporarily shut-in as a result of the wildfires in West Central Alberta has been restored thanks to the hard work of our employees, and we confirm there was no major damage to our facilities or well sites. |
| • | As a result of strong operational execution and performance across our portfolio, we are maintaining our 2023 annual production guidance of 82,000 to 86,000 boe/d. |
| • | Late in the second quarter we received the final permit required to proceed with the construction of the 16,000 boe/d battery on our Montney Mica lands in British Columbia, which will facilitate the long-term development of our high-quality lands offsetting the strong BC well results. |
| • | We released the annual update to our online sustainability report in July 2023, marking our 10th year of ESG reporting. One notable highlight is the decrease in our 2022 Scope 1 emission intensity to 0.017 tCO2e per throughput operated boe, in line with our target to reduce our 2019 baseline of 0.019 tCO2e per throughput operated boe by 15% to 20% by 2025. The full report is available at https://www.vermilionenergy.com/sustainability. |
| | | |
| | Vermilion Energy Inc. ■ Page 4 ■ 2023 Second Quarter Report | |
| ($M except as indicated) | Q2 2023 | Q1 2023 | Q2 2022 | YTD 2023 | YTD 2022 |
| Financial | | | | | |
| Petroleum and natural gas sales | 471,356 | 552,698 | 858,844 | 1,024,054 | 1,669,023 |
| Cash flows from operating activities | 173,632 | 388,629 | 530,364 | 562,261 | 871,417 |
| Fund flows from operations (1) | 247,109 | 253,167 | 452,901 | 500,276 | 842,769 |
| Fund flows from operations ($/basic share) (2) | 1.51 | 1.56 | 2.75 | 3.05 | 5.16 |
| Fund flows from operations ($/diluted share) (2) | 1.48 | 1.51 | 2.68 | 2.99 | 5.00 |
| Net earnings | 127,908 | 380,332 | 362,621 | 508,240 | 646,575 |
| Net earnings ($/basic share) | 0.78 | 2.34 | 2.20 | 3.10 | 3.96 |
| Cash flows used in investing activities | 164,404 | 108,695 | 612,634 | 273,099 | 722,964 |
| Capital expenditures (3) | 166,845 | 154,820 | 113,153 | 321,665 | 198,497 |
| Acquisitions (14) | (9,716) | 251,772 | 522,223 | 242,056 | 528,935 |
| Dispositions | - | 182,152 | - | 182,152 | - |
| Asset retirement obligations settled | 11,893 | 2,554 | 4,300 | 14,447 | 10,620 |
| Repurchase of shares | 24,316 | 30,141 | - | 54,457 | - |
| Cash dividends ($/share) | 0.10 | 0.10 | 0.06 | 0.20 | 0.12 |
| Dividends declared | 16,430 | 16,226 | 9,913 | 32,656 | 19,680 |
| % of fund flows from operations (9) | 7 % | 6 % | 2 % | 7 % | 2 % |
| Payout (10) | 195,168 | 173,600 | 127,366 | 368,768 | 228,797 |
| % of fund flows from operations (10) | 79 % | 69 % | 28 % | 74 % | 27 % |
| Free cash flow (4) | 80,264 | 98,347 | 339,748 | 178,611 | 644,272 |
| Long-term debt | 913,785 | 933,463 | 1,527,217 | 913,785 | 1,527,217 |
| Net debt (6) | 1,321,100 | 1,368,029 | 1,588,668 | 1,321,100 | 1,588,668 |
| Net debt to four quarter trailing fund flows from operations (7) | 1.0 | 0.9 | 1.1 | 1.0 | 1.1 |
| Operational |
| Production (8) | | | | | |
| Crude oil and condensate (bbls/d) | 29,342 | 33,291 | 36,783 | 31,305 | 36,936 |
| NGLs (bbls/d) | 6,538 | 7,896 | 8,113 | 7,213 | 8,227 |
| Natural gas (mmcf/d) | 283.63 | 247.61 | 239.83 | 265.72 | 242.25 |
| Total (boe/d) | 83,152 | 82,455 | 84,868 | 82,805 | 85,537 |
| Average realized prices | | | | | |
| Crude oil and condensate ($/bbl) | 96.64 | 98.62 | 138.55 | 97.66 | 129.48 |
| NGLs ($/bbl) | 28.11 | 36.23 | 51.86 | 32.53 | 49.38 |
| Natural gas ($/mcf) | 7.37 | 10.77 | 16.50 | 8.94 | 16.96 |
| Production mix (% of production) | | | | | |
| % priced with reference to WTI | 32 % | 39 % | 39 % | 35 % | 38 % |
| % priced with reference to Dated Brent | 12 % | 12 % | 16 % | 11 % | 16 % |
| % priced with reference to AECO | 33 % | 34 % | 29 % | 34 % | 29 % |
| % priced with reference to TTF and NBP | 23 % | 15 % | 16 % | 20 % | 17 % |
| Netbacks ($/boe) | | | | | |
| Operating netback (11) | 43.66 | 46.33 | 72.57 | 44.98 | 66.15 |
| Fund flows from operations ($/boe) (12) | 32.35 | 34.52 | 58.82 | 33.43 | 54.81 |
| Operating expenses | 17.91 | 18.66 | 14.89 | 18.28 | 14.75 |
| General and administration expenses | 2.63 | 2.71 | 2.04 | 2.67 | 1.95 |
| Average reference prices | | | | | |
| WTI (US $/bbl) | 73.80 | 76.13 | 108.41 | 74.97 | 101.35 |
| Dated Brent (US $/bbl) | 78.39 | 81.27 | 113.78 | 79.83 | 107.59 |
| AECO ($/mcf) | 2.45 | 3.22 | 7.24 | 2.84 | 5.99 |
| TTF ($/mcf) | 15.04 | 22.99 | 38.08 | 19.03 | 38.93 |
| Share information ('000s) |
| Shares outstanding - basic | 164,294 | 162,261 | 165,222 | 164,294 | 165,222 |
| Shares outstanding - diluted (13) | 168,530 | 168,874 | 170,969 | 168,530 | 170,969 |
| Weighted average shares outstanding - basic | 164,997 | 162,585 | 164,518 | 163,798 | 163,452 |
| Weighted average shares outstanding - diluted (13) | 167,364 | 167,857 | 169,169 | 167,343 | 168,517 |
| | | |
| | Vermilion Energy Inc. ■ Page 5 ■ 2023 Second Quarter Report | |
| (1) | Fund flows from operations (FFO) is a total of segments measure comparable to net earnings that is comprised of sales less royalties, transportation, operating, G&A, corporate income tax, PRRT, windfall taxes, interest expense, realized gain on derivatives, realized foreign exchange gain (loss), and realized other income. The measure is used to assess the contribution of each business unit to Vermilion's ability to generate income necessary to pay dividends, repay debt, fund asset retirement obligations, and make capital investments. FFO does not have a standardized meaning under IFRS and therefore may not be comparable to similar measures provided by other issuers. More information and a reconciliation to primary financial statement measures can be found in the “Non-GAAP and Other Specified Financial Measures” section of this document. |
| (2) | Fund flows from operations per share (basic and diluted) are supplementary financial measures and are not a standardized financial measures under IFRS, and therefore may not be comparable to similar measures disclosed by other issuers. They are calculated using FFO (a total of segments measure) and basic/diluted shares outstanding. The measure is used to assess the contribution per share of each business unit. More information and a reconciliation to primary financial statement measures can be found in the “Non-GAAP and Other Specified Financial Measures” section of this document. |
| (3) | Capital expenditures is a non-GAAP financial measure that is the sum of drilling and development costs and exploration and evaluation costs from the Consolidated Statements of Cash Flows. More information and a reconciliation to primary financial statement measures can be found in the “Non-GAAP and Other Specified Financial Measures” section of this document. |
| (4) | Free cash flow (FCF) is a non-GAAP financial measure comparable to cash flows from operating activities and is comprised of FFO less drilling and development and exploration and evaluation expenditures. More information and a reconciliation to primary financial statement measures can be found in the “Non-GAAP and Other Specified Financial Measures” section of this document. |
| (5) | Free cash flow per basic share is a non-GAAP supplementary financial measure and is not a standardized financial measure under IFRS and may not be comparable to similar measures disclosed by other issuers. It is calculated using FCF and basic shares outstanding. |
| (6) | Net debt is a capital management measure comparable to long-term debt and is comprised of long-term debt (excluding unrealized foreign exchange on swapped USD borrowings) plus adjusted working capital (defined as current assets less current liabilities, excluding current derivatives and current lease liabilities). More information and a reconciliation to primary financial statement measures can be found in the “Non-GAAP and Other Specified Financial Measures” section of this document. |
| (7) | Net debt to trailing FFO is a supplementary financial measure and is not a standardized financial measure under IFRS. It may not be comparable to similar measures disclosed by other issuers and is calculated using net debt (capital management measure) and FFO (total of segment measure). The measure is used to assess the ability to repay debt. Information in this document is included by reference; refer to the "Non-GAAP and Other Specified Financial Measures" section of this document. |
| (8) | Please refer to Supplemental Table 4 "Production" of the accompanying Management's Discussion and Analysis for disclosure by product type. |
| (9) | Dividends % of FFO is a supplementary financial measure that is not standardized under IFRS and may not be comparable to similar measures disclosed by other issuers, calculated as dividends divided by FFO. The ratio is used by management as a metric to assess the cash distributed to shareholders. Reconciliation to primary financial statement measures can be found in the “Non-GAAP and Other Specified Financial Measures” section of this document. |
| (10) | Payout and payout % of FFO are a non-GAAP financial measure and a non-GAAP ratio, respectively, that are not standardized under IFRS and may not be comparable to similar measures disclosed by other issuers. Payout is comparable to dividends declared and is comprised of dividends declared plus drilling and development costs, exploration and evaluation costs, and asset retirement obligations settled, while the ratio is calculated as payout divided by FFO. More information and a reconciliation to primary financial statement measures can be found in the “Non-GAAP and Other Specified Financial Measures” section of this document. |
| (11) | Operating netback is a non-GAAP financial measure comparable to net earnings and is comprised of sales less royalties, operating expense, transportation costs, PRRT, and realized hedging gains and losses. More information and a reconciliation to primary financial statement measures can be found in the “Non-GAAP and Other Specified Financial Measures” section of this document. |
| (12) | Fund flows from operations per boe is a supplementary financial measure that is not standardized under IFRS and may not be comparable to similar measures disclosed by other issuers, calculated as FFO by boe production. Fund flows from operations per boe is used by management to assess the profitability of our business units and Vermilion as a whole. More information and a reconciliation to primary financial statement measures can be found in the “Non-GAAP and Other Specified Financial Measures” section of this document. |
| (13) | Diluted shares outstanding represent the sum of shares outstanding at the period end plus outstanding awards under the Long-term Incentive Plan (“LTIP”), based on current estimates of future performance factors and forfeiture rates. |
| (14) | Acquisitions is a non-GAAP financial measure that is calculated as the sum of acquisitions and acquisitions of securities from the Consolidated Statements of Cash Flows, Vermilion common shares issued as consideration, the estimated value of contingent consideration, the amount of acquiree's outstanding long-term debt assumed, and net acquired working capital deficit or surplus. More information and a reconciliation to primary financial statement measures can be found in the “Non-GAAP and Other Specified Financial Measures” section of this document. |
| | | |
| | Vermilion Energy Inc. ■ Page 6 ■ 2023 Second Quarter Report | |
Message to Shareholders
Production during the second quarter of 2023 averaged 83,152 boe/d, which was at the top end of our Q2 2023 guidance range. We revised our Q2 2023 production guidance in mid-May to a range of 80,000 to 83,000 boe/d following the temporary shut-in of approximately 30,000 boe/d in West Central Alberta due to numerous fires in the region. There was no major damage to our facilities or well sites, and our team was able to safely restore all of the production within weeks of the initial shut-in thanks to the hard work of our employees. In addition, we achieved strong operational performance across many of our other assets which further mitigated the approximately 8,000 boe/d quarterly production impact from the fire-related shut-ins in West Central Alberta and downtime in Australia. This operational flexibility is one of the advantages of operating a geographically diverse portfolio of assets. Due to the stronger than anticipated asset performance, we are maintaining annual 2023 production guidance of 82,000 to 86,000 boe/d and we are well positioned to deliver Q4 2023 production of 86,000 to 89,000 boe/d.
We generated $247 million of fund flows from operations (“FFO”) in Q2 2023 and invested $167 million of E&D capital, resulting in $80 million of free cash flow (“FCF”). We returned a total of $40 million to shareholders in Q2 2023 via the base dividend and share buybacks. During the first half of 2023, we have declared $33 million in dividends and repurchased $54 million of our common shares, representing a total of $87 million returned to shareholders. We continue to target shareholder returns representing 25 to 30% of FCF for 2023 with the majority of FCF being allocated to debt reduction until we achieve our next net debt target of $1 billion. Upon achieving this debt target we plan to increase the capital return to shareholders and will communicate the targeted payout range at that time. We anticipate share buybacks will remain the primary method for returning incremental capital beyond the base dividend, and, as such, we renewed our normal course issuer bid in early July 2023. Net debt at the end of Q2 2023 decreased slightly to $1.3 billion, representing a trailing net debt-to-FFO ratio of 1.0 times.
The downtime in Australia continues to impact our 2023 results with the facility now expected to remain offline until the end of Q3 to complete additional work. While these delays impact short-term production and cash flow, it is the right long-term decision as it enhances the safety and integrity of our asset while improving future operational run-rates.
Late in the second quarter, we received the final permit required to proceed with the construction of the 16,000 boe/d battery on our Montney Mica lands in British Columbia. This is a key milestone that will facilitate the next leg of growth at Mica and underpin the long-term development of this asset. The results from our most recently drilled Montney wells are very encouraging as we continue to see flat production through the first 120 days on-stream, with 40% liquids content on our BC pad. We are excited to move forward with the next expansion phase and look forward to providing further updates in the quarters ahead.
Our disciplined approach towards debt reduction, combined with our asset high-grading initiatives over the past two years has made Vermilion a more resilient business today. By the end of this year we will have nearly cut our debt in half while significantly increasing our average annual FFO from pre-COVID levels. While strong commodity prices have contributed to this improvement, we believe the company is much better positioned. We believe our top decile netbacks, low base decline and capital efficient asset base, combined with our modest base dividend payout ratio, translates to a very resilient business that can be managed through low commodity cycles and is well positioned for increased return of capital to shareholders. With our leverage at a decade low and 2023 on track to deliver the second highest annual FFO in corporate history, we look forward to providing an update on returns to shareholders as we achieve our debt targets.
Q2 2023 Operations Review
North America
Production from our North American operations averaged 54,065 boe/d(1) in Q2 2023, a decrease of 10% from the prior quarter primarily due to the disposition of approximately 5,500 boe/d of higher-cost assets in southeast Saskatchewan and approximately 4,000 boe/d of fire-related downtime in West Central Alberta, partially offset by new production from our Mica Montney, United States, and southeast Saskatchewan assets. All production that was temporarily shut-in as a result of the wildfires in West Central Alberta has been restored, and there was no major damage to our facilities or well sites. We will continue to monitor the forest fires and take any necessary actions to ensure the safety of our people and assets.
Our recent Montney wells at Mica continue to perform well, with minimal decline seen over the first 120 days of production. We are encouraged by these results and will continue to optimize the drilling and completion process on future wells, including approximately 10 planned wells on or offsetting our recent BC pad that we expect to drill in 2024. We recently received the final permit required to proceed with construction of the planned 16,000 boe/d battery on our Montney Mica lands in British Columbia and will start site preparation for this activity later this year. The majority of this construction will occur in the first half of 2024 and will be funded through a financing agreement with a third-party midstream company that was part of the Mica acquisition.
| | | |
| | Vermilion Energy Inc. ■ Page 7 ■ 2023 Second Quarter Report | |
In West Central Alberta, we completed one (0.3 net) and brought on production five (2.0 net) Mannville liquids rich conventional natural gas wells, while at Mica we drilled two (2.0 net), completed four (4.0 net), and brought on production one (1.0 net) Montney liquids rich shale gas wells. In Saskatchewan, we drilled one (1.0 net), completed one (1.0 net), and brought on production one (1.0 net) light and medium crude oil well. In the United States, we drilled seven (4.3 net), completed ten (5.7 net), and brought on production five (3.1 net) light and medium crude oil wells in Wyoming. As part of our activity in the quarter we participated in the drilling of two (0.5 net) non-operated Parkman wells and one (0.1 net) non-operated Niobrara well. We continue to evaluate these formations as they relate to future development prospects on our Powder River Basin acreage in Wyoming.
Across North America we are seeing strong overall performance from our capital program and ongoing operations, which has helped in mitigating the impact of fire-related downtime in West Central Alberta.
International
Production from our International operations averaged 29,087 boe/d(1) in Q2 2023, an increase of 30% from the prior quarter, primarily due to the acquisition of additional working interest in the Corrib Natural Gas Project ("Corrib") in Ireland, which closed on March 31, 2023. This acquisition added approximately 7,000 boe/d of European natural gas production. In the Netherlands, we completed one (0.5 net) conventional natural gas well from our Q1 2023 drilling program. In Germany, we continued to advance our deep gas exploration and development plans as we prepare for our first well to be drilled in the fourth quarter of 2023.
In Australia, we completed all remaining inspections and repair work within the primary systems on the platform in Q2 2023, and transitioned to start-up procedures in early July. While testing the systems prior to start-up we identified a leak in a pipe supplying seawater to a secondary area of the deluge fire suppression system. To ensure we have addressed any outstanding items, we have elected to replace the seawater piping at this time, which will delay startup to the end of Q3. The bulk of our focus throughout this maintenance program was on inspections and pipe replacement, which we expect to result in higher operational run-rates with less unplanned downtime in the future.
Outlook and Guidance Update
As a result of the increased scope of repair work on the Wandoo platform in Australia, as well as the planned turnaround at the Corrib facility in Ireland, Q3 2023 volumes are expected to be consistent with Q2 2023 at 80,000 to 83,000 boe/d. As we complete the Australia integrity work and Corrib turnaround we will be well-positioned to deliver an expected Q4 2023 production rate of 86,000 to 89,000 boe/d. As a result of strong operational execution and performance across our portfolio, we are maintaining our 2023 annual production guidance of 82,000 to 86,000 boe/d.
Sustainability
We released the annual update to our online sustainability report in July 2023, marking our 10th year of ESG reporting. One notable highlight is the decrease in our 2022 Scope 1 emission intensity to 0.017 tCO2e per throughput operated boe, in line with our target to reduce our 2019 baseline of 0.019 tCO2e per throughput operated boe by 15% to 20% by 2025. The full report is available at https://www.vermilionenergy.com/sustainability.
Commodity Hedging
Vermilion hedges to manage commodity price exposures and increase the stability of our cash flows. In aggregate, as of August 2, 2023, we have 16% of our expected net-of-royalty production hedged for the remainder of 2023. With respect to individual commodity products, we have hedged 52% of our European natural gas production, 4% of our crude oil production, and 12% of our North American natural gas volumes for the remainder of 2023, respectively. Please refer to the Hedging section of our website under Invest With Us for further details using the following link:
https://www.vermilionenergy.com/invest-with-us/hedging.
| (Signed “Dion Hatcher”) | |
| | |
| Dion Hatcher | |
| President & Chief Executive Officer | |
| August 2, 2023 | |
| (1) | Please refer to Supplemental Table 4 "Production" of the accompanying Management's Discussion and Analysis for disclosure by product type. |
| | | |
| | Vermilion Energy Inc. ■ Page 8 ■ 2023 Second Quarter Report | |
Non-GAAP and Other Specified Financial Measures
This report and other materials released by Vermilion includes financial measures that are not standardized, specified, defined, or determined under IFRS and are therefore considered non-GAAP or other specified financial measures and may not be comparable to similar measures presented by other issuers. These financial measures include:
Total of Segments Measures
Fund flows from operations (FFO): Most directly comparable to net earnings, FFO is comprised of sales excluding royalties, transportation, operating, G&A, corporate income tax, PRRT, windfall taxes, interest expense, realized loss on derivatives, realized foreign exchange gain (loss), and realized other income. The measure is used to assess the contribution of each business unit to Vermilion's ability to generate income necessary to pay dividends, repay debt, fund asset retirement obligations and make capital investments.
| | Q2 2023 | Q2 2022 | YTD 2023 | YTD 2022 |
| | $M | $/boe | $M | $/boe | $M | $/boe | $M | $/boe |
| Sales | 471,356 | 61.74 | 858,844 | 111.55 | 1,024,054 | 68.42 | 1,669,023 | 108.54 |
| Royalties | (46,993) | (6.16) | (83,553) | (10.85) | (114,337) | (7.64) | (154,860) | (10.07) |
| Transportation | (21,905) | (2.87) | (20,153) | (2.62) | (44,955) | (3.00) | (37,422) | (2.43) |
| Operating | (136,749) | (17.91) | (114,617) | (14.89) | (273,574) | (18.28) | (226,800) | (14.75) |
| General and administration | (20,058) | (2.63) | (15,691) | (2.04) | (39,947) | (2.67) | (29,911) | (1.95) |
| Corporate income tax expense | (18,928) | (2.48) | (69,501) | (9.03) | (41,190) | (2.75) | (115,173) | (7.49) |
| Windfall taxes | (34,784) | (4.56) | - | - | (56,224) | (3.76) | - | - |
| PRRT | - | - | (2,019) | (0.26) | - | - | (8,728) | (0.57) |
| Interest expense | (20,210) | (2.65) | (21,074) | (2.74) | (42,085) | (2.81) | (35,897) | (2.33) |
| Realized gain (loss) on derivatives | 67,673 | 8.86 | (79,778) | (10.36) | 82,003 | 5.48 | (224,001) | (14.57) |
| Realized foreign exchange gain (loss) | 3,679 | 0.48 | (2,297) | (0.30) | (1,092) | (0.07) | (1,547) | (0.10) |
| Realized other income | 4,028 | 0.53 | 2,740 | 0.36 | 7,623 | 0.51 | 8,085 | 0.53 |
| Fund flows from operations | 247,109 | 32.35 | 452,901 | 58.82 | 500,276 | 33.43 | 842,769 | 54.81 |
| Equity based compensation | (4,998) | | (7,499) | | (28,523) | | (32,868) | |
| Unrealized gain (loss) on derivative instruments (1) | 11,177 | | 168,058 | | 103,875 | | (52,736) | |
| Unrealized foreign exchange gain (loss) (1) | 35,124 | | (32,267) | | 19,646 | | 7,870 | |
| Accretion | (18,599) | | (13,746) | | (38,650) | | (27,384) | |
| Depletion and depreciation | (154,389) | | (140,763) | | (302,520) | | (275,003) | |
| Deferred tax recovery (expense) | 480 | | (63,497) | | 36,946 | | (7,404) | |
| Gain on business combination | 12,544 | | - | | 445,094 | | - | |
| Loss on disposition | - | | - | | (226,828) | | - | |
| Impairment reversal | - | | - | | - | | 192,094 | |
| Unrealized other expense | (540) | | (566) | | (1,076) | | (763) | |
| Net earnings | 127,908 | | 362,621 | | 508,240 | | 646,575 | |
| (1) | Unrealized gain (loss) on derivative instruments, Unrealized foreign exchange gain (loss), and Unrealized other expense are line items from the respective Consolidated Statements of Cash Flows. |
Non-GAAP Financial Measures and Non-GAAP Ratios
Free cash flow (FCF): Most directly comparable to cash flows from operating activities, FCF is comprised of fund flows from operations less drilling and development costs and exploration and evaluation costs. The measure is used to determine the funding available for investing and financing activities including payment of dividends, repayment of long-term debt, reallocation into existing business units and deployment into new ventures.
| | | |
| | Vermilion Energy Inc. ■ Page 9 ■ 2023 Second Quarter Report | |
| ($M) | Q2 2023 | Q2 2022 | 2023 | 2022 |
| Cash flows from operating activities | 173,632 | 530,364 | 562,261 | 871,417 |
| Changes in non-cash operating working capital | 61,584 | (81,763) | (76,432) | (39,268) |
| Asset retirement obligations settled | 11,893 | 4,300 | 14,447 | 10,620 |
| Fund flows from operations | 247,109 | 452,901 | 500,276 | 842,769 |
| Drilling and development | (164,070) | (109,488) | (317,398) | (192,329) |
| Exploration and evaluation | (2,775) | (3,665) | (4,267) | (6,168) |
| Free cash flow | 80,264 | 339,748 | 178,611 | 644,272 |
Adjusted working capital: Defined as current assets less current liabilities, excluding current derivatives and current lease liabilities. The measure is used to calculate net debt, a capital measure disclosed above.
| | As at |
| ($M) | Jun 30, 2023 | Dec 31, 2022 |
| Current assets | 743,515 | 714,446 |
| Current derivative asset | (326,143) | (162,843) |
| Current liabilities | (870,758) | (892,045) |
| Current lease liability | 21,059 | 19,486 |
| Current derivative liability | 25,012 | 55,845 |
| Adjusted working capital | (407,315) | (265,111) |
Capital expenditures: Calculated as the sum of drilling and development costs and exploration and evaluation costs from the Consolidated Statements of Cash Flows and most directly comparable to cash flows used in investing activities. We consider capital expenditures to be a useful measure of our investment in our existing asset base. Capital expenditures are also referred to as E&D capital.
| ($M) | Q2 2023 | Q2 2022 | 2023 | 2022 |
| Drilling and development | 164,070 | 109,488 | 317,398 | 192,329 |
| Exploration and evaluation | 2,775 | 3,665 | 4,267 | 6,168 |
| Capital expenditures | 166,845 | 113,153 | 321,665 | 198,497 |
Operating netback: Most directly comparable to net earnings and is calculated as sales less royalties, operating expense, transportation costs, PRRT, and realized hedging gains and losses presented on a per unit basis. Management assesses operating netback as a measure of the profitability and efficiency of our field operations.
Payout and payout % of FFO: A non-GAAP financial measure and non-GAAP ratio respectively most directly comparable to dividends declared. Payout is comprised of dividends declared plus drilling and development costs, exploration and evaluation costs, and asset retirement obligations settled. The measure is used to assess the amount of cash distributed back to shareholders and reinvested in the business for maintaining production and organic growth. The reconciliation of the measure to primary financial statement measure can be found below. Management uses payout and payout as a percentage of FFO (also referred to as the payout or sustainability ratio).
| ($M) | Q2 2023 | Q2 2022 | 2023 | 2022 |
| Dividends Declared | 16,430 | 9,913 | 32,656 | 19,680 |
| % of fund flows from operations | 7 % | 2 % | 7 % | 2 % |
| Drilling and development | 164,070 | 109,488 | 317,398 | 192,329 |
| Exploration and evaluation | 2,775 | 3,665 | 4,267 | 6,168 |
| Asset retirement obligations settled | 11,893 | 4,300 | 14,447 | 10,620 |
| Payout | 195,168 | 127,366 | 368,768 | 228,797 |
| % of fund flows from operations | 79 % | 28 % | 74 % | 27 % |
Acquisitions: The sum of acquisitions and acquisitions of securities from the Consolidated Statements of Cash Flows, Vermilion common shares issued as consideration, the estimated value of contingent consideration, the amount of acquiree's outstanding long-term debt assumed, and net acquired working capital deficit or surplus. We believe that including these components provides a useful measure of the economic investment associated with our acquisition activity and is most directly comparable to cash flows used in investing activities. A reconciliation to the acquisitions line items in the Consolidated Statements of Cash Flows can be found below.
| | | |
| | Vermilion Energy Inc. ■ Page 10 ■ 2023 Second Quarter Report | |
| ($M) | Q2 2023 | Q2 2022 | 2023 | 2022 |
| Acquisitions, net of cash acquired | 2,196 | 497,800 | 136,421 | 504,512 |
| Acquisition of securities | 632 | 18,301 | 2,108 | 18,301 |
| Acquired working capital (surplus) deficit | (12,544) | 6,122 | 103,527 | 6,122 |
| Acquisitions | (9,716) | 522,223 | 242,056 | 528,935 |
Capital Management Measure
Net debt: Is in accordance with IAS 1 "Presentation of Financial Statements" and is most directly comparable to long-term debt. Net debt is comprised of long-term debt (excluding unrealized foreign exchange on swapped USD borrowings) plus adjusted working capital and represents Vermilion's net financing obligations after adjusting for the timing of working capital fluctuations.
| | As at |
| ($M) | Jun 30, 2023 | Dec 31, 2022 |
| Long-term debt | 913,785 | 1,081,351 |
| Adjusted working capital | 407,315 | 265,111 |
| Unrealized FX on swapped USD borrowings | - | (1,876) |
| Net debt | 1,321,100 | 1,344,586 |
| | | |
| Ratio of net debt to four quarter trailing fund flows from operations | 1.0 | 0.8 |
Supplementary Financial Measures
Net debt to four quarter trailing fund flows from operations: Calculated as net debt (capital management measure) over the FFO (total of segments measure) from the preceding four quarters. The measure is used to assess the ability to repay debt.
Dividends % of FFO: Calculated as dividends declared divided by FFO (total of segments measure). The measure is used by management as a metric to assess the cash distributed to shareholders.
Fund flows from operations per boe: Calculated as FFO (total of segments measure) by boe production. Fund flows from operations per boe is used by management to assess the profitability of our business units and Vermilion as a whole.
| | | |
| | Vermilion Energy Inc. ■ Page 11 ■ 2023 Second Quarter Report | |
Management's Discussion and Analysis
The following is Management’s Discussion and Analysis (“MD&A”), dated August 2, 2023, of Vermilion Energy Inc.’s (“Vermilion”, “we”, “our”, “us” or the “Company”) operating and financial results as at and for the three and six months ended June 30, 2023 compared with the corresponding periods in the prior year.
This discussion should be read in conjunction with the unaudited condensed consolidated interim financial statements for the three and six months ended June 30, 2023 and the audited consolidated financial statements for the years ended December 31, 2022 and 2021, together with the accompanying notes. Additional information relating to Vermilion, including its Annual Information Form, is available on SEDAR+ at www.sedarplus.ca or on Vermilion’s website at www.vermilionenergy.com.
The unaudited condensed consolidated interim financial statements for the three and six months ended June 30, 2023 and comparative information have been prepared in Canadian dollars, except where another currency has been indicated, and in accordance with IAS 34, "Interim Financial Reporting", as issued by the International Accounting Standards Board ("IASB").
This MD&A includes references to certain financial and performance measures which do not have standardized meanings prescribed by International Financial Reporting Standards ("IFRS"). These measures include:
| • | Fund flows from operations: Fund flows from operations (FFO) is a total of segments measure most directly comparable to net earnings and is comprised of sales excluding royalties, transportation, operating, G&A, corporate income tax, PRRT, windfall taxes, interest expense, realized loss on derivatives, realized foreign exchange gain (loss), and realized other income. The measure is used to assess the contribution of each business unit to Vermilion's ability to generate income necessary to pay dividends, repay debt, fund asset retirement obligations and make capital investments. A reconciliation to Net Earnings can be found within the "Non-GAAP and Other Specified Financial Measures" section of this MD&A. |
| • | Free cash flow: Free cash flow (FCF) is a non-GAAP financial measure most directly comparable to Cash flows used in investing activities and is comprised of FFO less drilling and development costs and exploration and evaluation costs. The measure is used to determine the funding available for investing and financing activities including payment of dividends, repayment of long-term debt, reallocation into existing business units and deployment into new ventures. A reconciliation to Cash flows used in investing activities can be found within the "Non-GAAP and Other Specified Financial Measures" section of this MD&A. |
| • | Net debt: Net debt is a capital management measure in accordance with IAS 1 "Presentation of Financial Statements" and is most directly comparable to long-term debt. Net debt is comprised of long-term debt (excluding unrealized foreign exchange on swapped USD borrowings) plus adjusted working capital (defined as current assets less current liabilities, excluding current derivatives and current lease liabilities), and represents Vermilion's net financing obligations after adjusting for the timing of working capital fluctuations. Net debt excludes lease obligations which are secured by a corresponding right-of-use asset. A reconciliation to long-term debt can be found within the "Financial Position Review" section of this MD&A. |
| • | Operating Netbacks: Operating Netbacks is a non-GAAP financial measure most directly comparable to net earnings and is calculated as sales less royalties, operating expense, transportation costs, PRRT, and realized hedging gains and losses presented on a per unit basis. Management assesses operating netback as a measure of the profitability and efficiency of our field operations. A reconciliation to the primary financial statement measures can be found within "Supplemental Table 1: Netbacks" of this MD&A. |
| • | Fund flows from operations per boe: Fund flows from operations per boe includes general and administration expense. Fund flows from operations netback is used by management to assess the profitability of our business units and Vermilion as a whole. A reconciliation to the primary financial statement measures can be found within "Supplemental Table 1: Netbacks" of this MD&A. |
In addition, this MD&A includes references to certain financial measures which are not specified, defined, or determined under IFRS and are therefore considered non-GAAP financial measures. These non-GAAP financial measures may not be comparable to similar financial measures presented by other issuers. For a full description of these non-GAAP financial measures and a reconciliation of these measures to their most directly comparable GAAP measures, please refer to the “Non-GAAP and Other Specified Financial Measures” section of this MD&A.
Product Type Disclosure
Under National Instrument 51-101 "Standards of Disclosure for Oil and Gas Activities", disclosure of production volumes should include segmentation by product type as defined in the instrument. In this report, references to "crude oil" and "light and medium crude oil" mean "light crude oil and medium crude oil" and references to "natural gas" mean "conventional natural gas".
In addition, in Supplemental Table 4 "Production", Vermilion provides a reconciliation from total production volumes to product type and also a reconciliation of "crude oil and condensate" and "NGLs" to the product types "light crude oil and medium crude oil" and "natural gas liquids".
Production volumes reported are based on quantities as measured at the first point of sale.
| | | |
| | Vermilion Energy Inc. ■ Page 12 ■ 2023 Second Quarter Report | |
Guidance
On January 6, 2023, we released our 2023 capital budget and associated production guidance, which incorporated the March 31, 2023 close date of the acquisition of an incremental 36.5% interest in the Corrib Natural Gas Project (“Corrib”) in Ireland. On March 8, 2023, we decreased annual production guidance to 82,000 to 86,000 boe/d to reflect the southeast Saskatchewan asset sale and unplanned downtime in Australia, and decreased operating expense guidance to reflect the southeast Saskatchewan asset sale and lower European gas prices. On May 3, 2023, we updated royalty rate guidance to include Netherlands windfall royalties, which were previously included in windfall tax guidance, and provided revisions to 2023 guidance items to reflect the assumptions used in management's most recent forecast. On August 2, 2023 we maintained our 2023 guidance as follows:
| Category | | Current (1) |
| Production (boe/d) | | 82,000 - 86,000 |
| E&D capital expenditures ($MM) | | 570 |
| Royalty rate, including windfall royalties (% of sales) (2) | | 12 - 14% |
| Operating ($/boe) | | $16.50 - 17.50 |
| Transportation ($/boe) | | $2.75 - 3.25 |
| General and administration ($/boe) | | $2.00 - 2.50 |
| Cash taxes (% of pre-tax FFO) | | 6 - 8% |
| Windfall tax, excluding windfall royalties (% of pre-tax FFO) (3) | | 9 - 11% |
| (1) | Current 2023 guidance reflects foreign exchange assumptions of CAD/USD 1.33, CAD/EUR 1.46, and CAD/AUD 0.90. |
| (2) | Royalty rate guidance includes windfall royalties paid as part of the European Solidarity Contribution. For 2023 and 2024, Netherlands has implemented a windfall royalty. This royalty applies if annual realized pricing (net of hedges) exceeds #eu#0.50/Nm3. This royalty is assessed annually at a rate of 65% on realized pricing (net of hedges) less #eu#0.50/Nm3 and payments on this royalty are deductible in calculating current income taxes. |
| (3) | Windfall tax guidance is based on forward prices as at July 31, 2023, and incorporates windfall taxes as legislated or proposed in EU member states in which Vermilion does business. Windfall royalties in the Netherlands are excluded from windfall tax guidance, and have been included in royalty rate guidance, above. |
| | | |
| | Vermilion Energy Inc. ■ Page 13 ■ 2023 Second Quarter Report | |
Vermilion's Business
Vermilion is a Calgary, Alberta-based international oil and gas producer focused on the acquisition, exploration, development, and optimization of producing properties in North America, Europe, and Australia. We manage our business through our Calgary head office and our international business unit offices.
| | | |
| | Vermilion Energy Inc. ■ Page 14 ■ 2023 Second Quarter Report | |
Consolidated Results Overview
| | Q2 2023 | Q2 2022 | Q2/23 vs. Q2/22 | YTD 2023 | YTD 2022 | 2023 vs. 2022 |
| Production (1) | | | | | | |
| Crude oil and condensate (bbls/d) | 29,342 | 36,783 | (20)% | 31,305 | 36,936 | (15)% |
| NGLs (bbls/d) | 6,538 | 8,113 | (19)% | 7,213 | 8,227 | (12)% |
| Natural gas (mmcf/d) | 283.63 | 239.83 | 18% | 265.72 | 242.25 | 10% |
| Total (boe/d) | 83,152 | 84,868 | (2)% | 82,805 | 85,537 | (3)% |
| (Draw) build in inventory (mbbls) | (30) | 23 | | 57 | 104 | |
| Financial metrics | | | | | | |
| Fund flows from operations ($M) (2) | 247,109 | 452,901 | (45)% | 500,276 | 842,769 | (41)% |
| Per share ($/basic share) | 1.51 | 2.75 | (45)% | 3.05 | 5.16 | (41)% |
| Net earnings ($M) | 127,908 | 362,621 | (65)% | 508,240 | 646,575 | (21)% |
| Per share ($/basic share) | 0.78 | 2.20 | (65)% | 3.10 | 3.96 | (22)% |
| Cash flows from operating activities ($M) | 173,632 | 530,364 | (67)% | 562,261 | 871,417 | (36)% |
| Free cash flow ($M) (3) | 80,264 | 339,748 | (76)% | 178,611 | 644,272 | (72)% |
| Long-term debt ($M) | 913,785 | 1,527,217 | (40)% | 913,785 | 1,527,217 | (40)% |
| Net debt ($M) (4) | 1,321,100 | 1,588,668 | (17)% | 1,321,100 | 1,588,668 | (17)% |
| Activity | | | | | | |
| Capital expenditures ($M) (5) | 166,845 | 113,153 | 48% | 321,665 | 198,497 | 62% |
| Acquisitions ($M) (6) | (9,716) | 522,223 | | 242,056 | 528,935 | |
| Dispositions ($M) | - | - | | 182,152 | - | |
| (1) | Please refer to Supplemental Table 4 "Production" for disclosure by product type. |
| (2) | Fund flows from operations (FFO) and FFO per share are a total of segments measure and supplementary financial measure respectively most directly comparable to net earnings and net earnings per share, respectively. The measures do not have a standardized meaning under IFRS and therefore may not be comparable to similar measures presented by other issuers. FFO is comprised of sales excluding royalties, transportation, operating, G&A, corporate income tax, PRRT, windfall taxes, interest expense, and realized loss (gain) on derivatives, plus realized gain (loss) on foreign exchange and realized other income. The measure is used to assess the contribution of each business unit to Vermilion's ability to generate income necessary to pay dividends, repay debt, fund asset retirement obligations and make capital investments. A reconciliation to the primary financial statement measures can be found within the "Non-GAAP and Other Specified Financial Measures" section of this MD&A. |
| (3) | Free cash flow (FCF) is a non-GAAP financial measure most directly comparable to cash flows from operating activities; it does not have a standardized meaning under IFRS and therefore may not be comparable to similar measures presented by other issuers. FCF is comprised of fund flows from operations less drilling and development costs and exploration and evaluation costs. The measure is used to determine the funding available for investing and financing activities including payment of dividends, repayment of long-term debt, reallocation into existing business units and deployment into new ventures. A reconciliation to primary financial statement measures can be found within the "Non-GAAP and Other Specified Financial Measures" section of this MD&A. |
| (4) | Net debt is a capital management measure in accordance with IAS 1 "Presentation of Financial Statements" and is most directly comparable to long-term debt. Net debt is comprised of long-term debt (excluding unrealized foreign exchange on swapped USD borrowings) plus adjusted working capital (defined as current assets less current liabilities, excluding current derivatives and current lease liabilities), and represents Vermilion's net financing obligations after adjusting for the timing of working capital fluctuations. Net debt excludes lease obligations which are secured by a corresponding right-of-use asset. A reconciliation to the primary financial statement measures can be found within the "Financial Position Review" section of this MD&A. |
| (5) | Capital expenditures is a non-GAAP financial measure that does not have a standardized meaning under IFRS and therefore may not be comparable to similar measures presented by other issuers. The measure is calculated as the sum of drilling and development costs and exploration and evaluation costs from the Consolidated Statements of Cash Flows. We consider capital expenditures to be a useful measure of our investment in our existing asset base. Capital expenditures are also referred to as E&D capital. A reconciliation to the primary financial statement measures can be found within the "Non-GAAP and Other Specified Financial Measures" section of this MD&A. |
| (6) | Acquisitions is a non-GAAP financial measure that does not have a standardized meaning under IFRS and therefore may not be comparable to similar measures presented by other issuers. The measure is calculated as the sum of acquisitions, net of cash and acquisitions of securities from the Consolidated Statements of Cash Flows, Vermilion common shares issued as consideration, the estimated value of contingent consideration, the amount of acquiree's outstanding long-term debt assumed, and net acquired working capital deficit or surplus. We believe that including these components provides a useful measure of the economic investment associated with our acquisition activity. A reconciliation to the acquisitions line item in the Consolidated Statements of Cash Flows can be found in "Supplemental Table 3: Capital Expenditures and Acquisitions" section of this MD&A. |
| | | |
| | Vermilion Energy Inc. ■ Page 15 ■ 2023 Second Quarter Report | |
Financial performance review |
Q2 2023 vs. Q2 2022
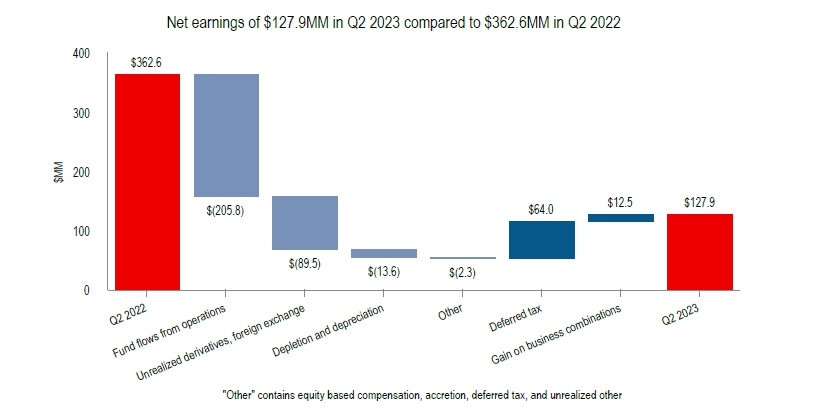
| • | We recorded net earnings of $127.9 million ($0.78/basic share) for Q2 2023 compared to $362.6 million ($2.20/basic share) in Q2 2022. The decrease in net earnings was primarily due to lower fund flows from operations primarily driven by decreased commodity prices, a change in the position of unrealized derivatives and a net increase in depletion and depreciation due to acquisition and disposition activity in Q1 2023. This was partially offset by lower deferred income taxes and the gain recognized on the Corrib acquisition in 2023. |
| | | |
| | Vermilion Energy Inc. ■ Page 16 ■ 2023 Second Quarter Report | |
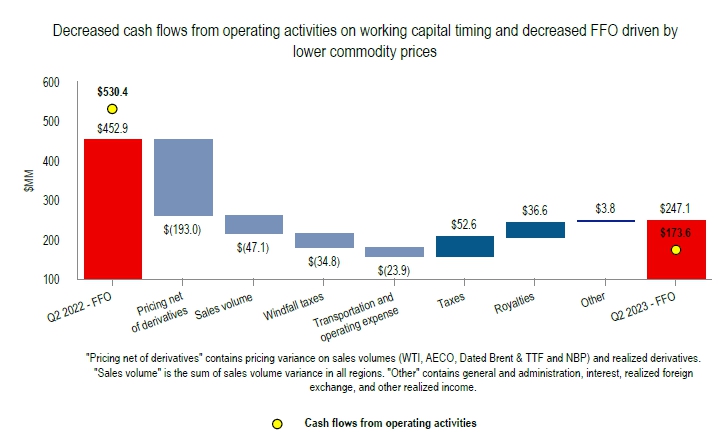
| • | We generated cash flows from operating activities of $173.6 million in Q2 2023 compared to $530.4 million in Q2 2022 and fund flows from operations of $247.1 million in Q2 2023 compared to $452.9 million in Q2 2022. The decrease in fund flows from operations was primarily driven by lower commodity prices and windfall tax recognition in 2023. This was partially offset by lower income taxes and lower royalties driven by lower commodity prices. The variance between cash flows from operating activities and fund flows from operations is primarily due to timing of windfall tax payments. |
2023 vs. 2022
| | | |
| | Vermilion Energy Inc. ■ Page 17 ■ 2023 Second Quarter Report | |
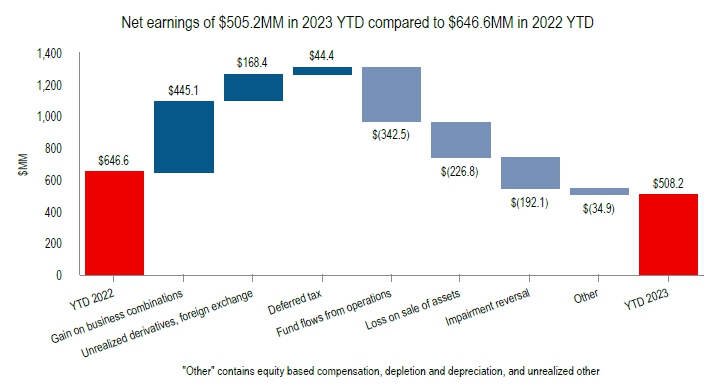
| • | For the six months ended June 30, 2023, we recorded net earnings of $508.2 million compared to $646.6 million for the comparable period in 2022. The decrease in net earnings was primarily due to a decrease in FFO driven by lower commodity prices, the loss recognized on the sale of our southeast Saskatchewan assets in Q1 2023 and non-recurring impairment reversals recorded in 2022 of $144.4 million (net of $47.7 million deferred income tax expense). This was partially offset by the gain recognized on the Corrib acquisition and unrealized commodity derivative gains in 2023. |
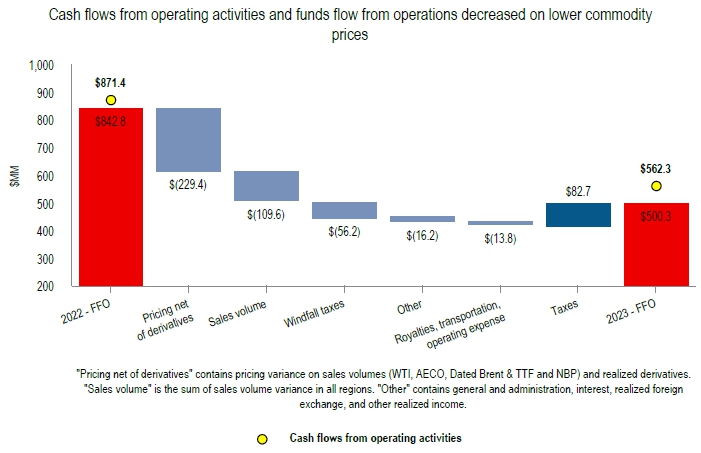
| • | For the six months ended June 30, 2023 as compared to 2022, cash flows from operating activities decreased by $309.2 million to $562.3 million and fund flows from operations decreased by $342.5 million to $500.3 million. The decrease in fund flows from operations was primarily driven by a 37% decrease in our consolidated realized price from $108.54/boe to $68.42/boe, and a decrease in sales volumes primarily driven by the Australian Wandoo platform being shut down for maintenance. The variance between cash flows from operating activities and fund flows from operations is primarily driven by non-cash working capital impact of the windfall tax payments. |
Q2 2023 vs. Q2 2022
| • | Consolidated average production of 83,152 boe/d in Q2 2023 decreased slightly compared to Q2 2022 production of 84,868 boe/d. Production decreased primarily due to fire-related downtime in West Central Alberta, the Q1 2023 sale of non-core assets in southeast Saskatchewan, and extended maintenance downtime in Australia. This was partially offset by increased production in Ireland due to the acquisition of an additional 36.5% interest in the Corrib Natural Gas Project. |
YTD 2023 vs. YTD 2022
| • | Consolidated average production of 82,805 boe/d in the six months ended June 30, 2023 decreased compared to the prior year comparative period production of 85,537 boe/d. Production decreased primarily due to unplanned downtime in Australia partially offset by increased production in Ireland due to the acquisition of an additional 36.5% interest in the Corrib Natural Gas Project. Production in Canada was relatively flat as growth in the Mica Montney assets offset unplanned downtime due to wildfires in West Central Alberta and the sale of non-core assets in southeast Saskatchewan. |
| | | |
| | Vermilion Energy Inc. ■ Page 18 ■ 2023 Second Quarter Report | |
| • | For the three months ended June 30, 2023, capital expenditures of $166.8 million were incurred. |
| • | In our North America core region, we incurred capital expenditures of $135.7 million. In Canada, capital expenditures totaled $73.5 million as we completed one (0.3 net) and brought on production five (2.0 net) Mannville liquids rich conventional natural gas wells, we drilled two (2.0 net), completed four (4.0 net), and brought on production one (1.0 net) Montney liquids rich shale gas wells. In Saskatchewan we drilled one (1.0 net), completed one (1.0 net), and brought on production one (1.0 net) light and medium crude oil well. In the United States, $62.3 million was incurred as we drilled seven (4.3 net), completed ten (5.7 net), and brought on production five (3.1 net) light and medium crude oil wells in Wyoming. |
| • | In our International core region, capital expenditures of $31.1 million were incurred during Q2 2023. Our activities included $11.3 million incurred in France primarily on subsurface maintenance and facilities activities, $5.8 million incurred in the Netherlands as we completed one (0.5 net) conventional natural gas well, $7.9 million incurred in Germany as we continued to advance our deep gas exploration and development plans, and $5.5 million incurred In Australia, as maintenance work on the Wandoo platform progressed as planned through the second quarter. |
| Financial sustainability review |
Free cash flow
| • | Free cash flow of $178.6 million decreased by $465.7 million for the six months ended June 30, 2023 compared to the prior year period which was primarily driven by decreased fund flows from operations on lower pricing, lower production, the introduction of windfall taxes in late 2022, and higher expenditures on drilling and development activities. |
Long-term debt and net debt
| • | Long-term debt decreased to $0.9 billion as at June 30, 2023 from $1.1 billion as at December 31, 2022 primarily as a result of revolving credit facility repayments of $146.6 million. |
| • | As at June 30, 2023, net debt remained flat at $1.3 billion (December 31, 2022 - $1.3 billion), primarily as a result of acquisition activities driven by the purchase of an additional 36.5% working interest in our operated Corrib project for $192.4 million (net of cash and working capital deficit acquired) and offset by revolving credit facility repayments of $146.6 million, funded by the disposition of our southeast Saskatchewan assets for $182.2 million, and $178.6 million of free cash flow generated during the year. |
| • | The ratio of net debt to four quarter trailing fund flows from operations(1) increased to 1.0 as at June 30, 2023 (December 31, 2022 - 0.8) primarily due to lower four quarter trailing fund flows from operations on lower prices. |
| (1) | Net debt to four quarter trailing fund flows from operations is a supplementary financial measure that does not have a standardized meaning under IFRS and therefore may not be comparable to similar measures presented by other issuers. It is calculated as net debt (capital measure) over the FFO from the preceding four quarters (total of segments measure). The measure is used to assess our ability to repay debt. |
| | | |
| | Vermilion Energy Inc. ■ Page 19 ■ 2023 Second Quarter Report | |
Benchmark Commodity Prices
| | Q2 2023 | Q2 2022 | Q2/23 vs. Q2/22 | YTD 2023 | YTD 2022 | 2023 vs. 2022 |
| Crude oil | | | | | | |
| WTI ($/bbl) | 99.12 | 138.39 | (28)% | 101.03 | 128.87 | (22)% |
| WTI (US $/bbl) | 73.80 | 108.41 | (32)% | 74.97 | 101.35 | (26)% |
| Edmonton Sweet index ($/bbl) | 94.92 | 137.75 | (31)% | 96.98 | 126.67 | (23)% |
| Edmonton Sweet index (US $/bbl) | 70.67 | 107.91 | (35)% | 71.96 | 99.62 | (28)% |
| Saskatchewan LSB index ($/bbl) | 93.87 | 136.48 | (31)% | 94.02 | 125.41 | (25)% |
| Saskatchewan LSB index (US $/bbl) | 69.89 | 106.92 | (35)% | 69.76 | 98.63 | (29)% |
| Canadian C5+ Condensate index ($/bbl) | 97.18 | 138.30 | (30)% | 102.55 | 129.97 | (21)% |
| Canadian C5+ Condensate index (US $/bbl) | 72.36 | 108.34 | (33)% | 76.09 | 102.22 | (26)% |
| Dated Brent ($/bbl) | 105.29 | 145.24 | (28)% | 107.59 | 136.80 | (21)% |
| Dated Brent (US $/bbl) | 78.39 | 113.78 | (31)% | 79.83 | 107.59 | (26)% |
| Natural gas | | | | | | |
| North America | | | | | | |
| AECO 5A ($/mcf) | 2.45 | 7.24 | (66)% | 2.84 | 5.99 | (53)% |
| Henry Hub ($/mcf) | 2.82 | 9.16 | (69)% | 3.72 | 7.72 | (52)% |
| Henry Hub (US $/mcf) | 2.10 | 7.18 | (71)% | 2.76 | 6.07 | (55)% |
| Europe(1) | | | | | | |
| NBP Day Ahead ($/mmbtu) | 14.02 | 20.37 | (31)% | 17.97 | 29.05 | (38)% |
| NBP Month Ahead ($/mmbtu) | 15.74 | 27.80 | (43)% | 23.77 | 33.77 | (30)% |
| NBP Day Ahead (#eu#/mmbtu) | 9.58 | 14.99 | (36)% | 12.34 | 20.91 | (41)% |
| NBP Month Ahead (#eu#/mmbtu) | 10.76 | 20.45 | (47)% | 16.31 | 24.31 | (33)% |
| TTF Day Ahead ($/mmbtu) | 15.04 | 38.08 | (61)% | 19.03 | 38.93 | (51)% |
| TTF Month Ahead ($/mmbtu) | 16.72 | 40.30 | (59)% | 24.91 | 40.53 | (39)% |
| TTF Day Ahead (#eu#/mmbtu) | 10.28 | 28.02 | (63)% | 13.06 | 28.02 | (53)% |
| TTF Month Ahead (#eu#/mmbtu) | 11.43 | 29.65 | (62)% | 17.10 | 29.17 | (41)% |
| Average exchange rates | | | | | | |
| CDN $/US $ | 1.34 | 1.28 | 5% | 1.35 | 1.27 | 6% |
| CDN $/Euro | 1.46 | 1.36 | 7% | 1.46 | 1.39 | 5% |
| Realized prices | | | | | | |
| Crude oil and condensate ($/bbl) | 96.64 | 138.55 | (30)% | 97.66 | 129.48 | (25)% |
| NGLs ($/bbl) | 28.11 | 51.86 | (46)% | 32.53 | 49.38 | (34)% |
| Natural gas ($/mcf) | 7.37 | 16.50 | (55)% | 8.94 | 16.96 | (47)% |
| Total ($/boe) | 61.74 | 111.55 | (45)% | 68.42 | 108.54 | (37)% |
| (1) | NBP and TTF pricing can occur on a day-ahead ("DA") or month-ahead ("MA") basis. DA prices in a period reflect the average current day settled price on the next days' delivery and MA prices in a period represent daily one month futures contract prices which are determined at the end of each month. In a rising price environment, the DA price will tend to be greater than the MA price and vice versa. Natural gas in the Netherlands and Germany is benchmarked to the TTF and production is generally equally split between DA and MA contracts. Natural gas in Ireland is benchmarked to the NBP and is sold on DA contracts. |
As an internationally diversified producer, we are exposed to a range of commodity prices. In our North America core region, our crude oil is sold at benchmarks linked to WTI (including the Edmonton Sweet index, the Saskatchewan LSB index, and the Canadian C5+ index) and our natural gas is sold at benchmarks linked to the AECO index (in Canada) or the Henry Hub ("HH") index (in the United States). In our International core region, our crude oil is sold with reference to Dated Brent and our natural gas is sold with reference to NBP, TTF, or indices highly correlated to TTF
| | | |
| | Vermilion Energy Inc. ■ Page 20 ■ 2023 Second Quarter Report | |
.
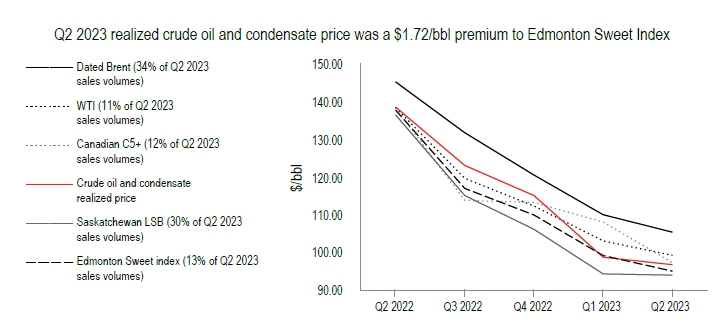
| • | Crude oil prices decreased in Q2 2023 relative to Q2 2022 as supply loss risks eased and the market increasingly focused on sluggish demand growth and monetary policy tightening. This contrasts with elevated geopolitical risks and supply loss expectations present in Q2 2022. Canadian dollar WTI and Brent prices both decreased by 28% in Q2 2023 relative to Q2 2022. |
| • | In Canadian dollar terms, year-over-year, the Edmonton Sweet differential widened by $3.56/bbl to a discount of $4.20/bbl against WTI, and the Saskatchewan LSB differential widened by $3.34/bbl to a discount of $5.25/bbl against WTI. |
| • | Approximately 34% of Vermilion’s Q2 2023 crude oil and condensate production was priced at the Dated Brent index, which averaged a premium to WTI of US$4.59/bbl, while the remainder of our crude oil and condensate production was priced at the Saskatchewan LSB, Canadian C5+, Edmonton Sweet, and WTI indices. |
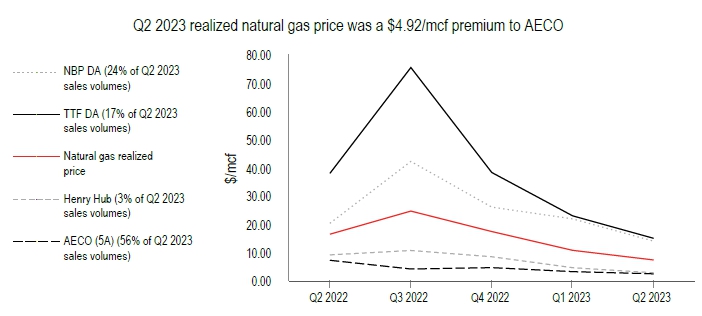
| • | In Canadian dollar terms, year-over-year, prices for European natural gas linked to NBP and TTF decreased by 31% and 61% respectively on a day-ahead basis. On a month ahead basis, NBP and TTF decreased by 43% and 59% respectively. Prices declined in response to lower demand in Europe, driven by seasonality, consumer rationing measures and contracting industrial demand, while higher LNG import volumes offset some Russian pipeline supply losses. While prices are off their Q3 2022 highs, they remained elevated compared to historical trends due to lost Russian pipeline supply, global LNG imports competitiveness, and weather related risk premiums. |
| • | Year-over-year natural gas prices in Canadian dollar terms at NYMEX HH, and AECO decreased by 66% and 69% respectively. NYMEX HH prices decreased due to warmer than normal winter weather impacting demand and strong production growth, leading to above seasonal storage levels to start the injection season. AECO basis narrowed on a year-over-year basis, but widened during the quarter on record high WCSB production levels and high storage levels. |
| • | For Q2 2023, average European natural gas prices represented a $12.93/mcf premium to AECO. Approximately 41% of our natural gas production in Q2 2023 benefited from this premium European pricing. |
| | | |
| | Vermilion Energy Inc. ■ Page 21 ■ 2023 Second Quarter Report | |
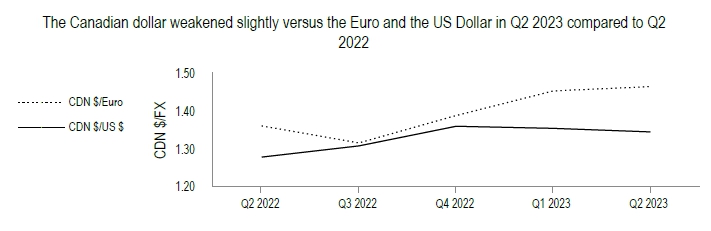
| • | For the three months ended June 30, 2023, the Canadian Dollar weakened 7% against the Euro compared to Q2 2022. |
| • | For the three months ended June 30, 2023, the Canadian Dollar weakened 5% against the US Dollar compared to Q2 2022. |
| | | |
| | Vermilion Energy Inc. ■ Page 22 ■ 2023 Second Quarter Report | |
North America
| | Q2 2023 | Q2 2022 | YTD 2023 | YTD 2022 |
| Production (1) | | | | | | | | |
| Crude oil and condensate (bbls/d) | 19,778 | | 24,801 | | 21,995 | | 24,190 | |
| NGLs (bbls/d) | 6,538 | | 8,113 | | 7,213 | | 8,226 | |
| Natural gas (mmcf/d) | 166.49 | | 150.68 | | 166.98 | | 149.40 | |
| Total production volume (boe/d) | 54,065 | | 58,027 | | 57,039 | | 57,316 | |
| (1) | Please refer to Supplemental Table 4 "Production" for disclosure by product type. |
| | Q2 2023 | Q2 2022 | YTD 2023 | YTD 2022 |
| | $M | $/boe | $M | $/boe | $M | $/boe | $M | $/boe |
| Sales | 221,980 | 45.12 | 440,096 | 83.34 | 518,332 | 50.21 | 775,689 | 74.77 |
| Royalties | (26,824) | (5.45) | (66,075) | (12.51) | (68,323) | (6.62) | (123,338) | (11.89) |
| Transportation | (7,704) | (1.57) | (11,340) | (2.15) | (20,885) | (2.02) | (21,081) | (2.03) |
| Operating | (60,116) | (12.22) | (61,142) | (11.58) | (136,335) | (13.21) | (121,994) | (11.76) |
| General and administration (1) | 514 | 0.10 | (8,043) | (1.52) | (4,857) | (0.47) | (14,468) | (1.39) |
| Corporate income tax expense (1) | (504) | (0.10) | (26) | - | (1,151) | (0.11) | (145) | (0.01) |
| Fund flows from operations | 127,346 | 25.88 | 293,470 | 55.58 | 286,781 | 27.78 | 494,663 | 47.69 |
| Drilling and development | (135,723) | | (54,913) | | (251,793) | | (112,426) | |
| Free cash flow | (8,377) | | 238,557 | | 34,988 | | 382,237 | |
| (1) | Includes amounts from Corporate segment. |
Production from our North American operations averaged 54,065 boe/d in Q2 2023, a decrease of 10% from the prior quarter primarily due to the disposition of approximately 5,500 boe/d of higher-cost assets in southeast Saskatchewan and approximately 4,000 boe/d of fire-related downtime in West Central Alberta, partially offset by new production from our Mica Montney, United States, and southeast Saskatchewan assets. All production that was temporarily shut-in as a result of the wildfires in West Central Alberta has been restored, and there was no major damage to our facilities or well sites. We will continue to monitor the forest fires and take any necessary actions to ensure the safety of our people and assets.
In West Central Alberta, we completed one (0.3 net) and brought on production five (2.0 net) Mannville liquids rich conventional natural gas wells, while at Mica we drilled two (2.0 net), completed four (4.0 net), and brought on production one (1.0 net) Montney liquids rich shale gas wells. In Saskatchewan, we drilled one (1.0 net), completed one (1.0 net), and brought on production one (1.0 net) light and medium crude oil well. In the United States, we drilled seven (4.3 net), completed ten (5.7 net), and brought on production five (3.1 net) light and medium crude oil wells in Wyoming. As part of our activity in the quarter we participated in the drilling of two (0.5 net) non-operated Parkman wells and one (0.1 net) non-operated Niobrara well. We continue to evaluate these formations as they relate to future development prospects on our Powder River Basin acreage in Wyoming.
| | Q2 2023 | Q2 2022 | YTD 2023 | YTD 2022 |
| | $M | $/boe | $M | $/boe | $M | $/boe | $M | $/boe |
| Canada | 187,789 | 42.58 | 394,604 | 81.72 | 451,886 | 48.28 | 695,469 | 73.43 |
| United States | 34,191 | 67.08 | 45,492 | 100.64 | 66,446 | 68.88 | 80,220 | 88.81 |
| North America | 221,980 | 45.12 | 440,096 | 83.34 | 518,332 | 50.21 | 775,689 | 74.77 |
Sales in North America decreased on a dollar basis for the three and six months ended June 30, 2023 versus the comparable prior year periods primarily due to decrease in production and lower realized prices across all commodities.
Sales in North America decreased on a per unit basis for the three and six months ended June 30, 2023 versus the comparable prior year periods primarily due to lower pricing across all commodities.
| | | |
| | Vermilion Energy Inc. ■ Page 23 ■ 2023 Second Quarter Report | |
| | Q2 2023 | Q2 2022 | YTD 2023 | YTD 2022 |
| | $M | $/boe | $M | $/boe | $M | $/boe | $M | $/boe |
| Canada | (18,000) | (4.08) | (54,090) | (11.20) | (50,896) | (5.44) | (102,339) | (10.81) |
| United States | (8,824) | (17.31) | (11,985) | (26.51) | (17,427) | (18.07) | (20,999) | (23.25) |
| North America | (26,824) | (5.45) | (66,075) | (12.51) | (68,323) | (6.62) | (123,338) | (11.89) |
Royalties in North America decreased on a dollar and per unit basis for the three and six months ended June 30, 2023 versus the comparable prior year periods primarily due to decreased sliding scale royalties on lower commodity prices. Royalties as a percentage of sales for the three and six months ended June 30, 2023 were 12.1% and 13.2% respectively, compared to the prior year comparative period of 15.0%. and 15.9% respectively.
| | Q2 2023 | Q2 2022 | YTD 2023 | YTD 2022 |
| | $M | $/boe | $M | $/boe | $M | $/boe | $M | $/boe |
| Canada | (7,639) | (1.73) | (11,177) | (2.31) | (20,753) | (2.22) | (20,631) | (2.18) |
| United States | (65) | (0.13) | (163) | (0.36) | (132) | (0.14) | (450) | (0.50) |
| North America | (7,704) | (1.57) | (11,340) | (2.15) | (20,885) | (2.02) | (21,081) | (2.03) |
Transportation expense in North America decreased on a dollar and per boe basis for the three months ended June 30, 2023 versus the comparable prior period due to lower production related to Alberta wildfires. For the six months ended June 30, 2023, transportation expense increased primarily due to increased costs associated with our Mica Montney assets acquired in May 2022.
| | Q2 2023 | Q2 2022 | YTD 2023 | YTD 2022 |
| | $M | $/boe | $M | $/boe | $M | $/boe | $M | $/boe |
| Canada | (53,430) | (12.12) | (55,583) | (11.51) | (123,097) | (13.15) | (111,349) | (11.76) |
| United States | (6,686) | (13.12) | (5,559) | (12.30) | (13,238) | (13.72) | (10,645) | (11.79) |
| North America | (60,116) | (12.22) | (61,142) | (11.58) | (136,335) | (13.21) | (121,994) | (11.76) |
Operating expenses in North America remained relatively flat on a dollar basis and increased on a per boe basis for the three months ended June 30, 2023 compared to the prior year period and increased on a dollar and period boe basis for the six months ended June 30, 2023 versus the comparable prior year period. The changes were primarily the result of an increase in maintenance activities, lower production due to forest fires, and inflationary pressures, partially offset by lower power prices.
| | | |
| | Vermilion Energy Inc. ■ Page 24 ■ 2023 Second Quarter Report | |
International
| | Q2 2023 | Q2 2022 | YTD 2023 | YTD 2022 |
| Production (1) | | | | | | | | |
| Crude oil and condensate (bbls/d) | 9,564 | | 11,983 | | 9,310 | | 12,746 | |
| Natural gas (mmcf/d) | 117.14 | | 89.15 | | 98.74 | | 92.84 | |
| Total production volume (boe/d) | 29,087 | | 26,840 | | 25,767 | | 28,220 | |
| Total sales volume (boe/d) | 29,824 | | 26,578 | | 25,657 | | 27,639 | |
| (1) | Please refer to Supplemental Table 4 "Production" for disclosure by product type. |
| | Q2 2023 | Q2 2022 | YTD 2023 | YTD 2022 |
| | $M | $/boe | $M | $/boe | $M | $/boe | $M | $/boe |
| Sales | 249,376 | 91.89 | 418,748 | 173.14 | 505,722 | 108.90 | 893,334 | 178.57 |
| Royalties | (20,169) | (7.43) | (17,478) | (7.23) | (46,014) | (9.91) | (31,522) | (6.30) |
| Transportation | (14,201) | (5.23) | (8,813) | (3.64) | (24,070) | (5.18) | (16,341) | (3.27) |
| Operating | (76,633) | (28.24) | (53,475) | (22.11) | (137,239) | (29.55) | (104,806) | (20.95) |
| General and administration | (20,572) | (7.58) | (7,648) | (3.16) | (35,090) | (7.56) | (15,443) | (3.09) |
| Corporate income tax expense | (18,424) | (6.79) | (69,475) | (28.73) | (40,039) | (8.62) | (115,028) | (22.99) |
| PRRT | - | - | (2,019) | (0.83) | - | - | (8,728) | (1.74) |
| Fund flows from operations | 99,377 | 36.62 | 259,840 | 107.44 | 223,270 | 48.08 | 601,466 | 120.23 |
| Drilling and development | (28,347) | | (54,575) | | (65,605) | | (79,903) | |
| Exploration and evaluation | (2,775) | | (3,665) | | (4,267) | | (6,168) | |
| Free cash flow | 68,255 | | 201,600 | | 153,398 | | 515,395 | |
Production from our International operations averaged 29,087 boe/d in Q2 2023, an increase of 30% from the prior quarter, primarily due to the acquisition of additional working interest in the Corrib Natural Gas Project ("Corrib") in Ireland, which closed on March 31, 2023. This acquisition added approximately 7,000 boe/d of European natural gas production. In the Netherlands, we completed one (0.5 net) conventional natural gas well from our Q1 2023 drilling program. In Germany, we continued to advance our deep gas exploration and development plans as we prepare for our first well to be drilled in the fourth quarter of 2023.
In Australia, we completed all remaining inspections and repair work within the primary systems on the platform in Q2 2023, and transitioned to start-up procedures in early July. While testing the systems prior to start-up we identified a leak in a pipe supplying seawater to a secondary area of the deluge fire suppression system. To ensure we have addressed any outstanding items, we have elected to replace the seawater piping at this time, which will delay startup to the end of Q3. The bulk of our focus throughout this maintenance program was on inspections and pipe replacement, which we expect to result in higher operational run-rates with less unplanned downtime in the future.
| | Q2 2023 | Q2 2022 | YTD 2023 | YTD 2022 |
| | $M | $/boe | $M | $/boe | $M | $/boe | $M | $/boe |
| Australia | - | - | 36,966 | 166.75 | - | - | 86,547 | 154.94 |
| France | 79,718 | 100.51 | 103,798 | 141.80 | 144,184 | 103.79 | 196,696 | 137.71 |
| Netherlands | 38,257 | 91.25 | 125,321 | 232.23 | 107,337 | 124.64 | 257,893 | 227.70 |
| Germany | 42,253 | 89.28 | 96,879 | 196.88 | 113,725 | 115.24 | 191,437 | 193.19 |
| Ireland | 88,689 | 86.63 | 53,277 | 125.76 | 138,176 | 99.23 | 157,306 | 179.27 |
| Central and Eastern Europe | 460 | 101.10 | 2,507 | 259.90 | 2,300 | 162.91 | 3,455 | 232.79 |
| International | 249,376 | 91.89 | 418,748 | 173.14 | 505,722 | 108.90 | 893,334 | 178.57 |
As a result of changes in inventory levels, our sales volumes for crude oil in Australia, France, and Germany may differ from our production volumes in those business units. The following table provides the crude oil sales volumes (consisting entirely of "light crude oil and medium crude oil") for those jurisdictions.
| | | |
| | Vermilion Energy Inc. ■ Page 25 ■ 2023 Second Quarter Report | |
| Crude oil sales volumes (bbls/d) | Q2 2023 | Q2 2022 | YTD 2023 | YTD 2022 |
| Australia | - | | 2,436 | | - | | 3,086 | |
| France | 8,716 | | 8,044 | | 7,675 | | 7,891 | |
| Germany | 1,525 | | 1,180 | | 1,462 | | 1,116 | |
| International | 10,241 | | 11,660 | | 9,137 | | 12,093 | |
Sales decreased on a dollar and per unit basis for the three and six months ended June 30, 2023 versus the prior year comparable periods due to lower realized prices across all business units combined with lower sales volumes.
| | Q2 2023 | Q2 2022 | YTD 2023 | YTD 2022 |
| | $M | $/boe | $M | $/boe | $M | $/boe | $M | $/boe |
| France | (10,833) | (13.66) | (11,933) | (16.30) | (17,924) | (12.90) | (20,657) | (14.46) |
| Netherlands | (6,653) | (15.87) | - | - | (21,482) | (24.94) | - | - |
| Germany | (2,496) | (5.27) | (5,073) | (10.31) | (5,399) | (5.47) | (10,116) | (10.21) |
| Central and Eastern Europe | (187) | (41.10) | (472) | (48.93) | (1,209) | (85.64) | (749) | (50.46) |
| International | (20,169) | (7.43) | (17,478) | (7.23) | (46,014) | (9.91) | (31,522) | (6.30) |
Royalties in our International core region are primarily incurred in France, Germany and the Netherlands, where royalties include charges based on a percentage of sales and fixed per boe charges. Our production in Australia and Ireland is not subject to royalties.
Royalties increased on a dollar and per unit basis for the three and six months ended June 30, 2023 versus the comparable prior periods primarily due to the implementation of windfall royalties in the Netherlands partially offset by lower sales prices in France and Germany.
Royalties as a percentage of sales for the three and six months ended June 30, 2023 of 8.1% and 9.1% increased versus the comparable prior periods of 4.2% and 3.5% primarily due to the implementation of windfall royalties in the Netherlands.
| | Q2 2023 | Q2 2022 | YTD 2023 | YTD 2022 |
| | $M | $/boe | $M | $/boe | $M | $/boe | $M | $/boe |
| France | (8,215) | (10.36) | (5,868) | (8.02) | (14,415) | (10.38) | (10,634) | (7.44) |
| Germany | (3,409) | (7.20) | (2,007) | (4.08) | (6,173) | (6.26) | (3,788) | (3.82) |
| Ireland | (2,577) | (2.52) | (938) | (2.21) | (3,482) | (2.50) | (1,919) | (2.19) |
| International | (14,201) | (5.23) | (8,813) | (3.64) | (24,070) | (5.18) | (16,341) | (3.27) |
Transportation expense increased on a dollar and per unit basis for the three and six months ended June 30, 2023 versus the comparable prior periods primarily due to tariff adjustments in Germany, increased volumes in Ireland on acquisition production, and higher vessel costs in France.
Our production in Australia, Netherlands and Central and Eastern Europe is not subject to transportation expense.
| | | |
| | Vermilion Energy Inc. ■ Page 26 ■ 2023 Second Quarter Report | |
| | Q2 2023 | Q2 2022 | YTD 2023 | YTD 2022 |
| | $M | $/boe | $M | $/boe | $M | $/boe | $M | $/boe |
| Australia | (16,415) | - | (12,498) | (56.38) | (31,746) | - | (25,838) | (46.26) |
| France | (24,756) | (31.21) | (15,459) | (21.12) | (41,303) | (29.73) | (30,489) | (21.35) |
| Netherlands | (13,691) | (32.66) | (11,004) | (20.39) | (26,603) | (30.89) | (21,474) | (18.96) |
| Germany | (10,953) | (23.14) | (10,750) | (21.85) | (21,616) | (21.90) | (19,043) | (19.22) |
| Ireland | (10,526) | (10.28) | (3,325) | (7.85) | (15,144) | (10.88) | (7,178) | (8.18) |
| Central and Eastern Europe | (292) | (64.18) | (439) | (45.51) | (827) | (58.58) | (784) | (52.82) |
| International | (76,633) | (28.24) | (53,475) | (22.11) | (137,239) | (29.55) | (104,806) | (20.95) |
For the three and six months ended June 30, 2023 versus the prior comparable periods, operating expense increased on a dollar and per unit basis. On a dollar basis increases were primarily due to maintenance costs in Ireland, Australia and Germany, and higher power prices in France. On a per unit basis, the increase was primarily attributable to the shut-in of our Wandoo platform in Australia resulting in no production as we continued maintenance.
| | | |
| | Vermilion Energy Inc. ■ Page 27 ■ 2023 Second Quarter Report | |
Consolidated Financial Performance Review
| | Q2 2023 | Q2 2022 | YTD 2023 | YTD 2022 |
| | $M | $/boe | $M | $/boe | $M | $/boe | $M | $/boe |
| Sales | 471,356 | 61.74 | 858,844 | 111.55 | 1,024,054 | 68.42 | 1,669,023 | 108.54 |
| Royalties | (46,993) | (6.16) | (83,553) | (10.85) | (114,337) | (7.64) | (154,860) | (10.07) |
| Transportation | (21,905) | (2.87) | (20,153) | (2.62) | (44,955) | (3.00) | (37,422) | (2.43) |
| Operating | (136,749) | (17.91) | (114,617) | (14.89) | (273,574) | (18.28) | (226,800) | (14.75) |
| General and administration | (20,058) | (2.63) | (15,691) | (2.04) | (39,947) | (2.67) | (29,911) | (1.95) |
| Corporate income tax expense | (18,928) | (2.48) | (69,501) | (9.03) | (41,190) | (2.75) | (115,173) | (7.49) |
| Windfall taxes | (34,784) | (4.56) | - | - | (56,224) | (3.76) | - | - |
| PRRT | - | - | (2,019) | (0.26) | - | - | (8,728) | (0.57) |
| Interest expense | (20,210) | (2.65) | (21,074) | (2.74) | (42,085) | (2.81) | (35,897) | (2.33) |
| Realized gain (loss) on derivatives | 67,673 | 8.86 | (79,778) | (10.36) | 82,003 | 5.48 | (224,001) | (14.57) |
| Realized foreign exchange gain (loss) | 3,679 | 0.48 | (2,297) | (0.30) | (1,092) | (0.07) | (1,547) | (0.10) |
| Realized other income | 4,028 | 0.53 | 2,740 | 0.36 | 7,623 | 0.51 | 8,085 | 0.53 |
| Fund flows from operations | 247,109 | 32.35 | 452,901 | 58.82 | 500,276 | 33.43 | 842,769 | 54.81 |
| Equity based compensation | (4,998) | | (7,499) | | (28,523) | | (32,868) | |
| Unrealized gain (loss) on derivative instruments (1) | 11,177 | | 168,058 | | 103,875 | | (52,736) | |
| Unrealized foreign exchange gain (loss) (1) | 35,124 | | (32,267) | | 19,646 | | 7,870 | |
| Accretion | (18,599) | | (13,746) | | (38,650) | | (27,384) | |
| Depletion and depreciation | (154,389) | | (140,763) | | (302,520) | | (275,003) | |
| Deferred tax recovery (expense) | 480 | | (63,497) | | 36,946 | | (7,404) | |
| Gain on business combination | 12,544 | | - | | 445,094 | | - | |
| Loss on disposition | - | | - | | (226,828) | | - | |
| Impairment reversal | - | | - | | - | | 192,094 | |
| Unrealized other expense (1) | (540) | | (566) | | (1,076) | | (763) | |
| Net earnings | 127,908 | | 362,621 | | 508,240 | | 646,575 | |
| (1) | Unrealized gain (loss) on derivative instruments, Unrealized foreign exchange gain (loss), and Unrealized other expense are line items from the respective Consolidated Statements of Cash Flows. |
Fluctuations in fund flows from operations may occur as a result of changes in production levels, commodity prices, and costs to produce petroleum and natural gas. In addition, fund flows from operations may be affected by the timing of crude oil shipments in Australia and France. When crude oil inventory is built up, the related operating expense, royalties, and depletion expense are deferred and carried as inventory on the consolidated balance sheet. When the crude oil inventory is subsequently drawn down, the related expenses are recognized within profit or loss.
General and administration
| • | General and administration expense increased for the three and six months ended June 30, 2023 versus the prior year comparable periods primarily due to increased consulting and IT related costs. |
PRRT and corporate income taxes
| • | PRRT decreased for the three and six months ended June 30, 2023 versus the comparable prior period due to downtime in Australia resulting in no taxable income in the current period. |
| • | Corporate income taxes for the three and six months ended June 30, 2023 decreased versus the comparable prior period primarily due to lower taxable income as a result of decreased commodity prices in 2023. |
Windfall taxes
| • | Current taxes include amounts relating to the European Union temporary solidarity contribution. The contribution set out minimum amounts to be calculated on taxable profits starting in 2022 and/or 2023, which are above a 20% increase of the average yearly taxable profits for 2018 to 2021. For 2023, the legislated rate in Germany is 33% and in Ireland is 75%. For the three and six months ended June 30, 2023, windfall tax expense was $34.8 million and $56.2 million. |
| | | |
| | Vermilion Energy Inc. ■ Page 28 ■ 2023 Second Quarter Report | |
Interest expense
| • | Interest expense decreased for the three months ended June 30, 2023 versus the comparable prior period due to lower debt levels, partially offset by an increase in the percentage of our debt with fixed interest rates following the issuance of the 2030 senior unsecured notes. |
| • | Interest expense increased for the six months ended June 30, 2023 versus the comparable prior period primarily due to an increase in the percentage of our debt with fixed interest rates following the issuance of the 2030 senior unsecured notes, combined with the impact of a weaker Canadian Dollar on US Dollar interest payments. |
Realized gain or loss on derivatives
| • | For the three and six months ended June 30, 2023, we recorded realized gains on our natural gas hedges due to lower commodity pricing compared to the strike prices. |
| • | A listing of derivative positions as at June 30, 2023 is included in “Supplemental Table 2” of this MD&A. |
Realized other income
| • | Realized other income for the three months ended June 30, 2023 increased versus the comparable prior period primarily due to higher amounts for funding under the Saskatchewan Accelerated Site Closure program in the current period. For the six months ended June 30, 2023, realized other income decreased slightly due to lower amounts for funding under the Saskatchewan Accelerated Site Closure program partially offset by insurance proceeds receivable related to the 2022 Cazaux fire in France. |
Fluctuations in net earnings from period-to-period are caused by changes in both cash and non-cash based income and charges. Cash based items are reflected in fund flows from operations. Non-cash items include: equity based compensation expense, unrealized gains and losses on derivative instruments, unrealized foreign exchange gains and losses, accretion, depletion and depreciation expense, and deferred taxes. In addition, non-cash items may also include gains resulting from business combinations or charges resulting from impairment or impairment reversals.
Equity based compensation
Equity based compensation expense relates primarily to non-cash compensation expense attributable to long-term incentives granted to directors, officers, and employees under security-based arrangements. Equity based compensation expense decreased for the three and six months ended June 30, 2023 versus the comparable prior period primarily due to the lower value of LTIP awards outstanding in the current period and lower bonuses under the employee bonus plan in the current period.
Unrealized gain or loss on derivative instruments
Unrealized gain or loss on derivative instruments arises as a result of changes in forecasts for future prices and rates. As Vermilion uses derivative instruments to manage the commodity price exposure of our future crude oil and natural gas production, we will normally recognize unrealized gains on derivative instruments when future commodity price forecasts decline and vice-versa. As derivative instruments are settled, the unrealized gain or loss previously recognized is reversed, and the settlement results in a realized gain or loss on derivative instruments.
For the three months ended June 30, 2023, we recognized a net unrealized gain on derivative instruments of $11.2 million. This consists of unrealized gains of $13.4 million on our European natural gas commodity derivative instruments, $3.4 million on our North American natural gas commodity derivative instruments, partially offset by losses of $3.8 million on our equity swaps and $1.2 million on our North American crude oil derivative instruments.
For the six months ended June 30, 2023, we recognized a net unrealized gain on derivative instruments of $103.9 million. This consists of unrealized
gains of $136.6 million on our European natural gas commodity derivative instruments which were partially offset by losses of $27.8 million on our equity swaps, $1.9 million on our USD-to-CAD foreign exchange swaps, $1.2 million on our North American natural gas commodity derivative instruments and $1.2 million on our North American crude oil derivative instruments.
Unrealized foreign exchange gains or losses
As a result of Vermilion’s international operations, Vermilion has monetary assets and liabilities denominated in currencies other than the Canadian dollar. These monetary assets and liabilities include cash, receivables, payables, long-term debt, derivative instruments and intercompany loans. Unrealized foreign exchange gains and losses result from translating these monetary assets and liabilities from their underlying currency to the Canadian dollar.
| | | |
| | Vermilion Energy Inc. ■ Page 29 ■ 2023 Second Quarter Report | |
In 2023, unrealized foreign exchange gains and losses primarily resulted from:
| • | The translation of Euro denominated intercompany loans from our international subsidiaries to Vermilion Energy Inc. An appreciation in the Euro against the Canadian dollar will result in an unrealized foreign exchange loss (and vice-versa). Under IFRS, the offsetting foreign exchange loss or gain is recorded as a currency translation adjustment within other comprehensive income. As a result, consolidated comprehensive income reflects the offsetting of these translation adjustments while net earnings reflects only the parent company's side of the translation. |
| • | The translation of our USD denominated 2025 senior unsecured notes and USD denominated 2030 senior unsecured notes. |
For the three months ended June 30, 2023, we recognized a net unrealized foreign exchange gain of $35.1 million, driven by an unrealized gain of
$20.2 million on our USD senior notes combined with an $11.4 million gain on intercompany loans due to the Euro weakening 1.8% against the Canadian dollar in Q2 2023. For the six months ended June 30, 2023, we recognized a net unrealized foreign exchange gain of $19.6 million, primarily driven by an unrealized gain on our USD senior notes.
As at June 30, 2023, a $0.01 appreciation of the Euro against the Canadian dollar would result in a $7.1 million decrease to net earnings as a result of an unrealized loss on foreign exchange, while a $0.01 appreciation of the US dollar against the Canadian dollar would result in a $5.4 million decrease to net earnings as a result of an unrealized loss on foreign exchange.
Accretion
Accretion expense is recognized to update the present value of the asset retirement obligation balance. For the three months and six months ended June 30, 2023, accretion expense increased versus the comparable prior periods primarily due to the impact of a higher asset retirement obligation balance at June 30, 2023 compared to June 30, 2022 and strengthening of the Euro against the Canadian dollar.
Depletion and depreciation
Depletion and depreciation expense is recognized to allocate the cost of capital assets over the useful life of the respective assets. Depletion and depreciation expense per unit of production is determined for each depletion unit (which are groups of assets within a specific production area that have similar economic lives) by dividing the sum of the net book value of capital assets and future development costs by total proved plus probable reserves.
Fluctuations in depletion and depreciation expense are primarily the result of changes in produced crude oil and natural gas volumes, and changes in depletion and depreciation per unit. Fluctuations in depletion and depreciation per unit are the result of changes in reserves, depletable base (net book value of capital assets and future development costs), and relative production mix.
Depletion and depreciation on a per boe basis for the three months ended June 30, 2023 of $20.22 increased from $18.28 in the comparable prior period primarily due to acquisitions completed in 2022 and early 2023 increasing the depletable base and the strengthening of the Euro against the Canadian dollar, partially offset by the Southeast Saskatchewan disposition completed at the end of Q1 2023 decreasing the depletable base.
Depletion and depreciation on a per boe basis for the six months ended June 30, 2023 of $20.21 increased from $17.88 in the comparable prior period primarily due to acquisitions completed in 2022 and early 2023 increasing 2023 depletable base, changes in reserves and strengthening of the Euro against the Canadian dollar.
Deferred tax
Deferred tax assets arise when the tax basis of an asset exceeds its accounting basis (known as a deductible temporary difference). Conversely, deferred tax liabilities arise when the tax basis of an asset is less than its accounting basis (known as a taxable temporary difference). Deferred tax assets are recognized only to the extent that it is probable that there are future taxable profits against which the deductible temporary difference can be utilized. Deferred tax assets and liabilities are measured at the enacted or substantively enacted tax rate that is expected to apply when the asset is realized, or the liability is settled.
As such, fluctuations in deferred tax expenses and recoveries primarily arise as a result of: changes in the accounting basis of an asset or liability without a corresponding tax basis change (e.g. when derivative assets and liabilities are marked-to-market or when accounting depletion differs from tax depletion), changes in available tax losses (e.g. if they are utilized to offset taxable income), changes in estimated future taxable profits resulting in a derecognition or recognition of deferred tax assets, and changes in enacted or substantively enacted tax rates.
For the six months ended June 30, 2023, the Company recorded a deferred tax recovery of $36.9 million compared to a deferred tax expense of $7.4 million in the prior year period. The recovery recorded in the current year is primarily attributable to the disposition of assets in southeast Saskatchewan in Q1 2023.
| | | |
| | Vermilion Energy Inc. ■ Page 30 ■ 2023 Second Quarter Report | |
Gain on business combination
On March 31, 2023, Vermilion purchased Equinor Energy Ireland Limited ("EEIL") from Equinor ASA. The acquisition adds an incremental 36.5% interest in the Corrib Natural Gas Project, increasing Vermilion's operated interest to 56.5%. The acquisition makes Vermilion the largest provider of domestic natural gas in Ireland.
The gain on the business combination primarily resulted from increases in working capital and the fair value of capital assets from when the purchase and sale agreement was entered into in November 2021 and when the acquisition closed in March 2023.
Loss on disposition
In March 2023, Vermilion sold non-core assets in southeast Saskatchewan for net proceeds of $182.2 million. The book value of the net assets disposed of was $409.0 million resulting in a loss on disposition of $226.8 million.
| | | |
| | Vermilion Energy Inc. ■ Page 31 ■ 2023 Second Quarter Report | |
Financial Position Review
We regularly review whether our forecast of fund flows from operations is sufficient to finance planned capital expenditures, dividends, share buy-backs, and abandonment and reclamation expenditures. To the extent that fund flows from operations forecasts are not expected to be sufficient to fulfill such expenditures, we will evaluate our ability to finance any shortfall by reducing some or all categories of expenditures, with issuances of equity, and/or with debt (including borrowing using the unutilized capacity of our existing revolving credit facility). We have a long-term goal of maintaining a ratio of net debt to four quarter trailing fund flows from operations of approximately 1.0.
As at June 30, 2023, we have a ratio of net debt to four quarter trailing fund flows from operations of 1.0. We will continue to monitor for changes in forecasted fund flows from operations and, as appropriate, will adjust our exploration, development capital plans (and associated production targets), and return of capital plans to target optimal debt levels.
Maintaining a strong balance sheet is a core principle of Vermilion and will remain a focus going forward. As debt reduction continues, we will plan to increase the amount of free cash flow that is available for the return of capital, while taking into account other capital requirements.
Net debt is reconciled to long-term debt, as follows:
| | As at |
| ($M) | Jun 30, 2023 | Dec 31, 2022 |
| Long-term debt | 913,785 | 1,081,351 |
| Adjusted working capital deficit (1) | 407,315 | 265,111 |
| Unrealized FX on swapped USD borrowings | - | (1,876) |
| Net debt | 1,321,100 | 1,344,586 |
| | | |
| Ratio of net debt to four quarter trailing fund flows from operations | 1.0 | 0.8 |
| (1) | Adjusted working capital is a non-GAAP financial measure that is not standardized under IFRS and may not be comparable to similar measures disclosed by other issuers. It is defined as current assets less current liabilities, excluding current derivatives and current lease liabilities. The measure is used to calculate net debt, a capital measure disclosed above. Reconciliation to the primary financial statement measures can be found in the “Non-GAAP and Other Specified Financial Measures” section of this document. |
As at June 30, 2023, net debt remained flat at $1.3 billion (December 31, 2022 - $1.3 billion), primarily as a result of acquisition activities driven by the purchase of an additional 36.5% working interest in our operated Corrib project for $192.4 million (net of cash and working capital deficit acquired) and offset by debt repayments of $146.6 million, funded by the disposition of our southeast Saskatchewan assets for $182.2 million and $178.6 million of free cash flow generated during the year. The ratio of net debt to four quarter trailing fund flows from operations as at June 30, 2023 increased to 1.0 (December 31, 2022 - 0.8) due to lower four quarter trailing fund flows from operations, driven primarily by pricing.
The balances recognized on our balance sheet are as follows:
| | As at |
| | Jun 30, 2023 | Dec 31, 2022 |
| Revolving credit facility | - | 147,666 |
| 2025 senior unsecured notes | 395,796 | 404,463 |
| 2030 senior unsecured notes | 517,989 | 529,222 |
| Long-term debt | 913,785 | 1,081,351 |
| | | |
| | Vermilion Energy Inc. ■ Page 32 ■ 2023 Second Quarter Report | |
Revolving Credit Facility
As at June 30, 2023, Vermilion had in place a bank revolving credit facility maturing May 29, 2027 with terms and outstanding positions as follows:
| | As at |
| ($M) | Jun 30, 2023 | Dec 31, 2022 |
| Total facility amount | 1,600,000 | 1,600,000 |
| Amount drawn | - | (147,666) |
| Letters of credit outstanding | (31,285) | (13,527) |
| Unutilized capacity | 1,568,715 | 1,438,807 |
During the quarter, the maturity date of the facility was extended to May 28, 2027 (previously May 29, 2026) and the total facility amount of $1.6 billion was unchanged. As at June 30, 2023, the facility was undrawn.
As at June 30, 2023, the revolving credit facility was subject to the following financial covenants:
| | | As at |
| Financial covenant | Limit | Jun 30, 2023 | Dec 31, 2022 |
| Consolidated total debt to consolidated EBITDA | Less than 4.0 | 0.46 | 0.51 |
| Consolidated total senior debt to consolidated EBITDA | Less than 3.5 | - | 0.07 |
| Consolidated EBITDA to consolidated interest expense | Greater than 2.5 | 23.39 | 27.10 |
Our financial covenants include financial measures defined within our revolving credit facility agreement that are not defined under IFRS. These financial measures are defined by our revolving credit facility agreement as follows:
| • | Consolidated total debt: Includes all amounts classified as “Long-term debt”, “Current portion of long-term debt”, and “Lease obligations” (including the current portion included within "Accounts payable and accrued liabilities" but excluding operating leases as defined under IAS 17) on our consolidated balance sheet. |
| • | Consolidated total senior debt: Consolidated total debt excluding unsecured and subordinated debt. |
| • | Consolidated EBITDA: Consolidated net earnings before interest, income taxes, depreciation, accretion and certain other non-cash items, adjusted for the impact of the acquisition of a material subsidiary. |
| • | Total interest expense: Includes all amounts classified as "Interest expense", but excludes interest on operating leases as defined under IAS 17. |
In addition, our revolving credit facility has provisions relating to our liability management ratings in Alberta and Saskatchewan whereby if our security adjusted liability management ratings fall below specified limits in a province, a portion of the asset retirement obligations are included in the definitions of consolidated total debt and consolidated total senior debt. An event of default occurs if our security adjusted liability management ratings breach additional lower limits for a period greater than 90 days. As of June 30, 2023, Vermilion's liability management ratings were higher than the specified levels, and as such, no amounts relating to asset retirement obligations were included in the calculation of consolidated total debt and consolidated total senior debt.
As at June 30, 2023 and December 31, 2022, Vermilion was in compliance with the above covenants.
2025 senior unsecured notes
On March 13, 2017, Vermilion issued US $300.0 million of senior unsecured notes at par. The notes bear interest at a rate of 5.625% per annum, paid semi-annually on March 15 and September 15, and mature on March 15, 2025. As direct senior unsecured obligations of Vermilion, the notes rank equally in right of payment with existing and future senior indebtedness of the Company.
The senior unsecured notes were recognized at amortized cost and include the transaction costs directly related to the issuance.
Subsequent to March 15, 2023, Vermilion may redeem some or all of the senior unsecured notes at a 100.000% redemption price plus any accrued and unpaid interest.
| | | |
| | Vermilion Energy Inc. ■ Page 33 ■ 2023 Second Quarter Report | |
2030 senior unsecured notes
On April 26, 2022, Vermilion closed a private offering of US $400.0 million 8-year senior unsecured notes. The notes were priced at 99.241% of par, mature on May 1, 2030, and bear interest at a rate of 6.875% per annum. Interest is paid semi-annually on May 1 and November 1, commencing on November 1, 2022. The notes are senior unsecured obligations of Vermilion and rank equally with existing and future senior unsecured indebtedness.
The senior unsecured notes were recognized at amortized cost and include the transaction costs directly related to the issuance.
Vermilion may, at its option, redeem the notes prior to maturity as follows:
| • | On or after May 1, 2025, Vermilion may redeem some or all of the senior unsecured notes at the redemption prices set forth below, together with accrued and unpaid interest. |
| • | Prior to May 1, 2025, Vermilion may redeem up to 35% of the original principal amount of the notes with an amount of cash not greater than the net cash proceeds of certain equity offerings at a redemption price of 106.875% of the principal amount of the notes, together with accrued and unpaid interest. |
| • | Prior to May 1, 2025, Vermilion may also redeem some or all of the notes at a price equal to 100% of the principal amount of the notes, plus a “make-whole premium,” together with applicable premium, accrued and unpaid interest. |
| Year | Redemption price |
| 2025 | 103.438 % |
| 2026 | 102.292 % |
| 2027 | 101.146 % |
| 2028 and thereafter | 100.000 % |
The following table outlines our dividend payment history:
| Date | Frequency | Dividend per unit or share |
| January 2003 to December 2007 | Monthly | $0.170 |
| January 2008 to December 2012 | Monthly | $0.190 |
| January 2013 to December 2013 | Monthly | $0.200 |
| January 2014 to March 2018 | Monthly | $0.215 |
| April 2018 to February 2020 | Monthly | $0.230 |
| March 2020 | Monthly | $0.115 |
| April 2022 to July 2022 | Quarterly | $0.060 |
| August 2022 to March 2023 | Quarterly | $0.080 |
| April 2023 onwards | Quarterly | $0.100 |
In January 2023, we announced our plan to increase the quarterly dividend by 25% to $0.10 per share effective for the planned Q1 2023 distribution.
The following table reconciles the change in shareholders’ capital:
| Shareholders’ Capital | Shares ('000s) | Amount |
| Balance at January 1 | 163,227 | 4,243,794 |
| Vesting of equity based awards | 3,428 | 21,175 |
| Shares issued for equity based compensation | 600 | 10,280 |
| Share-settled dividends on vested equity based awards | 57 | 1,051 |
| Repurchase of shares | (3,018) | (78,112) |
| Balance at June 30 | 164,294 | 4,198,188 |
As at June 30, 2023, there were approximately 4.6 million equity based compensation awards outstanding. As at August 2, 2023, there were approximately 164.0 million common shares issued and outstanding.
On July 10, 2023, the Toronto Stock Exchange approved our notice of intention to renew our normal course issuer bid ("the NCIB"). The NCIB renewal allows Vermilion to purchase up to 16,308,587 common shares (representing approximately 10% of outstanding common shares) beginning July 12, 2023 and ending July 11, 2024. Common shares purchased under the NCIB will be cancelled.
Subsequent to June 30, 2023 Vermilion purchased and cancelled 0.3 million common shares under the NCIB for total consideration of $4.7 million.
| | | |
| | Vermilion Energy Inc. ■ Page 34 ■ 2023 Second Quarter Report | |
Asset Retirement Obligations
As at June 30, 2023, asset retirement obligations were $1,033.3 million compared to $1,087.8 million as at December 31, 2022. The decrease in asset retirement obligations is primarily attributable to the disposition of our southeast Saskatchewan assets, partially offset by the acquisition of an additional 36.5% working interest in our Corrib project and accretion expense recognized. The credit spread of 4.5% at June 30, 2023 was unchanged to 4.5% at December 31, 2022.
The present value of the obligation is calculated using a credit-adjusted risk-free rate, calculated using a credit spread added to risk-free rates based on long-term, risk-free government bonds. Vermilion's credit spread is determined using the Company's expected cost of borrowing at the end of the reporting period.
The risk-free rates and credit spread used as inputs to discount the obligations were as follows:
| | 6/30/2023 | 12/31/2022 | Change |
| Credit spread added to below noted risk-free rates | 4.5 % | 4.5 % | - % |
| Country specific risk-free rate | | | |
| Canada | 3.2 % | 3.3 % | (0.1) % |
| United States | 4.0 % | 4.1 % | (0.1) % |
| France | 3.2 % | 3.4 % | (0.2) % |
| Netherlands | 2.7 % | 2.7 % | - % |
| Germany | 2.3 % | 2.5 % | (0.2) % |
| Ireland | 3.1 % | 3.2 % | (0.1) % |
| Australia | 4.0 % | 4.2 % | (0.2) % |
Current cost estimates are inflated to the estimated time of abandonment using inflation rates of between 1.6% and 4.2% (as at December 31, 2022 - between 1.6% and 4.2%).
| | | |
| | Vermilion Energy Inc. ■ Page 35 ■ 2023 Second Quarter Report | |
Risks and Uncertainties
Vermilion is exposed to various market and operational risks. For a discussion of these risks, please see Vermilion's MD&A and Annual Information Form, each for the year ended December 31, 2022 available on SEDAR+ at www.sedarplus.ca or on Vermilion’s website at www.vermilionenergy.com.
Critical Accounting Estimates
The preparation of financial statements in accordance with IFRS requires management to make estimates, judgments and assumptions that affect reported assets, liabilities, revenues and expenses, gains and losses, and disclosures of any possible contingencies. These estimates and assumptions are developed based on the best available information which management believed to be reasonable at the time such estimates and assumptions were made. As such, these assumptions are uncertain at the time estimates are made and could change, resulting in a material impact on Vermilion’s consolidated financial statements. Estimates are reviewed by management on an ongoing basis and as a result may change from period to period due to the availability of new information or changes in circumstances. Additionally, as a result of the unique circumstances of each jurisdiction that Vermilion operates in, the critical accounting estimates may affect one or more jurisdictions. There have been no material changes to our critical accounting estimates used in applying accounting policies for the six months ended June 30, 2023. Further information, including a discussion of critical accounting estimates, can be found in the notes to the Consolidated Financial Statements and annual MD&A for the year ended December 31, 2022, available on SEDAR+ at www.sedarplus.ca or on Vermilion’s website at www.vermilionenergy.com.
Off Balance Sheet Arrangements
We have not entered into any guarantee or off balance sheet arrangements that would materially impact our financial position or results of operations.
Internal Control Over Financial Reporting
There has been no change in Vermilion’s internal control over financial reporting ("ICFR") during the period covered by this MD&A that materially affected, or is reasonably likely to materially affect, our internal control over financial reporting.
Vermilion has limited the scope of design controls and procedures ("DC&P") and internal controls over financial reporting to exclude controls, policies
and procedures of Equinor Energy Ireland Limited, which was acquired on March 31, 2023. The scope limitation is in accordance with section 3.3(1)(b) of NI 52-109 which allows an issuer to limit the design of DC&P and ICFR to exclude controls, policies, and procedures of a business that the issuer acquired not more than 365 days before the end of the fiscal period.
The tables below present the summary financial information of Equinor Energy Ireland Limited included in Vermilion's financial statements as at and for the six months ended June 30, 2023:
Equinor Energy Ireland Limited:
| ($M) | As at Jun 30, 2023 |
| Non-current assets | 765,457 |
| Non-current liabilities | 81,224 |
| Net assets | 578,905 |
| ($M) | Six Months Ended Jun 30, 2023 |
| Revenue net of royalties | 56,054 |
| Net earnings | 12,559 |
Recently Adopted Accounting Pronouncements
Vermilion did not adopt any new accounting pronouncements as at June 30, 2023.
| | | |
| | Vermilion Energy Inc. ■ Page 36 ■ 2023 Second Quarter Report | |
Regulatory Pronouncements Not Yet Adopted
Issuance of IFRS Sustainability Standards - IFRS S1 "General Requirements for Disclosure of Sustainability-related Financial Information" and IFRS S2 "Climate-related Disclosures"
In June 2023 the International Sustainability Standards Board (ISSB) issued its inaugural standards - IFRS S1 and IFRS S2. The ISSB was formed as a new standard-setting board within the IFRS Foundation to issue standards that deliver a comprehensive global baseline of sustainability-related financial disclosures, operating alongside the International Accounting Standards Board.
IFRS S1 and IFRS S2 are effective for annual reporting periods beginning on or after January 1, 2024, with earlier application permitted, as long as both standards are applied. IFRS S1 provides a set of disclosure requirements designed to enable companies to communicate to investors about the sustainability-related risks and opportunities, while IFRS S2 sets out specific climate-related disclosures and is designed to be used in conjunction with IFRS S1. Canadian regulators have not yet mandated these standards; however, Vermilion is currently reviewing the impact of the standards on its financial reporting.
Disclosure Controls and Procedures
Our officers have established and maintained disclosure controls and procedures and evaluated the effectiveness of these controls in conjunction with our filings.
As of June 30, 2023, we have evaluated the effectiveness of the design and operation of our disclosure controls and procedures. Based on this evaluation, the Chief Executive Officer and the Chief Financial Officer have concluded and certified that our disclosure controls and procedures are effective.
| | | |
| | Vermilion Energy Inc. ■ Page 37 ■ 2023 Second Quarter Report | |
Supplemental Table 1: Netbacks
The following table includes financial statement information on a per unit basis by business unit. Liquids includes crude oil, condensate, and NGLs. Natural gas sales volumes have been converted on a basis of six thousand cubic feet of natural gas to one barrel of oil equivalent.
| | Q2 2023 | YTD 2023 | Q2 2022 | YTD 2022 |
| | Liquids | Natural Gas | Total | Liquids | Natural Gas | Total | Total | Total |
| | $/bbl | $/mcf | $/boe | $/bbl | $/mcf | $/boe | $/boe | $/boe |
| Canada | | | | | | | | |
| Sales | 77.32 | 2.32 | 42.58 | 79.02 | 3.22 | 48.28 | 81.72 | 73.43 |
| Royalties | (11.85) | 0.39 | (4.08) | (11.32) | 0.02 | (5.44) | (11.20) | (10.81) |
| Transportation | (2.76) | (0.15) | (1.73) | (3.03) | (0.24) | (2.22) | (2.31) | (2.18) |
| Operating | (17.28) | (1.31) | (12.12) | (17.50) | (1.51) | (13.15) | (11.51) | (11.76) |
| Operating netback | 45.43 | 1.25 | 24.65 | 47.17 | 1.49 | 27.47 | 56.70 | 48.68 |
| General and administration | | | (4.97) | | | (4.86) | (1.75) | (1.61) |
| Fund flows from operations ($/boe) | | | 19.68 | | | 22.61 | 54.95 | 47.07 |
| United States | | | | | | | | |
| Sales | 82.65 | 1.71 | 67.08 | 84.24 | 2.65 | 68.88 | 100.64 | 88.81 |
| Royalties | (21.21) | (0.51) | (17.31) | (21.98) | (0.76) | (18.07) | (26.51) | (23.25) |
| Transportation | (0.16) | - | (0.13) | (0.18) | - | (0.14) | (0.36) | (0.50) |
| Operating | (13.04) | (2.24) | (13.12) | (13.81) | (2.24) | (13.72) | (12.30) | (11.79) |
| Operating netback | 48.24 | (1.04) | 36.52 | 48.27 | (0.35) | 36.95 | 61.47 | 53.27 |
| General and administration | | | (2.50) | | | (3.93) | (1.87) | (2.69) |
| Fund flows from operations ($/boe) | | | 34.02 | | | 33.02 | 59.60 | 50.58 |
| France | | | | | | | | |
| Sales | 100.51 | - | 100.51 | 103.79 | - | 103.79 | 141.80 | 137.71 |
| Royalties | (13.66) | - | (13.66) | (12.90) | - | (12.90) | (16.30) | (14.46) |
| Transportation | (10.36) | - | (10.36) | (10.38) | - | (10.38) | (8.02) | (7.44) |
| Operating | (31.21) | - | (31.21) | (29.73) | - | (29.73) | (21.12) | (21.35) |
| Operating netback | 45.28 | - | 45.28 | 50.78 | - | 50.78 | 96.36 | 94.46 |
| General and administration | | | (9.89) | | | (9.13) | (5.07) | (5.30) |
| Current income taxes | | | (2.28) | | | (2.17) | (12.96) | (11.69) |
| Fund flows from operations ($/boe) | | | 33.11 | | | 39.48 | 78.33 | 77.47 |
| Netherlands | | | | | | | | |
| Sales | 71.92 | 15.25 | 91.25 | 77.00 | 20.88 | 124.64 | 232.23 | 227.70 |
| Royalties | - | (2.68) | (15.87) | - | (4.21) | (24.94) | - | - |
| Operating | - | (5.52) | (32.66) | - | (5.22) | (30.89) | (20.39) | (18.96) |
| Operating netback | 71.92 | 7.05 | 42.72 | 77.00 | 11.45 | 68.81 | 211.84 | 208.74 |
| General and administration | | | 2.38 | | | (1.29) | (1.61) | (1.48) |
| Current income taxes | | | (13.88) | | | (14.53) | (96.26) | (77.00) |
| Fund flows from operations ($/boe) | | | 31.22 | | | 52.99 | 113.97 | 130.26 |
| Germany | | | | | | | | |
| Sales | 99.54 | 14.17 | 89.28 | 102.62 | 19.98 | 115.24 | 196.88 | 193.19 |
| Royalties | (3.32) | (1.01) | (5.27) | (2.42) | (1.10) | (5.47) | (10.31) | (10.21) |
| Transportation | (17.92) | (0.46) | (7.20) | (14.87) | (0.52) | (6.26) | (4.08) | (3.82) |
| Operating | (21.31) | (3.98) | (23.14) | (22.05) | (3.64) | (21.90) | (21.85) | (19.22) |
| Operating netback | 56.99 | 8.72 | 53.67 | 63.28 | 14.72 | 81.61 | 160.64 | 159.94 |
| General and administration | | | (9.81) | | | (7.48) | (2.92) | (2.61) |
| Current income taxes | | | (20.48) | | | (23.08) | (16.10) | (11.01) |
| Fund flows from operations ($/boe) | | | 23.38 | | | 51.05 | 141.62 | 146.32 |
| | | |
| | Vermilion Energy Inc. ■ Page 38 ■ 2023 Second Quarter Report | |
| | Q2 2023 | YTD 2023 | Q2 2022 | YTD 2022 |
| | Liquids | Natural Gas | Total | Liquids | Natural Gas | Total | Total | Total |
| | $/bbl | $/mcf | $/boe | $/bbl | $/mcf | $/boe | $/boe | $/boe |
| Ireland | | | | | | | | |
| Sales | - | 14.43 | 86.63 | - | 16.53 | 99.23 | 125.76 | 179.27 |
| Transportation | - | (0.42) | (2.52) | - | (0.42) | (2.50) | (2.21) | (2.19) |
| Operating | - | (1.71) | (10.28) | - | (1.81) | (10.88) | (7.85) | (8.18) |
| Operating netback | - | 12.30 | 73.83 | - | 14.30 | 85.85 | 115.70 | 168.90 |
| General and administration | | | (4.65) | | | (4.34) | 1.40 | 0.42 |
| Current income taxes | | | (0.22) | | | (0.16) | - | - |
| Fund flows from operations ($/boe) | | | 68.96 | | | 81.35 | 117.10 | 169.32 |
| Australia | | | | | | | | |
| Sales | - | - | - | - | - | - | 166.75 | 154.94 |
| Operating | - | - | - | - | - | - | (56.38) | (46.26) |
| PRRT (2) | - | - | - | - | - | - | (9.11) | (15.62) |
| Operating netback | - | - | - | - | - | - | 101.26 | 93.06 |
| General and administration | | | - | | | - | (4.77) | (3.40) |
| Current income taxes | | | - | | | - | (0.52) | (0.38) |
| Fund flows from operations ($/boe) | | | - | | | - | 95.97 | 89.28 |
| Total Company | | | | | | | | |
| Sales | 84.41 | 7.37 | 61.74 | 85.43 | 8.94 | 68.42 | 111.55 | 108.54 |
| Realized hedging gain (loss) | 0.51 | 2.56 | 8.86 | 0.25 | 1.67 | 5.48 | (10.36) | (14.57) |
| Royalties | (13.03) | (0.14) | (6.16) | (12.42) | (0.58) | (7.64) | (10.85) | (10.07) |
| Transportation | (4.93) | (0.21) | (2.87) | (4.65) | (0.26) | (3.00) | (2.62) | (2.43) |
| Operating | (24.62) | (2.12) | (17.91) | (23.61) | (2.28) | (18.28) | (14.89) | (14.75) |
| PRRT (2) | - | - | - | - | - | - | (0.26) | (0.57) |
| Operating netback | 42.34 | 7.46 | 43.66 | 45.00 | 7.49 | 44.98 | 72.57 | 66.15 |
| General and administration | | | (2.63) | | | (2.67) | (2.04) | (1.95) |
| Interest expense | | | (2.65) | | | (2.81) | (2.74) | (2.33) |
| Realized foreign exchange | | | 0.48 | | | (0.07) | (0.30) | (0.10) |
| Other income | | | 0.53 | | | 0.51 | 0.36 | 0.53 |
| Corporate income taxes | | | (2.48) | | | (2.75) | (9.03) | (7.49) |
| Windfall taxes | | | (4.56) | | | (3.76) | - | - |
| Fund flows from operations ($/boe) | | | 32.35 | | | 33.43 | 58.82 | 54.81 |
| (1) | Vermilion considers Australian PRRT to be an operating item and, accordingly, has included PRRT in the calculation of operating netbacks. Current income taxes presented above excludes PRRT. |
| | | |
| | Vermilion Energy Inc. ■ Page 39 ■ 2023 Second Quarter Report | |
Supplemental Table 2: Hedges
The prices in these tables may represent the weighted averages for several contracts with foreign currency amounts translated to the disclosure currency using forward rates as at the month-end date. The weighted average price for the portfolio of options listed below may not have the same payoff profile as the individual contracts. As such, the presentation of the weighted average prices is purely for indicative purposes.
The following tables outline Vermilion’s outstanding risk management positions as at June 30, 2023:
| | Unit | Currency | Daily Bought Put Volume | Weighted Average Bought Put Price | Daily Sold Call Volume | Weighted Average Sold Call Price | Daily Sold Put Volume | Weighted Average Sold Put Price | Daily Sold Swap Volume | Weighted Average Sold Swap Price | Daily Bought Swap Volume | Weighted Average Bought Swap Price |
| AECO | | |
| Q3 2023 | mcf | CAD | - | - | - | - | - | - | 18,956 | 3.86 | - | - |
| Q4 2023 | mcf | CAD | - | - | - | - | - | - | 6,387 | 3.86 | - | - |
| Q1 2024 | mcf | CAD | 4,739 | 3.17 | 4,739 | 4.22 | - | - | 4,739 | 3.69 | - | - |
| Q2 2024 | mcf | CAD | 4,739 | 3.17 | 4,739 | 4.22 | - | - | 4,739 | 3.69 | - | - |
| Q3 2024 | mcf | CAD | 4,739 | 3.17 | 4,739 | 4.22 | - | - | 4,739 | 3.69 | - | - |
| Q4 2024 | mcf | CAD | 4,739 | 3.17 | 4,739 | 4.22 | - | - | 4,739 | 3.69 | - | - |
| Q1 2025 | mcf | CAD | 4,739 | 3.17 | 4,739 | 4.22 | - | - | 4,739 | 3.69 | - | - |
| Q2 2025 | mcf | CAD | 4,739 | 3.17 | 4,739 | 4.22 | - | - | 4,739 | 3.69 | - | - |
| Q3 2025 | mcf | CAD | 4,739 | 3.17 | 4,739 | 4.22 | - | - | 4,739 | 3.69 | - | - |
| Q4 2025 | mcf | CAD | 4,739 | 3.17 | 4,739 | 4.22 | - | - | 4,739 | 3.69 | - | - |
| Q1 2026 | mcf | CAD | 4,739 | 3.17 | 4,739 | 4.22 | - | - | 4,739 | 3.69 | - | - |
| Q2 2026 | mcf | CAD | 4,739 | 3.17 | 4,739 | 4.22 | - | - | 4,739 | 3.69 | - | - |
| Q3 2026 | mcf | CAD | 4,739 | 3.17 | 4,739 | 4.22 | - | - | 4,739 | 3.69 | - | - |
| Q4 2026 | mcf | CAD | 4,739 | 3.17 | 4,739 | 4.22 | - | - | 4,739 | 3.69 | - | - |
| AECO Basis (AECO less NYMEX Henry Hub) | | |
| Q3 2023 | mcf | USD | - | - | - | - | - | - | 43,000 | (1.29) | - | - |
| Q4 2023 | mcf | USD | - | - | - | - | - | - | 14,489 | (1.29) | - | - |
| NYMEX Henry Hub | | |
| Q3 2023 | mcf | USD | 5,000 | 4.00 | 5,000 | 8.75 | - | - | - | - | - | - |
| Q4 2023 | mcf | USD | 1,685 | 4.00 | 1,685 | 8.75 | - | - | - | - | - | - |
| Q1 2024 | mcf | USD | 15,000 | 3.50 | 15,000 | 4.48 | - | - | - | - | - | - |
| Q2 2024 | mcf | USD | 15,000 | 3.50 | 15,000 | 4.48 | - | - | - | - | - | - |
| Q3 2024 | mcf | USD | 15,000 | 3.50 | 15,000 | 4.48 | - | - | - | - | - | - |
| Q4 2024 | mcf | USD | 15,000 | 3.50 | 15,000 | 4.48 | - | - | - | - | - | - |
| Q1 2025 | mcf | USD | 15,000 | 3.50 | 15,000 | 4.48 | - | - | - | - | - | - |
| Q2 2025 | mcf | USD | 15,000 | 3.50 | 15,000 | 4.48 | - | - | - | - | - | - |
| Q3 2025 | mcf | USD | 15,000 | 3.50 | 15,000 | 4.48 | - | - | - | - | - | - |
| Q4 2025 | mcf | USD | 15,000 | 3.50 | 15,000 | 4.48 | - | - | - | - | - | - |
| Q1 2026 | mcf | USD | 15,000 | 3.50 | 15,000 | 4.48 | - | - | - | - | - | - |
| Q2 2026 | mcf | USD | 15,000 | 3.50 | 15,000 | 4.48 | - | - | - | - | - | - |
| Q3 2026 | mcf | USD | 15,000 | 3.50 | 15,000 | 4.48 | - | - | - | - | - | - |
| Q4 2026 | mcf | USD | 15,000 | 3.50 | 15,000 | 4.48 | - | - | - | - | - | - |
| | | |
| | Vermilion Energy Inc. ■ Page 40 ■ 2023 Second Quarter Report | |
| | Unit | Currency | Daily Bought Put Volume | Weighted Average Bought Put Price | Daily Sold Call Volume | Weighted Average Sold Call Price | Daily Sold Put Volume | Weighted Average Sold Put Price | Daily Sold Swap Volume | Weighted Average Sold Swap Price | Daily Bought Swap Volume | Weighted Average Bought Swap Price |
| NBP | | |
| Q3 2023 (1) | mcf | EUR | 2,457 | 22.71 | 2,457 | 35.90 | - | - | 27,146 | 9.89 | - | - |
| Q4 2023 (1) | mcf | EUR | 4,913 | 8.79 | 4,913 | 21.98 | - | - | 28,209 | 10.64 | - | - |
| Q1 2024 | mcf | EUR | 4,913 | 41.03 | 4,913 | 84.26 | - | - | - | - | - | - |
| Q2 2024 | mcf | EUR | - | - | - | - | - | - | 2,457 | 14.65 | - | - |
| Q3 2024 | mcf | EUR | - | - | - | - | - | - | 2,457 | 14.65 | - | - |
| TTF | | |
| Q3 2023 | mcf | EUR | 19,654 | 34.53 | 19,654 | 53.21 | - | - | - | - | - | - |
| Q4 2023 | mcf | EUR | 12,284 | 44.84 | 12,284 | 84.99 | - | - | 3,685 | 67.41 | - | - |
| Q1 2024 | mcf | EUR | 31,938 | 40.69 | 31,938 | 78.00 | - | - | 3,685 | 67.41 | - | - |
| Q2 2024 | mcf | EUR | 3,593 | 37.56 | 3,593 | 74.66 | - | - | 24,567 | 13.88 | - | - |
| Q3 2024 | mcf | EUR | 3,593 | 37.56 | 3,593 | 74.66 | - | - | 24,567 | 13.88 | - | - |
| (1) | NBP swaps were acquired as part of the Corrib acquisition on March 31, 2023. These swaps are contracted as p/therm and have been converted to #eu#/mcf for the purposes of this disclosure. |
| VET Equity Swaps | | | Initial Share Price | Share Volume |
| Swap | Jan 2020 - Apr 2025 | | | | 20.9788 | CAD | 2,250,000 |
| Swap | Jan 2020 - Jul 2025 | | | | 22.4587 | CAD | 1,500,000 |
The following sold option instruments allow the counterparties, at the specified date, to enter into a derivative instrument contract with Vermilion at the detailed terms:
| Period if Option Exercised | Unit | Currency | Option Expiration Date | Daily Sold Swap Volume | Weighted Average Sold Swap Price |
| WTI |
| Oct 2023 - Mar 2024 | bbl | USD | 29-Sep-2023 | 2,500 | 75.00 |
| | | |
| | Vermilion Energy Inc. ■ Page 41 ■ 2023 Second Quarter Report | |
Supplemental Table 3: Capital Expenditures and Acquisitions
| By classification ($M) | Q2 2023 | Q2 2022 | YTD 2023 | YTD 2022 |
| Drilling and development | 164,070 | 109,488 | 317,398 | 192,329 |
| Exploration and evaluation | 2,775 | 3,665 | 4,267 | 6,168 |
| Capital expenditures | 166,845 | 113,153 | 321,665 | 198,497 |
| | | | | |
| Acquisitions, net of cash acquired | 2,196 | 497,800 | 136,421 | 504,512 |
| Acquisition of securities | 632 | 18,301 | 2,108 | 18,301 |
| Acquired working capital (surplus) deficit | (12,544) | 6,122 | 103,527 | 6,122 |
| Acquisitions | (9,716) | 522,223 | 242,056 | 528,935 |
| | | | | |
| Dispositions ($M) | Q2 2023 | Q2 2022 | YTD 2023 | YTD 2022 |
| Canada | - | - | 182,152 | - |
| Total dispositions | - | - | 182,152 | - |
| | | | | |
| By category ($M) | Q2 2023 | Q2 2022 | YTD 2023 | YTD 2022 |
| Drilling, completion, new well equip and tie-in, workovers and recompletions | 112,393 | 81,211 | 245,031 | 151,888 |
| Production equipment and facilities | 43,849 | 27,082 | 64,415 | 34,995 |
| Seismic, studies, land and other | 10,603 | 4,860 | 12,219 | 11,614 |
| Capital expenditures | 166,845 | 113,153 | 321,665 | 198,497 |
| Acquisitions | (9,716) | 522,223 | 242,056 | 528,935 |
| Total capital expenditures and acquisitions | 157,129 | 635,376 | 563,721 | 727,432 |
| | | | | |
| Capital expenditures by country ($M) | Q2 2023 | Q2 2022 | YTD 2023 | YTD 2022 |
| Canada | 73,471 | 30,849 | 175,321 | 80,377 |
| United States | 62,252 | 24,064 | 76,472 | 32,049 |
| France | 11,326 | 11,913 | 23,011 | 18,924 |
| Netherlands | 5,815 | 1,369 | 16,198 | 1,873 |
| Germany | 7,853 | 3,574 | 16,017 | 12,734 |
| Ireland | (619) | 656 | 1,439 | 972 |
| Australia | 5,470 | 37,825 | 10,602 | 45,352 |
| Central and Eastern Europe | 1,277 | 2,903 | 2,605 | 6,216 |
| Total capital expenditures | 166,845 | 113,153 | 321,665 | 198,497 |
| | | | | |
| Acquisitions by country ($M) | Q2 2023 | Q2 2022 | YTD 2023 | YTD 2022 |
| Canada | 680 | 522,351 | 45,830 | 525,059 |
| United States | 2,148 | 1,055 | 3,808 | 1,075 |
| Germany | - | (1,183) | - | 2,659 |
| Ireland | (12,544) | - | 192,418 | 142 |
| Acquisitions | (9,716) | 522,223 | 242,056 | 528,935 |
| | | |
| | Vermilion Energy Inc. ■ Page 42 ■ 2023 Second Quarter Report | |
Supplemental Table 4: Production
| | Q2/23 | Q1/23 | Q4/22 | Q3/22 | Q2/22 | Q1/22 | Q4/21 | Q3/21 | Q2/21 | Q1/21 | Q4/20 | Q3/20 |
| Canada | | | | | | | | | | | | |
| Light and medium crude oil (bbls/d) | 12,901 | 16,674 | 17,448 | 16,835 | 17,042 | 15,980 | 16,388 | 16,809 | 16,868 | 17,767 | 19,301 | 19,847 |
| Condensate (1) (bbls/d) | 3,506 | 4,719 | 4,525 | 4,204 | 4,873 | 4,892 | 4,785 | 4,426 | 5,558 | 4,556 | 4,662 | 5,200 |
| Other NGLs (1) (bbls/d) | 5,513 | 6,875 | 6,279 | 6,870 | 7,155 | 7,286 | 7,073 | 6,862 | 7,767 | 7,016 | 7,334 | 8,350 |
| NGLs (bbls/d) | 9,019 | 11,594 | 10,804 | 11,074 | 12,028 | 12,178 | 11,858 | 11,288 | 13,325 | 11,572 | 11,996 | 13,550 |
| Conventional natural gas (mmcf/d) | 159.26 | 160.34 | 146.81 | 145.04 | 143.94 | 140.55 | 128.85 | 138.42 | 146.55 | 138.41 | 135.27 | 155.15 |
| Total (boe/d) | 48,464 | 54,991 | 52,720 | 52,080 | 53,060 | 51,584 | 49,720 | 51,168 | 54,618 | 52,407 | 53,840 | 59,256 |
| United States | | | | | | | | | | | | |
| Light and medium crude oil (bbls/d) | 3,349 | 2,824 | 3,282 | 2,824 | 2,846 | 2,675 | 2,647 | 3,520 | 1,888 | 2,322 | 2,495 | 3,243 |
| Condensate (1) (bbls/d) | 22 | 20 | 36 | 35 | 40 | 24 | 26 | 2 | 2 | - | 1 | 6 |
| Other NGLs (1) (bbls/d) | 1,025 | 1,020 | 1,218 | 1,031 | 958 | 1,056 | 1,388 | 1,206 | 928 | 1,058 | 1,294 | 1,158 |
| NGLs (bbls/d) | 1,047 | 1,040 | 1,254 | 1,066 | 998 | 1,080 | 1,414 | 1,208 | 930 | 1,058 | 1,295 | 1,164 |
| Conventional natural gas (mmcf/d) | 7.23 | 7.14 | 7.45 | 7.03 | 6.74 | 7.56 | 9.09 | 6.75 | 5.51 | 5.95 | 6.87 | 7.94 |
| Total (boe/d) | 5,601 | 5,055 | 5,779 | 5,062 | 4,967 | 5,014 | 5,575 | 5,854 | 3,736 | 4,373 | 4,934 | 5,730 |
| France | | | | | | | | | | | | |
| Light and medium crude oil (bbls/d) | 7,788 | 7,578 | 7,247 | 6,818 | 8,126 | 8,389 | 8,453 | 8,677 | 9,013 | 9,062 | 9,255 | 9,347 |
| Total (boe/d) | 7,788 | 7,578 | 7,247 | 6,818 | 8,126 | 8,389 | 8,453 | 8,677 | 9,013 | 9,062 | 9,255 | 9,347 |
| Netherlands | | | | | | | | | | | | |
| Light and medium crude oil (bbls/d) | - | - | - | - | 1 | 1 | - | 6 | 1 | 6 | 1 | - |
| Condensate (1) (bbls/d) | 61 | 66 | 49 | 74 | 60 | 83 | 97 | 104 | 95 | 92 | 99 | 83 |
| NGLs (bbls/d) | 61 | 66 | 49 | 74 | 60 | 83 | 97 | 104 | 95 | 92 | 99 | 83 |
| Conventional natural gas (mmcf/d) | 27.28 | 29.07 | 27.41 | 29.15 | 35.22 | 39.03 | 51.98 | 42.48 | 37.59 | 41.45 | 42.95 | 46.09 |
| Total (boe/d) | 4,607 | 4,910 | 4,617 | 4,933 | 5,930 | 6,589 | 8,761 | 7,190 | 6,362 | 7,006 | 7,257 | 7,764 |
| Germany | | | | | | | | | | | | |
| Light and medium crude oil (bbls/d) | 1,715 | 1,410 | 1,481 | 1,764 | 1,331 | 1,158 | 1,127 | 1,043 | 1,093 | 911 | 960 | 964 |
| Conventional natural gas (mmcf/d) | 22.05 | 25.85 | 25.86 | 26.54 | 25.36 | 26.95 | 18.00 | 16.19 | 15.60 | 13.40 | 11.50 | 11.25 |
| Total (boe/d) | 5,391 | 5,717 | 5,791 | 6,187 | 5,558 | 5,650 | 4,127 | 3,741 | 3,694 | 3,144 | 2,876 | 2,839 |
| Ireland | | | | | | | | | | | | |
| Conventional natural gas (mmcf/d) | 67.51 | 24.58 | 26.04 | 25.74 | 27.93 | 30.26 | 30.12 | 22.67 | 30.19 | 34.14 | 34.76 | 35.12 |
| Total (boe/d) | 11,251 | 4,096 | 4,340 | 4,290 | 4,655 | 5,043 | 5,020 | 3,778 | 5,031 | 5,690 | 5,793 | 5,853 |
| Australia | | | | | | | | | | | | |
| Light and medium crude oil (bbls/d) | - | - | 4,847 | 4,763 | 2,465 | 3,888 | 2,742 | 4,190 | 3,835 | 4,489 | 3,781 | 4,549 |
| Total (boe/d) | - | - | 4,847 | 4,763 | 2,465 | 3,888 | 2,742 | 4,190 | 3,835 | 4,489 | 3,781 | 4,549 |
| Central and Eastern Europe | | | | | | | | | | | | |
| Conventional natural gas (mmcf/d) | 0.30 | 0.64 | 0.67 | 0.63 | 0.64 | 0.34 | 0.12 | 0.22 | 0.28 | 0.63 | 0.67 | 0.80 |
| Total (boe/d) | 50 | 107 | 111 | 104 | 106 | 57 | 20 | 36 | 46 | 104 | 111 | 132 |
| Consolidated | | | | | | | | | | | | |
| Light and medium crude oil (bbls/d) | 25,753 | 28,485 | 34,305 | 33,003 | 31,811 | 32,091 | 31,356 | 34,245 | 32,698 | 34,556 | 35,793 | 37,951 |
| Condensate (1) (bbls/d) | 3,589 | 4,805 | 4,610 | 4,312 | 4,973 | 4,999 | 4,908 | 4,532 | 5,656 | 4,648 | 4,762 | 5,289 |
| Other NGLs (1) (bbls/d) | 6,538 | 7,896 | 7,497 | 7,901 | 8,113 | 8,342 | 8,461 | 8,068 | 8,695 | 8,074 | 8,627 | 9,509 |
| NGLs (bbls/d) | 10,127 | 12,701 | 12,107 | 12,213 | 13,086 | 13,341 | 13,369 | 12,600 | 14,351 | 12,722 | 13,389 | 14,798 |
| Conventional natural gas (mmcf/d) | 283.63 | 247.61 | 234.23 | 234.12 | 239.83 | 244.69 | 238.16 | 226.73 | 235.72 | 233.98 | 232.00 | 256.34 |
| Total (boe/d) | 83,152 | 82,455 | 85,450 | 84,237 | 84,868 | 86,213 | 84,417 | 84,633 | 86,335 | 86,276 | 87,848 | 95,471 |
| | | |
| | Vermilion Energy Inc. ■ Page 43 ■ 2023 Second Quarter Report | |
| | | | | | | YTD 2023 | 2022 | 2021 | 2020 | 2019 | 2018 |
| Canada | | | | | | | | | | | | |
| Light and medium crude oil (bbls/d) | | | | | | | 14,777 | 16,830 | 16,954 | 21,106 | 23,971 | 17,400 |
| Condensate (1) (bbls/d) | | | | | | | 4,109 | 4,621 | 4,831 | 4,886 | 4,295 | 3,754 |
| Other NGLs (1) (bbls/d) | | | | | | | 6,190 | 6,895 | 7,179 | 7,719 | 6,988 | 5,914 |
| NGLs (bbls/d) | | | | | | | 10,299 | 11,516 | 12,010 | 12,605 | 11,283 | 9,668 |
| Conventional natural gas (mmcf/d) | | | | | | | 159.80 | 144.10 | 138.03 | 151.38 | 148.35 | 129.37 |
| Total (boe/d) | | | | | | | 51,709 | 52,364 | 51,968 | 58,942 | 59,979 | 48,630 |
| United States | | | | | | | | | | | | |
| Light and medium crude oil (bbls/d) | | | | | | | 3,088 | 2,908 | 2,597 | 3,046 | 2,514 | 1,069 |
| Condensate (1) (bbls/d) | | | | | | | 21 | 34 | 8 | 5 | 18 | 8 |
| Other NGLs (1) (bbls/d) | | | | | | | 1,023 | 1,066 | 1,146 | 1,218 | 996 | 452 |
| NGLs (bbls/d) | | | | | | | 1,044 | 1,100 | 1,154 | 1,223 | 1,014 | 460 |
| Conventional natural gas (mmcf/d) | | | | | | | 7.19 | 7.20 | 6.84 | 7.47 | 6.89 | 2.78 |
| Total (boe/d) | | | | | | | 5,330 | 5,207 | 4,890 | 5,514 | 4,675 | 1,992 |
| France | | | | | | | | | | | | |
| Light and medium crude oil (bbls/d) | | | | | | | 7,684 | 7,639 | 8,799 | 8,903 | 10,435 | 11,362 |
| Conventional natural gas (mmcf/d) | | | | | | | - | - | - | - | 0.19 | 0.21 |
| Total (boe/d) | | | | | | | 7,684 | 7,639 | 8,799 | 8,903 | 10,467 | 11,396 |
| Netherlands | | | | | | | | | | | | |
| Light and medium crude oil (bbls/d) | | | | | | | - | - | 3 | 1 | 3 | - |
| Condensate (1) (bbls/d) | | | | | | | 63 | 66 | 97 | 88 | 88 | 90 |
| NGLs (bbls/d) | | | | | | | 63 | 66 | 97 | 88 | 88 | 90 |
| Conventional natural gas (mmcf/d) | | | | | | | 28.17 | 32.66 | 43.40 | 46.16 | 49.10 | 46.13 |
| Total (boe/d) | | | | | | | 4,758 | 5,510 | 7,334 | 7,782 | 8,274 | 7,779 |
| Germany | | | | | | | | | | | | |
| Light and medium crude oil (bbls/d) | | | | | | | 1,563 | 1,435 | 1,044 | 968 | 917 | 1,004 |
| Conventional natural gas (mmcf/d) | | | | | | | 23.94 | 26.18 | 15.81 | 12.65 | 15.31 | 15.66 |
| Total (boe/d) | | | | | | | 5,553 | 5,798 | 3,679 | 3,076 | 3,468 | 3,614 |
| Ireland | | | | | | | | | | | | |
| Conventional natural gas (mmcf/d) | | | | | | | 46.16 | 27.48 | 29.25 | 37.44 | 46.57 | 55.17 |
| Total (boe/d) | | | | | | | 7,693 | 4,579 | 4,875 | 6,240 | 7,762 | 9,195 |
| Australia | | | | | | | | | | | | |
| Light and medium crude oil (bbls/d) | | | | | | | - | 3,995 | 3,810 | 4,416 | 5,662 | 4,494 |
| Total (boe/d) | | | | | | | - | 3,995 | 3,810 | 4,416 | 5,662 | 4,494 |
| Central and Eastern Europe | | | | | | | | | | | | |
| Conventional natural gas (mmcf/d) | | | | | | | 0.47 | 0.57 | 0.31 | 1.90 | 0.42 | 1.02 |
| Total (boe/d) | | | | | | | 78 | 95 | 51 | 317 | 70 | 169 |
| Consolidated | | | | | | | | | | | | |
| Light and medium crude oil (bbls/d) | | | | | | | 27,112 | 32,809 | 33,208 | 38,441 | 43,502 | 35,329 |
| Condensate (1) (bbls/d) | | | | | | | 4,193 | 4,721 | 4,936 | 4,980 | 4,400 | 3,853 |
| Other NGLs (1) (bbls/d) | | | | | | | 7,213 | 7,961 | 8,325 | 8,937 | 7,984 | 6,366 |
| NGLs (bbls/d) | | | | | | | 11,406 | 12,682 | 13,261 | 13,917 | 12,384 | 10,219 |
| Conventional natural gas (mmcf/d) | | | | | | | 265.73 | 238.18 | 233.64 | 256.99 | 266.82 | 250.33 |
| Total (boe/d) | | | | | | | 82,805 | 85,187 | 85,408 | 95,190 | 100,357 | 87,270 |
| (1) | Under National Instrument 51-101 "Standards of Disclosure for Oil and Gas Activities", disclosure of production volumes should include segmentation by product type as defined in the instrument. This table provides a reconciliation from "crude oil and condensate", "NGLs" and "natural gas" to the product types. In this report, references to "crude oil" and "light and medium crude oil" mean "light crude oil and medium crude oil" and references to "natural gas" mean "conventional natural gas". Production volumes reported are based on quantities as measured at the first point of sale. |
| | | |
| | Vermilion Energy Inc. ■ Page 44 ■ 2023 Second Quarter Report | |
Supplemental Table 5: Operational and Financial Data by Core Region
Production volumes (1)
| | Q2/23 | Q1/23 | Q4/22 | Q3/22 | Q2/22 | Q1/22 | Q4/21 | Q3/21 | Q2/21 | Q1/21 | Q4/20 | Q3/20 |
| North America | | | | | | | | | | | | |
| Crude oil and condensate (bbls/d) | 19,778 | 24,237 | 25,291 | 23,898 | 24,801 | 23,571 | 23,846 | 24,757 | 24,316 | 24,645 | 26,459 | 28,296 |
| NGLs (bbls/d) | 6,538 | 7,895 | 7,497 | 7,901 | 8,113 | 8,342 | 8,461 | 8,068 | 8,695 | 8,074 | 8,628 | 9,508 |
| Natural gas (mmcf/d) | 166.49 | 167.48 | 154.26 | 152.07 | 150.68 | 148.11 | 137.93 | 145.18 | 152.06 | 144.36 | 142.13 | 163.09 |
| Total (boe/d) | 54,065 | 60,046 | 58,499 | 57,142 | 58,027 | 56,598 | 55,295 | 57,022 | 58,354 | 56,780 | 58,774 | 64,986 |
| | | | | | | | | | | | | |
| International | | | | | | | | | | | | |
| Crude oil and condensate (bbls/d) | 9,564 | 9,054 | 13,624 | 13,419 | 11,983 | 13,519 | 12,419 | 14,020 | 14,037 | 14,560 | 14,096 | 14,943 |
| Natural gas (mmcf/d) | 117.14 | 80.13 | 79.97 | 82.05 | 89.15 | 96.58 | 100.22 | 81.55 | 83.66 | 89.62 | 89.86 | 93.25 |
| Total (boe/d) | 29,087 | 22,408 | 26,953 | 27,095 | 26,840 | 29,616 | 29,123 | 27,612 | 27,981 | 29,495 | 29,073 | 30,484 |
| | | | | | | | | | | | | |
| Consolidated | | | | | | | | | | | | |
| Crude oil and condensate (bbls/d) | 29,341 | 33,290 | 38,915 | 37,315 | 36,784 | 37,090 | 36,264 | 38,777 | 38,354 | 39,204 | 40,555 | 43,240 |
| NGLs (bbls/d) | 6,538 | 7,896 | 7,497 | 7,901 | 8,113 | 8,342 | 8,461 | 8,068 | 8,695 | 8,074 | 8,627 | 9,509 |
| Natural gas (mmcf/d) | 283.63 | 247.61 | 234.23 | 234.12 | 239.83 | 244.69 | 238.16 | 226.73 | 235.72 | 233.98 | 232.00 | 256.34 |
| Total (boe/d) | 83,152 | 82,455 | 85,450 | 84,237 | 84,868 | 86,213 | 84,417 | 84,633 | 86,335 | 86,276 | 87,848 | 95,471 |
| (1) | Please refer to Supplemental Table 4 "Production" for disclosure by product type. |
Sales volumes
| | Q2/23 | Q1/23 | Q4/22 | Q3/22 | Q2/22 | Q1/22 | Q4/21 | Q3/21 | Q2/21 | Q1/21 | Q4/20 | Q3/20 |
| North America | | | | | | | | | | | | |
| Crude oil and condensate (bbls/d) | 19,778 | 24,237 | 25,291 | 23,897 | 24,801 | 23,571 | 23,845 | 24,757 | 24,316 | 24,645 | 26,459 | 28,297 |
| NGLs (bbls/d) | 6,538 | 7,895 | 7,497 | 7,901 | 8,113 | 8,342 | 8,461 | 8,068 | 8,695 | 8,074 | 8,628 | 9,508 |
| Natural gas (mmcf/d) | 166.49 | 167.48 | 154.26 | 152.07 | 150.68 | 148.11 | 137.93 | 145.18 | 152.06 | 144.36 | 142.13 | 163.09 |
| Total (boe/d) | 54,065 | 60,046 | 58,499 | 57,142 | 58,027 | 56,598 | 55,295 | 57,022 | 58,354 | 56,780 | 58,774 | 64,986 |
| | | | | | | | | | | | | |
| International | | | | | | | | | | | | |
| Crude oil and condensate (bbls/d) | 10,302 | 8,087 | 16,257 | 11,493 | 11,720 | 12,615 | 13,985 | 15,227 | 13,859 | 11,421 | 15,359 | 15,689 |
| Natural gas (mmcf/d) | 117.14 | 80.13 | 79.97 | 82.05 | 89.15 | 96.58 | 100.22 | 81.55 | 83.66 | 89.62 | 89.86 | 93.25 |
| Total (boe/d) | 29,824 | 21,442 | 29,585 | 25,169 | 26,578 | 28,712 | 30,689 | 28,820 | 27,802 | 26,357 | 30,336 | 31,229 |
| | | | | | | | | | | | | |
| Consolidated | | | | | | | | | | | | |
| Crude oil and condensate (bbls/d) | 30,080 | 32,324 | 41,547 | 35,391 | 36,522 | 36,186 | 37,830 | 39,985 | 38,174 | 36,066 | 41,818 | 43,985 |
| NGLs (bbls/d) | 6,538 | 7,896 | 7,497 | 7,901 | 8,113 | 8,342 | 8,461 | 8,068 | 8,695 | 8,074 | 8,627 | 9,509 |
| Natural gas (mmcf/d) | 283.63 | 247.61 | 234.23 | 234.12 | 239.83 | 244.69 | 238.16 | 226.73 | 235.72 | 233.98 | 232.00 | 256.34 |
| Total (boe/d) | 83,889 | 81,489 | 88,083 | 82,312 | 84,607 | 85,310 | 85,984 | 85,841 | 86,156 | 83,138 | 89,111 | 96,217 |
| | | |
| | Vermilion Energy Inc. ■ Page 45 ■ 2023 Second Quarter Report | |
Financial results
| | Q2/23 | Q1/23 | Q4/22 | Q3/22 | Q2/22 | Q1/22 | Q4/21 | Q3/21 | Q2/21 | Q1/21 | Q4/20 | Q3/20 |
| North America | | | | | | | | | | | | |
| Crude oil and condensate sales ($/bbl) | 94.78 | 95.63 | 106.66 | 114.82 | 134.72 | 111.42 | 92.99 | 82.23 | 75.43 | 66.31 | 51.06 | 49.79 |
| NGL sales ($/bbl) | 28.11 | 36.24 | 39.93 | 44.64 | 51.86 | 46.94 | 47.26 | 35.55 | 25.43 | 29.39 | 19.20 | 15.04 |
| Natural gas sales ($/mcf) | 2.29 | 4.11 | 5.96 | 6.41 | 7.13 | 4.80 | 5.07 | 3.80 | 2.72 | 3.98 | 2.77 | 2.02 |
| Sales ($/boe) | 45.12 | 54.84 | 66.95 | 71.24 | 83.34 | 65.88 | 59.97 | 50.40 | 42.30 | 43.08 | 32.51 | 28.94 |
| Royalties ($/boe) | (5.45) | (7.68) | (9.47) | (12.58) | (12.51) | (11.24) | (9.26) | (7.14) | (5.98) | (5.49) | (3.64) | (3.58) |
| Transportation ($/boe) | (1.57) | (2.44) | (2.42) | (2.16) | (2.15) | (1.91) | (1.86) | (1.92) | (1.90) | (2.05) | (1.92) | (1.74) |
| Operating ($/boe) | (12.22) | (14.10) | (13.51) | (14.00) | (11.58) | (11.95) | (11.68) | (11.02) | (10.89) | (11.21) | (10.94) | (7.82) |
| General and administration ($/boe) | 0.10 | (0.99) | 0.10 | (1.27) | (1.52) | (1.26) | (2.01) | (1.14) | (0.91) | (1.34) | (1.94) | (0.78) |
| Corporate income taxes ($/boe) | (0.10) | (0.12) | (0.13) | (0.03) | - | (0.02) | 0.42 | (0.05) | (0.04) | (0.04) | 0.04 | (0.02) |
| Fund flows from operations ($/boe) | 25.88 | 29.51 | 41.52 | 41.20 | 55.58 | 39.50 | 35.58 | 29.13 | 22.58 | 22.95 | 14.11 | 15.00 |
| | | | | | | | | | | | | |
| Fund flows from operations | 127,346 | 159,435 | 223,443 | 216,579 | 293,470 | 201,193 | 180,979 | 152,764 | 119,916 | 117,227 | 76,375 | 89,635 |
| Drilling and development | (135,723) | (116,070) | (113,892) | (112,238) | (54,913) | (57,513) | (89,643) | (35,179) | (38,847) | (59,113) | (33,781) | (9,575) |
| Free cash flow | (8,377) | 43,365 | 109,551 | 104,341 | 238,557 | 143,680 | 91,336 | 117,585 | 81,069 | 58,114 | 42,594 | 80,060 |
| | | | | | | | | | | | | |
| International | | | | | | | | | | | | |
| Crude oil and condensate sales ($/bbl) | 100.23 | 107.57 | 128.02 | 140.09 | 146.67 | 136.69 | 103.53 | 94.91 | 85.41 | 81.40 | 62.65 | 58.19 |
| Natural gas sales ($/mcf) | 14.58 | 24.69 | 39.54 | 58.55 | 32.33 | 36.75 | 35.54 | 18.82 | 9.83 | 7.98 | 6.27 | 2.91 |
| Sales ($/boe) | 91.89 | 132.84 | 177.23 | 254.86 | 173.14 | 183.66 | 163.23 | 103.39 | 72.16 | 62.39 | 50.30 | 37.94 |
| Royalties ($/boe) | (7.43) | (13.39) | (6.38) | (7.21) | (7.23) | (5.43) | (4.13) | (4.52) | (3.83) | (3.53) | (3.02) | (3.32) |
| Transportation ($/boe) | (5.23) | (5.11) | (3.29) | (3.51) | (3.64) | (2.91) | (3.40) | (3.47) | (4.64) | (2.76) | (2.40) | (2.28) |
| Operating ($/boe) | (28.24) | (31.41) | (23.35) | (22.63) | (22.11) | (19.86) | (18.86) | (17.55) | (16.56) | (16.42) | (16.99) | (15.18) |
| General and administration ($/boe) | (7.58) | (7.52) | (5.09) | (3.34) | (3.16) | (3.02) | (2.53) | (2.40) | (2.61) | (2.06) | (2.92) | (2.53) |
| Corporate income taxes ($/boe) | (6.79) | (11.20) | (15.15) | (21.97) | (28.73) | (17.63) | (12.17) | 0.64 | (0.19) | 0.66 | 2.25 | 0.04 |
| PRRT ($/boe) | - | - | (1.85) | (1.96) | (0.83) | (2.60) | (1.96) | (2.74) | (0.58) | (0.60) | (1.45) | (1.27) |
| Fund flows from operations ($/boe) | 36.62 | 64.21 | 122.12 | 194.24 | 107.44 | 132.21 | 120.18 | 73.35 | 43.75 | 37.68 | 25.77 | 13.40 |
| | | | | | | | | | | | | |
| Fund flows from operations | 99,377 | 123,893 | 332,377 | 449,771 | 259,840 | 341,626 | 339,286 | 194,505 | 110,654 | 89,403 | 71,934 | 38,498 |
| Drilling and development | (28,347) | (37,258) | (43,957) | (65,640) | (54,575) | (25,328) | (29,359) | (27,994) | (38,856) | (20,399) | (19,122) | (20,187) |
| Exploration and evaluation | (2,775) | (1,492) | (11,456) | (6,137) | (3,665) | (2,503) | (26,805) | (3,277) | (1,473) | (3,851) | (6,991) | (1,568) |
| Free cash flow | 68,255 | 85,143 | 276,964 | 377,994 | 201,600 | 313,795 | 283,122 | 163,234 | 70,325 | 65,153 | 45,821 | 16,743 |
| | Q2/23 | Q1/23 | Q4/22 | Q3/22 | Q2/22 | Q1/22 | Q4/21 | Q3/21 | Q2/21 | Q1/21 | Q4/20 | Q3/20 |
| Consolidated | | | | | | | | | | | | |
| Crude oil and condensate sales ($/bbl) | 96.64 | 98.62 | 115.02 | 123.02 | 138.55 | 120.23 | 96.88 | 87.05 | 79.06 | 71.09 | 55.31 | 52.79 |
| NGL sales ($/bbl) | 28.11 | 36.23 | 39.93 | 44.64 | 51.86 | 46.94 | 47.26 | 35.55 | 25.43 | 29.39 | 19.20 | 15.04 |
| Natural gas sales ($/mcf) | 7.37 | 10.77 | 17.43 | 24.68 | 16.50 | 17.41 | 17.89 | 9.20 | 5.24 | 5.51 | 4.13 | 2.34 |
| Sales ($/boe) | 61.74 | 75.36 | 103.99 | 127.39 | 111.55 | 105.52 | 96.82 | 68.19 | 51.93 | 49.20 | 38.57 | 31.86 |
| Royalties ($/boe) | (6.16) | (9.18) | (8.43) | (10.94) | (10.85) | (9.29) | (7.43) | (6.26) | (5.29) | (4.87) | (3.43) | (3.50) |
| Transportation ($/boe) | (2.87) | (3.14) | (2.71) | (2.57) | (2.62) | (2.25) | (2.41) | (2.44) | (2.78) | (2.27) | (2.08) | (1.92) |
| Operating ($/boe) | (17.91) | (18.66) | (16.81) | (16.64) | (14.89) | (14.61) | (14.24) | (13.21) | (12.72) | (12.86) | (13.00) | (10.21) |
| General and administration ($/boe) | (2.63) | (2.71) | (1.65) | (1.90) | (2.04) | (1.85) | (2.20) | (1.56) | (1.46) | (1.57) | (2.27) | (1.35) |
| Corporate income taxes ($/boe) | (2.48) | (3.04) | (5.18) | (6.74) | (9.03) | (5.95) | (4.07) | 0.18 | (0.09) | 0.18 | 0.80 | - |
| Windfall taxes ($/boe) | (4.56) | (2.92) | (27.50) | - | - | - | - | - | - | - | - | - |
| PRRT ($/boe) | - | - | (0.62) | (0.60) | (0.26) | (0.87) | (0.70) | (0.92) | (0.19) | (0.19) | (0.49) | (0.41) |
| Interest ($/boe) | (2.65) | (2.98) | (2.78) | (3.23) | (2.74) | (1.93) | (2.06) | (2.37) | (2.41) | (2.57) | (2.42) | (1.97) |
| Realized derivatives ($/boe) | 8.86 | 1.95 | (5.42) | (18.22) | (10.36) | (18.78) | (23.97) | (9.19) | (5.05) | (3.43) | 0.10 | 0.47 |
| Realized foreign exchange ($/boe) | 0.48 | (0.65) | 2.33 | (0.28) | (0.30) | 0.10 | (0.30) | 0.37 | (0.25) | (0.69) | 0.16 | (0.31) |
| Realized other ($/boe) | 0.53 | 0.49 | (0.14) | 0.80 | 0.36 | 0.70 | 1.29 | 0.48 | 0.35 | 0.73 | 0.56 | 0.29 |
| Fund flows from operations ($/boe) | 32.35 | 34.52 | 35.08 | 67.07 | 58.82 | 50.79 | 40.73 | 33.27 | 22.04 | 21.66 | 16.50 | 12.95 |
| | | | | | | | | | | | | |
| Fund flows from operations | 247,109 | 253,167 | 284,220 | 507,876 | 452,901 | 389,868 | 322,173 | 262,696 | 172,942 | 162,051 | 135,212 | 114,776 |
| Drilling and development | (164,070) | (153,328) | (157,849) | (177,878) | (109,488) | (82,841) | (119,002) | (63,173) | (77,703) | (79,512) | (52,903) | (29,762) |
| Exploration and evaluation | (2,775) | (1,492) | (11,456) | (6,137) | (3,665) | (2,503) | (26,805) | (3,277) | (1,473) | (3,851) | (6,991) | (1,568) |
| Free cash flow | 80,264 | 98,347 | 114,915 | 323,861 | 339,748 | 304,524 | 176,366 | 196,246 | 93,766 | 78,688 | 75,318 | 83,446 |
| | | |
| | Vermilion Energy Inc. ■ Page 46 ■ 2023 Second Quarter Report | |
Non-GAAP and Other Specified Financial Measures
This MD&A includes references to certain financial measures which do not have standardized meanings and may not be comparable to similar measures presented by other issuers. These financial measures include fund flows from operations, a total of segments measure of profit or loss in accordance with IFRS 8 “Operating Segments” (please see Segmented Information in the Notes to the condensed Consolidated Interim Financial Statements) and net debt, a capital management measure in accordance with IAS 1 “Presentation of Financial Statements” (please see Capital Disclosures in the Notes to the condensed Consolidated Interim Financial Statements).
In addition, this MD&A includes financial measures which are not specified, defined, or determined under IFRS and are therefore considered non-GAAP financial measures and may not be comparable to similar measures presented by other issuers. These non-GAAP financial measures include:
Total of Segments Measure
Fund flows from operations (FFO): Most directly comparable to net earnings, FFO is comprised of sales excluding royalties, transportation, operating, G&A, corporate income tax, PRRT, windfall taxes, interest expense, realized loss on derivatives, realized foreign exchange gain (loss), and realized other income. The measure is used to assess the contribution of each business unit to Vermilion's ability to generate income necessary to pay dividends, repay debt, fund asset retirement obligations and make capital investments. Reconciliation to the primary financial statement measures can be found below.
| | Q2 2023 | Q2 2022 | YTD 2023 | YTD 2022 |
| | $M | $/boe | $M | $/boe | $M | $/boe | $M | $/boe |
| Sales | 471,356 | 61.74 | 858,844 | 111.55 | 1,024,054 | 68.42 | 1,669,023 | 108.54 |
| Royalties | (46,993) | (6.16) | (83,553) | (10.85) | (114,337) | (7.64) | (154,860) | (10.07) |
| Transportation | (21,905) | (2.87) | (20,153) | (2.62) | (44,955) | (3.00) | (37,422) | (2.43) |
| Operating | (136,749) | (17.91) | (114,617) | (14.89) | (273,574) | (18.28) | (226,800) | (14.75) |
| General and administration | (20,058) | (2.63) | (15,691) | (2.04) | (39,947) | (2.67) | (29,911) | (1.95) |
| Corporate income tax expense | (18,928) | (2.48) | (69,501) | (9.03) | (41,190) | (2.75) | (115,173) | (7.49) |
| Windfall taxes | (34,784) | (4.56) | - | - | (56,224) | (3.76) | - | - |
| PRRT | - | - | (2,019) | (0.26) | - | - | (8,728) | (0.57) |
| Interest expense | (20,210) | (2.65) | (21,074) | (2.74) | (42,085) | (2.81) | (35,897) | (2.33) |
| Realized gain (loss) on derivatives | 67,673 | 8.86 | (79,778) | (10.36) | 82,003 | 5.48 | (224,001) | (14.57) |
| Realized foreign exchange gain (loss) | 3,679 | 0.48 | (2,297) | (0.30) | (1,092) | (0.07) | (1,547) | (0.10) |
| Realized other income | 4,028 | 0.53 | 2,740 | 0.36 | 7,623 | 0.51 | 8,085 | 0.53 |
| Fund flows from operations | 247,109 | 32.35 | 452,901 | 58.82 | 500,276 | 33.43 | 842,769 | 54.81 |
| Equity based compensation | (4,998) | | (7,499) | | (28,523) | | (32,868) | |
| Unrealized gain (loss) on derivative instruments (1) | 11,177 | | 168,058 | | 103,875 | | (52,736) | |
| Unrealized foreign exchange gain (loss) (1) | 35,124 | | (32,267) | | 19,646 | | 7,870 | |
| Accretion | (18,599) | | (13,746) | | (38,650) | | (27,384) | |
| Depletion and depreciation | (154,389) | | (140,763) | | (302,520) | | (275,003) | |
| Deferred tax recovery (expense) | 480 | | (63,497) | | 36,946 | | (7,404) | |
| Gain on business combination | 12,544 | | - | | 445,094 | | - | |
| Loss on disposition | - | | ��- | | (226,828) | | - | |
| Impairment reversal | - | | - | | - | | 192,094 | |
| Unrealized other expense (1) | (540) | | (566) | | (1,076) | | (763) | |
| Net earnings | 127,908 | | 362,621 | | 508,240 | | 646,575 | |
| (1) | Unrealized gain (loss) on derivative instruments, Unrealized foreign exchange gain (loss), and Unrealized other expense are line items from the respective Consolidated Statements of Cash Flows. |
Non-GAAP Financial Measures and Non-GAAP Ratios
Free cash flow: Most directly comparable to cash flows from operating activities and is comprised of fund flows from operations less drilling and development costs and exploration and evaluation costs. The measure is used to determine the funding available for investing and financing activities including payment of dividends, repayment of long-term debt, reallocation into existing business units and deployment into new ventures. Reconciliation to the primary financial statement measures can be found in the following table.
| | | |
| | Vermilion Energy Inc. ■ Page 47 ■ 2023 Second Quarter Report | |
| ($M) | Q2 2023 | Q2 2022 | YTD 2023 | YTD 2022 |
| Cash flows from operating activities | 173,632 | 530,364 | 562,261 | 871,417 |
| Changes in non-cash operating working capital | 61,584 | (81,763) | (76,432) | (39,268) |
| Asset retirement obligations settled | 11,893 | 4,300 | 14,447 | 10,620 |
| Fund flows from operations | 247,109 | 452,901 | 500,276 | 842,769 |
| Drilling and development | (164,070) | (109,488) | (317,398) | (192,329) |
| Exploration and evaluation | (2,775) | (3,665) | (4,267) | (6,168) |
| Free cash flow | 80,264 | 339,748 | 178,611 | 644,272 |
Capital expenditures: Calculated as the sum of drilling and development costs and exploration and evaluation costs from the Consolidated Statements of Cash Flows that is most directly comparable to cash flows used in investing activities. We consider capital expenditures to be a useful measure of our investment in our existing asset base. Capital expenditures are also referred to as E&D capital. Reconciliation to the primary financial statement measures can be found below.
| ($M) | Q2 2023 | Q2 2022 | YTD 2023 | YTD 2022 |
| Drilling and development | 164,070 | 109,488 | 317,398 | 192,329 |
| Exploration and evaluation | 2,775 | 3,665 | 4,267 | 6,168 |
| Capital expenditures | 166,845 | 113,153 | 321,665 | 198,497 |
Payout and payout % of FFO: A non-GAAP financial measure and non-GAAP ratio respectively, most directly comparable to dividends declared. Payout is comprised of dividends declared plus drilling and development costs, exploration and evaluation costs, and asset retirement obligations settled, and payout % of FFO is calculated as payout over FFO (total of segments measure). The measure is used to assess the amount of cash distributed back to shareholders and reinvested in the business for maintaining production and organic growth. The reconciliation of the measure to the primary financial statement measure can be found below.
| ($M) | Q2 2023 | Q2 2022 | YTD 2023 | YTD 2022 |
| Dividends declared | 16,430 | 9,913 | 32,656 | 19,680 |
| Drilling and development | 164,070 | 109,488 | 317,398 | 192,329 |
| Exploration and evaluation | 2,775 | 3,665 | 4,267 | 6,168 |
| Asset retirement obligations settled | 11,893 | 4,300 | 14,447 | 10,620 |
| Payout | 195,168 | 127,366 | 368,768 | 228,797 |
| % of fund flows from operations | 79 % | 28 % | 74 % | 27 % |
Return on capital employed (ROCE): A non-GAAP ratio, ROCE is a measure that we use to analyze our profitability and the efficiency of our capital allocation process; the comparable primary financial statement measure is earnings before income taxes. ROCE is calculated by dividing net earnings before interest and taxes ("EBIT") by average capital employed over the preceding twelve months. Capital employed is calculated as total assets less current liabilities while average capital employed is calculated using the balance sheets at the beginning and end of the twelve-month period.
| | Twelve Months Ended |
| ($M) | Jun 30, 2023 | Jun 30, 2022 |
| Net earnings | 1,174,727 | 844,033 |
| Taxes | 667,200 | 127,529 |
| Interest expense | 89,046 | 70,875 |
| EBIT | 1,930,973 | 1,042,437 |
| Average capital employed | 5,816,057 | 5,101,088 |
| Return on capital employed | 33 % | 20 % |
Adjusted working capital: Defined as current assets less current liabilities, excluding current derivatives and current lease liabilities. The measure is used to calculate net debt, a capital management measure disclosed below.
| | | |
| | Vermilion Energy Inc. ■ Page 48 ■ 2023 Second Quarter Report | |
| | As at |
| ($M) | Jun 30, 2023 | Dec 31, 2022 |
| Current assets | 743,515 | 714,446 |
| Current derivative asset | (326,143) | (162,843) |
| Current liabilities | (870,758) | (892,045) |
| Current lease liability | 21,059 | 19,486 |
| Current derivative liability | 25,012 | 55,845 |
| Adjusted working capital | (407,315) | (265,111) |
Acquisitions: The sum of acquisitions and acquisitions of securities from the Consolidated Statements of Cash Flows, Vermilion common shares issued as consideration, the estimated value of contingent consideration, the amount of acquiree's outstanding long-term debt assumed, and net acquired working capital deficit or surplus. We believe that including these components provides a useful measure of the economic investment associated with our acquisition activity and is most directly comparable to cash flows used in investing activities. A reconciliation to the acquisitions line items in the Consolidated Statements of Cash Flows can be found below.
| ($M) | Q2 2023 | Q2 2022 | Q2 2023 | Q2 2022 |
| Acquisitions, net of cash acquired | 2,196 | 497,800 | 136,421 | 504,512 |
| Acquisition of securities | 632 | 18,301 | 2,108 | 18,301 |
| Acquired working capital (surplus) deficit | (12,544) | 6,122 | 103,527 | 6,122 |
| Acquisitions | (9,716) | 522,223 | 242,056 | 528,935 |
Capital Management Measure
Net debt: Is in accordance with IAS 1 "Presentation of Financial Statements" that is most directly comparable to long-term debt. Net debt is comprised of long-term debt (excluding unrealized foreign exchange on swapped USD borrowings) plus adjusted working capital (defined as current assets less current liabilities, excluding current derivatives and current lease liabilities), and represents Vermilion's net financing obligations after adjusting for the timing of working capital fluctuations. Net debt excludes lease obligations which are secured by a corresponding right-of-use asset.
| | As at |
| ($M) | Jun 30, 2023 | Dec 31, 2022 |
| Long-term debt | 913,785 | 1,081,351 |
| Adjusted working capital | 407,315 | 265,111 |
| Unrealized FX on swapped USD borrowings | - | (1,876) |
| Net debt | 1,321,100 | 1,344,586 |
| | | |
| Ratio of net debt to four quarter trailing fund flows from operations | 1.0 | 0.8 |
Supplementary Financial Measures
Diluted shares outstanding: The sum of shares outstanding at the period end plus outstanding awards under the LTIP, based on current estimates of future performance factors and forfeiture rates.
| ('000s of shares) | Q2 2023 | Q2 2022 |
| Shares outstanding | 164,294 | 165,222 |
| Potential shares issuable pursuant to the LTIP | 4,236 | 5,747 |
| Diluted shares outstanding | 168,530 | 170,969 |
| | | |
| | Vermilion Energy Inc. ■ Page 49 ■ 2023 Second Quarter Report | |
Fund flows from operations per basic and diluted share: Management assesses fund flows from operations on a per share basis as we believe this provides a measure of our operating performance after taking into account the issuance and potential future issuance of Vermilion common shares. Fund flows from operations per basic share is calculated by dividing fund flows from operations (total of segments measure) by the basic weighted average shares outstanding as defined under IFRS. Fund flows from operations per diluted share is calculated by dividing fund flows from operations by the sum of basic weighted average shares outstanding and incremental shares issuable under the equity based compensation plans as determined using the treasury stock method.
Operating netback: Most directly comparable to net earnings that is calculated as sales less royalties, operating expense, transportation costs, PRRT, and realized hedging gains and losses presented on a per unit basis. Management assesses operating netback as a measure of the profitability and efficiency of our field operations.
Fund flows from operations per boe: Calculated as FFO (total of segments measure) by boe production. Fund flows from operations netback is used by management to assess the profitability of our business units and Vermilion as a whole.
Net debt to four quarter trailing fund flows from operations: Calculated as net debt (capital management measure) over the FFO (total of segments measure) from the preceding four quarters. The measure is used to assess the ability to repay debt.
Cash dividends per share: Represents cash dividends declared per share that is a useful measure of the dividends a common shareholder was entitled to during the period.
Covenants: The financial covenants on our revolving credit facility contain non-GAAP measures. The definitions for these financial covenants are included in Financial Position Review.
| | | |
| | Vermilion Energy Inc. ■ Page 50 ■ 2023 Second Quarter Report | |
Consolidated Interim Financial Statements
Consolidated Balance Sheet
thousands of Canadian dollars, unaudited
| | Note | June 30, 2023 | December 31, 2022 |
| Assets | | | |
| Current | | | |
| Cash and cash equivalents | 12 | 50,700 | 13,836 |
| Accounts receivable | | 287,898 | 373,651 |
| Crude oil inventory | | 21,346 | 19,657 |
| Derivative instruments | | 326,143 | 162,843 |
| Prepaid expenses | | 57,428 | 144,459 |
| Total current assets | | 743,515 | 714,446 |
| | | | |
| Derivative instruments | | 13,628 | 132,598 |
| Investment in securities | 4 | 58,625 | 56,366 |
| Deferred taxes | | 128,786 | 125,533 |
| Exploration and evaluation assets | 6 | 237,792 | 270,593 |
| Capital assets | 2, 5 | 5,997,642 | 5,691,522 |
| Total assets | | 7,179,988 | 6,991,058 |
| | | | |
| Liabilities | | | |
| Current | | | |
| Accounts payable and accrued liabilities | | 428,520 | 481,444 |
| Dividends payable | 10 | 16,430 | 13,058 |
| Derivative instruments | | 25,012 | 55,845 |
| Income taxes payable | | 400,796 | 341,698 |
| Total current liabilities | | 870,758 | 892,045 |
| | | | |
| Derivative instruments | | 22,474 | - |
| Long-term debt | 9 | 913,785 | 1,081,351 |
| Lease obligations | | 40,911 | 51,507 |
| Asset retirement obligations | 7 | 1,033,262 | 1,087,757 |
| Deferred taxes | | 475,762 | 477,340 |
| Total liabilities | | 3,356,952 | 3,590,000 |
| | | | |
| Shareholders' Equity | | | |
| Shareholders' capital | 10 | 4,198,188 | 4,243,794 |
| Contributed surplus | | 32,477 | 35,409 |
| Accumulated other comprehensive income | | 95,833 | 123,505 |
| Deficit | | (503,462) | (1,001,650) |
| Total shareholders' equity | | 3,823,036 | 3,401,058 |
| Total liabilities and shareholders' equity | | 7,179,988 | 6,991,058 |
Approved by the Board
| (Signed “Manjit Sharma”) | | (Signed “Dion Hatcher”) |
| | | |
| Manjit Sharma, Director | | Dion Hatcher, Director |
| | | |
| | Vermilion Energy Inc. ■ Page 51 ■ 2023 Second Quarter Report | |
Consolidated Statements of Net Earnings and Comprehensive Income
thousands of Canadian dollars, except share and per share amounts, unaudited
| | | Three Months Ended | Six Months Ended |
| | Note | June 30, 2023 | June 30, 2022 | June 30, 2023 | June 30, 2022 |
| Revenue | | | | | |
| Petroleum and natural gas sales | | 471,356 | 858,844 | 1,024,054 | 1,669,023 |
| Royalties | | (46,993) | (83,553) | (114,337) | (154,860) |
| Sales of purchased commodities | | 38,278 | 63,429 | 87,290 | 111,159 |
| Petroleum and natural gas revenue | | 462,641 | 838,720 | 997,007 | 1,625,322 |
| | | | | | |
| Expenses | | | | | |
| Purchased commodities | | 38,278 | 63,429 | 87,290 | 111,159 |
| Operating | | 136,749 | 114,617 | 273,574 | 226,800 |
| Transportation | | 21,905 | 20,153 | 44,955 | 37,422 |
| Equity based compensation | | 4,998 | 7,499 | 28,523 | 32,868 |
| (Gain) loss on derivative instruments | | (78,850) | (88,280) | (185,878) | 276,737 |
| Interest expense | | 20,210 | 21,074 | 42,085 | 35,897 |
| General and administration | | 20,058 | 15,691 | 39,947 | 29,911 |
| Foreign exchange (gain) loss | | (38,803) | 34,564 | (18,554) | (6,323) |
| Other income | | (3,488) | (2,174) | (6,547) | (7,322) |
| Accretion | 7 | 18,599 | 13,746 | 38,650 | 27,384 |
| Depletion and depreciation | 5, 6 | 154,389 | 140,763 | 302,520 | 275,003 |
| Impairment reversal | 5 | - | - | - | (192,094) |
| Gain on business combination | 3 | (12,544) | - | (445,094) | - |
| Loss on disposition | 5 | - | - | 226,828 | - |
| | | 281,501 | 341,082 | 428,299 | 847,442 |
| Earnings before income taxes | | 181,140 | 497,638 | 568,708 | 777,880 |
| | | | | | |
| Income tax (recovery) expense | | | | | |
| Deferred | | (480) | 63,497 | (36,946) | 7,404 |
| Current | | 18,928 | 71,520 | 41,190 | 123,901 |
| Windfall taxes | | 34,784 | - | 56,224 | - |
| | | 53,232 | 135,017 | 60,468 | 131,305 |
| | | | | | |
| Net earnings | | 127,908 | 362,621 | 508,240 | 646,575 |
| | | | | | |
| Other comprehensive income | | | | | |
| Currency translation adjustments | | (56,293) | (27,800) | (31,612) | (66,619) |
| Hedge accounting reserve, net of tax | | 1,634 | 1,632 | 3,789 | 3,264 |
| Fair value adjustment on investment in securities | 4 | 5,884 | 18,944 | 151 | 18,944 |
| Comprehensive income | | 79,133 | 355,397 | 480,568 | 602,164 |
| | | | | | |
| Net earnings per share | | | | | |
| Basic | | 0.78 | 2.20 | 3.10 | 3.96 |
| Diluted | | 0.76 | 2.14 | 3.04 | 3.84 |
| | | | | | |
| Weighted average shares outstanding ('000s) | | | | | |
| Basic | | 164,997 | 164,518 | 163,798 | 163,452 |
| Diluted | | 167,364 | 169,169 | 167,343 | 168,517 |
| | | |
| | Vermilion Energy Inc. ■ Page 52 ■ 2023 Second Quarter Report | |
Consolidated Statements of Cash Flows
thousands of Canadian dollars, unaudited
| | | Three Months Ended | Six Months Ended |
| | Note | June 30, 2023 | June 30, 2022 | June 30, 2023 | June 30, 2022 |
| Operating | | | | | |
| Net earnings | | 127,908 | 362,621 | 508,240 | 646,575 |
| Adjustments: | | | | | |
| Accretion | 7 | 18,599 | 13,746 | 38,650 | 27,384 |
| Depletion and depreciation | 5, 6 | 154,389 | 140,763 | 302,520 | 275,003 |
| Impairment reversal | 5 | - | - | - | (192,094) |
| Gain on business combination | 3 | (12,544) | - | (445,094) | - |
| Loss on disposition | 5 | - | - | 226,828 | - |
| Unrealized (gain) loss on derivative instruments | | (11,177) | (168,058) | (103,875) | 52,736 |
| Equity based compensation | | 4,998 | 7,499 | 28,523 | 32,868 |
| Unrealized foreign exchange (gain) loss | | (35,124) | 32,267 | (19,646) | (7,870) |
| Unrealized other expense | | 540 | 566 | 1,076 | 763 |
| Deferred tax recovery | | (480) | 63,497 | (36,946) | 7,404 |
| Asset retirement obligations settled | 7 | (11,893) | (4,300) | (14,447) | (10,620) |
| Changes in non-cash operating working capital | | (61,584) | 81,763 | 76,432 | 39,268 |
| Cash flows from operating activities | | 173,632 | 530,364 | 562,261 | 871,417 |
| | | | | | |
| Investing | | | | | |
| Drilling and development | 5 | (164,070) | (109,488) | (317,398) | (192,329) |
| Exploration and evaluation | 6 | (2,775) | (3,665) | (4,267) | (6,168) |
| Acquisitions, net of cash acquired | 5 | (2,196) | (497,800) | (136,421) | (504,512) |
| Acquisition of securities | 4 | (632) | (18,301) | (2,108) | (18,301) |
| Dispositions | 5 | - | - | 182,152 | - |
| Changes in non-cash investing working capital | | 5,269 | 16,620 | 4,943 | (1,654) |
| Cash flows used in investing activities | | (164,404) | (612,634) | (273,099) | (722,964) |
| | | | | | |
| Financing | | | | | |
| Repayments on the revolving credit facility | 9 | - | (406,491) | (146,591) | (633,100) |
| Issuance of senior unsecured notes | 9 | - | 499,037 | - | 499,037 |
| Payments on lease obligations | | (4,665) | (4,310) | (9,064) | (9,081) |
| Repurchase of shares | 10 | (24,316) | - | (54,457) | - |
| Cash dividends | 10 | (16,226) | (9,727) | (29,284) | (9,727) |
| Cash flows (used in) from financing activities | | (45,207) | 78,509 | (239,396) | (152,871) |
| Foreign exchange loss on cash held in foreign currencies | | (13,165) | (108) | (12,902) | (935) |
| | | | | | |
| Net change in cash and cash equivalents | | (49,144) | (3,869) | 36,864 | (5,353) |
| Cash and cash equivalents, beginning of period | | 99,844 | 4,544 | 13,836 | 6,028 |
| Cash and cash equivalents, end of period | | 50,700 | 675 | 50,700 | 675 |
| | | | | | |
| Supplementary information for cash flows from operating activities | | | | | |
| Interest paid | | 25,374 | 10,684 | 42,645 | 30,025 |
| Income taxes paid | | 138,469 | 29,450 | 152,776 | 24,191 |
| | | |
| | Vermilion Energy Inc. ■ Page 53 ■ 2023 Second Quarter Report | |
Consolidated Statements of Changes in Shareholders' Equity
thousands of Canadian dollars, unaudited
| | | Six Months Ended |
| | Note | June 30, 2023 | June 30, 2022 |
| Shareholders' capital | 10 | | |
| Balance, beginning of period | | 4,243,794 | 4,241,773 |
| Vesting of equity based awards | | 21,175 | 41,193 |
| Equity based compensation | | 10,280 | 13,123 |
| Share-settled dividends on vested equity based awards | | 1,051 | 4,185 |
| Repurchase of shares | | (78,112) | - |
| Balance, end of period | | 4,198,188 | 4,300,274 |
| Contributed surplus | 10 | | |
| Balance, beginning of period | | 35,409 | 49,529 |
| Equity based compensation | | 18,243 | 19,745 |
| Vesting of equity based awards | | (21,175) | (41,193) |
| Balance, end of period | | 32,477 | 28,081 |
| Accumulated other comprehensive income | | | |
| Balance, beginning of period | | 123,505 | 28,467 |
| Currency translation adjustments | | (31,612) | (66,619) |
| Hedge accounting reserve, net of tax | | 3,789 | 3,264 |
| Fair value adjustment on investment in securities, net of tax | 4 | 151 | 18,944 |
| Balance, end of period | | 95,833 | (15,944) |
| Deficit | | | |
| Balance, beginning of period | | (1,001,650) | (2,253,624) |
| Net earnings | | 508,240 | 646,575 |
| Dividends declared | | (32,656) | (19,680) |
| Share-settled dividends on vested equity based awards | | (1,051) | (4,185) |
| Repurchase of shares | 10 | 23,655 | - |
| Balance, end of period | | (503,462) | (1,630,914) |
| | | | |
| Total shareholders' equity | | 3,823,036 | 2,681,497 |
| | | |
| | Vermilion Energy Inc. ■ Page 54 ■ 2023 Second Quarter Report | |
Description of equity reserves
Shareholders’ capital
Represents the recognized amount for common shares issued (net of equity issuance costs and deferred taxes) less the weighted-average carrying value of shares repurchased. The price paid to repurchase common shares is compared to the carrying value of the shares and the difference is recorded against deficit.
Contributed surplus
Represents the recognized value of unvested equity based awards that will be settled in shares. Once vested, the value of the awards are transferred to shareholders’ capital.
Accumulated other comprehensive income
Represents currency translation adjustments, hedge accounting reserve and fair value adjustments on investments.
Currency translation adjustments result from translating the balance sheets of subsidiaries with a foreign functional currency to Canadian dollars at period-end rates. These amounts may be reclassified to net earnings if there is a disposal or partial disposal of a subsidiary.
The hedge accounting reserve represents the effective portion of the change in fair value related to cash flow and net investment hedges recognized in other comprehensive income, net of tax and reclassified to the consolidated statement of net earnings in the same period in which the transaction associated with the hedged item occurs.
Fair value adjustment on investment in securities, net of tax, are a result of changes in the fair value of investments that have been elected to be subsequently measured at fair value through other comprehensive income.
Deficit
Represents the cumulative net earnings less distributed earnings and surplus of the price paid to repurchase common shares of Vermilion Energy Inc. over the weighted-average carrying value of the shares repurchased.
| | | |
| | Vermilion Energy Inc. ■ Page 55 ■ 2023 Second Quarter Report | |
Notes to the Condensed Consolidated Interim Financial Statements for the three and six months ended June 30, 2023 and 2022
tabular amounts in thousands of Canadian dollars, except share and per share amounts, unaudited
Vermilion Energy Inc. (the “Company” or “Vermilion”) is a corporation governed by the laws of the Province of Alberta and is actively engaged in the business of crude oil and natural gas exploration, development, acquisition, and production.
These condensed consolidated interim financial statements are in compliance with International Accounting Standard (“IAS”) 34, “Interim Financial Reporting”. These condensed consolidated interim financial statements have been prepared using the same accounting policies and methods of computation as Vermilion’s consolidated financial statements for the year ended December 31, 2022.
These condensed consolidated interim financial statements should be read in conjunction with Vermilion’s consolidated financial statements for the year ended December 31, 2022, which are contained within Vermilion’s Annual Report for the year ended December 31, 2022 and are available on SEDAR+ at www.sedarplus.ca or on Vermilion’s website at www.vermilionenergy.com.
These condensed consolidated interim financial statements were approved and authorized for issuance by the Board of Directors of Vermilion on
August 2, 2023.
| | | |
| | Vermilion Energy Inc. ■ Page 56 ■ 2023 Second Quarter Report | |
| | Three Months Ended June 30, 2023 |
| | Canada | USA | France | Netherlands | Germany | Ireland | Australia | Corporate | Total |
| Drilling and development | 73,471 | 62,252 | 11,326 | 5,815 | 5,220 | (619) | 5,470 | 1,135 | 164,070 |
| Exploration and evaluation | - | - | - | - | 2,633 | - | - | 142 | 2,775 |
| | | | | | | | | | |
| Crude oil and condensate sales | 141,027 | 29,547 | 79,718 | 398 | 13,817 | 30 | - | - | 264,537 |
| NGL sales | 13,207 | 3,517 | - | - | - | - | - | - | 16,724 |
| Natural gas sales | 33,555 | 1,127 | - | 37,858 | 28,436 | 88,659 | - | 460 | 190,095 |
| Sales of purchased commodities | - | - | - | - | - | - | - | 38,278 | 38,278 |
| Royalties | (18,000) | (8,824) | (10,833) | (6,653) | (2,496) | - | - | (187) | (46,993) |
| Revenue from external customers | 169,789 | 25,367 | 68,885 | 31,603 | 39,757 | 88,689 | - | 38,551 | 462,641 |
| Purchased commodities | - | - | - | - | - | - | - | (38,278) | (38,278) |
| Transportation | (7,639) | (65) | (8,215) | - | (3,409) | (2,577) | - | - | (21,905) |
| Operating | (53,430) | (6,686) | (24,756) | (13,691) | (10,953) | (10,526) | (16,415) | (292) | (136,749) |
| General and administration | (21,925) | (1,273) | (7,848) | 996 | (4,643) | (4,763) | (2,583) | 21,981 | (20,058) |
| PRRT | - | - | - | - | - | - | - | - | - |
| Corporate income taxes | 1 | - | (1,805) | (5,818) | (9,690) | (227) | (886) | (503) | (18,928) |
| Windfall taxes | - | - | - | - | - | - | - | (34,784) | (34,784) |
| Interest expense | - | - | - | - | - | - | - | (20,210) | (20,210) |
| Realized gain on derivative instruments | - | - | - | - | - | - | - | 67,673 | 67,673 |
| Realized foreign exchange gain | - | - | - | - | - | - | - | 3,679 | 3,679 |
| Realized other income | - | - | - | - | - | - | - | 4,028 | 4,028 |
| Fund flows from operations | 86,796 | 17,343 | 26,261 | 13,090 | 11,062 | 70,596 | (19,884) | 41,845 | 247,109 |
| | | | | | | | | | |
| | Three Months Ended June 30, 2022 |
| | Canada | USA | France | Netherlands | Germany | Ireland | Australia | Corporate | Total |
| Drilling and development | 30,849 | 24,064 | 11,911 | 865 | 3,170 | 656 | 37,825 | 148 | 109,488 |
| Exploration and evaluation | - | - | 2 | 504 | 404 | - | - | 2,755 | 3,665 |
| | | | | | | | | | |
| Crude oil and condensate sales | 267,414 | 36,637 | 103,798 | 610 | 15,056 | - | 36,966 | - | 460,481 |
| NGL sales | 33,579 | 4,709 | - | - | - | - | - | - | 38,288 |
| Natural gas sales | 93,611 | 4,146 | - | 124,711 | 81,823 | 53,277 | - | 2,507 | 360,075 |
| Sales of purchased commodities | - | - | - | - | - | - | - | 63,429 | 63,429 |
| Royalties | (54,090) | (11,985) | (11,933) | - | (5,073) | - | - | (472) | (83,553) |
| Revenue from external customers | 340,514 | 33,507 | 91,865 | 125,321 | 91,806 | 53,277 | 36,966 | 65,464 | 838,720 |
| Purchased commodities | - | - | - | - | - | - | - | (63,429) | (63,429) |
| Transportation | (11,177) | (163) | (5,868) | - | (2,007) | (938) | - | - | (20,153) |
| Operating | (55,583) | (5,559) | (15,459) | (11,004) | (10,750) | (3,325) | (12,498) | (439) | (114,617) |
| General and administration | (8,441) | (845) | (3,709) | (871) | (1,437) | 595 | (1,058) | 75 | (15,691) |
| PRRT | - | - | - | - | - | - | (2,019) | - | (2,019) |
| Corporate income taxes | - | - | (9,488) | (51,948) | (7,924) | - | (115) | (26) | (69,501) |
| Interest expense | - | - | - | - | - | - | - | (21,074) | (21,074) |
| Realized loss on derivative instruments | - | - | - | - | - | - | - | (79,778) | (79,778) |
| Realized foreign exchange loss | - | - | - | - | - | - | - | (2,297) | (2,297) |
| Realized other income | - | - | - | - | - | - | - | 2,740 | 2,740 |
| Fund flows from operations | 265,313 | 26,940 | 57,341 | 61,498 | 69,688 | 49,609 | 21,276 | (98,764) | 452,901 |
| | | |
| | Vermilion Energy Inc. ■ Page 57 ■ 2023 Second Quarter Report | |
| | Six Months Ended June 30, 2023 |
| | Canada | USA | France | Netherlands | Germany | Ireland | Australia | Corporate | Total |
| Drilling and development | 175,321 | 76,472 | 23,011 | 16,197 | 12,936 | 1,439 | 10,602 | 1,420 | 317,398 |
| Exploration and evaluation | - | - | - | 1 | 3,081 | - | - | 1,185 | 4,267 |
| | | | | | | | | | |
| Crude oil and condensate sales | 323,810 | 55,373 | 144,184 | 882 | 27,161 | 32 | - | - | 551,442 |
| NGL sales | 34,846 | 7,625 | - | - | - | - | - | - | 42,471 |
| Natural gas sales | 93,230 | 3,448 | - | 106,455 | 86,564 | 138,144 | - | 2,300 | 430,141 |
| Sales of purchased commodities | | - | - | - | - | - | - | 87,290 | 87,290 |
| Royalties | (50,896) | (17,427) | (17,924) | (21,482) | (5,399) | - | - | (1,209) | (114,337) |
| Revenue from external customers | 400,990 | 49,019 | 126,260 | 85,855 | 108,326 | 138,176 | - | 88,381 | 997,007 |
| Purchased commodities | | | | | | | | (87,290) | (87,290) |
| Transportation | (20,753) | (132) | (14,415) | - | (6,173) | (3,482) | - | - | (44,955) |
| Operating | (123,097) | (13,238) | (41,303) | (26,603) | (21,616) | (15,144) | (31,746) | (827) | (273,574) |
| General and administration | (45,462) | (3,789) | (12,681) | (1,115) | (7,384) | (6,040) | (4,318) | 40,842 | (39,947) |
| Corporate income taxes | - | - | (3,015) | (12,512) | (22,772) | (227) | (1,515) | (1,149) | (41,190) |
| Windfall taxes | - | - | - | - | - | - | - | (56,224) | (56,224) |
| Interest expense | - | - | - | - | - | - | - | (42,085) | (42,085) |
| Realized gain on derivative instruments | - | - | - | - | - | - | - | 82,003 | 82,003 |
| Realized foreign exchange loss | - | - | - | - | - | - | - | (1,092) | (1,092) |
| Realized other income | - | - | - | - | - | - | - | 7,623 | 7,623 |
| Fund flows from operations | 211,678 | 31,860 | 54,846 | 45,625 | 50,381 | 113,283 | (37,579) | 30,182 | 500,276 |
| | | | | | | | | | |
| | Six Months Ended June 30, 2022 |
| | Canada | USA | France | Netherlands | Germany | Ireland | Australia | Corporate | Total |
| Drilling and development | 80,377 | 32,049 | 18,922 | 2,217 | 12,138 | 972 | 45,352 | 302 | 192,329 |
| Exploration and evaluation | - | - | 2 | (344) | 596 | - | - | 5,914 | 6,168 |
| | | | | | | | | | |
| Crude oil and condensate sales | 476,498 | 63,914 | 196,696 | 1,203 | 27,176 | - | 86,547 | - | 852,034 |
| NGL sales | 64,412 | 9,114 | - | - | - | - | - | - | 73,526 |
| Natural gas sales | 154,559 | 7,192 | - | 256,690 | 164,261 | 157,306 | - | 3,455 | 743,463 |
| Sales of purchased commodities | - | - | - | - | - | - | - | 111,159 | 111,159 |
| Royalties | (102,339) | (20,999) | (20,657) | - | (10,116) | - | - | (749) | (154,860) |
| Revenue from external customers | 593,130 | 59,221 | 176,039 | 257,893 | 181,321 | 157,306 | 86,547 | 113,865 | 1,625,322 |
| Purchased commodities | - | - | - | - | - | - | - | (111,159) | (111,159) |
| Transportation | (20,631) | (450) | (10,634) | - | (3,788) | (1,919) | - | - | (37,422) |
| Operating | (111,349) | (10,645) | (30,489) | (21,474) | (19,043) | (7,178) | (25,838) | (784) | (226,800) |
| General and administration | (15,263) | (2,430) | (7,574) | (1,675) | (2,591) | 367 | (1,901) | 1,156 | (29,911) |
| PRRT | - | - | - | - | - | - | (8,728) | - | (8,728) |
| Corporate income taxes | - | - | (16,691) | (87,214) | (10,908) | - | (215) | (145) | (115,173) |
| Interest expense | - | - | - | - | - | - | - | (35,897) | (35,897) |
| Realized loss on derivative instruments | - | - | - | - | - | - | - | (224,001) | (224,001) |
| Realized foreign exchange loss | - | - | - | - | - | - | - | (1,547) | (1,547) |
| Realized other income | - | - | - | - | - | - | - | 8,085 | 8,085 |
| Fund flows from operations | 445,887 | 45,696 | 110,651 | 147,530 | 144,991 | 148,576 | 49,865 | (250,427) | 842,769 |
| | | |
| | Vermilion Energy Inc. ■ Page 58 ■ 2023 Second Quarter Report | |
Reconciliation of fund flows from operations to net earnings:
| | Three Months Ended | Six Months Ended |
| | Jun 30, 2023 | Jun 30, 2022 | Jun 30, 2023 | Jun 30, 2022 |
| Fund flows from operations | 247,109 | 452,901 | 500,276 | 842,769 |
| Equity based compensation | (4,998) | (7,499) | (28,523) | (32,868) |
| Unrealized gain (loss) on derivative instruments | 11,177 | 168,058 | 103,875 | (52,736) |
| Unrealized foreign exchange gain (loss) | 35,124 | (32,267) | 19,646 | 7,870 |
| Accretion | (18,599) | (13,746) | (38,650) | (27,384) |
| Depletion and depreciation | (154,389) | (140,763) | (302,520) | (275,003) |
| Deferred tax recovery (expense) | 480 | (63,497) | 36,946 | (7,404) |
| Gain on business combination | 12,544 | - | 445,094 | - |
| Loss on disposition | - | - | (226,828) | - |
| Impairment reversal | - | - | - | 192,094 |
| Unrealized other expense | (540) | (566) | (1,076) | (763) |
| Net earnings | 127,908 | 362,621 | 508,240 | 646,575 |
Equinor Energy Ireland Limited
On March 31, 2023, Vermilion purchased 100% of the shares outstanding of Equinor Energy Ireland Limited ("EEIL") from Equinor ASA. The acquisition adds an incremental 36.5% interest in the Corrib Natural Gas Project, increasing Vermilion's operated interest to 56.5%. The acquisition makes Vermilion the largest provider of domestic natural gas in Ireland.
The total consideration paid and the fair value of the assets acquired and liabilities assumed at the date of acquisition are detailed in the table below. The initial accounting for the working capital deficit has been determined on a provisional basis as final working capital amounts related to accounts receivable, accounts payable, and taxes payable are unavailable due to the timing of close.
| | Consideration |
| Cash consideration paid | 488,893 |
| | |
| | Allocation of consideration |
| Cash acquired | 400,002 |
| Capital assets | 768,026 |
| Acquired working capital deficit | (103,527) |
| Asset retirement obligations | (42,277) |
| Derivative liability | (51,789) |
| Deferred tax liability | (36,448) |
| Net assets acquired | 933,987 |
| Gain on business combination | (445,094) |
| Total net assets acquired, net of gain on business combination | 488,893 |
The gain on the business combination primarily resulted from increases in working capital and the fair value of capital assets from when the purchase and sale agreement was entered into in November 2021 and when the acquisition closed in March 2023.
The results of operations from the assets acquired and liabilities assumed have been included in Vermilion's consolidated financial statements beginning March 31, 2023 and have contributed revenues net of royalties of $56.1 million and net earnings of $12.6 million. Had the acquisition occurred on January 1, 2023, revenues would have increased by $90.3 million and net earnings would have increased by $55.0 million for the six months ended June 30, 2023.
| | | |
| | Vermilion Energy Inc. ■ Page 59 ■ 2023 Second Quarter Report | |
| 4. Investment in securities |
The total consideration paid and the fair value of the investments acquired are detailed in the table below:
| | 2023 |
| Balance at January 1 | 56,366 |
| Acquisition of securities | 2,108 |
| Fair value adjustment | 151 |
| Balance at June 30 | 58,625 |
The following table reconciles the change in Vermilion's capital assets:
| | 2023 |
| Balance at January 1 | 5,691,522 |
| Acquisitions | 830,435 |
| Dispositions | (534,016) |
| Additions | 317,398 |
| Increase in right-of-use assets | 25 |
| Depletion and depreciation | (287,134) |
| Changes in asset retirement obligations | 21,354 |
| Foreign exchange | (41,942) |
| Balance at June 30 | 5,997,642 |
Southeast Saskatchewan disposition
In March 2023, Vermilion sold non-core assets in southeast Saskatchewan for net proceeds of $182.2 million and resulted in a loss on disposition of $226.8 million. The book value of the net assets disposed of was $409.0 million and consisted of $534.0 million of capital assets, $25.9 million of exploration and evaluation assets, and $150.9 million of asset retirement obligations.
Minor acquisition
In March 2023, Vermilion completed a minor acquisition of Alberta assets for total consideration of $19.0 million where $33.9 million of capital assets and $14.9 million of asset retirement obligations were recognized.
6. Exploration and evaluation assets |
The following table reconciles the change in Vermilion's exploration and evaluation assets:
| | 2023 |
| Balance at January 1 | 270,593 |
| Additions | 4,267 |
| Dispositions | (25,862) |
| Depreciation | (15,386) |
| Foreign exchange | 4,180 |
| Balance at June 30 | 237,792 |
| | | |
| | Vermilion Energy Inc. ■ Page 60 ■ 2023 Second Quarter Report | |
| 7. Asset retirement obligations |
The following table reconciles the change in Vermilion’s asset retirement obligations:
| | 2023 |
| Balance at January 1 | 1,087,757 |
| Additional obligations recognized | 59,346 |
| Dispositions | (150,885) |
| Obligations settled | (14,447) |
| Accretion | 38,650 |
| Changes in rates | 19,162 |
| Foreign exchange | (6,321) |
| Balance at June 30 | 1,033,262 |
Vermilion calculated the present value of the obligations using a credit-adjusted risk-free rate, calculated using a credit spread of 4.5% as at June 30, 2023 (December 31, 2022 - 4.5%) added to risk-free rates based on long-term, risk-free government bonds. Vermilion's credit spread is determined using the Company's expected cost of borrowing at the end of the reporting period.
The country-specific risk-free rates used as inputs to discount the obligations were as follows:
| | Jun 30, 2023 | Dec 31, 2022 |
| Canada | 3.2 % | 3.3 % |
| United States | 4.0 % | 4.1 % |
| France | 3.2 % | 3.4 % |
| Netherlands | 2.7 % | 2.7 % |
| Germany | 2.3 % | 2.5 % |
| Ireland | 3.1 % | 3.2 % |
| Australia | 4.0 % | 4.2 % |
Vermilion defines capital as net debt and shareholders' capital. Net debt consists of long-term debt (excluding unrealized foreign exchange on swapped USD borrowings) plus adjusted working capital (defined as current assets less current liabilities, excluding current derivatives and current lease liabilities). In managing capital, Vermilion reviews whether fund flows from operations is sufficient to fund capital expenditures, dividends, and asset retirement obligations.
The following table calculates Vermilion’s ratio of net debt to four quarter trailing fund flows from operations:
| | Jun 30, 2023 | Dec 31, 2022 |
| Long-term debt | 913,785 | 1,081,351 |
| Adjusted working capital deficit (1) | 407,315 | 265,111 |
| Unrealized FX on swapped USD borrowings | - | (1,876) |
| Net debt | 1,321,100 | 1,344,586 |
| | | |
| Ratio of net debt to four quarter trailing fund flows from operations | 1.0 | 0.8 |
(1) Adjusted working capital is defined as current assets (excluding current derivatives), less current liabilities (excluding current derivatives and current lease liabilities)
| | | |
| | Vermilion Energy Inc. ■ Page 61 ■ 2023 Second Quarter Report | |
The following table summarizes Vermilion’s outstanding long-term debt:
| | As at |
| | Jun 30, 2023 | Dec 31, 2022 |
| Revolving credit facility | - | 147,666 |
| 2025 senior unsecured notes | 395,796 | 404,463 |
| 2030 senior unsecured notes | 517,989 | 529,222 |
| Long-term debt | 913,785 | 1,081,351 |
The fair value of the revolving credit facility is equal to its carrying value due to the use of short-term borrowing instruments at market rates of interest. The fair value of the 2025 senior unsecured notes as at June 30, 2023 was $388.6 million (December 31, 2022 - $391.3 million). The fair value of the 2030 senior unsecured notes as at June 30, 2023 was $489.9 million (December 31, 2022 - $496.8 million).
The following table reconciles the change in Vermilion’s long-term debt:
| | 2023 |
| Balance at January 1 | 1,081,351 |
| Repayments on the revolving credit facility | (146,591) |
| Amortization of transaction costs | 1,076 |
| Foreign exchange | (22,051) |
| Balance at June 30 | 913,785 |
Revolving credit facility
As at June 30, 2023, Vermilion had in place a bank revolving credit facility maturing May 29, 2027 with the following terms:
| | As at |
| | Jun 30, 2023 | Dec 31, 2022 |
| Total facility amount | 1,600,000 | 1,600,000 |
| Amount drawn | - | (147,666) |
| Letters of credit outstanding | (31,285) | (13,527) |
| Unutilized capacity | 1,568,715 | 1,438,807 |
The facility can be extended from time to time at the option of the lenders and upon notice from Vermilion. If no extension is granted by the lenders, the amounts owing pursuant to the facility are due at the maturity date. The facility is secured by various fixed and floating charges against the subsidiaries of Vermilion.
On May 19, 2023, the maturity date of the facility was extended to May 28, 2027 (previously May 29, 2026) and the total facility amount of $1.6 billion was unchanged. As at June 30, 2023, the facility was undrawn.
The facility bears interest at a rate applicable to demand loans plus applicable margins.
As at June 30, 2023, the revolving credit facility was subject to the following financial covenants:
| | | As at |
| Financial covenant | Limit | Jun 30, 2023 | Dec 31, 2022 |
| Consolidated total debt to consolidated EBITDA | Less than 4.0 | 0.46 | 0.51 |
| Consolidated total senior debt to consolidated EBITDA | Less than 3.5 | - | 0.07 |
| Consolidated EBITDA to consolidated interest expense | Greater than 2.5 | 23.39 | 27.10 |
The financial covenants include financial measures defined within the revolving credit facility agreement that are not defined under IFRS. These financial measures are defined by the revolving credit facility agreement as follows:
| | | |
| | Vermilion Energy Inc. ■ Page 62 ■ 2023 Second Quarter Report | |
| • | Consolidated total debt: Includes all amounts classified as “Long-term debt” and “Lease obligations” (including the current portion included within "Accounts payable and accrued liabilities" but excluding operating leases as defined under IAS 17) on the consolidated balance sheet. |
| • | Consolidated total senior debt: Consolidated total debt excluding unsecured and subordinated debt. |
| • | Consolidated EBITDA: Consolidated net earnings before interest, income taxes, depreciation, accretion and certain other non-cash items, adjusted for the impact of the acquisition of a material subsidiary. |
| • | Consolidated total interest expense: Includes all amounts classified as "Interest expense", but excludes interest on operating leases as defined under IAS 17. |
In addition, our revolving credit facility has provisions relating to our liability management ratings in Alberta and Saskatchewan whereby if our security adjusted liability management ratings fall below specified limits in a province, a portion of the asset retirement obligations are included in the definitions of consolidated total debt and consolidated total senior debt. An event of default occurs if our security adjusted liability management ratings breach additional lower limits for a period greater than 90 days. As of June 30, 2023, Vermilion's liability management ratings were higher than the specified levels, and as such, no amounts relating to asset retirement obligations were included in the calculation of consolidated total debt and consolidated total senior debt.
As at June 30, 2023 and December 31, 2022, Vermilion was in compliance with the above covenants.
2025 senior unsecured notes
On March 13, 2017, Vermilion issued US $300.0 million of senior unsecured notes at par. The notes bear interest at a rate of 5.625% per annum, to be paid semi-annually on March 15 and September 15. The notes mature on March 15, 2025. As direct senior unsecured obligations of Vermilion, the notes rank equally with existing and future senior unsecured indebtedness of the Company.
The senior unsecured notes were recognized at amortized cost and include the transaction costs directly related to the issuance.
Subsequent to March 15, 2023, Vermilion may redeem some or all of the senior unsecured notes at a 100.000% redemption price plus any accrued and unpaid interest.
2030 senior unsecured notes
On April 26, 2022, Vermilion closed a private offering of US $400.0 million 8-year senior unsecured notes. The notes were priced at 99.241% of par, mature on May 1, 2030, and bear interest at a rate of 6.875% per annum. Interest is paid semi-annually on May 1 and November 1, commencing on November 1, 2022. The notes are senior unsecured obligations of Vermilion and rank equally with existing and future senior unsecured indebtedness.
The senior unsecured notes were recognized at amortized cost and include the transaction costs directly related to the issuance.
Vermilion may, at its option, redeem the notes prior to maturity as follows:
| • | On or after May 1, 2025, Vermilion may redeem some or all of the senior unsecured notes at the redemption prices set forth below, together with accrued and unpaid interest. |
| • | Prior to May 1, 2025, Vermilion may redeem up to 35% of the original principal amount of the notes with an amount of cash not greater than the net cash proceeds of certain equity offerings at a redemption price of 106.875% of the principal amount of the notes, together with accrued and unpaid interest. |
| • | Prior to May 1, 2025, Vermilion may also redeem some or all of the notes at a price equal to 100% of the principal amount of the notes, plus a “make-whole premium,” together with applicable premium, accrued and unpaid interest. |
| Year | Redemption price |
| 2025 | 103.438 % |
| 2026 | 102.292 % |
| 2027 | 101.146 % |
| 2028 and thereafter | 100.000 % |
| | | |
| | Vermilion Energy Inc. ■ Page 63 ■ 2023 Second Quarter Report | |
| 10. Shareholders' capital |
The following table reconciles the change in Vermilion’s shareholders’ capital:
| | 2023 |
| Shareholders’ Capital | Shares ('000s) | Amount |
| Balance at January 1 | 163,227 | 4,243,794 |
| Vesting of equity based awards | 3,428 | 21,175 |
| Shares issued for equity based compensation | 600 | 10,280 |
| Share-settled dividends on vested equity based awards | 57 | 1,051 |
| Repurchase of shares | (3,018) | (78,112) |
| Balance at June 30 | 164,294 | 4,198,188 |
Dividends are approved by the Board of Directors and are paid quarterly. Dividends declared to shareholders for the six months ended June 30, 2023 were $32.7 million or $0.20 per common share (2022 - $19.7 million or $0.06 per common share)
On July 10, 2023, the Toronto Stock Exchange approved our notice of intention to renew our normal course issuer bid ("the NCIB"). The NCIB renewal allows Vermilion to purchase up to 16,308,587 common shares (representing approximately 10% of outstanding common shares) beginning July 12, 2023 and ending July 11, 2024. Common shares purchased under the NCIB will be cancelled.
Subsequent to June 30, 2023 Vermilion purchased and cancelled 0.3 million common shares under the NCIB for total consideration of $4.7 million.
| 11. Financial instruments |
The following table summarizes the increase (positive values) or decrease (negative values) to net earnings before tax due to a change in the value of Vermilion’s financial instruments as a result of a change in the relevant market risk variable. This analysis does not attempt to reflect any interdependencies between the relevant risk variables.
| | Jun 30, 2023 |
| Currency risk - Euro to Canadian dollar | |
| $0.01 increase in strength of the Canadian dollar against the Euro | 7,113 |
| $0.01 decrease in strength of the Canadian dollar against the Euro | (7,113) |
| | |
| Currency risk - US dollar to Canadian dollar | |
| $0.01 increase in strength of the Canadian dollar against the US $ | 5,448 |
| $0.01 decrease in strength of the Canadian dollar against the US $ | (5,448) |
| | |
| Commodity price risk - Crude oil | |
| US $5.00/bbl increase in crude oil price used to determine the fair value of derivatives | (3,017) |
| US $5.00/bbl decrease in crude oil price used to determine the fair value of derivatives | 3,017 |
| | |
| Commodity price risk - European natural gas | |
| #eu#5.0/GJ increase in European natural gas price used to determine the fair value of derivatives | (126,122) |
| #eu#5.0/GJ decrease in European natural gas price used to determine the fair value of derivatives | 146,224 |
| | | |
| | Vermilion Energy Inc. ■ Page 64 ■ 2023 Second Quarter Report | |
| 12. Cash and cash equivalents |
The following table summarizes Vermilion’s cash and cash equivalents:
| | As at |
| | Jun 30, 2023 | Dec 31, 2022 |
| Cash on deposit with financial institutions | 50,568 | 13,701 |
| Guaranteed investment certificates | 132 | 135 |
| Cash and cash equivalents | 50,700 | 13,836 |
| | | |
| | Vermilion Energy Inc. ■ Page 65 ■ 2023 Second Quarter Report | |
DIRECTORS Robert Michaleski 1,3,5 Calgary, Alberta Dion Hatcher Calgary, Alberta James J. Kleckner Jr. 7,9 Edwards, Colorado Carin Knickel 4,7,11 Golden, Colorado Stephen P. Larke 3,5,10 Calgary, Alberta Timothy R. Marchant 6,9,11 Calgary, Alberta William Roby 7,8,11 Katy, Texas Manjit Sharma 2,5 Toronto, Ontario Myron Stadnyk 7,9 Calgary, Alberta Judy Steele 3,5,11 Halifax, Nova Scotia 1 Chairman (Independent) 2 Audit Committee Chair (Independent) 3 Audit Committee Member (Independent) 4 Governance and Human Resources Committee Chair __(Independent) 5 Governance and Human Resources Committee Member __(Independent) 6 Health, Safety and Environment Committee Chair __(Independent) 7 Health, Safety and Environment Committee Member __(Independent) 8 Independent Reserves Committee Chair (Independent) 9 Independent Reserves Committee Member __(Independent) 10 Sustainability Committee Chair (Independent) 11 Sustainability Committee Member (Independent) | OFFICERS / CORPORATE SECRETARY Dion Hatcher * President & Chief Executive Officer Lars Glemser * Vice President & Chief Financial Officer Terry Hergott Vice President Marketing Yvonne Jeffery Vice President Sustainability Darcy Kerwin * Vice President International & HSE Bryce Kremnica * Vice President North America Geoff MacDonald Vice President Geosciences Kyle Preston Vice President Investor Relations Averyl Schraven Vice President People & Culture Jenson Tan * Vice President Business Development Gerard Schut Vice President European Operations Jamie Gagner Interim Corporate Secretary * Executive Committee | AUDITORS Deloitte LLP Calgary, Alberta BANKERS The Toronto-Dominion Bank Alberta Treasury Branches Bank of America N.A., Canada Branch Canadian Imperial Bank of Commerce Export Development Canada National Bank of Canada Royal Bank of Canada The Bank of Nova Scotia Wells Fargo Bank N.A., Canadian Branch La Caisse Centrale Desjardins du Québec Citibank N.A., Canadian Branch - Citibank Canada Canadian Western Bank JPMorgan Chase Bank, N.A., Toronto Branch Goldman Sachs Lending Partners LLC EVALUATION ENGINEERS GLJ Petroleum Consultants Ltd. Calgary, Alberta LEGAL COUNSEL Norton Rose Fulbright Canada LLP Calgary, Alberta TRANSFER AGENT Odyssey Trust Company STOCK EXCHANGE LISTINGS The Toronto Stock Exchange (“VET”) The New York Stock Exchange (“VET”) INVESTOR RELATIONS Kyle Preston Vice President Investor Relations 403-476-8431 TEL 403-476-8100 FAX 1-866-895-8101 IR TOLL FREE investor_relations@vermilionenergy.com |
| | Vermilion Energy Inc. ■ Page 65 ■ 2023 Second Quarter Report | |