Exhibit 99.2
Disclaimer
Certain statements included or incorporated by reference in this document may constitute forward-looking statements or information under applicable securities legislation. Such forward-looking statements or information typically contain statements with words such as "anticipate", "believe", "expect", "plan", "intend", "estimate", "propose", or similar words suggesting future outcomes or statements regarding an outlook. Forward looking statements or information in this document may include, but are not limited to: capital expenditures and Vermilion’s ability to fund such expenditures; Vermilion’s additional debt capacity providing it with additional working capital; statements regarding the return of capital, the flexibility of Vermilion’s capital program and operations; business strategies and objectives; operational and financial performance; estimated volumes of reserves and resources; petroleum and natural gas sales; future production levels and the timing thereof, including Vermilion’s 2023 guidance, and rates of average annual production growth; the effect of changes in crude oil and natural gas prices, changes in exchange and inflation rates; significant declines in production or sales volumes due to unforeseen circumstances; the effect of possible changes in critical accounting estimates; statements regarding the growth and size of Vermilion’s future project inventory wells expected to be drilled in 2023; exploration and development plans and the timing thereof; Vermilion’s ability to reduce its debt; statements regarding Vermilion’s hedging program, its plans to add to its hedging positions, and the anticipated impact of Vermilion’s hedging program on project economics and free cash flows; the potential financial impact of climate-related risks; acquisition and disposition plans and the timing thereof; operating and other expenses, including the payment and amount of future dividends; royalty and income tax rates and Vermilion’s expectations regarding future taxes and taxability; and the timing of regulatory proceedings and approvals.
Such forward-looking statements or information are based on a number of assumptions, all or any of which may prove to be incorrect. In addition to any other assumptions identified in this document, assumptions have been made regarding, among other things: the ability of Vermilion to obtain equipment, services and supplies in a timely manner to carry out its activities in Canada and internationally; the ability of Vermilion to market crude oil, natural gas liquids, and natural gas successfully to current and new customers; the timing and costs of pipeline and storage facility construction and expansion and the ability to secure adequate product transportation; the timely receipt of required regulatory approvals; the ability of Vermilion to obtain financing on acceptable terms; foreign currency exchange rates and interest rates; future crude oil, natural gas liquids, and natural gas prices; and management’s expectations relating to the timing and results of exploration and development activities.
Although Vermilion believes that the expectations reflected in such forward-looking statements or information are reasonable, undue reliance should not be placed on forward-looking statements because Vermilion can give no assurance that such expectations will prove to be correct. Financial outlooks are provided for the purpose of understanding Vermilion’s financial position and business objectives, and the information may not be appropriate for other purposes. Forward-looking statements or information are based on current expectations, estimates, and projections that involve a number of risks and uncertainties which could cause actual results to differ materially from those anticipated by Vermilion and described in the forward-looking statements or information. These risks and uncertainties include, but are not limited to: the ability of management to execute its business plan; the risks of the oil and gas industry, both domestically and internationally, such as operational risks in exploring for, developing and producing crude oil, natural gas liquids, and natural gas; risks and uncertainties involving geology of crude oil, natural gas liquids, and natural gas deposits; risks inherent in Vermilion's marketing operations, including credit risk; the uncertainty of reserves estimates and reserves life and estimates of resources and associated expenditures; the uncertainty of estimates and projections relating to production and associated expenditures; potential delays or changes in plans with respect to exploration or development projects; Vermilion's ability to enter into or renew leases on acceptable terms; fluctuations in crude oil, natural gas liquids, and natural gas prices, foreign currency exchange rates, interest rates, and inflation rates; health, safety, and environmental risks; uncertainties as to the availability and cost of financing; the ability of Vermilion to add production and reserves through exploration and development activities; the possibility that government policies or laws may change or governmental approvals may be delayed or withheld; uncertainty in amounts and timing of royalty payments; risks associated with existing and potential future law suits and regulatory actions against or involving Vermilion; and other risks and uncertainties described elsewhere in this document or in Vermilion's other filings with Canadian securities regulatory authorities.
The forward-looking statements or information contained in this document are made as of the date hereof and Vermilion undertakes no obligation to update publicly or revise any forward-looking statements or information, whether as a result of new information, future events, or otherwise, unless required by applicable securities laws.
This document contains references to sustainability/ESG data and performance that reflect metrics and concepts that are commonly used in such frameworks as the Global Reporting Initiative, the Task Force on Climate-related Financial Disclosures, and the Sustainability Accounting Standards Board. Vermilion has used best efforts to align with the most commonly accepted methodologies for ESG reporting, including with respect to climate data and information on potential future risks and opportunities, in order to provide a fuller context for our current and future operations. However, these methodologies are not yet standardized, are frequently based on calculation factors that change over time, and continue to evolve rapidly. Readers are particularly cautioned to evaluate the underlying definitions and measures used by other companies, as these may not be comparable to Vermilion's. While Vermilion will continue to monitor and adapt its reporting accordingly, the Company is not under any duty to update or revise the related sustainability/ESG data or statements except as required by applicable securities laws.
All crude oil and natural gas reserve and resource information contained in this document has been prepared and presented in accordance with National Instrument 51-101 Standards of Disclosure for Oil and Gas Activities and the Canadian Oil and Gas Evaluation Handbook. Reserves
Vermilion Energy Inc. ■ Page 1 ■ 2022 Management's Discussion and Analysis
estimates have been made assuming that development of each property in respect of which the estimate is made will occur, without regard to the likely availability of funding required for such development. The actual crude oil and natural gas reserves and future production will be greater than or less than the estimates provided in this document.
Natural gas volumes have been converted on the basis of six thousand cubic feet of natural gas to one barrel of oil equivalent. Barrels of oil equivalent (boe) may be misleading, particularly if used in isolation. A boe conversion ratio of six thousand cubic feet to one barrel of oil is based on an energy equivalency conversion method primarily applicable at the burner tip and does not represent a value equivalency at the wellhead.
Financial data contained within this document are reported in Canadian dollars unless otherwise stated.
Vermilion Energy Inc. ■ Page 2 ■ 2022 Management's Discussion and Analysis
Abbreviations
$M | thousand dollars |
$MM | million dollars |
AECO | the daily average benchmark price for natural gas at the AECO ‘C’ hub in Alberta |
bbl(s) | barrel(s) |
bbls/d | barrels per day |
boe | barrel of oil equivalent, including: crude oil, condensate, natural gas liquids, and natural gas (converted on the basis of one boe for six mcf of natural gas) |
boe/d | barrel of oil equivalent per day |
GJ | gigajoules |
LSB | light sour blend crude oil reference price |
mbbls | thousand barrels |
mcf | thousand cubic feet |
mmcf/d | million cubic feet per day |
NBP | the reference price paid for natural gas in the United Kingdom at the National Balancing Point Virtual Trading Point |
NGLs | natural gas liquids, which includes butane, propane, and ethane |
PRRT | Petroleum Resource Rent Tax, a profit based tax levied on petroleum projects in Australia |
tCO2e | tonnes of carbon dioxide equivalent |
TTF | the price for natural gas in the Netherlands, quoted in megawatt hours of natural gas, at the Title Transfer Facility Virtual Trading Point |
WTI | West Texas Intermediate, the reference price paid for crude oil of standard grade in US dollars at Cushing, Oklahoma |
Vermilion Energy Inc. ■ Page 3 ■ 2022 Management's Discussion and Analysis
Management's Discussion and Analysis
The following is Management’s Discussion and Analysis (“MD&A”), dated March 8, 2023, of Vermilion Energy Inc.’s (“Vermilion”, “we”, “our”, “us” or the “Company”) operating and financial results as at and for the three months and year ended December 31, 2022 compared with the corresponding periods in the prior year.
This discussion should be read in conjunction with the audited consolidated financial statements for the year ended December 31, 2022 and 2021, together with the accompanying notes. Additional information relating to Vermilion, including its Annual Information Form, is available on SEDAR at www.sedar.com or on Vermilion’s website at www.vermilionenergy.com.
The audited consolidated financial statements for the year ended December 31, 2022 and comparative information have been prepared in Canadian dollars and in accordance with International Financial Reporting Standards (“IFRS” or, alternatively, “GAAP”) as issued by the International Accounting Standards Board ("IASB").
This MD&A includes references to certain financial and performance measures which do not have standardized meanings prescribed by IFRS. These measures include:
| ● | Fund flows from operations: Fund flows from operations (FFO) is a total of segments measure most directly comparable to net earnings and is comprised of sales excluding royalties, transportation, operating, G&A, corporate income tax, PRRT, windfall taxes, interest expense, realized loss on derivatives, realized foreign exchange gain (loss), and realized other income. The measure is used to assess the contribution of each business unit to Vermilion's ability to generate income necessary to pay dividends, repay debt, fund asset retirement obligations and make capital investments. A reconciliation to Net Earnings can be found within the "Non-GAAP and Other Specified Financial Measures" section of this MD&A. |
| ● | Free cash flow: Free cash flow (FCF) is a non-GAAP financial measure most directly comparable to Cash flows used in investing activities and is comprised of FFO less drilling and development costs and exploration and evaluation costs. The measure is used to determine the funding available for investing and financing activities including payment of dividends, repayment of long-term debt, reallocation into existing business units and deployment into new ventures. A reconciliation to Cash flows used in investing activities can be found within the "Non-GAAP and Other Specified Financial Measures" section of this MD&A. |
| ● | Net debt: Net debt is a capital management measure in accordance with IAS 1 "Presentation of Financial Statements" and is most directly comparable to long-term debt. Net debt is comprised of long-term debt (excluding unrealized foreign exchange on swapped USD borrowings) plus adjusted working capital (defined as current assets less current liabilities, excluding current derivatives and current lease liabilities), and represents Vermilion's net financing obligations after adjusting for the timing of working capital fluctuations. Net debt excludes lease obligations which are secured by a corresponding right-of-use asset. A reconciliation to long term-debt can be found within the "Financial Position Review" section of this MD&A. |
| ● | Operating Netbacks: Operating Netbacks is a non-GAAP financial measure most directly comparable to net earnings and is calculated as sales less royalties, operating expense, transportation costs, PRRT, and realized hedging gains and losses presented on a per unit basis. Management assesses operating netback as a measure of the profitability and efficiency of our field operations. A reconciliation to the primary financial statement measures can be found within "Supplemental Table 1: Netbacks" of this MD&A. |
| ● | Fund flows from operations per boe: Fund flows from operations per boe includes general and administration expense. Fund flows from operations netback is used by management to assess the profitability of our business units and Vermilion as a whole. A reconciliation to the primary financial statement measures can be found within "Supplemental Table 1: Netbacks" of this MD&A. |
In addition, this MD&A includes references to certain financial measures which are not specified, defined, or determined under IFRS and are therefore considered non-GAAP and other specified financial measures. These financial measures are unlikely to be comparable to similar financial measures presented by other issuers. For a full description of these non-GAAP and other specified financial measures and a reconciliation of these measures to their most directly comparable GAAP measures, please refer to “Non-GAAP and Other Specified Financial Measures”.
Product Type Disclosure
Under National Instrument 51-101 "Standards of Disclosure for Oil and Gas Activities", disclosure of production volumes should include segmentation by product type as defined in the instrument. In this report, references to "crude oil" and "light and medium crude oil" mean "light crude oil and medium crude oil" and references to "natural gas" mean "conventional natural gas".
In addition, in Supplemental Table 4 "Production", Vermilion provides a reconciliation from total production volumes to product type and also a reconciliation of "crude oil and condensate" and "NGLs" to the product types "light crude oil and medium crude oil" and "natural gas liquids".
Vermilion Energy Inc. ■ Page 4 ■ 2022 Management's Discussion and Analysis
Production volumes reported are based on quantities as measured at the first point of sale.
Guidance
On November 29, 2021, we released our 2022 capital budget and associated production guidance. On March 28, 2022, we increased our 2022 capital expenditure guidance to $500 million and our 2022 annual production guidance to 86,000 to 88,000 boe/d to reflect the post-closing impact of the acquisition of Leucrotta Exploration Inc. On August 11, 2022, as a result of forest fire related downtime in France and offshore drilling delays in Australia, combined with inflationary pressure, we increased our 2022 budget by $50 million to $550 million.
The following table summarizes our 2022 guidance:
| | | | | | |
|
| Date |
| Capital Expenditures ($MM) |
| Production (boe/d) |
2022 Guidance | | | | | | |
2022 Guidance | | November 29, 2021 |
| 425 |
| 83,000 - 85,000 |
2022 Guidance | | March 28, 2022 |
| 500 |
| 86,000 - 88,000 |
2022 Guidance | | August 11, 2022 |
| 550 |
| 86,000 - 88,000 |
2022 Actual Results | | March 8, 2023 |
| 552 |
| 85,187 |
On January 6, 2023, we released our 2023 capital budget and associated production guidance. Our 2023 guidance assumes the Corrib acquisition will close on March 31, 2023. On March 8, 2023, we decreased annual production guidance to 82,000 to 86,000 boe/d to reflect the southeast Saskatchewan asset sale and unplanned downtime in Australia, and decreased operating expense guidance to reflect the southeast Saskatchewan asset sale and lower European gas prices. Revisions to other guidance items reflect the assumptions used in management's most recent forecast. The Company's guidance for 2023 is as follows:
| | | | | | | |
Category |
| Prior (1) |
| Revised (1) |
| ||
Production (boe/d) |
| | 87,000 - 91,000 |
| | 82,000 - 86,000 | |
E&D Capital Expenditures ($MM) |
| | 570 |
| | 570 | |
Royalty rate (%) (2) |
| | 8 - 10 | % | | 9 - 11 | % |
Operating ($/boe) | | $ | 17.50 - 18.50 | | $ | 16.50 - 17.50 | |
Transportation ($/boe) | | $ | 2.75 - 3.25 | | $ | 3.00 - 3.50 | |
General and administration ($/boe) | | $ | 2.00 - 2.50 | | $ | 2.00 - 2.50 | |
Cash taxes (% of pre-tax FFO) | |
| 11 - 13 | % |
| 7 - 9 | % |
Windfall tax (% of pre-tax FFO) (3) | |
| 14 - 16 | % |
| 12 - 14 | % |
| (1) | Revised 2023 guidance reflects foreign exchange assumptions of CAD/USD 1.35, CAD/EUR 1.45, and CAD/AUD 0.92. Prior 2023 guidance reflected foreign exchange assumptions of CAD/USD 1.36, CAD/EUR 1.46, and CAD/AUD 0.92. |
| (3) | Windfall tax guidance is based on forward prices as at February 27, 2023 (prior as at December 30, 2022), and incorporates all forms of solidarity payments including windfall taxes and windfall royalties net of tax. |
Vermilion Energy Inc. ■ Page 5 ■ 2022 Management's Discussion and Analysis
Vermilion's Business
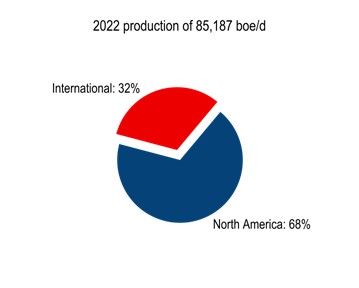
Vermilion is a Calgary, Alberta-based international oil and gas producer focused on the acquisition, exploration, development, and optimization of producing properties in North America, Europe, and Australia. We manage our business through our Calgary head office and our international business unit offices.
|
|
| |
| |
Vermilion Energy Inc. ■ Page 6 ■ 2022 Management's Discussion and Analysis
Consolidated Results Overview
| | | | | | | | | | | | | |
| | | | | | Q4/22 vs. | | | | | | 2022 vs. | |
|
| Q4 2022 |
| Q4 2021 |
| Q4/21 |
| 2022 |
| 2021 |
| 2021 |
|
Production (1) | | | | | | | | | | | | | |
Crude oil and condensate (bbls/d) |
| 38,915 |
| 36,264 | | 7 | % | 37,530 |
| 38,143 |
| (2) | % |
NGLs (bbls/d) |
| 7,497 |
| 8,461 | | (11) | % | 7,961 |
| 8,325 |
| (4) | % |
Natural gas (mmcf/d) |
| 234.23 |
| 238.16 | | (2) | % | 238.18 |
| 233.64 |
| 2 | % |
Total (boe/d) |
| 85,450 |
| 84,417 | | 1 | % | 85,187 |
| 85,408 |
| — | % |
(Draw) build in inventory (mbbls) |
| (242) |
| (144) | | |
| 39 |
| 44 |
|
| |
Financial metrics |
|
|
|
| |
|
| |
|
|
|
| |
Fund flows from operations ($M) (2) |
| 284,220 |
| 322,173 | | (12) | % | 1,634,865 |
| 919,862 |
| 78 | % |
Per share ($/basic share) |
| 1.74 |
| 1.99 | | (13) | % | 10.00 |
| 5.71 |
| 75 | % |
Net earnings ($M) |
| 395,408 |
| 344,588 | | 15 | % | 1,313,062 |
| 1,148,696 |
| 14 | % |
Per share ($/basic share) |
| 2.42 |
| 2.12 | | 14 | % | 8.03 |
| 7.13 |
| 13 | % |
Cash flows from operating activities ($M) | | 495,195 | | 250,352 | | 98 | % | 1,814,220 | | 834,453 | | 117 | % |
Free cash flow ($M) (3) | | 114,915 | | 176,366 | | (35) | % | 1,083,048 | | 545,066 | | 99 | % |
Long-term debt ($M) |
| 1,081,351 |
| 1,651,569 | | (35) | % | 1,081,351 |
| 1,651,569 |
| (35) | % |
Net debt ($M) (4) |
| 1,344,586 |
| 1,644,786 | | (18) | % | 1,344,586 |
| 1,644,786 |
| (18) | % |
Activity |
|
|
|
| |
|
| |
|
|
|
| |
Capital expenditures ($M)(5) |
| 169,305 |
| 145,807 | | 16 | % | 551,817 |
| 374,796 |
| 47 | % |
Acquisitions ($M)(6) |
| 4,558 |
| 23,633 | | |
| 539,713 |
| 130,965 |
|
| |
(1) | Please refer to Supplemental Table 4 "Production" for disclosure by product type. |
(2) | Fund flows from operations (FFO) and FFO per share are a total of segments measure and supplementary financial measure respectively most directly comparable to net earnings and net earnings per share, respectively. The measures do not have a standardized meaning under IFRS and therefore may not be comparable to similar measures presented by other issuers. FFO is comprised of sales excluding royalties, transportation, operating, G&A, corporate income tax, PRRT, windfall taxes, interest expense, and realized loss (gain) on derivatives, plus realized gain (loss) on foreign exchange and realized other income. The measure is used to assess the contribution of each business unit to Vermilion's ability to generate income necessary to pay dividends, repay debt, fund asset retirement obligations and make capital investments. A reconciliation to the primary financial statement measures can be found within the "Non-GAAP and Other Specified Financial Measures" section of this MD&A. |
(3) | Free cash flow (FCF) is a non-GAAP financial measure most directly comparable to cash flows from operating activities; it does not have a standardized meaning under IFRS and therefore may not be comparable to similar measures presented by other issuers. FCF is comprised of fund flows from operations less drilling and development costs and exploration and evaluation costs. The measure is used to determine the funding available for investing and financing activities including payment of dividends, repayment of long-term debt, reallocation into existing business units and deployment into new ventures. A reconciliation to primary financial statement measures can be found within the "Non-GAAP and Other Specified Financial Measures" section of this MD&A. |
(4) | Net debt is a capital management measure in accordance with IAS 1 "Presentation of Financial Statements" and is most directly comparable to long-term debt. Net debt is comprised of long-term debt (excluding unrealized foreign exchange on swapped USD borrowings) plus adjusted working capital (defined as current assets less current liabilities, excluding current derivatives and current lease liabilities), and represents Vermilion's net financing obligations after adjusting for the timing of working capital fluctuations. Net debt excludes lease obligations which are secured by a corresponding right-of-use asset. A reconciliation to the primary financial statement measures can be found within the "Financial Position Review" section of this MD&A. |
(5) | Capital expenditures is a non-GAAP financial measure that does not have a standardized meaning under IFRS and therefore may not be comparable to similar measures presented by other issuers. The measure is calculated as the sum of drilling and development costs and exploration and evaluation costs from the Consolidated Statements of Cash Flows. We consider capital expenditures to be a useful measure of our investment in our existing asset base. Capital expenditures are also referred to as E&D capital. A reconciliation to the primary financial statement measures can be found within the "Non-GAAP and Other Specified Financial Measures" section of this MD&A. |
(6) | Acquisitions is a non-GAAP financial measure that does not have a standardized meaning under IFRS and therefore may not be comparable to similar measures presented by other issuers. The measure is calculated as the sum of acquisitions from the Consolidated Statements of Cash Flows, Vermilion common shares issued as consideration, the estimated value of contingent consideration, the amount of acquiree's outstanding long-term debt assumed plus or net of acquired working capital deficit or surplus. We believe that including these components provides a useful measure of the economic investment associated with our acquisition activity. A reconciliation to the acquisitions line item in the Consolidated Statements of Cash Flows can be found in "Supplemental Table 3: Capital Expenditures and Acquisitions" section of this MD&A. |
Vermilion Energy Inc. ■ Page 7 ■ 2022 Management's Discussion and Analysis
Financial performance review
Q4 2022 vs. Q4 2021
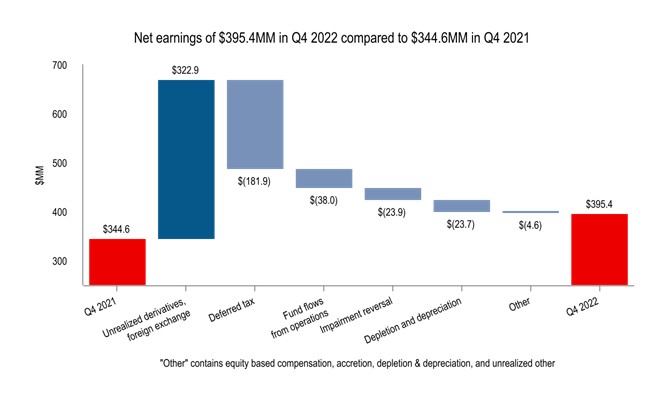
·We recorded net earnings of $395.4 million ($2.42/basic share) for Q4 2022 compared to $344.6 million ($2.12/basic share) in Q4 2021. The increase in net earnings was primarily due to a change in the position of unrealized derivative loss in Q4 2022 by $377.4 million driven by changes in our mark-to-market position and settlements. This was partially offset by deferred taxes resulting from increased taxable income and lower fund flows from operations as the full year impact of 2022 windfall taxes ($222.9 million) was accrued in Q4, 2022.
Vermilion Energy Inc. ■ Page 8 ■ 2022 Management's Discussion and Analysis
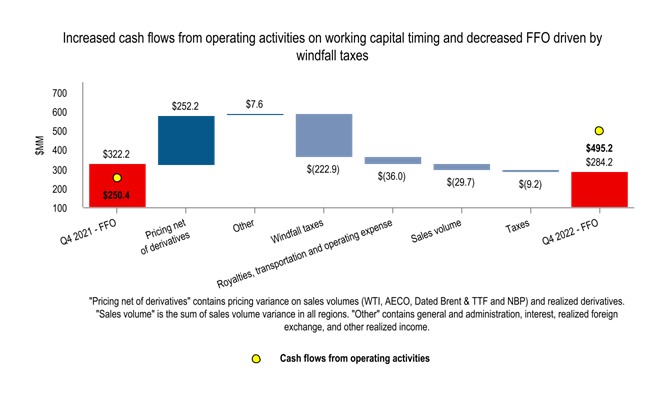
| ● | We generated cash flows from operating activities of $495.2 million in Q4 2022 compared to $250.4 million in Q4 2021 and fund flows from operations of $284.2 million in Q4 2022 compared to $322.2 million in Q4 2021. The decrease in fund flows from operations was primarily due to the recognition of the full year impact of 2022 windfall taxes ($222.9 million) in Q4 2022. These decreases were partially offset by higher commodity prices. The variance between cash flows from operating activities and fund flows from operations is primarily due to non-cash working capital impacts of the windfall taxes payable. |
2022 vs. 2021
Vermilion Energy Inc. ■ Page 9 ■ 2022 Management's Discussion and Analysis
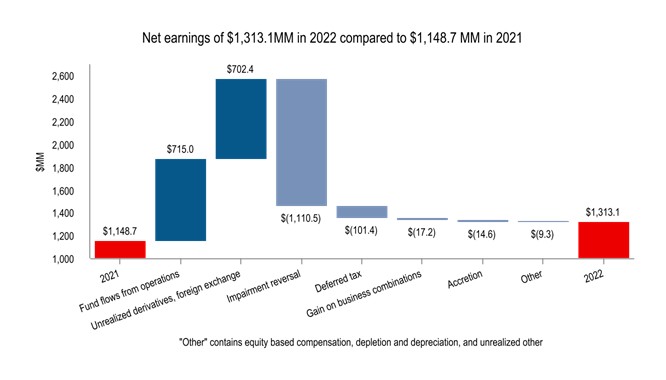
·For the year ended December 31, 2022, we recorded net earnings of $1,313.1 million compared $1,148.7 million for the comparable period in 2021. The increase in net earnings was primarily due to higher fund flows from operations driven by increased consolidated realized pricing and changes in our unrealized derivative position of $721.9 million driven by changes in the mark-to-market position. The increases were partially offset by lower impairment reversals recorded in 2022 of $144.4 million (net of $47.7 million deferred income tax expense), compared to impairment reversals recorded in 2021 of $987.1 million (net of $315.5 million deferred income tax expense).
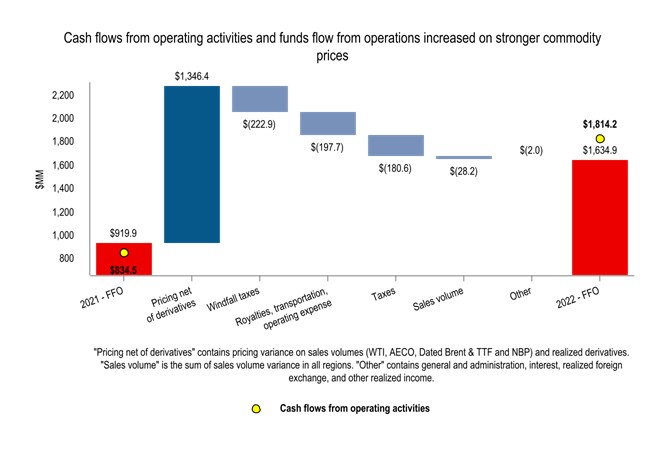
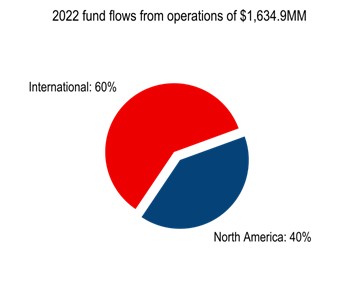
·For the year ended December 31, 2022 as compared to 2021, cash flows from operating activities increased by $979.8 million to $1,814.2 million and fund flows from operations increased by $715.0 million to $1,634.9 million. The increase in fund flows from operations were primarily driven by a 68% increase in our consolidated realized price from $66.81/boe to $111.95/boe and were partially offset by increased contributions to the jurisdictions we operate in the form of windfall taxes, increased current taxes, and increased royalties. The variance between cash flows from operating activities and fund flows from operations is primarily driven by non-cash working capital impact of the windfall taxes payable.
Production review
Q4 2022 vs. Q4 2021
· Consolidated average production of 85,450 boe/d in Q4 2022 increased slightly compared to Q4 2021 production of 84,417 boe/d. Production increased in Germany and Canada due to acquisitions in 2021 and 2022, respectively, as well as in Australia primarily due to new wells coming online in 2022. The increases were partially offset by natural decline in the Netherlands, France, and Ireland.
2022 vs. 2021
· Consolidated average production of 85,187 boe/d in the year ended December 31, 2022 decreased slightly from 85,408 boe/d in the prior year comparative period. Production decreased in the Netherlands, France, and Ireland primarily due to natural decline. This was partially offset by an increase in Canada, Germany and the United States primarily due to acquisition activity in 2021 and 2022.
Activity review
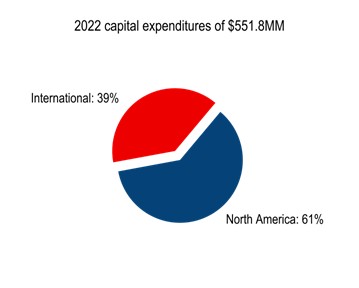
| ● | For the three months ended December 31, 2022, capital expenditures of $169.3 million were incurred. |
| ● | In our North America core region, we incurred capital expenditures of $113.9 million. In Canada, capital expenditures totaled $111.5 million as we drilled seven (5.5 net) wells, completed ten (6.9 net) wells, and brought on production twelve (6.7 net) wells in southeast Saskatchewan, and drilled twelve (10.6 net), completed ten (8.2 net), and brought on production seven (6.9 net) Mannville liquids-rich gas wells, we drilled one (1.0 |
Vermilion Energy Inc. ■ Page 10 ■ 2022 Management's Discussion and Analysis
| net) Mica well, and brought on production the wells on our first 6.0 (6.0 net) well Montney pad in Alberta. In the United States, $2.4 million was incurred primarily related to preparation for the 2023 drilling program which will commence in Q2 2023. |
| ● | In our International core region, capital expenditures of $55.4 million were incurred during Q4 2022. Our activities included $15.7 million incurred in France primarily on facilities and subsurface maintenance activities, $14.2 million incurred in the Netherlands primarily on drilling activities, and $10.1 million incurred in Germany primarily on drilling and facilities activity along with various other costs associated with support work for our Q4 2022 drilling campaign in Europe. |
Financial sustainability review
Free cash flow
| ● | Free cash flow of $1,083.0 million increased by $538.0 million for the year ended December 31, 2022 compared to the prior year period which was primarily driven by increased fund flows from operations on higher realized prices, partially offset by higher expenditure on drilling and development activities. |
Long-term debt and net debt
| ● | Long-term debt decreased to $1.1 billion as at December 31, 2022 from $1.7 billion as at December 31, 2021 as a result of net repayments of $622.8 million, partially offset by unrealized foreign exchange losses of $50.8 million due to the US dollar strengthening. |
| ● | Net debt as at December 31, 2022 decreased to $1.3 billion from $1.6 billion at December 31, 2021 primarily due to decreases in long-term debt, partially offset by increases in income taxes payable as a result of $222.9 million of windfall taxes in Q4 2022. |
| ● | The ratio of net debt to four quarter trailing fund flows from operations(1) decreased to 0.8 as at December 31, 2022 (December 31, 2021 - 1.8) primarily due to higher four quarter trailing fund flows from operations. |
| (1) | Net debt to four quarter trailing fund flows from operations is a supplementary financial measure that does not have a standardized meaning under IFRS and therefore may not be comparable to similar measures presented by other issuers. It is calculated as net debt (capital measure) over the FFO from the preceding 4 quarters (total of segments measure). The measure is used to assess our ability to repay debt. |
Vermilion Energy Inc. ■ Page 11 ■ 2022 Management's Discussion and Analysis
Benchmark Commodity Prices
| | | | | | | | | | | | | |
|
| |
| |
| Q4/22 vs. |
| |
| |
| 2022 vs. |
|
| | Q4 2022 | | Q4 2021 | | Q4/21 | | 2022 | | 2021 | | 2021 |
|
Crude oil | | | | | | | | | | | | | |
WTI ($/bbl) |
| 112.24 |
| 97.21 |
| 16 | % | 122.62 |
| 85.14 |
| 44 | % |
WTI (US $/bbl) |
| 82.65 |
| 77.19 |
| 7 | % | 94.23 |
| 67.92 |
| 39 | % |
Edmonton Sweet index ($/bbl) |
| 109.85 |
| 93.30 |
| 18 | % | 120.25 |
| 80.27 |
| 50 | % |
Edmonton Sweet index (US $/bbl) |
| 80.89 |
| 74.09 |
| 9 | % | 92.41 |
| 64.03 |
| 44 | % |
Saskatchewan LSB index ($/bbl) |
| 106.05 |
| 92.90 |
| 14 | % | 118.22 |
| 80.12 |
| 48 | % |
Saskatchewan LSB index (US $/bbl) |
| 78.09 |
| 73.77 |
| 6 | % | 90.85 |
| 63.91 |
| 42 | % |
Canadian C5+ Condensate index ($/bbl) |
| 113.19 |
| 99.65 |
| 14 | % | 121.96 |
| 85.50 |
| 43 | % |
Canadian C5+ Condensate index (US $/bbl) |
| 83.35 |
| 79.13 |
| 5 | % | 93.72 |
| 68.20 |
| 37 | % |
Dated Brent ($/bbl) |
| 120.47 |
| 100.40 |
| 20 | % | 131.68 |
| 88.67 |
| 49 | % |
Dated Brent (US $/bbl) |
| 88.71 |
| 79.73 |
| 11 | % | 101.19 |
| 70.73 |
| 43 | % |
Natural gas |
| |
| |
|
|
| |
| |
|
| |
North America |
| | | | | | | | | | | | |
AECO 5A ($/mcf) |
| 4.64 |
| 4.66 |
| — | % | 5.25 |
| 3.62 |
| 45 | % |
Henry Hub ($/mcf) |
| 8.50 |
| 7.34 |
| 16 | % | 8.67 |
| 4.82 |
| 80 | % |
Henry Hub (US $/mcf) | | 6.26 |
| 5.83 |
| 7 | % | 6.66 |
| 3.85 |
| 73 | % |
Europe(1) | | | | | | | | | | | | | |
NBP Day Ahead ($/mmbtu) | | 26.09 | | 37.76 | | (31) | % | 31.78 | | 19.62 | | 62 | % |
NBP Month Ahead ($/mmbtu) | | 43.51 | | 41.00 | | 6 | % | 41.44 | | 20.61 | | 101 | % |
NBP Day Ahead (€/mmbtu) | | 18.82 | | 26.21 | | (28) | % | 23.21 | | 13.22 | | 76 | % |
NBP Month Ahead (€/mmbtu) | | 31.38 | | 28.46 | | 10 | % | 30.26 | | 13.89 | | 118 | % |
TTF Day Ahead ($/mmbtu) | | 38.36 | | 38.86 | | (1) | % | 48.35 | | 19.86 | | 144 | % |
TTF Month Ahead ($/mmbtu) |
| 49.98 |
| 40.25 |
| 24 | % | 52.59 |
| 20.35 |
| 158 | % |
TTF Day Ahead (€/mmbtu) |
| 27.67 |
| 26.97 |
| 3 | % | 35.30 |
| 13.39 |
| 164 | % |
TTF Month Ahead (€/mmbtu) |
| 36.05 |
| 27.94 |
| 29 | % | 38.40 |
| 13.72 |
| 180 | % |
Average exchange rates |
|
|
| |
|
|
| |
| |
|
| |
CDN $/US $ |
| 1.36 |
| 1.26 |
| 8 | % | 1.30 |
| 1.25 | | 4 | % |
CDN $/Euro |
| 1.39 |
| 1.44 |
| (4) | % | 1.37 |
| 1.48 |
| (7) | % |
Realized prices |
|
|
| |
|
|
| |
| |
|
| |
Crude oil and condensate ($/bbl) |
| 115.02 |
| 96.88 |
| 19 | % | 123.89 |
| 83.78 |
| 48 | % |
NGLs ($/bbl) |
| 39.93 |
| 47.27 |
| (16) | % | 45.95 |
| 34.44 |
| 33 | % |
Natural gas ($/mcf) |
| 17.43 |
| 17.89 |
| (3) | % | 18.99 |
| 9.53 |
| 99 | % |
Total ($/boe) |
| 103.99 |
| 96.82 |
| 7 | % | 111.95 |
| 66.81 |
| 68 | % |
(1) NBP and TTF pricing can occur on a day-ahead ("DA") or month-ahead ("MA") basis. DA prices in a period reflect the average current day settled price on the next days' delivery and MA prices in a period represent daily one month futures contract prices which are determined at the end of each month. In a rising price environment, the DA price will tend to be greater than the MA price and vice versa. Natural gas in the Netherlands and Germany is benchmarked to the TTF and production is generally equally split between DA and MA contracts. Natural gas in Ireland is benchmarked to the NBP and is sold on DA contracts.
As an internationally diversified producer, we are exposed to a range of commodity prices. In our North America core region, our crude oil is sold at benchmarks linked to WTI (including the Edmonton Sweet index, the Saskatchewan LSB index, and the Canadian C5+ index) and our natural gas is
Vermilion Energy Inc. ■ Page 12 ■ 2022 Management's Discussion and Analysis
sold at benchmarks linked to the AECO index (in Canada) or the Henry Hub ("HH") index (in the United States). In our International core region, our crude oil is sold with reference to Dated Brent and our natural gas is sold with reference to NBP, TTF, or indices highly correlated to TTF.
| ● | Crude oil prices increased in Q4 2022 relative to Q4 2021 as reduced spare capacity and increased geopolitical supply risks outweighed the incremental demand concerns regarding tighter monetary policies and global recession risks. Canadian dollar WTI and Brent prices rose 16% and 20%, respectively in Q4 2022 relative to Q4 2021. |
| ● | In Canadian dollar terms, year-over-year, the Edmonton Sweet differential narrowed by $1.42/bbl to a discount of $2.49/bbl against WTI, and the Saskatchewan LSB differential widened by $1.88/bbl to a discount of $6.19/bbl against WTI. |
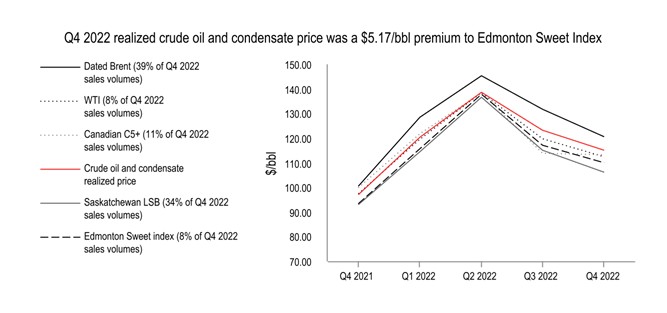
| ● | Approximately 39% of Vermilion’s Q4 2022 crude oil and condensate production was priced at the Dated Brent index, which averaged a premium to WTI of US$6.06/bbl, while the remainder of our crude oil and condensate production was priced at the Saskatchewan LSB, Canadian C5+, Edmonton Sweet, and WTI indices. |
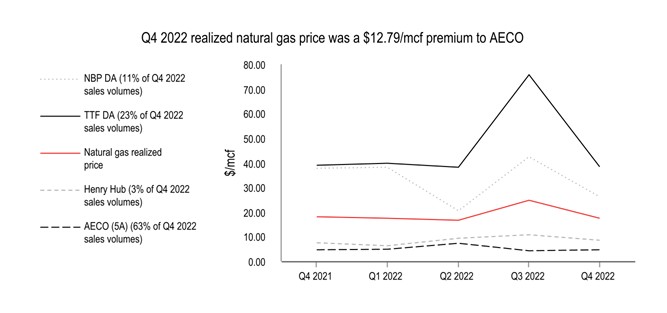
| ● | In Canadian dollar terms, year-over-year, prices for European natural gas linked to NBP and TTF decreased by 31% and 1% respectively on a day-ahead basis. On a month ahead basis, NBP and TTF rose by 6% and 24% respectively. While prices were off their Q3 2022 highs, they |
Vermilion Energy Inc. ■ Page 13 ■ 2022 Management's Discussion and Analysis
| remained slightly elevated compared to historical trends due to Russian pipeline supply decreases, elevated winter risk premium, and requirement to attract increased LNG imports. |
| ● | Natural gas prices in Canadian dollar terms at NYMEX HH increased by 16% while AECO remained flat. NYMEX HH prices benefited from temporary weather related demand increases and limited production growth in the second half of 2022. AECO year-over-year price changes were limited compared to NYMEX as basis widened on high WCSB production growth and storage levels returning to within their 5 year range levels. |
| ● | For Q4 2022, average European natural gas prices represented a $34.85/mcf premium to AECO. Approximately 34% of our natural gas production in Q4 2022 benefited from this premium European pricing. |
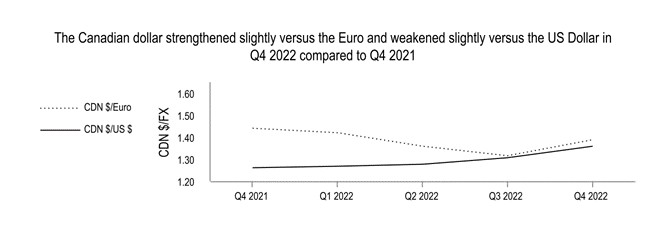
| ● | For the three months ended December 31, 2022, the Canadian dollar strengthened 4% against the Euro compared to Q4 2021. |
| ● | For the three months ended December 31, 2022, the Canadian dollar weakened 8% against the US Dollar compared to Q4 2021. |
North America
| | | | | | | | |
|
| Q4 2022 |
| Q4 2021 |
| 2022 |
| 2021 |
Production (1) |
|
|
|
|
|
|
|
|
Crude oil and condensate (bbls/d) |
| 25,291 |
| 23,846 |
| 24,393 |
| 24,390 |
NGLs (bbls/d) |
| 7,497 |
| 8,461 |
| 7,961 |
| 8,325 |
Natural gas (mmcf/d) |
| 154.26 |
| 137.93 |
| 151.30 |
| 144.87 |
Total production volume (boe/d) |
| 58,499 |
| 55,295 |
| 57,571 |
| 56,858 |
(1)Please refer to Supplemental Table 4 "Production" for disclosure by product type.
| | | | | | | | | | | | | | | | |
|
| Q4 2022 |
| Q4 2021 |
| 2022 |
| 2021 | ||||||||
| | $M |
| $/boe | | $M |
| $/boe | | $M |
| $/boe | | $M |
| $/boe |
Sales |
| 360,295 |
| 66.95 | | 305,054 |
| 59.97 |
| 1,510,517 |
| 71.88 |
| 1,014,190 |
| 48.87 |
Royalties |
| (50,945) | | (9.47) |
| (47,119) | | (9.26) |
| (240,432) | | (11.44) |
| (144,398) | | (6.96) |
Transportation |
| (13,014) | | (2.42) |
| (9,447) | | (1.86) |
| (45,467) | | (2.16) |
| (40,100) | | (1.93) |
Operating |
| (72,694) | | (13.51) |
| (59,425) | | (11.68) |
| (268,271) | | (12.77) |
| (232,370) | | (11.20) |
General and administration (1) |
| 513 | | 0.10 |
| (10,224) | | (2.01) |
| (20,651) | | (0.98) |
| (27,887) | | (1.34) |
Corporate income tax expense (1) | | (712) | | (0.13) | | 2,140 | | 0.42 | | (1,011) | | (0.05) | | 1,451 | | 0.07 |
Fund flows from operations |
| 223,443 | | 41.52 |
| 180,979 | | 35.58 |
| 934,685 | | 44.48 |
| 570,886 | | 27.51 |
Drilling and development |
| (113,892) | | |
| (89,643) | | |
| (338,556) | | |
| (222,782) | | |
Free cash flow |
| 109,551 | | |
| 91,336 | | |
| 596,129 | | |
| 348,104 | | |
(1)Includes amounts from Corporate segment.
Production from our North American operations averaged 58,499 boe/d in Q4 2022, an increase of 2% from the prior quarter primarily due to new well production from our Montney assets in Canada and a full quarter contribution from our 2022 drilling program in the United States. In Alberta, we drilled twelve (10.6 net), completed ten (8.2 net), and brought on production seven (6.9 net) Mannville liquids rich gas wells, while at Mica we drilled one (1.0 net) well and brought on production the six (6.0 net) wells from our first Montney pad. The six well Montney pad was brought on production in late November and saw rates increase through the balance of the year as the wells cleaned up. Total production from our Montney assets averaged 7,500
Vermilion Energy Inc. ■ Page 14 ■ 2022 Management's Discussion and Analysis
boe/d during the month of December. In December, drilling commenced on a follow up three-well pad in Alberta which is expected to be completed and tied in during the first half of 2023. During the fourth quarter we received three permits in British Columbia, including one of the permits to construct a 16,000 boe/d battery and drill a multi-well pad in British Columbia. We also signed agreements to acquire 11 sections of adjacent land at Mica, further consolidating our contiguous land base and increasing our Tier 1 inventory.
In Saskatchewan, we drilled seven (5.5 net) wells, completed ten (6.9 net) wells, and brought on production twelve (6.7 net) wells in southeast Saskatchewan. No drilling or completion activity occurred in the United States in the fourth quarter as the team focused on preparation for the 2023 drilling program which will commence in Q2 2023.
Sales
| | | | | | | | | | | | | | | | |
|
| Q4 2022 |
| Q4 2021 |
| 2022 |
| 2021 | ||||||||
| | $M |
| $/boe | | $M |
| $/boe | | $M |
| $/boe | | $M |
| $/boe |
Canada |
| 315,897 | | 65.13 |
| 270,600 | | 59.16 |
| 1,344,284 | | 70.33 |
| 901,775 | | 47.54 |
United States |
| 44,398 | | 83.51 |
| 34,454 | | 67.18 |
| 166,233 | | 87.46 |
| 112,415 | | 62.98 |
North America |
| 360,295 | | 66.95 |
| 305,054 | | 59.97 |
| 1,510,517 | | 71.88 |
| 1,014,190 | | 48.87 |
Sales in North America increased on a dollar and per unit basis for the three months and year ended December 31, 2022 versus the comparable prior periods due to significantly higher realized prices across all products coupled with slightly higher production primarily related to acquisition activity.
Royalties
| | | | | | | | | | | | | | | | |
|
| Q4 2022 |
| Q4 2021 |
| 2022 |
| 2021 | ||||||||
| | $M |
| $/boe | | $M |
| $/boe | | $M |
| $/boe | | $M |
| $/boe |
Canada |
| (38,747) | | (7.99) |
| (37,064) | | (8.10) |
| (196,005) | | (10.26) |
| (113,651) | | (5.99) |
United States |
| (12,198) |
| (22.94) |
| (10,055) |
| (19.60) |
| (44,427) |
| (23.38) |
| (30,747) |
| (17.23) |
North America |
| (50,945) |
| (9.47) |
| (47,119) |
| (9.26) |
| (240,432) |
| (11.44) |
| (144,398) |
| (6.96) |
Royalties in North America increased on a dollar and per unit basis for the three months and year ended December 31, 2022 versus the comparable prior periods primarily due to increased sliding scale royalties driven by higher commodity prices. Royalties as a percentage of sales for the three months and year ended December 31, 2022 were 14.1% and 15.9%, respectively, compared to the prior year comparative periods of 15.4% and 14.2% respectively.
Transportation
| | | | | | | | | | | | | | | | |
|
| Q4 2022 |
| Q4 2021 |
| 2022 |
| 2021 | ||||||||
| | $M |
| $/boe | | $M |
| $/boe | | $M |
| $/boe | | $M |
| $/boe |
Canada |
| (12,919) | | (2.66) |
| (9,134) | | (2.00) |
| (44,849) | | (2.35) |
| (38,764) | | (2.04) |
United States |
| (95) |
| (0.18) |
| (313) |
| (0.61) |
| (618) |
| (0.33) |
| (1,336) |
| (0.75) |
North America |
| (13,014) |
| (2.42) |
| (9,447) |
| (1.86) |
| (45,467) |
| (2.16) |
| (40,100) |
| (1.93) |
Transportation expense in North America increased on a dollar and per boe basis for the three months and year ended December 31, 2022 versus the comparable prior period primarily due to increased tariffs in Saskatchewan beginning in mid-2022.
Operating expense
| | | | | | | | | | | | | | | | |
|
| Q4 2022 |
| Q4 2021 |
| 2022 |
| 2021 | ||||||||
| | $M |
| $/boe | | $M |
| $/boe | | $M |
| $/boe | | $M |
| $/boe |
Canada |
| (63,305) | | (13.05) |
| (54,695) | | (11.96) |
| (240,899) | | (12.60) |
| (215,378) | | (11.35) |
United States |
| (9,389) |
| (17.66) |
| (4,730) |
| (9.22) |
| (27,372) |
| (14.40) |
| (16,992) |
| (9.52) |
North America |
| (72,694) |
| (13.51) |
| (59,425) |
| (11.68) |
| (268,271) |
| (12.77) |
| (232,370) |
| (11.20) |
Operating expenses in North America increased on a dollar basis and per boe basis for the three months and year ended December 31, 2022 versus the comparable prior periods. In Canada, increases during the three months ended December 31, 2022 were primarily the result of an increase in downhole, trucking and project expenses related to our Mica assets, as well as processing fees due to higher plant rates in Saskatchewan. Increases
Vermilion Energy Inc. ■ Page 15 ■ 2022 Management's Discussion and Analysis
during the year ended December 31, 2022 were primarily the result of acquisition activity, planned maintenance, and downhole costs. In the United States, increases during the three months and year ended December 31, 2022 were primarily downhole costs and inflationary pressures.
International
| | | | | | | | |
|
| Q4 2022 |
| Q4 2021 |
| 2022 |
| 2021 |
Production (1) |
|
|
|
|
|
|
|
|
Crude oil and condensate (bbls/d) |
| 13,624 |
| 12,419 |
| 13,135 |
| 13,753 |
Natural gas (mmcf/d) |
| 79.97 |
| 100.22 |
| 86.88 |
| 88.77 |
Total production volume (boe/d) |
| 26,953 |
| 29,123 |
| 27,616 |
| 28,548 |
Total sales volume (boe/d) |
| 29,585 |
| 30,689 |
| 27,506 |
| 28,430 |
(1)Please refer to Supplemental Table 4 "Production" for disclosure by product type.
| | | | | | | | | | | | | | | | |
| | Q4 2022 | | Q4 2021 | | 2022 | | 2021 | ||||||||
|
| $M |
| $/boe |
| $M |
| $/boe |
| $M |
| $/boe |
| $M |
| $/boe |
Sales |
| 482,398 | | 177.23 |
| 460,861 | | 163.23 |
| 1,965,877 | | 195.81 |
| 1,065,571 | | 102.69 |
Royalties |
| (17,358) |
| (6.38) |
| (11,666) |
| (4.13) |
| (65,585) |
| (6.53) |
| (41,724) |
| (4.02) |
Transportation |
| (8,962) |
| (3.29) |
| (9,586) |
| (3.40) |
| (33,429) |
| (3.33) |
| (37,061) |
| (3.57) |
Operating |
| (63,553) |
| (23.35) |
| (53,255) |
| (18.86) |
| (220,763) |
| (21.99) |
| (180,643) |
| (17.41) |
General and administration |
| (13,857) |
| (5.09) |
| (7,150) |
| (2.53) |
| (37,026) |
| (3.69) |
| (24,990) |
| (2.41) |
Corporate income tax expense |
| (41,246) |
| (15.15) |
| (34,374) |
| (12.17) |
| (207,142) |
| (20.63) |
| (31,617) |
| (3.05) |
PRRT |
| (5,045) |
| (1.85) |
| (5,544) |
| (1.96) |
| (18,318) |
| (1.82) |
| (15,688) |
| (1.51) |
Fund flows from operations |
| 332,377 |
| 122.12 |
| 339,286 |
| 120.18 |
| 1,383,614 |
| 137.82 |
| 733,848 |
| 70.72 |
Drilling and development |
| (43,957) |
| |
| (29,359) |
| |
| (189,500) |
| |
| (116,608) |
|
|
Exploration and evaluation | | (11,456) | | | | (26,805) | | | | (23,761) | | | | (35,406) | | |
Free cash flow |
| 276,964 |
| |
| 283,122 |
| |
| 1,170,353 |
| |
| 581,834 |
|
|
Production from our International operations averaged 26,953 boe/d in Q4 2022, a decrease of 1% from the prior quarter, primarily due to natural decline in Netherlands and Germany, as well as lower than anticipated production in Australia due to unplanned downtime. This was largely offset by higher production in France and Ireland. Production from the fire-related downtime in France was gradually restored through the fourth quarter of 2022 and has been fully restored subsequent to year end. Ireland production increased 1% in Q4 2022 compared to the previous quarter as the Corrib facility experienced strong operational run time during the quarter.
During the fourth quarter we drilled one (1.0 net) oil well in Germany, which was brought on production in Q1 2023. We also continued to advance our deep well gas exploration and development plans in Germany as we prepare for our first well to be drilled in the fourth quarter of 2023. In the Netherlands, we drilled one (0.5 net) gas well which encountered a 19 metre gas column and is expected to be brought on production in the first half of 2023. We drilled two (2.0 net) exploratory wells in Croatia, however, neither of the wells encountered commercial hydrocarbons.
Sales
| | | | | | | | | | | | | | | | |
| | Q4 2022 | | Q4 2021 | | 2022 | | 2021 | ||||||||
|
| $M |
| $/boe |
| $M |
| $/boe |
| $M |
| $/boe |
| $M |
| $/boe |
Australia |
| 95,420 | | 139.95 |
| 40,332 | | 112.26 |
| 221,187 | | 148.15 |
| 143,014 | | 103.01 |
France |
| 77,910 |
| 119.68 |
| 79,809 |
| 100.18 |
| 365,431 |
| 132.90 |
| 279,263 |
| 88.15 |
Netherlands |
| 119,668 |
| 281.75 |
| 165,370 |
| 205.17 |
| 562,857 |
| 279.87 |
| 295,723 |
| 110.47 |
Germany |
| 121,011 |
| 218.13 |
| 65,623 |
| 164.96 |
| 481,260 |
| 231.34 |
| 131,935 |
| 98.06 |
Ireland |
| 64,753 |
| 162.16 |
| 109,352 |
| 236.78 |
| 324,345 |
| 194.05 |
| 214,425 |
| 120.51 |
Central and Eastern Europe |
| 3,636 |
| 356.05 |
| 375 |
| 203.80 |
| 10,797 |
| 313.02 |
| 1,211 |
| 65.06 |
International |
| 482,398 |
| 177.23 |
| 460,861 |
| 163.23 |
| 1,965,877 |
| 195.81 |
| 1,065,571 |
| 102.69 |
Vermilion Energy Inc. ■ Page 16 ■ 2022 Management's Discussion and Analysis
As a result of changes in inventory levels, our sales volumes for crude oil in Australia, France, and Germany may differ from our production volumes in those business units. The following table provides the crude oil sales volumes (consisting entirely of "light crude oil and medium crude oil") for those jurisdictions.
| | | | | | | | |
Crude oil sales volumes (bbls/d) |
| Q4 2022 |
| Q4 2021 |
| 2022 |
| 2021 |
Australia |
| 7,411 |
| 3,905 |
| 4,090 |
| 3,804 |
France |
| 7,076 |
| 8,659 |
| 7,533 |
| 8,680 |
Germany |
| 1,721 |
| 1,324 |
| 1,337 |
| 1,051 |
International | | 16,208 | | 13,888 | | 12,960 | | 13,535 |
Sales increased on a dollar and per boe basis for the three months and year ended December 31, 2022 versus the comparable prior periods due to higher realized prices across Australia, France, Netherlands, Germany and Central and Eastern Europe business units and higher sales volume in Australia and Germany due to new wells coming online and acquisition activity. These increases were partially offset by lower realized price for the three month period in Ireland and lower sales volumes in France, Netherlands, and Ireland, due to natural decline combined with the timing of liftings in France.
Royalties
| | | | | | | | | | | | | | | | |
| | Q4 2022 |
| Q4 2021 | | 2022 | | 2021 | ||||||||
|
| $M |
| $/boe | | $M |
| $/boe |
| $M |
| $/boe |
| $M |
| $/boe |
France |
| (9,294) |
| (14.28) |
| (10,174) |
| (12.77) |
| (40,353) |
| (14.68) |
| (37,666) |
| (11.89) |
Netherlands |
| (512) |
| (1.21) |
| (419) |
| (0.52) |
| (512) |
| (0.25) |
| (873) |
| (0.33) |
Germany |
| (6,403) |
| (11.54) |
| (909) |
| (2.29) |
| (21,232) |
| (10.21) |
| (2,847) |
| (2.12) |
Central and Eastern Europe |
| (1,149) |
| (112.51) |
| (164) |
| (89.13) |
| (3,488) |
| (101.12) |
| (338) |
| (18.16) |
International |
| (17,358) |
| (6.38) |
| (11,666) |
| (4.13) |
| (65,585) |
| (6.53) |
| (41,724) |
| (4.02) |
Royalties in our International core region are primarily incurred in France and Germany, where royalties include charges based on a percentage of sales and fixed per boe charges. Our production in Australia and Ireland is not subject to royalties.
Royalties increased on a dollar and per unit basis for the three months and year ended December 31, 2022 versus the comparable prior periods primarily due to higher sales prices.
Royalties as a percentage of sales for the three months ended December 31, 2022 of 3.6% increased versus the comparable prior period of 2.5% primarily due to an increase in royalty rate in Germany. Royalties as a percentage of sales for the year ended December 31, 2022 of 3.3% decreased versus the prior year comparable period of 3.9% primarily due to higher sales in business units that are not subject to royalties.
Transportation
| | | | | | | | | | | | | | | | |
| | Q4 2022 | | Q4 2021 | | 2022 | | 2021 | ||||||||
|
| $M |
| $/boe |
| $M |
| $/boe |
| $M |
| $/boe |
| $M |
| $/boe |
France |
| (4,589) |
| (7.05) |
| (6,574) |
| (8.25) |
| (20,100) |
| (7.31) |
| (26,497) |
| (8.36) |
Germany |
| (3,621) |
| (6.53) |
| (2,076) |
| (5.22) |
| (9,751) |
| (4.69) |
| (6,359) |
| (4.73) |
Ireland |
| (752) |
| (1.88) |
| (936) |
| (2.03) |
| (3,578) |
| (2.14) |
| (4,205) |
| (2.36) |
International |
| (8,962) |
| (3.29) |
| (9,586) |
| (3.40) |
| (33,429) |
| (3.33) |
| (37,061) |
| (3.57) |
Transportation expense decreased for the three months and year ended December 31, 2022 versus the comparable prior periods. This was primarily due to the lower volume of liftings in France, partially offset by increased volumes in Germany. On a per unit basis, transportation expense remained relatively flat versus prior year comparable periods.
Our production in Australia, Netherlands and Central and Eastern Europe is not subject to transportation expense.
Vermilion Energy Inc. ■ Page 17 ■ 2022 Management's Discussion and Analysis
Operating expense
| | | | | | | | | | | | | | | | |
| | Q4 2022 | | Q4 2021 | | 2022 | | 2021 | ||||||||
|
| $M | | $/boe |
| $M | | $/boe |
| $M | | $/boe |
| $M | | $/boe |
Australia |
| (21,291) |
| (31.23) |
| (15,918) |
| (44.31) |
| (57,478) |
| (38.50) |
| (50,748) |
| (36.55) |
France |
| (12,638) |
| (19.41) |
| (14,242) |
| (17.88) |
| (57,588) |
| (20.94) |
| (52,147) |
| (16.46) |
Netherlands |
| (11,229) |
| (26.44) |
| (11,449) |
| (14.20) |
| (45,903) |
| (22.82) |
| (35,269) |
| (13.17) |
Germany |
| (13,292) |
| (23.96) |
| (7,323) |
| (18.41) |
| (41,523) |
| (19.96) |
| (27,149) |
| (20.18) |
Ireland |
| (4,687) |
| (11.74) |
| (4,107) |
| (8.89) |
| (16,580) |
| (9.92) |
| (14,889) |
| (8.37) |
Central and Eastern Europe |
| (416) |
| (40.74) |
| (216) |
| (117.39) |
| (1,691) |
| (49.03) |
| (441) |
| (23.69) |
International |
| (63,553) |
| (23.35) |
| (53,255) |
| (18.86) |
| (220,763) |
| (21.99) |
| (180,643) |
| (17.41) |
For the three months ended December 31, 2022 versus the prior comparable period, operating expense increased on a dollar and per boe basis primarily due to asset integrity costs in Australia, increased maintenance activity and electricity charges in Germany, partially offset by a decrease in France due to a rate recovery on previous period electricity charges. Operating expense increased on a dollar and per boe basis for the year ended December 31, 2022 versus the prior year comparable period primarily due to the impact of higher fuel and electricity prices in Europe and increased costs in Germany due to 2021 acquisition activity.
Consolidated Financial Performance Review
| | | | | | |
($M except per share) |
| Dec 31, 2022 |
| Dec 31, 2021 |
| Dec 31, 2020 |
Total assets | | 6,991,058 | | 5,905,323 | | 4,109,139 |
Long-term debt |
| 1,081,351 |
| 1,651,569 |
| 1,933,848 |
Petroleum and natural gas sales |
| 3,476,394 |
| 2,079,761 |
| 1,119,545 |
Net earnings (loss) |
| 1,313,062 |
| 1,148,696 |
| (1,517,427) |
Net earnings (loss) per share |
| |
| |
| |
Basic |
| 8.03 |
| 7.13 |
| (9.61) |
Diluted |
| 7.80 |
| 6.97 |
| (9.61) |
Cash dividends ($/share) |
| 0.28 |
| — |
| 0.58 |
Vermilion Energy Inc. ■ Page 18 ■ 2022 Management's Discussion and Analysis
Financial performance
| | | | | | | | | | | | | | | | |
| | Q4 2022 | | Q4 2021 | | 2022 | | 2021 | ||||||||
|
| $M |
| $/boe |
| $M |
| $/boe |
| $M |
| $/boe |
| $M |
| $/boe |
Sales |
| 842,693 |
| 103.99 |
| 765,915 |
| 96.82 |
| 3,476,394 |
| 111.95 |
| 2,079,761 |
| 66.81 |
Royalties |
| (68,303) |
| (8.43) |
| (58,785) |
| (7.43) |
| (306,017) |
| (9.85) |
| (186,122) |
| (5.98) |
Transportation |
| (21,976) |
| (2.71) |
| (19,033) |
| (2.41) |
| (78,896) |
| (2.54) |
| (77,161) |
| (2.48) |
Operating |
| (136,247) |
| (16.81) |
| (112,680) |
| (14.24) |
| (489,034) |
| (15.75) |
| (413,013) |
| (13.27) |
General and administration |
| (13,344) |
| (1.65) |
| (17,374) |
| (2.20) |
| (57,677) |
| (1.86) |
| (52,877) |
| (1.70) |
Corporate income tax expense |
| (41,958) |
| (5.18) |
| (32,234) |
| (4.07) |
| (208,153) |
| (6.70) |
| (30,166) |
| (0.97) |
Windfall taxes | | (222,859) | | (27.50) | | — | | — | | (222,859) | | (7.18) | | — | | — |
PRRT |
| (5,045) |
| (0.62) |
| (5,544) |
| (0.70) |
| (18,318) |
| (0.59) |
| (15,688) |
| (0.50) |
Interest expense |
| (22,506) |
| (2.78) |
| (16,279) |
| (2.06) |
| (82,858) |
| (2.67) |
| (73,075) |
| (2.35) |
Realized loss on derivatives |
| (43,940) |
| (5.42) |
| (189,598) |
| (23.97) |
| (405,894) |
| (13.07) |
| (327,384) |
| (10.52) |
Realized foreign exchange gain (loss) |
| 18,845 |
| 2.33 |
| (2,395) |
| (0.30) |
| 15,195 |
| 0.49 |
| (6,613) |
| (0.21) |
Realized other (expense) income |
| (1,140) |
| (0.14) |
| 10,180 |
| 1.29 |
| 12,982 |
| 0.42 |
| 22,200 |
| 0.71 |
Fund flows from operations |
| 284,220 |
| 35.08 |
| 322,173 |
| 40.73 |
| 1,634,865 |
| 52.65 |
| 919,862 |
| 29.54 |
Equity based compensation | | (5,377) | | | | (6,666) | | | | (44,390) | | | | (41,565) | | |
Unrealized gain (loss) on derivative instruments (1) | | 549,693 | | | | 172,265 | | | | 540,801 | | | | (181,094) | | |
Unrealized foreign exchange (loss) gain (1) | | (47,405) | | | | 7,122 | | | | (84,464) | | | | (64,963) | | |
Accretion | | (16,501) | | | | (10,983) | | | | (58,170) | | | | (43,552) | | |
Depletion and depreciation | | (171,926) | | | | (148,216) | | | | (577,134) | | | | (571,688) | | |
Deferred tax expense | | (196,733) | | | | (14,834) | | | | (288,707) | | | | (187,343) | | |
Gain on business combinations | | — | | | | — | | | | — | | | | 17,198 | | |
Impairment reversal | | — | | | | 23,922 | | | | 192,094 | | | | 1,302,619 | | |
Unrealized other expense (1) | | (563) | | | | (195) | | | | (1,833) | | | | (778) | | |
Net earnings | | 395,408 | | | | 344,588 | | | | 1,313,062 | | | | 1,148,696 | | |
| (1) | Unrealized gain (loss) on derivative instruments, Unrealized foreign exchange (loss) gain, and Unrealized other expense are line items from the respective Consolidated Statements of Cash Flows. |
Fluctuations in fund flows from operations may occur as a result of changes in production levels, commodity prices, and costs to produce petroleum and natural gas. In addition, fund flows from operations may be affected by the timing of crude oil shipments in Australia and France. When crude oil inventory is built up, the related operating expense, royalties, and depletion expense are deferred and carried as inventory on the consolidated balance sheet. When the crude oil inventory is subsequently drawn down, the related expenses are recognized within profit or loss.
General and administration
| ● | General and administration expense decreased in Q4 2022 versus Q4 2021 primarily due to lower discretionary headcount costs. |
| ● | General and administration expense increased for the year ended December 31, 2022 versus the prior year comparable period primarily due to higher legal, tax, and financial advisory costs. |
PRRT and corporate income taxes
| ● | PRRT remained relatively consistent for the three months ended December 31, 2022 versus the comparable prior period. PRRT increased for the year ended December 31, 2022 versus the prior year comparable period due to higher sales partially offset by higher capital expenditures in the current period. |
| ● | Corporate income taxes for the three months and year ended December 31, 2022 increased versus the comparable prior periods primarily due to higher taxable income as a result of increased commodity prices in 2022. |
Windfall taxes
| ● | On September 30, 2022 the Council of the European Union and member states agreed to a set mandatory temporary solidarity contribution on the profits of oil and gas producers. The contribution set out minimum amounts to be calculated on taxable profits starting in 2022 and/or 2023, which are above a 20% increase of the average yearly taxable profits for 2018 to 2021. Legislation became substantively enacted during the fourth quarter of 2022 resulting in a full year of windfall taxes being booked during the fourth quarter. |
| ● | Windfall taxes recorded in 2022 are based on the rates legislated or, in the case of Ireland, announced as of December 31, 2022. In Netherlands, Germany, and France, a rate of 33% has been legislated on excess profits and a rate of 75% has been announced by the Irish Government. For the three months ended and year ended December 31, 2022, windfall tax expense was $222.9 million. |
Vermilion Energy Inc. ■ Page 19 ■ 2022 Management's Discussion and Analysis
Interest expense
| ● | Interest expense increased for the three months and year ended December 31, 2022 compared to the comparable prior periods despite lower debt levels. This was due to higher variable interest rates and an increase in the percentage of our debt with fixed interest rates following the issuance of the 2030 senior unsecured notes. |
Realized gain or loss on derivatives
| ● | For the three months and year ended December 31, 2022, we recorded realized losses on our crude oil and natural gas hedges due to higher commodity pricing compared to the strike prices on our hedges. |
| ● | A listing of derivative positions as at December 31, 2022 is included in “Supplemental Table 2” of this MD&A. |
Realized other income
| ● | Realized other income for the three months and year ended December 31, 2022 decreased versus the comparable prior periods primarily due to amounts for funding under the Saskatchewan Accelerated Site Closure program to complete abandonment and reclamation on inactive oil and gas wells and facilities. |
Net earnings
Fluctuations in net earnings from period-to-period are caused by changes in both cash and non-cash based income and charges. Cash based items are reflected in fund flows from operations. Non-cash items include: equity based compensation expense, unrealized gains and losses on derivative instruments, unrealized foreign exchange gains and losses, accretion, depletion and depreciation expense, and deferred taxes. In addition, non-cash items may also include gains resulting from business combinations or charges resulting from impairment or impairment reversals.
Equity based compensation
Equity based compensation expense relates primarily to non-cash compensation expense attributable to long-term incentives granted to directors, officers, and employees under security-based arrangements. Equity based compensation expense decreased for the three months ended December 31, 2022 versus the comparable prior period primarily due to the lower value of LTIP awards outstanding in the current period. For the year ended December 31, 2022 versus the prior year comparable period, equity based compensation expense increased primarily due to higher bonuses under the employee bonus plan during the current year.
Unrealized gain or loss on derivative instruments
Unrealized gain or loss on derivative instruments arises as a result of changes in forecasts for future prices and rates. As Vermilion uses derivative instruments to manage the commodity price exposure of our future crude oil and natural gas production, we will normally recognize unrealized gains on derivative instruments when future commodity price forecasts decline and vice-versa. As derivative instruments are settled, the unrealized gain or loss previously recognized is reversed, and the settlement results in a realized gain or loss on derivative instruments.
USD-to-CAD cross currency interest rate swaps and foreign exchange swaps may be entered into to hedge the foreign exchange movements on USD borrowings on our revolving credit facility. As such, unrealized gains and losses on our cross currency interest swaps are offset by unrealized losses and gains on foreign exchange relating to the underlying USD borrowings from our revolving credit facility.
For the three months ended December 31, 2022, we recognized a net unrealized gain on derivative instruments of $549.7 million. This consists of unrealized gains of $573.4 million on our European natural gas commodity derivative instruments, $10.9 million on our North American natural gas commodity derivative instruments, and $4.2 million on our crude oil commodity derivative instruments, partially offset by unrealized losses of $21.0 million on our equity swaps and $17.8 million on our USD-to-CAD foreign exchange swaps.
For the year ended December 31, 2022, we recognized a net unrealized gain on derivative instruments of $540.8 million. This consists of unrealized gains of $509.1 million on our European natural gas commodity derivative instruments, $30.4 million on our equity swaps, $9.9 million on our crude oil commodity derivative instruments, and $5.6 million on our North American natural gas commodity derivative instruments, partially offset by unrealized losses of $14.2 million on our USD-to-CAD foreign exchange swaps.
Unrealized foreign exchange gains or losses
As a result of Vermilion’s international operations, Vermilion has monetary assets and liabilities denominated in currencies other than the Canadian dollar. These monetary assets and liabilities include cash, receivables, payables, long-term debt, derivative instruments and intercompany loans. Unrealized foreign exchange gains and losses result from translating these monetary assets and liabilities from their underlying currency to the Canadian dollar.
Vermilion Energy Inc. ■ Page 20 ■ 2022 Management's Discussion and Analysis
In 2022, unrealized foreign exchange gains and losses primarily resulted from:
| ● | The translation of Euro denominated intercompany loans from our international subsidiaries to Vermilion Energy Inc. An appreciation in the Euro against the Canadian dollar will result in an unrealized foreign exchange loss (and vice-versa). Under IFRS, the offsetting foreign exchange loss or gain is recorded as a currency translation adjustment within other comprehensive income. As a result, consolidated comprehensive income reflects the offsetting of these translation adjustments while net earnings reflects only the parent company's side of the translation. |
| ● | The translation of USD borrowings on our revolving credit facility. The unrealized foreign exchange gains or losses on these borrowings are offset by unrealized derivative gains or losses on associated USD-to-CAD cross currency interest rate swaps (discussed further below). |
| ● | The translation of our USD denominated 2025 senior unsecured notes and USD denominated 2030 senior unsecured notes. During the period between June 12, 2019 and May 5, 2020 the USD 2025 senior unsecured notes were hedged by a USD-to-CAD cross currency interest rate swap. Subsequent to the termination of these instruments, amounts previously recognized in the hedge accounting reserve will be recognized into earnings through unrealized foreign exchange loss over the period of the hedged cash flows. |
For the three months ended December 31, 2022, we recognized a net unrealized foreign exchange loss of $47.4 million, driven by an unrealized loss of $73.1 million on intercompany loans due to the Euro strengthening 8.0% against the Canadian dollar in Q4 2022. This was partially offset by an unrealized gain of $15.6 million on our USD borrowings from our revolving credit facility as well as an unrealized gain of $11.2 million on our senior unsecured notes resulting from the US dollar weakening 1.2% against the Canadian dollar in Q4 2022.
For the year ended December 31, 2022, we recognized a net unrealized foreign exchange loss of $84.5 million, driven by an unrealized loss of $55.0 million on our senior unsecured notes resulting from the US dollar strengthening 6.8% against the Canadian dollar in 2022, as well as unrealized losses of $27.0 million on intercompany loans due to the Euro strengthening 0.5% against the Canadian dollar in 2022, with the majority of the unrealized loss driven by the significant Q4 strengthening of the Euro. This was partially offset by unrealized gains of $4.3 million on our USD borrowings from our revolving credit facility.
As at December 31, 2022, a $0.01 appreciation of the Euro against the Canadian dollar would result in a $5.6 million decrease to net earnings as a result of an unrealized loss on foreign exchange, while a $0.01 appreciation of the US dollar against the Canadian dollar would result in a $5.4 million decrease to net earnings as a result of an unrealized loss on foreign exchange.
Accretion
Accretion expense is recognized to update the present value of the asset retirement obligation balance. For the three months and year ended December 31, 2022, accretion expense increased versus the comparable prior periods primarily due to the impact of a higher asset retirement obligation balance at the end of 2022 compared to 2021 and slight strengthening of the Euro against the Canadian dollar.
Depletion and depreciation
Depletion and depreciation expense is recognized to allocate the cost of capital assets over the useful life of the respective assets. Depletion and depreciation expense per unit of production is determined for each depletion unit (which are groups of assets within a specific production area that have similar economic lives) by dividing the sum of the net book value of capital assets and future development costs by total proved plus probable reserves.
Fluctuations in depletion and depreciation expense are primarily the result of changes in produced crude oil and natural gas volumes, and changes in depletion and depreciation per unit. Fluctuations in depletion and depreciation per unit are the result of changes in reserves, depletable base (net book value of capital assets and future development costs), and relative production mix.
Depletion and depreciation on a per boe basis for the three months and year ended December 31, 2022 of $21.22 and $18.59, respectively increased from $18.74 and $18.36 in the comparable prior periods primarily due to a higher depletable base due to impairment reversals in 2021 and 2022, acquisitions, and the strengthening of the Euro against the Canadian dollar in Q4 2022.
Deferred tax
Deferred tax assets arise when the tax basis of an asset exceeds its accounting basis (known as a deductible temporary difference). Conversely, deferred tax liabilities arise when the tax basis of an asset is less than its accounting basis (known as a taxable temporary difference). Deferred tax assets are recognized only to the extent that it is probable that there are future taxable profits against which the deductible temporary difference can be utilized. Deferred tax assets and liabilities are measured at the enacted or substantively enacted tax rate that is expected to apply when the asset is realized, or the liability is settled.
As such, fluctuations in deferred tax expenses and recoveries primarily arise as a result of: changes in the accounting basis of an asset or liability without a corresponding tax basis change (e.g. when derivative assets and liabilities are marked-to-market or when accounting depletion differs from tax depletion), changes in available tax losses (e.g. if they are utilized to offset taxable income), changes in estimated future taxable profits resulting in a derecognition or recognition of deferred tax assets, and changes in enacted or substantively enacted tax rates.
Vermilion Energy Inc. ■ Page 21 ■ 2022 Management's Discussion and Analysis
For the three months and year ended December 31, 2022, the Company recorded deferred tax expense of $196.7 million and $288.7 million, respectively, compared to deferred tax expense of $14.8 million and $187.3 million, respectively, for the comparable prior periods. The deferred tax expense for the three months ended and year ended December 31, 2022 was primarily due to loss utilization on increased taxable income, as well as the tax impact on unrealized derivative movement.
Impairment
Impairment losses or reversals of losses are recognized when indicators of impairment or impairment reversal arise and the carrying amount of a cash generating unit ("CGU") is greater than (impairment) or less than (impairment reversal) its recoverable amount, determined as the higher of fair value less costs of disposal or value-in-use. Subsequent to the first quarter of 2022 there were no indicators of impairment and no amounts relating to previous impairments remaining to be reversed.
In the first quarter of 2022, indicators of impairment reversal were present in our Canada - Saskatchewan and France - Neocomian CGUs due to an increase in forecast oil prices. As a result of the indicators of impairment reversal, the Company performed impairment reversal calculations on the identified CGUs and the recoverable amounts were determined using fair value less costs to sell, which considered future after-tax cash flows from proved plus probable reserves and an after-tax discount rate of 12.0%. Based on the results of the impairment reversal calculations completed, recoverable amounts were determined to be greater than the carrying values of the CGUs tested and $144.4 million (net of $47.7 million deferred income tax expense) of impairment reversal was recorded.
Inputs used in the measurement of capital assets are not based on observable market data and fall within level 3 of the fair value hierarchy.
Vermilion Energy Inc. ■ Page 22 ■ 2022 Management's Discussion and Analysis
Taxes
Current income tax rates
Vermilion typically pays corporate income taxes in France, Netherlands, Australia and Germany. In addition, Vermilion pays PRRT in Australia which is a profit based tax applied at a rate of 40% on sales less operating expenses, capital expenditures, and other eligible expenditures. PRRT is deductible in the calculation of taxable income in Australia.
For 2022 and 2021, taxable income was subject to corporate income tax at the following statutory rates:
| | | | | |
Jurisdiction |
| 2022 |
| 2021 |
|
Canada |
| 24.6 | % | 24.6 | % |
United States |
| 21.0 | % | 21.0 | % |
France |
| 25.8 | % | 27.4 | % |
Netherlands (1) |
| 50.0 | % | 50.0 | % |
Germany |
| 31.3 | % | 31.4 | % |
Ireland |
| 25.0 | % | 25.0 | % |
Australia |
| 30.0 | % | 30.0 | % |
(1) | In the Netherlands, an additional 10% uplift deduction is allowed against taxable income that is applied to operating expenses, eligible general and administration expenses, and tax deductions for depletion and abandonment retirement obligations. |
Windfall Taxes
On September 30, 2022 the Council of the European Union and member states agreed to a set mandatory temporary solidarity contribution on the profits of oil and gas producers. The contribution set out minimum amounts to be calculated on taxable profits starting in 2022 and/or 2023, which are above a 20% increase of the average yearly taxable profits for 2018 to 2021 period. Legislation became substantively enacted during the fourth quarter of 2022 resulting in a full year of windfall taxes being booked during the fourth quarter.
Windfall tax rates apply to taxable profits which are above a 20% increase of the average yearly profits for the 2018 to 2021 period. The following rates have been legislated as of December 31, 2022:
| | | | | |
Jurisdiction |
| 2023 |
| 2022 |
|
France |
| N/A |
| 33.0 | % |
Netherlands (1) |
| N/A |
| 33.0 | % |
Germany |
| 33.0 | % | 33.0 | % |
Ireland (2) |
| N/A |
| N/A | |
(1)For 2023 and 2024, Netherlands has implemented a windfall royalty. This royalty applies if annual realized pricing (net of hedges) exceeds €0.50/Nm3. This royalty is assessed annually at a rate of 65% on realized pricing (net of hedges) less €0.50/Nm3 and payments on this royalty are deductible in calculating current income taxes.
(2)As at December 31, 2022, Ireland has not legislated a windfall tax rate. A rate of 75% was announced in November 2022.
Tax legislation changes
On December 21, 2021, the Dutch Senate approved the 2022 Tax Plan that included an increase to the Dutch corporate tax rate from 25.0% in 2021 to 25.8% in 2022. Due to the tax regime applicable to natural gas producers in the Netherlands, the increase to the corporate tax rate is not expected to have a material impact to Vermilion taxes in the Netherlands.
On December 28, 2019, the French Parliament approved the Finance Bill for 2020. The Finance Bill for 2020 provides for a progressive decrease of the French corporate income tax rate for companies with sales below €250 million from 32.0% to 25.8% by 2022.
In 2021, 136 countries and jurisdictions, including Canada, agreed to implement the Organisation for Economic Co-operation and Development’s (OECD) Pillar Two rules, effective in 2023. The proposed Pillar Two rules are designed to ensure that large multinational enterprises pay a minimum level of tax (currently agreed upon at 15%) on the income arising in each jurisdiction where they operate. The proposed rules remain subject to approval and ratification in multiple countries and jurisdictions. We are monitoring developments relating to the Pillar Two rules and implementation to assess potential impacts on Vermilion.
Vermilion Energy Inc. ■ Page 23 ■ 2022 Management's Discussion and Analysis
Tax pools
As at December 31, 2022, we had the following tax pools:
| | | | | | | | |
($M) |
| Oil & Gas |
| Tax Losses |
| Other |
| Total |
Canada | | 1,778,803 | (1) | 1,374,896 | (4) | 27,359 | | 3,181,058 |
United States | | 265,091 | (2) | 208,272 | (5) | 57,941 | | 531,304 |
France | | 293,484 | (2) | — | | — | | 293,484 |
Netherlands | | 48,138 | (3) | — | | — | | 48,138 |
Germany | | 198,444 | (3) | — | | 16,513 | | 214,957 |
Ireland | | — | | 803,763 | (4) | — |
| 803,763 |
Australia | | 175,126 | (1) | 15,431 | (4) | — |
| 190,557 |
Total | | 2,759,086 | | 2,402,362 |
| 101,813 |
| 5,263,261 |
| (1) | Deduction calculated using various declining balance rates. |
| (2) | Deduction calculated using a combination of straight-line over the assets life and unit of production method. |
| (3) | Deduction calculated using a unit of production method. |
| (4) | Tax losses can be carried forward and applied at 100% against taxable income. |
| (5) | Tax losses of $47 million created prior to January 1, 2018 are carried forward and applied at 100% against taxable income, tax losses of $161 million created after January 1, 2018 are carried forward and applied to 80% of taxable income in each taxation year. |
Financial Position Review
Balance sheet strategy
We regularly review whether our forecast of fund flows from operations is sufficient to finance planned capital expenditures, dividends, share buy-backs, and abandonment and reclamation expenditures. To the extent that fund flows from operations forecasts are not expected to be sufficient to fulfill such expenditures, we will evaluate our ability to finance any shortfall by reducing some or all categories of expenditures, with issuances of equity, and/or with debt (including borrowing using the unutilized capacity of our existing revolving credit facility). We have a long-term goal of achieving and maintaining a ratio of net debt to four quarter trailing fund flows from operations of approximately 1.0.
As at December 31, 2022, we have a ratio of net debt to four quarter trailing fund flows from operations of 0.8. We will continue to monitor for changes in forecasted fund flows from operations and, as appropriate, will adjust our exploration, development capital plans (and associated production targets), and return of capital plans to target optimal debt levels.
Maintaining a strong balance sheet is a core principle of Vermilion and will remain a focus going forward. As debt reduction continues, we will plan to increase the amount of free cash flow that is available for the return of capital, while taking into account other capital requirements.
Net debt
Net debt is reconciled to long-term debt, as follows:
| | | | |
| | As at | ||
($M) |
| Dec 31,2022 |
| Dec 31,2021 |
Long-term debt |
| 1,081,351 |
| 1,651,569 |
Adjusted working capital deficit (1) |
| 265,111 |
| 9,284 |
Unrealized FX on swapped USD borrowings |
| (1,876) |
| (16,067) |
Net debt |
| 1,344,586 |
| 1,644,786 |
| | | | |
Ratio of net debt to four quarter trailing fund flows from operations |
| 0.8 |
| 1.8 |
(1) | Adjusted working capital is a non-GAAP financial measure that is not standardized under IFRS and may not be comparable to similar measures disclosed by other issuers. It is defined as current assets less current liabilities, excluding current derivatives and current lease liabilities. The |
Vermilion Energy Inc. ■ Page 24 ■ 2022 Management's Discussion and Analysis
measure is used to calculate net debt, a capital measure disclosed above. Reconciliation to the primary financial statement measures can be found in the “Non-GAAP and Other Specified Financial Measures” section of this document.
As at December 31, 2022, net debt decreased to $1.3 billion (December 31, 2021 - $1.6 billion), primarily as a result of debt repayments of $1,121.9 million, funded by the $1,083.0 million of free cash flow generated during 2022. This was partially offset by borrowings made to fund the Leucrotta acquisition, unrealized foreign exchange losses of $50.8 million on our senior unsecured notes due to the US dollar strengthening, and working capital movements. The ratio of net debt to four quarter trailing fund flows from operations decreased to 0.8 (December 31, 2021 - 1.8) due to higher four quarter trailing fund flows from operations, driven by strong commodity prices.
Long-term debt
The balances recognized on our balance sheet are as follows:
| | | | |
| | As at | ||
|
| Dec 31,2022 |
| Dec 31,2021 |
Revolving credit facility |
| 147,666 |
| 1,273,755 |
2025 senior unsecured notes |
| 404,463 |
| 377,814 |
2030 senior unsecured notes | | 529,222 | | — |
Long-term debt |
| 1,081,351 |
| 1,651,569 |
Revolving Credit Facility
As at December 31, 2022, Vermilion had in place a bank revolving credit facility maturing May 29, 2026 with terms and outstanding positions as follows:
| | | | |
| | As at | ||
($M) |
| Dec 31,2022 |
| Dec 31,2021 |
Total facility amount |
| 1,600,000 |
| 2,100,000 |
Amount drawn |
| (147,666) |
| (1,273,755) |
Letters of credit outstanding |
| (13,527) |
| (11,035) |
Unutilized capacity |
| 1,438,807 |
| 815,210 |
On April 26, 2022, contemporaneous with the issuance of the 2030 senior unsecured notes and at Vermilion's election, the maturity date of the facility was extended to May 29, 2026 (previously May 31, 2024) and the total facility amount was reduced to $1.6 billion (previously $2.1 billion).
As at December 31, 2022, the revolving credit facility was subject to the following financial covenants:
| | | | | | |
| | | | As at | ||
Financial covenant |
| Limit |
| Dec 31,2022 |
| Dec 31,2021 |
Consolidated total debt to consolidated EBITDA |
| Less than 4.0 |
| 0.51 |
| 1.61 |
Consolidated total senior debt to consolidated EBITDA |
| Less than 3.5 |
| 0.07 |
| 1.24 |
Consolidated EBITDA to consolidated interest expense |
| Greater than 2.5 |
| 27.10 |
| 14.78 |
Our financial covenants include financial measures defined within our revolving credit facility agreement that are not defined under IFRS. These financial measures are defined by our revolving credit facility agreement as follows:
| ● | Consolidated total debt: Includes all amounts classified as “Long-term debt”, “Current portion of long-term debt”, and “Lease obligations” (including the current portion included within "Accounts payable and accrued liabilities" but excluding operating leases as defined under IAS 17) on our consolidated balance sheet. |
| ● | Consolidated total senior debt: Consolidated total debt excluding unsecured and subordinated debt. |
| ● | Consolidated EBITDA: Consolidated net earnings before interest, income taxes, depreciation, accretion and certain other non-cash items, adjusted for the impact of the acquisition of a material subsidiary. |
| ● | Total interest expense: Includes all amounts classified as "Interest expense", but excludes interest on operating leases as defined under IAS 17. |
In addition, our revolving credit facility has provisions relating to our liability management ratings in Alberta and Saskatchewan whereby if our security adjusted liability management ratings fall below specified limits in a province, a portion of the asset retirement obligations are included in the definitions of consolidated total debt and consolidated total senior debt. An event of default occurs if our security adjusted liability management ratings breach additional lower limits for a period greater than 90 days. As of December 31, 2022, Vermilion's liability management ratings were higher than the
Vermilion Energy Inc. ■ Page 25 ■ 2022 Management's Discussion and Analysis
specified levels, and as such, no amounts relating to asset retirement obligations were included in the calculation of consolidated total debt and consolidated total senior debt.
As at December 31, 2022 and December 31, 2021, Vermilion was in compliance with the above covenants.
2025 senior unsecured notes
On March 13, 2017, Vermilion issued US $300.0 million of senior unsecured notes at par. The notes bear interest at a rate of 5.625% per annum, paid semi-annually on March 15 and September 15, and mature on March 15, 2025. As direct senior unsecured obligations of Vermilion, the notes rank equally in right of payment with existing and future senior indebtedness of the Company.
The senior unsecured notes were recognized at amortized cost and include the transaction costs directly related to the issuance.
Vermilion may redeem some or all of the senior unsecured notes at the redemption prices set forth in the following table plus any accrued and unpaid interest, if redeemed during the twelve-month period beginning on March 15 of each of the years indicated below:
| | | |
Year |
| Redemption price |
|
2022 |
| 101.406 | % |
2023 and thereafter |
| 100.000 | % |
2030 senior unsecured notes
On April 26, 2022, Vermilion closed a private offering of US $400.0 million 8-year senior unsecured notes. The notes were priced at 99.241% of par, mature on May 1, 2030, and bear interest at a rate of 6.875% per annum. Interest is paid semi-annually on May 1 and November 1, commencing on November 1, 2022. The notes are senior unsecured obligations of Vermilion and rank equally with existing and future senior unsecured indebtedness.
The senior unsecured notes were recognized at amortized cost and include the transaction costs directly related to the issuance.
Vermilion may, at its option, redeem the notes prior to maturity as follows:
| ● | On or after May 1, 2025, Vermilion may redeem some or all of the senior unsecured notes at the redemption prices set forth below, together with accrued and unpaid interest. |
| ● | Prior to May 1, 2025, Vermilion may redeem up to 35% of the original principal amount of the notes with an amount of cash not greater than the net cash proceeds of certain equity offerings at a redemption price of 106.875% of the principal amount of the notes, together with accrued and unpaid interest. |
| ● | Prior to May 1, 2025, Vermilion may also redeem some or all of the notes at a price equal to 100% of the principal amount of the notes, plus a “make-whole premium,” together with applicable premium, accrued and unpaid interest. |
| | | |
Year |
| Redemption price |
|
2025 |
| 103.438 | % |
2026 |
| 102.292 | % |
2027 |
| 101.146 | % |
2028 and thereafter |
| 100.000 | % |
Shareholders' capital
The following table outlines our dividend payment history:
| | | | | |
Date |
| Frequency |
| Dividend per unit or share | |
January 2003 to December 2007 | | Monthly | | $ | 0.170 |
January 2008 to December 2012 | | Monthly | | $ | 0.190 |
January 2013 to December 2013 | | Monthly | | $ | 0.200 |
January 2014 to March 2018 | | Monthly | | $ | 0.215 |
April 2018 to February 2020 | | Monthly | | $ | 0.230 |
March 2020 | | Monthly | | $ | 0.115 |
April 2022 to July 2022 | | Quarterly | | $ | 0.060 |
August 2022 onwards | | Quarterly | | $ | 0.080 |
Vermilion Energy Inc. ■ Page 26 ■ 2022 Management's Discussion and Analysis
In the first quarter of 2022, we announced our plan to distribute a fixed quarterly dividend due to stronger commodity prices and a strengthened balance sheet. In August 2022, we announced a 33% increase to our quarterly cash dividend effective for the Q3 2022 distribution. In January 2023, we announced our plan to increase the quarterly dividend by 25% to $0.10 per share effective for the planned Q1 2023 distribution.
The following table reconciles the change in shareholders’ capital:
| | | | |
Shareholders’ Capital |
| Shares ('000s) |
| Amount |
Balance at January 1 |
| 162,261 |
| 4,241,773 |
Vesting of equity based awards |
| 2,578 |
| 44,811 |
Shares issued for equity based compensation |
| 549 |
| 13,699 |
Share-settled dividends on vested equity based awards | | 178 | | 4,377 |
Repurchase of shares |
| (2,339) |
| (60,866) |
Balance at December 31 |
| 163,227 |
| 4,243,794 |
As at December 31, 2022, there were approximately 5.5 million equity based compensation awards outstanding. As at March 8, 2023, there were approximately 162.1 million common shares issued and outstanding.
On July 4, 2022, the Toronto Stock Exchange approved our notice of intention to commence a normal course issuer bid ("the NCIB"). The NCIB allows Vermilion to purchase up to 16,076,666 common shares representing approximately 10% of its public float as at June 22, 2022 beginning
July 6, 2022 and ending July 5, 2023.
In 2022, Vermilion purchased and cancelled 2.34 million common shares under the NCIB for total consideration of $71.7 million. Subsequent to year end 2022 and as at March 8, 2023, Vermilion purchased and cancelled 1.14 million common shares under the NCIB for total consideration of $22.4 million.
Contractual Obligations and Commitments
As at December 31, 2022, we had the following contractual obligations and commitments:
| | | | | | | | | | |
($M) |
| Less than 1 year |
| 1 - 3 years |
| 3 - 5 years |
| After 5 years |
| Total |
Long-term debt (1) |
| 69,235 |
| 533,362 |
| 225,861 |
| 634,875 |
| 1,463,333 |
Lease obligations |
| 46,245 |
| 49,730 |
| 29,062 |
| 8,597 |
| 133,634 |
Processing and transportation agreements |
| 40,267 |
| 52,786 |
| 23,133 |
| 101,629 |
| 217,815 |
Purchase obligations |
| 27,481 |
| 4,907 |
| 444 |
| 285 |
| 33,117 |
Drilling and service agreements |
| 5,051 |
| 58,122 |
| — |
| — |
| 63,173 |
Total contractual obligations and commitments |
| 188,279 |
| 698,907 |
| 278,500 |
| 745,386 |
| 1,911,072 |
(1) | Interest on revolving credit facility calculated assuming an annual interest rate of 6.19%. |
(2) | Commitments denominated in foreign currencies have been translated using the related spot rates on December 31, 2022. |
Asset Retirement Obligations
As at December 31, 2022, asset retirement obligations were $1,087.8 million compared to $1,000.6 million as at December 31, 2021. The increase in asset retirement obligations is primarily attributable to increases in inflationary market pressures and increases in estimated abandonment costs in Netherlands, France and Canada. This increase was partially offset by higher country specific risk-free rates.
The present value of the obligation is calculated using a credit-adjusted risk-free rate, calculated using a credit spread added to risk-free rates based on long-term, risk-free government bonds. Vermilion's credit spread is determined using the Company's expected cost of borrowing at the end of the reporting period.
Vermilion Energy Inc. ■ Page 27 ■ 2022 Management's Discussion and Analysis
The risk-free rates and credit spread used as inputs to discount the obligations were as follows:
| | | | | | | |
|
| Dec 31,2022 |
| Dec 31,2021 |
| Change |
|
Credit spread added to below noted risk-free rates |
| 4.5 | % | 4.9 | % | (0.4) | % |
Country specific risk-free rate |
| | | | | | |
Canada |
| 3.3 | % | 1.8 | % | 1.5 | % |
United States |
| 4.1 | % | 1.9 | % | 2.2 | % |
France |
| 3.4 | % | 0.8 | % | 2.6 | % |
Netherlands |
| 2.7 | % | (0.3) | % | 3.0 | % |
Germany |
| 2.5 | % | 0.1 | % | 2.4 | % |
Ireland |
| 3.2 | % | 0.5 | % | 2.7 | % |
Australia |
| 4.2 | % | 1.9 | % | 2.3 | % |
Current cost estimates are inflated to the estimated time of abandonment using inflation rates of between 1.6% and 4.2% (as at December 31, 2021 - between 1.1% and 3.1%).
Risks and Uncertainties
Crude oil and natural gas exploration, production, acquisition and marketing operations involve a number of risks and uncertainties that have affected the financial statements and are reasonably likely to affect them in the future. These risks and uncertainties are discussed further below.
Commodity prices
Crude oil and natural gas prices have fluctuated significantly in recent years due to supply and demand factors. Changes in crude oil and natural gas prices affect the level of revenue we generate, the amount of proceeds we receive and payments we make on our commodity derivative instruments, and the level of taxes that we pay. In addition, lower crude oil and natural gas prices would reduce the recoverable amount of our capital assets and could result in impairments or impairment reversals.
Exchange rates
Exchange rate changes impact the Canadian dollar equivalent revenue and costs that we recognize. The majority of our crude oil and condensate revenue stream is priced in US dollars and as such an increase in the strength of the Canadian dollar relative to the US dollar would result in the receipt of fewer Canadian dollars for our revenue. We also incur expenses and capital costs in US dollars, Euros and Australian dollars and thus a decrease in strength of the Canadian dollar relative to those currencies may result in the payment of more Canadian dollars for our expenditures.
In addition, exchange rate changes impact the Canadian equivalent carrying balances for our assets and liabilities. For foreign currency denominated monetary assets (such as cash and cash equivalents, long-term debt, and intercompany loans), the impact of changes in exchange rates is recorded in net earnings as a foreign exchange gain or loss.
Production and sales volumes
Our production and sales volumes affect the level of revenue we generate and correspondingly the royalties and taxes that we pay. In addition, significant declines in production or sales volumes due to unforeseen circumstances may also result in an indicator of impairment and potential impairment charges.
Interest rates
Changes in interest rates impact the amount of interest expense we pay on our variable rate debt and also our ability to obtain fixed rate financing in the future.
Tax and royalty rates
Changes in tax and royalty rates in the jurisdictions that we operate in would impact the amount of current taxes and royalties that we pay. In addition, changes to substantively enacted tax rates would impact the carrying balance of deferred tax assets and liabilities, potentially resulting in a deferred tax recovery or incremental deferred tax expense.
Windfall taxes and royalties
Vermilion is exposed to increased taxation and royalties due to windfall taxes on profits. Windfall taxes have been substantively enacted within the European Union for oil and gas companies for 2022 and/or 2023 at a minimum rate of 33% calculated on taxable profits above a 20% increase in the average yearly taxable profits as compared to 2018 to 2021. Windfall tax rates have been legislated or, in the case of Ireland, announced as described in the preceding section “Taxes”. There remains uncertainty on whether the announced windfall tax rate in Ireland of 75% will change upon legislation.
Vermilion Energy Inc. ■ Page 28 ■ 2022 Management's Discussion and Analysis
In addition, there is uncertainty on whether windfall taxes will continue beyond 2023 or whether similar legislation could be enacted in other jurisdictions that Vermilion operates in.
Ukraine War
During 2022, Russian military forces invaded Ukraine resulting in a war between the two countries. The ongoing conflict between countries has impacted the supply of oil and gas from the region and has resulted in countries throughout the world imposing financial and trade sanctions against Russia which have had macroeconomic effects. The risks disclosed in our Annual Information Form for the year ended December 31, 2022 may be exacerbated as a result of the Ukraine war, including: market risks including volatility of oil and gas prices, volatility of foreign exchange rates, volatility of market price of common shares, hedging arrangements; regulatory and political risks including tax, royalty, and other government legislation; financing risks including additional financing, debt service, variations in interest rates and foreign exchange rates; acquisition and expansion risks including international operations and future geographical/industry expansion, acquisition assumptions, failure to realize anticipated benefits of prior acquisitions.
COVID-19
The extent of the risks surrounding the severity and timing of the COVID-19 pandemic is continually evolving; therefore, there is significant risk and uncertainty which may have a material and adverse effect on our operations. The following risks disclosed in our Annual Information Form for the year ended December 31, 2022 may be exacerbated as a result of the continued COVID-19 pandemic: market risks related to the volatility of oil and gas prices, volatility of foreign exchange rates, volatility of the market price of common shares, and hedging arrangements; operational risks related to increasing operating costs or declines in production levels, operator performance and payment delays, and government regulations; financing risks related to the ability to obtain additional financing, ability to service debt, and variations in interest rates and foreign exchanges rates; and other risks related to cyber-security as parts of our workforce continue to work through remote connections, accounting adjustments, effectiveness of internal controls, and reliance on key personnel, management, and labour.
In addition to the above, we are exposed to risk factors that impact our company and business. For further information on these risk factors, please refer to our Annual Information Form, available on SEDAR at www.sedar.com or on our website at www.vermilionenergy.com.
There has been no change in Vermilion’s internal control over financial reporting during the period covered by this MD&A that materially affected, or is reasonably likely to materially affect, its internal control over financial reporting.
Financial Risk Management
To mitigate the risks affecting our business whenever possible, we seek to hire personnel with experience in specific areas. In addition, we provide continued training and development to staff to further develop their skills. When appropriate, we use third party consultants with relevant experience to augment our internal capabilities with respect to certain risks.
We consider our commodity price risk management program as a form of insurance that protects our cash flow and rate of return. The primary objective of the risk management program is to support our return of capital and internal capital development programs. The level of commodity price risk management that occurs is dependent on the amount of debt that is carried. When debt levels are higher, we will be more active in protecting our cash flow stream through our commodity price risk management strategy.
When executing our commodity price risk management programs, we use derivative financial instruments encompassing over-the-counter financial structures as well as fixed and collar structures to economically hedge a part of our physical crude oil and natural gas production. We have strict controls and guidelines in relation to these activities and contract principally with counterparties that have investment grade credit ratings.
Critical Accounting Estimates
The preparation of financial statements in accordance with IFRS requires us to make estimates. Critical accounting estimates are those accounting estimates that require us to make assumptions about matters that are highly uncertain at the time the estimate is made and a different estimate could have been made in the current period or the estimate could change period-to-period.
The carrying amount of asset retirement obligations
The carrying amount of asset retirement obligations ($1,087.8 million as at December 31, 2022) is the present value of estimated future costs, discounted from the estimated abandonment date using a credit-adjusted risk-free rate. Estimated future costs are based on our assessment of regulatory requirements and the present condition of our assets. The estimated abandonment date is based on the reserve life of the associated assets. The credit-adjusted risk-free rate is based on prevailing interest rates for the appropriate term, risk-free government bonds adjusted for our estimated credit spread (determined by reference to the trading prices for debt issued by similarly rated independent oil and gas producers). Changes
Vermilion Energy Inc. ■ Page 29 ■ 2022 Management's Discussion and Analysis
in these estimates would result in a change in the carrying amount of asset retirement obligations and capital assets and, to a significantly lesser degree, future accretion and depletion expense.
The estimated abandonment date may change from period to period as the estimated abandonment date changes in response to new information, such as changes in reserve life assumptions or regulations. A one year increase or decrease in the estimated abandonment date would decrease or increase asset retirement obligations (with an offsetting increase to capital assets) by approximately $54.0 million.
The estimated credit-adjusted risk-free rate may change from period to period in response to market conditions in Canada and the international jurisdictions that we operate in. A 0.5% increase or decrease in the credit-adjusted risk-free rate would decrease or increase asset retirement obligations by approximately $64.8 million.
The fair value of capital assets acquired in business combinations
In preparing the purchase price allocation for the business combinations completed in 2022, we estimate the fair value of assets acquired. Assets acquired in an acquisition primarily relates to the crude oil and natural gas reserves. The estimated fair value of the crude oil and natural gas reserves acquired is based on the present value of proved plus probable reserves and forecast commodity prices. Changes in these assumptions, including the discount rate used, would change the amount of capital assets recognized and as a result may cause rise to goodwill or gains recognized on the acquisition and future depletion and depreciation expense.
The recognition of deferred tax assets
The extent to which deferred tax assets are recognized are based on estimates of future profitability. These estimates are based on estimated future commodity prices and estimates of reserves. As at December 31, 2022, the deferred tax asset balance of $125.5 million relates to Ireland.
In Ireland, we are projected to use all tax pools based on forecasted reserves and pricing and have not recognized any contra valuation allowances against deferred tax assets. A 10% decrease in pricing or volumes would continue to result in no contra valuation allowance being recognized.
Depletion and depreciation
Capital assets are grouped into depletion units, which are groups of assets within a specific production area that have similar economic lives. Depletion units represent the lowest level of disaggregation for which costs are accumulated for the purposes of calculating depletion and depreciation.
The net carrying value of each depletion unit is depleted using the unit of production method by reference to the ratio of production in the period to the total proved and probable reserves, taking into account the future development costs necessary to bring the applicable reserves into production.
Key judgments that are made to reserve estimates such as revisions in reserves, changes in forecast commodity prices, foreign exchange rates, capital or operating costs would impact the amount of depletion and depreciation recorded in a period.
The estimated recoverable amount of cash generating units
Each reporting period, we assess our CGUs for indicators of impairment or impairment reversal. If an indicator of impairment or impairment reversal is identified, we estimate the recoverable amount of the CGU. Judgment is required when determining whether indicators of impairment or impairment reversal exist, as well as judgments made when determining the recoverable amount of a CGU. Changes in any of the key judgments, such as a revision in reserves, changes in forecast commodity prices, foreign exchange rates, capital or operating costs would impact the estimated recoverable amount.
In the first quarter of 2022, indicators of impairment reversal were present in our Canada - Saskatchewan and France - Neocomian CGUs due to an increase in forecast oil prices. As a result of the indicators of impairment reversal, the Company performed impairment reversal calculations on the identified CGUs and the recoverable amounts were determined using fair value less costs to sell, which considered future after-tax cash flows from proved plus probable reserves and an after-tax discount rate of 12.0%. Based on the results of the impairment reversal calculations completed, recoverable amounts were determined to be greater than the carrying values of the CGUs tested and $144.4 million (net of $47.7 million deferred income tax expense) of impairment reversal was recorded. A 1% increase in the assumed after-tax discount rate would reduce the estimated recoverable amount of assets tested and result in a lower impairment reversal of $123.0 million while a 5% decrease in revenues (due to a decrease in commodity price forecasts or reserve estimates) would reduce the estimated recoverable amount of assets tested and result in lower impairment reversal of $220.4 million.
In the fourth quarter of 2021, indicators of impairment reversal were present in our France - Neocomian CGU due to increases and stabilization of commodity prices resulting in increased cash flow estimates. As a result of the indicators of impairment reversal, the Company performed impairment reversal calculations on the identified CGU and the recoverable amounts were determined using fair value less costs to sell, which considered future after-tax cash flows from proved plus probable reserves and an after-tax discount rate of 12.0%. Based on the results of the impairment reversal calculations completed, recoverable amounts were determined to be greater than the carrying values of the CGU tested and $17.7 million (net of $6.2
Vermilion Energy Inc. ■ Page 30 ■ 2022 Management's Discussion and Analysis
million deferred income tax expense) of impairment reversal was recorded. A 1% increase in the assumed after-tax discount rate would reduce the estimated recoverable amount of assets tested and result in a lower impairment reversal of $6.4 million while a 5% decrease in revenues (due to a decrease in commodity price forecasts or reserve estimates) would reduce the estimated recoverable amount of assets tested and result in lower impairment reversal of $12.9 million.
In the third quarter of 2021, indicators of impairment reversal were present in our Ireland CGU due to an increase and stabilization in forecast gas prices. As a result of the indicators of impairment reversal, the Company performed impairment reversal calculations on the Ireland CGU and the recoverable amount was determined using fair value less costs to sell, which considered future after-tax cash flows from proved plus probable reserves and an after-tax discount rate of 12.0%. Based on the results of the impairment reversal calculations completed, the recoverable amount was determined to be greater than the carrying value and $16.7 million (net of $5.5 million deferred income tax expense) of impairment reversal was recorded. A 1% increase in the assumed after-tax discount rate would reduce the estimated recoverable amount of assets tested and result in an impairment of $5.6 million while a 5% decrease in revenues (due to a decrease in commodity price forecasts or reserve estimates) would reduce the estimated recoverable amount of assets tested and result in an impairment of $24.8 million. A 1% increase in the assumed after-tax discount rate or a 5% decrease in revenues (due to a decrease in commodity price forecasts or reserve estimates) would not affect the amount of impairment reversal recorded.
In the second quarter of 2021, indicators of impairment reversal were present in our Alberta, Saskatchewan, Germany, Ireland and United States CGUs due to an increase and stabilization in forecast oil and gas prices. As a result of the indicators of impairment reversal, the Company performed impairment reversal calculations on the identified CGUs and the recoverable amounts were determined using fair value less costs to sell, which considered future after-tax cash flows from proved plus probable reserves and an after-tax discount rate of 12.0%. Based on the results of the impairment reversal calculations completed, recoverable amounts were determined to be greater than the carrying values of the CGUs tested and $460.4 million (net of $133.2 million deferred income tax expense) of impairment reversal was recorded. A 1% increase in the assumed after-tax discount rate would reduce the estimated recoverable amount of assets tested and result in a lower impairment reversal of $116.8 million while a 5% decrease in revenues (due to a decrease in commodity price forecasts or reserve estimates) would reduce the estimated recoverable amount of assets tested and result in lower impairment reversal of $254.9 million.
In the first quarter of 2021, indicators of impairment reversal were present in our Australia, Alberta, Saskatchewan, and United States CGUs due to an increase and stabilization in forecast crude oil prices versus 2020 when impairment charges were taken. As a result of the indicators of impairment reversal, the Company performed impairment reversal tests on the identified CGUs and the recoverable amounts were determined using fair value less costs to sell, which considered future after-tax cash flows from proved plus probable reserves and an after-tax discount rate of 12.0%. Based on the results of the impairment reversal calculations completed, recoverable amounts were determined to be greater than the carrying values of the CGUs tested and $492.2 million (net of $170.7 million deferred income tax expense) of impairment reversal was recorded. A 1% increase in the assumed after-tax discount rate would reduce the estimated recoverable amount of assets tested and result in a lower impairment reversal of $146.4 million while a 5% decrease in revenues (due to a decrease in commodity price forecasts or reserve estimates) would reduce the estimated recoverable amount of assets tested and result in lower impairment reversal of $285.6 million.
Off Balance Sheet Arrangements
We have not entered into any guarantee or off balance sheet arrangements that would materially impact our financial position or results of operations.
Cybersecurity
Vermilion has an information security training and compliance program that is completed at least annually. We have not experienced a cybersecurity breach in the last three years.
Recently Adopted Accounting Pronouncements
Vermilion did not adopt any new accounting pronouncements as at December 31, 2022.
Health, Safety and Environment
We are committed to ensuring we conduct our activities in a manner that protects the health and safety of our employees, our contractors and the public. Our HSE Vision is to consistently apply our core values of Excellence, Trust, Respect and Responsibility. Our goal is to create a workplace free of incidents by ensuring our proactive culture and behaviours create a high-reliability organization where HSE is fully integrated into our business – it is our way of life. Our mantra is HSE: Everyone. Everywhere. Everyday.
Vermilion Energy Inc. ■ Page 31 ■ 2022 Management's Discussion and Analysis
Vermilion seeks to maintain health, safety and environmental practices and procedures that comply with or exceed regulatory requirements and industry standards. All of our personnel are expected to work safely and in accordance with established regulations and procedures, and we seek to reduce impacts to land, water and air. During 2022 we:
| ● | Maintained clear priorities around 5 key focus areas of HSE Culture, Communication and Knowledge Management, Management Systems, Environmental & Operational Stewardship, and Health; |
| ● | Completed ongoing HSE performance monitoring through key performance indicator development, analysis and reporting; |
| ● | Continued comprehensive investigations of our incidents and near misses to ensure root causes were identified and corrective actions effectively implemented; |
| ● | Worked towards fulfilling our updated HSE Strategy and further enhanced our Visible Active Leadership program; |
| ● | Completed a comprehensive HSE Management System Assessment across the organization; |
| ● | Completed a gap assessment and action plan as part of our Process Safety Management System implementation; |
| ● | Completed our 4th HSE Perception Survey, analyzed the results and developed action plans; |
| ● | Continued reinforcement of the “Vermilion High 5”, an individual safety awareness initiative aimed at keeping front-line workers safe; |
| ● | Advanced our Energy Safety Canada and International Oil and Gas Producers Life-Saving Rules implementation and competency development; |
| ● | Submitted our CDP Water and Climate reports; |
| ● | Managed our waste products by reducing, recycling and recovering; |
| ● | Reduced long-term environmental liabilities through decommissioning, abandoning and reclaiming well leases and facilities; |
| ● | Continued the development of a robust hazard identification and risk mitigation program specific to environmentally sensitive areas; |
| ● | Performed auditing, management inspections and workforce observations to measure compliance and identify potential hazards and apply risk reduction measures; and |
| ● | Assessed the effectiveness of our performance management standards across multiple business units. |
We are a member of several organizations concerned with environment, health and safety, including numerous regional co-operatives and synergy groups. In the area of stakeholder relations, we work to build long-term relationships with environmental stakeholders and communities.
Task Force on Climate-related Financial Disclosure (TCFD)
Environmental, Social and Governance (ESG)
As an international company, Vermilion responsibly produces essential energy while delivering long-term value to our stakeholders. We believe that integrating sustainability principles into our business increases shareholder returns, enhances development opportunities, reduces long-term risks, and supports the well-being of key stakeholders including the communities in which we operate.
Vermilion has established a leadership position in sustainability performance and disclosure, launching our first CDP Climate submission and Sustainability Report in 2014, with data to 2012, aligned with the Global Reporting Initiative (GRI). We have since adopted recommendations from the Task Force on Climate-related Financial Disclosure (TCFD), the Sustainability Accounting Standards Board (SASB), and the International Sustainability Standards Board (ISSB).
In particular, we have applied the TCFD framework in the management of climate- and other sustainability-related risks and opportunities. This recognizes the importance of climate-specific disclosure while reflecting its intersection with other environment-related risks and opportunities, social factors such as safety and community engagement, and governance issues. Our Index follows:
| | |
● Governance | Information Circular | |
● Strategy | Annual Report MD&A | |
● Risk Management | Annual Report MD&A | |
● Metrics and Targets | Annual Report MD&A | |
● Consolidated Climate (TCFD) Report | www.vermilionenergy.com/sustainability/reports/ | |
Sustainability and Climate-Related Strategy
Vermilion understands our stakeholders’ expectations that we deliver strong financial results in a responsible and ethical way. As a result, we align our strategic priorities in the following order:
| ● | the safety and health of our staff and those involved directly or indirectly in our operations; |
Vermilion Energy Inc. ■ Page 32 ■ 2022 Management's Discussion and Analysis
| ● | our responsibility to protect the environment. We follow the Precautionary Principle introduced in 1992 by the United Nations "Rio Declaration on Environment and Development" by using environmental risk as part of our development decision criteria, and by continually seeking improved environmental performance in our operations; and |
| ● | economic success through a focus on operational excellence across our business, which includes technical and process excellence, efficiency, expertise, stakeholder relations, and respectful and fair treatment of staff, contractors, partners and suppliers. |
Reflecting these priorities, we have positioned Vermilion purposefully within the energy transition. Our scenario analysis has consistently demonstrated that Vermilion can best contribute by focusing on producing energy responsibly: safely, reliably and cost-effectively. Our Sustainability Report provides further details at: www.vermilionenergy.com/sustainability.
Vermilion Energy Inc. ■ Page 33 ■ 2022 Management's Discussion and Analysis
Description of Sustainability- and Climate-related Risks and Opportunities, and Impacts
Given the intersection of environmental and social issues, and their impact over varying timeframes, we have identified climate-related risks and opportunities within short-term (0-3 years), medium-term (3-6 years) and long-term (6-50 years) horizons. We describe these below, along with their potential company and financial impact (assessed using processes such as scenario analysis, cost projections and our Emissions Long-Range Planning tool), and our resulting management approach, including operations such as equipment upgrade, and capital allocation. Our annual CDP Climate Change and Water Security submissions provide additional information, including where in the value chain these risks and opportunities occur: see www.vermilionenergy.com/sustainability/reports/.
Category / | Description of Impacts | Potential Financial Impact | Management Approach |
|---|---|---|---|
Short-term Transition Risks (0-3 Years) | |||
Policy and Legal: Increased Pricing of GHG Emissions e.g. Carbon Tax
| Short-term impact is primarily in Canada and Ireland. Canadian Federal Greenhouse Gas Pollution Pricing Act has set carbon tax rates at $50 per tCO2e in 2022, rising to $170 by 2030. Our exposure is mitigated by provincial responses to the Act, including Alberta's Technology Innovation and Emissions Reduction (TIER) regulation and Saskatchewan’s Output-Based Pricing System (OBPS). Our Ireland operations are subject to the EU ETS and Ireland Carbon Tax systems. Longer-term impact rests on carbon pricing’s vulnerability to changes in government policy. We note the political focus in the EU, Canada and USA on a COVID-19 economic recovery that is both climate-focused and responsive to social justice issues such as labour practices. | With our recent Montney acquisition, our Canadian carbon tax liability increased to approximately $0.7MM in 2022, and is forecasted to exceed $1MM/year in the near term. Our Ireland EU ETS liability is forecast to be approximately $0.8MM in 2022, increasing to approximately $2.6MM in 2025 and $3.5MM in 2030. The Ireland Carbon Tax liability is expected to be an additional approximately $0.1MM/year over this period. All of the liability estimates are net Vermilion. | We voluntarily opted into Alberta’s TIER regulation, which provides tax exemptions contingent on emissions reduction activities that Vermilion is in the process of implementing. Our ongoing efforts to reduce the energy and emissions intensity of our operations are integral to managing this risk, including our announcement of two emission reduction targets in 2021. Vermilion continues to monitor and comply with taxation requirements, engaging external subject matter experts and in-house experts in engineering, asset integrity, optimization, health safety & environment, and sustainability that assess our operations. |
| | | |
Policy and Legal: Enhanced Emissions & Other ESG Reporting Obligations | Climate and other ESG reporting obligations are evolving rapidly, with Vermilion potentially subject to European Sustainability Reporting Standards, U.S. Securities and Exchange Commission Climate-Related Disclosure Rules, and Canadian Securities Administrators Climate-Related Disclosure Rule, much of which is founded on the work of TCFD, SASB and the International Sustainability Standards Board. Although Vermilion's existing sustainability-related disclosure provides a sound foundation for compliance with these proposed rules, there are costs to monitor developments and respond to the final versions, particularly potential requirements for increased levels of audit. The impact to Vermilion would be a decreased netback per BOE, due to increased expenses for staff time and system development and implementation. | The financial impact is an increase in operational cost associated with the management and quantification of emissions to meet new reporting requirements, and the administrative costs associated with reporting and audit obligations. This is built into Vermilion's budgeting and is currently estimated at $0.5MM annually. | Regulations in all of our business units are monitored on an ongoing basis, and assumptions/scenario planning is used annually to assess risk. In Canada, we implemented an external emission data gathering software in 2021 to support the evolving regulatory landscape. Vermilion also engages stakeholders relating to emissions reporting obligations. Management of this risk is built into Vermilion's operations and our ERM. In addition, we expect to automate our emissions data gathering, aggregation and calculation processes in 2023-2024, while ensuring audit-ready processes for all ESG data points to align with proposed regulatory requirements. |
| | | |
Vermilion Energy Inc. ■ Page 34 ■ 2022 Management's Discussion and Analysis
Category / | Description of Impacts | Potential Financial Impact | Management Approach |
|---|---|---|---|
Policy and Legal and Technology: Mandates on and Regulation of Existing Products and Service, and Changes in Emissions Regulations; and Market and Reputational: Changing Customer Behaviour
| Vermilion's operations are subject to regional regulatory changes that result in changes to equipment requirements such as engineering and equipment modifications to reduce carbon emissions and / or emissions of criteria air contaminants. The most likely short-term impact is regulations in Canada to reduce methane emissions, in France to reduce flaring and in Netherlands to reduce NOx. From a macro perspective, geopolitical impacts (e.g. war in Ukraine) have escalated diverging government and consumer viewpoints on the need for energy security vs energy transition. We expect that demand for oil and natural gas to remain strong in the short term, while safety and environmental regulations governing its production will increase. We have identified these risks as interconnected and existing in the short-term; however, they should be seen as medium- to long-term risks as well. | Operational changes to comply with existing methane reduction regulations is expected at approx. $1.5MM in the short term, with those associated with eliminating routine flaring in France subject to continuing review in 2023. The cost of compliance with proposed regulations, such as Canada's proposed regulatory framework for reducing oil and gas methane emissions to achieve a 75% reduction by 2030 is not yet established, and will depend on the final version of the framework. | Vermilion is closely monitoring regulatory and market changes to ensure its approach to resilience under evolving conditions remains appropriate. We provide feedback to governments on proposed regulations, as per our lobbying disclosures, and allocate resources, including staff and capital, to ensure that required operational changes can be effectively actioned. In the short term, tying in vented equipment to flaring infrastructure in Canada is an example of projects to address this risk; in Netherlands we have used NOx scrubbers and purchased NOx certificates to comply with new regulations. Our ongoing efforts to proactively reduce the energy and emissions intensity of our operations are integral to managing this risk, including our announcement of two emission reduction targets in 2021, and our work in 2022-2023 to establish a clear net zero to 2050 plan and 2030 emissions reduction target. We are also working with external partners to further implement and develop emission reduction technologies that are economic to the Company, in part due to the potential generation of carbon credits. Based on stakeholder engagement, Vermilion believes that independent assessments of our operations by third parties are an important tool to demonstrate our responsible approach to production of essential energy. As a result, we have sought and achieved Equitable Origin responsible gas producer certification for 3 of our Canadian sites, the AFNOR CSR Committed label in France, and the Business Working Responsibly mark in Ireland. |
| |||
Medium-term Physical Risks (3-6 Years) | |||
Acute: Increased Severity of Extreme Weather Events such as Cyclones and Floods | Vermilion owns and operates an offshore platform in the Wandoo field off northwestern Australia, co-owns and operates the Corrib project off the Irish coast, and owns and operates oil fields in the coastal area of SW France. Extreme weather events have the potential to directly impact our offshore operations resulting in down time or damage to infrastructure, and can impact the downstream handling capacity of our partners, resulting in a limitation to the distribution and sale of our products. | Based on the value of the Wandoo Platform and a 1-in-10,000-year cyclonic event, the financial implications associated with damage due to a severe weather event is estimated at $274MM (total impact before insurance). The third-party costs associated with potential damages from extreme weather events are not tracked. | Vermilion maintains insurance as a mitigative measure to reduce the financial impact associated with damage to our assets due to severe weather events. We also have a robust asset integrity program that maintains our offshore facilities to their original design specifications of CAT 5 hurricane force. We also have protocols for monitoring and preparing for cyclones, and have invested in our emergency response capabilities in the event of damage to our assets due to severe weather. |
| |||
Vermilion Energy Inc. ■ Page 35 ■ 2022 Management's Discussion and Analysis
Category / | Description of Impacts | Potential Financial Impact | Management Approach |
|---|---|---|---|
Long-term Transition Risks (6-50 Years) | |||
Technology: Substitution of existing products and services with lower emissions options | Although we see demand for oil and natural gas remaining robust in the short- to mid-term, it is likely that demand for oil and, to a lesser degree, natural gas will eventually fall as the energy transition evolves and various alternatives for renewable energy options become technologically and economically available. This could impact the need for our products in the longer term, post 2030 for oil and even further out for natural gas. As 2021 and 2022 have demonstrated, it will be critical to maintain adequate supplies of both oil and natural gas during the energy transition, to provide both accessibility and affordability. | Given the uncertain timeline and progression of the energy transition, and supply-demand dynamics, we are not using a financial forecast for impact. We are, however, using our scenario analysis to identify potential opportunities that would mitigate the risk to our products. | Based on our scenario analysis, we identified the need to explore new and evolving technologies and processes to identify synergistic fits for our business in both traditional and renewable energy production. We are pursuing this via our established track record in geothermal energy from produced water, for which our internal expertise in engineering, geoscience and drilling is particularly well suited. We are also investing in early R&D in other areas, such as biogas and the conversion of traditional oil and gas assets to geothermal and hydrogen production, to better understand the long-term potential. |
| |||
Long-term Physical Risks (6-50 Years) | |||
Chronic: Changes in Temperature Extremes, Including Rising Mean Temperatures | A decrease or increase in the temperature extremes experienced in winter/summer months (i.e. lower seasonal lows, higher seasonal highs) could result in an increase in fuel gas for a variety of equipment essential for safe production, along with additional equipment (e.g. building heaters, line heaters). This would require additional resources (infrastructure) as well as increase our carbon footprint. Temperature extremes also have the potential to increase capital costs associated with drilling, completion and workover operations due to increased timelines, decreased productivity, equipment breakdown, etc. | For example, an overall increase in seasonal lows (warmer winters) would have a direct impact on Vermilion's more northern onshore operations, via a decreased ability to access lands and an increase in construction capital requirements. The financial implications on an annual basis are difficult to quantify; however, based on Vermilion's experience, the most significant financial implications would result from shutdowns in drilling or completions locations. The estimated cost of this would be $0.5MM per day of delay. | As weather extremes cannot be controlled, Vermilion uses our Management Systems and processes to protect the health and safety of our workers, contractors and the public, and to protect the environment from adverse effect. For example, we have reduced the potential impact related to access in remote assets by using multi-well pads wherever possible. This would significantly decrease capital considerations in the event that limited frost days occurred. Each risk associated with weather is assessed on a case-by-case basis. |
| | | |
Chronic: Changes In Precipitation Patterns and Extreme Variability in Weather Patterns
| Vermilion holds assets inland, in coastal regions, and offshore, where a change in precipitation could negatively impact on operations due to drought or flooding. Flooding could result in limited access to locations / facilities, and poses a risk to our corporate headquarters. Alternatively, drought conditions could impact the availability of surface and / or groundwater, which Vermilion, in part, relies on for drilling and completion activities. This could negatively impact forecasted growth by increasing the timelines and capital costs to bring new infrastructure onto production. | The financial implications of a single time event (i.e. wildfire) have been assessed on a case-specific basis, and are believed to be substantive (impact > $10.0MM). Vermilion maintains insurance to mitigate the potential impact of precipitation-related extreme events (i.e. Wildfire, Flooding). | As these incidents are out of Vermilion's control, we take all measures possible to ensure effective emergency response to extreme weather events, to ensure the protection of the health and safety of our workers, contractors and the public, the protection of the environment and limiting the financial impact of the event. In the case of a longer term extreme precipitation event or drought, Vermilion would implement water management programs to reduce our reliance on fresh water sources to limit the potential impact on operations. |
| | | |
Chronic: Rising Sea Levels
| Vermilion owns and operates assets in the Netherlands, where we have assessed the potential risk associated with rising sea levels. This could physically impact our operations due to issues such as flooding, transportation difficulties and supply chain interruptions. Rising sea levels also pose a threat related to the salinization of groundwater. | We have estimated that a rise in sea level could have a financial impact of $571MM before insurance at our main gas processing facility Garijp (GTC) in the Netherlands, caused by an extreme 1-in-10000-years tide/extreme wind event. | Other than conventional berm protection, there is no measure available to protect Vermilion's assets in the Netherlands if water levels rise to a level resulting in one of our main facilities being temporarily invaded by sea water. Based on Vermilion's assessment of the probability of these events occurring over the next 5 years being less than 0.05%, Vermilion has accepted this level of risk exposure. Vermilion currently includes a review of this risk in our annual risk management process. |
| |||
Vermilion Energy Inc. ■ Page 36 ■ 2022 Management's Discussion and Analysis
Category / | Description of Impacts | Potential Financial Impact | Management Approach |
|---|---|---|---|
| |||
Short-term Opportunities (0-3 Years) | |||
Products and Services, and Resilience: Development of New Products and Services through R&D and Innovation; participation in renewable energy programs | Directly related to the long-term transitional risk associated with the substitution of low-carbon products, we have the opportunity to participate in the development of those products. This has the potential to reuse our current infrastructure to provide alternative products, such as biogas or hydrogen, or to develop new products such as geothermal energy, creating new revenue streams. An example of this opportunity is the geothermal heat we are providing heat from the produced water in our oil operations to develop sustainable agriculture and residential projects near our operations. | As this opportunity is in the early stage of assessment, it is difficult to quantify the financial impact, but it is estimated at up to $2.0MM per year in revenue and returns on investment. Potential also exists for significant cost adjustments, as assets slated for abandonment would be repurposed to enable them to continue to generate energy. | We are leveraging our technical experts and partnerships to provide input into alternative and renewable energy projects as they are identified. An example of the development of low emission goods/services is our France-based industry partnership with Avenia to expand the use of geothermal energy production in oil production, and a geothermal association in Germany. We have also developed criteria for approving the move of these ideas into our Vermilion Opportunity Development Process, which provides clear gates and criteria for considering and implementing such projects. |
| | | |
Products and Services: Access to New Markets | More stringent global measures to reduce emissions from individual ships by 30% by 2030, established through amendments to MARPOL Annex VI, came into force on Jan 1 2020, limiting the sulphur content of bunker fuel to a maximum of 0.5%. Vermilion’s Australian Wando facility produces 4500 bbl/d of low sulphur crude oil that meets the needs of refineries in the short term to meet IMO regulations. | Vermilion conservatively foresees achieving a premium of $10/bbl for its Wandoo production over the next three years for cumulative incremental revenue of $49.3MM. | Vermilion continues to access local markets for our low sulphur production, while exploring regions to expand our operations. Our Marketing group ensures that Vermilion meets its contractual obligation with our buyers in terms of volumes, delivery dates and crude quality. |
| | | |
Products and Services: Ability to Diversify Business Activities; Shift in Consumer Preferences | Vermilion maintains a diverse, stable global portfolio of oil and gas assets. Our strong record of safe and socially conscious development of energy resources has provided opportunities to access and develop these resources. We see our commitment to sustainability as core to our business, which has provided important organizational focus on emissions quantification and management. As consumers become more aware of and involved in the selection of their energy sources and associated carbon intensity, we believe that Vermilion will continue to be a top quartile choice, providing us with opportunities not available to peer organizations. | The financial impact of changing consumer preferences in difficult to quantify. We foresee revenue opportunities in two distinct areas. (1) In consumers selecting premium energy products, with these products demanding a higher price than other energy sources on the market; currently we estimate the potential impact of premium pricing in the long-term to be $1-5 per BOE, or $31.1MM/year based on $1 at 2022 production levels. (2) Access to more stringent markets, supported by our environmental and sustainability performance. Vermilion has entered into German, Hungarian, Croatian and Slovak oil and gas operations, which our sustainability performance has supported. | Based on stakeholder engagement, Vermilion believes that independent assessments of our operations by third parties are an important tool to demonstrate our responsible approach to production of essential energy, and generate premium. As a result, we have sought and achieved Equitable Origin responsible gas producer certification for 3 of our Canadian sites, the AFNOR CSR Committed label in France, and the Business Working Responsibly mark in Ireland. We are currently assessing the potential to expand these certifications. |
| |||
Medium-term Opportunities (3-6 Years) | |||
Energy Source: Participation in Carbon Market
| Under the revised EU ETS Directive in effect 2021-2030, it is anticipated that there will be an active market and consumers for the offset credits generated at some of Vermilion's sustainability initiatives around the world. This shift in the cap and trade scheme may provide opportunities for Vermilion to generate certified energy reduction / offset credits through our geothermal cogeneration projects in France; however, current carbon markets are experiencing significant volatility, including reputational impacts to voluntary markets. | Vermilion is not accounting for any short term financial impact due to the volatility in current markets. | We will continue to evaluate the benefit that certified offset credits from various emission reduction projects across our operations could provide. Examples of projects that have the potential to generate credits include four geothermal co-production projects in France. Vermilion's project assessment framework is applied to each identified opportunity, including considerations associated with emissions offset. |
Vermilion Energy Inc. ■ Page 37 ■ 2022 Management's Discussion and Analysis
Category / | Description of Impacts | Potential Financial Impact | Management Approach |
Long-term Opportunities (6-50 Years) | |||
Products and Services: Shift in Consumer Preferences
| Under the Canadian Environmental Protection Act and based on commitments made by the Canadian and Alberta governments and energy utilities relating to COP21, there is a commitment to reduce emissions for coal-fired power generation. Based on this and with a number of power generating facilities in Alberta nearing the end of their service life, the demand for natural gas is likely to increase due to increased use of combined cycle gas turbine (CCGT) power generation. | The short term impact of this regulatory change on gas pricing is anticipated to be low and increase to medium in the mid- to long-term. Once the regulations have come into effect and the implementation period has occurred, there is a potential to see an impact on the marketable price and demand for natural gas. As a natural gas and oil producer, Vermilion would benefit from an increase in marketable prices for natural gas in our Canadian operations. | As we move further into the energy transition, we foresee natural gas playing an impactful role as a less carbon intense fuel than other options (i.e. coal). Vermilion continues to focus on the identification of resources and assets where we have the opportunity to apply our industry leading expertise to optimize production while reducing emissions. An example of our strategy to realize this opportunity is our asset base in Alberta, which currently includes a large liquids rich gas play. Vermilion's marketing team is also actively pursuing options for our natural gas production that will enable Vermilion to achieve the best netbacks on production. |
| | | |
Energy Source: Shift Toward Decentralized Energy Generation | The carbon intensity of energy used around the world has a direct relationship to where the energy product was generated. Vermilion’s business unit structure supports production and distribution of energy products into local markets. This strategy results in the significant reduction of the carbon footprint of our energy when compared to non-local sources. | The long-term financial impact of decentralized energy generation will depend on the speed of the energy transition balanced against the need for energy security. As such, we believe it is not possible to predict the financial impact at this time. | Vermilion continues to assess where we can access local markets for our production, while exploring regions to expand our operations. The actions taken in the past several years to realize this opportunity include alterations to our structure, our strategic objectives and our operational development plans to support Vermilion as a distributed energy provider, and exploration and development programs in regions with relatively low energy production as compared to consumption (i.e. Hungary). |
Resilience of the Company’s Strategy
Countries in all of our operating regions have implemented policies to support a low-carbon future for the world’s economy, consistent with a 1.5-2C or lower scenario. As a global energy producer, we contribute to the supply of safe, reliable and affordable energy during this transition; our strategy is therefore based on our risk and opportunity identification, which in turn contributes to our materiality analysis. This analysis is based on double materiality, considering issues based on both external and internal impacts. The Board of Directors and senior leadership used these analyses in our scenario analysis. Vermilion uses two energy transition scenarios from the World Economic Forum. These compare a Gradual versus Rapid low-carbon transition based on inputs that include the International Energy Agency’s New Policies Scenario (Gradual) and Sustainable Development Scenario (Rapid), which meets the Paris Agreement’s goal to limit global temperature increases to 1.5 to 2ºC. Vermilion examines key factors impacting the speed of the transition – including the influence of new energy technologies; potential speed of their adoption; anticipated changes in policy and regulation; and emerging market pathways such as India – and resulting factors that could impact the Company, including economics (demand, supply, consumer behaviour, and costs of energy); technological advancement; capital availability; government policy; and Company reputation. Among these, government policy is seen as most influential in the near to mid-term.
We applied these findings to Vermilion’s strategy to 2050 and beyond, described below. In particular, the scenario analysis led us to develop two emission-related targets that were announced in 2021: an aspirational commitment to net zero emissions in our own operations, including Scope 1 and Scope 2 emissions, by 2050, and a near-term target to reduce Scope 1 emissions intensity from our operations by 15 to 20% by 2025, using a baseline year of 2019. See Metrics and Targets, below, for more information.
In 2022, we furthered this commitment by establishing high-level approaches to net zero, including: reducing emissions; converting production by replacing end-of-life fields with lower intensity production; adapting to new technology such as carbon capture and storage and renewable energy; and — when no other options exist — a careful approach to offsetting. We are building out this plan in 2023, including establishing our next emissions reduction target, for 2030.
Vermilion Energy Inc. ■ Page 38 ■ 2022 Management's Discussion and Analysis
Overall, our strategy to ensure our resilience under various scenarios rests on three strategic activities:
| ● | Focusing on efficient and responsible production of oil and natural gas, viewing emissions as potential energy sources: |
| ° | Lower carbon fuels. Since 2012, we have shifted our production mix towards natural gas as a cleaner burning fuel than other fossil fuels. We also sell our fuels within the country of production wherever possible, reducing the carbon footprint associated with transportation of the fuel to consumers while increasing national energy security. |
| ° | Socially responsible fuels. We are committed to ensuring that our products are produced in an environmentally and socially responsible manner, respecting worker rights and community engagement. We operate in regions noted for their stable, well-developed fiscal and regulatory policies related to oil and gas exploration and development, and for their robust health, safety, environmental and human rights legislation. |
| ° | Transparency and reporting. We have established a strong record of reporting on greenhouse gas emissions, energy usage and other key environmental metrics, which has supported our emission reduction targets. |
| ● | Implementing technically and economically feasible options for emission reduction, covering combustion, flaring, venting and fugitive emissions: |
| ° | Greater energy efficiency. Many energy and operational efficiency initiatives go hand-in-hand, which in turn helps us minimize our carbon footprint and reduce greenhouse gas emissions. |
| ° | Lower greenhouse gas emission intensity. We are committed to reducing the greenhouse gas emissions associated with our production, with particular focus on methane. |
| ● | Exploring new and evolving technologies and processes to identify synergistic fits for our business in both traditional and renewable energy production: |
| ° | Alternative energy. We are continuing to develop our knowledge and use of alternative energy sources, including geothermal energy, for which our internal expertise in engineering, geoscience and drilling is particularly well suited. This work has begun with the geothermal potential of our produced water, supporting a circular economy model that conserves, reuses and recycles resources to better protect our environment. It is also expanding into areas such as biogas and the conversion of traditional oil and gas assets to geothermal and hydrogen production. |
In addition, we identified two further pillars of our sustainability strategy that are integral to managing sustainability- and climate-related issues:
Conservation
We are committed to reducing the impact our operations have, beginning with regulatory compliance across all business units. Our conservation efforts are further focused in three areas:
| ● | Water: We recognize water as a basic human right, and as a vital resource that is shared among many stakeholders in our communities. We are therefore committed to protecting both the supply and the quality of water sources in our areas of operation by: |
| ° | Proactively preventing harm and supporting healthy surface and groundwater bodies |
| ° | Reducing potable and freshwater usage to the lowest level practical, and |
| ° | Taking a lifecycle and circular economy approach to water, exploring opportunities to reuse and recycle products such as produced water |
| ● | Asset Retirement Obligations: We are adapting our long-term Asset Retirement Obligation management to include revitalizing or reusing assets to benefit our environment and our communities. |
| ● | Biodiversity: We are focusing on protecting the species and habitats around us by proactively identifying biodiversity risks and opportunities, and implementing associated plans. |
Community
Our communities comprise a wide diversity of people and organizations, but they have one key thing in common: they care deeply about the safety, environmental stewardship and corporate citizenship that we bring to our local operations. In addition, our people care deeply about their communities - whether we work there or live there, these are the places we call home. We therefore steward our operations and relationships to demonstrate our commitment to being a responsible producer and a valued and trusted neighbor and business partner, including:
| ● | Transparency with respect to safe and environmentally responsible operations, including our potential impacts on local communities |
| ● | Maintaining strong, genuine relationships with our communities, with engagement based on respect, listening and openness, and |
| ● | Creating a shared value focused on local economic and social development |
Vermilion Energy Inc. ■ Page 39 ■ 2022 Management's Discussion and Analysis
Sustainability and Climate-Related Risk Management
Process for Identifying, Assessing and Managing Sustainability- and Climate-related Risks, and
Integration into the Company’s Enterprise Risk Management (ERM) System
Sustainability-related risks and opportunities, including those related to climate, are integrated into multi-disciplinary Company-wide risk identification, assessment, and management processes as part of our ERM system, based on the Committee of Sponsoring Organizations of the Treadway Commission (COSO) framework. This provides an integrated approach to managing risk as it impacts strategy and performance, and includes Operational, Market & Financial, Credit, Organizational, Political, Regulatory Compliance, Strategic and Reputational, and Sustainability categories. Our sustainability materiality analysis, which assesses issues with impact for both the Company and our key stakeholders, is integrated into our ERM system using the Corporate Risk Register through a collaboration between our Finance, HSE and Sustainability teams.
Overall, risk management is the responsibility of the Board and the Executive Committee based on a Top-Down, Bottom-Up approach to engage all staff. Top-Down begins with our Board and its committees with clear terms of reference, including oversight for identification and management of specific allocations of risk type. This is translated into action by our Executive Committee, which reviews and manages the ERM process through implementation of associated policies and procedures. Our staff help develop systems, standards and procedures. Bottom-Up is how staff implement, maintain and improve risk management processes, applying the hazard-risk-mitigation process in every part of our business.
Risks are identified by key staff across our Company, including our Operations, Finance, Health, Safety and Environment, Economics, Government and Public Relations, and Sustainability teams at corporate, business unit and asset levels. These employees have significant experience, and use a wide array of inputs, including operational and facility assessments, technical and research reports, external stakeholder organizations, government policy and regulation changes, industry initiatives, communities and landowners, and non-governmental entities.
The results are incorporated into our Corporate Risk Register, which provides a consistent framework to ensure the effective tracking and communication of our material risks. Using our Risk Matrix as a prioritization tool, Teams assess severity, likelihood, speed of onset, and vulnerability using scales from 1 to 5 for each factor, described in terms of human, environment, financial, social license and cybersecurity impacts. Every risk case has also been assessed to determine where sustainability- or climate-related risk is a contributing factor. The results are provided annually at minimum to senior management, the Executive Committee and the Board and its Committees as appropriate, who further assess the risks including interdependencies.
Our risk management approach focuses on reducing the risk to a level as low as reasonably practicable, accepting the risk, and/or controlling it (such as insuring it). For example, if direct mitigation is not possible (e.g. changes in temperature extremes), we would adapt our business processes to reduce the potential impact (e.g. changing work hours to avoid extreme mid-day heat). In other situations (e.g. increasing risk of flood), we may take measures to protect against the risk (e.g. flood controls) while also insuring our operations.
To support climate risk identification and management, we developed a Carbon Liability Assessment Tool, with Scope 1 emissions quantification and regulatory information for each business unit. We assessed the price of carbon on both a realized cost and shadow pricing basis, and have identified likely carbon pricing scenarios for all our operating areas. The Tool provides the basis for developing carbon liability risk cases for all business units, supports ongoing identification of carbon opportunities, and supports activities such as business development, taxation review and marginal abatement cost curve preparation. In 2022, we built on this approach by developing our Emissions Long-Range Planning Tool. This is based on our long-range planning tool for production, and allows us to forecast emissions, carbon taxes and the impact of various emission reduction projects. This supports our decision-making on production, capital allocation, and mergers and acquisitions.
Sustainability and Climate-Related Metrics and Targets
Metrics Used to Assess Sustainability- and Climate-Related Risks and Opportunities
Our sustainability reporting (www.vermilionenergy.com/sustainability) continues to describe significant economic, environmental, social and governance measures, which are reported with reference to TCFD, SASB and GRI. These include but are not limited to:
| ● | Climate: energy consumption and intensity; investment in and generation of renewable energy; greenhouse gas emission and intensity, including flaring and venting, and avoided emissions; and water withdrawal, including from areas of high baseline water stress, and discharge. |
| ● | Environment: Waste generation and management; Asset integrity and spills; and Environmental investment |
| ● | Social: Health and Safety; People; and Community investment |
| ● | Governance: Ethics |
Vermilion Energy Inc. ■ Page 40 ■ 2022 Management's Discussion and Analysis
These metrics contribute to our performance for CDP Climate, and S&P Global Corporate Sustainability Assessment and Sustainalytics, which comprise 10% of the Corporate Performance Scorecard for our Long-term Incentive Plan. In addition, HSE metrics comprise 25% of the scorecard for our Short-Term Incentive Plan. These plans apply to all employees, including our executive team.
We also track carbon pricing, and have identified actual and likely pricing scenarios for all of our operations based on current government policies and published research relating to the Paris Agreement. For example, in Canada, the 2022 carbon tax was $50 per tCO2e, and in Ireland, carbon pricing was 41 € per tCO2e. Further information is available in our CDP Climate submission, available at vermilionenergy.com/sustainability/reports/.
In addition, we benchmark our performance via third-party ESG rating agencies, including:
| ● | CDP Climate Change and Water Security: Climate Score of A- and Water score of “B” in 2022. |
| ● | ISS ESG QualityScore: Decile rating of “1” for Environmental and Social practices as of March 2023. |
| ● | MSCI ESG Rating: AAA in 2022. |
| ● | S&P Global Corporate Sustainability Assessment: Top of our peer group in 2022. |
Scope 1, 2 and 3 GHG Emissions Disclosure
We report Scopes 1, 2 and 3 emissions, which are externally verified under ISO 14064-3. Historical, corporate and business unit data can be found in the Energy and Emissions Performance Metric document available at www.vermilionenergy.com/sustainability/, summarized in the charts below. The 2018 increase in emissions was associated with the acquisition of southeast Saskatchewan assets. Our Scope 1 and 2 emissions intensity and methane emissions intensity decreased in 2019 and 2020, primarily related to our first full year of operatorship for the Corrib gas asset in Ireland, and our focus on reducing post-acquisition emissions over time through superior operations, as we did in 2014 to 2017 following the acquisition of previous Saskatchewan assets. This has been achieved through a variety of gas conservation and recovery initiatives including construction of new infrastructure, operational changes and increased infrastructure runtimes. Additional decreases have been achieved through improved measurement and methodologies, projects such as replacing diesel or propane with compressed natural gas for boilers and water heating for the drilling program in Alberta, converting pneumatic devices from high- to low-bleed, installing solar-powered chemical injection pumps, and the purchase of renewable energy certificates for electricity use in Netherlands and Ireland.
| |
|
|
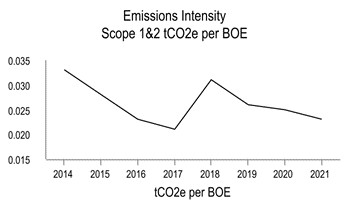
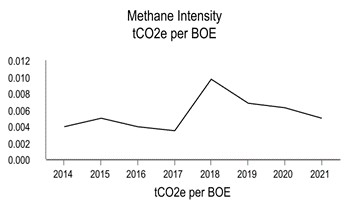
Related Targets and Performance
Vermilion has committed to two emission-related targets:
| ● | Net zero emissions in our own operations, including Scope 1 and Scope 2 emissions, by 2050. We are transparent that this is an aspirational goal, and that we will continue building the plan to achieve this target over time. |
| ● | As a first step, we set a near-term target to reduce Scope 1 emissions intensity from our operations by 15 to 20% by 2025, using a baseline year of 2019. We will set new targets every five years at minimum, building on this foundation while exploring broader options, including the potential to reduce Scope 3 emissions. |
| ● | In 2022, we furthered this commitment by establishing high-level approaches to net zero, including: reducing emissions; converting production by replacing end-of-life fields with lower intensity production; adapting to new technology such as carbon capture and storage and renewable energy; and — when no other options exist — a careful approach to offsetting. We continue to build out this plan in 2023, including establishing our next emissions reduction target, for 2030. |
Vermilion Energy Inc. ■ Page 41 ■ 2022 Management's Discussion and Analysis
We are tracking our performance using Scope 1 and 2 absolute and intensity emission metrics, and were on track as of end of year 2021 with a 5% decrease in Scope 1 emissions intensity. Fiscal year 2022 environmental reporting will be available in mid-2022 at https://www.vermilionenergy.com/sustainability/, where additional targets to reduce emissions and methane in our southeast Saskatchewan assets, reduce Scope 2 emissions in our Netherlands and Ireland Business Units, and generate renewable energy in our France Business Unit can also be found.
For more information on our sustainability- and climate-related performance, please see our 2023 Proxy Statement and Information Circular, online sustainability reporting, particularly the Index and Performance Metrics sections, and 2022 CDP Responses.
Corporate Governance
We are committed to a high standard of corporate governance practices, a dedication that begins at the Board level and extends throughout the Company. We believe good corporate governance is in the best interest of our shareholders, and that successful companies are those that deliver growth and a competitive return along with a commitment to the environment, to the communities where they operate, and to their employees.
We comply with the objectives and guidelines relating to corporate governance adopted by the Canadian Securities Administrators and the Toronto Stock Exchange ("TSX"). In addition, the Board monitors and considers the implementation of corporate governance standards proposed by various regulatory and non-regulatory authorities in Canada. A discussion of corporate governance policies is included each year in our proxy materials for our annual general meeting of shareholders, copies of which are available on SEDAR (www.sedar.com).
As a Canadian reporting issuer with securities listed on the TSX and the New York Stock Exchange (“NYSE”), Vermilion is required to comply with all applicable Canadian requirements adopted by the Canadian Securities Administrators and the TSX, and applicable rules for foreign private issuers adopted by the U.S. Securities and Exchange Commission that give effect to the provisions of the Sarbanes-Oxley Act of 2002.
Our corporate governance practices also incorporate many “best practices” derived from those required to be followed by US domestic companies under the NYSE listing standards. We are required by Section 303A.11 of the NYSE Listed Company Manual to identify any significant ways in which our corporate governance practices differ from those required to be followed by US domestic companies under NYSE listing standards. We believe that there are no such significant differences in our corporate governance practices, except as follows:
| ● | Shareholder Approval of Equity Compensation Plans. Section 303A.8 of the NYSE Listed Company Manual requires shareholder approval of all “equity compensation plans” and material revisions to those plans. The definition of “equity compensation plans” covers plans that provide for the delivery of newly issued securities, and also plans which rely on securities reacquired on the market by the issuing company for the purpose of redistribution to employees and directors. The TSX rules provide that equity compensation plans and material amendments thereto require shareholder approval only if they involve newly issued securities and the amendments are not otherwise addressed in the plan’s amendment procedures. In addition, the TSX rules require that every three years after institution, all unallocated options, rights or other entitlements under equity compensation plans which do not have a fixed maximum aggregate of securities issuable must be approved by shareholders. Vermilion follows the TSX rules with respect to shareholder approval of equity compensation plans and material revisions to those plans. |
Disclosure Controls and Procedures
Our officers have established and maintained disclosure controls and procedures and evaluated the effectiveness of these controls in conjunction with our filings.
As of December 31, 2022, we have evaluated the effectiveness of the design and operation of our disclosure controls and procedures. Based on this evaluation, the Chief Executive Officer and the Chief Financial Officer have concluded and certified that our disclosure controls and procedures are effective.
Internal Control Over Financial Reporting
A company's internal control over financial reporting is a process to provide reasonable assurance regarding the reliability of financial reporting and the preparation of financial statements for external purposes in accordance with generally accepted accounting principles. A company's internal control over financial reporting includes those policies and procedures that (1) pertain to the maintenance of records that, in reasonable detail, accurately and fairly reflect the transactions of the company; (2) provide reasonable assurance that transactions are recorded as necessary to permit preparation of financial statements in accordance with generally accepted accounting principles, and that receipts and expenditures of the company are being made only in accordance with authorizations of management and directors of the company; and (3) provide reasonable assurance regarding prevention or timely detection of unauthorized acquisition, use, or disposition of the company's assets that could have a material effect on the financial statements.
Vermilion Energy Inc. ■ Page 42 ■ 2022 Management's Discussion and Analysis
The Chief Executive Officer and the Chief Financial Officer of Vermilion have assessed the effectiveness of Vermilion’s internal control over financial reporting as defined in Rule 13a-15 under the US Securities Exchange Act of 1934 and as defined in Canada by National Instrument 52-109, Certification of Disclosure in Issuers’ Annual and Interim Filings. The assessment was based on the framework in Internal Control – Integrated Framework (2013) issued by the Committee of Sponsoring Organizations of the Treadway Commission. The Chief Executive Officer and the Chief Financial Officer of Vermilion have concluded that Vermilion’s internal control over financial reporting was effective as of December 31, 2022. The effectiveness of Vermilion’s internal control over financial reporting as of December 31, 2022 has been audited by Deloitte LLP, as reflected in their report included in the 2022 audited annual financial statements filed with the US Securities and Exchange Commission. No changes were made to Vermilion’s internal control over financial reporting during the year ended December 31, 2022, that have materially affected, or are reasonably likely to materially affect, the internal controls over financial reporting.
Vermilion has limited the scope of design controls and procedures ("DC&P") and internal controls over financial reporting to exclude controls, policies
and procedures of Leucrotta Exploration Inc., which was acquired on May 31, 2022. The scope limitation is in accordance with section 3.3(1)(b) of NI 52-109 which allows an issuer to limit the design of DC&P and ICFR to exclude controls, policies, and procedures of a business that the issuer acquired not more than 365 days before the end of the fiscal period.
The table below presents the summary financial information of Leucrotta Exploration Inc. included in Vermilion's financial statements as at and for the year ended December 31, 2022:
| | |
($M) |
| As at Dec 31, 2022 |
Non-current assets |
| 659,047 |
Non-current liabilities |
| 100,697 |
Net assets |
| 558,350 |
| | |
($M) |
| Year Ended Dec 31, 2022 |
Revenue net of royalties |
| 55,696 |
Net earnings |
| 17,055 |
Vermilion Energy Inc. ■ Page 43 ■ 2022 Management's Discussion and Analysis
Supplemental Table 1: Netbacks
The following table includes financial statement information on a per unit basis by business unit. Liquids includes crude oil, condensate, and NGLs. Natural gas sales volumes have been converted on a basis of six thousand cubic feet of natural gas to one barrel of oil equivalent.
| | | | | | | | | | | | | | | | |
|
| |
| Q4 2022 |
| |
| |
| 2022 |
|
|
| Q4 2021 |
| 2021 |
| | Liquids | | Natural Gas | | Total | | Liquids | | Natural Gas | | Total | | Total | | Total |
| | $/bbl | | $/mcf | | $/boe | | $/bbl | | $/mcf | | $/boe | | $/boe | | $/boe |
Canada |
|
|
|
|
|
|
|
|
|
|
|
|
|
|
|
|
Sales |
| 90.58 |
| 5.96 |
| 65.13 |
| 99.07 |
| 6.07 |
| 70.33 |
| 59.16 |
| 47.54 |
Royalties |
| (14.09) |
| (0.16) |
| (7.99) |
| (16.56) |
| (0.47) |
| (10.26) |
| (8.10) |
| (5.99) |
Transportation |
| (3.10) |
| (0.36) |
| (2.66) |
| (2.92) |
| (0.28) |
| (2.35) |
| (2.00) |
| (2.04) |
Operating |
| (17.05) |
| (1.41) |
| (13.05) |
| (16.30) |
| (1.37) |
| (12.60) |
| (11.96) |
| (11.35) |
Operating netback |
| 56.34 |
| 4.03 |
| 41.43 |
| 63.29 |
| 3.95 |
| 45.12 |
| 37.10 |
| 28.16 |
General and administration |
| |
| |
| (1.37) |
| |
| |
| (1.50) |
| (0.71) |
| (0.97) |
Fund flows from operations ($/boe) |
|
|
| |
| 40.06 |
|
|
| |
| 43.62 |
| 36.39 |
| 27.19 |
United States |
|
|
|
|
|
|
|
|
|
|
|
|
|
|
|
|
Sales |
| 96.51 |
| 6.00 |
| 83.51 |
| 102.22 |
| 6.36 |
| 87.46 |
| 67.18 |
| 62.98 |
Royalties |
| (26.18) |
| (1.85) |
| (22.94) |
| (27.00) |
| (1.88) |
| (23.38) |
| (19.60) |
| (17.23) |
Transportation |
| (0.23) |
| — |
| (0.18) |
| (0.42) |
| — |
| (0.33) |
| (0.61) |
| (0.75) |
Operating |
| (17.98) |
| (2.75) |
| (17.66) |
| (14.59) |
| (2.29) |
| (14.40) |
| (9.22) |
| (9.52) |
Operating netback |
| 52.12 |
| 1.40 |
| 42.73 |
| 60.21 |
| 2.19 |
| 49.35 |
| 37.75 |
| 35.48 |
General and administration |
| |
| |
| (4.28) |
| |
| |
| (3.08) |
| (3.10) |
| (2.56) |
Fund flows from operations ($/boe) |
| |
| |
| 38.45 |
| |
| |
| 46.27 |
| 34.65 |
| 32.92 |
France |
|
|
|
|
|
|
|
|
|
|
|
|
|
|
|
|
Sales |
| 119.68 |
| — |
| 119.68 |
| 132.90 |
| — |
| 132.90 |
| 100.18 |
| 88.15 |
Royalties |
| (14.27) |
| — |
| (14.28) |
| (14.67) |
| — |
| (14.68) |
| (12.77) |
| (11.89) |
Transportation |
| (7.05) |
| — |
| (7.05) |
| (7.31) |
| — |
| (7.31) |
| (8.25) |
| (8.36) |
Operating |
| (19.41) |
| — |
| (19.41) |
| (20.94) |
| — |
| (20.94) |
| (17.88) |
| (16.46) |
Operating netback |
| 78.95 |
| — |
| 78.94 |
| 89.98 |
| — |
| 89.97 |
| 61.28 |
| 51.44 |
General and administration |
| |
| |
| (7.73) |
| |
| |
| (5.98) |
| (3.02) |
| (3.46) |
Current income taxes |
| |
| |
| (7.69) |
| |
| |
| (10.87) |
| (4.12) |
| 2.88 |
Fund flows from operations ($/boe) |
| |
| |
| 63.52 |
| |
| |
| 73.12 |
| 54.14 |
| 50.86 |
Netherlands |
|
|
|
|
|
|
|
|
|
|
|
|
|
|
|
|
Sales |
| (6.47) |
| 47.47 |
| 281.75 |
| 87.13 |
| 47.04 |
| 279.87 |
| 205.17 |
| 110.47 |
Royalties |
| — |
| (0.20) |
| (1.21) |
| — |
| (0.04) |
| (0.25) |
| (0.52) |
| (0.33) |
Operating |
| — |
| (4.45) |
| (26.44) |
| — |
| (3.85) |
| (22.82) |
| (14.20) |
| (13.17) |
Operating netback |
| (6.47) |
| 42.82 |
| 254.10 |
| 87.13 |
| 43.15 |
| 256.80 |
| 190.45 |
| 96.97 |
General and administration |
| |
| |
| (4.75) |
| |
| |
| (2.12) |
| (0.88) |
| (0.46) |
Current income taxes |
| |
| |
| (86.02) |
| |
| |
| (74.91) |
| (41.66) |
| (17.40) |
Fund flows from operations ($/boe) |
| |
| |
| 163.33 |
| |
| |
| 179.77 |
| 147.91 |
| 79.11 |
Germany |
|
|
|
|
|
|
|
|
|
|
|
|
|
|
|
|
Sales |
| 114.67 |
| 43.24 |
| 218.13 |
| 128.00 |
| 43.84 |
| 231.34 |
| 164.96 |
| 98.06 |
Royalties |
| (2.64) |
| (2.52) |
| (11.54) |
| (2.66) |
| (2.09) |
| (10.21) |
| (2.29) |
| (2.12) |
Transportation |
| (13.67) |
| (0.61) |
| (6.53) |
| (10.69) |
| (0.47) |
| (4.69) |
| (5.22) |
| (4.73) |
Operating |
| (17.53) |
| (4.42) |
| (23.96) |
| (19.57) |
| (3.35) |
| (19.96) |
| (18.41) |
| (20.18) |
Operating netback |
| 80.83 |
| 35.69 |
| 176.10 |
| 95.08 |
| 37.93 |
| 196.48 |
| 139.04 |
| 71.03 |
General and administration |
| |
| |
| (5.36) |
| |
| |
| (3.34) |
| (3.80) |
| (3.91) |
Current income taxes | | | | | | (3.53) | | | | | | (15.15) | | — | | — |
Fund flows from operations ($/boe) |
| |
| |
| 167.21 |
| |
| |
| 177.99 |
| 135.24 |
| 67.12 |
Ireland |
|
|
|
|
|
|
|
|
|
|
|
|
|
|
|
|
Sales |
| — |
| 27.02 |
| 162.16 |
| — |
| 32.34 |
| 194.05 |
| 236.78 |
| 120.51 |
Transportation |
| — |
| (0.31) |
| (1.88) |
| — |
| (0.36) |
| (2.14) |
| (2.03) |
| (2.36) |
Operating |
| — |
| (1.96) |
| (11.74) |
| — |
| (1.65) |
| (9.92) |
| (8.89) |
| (8.37) |
Operating netback |
| — |
| 24.75 |
| 148.54 |
| — |
| 30.33 |
| 181.99 |
| 225.86 |
| 109.78 |
General and administration |
| |
| |
| (0.78) |
| |
| |
| 0.07 |
| (0.81) |
| 0.01 |
Fund flows from operations ($/boe) | | | | | | 147.76 | | | | | | 182.06 | | 225.05 | | 109.79 |
Vermilion Energy Inc. ■ Page 44 ■ 2022 Management's Discussion and Analysis
| | | | | | | | | | | | | | | | |
| | | | Q4 2022 | | | | | | 2022 | | |
| Q4 2021 |
| 2021 |
|
| Liquids |
| Natural Gas |
| Total |
| Liquids |
| Natural Gas |
| Total |
| Total |
| Total |
| | $/bbl | | $/mcf | | $/boe | | $/bbl | | $/mcf | | $/boe | | $/boe | | $/boe |
Australia | |
|
|
| |
|
|
| |
| |
| |
| |
|
Sales | | 139.95 |
| — | | 139.95 |
| 148.15 |
| — | | 148.15 | | 112.26 | | 103.01 |
Operating | | (31.23) |
| — | | (31.23) |
| (38.50) |
| — | | (38.50) | | (44.31) | | (36.55) |
PRRT (1) | | (7.40) |
| — | | (7.40) |
| (12.27) |
| — | | (12.27) | | (15.43) | | (11.30) |
Operating netback | | 101.32 |
| — | | 101.32 |
| 97.38 |
| — | | 97.38 | | 52.52 | | 55.16 |
General and administration | | |
| | | (2.93) |
| |
| | | (3.32) | | (3.07) | | (2.49) |
Current income taxes | | |
| | | 3.47 |
| |
| | | 3.36 | | 6.73 | | 4.15 |
Fund flows from operations ($/boe) | | |
| | | 101.86 |
| |
| | | 97.42 | | 56.18 | | 56.82 |
| | | | | | | | | | | | | | | | |
Total Company | |
|
|
| |
|
|
|
|
| |
| |
| |
|
Sales | | 103.54 |
| 17.43 | | 103.99 |
| 110.22 |
| 18.99 | | 111.95 | | 96.82 | | 66.81 |
Realized hedging (loss) gain | | (0.68) |
| (1.90) | | (5.42) |
| (5.82) |
| (3.56) | | (13.07) | | (23.97) | | (10.52) |
Royalties | | (12.69) |
| (0.51) | | (8.43) |
| (15.24) |
| (0.62) | | (9.85) | | (7.43) | | (5.98) |
Transportation | | (3.30) |
| (0.33) | | (2.71) |
| (3.39) |
| (0.26) | | (2.54) | | (2.41) | | (2.48) |
Operating | | (19.62) |
| (2.21) | | (16.81) |
| (18.99) |
| (2.01) | | (15.75) | | (14.24) | | (13.27) |
PRRT (1) | | (1.12) |
| — | | (0.62) |
| (1.11) |
| — | | (0.59) | | (0.70) | | (0.50) |
Operating netback | | 66.13 |
| 12.48 | | 70.00 |
| 65.67 |
| 12.54 | | 70.15 | | 48.07 | | 34.06 |
General and administration | | |
| | | (1.65) |
| |
| | | (1.86) | | (2.20) | | (1.70) |
Interest expense | | |
| | | (2.78) |
| |
| | | (2.67) | | (2.06) | | (2.35) |
Realized foreign exchange | | |
| | | 2.33 |
| |
| | | 0.49 | | (0.30) | | (0.21) |
Other income | | |
| | | (0.14) |
| |
| | | 0.42 | | 1.29 | | 0.71 |
Corporate income taxes | | |
| | | (5.18) |
| |
| | | (6.70) | | (4.07) | | (0.97) |
Windfall taxes | | | | | | (27.50) | | | | | | (7.18) | | — | | — |
Fund flows from operations ($/boe) | | |
| | | 35.08 |
| |
| | | 52.65 | | 40.73 | | 29.54 |
(1)Vermilion considers Australian PRRT to be an operating item and, accordingly, has included PRRT in the calculation of operating netbacks. Current income taxes presented above excludes PRRT.
Vermilion Energy Inc. ■ Page 45 ■ 2022 Management's Discussion and Analysis
Supplemental Table 2: Hedges
The prices in these tables may represent the weighted averages for several contracts with foreign currency amounts translated to the disclosure currency using forward rates as at the month-end date. The weighted average price for the portfolio of options listed below may not have the same payoff profile as the individual contracts. As such, the presentation of the weighted average prices is purely for indicative purposes.
The following tables outline Vermilion’s outstanding risk management positions as at December 31, 2022:
| | | | | | | | | | | | | | | | | | | | | | | | |
| | | | | | | | | | | | | | | | | | | | | | | | Weighted |
|
|
|
|
|
| Daily |
| Weighted |
|
|
| Weighted |
|
|
| Weighted |
|
|
| Weighted |
| Daily |
| Average |
| | | | | | Bought | | Average | | Daily | | Average | | Daily | | Average | | Daily | | Average | | Bought | | Bought |
| | | | | | Put | | Bought Put | | Sold Call | | Sold Call | | Sold Put | | Sold Put | | Sold Swap | | Sold Swap | | Swap | | Swap |
| | Unit | | Currency | | Volume | | Price | | Volume | | Price | | Volume | | Price | | Volume | | Price | | Volume | | Price |
AECO |
|
|
|
|
|
|
|
|
|
|
|
|
|
|
|
|
|
|
|
|
|
|
|
|
Q1 2023 | | mcf |
| CAD |
| 4,739 |
| 3.69 |
| 4,739 |
| 7.70 |
| — |
| — |
| 28,435 |
| 4.95 |
| — |
| — |
Q2 2023 |
| mcf |
| CAD |
| — |
| — |
| — |
| — |
| — |
| — |
| 14,217 |
| 4.19 |
| — |
| — |
Q3 2023 |
| mcf |
| CAD |
| — |
| — |
| — |
| — |
| — |
| — |
| 14,217 |
| 4.19 |
| — |
| — |
Q4 2023 |
| mcf |
| CAD |
| — |
| — |
| — |
| — |
| — |
| — |
| 4,791 |
| 4.19 |
| — |
| — |
AECO Basis (AECO less NYMEX Henry Hub) |
|
|
|
|
|
|
|
|
|
|
|
|
|
|
|
|
|
|
|
|
|
|
|
|
Q2 2023 |
| mcf |
| USD |
| — |
| — |
| — |
| — |
| — |
| — |
| 23,000 |
| (1.13) |
| — |
| — |
Q3 2023 |
| mcf |
| USD |
| — |
| — |
| — |
| — |
| — |
| — |
| 23,000 |
| (1.13) |
| — |
| — |
Q4 2023 |
| mcf |
| USD |
| — |
| — |
| — |
| — |
| — |
| — |
| 7,750 |
| (1.13) |
| — |
| — |
NYMEX Henry Hub |
|
|
|
|
|
|
|
|
|
|
|
|
|
|
|
|
|
|
|
|
|
|
|
|
Q1 2023 |
| mcf |
| USD |
| 24,000 |
| 4.00 |
| 24,000 |
| 8.44 |
| — |
| — |
| — |
| — |
| — |
| — |
Q2 2023 |
| mcf |
| USD |
| 5,000 |
| 4.00 |
| 5,000 |
| 8.75 |
| — |
| — |
| — |
| — |
| — |
| — |
Q3 2023 |
| mcf |
| USD |
| 5,000 |
| 4.00 |
| 5,000 |
| 8.75 |
| — |
| — |
| — |
| — |
| — |
| — |
Q4 2023 |
| mcf |
| USD |
| 1,685 |
| 4.00 |
| 1,685 |
| 8.75 |
| — |
| — |
| — |
| — |
| — |
| — |
| | | | | | | | | | | | | | | | | | | | | | | | |
| | | | | | | | | | | | | | | | | | | | | | | | Weighted |
|
|
|
|
|
|
|
| Weighted |
| Daily |
| Weighted |
|
|
| Weighted |
|
|
| Weighted |
| Daily |
| Average |
| | | | | | Daily | | Average | | Sold | | Average | | Daily | | Average | | Daily | | Average | | Bought | | Bought |
| | | | | | Bought Put | | Bought Put | | Call | | Sold Call | | Sold Put | | Sold Put | | Sold Swap | | Sold Swap | | Swap | | Swap |
| | Unit | | Currency | | Volume | | Price | | Volume | | Price | | Volume | | Price | | Volume | | Price | | Volume | | Price |
NBP |
|
|
|
|
|
|
|
|
|
|
|
|
|
|
|
|
|
|
|
|
|
|
|
|
Q1 2023 |
| mcf | | EUR | | 18,426 | | 11.76 | | 18,426 | | 19.54 | | 14,740 | | 4.10 | | — | | — | | — | | — |
Q2 2023 |
| mcf | | EUR | | 7,370 | | 11.48 | | 7,370 | | 17.46 | | 4,913 | | 4.40 | | — | | — | | — | | — |
Q3 2023 |
| mcf | | EUR | | 2,457 | | 22.71 | | 2,457 | | 35.90 | | — | | — | | — | | — | | — | | — |
Q1 2024 |
| mcf | | EUR | | 4,913 | | 41.03 | | 4,913 | | 84.26 | | — | | — | | — | | — | | — | | — |
TTF |
|
|
|
|
|
|
|
|
|
|
|
|
|
|
|
|
|
|
|
|
| | | |
Q1 2023 |
| mcf |
| EUR |
| 14,740 |
| 24.01 |
| 14,740 |
| 46.12 |
| 2,457 |
| 3.52 |
| — |
| — |
| — |
| — |
Q2 2023 |
| mcf |
| EUR |
| 19,654 |
| 34.53 |
| 19,654 |
| 53.21 |
| — |
| — |
| — |
| — |
| — |
| — |
Q3 2023 |
| mcf | | EUR | | 19,654 | | 34.53 | | 19,654 | | 53.21 | | — | | — | | — | | — | | — | | — |
Q4 2023 |
| mcf | | EUR | | 12,284 | | 44.84 | | 12,284 | | 84.99 | | — | | — | | 3,685 | | 67.41 | | — | | — |
Q1 2024 |
| mcf | | EUR | | 31,938 | | 40.69 | | 31,938 | | 78.00 | | — | | — | | 3,685 | | 67.41 | | — | | — |
Q2 2024 |
| mcf | | EUR | | 3,593 | | 37.56 | | 3,593 | | 74.66 | | — | | — | | — | | — | | — | | — |
Q3 2024 |
| mcf | | EUR | | 3,593 | | 37.56 | | 3,593 | | 74.66 | | — | | — | | — | | — | | — | | — |
| | | | | | | | |
VET Equity Swaps |
| |
| Initial Share Price | | |
| Share Volume |
Swap |
| Jan 2020 - Apr 2023 |
| 20.9788 |
| CAD |
| 2,250,000 |
Swap |
| Jan 2020 - Jul 2024 |
| 22.4587 |
| CAD |
| 1,500,000 |
| | | | | | | | | | | | | | |
Cross Currency Interest Rate |
| |
| Receive |
| Receive Rate |
| Pay Notional Amount |
| |
| Pay Rate | ||
Swap |
| January 2023 |
| 111,600,000 |
| USD |
| SOFR + 1.35% |
| 150,000,000 |
| CAD |
| CDOR + 0.88% |
Vermilion Energy Inc. ■ Page 46 ■ 2022 Management's Discussion and Analysis
Supplemental Table 3: Capital Expenditures and Acquisitions
| | | | | | | | |
By classification ($M) |
| Q4 2022 |
| Q4 2021 |
| 2022 |
| 2021 |
Drilling and development |
| 157,849 |
| 119,002 |
| 528,056 |
| 339,390 |
Exploration and evaluation |
| 11,456 |
| 26,805 |
| 23,761 |
| 35,406 |
Capital expenditures |
| 169,305 |
| 145,807 |
| 551,817 |
| 374,796 |
| | | | | | | | |
Acquisitions |
| 3,594 |
| 26,848 |
| 510,309 |
| 131,628 |
Acquisition of securities | | 964 | | — | | 23,282 | | — |
Contingent consideration | | — | | — | | — | | 330 |
Working capital assumed | | — | | (3,215) | | 6,122 | | (993) |
Acquisitions |
| 4,558 |
| 23,633 |
| 539,713 |
| 130,965 |
| | | | | | | | |
By category ($M) |
| Q4 2022 |
| Q4 2021 |
| 2022 |
| 2021 |
Drilling, completion, new well equip and tie-in, workovers and recompletions |
| 112,755 |
| 97,833 |
| 418,284 |
| 252,734 |
Production equipment and facilities |
| 49,286 |
| 30,919 |
| 105,722 |
| 93,901 |
Seismic, studies, land and other |
| 7,264 |
| 17,055 |
| 27,811 |
| 28,161 |
Capital expenditures |
| 169,305 |
| 145,807 |
| 551,817 |
| 374,796 |
Acquisitions |
| 4,558 |
| 23,633 |
| 539,713 |
| 130,965 |
Total capital expenditures and acquisitions |
| 173,863 |
| 169,440 |
| 1,091,530 |
| 505,761 |
| | | | | | | | |
Capital expenditures by country ($M) |
| Q4 2022 |
| Q4 2021 |
| 2022 |
| 2021 |
Canada |
| 111,483 |
| 86,051 |
| 275,203 |
| 190,242 |
United States |
| 2,409 |
| 3,592 |
| 63,353 |
| 32,540 |
France |
| 15,704 |
| 15,030 |
| 44,252 |
| 39,708 |
Netherlands |
| 14,232 |
| 12,432 |
| 21,652 |
| 27,037 |
Germany |
| 10,089 |
| 10,883 |
| 26,157 |
| 20,307 |
Ireland |
| 1,323 |
| 105 |
| 3,030 |
| 1,261 |
Australia |
| 5,753 |
| 8,755 |
| 95,173 |
| 34,785 |
Central and Eastern Europe |
| 8,312 |
| 8,959 |
| 22,997 |
| 28,916 |
Total capital expenditures |
| 169,305 |
| 145,807 |
| 551,817 |
| 374,796 |
| | | | | | | | |
Acquisitions by country ($M) |
| Q4 2022 |
| Q4 2021 |
| 2022 |
| 2021 |
Canada |
| 1,985 |
| 1,191 |
| 531,348 |
| 1,699 |
United States |
| — |
| 78 |
| 1,075 |
| 94,248 |
Netherlands |
| — |
| — |
| 707 |
| — |
Germany |
| (11) |
| 20,485 |
| 3,857 |
| 33,139 |
Ireland | | 2,584 | | 1,879 | | 2,726 | | 1,879 |
Total acquisitions |
| 4,558 |
| 23,633 |
| 539,713 |
| 130,965 |
Vermilion Energy Inc. ■ Page 47 ■ 2022 Management's Discussion and Analysis
Supplemental Table 4: Production
| | | | | | | | | | | | | | | | | | | | | | | | |
|
| Q4/22 |
| Q3/22 |
| Q2/22 |
| Q1/22 |
| Q4/21 |
| Q3/21 |
| Q2/21 |
| Q1/21 |
| Q4/20 |
| Q3/20 |
| Q2/20 |
| Q1/20 |
Canada |
|
|
|
|
|
|
|
|
|
|
|
|
|
|
|
|
|
|
|
|
|
|
|
|
Light and medium crude oil (bbls/d) |
| 17,448 |
| 16,835 |
| 17,042 |
| 15,980 |
| 16,388 |
| 16,809 |
| 16,868 |
| 17,767 |
| 19,301 |
| 19,847 |
| 22,545 |
| 22,767 |
Condensate (1) (bbls/d) |
| 4,525 |
| 4,204 |
| 4,873 |
| 4,892 |
| 4,785 |
| 4,426 |
| 5,558 |
| 4,556 |
| 4,662 |
| 5,200 |
| 5,047 |
| 4,634 |
Other NGLs (1) (bbls/d) |
| 6,279 |
| 6,870 |
| 7,155 |
| 7,286 |
| 7,073 |
| 6,862 |
| 7,767 |
| 7,016 |
| 7,334 |
| 8,350 |
| 8,248 |
| 6,943 |
NGLs (bbls/d) |
| 10,804 |
| 11,074 |
| 12,028 |
| 12,178 |
| 11,858 |
| 11,288 |
| 13,325 |
| 11,572 |
| 11,996 |
| 13,550 |
| 13,295 |
| 11,577 |
Conventional natural gas (mmcf/d) |
| 146.81 |
| 145.04 |
| 143.94 |
| 140.55 |
| 128.85 |
| 138.42 |
| 146.55 |
| 138.41 |
| 135.27 |
| 155.15 |
| 164.08 |
| 151.16 |
Total (boe/d) |
| 52,720 |
| 52,080 |
| 53,060 |
| 51,584 |
| 49,720 |
| 51,168 |
| 54,618 |
| 52,407 |
| 53,840 |
| 59,256 |
| 63,187 |
| 59,537 |
United States |
|
|
|
|
|
|
|
|
|
|
|
|
|
|
|
|
|
|
|
|
|
|
|
|
Light and medium crude oil (bbls/d) |
| 3,282 |
| 2,824 |
| 2,846 |
| 2,675 |
| 2,647 |
| 3,520 |
| 1,888 |
| 2,322 |
| 2,495 |
| 3,243 |
| 3,971 |
| 2,481 |
Condensate (1) (bbls/d) |
| 36 |
| 35 |
| 40 |
| 24 |
| 26 |
| 2 |
| 2 |
| — |
| 1 |
| 6 |
| 6 |
| 6 |
Other NGLs (1) (bbls/d) |
| 1,218 |
| 1,031 |
| 958 |
| 1,056 |
| 1,388 |
| 1,206 |
| 928 |
| 1,058 |
| 1,294 |
| 1,158 |
| 1,340 |
| 1,079 |
NGLs (bbls/d) |
| 1,254 |
| 1,066 |
| 998 |
| 1,080 |
| 1,414 |
| 1,208 |
| 930 |
| 1,058 |
| 1,295 |
| 1,164 |
| 1,346 |
| 1,085 |
Conventional natural gas (mmcf/d) |
| 7.45 |
| 7.03 |
| 6.74 |
| 7.56 |
| 9.09 |
| 6.75 |
| 5.51 |
| 5.95 |
| 6.87 |
| 7.94 |
| 8.35 |
| 6.72 |
Total (boe/d) |
| 5,779 |
| 5,062 |
| 4,967 |
| 5,014 |
| 5,575 |
| 5,854 |
| 3,736 |
| 4,373 |
| 4,934 |
| 5,730 |
| 6,708 |
| 4,685 |
France |
|
|
|
|
|
|
|
|
|
|
|
|
|
|
|
|
|
|
|
|
|
|
|
|
Light and medium crude oil (bbls/d) |
| 7,247 |
| 6,818 |
| 8,126 |
| 8,389 |
| 8,453 |
| 8,677 |
| 9,013 |
| 9,062 |
| 9,255 |
| 9,347 |
| 7,046 |
| 9,957 |
Total (boe/d) |
| 7,247 |
| 6,818 |
| 8,126 |
| 8,389 |
| 8,453 |
| 8,677 |
| 9,013 |
| 9,062 |
| 9,255 |
| 9,347 |
| 7,046 |
| 9,957 |
Netherlands |
|
|
|
|
|
|
|
|
|
|
|
|
|
|
|
|
|
|
|
|
|
|
|
|
Light and medium crude oil (bbls/d) |
| — |
| — |
| 1 |
| 1 |
| — |
| 6 |
| 1 |
| 6 |
| 1 |
| — |
| 1 |
| 3 |
Condensate (1) (bbls/d) |
| 49 |
| 74 |
| 60 |
| 83 |
| 97 |
| 104 |
| 95 |
| 92 |
| 99 |
| 83 |
| 86 |
| 84 |
NGLs (bbls/d) |
| 49 |
| 74 |
| 60 |
| 83 |
| 97 |
| 104 |
| 95 |
| 92 |
| 99 |
| 83 |
| 86 |
| 84 |
Conventional natural gas (mmcf/d) |
| 27.41 |
| 29.15 |
| 35.22 |
| 39.03 |
| 51.98 |
| 42.48 |
| 37.59 |
| 41.45 |
| 42.95 |
| 46.09 |
| 47.31 |
| 48.33 |
Total (boe/d) |
| 4,617 |
| 4,933 |
| 5,930 |
| 6,589 |
| 8,761 |
| 7,190 |
| 6,362 |
| 7,006 |
| 7,257 |
| 7,764 |
| 7,972 |
| 8,143 |
Germany |
|
|
|
|
|
|
|
|
|
|
|
|
|
|
|
|
|
|
|
|
|
|
|
|
Light and medium crude oil (bbls/d) |
| 1,481 |
| 1,764 |
| 1,331 |
| 1,158 |
| 1,127 |
| 1,043 |
| 1,093 |
| 911 |
| 960 |
| 964 |
| 1,039 |
| 909 |
Conventional natural gas (mmcf/d) |
| 25.86 |
| 26.54 |
| 25.36 |
| 26.95 |
| 18.00 |
| 16.19 |
| 15.60 |
| 13.40 |
| 11.50 |
| 11.25 |
| 13.23 |
| 14.64 |
Total (boe/d) |
| 5,791 |
| 6,187 |
| 5,558 |
| 5,650 |
| 4,127 |
| 3,741 |
| 3,694 |
| 3,144 |
| 2,876 |
| 2,839 |
| 3,244 |
| 3,349 |
Ireland |
|
|
|
|
|
|
|
|
|
|
|
|
|
|
|
|
|
|
|
|
|
|
|
|
Conventional natural gas (mmcf/d) |
| 26.04 |
| 25.74 |
| 27.93 |
| 30.26 |
| 30.12 |
| 22.67 |
| 30.19 |
| 34.14 |
| 34.76 |
| 35.12 |
| 38.57 |
| 41.38 |
Total (boe/d) |
| 4,340 |
| 4,290 |
| 4,655 |
| 5,043 |
| 5,020 |
| 3,778 |
| 5,031 |
| 5,690 |
| 5,793 |
| 5,853 |
| 6,428 |
| 6,896 |
Australia |
|
|
|
|
|
|
|
|
|
|
|
|
|
|
|
|
|
|
|
|
|
|
|
|
Light and medium crude oil (bbls/d) |
| 4,847 |
| 4,763 |
| 2,465 |
| 3,888 |
| 2,742 |
| 4,190 |
| 3,835 |
| 4,489 |
| 3,781 |
| 4,549 |
| 5,299 |
| 4,041 |
Total (boe/d) |
| 4,847 |
| 4,763 |
| 2,465 |
| 3,888 |
| 2,742 |
| 4,190 |
| 3,835 |
| 4,489 |
| 3,781 |
| 4,549 |
| 5,299 |
| 4,041 |
Central and Eastern Europe |
|
|
|
|
|
|
|
|
|
|
|
|
|
|
|
|
|
|
|
|
|
|
|
|
Conventional natural gas (mmcf/d) |
| 0.67 |
| 0.63 |
| 0.64 |
| 0.34 |
| 0.12 |
| 0.22 |
| 0.28 |
| 0.63 |
| 0.67 |
| 0.80 |
| 2.89 |
| 3.27 |
Total (boe/d) |
| 111 |
| 104 |
| 106 |
| 57 |
| 20 |
| 36 |
| 46 |
| 104 |
| 111 |
| 132 |
| 483 |
| 546 |
Consolidated |
|
|
|
|
|
|
|
|
|
|
|
|
|
|
|
|
|
|
|
|
|
|
|
|
Light and medium crude oil (bbls/d) |
| 34,305 |
| 33,003 |
| 31,811 |
| 32,091 |
| 31,356 |
| 34,245 |
| 32,698 |
| 34,556 |
| 35,793 |
| 37,951 |
| 39,899 |
| 40,157 |
Condensate (1) (bbls/d) |
| 4,610 |
| 4,312 |
| 4,973 |
| 4,999 |
| 4,908 |
| 4,532 |
| 5,656 |
| 4,648 |
| 4,762 |
| 5,289 |
| 5,142 |
| 4,724 |
Other NGLs (1) (bbls/d) |
| 7,497 |
| 7,901 |
| 8,113 |
| 8,342 |
| 8,461 |
| 8,068 |
| 8,695 |
| 8,074 |
| 8,627 |
| 9,509 |
| 9,588 |
| 8,022 |
NGLs (bbls/d) |
| 12,107 |
| 12,213 |
| 13,086 |
| 13,341 |
| 13,369 |
| 12,600 |
| 14,351 |
| 12,722 |
| 13,389 |
| 14,798 |
| 14,730 |
| 12,746 |
Conventional natural gas (mmcf/d) |
| 234.23 |
| 234.12 |
| 239.83 |
| 244.69 |
| 238.16 |
| 226.73 |
| 235.72 |
| 233.98 |
| 232.00 |
| 256.34 |
| 274.42 |
| 265.51 |
Total (boe/d) |
| 85,450 |
| 84,237 |
| 84,868 |
| 86,213 |
| 84,417 |
| 84,633 |
| 86,335 |
| 86,276 |
| 87,848 |
| 95,471 |
| 100,366 |
| 97,154 |
Vermilion Energy Inc. ■ Page 48 ■ 2022 Management's Discussion and Analysis
| | | | | | | | | | | | |
|
| 2022 |
| 2021 |
| 2020 |
| 2019 |
| 2018 |
| 2017 |
Canada |
| | | | |
|
|
|
|
|
|
|
Light and medium crude oil (bbls/d) |
| 16,830 | | 16,954 | | 21,106 |
| 23,971 |
| 17,400 |
| 6,015 |
Condensate (1) (bbls/d) |
| 4,621 | | 4,831 | | 4,886 |
| 4,295 |
| 3,754 |
| 3,036 |
Other NGLs (1) (bbls/d) |
| 6,895 | | 7,179 | | 7,719 |
| 6,988 |
| 5,914 |
| 4,144 |
NGLs (bbls/d) |
| 11,516 | | 12,010 | | 12,605 |
| 11,283 |
| 9,668 |
| 7,180 |
Conventional natural gas (mmcf/d) |
| 144.10 | | 138.03 | | 151.38 |
| 148.35 |
| 129.37 |
| 97.89 |
Total (boe/d) |
| 52,364 | | 51,968 | | 58,942 |
| 59,979 |
| 48,630 |
| 29,510 |
United States |
| | | | |
|
|
|
|
|
|
|
Light and medium crude oil (bbls/d) |
| 2,908 | | 2,597 | | 3,046 |
| 2,514 |
| 1,069 |
| 662 |
Condensate (1) (bbls/d) |
| 34 | | 8 | | 5 |
| 18 |
| 8 |
| 4 |
Other NGLs (1) (bbls/d) |
| 1,066 | | 1,146 | | 1,218 |
| 996 |
| 452 |
| 50 |
NGLs (bbls/d) |
| 1,100 | | 1,154 | | 1,223 |
| 1,014 |
| 460 |
| 54 |
Conventional natural gas (mmcf/d) |
| 7.20 | | 6.84 | | 7.47 |
| 6.89 |
| 2.78 |
| 0.39 |
Total (boe/d) |
| 5,207 | | 4,890 | | 5,514 |
| 4,675 |
| 1,992 |
| 781 |
France |
| | | | |
|
|
|
|
|
|
|
Light and medium crude oil (bbls/d) |
| 7,639 | | 8,799 | | 8,903 |
| 10,435 |
| 11,362 |
| 11,084 |
Conventional natural gas (mmcf/d) |
| — | | — | | — |
| 0.19 |
| 0.21 |
| — |
Total (boe/d) |
| 7,639 | | 8,799 | | 8,903 |
| 10,467 |
| 11,396 |
| 11,084 |
Netherlands |
| | | | |
|
|
|
|
|
|
|
Light and medium crude oil (bbls/d) |
| — | | 3 | | 1 |
| 3 |
| — |
| — |
Condensate (1) (bbls/d) |
| 66 | | 97 | | 88 |
| 88 |
| 90 |
| 90 |
NGLs (bbls/d) |
| 66 | | 97 | | 88 |
| 88 |
| 90 |
| 90 |
Conventional natural gas (mmcf/d) |
| 32.66 | | 43.40 | | 46.16 |
| 49.10 |
| 46.13 |
| 40.54 |
Total (boe/d) |
| 5,510 | | 7,334 | | 7,782 |
| 8,274 |
| 7,779 |
| 6,847 |
Germany |
| | | | |
|
|
|
|
|
|
|
Light and medium crude oil (bbls/d) |
| 1,435 | | 1,044 | | 968 |
| 917 |
| 1,004 |
| 1,060 |
Conventional natural gas (mmcf/d) |
| 26.18 | | 15.81 | | 12.65 |
| 15.31 |
| 15.66 |
| 19.39 |
Total (boe/d) |
| 5,798 | | 3,679 | | 3,076 |
| 3,468 |
| 3,614 |
| 4,291 |
Ireland |
| | | | |
|
|
|
|
|
|
|
Conventional natural gas (mmcf/d) |
| 27.48 | | 29.25 | | 37.44 |
| 46.57 |
| 55.17 |
| 58.43 |
Total (boe/d) |
| 4,579 | | 4,875 | | 6,240 |
| 7,762 |
| 9,195 |
| 9,737 |
Australia |
| | | | |
|
|
|
|
|
|
|
Light and medium crude oil (bbls/d) |
| 3,995 | | 3,810 | | 4,416 |
| 5,662 |
| 4,494 |
| 5,770 |
Total (boe/d) |
| 3,995 | | 3,810 | | 4,416 |
| 5,662 |
| 4,494 |
| 5,770 |
Central and Eastern Europe |
| | | | |
|
|
|
|
|
|
|
Conventional natural gas (mmcf/d) |
| 0.57 | | 0.31 | | 1.90 |
| 0.42 |
| 1.02 |
| — |
Total (boe/d) |
| 95 | | 51 | | 317 |
| 70 |
| 169 |
| — |
Consolidated |
| | | | |
|
|
|
|
|
|
|
Light and medium crude oil (bbls/d) |
| 32,809 | | 33,208 | | 38,441 |
| 43,502 |
| 35,329 |
| 24,591 |
Condensate (1) (bbls/d) |
| 4,721 | | 4,936 | | 4,980 |
| 4,400 |
| 3,853 |
| 3,130 |
Other NGLs (1) (bbls/d) |
| 7,961 | | 8,325 | | 8,937 |
| 7,984 |
| 6,366 |
| 4,194 |
NGLs (bbls/d) |
| 12,682 | | 13,261 | | 13,917 |
| 12,384 |
| 10,219 |
| 7,324 |
Conventional natural gas (mmcf/d) |
| 238.18 | | 233.64 | | 256.99 |
| 266.82 |
| 250.33 |
| 216.64 |
Total (boe/d) |
| 85,187 | | 85,408 | | 95,190 |
| 100,357 |
| 87,270 |
| 68,021 |
(1)Under National Instrument 51-101 "Standards of Disclosure for Oil and Gas Activities", disclosure of production volumes should include segmentation by product type as defined in the instrument. This table provides a reconciliation from "crude oil and condensate", "NGLs" and "natural gas" to the product types. In this report, references to "crude oil" and "light and medium crude oil" mean "light crude oil and medium crude oil" and references to "natural gas" mean "conventional natural gas". Production volumes reported are based on quantities as measured at the first point of sale.
Vermilion Energy Inc. ■ Page 49 ■ 2022 Management's Discussion and Analysis
Supplemental Table 5: Segmented Financial Results
| | | | | | | | | | | | | | | | | | |
|
| Three Months Ended December 31, 2022 | ||||||||||||||||
($M) | | Canada |
| USA |
| France |
| Netherlands |
| Germany |
| Ireland |
| Australia |
| Corporate |
| Total |
Drilling and development |
| 111,483 |
| 2,409 |
| 15,704 |
| 13,897 |
| 9,844 |
| 1,323 |
| 5,753 |
| (2,564) |
| 157,849 |
Exploration and evaluation |
| — |
| — |
| — |
| 335 |
| 245 |
| — |
| — |
| 10,876 |
| 11,456 |
Crude oil and condensate sales |
| 213,382 |
| 34,786 |
| 77,910 |
| (29) |
| 18,153 |
| 15 |
| 95,420 |
| — |
| 439,637 |
NGL sales |
| 22,043 |
| 5,496 |
| — |
| — |
| — |
| — |
| — |
| — |
| 27,539 |
Natural gas sales |
| 80,472 |
| 4,116 |
| — |
| 119,697 |
| 102,858 |
| 64,738 |
| — |
| 3,636 |
| 375,517 |
Sales of purchased commodities |
| — |
| — |
| — |
| — |
| — |
| — |
| — |
| 50,215 |
| 50,215 |
Royalties |
| (38,747) |
| (12,198) |
| (9,294) |
| (512) |
| (6,403) |
| — |
| — |
| (1,149) |
| (68,303) |
Revenue from external customers |
| 277,150 |
| 32,200 |
| 68,616 |
| 119,156 |
| 114,608 |
| 64,753 |
| 95,420 |
| 52,702 |
| 824,605 |
Purchased commodities |
| — |
| — |
| — |
| — |
| — |
| — |
| — |
| (50,215) |
| (50,215) |
Transportation |
| (12,919) |
| (95) |
| (4,589) |
| — |
| (3,621) |
| (752) |
| — |
| — |
| (21,976) |
Operating |
| (63,305) |
| (9,389) |
| (12,638) |
| (11,229) |
| (13,292) |
| (4,687) |
| (21,291) |
| (416) |
| (136,247) |
General and administration |
| (6,661) |
| (2,274) |
| (5,033) |
| (2,016) |
| (2,972) |
| (313) |
| (2,000) |
| 7,925 |
| (13,344) |
PRRT |
| — |
| — |
| — |
| — |
| — |
| — |
| (5,045) |
| — |
| (5,045) |
Corporate income taxes |
| (10) |
| — |
| (5,008) |
| (36,536) |
| (1,959) |
| — |
| 2,366 |
| (811) |
| (41,958) |
Windfall taxes |
| — |
| — |
| — |
| — |
| — |
| — |
| — |
| (222,859) |
| (222,859) |
Interest expense |
| — |
| — |
| — |
| — |
| — |
| — |
| — |
| (22,506) |
| (22,506) |
Realized loss on derivative instruments | | — | | — | | — | | — | | — | | — | | — | | (43,940) | | (43,940) |
Realized foreign exchange gain |
| — |
| — |
| — |
| — |
| — |
| — |
| — |
| 18,845 |
| 18,845 |
Realized other expense |
| — |
| — |
| — |
| — |
| — |
| — |
| — |
| (1,140) |
| (1,140) |
Fund flows from operations |
| 194,255 |
| 20,442 |
| 41,348 |
| 69,375 |
| 92,764 |
| 59,001 |
| 69,450 |
| (262,415) |
| 284,220 |
| | | | | | | | | | | | | | | | | | |
|
| Year Ended December 31, 2022 | ||||||||||||||||
($M) | | Canada |
| USA |
| France |
| Netherlands |
| Germany |
| Ireland |
| Australia |
| Corporate |
| Total |
Total assets |
| 3,612,487 |
| 618,116 |
| 823,544 |
| 240,276 |
| 398,612 |
| 465,643 |
| 249,253 |
| 583,127 |
| 6,991,058 |
Drilling and development |
| 275,203 |
| 63,353 |
| 44,250 |
| 21,629 |
| 25,087 |
| 3,030 |
| 95,173 |
| 331 |
| 528,056 |
Exploration and evaluation |
| — |
| — |
| 2 |
| 23 |
| 1,070 |
| — |
| — |
| 22,666 |
| 23,761 |
| | | | | | | | | | | | | | | | | | |
Crude oil and condensate sales |
| 910,863 |
| 130,150 |
| 365,431 |
| 2,119 |
| 62,464 |
| 15 |
| 221,187 |
| — |
| 1,692,229 |
NGL sales |
| 114,128 |
| 19,385 |
| — |
| — |
| — |
| — |
| — |
| — |
| 133,513 |
Natural gas sales |
| 319,293 |
| 16,698 |
| — |
| 560,738 |
| 418,796 |
| 324,330 |
| — |
| 10,797 |
| 1,650,652 |
Sales of purchased commodities |
| — |
| — |
| — |
| — |
| — |
| — |
| — |
| 244,834 |
| 244,834 |
Royalties |
| (196,005) |
| (44,427) |
| (40,353) |
| (512) |
| (21,232) |
| — |
| — |
| (3,488) |
| (306,017) |
Revenue from external customers |
| 1,148,279 |
| 121,806 |
| 325,078 |
| 562,345 |
| 460,028 |
| 324,345 |
| 221,187 |
| 252,143 |
| 3,415,211 |
Purchased commodities |
| — |
| — |
| — |
| — |
| — |
| — |
| — |
| (244,834) |
| (244,834) |
Transportation |
| (44,849) |
| (618) |
| (20,100) |
| — |
| (9,751) |
| (3,578) |
| — |
| — |
| (78,896) |
Operating |
| (240,899) |
| (27,372) |
| (57,588) |
| (45,903) |
| (41,523) |
| (16,580) |
| (57,478) |
| (1,691) |
| (489,034) |
General and administration |
| (28,643) |
| (5,863) |
| (16,444) |
| (4,255) |
| (6,949) |
| 122 |
| (4,964) |
| 9,319 |
| (57,677) |
PRRT |
| — |
| — |
| — |
| — |
| — |
| — |
| (18,318) |
| — |
| (18,318) |
Corporate income taxes |
| (10) |
| — |
| (29,889) |
| (150,647) |
| (31,513) |
| — |
| 5,016 |
| (1,110) |
| (208,153) |
Windfall taxes |
| — |
| — |
| — |
| — |
| — |
| — |
| — |
| (222,859) |
| (222,859) |
Interest expense |
| — |
| — |
| — |
| — |
| — |
| — |
| — |
| (82,858) |
| (82,858) |
Realized loss on derivative instruments | | — | | — | | — | | — | | — | | — | | — | | (405,894) | | (405,894) |
Realized foreign exchange gain | | — | | — | | — | | — | | — | | — | | — | | 15,195 | | 15,195 |
Realized other income |
| — |
| — |
| — |
| — |
| — |
| — |
| — |
| 12,982 |
| 12,982 |
Fund flows from operations |
| 833,878 |
| 87,953 |
| 201,057 |
| 361,540 |
| 370,292 |
| 304,309 |
| 145,443 |
| (669,607) |
| 1,634,865 |
Vermilion Energy Inc. ■ Page 50 ■ 2022 Management's Discussion and Analysis
Supplemental Table 6: Operational and Financial Data by Core Region
Production volumes (1)
| | | | | | | | | | | | | | | | | | | | | | | | |
|
| Q4/22 |
| Q3/22 |
| Q2/22 |
| Q1/22 |
| Q4/21 |
| Q3/21 |
| Q2/21 |
| Q1/21 |
| Q4/20 |
| Q3/20 |
| Q2/20 |
| Q1/20 |
North America | |
| |
| |
| |
| |
| |
| | �� | |
| |
| |
| |
| |
|
Crude oil and condensate (bbls/d) |
| 25,291 |
| 23,898 |
| 24,801 |
| 23,571 |
| 23,846 |
| 24,757 |
| 24,316 |
| 24,645 |
| 26,459 |
| 28,296 |
| 31,569 |
| 29,888 |
NGLs (bbls/d) |
| 7,497 |
| 7,901 |
| 8,113 |
| 8,342 |
| 8,461 |
| 8,068 |
| 8,695 |
| 8,074 |
| 8,628 |
| 9,508 |
| 9,588 |
| 8,022 |
Natural gas (mmcf/d) |
| 154.26 |
| 152.07 |
| 150.68 |
| 148.11 |
| 137.93 |
| 145.18 |
| 152.06 |
| 144.36 |
| 142.13 |
| 163.09 |
| 172.43 |
| 157.88 |
Total (boe/d) |
| 58,499 |
| 57,142 |
| 58,027 |
| 56,598 |
| 55,295 |
| 57,022 |
| 58,354 |
| 56,780 |
| 58,774 |
| 64,986 |
| 69,895 |
| 64,222 |
| | | | | | | | | | | | | | | | | | | | | | | | |
International |
|
|
| |
| |
| |
|
|
|
|
|
|
|
|
|
|
|
|
|
|
|
|
Crude oil and condensate (bbls/d) |
| 13,624 |
| 13,419 |
| 11,983 |
| 13,519 |
| 12,419 |
| 14,020 |
| 14,037 |
| 14,560 |
| 14,096 |
| 14,943 |
| 13,471 |
| 14,994 |
Natural gas (mmcf/d) |
| 79.97 |
| 82.05 |
| 89.15 |
| 96.58 |
| 100.22 |
| 81.55 |
| 83.66 |
| 89.62 |
| 89.86 |
| 93.25 |
| 101.99 |
| 107.63 |
Total (boe/d) |
| 26,953 |
| 27,095 |
| 26,840 |
| 29,616 |
| 29,123 |
| 27,612 |
| 27,981 |
| 29,495 |
| 29,073 |
| 30,484 |
| 30,472 |
| 32,932 |
| | | | | | | | | | | | | | | | | | | | | | | | |
Consolidated |
| |
| |
| |
| |
|
|
|
|
|
|
|
|
|
|
|
|
|
|
|
|
Crude oil and condensate (bbls/d) |
| 38,915 |
| 37,315 |
| 36,784 |
| 37,090 |
| 36,264 |
| 38,777 |
| 38,354 |
| 39,204 |
| 40,555 |
| 43,240 |
| 45,041 |
| 44,881 |
NGLs (bbls/d) |
| 7,497 |
| 7,901 |
| 8,113 |
| 8,342 |
| 8,461 |
| 8,068 |
| 8,695 |
| 8,074 |
| 8,627 |
| 9,509 |
| 9,588 |
| 8,022 |
Natural gas (mmcf/d) |
| 234.23 |
| 234.12 |
| 239.83 |
| 244.69 |
| 238.16 |
| 226.73 |
| 235.72 |
| 233.98 |
| 232.00 |
| 256.34 |
| 274.42 |
| 265.51 |
Total (boe/d) |
| 85,450 |
| 84,237 |
| 84,868 |
| 86,213 |
| 84,417 |
| 84,633 |
| 86,335 |
| 86,276 |
| 87,848 |
| 95,471 |
| 100,366 |
| 97,154 |
(1)Please refer to Supplemental Table 4 "Production" for disclosure by product type.
Vermilion Energy Inc. ■ Page 51 ■ 2022 Management's Discussion and Analysis
Sales volumes
| | | | | | | | | | | | | | | | | | | | | | | | |
|
| Q4/22 |
| Q3/22 |
| Q2/22 |
| Q1/22 |
| Q4/21 |
| Q3/21 |
| Q2/21 |
| Q1/21 |
| Q4/20 |
| Q3/20 |
| Q2/20 |
| Q1/20 |
North America | | | | | | | | | | | | | | | | | | | | | | | | |
Crude oil and condensate (bbls/d) |
| 25,291 |
| 23,897 |
| 24,801 |
| 23,571 |
| 23,845 |
| 24,757 |
| 24,316 |
| 24,645 |
| 26,459 |
| 28,297 |
| 31,569 |
| 29,888 |
NGLs (bbls/d) |
| 7,497 |
| 7,901 |
| 8,113 |
| 8,342 |
| 8,461 |
| 8,068 |
| 8,695 |
| 8,074 |
| 8,628 |
| 9,508 |
| 9,588 |
| 8,022 |
Natural gas (mmcf/d) |
| 154.26 |
| 152.07 |
| 150.68 |
| 148.11 |
| 137.93 |
| 145.18 |
| 152.06 |
| 144.36 |
| 142.13 |
| 163.09 |
| 172.43 |
| 157.88 |
Total (boe/d) |
| 58,499 |
| 57,142 |
| 58,027 |
| 56,598 |
| 55,295 |
| 57,022 |
| 58,354 |
| 56,780 |
| 58,774 |
| 64,986 |
| 69,895 |
| 64,222 |
| | | | | | | | | | | | | | | | | | | | | | | | |
International |
| |
| |
| |
| |
|
|
|
|
|
|
|
|
|
|
|
|
|
|
|
|
Crude oil and condensate (bbls/d) |
| 16,257 |
| 11,493 |
| 11,720 |
| 12,615 |
| 13,985 |
| 15,227 |
| 13,859 |
| 11,421 |
| 15,359 |
| 15,689 |
| 12,202 |
| 17,090 |
Natural gas (mmcf/d) |
| 79.97 |
| 82.05 |
| 89.15 |
| 96.58 |
| 100.22 |
| 81.55 |
| 83.66 |
| 89.62 |
| 89.86 |
| 93.25 |
| 101.99 |
| 107.63 |
Total (boe/d) |
| 29,585 |
| 25,169 |
| 26,578 |
| 28,712 |
| 30,689 |
| 28,820 |
| 27,802 |
| 26,357 |
| 30,336 |
| 31,229 |
| 29,201 |
| 35,028 |
| | | | | | | | | | | | | | | | | | | | | | | | |
Consolidated |
|
|
|
|
|
|
|
|
|
|
|
|
|
|
|
|
|
|
|
|
|
|
|
|
Crude oil and condensate (bbls/d) |
| 41,547 |
| 35,391 |
| 36,522 |
| 36,186 |
| 37,830 |
| 39,985 |
| 38,174 |
| 36,066 |
| 41,818 |
| 43,985 |
| 43,771 |
| 46,977 |
NGLs (bbls/d) |
| 7,497 |
| 7,901 |
| 8,113 |
| 8,342 |
| 8,461 |
| 8,068 |
| 8,695 |
| 8,074 |
| 8,627 |
| 9,509 |
| 9,588 |
| 8,022 |
Natural gas (mmcf/d) |
| 234.23 |
| 234.12 |
| 239.83 |
| 244.69 |
| 238.16 |
| 226.73 |
| 235.72 |
| 233.98 |
| 232.00 |
| 256.34 |
| 274.42 |
| 265.51 |
Total (boe/d) |
| 88,083 |
| 82,312 |
| 84,607 |
| 85,310 |
| 85,984 |
| 85,841 |
| 86,156 |
| 83,138 |
| 89,111 |
| 96,217 |
| 99,096 |
| 99,250 |
Vermilion Energy Inc. ■ Page 52 ■ 2022 Management's Discussion and Analysis
Financial results
| | | | | | | | | | | | | | | | | | | | | | | | |
|
| Q4/22 |
| Q3/22 |
| Q2/22 |
| Q1/22 |
| Q4/21 |
| Q3/21 |
| Q2/21 |
| Q1/21 |
| Q4/20 |
| Q3/20 |
| Q2/20 |
| Q1/20 |
North America | | | | | | | | | | | | | | | | | | | | | | | | |
Crude oil and condensate sales ($/bbl) |
| 106.66 |
| 114.82 |
| 134.72 |
| 111.42 |
| 92.99 |
| 82.23 |
| 75.43 |
| 66.31 |
| 51.06 |
| 49.79 |
| 28.94 |
| 50.25 |
NGL sales ($/bbl) |
| 39.93 |
| 44.64 |
| 51.86 |
| 46.94 |
| 47.26 |
| 35.55 |
| 25.43 |
| 29.39 |
| 19.20 |
| 15.04 |
| 8.94 |
| 8.92 |
Natural gas sales ($/mcf) |
| 5.96 |
| 6.41 |
| 7.13 |
| 4.80 |
| 5.07 |
| 3.80 |
| 2.72 |
| 3.98 |
| 2.77 |
| 2.02 |
| 1.60 |
| 1.92 |
Sales ($/boe) |
| 66.95 |
| 71.24 |
| 83.34 |
| 65.88 |
| 59.97 |
| 50.40 |
| 42.30 |
| 43.08 |
| 32.51 |
| 28.94 |
| 18.24 |
| 29.22 |
Royalties ($/boe) |
| (9.47) |
| (12.58) |
| (12.51) |
| (11.24) |
| (9.26) |
| (7.14) |
| (5.98) |
| (5.49) |
| (3.64) |
| (3.58) |
| (1.67) |
| (3.54) |
Transportation ($/boe) |
| (2.42) |
| (2.16) |
| (2.15) |
| (1.91) |
| (1.86) |
| (1.92) |
| (1.90) |
| (2.05) |
| (1.92) |
| (1.74) |
| (1.72) |
| (1.91) |
Operating ($/boe) |
| (13.51) |
| (14.00) |
| (11.58) |
| (11.95) |
| (11.68) |
| (11.02) |
| (10.89) |
| (11.21) |
| (10.94) |
| (7.82) |
| (9.60) |
| (11.93) |
General and administration ($/boe) |
| 0.10 |
| (1.27) |
| (1.52) |
| (1.26) |
| (2.01) |
| (1.14) |
| (0.91) |
| (1.34) |
| (1.94) |
| (0.78) |
| (1.52) |
| (0.84) |
Corporate income taxes ($/boe) |
| (0.13) |
| (0.03) |
| — |
| (0.02) |
| 0.42 |
| (0.05) |
| (0.04) |
| (0.04) |
| 0.04 |
| (0.02) |
| (0.02) |
| (0.04) |
Fund flows from operations ($/boe) |
| 41.52 |
| 41.20 |
| 55.58 |
| 39.50 |
| 35.58 |
| 29.13 |
| 22.58 |
| 22.95 |
| 14.11 |
| 15.00 |
| 3.71 |
| 10.96 |
| | | | | | | | | | | | | | | | | | | | | | | | |
Fund flows from operations |
| 223,443 |
| 216,579 |
| 293,470 |
| 201,193 |
| 180,979 |
| 152,764 |
| 119,916 |
| 117,227 |
| 76,375 |
| 89,635 |
| 23,639 |
| 64,048 |
Drilling and development | | (113,892) | | (112,238) | | (54,913) | | (57,513) | | (89,643) | | (35,179) | | (38,847) | | (59,113) | | (33,781) | | (9,575) | | (23,979) | | (197,926) |
Free cash flow |
| 109,551 |
| 104,341 |
| 238,557 |
| 143,680 |
| 91,336 |
| 117,585 |
| 81,069 |
| 58,114 |
| 42,594 |
| 80,060 |
| (340) |
| (133,878) |
| | | | | | | | | | | | | | | | | | | | | | | | |
International |
|
|
|
|
|
|
|
|
|
|
|
|
|
|
|
|
|
|
|
|
|
|
|
|
Crude oil and condensate sales ($/bbl) |
| 128.02 |
| 140.09 |
| 146.67 |
| 136.69 |
| 103.53 |
| 94.91 |
| 85.41 |
| 81.40 |
| 62.65 |
| 58.19 |
| 50.27 |
| 73.35 |
Natural gas sales ($/mcf) |
| 39.54 |
| 58.55 |
| 32.33 |
| 36.75 |
| 35.54 |
| 18.82 |
| 9.83 |
| 7.98 |
| 6.27 |
| 2.91 |
| 2.28 |
| 4.44 |
Sales ($/boe) |
| 177.23 |
| 254.86 |
| 173.14 |
| 183.66 |
| 163.23 |
| 103.39 |
| 72.16 |
| 62.39 |
| 50.30 |
| 37.94 |
| 28.98 |
| 49.42 |
Royalties ($/boe) |
| (6.38) |
| (7.21) |
| (7.23) |
| (5.43) |
| (4.13) |
| (4.52) |
| (3.83) |
| (3.53) |
| (3.02) |
| (3.32) |
| (2.16) |
| (3.27) |
Transportation ($/boe) |
| (3.29) |
| (3.51) |
| (3.64) |
| (2.91) |
| (3.40) |
| (3.47) |
| (4.64) |
| (2.76) |
| (2.40) |
| (2.28) |
| (2.04) |
| (1.94) |
Operating ($/boe) |
| (23.35) |
| (22.63) |
| (22.11) |
| (19.86) |
| (18.86) |
| (17.55) |
| (16.56) |
| (16.42) |
| (16.99) |
| (15.18) |
| (14.35) |
| (16.13) |
General and administration ($/boe) |
| (5.09) |
| (3.34) |
| (3.16) |
| (3.02) |
| (2.53) |
| (2.40) |
| (2.61) |
| (2.06) |
| (2.92) |
| (2.53) |
| (2.72) |
| (2.63) |
Corporate income taxes ($/boe) |
| (15.15) |
| (21.97) |
| (28.73) |
| (17.63) |
| (12.17) |
| 0.64 |
| (0.19) |
| 0.66 |
| 2.25 |
| 0.04 |
| (0.02) |
| (0.11) |
PRRT ($/boe) |
| (1.85) |
| (1.96) |
| (0.83) |
| (2.60) |
| (1.96) |
| (2.74) |
| (0.58) |
| (0.60) |
| (1.45) |
| (1.27) |
| (1.21) |
| (2.90) |
Fund flows from operations ($/boe) |
| 122.12 |
| 194.24 |
| 107.44 |
| 132.21 |
| 120.18 |
| 73.35 |
| 43.75 |
| 37.68 |
| 25.77 |
| 13.40 |
| 6.48 |
| 22.44 |
| | | | | | | | | | | | | | | | | | | | | | | | |
Fund flows from operations |
| 332,377 |
| 449,771 |
| 259,840 |
| 341,626 |
| 339,286 |
| 194,505 |
| 110,654 |
| 89,403 |
| 71,934 |
| 38,498 |
| 17,193 |
| 71,526 |
Drilling and development | | (43,957) | | (65,640) | | (54,575) | | (25,328) | | (29,359) | | (27,994) | | (38,856) | | (20,399) | | (19,122) | | (20,187) | | (18,404) | | (29,507) |
Exploration and evaluation | | (11,456) | | (6,137) | | (3,665) | | (2,503) | | (26,805) | | (3,277) | | (1,473) | | (3,851) | | (6,991) | | (1,568) | | 109 | | (6,271) |
Free cash flow |
| 276,964 |
| 377,994 |
| 201,600 |
| 313,795 |
| 283,122 |
| 163,234 |
| 70,325 |
| 65,153 |
| 45,821 |
| 16,743 |
| (1,102) |
| 35,748 |
| | | | | | | | | | | | | | | | | | | | | | | | |
|
| Q4/22 |
| Q3/22 |
| Q2/22 |
| Q1/22 |
| Q4/21 |
| Q3/21 |
| Q2/21 |
| Q1/21 |
| Q4/20 |
| Q3/20 |
| Q2/20 |
| Q1/20 |
Consolidated |
|
|
|
|
|
|
|
|
|
|
|
|
|
|
|
|
|
|
|
|
|
|
|
|
Crude oil and condensate sales ($/bbl) |
| 115.02 |
| 123.02 |
| 138.55 |
| 120.23 |
| 96.88 |
| 87.05 |
| 79.06 |
| 71.09 |
| 55.31 |
| 52.79 |
| 34.89 |
| 58.66 |
NGL sales ($/bbl) |
| 39.93 |
| 44.64 |
| 51.86 |
| 46.94 |
| 47.26 |
| 35.55 |
| 25.43 |
| 29.39 |
| 19.20 |
| 15.04 |
| 8.94 |
| 8.92 |
Natural gas sales ($/mcf) |
| 17.43 |
| 24.68 |
| 16.50 |
| 17.41 |
| 17.89 |
| 9.20 |
| 5.24 |
| 5.51 |
| 4.13 |
| 2.34 |
| 1.85 |
| 2.94 |
Sales ($/boe) |
| 103.99 |
| 127.39 |
| 111.55 |
| 105.52 |
| 96.82 |
| 68.19 |
| 51.93 |
| 49.20 |
| 38.57 |
| 31.86 |
| 21.40 |
| 36.35 |
Royalties ($/boe) |
| (8.43) |
| (10.94) |
| (10.85) |
| (9.29) |
| (7.43) |
| (6.26) |
| (5.29) |
| (4.87) |
| (3.43) |
| (3.50) |
| (1.81) |
| (3.45) |
Transportation ($/boe) |
| (2.71) |
| (2.57) |
| (2.62) |
| (2.25) |
| (2.41) |
| (2.44) |
| (2.78) |
| (2.27) |
| (2.08) |
| (1.92) |
| (1.81) |
| (1.92) |
Operating ($/boe) |
| (16.81) |
| (16.64) |
| (14.89) |
| (14.61) |
| (14.24) |
| (13.21) |
| (12.72) |
| (12.86) |
| (13.00) |
| (10.21) |
| (11.00) |
| (13.41) |
General and administration ($/boe) |
| (1.65) |
| (1.90) |
| (2.04) |
| (1.85) |
| (2.20) |
| (1.56) |
| (1.46) |
| (1.57) |
| (2.27) |
| (1.35) |
| (1.88) |
| (1.47) |
Corporate income taxes ($/boe) |
| (5.18) |
| (6.74) |
| (9.03) |
| (5.95) |
| (4.07) |
| 0.18 |
| (0.09) |
| 0.18 |
| 0.80 |
| — |
| (0.02) |
| (0.06) |
Windfall taxes ($/boe) |
| (27.50) |
| — |
| — |
| — |
| — |
| — |
| — |
| — |
| — |
| — |
| — |
| — |
PRRT ($/boe) |
| (0.62) |
| (0.60) |
| (0.26) |
| (0.87) |
| (0.70) |
| (0.92) |
| (0.19) |
| (0.19) |
| (0.49) |
| (0.41) |
| (0.36) |
| (1.02) |
Interest ($/boe) |
| (2.78) |
| (3.23) |
| (2.74) |
| (1.93) |
| (2.06) |
| (2.37) |
| (2.41) |
| (2.57) |
| (2.42) |
| (1.97) |
| (1.98) |
| (2.21) |
Realized derivatives ($/boe) |
| (5.42) |
| (18.22) |
| (10.36) |
| (18.78) |
| (23.97) |
| (9.19) |
| (5.05) |
| (3.43) |
| 0.10 |
| 0.47 |
| 6.07 |
| 5.47 |
Realized foreign exchange ($/boe) |
| 2.33 |
| (0.28) |
| (0.30) |
| 0.10 |
| (0.30) |
| 0.37 |
| (0.25) |
| (0.69) |
| 0.16 |
| (0.31) |
| 0.44 |
| 0.94 |
Realized other ($/boe) |
| (0.14) |
| 0.80 |
| 0.36 |
| 0.70 |
| 1.29 |
| 0.48 |
| 0.35 |
| 0.73 |
| 0.56 |
| 0.29 |
| 0.03 |
| (0.37) |
Fund flows from operations ($/boe) | | 35.08 | | 67.07 | | 58.82 | | 50.79 | | 40.73 |
| 33.27 |
| 22.04 |
| 21.66 |
| 16.50 |
| 12.95 |
| 9.08 |
| 18.85 |
| | | | | | | | | | | | | | | | | | | | | | | | |
Fund flows from operations |
| 284,220 |
| 507,876 |
| 452,901 |
| 389,868 |
| 322,173 |
| 262,696 |
| 172,942 |
| 162,051 |
| 135,212 |
| 114,776 |
| 81,852 |
| 170,225 |
Drilling and development | | (157,849) | | (177,878) | | (109,488) | | (82,841) | | (119,002) | | (63,173) | | (77,703) | | (79,512) | | (52,903) | | (29,762) | | (42,383) | | (227,433) |
Exploration and evaluation | | (11,456) | | (6,137) | | (3,665) | | (2,503) | | (26,805) | | (3,277) | | (1,473) | | (3,851) | | (6,991) | | (1,568) | | 109 | | (6,271) |
Free cash flow |
| 114,915 |
| 323,861 |
| 339,748 |
| 304,524 |
| 176,366 |
| 196,246 |
| 93,766 |
| 78,688 |
| 75,318 |
| 83,446 |
| 39,578 |
| (63,479) |
Vermilion Energy Inc. ■ Page 53 ■ 2022 Management's Discussion and Analysis
Non-GAAP and Other Specified Financial Measures
This MD&A includes references to certain financial measures which do not have standardized meanings and may not be comparable to similar measures presented by other issuers. These financial measures include fund flows from operations, a total of segments measure of profit or loss in accordance with IFRS 8 “Operating Segments” (please see Segmented Information in the Notes to the condensed Consolidated Financial Statements) and net debt, a capital management measure in accordance with IAS 1 “Presentation of Financial Statements” (please see Capital Disclosures in the Notes to the condensed Consolidated Financial Statements).
In addition, this MD&A includes financial measures which are not specified, defined, or determined under IFRS and are therefore considered non-GAAP financial measures and may not be comparable to similar measures presented by other issuers. These non-GAAP financial measures include:
Total of Segments Measure
Fund flows from operations (FFO): Most directly comparable to net earnings, FFO is comprised of sales excluding royalties, transportation, operating, G&A, corporate income tax, PRRT, windfall taxes, interest expense, realized loss on derivatives, realized foreign exchange gain (loss), and realized other income. The measure is used to assess the contribution of each business unit to Vermilion's ability to generate income necessary to pay dividends, repay debt, fund asset retirement obligations and make capital investments. Reconciliation to the primary financial statement measures can be found below.
| | | | | | | | | | | | | | | | |
| | Q4 2022 | | Q4 2021 | | 2022 | | 2021 | ||||||||
|
| $M |
| $/boe |
| $M |
| $/boe |
| $M |
| $/boe |
| $M |
| $/boe |
Sales |
| 842,693 |
| 103.99 |
| 765,915 |
| 96.82 |
| 3,476,394 |
| 111.95 |
| 2,079,761 |
| 66.81 |
Royalties |
| (68,303) |
| (8.43) |
| (58,785) |
| (7.43) |
| (306,017) |
| (9.85) |
| (186,122) |
| (5.98) |
Transportation |
| (21,976) |
| (2.71) |
| (19,033) |
| (2.41) |
| (78,896) |
| (2.54) |
| (77,161) |
| (2.48) |
Operating |
| (136,247) |
| (16.81) |
| (112,680) |
| (14.24) |
| (489,034) |
| (15.75) |
| (413,013) |
| (13.27) |
General and administration |
| (13,344) |
| (1.65) |
| (17,374) |
| (2.20) |
| (57,677) |
| (1.86) |
| (52,877) |
| (1.70) |
Corporate income tax expense |
| (41,958) |
| (5.18) |
| (32,234) |
| (4.07) |
| (208,153) |
| (6.70) |
| (30,166) |
| (0.97) |
Windfall taxes | | (222,859) | | (27.50) | | — | | — | | (222,859) | | (7.18) | | — | | — |
PRRT |
| (5,045) |
| (0.62) |
| (5,544) |
| (0.70) |
| (18,318) |
| (0.59) |
| (15,688) |
| (0.50) |
Interest expense |
| (22,506) |
| (2.78) |
| (16,279) |
| (2.06) |
| (82,858) |
| (2.67) |
| (73,075) |
| (2.35) |
Realized loss on derivatives |
| (43,940) |
| (5.42) |
| (189,598) |
| (23.97) |
| (405,894) |
| (13.07) |
| (327,384) |
| (10.52) |
Realized foreign exchange gain (loss) |
| 18,845 |
| 2.33 |
| (2,395) |
| (0.30) |
| 15,195 |
| 0.49 |
| (6,613) |
| (0.21) |
Realized other (expense) income |
| (1,140) |
| (0.14) |
| 10,180 |
| 1.29 |
| 12,982 |
| 0.42 |
| 22,200 |
| 0.71 |
Fund flows from operations |
| 284,220 |
| 35.08 |
| 322,173 |
| 40.73 |
| 1,634,865 |
| 52.65 |
| 919,862 |
| 29.54 |
Equity based compensation | | (5,377) | | | | (6,666) | | | | (44,390) | | | | (41,565) | | |
Unrealized gain (loss) on derivative instruments (1) | | 549,693 | | | | 172,265 | | | | 540,801 | | | | (181,094) | | |
Unrealized foreign exchange (loss) gain (1) | | (47,405) | | | | 7,122 | | | | (84,464) | | | | (64,963) | | |
Accretion | | (16,501) | | | | (10,983) | | | | (58,170) | | | | (43,552) | | |
Depletion and depreciation | | (171,926) | | | | (148,216) | | | | (577,134) | | | | (571,688) | | |
Deferred tax expense | | (196,733) | | | | (14,834) | | | | (288,707) | | | | (187,343) | | |
Gain on business combinations | | — | | | | — | | | | — | | | | 17,198 | | |
Impairment reversal | | — | | | | 23,922 | | | | 192,094 | | | | 1,302,619 | | |
Unrealized other expense (1) | | (563) | | | | (195) | | | | (1,833) | | | | (778) | | |
Net earnings | | 395,408 | | | | 344,588 | | | | 1,313,062 | | | | 1,148,696 | | |
(1) | Unrealized gain (loss) on derivative instruments, Unrealized foreign exchange (loss) gain, and Unrealized other expense are line items from the respective Consolidated Statements of Cash Flows. |
Vermilion Energy Inc. ■ Page 54 ■ 2022 Management's Discussion and Analysis
Non-GAAP Financial Measures and Non-GAAP Ratios
Free cash flow: Most directly comparable to cash flows from operating activities and is comprised of fund flows from operations less drilling and development costs and exploration and evaluation costs. The measure is used to determine the funding available for investing and financing activities including payment of dividends, repayment of long-term debt, reallocation into existing business units and deployment into new ventures. Reconciliation to the primary financial statement measures can be found in the following table.
| | | | | | | | |
($M) |
| Q4 2022 |
| Q4 2021 |
| 2022 |
| 2021 |
Cash flows from operating activities |
| 495,195 |
| 250,352 |
| 1,814,220 |
| 834,453 |
Changes in non-cash operating working capital |
| (227,483) |
| 58,782 |
| (216,869) |
| 56,884 |
Asset retirement obligations settled |
| 16,508 |
| 13,039 |
| 37,514 |
| 28,525 |
Fund flows from operations |
| 284,220 |
| 322,173 |
| 1,634,865 |
| 919,862 |
Drilling and development |
| (157,849) |
| (119,002) |
| (528,056) |
| (339,390) |
Exploration and evaluation |
| (11,456) |
| (26,805) |
| (23,761) |
| (35,406) |
Free cash flow |
| 114,915 |
| 176,366 |
| 1,083,048 |
| 545,066 |
Capital expenditures: Calculated as the sum of drilling and development costs and exploration and evaluation costs from the Consolidated Statements of Cash Flows that is most directly comparable to cash flows used in investing activities. We consider capital expenditures to be a useful measure of our investment in our existing asset base. Capital expenditures are also referred to as E&D capital. Reconciliation to the primary financial statement measures can be found below.
| | | | | | | | |
($M) |
| Q4 2022 |
| Q4 2021 |
| 2022 |
| 2021 |
Drilling and development |
| 157,849 |
| 119,002 |
| 528,056 |
| 339,390 |
Exploration and evaluation |
| 11,456 |
| 26,805 |
| 23,761 |
| 35,406 |
Capital expenditures |
| 169,305 |
| 145,807 |
| 551,817 |
| 374,796 |
Payout and payout % of FFO: A non-GAAP financial measure and non-GAAP ratio respectively, most directly comparable to dividends declared. Payout is comprised of dividends declared plus drilling and development costs, exploration and evaluation costs, and asset retirement obligations settled, and payout % of FFO is calculated as payout over FFO (total of segments measure). The measure is used to assess the amount of cash distributed back to shareholders and reinvested in the business for maintaining production and organic growth. The reconciliation of the measure to the primary financial statement measure can be found below.
| | | | | | | | | |
($M) |
| Q4 2022 |
| Q4 2021 |
| 2022 |
| 2021 |
|
Dividends declared |
| 13,058 |
| — |
| 45,769 |
| — | |
Drilling and development |
| 157,849 |
| 119,002 |
| 528,056 |
| 339,390 | |
Exploration and evaluation |
| 11,456 |
| 26,805 |
| 23,761 |
| 35,406 | |
Asset retirement obligations settled |
| 16,508 |
| 13,039 |
| 37,514 |
| 28,525 | |
Payout |
| 198,871 |
| 158,846 |
| 635,100 |
| 403,321 | |
% of fund flows from operations |
| 70 | % | 49 | % | 39 | % | 44 | % |
Return on capital employed (ROCE): A non-GAAP ratio, ROCE is a measure that we use to analyze our profitability and the efficiency of our capital allocation process; the comparable primary financial statement measure is earnings before income taxes. ROCE is calculated by dividing net earnings before interest and taxes ("EBIT") by average capital employed over the preceding twelve months. Capital employed is calculated as total assets less current liabilities while average capital employed is calculated using the balance sheets at the beginning and end of the twelve-month period.
| | | | | |
|
| Twelve Months Ended |
| ||
($M) | | Dec 31, 2022 |
| Dec 31, 2021 |
|
Net earnings |
| 1,313,062 |
| 1,148,696 | |
Taxes |
| 738,037 |
| 233,197 | |
Interest expense |
| 82,858 |
| 73,075 | |
EBIT |
| 2,133,957 |
| 1,454,968 | |
Average capital employed |
| 5,628,762 |
| 4,417,260 | |
Return on capital employed |
| 38 | % | 33 | % |
Vermilion Energy Inc. ■ Page 55 ■ 2022 Management's Discussion and Analysis
Adjusted working capital: Defined as current assets less current liabilities, excluding current derivatives and current lease liabilities. The measure is used to calculate net debt, a capital management measure disclosed below.
| | | | |
| | As at | ||
($M) |
| Dec 31, 2022 |
| Dec 31, 2021 |
Current assets |
| 714,446 |
| 472,845 |
Current derivative asset |
| (162,843) |
| (19,321) |
Current liabilities |
| (892,045) |
| (746,813) |
Current lease liability |
| 19,486 |
| 15,032 |
Current derivative liability |
| 55,845 |
| 268,973 |
Adjusted working capital |
| (265,111) |
| (9,284) |
Capital Management Measure
Net debt: Is in accordance with IAS 1 "Presentation of Financial Statements" that is most directly comparable to long-term debt. Net debt is comprised of long-term debt (excluding unrealized foreign exchange on swapped USD borrowings) plus adjusted working capital (defined as current assets less current liabilities, excluding current derivatives and current lease liabilities), and represents Vermilion's net financing obligations after adjusting for the timing of working capital fluctuations. Net debt excludes lease obligations which are secured by a corresponding right-of-use asset.
| | | | |
| | As at | ||
($M) |
| Dec 31, 2022 |
| Dec 31, 2021 |
Long-term debt |
| 1,081,351 |
| 1,651,569 |
Adjusted working capital | | 265,111 | | 9,284 |
Unrealized FX on swapped USD borrowings | | (1,876) | | (16,067) |
Net debt |
| 1,344,586 |
| 1,644,786 |
|
| |
| |
Ratio of net debt to four quarter trailing fund flows from operations |
| 0.8 |
| 1.8 |
Supplementary Financial Measures
Diluted shares outstanding: The sum of shares outstanding at the period end plus outstanding awards under the LTIP, based on current estimates of future performance factors and forfeiture rates.
| | | | |
('000s of shares) |
| Q4 2022 |
| Q4 2021 |
Shares outstanding |
| 163,227 |
| 162,261 |
Potential shares issuable pursuant to the LTIP |
| 5,389 |
| 6,485 |
Diluted shares outstanding |
| 168,616 |
| 168,746 |
Fund flows from operations per basic and diluted share: Management assesses fund flows from operations on a per share basis as we believe this provides a measure of our operating performance after taking into account the issuance and potential future issuance of Vermilion common shares. Fund flows from operations per basic share is calculated by dividing fund flows from operations (total of segments measure) by the basic weighted average shares outstanding as defined under IFRS. Fund flows from operations per diluted share is calculated by dividing fund flows from operations by the sum of basic weighted average shares outstanding and incremental shares issuable under the equity based compensation plans as determined using the treasury stock method.
Operating netback: Most directly comparable to net earnings that is calculated as sales less royalties, operating expense, transportation costs, PRRT, and realized hedging gains and losses presented on a per unit basis. Management assesses operating netback as a measure of the profitability and efficiency of our field operations.
Fund flows from operations per boe: Calculated as FFO (total of segments measure) by boe production. Fund flows from operations netback is used by management to assess the profitability of our business units and Vermilion as a whole.
Net debt to four quarter trailing fund flows from operations: Calculated as net debt (capital management measure) over the FFO (total of segments measure) from the preceding four quarters. The measure is used to assess the ability to repay debt.
Vermilion Energy Inc. ■ Page 56 ■ 2022 Management's Discussion and Analysis
Acquisitions: The sum of acquisitions from the Consolidated Statements of Cash Flows, Vermilion common shares issued as consideration, the estimated value of contingent consideration, the amount of acquiree's outstanding long-term debt assumed plus or net of acquired working capital deficit or surplus. We believe that including these components provides a useful measure of the economic investment associated with our acquisition activity. A reconciliation to the acquisitions line item in the Consolidated Statements of Cash Flows can be found in Supplemental Table 3 of this MD&A.
Cash dividends per share: Represents cash dividends declared per share that is a useful measure of the dividends a common shareholder was entitled to during the period.
Covenants: The financial covenants on our revolving credit facility contain non-GAAP measures. The definitions for these financial covenants are included in Financial Position Review.
Vermilion Energy Inc. ■ Page 57 ■ 2022 Management's Discussion and Analysis
DIRECTORS |
| OFFICERS / CORPORATE SECRETARY |
| AUDITORS |
| | | | |
Robert Michaleski 1,3,5 | | Dion Hatcher * | | Deloitte LLP |
Calgary, Alberta | | President & Chief Executive Officer | | Calgary, Alberta |
| | | | |
Dion Hatcher | | Lars Glemser * | | BANKERS |
Calgary, Alberta | | Vice President & Chief Financial Officer | | |
| | | | |
James J. Kleckner Jr. 7,9 | | Terry Hergott | | The Toronto-Dominion Bank |
Edwards, Colorado | | Vice President Marketing | | |
| | | | |
Carin Knickel 4,7,11 | | Yvonne Jeffery | | Alberta Treasury Branches |
Golden, Colorado | | Vice President Sustainability | | |
| | | | |
Stephen P. Larke 3,5,10 | | Darcy Kerwin * | | Bank of America N.A., Canada Branch |
Calgary, Alberta | | Vice President International & HSE | | |
| | | | Canadian Imperial Bank of Commerce |
Timothy R. Marchant 6,9,11 | | Bryce Kremnica * | | |
Calgary, Alberta | | Vice President North America | | Export Development Canada |
| | | | |
William Roby 7,8,11 | | Geoff MacDonald | | National Bank of Canada |
Katy, Texas | | Vice President Geosciences | | |
| | | | Royal Bank of Canada |
Manjit Sharma 2,5 | | Kyle Preston | | |
Toronto, Ontario | | Vice President Investor Relations | | The Bank of Nova Scotia |
| | | | |
Myron Stadnyk 7,9 | | Averyl Schraven | | Wells Fargo Bank N.A., Canadian Branch |
Calgary, Alberta | | Vice President People and Culture | | |
| | | | La Caisse Centrale Desjardins du Québec |
Judy Steele 3,5,11 | | Jenson Tan * | | |
Halifax, Nova Scotia | | Vice President Business Development | | Citibank N.A., Canadian Branch - Citibank Canada |
| | | | |
| Gerard Schut * | | Canadian Western Bank | |
1 Chairman (Independent) | | Vice President European Operations | | |
2 Audit Committee Chair (Independent) | | Robert (Bob) J. Engbloom | | JPMorgan Chase Bank, N.A., Toronto Branch |
3 Audit Committee Member (Independent) | | Corporate Secretary | | |
4 Governance and Human Resources Committee Chair (Independent) | | * Executive Committee | | Goldman Sachs Lending Partners LLC |
5 Governance and Human Resources Committee Member (Independent) | | | | |
6 Health, Safety and Environment Committee Chair (Independent) | | | | EVALUATION ENGINEERS |
7 Health, Safety and Environment Committee Member (Independent) | | | | |
8 Independent Reserves Committee Chair (Independent) | | | GLJ Petroleum Consultants Ltd. | |
9 Independent Reserves Committee Member (Independent) | | | | Calgary, Alberta |
10 Sustainability Committee Chair (Independent) | | | | |
11 Sustainability Committee Member (Independent) | | | | |
| | | | LEGAL COUNSEL |
| | | | |
| | | | Norton Rose Fulbright Canada LLP |
| | | | Calgary, Alberta |
| | | | |
| | | | TRANSFER AGENT |
| | | | |
| | | | Odyssey Trust Company |
| | | | |
| | | | STOCK EXCHANGE LISTINGS |
| | | | |
| | | | The Toronto Stock Exchange (“VET”) |
| | | | The New York Stock Exchange (“VET”) |
| | | | |
| | | | INVESTOR RELATIONS |
| | | | Kyle Preston |
| | | | Vice President Investor Relations |
| | | | 403-476-8431 TEL |
| | | | 403-476-8100 FAX |
| | | | 1-866-895-8101 IR TOLL FREE |
| | | | investor_relations@vermilionenergy.com |
| | | | |
| | | |
Vermilion Energy Inc. ■ Page 58 ■ 2022 Management's Discussion and Analysis