|
|---|
| Exhibit 99.2 |
| |
| |
| |
|
| |
| |
| |
| |
| |
| |
|
| INVESTOR PRESENTATION |

ACB Community Bank Investor Conference
November 2, 2006

During the course of this presentation, management may make projections and other forward-looking statements regarding events or the future financial performance of Naugatuck Valley Financial Corporation (“NVSL”). We wish to caution you that these forward-looking statements may differ materially from actual results due to a number of risks and uncertainties. These statements are based on the beliefs and assumptions of the management of NVSL, and on the information available to management at the time the presentation materials were prepared. For a more detailed description of the factors that may affect NVSL’s operating results, we refer you to our filings with the Securities & Exchange Commission, including the Quarterly Report on Form 10-Q, the Annual Report on Form 10-K, and other required filings. Naugatuck Valley Financial Corporation assumes no obligation to update the forward-looking statements made during this presentation. This presentation is not an offer to sell nor a solicitation to buy any securities. An offer to sell or a solicitation to buy any securities may only be made through a prospectus.
Forward Looking Statements
2
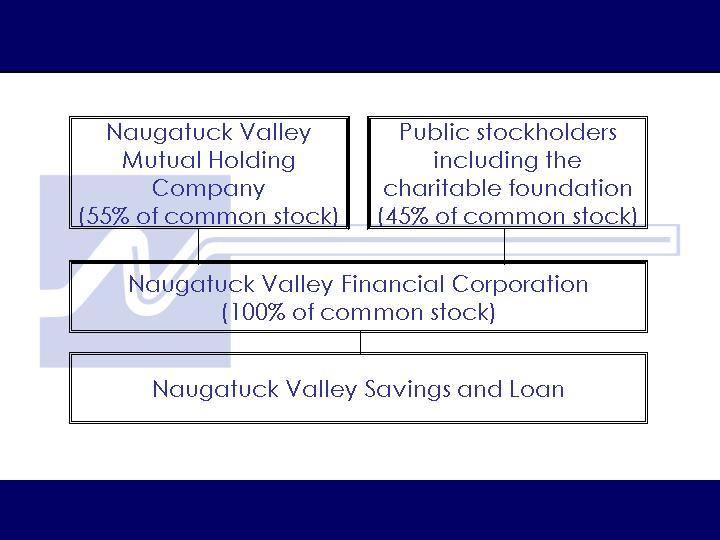
MHC Structure
3

Corporate Overview
4

Originally organized in 1922, the Bank is a federally
chartered stock savings bank headquartered in
Naugatuck, Connecticut.
Naugatuck Valley Financial Corporation was formed on
September 30, 2004 through a minority MHC offering selling
$32.7 million or 3,269,881 shares and currently trades on the
NASDAQ Global Market under the symbol “NVSL”.
Currently operates 9 branch offices located in Fairfield and
New Haven Counties, Connecticut.
Total assets of $405.0 million, net loans of $293.8 million,
deposits of $287.1 million and stockholders’ equity of $51.0
million at September 30, 2006.
Overview of Naugatuck Valley Financial
5
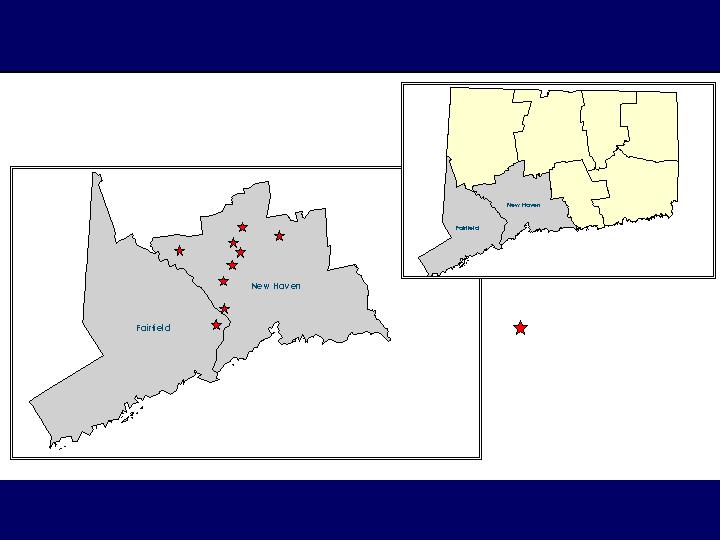
Branch Map
NVSL Branches
6

Our Mission
7
Our mission is to operate and
grow a profitable community
oriented financial institution
serving primarily retail
customers and small
businesses in our market area.

Management Team
8

Business Strategy & Financial Highlights
9
Post Conversion (2004)

Our business strategy is designed to build shareholder value by:
Growing Deposits and Diversifying the Mix;
Growing Loans and Diversifying the Mix;
Growing and Diversifying Non Interest Income;
Controlling Expenses;
Enhancing Our Branch Network and Alternative Delivery Systems.
Business Strategy
10
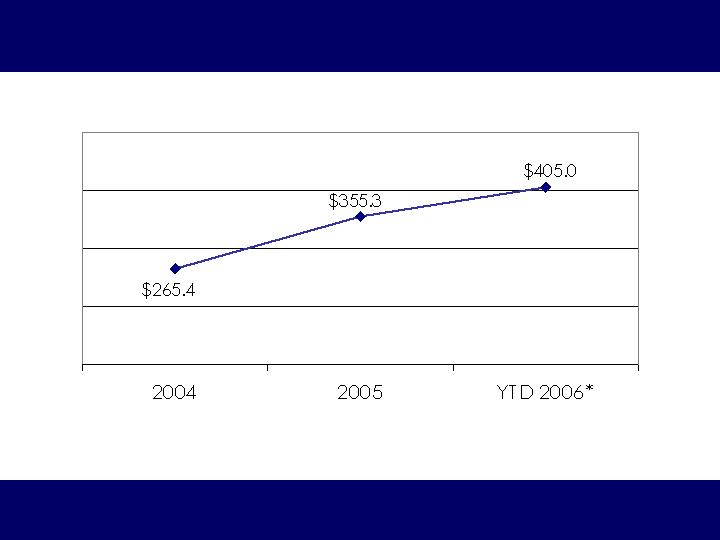
Asset Growth (in millions)
11
* As of September 30, 2006
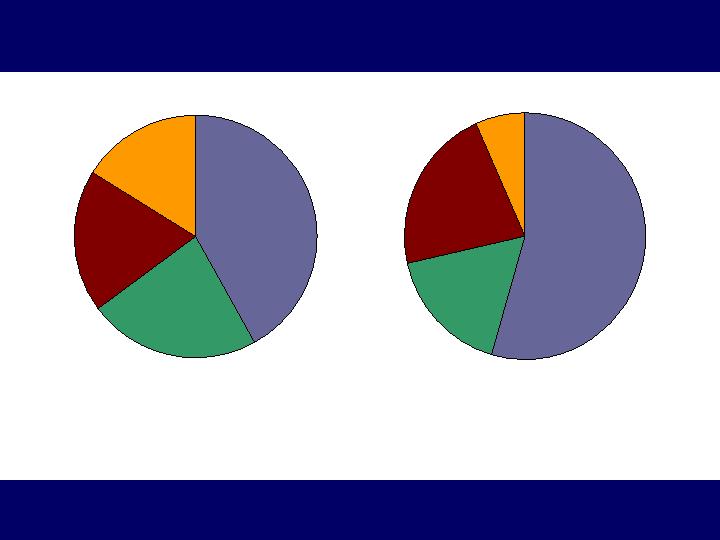
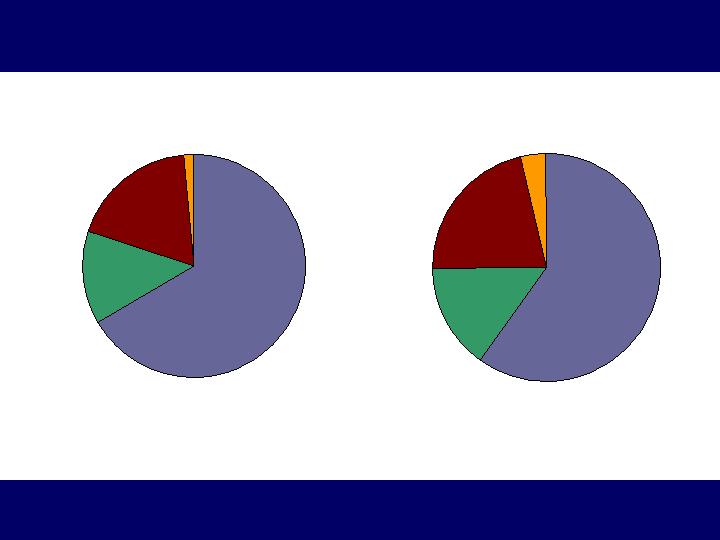
Growing Deposits & Diversifying The Mix
12
MMDA
16.2%
CD’s
42.0%
Savings
22.7%
DDA
19.1%
CD’s
54.5%
DDA
21.7%
Savings
17.0%
MMDA
6.8%
As of 12/31/04
$193,366,000
As of 09/30/06
$287,054,000
Up 48%
13
Growing Loans & Diversifying The Mix
As of 12/31/04
$206,000,000
As of 09/30/06
$296,200,000
Up 44%
CML MTGE
18.4%
RES MTGE
66.4%
Other
Commercial
1.5%
Consumer
13.7%
Other
Commercial
3.7%
CML MTGE
21.7%
RES MTGE
59.7%
Consumer
14.9%

Loan to Deposit Ratio
14

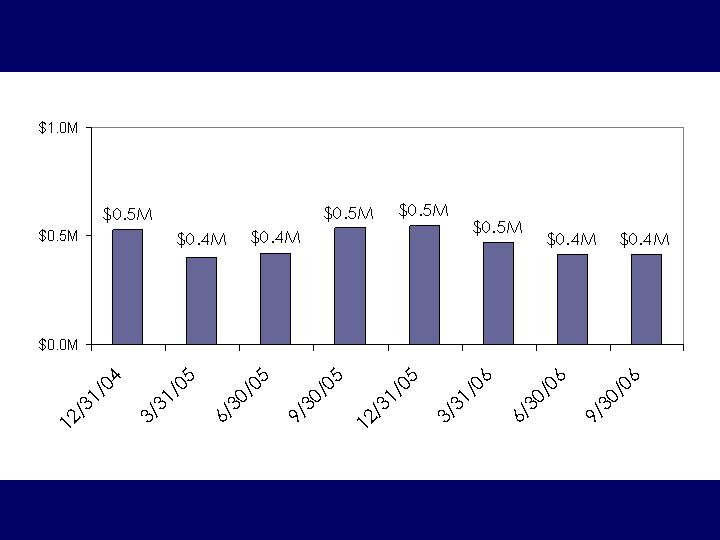
Growing & Diversifying Non Interest Income
15
1,462,000
1,078,000
Totals
325,000
113,000
All Other
78,000
N/A
Res. Brokerage &
Reverse Mortgage
77,000
87,000
229,000
666,000
YTD 2006*
100,000
ATM Fees
107,000
Ins & Invest Serv
201,000
BOLI
557,000
DDA Fees
2004
Up 36%
Significant Sources of Non-Interest Income
* For the nine months ended September 30, 2006.

Control Expenses
16
* For the nine months ended September 30, 2006
Total Operating Expenses
17
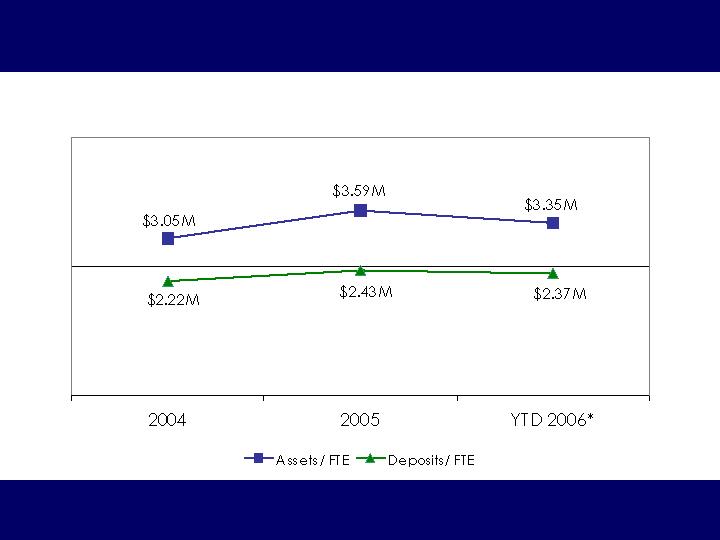
Control Expenses
Per Full Time Employee
* As of September 30, 2006.

18
Enhance Branch Network and Delivery Systems
287,054
1,497
2,398
2,505
34,095
246,559
Deposits (000s)
09/30/06
193,366
Totals
0
Cheshire – Aug 2006
0
Waterbury – Aug 2006
0
Southford – Aug 2006
0
Seymour – 2005
193,366
Pre 2005 Branches
Deposits (000s)
12/31/04
Opened
09/30/06
489
325
Bill Pay
1,828
12/31/04
1,147
Total Evalley
Internet Banking

Reserves / Loans
NPLs / Loans
Credit Quality
19
* As of September 30, 2006

Credit Quality
0.69%
189.08%
0.32%
0.26%
Nationwide
MHC’s 2
0.83%
167.47%
0.35%
0.25%
Nationwide
Thrifts 3
0.68%
LLR/Loans
339.36%
LLR/NPL
0.20%
NPL’s/Loans
0.15%
NPA’s/Assets
Naugatuck
Valley
Financial
Corporation 1
1 Ratios as of 09/30/06.
2 Source: SNL Database. Data as of 06/30/06.
3 Source: SNL Database. Excludes MHC’s. Data as of 06/30/06.
20

Spread
21
* As of September 30, 2006

Net Interest Income (in millions)
22
Net Income (in millions)
23
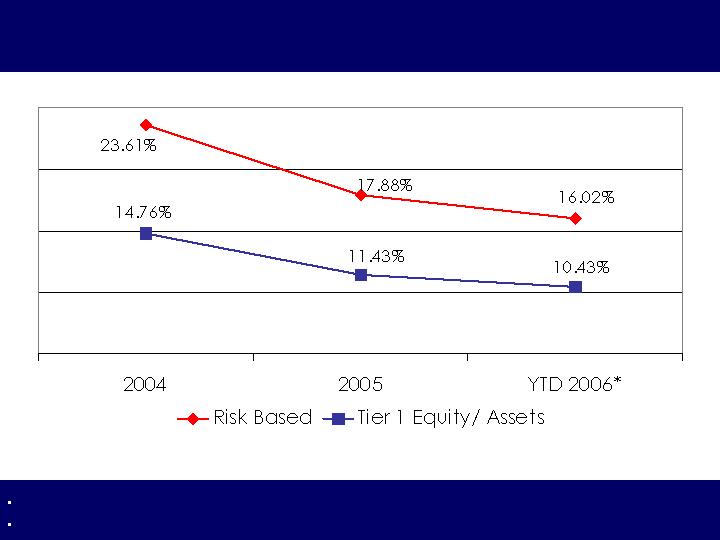
Capital Ratios
24
As of June 30, 2006
Based on Bank Level Numbers.

Market Data
25
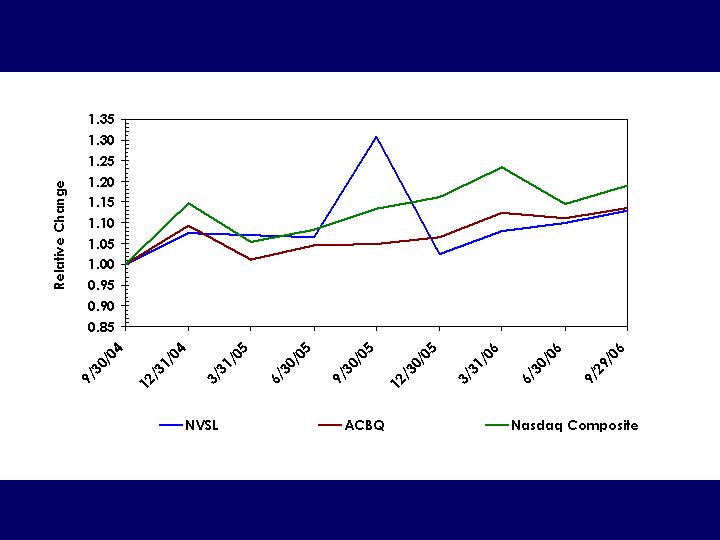
Index Graph
26

Peer Group Comparison
179.1%
174.6%
40.5x
Medians
Nationwide
MHC’s 3
179.1%
172.9%
45.7x
Medians
New
England
MHC’s 3
165.8%
Price / Tang Book
165.1%
Price / Book
45.9x
Price / Earnings
NVSL 1
1Pricing ratios for NVSL are based on the closing price of $11.02 as of 10/20/06.
2 The fully-converted valuation is based on RBCOs Research Department.
3 Source: SNL Database for the latest reported twelve month period. Ratios are based on closing prices as of 10/20/06. Excludes merger targets.
4 Source: SNL Database for the latest reported twelve month period. Ratios are based on closing prices as of 10/20/06. Excludes MHCs and merger targets.
27
143.6%
134.4%
22.5x
New
England
Thrifts 4
140.1%
127.0%
16.0x
Nationwide
Thrifts 4
81.8%
Price / Tang Book
81.7%
Price / Book
27.5x
Price / Earnings
NVSL 1,2
NVSL on an
MHC Basis
NVSL on a
fully-converted
basis

Peer Group Comparison
69.03%
1.50%
$0.05
Medians
Nationwide
MHC’s 2
57.69%
1.41%
$0.05
Medians
New England
MHC’s 2
37.50%
Dividend Payout Ratio 4
1.81%
Current Dividend Yield 3
$0.05
Quarterly Dividend Rate
Naugatuck
Valley
Financial
Corporation 1
1 Source: SNL Database.
2 Source: SNL Database. Excludes merger targets.
3 Dividend Yield is based on stock prices at 10/20/06.
4 Dividend Payout Ratio is on a minority basis.
28

Stock Buy Back Program
29
On May 2, 2006, the board of directors
authorized the company to repurchase up to
380,218 shares or approximately 5% of the
outstanding shares held by persons other than
Naugatuck Valley Mutual Holding Co.
As of September 30, 2006, 105,350 shares had
been repurchased under this program at at
weighted average price of approximately $11.40
per share.

Investment Attributes
30

Trades at a Discount to Fully-Converted Thrifts on
Book Value;
Attractive Dividend;
Solid Growth in Assets, Loans and Deposits;
Appealing Market Area; and
Strong Asset Quality.
Investment Attributes
31

NAUGATUCK VALLEY
FINANCIAL CORPORATION
(www.nvsl.com)
Contact:
President and Chief Executive Officer:
John C. Roman
203.720.5000
32