UNITED STATES
SECURITIES AND EXCHANGE COMMISSION
WASHINGTON, D.C. 20549
FORM N-CSR
CERTIFIED SHAREHOLDER REPORT OF REGISTERED MANAGEMENT
INVESTMENT COMPANIES
Investment Company Act file number 811-21596
MUNDOVAL FUNDS
(Exact name of registrant as specified in charter)
7855 Ivanhoe Avenue, #210, La Jolla, CA 92037
(Address of principal executive offices) (Zip code)
Arthur Q. Johnson
Mundoval Funds
7855 Ivanhoe Avenue, #210, La Jolla, CA 92037
(Name and address of agent for service)
Registrant's telephone number, including area code: (858) 454-4837
Date of fiscal year end: December 31
Date of reporting period: December 31, 2015
Form N-CSR is to be used by management investment companies to file reports with the Commission not later than 10 days after the transmission to stockholders of any report that is required to be transmitted to stockholders under Rule 30e-1 under the Investment Company Act of 1940 (17 CFR 270.30e -1). The Commission may use the information provided on Form N-CSR in its regulatory, disclosure review, inspection and policymaking roles.
A registrant is required to disclose the information specified by Form N-CSR, and the Commission will make this information public. A registrant is not required to respond to the collection of information contained in Form N-CSR unless the Form displays a currently valid Office of Management and Budget ("OMB") control number.
Item 1. Reports to Stockholders.
Mundoval Fund
ANNUAL REPORT
December 31, 2015
Mundoval Fund
Annual Report
December 31, 2015
Dear Shareholders,
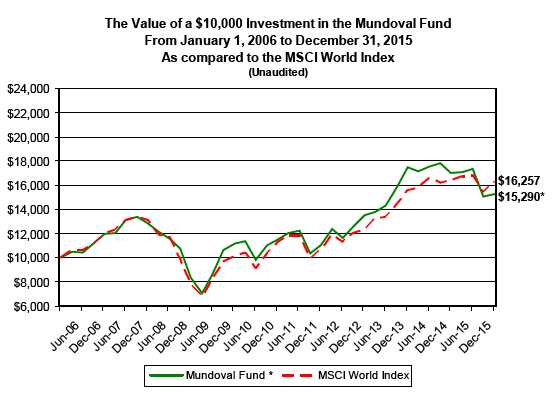
For the one year period ended December 31, 2015, the Mundoval Fund (the “Fund”) returned -10.01% versus -0.87% for the MSCI World Index. Since inception on September 3, 2004, the annualized rate of return for the Mundoval Fund has been 5.40% versus 6.34% for the MSCI World Index.
Net assets under management in the Fund as of December 31, 2015 were $18.75 million. During the year shares of Munich RE Group, EMC Corporation, American Movil ADR and Kellogg Co. were sold because the investment adviser believed them to be fairly valued or determined that there were more attractive businesses to be purchased with the proceeds. New security positions for the year included Discovery Communications, Bridgestone Corp., LG Display, Banco do Brasil, Companhia Paranese de Energia, A.P. Moeller-Maersk and Chesapeake Energy. The geographic diversification of the Fund as of December 31, 2015 is 42.20% Domestic stocks, 49.44% International stocks with 8.36% net cash equivalents and liabilities in excess of other assets. As of December 31, 2015 the Fund owned shares of common stock in 35 companies.
Given weak corporate earnings, declining commodity prices and slow global growth during the course of 2015, global stock markets worldwide posted less than stellar rates of return relative to their historical norms. U.S. stocks, as measured by the S&P 500 Index, posted their worst performance since 2008 and international and emerging stock market indices, as measured by the MSCI EAFE and Emerging Markets Indices, posted negative rates of return for the year as well. Despite continued concerns about declining energy prices for the second consecutive year and unrealistic expectations for continued Chinese economic expansion, global stock markets continue to offer attractive investment opportunities for investors seeking long-term capital appreciation.
As of December 31, 2015, the Mundoval Fund has invested more than 49% of its net assets in international companies, of which 30% is allocated to companies that are domiciled in Emerging Markets. Although stock price performance in Emerging Markets, as measured by the MSCI Emerging Markets Index, has languished relative to the U.S. and International developed markets for the past five years, we believe the companies that we own in China, Brazil, Russia, Korea, Indonesia and South Africa will provide shareholders with rates of return that are commensurate with the long term operating performance of their respective businesses. Industry sectors such as telecommunications, energy, information technology, consumer discretionary and utilities are represented in our portfolio because of the important role they will continue to provide in the growth of Emerging Market economies throughout the world. As long term, fundamental investors, we believe that share prices can deviate from fundamental business valuations but ultimately return to fundamental value.
Thank you for your business and continued support.
Arthur Q. Johnson
Portfolio Manager
2015 Annual Report 1
Mundoval Fund
PERFORMANCE INFORMATION (Unaudited)
AVERAGE ANNUAL RATE OF RETURN (%) FOR PERIODS ENDED DECEMBER 31, 2015.
December 31, 2015 NAV $13.33
| 1 Year(A) | 3 Years(A) | 5 Years(A) | 7 Years(A) | 10 Years(A) | ||||||
| Mundoval Fund | -10.01% | 4.22% | 5.86% | 9.02% | 4.34% | |||||
| MSCI World Index(B) | -0.87% | 9.63% | 7.59% | 11.13% | 4.98% |
The Fund’s total annual operating expense ratio per the May 1, 2015 prospectus is 1.51% .
The Total Annual Fund Operating Expenses will not correlate to the expense ratio in the Fund's financial highlights because the financial highlights include only the direct operating expenses incurred by the Fund, not the indirect costs of investing in Acquired Funds.
(A) 1 Year, 3 Years, 5 Years, 7 Years and 10 Years returns include change in share prices and in each case includes reinvestment of any dividends and capital gain distributions. The inception date of the Mundoval Fund was September 3, 2004.
(B) The MSCI World Index is a free float-adjusted market capitalization index that is designed to measure global developed market equity performance in twenty-three countries in Europe, Australia, Asia, the Far East and North America.
PAST PERFORMANCE DOES NOT GUARANTEE FUTURE RESULTS. INVESTMENT RETURN AND PRINCIPAL VALUE WILL FLUCTUATE SO THAT SHARES, WHEN REDEEMED, MAY BE WORTH MORE OR LESS THAN THEIR ORIGINAL COST. RETURNS DO NOT REFLECT THE DEDUCTION OF TAXES THAT A SHAREHOLDER WOULD PAY ON FUND DISTRIBUTIONS OR THE REDEMPTION OF FUND SHARES. CURRENT PERFORMANCE MAY BE LOWER OR HIGHER THAN THE PERFORMANCE DATA QUOTED. TO OBTAIN PERFORMANCE DATA CURRENT TO THE MOST RECENT MONTH END, PLEASE CALL 1-800-595-2877.
2015 Annual Report 2
Expense Example (Unaudited)
Shareholders of this Fund incur ongoing expenses consisting solely of management fees. Although the Fund charges no sales loads or transaction fees, you will be assessed fees for outgoing wire transfers, returned checks and stop payment orders at prevailing rates charged by Mutual Shareholder Services, LLC, the Fund’s transfer agent. IRA accounts will be charged an $8.00 annual maintenance fee. The following example is intended to help you understand your ongoing costs of investing in the Fund and to compare these costs with similar costs of investing in other mutual funds. The example is based on an investment of $1,000 invested in the Fund on July 1, 2015 and held through December 31, 2015.
Actual Expenses
The first line of the table below provides information about actual account values and actual expenses. In order to estimate the expenses a shareholder paid during the period covered by this report, shareholders can divide their account value by $1,000 (for example, an $8,600 account value divided by $1,000 = 8.6) and then multiply the result by the number in the first line under the heading entitled “Expenses Paid During the Period.”
Hypothetical Example for Comparison Purposes
The second line of the table below provides information about hypothetical account values and hypothetical expenses based on the Fund’s actual expense ratio and an assumed rate of return of 5% per year before expenses, which is not the Fund’s actual return. The hypothetical account values and expenses may not be used to estimate the actual ending account balance or expenses paid by a shareholder for the period. Shareholders may use this information to compare the ongoing costs of investing in this Fund and other funds. To do so, compare this 5% hypothetical example with the 5% hypothetical examples that appear in other funds' shareholder reports.
Please note that the expenses shown in the table are meant to highlight your ongoing costs only and do not reflect any transactional costs, such as the charges assessed by Mutual Shareholder Services, LLC as described above. Therefore, the second line of the table is useful in comparing ongoing costs only, and will not help you determine the relative total costs of owning different funds. In addition, if these transactional costs were included, your costs would have been higher.
| Expenses Paid | ||||||
| Beginning | Ending | During the Period* | ||||
| Account Value | Account Value | July 1, 2015 to | ||||
| July 1, 2015 | December 31, 2015 | December 31, 2015 | ||||
| Actual | $1,000.00 | $882.59 | $7.12 | |||
| Hypothetical | $1,000.00 | $1,017.64 | $7.63 | |||
| (5% annual return | ||||||
| before expenses) | ||||||
| * Expenses are equal to the Fund’s annualized expense ratio of 1.50%, multiplied by the average account value over the period, multiplied by 184/365 (to reflect the one-half year period ended December 31, 2015). |
2015 Annual Report 3
Availability of Quarterly Schedule of Investments (Unaudited)
The Fund files its complete schedule of portfolio holdings with the Securities and Exchange Commission (“SEC”) for the first and third quarters of each fiscal year on Form N-Q. The Fund’s Forms N-Q are available on the SEC’s Web site at http://www.sec.gov. The Fund’s Forms N-Q may also be reviewed and copied at the SEC's Public Reference Room in Washington, DC. Information on the operation of the Public Reference Room may be obtained by calling 1-800-SEC-0330.
Proxy Voting Guidelines (Unaudited)
Mundoval Capital Management, Inc., the Fund’s Adviser, is responsible for exercising the voting rights associated with the securities held by the Fund. A description of the policies and procedures used by the Adviser in fulfilling this responsibility is available without charge by calling our toll free number (1-800-595-2877) or by visiting the Fund’s website at www.mundoval.com. This information is also included in the Fund’s Statement of Additional Information, which is available on the Securities and Exchange Commission’s website at http://www.sec.gov.
Information regarding how the Fund voted proxies, Form N-PX, relating to portfolio securities during the most recent 12-month period ended June 30th is available without charge, upon request, by calling our toll free number (1-800-595-2877). This information is also available on the Securities and Exchange Commission’s website at http://www.sec.gov.
Mundoval Fund
by Industry Sectors (as a percentage of Net Assets)
as of December 31, 2015
(Unaudited)

*Net Cash represents cash, cash equivalents and liabilities less other assets.
2015 Annual Report 4
| Mundoval Fund | |||||
| Schedule of Investments | |||||
| December 31, 2015 | |||||
| Shares | Fair Value | % of Net Assets | |||
| COMMON STOCKS | |||||
| Agricultural Chemicals | |||||
| 15,000 | CF Industries Holdings, Inc. | $ | 612,150 | 3.26 | % |
| Auto Components | |||||
| 14,000 | Bridgestone Corporation ** | 239,190 | 1.28 | % | |
| Banks | |||||
| 60,000 | Banco do Brasil S.A. ** | 220,800 | 1.18 | % | |
| Beverages | |||||
| 100,000 | Ambev S.A. ** | 446,000 | |||
| 5,500 | Diageo PLC ** | 599,885 | |||
| 1,045,885 | 5.58 | % | |||
| Cable & Other Pay Television Services | |||||
| 13,000 | Discovery Communications, Inc. Class A * | 346,840 | |||
| 7,500 | Viacom Inc. Class B | 308,700 | |||
| 655,540 | 3.50 | % | |||
| Construction Special Trade Contractors | |||||
| 15,000 | Chicago Bridge & Iron Company N.V. (Netherlands) | 584,850 | 3.12 | % | |
| Crude Petroleum & Natural Gas | |||||
| 40,000 | Chesapeake Energy Corporation | 180,000 | |||
| 3,000 | CNOOC Ltd. ** | 313,140 | |||
| 493,140 | 2.63 | % | |||
| Diversified Banking Institutions | |||||
| 20,000 | BNP Paribas ** | 565,200 | 3.01 | % | |
| Electronic Components, NEC | |||||
| 22,000 | LG Display Co., Ltd. * ** | 229,680 | 1.22 | % | |
| Electronic Computers | |||||
| 8,000 | Apple Inc. | 842,080 | |||
| 3,500 | International Business Machines Corporation | 481,670 | |||
| 1,323,750 | 7.06 | % | |||
| Electric Utilities | |||||
| 36,000 | Companhia Paranaense De Energia ** | 211,320 | 1.13 | % | |
| Fire, Marine & Casualty Insurance | |||||
| 15,000 | American International Group, Inc. | 929,550 | 4.96 | % | |
| Hotels & Motels | |||||
| 20,000 | Melco Crown Entertainment Limited ** | 336,000 | 1.79 | % | |
| Leather & Leather Products | |||||
| 20,000 | Coach, Inc. | 654,600 | 3.49 | % | |
| Marine | |||||
| 32,000 | A.P. Moller - Maersk A/S ** | 208,320 | 1.11 | % | |
| National Commercial Banks | |||||
| 40,000 | Bank of America Corporation | 673,200 | |||
| 12,000 | Citigroup, Inc. | 621,000 | |||
| 1,294,200 | 6.90 | % | |||
| Oil & Gas Field Machinery & Equipment | |||||
| 2,000 | National Oilwell Varco, Inc. | 66,980 | 0.36 | % | |
| Oil Company - Integrated | |||||
| 85,000 | Gazprom OAO ** | 311,950 | |||
| 8,200 | LUKOIL Company ** | 266,377 | |||
| 70,000 | Petroleo Brasileiro S.A. - Petrobras * ** | 301,000 | |||
| 879,327 | 4.69 | % | |||
| Pharmaceutical Preparations | |||||
| 17,000 | Teva Pharmaceutical Industries Limited ** | 1,115,880 | 5.95 | % | |
| Radiotelephone Communications | |||||
| 70,000 | Mobile TeleSystems OJSC ** | 432,600 | 2.31 | % | |
| * Non-Income Producing Securities. ** ADR - American Depositary Receipt. The accompanying notes are an integral part of these financial statements. |
2015 Annual Report 5
| Mundoval Fund | |||||||
| Schedule of Investments | |||||||
| December 31, 2015 | |||||||
| Shares | Fair Value | % of Net Assets | |||||
| COMMON STOCKS | |||||||
| Retail - Grocery Stores | |||||||
| 60,000 | Tesco PLC * ** | $ | 395,400 | 2.11 | % | ||
| Services - Business Services, NEC | |||||||
| 11,500 | MasterCard Incorporated Class A | 1,119,640 | 5.97 | % | |||
| Services - Computer Programming, Data Processing, Etc. | |||||||
| 4,000 | Baidu, Inc. * ** | 756,160 | |||||
| 700 | Alphabet Inc. Class A * | 544,607 | |||||
| 701 | Alphabet Inc. Class C * | 531,975 | |||||
| 1,832,742 | 9.76 | % | |||||
| Telecommunications | |||||||
| 40,000 | MTN Group Limited ** | 338,800 | 1.81 | % | |||
| Telephone Communications | |||||||
| 13,000 | China Mobile Limited ** | 732,290 | |||||
| 15,000 | P.T. Telekomunikasi Indonesia Tbk ** | 666,000 | |||||
| 1,398,290 | 7.46 | % | |||||
| Total for Common Stocks (Cost - $14,995,480) | $ | 17,183,834 | 91.64 | % | |||
| Money Market Funds | |||||||
| 2,323,415 | First American Treasury Obligation Fund Cl Y 0.00% *** | 2,323,415 | 12.39 | % | |||
| (Cost - $2,323,415) | |||||||
| Total Investments | 19,507,249 | 104.03 | % | ||||
| (Cost - $17,318,895) **** | |||||||
| Liabilities in Excess of Other Assets | (755,639 | ) | -4.03 | % | |||
| Net Assets | $ | 18,751,610 | 100.00 | % | |||
| SUMMARY OF INVESTMENTS BY COUNTRY | |||||
| % of Investment | |||||
| Fair Value | Securities | ||||
| Brazil | $ | 1,179,120 | 6.86 | % | |
| China | 756,160 | 4.40 | % | ||
| Denmark | 208,320 | 1.21 | % | ||
| France | 565,200 | 3.29 | % | ||
| Japan | 239,190 | 1.39 | % | ||
| Hong Kong | 1,381,430 | 8.04 | % | ||
| Indonesia | 666,000 | 3.88 | % | ||
| Israel | 1,115,880 | 6.49 | % | ||
| Netherlands | 584,850 | 3.40 | % | ||
| Russia | 1,010,927 | 5.88 | % | ||
| South Africa | 338,800 | 1.97 | % | ||
| South Korea | 229,680 | 1.34 | % | ||
| United Kingdom | 995,285 | 5.79 | % | ||
| United States | 7,912,992 | 46.06 | % | ||
| $ | 17,183,834 | 100.00 | % |
| * Non-Income Producing Securities. ** ADR - American Depositary Receipt. *** Variable Rate Security; the Yield Rate shown represents the rate at December 31, 2015. **** At December 31. 2015, tax basis cost of the Fund’s investments was $17,318,895 and the unreal- ized appreciation and depreciation were $4,518,284 and ($2,329,930), respectively, with a net unreal- ized appreciation of $2,188,354. |
| The accompanying notes are an integral part of these financial statements. |
2015 Annual Report 6
| Mundoval Fund | |||
| Statement of Assets and Liabilities | |||
| December 31, 2015 | |||
| Assets: | |||
| Investment Securities at Fair Value | $ | 19,507,249 | |
| (Cost - $17,318,895) | |||
| Cash | 892 | ||
| Dividends Receivable | 14,960 | ||
| Total Assets | 19,523,101 | ||
| Liabilities: | |||
| Payable to Adviser | 24,352 | ||
| Payable for Shareholder Redemptions | 4,000 | ||
| Payable for Securities Purchased | 743,139 | ||
| Total Liabilities | 771,491 | ||
| Net Assets | $ | 18,751,610 | |
| Net Assets Consist of: | |||
| Capital Paid In | $ | 16,753,790 | |
| Accumulated Undistributed Net Investment Income | 36,544 | ||
| Accumulated Realized Loss on Investments - Net | (227,078 | ) | |
| Unrealized Appreciation in Value of Investments | |||
| Based on Identified Cost - Net | 2,188,354 | ||
| Net Assets, for 1,406,419 Shares Outstanding | $ | 18,751,610 | |
| (Without par value, unlimited shares authorized) | |||
| Net Asset Value, Offering and Redemption Price | |||
| Per Share ($18,751,610/1,406,419 shares) | $ | 13.33 | |
| Statement of Operations | |||
| For the fiscal year ended December 31, 2015 | |||
| Investment Income: | |||
| Dividends (Net of Foreign withholding taxes and fees of $53,901) | $ | 406,053 | |
| Interest | 16 | ||
| Total Investment Income | 406,069 | ||
| Expenses: | |||
| Management Fees | 314,717 | ||
| Total Expenses | 314,717 | ||
| Net Investment Income | 91,352 | ||
| Realized and Unrealized Loss on Investments: | |||
| Net Realized Loss on Investments | (227,078 | ) | |
| Change in Unrealized Appreciation on Investments | (1,980,441 | ) | |
| Net Realized and Unrealized Loss on Investments | (2,207,519 | ) | |
| Net Decrease in Net Assets from Operations | $ | (2,116,167 | ) |
| The accompanying notes are an integral part of these financial statements. |
2015 Annual Report 7
| Mundoval Fund | |||||||
| Statements of Changes in Net Assets | |||||||
| 1/1/2015 | 1/1/2014 | ||||||
| to | to | ||||||
| 12/31/2015 | 12/31/2014 | ||||||
| From Operations: | |||||||
| Net Investment Income | $ | 91,352 | $ | 108,715 | |||
| Net Realized Gain/(Loss) on Investments | (227,078 | ) | 1,514,002 | ||||
| Change in Net Unrealized Appreciation | (1,980,441 | ) | (2,205,104 | ) | |||
| Decrease in Net Assets from Operations | (2,116,167 | ) | (582,387 | ) | |||
| From Distributions to Shareholders: | |||||||
| Net Investment Income | (86,700 | ) | (87,328 | ) | |||
| Net Realized Gain from Security Transactions | (500,983 | ) | (1,206,979 | ) | |||
| Change in Net Assets from Distributions | (587,683 | ) | (1,294,307 | ) | |||
| From Capital Share Transactions: | |||||||
| Proceeds From Sale of Shares | 1,418,602 | 1,701,111 | |||||
| Shares Issued on Reinvestment of Dividends | 587,683 | 1,294,307 | |||||
| Cost of Shares Redeemed | (1,495,740 | ) | (604,364 | ) | |||
| Net Increase from Shareholder Activity | 510,545 | 2,391,054 | |||||
| Net Increase/(Decrease) in Net Assets | (2,193,305 | ) | 514,360 | ||||
| Net Assets at Beginning of Period | 20,944,915 | 20,430,555 | |||||
| Net Assets at End of Period | |||||||
| (Including Accumulated Undistributed Net Investment | $ | 18,751,610 | $ | 20,944,915 | |||
| Income of $36,544 and $31,890, respectively) | |||||||
| Share Transactions: | |||||||
| Issued | 92,308 | 102,798 | |||||
| Reinvested | 43,148 | 83,128 | |||||
| Redeemed | (99,404 | ) | (37,038 | ) | |||
| Net Increase in Shares | 36,052 | 148,888 | |||||
| Shares Outstanding Beginning of Period | 1,370,367 | 1,221,479 | |||||
| Shares Outstanding End of Period | 1,406,419 | 1,370,367 | |||||
| Financial Highlights | ||||||||||||||||||||
| Selected data for a share outstanding | ||||||||||||||||||||
| throughout the period: | 1/1/2015 | 1/1/2014 | 1/1/2013 | 1/1/2012 | 1/1/2011 | |||||||||||||||
| to | to | to | to | to | ||||||||||||||||
| 12/31/2015 | 12/31/2014 | 12/31/2013 | 12/31/2012 | 12/31/2011 | ||||||||||||||||
| Net Asset Value - | ||||||||||||||||||||
| Beginning of Period | $ | 15.28 | $ | 16.73 | $ | 13.03 | $ | 10.83 | $ | 11.42 | ||||||||||
| Net Investment Income (a) | 0.07 | 0.09 | 0.07 | 0.20 | 0.11 | |||||||||||||||
| Net Gain/(Loss) on Securities | ||||||||||||||||||||
| (Realized and Unrealized) | (1.59 | ) | (0.54 | ) | 3.76 | 2.22 | (0.57 | ) | ||||||||||||
| Total from Investment Operations | (1.52 | ) | (0.45 | ) | 3.83 | 2.42 | (0.46 | ) | ||||||||||||
| Distributions (From Net Investment Income) | (0.06 | ) | (0.07 | ) | (0.07 | ) | (0.22 | ) | (0.07 | ) | ||||||||||
| Distributions (From Realized Capital Gains) | (0.37 | ) | (0.93 | ) | (0.06 | ) | - | (0.06 | ) | |||||||||||
| Total Distributions | (0.43 | ) | (1.00 | ) | (0.13 | ) | (0.22 | ) | (0.13 | ) | ||||||||||
| Net Asset Value - | ||||||||||||||||||||
| End of Period | $ | 13.33 | $ | 15.28 | $ | 16.73 | $ | 13.03 | $ | 10.83 | ||||||||||
| Total Return (b) | (10.01)% | (2.78)% | 29.39% | 22.37% | (4.01)% | |||||||||||||||
| Ratios/Supplemental Data | ||||||||||||||||||||
| Net Assets - End of Period (Thousands) | $ | 18,752 | $ | 20,945 | $ | 20,431 | $ | 15,495 | $ | 12,125 | ||||||||||
| Ratio of Expenses to Average Net Assets | 1.50% | 1.50% | 1.50% | 1.50% | 1.50% | |||||||||||||||
| Ratio of Net Investment Income to | ||||||||||||||||||||
| Average Net Assets | 0.44% | 0.52% | 0.49% | 1.69% | 1.00% | |||||||||||||||
| Portfolio Turnover Rate | 11.27% | 29.97% | 32.54% | 28.79% | 44.38% | |||||||||||||||
| (a) Per share amounts were calculated using the average shares method. (b) Total return in the above table represents the rate that the investor would have earned or lost on an investment in the Fund assuming reinvestment of dividends and distributions. |
| The accompanying notes are an integral part of these financial statements. |
2015 Annual Report 8
NOTES TO FINANCIAL STATEMENTS
MUNDOVAL FUND
December 31, 2015
1.) ORGANIZATION
The Mundoval Fund (the “Fund”) is a diversified series of the Mundoval Funds (the “Trust”), an open-end management investment company. The Trust was organized in Ohio as a business trust on March 24, 2004 and may offer shares of beneficial interest in a number of separate series, each series representing a distinct fund with its own investment objectives and policies. The Fund commenced operations on September 3, 2004. The Fund’s investment objective is long-term capital appreciation.
2.) SIGNIFICANT ACCOUNTING POLICIES
SECURITY VALUATION: The Fund is an investment company and accordingly follows the investment company accounting and reporting guidance of the Financial Accounting Standards Board (“FASB”) Accounting Standard Codification Topic 946 Financial Services - Investment Companies. All investments in securities are recorded at their estimated fair value, as described in Note 3.
FEDERAL INCOME TAXES: The Fund’s policy is to continue to comply with the requirements of the Internal Revenue Code that are applicable to regulated investment companies and to distribute all of its taxable income to shareholders. Therefore, no federal income tax provision is required. It is the Fund’s policy to distribute annually, prior to the end of the calendar year, dividends sufficient to satisfy excise tax requirements of the Internal Revenue Code. This Internal Revenue Code requirement may cause an excess of distributions over the book year-end accumulated income. In addition, it is the Fund’s policy to distribute annually, after the end of the fiscal year, any remaining net investment income and net realized capital gains.
The Fund recognizes the tax benefits of certain tax positions only where the position is “more likely than not” to be sustained assuming examination by tax authorities. Management has analyzed the Fund’s tax positions, and has concluded that no liability for unrecognized tax benefits should be recorded related to uncertain tax positions taken on returns filed for open tax years (2012-2014), or expected to be taken on the Fund’s 2015 tax return. The Fund identifies its major tax jurisdictions as U.S. Federal and California tax authorities; however the Fund is not aware of any tax positions for which it is reasonably possible that the total amounts of unrecognized tax benefits will change materially in the next twelve months. The Fund recognizes interest and penalties, if any, related to unrecognized tax benefits as income tax expense in the Statement of Operations. During the fiscal year ended December 31, 2015, the Fund did not incur any interest or penalties.
DISTRIBUTIONS TO SHAREHOLDERS: Distributions to shareholders, which are determined in accordance with income tax regulations, are recorded on the ex-dividend date. The treatment for financial reporting purposes of distributions made to shareholders during the year from net investment income or net realized capital gains may differ from their ultimate treatment for federal income tax purposes. These differences are caused primarily by differences in the timing of the recognition of certain components of income, expenses or realized capital gain for federal income tax purposes. Where such differences are permanent in nature, they are reclassified in the components of the net assets based on their ultimate characterization for federal income tax purposes. Any such reclassifications will have no effect on net assets, results of operations or net asset values per share of the Fund.
USE OF ESTIMATES: The preparation of financial statements in conformity with accounting principles generally accepted in the United States of America (“GAAP”) requires management to make estimates and assumptions that affect the reported amounts of assets and liabilities and disclosure of contingent assets and liabilities at the date of the financial statements and the reported amounts of increases and decreases in net assets from operations during the reporting period. Actual results could differ from those estimates.
OTHER: The Fund records security transactions based on trade date. Dividend income is recognized on the ex-dividend date. Interest income is recognized on an accrual basis. The Fund uses the specific identification method in computing gain or loss on sale of investment securities. Discounts and premiums on securities purchased are accreted and amortized over the life of the respective securities. Withholding taxes on foreign dividends have been provided for in accordance with the Fund’s understanding of the applicable country’s tax rules and regulations.
2015 Annual Report 9
Notes to Financial Statements - continued
3.) SECURITY VALUATIONS
The Fund utilizes various methods to measure the fair value of most of its investments on a recurring basis. GAAP establishes a hierarchy that prioritizes inputs to valuation methods. The three levels of inputs are:
Level 1 - Unadjusted quoted prices in active markets for identical assets or liabilities that the Fund has the ability to access.
Level 2 - Observable inputs other than quoted prices included in level 1 that are observable for the asset or liability, either directly or indirectly. These inputs may include quoted prices for the identical instrument in an inactive market, prices for similar instruments, interest rates, prepayment speeds, credit risk, yield curves, default rates and similar data.
Level 3 - Unobservable inputs for the asset or liability, to the extent relevant observable inputs are not available, representing the Fund’s own assumptions about the assumptions a market participant would use in valuing the asset or liability, and would be based on the best information available.
The availability of observable inputs can vary from security to security and is affected by a wide variety of factors, including, for example, the type of security, whether the security is new and not yet established in the marketplace, the liquidity of markets, and other characteristics particular to the security. To the extent that valuation is based on models or inputs that are less observable or unobservable in the market, the determination of fair value requires more judgment. Accordingly, the degree of judgment exercised in determining fair value is greatest for instruments categorized in level 3.
The inputs used to measure fair value may fall into different levels of the fair value hierarchy. In such cases, for disclosure purposes, the level in the fair value hierarchy within which the fair value measurement falls in its entirety, is determined based on the lowest level input that is significant to the fair value measurement in its entirety.
FAIR VALUE MEASUREMENTS
A description of the valuation techniques applied to the Fund’s major categories of assets measured at fair value on a recurring basis follows.
Equity securities (common stocks, including ADRs). Equity securities that are traded on any exchange or on the NASDAQ over-the-counter market are valued at the last quoted sale price. Lacking a last sale price, a long security is valued at its last bid price except when, in the Adviser’s opinion, the last bid price does not accurately reflect the current value of the long security. To the extent these securities are actively traded and valuation adjustments are not applied, they are classified in level 1 of the fair value hierarchy. When market quotations are not readily available, when the Adviser determines the last bid price does not accurately reflect the current value or when restricted securities are being valued, such securities are valued as determined in good faith by the Adviser, in conformity with guidelines adopted by and subject to review of the Board of Trustees (the “Trustees” or the “Board”) and are categorized in level 2 or level 3, when appropriate.
Money market funds. Money market funds are valued at net asset value and are classified in level 1 of the fair value hierarchy.
Fixed income securities. Fixed income securities generally are valued by using market quotations, but may be valued on the basis of prices furnished by a pricing service when the Adviser believes such prices accurately reflect the fair value of such securities. A pricing service utilizes electronic data processing techniques based on yield spreads relating to securities with similar characteristics to determine prices for normal institutional-size trading units of debt securities without regard to sale or bid prices. When prices are not readily available from a pricing service, or when restricted or illiquid securities are being valued, securities are valued at fair value as determined in good faith by the Adviser, subject to review of the Board. Short-term investments in fixed income securities with maturities of less than 60 days when acquired, or which subsequently are within 60 days of maturity, may be valued by using the amortized cost method of valuation. Generally, fixed income securities are categorized as level 2.
In accordance with the Trust’s good faith pricing guidelines, the Adviser is required to consider all appropriate factors relevant to the value of securities for which it has determined other pricing sources are not available or reliable as described above. There is no single standard for deter-
2015 Annual Report 10
Notes to Financial Statements - continued
mining fair value, since fair value depends upon the circumstances of each individual case. As a general principle, the current fair value of an issue of securities being valued by the Adviser would appear to be the amount which the owner might reasonably expect to receive for them upon their current sale. Methods which are in accordance with this principle may, for example, be based on (i) a multiple of earnings; (ii) a discount from market of a similar freely traded security (including a derivative security or a basket of securities traded on other markets, exchanges or among dealers); or (iii) yield to maturity with respect to debt issues, or a combination of these and other methods.
The following table summarizes the inputs used to value the Fund’s assets measured at fair value as of December 31, 2015:
| Valuation Inputs of Assets | Level 1 | Level 2 | Level 3 | Total | ||||
| Common Stocks | $17,183,834 | $0 | $0 | $17,183,834 | ||||
| Money Market Funds | 2,323,415 | 0 | 0 | 2,323,415 | ||||
| Total | $19,507,249 | $0 | $0 | $19,507,249 |
Refer to the Fund’s Schedule of Investments for a listing of securities by industry. The Fund did not hold any Level 3 assets during the fiscal year ended December 31, 2015. There were no transfers into or out of the levels during the fiscal year ended December 31, 2015. It is the Fund’s policy to consider transfers into or out of the levels as of the end of the reporting period.
The Fund did not invest in derivative instruments during the fiscal year ended December 31, 2015.
4.) INVESTMENT ADVISORY AGREEMENT
The Trust, on behalf of the Fund has entered into an investment advisory agreement (the “Management Agreement”) with Mundoval Capital Management, Inc. (the “Adviser”). Under the terms of the Management Agreement, the Adviser manages the investment portfolio of the Fund, subject to policies adopted by the Trust’s Board. Under the Management Agreement, the Adviser, at its own expense and without reimbursement from the Trust, furnishes office space and all necessary office facilities, equipment and executive personnel necessary for managing the assets of the Fund. The Adviser also pays the salaries and fees of all of its officers and employees that serve as officers and trustees of the Trust. The Adviser pays all operating expenses of the Fund with the exception of taxes, brokerage fees and commissions, acquired fund fees and expenses, borrowing costs (such as (a) interest and (b) dividend expenses on securities sold short), and extraordinary expenses. For its services, the Adviser receives an annual investment management fee payable monthly from the Fund of 1.50% of the average daily net assets of the Fund. The Adviser has agreed to waive a portion of its management fee (the “Fee Waiver”) so that the management fee, on an annual basis, does not exceed (i) 1.25% of the Fund’s average daily net assets greater than $25 million and up to and including $75 million, and (ii) 1.00% of the Fund’s average daily net assets greater than $75 million. The Fee Waiver will automatically terminate on April 30, 2016 unless it is renewed by the Adviser. The Adviser may not terminate the Fee Waiver before April 30, 2016. For the fiscal year ended December 31, 2015, the Adviser earned management fees totaling $314,717, of which $24,352 was payable to the Adviser as of December 31, 2015. No management fees were waived during the fiscal year ended December 31, 2015. Arthur Q. Johnson is the control person of the Adviser and also serves as a trustee/officer of the Trust. This individual receives benefits from the Adviser resulting from management fees paid to the Adviser by the Fund.
5.) RELATED PARTY TRANSACTIONS
The Trustees who are not interested persons of the Fund were paid $1,000 each, for a total of $3,000, in Trustees fees by the Adviser for the fiscal year ended December 31, 2015. Under the Management Agreement, the Adviser pays these fees.
6.) INVESTMENTS
For the fiscal year ended December 31, 2015, purchases and sales of investment securities other than U.S. Government obligations and short-term investments aggregated $2,119,316 and $3,487,701, respectively. There were no purchases or sales of U.S. Government obligations.
7.) CONTROL OWNERSHIP
The beneficial ownership, either directly or indirectly, of more than 25% of the voting shares of a fund creates a presumption of control of a fund, under Section 2(a)(9) of the Investment Company Act of 1940. As of December 31, 2015, Arthur Q. Johnson and immediate family members, locat-
þ2015 Annual Report 11
Notes to Financial Statements - continued
ed at 7855 Ivanhoe Ave., Suite 210, La Jolla, California, beneficially held 52.33% of the Fund, and therefore may be deemed to control the Fund. Mr. Johnson is the President of the Adviser and serves as a Trustee of the Trust.
8.) CAPITAL SHARES
The Trust is authorized to issue an unlimited number of shares of beneficial interest for the Fund. Paid in capital for the Fund at December 31, 2015 was $16,753,790 representing 1,406,419 shares outstanding.
9.) TAX MATTERS
For federal income tax purposes, the cost of investments owned at December 31, 2015 was $17,318,895. At December 31, 2015, the composition of unrealized appreciation (the excess of value over tax cost) and depreciation (the excess of tax cost over value) was as follows:
| Appreciation | (Depreciation) | Net Appreciation (Depreciation) | |||
| $4,518,284 | ($2,329,930) | $2,188,354 |
The tax character of distributions paid during the periods shown below were as follows:
| Distributions paid from: | |||||
| Year Ended | Year Ended | ||||
| December 31, 2015 | December 31, 2014 | ||||
| Ordinary Income | $ 86,700 | $ 127,580 | * | ||
| Short-Term Capital Gain | 0 | 4,362 | |||
| Long-Term Capital Gain | 500,983 | 1,202,617 | |||
| $ 587,683 | $ 1,334,559 | ||||
* The difference between ordinary distributions paid from book and ordinary distributions paid from tax relates to $40,252 of allowable foreign tax credits from the fiscal year ended December 31, 2014, which have been passed through to the Fund’s underlying shareholders.
As of December 31, 2015, the components of distributable earnings (accumulated losses) on a tax basis were as follows:
| Undistributed ordinary income/(accumulated losses) | $ | 36,544 | |
| Undistributed capital gain/(accumulated losses) | (227,078 | ) | |
| Unrealized appreciation/(depreciation) | 2,188,354 | ||
| $ | 1,997,820 |
As of December 31, 2015, there were no book to tax differences.
10.) CAPITAL LOSS CARRYFORWARDS
As of December 31, 2015, the Fund had available for federal tax purposes unused capital loss carryforwards of $227,078, of which $17,037 is short-term with no expiration and $210,041 is long-term with no expiration.
11.) SUBSEQUENT EVENTS
Subsequent events after the date of the Statement of Assets and Liabilities have been evaluated through the date the financial statements were issued. Management has concluded that there is no impact requiring adjustment or disclosure in the financial statements.
2015 Annual Report 12
REPORT OF INDEPENDENT REGISTERED PUBLIC ACCOUNTING FIRM
To the Shareholders and Board of Trustees of
Mundoval Fund
We have audited the accompanying statement of assets and liabilities, including the schedule of investments, of Mundoval Fund (the "Fund") as of December 31, 2015, and the related statement of operations for the year then ended, the statements of changes in net assets for each of the two years in the period then ended, and the financial highlights for each of the five years in the period then ended. These financial statements and financial highlights are the responsibility of the Fund's management. Our responsibility is to express an opinion on these financial statements and financial highlights based on our audits.
We conducted our audits in accordance with the standards of the Public Company Accounting Oversight Board (United States). Those standards require that we plan and perform the audit to obtain reasonable assurance about whether the financial statements and financial highlights are free of material misstatement. An audit includes examining, on a test basis, evidence supporting the amounts and disclosures in the financial statements. Our procedures included confirmation of securities owned as of December 31, 2015, by correspondence with the custodian and brokers. An audit also includes assessing the accounting principles used and significant estimates made by management, as well as evaluating the overall financial statement presentation. We believe that our audits provide a reasonable basis for our opinion.
In our opinion, the financial statements and financial highlights referred to above present fairly, in all material respects, the financial position of Mundoval Fund as of December 31, 2015, the results of its operations for the year then ended, the changes in its net assets for each of the two years in the period then ended, and the financial highlights for each of the five years in the period then ended, in conformity with accounting principles generally accepted in the United States of America.
COHEN FUND AUDIT SERVICES, LTD.
Cleveland, Ohio
February 8, 2016
2015 Annual Report 13
TRUSTEES AND OFFICERS
(Unaudited)
The Board of Trustees supervises the business activities of the Trust. The names of the Trustees and executive officers of the Trust are shown below. Each Trustee serves until the Trustee dies, resigns, retires or is removed. Officers hold office for one year and until their respective successors are chosen and qualified.
The trustees and officers of the Trust and their principal business activities during the past five years are:
Interested Trustees and Officers
| Position | Principal | Number of | Other | ||
| Name, | with the | Length of | Occupation(s) | Portfolios | Directorships |
| Address(1), | Trust | Time | During | Overseen | Held By |
| and Age | Served | Past 5 Years | By Trustee | Trustee | |
| Arthur Q. Johnson(2), | President, Secretary, | Indefinite | President of Mundoval Capital | 1 | None |
| 54 | Treasurer | Term, | Management, Inc. (2002 – current), | ||
| and Trustee | Since 2004 | ||||
| N/A | N/A | ||||
| Natalie M. Gumina, | Chief Compliance | Indefinite | Chief Operating Officer and | ||
| 33 | Officer | Term, | Investment Advisory | ||
| Since 2006 | Representative of Mundoval Capital | ||||
| Management, Inc. (August 2006 – | |||||
| current). | |||||
| (1) The address of each trustee and officer is c/o Mundoval Funds, 7855 Ivanhoe Ave., Ste. 210, La Jolla, CA 92037. (2) Arthur Q. Johnson is considered an "interested person" as defined in Section 2(a)(19) of the Investment Company Act of 1940 by virtue of his affiliation with the Adviser. Independent Trustees |
| Name, | Position | Length of | Principal | Number of | Other |
| Address(3), | with the | Time | Occupation(s) | Portfolios | Directorships |
| and Age | Trust | Served | During | Overseen | Held By |
| Past 5 Years | By Trustee | Trustee | |||
| Martha G. Dennis, | Trustee | Indefinite | Principal, Gordian Knot | 1 | None |
| PhD., 73 | Term, Since | (2005 – current). | |||
| July 2013 | |||||
| Paul J. Dostart, 64 | Trustee | Indefinite | Managing Partner of Dostart | 1 | None |
| Term, Since | Clapp & Coveney LLP (1996 – | ||||
| May 2014 | current). | ||||
| Selwyn Isakow, 63 | Trustee | Indefinite | Chairman & CEO, The Oxford | 1 | Champion |
| Term, | Investment Group, Inc. (1985 – | Enterprises | |||
| Since | current). Chairman, San Diego | Inc. | |||
| February | Private Bank, (2006 – current). | (1991 – 2009) | |||
| 2012 | |||||
(3) The address of each Trustee is c/o Mundoval Funds, 7855 Ivanhoe Ave., Ste. 210, La Jolla, CA 92037.
The Statement of Additional Information contains additional and more detailed information about the Trustees and is available without charge by calling the transfer agent at 1-800-595-2877.
2015 Annual Report 14
Board of Trustees
|
| This report is provided for the general information of the shareholders of the Mundoval Fund. This report is not intended for distribution to prospective investors in the Fund, unless preceded or accompanied by an effective prospectus. |
Item 2. Code of Ethics.
The registrant has adopted a code of ethics that applies to the registrant’s principal executive officer and the principal financial officer. The registrant has not made any amendments to its code of ethics during the covered period. The registrant has not granted any waivers from any provisions of the code of ethics during the covered period. A copy of the registrant’s Code of Ethics is filed herewith.
Item 3. Audit Committee Financial Expert.
The registrant’s Board of Trustees has determined that Selwyn Isakow is an audit committee finical expert. Mr. Isakow is independent for purposes of this Item 3.
Item 4. Principal Accountant Fees and Services.
(a-d) The following table details the aggregate fees billed for each of the last two fiscal years for audit fees, audit-related fees, tax fees and other fees by the principal accountant to the registrant. The principal accountant has provided no services to the adviser or any entity controlled by, or under common control with the adviser that provides ongoing services to the registrant.
| FYE 12/31/15 | FYE 12/31/14 | |||
| Audit Fees | $14,750 | $14,760 | ||
| Audit-Related Fees | $0 | $0 | ||
| Tax Fees | $3,000 | $3,000 | ||
| All Other Fees | $750 | $750 |
Nature of Tax Fees: preparation of Excise Tax Statement and 1120 RIC.
Nature of All Other Fees: Review of Semi-Annual Report.
(e) (1) The audit committee approves all audit and non-audit related services and, therefore, has not adopted pre-approval policies and procedures described in paragraph (c)(7) of Rule 2-01 of Regulation S-X.
(e) (2) None of the services described in paragraph (b) through (d) of this Item were approved by the audit committee pursuant to paragraph (c)(7)(i)(C) of Rule 2-01 of Regulation S-X.
(f) All of the principal accountant’s hours spent on auditing the registrant’s financial statements were attributed to work performed by full-time permanent employees of the principal accountant.
(g) The following table indicates the aggregate non-audit fees billed by the registrant’s principal accountant for services to the registrant , the registrant’s investment adviser (not sub-adviser), and any entity controlling, controlled by, or under common control with the adviser that provides ongoing services to the registrant, for the last two years.
| Non-Audit Fees | FYE 12/31/15 | FYE 12/31/14 | ||
| Registrant | $3,750 | $3,750 | ||
| Registrant’s Investment Adviser | $0 | $0 |
(h) The principal accountant provided no services to the investment adviser or any entity controlling, controlled by, or under common control with the adviser that provides ongoing services to the registrant.
Item 5. Audit Committee of Listed Companies. Not applicable.
Item 6. Schedule of Investments. Schedule filed with Item 1.
Item 7. Disclosure of Proxy Voting Policies and Procedures for Closed-End Management Investment Companies. Not applicable.
Item 8. Portfolio Managers of Closed End Management Investment Companies. Not applicable.
Item 9. Purchases of Equity Securities by Closed-End Management Investment Companies and Affiliated Purchasers. Not applicable.
Item 10. Submission of Matters to a Vote of Security Holders.
The registrant has not adopted procedures by which shareholders may recommend nominees to the registrant’s board of trustees.
Item 11. Controls and Procedures.
(a) The registrant’s president and chief financial officer concluded that the disclosure controls and procedures (as defined in Rule 30a-3(c) under the Investment Company Act of 1940 (the “Act”)) were effective as of a date within 90 days of the filing date of this report, based on the evaluation of these controls and procedures required by Rule 30a-3(b) under the Act.
(b) There were no changes in the registrant’s internal control over financial reporting (as defined in Rule 30a-3(d) under the Act) that occurred during the registrant’s second fiscal quarter of the period covered by this report that have materially affected, or are reasonably likely to materially affect, the registrant’s internal control over financial reporting.
Item 12. Exhibits.
(a)(1) Code of Ethics. Filed herewith.
(a)(2) Certifications pursuant to Section 302 of the Sarbanes-Oxley Act of 2002. Filed herewith.
(a)(3) Not applicable.
(b) Certification pursuant to Section 906 Certification of the Sarbanes-Oxley Act of 2002. Filed herewith.
SIGNATURES
Pursuant to the requirements of the Securities Exchange Act of 1934 and the Investment Company Act of 1940, the registrant has duly caused this report to be signed on its behalf by the undersigned, thereunto duly authorized.
| Mundoval Funds |
| By: /s/Arthur Q. Johnson Arthur Q. Johnson President |
| Date: FEB. 20. 2016 |
Pursuant to the requirements of the Securities Exchange Act of 1934 and the Investment Company Act of 1940, this report has been signed below by the following persons on behalf of the registrant and in the capacities and on the dates indicated.
| By: /s/Arthur Q. Johnson Arthur Q. Johnson President |
| Date: FEB. 20. 2016 |
By: /s/Arthur Q. Johnson |
| Date: FEB. 20. 2016 |