| Item 6. Investments | | | | |
| | | | | | |
| Mundoval Fund |
| | | | | | |
| | | | Schedule of Investments |
| | June 30, 2024 (Unaudited) |
| | | | | | |
| Shares | | | Fair Value | | % of Net Assets |
| | | | | | |
| COMMON STOCKS | | | | |
| | | | | | |
| Aerospace & Defense | | | | |
| 3,500 | Airbus SE ** | | $ 119,840 | | 0.44% |
| | | | | | |
| Aircraft Engines & Engine Parts | | | | |
| 800 | Honeywell International Inc. | | 170,832 | | |
| 4,000 | RTX Corp. | | 401,560 | | |
| | | | 572,392 | | 2.08% |
| | | | | | |
| Beverages | | | | | |
| 4,000 | Diageo PLC ** | | 504,320 | | |
| 12,000 | LVMH Moët Hennessy Louis Vuitton ** | | 1,840,200 | | |
| | | | 2,344,520 | | 8.53% |
| | | | | | |
| Cable & Other Pay Television Services | | | | |
| 2,064 | The Walt Disney Company | | 204,935 | | 0.74% |
| | | | | | |
| Electronic Computers | | | | |
| 10,000 | Apple Inc. | | 2,106,200 | | 7.66% |
| | | | | | |
| Fabricated Rubber Products, NEC | | | | |
| 400 | West Pharmaceutical Services, Inc. | | 131,756 | | 0.48% |
| | | | | | |
| Fire, Marine & Casualty Insurance | | | | |
| 1,600 | Berkshire Hathaway Inc. Class B * | | 650,880 | | 2.37% |
| | | | | | |
| Food and Kindred Products | | | | |
| 6,000 | Nestlé S.A. ** | | 614,700 | | 2.24% |
| | | | | | |
| Guided Missiles & Space Vehicles & Parts | | | | |
| 700 | Lockheed Martin Corporation | | 326,970 | | 1.19% |
| | | | | | |
| Hospital & Medical Service Plans | | | | |
| 600 | Elevance Health, Inc. | | 325,116 | | |
| 200 | UnitedHealth Group Inc. | | 101,852 | | |
| | | | 426,968 | | 1.55% |
| | | | | | |
| Industrial Inorganic Chemicals | | | | |
| 400 | Linde PLC (United Kingdom) | | 175,524 | | 0.64% |
| | | | | | |
| Insurance Agents, Brokers & Service | | | | |
| 400 | Arthur J. Gallagher & Co. | | 103,724 | | 0.38% |
| | | | | | |
| Interactive Media & Services | | | | |
| 2,500 | Tencent Holdings Limited ** | | 118,400 | | 0.43% |
| | | | | | |
| Measuring & Controlling Devices, NEC | | | | |
| 200 | Thermo Fisher Scientific Inc. | | 110,600 | | 0.40% |
| | | | | | |
| National Commercial Banks | | | | |
| 25,000 | Bank of America Corporation | | 994,250 | | |
| 500 | Capital One Financial Corporation | | 69,225 | | |
| | | | 1,063,475 | | 3.87% |
| | | | | | |
| Perfumes, Cosmetics & Other Toilet Preparations | | | | |
| 5,000 | The Estée Lauder Companies Inc. Class A | | 532,000 | | 1.94% |
| | | | | | |
| Pharmaceutical Preparations | | | | |
| 2,000 | Merck & Co. | | 247,600 | | |
| 15,000 | Novo Nordisk A/S ** | | 2,141,100 | | |
| 1,100 | Zoetis Inc. | | 190,696 | | |
| | | | 2,579,396 | | 9.38% |
| | | | | | |
| Retail - Family Clothing Stores | | | | |
| 12,000 | The TJX Companies, Inc. | | 1,321,200 | | 4.81% |
| | | | | | |
| Retail - Variety Stores | | | | |
| 100 | Costco Wholesale Corporation | | 84,999 | | 0.31% |
| | | | | | |
| Rubber & Plastics Footwear | | | | |
| 8,000 | NIKE, Inc. Class B | | 602,960 | | 2.19% |
| | | | | | |
| Search, Detection, Navigation, Guidance, Aeronautical Systems | | | |
| 700 | Northrop Grumman Corp. | | 305,165 | | 1.11% |
| | | | | | |
| Security & Commodity Brokers, Dealers, Exchanges & Services | | | | |
| 5,000 | T. Rowe Price Group, Inc. | | 576,550 | | 2.10% |
| | | | | | |
| Security Brokers, Dealers & Flotation Companies | | | | |
| 150 | BlackRock, Inc. | | 118,098 | | |
| 1,500 | The Charles Schwab Corporation | | 110,535 | | |
| | | | 228,633 | | 0.83% |
| | | | | | |
| Semiconductors & Related Devices | | | | |
| 2,000 | Intel Corporation | | 61,940 | | |
| 7,500 | Taiwan Semiconductor Manufacturing Company Ltd. ** | 1,303,575 | | |
| | | | 1,365,515 | | 4.97% |
| | | | | | |
| Services - Business Services, NEC | | | | |
| 7,000 | MasterCard Incorporated Class A | | 3,088,120 | | |
| 700 | Visa Inc. Class A | | 183,729 | | |
| | | | 3,271,849 | | 11.90% |
| | | | | | |
| Services - Computer Programming, Data Processing, Etc. | | | | |
| 12,000 | Alphabet Inc. Class A | | 2,185,800 | | |
| 12,000 | Alphabet Inc. Class C | | 2,201,040 | | |
| | | | 4,386,840 | | 15.96% |
| | | | | | |
| Services - Prepackaged Software | | | | |
| 600 | Microsoft Corporation | | 268,170 | | 0.98% |
| | | | | | |
| Soap, Detergents, Cleaning Preparations, Perfumes, Cosmetics | | | |
| 6,000 | Unilever PLC ** | | 329,940 | | 1.20% |
| | | | | | |
| Special Industry Machinery, NEC | | | | |
| 300 | ASML Holding N.V. ** | | 306,819 | | 1.12% |
| | | | | | |
| Sugar & Confectionery Products | | | | |
| 4,500 | The Hershey Company | | 827,235 | | 3.01% |
| | | | | | |
| Total for Common Stocks (Cost - $8,435,529) | | 26,058,155 | | 94.81% |
| | | | | | |
| MONEY MARKET FUNDS | | | | |
| 1,445,890 | Goldman Sachs FS Government Fund Institutional | | | | |
| | Portfolio Institutional Class 5.22% *** | | 1,445,890 | | 5.26% |
| | (Cost - $ 1,445,890) | | | | |
| | | | | | |
| | Total Investment Securities | | 27,504,045 | | 100.07% |
| | (Cost - $9,881,419) | | | | |
| | | | | | |
| | Liabilities in Excess of Other Assets | | (19,440) | | -0.07% |
| | | | | | |
| | Net Assets | | $ 27,484,605 | | 100.00% |
| | | | | | |
| | | | | | |
| | | | | | |
| | | | | | |
| SUMMARY OF COMMON STOCKS BY COUNTRY | | | | |
| | | | | | % of Common |
| | | | Fair Value | | Stocks |
| China | | | $ 118,400 | | 0.45% |
| Denmark | | | 2,141,100 | | 8.22% |
| France | | | 1,840,200 | | 7.06% |
| Netherlands | | | 426,659 | | 1.64% |
| Switzerland | | | 614,700 | | 2.36% |
| Taiwan | | | 1,303,575 | | 5.00% |
| United Kingdom | | 1,009,784 | | 3.88% |
| United States | | | 18,603,737 | | 71.39% |
| | | | $ 26,058,155 | | 100.00% |
| | | | | | |
| | | | | | |
| | | | | | |
| * Non-Income Producing Securities. | | | | |
| ** ADR - American Depositary Receipt. | | | | |
| *** The yield shown represents the 7-day yield at June 30, 2024. | | | | |
| The accompanying notes are an integral part of these financial statements. | | |
| NOTES TO THE FINANCIAL STATEMENTS |
| MUNDOVAL FUND |
| June 30, 2024 |
| (Unaudited) |
| | | | | | | | | | |
| 1.) ORGANIZATION | | | | | | | | | |
The Mundoval Fund (the “Fund”) is a diversified series of the Mundoval Funds (the “Trust”), an open-end management investment company. The Trust was organized in Ohio as a business trust on March 24, 2004 and may offer shares of beneficial interest in a number of separate series, each series representing a distinct fund with its own investment objectives and policies. The Trust is registered as an open-end management investment company under the Investment Company Act of 1940, as amended (the “1940 Act”). The Fund commenced operations on September 3, 2004. The Fund’s investment objective is long-term capital appreciation.
|
| | | | | | | | | | |
| 2.) SIGNIFICANT ACCOUNTING POLICIES | | | | | | | |
The Fund is an investment company and accordingly follows the investment company accounting and reporting guidance of the Financial Accounting Standards Board (“FASB”) Accounting Standards Codification Topic 946 Financial Services - Investment Companies. The financial statements are prepared in conformity with accounting principles generally accepted in the United States of America (“GAAP”). The Fund follows the significant accounting policies described in this section.
|
| | | | | | | | | | |
| SECURITY VALUATION: | | | | | | | | | |
| All investments in securities are valued as described in Note 3. |
| | | | | | | | | | |
| SHARE VALUATION: | | | | | | | | | |
The net asset value (the “NAV”) is generally calculated as of the close of trading on the New York Stock Exchange (the “Exchange”) (normally 4:00 p.m. Eastern time) every day the Exchange is open. The NAV is calculated by taking the total value of the Fund’s assets, subtracting its liabilities, and then dividing by the total number of shares outstanding, rounded to the nearest cent. The offering price and redemption price per share are equal to the net asset value per share.
|
| | | | | | | | | | |
| FEDERAL INCOME TAXES: | | | | | | | | | |
The Fund’s policy is to continue to comply with the requirements of the Internal Revenue Code that are applicable to regulated investment companies and to distribute all of its taxable income to shareholders. Therefore, no federal income tax provision is required. It is the Fund’s policy to distribute annually, prior to the end of the calendar year, dividends sufficient to satisfy excise tax requirements of the Internal Revenue Code. This Internal Revenue Code requirement may cause an excess of distributions over the book year-end accumulated income. In addition, it is the Fund’s policy to distribute annually, after the end of the fiscal year, any remaining net investment income and net realized capital gains.
|
| | | | | | | | | | |
The Fund recognizes the tax benefits of certain tax positions only where the position is “more likely than not” to be sustained assuming examination by tax authorities. Management has analyzed the Fund’s tax positions, and has concluded that no liability for unrecognized tax benefits should be recorded related to uncertain tax positions taken on returns filed for open tax years. The Fund identifies its major tax jurisdictions as U.S. Federal and California tax authorities; however, the Fund is not aware of any tax positions for which it is reasonably possible that the total amounts of unrecognized tax benefits will change materially in the next twelve months. The Fund recognizes interest and penalties, if any, related to unrecognized tax benefits as income tax expense in the Statement of Operations. During the six month period ended June 30, 2024, the Fund did not incur any interest or penalties.
|
| | | | | | | | | | |
| DISTRIBUTIONS TO SHAREHOLDERS: | | | | | | | |
Distributions to shareholders, which are determined in accordance with income tax regulations, are recorded on the ex-dividend date. The treatment for financial reporting purposes of distributions made to shareholders during the year from net investment income or net realized capital gains may differ from their ultimate treatment for federal income tax purposes. These differences are caused primarily by differences in the timing of the recognition of certain components of income, expenses or realized capital gain for federal income tax purposes. Where such differences are permanent in nature, they are reclassified in the components of the net assets based on their ultimate characterization for federal income tax purposes. Any such reclassifications will have no effect on net assets, results of operations or net asset values per share of the Fund.
|
| | | | | | | | | | |
| USE OF ESTIMATES: | | | | | | | | | |
The financial statements are prepared in accordance with GAAP, which requires management to make estimates and assumptions that affect the reported amounts of assets and liabilities and disclosure of contingent assets and liabilities at the date of the financial statements and the reported amounts of increases and decreases in net assets from operations during the reporting period. Actual results could differ from those estimates.
|
| | | | | | | | | | |
| OTHER: | | | | | | | | | |
The Fund records security transactions based on trade date. Dividend income is recognized on the ex-dividend date. Interest income, if any, is recognized on an accrual basis. The Fund uses the specific identification method in computing gain or loss on sale of investment securities. Withholding taxes on foreign dividends have been provided for in accordance with the Fund’s understanding of the applicable country’s tax rules and regulations.
|
| | | | | | | | | | |
| 3.) SECURITY VALUATIONS | | | | | | | | | |
The Fund utilizes various methods to measure the fair value of its investments on a recurring basis. GAAP establishes a hierarchy that prioritizes inputs to valuation methods. The three levels of inputs are:
|
| | | | | | | | | | |
Level 1 – Unadjusted quoted prices in active markets for identical assets or liabilities that the Fund has the ability to access.
|
| | | | | | | | | | |
Level 2 – Observable inputs other than quoted prices included in level 1 that are observable for the asset or liability, either directly or indirectly. These inputs may include quoted prices for the identical instrument in an inactive market, prices for similar instruments, interest rates, prepayment speeds, credit risk, yield curves, default rates and similar data.
|
| | | | | | | | | | |
Level 3 – Unobservable inputs for the asset or liability, to the extent relevant observable inputs are not available, representing the Fund’s own assumptions about the assumptions a market participant would use in valuing the asset or liability, and would be based on the best information available.
|
| | | | | | | | | | |
The availability of observable inputs can vary from security to security and is affected by a wide variety of factors, including, for example, the type of security, whether the security is new and not yet established in the marketplace, the liquidity of markets, and other characteristics particular to the security. To the extent that valuation is based on models or inputs that are less observable or unobservable in the market, the determination of fair value requires more judgment. Accordingly, the degree of judgment exercised in determining fair value is greatest for instruments categorized in level 3.
|
| | | | | | | | | | |
The inputs used to measure fair value may fall into different levels of the fair value hierarchy. In such cases, for disclosure purposes, the level in the fair value hierarchy within which the fair value measurement falls in its entirety, is determined based on the lowest level input that is significant to the fair value measurement in its entirety.
|
| | | | | | | | | | |
| FAIR VALUE MEASUREMENTS | | | | | | | | | |
A description of the valuation techniques applied to the Fund’s major categories of assets measured at fair value on a recurring basis follows.
|
| | | | | | | | | | |
Equity securities (common stocks, including ADRs). Equity securities generally are valued by using market quotations but may be valued on the basis of prices furnished by a pricing service when the Valuation Committee believes such prices accurately reflect the fair market value of such securities. Securities that are traded on any stock exchange or on the NASDAQ over-the-counter market are generally valued by the pricing service at the last quoted sale price. Lacking a last sale price, an equity security is generally valued by the pricing service at its last bid price. Generally, if the security is traded in an active market and is valued at the last sale price, the security is categorized as a level 1 security, and if an equity security is valued by the pricing service at its last bid, it is generally categorized as a level 2 security. When market quotations are not readily available, when the Valuation Committee determines that the market quotation or the price provided by the pricing service does not accurately reflect the current market value, or when restricted or illiquid securities are being valued, such securities are valued pursuant to the Trust's Fair Value Pricing procedures. The Trust’s Valuation Committee consists of the Trust’s independent trustees, and the Fund portfolio manager as a non-voting member.
|
| | | | | | | | | | |
Money market funds. Money market funds are valued at net asset value provided by the underlying funds and are classified in level 1 of the fair value hierarchy.
|
| | | | | | | | | | |
In accordance with the Trust's Valuation and Fair Value Pricing Policies and Procedures, it is incumbent upon the Valuation Committee to consider all appropriate factors relevant to the value of securities for which market quotations are not readily available. No single standard for determining fair value can be established, since fair value depends upon the circumstances of each individual case. As a general principle, the current fair value of an issue of securities being valued by the Valuation Committee would appear to be the amount that the owner might reasonably expect to receive for them upon their current sale. Methods that are in accordance with this principle may, for example, be based on (i) a multiple of earnings; (ii) a discount from market of a similar freely traded security (including a derivative security or a basket of securities traded on other markets, exchanges or among dealers); or (iii) yield to maturity with respect to debt issues, or a combination of these or other methods.
|
| | | | | | | | | | |
The following table summarizes the inputs used to value the Fund’s assets measured at fair value as of June 30, 2024:
|
| | | | | | | | | | |
| Valuation Inputs of Assets | | Level 1 | | Level 2 | | Level 3 | | Total | |
| Common Stocks | | $ 26,058,155 | | $ - | | $ - | | $ 26,058,155 | |
| Money Market Funds | | 1,445,890 | | - | | - | | 1,445,890 | |
| Total | | $ 27,504,045 | | $ - | | $ - | | $ 27,504,045 | |
| | | | | | | | | | |
| The Fund did not hold any Level 3 assets during the six month period ended June 30, 2024. |
| | | | | | | | | | |
The Fund did not invest in derivative instruments during the six month period ended June 30, 2024.
|
| | | | | | | | | | |
| 4.) INVESTMENT ADVISORY AGREEMENT | | | | | | | |
The Trust, on behalf of the Fund has entered into an investment advisory agreement (the “Management Agreement”) with Mundoval Capital Management, Inc. (the “Adviser”). Under the terms of the Management Agreement, the Adviser manages the investment portfolio of the Fund, subject to policies adopted by the Trust’s Board. Under the Management Agreement, the Adviser, at its own expense and without reimbursement from the Trust, furnishes office space and all necessary office facilities, equipment and executive personnel necessary for managing the assets of the Fund. The Adviser also pays the salaries and fees of all of its officers and employees that serve as officers and trustees of the Trust. The Adviser pays all operating expenses of the Fund with the exception of taxes, brokerage fees and commissions, acquired fund fees and expenses, borrowing costs (such as (a) interest and (b) dividend expenses on securities sold short), and extraordinary expenses. For its services, the Adviser receives an annual investment management fee payable monthly from the Fund of 1.50% of the average daily net assets of the Fund. The Adviser has agreed to waive, without recoupment, a portion of its management fee (the “Fee Waiver”) so that the management fee, on an annual basis, does not exceed (i) 1.25% of the Fund’s average daily net assets greater than $25 million and up to and including $75 million, and (ii) 1.00% of the Fund’s average daily net assets greater than $75 million. The Fee Waiver will automatically terminate on April 30, 2025, unless it is renewed by the Adviser. The Adviser may not terminate the Fee Waiver before April 30, 2025. For the six month period ended June 30, 2024, the Adviser earned management fees totaling $199,549, of which $33,533 was payable to the Adviser as of June 30, 2024. For the six month period ended June 30, 2024, the Adviser waived fees in the amount of $2,179 with no recapture provision.
|
| | | | | | | | | | |
Arthur Q. Johnson is the control person of the Adviser and also serves as a trustee/officer of the Trust. This individual receives benefits from the Adviser resulting from management fees paid to the Adviser by the Fund.
|
| | | | | | | | | | |
| 5.) RELATED PARTY TRANSACTIONS | | | | | | | |
The Trustees who are not interested persons of the Fund were paid $0 each in Trustees fees by the Adviser for the six month period ended June 30, 2024. Under the Management Agreement, the Adviser pays these fees.
|
| | | | | | | | | | |
| 6.) INVESTMENTS | | | | | | | | | |
| For the six month period ended June 30, 2024, purchases and sales of investment securities other than U.S. Government obligations and short-term investments aggregated $847,876 and $1,600,117, respectively. There were no purchases or sales of U.S. Government obligations. |
| | | | | | | | | | |
| 7.) CONTROL OWNERSHIP | | | | | | | | | |
The beneficial ownership, either directly or indirectly, of more than 25% of the voting shares of a fund creates a presumption of control of a fund, under Section 2(a)(9) of the 1940 Act. As of June 30, 2024, Arthur Q. Johnson and immediate family members, located at 7855 Ivanhoe Ave., Suite 210, La Jolla, California, beneficially held 67.83% of the Fund, and therefore may be deemed to control the Fund. Mr. Johnson is the President of the Adviser and serves as a Trustee of the Trust.
|
| | | | | | | | | | |
| 8.) TAX MATTERS | | | | | | | | | |
For federal income tax purposes, the cost of investments owned at June 30, 2024 was $9,881,419. At June 30, 2024, the composition of unrealized appreciation (the excess of value over tax cost) and depreciation (the excess of tax cost over value) was as follows:
|
| | | | | | | | | | |
| Appreciation | | Depreciation | Net Appreciation/(Depreciation) |
| $17,633,853 | | ($11,227) | | $17,622,626 | |
| | | | | | | | | | |
As of June 30, 2024, there were no differences between book and tax basis unrealized appreciation.
|
| | | | | | | | | | |
| The tax character of distributions paid during the periods shown below were as follows: |
| | | | | | | | | | |
| | Six Months Ended | | Year Ended | | |
| | June 30, 2024 | | December 31, 2023 | | |
| Ordinary Income | | $ - | | | | $ - | | | |
| Long-Term Capital Gains | | - | | | | 787,763 | | | |
| | | $ - | | | | $ 787,763 | | | |
| | | | | | | | | | |
| 9.) CONCENTRATION OF SECTOR RISK | | | | | | | |
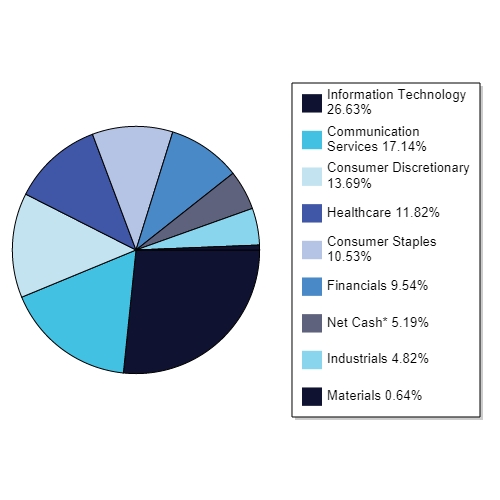
If a Fund has significant investments in the securities of issuers in industries within a particular sector, any development affecting that sector will have a greater impact on the value of the net assets of the Fund than would be the case if the Fund did not have significant investments in that sector. In addition, this may increase the risk of loss of an investment in the Fund and increase the volatility of the Fund’s NAV per share. From time to time, circumstances may affect a particular sector and the companies within such sector. For instance, economic or market factors, regulation or deregulation, and technological or other developments may negatively impact all companies in a particular sector and therefore the value of a Fund’s portfolio will be adversely affected. As of June 30, 2024, the Fund had 26.63% of the value of its net assets invested in stocks within the Information Technology sector.
|
| | | | | | | | | | |
| 10.) SUBSEQUENT EVENTS | | | | | | | | | |
Subsequent events after the date of the Statement of Assets and Liabilities have been evaluated through the date the financial statements were issued. Management has concluded that there is no impact requiring adjustment to or disclosure in the financial statements.
|
| Item 11. Statement Regarding Basis for Approval of Investment Advisory Contract. | |
| | | | | | | | | | |
On February 22, 2024, the Board of Trustees (the “Board” or the “Trustees”) considered the continuance of the management agreement (the “Agreement”) between the Trust and the Adviser, on behalf of the Fund. Legal counsel reviewed the memorandum provided, including the factors that the Board should evaluate in considering the continuance of the Agreement. Counsel further explained that, in consideration of the continuance of the Agreement, the Board should review as much information as is reasonably necessary to evaluate the terms of the Agreement and determine whether it is fair to the Fund and its shareholders. Counsel also explained that the Adviser has provided information to the Trustees necessary for evaluation of the continuance of the Agreement.
|
| | | | | | | | | | |
| In reviewing the Agreement, the Board of Trustees received and reviewed materials from the Adviser addressing the following factors: (i) the investment performance of the Fund and the investment adviser; (ii) the nature, extent and quality of the services provided by the investment adviser to the Fund; (iii) the cost of the services to be provided and the profits to be realized by the Adviser and its affiliates from the relationship with the Fund; (iv) the extent to which economies of scale will be realized as the Fund grows; and (v) whether the fee levels reflect these economies of scale to the benefit of shareholders. |
| |
| The Board met with representatives of the Adviser to discuss the terms of the Agreement. The Board reviewed the history of the Adviser, including background and investment management experience, as well as the Fund’s performance for various periods thru December 31, 2023, important factors relating to the Fund’s performance, the Adviser’s investment and research strategy, the Adviser’s strength, and expected expenses and revenue from the Fund. |
| | | | | | | | | | |
| The Board gave careful consideration to factors deemed relevant to the Trust and the Fund as well as the nature, extent and quality of the services to be provided by the Adviser and the performance of the Fund since commencement of operations. The Trustees analyzed the Adviser’s experience and the capabilities of the portfolio manager. The Trustees reviewed and discussed the Adviser’s Form ADV, internal compliance policies and financial statements. The Trustees also compared the Fund’s management fee and total annual operating expenses with those of comparable funds. |
| | | | | | | | | | |
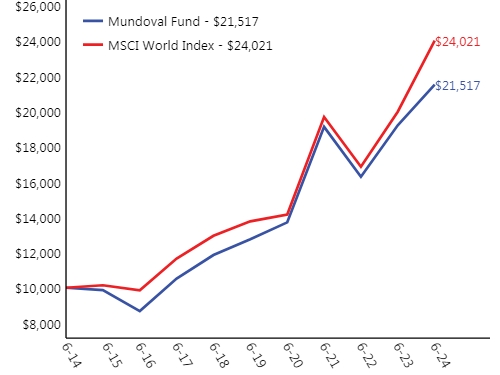
As to the performance of the Fund, the Trustees reviewed the materials from the Adviser, which included information regarding the Fund’s performance compared to a peer group of similar funds and the global large-stock growth category average. The Trustees reviewed materials showing specific returns comparing the Fund to its peer group, its benchmark index, and category average for the 1-year, 5-year, 10-year and since inception (September 3, 2004) periods ended December 31, 2023. The Trustees noted that (i) for the 1-year period ended December 31, 2023, the Fund underperformed the MSCI World Index, the global large-stock growth category and the peer group; (ii) for the 5-year annualized period ended December 31, 2023, the Fund outperformed the MSCI World Index, the peer group and the global large-stock growth category; (iii) for the 10-year annualized period ended December 31, 2023, the Fund underperformed the MSCI World Index, outperformed the peer group, and underperformed the global large-stock growth category; and (iv) the Fund slightly trailed the Index’s performance since inception. The Trustees noted that the Fund’s short-term comparative performance and long-term performance was relatively comparative overall. The Trustees noted that for each period reported the Fund’s performance was within the range of its peer group and the global large-stock growth category funds performances. The Trustees understood the sources of the outperformance and underperformance over various periods and were satisfied with the Adviser’s management of the Fund.
|
| | | | | | | | | | |
| As to the nature, extent and quality of the services provided by the Adviser, the Trustees analyzed the Adviser’s experience and capabilities. Representatives of the Adviser summarized the information provided to the Board. The Trustees discussed the Adviser’s financial condition, the portfolio manager’s background and investment management experience. The Board noted that there were no changes in the personnel managing the Fund or in the business or organization of the Adviser. The representatives of the Adviser reviewed and discussed the Adviser's ADV and the 17j-1 certifications with the Board. Representatives of the Adviser also discussed the Adviser’s financial stability. After reviewing the foregoing and further information from the Adviser, the Board concluded that the quality, extent, and nature of the services being provided by the Adviser were satisfactory and adequate and believes that the Adviser has the resources to meet its obligations under the Agreement. They noted that the Adviser continued to provide excellent portfolio management and compliance services. |
| | | | | | | | | | |
| As to the cost of the services to be provided and the profits to be realized by the Adviser and its affiliates from the relationship with the Fund, it was noted that the Adviser is paying substantially all operating expenses of the Fund. Additionally, the Trustees considered that the Adviser provides the Fund with officers, including the CCO, marketing support and office space. Representatives of the Adviser reviewed a summary of the Adviser’s profitability resulting from the services provided to the Fund for the period since the last renewal. The analysis showed the net profits from portfolio advisory services as well as the overall slight profit related to the Fund. The Trustees noted their discussion with Cohen regarding the Adviser’s expertise and the management fee charged by the Adviser. The Trustees also compared the Fund’s management fee and total annual operating expenses with those of comparable funds. The Board noted that overall, the Adviser was properly incentivized to continue to provide robust services. |
| | | | | | | | | | |
Turning to the level of the management fee, the Trustees were presented with a comparative analysis of advisory fees and expense ratios based on publicly available data and drawn from the global large-stock growth category and the Fund’s peer group, including a comparison of funds with similar asset ranges. It was noted that while the Adviser’s management fee was the highest in the peer group and at the high end of the global large-stock growth category, the Adviser is responsible under the Agreement for paying all but a very small fraction of the Fund’s expenses out of the management fee. The Board noted that the effective net management fee after payment of direct expenses was reasonable. The Trustees further noted that the Fund is within the range of the global large-stock growth category and peer group for annual report net expense ratio and prospectus net expense ratio. The Board reviewed the fees paid to the Adviser for separately managed accounts. It was noted that the fee was less than that charged to the Fund. However, it was noted that the Adviser does not provide the same comprehensive level of services to separate accounts as is provided to the Fund. Furthermore, the Board noted that the effective management fee rate after the Adviser pays expenses for the Fund was acceptable. Having considered the comparative data as described above, the Trustees concluded that the management fee and expense ratio were reasonable.
|
| | | | | | | | | | |
| As for potential economies of scale, the Trustees discussed and considered information regarding whether there have been economies of scale with respect to the management of the Fund, whether the Fund has appropriately benefited from any economies of scale, and whether there is potential for realization of any further economies of scale. The Trustees noted that the Adviser voluntarily agreed to waive a portion of its management fee so that the management fee, on an annual basis, does not exceed (i) 1.25% of the Fund’s average daily net assets greater than $25 million and up to and including $75 million, and (ii) 1.00% of the Fund’s average daily net assets greater than $75 million through April 30, 2024. A representative of the Adviser noted that he anticipates extending the waiver through April 30, 2025. The Trustees concluded that breakpoints were unnecessary because of the expense limitation agreement voluntarily entered into by the Adviser. |
| | | | | | | | | | |
Next, the Independent Trustees met in executive session to discuss the continuation of the Agreement. The officers of the Trust were excused during this discussion.
|
| | | | | | | | | | |
| Upon reconvening the meeting, the Trustees reported that they were satisfied with the performance of the Fund. They concluded that the nature and extent of services provided by the Adviser were consistent with the Board’s expectations. The Trustees also concluded that the Adviser has sufficient resources and had provided quality advisory services to the Fund. The Board agreed that the fees in the Agreement were reasonable and that the Adviser profitability was acceptable. The Trustees agreed that economies of scale will benefit shareholders as the Fund grows. Therefore, it was the consensus of the Trustees, including the Independent Trustees, that renewal of the Management Agreement would be in the best interests of the Fund and its shareholders. |