UNITED STATES
SECURITIES AND EXCHANGE COMMISSION
Washington, D.C. 20549
FORM 10-Q/A
(Mark One)
x | Quarterly Report Pursuant to Section 13 or 15(d) of the Securities Exchange Act of 1934 |
For the quarterly period ended June 30, 2006
or
¨ | Transition Report Pursuant to Section 13 of 15(d) of the Securities Exchange Act of 1934 |
For the Transition Period From to
Commission File number: 000-50601
SYNUTRA INTERNATIONAL, INC.
(Exact name of registrant as specified in its charter)
| DELAWARE | 13-4306188 | |
(State or other jurisdiction of incorporation or organization) | (IRS Employer Identification No.) |
15200 Shady Grove Road, Suite 350
Rockville, Maryland 20850
(Address of principal executive offices)
(301) 840-3888
(Registrant’s telephone number, including area code)
Vorsatech Ventures, Inc.
Former Name, Former Address and Former Fiscal Year, if Changed Since Last Report
Check whether the Registrant (1) has filed all reports required to be filed by Section 13 or 15(d) of the Securities Exchange Act of 1934 during the preceding 12 months (or for such shorter period that the Registrant was required to file such reports), and (2) has been subject to such filing requirements for the past 90 days.
Yes x No ¨
Indicate by check mark whether the registrant is a large accelerated filer, an accelerated filer, or a non-accelerated filer. See definition of “accelerated filer and large accelerated filer” in Rule 12b-2 of the Exchange Act.
Large accelerated filer ¨ Accelerated filer ¨ Non-accelerated filer x
Indicate by check mark whether the registrant is a shell company (as defined in Rule 12b-2of the Exchange Act).
Yes ¨ No x
As of July 31, 2006, there were 50,000,713 shares of Common Stock outstanding.
Reasons For Amendment
This filing is being amended to include, revise or omit information necessary to improve the disclosures as follows:
| Disclosure of the financial statements has been revised to describe and quantify material activities that generate income statement variances between periods (the amount of increase in sales that was attributable to price increases separately from the change attributable to volume increases). |
| Financial Statements have been revised to disclose the dollar amount of related party transactions on the face of financial statements. |
| Financial Statements have been revised to present the historical shares of common stock of Vorsatech that were issued and the historical activity in the Common Stock and Additional Paid-in Capital accounts during periods to the merger. The earnings per share have been revised also. |
| Financial Statements have been revised to reflect the cost of services rendered by various consultants and finder that received 2,844,500 shares and 35,000 shares, respectively, in conjunction with the share exchange. |
| Disclosure has been added to the financial statements, “Restatement” to elaborate upon the criteria of revenue recognition policy specifically applies to the retailers and to the distributors. |
| Disclosure has been added to the financial statements, “Restatement” to describe the nature and amounts of revenue dilution. |
| Disclosure has been added to the financial statements , “Restatement” to describe the tax holiday of subsidiaries. |
SYNUTRA INTERNATIONAL, INC.
FORM 10-Q
For the Quarter Ended June 30, 2006
| 3 -4 | ||
| 5 | ||
| 6 | ||
| 7-8 | ||
| 9-20 | ||
| 21 | ||
| 27 | ||
| 28 |
FINANCIAL INFORMATION
SYNUTRA INTERNATIONAL, INC. AND SUBSIDIARIES
(INCORPORATED IN THE STATE OF DELAWARE
WITH LIMITED LIABILITY)
June 30, | March 31, | ||||||
2006 | 2006 | ||||||
ASSETS | (as restated, unaudited) | (as restated, audited) | |||||
Current Assets | |||||||
| Cash and cash equivalents | $ | 25,877,244 | $ | 22,133,869 | |||
| Short term investment - at market | 42,671 | 42,557 | |||||
| Notes receivables | 148,955 | — | |||||
| Trade receivables, net of provisions | 8,287,013 | 2,539,717 | |||||
| Inventories, net of provisions | 8,464,441 | 11,789,433 | |||||
| Advances to suppliers | 2,328,675 | 354,052 | |||||
| Other receivables, net of provisions | 2,993,559 | 2,229,869 | |||||
| Due from related parties | 7,383,290 | 8,602,363 | |||||
| Including: Trade receivables | 35,910 | 2,018,344 | |||||
| Other receivables | 1,562,275 | 2,058,250 | |||||
| Prepayment | 5,785,105 | 4,525,769 |
| Deferred expenses | 79,667 | 125,931 | |||||
Total current assets | 55,605,515 | 47,817,791 | |||||
Property, plant and equipment, net | 13,601,653 | 13,727,873 | |||||
Other Assets | |||||||
| Intangible assets,net | 246,937 | 264,562 | |||||
| Construction in progress | 21,693,020 | 21,198,431 | |||||
TOTAL ASSETS | $ | 91,147,125 | $ | 83,008,658 | |||
The accompanying notes are an integral part of the consolidated financial statements.
SYNUTRA INTERNATIONAL, INC. AND SUBSIDIARIES
(INCORPORATED IN THE STATE OF DELAWARE
WITH LIMITED LIABILITY)
CONSOLIDATED BALANCE SHEETS
June 30, | March 31, | ||||||
2006 | 2006 | ||||||
| LIABILITIES & SHAREHOLDERS' EQUITY | (as restated, unaudited) | (as restated, audited) | |||||
Current Liabilities | |||||||
| Bank loans | $ | 17,551,071 | $ | 13,133,534 | |||
| Notes payable | 23,200,260 | 19,112,823 | |||||
| Trade payables | 9,312,636 | 12,579,942 | |||||
| Advance from customers | 756,034 | 932,843 | |||||
| Other payables | 5,395,525 | 4,569,873 | |||||
| Accrued expenses | 605,794 | 498,786 | |||||
| Tax payables | 1,910,042 | 1,996,789 | |||||
| Due to related parties | 2,204,319 | 4,301,137 | |||||
| Including: Trade payables | 2,204,319 | 4,301,137 |
Total current liabilities | $ | 60,935,681 | $ | 57,125,726 | |||
Long term debt | — | 4,932,182 | |||||
Total liabilities | $ | 60,935,681 | $ | 62,057,909 | |||
Minority interest | — | — | |||||
Shareholders' equity | |||||||
| Preferred Stock ($0.0001 par value; 20,000,000 authorized; 0 issued and outstanding) | — | — | |||||
| Common Stock (0.0001 par value; 250,000, 000 authorized; 50,000,713 issued and outstanding) | 5,000 | 5,000 | |||||
| Additional paid-in capital | 8,226,033 | 8,226,033 | |||||
| Reserves | 45,804 | 45,804 | |||||
| Retained earnings | 20,838,996 | 11,618,515 | |||||
| Accumulated other comprehensive income/(loss) | 1,095,611 | 1,055,397 | |||||
Total shareholders' equity | $ | 30,211,444 | $ | 20,950,749 | |||
TOTAL LIABILITIES AND SHAREHOLDERS' EQUITY | $ | 91,147,125 | $ | 83,008,658 | |||
The accompanying notes are an integral part of the consolidated financial statements.
SYNUTRA INTERNATIONAL, INC. AND SUBSIDIARIES
(INCORPORATED IN THE STATE OF DELAWARE
WITH LIMITED LIABILITY)
Three Months ended June 30 | |||||||
2006 | 2005 | ||||||
(as restated, unaudited) | (as restated, unaudited) | ||||||
Sales | $ | 42,676,120 | $ | 17,401,827 | |||
| Including sales to related parties | 47,708 | 341,500 |
| Cost of sales | 20,644,247 | 8,456,140 |
| Including cost of sales to related parties | 23,091 | 165,969 |
Gross profit | 22,031,873 | 8,945,687 | |||||
| Selling & distribution expenses | 5,042,348 | 1,814,977 | |||||
| Advertising and promotion | 6,928,074 | 5,257,881 | |||||
| General & administrative expenses | 993,542 | 859,501 | |||||
Income from operations | 9,067,909 | 1,013,328 | |||||
| Finance costs | (408,794 | ) | (415,286 | ) | |||
| Subsidy income | 1,387,420 | 604,120 | |||||
| Interest income | 61,132 | 63,830 | |||||
| Other income/(expenses) | (92,551 | ) | 484,355 | ||||
Income before tax | 10,015,116 | 1,750,346 | |||||
| Corporation income tax - current | 794,635 | 25,566 | |||||
Net income before minority interests | 9,220,481 | 1,724,780 | |||||
| Minority interests | — | (576 | ) | ||||
Net income attributable to shareholders | 9,220,481 | 1,724,204 | |||||
| Other Comprehensive income/-Foreign currency translation | 40,214 | 26,877 | |||||
Comprehensive income | 9,260,695 | 1,751,081 | |||||
Earning per share | |||||||
| Basic and diluted | $ | 0.18 | $ | 0.04 | |||
Weighted average common shares outstanding | |||||||
| Basic and diluted | 50,000,713 | 46,000,000 | |||||
The accompanying notes are an integral part of the consolidated financial statement.
SYNUTRA INTERNATIONAL, INC. AND SUBSIDIARIES
(INCORPORATED IN THE STATE OF DELAWARE
WITH LIMITED LIABILITY)
(as restated, unaudited)
| Common | Additional | Accumulated | Total | |||||||||||||||||||
| Stock | Share | paid-in | Retained | comprehensive | Stockholder’s | |||||||||||||||||
| outstanding | capital | capital | Reserves | profits | income(loss) | Equity | ||||||||||||||||
| Balance at March 31, 2005 | 46,000,000 | $ | 4,600 | $ | 7,205,809 | $ | 45,804 | $ | 583,603 | $ | (218,158 | ) | $ | 7,621,658 | ||||||||
| Capital contribution during quarter | — | — | 470,985 | — | — | — | 470,985 | |||||||||||||||
| Net income for the quarter | — | — | — | — | 1,724,204 | — | 1,724,204 | |||||||||||||||
| Foreign currency translation | — | — | — | — | — | 26,877 | 26,878 | |||||||||||||||
| Balance at June 30, 2005 | 46,000,000 | 4,600 | 7,676,794 | 45,804 | 2,307,807 | (191,281 | ) | 9,843,725 | ||||||||||||||
| Balance at March 31, 2006 | 50,000,713 | 5,000 | 8,226,033 | 45,804 | 11,618,515 | 1,055,397 | 20,950,749 | |||||||||||||||
| Net income for the quarter | — | — | — | — | 9,220,481 | — | 9,220,481 | |||||||||||||||
| Foreign currency translation | — | — | — | — | — | 40,214 | 40,214 | |||||||||||||||
| Balane at June 30, 2006 | 50,000,713 | $ | 5,000 | $ | 8,226,033 | $ | 45,804 | $ | 20,838,996 | $ | 1,095,611 | $ | 30,211,444 | |||||||||
| (1) | All shares and additional paid-in capital have been restated to reflect recapitalization on July 15, 2005. |
The accompanying notes are an integral part of the consolidated financial statements.
(INCORPORATED IN THE STATE OF DELAWARE
WITH LIMITED LIABILITY)
Three Months ended June 30 | |||||||
2006 | 2005 | ||||||
(as restated, unaudited) | (as restated, unaudited) | ||||||
Cash Flows from Operating Activities: | |||||||
| Net income | $ | 9,220,481 | $ | 1,724,204 | |||
| Adjustments to reconcile net income to | |||||||
| net cash provided by operating activities: | |||||||
| Depreciation and amortization | 371,436 | 358,370 | |||||
| Bad Debt Expenses/øIncome) | (18,566 | ) | - | ||||
| Gain on short term investment | (114 | ) | (3,891 | ) | |||
| Minority interest | — | 576 | |||||
| Changes in operating assets and liabilities: | |||||||
| Notes receivable | (148,955 | ) | (4,470 | ) | |||
| Trade receivable | (5,728,730 | ) | (13,649 | ) | |||
| Inventories | 3,324,992 | 311,389 | |||||
| Advances to suppliers | (1,974,624 | ) | 83,834 | ||||
| Other receivable, net | (763,690 | ) | (561,641 | ) | |||
| Deferred expenses | 46,265 | (2,436,600 | ) | ||||
| Due from related parties | 1,219,073 | 2,767,135 | |||||
| Due to related parties | (2,096,817 | ) | (1,452,258 | ) | |||
| Notes payable | 4,087,438 | 1,329,064 | |||||
| Trade payable | (3,267,307 | ) | 436,083 | ||||
| Advances from customers | (176,809 | ) | 855,871 | ||||
| Other payable & accrued expenses | 932,661 | 32,061 | |||||
| Tax payable | (86,747 | ) | - | ||||
Net Cash Provided by Operating Activities | 4,939,986 | 3,426,079 | |||||
Cash Flows from Investing Activities: | |||||||
| Acquisition of property, plant and equipment | (224,551 | ) | (1,066,068 | ) | |||
| Cash used for construction in progress | (494,589 | ) | (1,208,507 | ) | |||
| Purchases of intangible assets | (3,039 | ) | (302 | ) | |||
Net Cash Used in Investing Activities | (722,179 | ) | (2,274,877 | ) | |||
The accompanying notes are an integral part of the consolidated financial statements.
SYNUTRA INTERNATIONAL, INC. AND SUBSIDIARIES
(INCORPORATED IN THE STATE OF DELAWARE
WITH LIMITED LIABILITY)
CONSOLIDATED STATEMENTS OF CASH FLOW (CONTINUED)
Three Months ended June 30 | |||||||
2006 | 2005 | ||||||
(as restated, unaudited) | (as restated, unaudited) | ||||||
Cash Flows from Financing Activites: | |||||||
| Inception of bank loans, net | 1,208,240 | ||||||
| Repayment of bank loans, net | (514,646 | ) | |||||
| (Excess of)/ capital contribution | — | 470,985 | |||||
Net Cash Used in Financing Activities | (514,646 | ) | 1,679,225 | ||||
Net Change in Cash and Cash Equivalents | 3,703,161 | 2,830,427 | |||||
| Effect of Exchange Rate Changes on Cash and Cash Equivalents | 40,214 | 26,877 | |||||
| Cash and cash equivalents, beginning of period | 22,133,869 | 16,085,403 | |||||
Cash and cash equivalents, end of period | $ | 25,877,244 | $ | 18,942,707 | |||
Supplementary Cash Flows Disclosures | |||||||
| Interest paid | $ | 344,945 | $ | 360,243 | |||
| Income taxes paid | $ | 795,699 | $ | 7,793 | |||
The accompanying notes are an integral part of the consolidated financial statements.
1. DESCRIPTION OF BUSINESS
The Company is a Delaware corporation that at June 30, 2006 owned 100% of six subsidiary companies in the People’s Republic of China (“PRC” or “China”). These six subsidiaries are all principally engaged in different stages of the production, distribution, and sales of dairy based infant formulas and other nutritional products. The Company’s extensive sales network covers 24 provinces, 227 cities, and more than 800 counties throughout China. In 2004, the Company’s infant formula market share was rated number eight among international manufacturers and number three among domestic manufacturers in China. The Company’s fiscal year end is March 31.
2. CRITICAL ACCOUNTING POLICIES AND ESTIMATES
The accompanying unaudited condensed consolidated financial statements have been prepared in accordance with generally accepted accounting principles for interim financial information and with the instructions to Form 10-Q. Accordingly, they do not include all of the information and footnotes required by generally accepted accounting principles for complete financial statements and related notes.
In the opinion of management, the accompanying unaudited condensed consolidated financial statements contain all adjustments (which include only normal recurring adjustments) necessary to present fairly the balance sheet of Synutra , Inc. and subsidiaries as of June 30, 2006, and the results of their operations and their cash flows for the three month periods ended June 30, 2006 and 2005. The results of operations for the three month periods ended June 30, 2006 and 2005 are not necessarily indicative of the results to be expected for the entire year. The condensed consolidated balance sheet information as of March 31, 2006 was derived from the audited Fiscal 2005 Annual Report. These financial statements should read in conjunction with that report.
The following critical accounting policies affect the more significant judgments and estimates used in the preparation of the Company’s consolidated financial statements.
For certain of the Company's consolidated financial instruments, including cash and cash equivalents, trade receivables and payables, prepaid expenses, deposits and other current assets, short-term bank borrowings, and other payables and accruals, the carrying amounts approximate fair values due to their short maturities.
A related party is generally defined as (i) any person that holds 10% or more of the Company's securities and their immediate families, (ii) the Company's management, (iii) someone that directly or indirectly controls, is controlled by or is under common control with the Company, or (iv) anyone who can significantly influence the financial and operating decisions of the Company. A transaction is considered to be a related party transaction when there is a transfer of resources or obligations between related parties.
Accounting method
The Company uses the accrual method of accounting which recognizes revenues when earned and expenses when incurred.
Principles of consolidation
The consolidated financial statements as of June 30, 2006, the related consolidated statements of income for the three months ended June 30, 2006 and 2005, and the related consolidated statements of cash flows and stockholders’ equity statements for the three months ended June 30, 2006 and 2005 are unaudited. All significant inter-company balances and transactions have been eliminated in the consolidation.
The following companies are consolidated for financial statement presentation:
Name of subsidiaries | June 30, 2006 | Incorporation date | |||||
| Qingdao St. George Dairy Co. Ltd | 100 | % | Sep-01 | ||||
| Qingdao Sheng Yuan Dairy Co. Ltd | 100 | % | Jan-98 | ||||
| Heilongjiang Loubei Sheng Yuan Food Co. Ltd | 100 | % | Apr-01 | ||||
| Bei’an Yipin Dairy Co. Ltd | 100 | % | Jun-04 | ||||
| Qingdao Women and Children Nutrition Research Co. Ltd | 100 | % | Apr-04 | ||||
| Zhangjiakou Shen Yuan Co. Ltd * | 100 | % | Mar-04 | ||||
* Zhangjiakou completed a merger with Chaibei Sheng Yuan as of August 2005 and Zhangjiakou emerged as the surviving entity from the merger
Cash and cash equivalents
The Company considers cash and cash equivalents to include cash on hand and demand deposits with banks with an original maturity of three months or less.
30-Jun-06 | 30-Jun-05 | 31-Mar-06 | ||||||||
| Cash | $ | 8,777,152 | $ | 7,703,052 | $ | 5,676,616 | ||||
| Cash restricted | 17,100,092 | 11,239,654 | 16,457,253 | |||||||
| Total | $ | 25,877,244 | $ | 18,942,707 | $ | 22,133,869 | ||||
Cash restricted is 30%, 50%, or 100% of bank demand deposits used as security against notes payables of 3 to 6 months terms. This is used by the Company as a short term instrument to reduce short-term interest expenses.
Accounts receivable
The Company presents accounts receivable, net of allowance for doubtful accounts. The allowance is calculated based on review of individual customer accounts.
Trade receivables are recognized and carried at the original invoice amount less allowance for any uncollectible amounts. An estimate for doubtful accounts is made when collection of the full amount is no longer probable. Bad debts are written off as incurred. The allowance on the doubtful accounts was $398,577 and $202,401 as at June 30, 2006 and 2005, respectively.
Inventories
Inventories are stated at the lower of cost or net realizable value. Cost is calculated on the moving-average basis and includes all costs to acquire and other costs incurred in bringing the inventories to their present location and condition. The Company evaluates the net realizable value of its inventories on a regular basis and records a provision for loss to reduce the computed weighted-average cost if it exceeds the net realizable value. Net realizable value is the estimated selling price in the ordinary course of business less the estimated costs of completion and the estimated costs necessary to make the sale.
Property, plant and equipment
Property, plant and equipment are stated at cost less accumulated depreciation and impairment losses. The initial cost of the asset comprises its purchase price and any directly attributable costs of bringing the asset to its working condition and location for its intended use. Depreciation is provided using the straight-line method over the assets estimated useful life for periods ranging from five to fifty years. Significant improvements and betterments are capitalized where it is probable that the expenditure resulted in an increase in the future economic benefits expected to be obtained form the use of the asset beyond its originally assessed standard of performance. Routine repairs and maintenance are expensed when incurred. Gains and losses on disposal of fixed assets are recognized in the income statement based on the net disposal proceeds less the carrying amount of the assets.
Depreciation is calculated on a straight-line basis over the estimated useful lives of the assets. The useful lives for property, plant and equipment are as follows:
| Buildings and leasehold improvement | 40 - 50 years |
| Plant and machinery | 5 - 10 years |
| Office equipment and furnishings | 5 years |
| Motor vehicles | 5 years |
Income taxes
Income taxes of the Company’s subsidiaries are calculated in accordance with taxation principles currently effective in the PRC. For Synutra Illinois, applicable U.S. tax laws are followed. Deferred tax assets and liabilities are recognized for the future tax consequences attributable to differences between the financial statement carrying amounts of existing assets and liabilities and their respective tax bases. Deferred tax assets and liabilities are measured using enacted tax rates expected to apply to taxable income in the years in which those temporary differences are expected to be recovered or settled. The effect on deferred tax assets and liabilities of a change in tax rates is recognized as income in the period that includes the enactment date. A valuation allowance is provided for the amount of deferred tax assets and liabilities that, based on available evidence, are not expected to be realized.
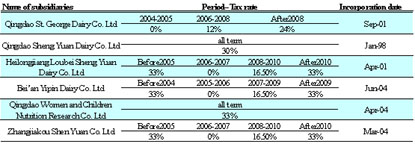
Qingdao St. George Dairy Co., Ltd ,Heilongjiang Loubei Shengyuan Dairy Co. Ltd, Bei’an Yipin Dairy Co. Ltd and Zhangjiakou Sheng Yuan Co. Ltd qualify as a foreign investment production enterprise and were established in a special economic zone. As approved by the tax authorities, such subsidiaries are entitled to a two year exemption from income taxes followed by three years of a 50% tax reduction, commencing from the first cumulative profit-making year net of losses carried forward.
Qingdao St. George Dairy Co., Ltd. is under such preferential tax treatment until December 31, 2008. Accordingly, the applicable enterprise income tax rate is 24% and the local tax rate is0%, resulting in an aggregate tax rate of 24%. The subsidiary will not be subject to local income tax prior to 2003,The subsidiary’s first cumulative profit-making year was 2004.
Heilongjiang Luobei Sheng Yuan Dairy Co., Ltd. is under such preferential tax treatment until December 31, 2010. Accordingly, the applicable enterprise income tax rate is 30% and the local tax rate is3%, resulting in an aggregate tax rate of 33%. The subsidiary will not be subject to local income tax prior to 2005, The subsidiary’s first cumulative profit-making year was2006.
Bei’an Yipin Dairy Co., Ltd. is under such preferential tax treatment until December 31, 2009. Accordingly, the applicable enterprise income tax rate is30% and the local tax rate is 3%, resulting in an aggregate tax rate of 33%. The subsidiary will not be subject to local income tax prior to 2004. The subsidiary’s first cumulative profit-making year was 2005.
Zhangjiakou Sheng Yuan Dairy Co., Ltd. is under such preferential tax treatment until December 31, 2010. Accordingly, the applicable enterprise income tax rate is 30% and the local tax rate is 3%, resulting in an aggregate tax rate of 33%. The subsidiary will not be subject to local income tax prior to 2005. The subsidiary’s first cumulative profit-making year was 2006.
Qingdao Women and Children Nutrition Research Co. Ltd is subject to 33% income tax.
Tax Rates Schedule for various operating subsidiaries of the Company in China is as follows.
Revenue recognition
The Company recognizes revenue from product sales when goods are shipped or delivered and rewards and risk of ownership and title pass to the customer. Revenues consist of the invoice value of the sale of goods and services net of value added tax, rebates and discounts, certain sales incentives, trade promotions, and product returns. Revenue dilution is accounted for either as reductions in sales in the same period the related sales are recorded, or as provisions with best estimates.
Most of the Company’s mainline product sales are through distributors. The Company’s revenue arrangement with all its distributors requires distributor advance payment before shipment and delivery of goods to distributors. Under this distributor arrangement, evidenced by purchase order together with advance payment, sales revenue is realized and earned upon shipment and acceptance of delivery of products to and by distributors. The Company applies this revenue recognition policy uniformly to all its mainline products, including all dairy-based pediatric and adult nutritional products. Revenue recognition criteria outlined in the provisions of SAB 104, namely, persuasive evidence of arrangement, product delivery, fixed and determinable product prices, and reasonable assurance of collectibility are, therefore, met and self-evident.
A fraction of the Company’s mainline product sales are through supermarket retailers directly. Revenue arrangement with these retailers requires receipt of purchase orders before product shipment and delivery. Similarly, the revenues from retailers are recognized upon shipment or delivery of the goods to the retailers under payment terms of the sales contracts which are negotiated with select long term retailers, to assure reasonable collectibility.
Product returns to the supermarket retailers are charged against current sales revenues. These include product returns due to package damages in transportation and shelf-life expiration. Majority of the Company’s products carry shelf lives of 18 to 24 months. Unsold products with expired shelf life are returned and deducted from sales revenue. The arrangement meets the revenue recognition criteria under FASB Statement of Financial Accounting Standards No.48.
The Company has put in place internal controls to track and assess product returns from retailers. Product returns are verified at the source, removed from shelf, and deducted from revenue. The Company evaluates market conditions for products or groups of products primarily through the analysis of third party sell-through and market research data, as well as internally generated information. Portions of the sales returns are estimated and recorded based on historical sales and returns information. Products that exhibit unusual sales or return patterns due to dating, competition or other marketing matters are specifically investigated and analyzed as part of the accounting for sales return accruals.
On top of standard distributor pricing arrangements, the Company provides its larger distributors with a growth-based incentive mechanism that ties incremental discounts to the levels of incremental sales growth attained in the corresponding periods. Qualified discounts are accrued in the corresponding periods during which the sales growth materialized. The cost of this policy is treated as discount and is charged against sales revenue of the corresponding period.
Most of the Company’s products are shipped to the distributors upon receipt of payment directly from them, and thus assume title of the products immediately. No single customer constitutes a significant distributor to the Company by commanding more than 3% of its total sales.
The Company does not employ any sales incentive programs aimed at inducing sales to customers that result in excess inventory levels. The practice of the Company’s standard cash in advance revenue arrangement with distributors also discourages customers from accumulating excessive inventory beyond their normal business needs.
Construction in progress
Construction in progress represents direct costs of construction or acquisition and design fees incurred. Capitalization of these costs ceases and the construction in progress is transferred to plant and equipment when substantially all the activities necessary to prepare the assets for their intended use are completed. No depreciation is provided until it is completed and ready for intended use.
The capitalized interest accrued up to the three months ended June 30, 2006 was $73,641 associated with construction in progress
Intangible assets
Intangible assets - Intangible assets represent computer software and applications. Intangible assets are measured initially at cost. Intangible assets are recognized if it is probable that the future economic benefits that are attributable to the asset will flow to the enterprise and the cost of the asset can be measured reliably.
The net carrying amount of the intangible assets was $246,937 at June 30, 2006 and $311,934 at June 30, 2005 respectively
Government subsidies
Subsidies from the government are recognized at their fair values when received or there is reasonable assurance that they will be received, and all attached conditions are complied with. The Subsidies from the government were $1,387,420 and $604,120 during the three months ended June 30, 2006 and 2005, respectively.
Related parties
Parties are considered to be related if one party has the ability, directly or indirectly, to control the other party or exercise significant influence over the other party in making financial and operational decisions. Parties are also considered to be related if they are subject to common control or common significant influence. Related parties may be individuals or corporate entities. The related parties were excluded from consolidation due to equity structure and other business reasons.
Foreign currency translation
The Company maintains its books and accounting records in Renminbi ("RMB"), the PRC's currency, being the functional currency. Transactions denominated in foreign currencies are translated into the reporting currency at the exchange rates prevailing on the transaction dates. Assets and liabilities denominated in foreign currencies are translated into the reporting currency at the exchange rates prevailing at the balance sheet date. Income and expenditures are translated at the average exchange rate of this term.
June 30, 2006 | |||||||||||||
| Balance sheet | RMB | 7.9956 | to US | $ | 1.00 | ||||||||
| Operating statement | RMB | 8.0063 | to US | $ | 1.00 | ||||||||
June 30, 2005 | |||||||||||||
| Balance sheet | RMB | 8.2765 | to US | $ | 1.00 | ||||||||
| Operating statement | RMB | 8.2765 | to US | $ | 1.00 | ||||||||
In July 2005, the PRC began to value the RMB against a basket of currencies of its major trading partners, including the U.S. This measure has allowed the RMB yuan to fluctuate within a narrow band vis á vis the U.S. dollars. Since the adoption of this managed flexible exchange rate policy, the RMB has been under pressure to appreciate against the U.S. dollar. This has affected changes in the foreign currency translation over the reporting period and is reflected in the other comprehensive income / (loss) of $40,214 and $26,877 for the three months ended June 30, 2006 and 2005 respectively.
Use of estimates
The preparation of financial statements in conformity with generally accepted accounting principles in the United States of America requires management to make estimates and assumptions that affect the reported amounts of assets and liabilities and disclosure of contingent assets and liabilities at the date of the financial statements, and the reported amounts of revenue and expenses during the reporting period. Actual results when ultimately realized could differ from those estimates.
Fair value of financial instruments
The carrying value of financial instruments including cash, receivables, accounts payable and accrued expenses and debt, approximates their fair value at June 30, 2006 and 2005 due to the relatively short-term nature of these instruments.
Shipping and handing
All shipping and handling are expensed as incurred and outbound freight is not billed to customers. Shipping and handling expenses are included in selling and distribution expenses. The expenses were $950,728 and $588,181 during the three months ended June 30, 2006 and 2005, respectively
Advertising costs and promotion
Advertising costs and promotion include salaries for all salesmen all over the Mainland China and are expensed as incurred. The advertising costs and promotion expenses were $6,928,074 and $5,257,881 during the three months ended June 30, 2006 and 2005, respectively.
Employees’ benefits
Mandatory contributions are made to the Government's health, retirement benefit and unemployment schemes at the statutory rates in force during the period, based on gross salary payments. The cost of these payments is charged to the statement of income in the same period as the related salary cost.
Comprehensive income/(loss)
The Company has adopted the provisions of Statement of Financial Accounting Standards No. 130, "Reporting Comprehensive Income" ("SFAS No. 130"). SFAS No. 130 establishes standards for the reporting and display of comprehensive income, its components and accumulated balances in a full set of general-purpose financial statements. SFAS No. 130 defines comprehensive income (loss) to include all changes in equity except those resulting from investments by owners and distributions to owners, including adjustments to minimum pension liabilities, accumulated foreign currency translation, and unrealized gains or losses on marketable securities. The comprehensive income was $40,214 and $26,877 for the three months ended June 30, 2006 and 2005, respectively.
3. CONCENTRATION OF CREDIT RISK
Financial instruments that potentially subject the Company to significant concentrations of credit risk consist primarily of accounts receivable. The Company performs ongoing credit evaluations with respect to the financial condition of its creditors, but does not require collateral. In order to determine the value of the Company’s accounts receivable, the Company records a provision for doubtful accounts to cover probable credit losses. Management reviews and adjusts this allowance periodically based on historical experience and its evaluation of the collectibility of outstanding accounts receivable. The Company is exposed to the following risk factors:
(i) Credit risks - The Company has policies in place to ensure that sales of products are made to customers with an appropriate credit history. The Company also has a concentration of credit risk due to geographic sales as a majority of its products are marketed and sold in the PRC.
(ii) Liquidity risks - Prudent liquidity risk management implies maintaining sufficient cash, the availability of funding through an adequate amount of committed credit facilities and ability to close out market positions.
(iii) Interest rate risk - The interest rate and terms of repayments of short-term and long-term bank borrowings are approximately 5% per annum. The Company's income and cash flows are substantially independent of changes in market interest rates. The Company has no significant interest-bearing assets. The Company's policy is to maintain all of its borrowings in fixed rate instruments.
4. RECENT PRONOUNCEMENTS
None.
5. ACCOUNT RECEIVABLES
The Company's trade receivables as at June 30, 2006 and 2005 are summarized as follows:
June 30, 2006 | June 30, 2005 | March 31, 2006 | ||||||||
| Trade receivables | $ | 8,685,590 | $ | 2,184,284 | $ | 2,956,860 | ||||
| Less: Allowance for doubtful accounts | (398,577 | ) | (202,401 | ) | (417,143 | ) | ||||
| Trade receivables, net | $ | 8,287,013 | $ | 1,981,883 | $ | 2,539,717 | ||||
6. PROPERTY, PLANT AND EQUIPMENT
June 30, 2006 | June 30, 2005 | March 31, 2006 | ||||||||
Cost: | ||||||||||
| Buildings and leasehold improvement | $ | 7,433,559 | $ | 7,348,308 | $ | 7,313,860 | ||||
| Land use rights | 1,668,050 | 1,607,166 | 1,659,542 | |||||||
| Plant and machinery | 7,317,238 | 6,567,167 | 7,206,411 | |||||||
| Office equipment and furnishings | 947,166 | 861,796 | 988,330 | |||||||
| Motor vehicles | 1,237,656 | 1,573,864 | 1,210,974 | |||||||
| 18,603,669 | 17,958,301 | 18,379,117 | ||||||||
Less: Accumulated depreciation: | ||||||||||
| Buildings and leasehold improvement | 1,376,661 | 1,079,344 | 1,264,683 | |||||||
| Land use rights | 122,546 | 83,285 | 113,585 | |||||||
| Plant and machinery | 2,495,349 | 1,737,303 | 2,306,131 | |||||||
| Office equipment and furnishings | 323,057 | 367,074 | 336,235 | |||||||
| Motor vehicles | 684,403 | 893,210 | 630,610 | |||||||
| 5,002,016 | 4,160,216 | 4,651,244 | ||||||||
| Property, plant and equipment, net | $ | 13,601,653 | $ | 13,798,085 | $ | 13,727,873 | ||||
Depreciation expenses relating to property, land, plant and equipment was $350,064 and $337,805 for the three months ended June 30, 2006 and 2005, respectively.
7. INVENTORIES
The Company's inventories at June 30, 2006 and 2005 are summarized as follows:
June 30,2006 | June 30,2005 | March 31, 2006 | ||||||||
| Raw Materials | $ | 917,612 | $ | 1,054,037 | $ | 1,984,520 | ||||
| Work in Process | 5,578,816 | 3,324,858 | 7,586,465 | |||||||
| Finished Goods | 1,291,860 | 1,541,000 | 2,131,552 | |||||||
| Packing Materials & Other Consumables | 676,153 | 525,737 | 86,896 | |||||||
| Total | $ | 8,464,441 | $ | 6,445,632 | $ | 11,789,433 | ||||
8. DUE FROM/(TO) RELATED PARTIES
The amounts are unsecured, interest-free and have no fixed repayment terms.
A. Classification by name of related parties
a. Due from related parties
June 30, 2006 | June 30, 2005 | March 31, 2006 | ||||||||
| Heilongjiang Baoquanling Shen Yuan Dairy Co. Ltd | $ | 514,450 | $ | 78,946 | $ | 226,383 | ||||
| Sheng Zhi Da Dairy Group Corporation | 629,693 | 2,924,653 | (268,349 | ) | ||||||
| Beijing Kelqin Dairy Co. Ltd | 399,495 | 625,286 | 1,708,230 | |||||||
| St. Angel (Beijing Business Service) | 35,910 | 1,146,200 | 1,761,265 | |||||||
| Beijing Honnete Dairy Corporation Ltd | 5,481,582 | 308,766 | 4,185,149 | |||||||
| Beijing Ao Naier Feed Stuff LLC | 303,524 | 231,466 | 297,892 | |||||||
| Beijing Ludin Xueyuan Trading Co. Ltd | 18,636 | — | 691,793 | |||||||
| Total Due from Related Companies | $ | 7,383,290 | $ | 5,315,317 | $ | 8,602,363 | ||||
b. Due to related parties
June 30, 2006 | June 30, 2005 | March 31, 2006 | ||||||||
| Heilongjiang Baoquanling Shen Yuan Dairy Co. Ltd | $ | 1,200,241 | $ | 1,673,937 | $ | 705,602 | ||||
| Sheng Zhi Da Dairy Group Corporation | 798,162 | 5,682,709 | 2,192,892 | |||||||
| Beijing Kelqin Dairy Co. Ltd | 205,916 | — | 63,909 | |||||||
| Beijing Honnete Dairy Corporation Lrd | 1,338,734 | |||||||||
| Total Due to Related Companies | $ | 2,204,319 | $ | 7,356,646 | $ | 4,301,137 | ||||
B. Classification of Related Party Transactions by Nature
a. Due from related parties | |||||
June 30,2006 | June 30,2005 | March 31, 2006 | ||||||||
| Trade receivables | $ | 35,910 | $ | 552,627 | $ | 2,018,344 | ||||
| Prepayments for goods | 5,785,105 | 1,765,543 | 4,525,769 | |||||||
| Other receivables(other income) | 1,562,275 | 2,924,653 | 2,058,250 | |||||||
| Notes receivables | — | 72,494 | ||||||||
Total | $ | 7,383,290 | $ | 5,315,317 | $ | 8,602,363 | ||||
b. Due to related parties | |||||
June 30,2006 | June 30,2005 | March 31, 2006 | ||||||||
| Trade payables | $ | 2,204,319 | $ | 7,356,087 | $ | 4,301,137 | ||||
| Notes payables | — | — | ||||||||
| Other payables | — | 559 | ||||||||
Total | $ | 2,204,319 | $ | 7,356,646 | $ | 4,301,137 | ||||
9. RELATED PARTY TRANSACTIONS
The following related party transactions occurred during the three months ended June 30, 2006 and 2005:
In the three months ended June 30, 2006 and 2005, the Company’s sales to the related parties included anhydrous milk fat and non-fat dry milk to Beijing Kelgin Dairy Co., Ltd. and Beijing Honnete Dairy Corporation, Ltd.; formulation ingredients to Sheng Zhi Da Dairy Group Corporation, and Heilongjiang Baoquanling Sheng Yuan Dairy Co., Ltd.; and the Company’s name brand products to St Angel (Beijing Business Service) and Luding Xueyuan for direct sales, catalogue sales, and regional retail outlets distribution. Terms of all the sales are at market price.
Sales to related parties
Three Months ended June 30,2006 | Three Months ended June 30,2005 | ||||||
| Beijing Honnete Dairy Corporation Ltd | — | - | |||||
| St. Angel (Beijing Business Service) | 31,776 | 250,134 | |||||
| Beijing Ao Naier Feed Stuff LLC | — | — | |||||
| Beijing Ludin Xueyuan Trading Co. Ltd | 15,932 | 91,366 | |||||
| Total | $ | 47,708 | $ | 341,500 | |||
Other income to related parties
Three Months ended June 30,2006 | Three Months ended June 30,2005 | ||||||
| Beijing Kelqin Dairy Co. Ltd | $ | 378,526 | 507,784 | ||||
| Sheng Zhi Da Dairy Group Corporation | — | 353,621 | |||||
| Heilongjiang Baoquanling Shen Yuan Dairy Co. Ltd | 836,306 | 563,269 | |||||
| Beijing Honnete Dairy Corporation Ltd | 4,157,688 | 95,593 | |||||
| Beijing Ao Naier Feed Stuff LLC | — | — | |||||
| Total | $ | 5,372,520 | $ | 1,520,267 | |||
In the three months ended June 30, 2006 and 2005, the Company’s purchases from related parties included whey protein powders from Beijing Kelgin Dairy Co. Ltd., Beijing Ao Naier Feed Stuff LLC and Beijing Honnete Dairy Corporation Ltd; various ingredients and materials (packaging, etc.) from Sheng Zhi Da Dairy Group Corporation; and spray-dried milk powder from Heilongjiang Baoquanling Sheng Yuan Dairy Co. Ltd.. Terms of these transactions are all done at market prices.
Purchases from related parties
Three months ended June 30, 2006 | Three months ended June 30, 2005 | ||||||
| Beijing Kelqin Dairy Co. Ltd | $ | 157,678 | $ | 921,657 | |||
| Sheng Zhi Da Dairy Group Corporation | — | 617,819 | |||||
| Heilongjiang Baoquanling Sheng Yuan Dairy Co. | 3,354,660 | 2,158,034 | |||||
| Beijing Honnete Dairy Corporation Ltd | 1,159,260 | 970,682 | |||||
| Beijing Ao Naier Feed Stuff LLC | 45,923 | — | |||||
| Beijing Sheng Long Media Co. Ltd | — | 22,685 | |||||
| Total | $ | 4,717,521 | $ | 4,690,877 | |||
10. INTANGIBLES
Intangible assets represent computer software and applications. Intangible assets are measured initially at cost. Intangible assets are recognized if it is probable that the future economic benefits that are attributable to the asset will flow to the enterprise and the cost of the asset can be measured reliably. After initial recognition, intangible assets are measured at cost less any impairment losses. Intangible assets with definite useful lives are amortized on a straight-line basis over their useful lives.
Intangible assets consist of the follow:
June 30, 2006 | June 30, 2005 | March 31, 2006 | |||||||||||||||||
Gross Carrying Amount | Accumulated Amortization | Gross Carrying Amount | Accumulated Amortization | Gross Carrying Amount | Accumulated Amortization | ||||||||||||||
| Computer software and applications | $ | 437,152 | $ | 190,215 | $ | 411,083 | $ | 99,149 | $ | 426,430 | $ | 161,868 | |||||||
Total intangible assets | 437,152 | 190,215 | 411,083 | 99,149 | 426,430 | 161,868 | |||||||||||||
Amortization expenses for the three months ended June 30, 2006 and 2005 was $21, 372 and $20,565 respectively
11. BANK LOANS
As at June 30, 2006 and 2005, the Company had short-term loans from banks in the amount of $17,551,071 and $13,508,125 bearing interest ranging from 5.576% to 7.488% per annum. Such loans are extendable for terms of no less than one year to June 2007. The loans were secured by the pledge of certain fixed assets held by the Company and its subsidiaries. The value of the fixed assets pledged was $11.56 million and $9.95 million during the three months ended June 30, 2006 and 2005, respectively.
There are no other long term borrowings by the Company at the time of this report.
12. INCOME TAXES
The Company’s income/(loss) before income taxes was comprised of the following for the three months ended June 30,2006 and 2005,respectively
Three months ended June 30, 2006 | Three months ended June 30, 2005 | ||||||
| United States | $ | 26,211 | $ | 68,116 | |||
| PRC | 9,988,905 | 1,682,230 | |||||
| Total | $ | 10,015,116 | $ | 1,750,346 | |||
Income taxes are calculated on a separate entity basis. There currently is no tax benefit or burden recorded in the United States.
The provisions for income taxes for the three months ended June 30, 2006 and 2005, respectively, are summarized as follows:
Three months ended June 30, 2006 | Three months ended June 30, 2005 | ||||||
| Current | $ | 794,635 | $ | 25,566 | |||
| Deferred | — | — | |||||
| Total | $ | 794,635 | $ | 25,566 | |||
13. NET INCOME/(LOSS) PER SHARE--EPS
SFAS 128 “Earnings Per Share” requires the Company to calculate its net income (loss) per share based on basic and diluted net income (loss) per share, as defined. Basic EPS excludes dilution and is computed by dividing net income (loss) by the weighted average number of shares outstanding for the period. Diluted EPS reflects the potential dilution that could occur if securities or other contracts to issue common stock were exercised or converted into common stock. The dilutive effect of outstanding options and warrants, if exists, will be reflected in diluted EPS using the treasury stock method. Under the treasury stock method, options and warrants will generally have a dilutive effect when the average market price of common stock during the period exceeds the exercise price of the options.
For the three Months Ended June 30, 2006 | ||||||||||
Income | Shares | Per-Share | ||||||||
(Numerator) | (Denominator) | Amount | ||||||||
Basic EPS | ||||||||||
| Income available to common stockholders | $ | 9,220,481 | 50,000,713 | $ | 0.18 | |||||
Effect of Dilutive Securities | ||||||||||
| Warrants and options | — | — | ||||||||
| Convertible preferred stock | — | — | ||||||||
Diluted EPS | ||||||||||
| Income available to common stockholders + assumed conversions | $ | 9,220,481 | 50,000,713 | $ | 0.18 | |||||
14. COMMITMENTS AND CONTINGENCIES
A. CAPITAL COMMITMENTS
As of June 30, 2006, the Company had no significant capital commitments required for disclosure.
B. LEASE COMMITMENTS
The lease commitments of the Company as at June 30, 2006 and 2005 were as follows:
Expiration date | Monthly payment | Mar-07 | Mar-08 | Mar-09 | Mar-10 | Mar-11 | |||||||||||||||||||
| Office facilities in Beijing (SOHO) | 20-Apr-05 | - 14-Dec-07 | $ | 7,239 | $ | 86,863 | $ | 57,909 | — | — | — | ||||||||||||||
| Office facilities in Beijing (SOHO 2903-2905) | 15-Dec-04 | - 14-Dec-07 | 10,975 | 131,700 | 87,800 | — | — | — | |||||||||||||||||
| Office facilities in Beijing | 1-Jan-06 | - 31-Dec-07 | 3,950 | 47,400 | 35,550 | — | — | — | |||||||||||||||||
| Warehouses in Qingdao | 21-Nov-05 | - 20-May-06 | 2,640 | 4,400 | — | — | — | — | |||||||||||||||||
| Warehouses in Qingdao | 21-Nov-05 | - 10-May-06 | 1,401 | 1,868 | — | — | — | — | |||||||||||||||||
Total rent expenses | $ | 272,230 | $ | 181,258 | — | — | — | ||||||||||||||||||
C. LEGAL PROCEEDINGS
N/A
15. RESTATEMENT
The financial statements for the period ended June 30, 2006 have been restated to give effect to the fair value of the 2,879,500 shares of common stocks issued to consultants for the services related to the recapitalization transaction of the company going public. The financial statement for the periods ended June 30, 2006 and 2005 have also been restated to reflect the historical shares of common stock of Vorsatech that were issued and the related earnings per share for the period prior to the merger. The effects on current liabilities, additional paid in capital, retained earnings, earnings per share, and weighted average common shares outstanding are summarized as follows:
Current Liabilities as of June 30, 2006 | Additional Paid In Capital as of June 30, 2006 | Retained Earnings as of June 30, 2006 | ||||||||
| As previously stated | $ | 60,918,320 | $ | 7,676,394 | $ | 21,405,996 | ||||
| Stock compensation and recapitalization | $ | 17,361 | $ | 549,639 | ($567,000 | ) | ||||
| Restated | $ | 60,935,681 | $ | 8,226,033 | $ | 20,838,996 | ||||
For the three months ended June 30, 2006 | For the three months ended June 30, 2005 | ||||||
| Earnings per share as previously stated | $ | 0.18 | $ | 0.03 | |||
| Earnings restated | $ | 0.18 | $ | 0.04 | |||
| Weighted average common shares outstanding as previously stated | 50,000,713 | 50,000,713 | |||||
| Weighted average common shares outstanding restated | 50,000713 | 46,000,000 | |||||
The weighted average common shares outstanding have been restated to reflect the actual time outstanding of common shares issued in connection with the recapitalization transaction of the company.
Organizational structure
Through its wholly owned subsidiary, Synutra Inc., an Illinois corporation (“Synutra Illinois”), Synutra International, Inc. (the “Company” or “Synutra”) owns all of the equity interests of six companies in the People’s Republic of China, (“China” or the “PRC”), each engaged in different stages of the production, marketing, packaging and development of dairy based nutritional products in China for infants, children, pregnant women and nursing mothers, and other adults under the brand names of Super, U-Smart, U-Strong, and National Standards. Approximately 90% of the revenue for the fiscal year ended March 31, 2006 was from pediatric products and the rest from adult and other products. In September 2005, Synutra launched a new rice cereal product line, and in March 2006 the Company launched new premium infant formula products and line extensions. As supplemental foods to infant and children formula products, management believes that rice cereal products possess significant market potential. The new premium products and line extensions were designed to capture the fastest growing segment of the infant formula market in China. At the same time, Synutra also began to make and sell non-fat dry milk as well as anhydrous milk-fat.
Qingdao Sheng Yuan Dairy Co., Ltd. is engaged in the sales and marketing of dairy based nutritional products for infants, children and adults under its brand names of Super, U-Smart, U-Strong, and National Standards. Qingdao Sheng Yuan Dairy Co., Ltd. was formed in January 1998 by Sodiaal Industrial Co. Ltd (55%) and Beijing Honnete Dairy Co., Ltd.,(45%) an affiliate of Mr. Liang Zhang, the Company’s Chief Executive Officer. In December 2003, Sodiaal Industrial Co. Ltd transferred 15% of its ownership to Beijing Honnete Dairy Co., Ltd ,and transferred 40% of its ownership to Synutra Illinois, In February 2004,Beijing Honnete Dairy Co., Ltd, transferred 60% of his ownership to Sheng Zhi Da Dairy Corporation ,In February 2005,Sheng Zhi Da Dairy Corporation transferred 60%of its ownership to Synutra Illinois, resulting in a 100% of ownership of Qingdao Sheng Yuan Dairy Co., Ltd. by Synutra Illinois.
Qingdao ST George Dairy Co., Ltd. is engaged in the production, packaging, shipping and distribution of all of Synutra’s products. Qingdao ST George Dairy Co., Ltd. was formed in September 2001 by Synutra Illinois. In March 2004 Synutra Illinois transferred 75% of Qingdao St George Dairy Co., Ltd ownership to Sheng Zhi Da Dairy Corporation and Synutra Illinois retained 25% of the company. In February 2005 Sheng Zhi Da Dairy Corporation transferred all of its ownership in Qingdao St. George Dairy Co., Ltd. (75%) to Synutra Illinois, resulting in a 100% ownership of Qingdao St. George Dairy Co., Ltd by Synutra Illinois.
Beian Yi Pin Dairy Co., Ltd. (“Beian”) is engaged in the production and processing of adult dairy based nutritional products and various milk powder products. Beian Yi Pin Dairy Co., Ltd. was formed In June 2004,by Sheng Zhi Da Dairy Corporation and Synutra Illinois-. In January 2005, Sheng Zhi Da Dairy Corporation transferred 71.26% of its ownership in Beian to Synutra Illinois, resulting in a 100% ownership of Beian Yi Pin Dairy Co., Ltd. by Synutra Illinois
Luobei Sheng Yuan Dairy Co., Ltd. (“Loubei”) is engaged in the production and processing of Synutra’s products for infants and children under the brand names U-Smart, U-Strong, and National Standards under the “Sheng Yuan” label. Loubei was formed in April 2001 by Mr. Liang Zhang, and Ms. Xiu Qing Meng. In June 2003, Mr. Zhang transferred 67% of his ownership to Sheng Zhi Da Dairy Corporation. In January 2005,Ms. Xiu Qing Meng transferred 33% of her ownership to Synutra Illinois , Sheng Zhi Da Dairy Corporation transferred 67% of its ownership to Synutra Illinois, resulting in a 100% ownership of Luobei Sheng Yuan Dairy Co., Ltd by Synutra Illinois.
Qingdao Mother and Infant Nutrition Research Company Limited is engaged in the research and development of various nutritional products for both infants and children as well as pregnant and lactating women. Qingdao Mother and Infant Nutrition Research Company Limited was formed in April 2004 by -Sheng Zhi Da Dairy Corporation (80%) and Ms. Xiu Qing Meng(20%). In May 2005, Sheng Zhi Da Dairy Corporation transferred 80% of its ownership to Synutra Illinois and Ms. Xiu Qing Meng transferred 20% of her ownership to Synutra Illinois, resulting in a 100% ownership of Qingdao Mother and Infant Nutrition Research Company Limited by Synutra Illinois.
Chabei Sheng Yuan Dairy Co., Ltd. is engaged in the production and processing of all of Synutra’s products under the brand names Super, U-Smart, U-Strong, and National Standards. Chabei Sheng Yuan Dairy Co., Ltd. was formed in February 2002,by Ms, Xiu Qing Meng(20%) and Sheng Zhi Da Dairy Corporation(80%). In March 2005, Ms. Xiu Qing Meng transferred 20% of her ownership to Synutra Illinois and Sheng Zhi Da Dairy Corporation transferred 80% of its ownership to Synutra Illinois, resulting in a 100% ownership of Chabei Sheng Yuan Dairy Co., Ltd. by Synutra Illinois. In August 2005, Chabei Sheng Yuan Diary Co., Ltd. was merged with Zhangjiakou Sheng Yuan Diary Co., Ltd. Zhangjiakou Sheng Yuan Diary Co., Ltd. emerged as the surviving entity from the merger.
Zhangjiakou Sheng Yuan Dairy Co., Ltd. (“Zhangjiakou”) is engaged in the production and processing of all of Synutra’s products under the brand names Super, U-Smart, U-Strong, and National Standards. Zhangjiakou Sheng Yuan Dairy Co., Ltd. was formed in March 2004 by Sheng Zhi Da Dairy Corporation(40%) and Synutra Illinois(60%). In March 2005, Sheng Zhi Da Dairy Corporation transferred 40% of its ownership to Synutra Illinois, resulting in Synutra Illinois owing 100% of Zhangjiakou.
On July 15, 2005, pursuant to a Share Exchange Agreement dated as of June 14, 2005 among the Company, Thomas Braun, Beams Power Investment Limited, Strong Gold Finance Ltd and Synutra Illinois, the Company issued 48,879,500 shares of its common stock in exchange for all of the issued and outstanding shares of Synutra Illinois that owned all the registered capital of the six subsidiaries (the “Exchange”). As a result of this Exchange, Synutra Illinois became a wholly owned subsidiary of the Company.
Immediately prior to the Exchange, the Company had 2,638,713 outstanding shares of common stock and no outstanding shares of preferred stock. The Company’s Certificate of Incorporation provides for authorized capital of two hundred and seventy million shares (270,000,000) of which two hundred and fifty million (250,000,000) are $0.0001 par value common stock and twenty million (20,000,000) are $0.0001 par value preferred stock. Prior to the Exchange, Thomas Braun, the sole director and officer of the Company, and his affiliates owned 2,200,000 shares of the Company common stock. Pursuant to the Exchange, the Company cancelled approximately 1,517,500 shares of common stock owned by Mr. Braun and his affiliates reducing their ownership to 682,500 shares, resulting in the total issued and outstanding shares of the Company common stock equaling 1,121,213 shares.
Pursuant to the Exchange, the Company issued 46,000,000 shares of its common stock in exchange for all of the outstanding capital stock of Synutra Illinois held by Beams Power Investment Limited and Strong Gold Finance Ltd., 2,844,500 shares were issued to various financial consultants and/or their designees and 35,000 shares to a finder. Therefore, the total issued and outstanding shares of the Company’s common stock were 50,000,713 shares after giving effect to the Exchange.
As a result of the Exchange, the stockholders of the Company immediately prior to the Exchange owned approximately 1,121,213 shares, or approximately 2% of the issued and outstanding shares of the Company’s common stock and the Company is now controlled by the former stockholders of Synutra Illinois.
The Share Exchange Agreement was determined through arms’-length negotiations between the Company and Synutra Illinois.
Immediately following the completion of the Exchange, all of the existing members of the Company’s board of directors and all of its executive officers resigned and new appointees were elected to the Company’s board of directors.
On September 9, 2005 the Company changed its name to Synutra International, Inc. (OTCBB: SYUT).
Although the Company acquired Synutra Illinois pursuant to the Exchange, the Exchange was treated as a “reverse merger” whereby Synutra Illinois is considered to be the accounting acquirer. As such, the results of operations are those of Synutra Illinois.
RESULTS OF OPERATIONS
Three Months Ended June 30, 2006 Compared to Three Months Ended June 30, 2005
Sales for the three months ended June 30, 2006 increased by $25,274,293 or 145.24% to $42,676,120 from $17,401,827 for the three months ended June 30, 2005.
Sales increased due to greater market penetration as a result of various measures including changes made by management to incentive programs and policies affecting the Synutra sales force. Such changes strengthened promotional efforts in the medium-sized city markets and rural markets of China by modifying sales force incentive programs through aligning rewards with sales performance.
The sales of traditional main products, such as the dairy based nutritional products for infants, children and adults under its brand names of Super, U-Smart, U-Strong, and National Standards, mostly contributed to the increasing trend of revenue.
| a. | The tons sold of such products increased 2,204 tons for the three months ended June 30, 2006, resulting in $10,951,921 increase of gross sales. |
| b. | The average selling price also contributed to the increase of gross sales. For the period ended June 30, 2006, the average selling price increased $881 per ton, resulting in an increase of $3,504,923 in gross sales. |
| c. | Sales growth attributable to combined factor of the increase of the volume and the price was $2,205,839; d. New product launched contributed $8,661,610 in gross sales growth. |
For the three months ended June 30, 2006, the Company realized and earned close to 99.6% of its total sales revenue of $43 million through its wholesale distributor networks and about 0.4% through the supermarket retailers. Of the total $17.4 million sales earned in the 3 months period ended June 30, 2005, about 98.5% was from distributors and about 1.5% from supermarket retailers.
Management believes that the overall infant formula industry in China has grown faster than its traditional natural growth due to increased consumer recognition and acceptance of the products, especially Synutra’s name-brand products. Management believes Synutra name brand product lines have gained recognition in the marketplaces where it operates and thus has captured a greater portion of the increased growth experienced by the industry. In addition, management believes premium products with a higher margin have grown faster in the period across the industry.
Cost of Sales
Cost of sales for the three months ended June 30, 2006 increased to $20,644,247 from $8,456,140 for the three months ended June 30, 2005. The 144.13% increase in cost of sales of $12,188,107 was a result of increases in purchases of raw materials and other ingredients, as well as increases in processing expenses, all in proportion to the production volume increases.
The increase of 2,204 tons sold of the traditional main products resulted in $5,321,911 increase of cost. The average cost per unit decreased by $109 per metric ton, resulting in $381,789 cost reduction for the three months ended June 30, 2006. Additionally, the combined factor of production volume and reduction of unit cost led to $240,286 decline of cost of products sold. The launch of new products accounted for $7,488,280 in the total cost of sales for the three months ended June 30, 2006.
Gross Profit
Gross profit was $22,031,873 or 51.63% of sales for the three months ended June 30, 2006, compared to $8,945,687 or 51.41% of sales for the three months ended June 30, 2005. It was an increase of $13,086,187 or 146.28%.
The sales of traditional main products mostly contributed $20,908,544 or 95% of gross profits for the three months ended June 30, 2006. Such main products contributed $8,945,687 or 100% gross profits for the three months ended June 30, 2005.
With sales increasing in the three months ended June 30, 2006 compared to 2005, the Company experienced an increase in both gross profit and gross margin. This increase was primarily a result of increased volume of products sold and the average sales price during the year. Due to implementation of targeted sales incentive programs, sales of the higher margin lines of products increased more, contributing to the increase in gross margin.
Selling and Distribution Expenses
Selling and distribution expenses increased by $3,227,371 or 177.82% to $5,042,348 for the three months ended June 30, 2006, as compared to $1,814,977 for the three months ended June 30, 2005. The increase in selling and distribution expenses in the three months ended June 30, 2006 as compared to 2005 was a result of increased transportation expenses due to the increase in sales volume, in addition to increases in other major components of such expenses such as wages, supermarket expenses and service expenses. The increase in total compensation to the sales force constitutes most of the increase in selling and distribution expenses.
Advertising and Sales Promotion
Advertising and sales promotion increased by $1,670,193 or 31.77% to $6,928,074 for the three months ended June 30, 2006, as compared to $5,257,881 for the three months ended June 30, 2005 as a result of increased advertising and promotional activity expenses. The major components of advertising and sales promotion are placement of advertisements with major media outlets and points of sale and community promotional activities.
Three months ended June 30, 2006 | Three months ended June 30, 2005 | change in $ | change in % | ||||||||||
| Advertising | $ | 715,878 | $ | 691,881 | $ | 23,997 | 3.47 | % | |||||
| Sales promotion | 6,212,196 | 4,566,000 | 1,646,196 | 36.05 | % | ||||||||
Totals | $ | 6,928,074 | $ | 5,257,881 | $ | 1,670,193 | 31.77 | % | |||||
General and Administrative Expenses
General and administrative expenses increased by $134,041 or 15.6% to $993,542 for the three months ended June 30, 2006, as compared to $859,501 for the three months ended June 30, 2005. The major increases of general and administrative expenses were for staff salaries, management expenses and expenses relating to the Company’s public status.
Based on the sales increase of $25.3 million or 145.24% and the cost of sales increase of $12.2 million or 144.13% for the three months ended June 30, 2006, gross profit was up by almost $13 million or 146.28% compared to the three months ended June 30, 2005. In the meantime, operational expenses also increased by approximately $5 million for the three months. As a result, income from operations was $9,067,909 for the three months ended June 30, 2006, as compared to $1,013,328 for the three months ended June 30, 2005, an increase of $8,054,581 or 794.86%.
Finance costs
Finance costs decreased by $6,492 or 1.56% to $408,794 for the three months ended June 30, 2006, as compared to $415,286 for the three months ended June 30, 2005.
Subsidy income
Subsidy income from local governments increased by $783,300 to $1,387,420 for the three months ended June 30, 2006 as compared to $604,120 for the three months ended June 30, 2005. These subsidies were provided to the Company as economic incentives and no repayment by the Company is required. The Company receives such subsidy from time to time.
Other Income (Expenses)
Other expenses were $92,551 for the three months ended June 30, 2006, as compared to other income of $484,355 for the three months ended June 30, 2005. These other expenses were incurred as a result of costs associated with disposal of returned products.
Three Months ended June 30,2006 | Three Months ended June 30,2005 | ||||||
| Other income | $ | 6,715,646 | $ | 4,581,844 | |||
| Other expenses | $ | 6,808,197 | $ | 4,097,489 | |||
Other income/(expenses),net | $ | (92,551 | ) | $ | 484,355 | ||
Provision for Income Taxes
The provision for income taxes, which is computed on a per subsidiary basis, was $794,635 and $25,566 for the three months ended June 30, 2006 and 2005, respectively. The difference in income tax provisions was due to changes in the status of tax holidays and abatement treatment for the year 2006 for some of the operating subsidiaries.
Net Income Attributed to Shareholders
Net income attributable to shareholders for the three months ended June 30, 2006 increased by $7,496,277 or 434.77% to $9,220,481 from $1,724,204 for the three months ended June 30, 2005 due to the factors discussed above.
Earnings Per Share
Basic and diluted Earnings Per Share were $0.18 for three months ended June 30, 2006 and $0.03 for three months ended June 30, 2005.
FINANCIAL CONDITION
LIQUIDITY AND CAPITAL RESOURCES
Cash
The cash balance increased by $3,743,375 to $25,877,244 at June 30, 2006, as compared to $22,133,869 at March 31, 2006. The increase was mainly attributable to cash flow from operations in 2006 which amounted to $4,939,986, being offset by cash spent in construction projects on plant and acquisition of fixed assets which amounted to$722,179 and repayment of bank loans which amounted to $514,646. The remaining $40,214 was the effect of exchange rate changes on cash items.
Cash flow generated from operations was $4,939,986 for the three months ended June 30, 2006. Trade receivables increased by $5,728,730 and advances to suppliers increased by $1,974,624. Expanded scale of operations from the increase in sales revenues in the three months ended June 30, 2006 resulted in additional demand on working capital. Therefore, we experienced increased account receivables and inventories to support our increased sales revenues and production activities.
Cash flows used in investing activities amounted to $722,179. During this quarter, we used $494,589 for the construction of a new factory plant and facilities. The facilities are expected to be completed in the year 2006 . We also spent around $224,551 for new machinery and equipment.
Cash used in repayment of bank loans was $514,646.
Working Capital
Working capital increased by $4 million to negative $5.3 million at June 30, 2006, as compared to negative $9.3 million at March 31, 2006. The increase in working capital reflects an improvement in the ratio of current assets over current liabilities to 91.28% from 83.73% over the period in discussion.
Although the Company continues to have a working capital deficit, since 2004, growth of the Company’s pretax earnings continues to outpace by an average factor of about 10 times the interest payments over current liabilities, demonstrating the Company’s ability to meet interest payment of current liabilities with cash from operations. In addition, management believes much of the bank loans and notes payables booked as current liabilities can be readily extended on a revolving bases.
The Company currently generates its cash flow through operations which it believes will be sufficient to sustain operations for at least the next twelve months. During the fiscal year ending March 31, 2007, we intend to continue to work to expand our product lines and product mix, as well as our product distribution throughout China. We plan to use our working capital for such purposes.
OTHER INFORMATION
EXHIBIT NO. | DOCUMENT DESCRIPTION | |
| 3.1 | Articles of Incorporation (1) | |
| 3.2 | Bylaws (1) | |
| 10.1 | Share Exchange Agreement dated as of June 14, 2005 (2) | |
| 10.2 | License and Supply Agreement dated as of September 1 st , 2003 (3) | |
| 31.1 | Certification of Principal Executive Officer pursuant to Rule 13a-14 and Rule 15d-14(a), promulgated under the Securities and Exchange Act of 1934, as amended. | |
| 31.2 | Certification of Principal Financial Officer pursuant to Rule 13a-14 and Rule 15d-14(a), promulgated under the Securities and Exchange Act of 1934, as amended. | |
| 32.1 | Certification pursuant to 18 U.S.C. Section 1350, as adopted pursuant to Section 906 of the Sarbanes-Oxley Act of 2002 (Chief Executive Officer). | |
| 32.2 | Certification pursuant to 18 U.S.C. Section 1350, as adopted pursuant to Section 906 of the Sarbanes-Oxley Act of 2002 (Chief Financial Officer). | |
| (1) | Incorporated herein by reference from the Registrant’s Form 10SB126 filed with the Securities and Exchange Commission on June 15, 2005. |
| (2) | Incorporated herein by reference from the Registrant’s Form 8-K filed with Securities and Exchange Commission on July 21, 2005. |
| (3) | Incorporated herein by reference from the Registrant’s Form 10-KSB filed with the Securities and Exchange Commission on June 29, 2006. |
Pursuant to the requirements of the Securities Exchange Act of 1934, the Registrant has duly caused this report to be signed on its behalf by the undersigned thereunto duly authorized.
| SYNUTRA INTERNATIONAL, INC. | ||
 | ||
| Date: September 28, 2006 | By: | /s/ Liang Zhang |
| Name: Liang Zhang | ||
| Title: Chief Executive Officer | ||
 | ||
| Date: September 28, 2006 | By: | /s/ Jibin Zhang |
| Name: Jibin Zhang | ||
| Title: Chief Financial Officer | ||
-28-