UNITED STATES
SECURITIES AND EXCHANGE COMMISSION
Washington, D.C. 20549
FORM N-CSR
CERTIFIED SHAREHOLDER REPORT OF REGISTERED
MANAGEMENT INVESTMENT COMPANIES
Investment Company Act file number 811-21593
Kayne Anderson MLP Investment Company
(Exact name of registrant as specified in charter)
| | |
| 811 Main Street, 14th Floor, Houston, Texas | | 77002 |
| (Address of principal executive offices) | | (Zip code) |
David Shladovsky, Esq.
KA Fund Advisors, LLC, 811 Main Street, 14th Floor, Houston, Texas 77002
(Name and address of agent for service)
Registrant’s telephone number, including area code: (713) 493-2020
Date of fiscal year end: November 30, 2016
Date of reporting period: November 30, 2016
Form N-CSR is to be used by management investment companies to file reports with the Commission not later than 10 days after the transmission to stockholders of any report that is required to be transmitted to stockholders under Rule 30e-1 under the Investment Company Act of 1940 (17 CFR 270.30e-1). The Commission may use the information provided on Form N-CSR in its regulatory, disclosure review, inspection, and policymaking roles.
A registrant is required to disclose the information specified by Form N-CSR, and the Commission will make this information public. A registrant is not required to respond to the collection of information contained in Form N-CSR unless the Form displays a currently valid Office of Management and Budget (“OMB”) control number. Please direct comments concerning the accuracy of the information collection burden estimate and any suggestions for reducing the burden to Secretary, Securities and Exchange Commission, 450 Fifth Street, NW, Washington, DC 20549-0609. The OMB has reviewed this collection of information under the clearance requirements of 44 U.S.C. § 3507.
Item 1. Reports to Stockholders.
The report of Kayne Anderson MLP Investment Company (the “Registrant”) to stockholders for the fiscal year ended November 30, 2016 is attached below.

MLP Investment Company

KYN Annual Report
November 30, 2016
CONTENTS
CAUTIONARY NOTE REGARDING FORWARD-LOOKING STATEMENTS: This report of Kayne Anderson MLP Investment Company (“the Company”) contains “forward-looking statements” as defined under the U.S. federal securities laws. Generally, the words “believe,” “expect,” “intend,” “estimate,” “anticipate,” “project,” “will” and similar expressions identify forward-looking statements, which generally are not historical in nature. Forward-looking statements are subject to certain risks and uncertainties that could cause actual results to materially differ from the Company’s historical experience and its present expectations or projections indicated in any forward-looking statements. These risks include, but are not limited to, changes in economic and political conditions; regulatory and legal changes; master limited partnership (“MLP”) industry risk; leverage risk; valuation risk; interest rate risk; tax risk; and other risks discussed in the Company’s filings with the Securities and Exchange Commission (“SEC”). You should not place undue reliance on forward-looking statements, which speak only as of the date they are made. The Company undertakes no obligation to update or revise any forward-looking statements made herein. There is no assurance that the Company’s investment objectives will be attained.
KAYNE ANDERSON MLP INVESTMENT COMPANY
LETTER TO STOCKHOLDERS
January 20, 2017
Dear Fellow Stockholders:
It is difficult to describe how pleased I am to have 2016 behind us. While it was a very successful year for the Company in terms of performance, it was also an extremely challenging year, especially during the first quarter of 2016. Since the most difficult days of January and February of 2016, the market has improved materially, and I am confident in saying that the worst is clearly behind us. When I wrote last year’s letter, the Alerian MLP index, or AMZ, had already declined 19% for the fiscal year, and it would go on to decline another 18% to an intraday low of 199 on February 11th. On that day, crude oil prices also hit a muti-year low of $26 per barrel, nearly $10 below the lowest price we saw during the 2008–2009 financial crisis. At the same time, as we noted in last year’s letter, investors were asking some very serious questions about the continued viability of the MLP model. While we did not agree with many of the prevailing concerns, the MLP market was indeed facing some very real challenges. Over the course of the past 12 months, most of the fears that investors had about the MLP market have been allayed.
As we turn the page to 2017, we start the year with an optimistic outlook. Despite the recovery we’ve seen thus far (the AMZ is up 61% since its low last February), we believe that the MLP market continues to present an attractive value proposition. The outlook for the domestic energy industry is much improved, which bodes well for the MLP sector. Further, we expect the new administration to be much more accommodating towards the development of additional energy infrastructure. As we will discuss in more detail in this letter, some potential headwinds exist for the MLP sector, but we believe these challenges are manageable. We, like everyone else, are carefully watching the new administration’s actions to get a better sense of its proposed policies – in particular as they relate to potential tax reform. It is too early to say with certainty what the next four years in Washington will bring, but our expectation is that it will bring more positives than negatives for MLPs. With all of these factors taken into consideration, we believe the next few years will provide a very constructive backdrop for the domestic energy industry and the MLP sector.
Performance Review
Coming off of a very challenging 2015, which was one of the worst years in the Company’s history, we are pleased to report that the Company performed very well in fiscal 2016. From the lows in February, our net asset value per share increased by over 70%. For the fiscal year, our Net Asset Value Return, which is equal to the change in net asset value per share plus the cash distributions paid during the period (assuming reinvestment through our dividend reinvestment program) was 14.6%. During the same period, the total return of the AMZ was 9.3%. We are very pleased to have outperformed the AMZ by such a wide margin during fiscal 2016, and we believe that the Company’s portfolio is well positioned to outperform as market conditions continue to improve. Another measure of the Company’s performance is Market Return (share price change plus reinvested dividends), which was 24.1% for fiscal 2016. This measure exceeded our Net Asset Value Return, as our stock price moved from trading at a 5% discount to NAV at the beginning of the year to trading at a 3% premium to NAV at the end of the year.
In addition to generating a strong return for the year, I am also proud of how our team navigated a very challenging market. During the first three months of fiscal 2016, we experienced extreme volatility and very rapid declines in the market. In response, we prudently sold securities to raise cash and decrease the Company’s leverage levels. During the first quarter of fiscal 2016, the Company redeemed $264 million of notes and $60 million of mandatory redeemable preferred stock (MRPS). While we never want to be forced to de-lever, we were able to strategically redeem notes and MRPS in such a way that we maintained compliance with our leverage covenants and avoided a significant amount of early redemption penalties. As a result of our experience through this downturn, we increased our asset coverage targets as the market recovered to ensure that the
1
KAYNE ANDERSON MLP INVESTMENT COMPANY
LETTER TO STOCKHOLDERS
Company has more downside protection in the event of future market declines. Currently, our leverage levels are in line with these new targets.
In spite of the difficult energy market during the year, I’m happy to report that we were able to continue to successfully access the capital markets. We were successful in refinancing the Company’s revolving credit facility during February, which was a very tough banking market for energy companies given crude oil prices were at their lows and many banks were expecting widespread defaults in the energy sector. In September, we were able to take advantage of very low interest rates and issue $50 million of MRPS to partially refinance some of our existing MRPS that were coming due.
Finally, as we noted in last year’s letter, we made the difficult decision to reduce the Company’s distribution from $0.6575 per share to $0.55 per share, starting with the distribution paid in January 2016. We detailed the reasons for this reduction last year, but as a reminder, the primary drivers were the Kinder Morgan distribution cut, our deleveraging activity (selling higher yielding securities to redeem lower-cost leverage) and merger activity in which lower yielding entities acquired higher yielding entities (resulting in lower distributions for the holders of the higher yielding entities). This last phenomenon, which we refer to as “back-door distribution cuts,” is a trend that has continued. In fact, the most recent example, the merger between Sunoco Logistics and Energy Transfer, was announced at the end of November 2016 and has yet to close. We will discuss further the impact of back-door distribution cuts on our future distributions later in the letter.
Overall, it was a good year for the Company in terms of both relative and absolute performance. We believe the actions that we took with the distribution and the balance sheet were prudent and necessary. The Company is on sound financial footing and well positioned to capitalize on attractive investment opportunities.
MLP Market — Year in Review
If one was to look at the MLP market only in terms of performance measured from the start of the year, it appears that fiscal 2016 was pretty uneventful. The AMZ started the year at 301 and finished at 303, and the total return (including distributions) was 9%. However, the year was anything but normal. When the MLP market reached the February low, it capped off a vicious, nearly 18-month downturn that saw the AMZ decline 63% from peak to trough. This downturn was longer and more severe than the 55% decline that the AMZ experienced during the 2008–2009 financial crisis. Moreover, the market displayed extreme volatility, especially in the first quarter. By the end of our first fiscal quarter, there had been six moves of greater than 18% (up or down), with the worst being the 28% decline between January 4th and January 20th (just 12 trading days).
So why did the MLP market fall so precipitously when MLPs are supposed to own stable energy infrastructure assets? We spent the majority of last year’s letter detailing why we thought these steep declines were not justified by the fundamentals in the market, but it is worth recapping some of what we wrote last year and reviewing how things actually played out.
First, it is important to highlight, as we do in almost every annual letter, that MLPs generally do not have direct exposure to crude oil prices. MLPs are primarily in the business of gathering, transporting and storing crude oil, natural gas and natural gas liquids, or NGLs. Despite this fact, the decline in crude oil prices was by far the biggest driver of the negative sentiment in the MLP market during the downturn, and we saw an unprecedented correlation between crude oil prices and MLP equity prices (this was the case for the broader market as well). This simply did not make sense, and thankfully, we have seen this correlation fall significantly over the last six months.
While the MLP market should not have been trading so closely with crude oil, commodity prices (including crude oil) are important for the long-term health of the MLP market, as producers need an economic price to produce the natural gas and oil that will supply the pipelines and storage assets owned by MLPs. As we described in last year’s letter, we were convinced that crude oil prices were unsustainably low and that the fundamentals
2
KAYNE ANDERSON MLP INVESTMENT COMPANY
LETTER TO STOCKHOLDERS
were in place for a recovery. Specifically, demand was projected to continue to grow, and producers were significantly reducing capital expenditures, resulting in projected declines in domestic crude oil production. Most importantly, the global “over-supply” was not very large at around 1-2% of demand, so we knew that the market would come back into balance in the near-term. Today, domestic oil production has declined from 9.6 to 8.8 million barrels per day, and crude oil prices are trading in the $50–$55 per barrel range (double the February low), as prices are now reflecting the rebalancing of supply and demand. Admittedly, OPEC helped out the market in November by agreeing to cut production, but most experts believe this only accelerated the market rebalancing by about six months. In the meantime, the industry still has excess crude oil inventories to work through, so we expect continued price recovery through 2017 and 2018.
A related point that we made in last year’s letter was that we expected MLP cash flows to be resilient, and this played out as predicted. On average, the top 20 MLPs by market cap have grown their distributable cash flow on a per unit basis since the market peak in 2014. This performance is simply not consistent with the severe declines in MLP equity prices during this downturn. The fact is that MLPs receive a substantial majority of their revenues in the form of fixed fees, and a significant portion of this revenue comes from “take-or-pay” arrangements whereby customers must pay whether or not they utilize the assets owned by MLPs. Furthermore, while certain assets within MLPs were challenged due to either lower volumes or lower prices (if not fee-based), many MLPs have become much more diversified across the midstream value chain and across producing basins. These more diversified MLPs benefitted during the downturn by offsetting weak parts of their asset portfolio with new growth projects, cost cutting and in some cases, converting commodity sensitive contracts to fee-based contracts on very favorable terms.
The MLP model for many years has been to pay out all free cash flow and finance acquisitions and growth expenditures in the capital markets. During the depths of the downturn, investors feared that the MLP “model” was broken. We asserted in last year’s letter that we did not think the model was broken and that we did not expect the capital markets to shut down for any material amount of time. As it turned out, institutional investors, including Kayne Anderson, stepped in to provide private financing for MLPs like Plains All American, Western Gas and MPLX in early 2016, and the regular-way public equity markets re-opened to issuers in March. During calendar 2016, there were 31 public equity offerings that raised over $7 billion and seven private placements, primarily in the form of convertible preferred equity, that raised $6 billion. As the year progressed, sentiment began to improve as management teams were very successful in cutting operating costs and delaying capital expenditures where possible, and as operating results continued to hold up better than expected.
As the market recovered, there were a few key themes that got investors excited about the MLP market again. First, investors pivoted with pretty amazing speed from being worried about midstream MLPs experiencing significant declines in pipeline throughput (i.e. volumes) to focusing on the impact of production growth in key domestic shale basins. This transition evolved as it became clear during 2016 that producers were doing significantly more with less capital, and that domestic production would be more resilient than originally expected. In particular, as upstream companies reported results and provided guidance, it became evident that the cumulative effect of lower oilfield service costs, improved drilling efficiency (how quickly a well can be drilled) and improved completion techniques (the fracking “recipe” to maximize well productivity) had dramatically lowered break-even prices (the commodity price needed by a producer to make an adequate return after spending capital). While many crude oil plays required prices in the $70 to $80 per barrel range in 2014 to be economic, by 2016 it was clear that many areas could be drilled economically at $40 per barrel and below.
The most talked about area in the context of this trend has been the Permian Basin in west Texas and New Mexico. In the Permian, producers have been aggressively acquiring acreage in the best areas, and the capital markets have been wide open for these producers to raise equity capital to finance these acreage acquisitions. This is quite the turnaround from the widespread belief that there would be mass bankruptcies for upstream companies during 2016. There also has been a lot of excitement around the SCOOP/STACK in
3
KAYNE ANDERSON MLP INVESTMENT COMPANY
LETTER TO STOCKHOLDERS
Oklahoma, and more recently, the core areas of the Bakken. These oil shale plays will be instrumental in stemming the decline of domestic crude oil production, which we believe bottomed in late 2016, and facilitating the resumption of production growth. Clearly these technological advancements in the upstream will be very beneficial for MLPs as well, especially for those MLPs with spare capacity on existing assets that will benefit from higher volumes with little incremental cost. Furthermore, this same dynamic is continuing to drive production growth for producers in natural gas plays like the Marcellus and Utica, and the MLPs that gather, process and transport this production will similarly benefit.
Another theme that received a lot of attention was the coming increase in ethane demand. Ethane makes up the largest portion of the typical NGL barrel and is used primarily for the production of ethylene, which in turn is used by petrochemical companies to produce plastics. From 2017 through 2020, several world-scale ethane crackers are slated to come on line, which should drive a step change in the demand for ethane in the U.S. Currently, the U.S. produces around 1.3 million barrels per day of ethane, and the vast majority of this production is consumed domestically by petrochemical companies. As the new ethane crackers are placed in service, domestic demand will increase by 40–50% over the next few years. For those MLPs that own processing plants, NGL pipelines and NGL fractionators, this increase in demand represents a huge opportunity, which is expected to be satisfied by increased domestic production and translate into higher utilization levels for midstream assets.
Some trends during 2016 were not so beneficial for MLPs and are contributing to some of the headwinds I mentioned earlier. First of all, we saw a much tougher regulatory environment in 2016. The poster child for increased regulatory difficulty has been the Bakken Pipeline Project, which includes the Dakota Access Pipeline (DAPL). This project is being pursued by a consortium of midstream energy companies, including Energy Transfer and Sunoco Logistics. Many of you have probably read news stories about DAPL protestors in North Dakota or seen protests on television or the internet (for example during a recent NFL game). In addition to garnering significant media attention, those who oppose projects like DAPL have become much more sophisticated in using the courts and the regulatory system to slow the approval process for new projects. While we believe the Trump administration will be more accommodating and we expect DAPL to be completed during 2017, we do not expect the opponents of fossil fuels to be any less zealous in attempting any and every way to slow or stop projects. Accordingly, the ultimate cost and timeline for announced projects will continue to be more uncertain than it has been in the past.
Finally, I want to spend some time discussing “back-door distribution cuts,” a trend that continued in 2016 and that we expect to continue into 2017 and beyond. As described above, these occur when an entity with a relatively lower yield acquires one with a relatively higher yield. The result of this kind of transaction is an effective distribution cut for the owner of the higher yielding entity, because the premium received is typically not sufficient to overcome the lower distribution of the acquiring entity. Most of these transactions have either been “simplifications” in which a c-corp parent acquires its subsidiary MLP, or mergers between MLPs under common control (i.e. two MLPs with the same general partner). In fact, since the Kinder Morgan simplification transaction closed in November of 2014, there have been seven additional back-door cuts announced or closed, only one of which was a true third-party transaction. We have had serious concerns about the fairness of some of these transactions to the limited partners of the MLP relative to the general partner, and we believe that the industry could benefit from more rigorous corporate governance with an eye toward protecting the interests of the limited partners.
The most recently announced transaction with a back-door cut is the proposed merger between Sunoco Logistics and Energy Transfer, which will result in an initial distribution cut of 27% to the owners of Energy Transfer. While the transaction consideration initially represented a 10% premium to Energy Transfer equity holders, that premium was wiped out by the trading performance of Sunoco Logistics after the deal was announced. We noted in our December press release for the fourth quarter distribution that we expected to recommend lowering our distribution for the first quarter by $0.07 to $0.08 per share, primarily as a result of this
4
KAYNE ANDERSON MLP INVESTMENT COMPANY
LETTER TO STOCKHOLDERS
transaction (though the actual amount will depend on a variety of factors). In contrast to some of the simplification transactions that resulted in back-door cuts, Plains All American and Williams Partners pursued simplification transactions whereby the MLP acquired the general partner and incentive distribution rights from their respective parents (rather than a “roll-up” in which the c-corp parent acquires the subsidiary MLP). Although Plains and Williams also announced distribution cuts at the MLPs in conjunction with these “buy-in” transactions, the equity prices of the MLPs reacted more favorably than the roll-up transactions for a number of reasons. First, because there is an explicit cut in the distribution at the MLP, we believe the boards of these companies were forced to consider more carefully the value of the general partner’s incentive distribution rights (IDRs) post-cut, which resulted in a fairer deal for the MLP. Second, buy-in transactions do not result in a taxable transaction for either the MLP unitholders or c-corp parent shareholders. Finally, we believe the resulting MLP with no IDRs will enjoy a better valuation than a c-corp survivor of a roll-up simply because the MLP will not be subject to entity-level taxation.
We expect to see simplifications continue. MPLX has recently announced its intention to buy-in its general partner and IDRs from Marathon Petroleum once MPLX has acquired all of the assets from Marathon that are intended for the MLP, and a number of other MLPs have publicly stated that they are evaluating what to do with their IDRs. As more MLPs pursue simplification, crafting a permanent solution to the IDR burden will eventually become a competitive imperative for larger MLPs that have not addressed the issue.
Outlook
The outlook for MLPs into 2017 and beyond is very good. The worst part of the downturn is in the rearview mirror, and once again, the MLP model has prevailed. Although the market is up an astounding 61% since the February lows, we believe that there is still room for additional, meaningful price appreciation in the MLP market. Currently, the AMZ stands at 320 and yields 7.0%. With 10-year U.S. Treasury Bonds currently yielding 2.47%, the MLP “spread to Treasuries” stands at 453 basis points. While this is much tighter than the 809 basis point spread as of last year’s letter, it is still significantly higher than the long-term spread of ~300–350 basis points. In addition, MLPs look very attractive relative to other yield alternatives, with Utilities yielding 3.6% and REITs yielding 4.6%, and also look compelling on traditional valuation metrics such as Enterprise Value to EBITDA and Price to Distributable Cash Flow multiples.
While we are optimistic for continued recovery in the MLP market, we expect that the rising tide will not necessarily lift all boats. Exposure to the right basins, prudent management teams and strong balance sheets will be the keys to success for individual MLPs. We believe our team is well situated to identify which MLPs will be the best performers as the recovery continues to unfold.
We know that it has not been a pleasant experience enduring this downturn, but we sincerely believe that patient, long-term investors in the Company will be rewarded with very attractive returns over the next three to five years. We appreciate your investment in the Company and look forward to executing on our business plan of achieving high after-tax total returns by investing in MLPs and other midstream companies. We invite you to visit our website at kaynefunds.com for the latest updates.
Sincerely,

Kevin S. McCarthy
Chairman of the Board of Directors
and Chief Executive Officer
5
KAYNE ANDERSON MLP INVESTMENT COMPANY
PORTFOLIO SUMMARY
(UNAUDITED)
Portfolio of Long-Term Investments by Category
| | |
| November 30, 2016 | | November 30, 2015 |
| |
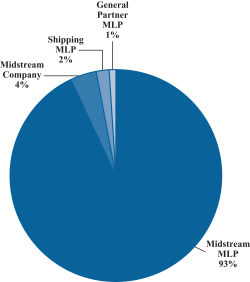 | | 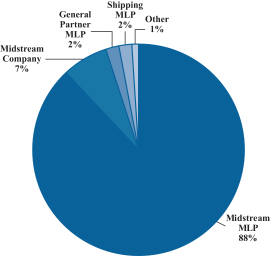 |
Top 10 Holdings by Issuer
| | | | | | | | | | |
| | | | | Percent of Long-Term
Investments as of
November 30, | |
| Holding | | Category | | 2016 | | | 2015 | |
1. Enterprise Products Partners L.P. | | Midstream MLP | | | 12.5 | % | | | 14.5 | % |
2. Williams Partners L.P. | | Midstream MLP | | | 10.3 | | | | 7.3 | |
3. Energy Transfer Partners, L.P.(1) | | Midstream MLP | | | 9.7 | | | | 11.1 | |
4. Plains All American Pipeline, L.P. | | Midstream MLP | | | 7.6 | | | | 5.3 | |
5. ONEOK Partners, L.P. | | Midstream MLP | | | 7.5 | | | | 5.3 | |
6. MPLX LP(2) | | Midstream MLP | | | 6.1 | | | | 0.1 | |
7. Western Gas Partners, LP | | Midstream MLP | | | 5.7 | | | | 4.6 | |
8. DCP Midstream Partners, LP | | Midstream MLP | | | 5.4 | | | | 4.3 | |
9. Buckeye Partners, L.P. | | Midstream MLP | | | 4.6 | | | | 4.7 | |
10. Targa Resources Corp.(3) | | Midstream Company | | | 4.3 | | | | — | |
| (1) | On November 21, 2016, Energy Transfer Partners, L.P. (“ETP”) and Sunoco Logistics Partners L.P. (“SXL”) announced an agreement to combine in a unit-for-unit merger. On a combined basis, ETP and SXL represent 12.1% of long-term investments as of November 30, 2016. |
| (2) | On December 4, 2015, MarkWest Energy Partners, L.P. (“MWE”) and MPLX LP (“MPLX”) completed a merger whereby MWE became a wholly owned subsidiary of MPLX. As of November 30, 2015, our investments in MWE and MPLX represented 5.6% of long-term investments. |
6
KAYNE ANDERSON MLP INVESTMENT COMPANY
PORTFOLIO SUMMARY
(UNAUDITED)
| (3) | On February 17, 2016, Targa Resources Corp. (“TRGP”) completed its acquisition of Targa Resources Partners LP (“NGLS”). As of November 30, 2015, our investment in NGLS represented 2.5% of long-term investments. As of that date we did not own any shares of TRGP. |
7
KAYNE ANDERSON MLP INVESTMENT COMPANY
MANAGEMENT DISCUSSION
(UNAUDITED)
Company Overview
Kayne Anderson MLP Investment Company is a non-diversified, closed-end fund that commenced operations in September 2004. Our investment objective is to obtain a high after-tax total return by investing at least 85% of our total assets in energy-related master limited partnerships and their affiliates (“MLPs”) and in other companies that operate assets used in the gathering, transporting, processing, storing, refining, distributing, mining or marketing of natural gas, natural gas liquids, crude oil, refined petroleum products or coal (collectively with MLPs, “Midstream Energy Companies”).
As of November 30, 2016, we had total assets of $3.9 billion, net assets applicable to our common stockholders of $2.2 billion (net asset value of $19.18 per share), and 113.7 million shares of common stock outstanding.
Our investments are principally in equity securities issued by MLPs, but we also may invest in debt securities of MLPs and equity/debt securities of other Midstream Energy Companies. As of November 30, 2016, we held $3.9 billion in equity investments and no debt investments.
Results of Operations — For the Three Months Ended November 30, 2016
Investment Income. Investment income totaled $7.2 million for the quarter. We received $75.3 million of dividends and distributions, of which $66.1 million was treated as return of capital and $2.0 million was treated as distributions in excess of cost basis. Interest income was $0.01 million. We also received $1.2 million of paid-in-kind dividends during the quarter, which are not included in investment income, but are reflected as an unrealized gain.
Operating Expenses. Operating expenses totaled $26.7 million, including $13.3 million of investment management fees, $7.4 million of interest expense, $5.1 million of preferred stock distributions and $0.9 million of other operating expenses. Interest expense includes $0.4 million of non-cash amortization of debt issuance costs. Preferred stock distributions include $1.2 million of non-cash amortization and write-off of offering costs.
Net Investment Loss. Our net investment loss totaled $13.8 million and included a current tax expense of $1.4 million and a deferred tax benefit of $7.1 million.
Net Realized Losses. We had net realized losses from our investments of $1.8 million, consisting of realized losses from long term investments of $2.3 million, $0.2 million of realized gains from option activity, a current tax benefit of $1.4 million and a deferred tax expense of $1.1 million.
Net Change in Unrealized Gains. We had a net increase in our unrealized gains of $63.3 million. The net change consisted of a $102.0 million increase in our unrealized gains on investments, $0.1 million of unrealized losses from option activity and a deferred tax expense of $38.6 million.
Net Increase in Net Assets Resulting from Operations. We had an increase in net assets resulting from operations of $47.7 million. This increase was comprised of a net investment loss of $13.8 million, net realized losses of $1.8 million and a net increase in unrealized gains of $63.3 million, as noted above.
Results of Operations — For the Fiscal Year Ended November 30, 2016
Investment Income. Investment income totaled $11.4 million for the year and consisted of net dividends and distributions on our investments. We received $301.5 million of dividends and distributions, of which $284.0 million was treated as return of capital and $6.2 million was treated as distributions in excess of cost basis. Return of capital was increased by $24.0 million due to 2015 tax reporting information that was received in fiscal 2016. Interest income was $0.1 million. We also received $4.7 million of paid-in-kind dividends during the fiscal year, which are not included in investment income, but are reflected as an unrealized gain.
8
KAYNE ANDERSON MLP INVESTMENT COMPANY
MANAGEMENT DISCUSSION
(UNAUDITED)
Operating Expenses. Operating expenses totaled $110.7 million, including $49.9 million of investment management fees, $36.5 million of interest expense, $20.4 million of preferred stock distributions and $3.9 million of other operating expenses. Interest expense includes $5.7 million of prepayment penalties and accelerated interest associated with unsecured notes (“Notes”) redemptions during fiscal 2016 and $2.4 million of non-cash amortization and write-off of debt issuance costs. Preferred stock distributions include $0.2 million of accelerated dividends associated with mandatory redeemable preferred stock (“MRP Shares”) redemptions during fiscal 2016 and $2.6 million of non-cash amortization and write-off of offering costs.
Net Investment Loss. Our net investment loss totaled $69.0 million and included a current tax expense of $4.6 million and a deferred tax benefit of $34.9 million.
Net Realized Gains. We had net realized gains from our investments of $111.7 million, consisting of realized gains from long term investments of $175.7 million, and $2.4 million of realized gains from option activity, a current tax benefit of $10.0 million and a deferred tax expense of $76.4 million.
Net Change in Unrealized Gains. We had a net increase in our unrealized gains of $210.9 million. The net change consisted of a $336.3 million increase in our unrealized gains on investments, $0.1 million of unrealized losses from option activity and a deferred tax expense of $125.3 million.
Net Increase in Net Assets Resulting from Operations. We had an increase in net assets resulting from operations of $253.6 million. This increase was comprised of a net investment loss of $69.0 million, net realized gains of $111.7 million and a net increase in unrealized gains of $210.9 million, as noted above.
Distributions to Common Stockholders
We pay quarterly distributions to our common stockholders, funded generally by net distributable income (“NDI”) generated from our portfolio investments. NDI is the amount of income received by us from our portfolio investments less operating expenses, subject to certain adjustments as described below. NDI is not a financial measure under the accounting principles generally accepted in the United States of America (“GAAP”). Refer to the “Reconciliation of NDI to GAAP” section below for a reconciliation of this measure to our results reported under GAAP.
Income from portfolio investments includes (a) cash dividends and distributions, (b) paid-in-kind dividends received (i.e., stock dividends), (c) interest income from debt securities and commitment fees from private investments in public equity (“PIPE investments”) and (d) net premiums received from the sale of covered calls.
Operating expenses include (a) investment management fees paid to our investment adviser (KAFA), (b) other expenses (mostly comprised of fees paid to other service providers), (c) interest expense and preferred stock distributions and (d) current and deferred income tax expense/benefit on net investment income/loss.
9
KAYNE ANDERSON MLP INVESTMENT COMPANY
MANAGEMENT DISCUSSION
(UNAUDITED)
Net Distributable Income (NDI)
(amounts in millions, except for per share amounts)
| | | | | | | | |
| | | Three Months
Ended
November 30,
2016 | | | Fiscal Year
Ended
November 30,
2016 | |
Distributions and Other Income from Investments | | | | | | | | |
Dividends and Distributions(1) | | $ | 75.3 | | | $ | 301.5 | |
Paid-In-Kind Dividends(1) | | | 1.2 | | | | 4.7 | |
Net Premiums Received from Call Options Written | | | 0.3 | | | | 3.5 | |
Other Income | | | — | | | | 0.1 | |
| | | | | | | | |
Total Distributions and Other Income from Investments | | | 76.8 | | | | 309.8 | |
Expenses | | | | | | | | |
Net Investment Management Fee | | | (13.3 | ) | | | (49.9 | ) |
Other Expenses | | | (0.9 | ) | | | (3.9 | ) |
Interest Expense(2) | | | (7.2 | ) | | | (35.1 | ) |
Preferred Stock Distributions(2) | | | (3.9 | ) | | | (17.8 | ) |
Income Tax Benefit(3) | | | 5.7 | | | | 30.3 | |
| | | | | | | | |
Net Distributable Income (NDI) | | $ | 57.2 | | | $ | 233.4 | |
| | | | | | | | |
Weighted Shares Outstanding | | | 113.5 | | | | 113.0 | |
NDI per Weighted Share Outstanding | | $ | 0.504 | | | $ | 2.067 | |
| | | | | | | | |
Adjusted NDI per Weighted Share Outstanding(2)(4)(5) | | $ | 0.540 | | | $ | 2.178 | |
| | | | | | | | |
Distributions paid per Common Share(6) | | $ | 0.550 | | | $ | 2.200 | |
| (1) | See Note 2 (Investment Income) to the Financial Statements for additional information regarding paid-in-kind and non-cash dividends and distributions. |
| (2) | Interest expense for the year includes prepayment penalties and accelerated interest related to the redemption of Notes ($5.7 million). Preferred stock distributions include accelerated dividends associated with MRP Shares redemptions ($0.2 million). Adjusted NDI for the year excludes the after-tax-impact of prepayment penalties and accelerated interest related to the redemption of Notes ($3.6 million) and accelerated dividends related to the redemption of MRP Shares ($0.2 million). |
| (3) | The income tax benefit for the year includes an $8.8 million increase which is attributable to a change made to our return of capital estimate for 2015 (the “Return of Capital Adjustment”). We increased our return of capital estimate for 2015 as a result of tax reporting information attributable to fiscal 2015 received during fiscal 2016. |
| (4) | For the purposes of calculating Adjusted NDI, we allocated the Return of Capital Adjustment equally to each quarter in 2016 ($8.8 million adjustment in aggregate; $2.2 million quarterly adjustment). |
| (5) | Adjusted NDI for the year includes $8.6 million of consideration received in two mergers that was intended to offset lower quarterly distributions as a result of such transactions. The two transactions were the mergers of Energy Transfer Partners, L.P. and Regency Energy Partners LP ($1.2 million) and MarkWest Energy Partners, L.P. and MPLX LP ($7.4 million, $1.9 million of which is included in the fourth quarter). Because the acquiring entity has deemed part of the merger consideration to be compensation to help offset the lower quarterly distribution that unitholders of the acquired entity would receive after closing, we believe it to be appropriate to include this amount in Adjusted NDI. This merger consideration is not included in investment income for GAAP purposes, but rather is treated as additional consideration when calculating the realized or unrealized gain (loss) that results from the merger transaction. |
| (6) | The distribution of $0.55 per share for the fourth quarter of fiscal 2016 was paid on January 13, 2017. Distributions for fiscal 2016 include the distributions paid in April 2016, July 2016, October 2016 and |
January 2017.
10
KAYNE ANDERSON MLP INVESTMENT COMPANY
MANAGEMENT DISCUSSION
(UNAUDITED)
Payment of future distributions is subject to Board of Directors approval, as well as meeting the covenants of our debt agreements and terms of our preferred stock. Because our quarterly distributions are funded primarily by NDI generated from our portfolio investments, the Board of Directors, in determining our quarterly distribution to common stockholders, gives a significant amount of consideration to the NDI and Adjusted NDI generated in the current quarter, as well as the NDI that our portfolio is expected to generate over the next twelve months. The Board of Directors also considers other factors, including but not limited to, realized and unrealized gains generated by the portfolio.
In December 2016, we provided guidance for our distribution for the first quarter of fiscal 2017. Management stated at such time that it expected to recommend a reduction of $0.07 to $0.08 per share to our quarterly distribution. Over the last two years there has been an on-going trend of MLPs (or GPs) with lower yields acquiring MLPs with higher yields, including the merger of Energy Transfer Partners, L.P. and Sunoco Logistics Partners, L.P. announced in November 2016. The impact of these transactions has been to significantly reduce our NDI over that time period. The actual amount of the first quarter distribution will depend on a variety of factors.
Reconciliation of NDI to GAAP
The difference between distributions and other income from investments in the NDI calculation and total investment income as reported in our Statement of Operations is reconciled as follows:
| | • | | GAAP recognizes that a significant portion of the cash distributions received from MLPs is characterized as a return of capital and therefore excluded from investment income, whereas the NDI calculation includes the return of capital portion of such distributions. |
| | • | | GAAP recognizes distributions received from MLPs that exceed the cost basis of our securities to be realized gains and are therefore excluded from investment income, whereas the NDI calculation includes these distributions. |
| | • | | NDI includes the value of paid-in-kind dividends and distributions, whereas such amounts are not included as investment income for GAAP purposes, but rather are recorded as unrealized gains upon receipt. |
| | • | | NDI includes commitment fees from PIPE investments, whereas such amounts are generally not included in investment income for GAAP purposes, but rather are recorded as a reduction to the cost of the investment. |
| | • | | We may hold debt securities from time to time. Certain of our investments in debt securities may be purchased at a discount or premium to the par value of such security. When making such investments, we consider the security’s yield to maturity, which factors in the impact of such discount (or premium). Interest income reported under GAAP includes the non-cash accretion of the discount (or amortization of the premium) based on the effective interest method. When we calculate interest income for purposes of determining NDI, in order to better reflect the yield to maturity, the accretion of the discount (or amortization of the premium) is calculated on a straight-line basis to the earlier of the expected call date or the maturity of the debt security. |
| | • | | We may sell covered call option contracts to generate income or to reduce our ownership of certain securities that we hold. In some cases, we are able to repurchase these call option contracts at a price less than the call premium that we received, thereby generating a profit. The premium we receive from selling call options, less (i) the premium that we pay to repurchase such call option contracts and (ii) the amount by which the market price of an underlying security is above the strike price at the time a new call option is written (if any), is included in NDI. For GAAP purposes, premiums received from call |
11
KAYNE ANDERSON MLP INVESTMENT COMPANY
MANAGEMENT DISCUSSION
(UNAUDITED)
| | option contracts sold are not included in investment income. See Note 2 — Significant Accounting Policies for a full discussion of the GAAP treatment of option contracts. |
The treatment of expenses included in NDI also differs from what is reported in the Statement of Operations as follows:
| | • | | The non-cash amortization or write-offs of capitalized debt issuance costs, premiums on newly issued debt and preferred stock offering costs related to our financings is included in interest expense and distributions on mandatory redeemable preferred stock for GAAP purposes, but is excluded from our calculation of NDI. |
| | • | | NDI also includes recurring payments (or receipts) on interest rate swap contracts or the amortization of termination payments on interest rate swap contracts entered into in anticipation of an offering of Notes or MRP Shares. The termination payments on interest rate swap contracts are amortized over the term of the Notes or MRP Shares issued. For GAAP purposes, these amounts are included in the realized gains/losses section of the Statement of Operations. |
Liquidity and Capital Resources
At November 30, 2016, we had total leverage outstanding of $1,110 million, which represented 28% of total assets and was comprised of $767 million of Notes, $43 million of borrowings outstanding under our unsecured term loan (the “Term Loan”) and $300 million of MRP Shares. At November 30, 2016, we did not have any borrowings outstanding under our unsecured revolving credit facility (the “Credit Facility”), and we had $1 million of cash and cash equivalents. As of January 20, 2017, we had no borrowings outstanding under our Credit Facility, $98 million outstanding under our Term Loan, and we had $2 million of cash and cash equivalents.
Our Credit Facility has a two-year term maturing on February 28, 2018 and a total commitment amount of $150 million. The interest rate on outstanding loan balances may vary between LIBOR plus 1.60% and LIBOR plus 2.25%, depending on our asset coverage ratios. We pay a fee of 0.30% per annum on any unused amounts of the Credit Facility.
Our Term Loan has a total commitment of $150 million and matures on February 18, 2019. Borrowings under the Term Loan bear interest at a rate of LIBOR plus 1.30%. Amounts borrowed under the Term Loan may be repaid and subsequently borrowed. We pay a fee of 0.25% per annum on any unused amounts of the Term Loan.
At November 30, 2016, we had $767 million of Notes outstanding that mature between 2017 and 2025 and we had $300 million of MRP Shares outstanding that are subject to mandatory redemption between 2017 and 2022.
On October 3, 2016, we redeemed all 2,000,000 shares of our Series G MRP Shares with an aggregate liquidation value of $50 million. On November 9, 2016, we completed the private placement of $50 million of Series J MRP Shares with an institutional investor. Net proceeds from the offering along with borrowings on our Term Loan were used to redeem all 4,160,000 shares of our Series A MRP Shares ($104 million liquidation value).
At November 30, 2016, our asset coverage ratios under the Investment Company Act of 1940, as amended (the “1940 Act”), were 406% for debt and 296% for total leverage (debt plus preferred stock). Our target asset coverage ratio with respect to our debt is 385%. At times we may be above or below our target depending on market conditions as well as certain other factors, including our target total leverage asset coverage ratio of 290% and the basic maintenance amount as stated in our rating agency guidelines.
As of November 30, 2016, our total leverage consisted 96% of fixed rate obligations and 4% of floating rate obligations. At such date, the weighted average interest/dividend rate on our total leverage was 3.57%.
12
KAYNE ANDERSON MLP INVESTMENT COMPANY
SCHEDULE OF INVESTMENTS
NOVEMBER 30, 2016
(amounts in 000’s, except number of option contracts)
| | | | | | | | |
Description | | No. of
Shares/Units | | | Value | |
Long-Term Investments — 177.5% | | | | | | | | |
Equity Investments(1) — 177.5% | | | | | | | | |
Midstream MLP(2) — 165.3% | | | | | | | | |
Antero Midstream Partners LP | | | 888 | | | $ | 25,015 | |
Arc Logistics Partners LP | | | 1,942 | | | | 28,638 | |
Buckeye Partners, L.P. | | | 2,748 | | | | 176,817 | |
Cheniere Energy Partners, L.P. | | | 137 | | | | 4,032 | |
Crestwood Equity Partners LP | | | 1,363 | | | | 30,528 | |
DCP Midstream Partners, LP | | | 6,054 | | | | 209,636 | |
Dominion Midstream Partners, LP | | | 267 | | | | 6,823 | |
Enable Midstream Partners, LP | | | 190 | | | | 2,968 | |
Enbridge Energy Management, L.L.C.(3) | | | 2,154 | | | | 53,812 | |
Enbridge Energy Partners, L.P. | | | 2,622 | | | | 64,773 | |
Energy Transfer Partners, L.P.(4) | | | 10,691 | | | | 375,473 | |
EnLink Midstream Partners, LP | | | 4,120 | | | | 72,181 | |
Enterprise Products Partners L.P. | | | 18,731 | | | | 485,702 | |
EQT Midstream Partners, LP | | | 704 | | | | 51,534 | |
Global Partners LP | | | 760 | | | | 12,015 | |
Magellan Midstream Partners, L.P. | | | 2,304 | | | | 159,520 | |
Midcoast Energy Partners, L.P. | | | 2,294 | | | | 14,339 | |
MPLX LP | | | 4,578 | | | | 150,372 | |
MPLX LP — Convertible Preferred Units(5)(6)(7) | | | 2,255 | | | | 85,118 | |
NGL Energy Partners LP | | | 257 | | | | 4,764 | |
Noble Midstream Partners LP(8) | | | 284 | | | | 9,098 | |
NuStar Energy L.P. | | | 216 | | | | 10,317 | |
ONEOK Partners, L.P.(9)(10) | | | 6,957 | | | | 290,797 | |
PBF Logistics LP | | | 1,505 | | | | 28,071 | |
PennTex Midstream Partners, LP | | | 336 | | | | 5,284 | |
Phillips 66 Partners LP | | | 227 | | | | 10,263 | |
Plains All American Pipeline, L.P.(10) | | | 8,875 | | | | 292,429 | |
Plains GP Holdings, L.P.(10) | | | 23 | | | | 817 | |
Plains GP Holdings, L.P. — Plains AAP, L.P.(7)(10)(11) | | | 1,278 | | | | 44,918 | |
Rice Midstream Partners LP(5)(7) | | | 581 | | | | 12,304 | |
Shell Midstream Partners, L.P. | | | 575 | | | | 15,867 | |
Spectra Energy Partners, LP | | | 777 | | | | 33,027 | |
Sprague Resources LP | | | 737 | | | | 16,610 | |
Summit Midstream Partners, LP | | | 881 | | | | 19,776 | |
Sunoco Logistics Partners L.P.(4) | | | 3,843 | | | | 91,035 | |
Tallgrass Energy Partners, LP | | | 1,326 | | | | 62,124 | |
TC PipeLines, LP | | | 221 | | | | 11,730 | |
Tesoro Logistics LP | | | 410 | | | | 19,328 | |
Western Gas Partners, LP | | | 3,707 | | | | 211,545 | |
Western Gas Partners, LP — Convertible Preferred Units(5)(7)(12) | | | 134 | | | | 7,839 | |
Williams Partners L.P. | | | 10,902 | | | | 397,917 | |
| | | | | | | | |
| | | | | | | 3,605,156 | |
| | | | | | | | |
See accompanying notes to financial statements.
13
KAYNE ANDERSON MLP INVESTMENT COMPANY
SCHEDULE OF INVESTMENTS
NOVEMBER 30, 2016
(amounts in 000’s, except number of option contracts)
| | | | | | | | |
Description | | No. of
Shares/Units | | | Value | |
Midstream Company — 7.7% | | | | | | | | |
Tallgrass Energy GP, LP | | | 71 | | | $ | 1,728 | |
Targa Resources Corp.(9) | | | 3,120 | | | | 166,262 | |
| | | | | | | | |
| | | | | | | 167,990 | |
| | | | | | | | |
Shipping MLP — 2.9% | | | | | | | | |
Capital Product Partners L.P. — Class B Units(5)(7)(13) | | | 3,030 | | | | 20,970 | |
Dynagas LNG Partners LP | | | 831 | | | | 12,882 | |
Golar LNG Partners LP | | | 1,344 | | | | 29,947 | |
| | | | | | | | |
| | | | | | | 63,799 | |
| | | | | | | | |
General Partner MLP — 0.9% | | | | | | | | |
Energy Transfer Equity, L.P. | | | 927 | | | | 15,792 | |
Western Gas Equity Partners, LP | | | 67 | | | | 2,868 | |
| | | | | | | | |
| | | | | | | 18,660 | |
| | | | | | | | |
Other —0.7% | | | | | | | | |
Clearwater Trust (5)(7)(10)(14) | | | N/A | | | | 90 | |
SunCoke Energy Partners, L.P. | | | 801 | | | | 15,860 | |
| | | | | | | | |
| | | | | | | 15,950 | |
| | | | | | | | |
Total Long-Term Investments — 177.5% (Cost — $2,816,599) | | | | 3,871,555 | |
| | | | | | | | |
| | | | | | | | | | | | | | | | |
| | | Strike
Price | | | Expiration
Date | | | No. of
Contracts | | | Value | |
| Liabilities | | | | | | | | | | | | | | | | |
Call Option Contracts Written(15) | | | | | | | | | | | | | | | | |
Midstream MLP | | | | | | | | | | | | | | | | |
ONEOK Partners, L.P. | | $ | 41.00 | | | | 12/16/16 | | | | 250 | | | | (40 | ) |
ONEOK Partners, L.P. | | | 42.00 | | | | 12/16/16 | | | | 250 | | | | (25 | ) |
| | | | | | | | | | | | | | | | |
| | | | | | | | | | | | | | | (65 | ) |
| | | | | | | | | | | | | | | | |
Midstream Company | | | | | | | | | | | | | | | | |
Targa Resources Corp. | | | 50.00 | | | | 12/16/16 | | | | 500 | | | | (216 | ) |
| | | | | | | | | | | | | | | | |
Total Call Option Contracts Written (Premiums Received — $124) | | | | (281 | ) |
| | | | | | | | | | | | | | | | |
Debt | | | | (810,000 | ) |
Mandatory Redeemable Preferred Stock at Liquidation Value | | | | (300,000 | ) |
Deferred Income Tax Liability | | | | (594,842 | ) |
Income Tax Receivable | | | | 18,470 | |
Other Liabilities in Excess of Other Assets | | | | (4,121 | ) |
| | | | | | | | | | | | | | | | |
Net Assets Applicable to Common Stockholders | | | $ | 2,180,781 | |
| | | | | | | | | | | | | | | | |
| (1) | Unless otherwise noted, equity investments are common units/common shares. |
| (2) | Includes limited liability companies. |
| (3) | Dividends are paid-in-kind. |
| (4) | On November 21, 2016, Energy Transfer Partners, L.P. (“ETP”) and Sunoco Logistics Partners L.P. (“SXL”) announced an agreement to combine in a unit-for-unit merger. |
See accompanying notes to financial statements.
14
KAYNE ANDERSON MLP INVESTMENT COMPANY
SCHEDULE OF INVESTMENTS
NOVEMBER 30, 2016
(amounts in 000’s, except number of option contracts)
| (5) | Fair valued security. See Notes 2 and 3 in Notes to Financial Statements. |
| (6) | On May 13, 2016, the Company purchased, in a private placement, Series A Convertible Preferred Units (“MPLX Convertible Preferred Units”) from MPLX LP (“MPLX”). The MPLX Convertible Preferred Units are senior to the common units in terms of liquidation preference and priority of distributions and pay a quarterly distribution of $0.528125 per unit for the first two years and thereafter will pay the higher of (a) $0.528125 per unit or (b) the distribution that the MPLX Convertible Preferred Units would receive on an as converted basis. The MPLX Convertible Preferred Units have a one-year lock-up through May 13, 2017. Holders of the MPLX Convertible Preferred Units may convert on a one-for-one basis to MPLX common units any time after May 13, 2019. |
| (7) | The Company’s ability to sell this security is subject to certain legal or contractual restrictions. As of November 30, 2016, the aggregate value of restricted securities held by the Company was $171,239 (4.4% of total assets). See Note 7 — Restricted Securities. |
| (8) | Security is not currently paying cash distributions but is expected to pay cash distributions within the next 12 months. |
| (9) | Security or a portion thereof is segregated as collateral on option contracts written. |
| (10) | The Company believes that it is an affiliate of Clearwater Trust, Plains AAP, L.P. (“PAGP-AAP”), Plains All American Pipeline, L.P. (“PAA”) and Plains GP Holdings, L.P. (“PAGP”). The Company does not believe that it is an affiliate of ONEOK Partners, L.P. See Note 5 — Agreements and Affiliations. |
| (11) | The Company’s ownership of PAGP-AAP is exchangeable on a one-for-one basis into either PAGP shares or PAA units at the Company’s option. The Company values its PAGP-AAP investment on an “as exchanged” basis based on the higher public market value of either PAGP or PAA. As of November 30, 2016, the Company’s PAGP-AAP investment is valued at PAGP’s closing price. See Notes 3 and 7 in Notes to Financial Statements. |
| (12) | On April 15, 2016, the Company purchased, in a private placement, Series A Convertible Preferred Units (“WES Convertible Preferred Units”) from Western Gas Partners, LP (“WES”). The WES Convertible Preferred Units are senior to the common units in terms of liquidation preference and priority of distributions and pay a quarterly distribution of $0.68 per unit. The WES Convertible Preferred Units have a one-year lock-up through March 14, 2017, and holders of the WES Convertible Preferred Units may convert on a one-for-one basis into common units of WES any time after March 14, 2018. |
| (13) | Class B Units are convertible on a one-for-one basis into common units of Capital Product Partners L.P. (“CPLP”) and are senior to the common units in terms of liquidation preference and priority of distributions. The Class B Units pay quarterly cash distributions and are convertible at any time at the option of the holder. The Class B Units paid a distribution of $0.21375 per unit for the fourth quarter. |
| (14) | The Company owns an interest in the Creditors Trust of Miller Bros. Coal, LLC (“Clearwater Trust”) consisting of a coal royalty interest and certain other assets. See Notes 5 and 7 in Notes to Financial Statements. |
| (15) | Security is non-income producing. |
See accompanying notes to financial statements.
15
KAYNE ANDERSON MLP INVESTMENT COMPANY
STATEMENT OF ASSETS AND LIABILITIES
NOVEMBER 30, 2016
(amounts in 000’s, except share and per share amounts)
| | | | |
ASSETS | | | | |
Investments at fair value: | | | | |
Non-affiliated (Cost — $2,673,881) | | $ | 3,533,301 | |
Affiliated (Cost — $142,718) | | | 338,254 | |
| | | | |
Total investments (Cost — $2,816,599) | | | 3,871,555 | |
Cash | | | 1,095 | |
Deposits with brokers | | | 251 | |
Receivable for securities sold | | | 22,622 | |
Dividends and distributions receivable | | | 910 | |
Income tax receivable | | | 18,470 | |
Deferred debt and preferred stock offering costs and other assets | | | 8,648 | |
| | | | |
Total Assets | | | 3,923,551 | |
| | | | |
| |
LIABILITIES | | | | |
Payable for securities purchased | | | 9,562 | |
Investment management fee payable | | | 13,286 | |
Accrued directors’ fees and expenses | | | 126 | |
Call option contracts written (Premiums received — $124) | | | 281 | |
Accrued expenses and other liabilities | | | 14,673 | |
Deferred income tax liability | | | 594,842 | |
Term loan | | | 43,000 | |
Notes | | | 767,000 | |
Mandatory redeemable preferred stock, $25.00 liquidation value per share (12,000,000 shares issued and outstanding) | | | 300,000 | |
| | | | |
Total Liabilities | | | 1,742,770 | |
| | | | |
NET ASSETS APPLICABLE TO COMMON STOCKHOLDERS | | $ | 2,180,781 | |
| | | | |
NET ASSETS APPLICABLE TO COMMON STOCKHOLDERS CONSIST OF | | | | |
Common stock, $0.001 par value (113,687,509 shares issued and outstanding, 188,000,000 shares authorized) | | $ | 114 | |
Paid-in capital | | | 2,124,102 | |
Accumulated net investment loss, net of income taxes, less dividends | | | (1,408,226 | ) |
Accumulated realized gains, net of income taxes | | | 799,062 | |
Net unrealized gains, net of income taxes | | | 665,729 | |
| | | | |
NET ASSETS APPLICABLE TO COMMON STOCKHOLDERS | | $ | 2,180,781 | |
| | | | |
NET ASSET VALUE PER COMMON SHARE | | $ | 19.18 | |
| | | | |
See accompanying notes to financial statements.
16
KAYNE ANDERSON MLP INVESTMENT COMPANY
STATEMENT OF OPERATIONS
FOR THE FISCAL YEAR ENDED NOVEMBER 30, 2016
(amounts in 000’s)
| | | | |
INVESTMENT INCOME | | | | |
Income | | | | |
Dividends and distributions: | | | | |
Non-affiliated investments | | $ | 275,374 | |
Affiliated investments | | | 26,117 | |
| | | | |
Total dividends and distributions | | | 301,491 | |
Return of capital | | | (283,982 | ) |
Distributions in excess of cost basis | | | (6,201 | ) |
| | | | |
Net dividends and distributions | | | 11,308 | |
Interest income | | | 102 | |
| | | | |
Total Investment Income | | | 11,410 | |
| | | | |
Expenses | | | | |
Investment management fees | | | 49,947 | |
Administration fees | | | 1,227 | |
Directors’ fees and expenses | | | 525 | |
Professional fees | | | 500 | |
Reports to stockholders | | | 415 | |
Custodian fees | | | 209 | |
Insurance | | | 205 | |
Other expenses | | | 781 | |
| | | | |
Total expenses — before fee waiver, interest expense, preferred distributions and taxes | | | 53,809 | |
Interest expense including amortization and write-off of offering costs | | | 36,547 | |
Distributions on mandatory redeemable preferred stock including amortization and write-off of offering costs | | | 20,383 | |
| | | | |
Total expenses — before taxes | | | 110,739 | |
| | | | |
Net Investment Loss — Before Taxes | | | (99,329 | ) |
Current income tax expense | | | (4,580 | ) |
Deferred income tax benefit | | | 34,861 | |
| | | | |
Net Investment Loss | | | (69,048 | ) |
| | | | |
REALIZED AND UNREALIZED GAINS (LOSSES) | | | | |
Net Realized Gains (Losses) | | | | |
Investments — non-affiliated | | | 168,172 | |
Investments — affiliated | | | 7,488 | |
Options | | | 2,389 | |
Current income tax benefit | | | 10,034 | |
Deferred income tax expense | | | (76,376 | ) |
| | | | |
Net Realized Gains | | | 111,707 | |
| | | | |
Net Change in Unrealized Gains (Losses) | | | | |
Investments — non-affiliated | | | 246,449 | |
Investments — affiliated | | | 89,893 | |
Options | | | (157 | ) |
Deferred income tax expense | | | (125,264 | ) |
| | | | |
Net Change in Unrealized Gains | | | 210,921 | |
| | | | |
Net Realized and Unrealized Gains | | | 322,628 | |
| | | | |
NET INCREASE IN NET ASSETS APPLICABLE TO COMMON STOCKHOLDERS RESULTING FROM OPERATIONS | | $ | 253,580 | |
| | | | |
See accompanying notes to financial statements.
17
KAYNE ANDERSON MLP INVESTMENT COMPANY
STATEMENT OF CHANGES IN NET ASSETS APPLICABLE TO COMMON STOCKHOLDERS
(amounts in 000’s, except share amounts)
| | | | | | | | |
| | | For the Fiscal Year Ended
November 30, | |
| | | 2016 | | | 2015 | |
OPERATIONS | | | | | | | | |
Net investment loss, net of tax(1) | | $ | (69,048 | ) | | $ | (58,462 | ) |
Net realized gains (losses), net of tax | | | 111,707 | | | | (45,613 | ) |
Net change in unrealized gains (losses), net of tax | | | 210,921 | | | | (1,549,027 | ) |
| | | | | | | | |
Net Increase (Decrease) in Net Assets Resulting from Operations | | | 253,580 | | | | (1,653,102 | ) |
| | | | | | | | |
DIVIDENDS AND DISTRIBUTIONS TO COMMON STOCKHOLDERS(2) | | | | | | | | |
Dividends | | | — | | | | (237,809 | ) |
Distributions — return of capital | | | (248,172 | ) | | | (52,871 | ) |
| | | | | | | | |
Dividends and Distributions to Common Stockholders | | | (248,172 | ) | | | (290,680 | ) |
| | | | | | | | |
CAPITAL STOCK TRANSACTIONS | | | | | | | | |
Issuance of 665,037 and 811,419 shares of common stock, respectively | | | 10,035 | (3) | | | 29,388 | |
Underwriting discounts and offering expenses associated with the issuance of common stock | | | — | | | | (609 | ) |
Issuance of 1,497,460 and 1,035,258 shares of common stock from reinvestment of dividends and distributions, respectively | | | 23,736 | | | | 29,783 | |
| | | | | | | | |
Net Increase in Net Assets Applicable to Common Stockholders from Capital Stock Transactions | | | 33,771 | | | | 58,562 | |
| | | | | | | | |
Total Increase (Decrease) in Net Assets Applicable to Common Stockholders | | | 39,179 | | | | (1,885,220 | ) |
| | | | | | | | |
NET ASSETS APPLICABLE TO COMMON STOCKHOLDERS | | | | | | | | |
Beginning of year | | | 2,141,602 | | | | 4,026,822 | |
| | | | | | | | |
End of year | | $ | 2,180,781 | | | $ | 2,141,602 | |
| | | | | | | | |
| (1) | Distributions on the Company’s mandatory redeemable preferred stock (“MRP Shares”) are treated as an operating expense under GAAP and are included in the calculation of net investment loss. See Note 2 —Significant Accounting Policies. Distributions in the amount of $17,811 paid to holders of MRP Shares for the fiscal year ended November 30, 2016 were characterized as distributions (return of capital). Distributions in the amount of $23,251 paid to holders of MRP Shares for the fiscal year ended November 30, 2015, were characterized as dividends (eligible to be treated as qualified dividend income). This characterization is based on the Company’s earnings and profits. |
| (2) | Distributions paid to common stockholders for the fiscal years ended November 30, 2016 and 2015 were characterized as either dividends (eligible to be treated as qualified dividend income) or distributions (return of capital). This characterization is based on the Company’s earnings and profits. |
| (3) | On December 17, 2015, the Company’s investment advisor, KA Fund Advisors, LLC, purchased $10,035 of newly issued shares funded in part with the after-tax management fees received during the fourth quarter of fiscal 2015. See Note 13 — Common Stock. |
See accompanying notes to financial statements.
18
KAYNE ANDERSON MLP INVESTMENT COMPANY
STATEMENT OF CASH FLOWS
FOR THE FISCAL YEAR ENDED NOVEMBER 30, 2016
(amounts in 000’s)
| | | | |
CASH FLOWS FROM OPERATING ACTIVITIES | | | | |
Net increase in net assets resulting from operations | | $ | 253,580 | |
Adjustments to reconcile net increase in net assets resulting from operations to net cash provided by operating activities: | | | | |
Return of capital distributions | | | 283,982 | |
Distributions in excess of cost basis | | | 6,201 | |
Net realized gains | | | (178,049 | ) |
Net unrealized gains | | | (336,185 | ) |
Purchase of long-term investments | | | (516,557 | ) |
Proceeds from sale of long-term investments | | | 795,593 | |
Increase in receivable for securities sold | | | (14,241 | ) |
Decrease in interest, dividends and distributions receivable | | | 153 | |
Increase in income tax receivable | | | (5,610 | ) |
Amortization and write-off of deferred debt offering costs | | | 2,362 | |
Amortization and write-off of mandatory redeemable preferred stock offering costs | | | 2,573 | |
Increase in other assets | | | (38 | ) |
Increase in payable for securities purchased | | | 3,421 | |
Decrease in investment management fee payable | | | (2,726 | ) |
Increase in accrued directors’ fees and expenses | | | 2 | |
Increase in premiums received on call option contracts written | | | 124 | |
Decrease in accrued expenses and other liabilities | | | (6,658 | ) |
Increase in deferred income tax liability | | | 166,779 | |
| | | | |
Net Cash Provided by Operating Activities | | | 454,706 | |
| | | | |
CASH FLOWS FROM FINANCING ACTIVITIES | | | | |
Increase in borrowings under term loan | | | 43,000 | |
Proceeds from issuance of shares of common stock | | | 10,035 | |
Proceeds from offering of mandatory redeemable preferred stock | | | 50,000 | |
Redemption of notes | | | (264,000 | ) |
Redemption of mandatory redeemable preferred stock | | | (214,000 | ) |
Costs associated with renewal of credit facility | | | (1,230 | ) |
Costs associated with offering of mandatory redeemable preferred stock | | | (717 | ) |
Cash distributions paid to common stockholders | | | (224,436 | ) |
| | | | |
Net Cash Used in Financing Activities | | | (601,348 | ) |
| | | | |
NET DECREASE IN CASH | | | (146,642 | ) |
CASH — BEGINNING OF YEAR | | | 147,737 | |
| | | | |
CASH — END OF YEAR | | $ | 1,095 | |
| | | | |
Supplemental disclosure of cash flow information:
Non-cash financing activities not included herein consisted of reinvestment of distributions of $23,736 pursuant to the Company’s dividend reinvestment plan.
During the fiscal year ended November 30, 2016, interest paid related to debt obligations was $39,157 and income tax paid was $156.
The Company received $4,750 of paid-in-kind dividends during the fiscal year ended November 30, 2016. See Note 2 — Significant Accounting Policies.
See accompanying notes to financial statements.
19
KAYNE ANDERSON MLP INVESTMENT COMPANY
FINANCIAL HIGHLIGHTS
(amounts in 000’s, except share and per share amounts)
| | | | | | | | | | | | |
| | | For the Fiscal Year Ended November 30, | |
| | | 2016 | | | 2015 | | | 2014 | |
| | | | | | | | | | |
Per Share of Common Stock(1) | | | | | | | | | | | | |
Net asset value, beginning of period | | $ | 19.20 | | | $ | 36.71 | | | $ | 34.30 | |
Net investment income (loss)(2) | | | (0.61 | ) | | | (0.53 | ) | | | (0.76 | ) |
Net realized and unrealized gain (loss) | | | 2.80 | | | | (14.39 | ) | | | 5.64 | |
| | | | | | | | | | | | |
Total income (loss) from operations | | | 2.19 | | | | (14.92 | ) | | | 4.88 | |
| | | | | | | | | | | | |
Dividends and distributions — auction rate preferred(2)(3) | | | — | | | | — | | | | — | |
| | | | | | | | | | | | |
Common dividends(3) | | | — | | | | (2.15 | ) | | | (2.28 | ) |
Common distributions — return of capital(3) | | | (2.20 | ) | | | (0.48 | ) | | | (0.25 | ) |
| | | | | | | | | | | | |
Total dividends and distributions — common | | | (2.20 | ) | | | (2.63 | ) | | | (2.53 | ) |
| | | | | | | | | | | | |
Underwriting discounts and offering costs on the issuance of auction rate preferred stock | | | — | | | | — | | | | — | |
Effect of issuance of common stock | | | — | | | | 0.03 | | | | 0.06 | |
Effect of shares issued in reinvestment of distributions | | | (0.01 | ) | | | 0.01 | | | | — | |
| | | | | | | | | | | | |
Total capital stock transactions | | | (0.01 | ) | | | 0.04 | | | | 0.06 | |
| | | | | | | | | | | | |
Net asset value, end of period | | $ | 19.18 | | | $ | 19.20 | | | $ | 36.71 | |
| | | | | | | | | | | | |
Market value per share of common stock, end of period | | $ | 19.72 | | | $ | 18.23 | | | $ | 38.14 | |
| | | | | | | | | | | | |
Total investment return based on common stock market value(4) | | | 24.1 | % | | | (47.7 | )% | | | 9.9 | % |
Total investment return based on net asset value(5) | | | 14.6 | % | | | (42.8 | )% | | | 14.8 | % |
Supplemental Data and Ratios(6) | | | | | | | | | | | | |
Net assets applicable to common stockholders, end of period | | $ | 2,180,781 | | | $ | 2,141,602 | | | $ | 4,026,822 | |
Ratio of expenses to average net assets | | | | | | | | | | | | |
Management fees (net of fee waiver) | | | 2.5 | % | | | 2.6 | % | | | 2.4 | % |
Other expenses | | | 0.2 | | | | 0.1 | | | | 0.1 | |
| | | | | | | | | | | | |
Subtotal | | | 2.7 | | | | 2.7 | | | | 2.5 | |
Interest expense and distributions on mandatory redeemable preferred stock(2) | | | 2.8 | | | | 2.4 | | | | 1.8 | |
Income tax expense(7) | | | 7.9 | | | | — | | | | 8.3 | |
| | | | | | | | | | | | |
Total expenses | | | 13.4 | % | | | 5.1 | % | | | 12.6 | % |
| | | | | | | | | | | | |
Ratio of net investment income (loss) to average net assets(2) | | | (3.4 | )% | | | (1.8 | )% | | | (2.0 | )% |
Net increase (decrease) in net assets to common stockholders resulting from operations to average net assets | | | 12.5 | % | | | (51.7 | )% | | | 13.2 | % |
Portfolio turnover rate | | | 14.5 | % | | | 17.1 | % | | | 17.6 | % |
Average net assets | | $ | 2,031,206 | | | $ | 3,195,445 | | | $ | 3,967,458 | |
Notes outstanding, end of period | | $ | 767,000 | | | $ | 1,031,000 | | | $ | 1,435,000 | |
Credit facility outstanding, end of period | | $ | — | | | $ | — | | | $ | — | |
Term loan outstanding, end of period | | $ | 43,000 | | | $ | — | | | $ | 51,000 | |
Auction rate preferred stock, end of period | | $ | — | | | $ | — | | | $ | — | |
Mandatory redeemable preferred stock, end of period | | $ | 300,000 | | | $ | 464,000 | | | $ | 524,000 | |
Average shares of common stock outstanding | | | 112,967,480 | | | | 110,809,350 | | | | 107,305,514 | |
Asset coverage of total debt(8) | | | 406.3 | % | | | 352.7 | % | | | 406.2 | % |
Asset coverage of total leverage (debt and preferred stock)(9) | | | 296.5 | % | | | 243.3 | % | | | 300.3 | % |
Average amount of borrowings per share of common stock during the period(1) | | $ | 7.06 | | | $ | 11.95 | | | $ | 13.23 | |
20
See accompanying notes to financial statements.
KAYNE ANDERSON MLP INVESTMENT COMPANY
FINANCIAL HIGHLIGHTS
(amounts in 000’s, except share and per share amounts)
| | | | | | | | | | | | | | | | |
| | | For the Fiscal Year Ended November 30, | |
| | | 2013 | | | 2012 | | | 2011 | | | 2010 | |
| | | | | | | | | | | | | |
Per Share of Common Stock(1) | | | | | | | | | | | | | | | | |
Net asset value, beginning of period | | $ | 28.51 | | | $ | 27.01 | | | $ | 26.67 | | | $ | 20.13 | |
Net investment income (loss)(2) | | | (0.73 | ) | | | (0.71 | ) | | | (0.69 | ) | | | (0.44 | ) |
Net realized and unrealized gain (loss) | | | 8.72 | | | | 4.27 | | | | 2.91 | | | | 8.72 | |
| | | | | | | | | | | | | | | | |
Total income (loss) from operations | | | 7.99 | | | | 3.56 | | | | 2.22 | | | | 8.28 | |
| | | | | | | | | | | | | | | | |
Dividends and distributions — auction rate preferred(2)(3) | | | — | | | | — | | | | — | | | | — | |
| | | | | | | | | | | | | | | | |
Common dividends(3) | | | (1.54 | ) | | | (1.54 | ) | | | (1.26 | ) | | | (0.84 | ) |
Common distributions — return of capital(3) | | | (0.75 | ) | | | (0.55 | ) | | | (0.72 | ) | | | (1.08 | ) |
| | | | | | | | | | | | | | | | |
Total dividends and distributions — common | | | (2.29 | ) | | | (2.09 | ) | | | (1.98 | ) | | | (1.92 | ) |
| | | | | | | | | | | | | | | | |
Underwriting discounts and offering costs on the issuance of auction rate preferred stock | | | — | | | | — | | | | — | | | | — | |
Effect of issuance of common stock | | | 0.09 | | | | 0.02 | | | | 0.09 | | | | 0.16 | |
Effect of shares issued in reinvestment of distributions | | | — | | | | 0.01 | | | | 0.01 | | | | 0.02 | |
| | | | | | | | | | | | | | | | |
Total capital stock transactions | | | 0.09 | | | | 0.03 | | | | 0.10 | | | | 0.18 | |
| | | | | | | | | | | | | | | | |
Net asset value, end of period | | $ | 34.30 | | | $ | 28.51 | | | $ | 27.01 | | | $ | 26.67 | |
| | | | | | | | | | | | | | | | |
Market value per share of common stock, end of period | | $ | 37.23 | | | $ | 31.13 | | | $ | 28.03 | | | $ | 28.49 | |
| | | | | | | | | | | | | | | | |
Total investment return based on common stock market value(4) | | | 28.2 | % | | | 19.3 | % | | | 5.6 | % | | | 26.0 | % |
Total investment return based on net asset value(5) | | | 29.0 | % | | | 13.4 | % | | | 8.7 | % | | | 43.2 | % |
Supplemental Data and Ratios(6) | | | | | | | | | | | | | | | | |
Net assets applicable to common stockholders, end of period | | $ | 3,443,916 | | | $ | 2,520,821 | | | $ | 2,029,603 | | | $ | 1,825,891 | |
Ratio of expenses to average net assets | | | | | | | | | | | | | | | | |
Management fees (net of fee waiver) | | | 2.4 | % | | | 2.4 | % | | | 2.4 | % | | | 2.1 | % |
Other expenses | | | 0.1 | | | | 0.2 | | | | 0.2 | | | | 0.2 | |
| | | | | | | | | | | | | | | | |
Subtotal | | | 2.5 | | | | 2.6 | | | | 2.6 | | | | 2.3 | |
Interest expense and distributions on mandatory redeemable preferred stock(2) | | | 2.1 | | | | 2.4 | | | | 2.3 | | | | 1.9 | |
Income tax expense(7) | | | 14.4 | | | | 7.2 | | | | 4.8 | | | | 20.5 | |
| | | | | | | | | | | | | | | | |
Total expenses | | | 19.0 | % | | | 12.2 | % | | | 9.7 | % | | | 24.7 | % |
| | | | | | | | | | | | | | | | |
Ratio of net investment income (loss) to average net assets(2) | | | (2.3 | )% | | | (2.5 | )% | | | (2.5 | )% | | | (1.8 | )% |
Net increase (decrease) in net assets to common stockholders resulting from operations to average net assets | | | 24.3 | % | | | 11.6 | % | | | 7.7 | % | | | 34.6 | % |
Portfolio turnover rate | | | 21.2 | % | | | 20.4 | % | | | 22.3 | % | | | 18.7 | % |
Average net assets | | $ | 3,027,563 | | | $ | 2,346,249 | | | $ | 1,971,469 | | | $ | 1,432,266 | |
Notes outstanding, end of period | | $ | 1,175,000 | | | $ | 890,000 | | | $ | 775,000 | | | $ | 620,000 | |
Credit facility outstanding, end of period | | $ | 69,000 | | | $ | 19,000 | | | $ | — | | | $ | — | |
Term loan outstanding, end of period | | $ | — | | | $ | — | | | $ | — | | | $ | — | |
Auction rate preferred stock, end of period | | $ | — | | | $ | — | | | $ | — | | | $ | — | |
Mandatory redeemable preferred stock, end of period | | $ | 449,000 | | | $ | 374,000 | | | $ | 260,000 | | | $ | 160,000 | |
Average shares of common stock outstanding | | | 94,658,194 | | | | 82,809,687 | | | | 72,661,162 | | | | 60,762,952 | |
Asset coverage of total debt(8) | | | 412.9 | % | | | 418.5 | % | | | 395.4 | % | | | 420.3 | % |
Asset coverage of total leverage (debt and preferred stock)(9) | | | 303.4 | % | | | 296.5 | % | | | 296.1 | % | | | 334.1 | % |
Average amount of borrowings per share of common stock during the period(1) | | $ | 11.70 | | | $ | 10.80 | | | $ | 10.09 | | | $ | 7.70 | |
21
See accompanying notes to financial statements.
KAYNE ANDERSON MLP INVESTMENT COMPANY
FINANCIAL HIGHLIGHTS
(amounts in 000’s, except share and per share amounts)
| | | | | | | | | | | | |
| | | For the Fiscal Year Ended
November 30, | |
| | | 2009 | | | 2008 | | | 2007 | |
| | | | | | | | | | |
Per Share of Common Stock(1) | | | | | | | | | | | | |
Net asset value, beginning of period | | $ | 14.74 | | | $ | 30.08 | | | $ | 28.99 | |
Net investment income (loss)(2) | | | (0.33 | ) | | | (0.73 | ) | | | (0.73 | ) |
Net realized and unrealized gain (loss) | | | 7.50 | | | | (12.56 | ) | | | 3.58 | |
| | | | | | | | | | | | |
Total income (loss) from operations | | | 7.17 | | | | (13.29 | ) | | | 2.85 | |
| | | | | | | | | | | | |
Dividends and distributions — auction rate preferred(2)(3) | | | (0.01 | ) | | | (0.10 | ) | | | (0.10 | ) |
| | | | | | | | | | | | |
Common dividends(3) | | | — | | | | — | | | | (0.09 | ) |
Common distributions — return of capital(3) | | | (1.94 | ) | | | (1.99 | ) | | | (1.84 | ) |
| | | | | | | | | | | | |
Total dividends and distributions — common | | | (1.94 | ) | | | (1.99 | ) | | | (1.93 | ) |
| | | | | | | | | | | | |
Underwriting discounts and offering costs on the issuance of auction rate preferred stock | | | — | | | | — | | | | — | |
Effect of issuance of common stock | | | 0.12 | | | | — | | | | 0.26 | |
Effect of shares issued in reinvestment of distributions | | | 0.05 | | | | 0.04 | | | | 0.01 | |
| | | | | | | | | | | | |
Total capital stock transactions | | | 0.17 | | | | 0.04 | | | | 0.27 | |
| | | | | | | | | | | | |
Net asset value, end of period | | $ | 20.13 | | | $ | 14.74 | | | $ | 30.08 | |
| | | | | | | | | | | | |
Market value per share of common stock, end of period | | $ | 24.43 | | | $ | 13.37 | | | $ | 28.27 | |
| | | | | | | | | | | | |
Total investment return based on common stock market value(4) | | | 103.0 | % | | | (48.8 | )% | | | (4.4 | )% |
Total investment return based on net asset value(5) | | | 51.7 | % | | | (46.9 | )% | | | 10.2 | % |
Supplemental Data and Ratios(6) | | | | | | | | | | | | |
Net assets applicable to common stockholders, end of period | | $ | 1,038,277 | | | $ | 651,156 | | | $ | 1,300,030 | |
Ratio of expenses to average net assets | | | | | | | | | | | | |
Management fees (net of fee waiver) | | | 2.1 | % | | | 2.2 | % | | | 2.3 | % |
Other expenses | | | 0.4 | | | | 0.3 | | | | 0.2 | |
| | | | | | | | | | | | |
Subtotal | | | 2.5 | | | | 2.5 | | | | 2.5 | |
Interest expense and distributions on mandatory redeemable preferred stock(2) | | | 2.5 | | | | 3.4 | | | | 2.3 | |
Income tax expense(7) | | | 25.4 | | | | — | | | | 3.5 | |
| | | | | | | | | | | | |
Total expenses | | | 30.4 | % | | | 5.9 | % | | | 8.3 | % |
| | | | | | | | | | | | |
Ratio of net investment income (loss) to average net assets(2) | | | (2.0 | )% | | | (2.8 | )% | | | (2.3 | )% |
Net increase (decrease) in net assets to common stockholders resulting from operations to average net assets | | | 43.2 | % | | | (51.2 | )% | | | 7.3 | % |
Portfolio turnover rate | | | 28.9 | % | | | 6.7 | % | | | 10.6 | % |
Average net assets | | $ | 774,999 | | | $ | 1,143,192 | | | $ | 1,302,425 | |
Notes outstanding, end of period | | $ | 370,000 | | | $ | 304,000 | | | $ | 505,000 | |
Credit facility outstanding, end of period | | $ | — | | | $ | — | | | $ | 97,000 | |
Term loan outstanding, end of period | | $ | — | | | $ | — | | | $ | — | |
Auction rate preferred stock, end of period | | $ | 75,000 | | | $ | 75,000 | | | $ | 75,000 | |
Mandatory redeemable preferred stock, end of period | | $ | — | | | $ | — | | | $ | — | |
Average shares of common stock outstanding | | | 46,894,632 | | | | 43,671,666 | | | | 41,134,949 | |
Asset coverage of total debt(8) | | | 400.9 | % | | | 338.9 | % | | | 328.4 | % |
Asset coverage of total leverage (debt and preferred stock)(9) | | | 333.3 | % | | | 271.8 | % | | | 292.0 | % |
Average amount of borrowings per share of common stock during the period(1) | | $ | 6.79 | | | $ | 11.52 | | | $ | 12.14 | |
22
See accompanying notes to financial statements.
KAYNE ANDERSON MLP INVESTMENT COMPANY
FINANCIAL HIGHLIGHTS
(amounts in 000’s, except share and per share amounts)
| (1) | Based on average shares of common stock outstanding. |
| (2) | Distributions on the Company’s MRP Shares are treated as an operating expense under GAAP and are included in the calculation of net investment income (loss). See Note 2 — Significant Accounting Policies. |
| (3) | The information presented for each period is a characterization of the total distributions paid to preferred stockholders and common stockholders as either a dividend (eligible to be treated as qualified dividend income) or a distribution (return of capital) and is based on the Company’s earnings and profits. |
| (4) | Total investment return based on market value is calculated assuming a purchase of common stock at the market price on the first day and a sale at the current market price on the last day of the period reported. The calculation also assumes reinvestment of distributions at actual prices pursuant to the Company’s dividend reinvestment plan. |
| (5) | Total investment return based on net asset value is calculated assuming a purchase of common stock at the net asset value on the first day and a sale at the net asset value on the last day of the period reported. The calculation also assumes reinvestment of distributions at actual prices pursuant to the Company’s dividend reinvestment plan. |
| (6) | Unless otherwise noted, ratios are annualized. |
| (7) | For the fiscal years ended November 30, 2015 and November 30, 2008, the Company reported an income tax benefit of $980,647 (30.7% of average net assets) and $339,991 (29.7% of average net assets), respectively, primarily related to unrealized losses on investments. The income tax expense is assumed to be 0% because the Company reported a net deferred income tax benefit during the year. |
| (8) | Calculated pursuant to section 18(a)(1)(A) of the 1940 Act. Represents the value of total assets less all liabilities not represented by Notes or any other senior securities representing indebtedness and MRP Shares divided by the aggregate amount of Notes and any other senior securities representing indebtedness. Under the 1940 Act, the Company may not declare or make any distribution on its common stock nor can it incur additional indebtedness if, at the time of such declaration or incurrence, its asset coverage with respect to senior securities representing indebtedness would be less than 300%. For purposes of this test, the Credit Facility and the Term Loan are considered senior securities representing indebtedness. |
| (9) | Calculated pursuant to section 18(a)(2)(A) of the 1940 Act. Represents the value of total assets less all liabilities not represented by Notes, any other senior securities representing indebtedness and MRP Shares divided by the aggregate amount of Notes, any other senior securities representing indebtedness and MRP Shares. Under the 1940 Act, the Company may not declare or make any distribution on its common stock nor can it issue additional preferred stock if at the time of such declaration or issuance, its asset coverage with respect to all senior securities would be less than 200%. In addition to the limitations under the 1940 Act, the Company, under the terms of its MRP Shares, would not be able to declare or pay any distributions on its common stock if such declaration would cause its asset coverage with respect to all senior securities to be less than 225%. For purposes of these tests, the Credit Facility and the Term Loan are considered senior securities representing indebtedness. |
See accompanying notes to financial statements.
23
KAYNE ANDERSON MLP INVESTMENT COMPANY
NOTES TO FINANCIAL STATEMENTS
(amounts in 000’s, except number of option contracts, share and per share amounts)
Kayne Anderson MLP Investment Company (the “Company”) was organized as a Maryland corporation on June 4, 2004, and is a non-diversified closed-end management investment company registered under the Investment Company Act of 1940, as amended (the “1940 Act”). The Company’s investment objective is to obtain a high after-tax total return by investing at least 85% of its net assets plus any borrowings (“total assets”) in energy-related master limited partnerships and their affiliates (collectively, “MLPs”), and in other companies that, as their principal business, operate assets used in the gathering, transporting, processing, storing, refining, distributing, mining or marketing of natural gas, natural gas liquids (including propane), crude oil, refined petroleum products or coal (collectively with MLPs, “Midstream Energy Companies”). The Company commenced operations on September 28, 2004. The Company’s shares of common stock are listed on the New York Stock Exchange, Inc. (“NYSE”) under the symbol “KYN.”
| 2. Significant | Accounting Policies |
The following is a summary of the significant accounting policies that the Company uses to prepare its financial statements in accordance with accounting principles generally accepted in the United States of America (“GAAP”). The Company is an investment company and follows accounting and reporting guidance of the Financial Accounting Standards Board (FASB) Accounting Standards Codification (ASC) Topic 946 — “Financial Services — Investment Companies.”
A. Use of Estimates — The preparation of financial statements in conformity with GAAP requires management to make estimates and assumptions that affect the reported amount of assets and liabilities and disclosure of contingent assets and liabilities as of the date of the financial statements and the reported amounts of income and expenses during the period. Actual results could differ materially from those estimates.
B. Cash and Cash Equivalents — Cash and cash equivalents include short-term, liquid investments with an original maturity of three months or less and include money market fund accounts.
C. Calculation of Net Asset Value — The Company determines its net asset value on a daily basis and reports its net asset value on its website. Net asset value is computed by dividing the value of the Company’s assets (including accrued interest and distributions and current and deferred income tax assets), less all of its liabilities (including accrued expenses, distributions payable, current and deferred accrued income taxes, and any borrowings) and the liquidation value of any outstanding preferred stock, by the total number of common shares outstanding.
D. Investment Valuation — Readily marketable portfolio securities listed on any exchange other than the NASDAQ Stock Market, Inc. (“NASDAQ”) are valued, except as indicated below, at the last sale price on the business day as of which such value is being determined. If there has been no sale on such day, the securities are valued at the mean of the most recent bid and ask prices on such day. Securities admitted to trade on the NASDAQ are valued at the NASDAQ official closing price. Portfolio securities traded on more than one securities exchange are valued at the last sale price on the business day as of which such value is being determined at the close of the exchange representing the principal market for such securities.
Equity securities traded in the over-the-counter market, but excluding securities admitted to trading on the NASDAQ, are valued at the closing bid prices. Debt securities that are considered bonds are valued by using the mean of the bid and ask prices provided by an independent pricing service or, if such prices are not available or in the judgment of KA Fund Advisors, LLC (“KAFA”) such prices are stale or do not represent fair value, by an independent broker. For debt securities that are considered bank loans, the fair market value is determined by using the mean of the bid and ask prices provided by the agent or syndicate bank or principal market maker. When price quotes for securities are not available, or such prices are stale or do not represent fair value in the judgment of KAFA, fair market value will be determined using the Company’s valuation process for securities that are privately issued or otherwise restricted as to resale.
24
KAYNE ANDERSON MLP INVESTMENT COMPANY
NOTES TO FINANCIAL STATEMENTS
(amounts in 000’s, except number of option contracts, share and per share amounts)
Exchange-traded options and futures contracts are valued at the last sales price at the close of trading in the market where such contracts are principally traded or, if there was no sale on the applicable exchange on such day, at the mean between the quoted bid and ask price as of the close of such exchange.
The Company holds securities that are privately issued or otherwise restricted as to resale. For these securities, as well as any security for which (a) reliable market quotations are not available in the judgment of KAFA, or (b) the independent pricing service or independent broker does not provide prices or provides a price that in the judgment of KAFA is stale or does not represent fair value, shall each be valued in a manner that most fairly reflects fair value of the security on the valuation date. Unless otherwise determined by the Board of Directors, the following valuation process is used for such securities:
| | • | | Investment Team Valuation. The applicable investments are valued by senior professionals of KAFA who are responsible for the portfolio investments. The investments will be valued monthly with new investments valued at the time such investment was made. |
| | • | | Investment Team Valuation Documentation. Preliminary valuation conclusions will be determined by senior management of KAFA. Such valuations and supporting documentation are submitted to the Valuation Committee (a committee of the Company’s Board of Directors) and the Board of Directors on a quarterly basis. |
| | • | | Valuation Committee. The Valuation Committee meets to consider the valuations submitted by KAFA at the end of each quarter. Between meetings of the Valuation Committee, a senior officer of KAFA is authorized to make valuation determinations. All valuation determinations of the Valuation Committee are subject to ratification by the Board of Directors at its next regular meeting. |
| | • | | Valuation Firm. Quarterly, a third-party valuation firm engaged by the Board of Directors reviews the valuation methodologies and calculations employed for these securities, unless the aggregate fair value of such security is less than 0.1% of total assets. |
| | • | | Board of Directors Determination. The Board of Directors meets quarterly to consider the valuations provided by KAFA and the Valuation Committee and ratify valuations for the applicable securities. The Board of Directors considers the report provided by the third-party valuation firm in reviewing and determining in good faith the fair value of the applicable portfolio securities. |
At November 30, 2016, the Company held 5.8% of its net assets applicable to common stockholders (3.2% of total assets) in securities valued at fair value pursuant to procedures adopted by the Board of Directors. The aggregate fair value of these securities at November 30, 2016 was $126,321. See Note 3 — Fair Value and Note 7 — Restricted Securities.
E. Repurchase Agreements — From time to time, the Company has agreed to purchase securities from financial institutions subject to the seller’s agreement to repurchase them at an agreed-upon time and price (“repurchase agreements”). The financial institutions with whom the Company enters into repurchase agreements are banks and broker/dealers which KAFA considers creditworthy. The seller under a repurchase agreement is required to maintain the value of the securities as collateral, subject to the agreement, at not less than the repurchase price plus accrued interest. KAFA monitors daily the mark-to-market of the value of the collateral, and, if necessary, requires the seller to maintain additional securities so that the value of the collateral is not less than the repurchase price. Default by or bankruptcy of the seller would, however, expose the Company to possible loss because of adverse market action or delays in connection with the disposition of the underlying securities. During the fiscal year ended November 30, 2016, the Company did not enter into any repurchase agreements.
F. Short Sales — A short sale is a transaction in which the Company sells securities it does not own (but has borrowed) in anticipation of or to hedge against a decline in the market price of the securities. To complete a short sale, the Company may arrange through a broker to borrow the securities to be delivered to the buyer. The
25
KAYNE ANDERSON MLP INVESTMENT COMPANY
NOTES TO FINANCIAL STATEMENTS
(amounts in 000’s, except number of option contracts, share and per share amounts)
proceeds received by the Company for the short sale are retained by the broker until the Company replaces the borrowed securities. In borrowing the securities to be delivered to the buyer, the Company becomes obligated to replace the securities borrowed at their market price at the time of replacement, whatever the price may be.
The Company’s short sales, if any, are fully collateralized. The Company is required to maintain assets consisting of cash or liquid securities equal in amount to the liability created by the short sale. These assets are adjusted daily to reflect changes in the value of the securities sold short. The Company is liable for any dividends or distributions paid on securities sold short.
The Company may also sell short “against the box” (i.e., the Company enters into a short sale as described above while holding an offsetting long position in the security which it sold short). If the Company enters into a short sale “against the box,” the Company would segregate an equivalent amount of securities owned as collateral while the short sale is outstanding. During the fiscal year ended November 30, 2016, the Company did not engage in any short sales.
G. Security Transactions — Security transactions are accounted for on the date these securities are purchased or sold (trade date). Realized gains and losses are calculated using the specific identification cost basis method for GAAP purposes. Since the Company’s inception, it had also utilized the specific identification cost basis method for tax purposes. On July 13, 2015, the Company filed a request with the Internal Revenue Service (the “IRS”) to change the tax accounting method used to compute the adjusted tax cost basis of its MLP securities to the average cost method. On January 5, 2016, the Company received notification that the IRS approved the tax accounting method change effective December 1, 2014. The tax accounting method change does not change the accounting method utilized for GAAP purposes. See Note 6 — Income Taxes.
H. Return of Capital Estimates — Distributions received from the Company’s investments in MLPs and other securities generally are comprised of income and return of capital. The Company records investment income and return of capital based on estimates made at the time such distributions are received. Since its inception, the Company has estimated that 90% of distributions received from its MLP investments were return of capital distributions. This estimate is adjusted to actual in the subsequent fiscal year when tax reporting information related to the Company’s MLP investments is received. Based on the actual return of capital during the previous two years, the Company revised its estimate of return of capital related to MLP investments to 91%.” Such estimates for MLPs and other investments are based on historical information available from each investment and other industry sources.
The return of capital portion of the distributions is a reduction to investment income that results in an equivalent reduction in the cost basis of the associated investments and increases net realized gains (losses) and net change in unrealized gains (losses). If the cash distributions received by the Company exceed its cost basis (i.e. its cost basis is zero), the distributions are treated as realized gains.
The Company includes all cash distributions received on its Statement of Operations and reduces its investment income by (i) the estimated return of capital and (ii) the distributions in excess of cost basis. For the fiscal year ended November 30, 2016, the Company estimated $283,982 of return of capital and $6,201 of cash distributions that were in excess of cost basis. The cash distributions that were in excess of cost basis were treated as realized gains.
In accordance with GAAP, the return of capital cost basis reductions for the Company’s MLP investments are limited to the total amount of the cash distributions received from such investments. For income tax purposes, the cost basis reductions for the Company’s MLP investments typically exceed cash distributions received from such investments due to allocated losses from these investments. See Note 6 — Income Taxes. The following
26
KAYNE ANDERSON MLP INVESTMENT COMPANY
NOTES TO FINANCIAL STATEMENTS
(amounts in 000’s, except number of option contracts, share and per share amounts)
table sets forth the Company’s estimated total return of capital portion of the distributions received from its investments.
| | | | |
| | | For the
Fiscal Year
Ended
November 30,
2016 | |
Return of capital portion of dividends and distributions received | | | 94 | % |
Return of capital — attributable to net realized gains (losses) | | $ | 17,761 | |
Return of capital — attributable to net change in unrealized gains (losses) | | | 266,221 | |
| | | | |
Total return of capital | | $ | 283,982 | |
| | | | |
For the fiscal year ended November 30, 2016, the Company estimated the return of capital portion of distributions received to be $259,968 (86%). This amount was increased by $24,014 due to 2015 tax reporting information received by the Company in the third quarter of fiscal 2016. As a result, the return of capital percentage for the fiscal year ended November 30, 2016 was 94%.
I. Investment Income — The Company records dividends and distributions on the ex-dividend date. Interest income is recognized on the accrual basis, including amortization of premiums and accretion of discounts. When investing in securities with payment in-kind interest, the Company will accrue interest income during the life of the security even though it will not be receiving cash as the interest is accrued. To the extent that interest income to be received is not expected to be realized, a reserve against income is established.
Debt securities that the Company may hold will typically be purchased at a discount or premium to the par value of the security. The non-cash accretion of a discount to par value increases interest income while the non-cash amortization of a premium to par value decreases interest income. The accretion of a discount and amortization of a premium are based on the effective interest method. The amount of these non-cash adjustments, if any, can be found in the Company’s Statement of Cash Flows. The non-cash accretion of a discount increases the cost basis of the debt security, which results in an offsetting unrealized loss. The non-cash amortization of a premium decreases the cost basis of the debt security, which results in an offsetting unrealized gain. To the extent that par value is not expected to be realized, the Company discontinues accruing the non-cash accretion of the discount to par value of the debt security.
The Company may receive paid-in-kind and non-cash dividends and distributions in the form of additional units or shares from the investments listed in the table below. For paid-in-kind dividends, the additional units are not reflected in investment income during the period received, but are recorded as unrealized gains upon receipt. Non-cash distributions are reflected in investment income because the Company has the option to receive its distributions in cash or in additional units of the security. During the fiscal year ended November 30, 2016, the Company received $4,750 of paid-in-kind dividends from its investment in Enbridge Energy Management, L.L.C.
J. Distributions to Stockholders — Distributions to common stockholders are recorded on the ex-dividend date. Distributions to holders of MRP Shares are accrued on a daily basis as described in Note 12 — Preferred Stock. As required by the Distinguishing Liabilities from Equity topic of the Financial Accounting Standards Board (“FASB”) Accounting Standards Codification (ASC 480), the Company includes the accrued distributions on its MRP Shares as an operating expense due to the fixed term of this obligation. For tax purposes the payments made to the holders of the Company’s MRP Shares are treated as dividends or distributions.
The characterization of the distributions paid to holders of MRP Shares and common stock as either a dividend (eligible to be treated as qualified dividend income) or a distribution (return of capital) is determined after the end of the fiscal year based on the Company’s actual earnings and profits and, therefore, the characterization may differ from preliminary estimates.
27
KAYNE ANDERSON MLP INVESTMENT COMPANY
NOTES TO FINANCIAL STATEMENTS
(amounts in 000’s, except number of option contracts, share and per share amounts)
K. Partnership Accounting Policy — The Company records its pro-rata share of the income (loss) and capital gains (losses), to the extent of distributions it has received, allocated from the underlying partnerships and adjusts the cost basis of the underlying partnerships accordingly. These amounts are included in the Company’s Statement of Operations.
L. Federal and State Income Taxation — The Company, as a corporation, is obligated to pay federal and state income tax on its taxable income. The Company invests its assets primarily in MLPs, which generally are treated as partnerships for federal income tax purposes. As a limited partner in the MLPs, the Company includes its allocable share of the MLP’s taxable income or loss in computing its own taxable income. Deferred income taxes reflect (i) taxes on unrealized gains (losses), which are attributable to the difference between fair value and tax cost basis, (ii) the net tax effects of temporary differences between the carrying amounts of assets and liabilities for financial reporting purposes and the amounts used for income tax purposes and (iii) the net tax benefit of accumulated net operating and capital losses. To the extent the Company has a deferred tax asset, consideration is given as to whether or not a valuation allowance is required. The need to establish a valuation allowance for deferred tax assets is assessed periodically by the Company based on the Income Tax Topic of the FASB Accounting Standards Codification (ASC 740), that it is more likely than not that some portion or all of the deferred tax asset will not be realized. In the assessment for a valuation allowance, consideration is given to all positive and negative evidence related to the realization of the deferred tax asset. This assessment considers, among other matters, the nature, frequency and severity of current and cumulative losses, forecasts of future profitability (which are highly dependent on future cash distributions from the Company’s MLP holdings), the duration of statutory carryforward periods and the associated risk that operating and capital loss carryforwards may expire unused.
The Company may rely to some extent on information provided by the MLPs, which may not necessarily be timely, to estimate taxable income allocable to the MLP units held in the portfolio and to estimate the associated deferred tax liability. Such estimates are made in good faith. From time to time, as new information becomes available, the Company modifies its estimates or assumptions regarding the deferred tax liability.
Since the Company’s inception, it had utilized the specific identification tax accounting method to compute the adjusted tax cost basis of its MLP securities and for selection of lots to be sold. On July 13, 2015, the Company filed a request with the IRS to change the tax accounting method used to compute the adjusted tax cost basis of its MLP securities to the average cost method. On January 5, 2016, the Company received notification that the IRS approved the tax accounting method change effective December 1, 2014. See Note 6 — Income Taxes.
The Company’s policy is to classify interest and penalties associated with underpayment of federal and state income taxes, if any, as income tax expense on its Statement of Operations. Tax years subsequent to fiscal year 2012 remain open and subject to examination by the federal and state tax authorities.
M. Derivative Financial Instruments — The Company may utilize derivative financial instruments in its operations.
In October 2016, the Securities and Exchange Commission (“SEC”) adopted new rules and forms, and amendments to certain current rules and forms, to modernize reporting and disclosure of information by registered investment companies. The amendments to Regulation S-X will require standardized, enhanced disclosure about derivatives in investment company financial statements, and will also change the rules governing the form and content of such financial statements. The amendments to Regulation S-X take effect on August 1, 2017. At this time, the Company is assessing the anticipated impact of these regulatory developments and will adopt these when they become effective.
Interest rate swap contracts. The Company may use hedging techniques such as interest rate swaps to mitigate potential interest rate risk on a portion of the Company’s leverage. Such interest rate swaps would principally be used to protect the Company against higher costs on its leverage resulting from increases in interest rates. The Company does not hedge any interest rate risk associated with portfolio holdings. Interest rate transactions the Company uses for hedging purposes expose it to certain risks that differ from the risks associated
28
KAYNE ANDERSON MLP INVESTMENT COMPANY
NOTES TO FINANCIAL STATEMENTS
(amounts in 000’s, except number of option contracts, share and per share amounts)
with its portfolio holdings. A decline in interest rates may result in a decline in the value of the swap contracts, which, everything else being held constant, would result in a decline in the net assets of the Company. In addition, if the counterparty to an interest rate swap defaults, the Company would not be able to use the anticipated net receipts under the interest rate swap to offset its cost of financial leverage.
Interest rate swap contracts are recorded at fair value with changes in value during the reporting period, and amounts accrued under the agreements, included as unrealized gains or losses in the Statement of Operations. Monthly cash settlements under the terms of the interest rate swap agreements or termination payments are recorded as realized gains or losses in the Statement of Operations. The Company generally values its interest rate swap contracts based on dealer quotations, if available, or by discounting the future cash flows from the stated terms of the interest rate swap agreement by using interest rates currently available in the market. See Note 8 — Derivative Financial Instruments.
Option contracts. The Company is also exposed to financial market risks including changes in the valuations of its investment portfolio. The Company may purchase or write (sell) call options. A call option on a security is a contract that gives the holder of the option, in return for a premium, the right to buy from the writer of the option the security underlying the option at a specified exercise price at any time during the term of the option.
The Company would realize a gain on a purchased call option if, during the option period, the value of such securities exceeded the sum of the exercise price, the premium paid and transaction costs; otherwise the Company would realize either no gain or a loss on the purchased call option. The Company may also purchase put option contracts. If a purchased put option is exercised, the premium paid increases the cost basis of the securities sold by the Company.
The Company may also write (sell) call options with the purpose of generating realized gains or reducing its ownership of certain securities. If the Company writes a call option on a security, the Company has the obligation upon exercise of the option to deliver the underlying security upon payment of the exercise price. The Company will only write call options on securities that the Company holds in its portfolio (i.e., covered calls).
When the Company writes a call option, an amount equal to the premium received by the Company is recorded as a liability and is subsequently adjusted to the current fair value of the option written. Premiums received from writing options that expire unexercised are treated by the Company on the expiration date as realized gains from investments. If the Company repurchases a written call option prior to its exercise, the difference between the premium received and the amount paid to repurchase the option is treated as a realized gain or loss. If a call option is exercised, the premium is added to the proceeds from the sale of the underlying security in determining whether the Company has realized a gain or loss. The Company, as the writer of an option, bears the market risk of an unfavorable change in the price of the security underlying the written option. See Note 8 — Derivative Financial Instruments.
N. Indemnifications — Under the Company’s organizational documents, its officers and directors are indemnified against certain liabilities arising out of the performance of their duties to the Company. In addition, in the normal course of business, the Company enters into contracts that provide general indemnification to other parties. The Company’s maximum exposure under these arrangements is unknown, as this would involve future claims that may be made against the Company that have not yet occurred, and may not occur. However, the Company has not had prior claims or losses pursuant to these contracts and expects the risk of loss to be remote.
O. Offering and Debt Issuance Costs — Offering costs incurred by the Company related to the issuance of its common stock reduce additional paid-in capital when the stock is issued. Costs incurred by the Company related to the issuance of its debt (credit facility, term loan or senior notes) or its preferred stock are capitalized and amortized over the period the debt or preferred stock is outstanding.
In April 2015, the FASB issued Accounting Standards Update (“ASU”) No. 2015-03 “Interest — Imputation of Interest (Subtopic 835-30), Simplifying the Presentation of Debt Issuance Costs”. ASU No. 2015-03 requires that all costs incurred to issue debt be presented in the balance sheet as a direct
29
KAYNE ANDERSON MLP INVESTMENT COMPANY
NOTES TO FINANCIAL STATEMENTS
(amounts in 000’s, except number of option contracts, share and per share amounts)
deduction from the carrying value of the debt. In August 2015, the FASB issued ASU No. 2015-15 “Interest — Imputation of Interest (Subtopic 835-30), Presentation and Subsequent Measurement of Debt Issuance Costs Associated with Line-of-Credit Arrangements”. ASU No. 2015-15 states that the SEC staff will not object to an entity presenting the cost of securing a revolving line of credit as an asset, regardless of whether a balance is outstanding. ASU No. 2015-03 and ASU No. 2015-15 are effective for fiscal years beginning after December 15, 2015, and interim periods within those fiscal years, and should be applied retrospectively. The Company will adopt these changes related to balance sheet presentation in fiscal 2017 when they become effective.
The Fair Value Measurement Topic of the FASB Accounting Standards Codification (“ASC 820”) defines fair value as the price at which an orderly transaction to sell an asset or to transfer a liability would take place between market participants under current market conditions at the measurement date. As required by ASC 820, the Company has performed an analysis of all assets and liabilities (other than deferred taxes) measured at fair value to determine the significance and character of all inputs to their fair value determination. Inputs are the assumptions, along with considerations of risk, that a market participant would use to value an asset or a liability. In general, observable inputs are based on market data that is readily available, regularly distributed and verifiable that the Company obtains from independent, third-party sources. Unobservable inputs are developed by the Company based on its own assumptions of how market participants would value an asset or a liability.
Accounting Standards Update (“ASU”) No. 2011-04 “Amendments to Achieve Common Fair Value Measurement and Disclosure Requirements in U.S. GAAP and IFRSs” amends ASC 820. The amended guidance clarifies the wording used to describe many requirements in accounting literature for fair value measurement and disclosure to establish consistency between U.S. GAAP and International Financial Reporting Standards (“IFRSs”).
ASU No. 2011-04 requires the inclusion of additional disclosures on assumptions used by the Company to determine fair value. Specifically, for assets measured at fair value using significant unobservable inputs (Level 3), ASU No. 2011-04 requires that the Company (i) describe the valuation process, (ii) disclose quantitative information about unobservable inputs and (iii) provide a qualitative discussion about the sensitivity of the fair value measurement to changes in the unobservable inputs and inter-relationships between the inputs.
The fair value hierarchy prioritizes the inputs to valuation techniques used to measure fair value into the following three broad categories.
| | • | | Level 1 — Valuations based on quoted unadjusted prices for identical instruments in active markets traded on a national exchange to which the Company has access at the date of measurement. |
| | • | | Level 2 — Valuations based on quoted prices for similar instruments in active markets; quoted prices for identical or similar instruments in markets that are not active; and model-derived valuations in which all significant inputs and significant value drivers are observable in active markets. Level 2 inputs are those in markets for which there are few transactions, the prices are not current, little public information exists or instances where prices vary substantially over time or among brokered market makers. |
| | • | | Level 3 — Model derived valuations in which one or more significant inputs or significant value drivers are unobservable. Unobservable inputs are those inputs that reflect the Company’s own assumptions that market participants would use to price the asset or liability based on the best available information. |
The following table presents the Company’s assets and liabilities measured at fair value on a recurring basis at November 30, 2016, and the Company presents these assets and liabilities by security type and description on its Schedule of Investments or on its Statement of Assets and Liabilities. Note that the valuation levels below are not necessarily an indication of the risk or liquidity associated with the underlying investment.
30
KAYNE ANDERSON MLP INVESTMENT COMPANY
NOTES TO FINANCIAL STATEMENTS
(amounts in 000’s, except number of option contracts, share and per share amounts)
| | | | | | | | | | | | | | | | |
| | | Total | | | Quoted Prices in
Active Markets
(Level 1) | | | Prices with Other
Observable Inputs
(Level 2) | | | Unobservable
Inputs
(Level 3) | |
Assets at Fair Value | | | | | | | | | | | | | | | | |
Equity investments | | $ | 3,871,555 | | | $ | 3,700,316 | | | $ | 44,918 | (1) | | $ | 126,321 | |
| | | | |
Liabilities at Fair Value | | | | | | | | | | | | | | | | |
Call option contracts written | | $ | 281 | | | $ | — | | | $ | 281 | | | $ | — | |
| (1) | The Company’s investment in Plains AAP, L.P. (“PAGP-AAP”) is exchangeable on a one-for-one basis into either Plains GP Holdings, L.P. (“PAGP”) shares or Plains All American Pipeline, L.P. (“PAA”) units at the Company’s option. The Company values its PAGP-AAP investment on an “as exchanged” basis based on the higher public market value of either PAGP or PAA. As of November 30, 2016, the Company’s PAGP-AAP investment is valued at PAGP’s closing price. The Company categorizes its investment as a Level 2 security for fair value reporting purposes. |
For the fiscal year ended November 30, 2016, there were no transfers between Level 1 and Level 2.
As of November 30, 2016, the Company had Notes outstanding with aggregate principal amount of $767,000 and 12,000,000 shares of MRP Shares outstanding with a total liquidation value of $300,000. See Note 11 — Notes and Note 12 — Preferred Stock.
Of the $300,000 of MRP Shares, Series F ($125,000 liquidation value) is publicly traded on the NYSE. As a result, the Company categorizes this series of MRP Shares as Level 1 securities. The remaining series of MRP Shares and all of the Notes were issued in private placements to institutional investors and are not listed on any exchange or automated quotation system. As such, the Company categorizes all of the Notes ($767,000 aggregate principal amount) and the remaining MRP Shares ($175,000 aggregate liquidation value) as Level 3 and determines the fair value of these instruments based on estimated market yields and credit spreads for comparable instruments with similar maturity, terms and structure.
The Company records these Notes and MRP Shares on its Statement of Assets and Liabilities at principal amount or liquidation value. As of November 30, 2016, the estimated fair values of these leverage instruments are as follows.
| | | | | | | | |
Instrument | | Principal Amount/
Liquidation Value | | | Fair Value | |
Notes (Series W, Y through GG and II through OO) | | $ | 767,000 | | | $ | 784,700 | |
MRP Shares (Series B, C, H, I and J) | | $ | 175,000 | | | $ | 176,100 | |
MRP Shares (Series F) | | $ | 125,000 | | | $ | 127,050 | |
The following table presents the Company’s assets measured at fair value on a recurring basis using significant unobservable inputs (Level 3) for the fiscal year ended November 30, 2016.
| | | | |
| | | Equity
Investments | |
Balance — November 30, 2015 | | $ | 21,926 | |
Purchases | | | 113,916 | |
Transfers out to Level 1 and 2 | | | (25,001 | ) |
Realized gains (losses) | | | — | |
Unrealized gains (losses), net | | | 15,480 | |
| | | | |
Balance — November 30, 2016 | | $ | 126,321 | |
| | | | |
The purchases of $113,916 relates to the Company’s investments in Sunoco LP common units (December 2015), Western Gas Partners, LP convertible preferred units (April 2016), MPLX LP convertible preferred units (May 2016) and Rice Midstream Partners LP common units (October 2016).
31
KAYNE ANDERSON MLP INVESTMENT COMPANY
NOTES TO FINANCIAL STATEMENTS
(amounts in 000’s, except number of option contracts, share and per share amounts)
The $25,001 transfers out to Level 1 relates to the Company’s investment in Sunoco LP that became marketable during the second quarter of 2016. The Company utilizes the beginning of the reporting period method for determining transfer between levels.
The $15,480 of net unrealized gains relates to investments that are still held at the end of the reporting period, and the Company includes these unrealized gains on the Statement of Operations — Net Change in Unrealized Gains (Losses).
Valuation Techniques and Unobservable Inputs
Unless otherwise determined by the Board of Directors, the Company values its private investments in public equity (“PIPE”) investments that are convertible into or otherwise will become publicly tradeable (e.g., through subsequent registration or expiration of a restriction on trading) based on the market value of the publicly-traded security less a discount. This discount is initially equal to the discount negotiated at the time the Company agrees to a purchase price. To the extent that such securities are convertible or otherwise become publicly traded within a time frame that may be reasonably determined, this discount will be amortized on a straight line basis over such estimated time frame.
The Company owns convertible preferred units of Capital Product Partners L.P. (“CPLP”), MPLX LP (“MPLX”) and Western Gas Partners, LP (“WES”) that were issued in private placements. The convertible preferred units are convertible on a one-for-one basis into common units and are senior to the underlying common units of CPLP, MPLX and WES in terms of liquidation preference and priority of distributions. The Company’s Board of Directors has determined that it is appropriate to value the convertible preferred units using a convertible pricing model. This model takes into account the attributes of the convertible preferred units, including the preferred dividend, conversion ratio and call features, to determine the estimated value of such units. In using this model, the Company estimates (i) the credit spread for the convertible preferred units, which is based on credit spreads for companies in a similar line of business for CPLP and the credit spread of the MLP’s unsecured notes in the case of MPLX and WES, and (ii) the expected volatility for the underlying common units, which is based on historical volatility. For CPLP, the Company applies a discount to the value derived from the convertible pricing model to account for an expected discount in market prices for convertible securities relative to the values calculated using the pricing model. For MPLX and WES, the Company applies a discount to the value derived from the convertible pricing model to account for the expected period of illiquidity. In each case, if the resulting price for the convertible preferred units is less than the public market price for the underlying common units at such time, the public market price for the common units will be used to value the convertible preferred units.
The Company also has a private investment in the Creditors Trust of Miller Bros. Coal, LLC (“Clearwater Trust”), which is a privately held entity. Clearwater Trust has an overriding royalty interest in certain coal reserves that were sold as part of the reorganization of Clearwater Natural Resources, LP. Clearwater Trust has agreed to sell this overriding royalty interest and is receiving monthly installment payments through September 2017 from the buyer as payment for this royalty interest. The Company values its interest in Clearwater Trust based on the discounted cash flow from the expected monthly installment payments. Generally an increase in the discount rate selected by the Company will result in a decrease in the fair value of Clearwater Trust.
Due to the inherent uncertainty of determining the fair value of investments that do not have a readily available market value, the fair value of the Company’s investments may fluctuate from period to period. Additionally, the fair value of the Company’s investments may differ from the values that would have been used had a ready market existed for such investments and may differ materially from the values that the Company may ultimately realize.
32
KAYNE ANDERSON MLP INVESTMENT COMPANY
NOTES TO FINANCIAL STATEMENTS
(amounts in 000’s, except number of option contracts, share and per share amounts)
The following table summarizes the significant unobservable inputs that the Company used to value its portfolio investments categorized as Level 3 as of November 30, 2016:
Quantitative Table for Valuation Techniques
| | | | | | | | | | | | | | | | | | | | |
| | | | | | | | | | Range | | | Weighted
Average | |
Assets at Fair Value | | Fair Value | | | Valuation Technique | | Unobservable Inputs | | Low | | | High | | |
Rice Midstream Partners LP (PIPE) – valued based on a discount to market value | | $ | 12,304 | | | - Discount to publicly-traded securities | | - Current discount | | | 1.8% | | | | 1.8% | | | | 1.8% | |
| | | | | | | | | | | | | | | | | | | | |
MPLX and WES – valued based on pricing model | | | 92,957 | | | - Convertible pricing model | | - Credit spread - Volatility - Illiquidity discount | |
| 4.0%
30.0%
0.5% |
| |
| 4.9%
35.0%
0.9% |
| |
| 4.6%
32.5%
0.9% |
|
| | | | | | | | | | | | | | | | | | | | |
CPLP – valued based on pricing model | |
| 20,970
|
| | - Convertible pricing model | | - Credit spread - Volatility - Discount for marketability | |
| 7.8%
40.0% 10.0% |
| |
| 8.5%
45.0% 10.0% |
| |
| 8.1%
42.5% 10.0% |
|
| | | | | | | | | | | | | | | | | | | | |
Clearwater Trust | | | 90 | | | - Discounted cash flow | | - Discount rate | | | 20% | | | | 20% | | | | 20% | |
| | | | | | | | | | | | | | | | | | | | |
| | | | | | | | | | | | | | | | | | | | |
Total | | $ | 126,321 | | | | | | | | | | | | | | | | | |
| | | | | | | | | | | | | | | | | | | | |
The Company’s investments are concentrated in the energy sector. The focus of the Company’s portfolio within the energy sector may present more risks than if the Company’s portfolio were broadly diversified across numerous sectors of the economy. A downturn in the energy sector would have a larger impact on the Company than on an investment company that does not focus on the energy sector. The performance of securities in the energy sector may lag the performance of other industries or the broader market as a whole. Additionally, to the extent that the Company invests a relatively high percentage of its assets in the securities of a limited number of issuers, the Company may be more susceptible than a more widely diversified investment company to any single economic, political or regulatory occurrence. At November 30, 2016, the Company had the following investment concentrations:
| | | | |
Category | | Percent of
Long-Term
Investments | |
Securities of energy companies | | | 100.0 | % |
Equity securities | | | 100.0 | % |
Securities of MLPs(1) | | | 95.7 | % |
Midstream Energy Companies | | | 99.6 | % |
Largest single issuer | | | 12.5 | % |
Restricted securities | | | 4.4 | % |
| (1) | Securities of MLPs consist of energy-related partnerships and their affiliates (including affiliates of MLPs that own general partner interests or, in some cases subordinated units, registered or unregistered common units, or other limited partner units in a MLP) and partnerships that elected to be taxed as a corporation for federal income tax purposes. |
| 5. Agreements | and Affiliations |
A. Administration Agreement — The Company has entered into an administration and accounting agreement with Ultimus Fund Solutions, LLC (“Ultimus”), which may be amended from time to time. Pursuant to the agreement, Ultimus will provide certain administrative and accounting services for the Company. The agreement has automatic one-year renewals unless earlier terminated by either party as provided under the terms of the agreement.
33
KAYNE ANDERSON MLP INVESTMENT COMPANY
NOTES TO FINANCIAL STATEMENTS
(amounts in 000’s, except number of option contracts, share and per share amounts)
B. Investment Management Agreement — The Company has entered into an investment management agreement with KA Fund Advisors, LLC (“KAFA”) under which KAFA, subject to the overall supervision of the Company’s Board of Directors, manages the day-to-day operations of, and provides investment advisory services to, the Company. For providing these services, KAFA receives an investment management fee from the Company. KAFA has also entered into a fee waiver agreement with the Company that provides for a management fee of 1.375% on average total assets up to $4,500,000, a fee of 1.25% on average total assets between $4,500,000 and $9,500,000, a fee of 1.125% on average total assets between $9,500,000 and $14,500,000 and a fee of 1.0% on average total assets in excess of $14,500,000. On March 9, 2016, the Company renewed its investment management agreement and fee waiver agreement with KAFA for a period of one year. The investment management and fee waiver agreements will expire on March 31, 2017 and may be renewed annually thereafter upon approval of the Company’s Board of Directors (including a majority of the Company’s directors who are not “interested persons” of the Company, as such term is defined in the 1940 Act). For the fiscal year ended November 30, 2016, the Company paid management fees at an annual rate of 1.375% of the Company’s average quarterly total assets (as defined in the investment management agreement).
For purposes of calculating the management fee the average total assets for each quarterly period are determined by averaging the total assets at the last day of that quarter with the total assets at the last day of the prior quarter. The Company’s total assets are equal to the Company’s gross asset value (which includes assets attributable to the Company’s use of preferred stock, commercial paper or notes and other borrowings and excludes any net deferred tax asset), minus the sum of the Company’s accrued and unpaid dividends and distributions on any outstanding common stock and accrued and unpaid dividends and distributions on any outstanding preferred stock and accrued liabilities (other than liabilities associated with borrowing or leverage by the Company and any accrued taxes, including, a deferred tax liability). Liabilities associated with borrowing or leverage by the Company include the principal amount of any borrowings, commercial paper or notes issued by the Company, the liquidation preference of any outstanding preferred stock, and other liabilities from other forms of borrowing or leverage such as short positions and put or call options held or written by the Company.
C. Portfolio Companies — From time to time, the Company may “control” or may be an “affiliate” of one or more of its portfolio companies, as each of these terms is defined in the 1940 Act. In general, under the 1940 Act, the Company would be presumed to “control” a portfolio company if the Company and its affiliates owned 25% or more of its outstanding voting securities and would be an “affiliate” of a portfolio company if the Company and its affiliates owned 5% or more of its outstanding voting securities. The 1940 Act contains prohibitions and restrictions relating to transactions between investment companies and their affiliates (including the Company’s investment adviser), principal underwriters and affiliates of those affiliates or underwriters.
The Company believes that there are several factors that determine whether or not a security should be considered a “voting security” in complex structures such as limited partnerships of the kind in which the Company invests. The Company also notes that the Securities and Exchange Commission (the “SEC”) staff has issued guidance on the circumstances under which it would consider a limited partnership interest to constitute a voting security. Under most partnership agreements, the management of the partnership is vested in the general partner, and the limited partners, individually or collectively, have no rights to manage or influence management of the partnership through such activities as participating in the selection of the managers or the board of the limited partnership or the general partner. As a result, the Company believes that many of the limited partnership interests in which it invests should not be considered voting securities. However, it is possible that the SEC staff may consider the limited partner interests the Company holds in certain limited partnerships to be voting securities. If such a determination were made, the Company may be regarded as a person affiliated with and controlling the issuer(s) of those securities for purposes of Section 17 of the 1940 Act.
In making such a determination as to whether to treat any class of limited partnership interests the Company holds as a voting security, the Company considers, among other factors, whether or not the holders of such limited partnership interests have the right to elect the board of directors of the limited partnership or the general partner. If the holders of such limited partnership interests do not have the right to elect the board of directors, the
34
KAYNE ANDERSON MLP INVESTMENT COMPANY
NOTES TO FINANCIAL STATEMENTS
(amounts in 000’s, except number of option contracts, share and per share amounts)
Company generally has not treated such security as a voting security. In other circumstances, based on the facts and circumstances of those partnership agreements, including the right to elect the directors of the general partner, the Company has treated those securities as voting securities. If the Company does not consider the security to be a voting security, it will not consider such partnership to be an “affiliate” unless the Company and its affiliates own more than 25% of the outstanding securities of such partnership. Additionally, certain partnership agreements give common unitholders the right to elect the partnership’s board of directors, but limit the amount of voting securities any limited partner can hold to no more than 4.9% of the partnership’s outstanding voting securities (i.e., any amounts held in excess of such limit by a limited partner do not have voting rights). In such instances, the Company does not consider itself to be an affiliate if it owns more than 5% of such partnership’s common units.
There is no assurance that the SEC staff will not consider that other limited partnership securities that the Company owns and does not treat as voting securities are, in fact, voting securities for the purposes of Section 17 of the 1940 Act. If such determination were made, the Company will be required to abide by the restrictions on “control” or “affiliate” transactions as proscribed in the 1940 Act. The Company or any portfolio company that it controls, and its affiliates, may from time to time engage in certain of such joint transactions, purchases, sales and loans in reliance upon and in compliance with the conditions of certain exemptive rules promulgated by the SEC. The Company cannot make assurances, however, that it would be able to satisfy the conditions of these rules with respect to any particular eligible transaction, or even if the Company were allowed to engage in such a transaction, that the terms would be more or as favorable to the Company or any company that it controls as those that could be obtained in an arm’s length transaction. As a result of these prohibitions, restrictions may be imposed on the size of positions that may be taken for the Company or on the type of investments that it could make.
Clearwater Trust — At November 30, 2016, the Company held approximately 63% of the Clearwater Trust. The Company believes that it is an “affiliate” of the trust under the 1940 Act by virtue of its majority interest in the trust.
Plains GP Holdings, L.P., Plains AAP, L.P. and Plains All American Pipeline, L.P. — Robert V. Sinnott is Co-Chairman of Kayne Anderson Capital Advisors, L.P. (“KACALP”), the managing member of KAFA. Mr. Sinnott also serves as a director of PAA GP Holdings LLC, which is the general partner of Plains GP Holdings L.P. (“PAGP”). Members of senior management of KACALP and KAFA and various affiliated funds managed by KACALP own PAGP shares, Plains All American Pipeline, L.P. (“PAA”) units and interests in Plains AAP, L.P. (“PAGP-AAP”). The Company believes that it is an affiliate of PAA, PAGP and PAGP-AAP under the 1940 Act by virtue of (i) the Company’s and other affiliated Kayne Anderson funds’ ownership interest in PAA, PAGP and PAGP-AAP and (ii) Mr. Sinnott’s participation on the board of PAA GP Holdings LLC.
ONEOK, Inc. and ONEOK Partners, L.P. — Kevin S. McCarthy, the Chief Executive Officer of the Company, began serving as a director of ONEOK, Inc. (“OKE”) during December of 2015. OKE is the general partner of ONEOK Partners, L.P. (“OKS”). Despite Mr. McCarthy’s participation on the board of OKE, the Company does not believe it is an affiliate of OKE or OKS because the Company’s and other Kayne Anderson funds’ aggregate ownership of each entity does not meet the criteria described above.
The following table summarizes the Company’s investments in affiliates as of November 30, 2016:
| | | | | | | | | | | | |
Investment | | No. of
Shares/Units
(in 000’s) | | | Dividends and
Distributions Received
During the Fiscal Year
Ended November 30,
2016 | | | Value | |
Clearwater Trust | | | N/A | | | $ | 63 | | | $ | 90 | |
Plains All American Pipeline, L.P. | | | 8,875 | | | | 22,400 | | | | 292,429 | |
Plains GP Holdings, L.P. | | | 23 | | | | 593 | | | | 817 | |
Plains GP Holdings, L.P. — Plains AAP, L.P. | | | 1,278 | | | | 3,061 | | | | 44,918 | |
| | | | | | | | | | | | |
Total | | | | | | $ | 26,117 | | | $ | 338,254 | |
| | | | | | | | | | | | |
35
KAYNE ANDERSON MLP INVESTMENT COMPANY
NOTES TO FINANCIAL STATEMENTS
(amounts in 000’s, except number of option contracts, share and per share amounts)
6. Income Taxes
The Company’s taxes include current and deferred income taxes. Current income taxes reflect the estimated income tax liability or asset of the Company as of a measurement date. Deferred income taxes reflect (i) taxes on net unrealized gains, which are attributable to the difference between fair market value and tax cost basis, (ii) the net tax effects of temporary differences between the carrying amounts of assets and liabilities for financial reporting purposes and the amounts used for income tax purposes and (iii) the net tax benefit of accumulated net operating losses, if any.
During the fourth quarter of fiscal 2016, the Company changed its state tax rate from 1.66% to 1.76% (net of federal benefit) based on updated state apportionment information. During the fiscal year ended November 30, 2016, the Company paid $156 of state income taxes. As of November 30, 2016, the components of the Company’s tax assets and liabilities are as follows.
| | | | |
Income tax receivable | | $ | 18,470 | |
Deferred tax assets: | | | | |
Net operating loss carryforwards — Federal | | $ | 76,026 | |
Net operating loss carryforwards — State | | | 5,538 | |
Capital loss carryforwards — State | | | 1,396 | |
AMT credit carryforwards | | | 3,631 | |
Deferred tax liabilities: | | | | |
Net unrealized gains on investment securities | | | (681,433 | ) |
| | | | |
Total deferred income tax liability, net | | $ | (594,842 | ) |
| | | | |
For the fiscal year ended November 30, 2016, the Company generated a net operating loss of $128,314. In addition, the Company generated a federal capital loss of $52,848 that expires in 2021 and can be carried back to the three preceding tax years. It is anticipated that the capital losses generated during the fiscal year ended November 30, 2016 will be carried back to offset prior capital gains and taxable income resulting in federal refunds of approximately $7,740. These carryback claims are expected to be filed shortly after filing the fiscal 2016 tax returns in August 2017. The Company is also exploring the ability to carry back claims in various states.
During the fourth quarter of fiscal 2016, the Company filed federal carryback claims related to a net operating loss in fiscal 2015. On December 27, 2016, the Company received refunds of $10,790 related to these carryback claims.
At November 30, 2016, the Company had a federal net operating loss carryforward of $223,104 (deferred tax asset of $76,026). Realization of the deferred tax assets and net operating loss carryforwards are dependent, in part, on generating sufficient taxable income prior to expiration of the loss carryforwards. The federal net operating loss carryforward begins to expire in 2030. In addition, the Company has state net operating loss carryforwards of $204,542 (deferred tax asset of $5,538). The majority of the state net operating loss carryforwards expires during 2035.
At November 30, 2016, the Company had a state capital loss carryforward of $52,848 (deferred tax asset of $1,396). Realization of the capital loss carryforward is dependent on generating sufficient capital gains prior to the expiration of the capital loss carryforward in 2021.
At November 30, 2016, the Company had alternative minimum tax (“AMT”) credit carryforwards of $3,631. AMT credits can be used to reduce regular tax to the extent that regular tax exceeds the AMT in a future year. AMT credits do not expire.
Although the Company currently has a net deferred tax liability, it periodically reviews the recoverability of its deferred tax assets based on the weight of available evidence. When assessing the recoverability of its deferred tax assets, significant weight is given to the effects of potential future realized and unrealized gains on
36
KAYNE ANDERSON MLP INVESTMENT COMPANY
NOTES TO FINANCIAL STATEMENTS
(amounts in 000’s, except number of option contracts, share and per share amounts)
investments and the period over which these deferred tax assets can be realized, as the expiration dates for the federal capital and operating loss carryforwards range from five to twenty years.
Based on the Company’s assessment, it has determined that it is more likely than not that its deferred tax assets will be realized through future taxable income of the appropriate character. Accordingly, no valuation allowance has been established for the Company’s deferred tax assets. The Company will continue to assess the need for a valuation allowance in the future. Significant declines in the fair value of its portfolio of investments may change the Company’s assessment regarding the recoverability of its deferred tax assets and may result in a valuation allowance. If a valuation allowance is required to reduce any deferred tax asset in the future, it could have a material impact on the Company’s net asset value and results of operations in the period it is recorded.
Total income taxes were different from the amount computed by applying the federal statutory income tax rate of 35% to the net investment loss and realized and unrealized gains (losses) on investments before taxes as follows:
| | | | |
| | | For the
Fiscal Year
Ended
November 30,
2016 | |
Computed federal income tax expense at 35% | | $ | (145,217 | ) |
State income tax expense, net of federal tax | | | (7,743 | ) |
Effect of change in state tax rate (0.10% increase) | | | (1,163 | ) |
Non-deductible distributions on MRP Shares, dividend received deductions and other, net | | | (7,202 | ) |
| | | | |
Total income tax expense | | $ | (161,325 | ) |
| | | | |
The Company primarily invests in equity securities issued by MLPs, which generally are treated as partnerships for federal income tax purposes. As a limited partner of MLPs, the Company includes its allocable share of such MLPs’ income or loss in computing its own taxable income or loss. Additionally, the Company reduces the GAAP and tax cost basis of its MLP investments by the cash distributions received, and increases or decreases the tax cost basis of its MLP investments by its allocable share of the MLP’s income or loss. During the fiscal year ended November 30, 2016, the Company reduced its tax cost basis by $258,092 due to its fiscal 2015 net allocated losses from its MLP investments.
On July 13, 2015, the Company filed a request with the IRS to change the tax accounting method used to compute the adjusted tax cost basis of its MLP securities to the average cost method. The two tax accounting methods that are generally used by owners of MLP securities are the average cost method and specific identification method. Since the Company’s inception, based on the advice of its tax adviser, it had utilized the specific identification tax accounting method to compute the adjusted tax cost basis of its MLP securities and for selection of lots to be sold. Although there is varied industry practice and no direct, clear guidance regarding the correct tax accounting method, the Company has recently come to the conclusion that the average cost method is a more certain tax position.
On January 5, 2016, the Company received notification that the IRS approved the tax accounting method change effective for the fiscal year beginning December 1, 2014. Had the Company utilized the average cost method since its inception, the Company would have reported a greater amount of taxable income. Accordingly, the tax accounting method change may result in a reclassification of approximately $47,752 of the Company’s deferred tax liability to a current tax liability. Pursuant to IRS regulations, the Company will recognize the effect of the tax accounting method change over four years beginning in fiscal 2015, which results in previously unrealized gains being recognized in taxable income (potential current tax liability of approximately $11,938 each year). The change in tax accounting method may not result in a current tax liability if the Company has a taxable loss in each of the four years or has sufficient net operating loss carryforwards to offset the income attributable to the change in tax accounting method. During the fiscal year ended November 30, 2016, the
37
KAYNE ANDERSON MLP INVESTMENT COMPANY
NOTES TO FINANCIAL STATEMENTS
(amounts in 000’s, except number of option contracts, share and per share amounts)
Company generated a taxable loss, and as such, was not subject to a current year tax liability. The tax accounting method change does not change the Company’s net asset value. See Note 2 — Significant Accounting Policies.
At November 30, 2016, the cost basis of investments for federal income tax purposes was $2,082,155 and the premiums received on outstanding option contracts written were $124. The cost basis for federal income tax purposes is $734,444 lower than the cost basis for GAAP reporting purposes primarily due to the additional basis adjustments attributable to the Company’s share of the allocated losses from its MLP investments. At November 30, 2016, gross unrealized appreciation and depreciation of investments and options for federal income tax purposes were as follows:
| | | | |
Gross unrealized appreciation of investments (including options) | | $ | 1,856,228 | |
Gross unrealized depreciation of investments (including options) | | | (66,986 | ) |
| | | | |
Net unrealized appreciation of investments | | $ | 1,789,242 | |
| | | | |
From time to time, the Company’s ability to sell certain of its investments is subject to certain legal or contractual restrictions. For instance, private investments that are not registered under the Securities Act of 1933, as amended (the “Securities Act”), cannot be offered for public sale in a non-exempt transaction without first being registered. In other cases, certain of the Company’s investments have restrictions such as lock-up agreements that preclude the Company from offering these securities for public sale.
At November 30, 2016, the Company held the following restricted investments:
| | | | | | | | | | | | | | | | | | | | | | | | | | | | |
Investment | | Acquisition
Date | | Type of
Restriction | | Number
of Units
(in 000’s) | | | Cost
Basis
(GAAP) | | | Fair
Value | | | Fair Value
Per Unit | | | Percent
of Net
Assets | | | Percent
of Total
Assets | |
Level 2 Investments(1) | | | | | | | | | | | | | | | | | | | | | | | | | | | | |
Plains GP Holdings, L.P. — Plains AAP, L.P. | | (2) | | (3) | | | 1,278 | | | $ | 9,444 | | | $ | 44,918 | | | $ | 35.16 | | | | 2.1 | % | | | 1.2 | % |
| | | | | | | | |
Level 3 Investments(4) | | | | | | | | | | | | | | | | | | | | | | | | | | | | |
Capital Product Partners L.P. | | | | | | | | | | | | | | | | | | | | | | | | | | | | |
Class B Units | | (2) | | (5) | | | 3,030 | | | $ | 18,054 | | | $ | 20,970 | | | $ | 6.92 | | | | 1.0 | % | | | 0.5 | % |
Clearwater Trust | | | | | | | | | | | | | | | | | | | | | | | | | | | | |
Trust Interest | | (6) | | (7) | | | N/A | | | | 2,695 | | | | 90 | | | | N/A | | | | — | | | | — | |
MPLX LP | | | | | | | | | | | | | | | | | | | | | | | | | | | | |
Convertible Preferred Units | | 5/13/16 | | (5) | | | 2,255 | | | | 72,148 | | | | 85,118 | | | | 37.74 | | | | 3.9 | | | | 2.2 | |
Rice Midstream Partners LP | | | | | | | | | | | | | | | | | | | | | | | | | | | | |
Common Units | | 10/7/16 | | (5) | | | 581 | | | | 12,375 | | | | 12,304 | | | | 21.16 | | | | 0.6 | | | | 0.3 | |
Western Gas Partners, LP | | | | | | | | | | | | | | | | | | | | | | | | | | | | |
Convertible Preferred Units | | 4/15/16 | | (5) | | | 134 | | | | 4,214 | | | | 7,839 | | | | 58.34 | | | | 0.3 | | | | 0.2 | |
| | | | | | | | | | | | | | | | | | | | | | | | | | | | |
Total | | | $ | 109,486 | | | $ | 126,321 | | | | | | | | 5.8 | % | | | 3.2 | % |
| | | | | | | | | | | | | | | | | | | | | | | | | | | | |
Total of all restricted securities | | | $ | 118,930 | | | $ | 171,239 | | | | | | | | 7.9 | % | | | 4.4 | % |
| | | | | | | | | | | | | | | | | | | | | | | | | | | | |
| (1) | The Company values its investment in Plains AAP, L.P. (“PAGP-AAP”) on an “as exchanged” basis based on the higher public market value of either Plains GP Holdings, L.P. (“PAGP”) or Plains All American, L.P. (“PAA”). As of November 30, 2016, the Company’s PAGP-AAP investment is valued at PAGP’s closing price. See Note 3 — Fair Value. |
| (2) | Security was acquired at various dates in prior fiscal years. |
| (3) | The Company’s investment in PAGP-AAP is exchangeable on a one-for-one basis into either PAGP shares or PAA units at the Company’s option. Upon exchange, the PAGP shares or the PAA units will be free of any restriction. |
38
KAYNE ANDERSON MLP INVESTMENT COMPANY
NOTES TO FINANCIAL STATEMENTS
(amounts in 000’s, except number of option contracts, share and per share amounts)
| (4) | Securities are valued using inputs reflecting the Company’s own assumptions as more fully described in Note 2 — Significant Accounting Policies and Note 3 — Fair Value. |
| (5) | Unregistered or restricted security of a publicly-traded company. |
| (6) | The Company holds an interest in the Clearwater Trust consisting primarily of a coal royalty interest. See Note 5 — Agreements and Affiliations. |
| (7) | Unregistered security of a private trust. |
| 8. Derivative | Financial Instruments |
As required by the Derivatives and Hedging Topic of the FASB Accounting Standards Codification (ASC 815), the following are the derivative instruments and hedging activities of the Company. See Note 2 — Significant Accounting Policies.
Option Contracts — Transactions in option contracts for the fiscal year ended November 30, 2016 were as follows:
| | | | | | | | |
| | | Number of
Contracts | | | Premium | |
Call Options Written | | | | | | | | |
Options outstanding at November 30, 2015 | | | — | | | $ | — | |
Options written | | | 41,670 | | | | 3,927 | |
Options subsequently repurchased(1) | | | (24,100 | ) | | | (2,206 | ) |
Options exercised | | | (11,160 | ) | | | (1,012 | ) |
Options expired | | | (5,410 | ) | | | (585 | ) |
| | | | | | | | |
Options outstanding at November 30, 2016(2) | | | 1,000 | | | $ | 124 | |
| | | | | | | | |
| (1) | The price at which the Company subsequently repurchased the options was $402 which resulted in net realized gains of $1,804. |
| (2) | The percentage of long-term investments subject to call options written was 0.1% at November 30, 2016. |
Interest Rate Swap Contracts — The Company may enter into interest rate swap contracts to partially hedge itself from increasing expense on its leverage resulting from increasing interest rates. At the time the interest rate swap contracts reach their scheduled termination, there is a risk that the Company would not be able to obtain a replacement transaction or that the terms of the replacement transaction would not be as favorable as on the expiring transaction. In addition, if the Company is required to terminate any swap contract early, then the Company could be required to make a termination payment. As of November 30, 2016, the Company did not have any interest rate swap contracts outstanding.
The following table sets forth the fair value of the Company’s derivative instruments on the Statement of Assets and Liabilities:
| | | | | | |
Derivatives Not Accounted for as Hedging Instruments | | Statement of Assets and Liabilities Location | | Fair Value as of
November 30, 2016 | |
Call options written | | Call option contracts written | | $ | (281 | ) |
39
KAYNE ANDERSON MLP INVESTMENT COMPANY
NOTES TO FINANCIAL STATEMENTS
(amounts in 000’s, except number of option contracts, share and per share amounts)
The following table sets forth the effect of the Company’s derivative instruments on the Statement of Operations:
| | | | | | | | | | |
| | | | | For the Fiscal Year Ended
November 30, 2016 | |
Derivatives Not Accounted for as
Hedging Instruments | | Location of Gains/(Losses) on Derivatives
Recognized in Income | | Net Realized
Gains/(Losses) on
Derivatives
Recognized in
Income | | | Change in
Unrealized
Gains/(Losses) on
Derivatives
Recognized in
Income | |
Call options written | | Options | | $ | 2,389 | | | $ | (157 | ) |
9. Investment Transactions
For the fiscal year ended November 30, 2016, the Company purchased and sold securities in the amounts of $516,557 and $795,593 (excluding short-term investments and options).
10. Credit Facility and Term Loan
At November 30, 2016, the Company had a $150,000 unsecured revolving credit facility (the “Credit Facility”) with a syndicate of lenders. The Credit Facility has a two-year term maturing on February 28, 2018. The interest rate on outstanding loan balances may vary between LIBOR plus 1.60% and LIBOR plus 2.25%, depending on the Company’s asset coverage ratios. The Company pays a fee of 0.30% per annum on any unused amounts of the Credit Facility.
For the fiscal year ended November 30, 2016, the Company did not have any borrowings outstanding under the Credit Facility. Under the terms of the Credit Facility, the Company is unable to borrow unless its net assets exceed a minimum net asset value threshold ($800,507 as of November 30, 2016). As of November 30, 2016, the Company was able to borrow under the Credit Facility because its net asset value ($2,180,781) was above the minimum net asset threshold.
At November 30, 2016, the Company had a $150,000 unsecured term loan (the “Term Loan”). The Term Loan has a five-year commitment maturing on February 18, 2019, and borrowings under the Term Loan bear interest at a rate of LIBOR plus 1.30%. The Company pays a fee of 0.25% per annum on any unused amount of the Term Loan. Amounts borrowed under the Term Loan may be repaid and subsequently reborrowed. For the fiscal year ended November 30, 2016, the average amount outstanding under the Term Loan was $8,880 with a weighted average interest rate of 1.86%. Under the terms of the Term Loan the Company is unable to borrow unless its net assets exceed a minimum net asset threshold ($1,866,600 as of November 30, 2016). As of November 30, 2016, the Company had $43,000 outstanding under the Term Loan at an interest rate of 1.86% and it was able to borrow under the Term Loan because its net asset value ($2,180,781) was above the minimum net asset threshold.
As of November 30, 2016, the Company was in compliance with all financial and operational covenants required by the Credit Facility and Term Loan. See Financial Highlights for the Company’s asset coverage ratios under the 1940 Act.
40
KAYNE ANDERSON MLP INVESTMENT COMPANY
NOTES TO FINANCIAL STATEMENTS
(amounts in 000’s, except number of option contracts, share and per share amounts)
11. Notes
At November 30, 2016, the Company had $767,000 aggregate principal amount of Notes outstanding. During the first quarter, the Company redeemed $264,000 of Notes. The table below sets forth a summary of those redemptions.
| | | | | | | | | | | | | | |
Date of Redemption | | | Series | | | Principal Redeemed | | | Redemption Price | |
| | 12/14/15 | | | | R | | | $ | 22,000 | | | | 102.0 | % |
| | 12/14/15 | | | | S | | | | 52,800 | | | | 102.0 | |
| | 12/14/15 | | | | T | | | | 35,200 | | | | 102.0 | |
| | 12/14/15 | | | | V | | | | 70,000 | | | | 100.7 | |
| | 1/20/16 | | | | W | | | | 10,000 | | | | 106.7 | |
| | 1/28/16 | | | | R | | | | 3,000 | | | | 102.0 | |
| | 1/28/16 | | | | S | | | | 7,200 | | | | 102.0 | |
| | 1/28/16 | | | | T | | | | 4,800 | | | | 102.0 | |
| | 1/28/16 | | | | W | | | | 21,000 | | | | 102.0 | |
| | 2/18/16 | | | | W | | | | 38,000 | | | | 102.0 | |
| | | | | | | | | | | | | | |
| | | | | | | | $ | 264,000 | | | | | |
| | | | | | | | | | | | | | |
The table below sets forth the key terms of each series of Notes outstanding at November 30, 2016.
| | | | | | | | | | | | | | | | | | | | |
| Series | | Principal
Outstanding,
November 30,
2015 | | | Principal
Redeemed | | | Principal
Outstanding,
November 30,
2016 | | | Estimated
Fair Value
November 30,
2016 | | | Fixed
Interest Rate | | Maturity
Date |
| R | | $ | 25,000 | | | $ | (25,000 | ) | | $ | — | | | $ | — | | | 3.73% | | 11/9/17 |
| S | | | 60,000 | | | | (60,000 | ) | | | — | | | | — | | | 4.40% | | 11/9/20 |
| T | | | 40,000 | | | | (40,000 | ) | | | — | | | | — | | | 4.50% | | 11/9/22 |
| V | | | 70,000 | | | | (70,000 | ) | | | — | | | | — | | | 3.71% | | 5/26/16 |
| W | | | 100,000 | | | | (69,000 | ) | | | 31,000 | | | | 32,500 | | | 4.38% | | 5/26/18 |
| Y | | | 20,000 | | | | — | | | | 20,000 | | | | 20,300 | | | 2.91% | | 5/3/17 |
| Z | | | 15,000 | | | | — | | | | 15,000 | | | | 15,500 | | | 3.39% | | 5/3/19 |
| AA | | | 15,000 | | | | — | | | | 15,000 | | | | 15,600 | | | 3.56% | | 5/3/20 |
| BB | | | 35,000 | | | | — | | | | 35,000 | | | | 36,600 | | | 3.77% | | 5/3/21 |
| CC | | | 76,000 | | | | — | | | | 76,000 | | | | 79,800 | | | 3.95% | | 5/3/22 |
| DD | | | 75,000 | | | | — | | | | 75,000 | | | | 76,200 | | | 2.74% | | 4/16/19 |
| EE | | | 50,000 | | | | — | | | | 50,000 | | | | 51,000 | | | 3.20% | | 4/16/21 |
| FF | | | 65,000 | | | | — | | | | 65,000 | | | | 66,300 | | | 3.57% | | 4/16/23 |
| GG | | | 45,000 | | | | — | | | | 45,000 | | | | 45,700 | | | 3.67% | | 4/16/25 |
| II | | | 30,000 | | | | — | | | | 30,000 | | | | 30,500 | | | 2.88% | | 7/30/19 |
| JJ | | | 30,000 | | | | — | | | | 30,000 | | | | 30,900 | | | 3.46% | | 7/30/21 |
| KK | | | 80,000 | | | | — | | | | 80,000 | | | | 82,900 | | | 3.93% | | 7/30/24 |
| LL | | | 50,000 | | | | — | | | | 50,000 | | | | 50,500 | | | 2.89% | | 10/29/20 |
| MM | | | 40,000 | | | | — | | | | 40,000 | | | | 40,300 | | | 3.26% | | 10/29/22 |
| NN | | | 20,000 | | | | — | | | | 20,000 | | | | 20,000 | | | 3.37% | | 10/29/23 |
| OO | | | 90,000 | | | | — | | | | 90,000 | | | | 90,100 | | | 3.46% | | 10/29/24 |
| | | | | | | | | | | | | | | | | | | | |
| | $ | 1,031,000 | | | $ | (264,000 | ) | | $ | 767,000 | | | $ | 784,700 | | | | | |
| | | | | | | | | | | | | | | | | | | | |
Holders of the fixed rate Notes are entitled to receive cash interest payments semi-annually (on June 19 and December 19) at the fixed rate. As of November 30, 2016, the weighted average interest rate on the outstanding Notes was 3.46%.
As of November 30, 2016, each series of Notes was rated “AAA” by FitchRatings. In the event the credit rating on any series of Notes falls below “A-”, the interest rate on such series will increase by 1% during the period
41
KAYNE ANDERSON MLP INVESTMENT COMPANY
NOTES TO FINANCIAL STATEMENTS
(amounts in 000’s, except number of option contracts, share and per share amounts)
of time such series is rated below “A-”. The Company is required to maintain a current rating from one rating agency with respect to each series of Notes.
The Notes were issued in private placement offerings to institutional investors and are not listed on any exchange or automated quotation system. The Notes contain various covenants related to other indebtedness, liens and limits on the Company’s overall leverage. Under the 1940 Act and the terms of the Notes, the Company may not declare dividends or make other distributions on shares of its common stock or make purchases of such shares if, at any time of the declaration, distribution or purchase, asset coverage with respect to the outstanding Notes would be less than 300%.
The Notes are redeemable in certain circumstances at the option of the Company. The Notes are also subject to a mandatory redemption to the extent needed to satisfy certain requirements if the Company fails to meet an asset coverage ratio required by law and is not able to cure the coverage deficiency by the applicable deadline, or fails to cure a deficiency as stated in the Company’s rating agency guidelines in a timely manner.
The Notes are unsecured obligations of the Company and, upon liquidation, dissolution or winding up of the Company, will rank: (1) senior to all of the Company’s outstanding preferred shares; (2) senior to all of the Company’s outstanding common shares; (3) on a parity with any unsecured creditors of the Company and any unsecured senior securities representing indebtedness of the Company; and (4) junior to any secured creditors of the Company.
At November 30, 2016, the Company was in compliance with all covenants under the Notes agreements.
12. Preferred Stock
At November 30, 2016, the Company had 12,000,000 shares of MRP Shares outstanding, with a total liquidation value of $300,000 ($25.00 per share). On December 16, 2015 and on January 12, 2016, the Company redeemed a total of 2,400,000 shares of its Series E MRP Shares at a redemption price equal to the liquidation value plus accumulated unpaid dividends. On October 3, 2016, the Company redeemed all 2,000,000 shares of its Series G MRP Shares with an aggregate liquidation value of $50,000 plus accumulated unpaid dividends.
On November 9, 2016, the Company completed a private placement of $50,000 of Series J MRP Shares. Net proceeds from the offering along with borrowings on the Company’s Term Loan were used to redeem all 4,160,000 shares of its Series A MRP Shares ($104,000 liquidation value) at a redemption price equal to the liquidation value plus accumulated unpaid dividends. The table below sets forth the key terms of each series of the MRP Shares at November 30, 2016.
| | | | | | | | | | | | | | | | | | | | | | | | | | |
| Series | | Liquidation
Value
November 30,
2015 | | | Liquidation
Value
Redeemed | | | Liquidation
Value
Issued | | | Liquidation
Value
November 30,
2016 | | | Estimated
Fair Value
November 30,
2016 | | | Rate | | | Mandatory
Redemption
Date |
| A | | $ | 104,000 | | | $ | (104,000 | ) | | $ | — | | | $ | — | | | $ | — | | | | 5.57 | % | | 5/7/17 |
| B | | | 8,000 | | | | — | | | | — | | | | 8,000 | | | | 8,100 | | | | 4.53 | % | | 11/9/17 |
| C | | | 42,000 | | | | — | | | | — | | | | 42,000 | | | | 44,200 | | | | 5.20 | % | | 11/9/20 |
| E | | | 60,000 | | | | (60,000 | ) | | | — | | | | — | | | | — | | | | 4.25 | % | | 4/1/19 |
| F(1) | | | 125,000 | | | | — | | | | — | | | | 125,000 | | | | 127,050 | | | | 3.50 | % | | 4/15/20 |
| G | | | 50,000 | | | | (50,000 | ) | | | — | | | | — | | | | — | | | | 4.60 | % | | 10/1/21 |
| H | | | 50,000 | | | | — | | | | — | | | | 50,000 | | | | 50,400 | | | | 4.06 | % | | 7/30/21 |
| I | | | 25,000 | | | | — | | | | — | | | | 25,000 | | | | 24,700 | | | | 3.86 | % | | 10/29/22 |
| J | | | — | | | | — | | | | 50,000 | | | | 50,000 | | | | 48,700 | | | | 3.36 | % | | 11/9/21 |
| | | | | | | | | | | | | | | | | | | | | | | | | | |
| | $ | 464,000 | | | $ | (214,000 | ) | | $ | 50,000 | | | $ | 300,000 | | | $ | 303,150 | | | | | | | |
| | | | | | | | | | | | | | | | | | | | | | | | | | |
| (1) | Series F MRP Shares are publicly traded on the NYSE under the symbol “KYNPRF”. The fair value is based on the price of $25.41 as of November 30, 2016. |
42
KAYNE ANDERSON MLP INVESTMENT COMPANY
NOTES TO FINANCIAL STATEMENTS
(amounts in 000’s, except number of option contracts, share and per share amounts)
Holders of the Series B, C, H, I and J MRP Shares are entitled to receive cumulative cash dividend payments on the first business day following each quarterly period (February 28, May 31, August 31 and November 30). Holders of the Series F MRP Shares are entitled to receive cumulative cash dividend payments on the first business day of each month.
On December 16, 2015, FitchRatings downgraded the rating on the Company’s MRP Shares to “A” from “AA”. The table below outlines the terms of each series of MRP Shares. The dividend rate on the Company’s MRP Shares will increase if the credit rating is downgraded below “A” by FitchRatings. Further, the annual dividend rate for all series of MRP Shares will increase by 4.0% if no ratings are maintained, and the annual dividend rate will increase by 5.0% if the Company fails to make dividend or certain other payments. The Company is required to maintain a current rating from one rating agency with respect to each series of MRP Shares.
| | | | |
| | | Series B, C, H, I and J | | Series F |
Ratings Threshold | | “A” | | “A” |
Method of Determination | | Lowest Credit Rating | | Highest Credit Rating |
Increase in Annual Dividend Rate | | 0.5% to 4.0% | | 0.75% to 4.0% |
The MRP Shares rank senior to all of the Company’s outstanding common shares and on parity with any other preferred stock. The MRP Shares are redeemable in certain circumstances at the option of the Company and are also subject to a mandatory redemption if the Company fails to meet a total leverage (debt and preferred stock) asset coverage ratio of 225% or fails to maintain its basic maintenance amount as stated in the Company’s rating agency guidelines.
Under the terms of the MRP Shares, the Company may not declare dividends or pay other distributions on shares of its common stock or make purchases of such shares if, at any time of the declaration, distribution or purchase, asset coverage with respect to total leverage would be less than 225% or the Company would fail to maintain its basic maintenance amount as stated in the Company’s rating agency guidelines.
The holders of the MRP Shares have one vote per share and will vote together with the holders of common stock as a single class except on matters affecting only the holders of MRP Shares or the holders of common stock. The holders of the MRP Shares, voting separately as a single class, have the right to elect at least two directors of the Company.
At November 30, 2016, the Company was in compliance with the asset coverage and basic maintenance requirements of its MRP Shares.
13. Common Stock
At November 30, 2016, the Company had 188,000,000 shares of common stock authorized and 113,687,509 shares outstanding. On December 17, 2015, KAFA agreed to purchase $10,035 of newly issued shares funded in part with the after-tax management fees received during the fourth quarter of fiscal 2015. The new shares were purchased at the net asset value as of the close of business on December 18, 2015 ($15.09 per share) which represents a 9.2% premium to the closing market price. The 665,037 shares issued in connection with this purchase were distributed amongst the principals of KAFA, including KACALP, the managing member of KAFA. As of November 30, 2016, KACALP owned 285,929 shares of the Company. Transactions in common shares for the fiscal year ended November 30, 2016 were as follows:
| | | | |
Shares outstanding at November 30, 2015 | | | 111,525,012 | |
Shares issued in connection with purchase by investment advisor | | | 665,037 | |
Shares issued through reinvestment of distributions | | | 1,497,460 | |
| | | | |
Shares outstanding at November 30, 2016 | | | 113,687,509 | |
| | | | |
43
KAYNE ANDERSON MLP INVESTMENT COMPANY
NOTES TO FINANCIAL STATEMENTS
(amounts in 000’s, except number of option contracts, share and per share amounts)
14. Subsequent Events
On December 15, 2016, the Company declared its quarterly distribution of $0.55 per common share for the fourth quarter. The total distribution of $62,528 was paid January 13, 2017. Of this total, pursuant to the Company’s dividend reinvestment plan, $6,035 was reinvested into the Company through the issuance of 324,488 shares of common stock.
The Company has performed an evaluation of subsequent events through the date the financial statements were issued and has determined that no additional items require recognition or disclosure.
44
KAYNE ANDERSON MLP INVESTMENT COMPANY
REPORT OF INDEPENDENT REGISTERED PUBLIC ACCOUNTING FIRM
To the Board of Directors and Stockholders of
Kayne Anderson MLP Investment Company
In our opinion, the accompanying statement of assets and liabilities, including the schedule of investments, and the related statements of operations, of changes in net assets applicable to common stockholders, and of cash flows and the financial highlights present fairly, in all material respects, the financial position of the Kayne Anderson MLP Investment Company (the “Company”) at November 30, 2016, the results of its operations and its cash flows for the year then ended, the changes in its net assets applicable to common stockholders for each of the two years in the period then ended and the financial highlights for each of the ten years in the period then ended, in conformity with accounting principles generally accepted in the United States of America. These financial statements and financial highlights (hereafter referred to as “financial statements”) are the responsibility of the Company’s management. Our responsibility is to express an opinion on these financial statements based on our audits. We conducted our audits of these financial statements in accordance with the standards of the Public Company Accounting Oversight Board (United States). Those standards require that we plan and perform the audit to obtain reasonable assurance about whether the financial statements are free of material misstatement. An audit includes examining, on a test basis, evidence supporting the amounts and disclosures in the financial statements, assessing the accounting principles used and significant estimates made by management, and evaluating the overall financial statement presentation. We believe that our audits, which included confirmation of securities at November 30, 2016, by correspondence with the custodian and brokers, provide a reasonable basis for our opinion.
PricewaterhouseCoopers LLP
Los Angeles, California
January 27, 2017
45
KAYNE ANDERSON MLP INVESTMENT COMPANY
PRIVACY POLICY NOTICE
(UNAUDITED)
Rev. 01/2011
| | |
FACTS | | WHAT DOES KAYNE ANDERSON MLP INVESTMENT COMPANY (“KYN”) DO WITH YOUR PERSONAL INFORMATION? |
| | |
Why? | | Financial companies choose how they share your personal information. Federal law gives consumers the right to limit some but not all sharing. Federal law also requires us to tell you how we collect, share, and protect your personal information. Please read this notice carefully to understand what we do. |
|
What? | | The types of personal information we collect and share depend on the product or service you have with us. This information can include: ∎ Social Security number and account balances ∎ Payment history and transaction history ∎ Account transactions and wire transfer instructions When you are no longer our customer, we continue to share your information as described in this notice. |
|
How? | | All financial companies need to share customers’ personal information to run their everyday business. In the section below, we list the reasons financial companies can share their customers’ personal information; the reasons KYN chooses to share; and whether you can limit this sharing. |
| | | | |
| Reasons we can share your personal information | | Does KYN share? | | Can you limit
this sharing? |
For our everyday business purposes — such as to process your transactions, maintain your account(s), respond to court orders and legal investigations, or report to credit bureaus | | Yes | | No |
For our marketing purposes — to offer our products and services to you | | No | | No |
| For joint marketing with other financial companies | | No | | We don’t share |
For our affiliates’ everyday business purposes —
information about your transactions and experiences | | No | | We don’t share |
For our affiliates’ everyday business purposes — information about your creditworthiness | | No | | We don’t share |
| For nonaffiliates to market to you | | No | | We don’t share |
| | |
Questions? | | Call 877-657-3863 or go to http://www.kaynefunds.com |
46
KAYNE ANDERSON MLP INVESTMENT COMPANY
PRIVACY POLICY NOTICE
(UNAUDITED)
| | | | |
| Who we are |
| Who is providing this notice? | | KYN | | |
| | | | |
| What we do |
How does KYN protect my personal information? | | To protect your personal information from unauthorized access and use, we use security measures that comply with federal law. These measures include computer safeguards and secured files and buildings. Access to your personal information is on a need-to-know basis. KYN has adopted internal policies to protect your non-public personal information. | | |
How does KYN collect my personal information? | | We collect your personal information, for example, when you ∎ Provide account information ∎ Buy securities from us or make a wire transfer ∎ Give us your contact information We also collect your personal information from other companies. | | |
| Why can’t I limit all sharing? | | Federal law gives you the right to limit only ∎ sharing for affiliates’ everyday business purposes — information about your creditworthiness ∎ affiliates from using your information to market to you ∎ sharing for nonaffiliates to market to you State laws and individual companies may give you additional rights to limit sharing. | | |
| | | | |
| Definitions |
| Affiliates | | Companies related by common ownership or control. They can be financial and nonfinancial companies. ∎ KYN does not share with our affiliates. | | |
| Nonaffiliates | | Companies not related by common ownership or control. They can be financial and nonfinancial companies. ∎ KYN does not share with nonaffiliates so they can market to you. | | |
| Joint marketing | | A formal agreement between nonaffiliated financial companies that together market financial products or services to you. ∎ KYN doesn’t jointly market. | | |
| | | | |
| Other important information |
| None. | | |
47
KAYNE ANDERSON MLP INVESTMENT COMPANY
DIVIDEND REINVESTMENT PLAN
(UNAUDITED)
Kayne Anderson MLP Investment Company, a Maryland corporation (the “Company”), has adopted the following plan (the “Plan”) with respect to distributions declared by its Board of Directors (the “Board”) on shares of its Common Stock:
1. Unless a stockholder specifically elects to receive cash as set forth below, all distributions hereafter declared by the Board shall be payable in shares of the Common Stock of the Company, and no action shall be required on such stockholder’s part to receive a distribution in stock.
2. Such distributions shall be payable on such date or dates as may be fixed from time to time by the Board to stockholders of record at the close of business on the record date(s) established by the Board for the distribution involved.
3. The Company may use newly-issued shares of its Common Stock or purchase shares in the open market in connection with the implementation of the plan. The number of shares to be issued to a stockholder shall be based on share price equal to 95% of the closing price of the Company’s Common Stock one day prior to the dividend payment date.
4. The Board may, in its sole discretion, instruct the Company to purchase shares of its Common Stock in the open market in connection with the implementation of the Plan as follows: If the Company’s Common Stock is trading below net asset value at the time of valuation, upon notice from the Company, the Plan Administrator (as defined below) will receive the dividend or distribution in cash and will purchase Common Stock in the open market, on the New York Stock Exchange or elsewhere, for the Participants’ accounts, except that the Plan Administrator will endeavor to terminate purchases in the open market and cause the Company to issue the remaining shares if, following the commencement of the purchases, the market value of the shares, including brokerage commissions, exceeds the net asset value at the time of valuation. These remaining shares will be issued by the Company at a price equal to the greater of (i) the net asset value at the time of valuation or (ii) 95% of the then current market price.
5. In a case where the Plan Administrator has terminated open market purchases and caused the issuance of remaining shares by the Company, the number of shares received by the participant in respect of the cash dividend or distribution will be based on the weighted average of prices paid for shares purchased in the open market, including brokerage commissions, and the price at which the Company issues the remaining shares. To the extent that the Plan Administrator is unable to terminate purchases in the open market before the Plan Administrator has completed its purchases, or remaining shares cannot be issued by the Company because the Company declared a dividend or distribution payable only in cash, and the market price exceeds the net asset value of the shares, the average share purchase price paid by the Plan Administrator may exceed the net asset value of the shares, resulting in the acquisition of fewer shares than if the dividend or distribution had been paid in shares issued by the Company.
6. A stockholder may, however, elect to receive his or its distributions in cash. To exercise this option, such stockholder shall notify American Stock Transfer & Trust Company, the plan administrator and the Company’s transfer agent and registrar (collectively the “Plan Administrator”), in writing so that such notice is received by the Plan Administrator no later than the record date fixed by the Board for the distribution involved.
7. The Plan Administrator will set up an account for shares acquired pursuant to the Plan for each stockholder who has not so elected to receive dividends and distributions in cash (each, a “Participant”). The Plan Administrator may hold each Participant’s shares, together with the shares of other Participants, in non-certificated form in the Plan Administrator’s name or that of its nominee. Upon request by a Participant, received no later than three (3) days prior to the payable date, the Plan Administrator will, instead of crediting shares to and/or carrying shares in a Participant’s account, issue, without charge to the Participant, a certificate registered in the Participant’s name for the number of whole shares payable to the Participant
48
KAYNE ANDERSON MLP INVESTMENT COMPANY
DIVIDEND REINVESTMENT PLAN
(UNAUDITED)
and a check for any fractional share less a broker commission on the sale of such fractional shares. If a request to terminate a Participant’s participation in the Plan is received less than three (3) days before the payable date, dividends and distributions for that payable date will be reinvested. However, subsequent dividends and distributions will be paid to the Participant in cash.
8. The Plan Administrator will confirm to each Participant each acquisition made pursuant to the Plan as soon as practicable but not later than ten (10) business days after the date thereof. Although each Participant may from time to time have an undivided fractional interest (computed to three decimal places) in a share of Common Stock of the Company, no certificates for a fractional share will be issued. However, dividends and distributions on fractional shares will be credited to each Participant’s account. In the event of termination of a Participant’s account under the Plan, the Plan Administrator will adjust for any such undivided fractional interest in cash at the market value of the Company’s shares at the time of termination.
9. The Plan Administrator will forward to each Participant any Company related proxy solicitation materials and each Company report or other communication to stockholders, and will vote any shares held by it under the Plan in accordance with the instructions set forth on proxies returned by Participants to the Company.
10. In the event that the Company makes available to its stockholders rights to purchase additional shares or other securities, the shares held by the Plan Administrator for each Participant under the Plan will be added to any other shares held by the Participant in certificated form in calculating the number of rights to be issued to the Participant.
11. The Plan Administrator’s service fee, if any, and expenses for administering the Plan will be paid for by the Company.
12. Each Participant may terminate his or its account under the Plan by so notifying the Plan Administrator via the Plan Administrator’s website at www.amstock.com, by filling out the transaction request form located at the bottom of the Participant’s Statement and sending it to American Stock Transfer and Trust Company, P.O. Box 922, Wall Street Station, New York, NY 10269-0560 or by calling the Plan Administrator at (888) 888-0317. Such termination will be effective immediately. The Plan may be terminated by the Company upon notice in writing mailed to each Participant at least 30 days prior to any record date for the payment of any dividend or distribution by the Company. Upon any termination, the Plan Administrator will cause a certificate or certificates to be issued for the full shares held for the Participant under the Plan and a cash adjustment for any fractional share to be delivered to the Participant without charge to the Participant. If a Participant elects by his or its written notice to the Plan Administrator in advance of termination to have the Plan Administrator sell part or all of his or its shares and remit the proceeds to the Participant, the Plan Administrator is authorized to deduct a $15.00 transaction fee plus a $0.10 per share brokerage commission from the proceeds.
13. These terms and conditions may be amended or supplemented by the Company at any time but, except when necessary or appropriate to comply with applicable law or the rules or policies of the Securities and Exchange Commission or any other regulatory authority, only by mailing to each Participant appropriate written notice at least 30 days prior to the effective date thereof. The amendment or supplement shall be deemed to be accepted by each Participant unless, prior to the effective date thereof, the Plan Administrator receives written notice of the termination of his or its account under the Plan. Any such amendment may include an appointment by the Plan Administrator in its place and stead of a successor agent under these terms and conditions, with full power and authority to perform all or any of the acts to be performed by the Plan Administrator under these terms and conditions. Upon any such appointment of any agent for the purpose of receiving dividends and distributions, the Company will be authorized to pay to such successor agent, for each Participant’s account, all dividends and distributions payable on shares of the
49
KAYNE ANDERSON MLP INVESTMENT COMPANY
DIVIDEND REINVESTMENT PLAN
(UNAUDITED)
Company held in the Participant’s name or under the Plan for retention or application by such successor agent as provided in these terms and conditions.
14. The Plan Administrator will at all times act in good faith and use its best efforts within reasonable limits to ensure its full and timely performance of all services to be performed by it under this Plan and to comply with applicable law, but assumes no responsibility and shall not be liable for loss or damage due to errors unless such error is caused by the Plan Administrator’s negligence, bad faith, or willful misconduct or that of its employees or agents.
15. These terms and conditions shall be governed by the laws of the State of Maryland.
Adopted: September 27, 2004
Amended: December 13, 2005
Amended: March 12, 2009
50
KAYNE ANDERSON MLP INVESTMENT COMPANY
INFORMATION CONCERNING DIRECTORS AND CORPORATE OFFICERS
(UNAUDITED)
| | | | | | |
Independent Directors(1) |
| | | |
Name(2), (Year Born) | | Position(s) Held with Company,
Term of Office/ Time of Service | | Principal Occupations During Past Five Years | | Other Directorships Held by Director/Officer During Past Five Years |
| | | |
Anne K. Costin
(born 1950) | | Director. 3-year term (until the 2019 Annual Meeting of Stockholders)/served since inception | | Professor at the Amsterdam Institute of Finance from 2007 to 2013. Adjunct Professor in the Finance and Economics Department of Columbia University Graduate School of Business in New York from 2004 through 2007. As of March 1, 2005, Ms. Costin retired after a 28-year career at Citigroup. During the seven years prior to her retirement, Ms. Costin was Managing Director and Global Deputy Head of the Project & Structured Trade Finance product group within Citigroup’s Investment Banking Division. | | • Kayne Anderson Energy Total Return Fund, Inc. (“KYE”) |
| | | |
Steven C. Good
(born 1942) | | Director. 3-year term (until the 2018 Annual Meeting of Stockholders)/served since inception | | Independent consultant since February 2010, when he retired from CohnReznick LLP, where he had been an active partner since 1976. CohnReznick LLP offers accounting, tax and business advisory services to middle market private and publicly-traded companies, their owners and their management. Founded Block, Good and Gagerman in 1976, which later evolved in stages into CohnReznick LLP. | | Current: • KYE • OSI Systems, Inc.
(specialized electronic products) • Rexford Industrial Realty, Inc. (real estate investment trust) Prior: • California Pizza Kitchen, Inc.
(restaurant chain) • Arden Realty, Inc.
(real estate investment trust) |
| | | |
Gerald I. Isenberg
(born 1940) | | Director. 3-year term (until the 2017 Annual Meeting of Stockholders)/served since 2005 | | Professor Emeritus at the University of Southern California School of Cinema-Television since 2007. Chief Financial Officer of Teeccino Caffe Inc., a privately owned beverage manufacturer and distributor. | | Current: • KYE • Teeccino Caffe Inc.
(beverage manufacturer and distributor) • Caucus for Television Producers, Writers & Directors Foundation
(not-for-profit organization) Prior: • Kayne Anderson Rudnick Mutual Funds(3) from 1998 to 2002 |
| | | |
William H. Shea, Jr.
(born 1954) | | Director. 3-year term (until the 2019 Annual Meeting of Stockholders)/served since March 2008 | | Chief Executive Officer of Mainline Energy Partners, LLC since July 2016. Chief Executive Officer and President of Niska Gas Storage Partners LLC from May 2014 to July 2016. Chief Executive Officer of the general partner of PVR Partners, L.P. (PVR) from March 2010 to March 2014. Chief Executive Officer and President of the general partner of Penn Virginia GP Holdings, L.P. (PVG), from March 2010 to March 2011. Private investor from June 2007 to March 2010. From September 2000 to June 2007, President, Chief Executive Officer and Director (Chairman from May 2004 to June 2007) of Buckeye Partners L.P. (BPL). From May 2004 to June 2007, President, Chief Executive Officer and Chairman of Buckeye GP Holdings L.P. (BGH) and its predecessors. | | Current: • KYE • Mainline Energy Partners, LLC
(midstream energy) • USA Compression Partners, LP
(natural gas compression MLP) Prior: • BGH
(general partner of BPL) • BPL
(midstream MLP) • Gibson Energy ULC
(midstream energy) • Niska Gas Storage Partners LLC
(natural gas storage) • PVG
(owned general partner of PVR) • PVR
(midstream MLP) • Penn Virginia Corporation
(oil and gas exploration and production company) |
51
KAYNE ANDERSON MLP INVESTMENT COMPANY
INFORMATION CONCERNING DIRECTORS AND CORPORATE OFFICERS
(UNAUDITED)
| | | | | | |
Interested Director and Non-Director Officers |
| | | |
Name(2), (Year Born) | | Position(s) Held with Company,
Term of Office/ Time of Service | | Principal Occupations During Past Five Years | | Other Directorships Held by Director/Officer During Past Five Years |
| | | |
Kevin S. McCarthy(4)
(born 1959) | | Chairman of the Board of Directors and Chief Executive Officer. 3-year term as a director (until the 2018 Annual Meeting of Stockholders), elected annually as an officer/served since inception | | Managing Partner of KACALP since June 2004 and Co-Managing Partner of KAFA since 2006. Chief Executive Officer of KYE; Kayne Anderson Energy Development Company (“KED”); and Kayne Anderson Midstream/Energy Fund, Inc. (“KMF”) since inception (KYE inception in 2005; KED inception in 2006; and KMF inception in 2010). | | Current: • KYE • KED • KMF • ONEOK, Inc. (midstream company) • Range Resources Corporation
(oil and gas exploration and production company) Prior: • Clearwater Natural Resources, L.P.
(coal mining) • Direct Fuels Partners, L.P.
(transmix refining and fuels distribution) • Emerge Energy Services LP
(frac sand MLP) • International Resource Partners LP
(coal mining) • K-Sea Transportation Partners LP
(shipping MLP) • ProPetro Services, Inc.
(oilfield services) |
| | | |
J.C. Frey
(born 1968) | | Executive Vice President, Assistant Treasurer and Assistant Secretary. Elected annually. Served as Assistant Treasurer and Assistant Secretary since inception; served as Executive Vice President since June 2008 | | Managing Partner of KACALP since 2004 and Co-Managing Partner of KAFA since 2006. Assistant Secretary and Assistant Treasurer of KYE since 2005 and of KED since 2006. Executive Vice President of KYE and KED since June 2008 and of KMF since August 2010. | | None |
| | | |
James C. Baker
(born 1972) | | President since June 2016. Executive Vice President from June 2008 to June 2016. Elected annually/served since June 2005 | | Senior Managing Director of KACALP and KAFA since February 2008. President of KYE, KED and KMF since June 2016. Executive Vice President of KYE and KED from June 2008 to June 2016 and of KMF from August 2010 to June 2016. | | Current: • KED Prior: • K-Sea Transportation Partners LP
(shipping MLP) • Petris Technology, Inc.
(data management for energy companies) • ProPetro Services, Inc.
(oilfield services) |
| | | |
Terry A. Hart
(born 1969) | | Chief Financial Officer and Treasurer. Elected annually/served since 2005 | | Managing Director of KACALP since December 2005 and Chief Financial Officer of KAFA since 2006. Chief Financial Officer and Treasurer of KYE since December 2005; of KED since September 2006; and of KMF since August 2010. | | Current: • KED • The Source for Women
(not-for-profit organization) |
52
KAYNE ANDERSON MLP INVESTMENT COMPANY
INFORMATION CONCERNING DIRECTORS AND CORPORATE OFFICERS
(UNAUDITED)
| | | | | | |
Interested Director and Non-Director Officers |
| | | |
Name(2), (Year Born) | | Position(s) Held with Company,
Term of Office/ Time of Service | | Principal Occupations During Past Five Years | | Other Directorships Held by Director/Officer During Past Five Years |
| | | |
Ron M. Logan, Jr.
(born 1960) | | Senior Vice President Elected annually/served since September 2012 | | Senior Managing Director of KACALP and KAFA since February 2014. Managing Director of KACALP and KAFA from September 2006 to February 2014. Senior Vice President of KED since September 2006. Senior Vice President of KMF since June 2012. Senior Vice President of KYE since September 2012. | | Prior • VantaCore Partners LP
(aggregates MLP) |
| | | |
Jody C. Meraz
(born 1978) | | Vice President. Elected annually/served since 2011 | | Managing Director of KACALP and KAFA since February 2014. Senior Vice President of KACALP and KAFA from 2011 to February 2014. Vice President of KYE, KED and KMF since 2011. | | None |
| | | |
Michael O’Neil
(born 1983) | | Chief Compliance Officer. Elected annually/served since 2013 | | Chief Compliance Officer of KACALP and KAFA since March 2012 and of KYE, KED, KMF since December 2013 and of KA Associates, Inc. (broker-dealer) since January 2013. A compliance officer at BlackRock Inc. from January 2008 to February 2012. | | None |
| | | |
David J. Shladovsky
(born 1960) | | Secretary. Elected annually/served since inception | | General Counsel of KACALP since 1997 and of KAFA since 2006. Secretary and Chief Compliance Officer (through December 2013) of KYE since 2005; of KED since 2006; and of KMF since August 2010. | | None |
| (1) | The 1940 Act requires the term “Fund Complex” to be defined to include registered investment companies advised by KAFA, the Company’s investment adviser, and the Fund Complex included the Company, KYE, KED and KMF. Each Independent Director oversees two registered investment companies in the Fund Complex the Company and KYE, as noted above. |
| (2) | The address of each director and corporate officer is c/o KA Fund Advisors, LLC, 811 Main Street, 14th Floor, Houston, Texas, 77002. |
| (3) | The investment adviser to the Kayne Anderson Rudnick Mutual Funds, Kayne Anderson Rudnick Investment Management, LLC, formerly was an affiliate of KACALP. |
| (4) | Mr. McCarthy is an “interested person” of the Company as defined in the 1940 Act by virtue of his employment relationship with KAFA. |
Additional information regarding the Company’s directors is contained in the Company’s Statement of Additional Information, the most recent version of which can be found on the Company’s website at http://www.kaynefunds.com or is available without charge, upon request, by calling (877) 657-3863.
53
KAYNE ANDERSON MLP INVESTMENT COMPANY
ANNUAL CERTIFICATION
(UNAUDITED)
The Company’s Chief Executive Officer has filed an annual certification with the NYSE that, as of the date of the certification, he was unaware of any violation by the Company of the NYSE’s corporate governance listing
standards.
PROXY VOTING AND PORTFOLIO HOLDINGS INFORMATION
(UNAUDITED)
The policies and procedures that the Company uses to determine how to vote proxies relating to its portfolio securities are available:
| | • | | without charge, upon request, by calling (877) 657-3863/MLP-FUND; |
| | • | | on the Company’s website, http://www.kaynefunds.com; and |
| | • | | on the SEC’s website, http://www.sec.gov. |
Information regarding how the Company voted proxies relating to portfolio securities during the most recent 12-month period ended June 30 is available without charge, upon request, by calling (877) 657-3863/MLP-FUND, and on the SEC’s website at http://www.sec.gov (see Form N-PX).
The Company files a complete schedule of its portfolio holdings for the first and third quarters of each of its fiscal years with the SEC on Form N-Q and Form N-30B-2. The Company’s Form N-Q and Form N-30B-2 are available on the SEC’s website at http://www.sec.gov and may be reviewed and copied at the SEC’s Public Reference Room in Washington, DC. Information on the operation of the SEC’s Public Reference Room may be obtained by calling 1-800-SEC-0330. The Company also makes its Form N-Q and Form N-30B-2 available on its website at http://www.kaynefunds.com.
REPURCHASE DISCLOSURE
(UNAUDITED)
Notice is hereby given in accordance with Section 23(c) of the 1940 Act, that the Company may from time to time purchase shares of its common and preferred stock and its Notes in the open market or in privately negotiated transactions.
54
| | |
| Directors and Corporate Officers | | |
| |
| Kevin S. McCarthy | | Chairman of the Board of Directors and Chief Executive Officer |
| |
| Anne K. Costin | | Director |
| |
| Steven C. Good | | Director |
| |
| Gerald I. Isenberg | | Director |
| |
| William H. Shea, Jr. | | Director |
| |
| James C. Baker | | President |
| |
| Terry A. Hart | | Chief Financial Officer and Treasurer |
| |
| David J. Shladovsky | | Secretary |
| |
| Michael J. O’Neil | | Chief Compliance Officer |
| |
| J.C. Frey | | Executive Vice President,
Assistant Secretary and Assistant Treasurer |
| |
| Ron M. Logan, Jr. | | Senior Vice President |
| |
| Jody C. Meraz | | Vice President |
| |
Investment Adviser
KA Fund Advisors, LLC
811 Main Street, 14th Floor
Houston, TX 77002 | | Administrator
Ultimus Fund Solutions, LLC
225 Pictoria Drive, Suite 450
Cincinnati, OH 45246 |
| |
1800 Avenue of the Stars, Third Floor
Los Angeles, CA 90067 | | Stock Transfer Agent and Registrar
American Stock Transfer & Trust Company, LLC
6201 15th Avenue
Brooklyn, NY 11219 (888) 888-0317 |
| |
Custodian
JPMorgan Chase Bank, N.A.
14201 North Dallas Parkway, Second Floor
Dallas, TX 75254 | | Independent Registered Public Accounting Firm
PricewaterhouseCoopers LLP
601 S. Figueroa Street, Suite 900
Los Angeles, CA 90017 |
| |
| | Legal Counsel
Paul Hastings LLP
55 Second Street, 24th Floor
San Francisco, CA 94105 |
Please visit us on the web at http://www.kaynefunds.com or call us toll-free at 1-877-657-3863.

This report, including the financial statements herein, is made available to stockholders of the Company for their information. It is not a prospectus, circular or representation intended for use in the purchase or sale of shares of the Company or of any securities mentioned in this report.
Item 2. Code of Ethics.
(a) As of the end of the period covered by this report, the Registrant has adopted a code of ethics that applies to the Registrant’s principal executive officer, principal financial officer, principal accounting officer or controller, or persons performing similar functions.
(c) and (d) During the period covered by this report, there was no amendment to, and no waiver, including implicit waiver, was granted from, any provision of the Registrant’s code of ethics that applies to the Registrant’s principal executive officer, principal financial officer, principal accounting officer or controller, or persons performing similar functions.
(f)(1) Pursuant to Item 12(a)(1), the Registrant is attaching as an exhibit (EX-99.CODE ETH) a copy of its code of ethics that applies to its principal executive officer, principal financial officer, principal accounting officer or controller, or persons performing similar functions.
Item 3. Audit Committee Financial Expert.
(a)(1) The Registrant’s board of directors has determined that the Registrant has one audit committee financial expert serving on its Audit Committee.
(a)(2) The audit committee financial expert is Steven C. Good. Mr. Good is “independent” for purposes of this Item.
Item 4. Principal Accountant Fees and Services.
(a) through (d) The information in the table below is provided for professional services rendered to the Registrant by its independent registered public accounting firm, PricewaterhouseCoopers LLP, during the Registrant’s (i) fiscal year ended November 30, 2016, and (ii) fiscal year ended November 30, 2015.
| | | | | | | | |
| | | 2016 | | | 2015 | |
Audit Fees | | $ | 180,600 | | | $ | 202,200 | |
Audit-Related Fees | | | 43,900 | | | | 49,900 | |
Tax Fees | | | 121,500 | | | | 104,300 | |
All Other Fees | | | — | | | | — | |
| | | | | | | | |
Total | | $ | 346,000 | | | $ | 356,400 | |
| | | | | | | | |
With respect to the table above, “Audit Fees” are the aggregate fees billed for professional services for the audit of the Registrant’s annual financial statements and services provided in connection with statutory and regulatory filings or engagements. “Audit-Related Fees” are the aggregate fees billed for assurance and related services reasonably related to the performance of the audit of the Registrant’s financial statements and are not reported under “Audit Fees.” “Tax Fees” are the aggregate fees billed for professional services for tax compliance, tax advice and tax planning.
(e)(1) Audit Committee Pre-Approval Policies and Procedures.
(i) Before the auditor is engaged by the Registrant to render audit, audit related or permissible non-audit services to the Registrant or (ii) with respect to non-audit services to be provided by the auditor to the Registrant’s investment adviser or any entity in the Registrant’s investment company complex, if the nature of the services provided relate directly to the operations or financial reporting of the Registrant, either: (a) the Audit Committee shall pre-approve such engagement; or (b) such engagement shall be entered into pursuant to pre-approval policies and procedures established by the Audit Committee. Any such policies and procedures must be detailed as to the particular service and not involve any delegation of the Audit Committee’s responsibilities to the Registrant’s investment adviser. The Audit Committee may delegate to one or more of its members the authority to grant pre-approvals. The pre-approval policies and procedures shall include the requirement that the decisions of any member to whom authority is delegated under this provision be presented to the full Audit Committee at its next scheduled meeting. Under certain limited circumstances, pre-approvals are not required if certain de minimis thresholds are not exceeded, as such thresholds are set forth by the Audit Committee and in accordance with applicable Securities and Exchange Commission rules and regulations.
(e)(2) None of the services provided to the Registrant described in paragraphs (b) through (d) of this Item 4 were pre-approved by the Audit Committee pursuant to paragraph (c)(7)(i)(C) of Rule 2-01 of regulation S-X.
(f) No disclosures are required by this Item 4(f).
(g) The aggregate non-audit fees billed by PricewaterhouseCoopers LLP for services rendered to the Registrant for the fiscal years ended November 30, 2016 and 2015 were $121,500 and $104,300, respectively. The aggregate non-audit fees billed by PricewaterhouseCoopers LLP totaled $4,516,000 and $3,497,000 for services rendered to the Registrant’s investment adviser and any entity controlling, controlled by, or under common control with the adviser that provides ongoing services to the Registrant for the fiscal years ended November 30, 2016 and 2015, respectively.
(h) The Registrant’s Audit Committee has considered the provision of non-audit services that were rendered to the Registrant’s investment adviser and any entity controlling, controlled by, or under common control with the investment adviser that provides ongoing services to the Registrant that were not pre-approved pursuant to paragraph (c)(7)(ii) of Rule 2-01 of Regulation S-X and has determined that the provision of such non-audit services is compatible with maintaining the Registrant’s principal accountant’s independence.
Item 5. Audit Committee of Listed Registrants.
The Registrant has a separately-designated standing audit committee established in accordance with Section 3(a)(58)(A) of the Securities and Exchange Act of 1934, as amended (the “Exchange Act”). Steven C. Good (Chair), Anne K. Costin, Gerald I. Isenberg and William H. Shea, Jr. are the members of the Registrant’s Audit Committee.
Item 6. Investments.
(a) Please see the Schedule of Investments contained in the KYN Annual Report for the fiscal year ended November 30, 2016 included under Item 1 of this Form N-CSR.
(b) Not applicable.
Item 7. Disclosure of Proxy Voting Policies and Procedures for Closed-End Management Investment Companies.
The Registrant has delegated the voting of proxies relating to its voting securities to its investment adviser, KA Fund Advisors, LLC (the “Adviser”). The respective proxy voting policies and procedures of the Registrant and the Adviser are attached as Exhibit 99.VOTEREG and Exhibit 99.VOTEADV hereto.
Item 8. Portfolio Managers of Closed-End Management Investment Companies.
(a)(1) As of the date of filing of this report, the following individuals (the “Portfolio Managers”) are primarily responsible for the day-to-day management of the Registrant’s portfolio:
Kevin S. McCarthy has served as the Registrant’s, Chief Executive Officer and co-portfolio manager since June 2004 and has served as the Chief Executive Officer and co-portfolio manager of Kayne Anderson Energy Total Return Fund, Inc. (“KYE”) since May 2005, of Kayne Anderson Energy Development Company (“KED”) since September 2006 and of Kayne Anderson Midstream/Energy Fund, Inc. (“KMF”) since November 2010. Mr. McCarthy has served as a Managing Partner of Kayne Anderson Capital Advisors, L.P. (“KACALP”) since June 2004 and Co-Managing Partner of the Adviser (together with KACALP, “Kayne Anderson”) since 2006. Prior to that, he was Global Head of Energy at UBS Securities LLC. In this role, he had senior responsibility for all of UBS’ energy investment banking activities. Mr. McCarthy was with UBS Securities from 2000 to 2004. From 1995 to 2000, Mr. McCarthy led the energy investment banking activities of Dean Witter Reynolds and then PaineWebber Incorporated. He began his investment banking career in 1984. He earned a BA degree in Economics and Geology from Amherst College in 1981, and an MBA degree in Finance from the University of Pennsylvania’s Wharton School in 1984.
J.C. Frey is the Registrant’s Executive Vice President (since June 2008) and Assistant Secretary, Assistant Treasurer and co-portfolio manager (since June 2004), Managing Partner of KACALP since 2004 and Co-Managing Partner of the Adviser since 2006. He serves as portfolio manager of Kayne Anderson’s various funds investing in master limited partnership (“MLP”) securities, including serving as a co-portfolio manager, Assistant Secretary and Assistant Treasurer of KYE since May 2005 and of KED since September 2006, Vice President of KYE from May 2005 through June 2008 and of KED from September 2006 through July 2008, Executive Vice President of KYE since June 2008 and of KED since July 2008 and Executive Vice President, Assistant Treasurer, Assistant Secretary and co-portfolio manager of KMF since November 2010. Mr. Frey began investing in MLPs on behalf of Kayne Anderson in 1998 and has served as portfolio manager of Kayne Anderson’s MLP funds since their inception in 2000. In addition to the closed-end funds, Mr. Frey manages approximately $5 billion in assets in MLPs and midstream companies and other Kayne Anderson energy funds. Prior to joining Kayne Anderson in 1997, Mr. Frey was a CPA and audit
2
manager in KPMG Peat Marwick’s financial services group, specializing in banking and finance clients and loan securitizations. Mr. Frey graduated from Loyola Marymount University with a BS degree in Accounting in 1990. In 1991, he received a Master’s degree in Taxation from the University of Southern California.
(a)(2)(i) and (ii) Other Accounts Managed by Portfolio Managers:
The following table reflects information regarding accounts for which the Portfolio Managers have day-to-day management responsibilities (other than the Registrant). Accounts are grouped into three categories: (i) registered investment companies, (ii) other pooled investment vehicles, and (iii) other accounts, and include accounts that pay advisory fees based on account performance shown in the separate table below under (a)(2)(iii). Information is shown as of November 30, 2016. Asset amounts are approximate and have been rounded.
| | | | | | | | | | | | | | | | | | | | | | | | | | | | |
| | | Registered
Investment Companies
(excluding the Registrant) | | | Other Pooled
Investment Vehicles | | | Other Accounts | |
Portfolio Manager | | Number of
Accounts | | | Total Assets
in the Accounts
($ in millions) | | | Number of
Accounts | | | Total Assets
in the Accounts
($ in millions) | | | Number of
Accounts | | | Total Assets
in the Accounts
($ in millions) | |
Kevin S. McCarthy | | | 3 | | | $ | 1,529 | | | | 2 | | | | | | | $ | 508 | | | | 12 | | | $ | 347 | |
J.C. Frey | | | 5 | | | $ | 1,994 | | | | 12 | | | | | | | $ | 3,066 | | | | 16 | | | $ | 1,119 | |
(a)(2)(iii) Other Accounts that Pay Performance-Based Advisory Fees Managed by Portfolio Managers:
The following table reflects information regarding accounts for which the Portfolio Managers have day-to-day management responsibilities (other than the Registrant) and with respect to which the advisory fee is based on the performance of the account. Information is shown as of November 30, 2016. Asset amounts are approximate and have been rounded.
| | | | | | | | | | | | | | | | | | | | | | | | |
| | | Registered
Investment Companies
(excluding the Registrant) | | | Other Pooled
Investment Vehicles | | | Other Accounts | |
Portfolio Manager | | Number of
Accounts | | | Total Assets
in the Accounts
($ in millions) | | | Number of
Accounts | | | Total Assets
in the Accounts
($ in millions) | | | Number of
Accounts | | | Total Assets
in the Accounts
($ in millions) | |
Kevin S. McCarthy | | | — | | | | N/A | | | | 2 | | | $ | 508 | | | | 12 | | | $ | 347 | |
J.C. Frey | | | — | | | | N/A | | | | 10 | | | $ | 2,942 | | | | 4 | | | $ | 347 | |
(a)(2)(iv) Potential Material Conflicts of Interest:
Some of the other accounts managed by Messrs. McCarthy and Frey have investment strategies that are similar to those of the Registrant. However, Kayne Anderson manages potential conflicts of interest by allocating investment opportunities in accordance with its written allocation policies and procedures.
(a)(3) Compensation of Each Portfolio Manager:
As of November 30, 2016, Messrs. McCarthy and Frey are compensated by Kayne Anderson through partnership distributions from Kayne Anderson, based on the amount of assets they manage, and they receive a portion of the advisory fees applicable to those accounts (including the Registrant), which, with respect to certain accounts (not including the Registrant), as noted above, are based in part on the performance of those accounts.
Additional benefits received by Messrs. McCarthy and Frey are normal and customary benefits generally available to all salaried employees.
(a)(4) As of November 30, 2016, the end of the Registrant’s most recently completed fiscal year, the dollar range of equity securities beneficially owned by each Portfolio Manager in the Registrant is shown below:
3
Kevin S. McCarthy: over $1,000,000
J.C. Frey: over $1,000,000
Through their limited partnership interests in KACALP, which owns shares of Registrant’s common stock, Messrs. McCarthy and Frey could be deemed to also indirectly own a portion of the Registrant’s equity securities.
(b) Not applicable.
Item 9. Purchases of Equity Securities by Closed-End Management Investment Company and Affiliated Purchasers.
None.
Item 10. Submission of Matters to a Vote of Security Holders.
None.
Item 11. Controls and Procedures.
(a) The Registrant’s principal executive officer and principal financial officer have evaluated the Registrant’s disclosure controls and procedures (as defined in Rule 30a-3(c) under the Investment Company Act of 1940, as amended (the “1940 Act”)), as of a date within 90 days of the filing of this report and have concluded that the Registrant’s disclosure controls and procedures are effective, as of such date, based on the evaluation of these controls and procedures required by Rule 30a-3(b) under the 1940 Act and
Rule 13a-15(b) or 15d-15(b) under the Exchange Act.
(b) There have been no changes in the Registrant’s internal control over financial reporting (as defined in Rule 30a-3(d) under the 1940 Act) that occurred during the second fiscal quarter of the period covered by this report that have materially affected, or are reasonably likely to materially affect, the Registrant’s internal control over financial reporting.
Item 12. Exhibits.
(a)(1) Code of Ethics attached hereto as EX-99.CODE ETH.
(a)(2) Separate certifications of Principal Executive and Principal Financial Officers of the Registrant pursuant to Section 302 of the Sarbanes-Oxley Act of 2002 attached hereto as EX-99.CERT.
(b) Certification of Principal Executive and Principal Financial Officers of the Registrant pursuant to Section 906 of the Sarbanes-Oxley Act of 2002 attached hereto as EX-99.906 CERT.
(99) Proxy Voting Policies of the Registrant attached hereto as EX-99.VOTEREG.
(99) Proxy Voting Policies of the Adviser attached hereto as EX-99.VOTEADV.
4
SIGNATURES
Pursuant to the requirements of the Securities Exchange Act of 1934 and the Investment Company Act of 1940, the Registrant has duly caused this report to be signed on its behalf by the undersigned, thereunto duly authorized.
| | | | | | |
| | | | KAYNE ANDERSON MLP INVESTMENT COMPANY |
| | | |
| | | | By: | | /S/ KEVIN S. MCCARTHY |
| | | | | | Kevin S. McCarthy |
| | | | | | Chairman of the Board of Directors and Chief Executive Officer |
| Date: January 27, 2017 | | | | | | |
Pursuant to the requirements of the Securities Exchange Act of 1934 and the Investment Company Act of 1940, this report has been signed below by the following persons on behalf of the Registrant and in the capacities and on the dates indicated.
| | | | | | |
| | | | By: | | /S/ KEVIN S. MCCARTHY |
| | | | | | Kevin S. McCarthy |
| | | | | | Chairman of the Board of Directors and Chief Executive Officer |
| Date: January 27, 2017 | | | | | | |
| | | |
| | | | By: | | /S/ TERRY A. HART |
| | | | | | Terry A. Hart |
| | | | | | Chief Financial Officer and Treasurer |
| Date: January 27, 2017 | | | | | | |
Exhibit Index
(a)(1) Code of Ethics attached hereto as EX-99.CODE ETH.
(a)(2) Separate certifications of Principal Executive and Principal Financial Officers of the Registrant pursuant to Section 302 of the Sarbanes-Oxley Act of 2002 attached hereto as EX-99.CERT.
(b) Certification of Principal Executive and Principal Financial Officers of the Registrant pursuant to Section 906 of the Sarbanes-Oxley Act of 2002 attached hereto as EX-99.906 CERT.
(99) Proxy Voting Policies of the Registrant attached hereto as EX-99.VOTEREG.
(99) Proxy Voting Policies of the Adviser attached hereto as EX-99.VOTEADV.