As filed with the Securities and Exchange Commission on April 4, 2018
File No. 333-218392
UNITED STATES
SECURITIES AND EXCHANGE COMMISSION
Washington, D.C. 20549
SECURITIES AND EXCHANGE COMMISSION
Washington, D.C. 20549
___________________
POST-EFFECTIVE AMENDMENT NO. 1
TO
FORM S-1
REGISTRATION STATEMENT
TO
FORM S-1
REGISTRATION STATEMENT
Under
The Securities Act of 1933
The Securities Act of 1933
___________________
OPGEN, INC.
(Exact name of registrant as specified in its charter)
(Exact name of registrant as specified in its charter)
Delaware (State or other jurisdiction of incorporation or organization) | 8071 (Primary Standard Industrial Classification Code Number) | 06-1614015 (I.R.S. Employer Identification Number) |
708 Quince Orchard Road, Suite 205
Gaithersburg, MD 20878
(240) 813-1260
(Address, including zip code, and telephone number, including area code, of registrant's principal executive offices)
Gaithersburg, MD 20878
(240) 813-1260
(Address, including zip code, and telephone number, including area code, of registrant's principal executive offices)
___________________
Evan Jones
Chief Executive Officer
708 Quince Orchard Road
Gaithersburg, MD 20878
(301) 869-9683
(Name, address, including zip code, and telephone number, including area code, of agent for service)
___________________
Copies to:
Mary J. Mullany, Esq. Ballard Spahr LLP 1735 Market Street 51st Floor Philadelphia, PA 19103 (215) 665-8500 |
___________________
Approximate date of commencement of proposed sale to the public: As soon as practicable after the effective date of this registration statement.
If any of the securities being registered on this Form are to be offered on a delayed or continuous basis pursuant to Rule 415 under the Securities Act of 1933, as amended, check the following box. ☒
If this Form is filed to register additional securities for an offering pursuant to Rule 462(b) under the Securities Act, please check the following box and list the Securities Act registration statement number of the earlier effective registration statement for the same offering. ☐
If this Form is a post-effective amendment filed pursuant to Rule 462(c) under the Securities Act, check the following box and list the Securities Act registration statement number of the earlier effective registration statement for the same offering. ☐
If this Form is a post-effective amendment filed pursuant to Rule 462(d) under the Securities Act, check the following box and list the Securities Act registration statement number of the earlier effective registration statement for the same offering. ☐
Indicate by check mark whether the registrant is a large accelerated filer, an accelerated filer, a non-accelerated filer, or a smaller reporting company. See the definitions of "large accelerated filer," "accelerated filer," "smaller reporting company" and "emerging growth company" in Rule 12b-2 of the Exchange Act.
Large Accelerated Filer ☐ | Accelerated Filer ☐ |
Non-Accelerated Filer ☐ | Smaller Reporting Company ☒ |
Emerging Growth Company ☒ |
If an emerging growth company, indicate by check mark if the registrant has elected not to use the extended transition period for complying with any new or revised financial accounting standards provided to Section 7(a)(2)(B) of the Securities Act. ☐
___________________
The registrant hereby amends this registration statement on such date or dates as may be necessary to delay its effective date until the registrant shall file a further amendment which specifically states that this registration statement shall thereafter become effective in accordance with Section 8(a) of the Securities Act of 1933 or until this registration statement shall become effective on such date as the Commission, acting pursuant to said Section 8(a), may determine.
EXPLANATORY NOTE
This Post-Effective Amendment No. 1 to Form S-1 Registration Statement contains an updated prospectus relating to the continued offering and sale of common stock issuable upon the exercise of common warrants that were issued by OpGen, Inc. to investors in connection with the registrant's July 2017 public offering of units and pre-funded units. Each unit consisted of one-twenty-fifth of a share of common stock and one common warrant to purchase one-twenty-fifth of a share of common stock, or a common warrant. In addition, the registrant issued warrants to H.C. Wainwright & Co., the placement agent in the public offering, or the placement agent warrants, each of which is exercisable to purchase one-twenty-fifth of a share of common stock at an exercise price of $12.50 per share. The common warrants and the placement agent warrants were all initially registered by the registrant on the Registration Statement on Form S-1 (File No. 333-218392) declared effective by the Securities and Exchange Commission on July 12, 2017. All filing fees payable in connection with the registration of the shares issuable upon exercise of such warrants were previously paid in connection with the filing of the original registration statement.
The information in this preliminary prospectus is not complete and may be changed. We may not sell these securities until the registration statement filed with the Securities and Exchange Commission is effective. This preliminary prospectus is not an offer to sell nor does it seek an offer to buy these securities in any jurisdiction where the offer or sale is not permitted.
Subject to Completion: Dated April 4, 2018
Preliminary Prospectus
1,050,000 shares of Common Stock isssuable upon the exercise of warrants
___________________
This prospectus relates to up to 1,050,000 shares of common stock which are issuable upon the exercise of outstanding common warrants and placement agent warrants issued in our public offering of units, pre-funded units and placement agent warrants which closed on July 18, 2017, pursuant to a prospectus dated July 14, 2017.
Each common warrant is exercisable into one-twenty-fifth of a share of common stock, at an exercise price of $10.625 per share, collectively, the common warrants. Common warrants became exercisable on July 18, 2017, the date of issuance, and will remain exercisable for five years from the issuance date. Each warrant to purchase one-twenty-fifth of a share of common stock issued to the placement agent, or collectively, the placement agent warrants, became exercisable on July 18, 2017, the date of issuance, and will remain exercisable for five years from the issuance date at an exercise price of $12.50 per share.
We will receive all of the proceeds from the exercise for cash of the common warrants and the placement agent warrants, which are referred to collectively as the warrants in this prospectus.
Our common stock is listed on the Nasdaq Capital Market under the symbol "OPGN." On April 2, 2018, the last reported sale price of our common stock on the Nasdaq Capital Market was $1.68 per share. We will not apply for listing of any of the warrants on any securities exchange or other nationally recognized trading system. There is no established public trading market for any of the warrants, and we do not expect a market to develop.
Following receipt of approval from stockholders at a special meeting of stockholders held on January 17, 2018, we filed an amendment to our Amended and Restated Certificate of Incorporation to effect a reverse stock split of the issued and outstanding shares of our common stock, at a ratio of one share for twenty-five shares, and to reduce the authorized shares of our common stock from 200,000,000 to 50,000,000 shares. All share and per share prices in this prospectus have been adjusted to reflect the reverse stock split.
We are an "emerging growth company" as the term is used in the Jumpstart Our Business Startups Act of 2012 and, as such, we have elected to comply with certain reduced public company reporting requirements for this prospectus and future filings. See
"Prospectus Summary - Implications of Being an Emerging Growth Company."
Investing in our common stock involves a high degree of risk. See "Risk Factors" beginning on page 13.
__________________
Neither the Securities and Exchange Commission nor any state securities commission has approved or disapproved of these securities or passed upon the accuracy or adequacy of this prospectus. Any representation to the contrary is a criminal offense.
___________________
Prospectus dated
TABLE OF CONTENTS
| Page | |
| PROSPECTUS SUMMARY | 1 |
| THE OFFERING | 8 |
| SUMMARY FINANCIAL DATA | 11 |
| RISK FACTORS | 13 |
| INFORMATION REGARDING FORWARD-LOOKING STATEMENTS | 39 |
| USE OF PROCEEDS | 40 |
| CAPITALIZATION | 41 |
| DILUTION | 43 |
| PRICE RANGE FOR OUR COMMON EQUITY AND RELATED SHAREHOLDER MATTERS | 44 |
| DESCRIPTION OF CAPITAL STOCK | 46 |
| DESCRIPTION OF SECURITIES WE ARE OFFERING | 50 |
| PLAN OF DISTRIBUTION | 54 |
| MANAGEMENT'S DISCUSSION AND ANALYSIS OF FINANCIAL CONDITION AND RESULTS OF OPERATIONS | 56 |
| BUSINESS | 64 |
| MANAGEMENT | 88 |
| EXECUTIVE COMPENSATION | 91 |
| CERTAIN RELATIONSHIPS AND RELATED PERSON TRANSACTIONS | 99 |
| SECURITY OWNERSHIP OF CERTAIN BENEFICIAL OWNERS | 101 |
| LEGAL MATTERS | 102 |
| EXPERTS | 102 |
| WHERE YOU CAN FIND ADDITIONAL INFORMATION | 102 |
| OPGEN, INC. INDEX TO AUDITED CONSOLIDATED FINANCIAL STATEMENTS | F-1 |
You should rely only on the information contained in this prospectus. We have not authorized any person to provide you with different information. If anyone provides you with different or inconsistent information, you should not rely on it. This prospectus is not an offer to sell securities in any state where the offer or solicitation is not permitted. The information contained in this prospectus is complete and accurate as of the date on the front cover of this prospectus, but information may have changed since that date. We are responsible for updating this prospectus to ensure that all material information is included and will update this prospectus to the extent required by law.
This prospectus includes statistical and other industry and market data that we obtained from industry publications and research, surveys and studies conducted by third parties. Industry publications and third-party research, surveys and studies generally indicate that their information has been obtained from sources believed to be reliable, although they do not guarantee the accuracy or completeness of such information. While we believe that these industry publications and third-party research, surveys and studies are reliable, we have not independently verified such data and we do not make any representation as to the accuracy of the information.
We own various U.S. federal trademark registrations and applications and unregistered trademarks and servicemarks, including OpGen®, Acuitas®, Acuitas Lighthouse® Argus®, AdvanDx®, QuickFISH® and PNA FISH®. All other trademarks, servicemarks or trade names referred to in this prospectus are the property of their respective owners. Solely for convenience, the trademarks and trade names in this prospectus are sometimes referred to without the ® and ™ symbols, but such references should not be construed as any indicator that their respective owners will not assert, to the fullest extent under applicable law, their rights thereto. We do not intend the use or display of other companies' trademarks and trade names to imply a relationship with, or endorsement or sponsorship of us by, any other companies, products or services.
PROSPECTUS SUMMARY
This summary highlights information contained in greater detail elsewhere in this prospectus. This summary is not complete and does not contain all of the information you should consider in making your investment decision. You should read the entire prospectus carefully before making an investment in our common stock. You should carefully consider, among other things, our financial statements and the related notes and the sections entitled "Risk Factors" and "Management's Discussion and Analysis of Financial Condition and Results of Operations" included elsewhere in this prospectus. When we refer to OpGen, Inc. we use the terms "OpGen," "the registrant," "the Company," "us," "we" and "our."
Please refer to the Glossary on page 85 of this prospectus for definitions of scientific, health care, regulatory and OpGen-specific terms used in this prospectus.
Overview
We are a precision medicine company using molecular diagnostics and informatics to help combat infectious disease. We are developing molecular information products and services for global healthcare settings, helping to guide clinicians with more rapid and actionable information about life threatening infections, improve patient outcomes, and decrease the spread of infections caused by multidrug-resistant microorganisms, or MDROs. Our proprietary DNA tests and informatics address the rising threat of antibiotic resistance by helping physicians and other healthcare providers optimize care decisions for patients with acute infections.
Our molecular diagnostics and informatics offerings combine our Acuitas® DNA tests and Acuitas Lighthouse® informatics platform for use with our proprietary, curated MDRO knowledgebase. We are working to deliver our products and services, some in development, to a global network of customers and partners.
| · | Our Acuitas DNA tests provide rapid microbial identification and antibiotic resistance gene information. These products include our Acuitas antimicrobial resistance, or AMR, Gene Panel u5.47 for complicated urinary tract infections in development as a clinical diagnostic test and available for Research Use Only, the QuickFISH® family of FDA-cleared and CE-marked diagnostics used to rapidly detect pathogens in positive blood cultures, and our Acuitas Resistome Tests for genetic analysis of hospital surveillance isolates. |
| · | Our Acuitas Lighthouse informatics systems are cloud-based HIPAA compliant informatics offerings that combine clinical lab test results with patient and hospital information to provide analytics and actionable insights to help manage MDROs in the hospital and patient care environment. Components of our informatics systems include the Acuitas Lighthouse Knowledgebase and the Acuitas Lighthouse Software. The Acuitas Lighthouse Knowledgebase is a relational database management system and a proprietary data warehouse of genomic data matched with antibiotic susceptibility information for bacterial pathogens. The Acuitas Lighthouse Software system includes the Acuitas Lighthouse Portal, a suite of web applications and dashboards, the Acuitas Lighthouse Prediction Engine, which is a data analysis software, and other supporting software components. The Acuitas Lighthouse Software can be customized and made specific to a healthcare facility or collaborator, such as a pharmaceutical company. |
We have established a number of collaborative arrangements to support execution of our business strategy as we work to address the more than $2 billion potential market for precision medicine MDRO solutions. Our relationship with Merck & Co., Inc. includes investment from Merck Global Health Innovation Fund, or MGHIF, and a research collaboration with Merck Sharp & Dohme, or MSD, to provide access to MSD's 250,000 clinical isolate SMART bacterial surveillance archive. In December 2017, we entered into a subcontractor agreement with ILÚM Health Solutions, LLC, an entity created by Merck's Healthcare Services and Solutions division, whereby ILÚM Health Solutions will provide services to the Company in the performance of the Company's CDC contract to deploy ILÚM's commercially-available cloud- and mobile-based software platform for infectious disease management in up to three medical sites in Colombia with the aim of improving antibiotic use in resource-limited settings.
1
In June 2017, we entered into a global supply agreement to provide customer access to Thermo Fisher Scientific's products to support the commercialization of our Acuitas Rapid Test and Acuitas Lighthouse Software products in development to combat MDROs. We have worked closely with Intermountain Healthcare, or IHC, a leading integrated health system, to complete a comprehensive retrospective study to evaluate the burden and costs of antibiotic resistance at IHC. We are working to expand these established relationships and to enter into additional collaborative arrangements in the future.
We believe more rapid genetic identification methods will reduce morbidity from MDROs, reduce healthcare costs through reduced length of stay, and assist in the identification of targeted antibiotic therapy. Current conventional microbiology, largely unchanged in 50 years, requires one to two days for growth and phenotypic analysis and often leads to the use of broad spectrum antibiotic therapy in the early stages of infection.
We are developing a new high resolution AMR Gene Panel designed to determine pathogen levels in clinical specimens and the key drug resistance gene profiles of Gram-negative organisms. Following completion of our research and development efforts and receipt of appropriate regulatory approvals, we anticipate the AMR Gene Panel will be used in the clinical setting to provide pathogen and antibiotic resistance gene information to aid in decision-making for patients with complicated urinary tract infections, or cUTI, lower respiratory tract infections, and blood stream infections.
Lead Rapid Diagnostic and Acuitas Lighthouse Software
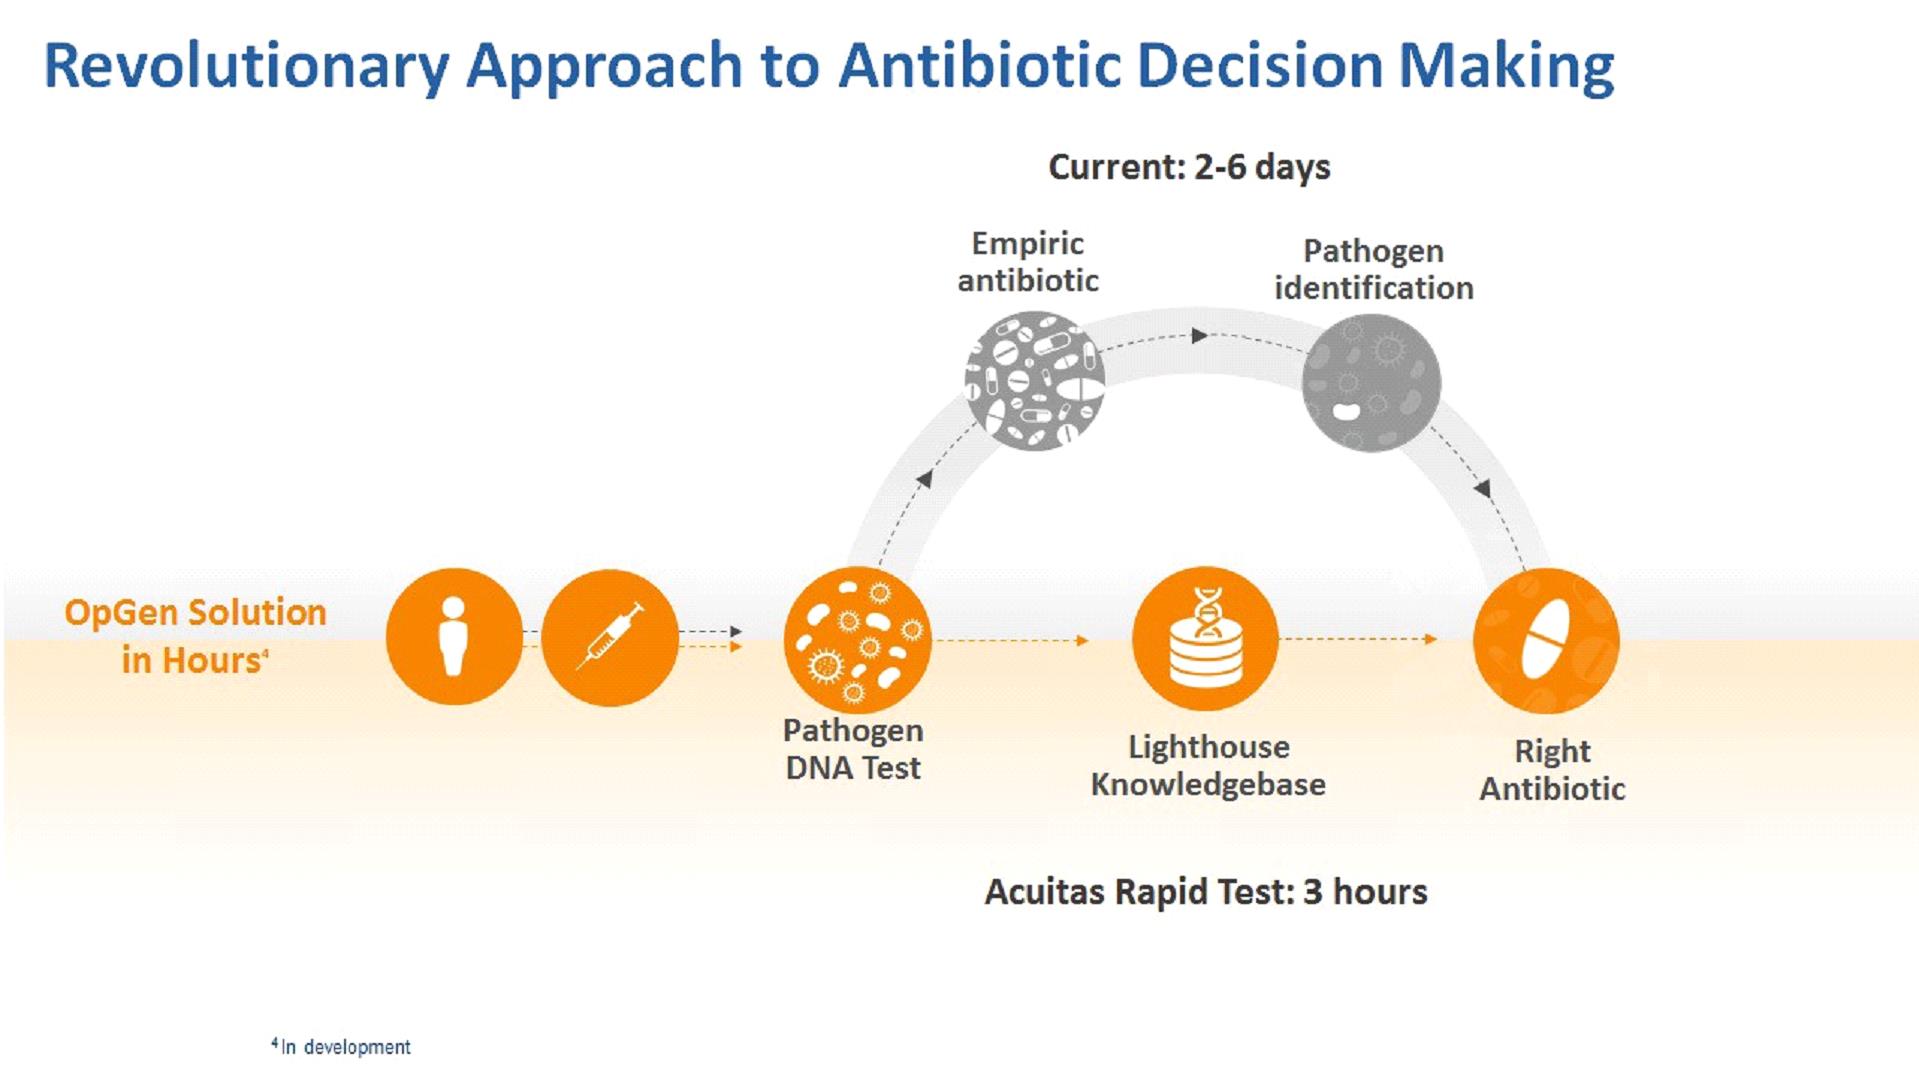
Our lead product in development is the Acuitas AMR Gene Panel u5.47 for patients at risk for cUTI. The AMR Gene Panel u5.47 is a direct test that will be able to be performed in under three hours to identify five pathogens associated with urinary tract infections and their levels and 47 genes associated with antibiotic resistance. We anticipate that the Acuitas Lighthouse Software will be used to provide additional interpretation of test results including probability of resistance for fourteen antibiotics commonly used to treat cUTI. Approximately 10,000 bacterial isolates from the Merck SMART surveillance network and other sources have been tested and added to the Acuitas Lighthouse Knowledgebase to support development and use of the Acuitas Lighthouse Software antibiotic resistance prediction decision-making algorithms. Preliminary performance data for E. coli and K. pneumonia in our Acuitas Lighthouse Software algorithms was presented at the ASM Microbe meeting in June 2017. Accuracy of prediction ranged from 77% to 96%. These data and additional data from our research combined with the anticipated results from the AMR Gene Panel u5.47 support the potential for the Acuitas Lighthouse Software to provide actionable antibiotic resistance prediction information directly from clinical specimens in under three hours. The figure below describes the potential workflow and anticipated results from our new testing approach.
Current Diagnostic Tests and Informatics Offerings
Our suite of DNA-based products and products in development are intended to provide actionable, precise diagnostic information supported by the proprietary genomic Acuitas Lighthouse Knowledgebase to facilitate data interpretation. The Acuitas DNA tests use multiplex PCR to help provide reliable and accurate detection of drug resistance. The QuickFISH tests are powered by PNA technology and provide rapid pathogen identification, typically in less than 30 minutes from a positive blood culture result. The Acuitas MDRO Gene Test is used for determining if acute care patients are colonized with MDROs. Positive samples are confirmed using microbiological methods and the Acuitas Resistome Test for high resolution genotyping. Test results are maintained in the Acuitas Lighthouse data warehouse for subsequent interpretation by physicians and healthcare providers.
2
Our Strategy
We are using our current product and service offerings, and will use our products in development to build and commercialize a comprehensive precision medicine solution for combatting infectious disease with a focus on developing diagnostic tests for rapid pathogen identification and genetic profiling, antibiotic resistance analysis and advanced informatics to store and analyze MDRO and other infectious disease data for hospitals, out-patient settings and other healthcare providers.
The two core components of our strategy are development and commercialization of rapid diagnostic tests and leveraging our Acuitas Lighthouse information services into new markets and channels.
| · | Rapid diagnostics – We are developing OpGen-branded Acuitas AMR Gene Panel tests for use on the Thermo Fisher Scientific Applied Biosystems™ QuantStudio™ 5 Real-Time PCR System. The first of these new tests will be for management of patients with cUTI. We anticipate developing tests for additional clinical indications such as lower respiratory tract infections and for new antibiotic decision- making applications. The second rapid diagnostics growth driver will be through strategic partner relationships where we will work to expand channel access for our proprietary DNA tests through development and subsequent use of these tests, utilizing the Acuitas Lighthouse Software on established rapid in vitro diagnostic testing platforms. |
| · | Acuitas Lighthouse informatics and services – We are pursuing commercial opportunities to provide our Acuitas Lighthouse informatics and companion genomic testing to pharmaceutical companies and CROs, health systems, third party in vitro diagnostic companies, and government agencies. Through our Pharmaceutical/CRO services we are working to help accelerate clinical trials and new product launches and to establish early access for diagnostic tests to help guide decision-making for new antibiotics. Our focus in the health system segment is on helping guide antibiotic decision-making and supporting patient safety initiatives. We are actively pursuing government funding for development and deployment of our Acuitas Lighthouse informatics in the United States and internationally. |
In support of our strategy we are working to:
| · | complete development, clinical evaluations, obtain necessary regulatory approvals, and successfully commercialize our AMR Gene Panel u5.47 for cUTI with a goal of achieving three-hour antibiotic resistance analysis from the time of specimen collection; |
| · | continue clinical evaluations for the AMR Gene Panel u5.47 in the first half of 2018; in January 2018 we introduced the AMR Gene Panel u5.47 as an RUO test and have a goal of making a FDA 510(k) submission in the fourth quarter of 2018 to support commercial launch; |
| · | obtain third party funding to expand our AMR Gene Panel development and access to additional third party rapid testing platforms; |
| · | expand our business collaborations with Merck and other pharmaceutical companies; |
| · | capitalize on opportunities to deploy our Acuitas Lighthouse informatics and genomic testing for pharmaceutical/CRO services; |
| · | grow our Acuitas Lighthouse data warehouse offerings for resistance and susceptibility data in hospital, hospital system, or broader community applications through continued development of the Acuitas Lighthouse Knowledgebase; |
| · | seek government funding to advance programs focused on identification and treatment of MDROs; and |
| · | continue development of our Acuitas Lighthouse Software and work to install Acuitas Lighthouse Software to customer sites in the United States and globally. |
3
Molecular Information Business
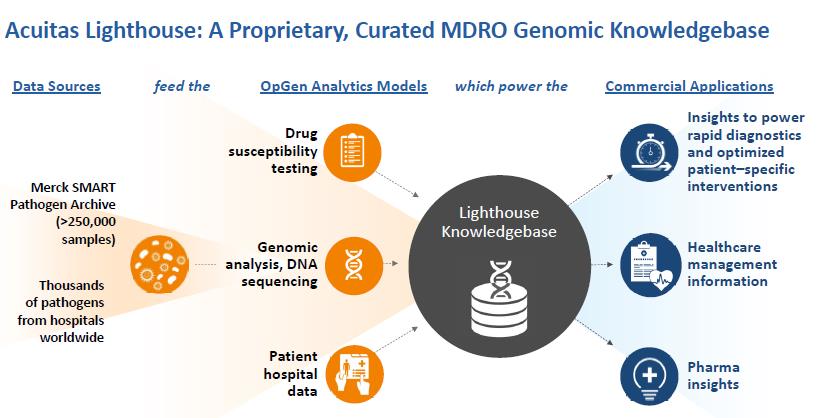
We are working to build a unique and highly proprietary molecular information business. Our approach combines FDA-cleared and CE-marked rapid diagnostics and CLIA lab-based MDRO surveillance tests with our Acuitas Lighthouse Software. We are developing an integrated solution based on a genomic knowledgebase of drug-resistant pathogens. Our approach involves sourcing thousands of pathogens from hospitals worldwide and completing genomic analysis including DNA sequencing and drug susceptibility testing of each individual pathogen. These data are combined along with hospital patient data and other information in our Acuitas Lighthouse Knowledgebase. We anticipate using this information and insights we derive from it to help power our rapid diagnostic products, healthcare management solutions and new applications to support pharmaceutical companies.
The lead products from our initial development work are the Acuitas AMR Gene Panel u5.47, which is in development as a clinical diagnostic for complicated urinary tract infections and clinical isolates and was released as a ROU product in the first quarter of 2018, and the Acuitas Lighthouse Software for managing and evaluating results from the AMR Gene Panel test. In conjunction with these development programs we have added and tested approximately 9,500 bacterial isolates from the SMART pathogen archive and added the results to the Lighthouse Knowledgebase which includes data from 15,000 bacterial isolates. In the future we anticipate developing additional AMR Gene Panel tests and expanding our software offerings.
Recent Developments
February 2018 Public Offering
On February 6, 2018, we closed a public offering, or the February 2018 Public Offering, of 2,841,152 units at $3.25 per unit, and 851,155 pre-funded units at $3.24 per pre-funded unit, raising gross proceeds of approximately $12 million and net proceeds of approximately $10.7 million. Each unit included one share of common stock and one common warrant to purchase 0.5 share of common stock at an exercise price of $3.25 per share. Each pre-funded unit included one pre-funded warrant to purchase one share of common stock for an exercise price of $0.01 per share, and one common warrant to purchase 0.5 share of common stock at an exercise price of $3.25 per share. The common warrants were exercisable immediately upon issuance and have a five-year term from the date of issuance.
Reverse Stock Split
On January 17, 2018, at a special meeting of stockholders, our stockholders approved an amendment to our Amended and Restated Certificate of Incorporation, authorizing a reverse stock split of the issued and outstanding shares of our common stock, at a ratio within a range of two-to-one and not more than twenty-five-to-one, such ratio and the implementation and timing of such reverse stock split to be determined in the discretion of our Board of Directors, and to reduce the authorized shares of common stock to 50,000,000 shares. On January 17, 2018, our Board of Directors approved a reverse stock split of one share for twenty-five outstanding shares, or the Reverse Stock Split, and we filed an Amendment to our Amended and Restated Certificate of Incorporation to effect the Reverse Stock Split and reduce our authorized shares of common stock to 50,000,000.
4
On June 20, 2017, we received a notice from the Listing Qualifications Staff of the Nasdaq Stock Market LLC, or Nasdaq, notifying us that, based upon the closing bid price of our common stock for the last 30 consecutive business days, we no longer met the requirement to maintain a minimum closing bid price of $1.00 per share, as set forth in Nasdaq Listing Rule 5550(a)(2). In accordance with Nasdaq Listing Rule 5810(c)(3)(A), we had a period of 180 calendar days to regain compliance with the rule. On December 21, 2017, the Company received written notification, or the December Notice, from the Listing Qualifications Staff of Nasdaq, or the Staff, indicating that, based upon (i) the Company's continued non-compliance with the minimum bid price rule and (ii) the Company's inability to meet The Nasdaq Capital Market initial listing requirements, specifically maintaining a minimum of stockholders' equity, the Staff had determined that the Company was not eligible for an additional 180 day extension to meet the minimum bid price rule.
As a result, the Staff had determined to delist the Company's securities from Nasdaq, effective January 2, 2018, unless the Company timely requested a hearing before the Nasdaq Hearings Panel, or the Panel. On December 21, 2017, the Company submitted a request for a hearing before the Panel, which request stayed any suspension or delisting action by Nasdaq at least until the hearing process concludes and any extension granted by the Panel expires. An oral hearing has been scheduled for February 8, 2018.
Following the Reverse Stock Split and the closing of our February 2018 Public Offering, we received confirmation from Nasdaq that we had regained compliance with the continued listing standards, and the need for a hearing was moot. The Company's common stock will continue to trade on the Nasdaq Capital Market under the symbol "OPGN" and the listed common stock warrants will continue to trade on the Nasdaq Capital Market under the symbol "OPGNW."
CDC Contract
In October 2017, the Company announced that it was awarded a contract from the Centers for Disease Control and Prevention, or CDC, to develop smartphone-based clinical decision support solutions for antimicrobial stewardship, or AMS, and infection control in low- and middle-income countries. The one-year $860,000 award began September 30, 2017 and funds development and evaluation of cloud-based mobile software. The Company will work with partners ILÚM Health Solutions and Universidad El Bosque, or UEB, of Bogota, Colombia. The Company's teaming partner ILÚM will is providing its cloud- and mobile-based software platform, which integrates electronic patient data and local empiric treatment guidelines to support antimicrobial stewardship. The ILÚM platform is state-of-the-art mobile AMS software that is commercially available and in use in major medical centers. The mobile platform will be extended to quickly identify patients requiring infection control precautions, assist with the implementation of appropriate precautions, and assist with the collection and tracking of indicators for monitoring implementation of infection control precautions. The software will be translated to Spanish and will support WHONET data integration. WHONET is an information system developed to support the World Health Organization's goal of global surveillance of bacterial resistance to antimicrobial agents. WHONET analyzes the data of over 4,000 laboratories worldwide and is used in more than 120 countries.
July 2017 Public Offering
On July 18, 2017, we closed a public offering of 18,164,195 units at $0.40 per unit, and 6,835,805 pre‑funded units at $0.39 per pre-funded unit, raising gross proceeds of approximately $10 million and net proceeds of approximately $8.8 million, or the July 2017 Public Offering. jVen Capital, LLC, or jVen Capital, an affiliate of Evan Jones, the Chairman of our Board of Directors and Chief Executive Officer, and three of our employees participated in the July 2017 Public Offering. Each unit included one twenty-fifth of a share of common stock and one common warrant to purchase one twenty-fifth of a share of common stock at an exercise price of $10.625 per share. Each pre-funded unit included one pre-funded warrant to purchase one twenty-fifth of a share of common stock for an exercise price of $0.25 per share, and one common warrant to purchase one twenty-fifth of a share of common stock at an exercise price of $10.625 per share. The common warrants are exercisable immediately and have a five-year term from the date of issuance. As of the date of this prospectus, all of the pre-funded warrants have been exercised.
5
ATM Offering
In August 2016, the Company filed a shelf registration statement on Form S-3 registering $50 million of common stock for future offerings. The shelf registration statement was declared effective by the SEC on September 9, 2016.
On September 13, 2016, we entered into the Sales Agreement with Cowen and Company, LLC, or Cowen, pursuant to which we may offer and sell from time to time, up to an aggregate of $25 million of shares of our common stock through Cowen, as sales agent, with initial sales limited to an aggregate of $11.5 million. Pursuant to the Sales Agreement, Cowen may sell the shares of common stock by any method permitted by law deemed to be an "at-the-market" offering as defined in Rule 415 of the Securities Act, including, without limitation, sales made by means of ordinary brokers' transactions on the Nasdaq Capital Market or otherwise at market prices prevailing at the time of sale, in block transactions, or as otherwise directed by the Company. We pay Cowen compensation equal to 3.0% of the gross proceeds from the sales of common stock pursuant to the terms of the Sales Agreement. As of December 31, 2017, we have sold an aggregate of approximately 372 thousand shares of our common stock under this at-the-market offering resulting in aggregate net proceeds to us of approximately $8.2 million, and gross proceeds of $8.8 million. Under the Sales Agreement, remaining availability under the at-the-market offering is $2.7 million.
Risk Factors
Our business is subject to numerous risks and uncertainties, including those highlighted in the section entitled "Risk Factors" immediately following this prospectus summary. These risks include, but are not limited to, the following:
| · | We are developing new diagnostic products for the more rapid identification of MDROs and antibiotic resistance genomic information. If we are unable to successfully develop, receive regulatory clearance or approval for or commercialize such new products and services, our business will be materially, adversely affected. |
| · | We expect to make significant additional investments in the future related to our diagnostic products and services, which investments will require additional financing transactions through the issuance of equity or debt. If we are unable to make such investments our business will suffer. |
| · | We have a history of losses, and we expect to incur losses for the next several years. Substantial doubt exists about our ability to continue as a going concern. |
| · | Our restructuring plans may not produce the cost savings we anticipate, and we may encounter difficulties associated with the related organizational change. |
| · | We are an early commercial stage company and may never be profitable. Our products and services may never achieve significant commercial market acceptance. |
| · | Our future success is dependent upon our ability to expand our customer base. |
| · | We have been awarded a contract by the CDC, and may enter into additional agreements with U.S. or other government agencies, which could be subject to uncertain future funding. |
| · | Our sales cycle for our marketed products and services is lengthy and variable, which makes it difficult for us to forecast revenue and other operating results. |
| · | We may enter into collaborations with third parties to develop product and services candidates. If these collaborations are not successful, our business could be adversely affected. |
| · | We may not be successful in finding strategic collaborators for continuing development of certain of our product or services candidates or successfully commercializing or competing in the market for certain indications. |
| · | The loss of key members of our senior management team or our inability to attract and retain highly skilled scientists and laboratory and field personnel could adversely affect our business. |
6
| · | We have limited experience in marketing and selling our products, and if we are unable to adequately address our customers' needs, it could negatively impact sales and market acceptance of our products and we may never generate sufficient revenue to achieve or sustain profitability. |
| · | If the utility of our current products and products in development is not supported by studies published in peer-reviewed medical publications, the rate of adoption of our current and future products and services by clinicians and healthcare facilities may be negatively affected. |
| · | The performance of clinical and economic utility studies is expensive and demands significant attention from our management team. |
| · | Our products and services are not covered by reimbursement by Medicare, Medicaid and other governmental and third-party payors. If we cannot convince our customers that the savings from use of our products and services will increase their overall reimbursement, our business could suffer. |
| · | If our sole laboratory facility or manufacturing facility becomes inoperable, we will be unable to perform Acuitas MDRO test services, or manufacture our QuickFISH and PNA Fish products, and our business will be harmed. |
| · | In order to meet the turn-around time required for our Acuitas MDRO test services, we rely on transport of specimens to our sole laboratory facility; any disruption in such transport could significantly adversely affect our business. |
| · | We rely on a limited number of suppliers or, in some cases, sole suppliers, for some of our laboratory instruments and materials and may not be able to find replacements or immediately transition to alternative suppliers. |
| · | If we cannot compete successfully with our competitors, we may be unable to increase or sustain our revenue or achieve and sustain profitability. |
| · | If we are unable to develop products to keep pace with rapid technological, medical and scientific change, our operating results and competitive position could be harmed. New test development involves a lengthy and complex process, and we may not be successful in our efforts to develop and commercialize our diagnostic and screening products and services. The further development and commercialization of additional diagnostic and screening product and service offering are key to our growth strategy. |
| · | Our insurance policies are expensive and protect us only from some business risks, which will leave us exposed to significant uninsured liabilities. |
| · | If we use hazardous materials in a manner that causes injury, we could be liable for damages. |
| · | If we are sued for product liability or errors and omissions liability, we could face substantial liabilities that exceed our resources. |
| · | Our ability to utilize our net operating loss carryforwards and certain other tax attributes may be limited. |
| · | We may be adversely affected by the current economic environment and future adverse economic environments. |
7
THE OFFERING
| Common Warrants | |
| Number of Common Warrants | 1,000,000 |
| Terms of Common Warrants: | Each common warrant is exercisable to purchase one-twenty-fifth of a share of common stock at an exercise price of $10.625 per share and is exercisable at any time after the date of issuance for five years from its date of issuance. To better understand the terms of the common warrants, you should carefully read the "Description of the Offered Securities" section of this prospectus. You should also read the form of common warrant, which is filed as an exhibit to the registration statement of which this prospectus forms a part. |
| Placement Agent Warrants | |
Number of Placement Agent Warrants | 50,000 |
| Terms of Pre-Funded Warrants: | Each placement agent warrant is exercisable to purchase one-twenty-fifth of a share of common stock at an exercise price of $12.50 per share and is exercisable at any time after the date of issuance for five years from its date of issuance. |
| Common stock outstanding before this offering: | 5,289,919 shares of common stock |
| Common stock outstanding after this offering: | 6,339,919 shares of common stock |
| Use of Proceeds: | Assuming that the warrants are exercised for cash, we will use the net proceeds of this offering for general corporate purposes, including working capital and product development, particularly development of our one to three hour antibiotic resistance diagnostic product. See "Use of Proceeds" on page 40 of this prospectus. |
| Risk Factors: | Investing in our securities involves a high degree of risk. See "Risk Factors" beginning on page 13 of this prospectus and the other information included or incorporated by reference in this prospectus. |
| Nasdaq Capital Market symbol: | "OPGN." There is no established trading market for the common warrants or the placement agent warrants, and we do not expect a trading market to develop. We will not list the common warrants or the placement agent warrants on any securities exchange or other trading market. Without a trading market, the liquidity of the common warrants or placement agent warrants will be extremely limited. |
8
The number of shares of common stock to be outstanding immediately after this offering is based on 5,289,919 shares of our common stock outstanding as of April 2, 2018, and excludes:
| · | 220,102 shares of common stock issuable upon the exercise of outstanding options granted as of April 2, 2018, under our equity incentive plans at a weighted average exercise price of $20.88 per share; |
| · | 3,148,873 shares of common stock issuable upon the exercise of outstanding warrants, other than the warrants being offered by this prospectus, issued as of April 2, 2018, at a weighted average exercise price of $13.05 per share; |
| · | 500 shares of common stock issuable upon vesting of outstanding restricted stock units granted as of April 2, 2018; |
| · | 42,289 shares of common stock available for future issuance under our equity incentive plans as of April 2, 2018; |
| · | 1,000,000 shares of common stock issuable upon the exercise of common warrants the subject of this offering; and |
| · | 50,000 shares of common stock issuable upon exercise of placement agent warrants the subject of this offering. |
Unless otherwise stated, all information in this prospectus (i) assumes no exercise of the outstanding options and warrants and the offered warrants into common stock as described above and (ii) is adjusted retroactively to reflect the 25:1 reverse share split effected on January 17, 2018.
Company and Other Information
OpGen, Inc. was incorporated in Delaware in 2001. On July 14, 2015, the Company acquired AdvanDx, Inc., a Delaware corporation, as a wholly owned subsidiary in a merger transaction, or the AdvanDx Merger. The Company's headquarters are in Gaithersburg, Maryland, and its principal operations are in Gaithersburg, Maryland and Woburn, Massachusetts. The Company also has operations in Copenhagen, Denmark. Our principal executive office is located at 708 Quince Orchard Road, Gaithersburg, Maryland, 20878, and our telephone number is (240) 813-1260. Our website address is www.opgen.com. We do not incorporate the information on or accessible through our website into this prospectus, and you should not consider any information on, or that can be accessed through, our website as part of this prospectus.
Implications of Being an Emerging Growth Company
As a company with less than $1.07 billion in revenue during our last fiscal year, we qualify as an "emerging growth company" as defined in the Jumpstart Our Business Startups Act, or the JOBS Act, enacted in April 2012. An "emerging growth company" may take advantage of exemptions from some of the reporting requirements that are otherwise applicable to public companies. These exceptions include:
| · | being permitted to present only two years of audited financial statements and only two years of related Management's Discussion and Analysis of Financial Condition and Results of Operations in this prospectus; |
| · | not being required to comply with the auditor attestation requirements of Section 404 of the Sarbanes-Oxley Act of 2002, as amended; |
9
| · | reduced disclosure obligations regarding executive compensation in our periodic reports, proxy statements and registration statements; and |
| · | exemptions from the requirements of holding a nonbinding advisory vote on executive compensation and stockholder approval of any golden parachute payments not previously approved. |
We may take advantage of these provisions until the last day of our fiscal year following the fifth anniversary of the closing of our initial public offering in May 2015. However, if certain events occur prior to the end of such five-year period, including if we become a "large accelerated filer," our annual gross revenue exceeds $1.07 billion or we issue more than $1.0 billion of non-convertible debt in any three-year period, we will cease to be an emerging growth company prior to the end of such five-year period.
We have elected to take advantage of certain of the reduced disclosure obligations in this prospectus and may elect to take advantage of other reduced reporting requirements in future filings. As a result, the information that we provide to our stockholders may be different than you might receive from other public reporting companies in which you hold equity interests.
In addition, the JOBS Act provides that an emerging growth company can take advantage of an extended transition period for complying with new or revised accounting standards. We have irrevocably elected not to avail ourselves of this exemption and, therefore, we will be subject to the same new or revised accounting standards as other public companies that are not emerging growth companies.
10
SUMMARY FINANCIAL DATA
The following summary financial data should be read together with our financial statements and related notes, and "Management's Discussion and Analysis of Financial Condition and Results of Operations" appearing elsewhere in this prospectus. The summary statements of operations data as of and for the years ended December 31, 2017 and 2016, have been derived from our audited financial statements included elsewhere in this prospectus. Historical results are not necessarily indicative of the results that may be expected in the future and results of interim periods are not necessarily indicative of the results for the entire year.
Year Ended December 31, | ||||||||
| 2017 | 2016 | |||||||
| (In thousands, except per share data) | ||||||||
| Statements of Operation Data: | ||||||||
| Revenue | $ | 3,211 | $ | 4,026 | ||||
| Operating expenses: | ||||||||
| Cost of products sold | 1,613 | 1,659 | ||||||
Cost of services(1) | 520 | 631 | ||||||
Research and development(1) | 6,883 | 8,613 | ||||||
General and administrative(1) | 6,693 | 6,603 | ||||||
Sales and marketing(1) | 2,768 | 5,529 | ||||||
| Transaction expenses | - | - | ||||||
Total operating expenses(1) | 18,477 | 23,035 | ||||||
| Operating loss | (15,266 | ) | (19,009 | ) | ||||
| Interest and other (expense) income | (87 | ) | (6 | ) | ||||
| Interest expense | (233 | ) | (144 | ) | ||||
| Foreign currency transaction gains (losses) | 23 | (8 | ) | |||||
| Change in fair value of derivative financial instruments | 144 | - | ||||||
| Provision for income taxes | - | - | ||||||
| Net loss | $ | (15,419 | ) | $ | (19,167 | ) | ||
| Net loss available to common stockholders | $ | (15,419 | ) | $ | (19,499 | ) | ||
| Net loss per common share, basic and diluted | (9.80 | ) | (27.59 | ) | ||||
| Weighted average shares outstanding—basic and diluted | 1,574 | 707 | ||||||
(1) Includes stock-based compensation as follows:
Year Ended December 31, | ||||||||
| 2017 | 2016 | |||||||
| Cost of services | $ | 13,776 | $ | 6,003 | ||||
| Research and development | 237,103 | 236,341 | ||||||
| General and administrative | 603,787 | 599,550 | ||||||
| Sales and marketing | 56,732 | 103,567 | ||||||
| Total stock-based compensation | $ | 911,398 | $ | 945,461 | ||||
11
| As of December 31, 2017 | ||||||||
| Actual | As Adjusted | |||||||
| (In thousands) | ||||||||
| Balance Sheet Data: | ||||||||
| Cash and cash equivalents | $ | 1,847 | $ | 13,097 | ||||
| Working capital (deficit) | (1,288 | ) | 9,962 | |||||
| Total assets | 6,620 | 17,870 | ||||||
| Accumulated deficit | (148,710 | ) | (137,460 | ) | ||||
| Total stockholders' equity | 1,401 | 12,651 | ||||||
The preceding table presents a summary of our balance sheet data as of December 31, 2017:
| · | on an actual basis; |
| · | on an as adjusted basis, to give further effect to the issuance and sale in this offering of 1,050,000 shares of common stock upon the exercise of the common warrants at an exercise price of $10.625 per share and of the placement agent warrants at an exercise price of $12.50 per share. |
12
RISK FACTORS
Investing in our securities involves a high degree of risk. You should consider carefully the risks and uncertainties described below, together with all of the other information in this prospectus, including our financial statements and related notes included elsewhere in this prospectus, before making an investment decision. If any of the following risks occur, our business, financial condition, results of operations and prospects could be materially and adversely affected. In that event, the trading price of our common stock could decline and you could lose part or all of your investment.
Risks Related to Our Business
We have a history of losses, and we expect to incur losses for the next several years. The report of our independent registered public accounting firm on our financial statements for the years ended December 31, 2017 and 2016 contains explanatory language that substantial doubt exists about our ability to continue as a going concern.
We have incurred substantial losses since our inception, and we expect to continue to incur additional losses for the next several years. For the years ended December 31, 2017 and 2016, we had net losses of $15.4 million and $19.2 million, respectively. From our inception through December 31, 2017, we had an accumulated deficit of $148.7 million. The report of our independent registered public accounting firm on our financial statements for the years ended December 31, 2017 and 2016 contains explanatory language that substantial doubt exists about our ability to continue as a going concern. We completed a number of financings in 2018, 2017, and 2016, including the February 2018 Public Offering, the July 2017 Public Offering, a private investment in public equity, or PIPE, in May and June 2016 to members of management, employees and accredited investors, including MGHIF and jVen Capital, and an at-the-market, or ATM, public offering commenced in September 2016. The net proceeds from such financings were approximately $37.1 million.
We expect to continue to incur significant operating expenses relating to, among other things:
| · | developing our Acuitas AMR Gene Panel products and services for antibiotic resistance testing, and our automated rapid molecular diagnostic products; |
| · | commercializing our rapid pathogen identification and Acuitas MDRO and Acuitas Lighthouse informatics services; |
| · | developing, presenting and publishing additional clinical and economic utility data intended to increase clinician adoption of our current and future products and services; |
| · | expansion of our operating capabilities; |
| · | development of collaborative arrangements during 2018; |
| · | maintenance, expansion and protection of our intellectual property portfolio and trade secrets; |
| · | future clinical trials as we seek regulatory approval for some of our product offerings; |
| · | expansion of the size and geographic reach of our sales force and our marketing capabilities to commercialize potential future products and services; and |
| · | continued focus on recruiting and retaining our quality assurance and compliance personnel and activities. |
Even if we achieve significant revenues, we may not become profitable, and even if we achieve profitability, we may not be able to sustain or increase profitability on a quarterly or annual basis. Our failure to become and remain consistently profitable could adversely affect the market price of our common stock and could significantly impair our ability to raise capital, expand our business or continue to pursue our growth strategy. We believe that current cash on hand including the February 2018 Public Offering will be sufficient to fund operations into the first quarter of 2019. In the event we are unable to successfully raise additional capital during or before the first quarter of 2019, we will not have sufficient cash flows and liquidity to finance our business operations as currently contemplated. Accordingly, in such circumstances we would be compelled to reduce general and administrative expenses and delay research and development projects, including the purchase of scientific equipment and supplies, until we are able to obtain sufficient financing. We have no committed sources of capital and may find it difficult to raise money on terms favorable to us or at all. The failure to obtain sufficient capital to support our operations would have an adverse effect on our business, financial condition and results of operations.
13
We expect to make significant additional investment in the future related to our diagnostic products and services, which investments will require additional financing transactions through the issuance of equity or debt. If we are unable to make such investments our business will suffer.
We anticipate that we will need to make significant investments in our Acuitas AMR Gene Panel tests in development, Acuitas MDRO tests and Acuitas Lighthouse bioinformatics services in order to make our business profitable. We have identified potential synergies for future rapid diagnostic test developments based on our existing product and service offerings, but need to expend significant investments to develop such products and services. There can be no assurance that we can obtain sufficient resources or capital from operations or future financings to support these development activities.
To meet our capital needs, we are considering multiple alternatives, including, but not limited to, additional equity financings, debt financings and other funding transactions, licensing and/or partnering arrangements and business combination transactions. In September 2016, we filed a shelf registration statement on Form S-3 to offer for sale and sell, from time to time, up to $50 million of shares of our common stock. As a smaller reporting company, we are limited to sales under such shelf registration statement, or similar offerings, of no more than one-third of our public float over a rolling twelve-month period. In September 2016, we commenced an "at the market," or ATM, offering under the shelf registration statement to raise up to $11.5 million. As of December 31, 2017, we have raised approximately $8.8 million under the ATM offering. We believe that additional equity financings are the most likely source of capital. There can be no assurance that we will be able to complete any such financing transaction on acceptable terms or otherwise.
We believe that current cash on hand including the February 2018 Public Offering will be sufficient to fund operations into the first quarter of 2019. In the event we are unable to successfully raise additional capital during or before the first quarter of 2019, we will not have sufficient cash flows and liquidity to finance our business operations as currently contemplated. Accordingly, in such circumstances we would be compelled to immediately reduce general and administrative expenses and delay research and development projects, including the purchase of scientific equipment and supplies, until we are able to obtain sufficient financing. If such sufficient financing is not received timely, we would then need to pursue a plan to license or sell assets, seek to be acquired by another entity, cease operations and/or seek bankruptcy protection.
In July 2015, in connection with our acquisition of our subsidiary, AdvanDx, MGHIF made investments in the Company, including the $1 million MGHIF Note, secured by a security interest in substantially all of our assets, including our intellectual property assets. The debt is due to be paid in July 2018. Such secured creditor rights could negatively impact our ability to raise money in the future. If we default on payments under the MGHIF Note, MGHIF has the rights of a secured creditor. If those rights are exercised, it could have a material adverse effect on our financial condition.
Our restructuring plans may not produce the cost savings we anticipate, and we may encounter difficulties associated with the related organizational change.
In June 2017, we commenced a restructuring of our operations to improve efficiency and reduce our cost structure. To date, we have achieved a reduction in operating expenses of approximately 31 percent. The restructuring plan anticipates that we will consolidate operations for our FDA-cleared and CE marked products and research and development activities for the Acuitas AMR Gene Panel in Gaithersburg, Maryland, and reduce the size of our commercial organization while we work to complete the development of our Acuitas AMR Gene Panel u5.47 test and Acuitas Lighthouse Software in development.
The restructuring is substantially complete, however, if we are unable to complete the objectives of the restructuring, our business and results of operations may be materially and adversely affected. We may not fully realize the anticipated benefits from our restructuring plans. Our restructuring plans may not adequately reduce expenses or produce the cost savings we anticipate or in the time frame we expect. Further restructuring activities may also be required in the future beyond what is currently planned, which could enhance the risks associated with these activities.
14
Moreover, the costs associated with the closing of our facility in Woburn, Massachusetts and consolidating our operations in Gaithersburg, Maryland are significant. In addition, our Gaithersburg facility may not meet the FDA and CE marked requirements. If we are unable to consolidate our operations, receive the necessary regulatory approvals for our Gaithersburg facility, or sufficiently reduce our cash burn it could have a material adverse effect on our business, operating results and financial condition.
Our products and services may never achieve significant commercial market acceptance.
Our products and services may never gain significant acceptance in the marketplace and, therefore, may never generate substantial revenue or profits for us. Our ability to achieve commercial market acceptance for our products will depend on several factors, including:
| · | our ability to convince the medical community of the clinical utility of our products and services and their potential advantages over existing tests, including our surveillance services offering, despite the lack of reimbursement for such services; |
| · | our ability to successfully develop automated rapid pathogen identification and antibiotic resistance testing products and services, including bioinformatics, and convince hospitals and other healthcare providers of the patient safety, improved patient outcomes and potential cost savings that could result; |
| · | our ability to grow our microbial isolate and antibiotic resistance genes knowledgebase; |
| · | our ability to convince the medical community of the accuracy and speed of our products and services, as contrasted with the current methods available; and |
| · | the willingness of hospitals and physicians to use our products and services. |
Our future success is dependent upon our ability to expand our customer base.
The current customers we are targeting for our Acuitas AMR Gene Panel and Acuitas Lighthouse Software test products and services are hospital systems, acute care hospitals, particularly those with advanced care units, such as intensive care units, community-based hospitals and governmental units, such as public health facilities. We need to provide a compelling case for the savings, patient safety and recovery, reduced length of stay and reduced costs that come from adopting our MDRO diagnosis and management products and services. If we are not able to successfully increase our customer base, sales of our products and our margins may not meet expectations. Attracting new customers and introducing new products and services requires substantial time and expense. Any failure to expand our existing customer base, or launch new products and services, would adversely affect our ability to improve our operating results.
We have seen declining revenues from our current customers for our QuickFISH products as we work to automate and expand our current product offerings. We may not be successful in developing such automated rapid pathogen identification products, which would materially, adversely affect our business.
We are developing new diagnostic products for the more rapid identification of MDROs and antibiotic resistance genomic information. If we are unable to successfully develop, receive regulatory clearance or approval for or commercialize such new products and services, our business will be materially, adversely affected.
We are developing a new one to three hour antibiotic resistance diagnostic product that we believe could help address many of the current issues with the need for more rapid identification of infectious diseases and testing for antibiotic resistance. Development of new diagnostic products is difficult and we cannot assure you that we will be successful in such product development efforts, or, if successful, that we will receive the necessary regulatory clearances to commercialize such products. We have identified approximately 47 antibiotic resistance genes to help guide clinician antibiotic therapy decisions when test results are evaluated using the Acuitas Lighthouse Software. Although we have demonstrated preliminary feasibility, and confirmed genotype/phenotype predictive algorithms, such product development efforts will require us to work collaboratively with other companies, academic and government laboratories, and healthcare providers to access sufficient numbers of microbial isolates, develop the diagnostic tests, successfully conduct the necessary clinical trials and apply for and receive regulatory clearances or approvals for the intended use of such diagnostic tests. In addition, we would need to successfully commercialize such products. Such product development, clearance or approval and commercialization activities are time-consuming, expensive and we are not assured that we will have sufficient funds to successfully complete such efforts. We currently estimate that such antibiotic resistance diagnostic tests will be commercially available by 2019. Any significant delays or failures in this process could have a material adverse effect on our business and financial condition.
15
We may offer these products in development to the research use only market or for other non-clinical research uses prior to receiving clearance or approval to commercialize these products in development for use in the clinical setting. We will need to comply with the applicable laws and regulations regarding such other uses. Failure to comply with such laws and regulations may have a significant impact on the Company.
We have been awarded a contract by the CDC, and may enter into additional agreements with U.S. or other government agencies, which could be subject to uncertain future funding.
The presence of MDROs and the need for antibiotic stewardship activities have prompted state, federal and international government agencies to develop programs to combat the effects of MDROs. In September 2017, we were awarded a contract by the CDC to assess use of smartphone-based clinical decision support tools for antimicrobial stewardship and infection control in low- and middle-income countries. Receipt of this funding is contingent on our successful implementation of the grant agreement with our collaboration partners. If we fail to meet the obligations under the contract, our financial condition could be adversely affected.
In the future, we may seek to enter into additional agreements with governmental funding sources or contract with government healthcare organizations to sell our products and services. Under such agreements, we would rely on the continued performance by these government agencies of their responsibilities under these agreements, including adequate continued funding of the agencies and their programs. We have no control over the resources and funding that government agencies may devote to these agreements, which may be subject to annual renewal.
Government agencies may fail to perform their responsibilities under these agreements, which may cause them to be terminated by the government agencies. In addition, we may fail to perform our responsibilities under these agreements. Any government agreements would be subject to audits, which may occur several years after the period to which the audit relates. If an audit identified significant unallowable costs, we could incur a material charge to our earnings or reduction in our cash position. As a result, we may be unsuccessful entering, or ineligible to enter, into future government agreements.
Our sales cycle for our marketed products and services is lengthy and variable, which makes it difficult for us to forecast revenue and other operating results.
The sales cycles for our Acuitas AMR Gene Panel and Acuitas Lighthouse Software is lengthy, which makes it difficult for us to accurately forecast revenues in a given period, and may cause revenue and operating results to vary significantly from period to period. Potential customers for our products typically need to commit significant time and resources to evaluate our products, and their decision to purchase our products may be further limited by budgetary constraints and numerous layers of internal review and approval, which are beyond our control. We spend substantial time and effort assisting potential customers in evaluating our products. Even after initial approval by appropriate decision makers, the negotiation and documentation processes for the actual adoption of our products on a facility-wide basis can be lengthy. As a result of these factors, based on our experience to date, our sales cycle, the time from initial contact with a prospective customer to routine commercial use of our products, has varied and could be 12 months or longer, which has made it difficult for us to accurately project revenues and operating results. In addition, the revenue generated from sales of our products may fluctuate from time to time due to changes in the testing volumes of our customers. As a result, our results may fluctuate on a quarterly basis, which may adversely affect the price of our common stock.
16
We may enter into collaborations with third parties to develop product and services candidates. If these collaborations are not successful, our business could be adversely affected.
We may enter into collaborations related to our MDRO and informatics products and services. Such collaborations may be with pharmaceutical companies, platform companies or other participants in our industry. We would have limited control over the amount and timing of resources that any such collaborators could dedicate to the development or commercialization of the subject matter of any such collaboration. Our ability to generate revenues from these arrangements would depend on our and our collaborator's abilities to successfully perform the functions assigned to each of us in these arrangements. Our relationships with future collaborators may pose several risks, including the following:
| · | collaborators have significant discretion in determining the efforts and resources that they will apply to these collaborations; |
| · | collaborators may not perform their obligations as expected; |
| · | we may not achieve any milestones, or receive any milestone payments, under our collaborations, including milestones and/or payments that we expect to achieve or receive; |
| · | the clinical trials, if any, conducted as part of these collaborations may not be successful; |
| · | a collaborator might elect not to continue or renew development or commercialization programs based on clinical trial results, changes in the collaborator's strategic focus or available funding or external factors, such as an acquisition, that diverts resources or creates competing priorities; |
| · | we may not have access to, or may be restricted from disclosing, certain information regarding product or services candidates being developed or commercialized under a collaboration and, consequently, may have limited ability to inform our stockholders about the status of such product or services candidates; |
| · | collaborators could independently develop, or develop with third parties, products that compete directly or indirectly with our product candidates if the collaborators believe that competitive products are more likely to be successfully developed or can be commercialized under terms that are more economically attractive than ours; |
| · | product or services candidates developed in collaboration with us may be viewed by our collaborators as competitive with their own product or services, which may cause collaborators to cease to devote resources to the commercialization of our product or services candidates; |
| · | a collaborator with marketing and distribution rights to one or more of our product or services candidates that achieve regulatory approval may not commit sufficient resources to the marketing and distribution of any such product candidate; |
| · | disagreements with collaborators, including disagreements over proprietary rights, contract interpretation or the preferred course of development of any product or services candidates, may cause delays or termination of the research, development or commercialization of such product or services candidates, may lead to additional responsibilities for us with respect to such product or services candidates or may result in litigation or arbitration, any of which would be time-consuming and expensive; |
| · | collaborators may not properly maintain or defend our intellectual property rights or may use our proprietary information in such a way as to invite litigation that could jeopardize or invalidate our intellectual property or proprietary information or expose us to potential litigation; |
| · | disputes may arise with respect to the ownership of intellectual property developed pursuant to a collaboration; |
17
| · | collaborators may infringe the intellectual property rights of third parties, which may expose us to litigation and potential liability; and |
| · | collaborations may be terminated for the convenience of the collaborator and, if terminated, we could be required to raise additional capital to pursue further development or commercialization of the applicable product or services candidates. |
If our future collaborations do not result in the successful development and commercialization of products or services, we may not receive any future research funding or milestone or royalty payments under the collaborations. If we do not receive the funding we would expect under these agreements, our development of product and services candidates could be delayed and we may need additional resources to develop our product candidates.
We may not be successful in finding strategic collaborators for continuing development of certain of our product or services candidates or successfully commercializing or competing in the market for certain indications.
We may seek to develop strategic partnerships for developing certain of our product or services candidates, due to capital costs required to develop the product or services candidates or manufacturing constraints. We may not be successful in our efforts to establish such a strategic partnership or other alternative arrangements for our product or services candidates because our research and development pipeline may be insufficient, our product or services candidates may be deemed to be at too early of a stage of development for collaborative effort or third parties may not view our product or services candidates as having the requisite potential to demonstrate commercial success.
If we are unable to reach agreements with suitable collaborators on a timely basis, on acceptable terms or at all, we may have to curtail the development of a product or service candidate, reduce or delay our development program, delay our potential commercialization, reduce the scope of any sales or marketing activities or increase our expenditures and undertake development or commercialization activities at our own expense. If we elect to fund development or commercialization activities on our own, we may need to obtain additional expertise and additional capital, which may not be available to us on acceptable terms or at all. If we fail to enter into collaborations and do not have sufficient funds or expertise to undertake the necessary development and commercialization activities, we may not be able to further develop our product candidates and our business, financial condition, results of operations and prospects may be materially and adversely affected.
We are an early commercial stage company and may never be profitable.
We rely principally on the commercialization of our QuickFISH and Acuitas Gene Panel test products and our Acuitas Lighthouse Software to generate future revenue growth. To date, the Acuitas MDRO test products and Acuitas Lighthouse services have delivered only minimal revenue. We believe that our commercialization success is dependent upon our ability to significantly increase the number of hospitals, long-term care facilities and other inpatient healthcare settings that use our products. We have experienced very limited revenue and customer adoption for our Acuitas MDRO products and services to date. If demand for products does not increase as quickly as we have planned, we may be unable to increase our revenue levels as expected. We are currently not profitable. Even if we succeed in increasing adoption of our products by our target markets, maintaining and creating relationships with our existing and new customers and developing and commercializing additional molecular testing products, we may not be able to generate sufficient revenue to achieve or sustain profitability.
The loss of key members of our senior management team or our inability to attract and retain highly skilled scientists and laboratory and field personnel could adversely affect our business.
Our success depends largely on the skills, experience and performance of key members of our executive management team. The efforts of each of these persons will be critical to us as we continue to develop our products and services and as we attempt to transition to a company with broader product offerings. If we were to lose one or more of these key employees, we may experience difficulties in competing effectively, developing our technologies and implementing our business strategies.
Our research and development programs and commercial laboratory operations depend on our ability to attract and retain highly skilled scientists and technicians, particularly as we seek to further integrate operations of the combined company. We may not be able to attract or retain qualified scientists and technicians in the future due to the intense competition for qualified personnel among life science businesses. We also face competition from universities, public and private research institutions and other organizations in recruiting and retaining highly qualified scientific personnel.
18
In addition, our success depends on our ability to attract and retain laboratory and field personnel with extensive experience in infection control in inpatient settings. We may have difficulties locating, recruiting or retaining qualified salespeople, which could cause a delay or decline in the rate of adoption of our current and future products and service offerings. If we are not able to attract and retain the necessary personnel to accomplish our business objectives, we may experience constraints that will adversely affect our ability to support our discovery, development, verification and commercialization programs.
We have limited experience in marketing and selling our products, and if we are unable to adequately address our customers' needs, it could negatively impact sales and market acceptance of our products and we may never generate sufficient revenue to achieve or sustain profitability.
We sell our products through our own direct sales force, which sells our Acuitas AMR Gene Panel and Acuitas Lighthouse Software, our QuickFISH products, and our Acuitas Lighthouse surveillance product and services offerings. All of these products and services may be offered and sold to different potential customers or involve discussions with multiple personnel in in-patient facilities. Our future sales will depend in large part on our ability to increase our marketing efforts and adequately address our customers' needs. The inpatient healthcare industry is a large and diverse market. As a result, we believe it is necessary to maintain a sales force that includes sales representatives with specific technical backgrounds that can support our customers' needs. We will also need to attract and develop sales and marketing personnel with industry expertise. Competition for such employees is intense. We may not be able to attract and retain sufficient personnel to maintain an effective sales and marketing force. If we are unable to successfully market our products and adequately address our customers' needs, it could negatively impact sales and market acceptance of our products and we may never generate sufficient revenue to achieve or sustain profitability.
If the utility of our current products and products in development is not supported by studies published in peer-reviewed medical publications, the rate of adoption of our current and future products and services by clinicians and healthcare facilities may be negatively affected.
The results of our clinical and economic validation studies involving our Acuitas AMR Gene Panel and Acuitas Lighthouse Software have been presented at major infectious disease and infection control society meetings. We need to maintain and grow a continued presence in peer-reviewed publications to promote clinician adoption of our products. We believe that peer-reviewed journal articles that provide evidence of the utility of our current and future products and services, and adoption by key opinion leaders in the infectious disease market are very important to our commercial success. Clinicians typically take a significant amount of time to adopt new products and testing practices, partly because of perceived liability risks and the uncertainty of a favorable cost/benefit analysis. It is critical to the success of our sales efforts that we educate a sufficient number of clinicians and administrators about our products and demonstrate their clinical benefits. Clinicians may not adopt our current and future products and services unless they determine, based on published peer- reviewed journal articles and the experience of other clinicians, that our products provide accurate, reliable, useful and cost-effective information that is useful in MDRO diagnosis, screening and outbreak prevention. If our current and future products and services or the technology underlying our products and services or our future product offerings do not receive sufficient favorable exposure in peer-reviewed publications, the rate of clinician adoption could be negatively affected. The publication of clinical data in peer-reviewed journals is a crucial step in commercializing our products, and our inability to control when, if ever, results are published may delay or limit our ability to derive sufficient revenue from any product that is the subject of a study.
The performance of clinical and economic utility studies is expensive and demands significant attention from our management team.
The performance of clinical and economic utility studies is expensive and demands significant attention from our management team. Data collected from these studies may not be positive or consistent with our existing data, or may not be statistically significant or compelling to the medical community. If the results obtained from our ongoing or future studies are inconsistent with certain results obtained from our previous studies, adoption of our current and future products and services would suffer and our business would be harmed.
19
Our products and services are not covered by reimbursement by Medicare, Medicaid and other governmental and third-party payors. If we cannot convince our customers that the savings from use of our products and services will increase their overall reimbursement, our business could suffer.
Our products and services do not currently receive reimbursement from Medicare, Medicaid, other governmental payors or commercial third-party payors. The recent policy and rule changes in reimbursement announced by CMS, including potential financial incentives for reductions in hospital acquired infection, and penalties and decreased Medicare reimbursement for patients with HAIs provide us with an opportunity to establish a business case for the purchase and use of our screening and diagnostic products and services. If we cannot convince our customers that the savings from use of our products and services will increase or stabilize their overall profitability and improve clinical outcomes, our business will suffer.
If our sole laboratory facility or manufacturing facility becomes inoperable, we will be unable to perform Acuitas MDRO test services, or manufacture our QuickFISH and PNA Fish products, and our business will be harmed.
We perform all of our Acuitas MDRO and Acuitas Lighthouse testing services in our CLIA-compliant laboratory located in Gaithersburg, Maryland. We do not have redundant laboratory facilities. Our facility and the equipment we use to perform our diagnostic and screening assays would be costly to replace and could require substantial lead time to repair or replace, if damaged or destroyed. The facility may be harmed or rendered inoperable by natural or man-made disasters, including flooding and power outages, which may render it difficult or impossible for us to perform our tests for some period of time. The inability to perform our tests may result in the loss of customers or harm our reputation, and we may be unable to regain those customers in the future. Although we possess insurance for damage to our property and the disruption of our business, this insurance may not be sufficient to cover all of our potential losses and may not continue to be available to us on acceptable terms, if at all.
In order to establish a redundant laboratory facility, we would have to spend considerable time and money securing adequate space, constructing the facility, recruiting and training employees, and establishing the additional operational and administrative infrastructure necessary to support a second facility. Additionally, any new clinical laboratory facility opened by us would be required to be certified under CLIA, a federal law that regulates clinical laboratories that perform testing on specimens derived from humans for the purpose of providing information for the diagnosis, prevention or treatment of disease. In addition to a CLIA certification, we would also be required to secure and maintain state licenses required by several states, including Maryland, California, Florida, New York and Pennsylvania which can take a significant amount of time and result in delays in our ability to begin operations at that facility. We currently have active licenses in Maryland, Florida, New York and Pennsylvania. If we failed to secure any such licenses, we would not be able to process samples from recipients in such states. If we fail to maintain our CLIA certification or if our CLIA certification is suspended, limited or revoked, we would not be able to process human-derived samples from recipients that are not for research purposes. We also expect that it would be difficult, time-consuming and costly to train, equip and use a third-party to perform tests on our behalf. We could only use another facility with the established state licensures and CLIA certification necessary to perform our current or future tests following validation and other required procedures. We cannot assure you that we would be able to find another CLIA-certified facility willing or able to adopt our current or future tests and comply with the required procedures, or that this laboratory would be willing or able to perform the tests for us on commercially reasonable terms.
We are completing the process of re-locating the manufacturing our QuickFISH and PNA Fish products from our leased facility located in Woburn, Massachusetts to our Gaithersburg, Maryland facility. If demand for these products increase beyond our current forecasts or, regulatory requirements arise, we may not be able to meet our obligations to produce these products, and backlog or reduced demand for such products could occur. We are in the process of obtaining all necessary FDA certifications with respect to such relocation. If we are not successful in obtaining all necessary FDA certifications, it could delay our ability to manufacture these products. If any of these issues occur, it could have a material adverse effect on our financial condition and results of operations.
20
In order to meet the turn-around time required for our Acuitas MDRO test services, we rely on transport of specimens to our sole laboratory facility; any disruption in such transport could significantly adversely affect our business.
Our current customers for our Acuitas MDRO test services are located near our sole laboratory facility in Gaithersburg, Maryland. As we expand our customer base, and the jurisdictions where we are licensed to provide our CLIA laboratory services, we will need to secure the proper licenses for shipment of specimens and rely on accurate and timely delivery of the specimens by overnight delivery services such as FedEx. Any failure to procure the proper licenses, to comply with the license regulations or to receive undamaged specimens from overnight delivery services could adversely affect our business and reputation.
We rely on a limited number of suppliers or, in some cases, sole suppliers, for some of our laboratory instruments and materials and may not be able to find replacements or immediately transition to alternative suppliers.
We rely on several sole suppliers and manufacturers, including Fluidigm Corporation, for supplying certain laboratory reagents, raw materials, supplies and substances which we use in our laboratory operations and products and to manufacture our products. An interruption in our operations could occur if we encounter delays or difficulties in securing these items or manufacturing our products, and if we cannot, then obtain an acceptable substitute. Any such interruption could significantly affect our business, financial condition, results of operations and reputation.
We believe that there are only a few other equipment manufacturers that are currently capable of supplying and servicing the equipment and other supplies and materials necessary for our laboratory operations. The use of equipment or materials furnished by these replacement suppliers would require us to alter our laboratory operations. Transitioning to a new supplier would be time consuming and expensive, may result in interruptions in our laboratory operations, could affect the performance specifications of our laboratory operations or could require that we revalidate our products. There can be no assurance that we will be able to secure alternative equipment and other materials, and bring such equipment and materials on line and revalidate them without experiencing interruptions in our workflow. If we should encounter delays or difficulties in securing, reconfiguring or revalidating the equipment we require for our products, our business, financial condition, results of operations and reputation could be adversely affected.
If we cannot compete successfully with our competitors, we may be unable to increase or sustain our revenue or achieve and sustain profitability.
Our competitors include rapid diagnostic testing and traditional microbiology companies, commercial laboratories, information technology companies, and hospital laboratories who may internally develop testing capabilities. Principal competitive factors in our target market include: organizational size, scale, and breadth of product offerings; rapidity of test results; quality and strength of clinical and analytical validation data and confidence in diagnostic results; cost effectiveness; ease of use; and regulatory approval status.
Our principal competition comes from traditional methods used by healthcare providers to diagnose and screen for MDROs and from other molecular diagnostic companies creating screening and diagnostic products such as Cepheid, Becton-Dickinson, bioMérieux, Accelerate Diagnostics, T2 Biosystems, GenMark and Nanosphere.
We also face competition from commercial laboratories, such as Bio-Reference Laboratories, Inc., Laboratory Corporation of America Holdings, Quest Diagnostics Incorporated and EuroFins, which have strong infrastructure to support the commercialization of diagnostic laboratory services.
Competitors may develop their own versions of competing products in countries where we do not have patents or where our intellectual property rights are not recognized.
Many of our potential competitors have widespread brand recognition and substantially greater financial, technical, research and development and selling and marketing capabilities than we do. Others may develop products with prices lower than ours that could be viewed by hospitals, physicians and payers as functionally equivalent to our product and service offering, or offer products at prices designed to promote market penetration, which could force us to lower the list prices of our product and service offerings and affect our ability to achieve profitability. If we are unable to change clinical practice in a meaningful way or compete successfully against current and future competitors, we may be unable to increase market acceptance and sales of our products, which could prevent us from increasing our revenue or achieving profitability and could cause our stock price to decline.
21
If we are unable to develop products to keep pace with rapid technological, medical and scientific change, our operating results and competitive position could be harmed. New test development involves a lengthy and complex process, and we may not be successful in our efforts to develop and commercialize our diagnostic and screening products and services. The further development and commercialization of additional diagnostic and screening product and service offering are key to our growth strategy.
A key element of our strategy is to discover, develop, validate and commercialize a portfolio of additional diagnostic and screening products and services to rapidly diagnose and effectively treat MDRO infections and reduce the associated costs to patients, inpatient facilities and the healthcare industry. We cannot assure you that we will be able to successfully complete development of, or commercialize any of our planned future products and services, or that they will be clinically usable. The product development process involves a high degree of risk and may take up to several years or more. Our new product development efforts may fail for many reasons, including:
| · | failure of the test at the research or development stage; |
| · | lack of clinical validation data to support the effectiveness of the test; |
| · | delays resulting from the failure of third-party suppliers or contractors to meet their obligations in a timely and cost-effective manner; |
| · | failure to obtain or maintain necessary certifications, licenses, clearances or approvals to market or perform the test; or |
| · | lack of commercial acceptance by in-patient healthcare facilities. |
Few research and development projects result in commercial products, and success in early clinical studies often is not replicated in later studies. At any point, we may abandon development of new products, or we may be required to expend considerable resources repeating clinical studies or trials, which would adversely impact the timing for generating potential revenues from those new products. In addition, as we develop new products, we will have to make additional investments in our sales and marketing operations, which may be prematurely or unnecessarily incurred if the commercial launch of a product is abandoned or delayed.
Our insurance policies are expensive and protect us only from some business risks, which will leave us exposed to significant uninsured liabilities.
We do not carry insurance for all categories of risk that our business may encounter. Some of the policies we currently maintain include general liability, employee benefits liability, property, umbrella, business interruption, workers' compensation, product liability, errors and omissions and directors' and officers' insurance. We do not know, however, if we will be able to maintain existing insurance with adequate levels of coverage. Any significant uninsured liability may require us to pay substantial amounts, which would adversely affect our cash position and results of operations.
If we use hazardous materials in a manner that causes injury, we could be liable for damages.
Our activities currently require the use of hazardous materials and the handling of patient samples. We cannot eliminate the risk of accidental contamination or injury to employees or third parties from the use, storage, handling or disposal of these materials. In the event of contamination or injury, we could be held liable for any resulting damages, and any liability could exceed our resources or any applicable insurance coverage we may have. Additionally, we are subject on an ongoing basis to federal, state and local laws and regulations governing the use, storage, handling and disposal of these materials and specified waste products. We are, or may be in the future, subject to compliance with additional laws and regulations relating to the protection of the environment and human health and safety, and including those relating to the handling, transportation and disposal of medical specimens, infectious and hazardous waste and Occupational Safety and Health Administration, or OSHA, requirements. The requirements of these laws and regulations are complex, change frequently and could become more stringent in the future. Failure to comply with current or future environmental laws and regulations could result in the imposition of substantial fines, suspension of production, alteration of our production processes, cessation of operations or other actions, which could severely harm our business.
22
If we are sued for product liability or errors and omissions liability, we could face substantial liabilities that exceed our resources.
The marketing, sale and use of our products could lead to product liability claims if someone were to allege that a product failed to perform as it was designed. We may also be subject to liability for errors in the results we provide to physicians or for a misunderstanding of, or inappropriate reliance upon, the information we provide. For example, if we diagnosed a patient as having an MDRO but such result was a false positive, the patient could be unnecessarily isolated in an in-patient setting or receive inappropriate treatment. We may also be subject to similar types of claims related to products we may develop in the future. A product liability or errors and omissions liability claim could result in substantial damages and be costly and time consuming for us to defend. Although we maintain product liability and errors and omissions insurance, we cannot assure you that our insurance would fully protect us from the financial impact of defending against these types of claims or any judgments, fines or settlement costs arising out of any such claims. Any product liability or errors and omissions liability claim brought against us, with or without merit, could increase our insurance rates or prevent us from securing insurance coverage in the future. Additionally, any product liability lawsuit could cause injury to our reputation or cause us to suspend sales of our products and services. The occurrence of any of these events could have an adverse effect on our business and results of operations.
Our ability to utilize our net operating loss carryforwards and certain other tax attributes may be limited.
We have incurred net losses since inception and do not expect to become profitable in 2018 or for several years thereafter. To the extent that we continue to generate taxable losses, unused losses will carry forward to offset future taxable income, if any, until such unused losses expire. We may be unable to use these net operating loss carryforwards, or NOLs, and certain tax credit carryforwards to offset income before such unused NOLs tax credit carryforwards expire. Under Section 382 of the Internal Revenue Code, if a corporation undergoes an "ownership change" (generally defined as a greater than 50% change (by value) in its equity ownership over a three-year period), the corporation's ability to use its pre-change NOLs and other pre- change tax attributes to offset its post-change income may be limited. The AdvanDx Merger resulted in an ownership change for AdvanDx and, accordingly, AdvanDx's net operating loss carryforwards and certain other tax attributes in U.S. taxing jurisdictions are subject to limitations on their use after the AdvanDx Merger. OpGen's net operating loss carryforwards may also be subject to limitation as a result of prior shifts in equity ownership and/or the AdvanDx Merger. Additional ownership changes in the future could result in additional limitations on the use of our net operating loss carryforwards. Consequently, even if we achieve profitability, we may not be able to utilize a material portion of our net operating loss carryforwards and other tax attributes, which could have a material adverse effect on cash flow and results of operations. We have not performed an analysis on previous ownership changes. It is possible that we have experienced an ownership change, or that we will experience an ownership change in the future. We had U.S. federal NOL carryforwards of $165.5 million and research and development tax credits of $2.6 million as of December 31, 2017, that may already be or could be limited if we experience an ownership change. In addition, the Tax Cuts and Jobs Act may limit the amount of losses incurred for tax years beginning after December 31, 2017 that can be used on a yearly basis. The limit is equal to 80 % of taxable income for a given year. However, losses incurred after December 31, 2017 may be carried forward indefinitely.
We may be adversely affected by the current economic environment and future adverse economic environments.
Our ability to attract and retain customers, invest in and grow our business and meet our financial obligations depends on our operating and financial performance, which, in turn, is subject to numerous factors, including the prevailing economic conditions and financial, business and other factors beyond our control, such as the rate of unemployment, the number of uninsured persons in the United States and inflationary pressures. We cannot anticipate all the ways in which the current economic climate and financial market conditions, and those in the future, could adversely impact our business.
23
We are exposed to risks associated with reduced profitability and the potential financial instability of our customers, many of which may be adversely affected by volatile conditions in the financial markets. For example, unemployment and underemployment, and the resultant loss of insurance, may decrease the demand for healthcare services and diagnostic testing. If fewer patients are seeking medical care because they do not have insurance coverage, we may experience reductions in revenues, profitability and/or cash flow. In addition, if economic challenges in the United States result in widespread and prolonged unemployment, either regionally or on a national basis, a substantial number of people may become uninsured or underinsured. To the extent such economic challenges result in less demand for our proprietary tests, our business, results of operations, financial condition and cash flows could be adversely affected.
Risks Related to Our Securities and Public Company Status
We incur increased costs and demands on management as a result of compliance with laws and regulations applicable to public companies, which could harm our operating results.
As a public company, we incur significant legal, accounting and other expenses that we did not incur as a private company, including costs associated with public company reporting requirements. In addition, the Sarbanes-Oxley Act of 2002 and the Dodd-Frank Act of 2010, as well as rules implemented by the SEC and the Nasdaq Stock Market, impose a number of requirements on public companies, including with respect to corporate governance practices. Our management and other personnel need to devote a substantial amount of time to these compliance and disclosure obligations. Moreover, compliance with these rules and regulations has increased our legal, accounting and financial compliance costs and has made some activities more time-consuming and costly. It is also more expensive for us to obtain director and officer liability insurance.
If we are unable to maintain effective internal control over financial reporting, investors may lose confidence in the accuracy and completeness of our reported financial information and the market price of our common stock may be negatively affected.
As a public company, we are required to maintain internal control over financial reporting and to report any material weaknesses in such internal control. Section 404 of the Sarbanes-Oxley Act of 2002 requires that we evaluate and determine the effectiveness of our internal control over financial reporting and provide a management report on internal control over financial reporting. If we have a material weakness in our internal control over financial reporting, we may not detect errors on a timely basis and our financial statements may be materially misstated.
When we are no longer an emerging growth company and a smaller reporting company, our independent registered public accounting firm will be required to issue an attestation report on the effectiveness of our internal control over financial reporting. Even if our management concludes that our internal control over financial reporting is effective, our independent registered public accounting firm may conclude that there are material weaknesses with respect to our internal controls or the level at which our internal controls are documented, designed, implemented or reviewed.
When we are no longer an emerging growth company and a smaller reporting company, if our auditors were to express an adverse opinion on the effectiveness of our internal control over financial reporting because we had one or more material weaknesses, investors could lose confidence in the accuracy and completeness of our financial disclosures, which could cause the price of our common stock to decline. Internal control deficiencies could also result in a restatement of our financial results in the future.
24
The market price of our common stock has been, and may continue to be, highly volatile, and such volatility could cause the market price of our common stock to decrease and could cause you to lose some or all of your investment in our common stock.
During the period from our initial public offering in May 2015 through April 2, 2018, the market price of our common stock fluctuated from a high of $136.00 per share to a low of $1.63 per share, and our stock price continues to fluctuate. The market price of our common stock may continue to fluctuate significantly in response to numerous factors, some of which are beyond our control, such as:
| · | our ability to grow our revenue and customer base; |
| · | the announcement of new products or product enhancements by us or our competitors; |
| · | developments concerning regulatory oversight and approvals; |
| · | variations in our and our competitors' results of operations; |
| · | changes in earnings estimates or recommendations by securities analysts, if our common stock is covered by analysts; |
| · | successes or challenges in our collaborative arrangements or alternative funding sources; |
| · | developments in the health care and life science industries; |
| · | the results of product liability or intellectual property lawsuits; |
| · | future issuances of common stock or other securities; |
| · | the addition or departure of key personnel; |
| · | announcements by us or our competitors of acquisitions, investments or strategic alliances; and |
| · | general market conditions and other factors, including factors unrelated to our operating performance. |
Further, the stock market in general, and the market for health care and life science companies in particular, has recently experienced extreme price and volume fluctuations. The volatility of our common stock is further exacerbated due to its low trading volume. Continued market fluctuations could result in extreme volatility in the price of our common stock, which could cause a decline in the value of our common stock and the loss of some or all of your investment.
Trading of our common stock is limited, and trading restrictions imposed on us by applicable regulations may further reduce trading in our common stock, making it difficult for our stockholders to sell their shares; and future sales of common stock could reduce our stock price.
Trading of our common stock is currently conducted on the Nasdaq Capital Market. The liquidity of our common stock is limited, not only in terms of the number of shares that can be bought and sold at a given price, but also as it may be adversely affected by delays in the timing of transactions and reduction in security analysts' and the media's coverage of us, if at all. Currently, approximately 9% of our common stock, on a fully diluted basis, is held by officers, directors and their affiliates, each of whom is subject to certain restrictions with regard to trading our common stock. This ownership may result in different prices for our common stock than might otherwise be obtained in a more liquid market and could also result in a larger spread between the bid and asked prices for our common stock. In addition, following the reverse stock split, without a large public float, our common stock is less liquid than the stock of companies with broader public ownership, and, as a result, the trading prices of our common stock may be more volatile. In the absence of an active public trading market, an investor may be unable to liquidate his investment in our common stock. Trading of a relatively small volume of our common stock may have a greater impact on the trading price of our stock than would be the case if our public float were larger. We cannot predict the prices at which our common stock will trade in the future, if at all.
The exercise of outstanding common stock purchase warrants and stock options will have a dilutive effect on the percentage ownership of our capital stock by existing stockholders.
As of April 2, 2018, we had outstanding warrants to acquire 4,198,876 shares of our common stock, and stock options to purchase 220,102 shares of our common stock. The expiration of the term of such options and warrants range from March 2019 to February 2025. A significant number of such warrants are out of the money, but the holders have the right to effect a cashless exercise of such warrants. If a significant number of such warrants and stock options are exercised by the holders, the percentage of our common stock owned by our existing stockholders will be diluted.
25
We have never paid dividends on our capital stock, and we do not anticipate paying dividends in the foreseeable future.
We have never paid dividends on any of our capital stock and currently intend to retain any future earnings to fund the growth of our business. In addition, an amended and restated promissory note issued in June 2017 to MGHIF, and the related security agreement restricts our ability to pay cash dividends on our common stock. We may also enter into credit agreements or other borrowing arrangements in the future that will restrict our ability to declare or pay cash dividends on our common stock. Any determination to pay dividends in the future will be at the discretion of our Board of Directors and will depend on our financial condition, operating results, capital requirements, general business conditions and other factors that our Board of Directors may deem relevant. As a result, capital appreciation, if any, of our common stock will be the sole source of gain for the foreseeable future.
We issued warrants to purchase an aggregate of 25,102 shares of common stock to jVen Capital and MGHIF in connection with the bridge financing transactions. These warrants must be revalued each reporting period. Such assessments involve the use of estimates that could later be found to differ materially from actual results, which could have an adverse effect on our financial condition.
In June and July 2017, we issued warrants to purchase an aggregate 25,102 shares of common stock to jVen Capital and MGHIF in connection with the bridge financing transactions. Each of these warrants has a put feature that allow the holder to put the warrants back to the Company for cash equal to the Black-Scholes value upon a change of control or fundamental transaction. The warrants are each recorded as a liability on our financial statements, and we are required to revalue each of the warrants each financial quarter. Such revaluations necessarily involve the use of estimates, assumptions, probabilities and application of complex accounting principles. Actual value at the time the warrants are exercised could vary significantly from the value assigned to such liabilities on a quarterly basis. We cannot assure you that the revaluation of the warrants will equal the value in the future, and know that the actual value could be significantly different, which could have a material adverse effect on our financial condition. In addition, as these warrants will be valued based upon the Black-Scholes value, which assesses a value to the warrants even if the exercise price is below the current fair market value of the underlying security, warrant holders could get a disproportionate amount of the consideration upon a change of control or fundamental transaction under certain circumstances.
We are an emerging growth company and have elected to comply with reduced public company reporting requirements applicable to emerging growth companies, which could make our common stock less attractive to investors.
We are an emerging growth company, as defined under the Securities Act. We will remain an emerging growth company until May 2020, although if our revenue exceeds $1.07 billion in any fiscal year before that time, we would cease to be an emerging growth company as of the end of that fiscal year. In addition, if the market value of our common stock that is held by non-affiliates exceeds $700 million as of the last business day of our second fiscal quarter of any fiscal year before May 2020, we would cease to be an emerging growth company as of December 31 of that year. As an emerging growth company, we take advantage of exemptions from various reporting requirements applicable to certain other public companies, including not being required to comply with the auditor attestation requirements of Section 404 of the Sarbanes-Oxley Act, reduced financial statement and financial-related disclosures, reduced disclosure obligations regarding executive compensation in our periodic reports and proxy statements, and exemptions from the requirement of holding a nonbinding advisory vote on executive compensation and obtaining stockholder approval of any golden parachute payments not previously approved by our stockholders. We cannot predict whether investors will find our common stock less attractive if we choose to rely on any of these exemptions. If some investors find our common stock less attractive as a result of any choices to reduce future disclosure we may make, there may be a less active trading market for our common stock and our stock price may be more volatile.
26
Risks Related to Regulation of Our Business
If we fail to comply with federal, state and foreign laboratory licensing requirements, we could lose the ability to perform our tests or experience disruptions to our business.
We are subject to CLIA for our Acuitas MDRO tests, a federal law that regulates clinical laboratories that perform testing on specimens derived from humans for the purpose of providing information for the diagnosis, prevention or treatment of disease. CLIA regulations mandate specific standards in the areas of personnel qualifications, administration and participation in proficiency testing, patient test management and quality assurance. CLIA certification is also required in order for us to be eligible to bill state and federal healthcare programs, as well as many private third-party payors. To renew these certifications, we are subject to survey and inspection every two years. Moreover, CLIA inspectors may make random inspections of our clinical reference laboratories.
We are also required to maintain state licenses to conduct testing in our laboratories. Maryland law requires that we maintain a state license and establishes standards for the day-to- day operation of our clinical reference laboratory in Gaithersburg, including the training and skills required of personnel and quality control matters. In addition, our clinical reference laboratory is required to be licensed on a test-specific basis by New York State. New York law also mandates proficiency testing for laboratories licensed under New York state law, regardless of whether such laboratories are located in New York. Moreover, several other states including California, Pennsylvania, and Florida require that we hold licenses to test samples from patients in those states. Other states may adopt similar requirements in the future.
If we were to lose, or have restrictions imposed on, our CLIA certificate or Maryland license for our Gaithersburg laboratory, whether as a result of revocation, suspension or limitation, we would no longer be able to perform our test products, which would eliminate our primary source of revenue and harm our business. If we cannot secure a license from states where we are required to hold licenses, we will not be able to test specimens from those states.
A number of the rapid diagnostic products are regulated by the FDA and non-U.S. regulatory authorities. If we or our suppliers fail to comply with ongoing FDA, or other foreign regulatory authority, requirements, or if we experience unanticipated problems with the products, these products could be subject to restrictions or withdrawal from the market.
We do not have significant experience in complying with the rules and regulations of the FDA and foreign regulatory authorities. The rapid diagnostic products regulated as medical devices, and the manufacturing processes, reporting requirements, post-approval clinical data and promotional activities for such products, are subject to continued regulatory review, oversight and periodic inspections by the FDA and other domestic and foreign regulatory bodies. In particular, we and our suppliers are required to comply with FDA's QSR regulations for the manufacture, labeling, distribution and promotion of the QuickFISH products and other regulations which cover the methods and documentation of the design, testing, production, control, quality assurance, labeling, packaging, storage and shipping of any product for which we obtain clearance or approval, and with ISO regulations. The FDA enforces the QSR and similarly, other regulatory bodies with similar regulations enforce those regulations through periodic inspections. The failure by us or one of our suppliers to comply with applicable statutes and regulations administered by the FDA and other regulatory bodies, or the failure to timely and adequately respond to any adverse inspectional observations or product safety issues, could result in, among other things, any of the following enforcement actions against us: (1) untitled letters, Form 483 observation letters, warning letters, fines, injunctions, consent decrees and civil penalties; (2) unanticipated expenditures to address or defend such actions; (3) customer notifications for repair, replacement and refunds; (4) recall, detention or seizure of our products; (5) operating restrictions or partial suspension or total shutdown of production; (6) refusing or delaying our requests for 510(k) clearance or premarket approval of new products or modified products; (7) operating restrictions; (8) withdrawing 510(k) clearances or PMA approvals that have already been granted; (9) refusal to grant export approval for our products; or (10) criminal prosecution.
If any of these actions were to occur it could harm our reputation and cause our product sales and profitability to suffer and may prevent us from generating revenue. Furthermore, if any of our key component suppliers are not in compliance with all applicable regulatory requirements we may be unable to produce our products on a timely basis and in the required quantities, if at all.
27
We and our suppliers are also subject to periodic inspections by the FDA to determine compliance with the FDA's requirements, including primarily the QSR and medical device reporting regulations. The results of these inspections can include inspectional observations on FDA's Form 483, untitled letters, warning letters, or other forms of enforcement. Since 2009, the FDA has significantly increased its oversight of companies subject to its regulations, by hiring new investigators and stepping up inspections of manufacturing facilities. The FDA has recently also significantly increased the number of warning letters issued to companies. If the FDA were to conclude that we are not in compliance with applicable laws or regulations, or that any of our FDA-cleared products are ineffective or pose an unreasonable health risk, the FDA could take a number of regulatory actions, including but not limited to, preventing us from manufacturing any or all of our devices or performing laboratory testing on human specimens, which could materially adversely affect our business.
Some of the clearances obtained are subject to limitations on the intended uses for which the product may be marketed, which can reduce our potential to successfully commercialize the product and generate revenue from the product. If the FDA determines that our promotional materials, labeling, training or other marketing or educational activities constitute promotion of an unapproved use, it could request that we cease or modify our training or promotional materials or subject us to regulatory enforcement actions. It is also possible that other federal, state or foreign enforcement authorities might take action if they consider our training or other promotional materials to constitute promotion of an unapproved use, which could result in significant fines or penalties under other statutory authorities, such as laws prohibiting false claims for reimbursement.
In addition, we may be required to conduct costly post-market testing and surveillance to monitor the safety or effectiveness of our products, and we must comply with medical device reporting requirements, including the reporting of adverse events and malfunctions related to our products. Later discovery of previously unknown problems with our products, including unanticipated adverse events or adverse events of unanticipated severity or frequency, manufacturing problems, or failure to comply with regulatory requirements such as QSR, may result in changes to labeling, restrictions on such products or manufacturing processes, withdrawal of the products from the market, voluntary or mandatory recalls, a requirement to repair, replace or refund the cost of any medical device we manufacture or distribute, fines, suspension of regulatory approvals, product seizures, injunctions or the imposition of civil or criminal penalties which would adversely affect our business, operating results and prospects.
If we were to lose, or have restrictions imposed on, FDA clearances received to date, or clearances we may receive in the future, our business, operations, financial condition and results of operations would likely be significantly adversely affected.
If the FDA were to begin regulating our laboratory tests, we could incur substantial costs and delays associated with trying to obtain premarket clearance or other approvals.
Clinical laboratory tests, like our Acuitas MDRO Gene Test, are regulated under CLIA, as well as by applicable state laws. Historically, most LDTs were not subject to FDA regulations applicable to medical devices, although reagents, instruments, software or components provided by third parties and used to perform LDTs may be subject to regulation. The FDA defines the term "laboratory developed test" as an IVD test that is intended for clinical use and designed, manufactured and used within a single laboratory. We believe that our Acuitas MDRO test products are LDTs. Until 2014, the FDA exercised enforcement discretion such that it did not enforce provisions of the Food, Drug, and Cosmetic Act (the "FDA Act") with respect to LDTs. In July 2014, due to the increased proliferation of LDTs for complex diagnostic testing and concerns with several high-risk LDTs related to lack of evidentiary support for claims, erroneous results and falsification of data, the FDA issued a Notification to Congress that it intended to issue a draft guidance that, when and if finalized, would likely adopt a risk-based framework that would increase FDA oversight of LDTs. The FDA issued draft guidance in October 2014, informing manufacturers of LDTs of its intent to collect information from laboratories regarding their current LDTs and newly developed LDTs through a notification process. The FDA will use this information to classify LDTs and to prioritize enforcement of premarket review requirements for categories of LDTs based on risk, using a public process. Specifically, the FDA plans to use advisory panels to provide recommendations to the agency on LDT risks, classification and prioritization of enforcement of applicable regulatory requirements on certain categories of LDTs, as appropriate. In November 2016, the FDA announced that a final LDT Policy guidance would not be issued to allow for further public discussion on an appropriate oversight approach, to give the FDA's congressional authorizing committees the opportunity to develop a legislative solution to LDT regulation. The FDA further elaborated in January 2017, through a discussion paper, the agency's intended framework for potential regulation while also confirming that the FDA intends to continue to exercise enforcement discretion over LDTs at this time.
28
We cannot provide any assurance that FDA regulation, including premarket review, will not be required in the future for our tests, whether through additional guidance or regulations issued by the FDA, new enforcement policies adopted by the FDA or new legislation enacted by Congress. It is possible that legislation will be enacted into law, regulations could be promulgated or guidance could be issued by the FDA which may result in increased regulatory burdens for us to continue to offer our tests or to develop and introduce new tests. We cannot predict the timing or content of future legislation enacted, regulations promulgated or guidance issued regarding LDTs, or how it will affect our business.
If FDA premarket review, including clearance or approval, is required for our Acuitas MDRO test products or any of our future tests (either alone or together with sample collection devices), products or services we may develop, or we decide to voluntarily pursue FDA clearance or approval, we may be forced to stop selling our tests while we work to obtain such FDA clearance or approval. Our business would be negatively affected until such review was completed and clearance to market or approval was obtained. The regulatory process may involve, among other things, successfully completing additional clinical studies and submitting premarket notification or filing a premarket approval application with the FDA. If premarket review is required by the FDA or if we decide to voluntarily pursue FDA premarket review of our tests, there can be no assurance that our Acuitas MDRO Gene Test or any tests, products or services we may develop in the future will be cleared or approved on a timely basis, if at all, nor can there be assurance that labeling claims will be consistent with our current claims or adequate to support continued adoption of our tests. If our tests are allowed to remain on the market but there is uncertainty in the marketplace about our tests, if we are required by the FDA to label them investigational, or if labeling claims the FDA allows us to make are limited, orders may decline. Ongoing compliance with FDA regulations would increase the cost of conducting our business, and subject us to heightened regulation by the FDA and penalties for failure to comply with these requirements.
If we are required to but fail to maintain regulatory approvals and clearances, or are unable to obtain, or experience significant delays in obtaining, FDA clearances or approvals for our products or product enhancements, our ability to commercially distribute and market our products could suffer.
If the FDA determines that enforcement discretion is not appropriate or that LDTs are generally subject to FDA regulation and that premarket review, including clearance or approval, is required for our Acuitas MDRO Gene Test or any of our future tests, diagnostic test kits that we may develop, or other products that would be classified as medical devices, the process of obtaining regulatory clearances or approvals to market a medical device can be costly and time consuming, and we may not be able to obtain these clearances or approvals on a timely basis, if at all. In particular, the FDA permits commercial distribution of a new medical device only after the device has received clearance under Section 510(k) of the FDA Act, or is the subject of an approved PMA, unless the device is specifically exempt from those requirements. The FDA will clear marketing of a lower risk medical device through the 510(k) process if the manufacturer demonstrates that the new product is substantially equivalent to other 510(k)-cleared products. High risk devices deemed to pose the greatest risk, such as life-sustaining, life-supporting, or implantable devices, or devices not deemed substantially equivalent to a previously cleared device, require the approval of a PMA. The PMA process is more costly, lengthy and uncertain than the 510(k) clearance process. A PMA application must be supported by extensive data, including, but not limited to, technical, preclinical, clinical trial, manufacturing and labeling data, to demonstrate to the FDA's satisfaction the safety and efficacy of the device for its intended use. Our currently commercialized products have not received FDA clearance or approval, as they are marketed under the FDA's enforcement discretion for LDTs or are class I medical devices, which are exempt from the requirement for FDA clearance or approval.
Our failure to comply with U.S. federal, state and foreign governmental regulations could lead to the issuance of warning letters or untitled letters, the imposition of injunctions, suspensions or loss of regulatory clearance or approvals, product recalls, termination of distribution, product seizures or civil penalties. In the most extreme cases, criminal sanctions or closure of our manufacturing facility are possible.
29
Modifications to our marketed products may require new 510(k) clearances or PMA approvals, or may require us to cease marketing or recall the modified products until clearances or approvals are obtained.
If we are required to obtain 510(k) clearance or PMA approval for any of our current or future products, any modification to those products would require additional clearances or approvals. Modifications to a 510(k)-cleared device that could significantly affect its safety or efficacy, or that would constitute a major change in its intended use, requires a new 510(k) clearance or, possibly, a PMA. The FDA requires every manufacturer to make this determination in the first instance, but the FDA may review the manufacturer's decision. The FDA may not agree with our decisions regarding whether new clearances or approvals are necessary. If the FDA requires us to seek 510(k) clearance or a PMA for any modification to a previously cleared product, we may be required to cease marketing and distributing, or to recall the modified product until we obtain such clearance or approval, and we may be subject to significant regulatory fines or penalties. Further, our products could be subject to recall if the FDA determines, for any reason, that our products are not safe or effective. Any recall or FDA requirement that we seek additional approvals or clearances could result in significant delays, fines, increased costs associated with modification of a product, loss of revenue and potential operating restrictions imposed by the FDA.
There is no guarantee that the FDA will grant 510(k) clearance or PMA approval of our future products, and failure to obtain necessary clearances or approvals for our future products would adversely affect our ability to grow our business.
Some of our future products may require 510(k) clearance from the FDA. Other products, potentially, could require PMA approval. In addition, some of our new products may require clinical trials to support regulatory approval and we may not successfully complete these clinical trials. The FDA may not approve or clear these products for the indications that are necessary or desirable for successful commercialization. Indeed, the FDA may refuse our requests for 510(k) clearance or premarket approval of new products. Failure to receive a required clearance or approval for our new products would have an adverse effect on our ability to expand our business.
Our products may in the future be subject to product recalls that could harm our reputation, business and financial results.
The FDA and similar foreign governmental authorities have the authority to require the recall of regulated products in the event of material deficiencies or defects in design or manufacture. In the case of the FDA, the authority to require a recall must be based on an FDA finding that there is a reasonable probability that the device would cause serious injury or death. In addition, foreign governmental bodies have the authority to require the recall of our products in the event of material deficiencies or defects in design or manufacture.
Manufacturers may, under their own initiative, recall a product if any material deficiency in a device is found. A government-mandated or voluntary recall by us or one of our distributors could occur as a result of component failures, manufacturing errors, design or labeling defects or other deficiencies and issues. Recalls of any of our products would divert managerial and financial resources and have an adverse effect on our financial condition and results of operations. The FDA requires that certain classifications of recalls be reported to the FDA within 10 working days after the recall is initiated. Companies are required to maintain certain records of recalls, even if they are not reportable to the FDA. We may initiate voluntary recalls involving our products in the future that we determine do not require notification of the FDA. If the FDA disagrees with our determinations, they could require us to report those actions as recalls. A future recall announcement could harm our reputation with customers and negatively affect our sales. In addition, the FDA could take enforcement action for failing to report the recalls when they were conducted.
If our products cause or contribute to a death or a serious injury, or malfunction in certain ways, we will be subject to medical device reporting regulations, which can result in voluntary corrective actions or agency enforcement actions.
Under the FDA medical device reporting regulations, medical device and LDT manufacturers are required to report to the FDA information that a device or LDT has or may have caused or contributed to a death or serious injury or has malfunctioned in a way that would likely cause or contribute to death or serious injury if the malfunction of the device or one of our similar devices were to recur. If we fail to report these events to the FDA within the required timeframes, or at all, the FDA could take enforcement action against us. Any such adverse event involving our products also could result in future voluntary corrective actions, such as recalls or customer notifications, or agency action, such as inspection or enforcement action. Any corrective action, whether voluntary or involuntary, as well as defending ourselves in a lawsuit, will require the dedication of our time and capital, distract management from operating our business, and may harm our reputation and financial results.
30
We may be subject to fines, penalties or injunctions if we are determined to be promoting the use of our products for unapproved or "off-label" uses.
We believe that our Acuitas MDRO test products are LDTs, subject to the FDA's enforcement discretion. To remain within the FDA's enforcement discretion, we are restricted in the ways we can promote and market our products. We believe that our promotional activities for our products fall within the scope of the FDA's enforcement discretion and applicable premarket exemptions. However, the FDA could disagree and require us to stop promoting our Acuitas MDRO products in certain ways unless and until we obtain FDA clearance or approval for them, or our FDA-cleared products for unapproved or "off-label" uses unless and until we obtain FDA clearance or approval for those uses. In addition, because our Acuitas MDRO products are not currently cleared or approved by the FDA, if the FDA determines that our promotional materials constitute promotion of a use for which premarket clearance or approval is required, it could request that we modify our promotional materials or subject us to regulatory or enforcement actions, including, but not limited to, the issuance of an untitled letter, a Form 483 letter, a warning letter, injunction, seizure, civil fine and criminal penalties. It is also possible that other federal, state or foreign enforcement authorities might take action if they consider our promotional materials to constitute promotion of an unapproved use, which could result in significant fines or penalties under other statutory authorities, such as laws prohibiting false claims for reimbursement. In that event, our reputation could be damaged and adoption of the products would be impaired.
We may generate a larger portion of our future revenue internationally and would then be subject to increased risks relating to international activities which could adversely affect our operating results.
We believe that a portion of our future revenue growth will come from international sources as we implement and expand overseas operations. Engaging in international business involves a number of difficulties and risks, including:
| · | required compliance with existing and changing foreign health care and other regulatory requirements and laws, such as those relating to patient privacy; |
| · | required compliance with anti-bribery laws, such as the U.S. Foreign Corrupt Practices Act, or FCPA, and U.K. Bribery Act, data privacy requirements, labor laws and anti- competition regulations; |
| · | export or import restrictions; |
| · | various reimbursement and insurance regimes; |
| · | laws and business practices favoring local companies; |
| · | longer payment cycles and difficulties in enforcing agreements and collecting receivables through certain foreign legal systems; |
| · | political and economic instability; |
| · | potentially adverse tax consequences, tariffs, customs charges, bureaucratic requirements and other trade barriers; |
| · | foreign exchange controls; |
| · | difficulties and costs of staffing and managing foreign operations; and |
| · | difficulties protecting or procuring intellectual property rights. |
As we expand internationally, our results of operations and cash flows would become increasingly subject to fluctuations due to changes in foreign currency exchange rates. Our expenses are generally denominated in the currencies in which our operations are located, which is in the United States. If the value of the U.S. dollar increases relative to foreign currencies in the future, in the absence of a corresponding change in local currency prices, our future revenue could be adversely affected as we convert future revenue from local currencies to U.S. dollars. If we dedicate resources to our international operations and are unable to manage these risks effectively, our business, operating results and prospects will suffer.
31
We face the risk of potential liability under the FCPA for past international distributions of products and to the extent we distribute products or otherwise operate internationally in the future.
In the past, we have distributed certain of our products internationally, and in the future we may distribute our products internationally and possibly engage in additional international operations. The FCPA prohibits companies such as us from engaging, directly or indirectly, in making payments to foreign government and political officials for the purpose of obtaining or retaining business or securing any other improper advantage, including, among other things, the distribution of products and other international business operations. Like other U.S. companies operating abroad, we may face liability under the FCPA if we, or third parties we have used to distribute our products or otherwise advance our international business, have violated the FCPA. Any violations of these laws, or allegations of such violations, could disrupt our operations, involve significant management distraction, involve significant costs and expenses, including legal fees, and could result in a material adverse effect on our business, prospects, financial condition or results of operations. We could also suffer severe penalties, including criminal and civil penalties, disgorgement and other remedial measures.
Risks Related to Compliance with Healthcare and Other Regulations
Changes in healthcare policy, including legislation reforming the U.S. healthcare system, may have a material adverse effect on our financial condition and operations.
In March 2010 both the Patient Protection and Affordable Care Act, or Affordable Care Act, and the reconciliation law known as Health Care and Education Reconciliation Act, with the Affordable Care Act, the 2010 Health Care Reform Legislation, were enacted. The constitutionality of the 2010 Health Care Reform Legislation was confirmed twice by the Supreme Court of the United States. The 2010 Health Care Reform Legislation has changed the existing state of the health care system by expanding coverage through voluntary state Medicaid expansion, attracting previously uninsured persons through the new health care insurance exchanges and by modifying the methodology for reimbursing medical services, drugs and devices. The U.S. Congress is seeking to replace the 2010 Health Care Reform Legislation. At this time the Company is not certain as to the impact of federal health care legislation on its business.
The 2010 Health Care Reform Legislation subjects manufacturers of medical devices to an excise tax of 2.3% on certain U.S. sales of medical devices beginning in January 2013. This excise tax has been suspended currently, and we anticipate that this may be repealed. If eventually implemented, this excise tax will likely increase our expenses in the future.
Further, the 2010 Health Care Reform Legislation includes the Open Payments Act (formerly referred to as the Physician Payments Sunshine Act), which, in conjunction with its implementing regulations, requires manufacturers of certain drugs, biologics, and devices that are reimbursed by Medicare, Medicaid and the Children's Health Insurance Program to report annually certain payments or "transfers of value" provided to physicians and teaching hospitals and to report annually ownership and investment interests held by physicians and their immediate family members during the preceding calendar year. We have provided reports under the Open Payments Act to the CMS since 2013. The failure to report appropriate data accurately, timely, and completely could subject us to significant financial penalties. Other countries and several states currently have similar laws and more may enact similar legislation.
We cannot predict whether future healthcare initiatives will be implemented at the federal or state level or in countries outside of the United States in which we may do business, or the effect any future legislation or regulation will have on us. The taxes imposed by the new federal legislation and the expansion in government's effect on the United States healthcare industry may result in decreased profits to us, which may adversely affect our business, financial condition and results of operations.
32
Failure in our information technology, storage systems or our digital platform technology could significantly disrupt our operations and our research and development efforts, which could adversely impact our revenues, as well as our research, development and commercialization efforts.
Our ability to execute our business strategy depends, in part, on the continued and uninterrupted performance of our information technology systems, which support our operations and our research and development efforts, as well as our storage systems and our analyzers. Due to the sophisticated nature of the technology we use in our products and service offerings, including our Acuitas Lighthouse services, we are substantially dependent on our information technology systems. Information technology systems are vulnerable to damage from a variety of sources, including telecommunications or network failures, malicious human acts and natural disasters. Moreover, despite network security and back-up measures, some of our servers are potentially vulnerable to physical or electronic break-ins, computer viruses and similar disruptive problems. Despite the precautionary measures we have taken to prevent unanticipated problems that could affect our information technology systems, sustained or repeated system failures that interrupt our ability to generate and maintain data, and in particular to operate our digital immunoassay platform, could adversely affect our ability to operate our business. Any interruption in the operation of our digital immunoassay platform, due to information technology system failures, part failures or potential disruptions in the event we are required to relocate our instruments within our facility or to another facility, could have an adverse effect on our operations.
Security breaches, loss of data and other disruptions could compromise sensitive information related to our business or prevent us from accessing critical information and expose us to liability, which could adversely affect our business and our reputation.
In the ordinary course of our business, we collect and store sensitive data, including legally protected health information and personally identifiable information about our customers and their patients. We also store sensitive intellectual property and other proprietary business information, including that of our customers. We manage and maintain our applications and data utilizing a combination of on-site systems and cloud-based data center systems. These applications and data encompass a wide variety of business critical information, including research and development information, commercial information and business and financial information.
We face four primary risks relative to protecting this critical information: loss of access risk, inappropriate disclosure risk, inappropriate modification risk and the risk of our being unable to identify and audit our controls over the first three risks.
We are highly dependent on information technology networks and systems, including the Internet, to securely process, transmit and store this critical information. Security breaches of this infrastructure, including physical or electronic break-ins, computer viruses, attacks by hackers and similar breaches, can create system disruptions, shutdowns or unauthorized disclosure or modification of confidential information. The secure processing, storage, maintenance and transmission of this critical information is vital to our operations and business strategy, and we devote significant resources to protecting such information. Although we take measures to protect sensitive information from unauthorized access or disclosure, our information technology and infrastructure may be vulnerable to attacks by hackers or viruses or breached due to employee error, malfeasance or other disruptions.
A security breach or privacy violation that leads to disclosure or modification of or prevents access to consumer information (including personally identifiable information or protected health information) could harm our reputation, compel us to comply with disparate state breach notification laws, require us to verify the correctness of database contents and otherwise subject us to liability under laws that protect personal data, resulting in increased costs or loss of revenue. If we are unable to prevent such security breaches or privacy violations or implement satisfactory remedial measures, our operations could be disrupted, and we may suffer loss of reputation, financial loss and other regulatory penalties because of lost or misappropriated information, including sensitive consumer data. In addition, these breaches and other inappropriate access can be difficult to detect, and any delay in identifying them may lead to increased harm of the type described above.
Any such breach or interruption could compromise our networks, and the information stored there could be inaccessible or could be accessed by unauthorized parties, publicly disclosed, lost or stolen. Any such interruption in access, improper access, disclosure or other loss of information could result in legal claims or proceedings, liability under laws that protect the privacy of personal information, such as the federal HIPAA and regulatory penalties. Unauthorized access, loss or dissemination could also disrupt our operations, including our ability to perform tests, provide test results, bill facilities or patients, process claims and appeals, provide customer assistance services, conduct research and development activities, collect, process and prepare Company financial information, provide information about our current and future solutions and other patient and clinician education and outreach efforts through our website, and manage the administrative aspects of our business and damage our reputation, any of which could adversely affect our business. Any such breach could also result in the compromise of our trade secrets and other proprietary information, which could adversely affect our competitive position.
33
In addition, the interpretation and application of consumer, health-related, privacy and data protection laws in the U.S. and elsewhere are often uncertain, contradictory and in flux. It is possible that these laws may be interpreted and applied in a manner that is inconsistent with our practices. If so, this could result in government-imposed fines or orders requiring that we change our practices, which could adversely affect our business. Complying with these various laws could cause us to incur substantial costs or require us to change our business practices and compliance procedures in a manner adverse to our business.
Payments for our tests and other services could decline because of factors beyond our control.
If hospital patient volumes drop as a result of severe economic conditions, or other unforeseen changes in healthcare provision or affordability, individual hospitals and health systems may be less willing to invest in our products and services. In addition, state and federal funds that are anticipated to be invested in the National Strategy for Combating Antibiotic-Resistant Bacteria could be reduced. If such funds are reduced, the market for our products would be impacted, which may affect our ability to generate revenues.
We are subject to potential enforcement actions involving false claims, kickbacks, physician self-referral or other federal or state fraud and abuse laws, and we could incur significant civil and criminal sanctions, which would hurt our business.
The government has made enforcement of the false claims, anti-kickback, physician self-referral and various other fraud and abuse laws a major priority. In many instances, private whistleblowers also are authorized to enforce these laws even if government authorities choose not to do so. Several clinical diagnostic laboratories and members of their management have been the subject of this enforcement scrutiny, which has resulted in very significant civil and criminal settlement payments. In most of these cases, private whistleblowers brought the allegations to the attention of federal enforcement agencies. The risk of our being found in violation of these laws and regulations is increased by the fact that some of the laws and regulations have not been fully interpreted by the regulatory authorities or the courts, and their provisions are open to a variety of interpretations. We could be subject to enforcement actions under the following laws:
| · | the federal Anti-Kickback Statute, which constrains certain marketing practices, educational programs, pricing policies and relationships with healthcare providers or other entities by prohibiting, among other things, soliciting, receiving, offering or paying remuneration, directly or indirectly, to induce or in return for, the purchase or recommendation of an item or service reimbursable under a federal healthcare program, such as the Medicare and Medicaid programs; |
| · | federal civil and criminal false claims laws and civil monetary penalty laws, which prohibit, among other things, individuals or entities from knowingly presenting, or causing to be presented, claims for payment from Medicare, Medicaid, or other third party payors that are false or fraudulent; |
| · | federal physician self-referral laws, such as the Stark Law, which prohibit a physician from making a referral to a provider of certain health services with which the physician or the physician's family member has a financial interest, and prohibit submission of a claim for reimbursement pursuant to a prohibited referral; and |
| · | state law equivalents of each of the above federal laws, such as anti-kickback and false claims laws, which may apply to items or services reimbursed by any third party payor, including commercial insurers, many of which differ from each other in significant ways and may not have the same effect, thus complicating compliance efforts. |
34
If we or our operations, are found to be in violation of any of these laws and regulations, we may be subject to penalties, including civil and criminal penalties, damages, fines, exclusion from participation in U.S. federal or state healthcare programs, such as Medicare and Medicaid, and the curtailment or restructuring of our operations. We have compliance policies and are in the process of adopting a written compliance plan based on the Health and Human Services' Office of the Inspector General guidance set forth in its model compliance plan for clinical laboratories, and federal and state fraud and abuse laws. We will monitor changes in government enforcement, particularly in these areas, as we grow and expand our business. Any action against us for violation of these laws, even if we successfully defend against it, could cause us to incur significant legal expenses, divert our management's attention from the operation of our business and hurt our reputation. If we were excluded from participation in U.S. federal healthcare programs, we would not be able to receive, or to sell our tests to other parties who receive reimbursement from Medicare, Medicaid and other federal programs, and that could have a material adverse effect on our business.
Risks Related to Our Intellectual Property
If we cannot license rights to use technologies on reasonable terms, we may not be able to commercialize new products in the future.
In the future, we may license third-party technology to develop or commercialize new products. In return for the use of a third party's technology, we may agree to pay the licensor royalties based on sales of our solutions. Royalties are a component of cost of services and affect the margins on our products. We may also need to negotiate licenses to patents and patent applications after introducing a commercial product. Our business may suffer if we are unable to enter into the necessary licenses on acceptable terms, or at all, if any necessary licenses are subsequently terminated, if the licensors fail to abide by the terms of the license or fail to prevent infringement by third parties, or if the licensed patents or other rights are found to be invalid or unenforceable.
If we are unable to protect our intellectual property effectively, our business would be harmed.
We rely on patent protection as well as trademark, copyright, trade secret and other intellectual property rights protection and contractual restrictions to protect our proprietary technologies, all of which provide limited protection and may not adequately protect our rights or permit us to gain or keep any competitive advantage. If we fail to protect our intellectual property, third parties may be able to compete more effectively against us and we may incur substantial litigation costs in our attempts to recover or restrict use of our intellectual property.
In July 2015, we issued a senior secured promissory note, in the principal amount of $1 million to MGHIF. Such promissory note is secured by a lien on our assets, including our intellectual property assets. If we default on our payment obligations under this secured promissory note, MGHIF has the right to control the disposition of our assets, including our intellectual property assets. If such default occurs, and our intellectual property assets are sold or licensed, our business could be materially adversely affected.
We apply for patents covering our products and technologies and uses thereof, as we deem appropriate, however we may fail to apply for patents on important products and technologies in a timely fashion or at all, or we may fail to apply for patents in potentially relevant jurisdictions. It is possible that none of our pending patent applications will result in issued patents in a timely fashion or at all, and even if patents are granted, they may not provide a basis for intellectual property protection of commercially viable products, may not provide us with any competitive advantages, or may be challenged and invalidated by third parties. It is possible that others will design around our current or future patented technologies. We may not be successful in defending any challenges made against our patents or patent applications. Any successful third-party challenge to our patents could result in the unenforceability or invalidity of such patents and increased competition to our business. The outcome of patent litigation can be uncertain and any attempt by us to enforce our patent rights against others may not be successful, or, if successful, may take substantial time and result in substantial cost, and may divert our efforts and attention from other aspects of our business.
The patent positions of life sciences companies can be highly uncertain and involve complex legal and factual questions for which important legal principles remain unresolved. No consistent policy regarding the breadth of claims allowed in such companies' patents has emerged to date in the United States or elsewhere. Courts frequently render opinions in the biotechnology field that may affect the patentability of certain inventions or discoveries, including opinions that may affect the patentability of methods for analyzing or comparing DNA.
35
In particular, the patent positions of companies engaged in the development and commercialization of genomic diagnostic tests, like ours, are particularly uncertain. Various courts, including the U.S. Supreme Court, have recently rendered decisions that affect the scope of patentability of certain inventions or discoveries relating to certain diagnostic tests and related methods. These decisions state, among other things, that patent claims that recite laws of nature (for example, the relationship between blood levels of certain metabolites and the likelihood that a dosage of a specific drug will be ineffective or cause harm) are not themselves patentable. What constitutes a law of nature is uncertain, and it is possible that certain aspects of genetic diagnostics tests would be considered natural laws. Accordingly, the evolving case law in the United States may adversely affect our ability to obtain patents and may facilitate third-party challenges to any owned and licensed patents. The laws of some foreign countries do not protect intellectual property rights to the same extent as the laws of the United States, and we may encounter difficulties protecting and defending such rights in foreign jurisdictions. The legal systems of many other countries do not favor the enforcement of patents and other intellectual property protection, particularly those relating to biotechnology, which could make it difficult for us to stop the infringement of our patents in such countries. Proceedings to enforce our patent rights in foreign jurisdictions could result in substantial cost and divert our efforts and attention from other aspects of our business.
Changes in either the patent laws or in interpretations of patent laws in the United States or other countries may diminish the value of our intellectual property. We cannot predict the breadth of claims that may be allowed or enforced in our patents or in third-party patents. We may not develop additional proprietary products, methods and technologies that are patentable.
In addition to pursuing patents on our technology, we take steps to protect our intellectual property and proprietary technology by entering into agreements, including confidentiality agreements, non-disclosure agreements and intellectual property assignment agreements, with our employees, consultants, academic institutions, corporate partners and, when needed, our advisors. Such agreements may not be enforceable or may not provide meaningful protection for our trade secrets or other proprietary information in the event of unauthorized use or disclosure or other breaches of the agreements, and we may not be able to prevent such unauthorized disclosure. If we are required to assert our rights against such party, it could result in significant cost and distraction.
Monitoring unauthorized disclosure is difficult, and we do not know whether the steps we have taken to prevent such disclosure are, or will be, adequate. If we were to enforce a claim that a third party had illegally obtained and was using our trade secrets, it would be expensive and time consuming, and the outcome would be unpredictable. In addition, courts outside the United States may be less willing to protect trade secrets.
We may also be subject to claims that our employees have inadvertently or otherwise used or disclosed trade secrets or other proprietary information of third parties, or to claims that we have improperly used or obtained such trade secrets. Litigation may be necessary to defend against these claims. If we fail in defending such claims, in addition to paying monetary damages, we may lose valuable intellectual property rights and face increased competition to our business. A loss of key research personnel work product could hamper or prevent our ability to commercialize potential products, which could harm our business. Even if we are successful in defending against these claims, litigation could result in substantial costs and be a distraction to management.
Further, competitors could attempt to replicate some or all of the competitive advantages we derive from our development efforts, willfully infringe our intellectual property rights, design around our protected technology or develop their own competitive technologies that fall outside of our intellectual property rights. Others may independently develop similar or alternative products and technologies or replicate any of our products and technologies. If our intellectual property does not adequately protect us against competitors' products and methods, our competitive position could be adversely affected, as could our business.
36
We have not yet registered certain of our trademarks in all of our potential markets. If we apply to register these trademarks, our applications may not be allowed for registration in a timely fashion or at all, and our registered trademarks may not be maintained or enforced. In addition, opposition or cancellation proceedings may be filed against our trademark applications and registrations, and our trademarks may not survive such proceedings. If we do not secure registrations for our trademarks, we may encounter more difficulty in enforcing them against third parties than we otherwise would.
To the extent our intellectual property offers inadequate protection, or is found to be invalid or unenforceable, we would be exposed to a greater risk of direct competition. If our intellectual property does not provide adequate coverage of our competitors' products, our competitive position could be adversely affected, as could our business. Both the patent application process and the process of managing patent disputes can be time consuming and expensive.
We may be involved in litigation related to intellectual property, which could be time-intensive and costly and may adversely affect our business, operating results or financial condition.
We may receive notices of claims of direct or indirect infringement or misappropriation or misuse of other parties' proprietary rights from time to time. Some of these claims may lead to litigation. We cannot assure you that we will prevail in such actions, or that other actions alleging misappropriation or misuse by us of third-party trade secrets, infringement by us of third-party patents and trademarks or other rights, or the validity of our patents, trademarks or other rights, will not be asserted or prosecuted against us.
We might not have been the first to make the inventions covered by each of our pending patent applications and we might not have been the first to file patent applications for these inventions. To determine the priority of these inventions, we may have to participate in interference proceedings, derivation proceedings, or other post-grant proceedings declared by the United States Patent and Trademark Office that could result in substantial cost to us. No assurance can be given that other patent applications will not have priority over our patent applications. In addition, recent changes to the patent laws of the United States allow for various post-grant opposition proceedings that have not been extensively tested, and their outcome is therefore uncertain. Furthermore, if third parties bring these proceedings against our patents, we could experience significant costs and management distraction.
Litigation may be necessary for us to enforce our patent and proprietary rights or to determine the scope, coverage and validity of the proprietary rights of others. The outcome of any litigation or other proceeding is inherently uncertain and might not be favorable to us, and we might not be able to obtain licenses to technology that we require on acceptable terms or at all. Further, we could encounter delays in product introductions, or interruptions in product sales, as we develop alternative methods or products. In addition, if we resort to legal proceedings to enforce our intellectual property rights or to determine the validity, scope and coverage of the intellectual property or other proprietary rights of others, the proceedings could be burdensome and expensive, even if we were to prevail. Any litigation that may be necessary in the future could result in substantial costs and diversion of resources and could have a material adverse effect on our business, operating results or financial condition.
37
As we move into new markets and applications for our products, incumbent participants in such markets may assert their patents and other proprietary rights against us as a means of slowing our entry into such markets or as a means to extract substantial license and royalty payments from us. Our competitors and others may now and, in the future, have significantly larger and more mature patent portfolios than we currently have. In addition, future litigation may involve patent holding companies or other adverse patent owners who have no relevant product revenue and against whom our own patents may provide little or no deterrence or protection. Therefore, our commercial success may depend in part on our non-infringement of the patents or proprietary rights of third parties. Numerous significant intellectual property issues have been litigated, and will likely continue to be litigated, between existing and new participants in our existing and targeted markets and competitors may assert that our products infringe their intellectual property rights as part of a business strategy to impede our successful entry into or growth in those markets. Third parties may assert that we are employing their proprietary technology without authorization. In addition, our competitors and others may have patents or may in the future obtain patents and claim that making, having made, using, selling, offering to sell or importing our products infringes these patents. We could incur substantial costs and divert the attention of our management and technical personnel in defending against any of these claims. Parties making claims against us may be able to obtain injunctive or other relief, which could block our ability to develop, commercialize and sell products, and could result in the award of substantial damages against us. In the event of a successful claim of infringement against us, we may be required to pay damages and ongoing royalties, and obtain one or more licenses from third parties, or be prohibited from selling certain products. We may not be able to obtain these licenses on acceptable terms, if at all. We could incur substantial costs related to royalty payments for licenses obtained from third parties, which could negatively affect our financial results. In addition, we could encounter delays in product introductions while we attempt to develop alternative methods or products to avoid infringing third-party patents or proprietary rights. Defense of any lawsuit or failure to obtain any of these licenses could prevent us from commercializing products, and the prohibition of sale of any of our products could materially affect our business and our ability to gain market acceptance for our products.
Furthermore, because of the substantial amount of discovery required in connection with intellectual property litigation, there is a risk that some of our confidential information could be compromised by disclosure during this type of litigation. In addition, during the course of this kind of litigation, there could be public announcements of the results of hearings, motions or other interim proceedings or developments. If securities analysts or investors perceive these results to be negative, it could have a substantial adverse effect on the price of our common stock.
In addition, our agreements with some of our customers, suppliers or other entities with whom we do business require us to defend or indemnify these parties to the extent they become involved in infringement claims, including the types of claims described above. We could also voluntarily agree to defend or indemnify third parties in instances where we are not obligated to do so if we determine it would be important to our business relationships. If we are required or agree to defend or indemnify third parties in connection with any infringement claims, we could incur significant costs and expenses that could adversely affect our business, operating results, or financial condition.
38
INFORMATION REGARDING FORWARD-LOOKING STATEMENTS
This prospectus includes forward-looking statements. All statements other than statements of historical facts contained in this prospectus, including statements regarding our future results of operations and financial position, strategy and plans, and our expectations for future operations, are forward-looking statements. The words "believe," "may," "will," "estimate," "continue," "anticipate," "design," "intend," "expect" or the negative version of these words and similar expressions are intended to identify forward-looking statements. We have based these forward-looking statements on our current expectations and projections about future events and trends that we believe may affect our financial condition, results of operations, strategy, short- and long-term business operations and objectives, and financial needs. These forward-looking statements are subject to a number of risks, uncertainties and assumptions, including those described in "Risk Factors". In light of these risks, uncertainties and assumptions, the forward-looking events and circumstances discussed in this prospectus may not occur, and actual results could differ materially and adversely from those anticipated or implied in the forward-looking statements. Given these uncertainties, you should not place undue reliance on these forward-looking statements. Forward-looking statements include, but are not limited to, statements about:
| · | the completion of our development efforts for the AMR Gene Panel for cUTI and Acuitas Lighthouse Software, and the timing of commercialization; |
| · | our ability to sustain or grow our customer base for our current products; |
| · | our liquidity and working capital requirements, including our cash requirements over the next 12 months; |
| · | our ability to maintain compliance with the ongoing listing requirements for the Nasdaq Capital Market; |
| · | anticipated trends and challenges in our business and the competition that we face; |
| · | the execution of our business plan and our growth strategy; |
| · | our expectations regarding the size of and growth in potential markets; |
| · | our opportunity to successfully enter into new collaborative agreements; |
| · | regulations and changes in laws or regulations applicable to our business, including regulation by the FDA; |
| · | compliance with the U.S. and international regulations applicable to our business; and |
| · | our expectations regarding future revenue and expenses. |
Although we believe that the expectations reflected in the forward-looking statements are reasonable, we cannot guarantee future results, level of activity, performance or achievements. In addition, neither we nor any other person assumes responsibility for the accuracy and completeness of any of these forward-looking statements. These risks should not be construed as exhaustive and should be read in conjunction with our other disclosures, including but not limited to the risk factors described in this prospectus. Other risks may be described from time to time in our filings made under the securities laws. New risks emerge from time to time. It is not possible for our management to predict all risks. All forward-looking statements in this prospectus speak only as of the date made and are based on our current beliefs and expectations. We undertake no obligation to update or revise any forward-looking statement, whether as a result of new information, future events or otherwise.
These factors should not be construed as exhaustive and should be read in conjunction with our other disclosures, including but not limited to the risk factors described in this prospectus. Other risks may be described from time to time in our filings made under the securities laws. New risks emerge from time to time. It is not possible for our management to predict all risks. All forward-looking statements in this prospectus speak only as of the date made and are based on our current beliefs and expectations. We undertake no obligation to update or revise any forward-looking statement, whether as a result of new information, future events or otherwise.
39
USE OF PROCEEDS
We will not receive any amounts pursuant to this offering unless the warrants are exercised for cash. Assuming the exercise of all of the warrants, we will receive gross proceeds of approximately $11.25 million. We will use the net proceeds, if any, of this offering for research and development, including funding the continued development and manufacturing of our AMR Gene Panel that is expected to be released for research use only in the first half of 2018, support acquisitions of products and technologies, capital expenditures, working capital and other general corporate purposes.
The primary programs and activities to which we intend to devote the net proceeds of this offering are:
| · | completion of development of AMR Gene Panel for cUTI and Acuitas Lighthouse Knowledgebase; |
| · | support of acquisitions of products and technologies; |
| · | initial commercialization efforts for the AMR Gene Panel for cUTI and Acuitas Lighthouse Knowledgebase; and |
| · | the balance for general corporate purposes, such as general and administrative expenses, capital expenditures and working capital needs. |
The expected use of net proceeds of this offering represents our current intentions based upon our present plan and business conditions. As of the date of this prospectus, we cannot specify with certainty all of the particular uses for the net proceeds to be received upon the completion of this offering. Our management will have broad discretion in the application of the net proceeds, and investors will be relying on the judgment of our management regarding the application of the proceeds of this offering.
40
CAPITALIZATION
The following table sets forth our capitalization as of December 31, 2017:
| · | on an actual basis; |
| · | on an as adjusted basis, to give further effect to the issuance and sale in this offering of 1,050,000 shares of common stock upon the exercise of the common warrants at an exercise price of $10.625 per share and of the placement agent warrants at an exercise price of $12.50 per share. |
The financial data in the following table should be read in conjunction with our consolidated financial statements for the year ended December 31, 2017, which are included elsewhere in this prospectus
| As of December 31, 2017 | ||||||||
| Actual | As Adjusted | |||||||
| (In thousands, except share and per share data) | ||||||||
| (Unaudited) | ||||||||
| Cash and cash equivalents | $ | 1,847 | $ | 13,097 | ||||
| Short-term debt, net of discount | $ | 1,011 | $ | 1,011 | ||||
| Stockholder's (deficit) equity: | ||||||||
| Common stock, par value $0.01 per share: 200,000,000 shares authorized, 2,265,320 shares issued and outstanding, actual; 200,000,000 shares authorized, 3,315,320 issued and outstanding, as adjusted | 23 | 33 | ||||||
| Additional paid-in capital | 150,115 | 161,354 | ||||||
| Accumulated other comprehensive loss | (26 | ) | (26 | ) | ||||
| Accumulated deficit | (148,710 | ) | (148,710 | ) | ||||
| Total stockholders' equity | 1,402 | 12,651 | ||||||
| Total capitalization | $ | 2,412 | $ | 13,662 | ||||
The number of shares of common stock outstanding in the table above is based on 2,265,320 shares of our common stock outstanding as of December 31, 2017, and excludes:
| · | 5,400 shares of common stock issued upon vesting of restricted stock units since December 31, 2017; |
| · | 178,087 shares of common stock issued pursuant to the exercise of pre-funded warrants since December 31, 2017; |
| · | 139,395 shares of common stock issuable upon the exercise of outstanding options granted as of December 31, 2017, under our equity incentive plans at a weighted average exercise price of $31.16 per share; |
| · | 2,841,152 shares of common stock issued to investors as part of our February 2018 Public Offering; |
| · | 445,028 shares of common stock issuable upon the exercise of outstanding warrants issued as of December 31, 2017, at a weighted average exercise price of $77.15 per share; |
| · | 500 shares of common stock issuable upon vesting of outstanding restricted stock units granted as of December 31, 2017; |
| · | 32,411 shares of common stock available for future issuance under our equity incentive plans as of December 31, 2017; |
41
| · | 1,846,153 shares of common stock issuable upon the exercise of common warrants issued to investors in the February 2018 Public Offering at an exercise price of $3.25 per share; |
| · | 673,077 shares of common stock issuable upon the exercise of pre-funded warrants issued to investors in the February 2018 Public Offering at an exercise price of $0.01 per share; |
| · | 184,615 shares of common stock issuable upon exercise of common warrants issued to investors in the February 2018 Public Offering at an exercise price of $4.0625 per share; and |
| · | 31 fractional shares cashed out as a result of the reverse stock split. |
The number of outstanding options, restricted stock units and shares of common stock available for future issuances under our equity incentive plans does not reflect grants of options to purchase 85,800 shares of our common stock with a weighted average exercise price of $4.02 per share, the expiration of grants to purchase 722 shares of our common stock or forfeitures of options to purchase 4,344 shares of our common stock since December 31, 2017, or the addition of 90,612 shares to the available shares under the 2015 Plan as of January 1, 2018 as a result of the evergreen provision of the 2015 Plan.
The Amendment to our Amended and Restated Certificate of Incorporation, filed on January 17, 2018 to effect the Reverse Stock Split also reduced the number of authorized shares of common stock from 200,000,000 to 50,000,000.
42
DILUTION
Our net tangible book value as of December 31, 2017 was approximately ($553) thousand, or ($0.24) per share. Net tangible book value per share is determined by dividing our total tangible assets, less total liabilities, by the number of shares of our common stock outstanding as of December 31, 2017. Dilution with respect to net tangible book value per share represents the difference between the amount per share paid by purchasers of shares of common stock in this offering and the net tangible book value per share of our common stock immediately after this offering.
After giving effect to the exercise for cash of warrants to acquire 1,050,000 shares that are the subject of this offering for an aggregate exercise price of $11.25 million, our as adjusted net tangible book value as of December 31, 2017 would have been approximately $10.7 million, or $3.23 per share. This represents an immediate increase in net tangible book value of $3.47 per share to existing stockholders and immediate dilution of $7.48 per share to investors purchasing our securities in this offering. The following table illustrates this dilution on a per share basis:
| Weighted average exercise price of warrant shares | $ | 10.71 | ||||||
| Net tangible book value per share of as December 31, 2017 | $ | (0.24 | ) | |||||
| Increase in net tangible book value per share attributable to this offering | $ | 3.47 | ||||||
| As adjusted net tangible book value per share as of December 31, 2017, after giving effect to this offering | $ | 3.23 | ||||||
| Dilution per share to new investors purchasing our common stock in this offering | $ | 7.48 | ||||||
The above discussion and table are based on 2,265,320 shares of our common stock outstanding as of December 31, 2017, and excludes:
| · | 5,400 shares of common stock issued upon vesting of restricted stock units since December 31, 2017; |
| · | 178,087 shares of common stock issued pursuant to the exercise of pre-funded warrants since December 31, 2017; |
| · | 139,395 shares of common stock issuable upon the exercise of outstanding options granted as of December 31, 2017, under our equity incentive plans at a weighted average exercise price of $31.16 per share; |
| · | 2,841,152 shares of common stock issued to investors as part of our February 2018 Public Offering; |
| · | 445,028 shares of common stock issuable upon the exercise of outstanding warrants issued as of December 31, 2017, at a weighted average exercise price of $77.15 per share; |
| · | 500 shares of common stock issuable upon vesting of outstanding restricted stock units granted as of December 31, 2017; |
| · | 32,411 shares of common stock available for future issuance under our equity incentive plans as of December 31, 2017; |
| · | 1,846,153 shares of common stock issuable upon the exercise of common warrants issued to investors in the February 2018 Public Offering at an exercise price of $3.25 per share; |
| · | 673,077 shares of common stock issuable upon the exercise of pre-funded warrants issued to investors in the February 2018 Public Offering at an exercise price of $0.01 per share; |
| · | 184,615 shares of common stock issuable upon exercise of common warrants issued to investors in the February 2018 Public Offering at an exercise price of $4.0625 per share; and |
| · | 31 fractional shares cashed out as a result of the reverse stock split. |
The number of outstanding options, restricted stock units and shares of common stock available for future issuances under our equity incentive plans does not reflect grants of options to purchase 85,800 shares of our common stock with a weighted average exercise price of $4.02 per share, the expiration of grants to purchase 722 shares of our common stock or forfeitures of options to purchase 4,344 shares of our common stock since December 31, 2017, or the addition of 90,612 shares to the available shares under the 2015 Plan as of January 1, 2018 as a result of the evergreen provision of the 2015 Plan.
43
PRICE RANGE FOR OUR COMMON EQUITY AND RELATED SHAREHOLDER MATTERS
Market Information
Our common stock and warrants we issued in our initial public offering, or the IPO Warrants, have traded on the Nasdaq Capital Market under the symbols "OPGN" and "OPGNW," respectively, since May 5, 2015. Prior to such time, there was no public market for our common stock or our warrants. The following table shows the high and low sales price for our common stock and IPO warrants as reported by the Nasdaq Capital Market and as adjusted to reflect our reverse stock split, for the periods indicated:
| High | Low | |||||||
Common Stock: | ||||||||
| Year Ended December 31, 2016 | ||||||||
| First Quarter | $ | 49.20 | $ | 34.00 | ||||
| Second Quarter | $ | 54.50 | $ | 25.50 | ||||
| Third Quarter | $ | 116.25 | $ | 34.00 | ||||
| Fourth Quarter | $ | 77.50 | $ | 21.75 | ||||
IPO Warrants: | ||||||||
| Year Ended December 31, 2016 | ||||||||
| First Quarter | $ | 9.25 | $ | 4.61 | ||||
| Second Quarter | $ | 11.50 | $ | 2.80 | ||||
| Third Quarter | $ | 17.00 | $ | 3.13 | ||||
| Fourth Quarter | $ | 7.48 | $ | 2.01 | ||||
| High | Low | |||||||
Common Stock: | ||||||||
| Year Ended December 31, 2017 | ||||||||
| First Quarter | $ | 46.25 | $ | 24.50 | ||||
| Second Quarter | $ | 31.25 | $ | 13.00 | ||||
| Third Quarter | $ | 16.76 | $ | 5.30 | ||||
| Fourth Quarter | $ | 10.25 | $ | 3.78 | ||||
IPO Warrants: | ||||||||
| Year Ended December 31, 2017 | ||||||||
| First Quarter | $ | 4.50 | $ | 1.50 | ||||
| Second Quarter | $ | 10.00 | $ | 0.88 | ||||
| Third Quarter | $ | 4.88 | $ | 1.50 | ||||
| Fourth Quarter | $ | 2.10 | $ | 0.25 | ||||
| High | Low | |||||||
Common Stock: | ||||||||
| Year Ending December 31, 2018 | ||||||||
| First Quarter | $ | 7.60 | $ | 1.63 | ||||
Second Quarter (through April 2, 2018) | $ | 1.74 | $ | 1.63 | ||||
IPO Warrants: | ||||||||
| Year Ended December 31, 2018 | ||||||||
| First Quarter | $ | 1.37 | $ | 0.12 | ||||
Second Quarter (through April 2, 2018) | $ | 0.50 | $ | 0.50 | ||||
44
Stockholder Information
As of April 2, 2018, there were approximately 34 stockholders of record of our common stock, which does not include stockholders that beneficially own shares held in a "nominee" or in "street" name.
Dividends
No cash dividends have been declared or paid on our common stock to date. We do not anticipate paying cash dividends in the foreseeable future, as we intend to use our revenue and capital to advance our product development and commercialization activities. In addition, the MGHIF Note prohibits us from declaring or paying cash dividends or making cash distributions on any class of our capital stock.
45
DESCRIPTION OF CAPITAL STOCK
Our authorized capital stock consists of 50,000,000 shares of common stock, par value $0.01 per share, and 10,000,000 shares of preferred stock, par value $0.01 per share, of which 7,690,572 shares are available for issuance. The following is a summary of the rights of our common and preferred stock, and the common warrants offered hereby, and some of the provisions of our amended and restated certificate of incorporation and amended and restated bylaws and the Delaware General Corporation Law. Because it is only a summary, it does not contain all of the information that may be important to you. Such summary is subject to and qualified in its entirety by our amended and restated certificate of incorporation and our amended and restated bylaws, a copy of each of which has been incorporated as an exhibit to the registration statement of which this prospectus forms a part.
Following receipt of approval from stockholders at a special meeting held on January 17, 2018, on January 17, 2018, we filed an Amendment to our Amended and Restated Certificate of Incorporation to effect a reverse stock split of the issued and outstanding shares of our common stock, at a ratio of one share for each twenty-five shares outstanding, and to reduce the authorized shares of common stock from 200,000,000 to 50,000,000 shares.
On June 20, 2017, we received a notice from the Listing Qualifications Staff of the Nasdaq Stock Market LLC, or Nasdaq, notifying us that, based upon the closing bid price of our common stock for the last 30 consecutive business days, we no longer met the requirement to maintain a minimum closing bid price of $1.00 per share, as set forth in Nasdaq Listing Rule 5550(a)(2). In accordance with Nasdaq Listing Rule 5810(c)(3)(A), we had a period of 180 calendar days to regain compliance with the rule. On December 21, 2017, the Company received written notification, or the December Notice, from the Listing Qualifications Staff of Nasdaq, or the Staff, indicating that, based upon (i) the Company's continued non-compliance with the minimum bid price rule and (ii) the Company's inability to meet The Nasdaq Capital Market initial listing requirements, specifically maintaining a minimum of stockholders' equity, the Staff had determined that the Company was not eligible for an additional 180 day extension to meet the minimum bid price rule.
In implementing the Reverse Stock Split, the number of shares of our common stock held by each stockholder was reduced by dividing the number of shares held immediately before the Reverse Stock Split by twenty-five and then rounding down to the nearest whole share. We will pay cash to each stockholder in lieu of any fractional interest in a share to which each stockholder would otherwise be entitled as a result of the Reverse Stock Split. The Reverse Stock Split does not affect any stockholder's percentage ownership interest in our Company or proportionate voting power, except to the extent that interests in fractional shares are paid in cash.
In addition, we have adjusted all outstanding shares of any restricted stock units, stock options and warrants entitling the holders to purchase shares of our common stock as a result of the Reverse Stock Split, as required by the terms of these securities. In particular, we have reduced the conversion ratio for each security, and increased the exercise price in accordance with the terms of each security based on Reverse Stock Split ratio (i.e., the number of shares issuable under such securities have been divided by twenty-five, and the exercise price per share has been multiplied by twenty-five). Also, we reduced the number of shares reserved for issuance under our existing 2015 Equity Incentive Plan, or the 2015 Plan, proportionately based on the Reverse Stock Split ratio. The Reverse Stock Split does not otherwise affect any of the rights currently accruing to holders of our common stock, or options or warrants exercisable for our common stock.
Common Stock
Of the authorized common stock, as of April 2, 2018, there were 5,289,919 shares outstanding. As of April 2, 2018, there were 4,419,478 shares of our common stock reserved for the exercise of outstanding stock options, warrants and restricted stock units. There were approximately 34 record holders as of April 2, 2018. The holders of our common stock are entitled to one vote for each share held on all matters submitted to a vote of the stockholders. The holders of our common stock do not have any cumulative voting rights. Holders of our common stock are entitled to receive ratably any dividends declared by the Board of Directors out of funds legally available for that purpose, subject to any preferential dividend rights of any outstanding preferred stock. Our common stock has no preemptive rights, conversion rights or other subscription rights or redemption or sinking fund provisions.
46
Preferred Stock
Series A Convertible Preferred Stock
Of the authorized preferred stock, the Company issued 2,309,428 shares of Series A Convertible Preferred Stock. As of August 10, 2016, no shares of the Series A Convertible Preferred Stock were outstanding. The holder of the Series A Convertible Preferred Stock converted all 2,309,428 shares of Series A Convertible Preferred Stock into 92,377 shares of common stock. All such converted shares of Series A Convertible Preferred Stock were canceled and will not be reissued.
Additional Series of Preferred Stock
Our Board of Directors has the authority, without further action by our stockholders, to issue from time to time 7,690,572 shares of preferred stock in one or more series. Our Board of Directors will have the authority to establish the number of shares to be included in each series and fix the powers, preferences and rights of the shares of each wholly unissued series and any of its qualifications, limitations or restrictions. Our Board of Directors will also be able to increase or decrease the number of shares of any series, but not below the number of shares of that series then outstanding, without any further vote or action by the stockholders.
The issuance of preferred stock could decrease the amount of earnings and assets available for distribution to the holders of common stock or adversely affect the rights and powers, including voting rights, of the holders of common stock. The issuance of preferred stock, while providing flexibility in connection with possible acquisitions and other corporate purposes, could, among other things, have the effect of delaying, deferring or preventing a change in control of our Company, which could depress the market price of our common stock. We have no current plans to issue any additional shares of preferred stock.
Outstanding Warrants
IPO Warrants
The warrants to purchase common stock that we issued in our initial public offering, or the IPO Warrants, entitle the registered holder to purchase one share of common stock at a price equal to $165.00 per share, subject to adjustment as discussed below, immediately following the issuance of such IPO Warrants and terminate at 5:00 p.m., New York City time, on May 8, 2020 or earlier upon the dissolution or winding up of the Company. We have listed the IPO Warrants on the Nasdaq Capital Market, as a standalone security under the symbol "OPGNW."
The IPO Warrants were issued pursuant to a Warrant Agreement between us and our transfer agent as the Warrant Agent. The exercise price and number of shares of common stock issuable upon exercise of the IPO Warrants may be adjusted in certain circumstances, including in the event of a stock dividend or recapitalization, reorganization, merger or consolidation.
The IPO Warrants may be exercised upon surrender of the applicable Warrant Certificate on or prior to the applicable expiration date at the offices of the Warrant Agent, with the exercise form on the reverse side of the Warrant Certificate completed and executed as indicated, accompanied by full payment of the exercise price, by certified or official bank check payable to us, unless such holders are willing to exercise their IPO Warrants on a cashless basis, as further described in this Warrant Agreement, for the number of IPO Warrants being exercised. Under the terms of the Warrant Agreement, we have agreed to use our reasonable best efforts to maintain the effectiveness of a registration statement and prospectus relating to common stock issuable upon exercise of the IPO Warrants until the expiration of the IPO Warrants. The Offered Warrant holders do not have the rights or privileges of holders of common stock or any voting rights until they exercise their IPO Warrants and receive shares of common stock. After the issuance of shares of common stock upon exercise of the IPO Warrants, each holder will be entitled to one vote for each share held of record on all matters to be voted on by stockholders.
47
A holder may not exercise any portion of an Offered Warrant to the extent that the holder, together with its affiliates and any other person or entity acting as a group, would own more than 4.99% of the outstanding common stock after exercise, as such percentage ownership is determined in accordance with the terms of the Offered Warrant. The foregoing limitation on exercise shall not apply to any registered holder of an Offered Warrant who, together with his, her or its affiliates, and any persons acting as a group together with such registered holder and such registered holder's affiliates, owns in excess of 4.99% immediately prior to the closing of this offering. In addition, upon at least 61 days' prior notice from the holder to us, the holder may waive such limitation.
No fractional shares of common stock will be issued upon exercise of the IPO Warrants. If, upon exercise of the Offered Warrant, a holder would be entitled to receive a fractional interest in a share, we will, upon exercise, round to the nearest whole number of shares of common stock to be issued to the Offered Warrant holder. If multiple IPO Warrants are exercised by the holder at the same time, we will aggregate the number of whole shares issuable upon exercise of all the IPO Warrants.
2016 PIPE Warrants
Pursuant to the terms of the Amended & Restated Purchase Agreement, dated as of May 18, 2016, by and among the Company and the purchasers party thereto, the purchasers purchased 362,142 warrants, or the PIPE Warrants, exercisable for an aggregate of 271,606 shares of common stock, or the PIPE Warrant Shares, in the PIPE Financing. The PIPE Warrants are exercisable at an exercise price of $32.8125 per share of common stock, became exercisable 90 days after the date of issuance, and may be exercised for five years from the date of issuance. The exercise price and the number of PIPE Warrant Shares will be adjusted to account for the subdivision or combination by the Company of outstanding shares of common stock. The exercise price may, at any time, also be voluntarily reduced at the discretion of the Board of Directors of the Company. The PIPE Warrants may be exercised pursuant to a cashless exercise, but only if a registration statement covering the resale of the PIPE Warrant Shares that are the subject of an exercise notice is not available for the resale of such PIPE Warrant Shares.
The PIPE Warrants also contain certain provisions providing for liquidated damages to be paid by the Company in the event the Company does not timely deliver registered shares of common stock to the holder upon exercise of a PIPE Warrant. Specifically, in addition to the PIPE Warrant holder's other available remedies, if the Company fails to issue and deliver (or cause to be delivered) to a holder by the required delivery date a certificate representing the shares so delivered to the Company by such holder that is free from all restrictive and other legends, the Company shall pay to a holder in cash, as partial liquidated damages and not as a penalty, an amount equal to 1% of the product of (A) the aggregate number of shares of common stock not issued to the holder on a timely basis and to which the holder is entitled and (B) the closing sale price on the trading day immediately preceding the required delivery date of the certificate, per trading day for each trading day after such required delivery date until such securities are delivered to the holder. In addition, if the Company fails to (i) issue and deliver (or cause to be delivered) to a holder by the required delivery date a certificate representing the shares so delivered to the Company by such holder that is free from all restrictive and other legends or (ii) if after the required delivery date such holder purchases (in an open market transaction or otherwise) shares of common stock to deliver in satisfaction of a sale by such holder of all or any portion of the number of shares of common stock, or a sale of a number of shares of common stock equal to all or any portion of the number of shares of common stock that such holder anticipated receiving from the Company without any restrictive legend, then, the Company shall either (y) pay cash to the holder in an amount equal to the holder's total purchase price (including brokerage commissions and other out-of-pocket expenses, if any) for the shares of common stock so purchased, or the Buy-In Price, at which point the Company's obligation to deliver such shares shall terminate, or (z) promptly honor its obligation to deliver to the holder a certificate or certificates representing such shares and pay cash to the holder in an amount equal to the excess (if any) of the Buy-In Price over the product of (1) such number of shares of common stock that the Company was required to deliver multiplied by (2) the lowest closing sale price of the common stock on any trading day during the period commencing on the date of the delivery by such holder to the Company of the applicable shares (as the case may be) and ending on the date of such delivery and payment under this clause (z).
Warrants issued in Bridge Financing
Pursuant to the Note Purchase Agreement and the underlying transactions, the Company has issued warrants to purchase shares of its common stock to jVen Capital in an amount equal to twenty percent (20%) of the principal of each of the two bridge financing notes issued, or the jVen Capital Warrants, and warrants to purchase shares of its common stock to MGHIF in an amount equal to twenty percent (20%) of the outstanding principal and accrued interest under the amended and restated MGHIF Note on June 28, 2017, the date of issuance. The warrants each have a five year term from issuance, are first exercisable on the date that is six months after the date of issuance and have an exercise price equal to 110% of the closing price of the Company's common stock on the date immediately prior to the date of issuance. The terms of the warrants issued in connection with the Bridge Financing (other than the exercise price and the number of shares) may be amended, in the discretion of the holder, to reflect the terms of the warrants issued in the July 2017 Public Offering.
48
The jVen Capital Warrants each include a blocker provision that prevents the exercise of the jVen Capital Warrants if such exercise, when aggregated with the other issuances contemplated under the Note Purchase Agreement, would violate Nasdaq Listing Rule 5635, unless stockholder approval is first obtained by the Company.
Warrants issued in the July 2017 Public Offering
The Company issued three types of warrants in connection with the July 2017 Public Offering. The common warrants issued in the July 2017 Public Offering entitle the registered holder to purchase one twenty-fifth of a share of common stock at an exercise price of $10.625 per share. The pre-funded warrants issued in the July 2017 Public Offering entitle the registered holders to purchase one twenty-fifth of a share of common stock for an exercise price of $0.25 per share. In addition, the Company issued warrants to the placement agent that have an exercise price of $12.50 per share of common stock. All of the warrants issued in the July 2017 Public Offering are immediately exercisable and have a five-year term from the date of issuance.
Holders of the pre-funded warrants may not exercise any portion of the pre-funded warrant to the extent that such holder would own more than 4.99% of the outstanding common stock immediately after exercise, except that upon at least 61 days' prior notice from the holder to the Company, the holder may increase the amount of ownership of outstanding stock after exercising the holder's pre-funded warrants up to 9.99% of the number of shares of our common stock outstanding immediately after giving effect to the exercise, as such percentage ownership is determined in accordance with the terms of the pre-funded warrants. Purchasers of pre-funded units in could also elect prior to the issuance of the pre‑funded units to have the initial exercise limitation set at 9.99% of the Company's outstanding common stock. As of the date of this prospectus, all of the pre-funded warrants have been exercised.
Registration Rights
Investors' Rights Agreement
Under the Third Amended and Restated Investors' Rights Agreement, dated as of December 18, 2013, among the Company and certain investors, or the investors' rights agreement, we granted registration rights to the holders of shares acquired prior to our initial public offering, or their permitted transferees. These rights are provided under the terms of the investors' rights agreement, and include demand registration rights, short-form registration rights and piggyback registration rights. All fees, costs and expenses of underwritten registrations will be borne by us and all selling expenses, including underwriting discounts and selling commissions, will be borne by the holders of the shares being registered. As of the date of this prospectus, the holders of 259,638 shares of our common stock have registration rights under the investors' rights agreement. The investors' rights agreement contains customary cross-indemnification provisions, under which we are obligated to indemnify holders of registrable shares in the event of material misstatements or omissions in the registration statement attributable to us, and they are obligated to indemnify us for material misstatements or omissions attributable to them. The registration rights granted under the investors' rights agreement will terminate at the earlier of the closing of a deemed liquidation event and when all of the holders of registrable securities are eligible to be sold without restrictions under Rule 144 promulgated under the Securities Act within any 90-day period.
AdvanDx Merger and MGHIF Investment
In connection with the July 2015 merger transaction among the Company, a merger sub and AdvanDx, Inc., and the related transactions in which MGHIF purchased shares of our common stock and initially issued the MGHIF Note, the Company also entered into a registration rights agreement with the AdvanDx stockholders receiving merger consideration and with MGHIF, pursuant to which the investors were granted certain demand registration rights and piggyback registration rights in connection with subsequent registered offerings of the Company's common stock. MGHIF also received rights to participate on a pro-rata basis in future securities offerings by the Company. MGHIF is the only holder of registrable securities under this registration rights agreement.
Bridge Financing Registration Rights
In connection with the bridge financing the Company entered into a registration rights agreement with jVen Capital and with MGHIF, pursuant to which the investors were granted certain demand registration rights and piggyback registration rights in connection with subsequent registered offerings of the Company's common stock. The registrable securities include the shares of common stock underlying the warrants issued to jVen Capital and to MGHIF under the terms of the bridge financing promissory notes.
49
DESCRIPTION OF SECURITIES WE ARE OFFERING
We are offering 1,050,000 shares of common stock of OpGen Inc., which are issuable upon the exercise of outstanding common warrants and placement agent warrants issued in our July 2017 Public Offering.
Common Stock
The material terms and provisions of our common stock and each other class of our securities which qualifies or limits our common stock are described under the caption "Description of Capital Stock" in this prospectus.
Common Warrants and Placement Agent Warrants
The following summary of certain terms and provisions of common warrants and placement agent warrants that are being offered hereby is not complete and is subject to, and qualified in its entirety by, the provisions of the common warrants, and the provisions of the placement agent warrants, as the case may be, the form of each of which is filed as an exhibit to the registration statement of which this prospectus forms a part. You should carefully review the terms and provisions of the form of common warrant or placement agent warrant for a complete description of the terms and conditions of the common warrants and placement agent warrants.
Duration and Exercise Price
Each common warrant has an initial exercise price per share equal to $10.625. Each placement agent warrant has an initial exercise price per share equal to $12.50. The common warrants and placement agent warrants are currently exercisable and will expire on the fifth anniversary of the original issuance date, which was July 18, 2017. The exercise price and number of shares of common stock issuable upon exercise is subject to appropriate adjustment in the event of stock dividends, stock splits, reorganizations or similar events affecting our common stock and the exercise price. The common warrants were issued separately from the common stock included in the units, or the pre-funded warrants included in the pre-funded units issued in the July 2017 Public Offering, as the case may be, and may be transferred separately immediately thereafter. The placement agent warrants were issued separately.
Cashless Exercise
If, at the time a holder exercises its common warrants or placement agent warrants, as the case may be, a registration statement registering the issuance of the shares of common stock underlying the common warrants or the placement agent warrants under the Securities Act is not then effective or available for the issuance of such shares, then in lieu of making the cash payment otherwise contemplated to be made to us upon such exercise in payment of the aggregate exercise price, the holder may elect instead to receive upon such exercise (either in whole or in part) the net number of shares of common stock determined according to a formula set forth in the common warrants and the placement agent warrants.
Exercisability
The common warrants or placement agent warrants will be exercisable, at the option of each holder, in whole or in part, by delivering to us a duly executed exercise notice accompanied by payment in full for the number of shares of our common stock purchased upon such exercise (except in the case of a cashless exercise as discussed above). A holder (together with its affiliates) may not exercise any portion of the common warrant or a placement agent warrant to the extent that the holder would own more than 4.99% of the outstanding common stock immediately after exercise, except that upon at least 61 days' prior notice from the holder to us, the holder may increase the amount of ownership of outstanding stock after exercising the holder's common warrants or placement agent warrants up to 9.99% of the number of shares of our common stock outstanding immediately after giving effect to the exercise, as such percentage ownership is determined in accordance with the terms of the common warrants or the placement agent warrants.
50
Fractional Shares
No fractional shares of common stock will be issued upon the exercise of the common warrants or placement agent warrants. Rather, the number of shares of common stock to be issued will, at our election, either be rounded up to the nearest whole number or we will pay a cash adjustment in respect of such final fraction in an amount equal to such fraction multiplied by the exercise price.
Transferability
Subject to applicable laws, a common warrant and a placement agent warrant may be transferred at the option of the holder upon surrender of the common warrant or placement agent warrant to us together with the appropriate instruments of transfer.
Exchange Listing
We do not intend to list the common warrants or placement agent warrants on any securities exchange or nationally recognized trading system.
Right as a Stockholder
Except as otherwise provided in the common warrants or placement agent warrants, or by virtue of such holder's ownership of shares of our common stock, the holders of the common warrants or placement agent warrants do not have the rights or privileges of holders of our common stock, including any voting rights, until they exercise their common warrants or placement agent warrants, as the case may be.
Fundamental Transaction
In the event of a fundamental transaction which is approved by our Board, the holders of the common warrants and placement agent warrants have the right to require us or a successor entity to redeem the warrant for cash in the amount of the Black-Scholes value of the unexercised portion of the warrant on the date of the consummation of the fundamental transaction. In the event of a fundamental transaction which is not approved by our Board, the holders of the common warrants and placement agent warrants have the right to require us or a successor entity to redeem the warrant for the consideration paid in the fundamental transaction in the amount of the Black Scholes value of the unexercised portion of the warrant on the date of the consummation of the fundamental transaction.
Anti-Takeover Effects of Our Certificate of Incorporation, Bylaws and Delaware Law
Our certificate of incorporation and bylaws include a number of provisions that may have the effect of delaying, deferring or preventing another party from acquiring control of us and encouraging persons considering unsolicited tender offers or other unilateral takeover proposals to negotiate with our Board of Directors rather than pursue non-negotiated takeover attempts. These provisions include the items described below. The following descriptions are summaries of the material terms of our Amended and Restated Certificate of Incorporation and Amended and Restated Bylaws. We refer in this section to our Amended and Restated Certificate of Incorporation as our certificate of incorporation, and we refer to our Amended and Restated Bylaws as our bylaws.
Meetings of Stockholders
Our certificate of incorporation and bylaws provide that only the Chair of the Board, the Chief Executive Officer or a majority of the members of our Board of Directors then in office may call special meetings of stockholders and only those matters set forth in the notice of the special meeting may be considered or acted upon at a special meeting of stockholders. Our bylaws limit the business that may be conducted at an annual meeting of stockholders to those matters properly brought before the meeting.
51
Advance Notice Requirements
Our bylaws establish advance notice procedures with regard to stockholder proposals relating to the nomination of candidates for election as directors or new business to be brought before meetings of our stockholders. These procedures provide that notice of stockholder proposals must be timely given in writing to our corporate secretary prior to the meeting at which the action is to be taken. Generally, to be timely, notice must be received at our principal executive offices not less than 90 days nor more than 120 days prior to the first anniversary date of the annual meeting for the preceding year. Our bylaws specify the requirements as to form and content of all stockholders' notices. These requirements may preclude stockholders from bringing matters before the stockholders at an annual or special meeting.
Amendment to Certificate of Incorporation and Bylaws
Any amendment of our certificate of incorporation must first be approved by a majority of our Board of Directors, and if required by law or our certificate of incorporation, must thereafter be approved by a majority of the outstanding shares entitled to vote on the amendment, except that the amendment of the provisions relating to stockholder action, board composition, limitation of liability and the amendment of our certificate of incorporation must be approved by not less than 66 2/3% of the outstanding shares entitled to vote on the amendment, and not less than 66 2/3% of the outstanding shares of each class entitled to vote thereon as a class. Our bylaws may be amended by the affirmative vote of a majority of the directors then in office, subject to any limitations set forth in the bylaws; and may also be amended by the affirmative vote of at least 66 2/3% of the outstanding shares entitled to vote on the amendment, or, if our Board of Directors recommends that the stockholders approve the amendment, by the affirmative vote of the majority of the outstanding shares entitled to vote on the amendment, in each case voting together as a single class.
Undesignated Preferred Stock
Our Board of Directors has the authority, without further action by our stockholders, to issue from time to time 7,690,572 shares of preferred stock in one or more series. The existence of authorized but unissued shares of preferred stock may enable our Board of Directors to discourage an attempt to obtain control of us by means of a merger, tender offer, proxy contest or otherwise. For example, if in the due exercise of its fiduciary obligations, our Board of Directors were to determine that a takeover proposal is not in the best interests of our stockholders, our Board of Directors could cause shares of preferred stock to be issued without stockholder approval in one or more private offerings or other transactions that might dilute the voting or other rights of the proposed acquirer or insurgent stockholder or stockholder group. In this regard, our certificate of incorporation grants our Board of Directors broad power to establish the rights and preferences of authorized and unissued shares of preferred stock. The issuance of shares of preferred stock could decrease the amount of earnings and assets available for distribution to holders of shares of common stock. The issuance may also adversely affect the rights and powers, including voting rights, of these holders and may have the effect of delaying, deterring or preventing a change in control of us.
Exclusive Jurisdiction for Certain Actions
Our certificate of incorporation provides that, once our common stock is a "covered security," unless we consent in writing to the selection of an alternative forum, the Court of Chancery of the State of Delaware shall be the sole and exclusive forum for (i) any derivative action or proceeding brought on our behalf, (ii) any action asserting a claim of breach of a fiduciary duty owed by any of our directors, officers or other employees to us or our stockholders, (iii) any action asserting a claim arising pursuant to any provision of the Delaware General Corporation Law, our certificate of incorporation or our bylaws, or (iv) any action asserting a claim against us governed by the internal affairs doctrine. Although we believe this provision benefits us by providing increased consistency in the application of Delaware law in the types of lawsuits to which it applies, the provision may have the effect of discouraging lawsuits against our directors and officers. The enforceability of similar exclusive forum provisions in other companies' certificates of incorporation has been challenged in legal proceedings, and it is possible that a court could rule that this provision in our certificate of incorporation is inapplicable or unenforceable.
52
Section 203 of the Delaware General Corporation Law
We are subject to the provisions of Section 203 of the Delaware General Corporation Law. In general, Section 203 prohibits a publicly held Delaware corporation from engaging in a "business combination" with an "interested stockholder" for a three-year period following the time that this stockholder becomes an interested stockholder, unless the business combination is approved in a prescribed manner. Under Section 203, a business combination between a corporation and an interested stockholder is prohibited unless it satisfies one of the following conditions:
| · | before the stockholder became interested, our Board of Directors approved either the business combination or the transaction which resulted in the stockholder becoming an interested stockholder; |
| · | upon consummation of the transaction which resulted in the stockholder becoming an interested stockholder, the interested stockholder owned at least 85% of the voting stock of the corporation outstanding at the time the transaction commenced, excluding for purposes of determining the voting stock outstanding, shares owned by persons who are directors and also officers, and employee stock plans, in some instances, but not the outstanding voting stock owned by the interested stockholder; or |
| · | at or after the time the stockholder became interested, the business combination was approved by our Board of Directors and authorized at an annual or special meeting of the stockholders by the affirmative vote of at least two-thirds of the outstanding voting stock which is not owned by the interested stockholder. |
Section 203 defines a business combination to include:
| · | any merger or consolidation involving the corporation and the interested stockholder; |
| · | any sale, transfer, lease, pledge or other disposition involving the interested stockholder of 10% or more of the assets of the corporation; |
| · | subject to exceptions, any transaction that results in the issuance or transfer by the corporation of any stock of the corporation to the interested stockholder; |
| · | subject to exceptions, any transaction involving the corporation that has the effect of increasing the proportionate share of the stock of any class or series of the corporation beneficially owned by the interested stockholder; and |
| · | the receipt by the interested stockholder of the benefit of any loans, advances, guarantees, pledges or other financial benefits provided by or through the corporation. |
In general, Section 203 defines an interested stockholder as any entity or person beneficially owning 15% or more of the outstanding voting stock of the corporation and any entity or person affiliated with or controlling or controlled by the entity or person.
Listing
Our common stock is listed on the Nasdaq Capital Market under the symbol "OPGN" and our IPO Warrants are listed on the Nasdaq Capital Market under the symbol "OPGNW."
Transfer Agent and Registrar
The transfer agent and registrar for our common stock is Philadelphia Stock Transfer, Inc. The transfer agent's address is 2320 Haverford Rd., Suite 230, Ardmore, PA 19003.
53
PLAN OF DISTRIBUTION
We are offering the warrants and shares of our common stock issuable upon the exercise of the warrants issued in the July 2017 Public Offering. The warrants are exercisable in whole or in part, at the election of the holder, in cash or pursuant to a cashless exercise if a registration statement covering the warrants is not then effective. The common stock issuable upon the exercise of the warrants will not be offered through underwriters, or brokers or dealers. We will not pay any compensation in connection with the offering of the shares upon exercise of the warrants.
The holders of the warrants may, from time to time, sell, transfer or otherwise dispose of any or all of their warrants or shares of our common stock covered by this prospectus on the Nasdaq Capital Market or any other stock exchange, market or trading facility on which the shares are traded or in private transactions. These dispositions may be at fixed prices, at prevailing market prices at the time of sale, at prices related to the prevailing market price, at varying prices determined at the time of sale, or at negotiated prices. The holders may use any one or more of the following methods when disposing of shares:
| · | ordinary brokerage transactions and transactions in which the broker-dealer solicits purchasers; |
| · | block trades in which the broker-dealer will attempt to sell the shares as agent but may position and resell a portion of the block as principal to facilitate the transaction; |
| · | purchases by a broker-dealer as principal and resale by the broker-dealer for its account; |
| · | an exchange distribution in accordance with the rules of the applicable exchange; |
| · | privately negotiated transactions; |
| · | settlement of short sales entered into after the effective date of the registration statement of which this prospectus is a part; |
| · | broker-dealers may agree with the holders to sell a specified number of such shares at a stipulated price per share; |
| · | through the writing or settlement of options or other hedging transactions, whether through an options exchange or otherwise; |
| · | a combination of any such methods of sale; or |
| · | any other method permitted pursuant to applicable law (including underwritten transactions). |
The holders may also sell shares under Rule 144 under the Securities Act, if available, rather than under this prospectus.
Broker-dealers, underwriters and agents engaged by a holder may arrange for other broker-dealers, underwriters or agents to participate in sales. Broker-dealers, underwriters or agents may receive commissions, discounts or concessions from the holder (or, if any broker-dealer acts as agent for the purchaser of shares, from the purchaser) in amounts to be negotiated, but, except as set forth in a supplement to this prospectus, in the case of an agency transaction not in excess of a customary brokerage commission in compliance with FINRA rules.
In connection with the sale of the common stock or interests therein, a holder may enter into hedging transactions with broker-dealers or other financial institutions, which may in turn engage in short sales of the common stock in the course of hedging the positions they assume. A holder may also sell shares of the common stock short and deliver these securities to close out their short positions, or loan or pledge the common stock to broker-dealers that in turn may sell these securities. A holder may also enter into option or other transactions with broker-dealers or other financial institutions or the creation of one or more derivative securities which require the delivery to such broker-dealer or other financial institution of shares offered by this prospectus, which shares such broker-dealer or other financial institution may resell pursuant to this prospectus (as supplemented or amended to reflect such transaction).
54
The holders and any broker-dealers, underwriters or agents that are involved in selling the shares may be deemed to be "underwriters" within the meaning of the Securities Act in connection with such sales. In such event, any commissions received by such broker-dealers, underwriters or agents and any profit on the resale of the shares purchased by them may be deemed to be underwriting commissions or discounts under the Securities Act. If a holder qualifies as an "underwriter," it will be subject to the prospectus delivery requirements of Section 5(b)(2) of the Securities Act.
All costs and expenses incurred in connection with the registration under the Securities Act of the offering made hereby will be paid by us, other than any brokerage fees and commissions, fees and disbursements of legal counsel for the holders and stock transfer and other taxes attributable to the sale of the shares, which will be paid by the applicable holder.
Because the holders may be deemed to be "underwriters" within the meaning of the Securities Act, they will be subject to the prospectus delivery requirements of the Securities Act including Rule 172 thereunder.
The resale shares will be sold only through registered or licensed brokers or dealers if required under applicable state securities laws. In addition, in certain states, the resale shares may not be sold unless they have been registered or qualified for sale in the applicable state or an exemption from the registration or qualification requirement is available and is complied with.
Under applicable rules and regulations under the Exchange Act, any person engaged in the distribution of the resale shares may not simultaneously engage in market making activities with respect to the common stock for the applicable restricted period, as defined in Regulation M, prior to the commencement of the distribution. In addition, the holder will be subject to applicable provisions of the Exchange Act and the rules and regulations thereunder, including Regulation M, which may limit the timing of purchases and sales of shares of our common stock by the holder or any other person. We will make copies of this prospectus available to the holders and have informed them of the need to deliver a copy of this prospectus to each purchaser at or prior to the time of the sale (including by compliance with Rule 172 under the Securities Act).
55
MANAGEMENT'S DISCUSSION AND ANALYSIS OF
FINANCIAL CONDITION AND RESULTS OF OPERATIONS
FINANCIAL CONDITION AND RESULTS OF OPERATIONS
The following discussion and analysis of our financial condition and results of operations should be read in conjunction with our financial statements and related notes included elsewhere in this prospectus. This discussion contains forward-looking statements that involve risks and uncertainties. Our actual results could differ materially from those discussed below. Factors that could cause or contribute to such differences include, but are not limited to, those identified below and those discussed in "Risk Factors" included elsewhere in this prospectus. When we refer to OpGen, Inc. we use the terms "OpGen," "the Company," "us," "we" and "our."
Overview
OpGen was incorporated in Delaware in 2001. On July 14, 2015, OpGen completed the Merger with AdvanDx ("the Merger"). Pursuant to the terms of a Merger Agreement, Velox Acquisition Corp., OpGen's wholly owned subsidiary formed for the express purpose of effecting the Merger, merged with and into AdvanDx with AdvanDx surviving as OpGen's wholly-owned subsidiary. OpGen, AdvanDx are collectively referred to hereinafter as the "Company." The Company's headquarters are in Gaithersburg, Maryland, and its principal operations are in Gaithersburg, Maryland and Woburn, Massachusetts. The Company also has operations in Copenhagen, Denmark. The Company operates in one business segment.
OpGen is a precision medicine company using molecular diagnostics and informatics to help combat infectious disease. The Company is developing molecular information products and services for global healthcare settings, helping to guide clinicians with more rapid and actionable information about life threatening infections, improve patient outcomes, and decrease the spread of infections caused by multidrug-resistant microorganisms. The Company's proprietary DNA tests and informatics address the rising threat of antibiotic resistance by helping physicians and other healthcare providers optimize care decisions for patients with acute infections.
The Company's molecular diagnostics and informatics offerings combine its Acuitas DNA tests and Acuitas Lighthouse informatics platform for use with its proprietary, curated MDRO knowledgebase. The Company is working to deliver products and services, some in development, to a global network of customers and partners.
| · | The Company's Acuitas DNA tests provide rapid microbial identification and antibiotic resistance gene information. These products include the Acuitas AMR Gene Panel u5.47 for complicated urinary tract infections in development as a clinical diagnostic test and available for Research Use Only, the QuickFISH® family of FDA-cleared and CE-marked diagnostics used to rapidly detect pathogens in positive blood cultures, and the Acuitas Resistome Tests for genetic analysis of hospital surveillance isolates. |
| · | The Company's Acuitas Lighthouse informatics systems are cloud-based HIPAA compliant informatics offerings that combine clinical lab test results with patient and hospital information to provide analytics and actionable insights to help manage MDROs in the hospital and patient care environment. |
The Company's operations are subject to certain risks and uncertainties. The risks include rapid technology changes, the need to manage growth, the need to retain key personnel, the need to protect intellectual property and the need to raise additional capital financing on terms acceptable to the Company. The Company's success depends, in part, on its ability to develop and commercialize its proprietary technology as well as raise additional capital.
2017 Financing Transactions
Since inception, the Company has incurred, and continues to incur, significant losses from operations. The Company has funded its operations primarily through external investor financing arrangements. The following financing transactions took place during 2017:
| · | On July 18, 2017, the Company closed its July 2017 Public Offering of 18,164,195 units at $0.40 per unit, and 6,835,805 pre-funded units at $0.39 per pre-funded unit, raising gross proceeds of approximately $10 million and net proceeds of approximately $8.8 million. jVen Capital, an affiliate of Evan Jones, the Company's Chairman of the Board and Chief Executive Officer, and three employees of the Company participated in the July 2017 Public Offering. Each unit included one twenty-fifth of a share of common stock and one common warrant to purchase one twenty-fifth of a share of common stock at an exercise price of $10.625 per share. Each pre-funded unit included one pre-funded warrant to purchase one twenty-fifth of a share of common stock for an exercise price of $0.25 per share, and one common warrant to purchase one twenty-fifth of a share of common stock at an exercise price of $10.625 per share. The common warrants are exercisable immediately and have a five-year term from the date of issuance. Approximately $1 million of the gross proceeds was used to repay the outstanding Bridge Financing Notes to jVen Capital in July 2017. |
56
| · | On May 31, 2017, the Company entered into a Note Purchase Agreement with jVen Capital, under which jVen Capital agreed to provide bridge financing in an aggregate principal amount of up to $1,500,000 to the Company in up to three separate tranches of bridge financing notes, each a Bridge Financing Note. The interest rate on each Bridge Financing Note was ten percent (10%) per annum (subject to increase upon an event of default). In connection with the Bridge Financing Notes, the Company issued jVen Capital stock purchase warrants to acquire 5,633 shares with an exercise price of $19.50 per share, and stock purchase warrants to acquire 6,349 shares at an exercise price of $17.25 per share. On June 14, 2017, the Company drew down on the first of three Bridge Financing Notes, with $1 million remaining capacity available. The Company drew down on the second Bridge Financing Note on July 5, 2017 and the third Bridge Financing Note was never issued. The outstanding Bridge Financing Notes were repaid in full upon the closing of the July 2017 Public Offering. |
| · | On June 6, 2017, as amended on June 28, 2017, the Company issued the amended and restated MGHIF Note to MGHIF, which extended the maturity date of the MGHIF Note from July 14, 2017 to July 14, 2018. In return for MGHIF's consent to such extension, the Company increased the interest rate of the MGHIF Note to 10% per annum and issued warrants to purchase shares of common stock to MGHIF equal to 20% of the principal balance of the MGHIF Note, plus interest accrued thereon, as of June 28, 2017. |
| · | During the year ended December 31, 2017, the Company sold approximately 227 thousand shares of its common stock under its at the market offering resulting in aggregate net proceeds to the Company of approximately $3.8 million, and gross proceeds of $4.0 million. |
Results of Operations for the Years Ended December 31, 2017 and 2016
Revenues
| Year Ended December 31, | ||||||||
| 2017 | 2016 | |||||||
| Product sales | $ | 2,771,869 | $ | 3,524,178 | ||||
| Laboratory services | 41,960 | 228,904 | ||||||
| Collaboration revenue | 397,178 | 272,603 | ||||||
| Total revenue | $ | 3,211,007 | $ | 4,025,685 | ||||
Our total revenue for the year ended December 31, 2017 decreased 20%, to $3.2 million from $4.0 million, when compared to the same period in 2016. This decrease is primarily attributable to:
| · | Product Sales: the decrease in revenue of 21% in 2017 as compared to 2016 is primarily attributable to a reduction in the sale of our legacy Argus Whole Genome Mapping System, or Argus, products, as we transitioned from our legacy mapping products to the introduction of Acuitas MDRO products sales, and a reduction in the sale of our rapid pathogen ID testing products; |
57
| · | Laboratory Services: the decrease in revenue of 82% in 2017 as compared to 2016 is a result of decreases in sales of our Acuitas MDRO test products; and |
| · | Collaboration Revenue: the increase in collaboration revenue of 46% in 2017 as compared to 2016 is primarily the result of increased revenue associated with our CDC contract. |
Operating expenses
| Year Ended December 31, | ||||||||
| 2017 | 2016 | |||||||
| Cost of products sold | $ | 1,612,838 | $ | 1,658,571 | ||||
| Cost of services | 520,338 | 631,333 | ||||||
| Research and development | 6,883,293 | 8,613,236 | ||||||
| General and administrative | 6,692,659 | 6,602,608 | ||||||
| Sales and marketing | 2,767,670 | 5,529,274 | ||||||
| Total operating expenses | $ | 18,476,798 | $ | 23,035,022 | ||||
The Company's total operating expenses for the year ended December 31, 2017 decreased 20%, to $18.5 million from $23.0 million, when compared to the same period in 2016. This decrease is primarily attributable to:
| · | Costs of products sold: expenses for the year ended December 31, 2017 decreased approximately 3% when compared to the same period in 2016. The change in costs of products sold is primarily attributable to the decrease in legacy Argus sales offset by increased payroll and facility costs; |
| · | Costs of services: expenses for the year ended December 31, 2017 decreased approximately 18% when compared to the same period in 2016. The change in costs of services is primarily attributable to a decrease in sales of Acuitas Lighthouse services; |
| · | Research and development: expenses for the year ended December 31, 2017 decreased approximately 20% when compared to the same period in 2016, primarily due to a decrease in costs related to the automated rapid pathogen identification project; |
| · | General and administrative: expenses for the year ended December 31, 2017 increased approximately 1% when compared to the same period in 2016, primarily due to legal costs; and |
| · | Sales and marketing: expenses for the year ended December 31, 2017 decreased approximately 50% when compared to the same period in 2016, primarily due to costs associated with marketing studies conducted in the first half of 2016 and the reductions in the size of our commercial organization that occurred in June through December 2017. |
Other income (expense)
| Year Ended December 31, | ||||||||
| 2017 | 2016 | |||||||
| Interest expense | $ | (233,505 | ) | $ | (143,347 | ) | ||
| Foreign currency transaction gains/(losses) | 23,179 | (8,102 | ) | |||||
| Change in fair value of derivative financial instruments | 144,064 | - | ||||||
| Interest and other expense | (87,255 | ) | (5,967 | ) | ||||
| Total other expense | $ | (153,517 | ) | $ | (157,416 | ) | ||
Other expense for the year ended December 31, 2017 decreased to a net expense of $153,517 from a net expense of $157,416 in the same period of 2016. The decrease was primarily a result of gains recognized due to the change in fair value of warrant liabilities offset by an increase in interest expense due to the issuance of the Bridge Financing Notes and modification of the MGHIF Note in June 2017 as well as the expense of the unamortized discount on the Bridge Financing Notes at repayment.
58
Liquidity and capital resources
On February 6, 2018, the Company closed a public offering, or the February 2018 Public Offering, of 2,841,152 units at $3.25 per unit, and 851,155 pre-funded units at $3.24 per pre-funded unit, raising gross proceeds of approximately $12 million and net proceeds of approximately $10.7 million. Each unit included one share of common stock and one common warrant to purchase 0.5 share of common stock at an exercise price of $3.25 per share. Each pre-funded unit included one pre-funded warrant to purchase one share of common stock for an exercise price of $0.01 per share, and one common warrant to purchase 0.5 share of common stock at an exercise price of $3.25 per share. The common warrants are exercisable immediately and have a five-year term from the date of issuance.
At December 31, 2017, the Company had cash and cash equivalents of $1.8 million, compared to $4.1 million at December 31, 2016. The Company has funded its operations primarily through external investor financing arrangements and has raised significant funds in 2017 and 2016, including:
On July 18, 2017, the Company closed a public offering of 18,164,195 units at $0.40 per unit, and 6,835,805 pre‑funded units at $0.39 per pre-funded unit, raising gross proceeds of approximately $10 million and net proceeds of approximately $8.8 million as described above under "2017 Financing Transactions."
On May 31, 2017, the Company entered the bridge financing transaction with jVen Capital described above under "2017 Financing Transactions."
A condition to the receipt of the bridge financing was an extension of the maturity date of the MGHIF Note from July 14, 2017 to July 14, 2018. In return for MGHIF's consent to such extension, the Company issued the amended and restated MGHIF Note to increase the interest rate to 10% and issued warrants to purchase shares of common stock to MGHIF equal to 20% of the principal balance of the MGHIF Note, plus interest accrued thereon, as of June 28, 2017.
In September 2016, the Company entered into the Sales Agreement with Cowen pursuant to which the Company may offer and sell from time to time, up to an aggregate of $25 million of shares of its common stock through Cowen, as sales agent, with initial sales limited to an aggregate of $11.5 million. Pursuant to the Sales Agreement, Cowen may sell the shares of common stock by any method permitted by law deemed to be an "at the market" offering as defined in Rule 415 of the Securities Act, including, without limitation, sales made by means of ordinary brokers' transactions on the Nasdaq Capital Market or otherwise at market prices prevailing at the time of sale, in block transactions, or as otherwise directed by the Company. The Company pays Cowen compensation equal to 3.0% of the gross proceeds from the sales of common stock pursuant to the terms of the Sales Agreement. As of December 31, 2017, the Company has sold an aggregate of approximately 372 thousand shares of its common stock under this at the market offering resulting in aggregate net proceeds to the Company of approximately $8.2 million, and gross proceeds of $8.8 million. As of December 31, 2017, remaining availability under the at the market offering is $2.7 million. During the year ended December 31, 2017, the Company sold approximately 227 thousand shares of its common stock under this at the market offering resulting in aggregate net proceeds to the Company of approximately $3.8 million, and gross proceeds of $4.0 million.
To meet its capital needs, the Company is considering multiple alternatives, including, but not limited to, additional equity financings, debt financings and other funding transactions, licensing and/or partnering arrangements and business combination transactions. There can be no assurance that the Company will be able to complete any such transaction on acceptable terms or otherwise. The Company believes that current cash on hand including the February 2018 Public Offering will be sufficient to fund operations into the first quarter of 2019. This has led management to conclude that there is substantial doubt about the Company's ability to continue as a going concern. In the event the Company is unable to successfully raise additional capital during or before the first quarter of 2019, the Company will not have sufficient cash flows and liquidity to finance its business operations as currently contemplated. Accordingly, in such circumstances the Company would be compelled to immediately reduce general and administrative expenses and delay research and development projects, including the purchase of scientific equipment and supplies, until it is able to obtain sufficient financing. If such sufficient financing is not received on a timely basis, the Company would then need to pursue a plan to license or sell its assets, seek to be acquired by another entity, cease operations and/or seek bankruptcy protection.
59
Sources and uses of cash
The following table summarizes the net cash and cash equivalents provided by (used in) operating activities, investing activities and financing activities for the periods indicated:
| Year Ended December 31, | ||||||||
| 2017 | 2016 | |||||||
| Net cash used in operating activities | $ | (14,303,880 | ) | $ | (17,250,637 | ) | ||
| Net cash used in investing activities | (276,950 | ) | (123,514 | ) | ||||
| Net cash provided by financing activities | 12,348,194 | 13,664,690 | ||||||
Net cash used in operating activities
Net cash used in operating activities in 2017 consists primarily of our net loss of $15.4 million, reduced by certain non-cash items, including depreciation and amortization expense of $0.7 million, share-based compensation of $0.9 million, partially offset by the net change in operating assets and liabilities of $0.6 million. Net cash used in operating activities for 2016 consists primarily of our net loss of $19.2 million, reduced by certain non-cash items, including depreciation and amortization expense of $0.7 million, share-based compensation expense of $0.9 million, and the net change in operating assets and liabilities of $0.2 million.
Net cash used in investing activities
Net cash used in investing activities in 2017 and 2016 consisted solely of the purchase of property and equipment.
Net cash provided by financing activities
Net cash provided by financing activities in 2017 of $12.3 million consisted primarily of net proceeds from the July 2017 Public Offering, the at the market offering and from the issuance of Bridge Financing Notes. Net cash provided by financing activities in 2016 of $13.7 million consisted primarily of the net proceeds from our private placement of common stock, non-voting convertible preferred stock and stock purchase warrants and issuance of common stock under the ATM offering.
Critical accounting policies and use of estimates
This Management's Discussion and Analysis of Financial Condition and Results of Operations is based on our audited consolidated financial statements, which have been prepared in accordance with GAAP. The preparation of financial statements in conformity with GAAP requires us to make estimates and assumptions that affect the reported amounts of assets and liabilities and disclosure of contingent assets and liabilities at the date of the financial statements and the reported amount of revenues and expenses during the reporting period. In our audited consolidated financial statements, estimates are used for, but not limited to, share-based compensation, allowances for doubtful accounts and inventories, valuation of derivative financial instruments, beneficial conversion features of convertible debt, deferred tax assets and liabilities and related valuation allowance, and depreciation and amortization and estimated useful lives of long-lived assets. Actual results could differ from those estimates.
A summary of our significant accounting policies is included in Note 3 to the accompanying audited consolidated financial statements. Certain of our accounting policies are considered critical, as these policies require significant, difficult or complex judgments by management, often requiring the use of estimates about the effects of matters that are inherently uncertain.
60
Revenue Recognition
Revenue for the sales of QuickFISH and PNA FISH diagnostic test products is recognized upon shipment to the customer.
The Company recognizes revenue associated with laboratory services contracts when the service has been performed and reports are made available to the customer.
The Company recognizes revenue primarily from sales of AdvanDx diagnostic products, providing laboratory services, and from "funded software development" arrangements with collaborative parties. Revenue is recognized when the following criteria are met: persuasive evidence of an arrangement exists; delivery has occurred; the selling price is fixed or determinable; and collectability is reasonably assured. At times, the Company sells products and services, or performs software development, under multiple-element arrangements with separate units of accounting; in these situations, total consideration is allocated to the identified units of accounting based on their relative fair value and revenue is then recognized for each unit based on its specific characteristics.
The Company's funded software development arrangements generally consist of multiple elements. Total arrangement consideration is allocated to the identified units of accounting based on their relative selling prices and revenue is then recognized for each unit based on its specific characteristics. When funded software development arrangements include substantive research and development milestones, revenue is recognized for each such milestone when the milestone is achieved and is due and collectible. Milestones are considered substantive if all of the following conditions are met: (1) the milestone is nonrefundable; (2) achievement of the milestone was not reasonably assured at the inception of the arrangement; (3) substantive effort is involved to achieve the milestone; and (4) the amount of the milestone appears reasonable in relation to the effort expended, the other milestones in the arrangement and the related risk associated with achievement of the milestone.
Impairment of Long-Lived Assets
Property and equipment is reviewed for impairment whenever events or changes in circumstances indicate that the carrying amount of an asset may not be recoverable. Recoverability of assets to be held and used is measured by a comparison of the carrying amount of an asset to future undiscounted net cash flows expected to be generated by the asset. Recoverability measurement and estimating of undiscounted cash flows is done at the lowest possible level for which we can identify assets. If such assets are considered to be impaired, impairment is recognized as the amount by which the carrying amount of assets exceeds the fair value of the assets.
Definite-lived intangible assets include trademarks, developed technology and customer relationships. If any indicators were present, the Company would test for recoverability by comparing the carrying amount of the asset to the net undiscounted cash flows expected to be generated from the asset. If those net undiscounted cash flows do not exceed the carrying amount (i.e., the asset is not recoverable), the Company would perform the next step, which is to determine the fair value of the asset and record an impairment loss, if any.
Goodwill represents the excess of the purchase price for AdvanDx over the fair values of the acquired tangible or intangible assets and assumed liabilities. The Company will conduct an impairment test of goodwill on an annual basis as of October 1 of each year, and will also conduct tests if events occur or circumstances change that would, more likely than not, reduce the Company's fair value below its net equity value.
Share-Based Compensation
Share-based payments to employees, directors and consultants are recognized at fair value. The resulting fair value is recognized ratably over the requisite service period, which is generally the vesting period of the option. The estimated fair value of equity instruments issued to nonemployees is recorded at fair value on the earlier of the performance commitment date or the date the services required are completed.
61
For all time-vesting awards granted, expense is amortized using the straight-line attribution method. For awards that contain a performance condition, expense is amortized using the accelerated attribution method. Share-based compensation expense recognized is based on the value of the portion of stock-based awards that is ultimately expected to vest during the period. The fair value of share-based payments is estimated, on the date of grant, using the Black-Scholes model. Option valuation models, including the Black-Scholes model, require the input of highly subjective estimates and assumptions, and changes in those estimates and assumptions can materially affect the grant-date fair value of an award. These assumptions include the fair value of the underlying and the expected life of the award.
See additional discussion of the use of estimates relating to share-based compensation, and a discussion of management's methodology for developing each of the assumptions used in such estimates, in Note 3 to the accompanying consolidated financial statements.
Recent accounting pronouncements
In May 2014, the FASB issued an Accounting Standards Update ("ASU") for revenue recognition for contracts, superseding the previous revenue recognition requirements, along with most existing industry-specific guidance. The guidance requires an entity to review contracts in five steps: 1) identify the contract, 2) identify performance obligations, 3) determine the transaction price, 4) allocate the transaction price, and 5) recognize revenue. The new standard will result in enhanced disclosures regarding the nature, amount, timing, and uncertainty of revenue arising from contracts with customers. In August 2015, the FASB issued guidance approving a one-year deferral, making the standard effective for reporting periods beginning after December 15, 2017, with early adoption permitted only for reporting periods beginning after December 15, 2016. In March 2016, the FASB issued guidance to clarify the implementation guidance on principal versus agent considerations for reporting revenue gross rather than net, with the same deferred effective date. In April 2016, the FASB issued guidance to clarify the identification of performance obligations and licensing arrangements. In May 2016, the FASB issued guidance addressing the presentation of sales and other similar taxes collected from customers, providing clarification of the collectability criterion assessment, as well as clarifying certain transition requirements. The Company has identified its major revenue streams and has completed its formal contract review and the Company will adopt this guidance effective January 1, 2018. The Company will adopt this guidance using the modified retrospective method. The adoption of this new guidance will not have a material impact on the Company's consolidated financial statements.
In July 2015, the FASB issued accounting guidance for inventory. Under the guidance, an entity should measure inventory within the scope of this guidance at the lower of cost and net realizable value, except when inventory is measured using LIFO or the retail inventory method. Net realizable value is the estimated selling price in the ordinary course of business, less reasonably predictable costs of completion, disposal, and transportation. In addition, the FASB has amended some of the other inventory guidance to more clearly articulate the requirements for the measurement and disclosure of inventory. The standard is effective for reporting periods beginning after December 15, 2016. The amendments in this pronouncement should be applied prospectively, with earlier application permitted. The Company adopted this guidance effective January 1, 2017 on a prospective basis. The adoption of this new guidance did not have a material impact on the Company's consolidated financial statements.
In February 2016, the FASB issued guidance for the accounting for leases. The guidance requires lessees to recognize assets and liabilities related to long-term leases on the consolidated balance sheets and expands disclosure requirements regarding leasing arrangements. The guidance is effective for reporting periods beginning after December 15, 2018 and early adoption is permitted. The guidance must be adopted on a modified retrospective basis and provides for certain practical expedients. The Company is currently evaluating the impact, if any, that this new accounting pronouncement will have on its consolidated financial statements.
The Company has evaluated all other issued and unadopted ASUs and believes the adoption of these standards will not have a material impact on its results of operations, financial position or cash flows.
Off-Balance Sheet Arrangements
As of December 31, 2017 and 2016, the Company did not have any off-balance sheet arrangements.
62
JOBS Act
On April 5, 2012, the JOBS Act was enacted. Section 107 of the JOBS Act provides that an "emerging growth company" can take advantage of the extended transition period provided in Section 7(a)(2)(B) of the Securities Act, for complying with new or revised accounting standards. In other words, an "emerging growth company" can delay the adoption of certain accounting standards until those standards would otherwise apply to private companies. The Company has elected to use the extended transition period for complying with new or revised accounting standards under Section 102(b)(1) of the JOBS Act. This election allows it to delay the adoption of new or revised accounting standards that have different effective dates for public and private companies until those standards apply to private companies. As a result of this election, the Company's financial statements may not be comparable to companies that comply with public company effective dates.
Subject to certain conditions set forth in the JOBS Act, as an "emerging growth company," the Company intends to rely on certain of these exemptions, including without limitation, (i) providing an auditor's attestation report on our system of internal controls over financial reporting pursuant to Section 404(b) of the Sarbanes-Oxley Act of 2002 and (ii) complying with any requirement that may be adopted by the PCAOB regarding mandatory audit firm rotation or a supplement to the auditor's report providing additional information about the audit and the financial statements, known as the auditor discussion and analysis. The Company will remain an "emerging growth company" until the earliest of (i) the last day of the fiscal year in which it has total annual gross revenues of $1 billion or more; (ii) December 31, 2019; (iii) the date on which the Company has issued more than $1 billion in nonconvertible debt during the previous three years; or (iv) the date on which the Company is deemed to be a large accelerated filer under the rules of the SEC.
63
BUSINESS
Please refer to the Glossary on page 85 of this prospectus for definitions of scientific, health care, regulatory and OpGen-specific terms used in this prospectus.
Overview
We are a precision medicine company using molecular diagnostics and informatics to help combat infectious disease. We are developing molecular information products and services for global healthcare settings, helping to guide clinicians with more rapid and actionable information about life threatening infections, improve patient outcomes, and decrease the spread of infections caused by multidrug-resistant microorganisms, or MDROs. Our proprietary DNA tests and informatics address the rising threat of antibiotic resistance by helping physicians and other healthcare providers optimize care decisions for patients with acute infections.
Our molecular diagnostics and informatics offerings combine our Acuitas® DNA tests and Acuitas Lighthouse® informatics platform for use with our proprietary, curated MDRO knowledgebase. We are working to deliver our products and services, some in development, to a global network of customers and partners.
| · | Our Acuitas DNA tests provide rapid microbial identification and antibiotic resistance gene information. These products include our Acuitas antimicrobial resistance, or AMR, Gene Panel u5.47 for complicated urinary tract infections in development as a clinical diagnostic test and available for Research Use Only, the QuickFISH® family of FDA-cleared and CE-marked diagnostics used to rapidly detect pathogens in positive blood cultures, and our Acuitas Resistome Tests for genetic analysis of hospital surveillance isolates. |
| · | Our Acuitas Lighthouse informatics systems are cloud-based HIPAA compliant informatics offerings that combine clinical lab test results with patient and hospital information to provide analytics and actionable insights to help manage MDROs in the hospital and patient care environment. Components of our informatics systems include the Acuitas Lighthouse Knowledgebase and the Acuitas Lighthouse Software. The Acuitas Lighthouse Knowledgebase is a relational database management system and a proprietary data warehouse of genomic data matched with antibiotic susceptibility information for bacterial pathogens. The Acuitas Lighthouse Software system includes the Acuitas Lighthouse Portal, a suite of web applications and dashboards, the Acuitas Lighthouse Prediction Engine, which is a data analysis software, and other supporting software components. The Acuitas Lighthouse Software can be customized and made specific to a healthcare facility or collaborator, such as a pharmaceutical company. |
We have established a number of collaborative arrangements to support execution of our business strategy as we work to address the more than $2 billion potential market for precision medicine MDRO solutions. Our relationship with Merck & Co., Inc. includes investment from Merck Global Health Innovation Fund, or MGHIF, and a research collaboration with Merck Sharp & Dohme, or MSD, to provide access to MSD's 250,000 clinical isolate SMART bacterial surveillance archive. In December 2017, we entered into a subcontractor agreement with ILÚM Health Solutions, LLC, an entity created by Merck's Healthcare Services and Solutions division, whereby ILÚM Health Solutions will provide services to the Company in the performance of the Company's CDC contract to deploy ILÚM's commercially-available cloud- and mobile-based software platform for infectious disease management in up to three medical sites in Colombia with the aim of improving antibiotic use in resource-limited settings.
In June 2017, we entered into a global supply agreement to provide customer access to Thermo Fisher Scientific's products to support the commercialization of our Acuitas Rapid Test and Acuitas Lighthouse Software products in development to combat MDROs. We have worked closely with Intermountain Healthcare, or IHC, a leading integrated health system, to complete a comprehensive retrospective study to evaluate the burden and costs of antibiotic resistance at IHC. We are working to expand these established relationships and to enter into additional collaborative arrangements in the future.
We believe more rapid genetic identification methods will reduce morbidity from MDROs, reduce healthcare costs through reduced length of stay, and assist in the identification of targeted antibiotic therapy. Current conventional microbiology, largely unchanged in 50 years, requires one to two days for growth and phenotypic analysis and often leads to the use of broad spectrum antibiotic therapy in the early stages of infection.
64
We are developing a new high resolution AMR Gene Panel designed to determine pathogen levels in clinical specimens and the key drug resistance gene profiles of Gram-negative organisms. Following completion of our research and development efforts and receipt of appropriate regulatory approvals, we anticipate the AMR Gene Panel will be used in the clinical setting to provide pathogen and antibiotic resistance gene information to aid in decision-making for patients with complicated urinary tract infections, or cUTI, lower respiratory tract infections, and blood stream infections.
Lead Rapid Diagnostic and Acuitas Lighthouse Software
Our lead product in development is the Acuitas AMR Gene Panel u5.47 for patients at risk for cUTI. The AMR Gene Panel u5.47 is a direct test that will be able to be performed in under three hours to identify five pathogens associated with urinary tract infections and their levels and 47 genes associated with antibiotic resistance. We anticipate that the Acuitas Lighthouse Software will be used to provide additional interpretation of test results including probability of resistance for fourteen antibiotics commonly used to treat cUTI. Approximately 10,000 bacterial isolates from the Merck SMART surveillance network and other sources have been tested and added to the Acuitas Lighthouse Knowledgebase to support development and use of the Acuitas Lighthouse Software antibiotic resistance prediction decision-making algorithms. Preliminary performance data for E. coli and K. pneumonia in our Acuitas Lighthouse Software algorithms was presented at the ASM Microbe meeting in June 2017. Accuracy of prediction ranged from 77% to 96%. These data and additional data from our research combined with the anticipated results from the AMR Gene Panel u5.47 support the potential for the Acuitas Lighthouse Software to provide actionable antibiotic resistance prediction information directly from clinical specimens in under three hours. The figure below describes the potential workflow and anticipated results from our new testing approach.
Current Diagnostic Tests and Informatics Offerings
Our suite of DNA-based products and products in development are intended to provide actionable, precise diagnostic information supported by the proprietary genomic Acuitas Lighthouse Knowledgebase to facilitate data interpretation. The Acuitas DNA tests use multiplex PCR to help provide reliable and accurate detection of drug resistance. The QuickFISH tests are powered by PNA technology and provide rapid pathogen identification, typically in less than 30 minutes from a positive blood culture result. The Acuitas MDRO Gene Test is used for determining if acute care patients are colonized with MDROs. Positive samples are confirmed using microbiological methods and the Acuitas Resistome Test for high resolution genotyping. Test results are maintained in the Acuitas Lighthouse data warehouse for subsequent interpretation by physicians and healthcare providers.
65
Our Strategy
We are using our current product and service offerings, and will use our products in development to build and commercialize a comprehensive precision medicine solution for combatting infectious disease with a focus on developing diagnostic tests for rapid pathogen identification and genetic profiling, antibiotic resistance analysis and advanced informatics to store and analyze MDRO and other infectious disease data for hospitals, out-patient settings and other healthcare providers.
The two core components of our strategy are development and commercialization of rapid diagnostic tests and leveraging our Acuitas Lighthouse information services into new markets and channels.
| · | Rapid diagnostics – We are developing OpGen-branded Acuitas AMR Gene Panel tests for use on the Thermo Fisher Scientific Applied Biosystems™ QuantStudio™ 5 Real-Time PCR System. The first of these new tests will be for management of patients with cUTI. We anticipate developing tests for additional clinical indications such as lower respiratory tract infections and for new antibiotic decision- making applications. The second rapid diagnostics growth driver will be through strategic partner relationships where we will work to expand channel access for our proprietary DNA tests through development and subsequent use of these tests, utilizing the Acuitas Lighthouse Software on established rapid in vitro diagnostic testing platforms. |
| · | Acuitas Lighthouse informatics and services – We are pursuing commercial opportunities to provide our Acuitas Lighthouse informatics and companion genomic testing to pharmaceutical companies and CROs, health systems, third party in vitro diagnostic companies, and government agencies. Through our Pharmaceutical/CRO services we are working to help accelerate clinical trials and new product launches and to establish early access for diagnostic tests to help guide decision-making for new antibiotics. Our focus in the health system segment is on helping guide antibiotic decision-making and supporting patient safety initiatives. We are actively pursuing government funding for development and deployment of our Acuitas Lighthouse informatics in the United States and internationally. |
In support of our strategy we are working to:
| · | complete development, clinical evaluations, obtain necessary regulatory approvals, and successfully commercialize our AMR Gene Panel u5.47 for cUTI with a goal of achieving three-hour antibiotic resistance analysis from the time of specimen collection; |
| · | continue clinical evaluations for the AMR Gene Panel u5.47 in the first half of 2018; in January 2018 we introduced the AMR Gene Panel u5.47 as an RUO test and have a goal of making a FDA 510(k) submission in the fourth quarter of 2018 to support commercial launch; |
| · | obtain third party funding to expand our AMR Gene Panel development and access to additional third party rapid testing platforms; |
| · | expand our business collaborations with Merck and other pharmaceutical companies; |
| · | capitalize on opportunities to deploy our Acuitas Lighthouse informatics and genomic testing for pharmaceutical/CRO services; |
| · | grow our Acuitas Lighthouse data warehouse offerings for resistance and susceptibility data in hospital, hospital system, or broader community applications through continued development of the Acuitas Lighthouse Knowledgebase; |
| · | seek government funding to advance programs focused on identification and treatment of MDROs; and |
| · | continue development of our Acuitas Lighthouse Software and work to install Acuitas Lighthouse Software to customer sites in the United States and globally. |
66
Molecular Information Business
We are working to build a unique and highly proprietary molecular information business. Our approach combines FDA-cleared and CE-marked rapid diagnostics and CLIA lab-based MDRO surveillance tests with our Acuitas Lighthouse Software. We are developing an integrated solution based on a genomic knowledgebase of drug-resistant pathogens. Our approach involves sourcing thousands of pathogens from hospitals worldwide and completing genomic analysis including DNA sequencing and drug susceptibility testing of each individual pathogen. These data are combined along with hospital patient data and other information in our Acuitas Lighthouse Knowledgebase. We anticipate using this information and insights we derive from it to help power our rapid diagnostic products, healthcare management solutions and new applications to support pharmaceutical companies.
The lead products from our initial development work are the Acuitas AMR Gene Panel u5.47, which is in development as a clinical diagnostic for complicated urinary tract infections and clinical isolates and was released as a ROU product in the first quarter of 2018, and the Acuitas Lighthouse Software for managing and evaluating results from the AMR Gene Panel test. In conjunction with these development programs we have added and tested approximately 9,500 bacterial isolates from the SMART pathogen archive and added the results to the Lighthouse Knowledgebase which includes data from 15,000 bacterial isolates. In the future we anticipate developing additional AMR Gene Panel tests and expanding our software offerings.
Recent Events
Business Initiatives
In June 2017, the Company entered into a global supply agreement to use Thermo Fisher Scientific's technology to support the commercialization of its rapid molecular products. Under the terms of the agreement, OpGen will commercialize the Acuitas Rapid Test for Pathogen ID and resistance genes on Thermo Fisher's new mid-throughput real-time PCR system. In January 2018, the Company entered into a second global supply agreement to incorporate Thermo Fisher Scientific's real-time PCR technology in the company's Acuitas® AMR Gene Panel Tests. Specific products covered under these agreements include the QuantStudio 5 Real-Time PCR System, TaqMan® Fast Advanced Master Mix and TaqMan® Probes for quick, multiplexed gene detection.
In early June 2017, the Company commenced a restructuring of its operations to improve efficiency and reduce its cost structure. To date, the Company has achieved a reduction in operating expenses of approximately 31 percent. The restructuring plans included work to consolidate the Company's operations for FDA-cleared and CE marked products and research and development activities for the Acuitas AMR Gene Panel products and Acuitas Lighthouse Software in Gaithersburg, Maryland, and reduce the size of its commercial organization while the Company focused on development work. The restructuring process was substantially completed by year-end, and is expected to be completed in the first quarter of 2018.
67
In October 2017, the Company announced that it was awarded a contract from the Centers for Disease Control and Prevention, or CDC, to develop smartphone-based clinical decision support solutions for antimicrobial stewardship, or AMS, and infection control in low- and middle-income countries. The one-year $860,000 award began September 30, 2017 and funds development and evaluation of cloud-based mobile software. The Company will work with partners ILÚM Health Solutions and Universidad El Bosque, or UEB, of Bogota, Colombia. The Company's teaming partner ILÚM is providing its cloud- and mobile-based software platform, which integrates electronic patient data and local empiric treatment guidelines to support antimicrobial stewardship. The ILÚM platform is state-of-the-art mobile AMS software that is commercially available and in use in major medical centers. The mobile platform will be extended to quickly identify patients requiring infection control precautions, assist with the implementation of appropriate precautions, and assist with the collection and tracking of indicators for monitoring implementation of infection control precautions. The software will be translated to Spanish and will support WHONET data integration. WHONET is an information system developed to support the World Health Organization's goal of global surveillance of bacterial resistance to antimicrobial agents. WHONET analyzes the data of over 4,000 laboratories worldwide and is used in more than 120 countries.
Corporate Events
Following receipt of approval from stockholders at a special meeting of stockholders held on January 17, 2018, we filed an amendment to our Amended and Restated Certificate of Incorporation to effect a reverse stock split of the issued and outstanding shares of our common stock, at a ratio of one share for twenty-five shares, and to reduce the authorized shares of our common stock from 200,000,000 to 50,000,000 shares. All share amounts and per share prices in this prospectus have been adjusted to reflect the reverse stock split.
On June 20, 2017, we received a notice from the Listing Qualifications Staff of the Nasdaq Stock Market LLC, or Nasdaq, notifying us that, based upon the closing bid price of our common stock for the last 30 consecutive business days, we no longer met the requirement to maintain a minimum closing bid price of $1.00 per share, as set forth in Nasdaq Listing Rule 5550(a)(2). In accordance with Nasdaq Listing Rule 5810(c)(3)(A), we had a period of 180 calendar days to regain compliance with the rule. On December 21, 2017, the Company received written notification, or the December Notice, from the Listing Qualifications Staff of Nasdaq, or the Staff, indicating that, based upon (i) the Company's continued non-compliance with the minimum bid price rule and (ii) the Company's inability to meet The Nasdaq Capital Market initial listing requirements, specifically maintaining a minimum of stockholders' equity, the Staff had determined that the Company was not eligible for an additional 180 day extension to meet the minimum bid price rule. On February 5, 2018, subsequent to completion of our reverse stock split, we received written notification from the Listing Qualifications Staff of Nasdaq that the minimum bid price deficiency of the Company's stock had been cured, and the Company would continue to be listed and trade on The Nasdaq Stock Market. In addition, the Company was informed that it was in compliance with all applicable listing standards of The Nasdaq Capital Market as of that date.
Financings
On February 6, 2018, the Company closed a public offering, or the February 2018 Public Offering, of 2,841,152 units at $3.25 per unit, and 851,155 pre-funded units at $3.24 per pre-funded unit, raising gross proceeds of approximately $12 million and net proceeds of approximately $10.7 million. Each unit included one share of common stock and one common warrant to purchase 0.5 share of common stock at an exercise price of $3.25 per share. Each pre-funded unit included one pre-funded warrant to purchase one share of common stock for an exercise price of $0.01 per share, and one common warrant to purchase 0.5 share of common stock at an exercise price of $3.25 per share. The common warrants are exercisable immediately and have a five-year term from the date of issuance.
On May 31, 2017, the Company entered into a Note Purchase Agreement with jVen Capital, LLC, a Delaware limited liability company and principal stockholder of the Company and an affiliate of Evan Jones, the Company's Chairman of the Board and Chief Executive Officer, or jVen Capital, under which jVen Capital agreed to provide bridge financing in an aggregate principal amount of up to $1,500,000 to the Company in up to three separate tranches of $500,000, each, a Bridge Financing Note and collectively, the Bridge Financing Notes. The purpose of the bridge financing was to provide capital while the Company pursued a public offering described below. The interest rate on each Bridge Financing Note was ten percent (10%) per annum (subject to increase upon an event of default). The Bridge Financing Notes were prepayable by the Company at any time without penalty, and had a maturity date of September 30, 2017, which could be accelerated upon the closing of a qualified financing (any equity or debt financing that raised net proceeds of $5 million or more). The Bridge Financing Notes were contingently convertible at the option of the holder upon an event of default into shares of the Company's convertible Series B preferred stock. In connection with the issuance of Bridge Financing Notes, in June and July 2017, the Company issued jVen Capital stock purchase warrants to acquire 5,634 shares with an exercise price of $19.50 per share, and warrants to acquire 6,350 shares with an exercise price of $17.25 per share. The Company drew down on two of three Bridge Financing Notes during June and July, and repaid such outstanding Bridge Financing Notes in full upon the closing of the July 2017 Public Offering.
68
As a condition to the receipt of the bridge financing, the Company issued the Second Amended & Restated Senior Secured Promissory Note, or the MGHIF Note, to MGHIF, which extended the maturity date of the promissory note from, July 14, 2017 to July 14, 2018. In return for MGHIF's consent to such extension, the Company increased the interest rate of the MGHIF Note to 10% per annum and issued warrants to purchase shares of common stock to MGHIF equal to 20% of the principal balance of the MGHIF Note, plus interest accrued thereon, as of June 28, 2017.
On July 18, 2017, the Company closed a public offering of 18,164,195 units at $0.40 per unit, and 6,835,805 pre-funded units at $0.39 per pre-funded unit, raising gross proceeds of approximately $10 million and net proceeds of approximately $8.8 million, or the July 2017 Public Offering. jVen Capital was one of the investors participating in the offering. Each unit included one twenty-fifth of a share of common stock and one common warrant to purchase one twenty-fifth of a share of common stock at an exercise price of $10.625 per share. Each pre-funded unit included one pre-funded warrant to purchase one twenty-fifth of a share of common stock for an exercise price of $0.25 per share, and one common warrant to purchase one twenty-fifth of a share of common stock at an exercise price of $10.625 per share. The common warrants are exercisable immediately and have a five-year term from the date of issuance. Approximately $1 million of the gross proceeds was used to repay the outstanding Bridge Financing Notes to jVen Capital in July 2017. As of December 31, 2017, all of the pre-funded warrants have been exercised.
In September 2016, the Company entered into a Sales Agreement, or the Sales Agreement, with Cowen and Company LLC, or Cowen, pursuant to which the Company may offer and sell from time to time, up to an aggregate of $25 million of shares of its common stock through Cowen, as sales agent, with initial sales limited to an aggregate of $11.5 million. Pursuant to the Sales Agreement, Cowen may sell the shares of the Company's common stock by any method permitted by law deemed to be an "at the market" offering as defined in Rule 415 of the Securities Act, including, without limitation, sales made by means of ordinary brokers' transactions on The Nasdaq Capital Market or otherwise at market prices prevailing at the time of sale, in block transactions, or as otherwise directed by the Company. The Company pays Cowen compensation equal to 3.0% of the gross proceeds from the sales of common stock pursuant to the terms of the Sales Agreement. As of December 31, 2017, the Company has sold an aggregate of approximately 372 thousand shares of its common stock under this at the market offering resulting in aggregate net proceeds to the Company of approximately $8.2 million, and gross proceeds of $8.8 million. As of December 31, 2017, remaining availability under the at the market offering is $2.7 million. During the year ended December 31, 2017, the Company sold approximately 227 thousand shares of its common stock under this at the market offering resulting in aggregate net proceeds to the Company of approximately $3.8 million, and gross proceeds of $4.0 million.
Market Overview
Antibiotic Resistance – An Urgent Global Issue
We believe that antimicrobial resistance is an urgent global healthcare issue. MDROs have been prioritized as an urgent national and global threat by the CDC, the executive branch of the federal government and the WHO. In September 2014, The White House issued a National Strategy for Combating Antibiotic-Resistant Bacteria. This strategy calls for the strengthening of surveillance efforts to combat resistance, the development and use of innovative diagnostic tests for identification and characterization of resistant bacteria and antibiotic stewardship and development.
69
The CDC estimates that in the United States more than two million people are sickened every year with antibiotic-resistant infections, with at least 23,000 dying as a result. Antibiotic- resistant infections add considerable but often avoidable costs to the U.S. healthcare system. In most cases, these infections require prolonged and/or costlier treatments, extended hospital stays, additional doctor visits and healthcare facilities use, and result in greater disability and death compared with infections that are treatable with antibiotics. Estimates for the total economic cost to the U.S. economy are difficult to calculate but have been estimated to be as high as $20 billion in excess direct healthcare costs annually. As described in a December 2014 report issued by the Review on Antimicrobial Resistance commissioned by the U.K. Prime Minister, titled "Antimicrobial Resistance: Tackling a Crisis for the Health and Wealth of Nations," 300 million people are expected to die prematurely because of drug resistance over the next 35 years, which could result in $60 to $100 trillion worth of lost economic output if the problem of antimicrobial drug resistance is not resolved.
Over the last decade multidrug-resistant Gram-negative bacteria, frequently referred to as Superbugs, have been implicated in severe HAIs, and their occurrence has increased steadily. For example, Klebsiella pneumoniae, or K. pneumoniae, is responsible for roughly 15% of Gram-negative infections in hospital intensive care units. Infections caused by KPC strains have few treatment options and are associated with a mortality rate upwards of 50%.
Exacerbating the problems associated with the emergence of these highly resistant KPC strains is their propensity to cause outbreaks in healthcare institutions. These pathogens persist both in the flora of hospitalized patients and in the hospital environment, and they have the capacity to silently colonize patients or hospital personnel by establishing residence in the gastrointestinal tract without causing any signs of infection. Individuals can be silently colonized or become asymptomatic carriers for long periods of time, with detection of these carriers often proving difficult. These silent carriers act as reservoirs for continued transmission, which makes subsequent spread difficult to control and outbreaks difficult to stop. In addition, KPC strains can survive for several hours on the hands of hospital personnel, which likely facilitates the spread of organisms from patient to patient. Effective control of KPC outbreaks requires a detailed understanding of how transmission occurs, but current technologies do not allow healthcare providers to routinely perform these investigations on a timely basis.
The lack of currently available treatment options and scarcity of new treatment options in development are compounding the emerging Superbug problem. It has been close to 30 years since a new class of antibiotics was developed and successfully introduced. As a result, we believe that rapid, accurate identification of the pathogen and its genetic make-up, screening, infection control and antibiotic stewardship have become one of the most powerful weapons in the fight to contain this threat.
Based on industry analyses, we believe the global HAI market is a $2 billion dollar market with the molecular diagnostic segment representing a fast growing segment of such market with multiple high acuity patients and significant infectious sites, including urinary tract infections, surgical site infections, pneumonia, bloodstream infections.
Products
Our lead product are the Acuitas® AMR Gene Panel u5.47 and the Acuitas Lighthouse Software. The Acuitas AMR Gene Panel u5.47 was introduced as an RUO test in the first quarter of 2018 and is under development as an in vitro diagnostic test to detect the most common bacterial causes of cUTI directly from urine. Our current product offerings include our QuickFISH and PNA FISH which are FDA-cleared, CE-marked IVD tests designed to rapidly identify antimicrobial- resistant pathogens significantly earlier than currently available conventional methods, our Acuitas MDRO Gene Test, Acuitas CR Elite Test and Acuitas Resistome Test, each a CLIA lab-based laboratory developed tests, or LDT, service that provides a profile of MDRO-resistant genes for surveillance and response to outbreaks, and our Acuitas Lighthouse informatics.
Acuitas AMR Gene Panel and Acuitas Lighthouse Software
The Acuitas® AMR Gene Panel u5.47 is a qualitative and semi-quantitative nucleic acid-based in vitro diagnostic test that is capable of simultaneous detection and identification of multiple bacterial nucleic acids and select genetic determinants of antimicrobial resistance in urine specimens or bacterial colonies isolated from urine. The Acuitas AMR Gene Panel u5.47 is intended as an aid in the diagnosis of specific agents of urinary tract infections, or UTI, for patients at risk of complicated urinary tract infection. The Acuitas AMR Gene Panel u5.47 employs automated deoxyribonucleic acid, or DNA, extraction on the Qiagen® EZ1® Advanced XL and multiplex real-time PCR on the Applied Biosystems™ QuantStudio 5™ PCR System. The Acuitas AMR Gene Panel u5.47 RUO test detects 47 gene targets which span 600 subtypes and convey resistance to 9 classes of antibiotics directly from urine and isolated colonies. Gene families detected include: KPC, NDM, VIM, IMP, OXA, CTXM-1, CTXM-9, CMY, MCR, and resistance genes to fluoroquinolone antibiotics. From urine specimens, the Acuitas AMR Gene Panel u5.47 RUO will semi-quantitatively detect the most common bacterial causes of cUTI (E. coli, K. pneumoniae, P. aeruginosa, P. mirabilis, E. faecalis). While the test is currently designed to detect only 5 bacterial species, this test will detect resistance genes in other organisms if present without providing species identification. Test results are provided in under three hours, compared with traditional microbiology methods, which can take two to three days. The figure below describes the workflow for the Acuitas AMR Gene Panel u5.47 test and the Acuitas Lighthouse Software.
70
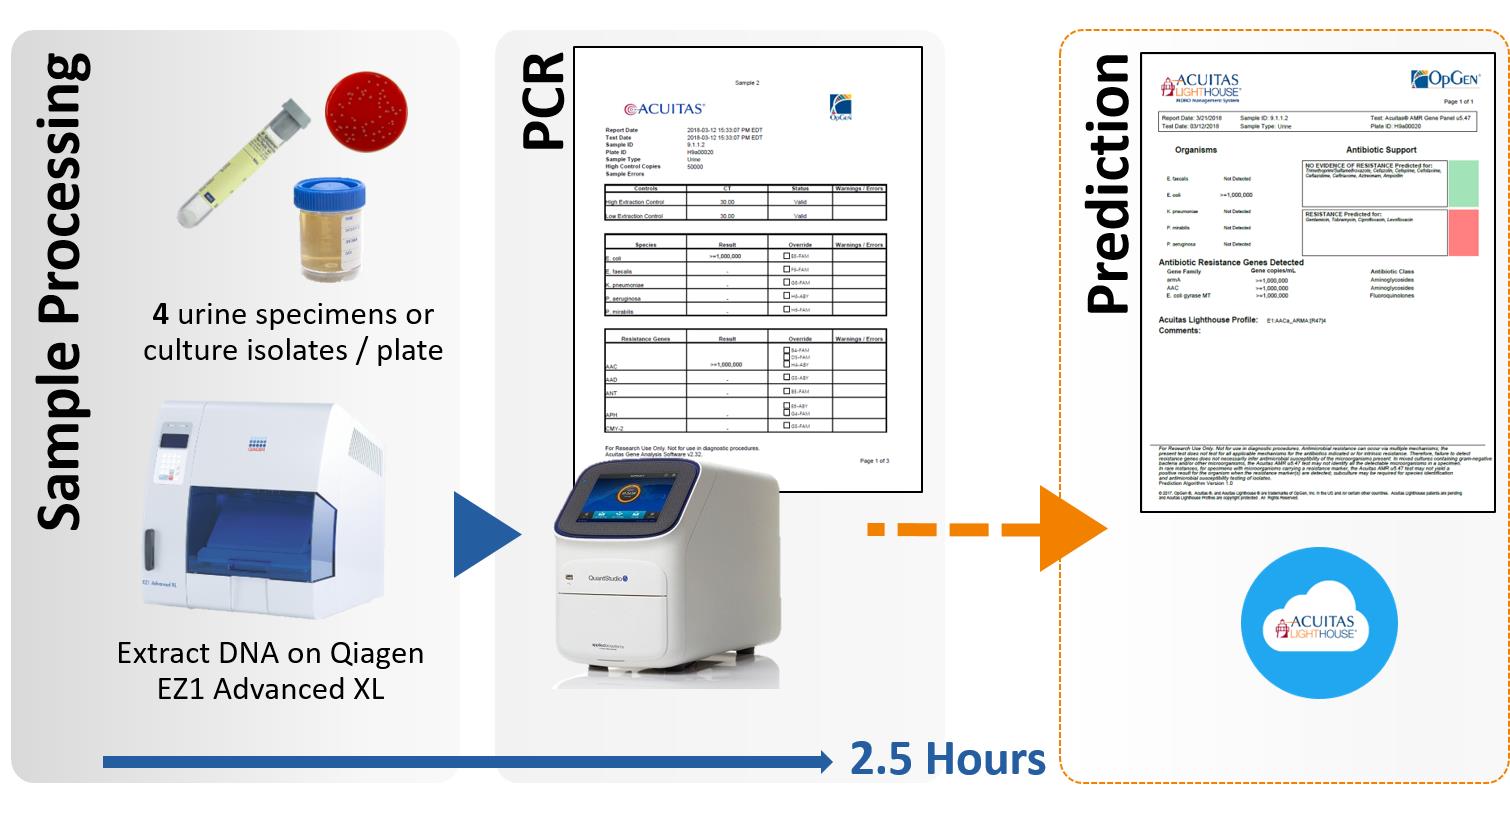
The Acuitas Lighthouse Software manages and evaluates data that identify the most common microbial causes of cUTI and key genetic determinants of antibiotic drug resistance, based on the amplification data of gene targets extracted from urine specimens. Through analysis of this data, the Acuitas Lighthouse Software can identify five bacterial species and predict resistance to up to fourteen different antibiotics from across nine antibiotic classes including: Aminoglycosides, Carbapenems, Cephalosporins, Fluoroquinolones, Polymyxins, Penicillins, Sulfonamides, Trimethoprim and Vancomycin. The Acuitas Lighthouse Software consists of the Acuitas Lighthouse Portal, a web application; the Acuitas Lighthouse Prediction Engine, data analysis software; and draws from the Lighthouse Knowledgebase, a relational database management system; and minor supporting software components. All components of this Acuitas Lighthouse Software are securely hosted in a cloud-hosted, web-based application. The input to Acuitas Lighthouse Software is a data file generated by processing the results from the Acuitas AMR Gene Panel u5.47 test through the Acuitas AMR Gene Panel u5.47 Gene Analysis Software. This input file indicates which gene targets were detected by the assay and is loaded into the Acuitas Lighthouse Software via an interface of the Acuitas Lighthouse Portal, accessed by the user through a web browser. The Acuitas AMR Gene Panel u5.47 Gene Analysis Software results are retained by the Acuitas Lighthouse Knowledgebase and are sent to the Acuitas Lighthouse Prediction Engine for analysis. The Acuitas Lighthouse Prediction Engine contains software implementations of data models that were derived using a training panel of thousands of bacterial isolates with detailed genotypic and phenotypic characterizations, all stored within the Acuitas Lighthouse Knowledgebase. These models, each specific to one (1) microbial species and antibiotic drug pairing, are used to make predictions of antibiotic resistance by analyzing the loaded input data. The results from the Acuitas Lighthouse Prediction Engine indicate whether there is evidence of resistance detected through the presence of specific genes, and if there is known intrinsic resistance to certain drugs. These final results are reported to the user via a Prediction Report and the Resistance Dashboard interface in the Acuitas Lighthouse Portal; both displays present the Acuitas Lighthouse Prediction Engine output in combination with selected input data and metadata, as well as the semi-quantitative counts of gene copies / mL for urine specimens. Development of the Acuitas Lighthouse Software and the Acuitas AMR Gene Panel u5.47 was the result of a comprehensive, multi-year development effort to help address urgent clinical needs for improved rapid antibiotic decision-making capabilities.
71
FISH Products
We have commercialized 12 QuickFISH and PNA FISH diagnostic test products in the United States and Europe for the identification of various infectious pathogens. The pathogens identified and differentiated by our FISH products are:
| QuickFISH | PNA FISH |
| Staphylococcus | Staphylococcus |
| Enterococcus | Enterococcus |
| Gram-negative bacteria | Gram-negative bacteria |
| Candida | Candida |
Our FISH products can provide pathogen identification and differentiation within 20 to 90 minutes of positive blood culture results. The tests provide actionable information that can be used by the healthcare provider to determine appropriate antibiotic therapy.
Approximately 80 U.S. hospital customers purchased our FISH products over the past twelve months, and we sell our FISH products to hospitals in 15 countries with antibiotic stewardship programs. Our hospital customers include academic medical centers, tertiary care hospitals and community hospitals.
Other Acuitas Products
Our high resolution DNA tests are marketed under the Acuitas trade name. We have developed Acuitas DNA tests, such as the Acuitas MDRO Gene Test, for use in our CLIA laboratory,
| · | Our Acuitas MDRO Gene Test, launched in 2014, is, to our knowledge, the first CLIA lab-based test able to provide information regarding the presence of ten MDRO resistance genes from one patient specimen. The ten drug-resistant genes identified by our Acuitas MDRO Gene Test are associated with CRE, ESBL and VRE organisms, and are gastrointestinal organisms frequently associated with antibiotic-resistant infections. The test results can be used by healthcare providers to identify patients colonized with organisms expressing the drug-resistant genes or who are actively infected. |
| · | Our Acuitas CR Elite Test, launched in 2014, adds the ability for the healthcare provider to order a microbiology culture screen to be performed from the same specimen sent for our Acuitas MDRO Gene Test, thereby providing additional information about the organism(s) associated with an active infection, as well as an antibiotic susceptibility profile for such organism(s). |
| · | Our Acuitas Resistome Test, launched in the second quarter of 2015, is a more comprehensive MDRO molecular test which detects 49 genes covering over 900 subtypes associated with antibiotic resistance. The test includes additional resistance genes for carbapenemases, ESBLs and AmpC genes, in replacement of the Vancomycin resistant genes found in the Acuitas MDRO Gene Test. We use Acuitas Resistome Test results for Acuitas Lighthouse profiling of specimens collected in hospitals and clinical isolates from infected patients. Information from our Acuitas Resistome Test provides additional gene detection information to supplement our Acuitas MDRO Gene Test. |
Acuitas Resistome Test results can be used in conjunction with the Acuitas CR Elite Test to provide high resolution Acuitas Lighthouse profiles. Our goal is to provide DNA test-based Acuitas Lighthouse profiles, within 24 hours of sample receipt, and, using the Acuitas CR Elite Test to supplement our Acuitas Lighthouse profiles, with biologically derived, phenotypic antibiotic susceptibility data within 48 hours. We anticipate improving the accuracy, over time, of our Acuitas Resistome Test by performing DNA sequence analysis of microbial isolates characterized within our Acuitas Lighthouse Knowledgebase. We believe our menu of genotypic and phenotypic tests along with our Acuitas Lighthouse informatics platform, will enable better surveillance and epidemiology, improved infection control practices, improved antibiotic stewardship and individualized patient care, as well as help to facilitate outbreak detection and response in healthcare settings.
72
Acuitas Lighthouse
Our Acuitas Lighthouse informatics platform enables proactive MDRO management to prevent in-hospital transmission events and to help improve patient outcomes. Using our Acuitas Lighthouse informatics, launched in December 2015, we offer trend analysis of patient specific data, data specific to individual hospital facilities and health systems, which can be accessed safely and confidentially by healthcare providers. Our Acuitas Lighthouse's dynamic profiling incorporates identity, phenotype and MDRO gene presence and assigns unique microbe identifiers, or Acuitas Lighthouse profiles, based on MDRO gene composition, and antibiotic susceptibility, or AST, data. We believe our Acuitas Lighthouse profiling will provide a comprehensive diagnostic tracking tool for MDRO infections in the hospital setting. It is based on our CLIA- and HIPAA-compliant LIMS database system. We have developed a web-based portal to allow our customers access to LIMS-based lab reports and Acuitas Lighthouse data reports.
Research and Development
For the years ended December 31, 2017 and 2016, our research and development expenses were $6.9 million and $8.6 million, respectively. We intend to continue to invest in the development of additional Acuitas AMR Gene Panel tests and our Acuitas Lighthouse informatics platform, and to support commercial sales of our QuickFISH rapid identification tests. Our current focus is on completing the development of the Acuitas AMR Gene Panel u5.47 and our other product offerings to provide actionable, precise diagnostics powered by our Acuitas Lighthouse Software for rapid diagnostics of pathogens, determination of the appropriate antibiotics to treat the infection and accumulation of actionable surveillance data to provide information useful for monitoring and controlling outbreaks and promoting antibiotic stewardship.
Our ongoing and anticipated research and development efforts include:
| · | development of the Acuitas AMR Gene Panel tests for additional indications, and clinical trial work to support a 510(k) application for commercial launch of the Acuitas AMR Gene Panel 5u.47; |
| · | continued investments in our Acuitas Lighthouse informatics platform, focused on (i) data warehouse and portal for MDRO data and (ii) antibiotic analysis; |
| · | expanding our clinical decision support capabilities by completing the work under the CDC contract to develop smartphone-based clinical decision support solutions for antimicrobial stewardship and infection control in low- and middle-income countries; |
| · | working with pharmaceutical companies to add new or recently FDA approved antibiotics to the Acuitas Lighthouse Software |
| · | further development of our Acuitas MDRO Gene Test, Acuitas Resistome Test and Acuitas Whole Genome Sequence Analysis; and |
| · | converting our CLIA lab-based products to IVD kits that can be sold, upon receipt of FDA clearance and other approvals, directly to our customers and to other clinical reference laboratories. |
During 2018 we anticipate finalizing the regulatory approach for commercializing the Acuitas AMR Gene Panel u5.47 and the Acuitas Lighthouse Software. We believe that separate FDA 510(k) regulatory submissions will be required for both of these products. The objective is to complete clinical trials and analytical validation work to support FDA submissions during the fourth quarter of 2018. We anticipate the clinical trial will involve 4-5 clinical sites and the testing of approximately 5,000 clinical samples and bacterial isolates. The final scope of the clinical trial will be finalized following pre-submission meetings with the FDA.
73
Sales and Marketing
We currently sell and market our products and services directly in the United States through a dedicated sales and marketing support team. Internationally, we sell our products through a network of distributors in 11 countries. We operate a subsidiary in Denmark that provides support for our European customers and to distributors in other parts of the world. We anticipate expanding our commercial organization in conjunction with the anticipated FDA clearance to commercialize our Acuitas AMR Gene Panel u5.47 and Acuitas Lighthouse Software products. During 2018 our strategy to build demand for our products following receipt of such regulatory clearance includes completing clinical verification studies, sales of the AMR Gene Panel for Research Use Only, and in conjunction with such FDA clearance entering into channel partner co-marketing and distribution agreements.
We are generating data to support the commercialization of our Acuitas AMR Gene Panel u5.47 and Acuitas Lighthouse Software products through a structured clinical verification program including academic medical centers and clinical collaborators. In March 2018 we announced the first of these agreements with Beth Israel Deaconess Medical Center in Boston. Participants in our clinical verification program will potentially participate in our FDA clinical trials. Results from these activities will support publications and peer to peer medical communications.
In the first quarter of 2018, we introduced the Acuitas AMR Gene Panel u5.47 for infection control purposes and pharmaceutical surveillance research as a Research Use Only test for cUTI. The Acuitas AMR Gene Panel u5.47 will be available while the Company completes clinical trials and regulatory submissions to support FDA clearance to commercialize such products for broader clinical use. We anticipate that customers who use the products as RUO tests for infection control and clinical research will serve as a potential installed base for the FDA cleared product in 2019. Our rapid pathogen identification FISH products are used by nearly 100 customers in the US and internationally. Many of these customers are potential customers for our FDA-cleared Acuitas AMR Gene Panel u5.47 test. We are working to expand our market reach by entering into strategic co-marketing relationships with larger diagnostic and pharmaceutical companies and by expanding our network of distributors globally.
We operate in one segment. Substantially all of our operations are in the United States. Total revenues from customers for the years ended December 31, 2017 and 2016 were $3.2 million and $4.0 million, respectively. Net loss for the years ended December 31, 2017 and 2016 was $15.4 million and $19.2 million, respectively. Total assets at December 31, 2017 and 2016 were $6.6 million and $9.0 million, respectively.
For the year ended December 31, 2017, revenue earned under the CDC contract represented 11% of total revenues. No individual customer represented in excess of 10% of revenues for the year ended December 31, 2016.
Competition
We believe we are currently the only company developing a molecular information business focused on leading a transformation in microbiology and infectious disease through precision medicine products and services that combine genomic data and informatics. Our approach combines proprietary DNA tests developed in our CLIA laboratory, FDA-cleared and CE-marked rapid diagnostics, and our Acuitas Lighthouse informatics and data warehouse offerings. Our competitors include rapid diagnostic testing and traditional microbiology companies, commercial laboratories, information technology companies, and hospital laboratories who may internally develop testing capabilities. Principal competitive factors in our target market include: organizational size, scale, and breadth of product offerings; rapidity of test results; quality and strength of clinical and analytical validation data and confidence in diagnostic results; cost effectiveness; ease of use; and regulatory approval status.
Our principal competition comes from traditional methods used by healthcare providers to diagnose and screen for MDROs and from other molecular diagnostic companies creating screening and diagnostic products such as Cepheid, Becton-Dickinson, bioMérieux, Accelerate Diagnostics, T2 Biosystems, GenMark, Curetis and Nanosphere. We believe our focus on identifying antibiotic-resistant genes, rather than primarily organisms, the genes and associated diseases included in our gene tests, and our Acuitas Lighthouse informatics offerings distinguish us from such competitors.
We also face competition from commercial laboratories, such as ARUP Laboratories, Laboratory Corporation of America Holdings, Quest Diagnostics Incorporated and EuroFins, which have strong infrastructure to support the commercialization of diagnostic laboratory services.
74
Competitors may develop their own versions of our product offerings in countries where we do not have patents or where our intellectual property rights are not recognized.
Many of our potential competitors have widespread brand recognition and substantially greater financial, technical, research and development and selling and marketing capabilities than we do. Others may develop products with prices lower than ours that could be viewed by hospitals, physicians and payers as functionally equivalent to our products and services, or offer products and services at prices designed to promote market penetration, which could force us to lower our list prices and affect our ability to achieve profitability. If we are unable to change clinical practice in a meaningful way or compete successfully against current and future competitors, we may be unable to increase market acceptance and sales of our products, which could prevent us from increasing our revenue or achieving profitability and could cause our stock price to decline.
Laboratory Operations
Our laboratory operations are headquartered at our CLIA-certified laboratory in Gaithersburg, Maryland, where we perform all Acuitas MDRO tests. Samples are transported to the laboratory by FedEx or by courier. Once received, samples are assessed for acceptability, accessioned into our LIMS, prepared for processing and analyzed with traditional microbiology culture methods or using molecular testing instrumentation. Laboratory test data is housed in a proprietary LIMS database that is CLIA and HIPAA compliant. Customers access CLIA laboratory test results through individual PDF test reports and through our Acuitas Lighthouse informatics. Our laboratory also performs testing for research and development, quality control, and for both the creation and ongoing maintenance of our Acuitas Lighthouse data warehouse.
We believe we have sufficient laboratory capacity to perform Acuitas testing for at least the next 24 months.
Manufacturing
During 2017, we manufactured our FDA-cleared and CE-marked QuickFISH and PNA FISH products in our Woburn, Massachusetts facility. We are currently in the process of transferring these manufacturing operations to our Gaithersburg, Maryland facility.
Manufacturing of our FDA-cleared products is performed under the current Good Manufacturing Practices – Quality System Regulation as required by the FDA for the manufacture of IVD labeled products. These regulations carefully control the manufacture, testing and release of IVD products as well as raw material receipt and control. We also have ongoing postmarket surveillance and vigilance responsibilities under FDA regulations, and are subject to periodic inspections by the FDA to determine compliance with the FDA's requirements, including primarily the quality system regulations and medical device reporting regulations. The results of these inspections can include inspectional observations on FDA's Form 483, warning letters, or other forms of enforcement. Our Woburn, Massachusetts facility was inspected by the FDA in 2015. Following such inspection, the FDA issued a report of its findings and observations, typically referred to as "Form 483 observations," primarily related to our quality systems and testing policies and documentation. We have responded to all inspection observations within the required timeframe and have worked with the FDA's Office of Compliance to satisfy all identified deficiencies.
Seasonality of Business
We do not believe our business is subject to seasonality. However, our business can be subject to and affected by the business practices of our business partners. To the extent that the availability of inventory or materials from or development practices of our partners is seasonal, our sales may be subject to fluctuations quarter to quarter or year over year.
Quality Assurance
Our quality assurance function oversees the quality of our laboratory and our FDA-cleared and CE-marked diagnostic products as well as the quality systems used in research and development, client services, billing operations and sales and marketing. We have established a quality assurance system across our entire business, including implementation and maintenance, document control, supplier qualification, corrective or preventive actions, oversight, and employee training processes. We monitor and seek to improve our quality over time in compliance with all applicable regulations.
75
Raw Materials and Suppliers
We procure PCR amplification reagents and the QuantStudio 5 Real-Time PCR System from Thermo Fisher Scientific. DNA purification reagents and the EZ1 DNA Purification System are procured from Qiagen, NV. We procure reagents, equipment, chips and other materials we use to perform our Acuitas MDRO Gene Test from sole suppliers such as Fluidigm Corporation. We purchase the PNA probes, glass slides and specialty consumables for our QuickFISH products from third party manufacturers who have long lead times and who manufacture several of these products for us on a sole source basis. We also purchase our collection kits from sole-source suppliers. Some of these items are unique to these suppliers and vendors. While we have developed alternative sourcing strategies for these materials and vendors, we cannot be certain whether these strategies will be effective or whether alternative sources will be available when we need them. If these suppliers can no longer provide us with the materials we need to perform our Acuitas MDRO Gene Test or manufacture our QuickFISH products, if the materials do not meet our quality specifications, or if we cannot obtain acceptable substitute materials, our business would be negatively affected.
Payments and Reimbursement
Our Acuitas AMR Gene Panel, the Acuitas Lighthouse Software, MDRO test products, and our QuickFISH tests are, and other future products and services will be, sold to hospitals and public health organizations as products and on a fee-for-service basis. When hospital and health system clients purchase our QuickFISH tests we bill them directly for the purchase of test kits and consumables. Hospitals that purchase MDRO services from our CLIA laboratory are billed on a per test basis. In the future, we envision selling our Acuitas Lighthouse Software to health systems, hospitals and long-term care facilities under capitated, flat-rate contracts. We believe that hospitals will recoup costs of our products and services by obtaining reimbursement from the government or private insurance companies for in-bed occupancies, which traditionally includes all testing required for admitted patients. When our tests are used prior to hospital admission, hospitals, clinical laboratories, and other healthcare provider customers that purchase our products may bill various third-party payers to cover all or a portion of the costs and fees associated with diagnostic tests, including the cost of the purchase of our products.
Intellectual Property
In order to remain competitive, we must develop and maintain protection of the proprietary aspects of our technologies. To that end, in order to remain competitive, we must develop and maintain protection of the proprietary aspects of our technologies. To that end, we rely on a combination of patents, copyrights and trademarks, as well as contracts, such as confidentiality, invention assignment and licensing agreements. We also rely upon trade secret laws to protect unpatented know-how and continuing technological innovation. In addition, we have what we consider to be reasonable security measures in place to maintain confidentiality. Our intellectual property strategy is intended to develop and maintain our competitive position.
As of December 31, 2017, we had total ownership rights to 35 patents, including 19 pending United States non-provisional patent applications, and 16 issued United States patents. More specifically, as of December 31, 2017, related to our FISH products, we had ownership rights to 11 patents, including 3 pending United States non-provisional patent applications, and 8 issued United States patents. These issued patents began to expire in November 2024 and will be fully expired by March 2032. As of December 31, 2017, related to our Acuitas products, we had ownership rights to 4 patents, including 4 pending United States non-provisional patent applications and no issued United States patents. As of December 31, 2017, related to our other products, we had ownership rights to 20 patents, including 12 pending United States non-provisional patent applications, and 8 issued United States patents related to our other products. These issued patents began to expire in June 2026 and will be fully expired by May 2032. A majority of our issued and exclusively licensed FISH patents expired over the last five years. The remaining 14 exclusively licensed United States FISH patents expire between 2018 and 2023.
We intend to file additional patent applications in the United States and abroad to strengthen our intellectual property rights; however, our patent applications (including the patent applications listed above) may not result in issued patents in a timely fashion or at all, and we cannot assure investors that any patents that have issued or might issue will protect our technology.
76
We require all employees and technical consultants working for us to execute confidentiality agreements, which provide that all confidential information received by them during the course of the employment, consulting or business relationship be kept confidential, except in specified circumstances. Our agreements with our research employees provide that all inventions, discoveries and other types of intellectual property, whether or not patentable or copyrightable, conceived by the individual while he or she is employed by us are assigned to us. We cannot provide any assurance, however, that employees and consultants will abide by the confidentiality or assignment terms of these agreements. Despite measures taken to protect our intellectual property, unauthorized parties might copy aspects of our technology or obtain and use information that we regard as proprietary.
Regulation
The following is a summary of the regulations materially affecting our business and operations.
Clinical Laboratory Improvement Amendments of 1988
Congress passed CLIA in 1988, which provided CMS authority over all laboratory testing, except research that is performed on humans in the United States. The Division of Laboratory Services, within the Survey and Certification Group, under the Center for Medicaid and State Operations, has the responsibility for implementing the CLIA program.
The CLIA program is designed to establish quality laboratory testing by ensuring the accuracy, reliability and timeliness of patient test results. Under CLIA, a laboratory is a facility that does laboratory testing on specimens derived from humans and used to provide information for the diagnosis, prevention or treatment of disease, or impairment of, or assessment of health. Under the CLIA program, laboratories must be certified by the government, satisfy governmental quality and personnel standards, undergo proficiency testing, be subject to inspections and pay fees.
As a clinical reference laboratory, we are required to hold certain Federal, state and local licenses, certifications and permits to conduct our business. Under CLIA, we are required to hold a certificate applicable to the type of laboratory examinations we perform and to comply with standards covering personnel, facilities administration, quality systems and proficiency testing.
We have a current Certificate of Compliance under CLIA and a Medical Laboratory Permit from the State of Maryland to perform clinical testing at our Gaithersburg, Maryland laboratory. To renew our CLIA certificate, we are subject to survey and inspection every two years to assess compliance with program standards. The regulatory and compliance standards applicable to the testing we perform may change over time, and any such changes could have a material effect on our business. Our current CLIA certificate expires on October 1, 2019, and our Medical Laboratory Permit expires on June 30, 2018.
If our clinical laboratory is out of compliance with CLIA requirements, we may be subject to sanctions such as suspension, limitation or revocation of our CLIA certificate, as well as a directed plan of correction, state on-site monitoring, civil money penalties, civil injunctive suit or criminal penalties. We must maintain CLIA compliance and certification in order to perform clinical laboratory tests and report patient test results. If we were to be found out of compliance with CLIA requirements and subjected to sanction, our business could be harmed.
Federal Oversight of Laboratory Developed Tests and Research-Use-Only Products
Clinical laboratory tests, like our Acuitas MDRO Gene Test, are regulated under CLIA, as well as by applicable state laws. Historically, most laboratory developed tests, or LDTs, were not subject to FDA regulations applicable to medical devices, although reagents, instruments, software or components provided by third parties and used to perform LDTs may be subject to regulation. The FDA defines the term "laboratory developed test" as an IVD test that is intended for clinical use and designed, manufactured and used within a single laboratory. We believe that our Acuitas MDRO test products are LDTs. Currently, the FDA exercises enforcement discretion with respect to LDTs such that it does not enforce provisions of the Food, Drug and Cosmetic Act applicable to IVD devices. In July 2014, due to the increased proliferation of LDTs for complex diagnostic testing, and concerns with several high-risk LDTs related to lack of evidentiary support for claims, erroneous results and falsification of data, the FDA notified Congress that it would issue guidance that, when finalized, would adopt a risk-based framework that would increase FDA oversight of LDTs. As part of this developing framework, the FDA issued draft guidance in October 2014, informing manufacturers of LDTs of its intent to collect information from laboratories regarding their current LDTs and newly developed LDTs through a notification process. In November 2016, the FDA announced that a final LDT Policy guidance would not be issued to allow for further public discussion on an appropriate oversight approach, to give FDA's congressional authorizing committees the opportunity to develop a legislative solution to LDT regulation. The FDA further elaborated in January 2017 through a discussion paper the agency's intended framework for potential regulation while also confirming that the FDA intends to continue to exercise enforcement discretion over LDTs at this time.
77
Some products are for RUO or for investigational use only, or IUO. RUO and IUO products are not intended for human clinical use and must be properly labeled in accordance with FDA guidance. Claims for RUOs and IUOs related to safety, effectiveness, or clinical utility or that are intended for human diagnostic or prognostic use are prohibited. In November 2013, the FDA issued guidance titled "Distribution of In Vitro Diagnostic Products Labeled for Research Use Only or Investigational Use Only – Guidance for Industry and Food and Drug Administration Staff." This guidance sets forth the requirements to utilize such designations, labeling requirements and acceptable distribution practices, among other requirements.
Mere placement of an RUO or IUO label on an IVD product does not render the device exempt from otherwise applicable clearance, approval or other requirements. The FDA may determine that the device is intended for use in clinical diagnosis based on other evidence, including how the device is marketed.
We cannot predict the potential effect the FDA's current and forthcoming guidance on LDTs and IUOs/RUOs will have on our product offerings or materials used to perform our diagnostic services. While we qualify all materials used in our diagnostic services according to CLIA regulations, we cannot be certain that the FDA might not promulgate rules or issue guidance documents that could affect our ability to purchase materials necessary for the performance of our diagnostic services. Should any of the reagents obtained by us from vendors and used in conducting our diagnostic services be affected by future regulatory actions, our business could be adversely affected by those actions, including increasing the cost of service or delaying, limiting or prohibiting the purchase of reagents necessary to perform the service.
We cannot provide any assurance that FDA regulation, including premarket review, will not be required in the future for our surveillance and diagnostic services, whether through additional guidance or regulations issued by the FDA, new enforcement policies adopted by the FDA or new legislation enacted by Congress. On November 17, 2015, the House Committee on Energy and Commerce held one such hearing entitled "Examining the Regulation of Diagnostic Tests and Laboratory Operations." We expect that new legislative proposals will be introduced from time to time. It is possible that legislation could be enacted into law or regulations or guidance could be issued by the FDA which may result in new or increased regulatory requirements for us to continue to offer our diagnostic services or to develop and introduce new services.
FDA's Premarket Clearance and Approval Requirements
The FDA also has broad authority over the regulation of medical devices marketed for sale in the United States. The FDA regulates the research, clinical testing, manufacturing, safety, labeling, storage, recordkeeping, premarket clearance or approval, promotion, distribution and production of medical devices. The FDA also regulates the export of medical devices manufactured in the United States to international markets.
Under the Food, Drug, and Cosmetic Act, or FDCA, the FDA classifies medical devices into one of three classes: Class 1, Class 2 or Class 3. Devices deemed to pose lower risk are placed into either Class 1 or Class 2.
Class 1 devices are deemed to pose the lowest risk to the patient. Accordingly, Class 1 devices are subject to the lowest degree of regulatory scrutiny and need only comply with the FDA's General Controls. The General Controls include compliance with the registration, listing, adverse event reporting requirements, and applicable portions of the QSR as well as the general misbranding and adulteration prohibitions. Unless specifically exempted in the regulations, general controls require a company that intends to market a Class 1 device, like us, to gain clearance for marketing through the 510(k) process. Many Class 1 devices, however, are exempt from 510(k) clearance because the level of risk is low.
78
Class 2 devices are considered higher risk devices than Class 1 devices. Class 2 devices are subject to General Controls as well as additional Special Controls. Special Controls may include labeling requirements, mandatory performance standards, and post market surveillance. Generally companies that intend to market Class 2 devices, like us, must comply with applicable regulations and submit a 510(k) premarket submission for review to receive clearance to list and market their devices. The 510(k) must establish substantial equivalence to a predicate device. Some Class 2 devices are exempt from filing a 510(k) but in some instances, Class 2 devices may be required to file a Premarket Approval, or PMA, application.
Class 3 devices are deemed by the FDA to pose the greatest risk, such as life-sustaining, life-supporting or implantable devices, or devices deemed not substantially equivalent to a previously cleared device, and require a PMA before commercialization.
All medical device manufacturers must register their establishments with the FDA; such registrations require the payment of user fees. In addition, both 510(k) premarket submissions and PMA applications are subject to the payment of user fees, paid at the time of submission for FDA review. At this time our CLIA lab in Maryland is not required to register and list with the FDA; however, the Medical Device User Fee Act IV, or MFUFA IV, negotiations currently taking place between the FDA and medical device manufacturers include discussions regarding user fees for clinical laboratories running LDTs. This new fee would be in addition to the user fees required to operate a clinical laboratory.
The FDA has issued a regulation outlining specific requirements for "specimen transport and storage containers." "Specimen transport and storage containers" are medical devices if "intended to contain biological specimens, body waste, or body exudate during storage and transport" so that the specimen can be used effectively for diagnostic examination. Since medical devices are subject to registration and listing requirements, the reporting of corrections and removals, and responsible for medical device reporting requirements, if the FDA were to determine that our sample collection container is a medical device, the manufacturer would be required to register and list with the FDA for us to use the container for diagnostic purposes. The specimen collection device would be exempt from premarket review, and from Quality System Regulation, or QSR, requirements except for recordkeeping and complaint handling requirements, so long as no sterility claims are made, but the manufacturer would still be required to comply with applicable regulations.
510(k) Clearance Pathway
If required to obtain 510(k) clearance for our future products or conversion of our Acuitas MDRO test products to diagnostic kits, such tests would be classified as medical devices and we would have to submit a premarket notification demonstrating that the proposed device is substantially equivalent to a previously cleared 510(k) device or a device that was in commercial distribution before May 28, 1976, for which the FDA has not yet called for the submission of premarket approval applications. FDA's 510(k) clearance pathway usually takes from three to twelve months. On average the review time is approximately six months, but it can take significantly longer than twelve months in some instances, as the FDA may require additional information, including clinical data, to make a determination regarding substantial equivalence.
After a device receives 510(k) clearance, any modification that could significantly affect its safety or effectiveness, or that would constitute a new or major change in its intended use, will require a new 510(k) clearance or, depending on the modification, require a PMA. The FDA requires each manufacturer to determine whether the proposed change requires submission of a new 510(k) notice, or a premarket approval, but the FDA can review any such decision and can disagree with a manufacturer's determination. If the FDA disagrees with a manufacturer's determination, the FDA can require the manufacturer to cease marketing and/or recall the modified device until 510(k) clearance or premarket approval is obtained. If the FDA requires us to seek 510(k) clearance or premarket approval for any modifications to a previously cleared product, we may be required to cease marketing or recall the modified device until we obtain this clearance or approval. Also, in these circumstances, we may be subject to significant regulatory fines or penalties. We have made and plan to continue to make additional product enhancements to products that we believe do not require new 510(k) clearances, but we cannot guarantee that the future enhancements, should they occur, will be exempt from new 510(k) clearances.
79
Premarket Approval Pathway
A PMA application must be submitted if a device cannot be cleared through the 510(k) process. The PMA application process is generally more costly and time consuming than the 510(k) process. A PMA application must be supported by extensive data including, but not limited to, analytical, preclinical, clinical trials, manufacturing, statutory preapproval inspections, and labeling to demonstrate to the FDA's satisfaction the safety and effectiveness of the device for its intended use.
After a PMA application is sufficiently complete, the FDA will accept the application and begin an in-depth review of the submitted information. By statute, the FDA has 180 days to review the "accepted application," although, generally, review of the application can take between one and three years, but it may take significantly longer. During this review period, the FDA may request additional information or clarification of information already provided. Also during the review period, an advisory panel of experts from outside the FDA may be convened to review and evaluate the application and provide recommendations to the FDA as to the approvability of the device. The preapproval inspections conducted by the FDA include an evaluation of the manufacturing facility to ensure compliance with the QSR, as well as inspections of the clinical trial sites by the Bioresearch Monitoring group to evaluate compliance with good clinical practice and human subject protections. New premarket approval applications or premarket approval application supplements are required for modifications that affect the safety or effectiveness of the device, including, for example, certain types of modifications to the device's indication for use, manufacturing process, labeling and design. Significant changes to an approved PMA require a 180-day supplement, whereas less substantive changes may utilize a 30-day notice, or the 135-day supplement. Premarket approval supplements often require submission of the same type of information as a premarket approval application, except that the supplement is limited to information needed to support any changes from the device covered by the original premarket approval application, and may not require as extensive clinical data or the convening of an advisory panel. None of our products are currently approved under a premarket approval.
Clinical Trials
Clinical trials are almost always required to support a PMA application and are usually required to support non-exempt Class 1 and Class 2 510(k) premarket submissions. Clinical trials may also be required to support certain marketing claims. If the device presents a "significant risk," as defined by the FDA, to human health, the FDA requires the device sponsor to file an investigational device exemption, or IDE application with the FDA and obtain IDE approval prior to conducting the human clinical trials. The IDE application must be supported by appropriate data, such as analytical, animal and laboratory testing results, manufacturing information, and an Investigational Review Board, or IRB approved protocol showing that it is safe to test the device in humans and that the testing protocol is scientifically sound. The IDE application must be approved in advance by the FDA prior to initiation of enrollment of human subjects. Clinical trials for a significant risk device may begin once the investigational device exemption application is approved by the FDA. If the clinical trial design is deemed to be "non-significant risk," the clinical trial may eligible for the "abbreviated" IDE requirements; in some instances IVD clinical trials may be exempt from the more burdensome IDE requirements if certain labeling requirements are met. All clinical trials conducted to support a premarket submission must be conducted in accordance with FDA regulations and Federal and state regulations concerning human subject protection, including informed consent, oversight by an IRB and healthcare privacy requirements. A clinical trial may be suspended by the FDA or the IRB review board at any time for various reasons, including a belief that the risks to the study participants outweigh the benefits of participation in the study. Even if a study is completed, the results of our clinical testing may not demonstrate the safety and efficacy of the device, or may be equivocal or otherwise not be sufficient to obtain approval of our product. Similarly, in Europe the clinical study must be approved by the local ethics committee and in some cases, including studies of high-risk devices, by the Ministry of Health in the applicable country.
21st Century Cures Act
The 21st Century Cures Act contains several sections specific to antimicrobial innovation and antibiotic stewardship, and other provisions related to medical device innovations. The Company believes that implementation of the 21st Century Cures Act may have a positive impact on the Company's businesses through facilitating innovation and/or reducing the regulatory burden imposed on medical device manufacturers, especially those involved in antimicrobial susceptibility testing. The Company cannot predict how and when these initiatives under the Act will be implemented at the federal or state level in which we may do business, or the effect any future regulation will have on us.
80
Pervasive and Continuing FDA Regulation
Numerous regulatory requirements apply to our products classified as devices would continue to apply. These include:
| · | product listing and establishment registration, which helps facilitate FDA inspections and other regulatory action; |
| · | QSR, which requires manufacturers, including third-party manufacturers, to follow stringent design, testing, control, documentation and other quality assurance procedures during all aspects of the development and manufacturing process; |
| · | labeling regulations and FDA prohibitions against the promotion of products for uncleared, unapproved or off-label use or indication; |
| · | clearance of product modifications that could significantly affect safety or efficacy or that would constitute a major change in intended use of one of our cleared devices; |
| · | approval of product modifications that affect the safety or effectiveness of one of our cleared devices; |
| · | medical device reporting regulations, which require that manufacturers comply with FDA requirements to report if their device may have caused or contributed to a death or serious injury, or has malfunctioned in a way that would likely cause or contribute to a death or serious injury if the malfunction of the device or a similar device were to recur; |
| · | post-approval restrictions or conditions, including post-approval study commitments; |
| · | post-market surveillance regulations, which apply when necessary to protect the public health or to provide additional safety and effectiveness data for the device; |
| · | the FDA's recall authority, whereby it can ask, or under certain conditions order, device manufacturers to recall from the market a product that is in violation of governing laws and regulations; |
| · | regulations pertaining to voluntary recalls; and |
| · | notices of corrections or removals. |
OpGen's Woburn, Massachusetts facility is currently registered as an establishment with the FDA. If the LDTs performed in OpGen's CLIA-certified lab were deemed medical devices by the FDA, then we and any third-party manufacturers of such devices would need to register with the FDA as medical device manufacturers and obtain all necessary state permits or licenses to operate our business. We and any third-party manufacturers would be subject to announced and unannounced inspections by the FDA to determine our compliance with quality system regulation and other regulations. Our Woburn, Massachusetts facility was inspected by the FDA in 2015. Following such inspection, the FDA issued a report of its findings and observations, typically referred to as "Form 483 observations," primarily related to our quality systems and testing policies and documentation. We have responded to all inspection observations within the required time frame and are working with the FDA's Office of Compliance to satisfy the identified deficiencies.
Failure to comply with applicable regulatory requirements could result in enforcement action by the FDA, which might include any of the following sanctions: (1) untitled letters, Form 483 observations, warning letters, fines, injunctions, consent decrees and civil penalties; (2) unanticipated expenditures to address or defend such actions; (3) customer notifications for repair, replacement and refunds; (4) recall, detention or seizure of our products; (5) operating restrictions or partial suspension or total shutdown of production; (6) refusing or delaying our requests for 510(k) clearance or premarket approval of new products or modified products; (7) operating restrictions; (8) withdrawing 510(k) clearances or PMA approvals that have already been granted; (9) refusal to grant export approval for our products; or (10) criminal prosecution.
After a medical device is placed on the market, numerous regulatory requirements apply. These include: all of the relevant elements of the QSR, labeling regulations, restrictions on promotion and advertising, the medical device reporting (which requires the manufacturer to report to the FDA if its device may have caused or contributed to a death or serious injury or malfunctioned in a way that would likely cause or contribute to a death or serious injury if it were to recur), the Reports of Corrections and Removals regulations (which requires manufacturers to report certain recalls and field actions to the FDA), and other post-market requirements.
81
Health Insurance Portability and Accountability Act
Under HIPAA, the Department of Health and Human Services, or HHS, has issued regulations to protect the privacy and security of protected health information used or disclosed by healthcare providers, such as us, and by certain vendors of ours, also known as our business associates. The regulations include limitations on the use and disclosure of protected health information and impose notification requirements in the event of a breach of protected health information. HIPAA also regulates standardization of data content, codes and formats used in healthcare transactions and standardization of identifiers for health plans and providers. Penalties for violations of HIPAA regulations include civil and criminal penalties.
We have developed and implemented policies and procedures designed to comply with these regulations. The requirements under these regulations may change periodically and could have an effect on our business operations if compliance becomes substantially more costly than under current requirements.
In addition to Federal privacy regulations, there are a number of state laws governing confidentiality of health information that are applicable to our business. If our business expands internationally, we would be subject to compliance with other laws regarding confidentiality of health information and privacy.
New laws governing privacy may be adopted in the future as well. We have taken steps to comply with health information privacy requirements to which we are aware that we are subject. However, we can provide no assurance that we are or will remain in compliance with diverse privacy requirements in all of the jurisdictions in which we do business. Failure to comply with privacy requirements could result in civil or criminal penalties, which could have a materially adverse effect on our business.
Federal and State Physician Self-referral Prohibitions
As a clinical laboratory, and manufacturer and seller of diagnostic tests, we are subject to the Federal physician self-referral prohibitions, commonly known as the Stark Law, and to similar restrictions under the Maryland Physician Self-Referral Law. Together, these restrictions generally prohibit us from billing a patient or any governmental or private payor for any clinical laboratory services when the physician ordering the service, or any member of such physician's immediate family, has an investment interest in or compensation arrangement with us, unless the arrangement meets an exception to the prohibition.
Both the Stark Law and the Maryland Physician Self-Referral Law contain an exception for compensation paid to a physician for personal services rendered by the physician. We have compensation arrangements with a number of physicians for personal services, such as clinical advisory board services, speaking engagements and other consulting activities. We have structured these arrangements with terms intended to comply with the requirements of the personal services exception to the Stark Law and the Maryland Physician Self-Referral Law.
However, we cannot be certain that regulators would find these arrangements to be in compliance with the Stark Law, the Maryland Physician Self-Referral Law, or similar state laws. We would be required to refund any payments we receive pursuant to a referral prohibited by these laws to the patient, the payor or the Medicare program, as applicable.
Sanctions for a violation of the Stark Law include the following:
| · | denial of payment for the services provided in violation of the prohibition; |
| · | refunds of amounts collected by an entity in violation of the Stark Law; |
| · | a civil penalty of up to $15,000 for each service arising out of the prohibited referral; |
| · | possible exclusion from Federal healthcare programs, including Medicare and Medicaid; and |
| · | a civil penalty of up to $100,000 against parties that enter into a scheme to circumvent the Stark Law's prohibition. |
82
These prohibitions apply regardless of the reasons for the financial relationship and the referral. No finding of intent to violate the Stark Law is required for a violation. In addition, knowing violations of the Stark Law may also serve as the basis for liability under the Federal False Claims Act, which prohibits knowingly presenting, or causing to be presented, a false or fraudulent claim for payment to the U.S. Government.
Further, if we submit claims in violation of the Maryland Physician Self-Referral Law, we can be held liable to the payer for any reimbursement received for the services by us. Finally, other states have self-referral restrictions with which we have to comply that differ from those imposed by Federal and Maryland law. While we have attempted to comply with the Stark Law and the Maryland Physician Self-Referral Law, it is possible that some of our financial arrangements with physicians could be subject to regulatory scrutiny at some point in the future, and we cannot provide assurance that we will be found to be in compliance with these laws following any such regulatory review.
Federal and State Anti-Kickback Laws
The Federal healthcare program Anti-Kickback Law makes it a felony for a person or entity, including a laboratory, to knowingly and willfully offer, pay, solicit or receive remuneration, directly or indirectly, in order to induce business that is reimbursable under any Federal healthcare program. A violation of the Anti-Kickback Law may result in imprisonment for up to five years and fines of up to $250,000 in the case of individuals and $500,000 in the case of organizations. Convictions under the Anti-Kickback Law result in mandatory exclusion from Federal healthcare programs for a minimum of five years. In addition, HHS has the authority to impose civil assessments and fines and to exclude healthcare providers and others engaged in prohibited activities from Medicare, Medicaid and other Federal healthcare programs. Actions which violate the Anti-Kickback Law also incur liability under the Federal False Claims Act.
Although the Anti-Kickback Law applies only to Federal healthcare programs, a number of states, including Maryland, have passed statutes substantially similar to the Anti-Kickback Law pursuant to which similar types of prohibitions are made applicable to all other health plans and third-party payers. Violations of Maryland's anti-kickback law are punishable by tiered criminal penalties based on the crime with a maximum penalty of life imprisonment and fines of up to $200,000, or both. Civil penalties include three times the amount of any overpayment made in violation of the statute.
Federal and state law enforcement authorities scrutinize arrangements between healthcare providers and potential referral sources to ensure that the arrangements are not designed as a mechanism to induce patient care referrals or induce the purchase or prescribing of particular products or services. The law enforcement authorities, the courts and Congress have also demonstrated a willingness to look behind the formalities of a transaction to determine the underlying purpose of payments between healthcare providers and actual or potential referral sources. Generally, courts have taken a broad interpretation of the scope of the Anti-Kickback Law, holding that the statute may be violated if merely one purpose of a payment arrangement is to induce referrals or purchases.
In addition to statutory exceptions to the Anti-Kickback Law, regulations provide for a number of safe harbors. If an arrangement meets the provisions of a safe harbor, it is deemed not to violate the Anti-Kickback Law. An arrangement must fully comply with each element of an applicable safe harbor in order to qualify for protection. There are no regulatory safe harbors to the Maryland anti-kickback law.
Among the safe harbors that may be relevant to us is the discount safe harbor. The discount safe harbor potentially applies to discounts provided by providers and suppliers, including laboratories, to physicians or institutions. If the terms of the discount safe harbor are met, the discounts will not be considered prohibited remuneration under the Anti-Kickback Law. Maryland does not have a discount safe harbor.
The personal services safe harbor to the Anti-Kickback Law provides that remuneration paid to a referral source for personal services will not violate the Anti-Kickback Law provided all of the elements of that safe harbor are met. One element is that if the agreement is intended to provide for the services of the physician on a periodic, sporadic or part-time basis, rather than on a full-time basis for the term of the agreement, the agreement must specify exactly the schedule of such intervals, their precise length, and the exact charge for such intervals.
83
Our personal services arrangements with some physicians may not meet the specific requirement of this safe harbor that the agreement specify exactly the schedule of the intervals of time to be spent on the services because the nature of the services, such as speaking engagements, does not lend itself to exact scheduling and therefore meeting this element of the personal services safe harbor is impractical. Failure to meet the terms of the safe harbor does not render an arrangement illegal. Rather, the government may evaluate such arrangements on a case-by-case basis, taking into account all facts and circumstances.
While we believe that we are in compliance with the Anti-Kickback Law and the Maryland anti-kickback law, there can be no assurance that our relationships with physicians, academic institutions and other customers will not be subject to investigation or challenge under such laws. If imposed for any reason, sanctions under the Anti-Kickback Law and the Maryland anti-kickback law could have a negative effect on our business.
Other Federal and State Fraud and Abuse Laws
In addition to the requirements discussed above, several other healthcare fraud and abuse laws could have an effect on our business. For example, provisions of the Social Security Act permit Medicare and Medicaid to exclude an entity that charges the Federal healthcare programs substantially in excess of its usual charges for its services. The terms "usual charge" and "substantially in excess" are ambiguous and subject to varying interpretations.
Further, the Federal False Claims Act prohibits a person from knowingly submitting a claim, making a false record or statement in order to secure payment or retaining an overpayment by the Federal government. In addition to actions initiated by the government itself, the statute authorizes actions to be brought on behalf of the Federal government by a private party having knowledge of the alleged fraud, also known as qui tam lawsuits. Because the complaint is initially filed under seal, the action may be pending for some time before the defendant is even aware of the action. If the government is ultimately successful in obtaining redress in the matter or if the plaintiff succeeds in obtaining redress without the government's involvement, then the plaintiff will receive a percentage of the recovery. It is not uncommon for qui tam lawsuits to be filed by employees, competitors or consultants.
Finally, the Social Security Act includes its own provisions that prohibit the filing of false claims or submitting false statements in order to obtain payment. Violation of these provisions may result in fines, imprisonment or both, and possible exclusion from Medicare or Medicaid programs. Maryland has an analogous state false claims act applicable to state health plans and programs, as do many other states.
Maryland Laboratory Licensing
Maryland requires that any site that performs clinical laboratory testing located in the state of Maryland, with limited exceptions, must be licensed by the state, in addition to meeting Federal CLIA requirements. As such, our laboratory in Gaithersburg, Maryland holds a current Maryland license and is subject to on-site surveys by Maryland's Office of Health Care Quality. Our license was renewed in 2016 and will expire in June 2018.
Other States' Laboratory Licensing
In addition to Maryland, other states including California, Florida, New York, Pennsylvania, Rhode Island, and the District of Columbia, require licensing of out-of-state laboratories under certain circumstances. We have obtained licenses to receive specimens from Pennsylvania, Florida, and New York. We intend to obtain licenses from additional states and jurisdictions where we believe we are required to be licensed, and believe we are in compliance with applicable licensing laws.
From time to time, we may become aware of other states that require out-of-state laboratories to obtain licensure in order to accept specimens from the state, and it is possible that other states do have such requirements or will have such requirements in the future. If we identify any other state with such requirements or if we are contacted by any other state advising us of such requirements, we intend to comply with such requirements.
84
International Regulation
Sales of diagnostic tests like our Acuitas MDRO test products outside the United States would be subject to foreign government regulations, which vary substantially from country to country. In order to market our products in other countries, we would need to obtain regulatory approvals and comply with extensive safety and quality regulations in other countries. OpGen's Woburn, Massachusetts facility is currently ISO 13485 certified; the facility passed an inspection by our Notified Body in January 2017. While such certification is not required to distribute products internationally, the ISO 13485 certification implies that we are in compliance with the applicable regulatory requirements to distribute our medical devices internationally. OpGen currently distributes products in the European Union through its Denmark office. The time required to obtain approval by a foreign country may be longer or shorter than that required for FDA clearance or approval, and the requirements may differ significantly. If we elect to, or are required to, seek clearance of or approval for any of our products from the FDA, we may be able to commercialize such products with shorter lead time in international markets, but would need to establish international operations in order to do so.
Environmental Matters
Our operations require the use of hazardous materials (including biological materials) which subject us to a variety of Federal, state and local environmental and safety laws and regulations. Some of these regulations provide for strict liability, holding a party potentially liable without regard to fault or negligence. We could be held liable for damages and fines as a result of our, or others', business operations should contamination of the environment or individual exposure to hazardous substances occur. We cannot predict how changes in laws or new regulations will affect our business, operations or the cost of compliance.
Glossary
The following scientific, healthcare, regulatory and OpGen-specific terms are used throughout this prospectus:
"Acuitas AMR Gene Panel u5.47" is a qualitative and semi-quantitative nucleic acid-based in vitro diagnostic test that is capable of simultaneous detection and identification of multiple bacterial nucleic acids and select genetic determinants of antimicrobial resistance in urine specimens or bacterial colonies isolated from urine.
"Acuitas CR Elite" is a comprehensive test for detection of CRE including our Acuitas MDRO gene test, culture-based detection, and Acuitas resistome testing on positive specimens.
"Acuitas Lighthouse" is our informatics platform, developed internally to provide real-time information on the MDRO status for patients and hospitals. We combine our molecular test information and microbiology test results from our customized CLIA-based tests to create Acuitas Lighthouse profiles for hospitals, health systems and communities, which we call our Acuitas Lighthouse informatics, and we are developing Acuitas Lighthouse Software for use with our Acuitas AMR Gene Panel in development. Acuitas Lighthouse profiling facilitates MDRO tracking and results can be aggregated with hospital data to provide customized reports including alerts, prevalence, trend analysis and transmission information.
"Acuitas MDRO Gene Test" means our internally developed test that detects ten critical MDRO genes, including CRE (7 genes), ESBL (2 genes) and VRE-resistant organisms, from one patient swab.
"Acuitas MDRO test products" means our Acuitas MDRO Gene Test, Acuitas CR Elite Test and Acuitas Resistome Test.
"Acuitas Resistome Test" means our rapid, high resolution test that includes additional resistance genes for carbapenems, ESBLs and AmpC.
"antibiotic stewardship" has been defined by the CDC to mean hospital-based programs dedicated to improving use of antibiotic therapy with the goal of optimizing the treatment of infections and reducing the adverse events associated with antibiotic use.
"CDC" means the U.S. Centers for Disease Control and Prevention.
85
"CLIA" means the Clinical Laboratory Improvements Act of 1988, as amended.
"CLIA lab" means a clinical or reference laboratory meeting the requirements of the Clinical Laboratory Improvements Act of 1988, as amended.
"CMS" means the Centers for Medicare and Medicaid Services.
"CRE" means carbapenem-resistant Enterobacteriaceae, an MDRO.
"CRO" means carbapenem-resistant organisms, an MDRO.
"DNA sequencing" is the process of determining the precise order of nucleotides within a DNA molecule.
"epidemiologically linked" means situations where it is shown that one person is the source of an infection that spreads through contact to one or more other persons.
"ESBL" means extended spectrum beta lactamase bacteria.
"FDA" means the U.S. Food and Drug Administration.
"HAIs" means healthcare-associated infections. Such infections could arise first in the hospital or other healthcare setting, or could result from a patient, colonized with an organism, developing an active infection once admitted to the hospital or other healthcare setting.
"HIPAA" means the Federal Health Insurance Portability and Accountability Act of 1996, as amended by the Health Information Technology for Economic and Clinical Health Act, or HITECH Act. HIPAA and HITECH Act are Federal laws mandating security and privacy of protected personal health information of patients.
"informatics" refers to methods, algorithms and processes for the collection, classification, storage and analysis of biochemical and biological data and information using computers, especially as applied in molecular genetics and genomics. Our focus is on acquiring such data and information related to MDROs to assist in diagnosis and screening of patients and antibiotic stewardship initiatives by acute care hospitals. When we use the term "advanced informatics," we mean informatics combined with higher levels of complexity, sophistication and subject matter expertise related to MDROs, diagnostics, antibiotic stewardship, and the development of associated analysis tools, or the novel application of existing informatics in future products or services. In this prospectus, we also sometimes use the phrase "informatics products and services," often interchangeably with "informatics platform," to describe the Company's focus on the use of informatics and advanced informatics in its current and future product and service offerings.
"informatics platform" means a combination of software tools and analytical processes that streamline the production and analysis of informatics data. When we use the term informatics platform, we are primarily referring to Acuitas Lighthouse.
"IVD" means in vitro diagnostic.
"KPC" means Klebsiella pneumoniae Carbapenemase, an MDRO.
"LIMS" means a laboratory information management system.
"MDRO" means a multidrug-resistant organism.
"PCR" means polymerase chain reaction.
"QSR" means Quality System Regulation.
"SEC" means the U.S. Securities and Exchange Commission.
"Securities Act" means the Securities Act of 1933, as amended.
86
"WHO" means the World Health Organization.
Employees
As of December 31, 2017, we had 43 employees worldwide, with 42 employed in the United States and 1 employed in Denmark. There are 35 full-time employees. The 42 employees in the United States primarily work in our Gaithersburg, Maryland and Woburn, Massachusetts locations. None of our employees are the subject of collective bargaining arrangements, and our management considers its relationships with employees to be good.
87
MANAGEMENT
Directors and Executive Officers
The Board of Directors of the Company, or the Board, are elected at the annual meeting of the stockholders, and serve for the term for which each director is elected and until his or her successor is elected and qualified. Executive officers of the Company are elected by the Board, and serve for a term of one year and until their successors have been elected and qualified or until their earlier resignation or removal by the Board. There are no family relationships among any of the directors and executive officers of the Company. None of the executive officers or directors has been involved in any legal proceedings of the type requiring disclosure by the Company during the past ten years. On July 14, 2015, the Company entered into the Purchase Agreement with MGHIF. Pursuant to the Purchase Agreement, the Company's Board was expanded to seven members and MGHIF had the right, subject to the consent of the Company, to fill the new vacancy on the Board. Additionally, for as long as MGHIF holds at least five percent (5%) of the outstanding common stock of the Company, the Board is required to nominate MGHIF's designee, or any replacement, for election by the stockholders at each annual or special meeting of the stockholders at which directors are elected. MGHIF nominated, and the Board consented to, David M. Rubin Ph.D. serving as its designee on the Board. Otherwise, there are no arrangements or understandings between any director or executive officer and the Company pursuant to which he or she was selected as a director.
The following table sets forth the names and ages of all directors and executive officers of the Company and their respective positions with the Company as of the date of this prospectus:
| Name | Age | Position |
Directors | ||
| Evan Jones | 60 | Chief Executive Officer, Director and Chairman of the Board |
| Harry J. D'Andrea | 61 | Director |
| Timothy J.R. Harris, Ph.D., D.Sc | 67 | Director |
| Tina S. Nova, Ph.D. | 64 | Director |
| David M. Rubin, Ph.D. | 52 | Director |
| Misti Ushio, Ph.D. | 46 | Director |
Other Executive Officers | ||
| Timothy C. Dec | 59 | Chief Financial Officer and Corporate Secretary |
| Vadim Sapiro | 47 | Chief Information Officer |
Board of Directors
The following information summarizes, for each of our directors, his or her principal occupations and other public company directorships for at least the last five years and information regarding the specific experiences, qualifications, attributes and skills of such director:
Evan Jones. Mr. Jones has served as our Chief Executive Officer since October 2013 and as Chairman of our Board since September 2010. He served as our President from October 2013 until April 2015. Since 2007, Mr. Jones has served as managing member of jVen Capital, LLC, a life sciences investment company. Previously, he co-founded Digene Corporation, a publicly traded biotechnology company focused on women's health and molecular diagnostic testing that was sold to Qiagen N.V. (Nasdaq: QGEN) in 2007. He served as chairman of Digene's board of directors from 1995 to 2007, as Digene's chief executive officer from 1990 to 2006, and as Digene's president from 1990 to 1999. Mr. Jones currently serves on the board of directors of Foundation Medicine, Inc. (Nasdaq: FMI), a cancer testing molecular informatics company, since January 2013, and Veracyte, Inc. (Nasdaq: VCYT), a leading genomic diagnostics company, since 2008. From March 2011 to August 2017 he served on the board of Fluidigm Corporation (Nasdaq: FLDM), a technology company that develops, manufactures and markets life science analytical and preparatory systems. Mr. Jones received a B.A. from the University of Colorado and an M.B.A. from The Wharton School at the University of Pennsylvania. We believe that Mr. Jones' qualifications to serve as CEO of the Company and as Chairman of our Board include his extensive experience in the molecular diagnostic testing industry, including as chief executive officer of a public company focused on molecular diagnostic testing, as well as his service as a board member with other public and private companies and Vice Chair of the board at Children's National Medical Center in Washington, D.C.
88
Harry J. D'Andrea. Mr. D'Andrea has been a director of OpGen since April 2016. Mr. D'Andrea is managing general partner of Valhalla Partners, a venture capital firm, a position he has held since January 2012. He previously served as administrative general partner of Valhalla Partners since June 2002, and was a co-founder of Valhalla Partners in 2002. From June 1999 to February 2002, Mr. D'Andrea was Chief Financial Officer of Advanced Switching Communications, Inc., a Nasdaq-listed company that completed its IPO in October 2000. Prior thereto from 1989 to 1999 he held senior financial positions with a number of privately held and public companies. Mr. D'Andrea has served on the boards of two publicly traded companies in the past. He received his B.A. in Foreign Service from The Pennsylvania State University in 1978 and his MBA from Drexel University in 1980.
Timothy J.R. Harris, Ph.D., D.Sc. Dr. Harris has been a director of OpGen since April 2015. Dr. Harris is a science and business leader with nearly 40 years of experience guiding and leading laboratory work and scientists in a range of molecular research areas. He is a molecular biologist, biochemist and geneticist by training and is currently EVP R&D at Bioverativ Inc, a Sanofi Company . and a Venture Partner at SV Health Investors, a position he has held since March 2016. He was the SVP for Precision Medicine at Biogen from March 2015 until February 2016, and prior to that SVP of Translational Medicine at Biogen Idec from June 2011 to February 2016. He was the Chief Technology Officer and Director of the Advanced Technology Program at SAIC-Frederick, Inc. in Maryland from January 2007 to June 2011, which operates the National Cancer Institute's leading center for cancer and AIDS research (now Frederick National Laboratory operated by Leidos Inc.). He has served as President and Chief Executive Officer of Novasite Pharmaceuticals, and he founded SGX Pharmaceuticals in 1999 (formerly Structural Genomix), where he built the company to more than 130 employees, raised $85M in capital, and generated more than $20M in revenue during six years as CEO before it was sold to Eli Lilly. Before founding SGX, Dr. Harris was Senior Vice President, Research and Development at Sequana/Axys. He began his scientific career working on animal viruses such as foot & mouth disease and was one of the first molecular biologists (1981) at Celltech (now UCB Pharma) in the United Kingdom. He subsequently spent nearly five years at Glaxo Group Research as Director of Biotechnology from 1989 to 1993. Dr. Harris received a Ph.D. and M.S. in General Virology and a B.Sc. in Biochemistry from the University of Birmingham in England and has an honorary doctorate (D.Sc.) from the University of Birmingham, UK awarded in July 2010. He is currently a visiting Professor at Columbia University.
Tina S. Nova, Ph.D. Dr. Nova has been a director of OpGen since April 2017. Dr. Nova is a life science industry veteran with extensive experience building and leading novel genomics- based businesses. She currently serves as president and chief executive officer of Molecular Stethoscope, Inc., a newly formed molecular diagnostics company, a position she has held since October 2015. Prior thereto, she served as senior vice president and general manager of Illumina's oncology business unit from July 2014 to August 2015. From March 2000 to April 2014, Dr. Nova was a co-founder and director, president and chief executive officer of Genoptix Medical Laboratory, which was purchased by Novartis Pharmaceuticals Corporation for nearly $500 million in 2011. She has also held senior executive positions with Nanogen, Inc., Ligand Pharmaceuticals, Inc. and Hybritech, Inc. Dr. Nova currently serves on the board of directors for Arena Pharmaceuticals, Veracyte, Inc. and is vice chairman of the board of directors for the newly formed Rady Pediatric Genomics and Systems Medicine Institute, which is part of Rady Children's Hospital-San Diego. She holds a B.S. degree in Biological Sciences from the University of California, Irvine, and a Ph.D. in Biochemistry from the University of California, Riverside.
David M. Rubin, Ph.D. Dr. Rubin has been a director of OpGen since July 2015. Dr. Rubin is currently a managing director at MGHIF, where he is responsible for identifying investment opportunities in emerging health care solutions and services, with a particular emphasis on solutions for precision medicine. Prior to joining MGHIF, Dr. Rubin led Merck & Co.'s portfolio management efforts in Oncology. Dr. Rubin joined Merck in 2007 from Cognia Corporation, where he was the president and chief executive officer. Previously, Dr. Rubin was at The Wilkerson Group/IBM Global Services. Dr. Rubin previously served on the board of VirtualScopics, Inc. (Nasdaq: VSCP) from 2012 through 2014 and several other GHI portfolio companies. Dr. Rubin currently serves on the boards of directors of Electrocore, LLC and Navigating Cancer, Inc. Dr. Rubin was a National Institute of Health and American Cancer Society post-doctoral fellow at Harvard Medical School. Dr. Rubin also received training in post-graduate business at Harvard University. Dr. Rubin holds a Ph.D. from Temple University in Molecular Biology and a B.A. from SUNY Binghamton in Biology.
Misti Ushio, Ph.D. Dr. Ushio has been a director of OpGen since March 2012. Dr. Ushio is the co-founding chief executive officer and a director of TARA Biosystems, a position she has held since February 2016. Prior thereto, she was Chief Strategy Officer and a Managing Director at Harris & Harris Group, Inc. from May 2007 to February 2016. Prior to joining Harris & Harris, Dr. Ushio worked at Merck & Co. (NYSE: MRK) for over ten years in bioprocess research & development, and was a Technology Licensing Officer at Columbia University. Dr. Ushio currently serves or has served on the boards of Accelerator-NYC, AgBiome, Enumeral Biomedical, Lodo Therapeutics, Petra Pharma, Senova Systems and SynGlyco. Dr. Ushio holds a B.S. in Chemical Engineering from Johns Hopkins University, an M.S. in Chemical Engineering from Lehigh University, and a Ph.D. in Biochemical Engineering from University College London.
89
Executive Officers
The following information summarizes, for each of our officers, his principal occupations and other employment for at least the last five years:
Evan Jones. See above under "Board of Directors."
Timothy C. Dec. Mr. Dec joined OpGen as our interim Chief Financial Officer in April 2015 and became our Chief Financial Officer in May 2015. Prior to joining OpGen, Mr. Dec served as Senior Vice President and Chief Financial Officer for Clubwidesports, LLC, a start-up sports management software company, from January 2014 to April 2015. From December 2012 to the present, Mr. Dec is an adjunct professor at Mount St. Mary's University, where he teaches M.B.A. courses in Finance. From August 2007 to December 2012, Mr. Dec served as Senior Vice President and Chief Financial Officer of Fortress International Group, Inc., a publicly traded company. Mr. Dec has served in chief financial officer or other senior financial executive roles at companies in a number of industries from September 1986 through August 2007, including three publicly traded companies listed on Nasdaq or NYSE American, such as Corvis Corporation, and with private equity-backed companies. Mr. Dec also has public accounting firm experience. Mr. Dec received his B.S. in Accounting from Mount St. Mary's University and an M.B.A. from American University.
Vadim Sapiro. Mr. Sapiro joined OpGen in December 2011 as Chief Information Officer. Mr. Sapiro is responsible for leading the development of the Company's informatics applications, software, databases and information technology operations. Prior to joining OpGen, Mr. Sapiro was Senior Vice President at SAIC-Frederick (now Leidos Biomedical Research Inc.) from June 2008 to December 2011, overseeing the Information Systems Program for the National Cancer Institute at SAIC-Frederick. From January 2007 to May 2008, Mr. Sapiro served as Vice President for Information Technology of J. Craig Venter Institute, a non-profit research institute. Mr. Sapiro served in other senior information technology roles from July 1999 through December 2006, including another non-profit research institute. Mr. Sapiro holds a B.S. in Mathematics and Computer Science from the University of Maryland.
Independence of the Board of Directors Members
The Company defines "independent" as that term is defined in Rule 5605(a)(2) of the Nasdaq listing standards. The Board has determined that Mr. D'Andrea and Drs. Harris, Nova, Rubin and Ushio qualify as independent and none of them has any material relationship with the Company that might interfere with his or her exercise of independent judgment.
90
EXECUTIVE COMPENSATION
Compensation Tables
Summary Compensation Table—2017 and 2016 Fiscal Years
This table provides disclosure, for fiscal years 2017 and 2016 for the named executive officers, who are (1) any individual serving in the office of Chief Executive Officer during any part of 2017 and (2) the Company's two most highly compensated officers, other than the Chief Executive Officer, who were serving in such capacity on December 31, 2017.
| Named Executive Officer and Principal Position | Year | Salary ($) | Bonus ($) | Stock Awards (1)($) | Option Awards (1)($) | Non-Equity Incentive Plan Compensation (2)($) | All Other Compensation ($) | Total ($) | |||||||||||||||||||||
| Evan Jones | 2017 | $ | 375,962 | $ | - | $ | - | $ | 43,210 | $ | - | $ | - | $ | 419,172 | ||||||||||||||
| Chief Executive Officer | 2016 | $ | 316,538 | $ | - | $ | - | $ | 499,352 | $ | - | $ | - | $ | 815,890 | ||||||||||||||
| Timothy Dec | 2017 | $ | 291,102 | $ | - | $ | 10,325 | $ | 45,580 | $ | - | $ | - | $ | 347,007 | ||||||||||||||
| Chief Financial Officer | 2016 | $ | 273,462 | $ | - | $ | - | $ | 44,996 | $ | - | $ | - | $ | 318,458 | ||||||||||||||
| Vadim Sapiro | 2017 | $ | 291,102 | $ | - | $ | 10,325 | $ | 38,559 | $ | 50,000 | $ | - | $ | 389,986 | ||||||||||||||
| Chief Information Officer | 2016 | $ | 280,385 | $ | - | $ | - | $ | 29,997 | $ | - | $ | - | $ | 310,882 | ||||||||||||||
| (1) | The "Stock Awards" column reflects the grant date fair value for all restricted stock units awarded under the 2015 Plan during 2017 and 2016. The "Option Awards" column reflects the grant date fair value for all stock option awards granted under the 2015 Plan or the 2008 Plan during 2017 and 2016, respectively, except for Mr. Jones – the 2016 stock option grant was made outside of the 2015 Plan, subject to stockholder approval that was obtained on June 22, 2016. These amounts are determined in accordance with FASB Accounting Standards Codification 718 (ASC 718), without regard to any estimate of forfeiture for service vesting. Assumptions used in the calculation of the amounts in these columns for 2017 and 2016 will be included in a footnote to the Company's consolidated audited financial statements for the year ended December 31, 2017. |
| (2) | On March 7, 2018, the Board upon the recommendation of the Compensation Committee approved the 2017 bonuses for the executive officers of the Company, including Vadim Sapiro, Chief Information Officer of the Company. During 2017, the Compensation Committee recommended, and the Board approved, a short-term annual cash bonus plan for employees, including the named executive officers (the "2017 Bonus Plan"). The 2017 Bonus Plan had six general corporate goals and a bonus pool funding mechanism. The general corporate goals related to: (1) successful completion of development goals for the Acuitas AMR Gene Panel and Acuitas Lighthouse products and services in development; (2) receipt of third party collaboration or partnering arrangement funding from third parties; (3) commercial traction for the Company's Acuitas AMR Gene Panel and Acuitas Lighthouse products and services in development; (4) consummation of capital raising transaction or transactions; (5) pursuit of strategic technology acquisitions and strengthening the management team; and (6) implementation of a restructuring plan to consolidate the Company's operations in its Gaithersburg MD facility. The bonus pool funding mechanism was designed to fund the pool only if annual revenues for 2017 exceeded a $3.0 million threshold. The Committee determined that the bonus pool funding was achieved at a level above threshold and that the corporate goals were achieved at 73% of target. Management recommended, and the Committee approved, payment of bonuses under the 2017 Bonus Plan at 55% of target. After discussion with the Committee and the Board, each of Mr. Jones and Mr. Dec agreed to forego receipt of a bonus under the 2017 Bonus Plan given the loss of shareholder value during 2017 despite the operational progress, to allow the Company to retain the cash to advance its operations. A bonus of $50,000, representing 55% of target, was earned by Mr. Sapiro under the 2017 Bonus Plan. |
91
Employment Agreements with Our Named Executive Officers
The Company has entered into employment agreements with, and provides post-employment benefits to, our named executive officers as follows:
Evan Jones – On March 3, 2014, we entered into an amended and restated employment agreement with Evan Jones, our Chief Executive Officer. The agreement provides that Mr. Jones will serve as our Chief Executive Officer at the equivalent of seventy percent of a full-time commitment. His initial base salary of $190,000 reflected that pro rata adjustment. When he assumed the role of Chief Executive Officer, he agreed to receive base compensation for all of his positions through the issuance of restricted stock units, in lieu of cash salary, for the period from October 25, 2013 to June 30, 2014. In addition, Mr. Jones received an award of stock options to purchase three and one-half percent (3.5%) of the fully diluted equity of the Company following the closing of the 2014 Series A Convertible Preferred Stock offering, completed in February, April and May 2014. Mr. Jones receives annual bonus opportunities based on performance goals determined by our Board. The current maximum target opportunity is seventy percent of annual base salary. Under his employment agreement, Mr. Jones waived his rights to participate in any fringe benefit plans offered to the Company's employees, except for participation in the Company's 401(k) plan. The agreement with Mr. Jones also includes standard confidentiality, general release and other provisions.
Timothy C. Dec – On April 17, 2015, we entered into an employment agreement with Timothy C. Dec, our Chief Financial Officer, with an initial base salary of $260,000 and annual bonus opportunities based on performance goals determined by our Board, with a bonus of thirty percent (30%) of annual base salary. In addition, Mr. Dec received an award of stock options to purchase three-quarters of one percent (0.75%) of the fully diluted equity of the Company. The stock options initially vested in equal monthly installments until June 30, 2015, and then vest in accordance with the Company's standard vesting practices. The agreement provided for the acceleration of the award if Mr. Dec's employment is terminated in connection with a change in control, if the award is not continued, assumed or substituted and would otherwise terminate and expire upon the change in control. In addition, the agreement provided for acceleration of the award, if the award is continued, assumed or substituted for in connection with a change in control, and, during the six (6) month period after the effective date of the change in control, Mr. Dec's employment with the Company is terminated without cause.
On January 29, 2018, we entered into an Executive Change in Control and Severance Benefits Agreement, or a severance agreement, with Mr. Dec. The severance agreement replaces the prior employment offer letter agreement described above. Under the severance agreement, in the event of a termination without cause by the Company or a termination for good reason by Mr. Dec, Mr. Dec will receive severance equal to six (6) months base salary at the time of termination. In addition, if Mr. Dec's employment is terminated without cause by the Company or any successor, or by Mr. Dec for good reason at any time within two years after a change of control of the Company, Mr. Dec shall receive the following additional benefits: (1) acceleration, vesting and lapse of forfeiture on any outstanding equity awards granted to Mr. Dec, and, if applicable, extended time to exercise vested stock options; and (2) payment by the Company or its successor of health benefits for Mr. Dec and/or his family at levels substantially equal to those which would have been provided to him or them in accordance with the plans, programs, practices and policies in effect as of the date before the change in control.
Vadim Sapiro – On January 27, 2012, we entered into an executive change in control and severance benefits agreement with Vadim Sapiro, our Chief Information Officer. Under the agreement, upon any termination of Mr. Sapiro's employment without "cause" that constitutes a "separation from service" under Section 409A of the Internal Revenue Code, he would receive severance compensation equal to his base salary at the time of termination for six months. The agreement provided for the acceleration of the vesting, or lapse of forfeiture restrictions on his outstanding equity awards that were granted on or prior to December 31, 2011, in the event of termination of employment in connection with a change in control. In addition, the agreement provided that, for 12 months following a change in control, if Mr. Sapiro terminates his employment with the Company for good reason and such termination constitutes a "separation from service" under Section 409A of the Code, Mr. Sapiro would receive severance compensation equal to his base salary at the time of termination for six months. On November 1, 2013, we amended the executive change in control and severance benefits agreement to add a provision providing the Company the ability to terminate the agreement upon sixty days (60) prior written notice.
92
On January 29, 2018, we entered into an Amended and Restated Executive Change in Control and Severance Benefits Agreement, or a severance agreement, with Mr. Sapiro. The severance agreement replaces the prior executive change in control and severance benefits agreement, as amended, described above. Under the severance agreement, in the event of a termination without cause by the Company or a termination for good reason by Mr. Sapiro, Mr. Sapiro will receive severance equal to six (6) months base salary at the time of termination. In addition, if Mr. Sapiro's employment is terminated without cause by the Company or any successor, or by Mr. Sapiro for good reason at any time within two years after a change of control of the Company, Mr. Sapiro shall receive the following additional benefits: (1) acceleration, vesting and lapse of forfeiture on any outstanding equity awards granted to Mr. Sapiro, and, if applicable, extended time to exercise vested stock options; and (2) payment by the Company or its successor of health benefits for Mr. Sapiro and/or his family at levels substantially equal to those which would have been provided to him or them in accordance with the plans, programs, practices and policies in effect as of the date before the change in control.
For purposes of the severance agreements in effect, the following terms have the following meanings (where applicable):
"cause" means (i) executive's commission of a felony; (ii) any act or omission of executive constituting dishonesty, fraud, immoral or disreputable conduct that causes material harm to the Company; (iii) executive's violation of Company policy that causes material harm to the Company; (iv) executive's material breach of any written agreement between executive and the Company which, if curable, remains uncured after notice; or (v) executive's breach of fiduciary duty. The termination of executive's employment as a result of the death or disability is not deemed to be a termination without cause.
"change in control" means:
(i) a transaction or series of transactions (other than an offering of common stock to the general public through a registration statement filed with the SEC) whereby any "person" or related "group" of "persons" (as such terms are used in Sections 13(d) and 14(d)(2) of the Exchange Act (other than the Company, any of its subsidiaries, an employee benefit plan maintained by the Company or any of its subsidiaries or a "person" that, prior to such transaction, directly or indirectly controls, is controlled by, or is under common control with, the Company) directly or indirectly acquires beneficial ownership (within the meaning of Rule 13d-3 under the Exchange Act) of securities of the Company possessing more than 50% of the total combined voting power of the Company's securities outstanding immediately after such acquisition; or
(ii) the consummation by the Company (whether directly involving the Company or indirectly involving the Company through one or more intermediaries) of (x) a merger, consolidation, reorganization, or business combination or (y) a sale or other disposition of all or substantially all of the Company's assets in any single transaction or series of related transactions or (z) the acquisition of assets or stock of another entity, in each case other than a transaction: (1) which results in the Company's voting securities outstanding immediately before the transaction continuing to represent (either by remaining outstanding or by being converted into voting securities of the Company or the person that, as a result of the transaction, controls, directly or indirectly, the Company or owns, directly or indirectly, all or substantially all of the Company's assets or otherwise succeeds to the business of the Company (the Company or such person, the Successor) directly or indirectly, at least a majority of the combined voting power of the Successor's outstanding voting securities immediately after the transaction, and (2) after which no person or group beneficially owns voting securities representing 50% or more of the combined voting power of the Successor; provided, however, that no person or group shall be treated for purposes of this definition as beneficially owning 50% or more of the combined voting power of the Successor solely as a result of the voting power held in the Company prior to the consummation of the transaction; or
(iii) the Company's stockholders approve a liquidation or dissolution of the Company.
"good reason" means any of the following, without executive's consent: (i) a material diminution of executive's responsibilities or duties (provided, however, that the acquisition of the Company and subsequent conversion of the Company to a division or unit of the acquiring company will not by itself be deemed to be a diminution of executive's responsibilities or duties); (ii) material reduction in the level of executive's base salary (and any such reduction will be ignored in determining executive's base salary for purposes of calculating the amount of severance pay); (iii) relocation of the office at which executive is principally based to a location that is more than fifty (50) miles from the location at which executive performed his duties immediately prior to the effective date of a change in control; (iv) failure of a successor in a change in control to assume the severance agreement; or (v) the Company's material breach of any written agreement between executive and the Company. Notwithstanding the foregoing, any actions taken by the Company to accommodate a disability of executive or pursuant to the Family and Medical Leave Act shall not be a good reason for purposes of the agreement. Additionally, before executive may terminate employment for a good reason, executive must notify the Company in writing within thirty (30) days after the initial occurrence of the event, condition or conduct giving rise to good reason, the Company must fail to remedy or cure the alleged good reason within the thirty (30) day period after receipt of such notice if capable of being cured within such thirty-day period, and, if the Company does not cure the good reason (or it is incapable of being cured within such thirty-day period), then executive must terminate employment by no later than thirty (30) days after the expiration of the last day of the cure period (or, if the event condition or conduct is not capable of being cured within such thirty-day period, within thirty (30) days after initial notice to the Company of the violation). Transferring executive's employment to a successor is not itself good reason to terminate employment under the agreement, provided, however, that subparagraphs (i) through (v) above shall continue to apply to executive's employment by the successor. This definition is intended to constitute a "substantial risk of forfeiture" as defined under Treasury Regulation 1.409A-1(d).
93
Outstanding Equity Awards at Fiscal Year-End Table—2017
The following table shows the outstanding equity awards held by the named executive officers as of December 31, 2017.
| OPTION AWARDS | STOCK AWARDS | ||||||||
| Name | (1) Number of Securities Underlying Unexercised Options Exercisable | (1) Number of Securities Underlying Unexercised Options Unexercisable | Equity Incentive Plan Awards: Number of Securities Underlying Unexercised Unearned Options | Option Exercise Price ($) | Option Expiration Date | Number of Shares of Stock that have not Vested | Market Value of Shares of Stock that have not Vested ($) | Equity Incentive Plan Awards: Number of Unearned Shares, Units or Other Rights that have not Vested | Equity Incentive Plan Awards: Market or Payout Value of Unearned Shares, Units or other Rights that have not Vested ($) (2) |
| Evan Jones(3) | 3 | - | - | 1,976.25 | 7/23/2018 | - | - | - | |
| 73 | - | - | 2,767.00 | 9/21/2020 | - | - | - | - | |
| 6,097 | 872 | - | 1.25 | 4/24/2024 | - | - | - | - | |
| 6,500 | 1,500 | - | 15.25 | 10/23/2024 | - | - | - | - | |
| 15,330 | 15,330 | - | 33.75 | 4/28/2026 | - | - | - | - | |
| 1,000 | 2,200 | - | 25.75 | 2/23/2027 | - | - | - | - | |
| Timothy Dec(4) | 3,143 | 1,429 | - | 150.00 | 5/4/2025 | - | - | 1,900 | 8,892 |
| 1,125 | 875 | - | 42.50 | 11/10/2025 | - | - | - | - | |
| 1,050 | 1,350 | - | 38.75 | 6/13/2026 | - | - | - | - | |
| - | 2,720 | - | 25.75 | 2/23/2027 | - | - | - | - | |
| - | 2,400 | - | 7.375 | 8/9/2027 | - | - | - | - | |
| Vadim Sapiro(5) | 2 | - | - | 197.75 | 3/23/2022 | - | - | 1,400 | 6,552 |
| 36 | - | - | 197.75 | 3/23/2022 | - | - | - | - | |
| 10 | - | - | 197.75 | 2/12/2023 | - | - | - | - | |
| 5 | - | - | 197.75 | 2/12/2023 | - | - | - | - | |
| 25 | - | - | 197.75 | 7/25/2023 | - | - | - | - | |
| 143 | - | - | 1.25 | 4/24/2024 | - | - | - | - | |
| 1,500 | 500 | - | 15.25 | 10/23/2024 | - | - | - | - | |
| 1,000 | - | - | 150.00 | 5/4/2025 | - | - | - | - | |
| 700 | 900 | - | 38.750 | 6/13/2026 | - | - | - | - | |
| - | 2,200 | - | 25.75 | 2/23/2027 | - | - | - | - | |
| - | 2,400 | - | 7.375 | 8/9/2027 | - | - | - | - | |
| (1) | The standard vesting schedule for all stock option grants is vesting over four years with twenty-five percent (25%) vesting on the first anniversary of the date of grant and six and one-quarter percent (6.25%) vesting on the last day of the next fiscal quarter over three years. |
| (2) | Calculated based on the closing price of the common stock the Nasdaq Capital Market on December 29, 2017 of $4.68 per share. |
| (3) | The stock option awards made to Mr. Jones were awarded on July 23, 2008 (3 shares), February 15, 2011 (73 shares), April 24, 2014 (6,969 shares), October 23, 2014 (8,000 shares) and April 28, 2016 (30,660 shares) and have the vesting schedule set forth in footnote (1). Mr. Jones was granted a stock option award on February 23, 2017 (3,200), which vests over four years with twenty-five percent (25%) vesting on February 23, 2018 and six and one-quarter percent (6.25%) vesting on the first business day of each quarter thereafter over the next three years. |
| (4) | Mr. Dec was granted stock option awards on May 4, 2015 (4,572 shares), November 10, 2015 (2,000 shares), June 13, 2016 (2,400 shares), February 23, 2017 (2,720), and August 9, 2017 (2,400). One-forty-eighth of Mr. Dec's stock option award granted on May 4, 2015 vested on the one month anniversary of the date of grant and thereafter vest over four years with twenty-five percent (25%) vesting on the first yearly anniversary of the date of grant and six and one-quarter percent (6.25%) vesting on the last day of the next fiscal quarter over three years. Mr. Dec's stock option awards granted on November 10, 2015 and June 13, 2016 have the vesting schedule set forth in footnote (1). Mr. Dec's stock option award granted on February 23, 2017 vests over four years with twenty-five percent (25%) vesting on February 23, 2018 and six and one-quarter percent (6.25%) vesting on the first business day of each quarter thereafter over the next three years. Mr. Dec's stock option award granted on August 9, 2017 vests on August 9, 2018. Mr. Dec was granted restricted stock units on November 10, 2015. Twenty-five percent (25%) of the entire restricted stock units award vests on the first four anniversaries of the date of grant. Mr. Dec was granted restricted stock units on August 9, 2017. The restricted stock units vest upon the successful launch of the Company's AMR Gene Panel for cUTI in the RUO market. |
94
| (5) | The stock option awards granted to Mr. Sapiro on March 23, 2012 (2 shares and 36 shares), February 12, 2013 (10 shares), July 25, 2013 (25 shares), October 23, 2014 (2,000 shares) and June 13, 2016 (1,600 shares) have the vesting schedule set forth in footnote (1). The stock option award granted to Mr. Sapiro on February 12, 2013 for 5 shares vested in full on the first anniversary of the date of grant, February 12, 2014. The stock option award granted to Mr. Sapiro on April 24, 2014 for 143 shares is vesting over four years with twenty-five percent (25%) vesting on December 31, 2014 and six and one-fourth percent (6.25%) vesting quarterly thereafter in equal proportions over the remaining three years. The stock option granted to Mr. Sapiro on May 4, 2015 vested quarterly over the first year following the date of grant. The stock option award granted to Mr. Sapiro on February 23, 2017 for 2,200 shares vest over four years with twenty-five percent (25%) vesting on February 23, 2018 and six and one-quarter percent (6.25%) vesting on the first business day of each quarter over the next three years. The stock option award granted to Mr. Sapiro on August 9, 2017 for 2,400 shares vests on August 9, 2018. Mr. Sapiro was granted restricted stock units on August 9, 2017. The restricted stock units vest upon the successful launch of the Company's AMR Gene Panel for cUTI in the RUO market. |
Director Compensation
Since May 2015, each non-employee director receives an annual cash retainer of $25,000, payable quarterly, plus additional annual cash compensation for committee chairs ($15,000 for Audit Committee, $10,000 for Compensation Committee and $7,500 for Compliance Committee) and for committee members ($7,000 for Audit Committee, $5,000 for Compensation Committee and $3,500 for Compliance Committee). In addition, each new director receives an initial stock option grant to purchase 1,200 shares of common stock and each non- employee director receives an annual stock option grants to purchase 500 shares of common stock. All such awards are made under the 2015 Plan. The annual stock option awards may be pro-rated in the first year of service depending on when the non-employee director joins the Board. This compensation program was reviewed by the Compensation Committee in February 2017, and the determination was made to continue to the program without change.
Evan Jones, Chairman of the Board and CEO, does not receive additional compensation for service on our Board. As managing director of MGHIF, Dr. Rubin is precluded from receiving compensation for serving as a director of OpGen, Inc. See "Summary Compensation Table" for his 2017 compensation. Compensation for the non-employee directors for the year ended December 31, 2017 was:
| Name | Fees Earned or Paid in Cash ($) | Option Awards ($)(1) | All Other Compensation ($) | Total ($) | ||||||||||||
| Brian G. Atwood (2) (4) | $ | 16,000 | $ | - | $ | - | $ | 16,000 | ||||||||
| Harry J. D'Andrea (4) | $ | 40,000 | $ | 13,632 | $ | - | $ | 53,632 | ||||||||
| Timothy J.R. Harris (4) | $ | 33,500 | $ | 13,632 | $ | - | $ | 47,132 | ||||||||
| Laurence R. McCarthy (2) (4) | $ | 18,750 | $ | - | $ | - | $ | 18,750 | ||||||||
| Tina S. Nova (4) | $ | 20,417 | $ | 16,173 | $ | - | $ | 36,590 | ||||||||
| David M. Rubin (3) | $ | - | $ | - | $ | - | $ | - | ||||||||
| Misti Ushio (4) | $ | 40,250 | $ | 13,632 | $ | - | $ | 53,882 | ||||||||
| (1) | The "Option Awards" column reflects the grant date fair value for all stock option awards granted under the 2015 Plan during 2016. These amounts are determined in accordance with FASB Accounting Standards Codification 718 (ASC 718), without regard to any estimate of forfeiture for service vesting. Assumptions used in the calculation of the amounts will be included in a footnote to the Company's consolidated audited financial statements for the year ended December 31, 2017. |
| (2) | Mr. Atwood and Dr. McCarthy did not stand for re-election at the 2017 Annual Meeting of the Stockholders. |
| (3) | As managing director of MGHIF, Dr. Rubin is precluded from receiving compensation for serving as a director of OpGen, Inc. |
| (4) | As of December 31, 2017, the non-employee directors held the following vested stock options: Atwood (500); D'Andrea (1,150); Harris (1,031); McCarthy (2,182); Nova (250); and Ushio (750). |
95
Compensation Risk Assessment
We believe that although a portion of the compensation provided to our executive officers and other employees is performance-based, our executive compensation program does not encourage excessive or unnecessary risk taking. This is primarily due to the fact that our compensation programs are designed to encourage our executive officers and other employees to recognize and support both short-term and long-term strategic goals, in particular in connection with our pay-for-performance compensation philosophy. As a result, we do not believe that our compensation programs are reasonably likely to have a material adverse effect on us.
Employee Incentive Plans
The following table shows, as of December 31, 2017, the Company's equity compensation plans under which the Company's equity securities are authorized for issuance:
| Plan Category | Number of securities to be issued upon exercise of outstanding options, warrants and rights(1) | Weighted average exercise price of outstanding options, warrants and rights(2) | Number of securities remaining available for future issuance | |||||||||
| Equity compensation plans approved by security holders | 145,295 | $ | 31.16 | 32,411 | ||||||||
| Equity compensation plans not approved by security holders | — | — | — | |||||||||
| Total | 145,295 | $ | 31.16 | 32,411 | ||||||||
(1) Includes 5,900 outstanding restricted stock units for which there is no exercise price.
(2) Includes the weighted-average exercise price of stock options only.
2008 Plan
Our 2008 Stock Option and Restricted Stock Plan, as amended, or 2008 Plan, was approved by our Board and stockholders in April 2008; subsequent increases in the number of shares available for awards under the 2008 Plan were approved by our Board and stockholders in January 2009, February 2011, March 2012, December 2012, April 2014 and October 2014. A total of 57,911 shares of our common stock are reserved for issuance under the 2008 Plan.
The 2008 Plan provided for the grant of stock options and restricted stock awards. The Compensation Committee determined the time or times at which a stock option will vest or become exercisable and the terms on which such option will remain exercisable. The Compensation Committee determined the conditions and restrictions and purchase price, if any, for grants or sales or restricted stock to plan participants. The Compensation Committee may also at any time accelerate the vesting or exercisability of an award.
Under the 2008 Plan, in the event of any dissolution or liquidation of the Company, the sale of all or substantially all of the Company's assets, or the merger or consolidation of the Company where the Company is not the surviving entity or which results in the acquisition of all or substantially all of the Company's then outstanding common stock, the Compensation Committee may: (a) provide for the assumption or substitution of some or all of the outstanding awards; (b) provide for a cash-out payment; or (c) in the case there is no assumption, substitution or cash-out, provide that all awards not exercised or awards providing for the future delivery of common stock will terminate upon the closing of the transaction.
Following our 2015 Equity Incentive Plan, or 2015 Plan, becoming effective, no further grants have been or will be made under our 2008 Plan.
96
2015 Plan
The 2015 Plan provides for the granting of incentive stock options within the meaning of Section 422 of the Code to employees and the granting of non-qualified stock options to employees, non-employee directors and consultants. The 2015 Plan also provides for grants of restricted stock, restricted stock units, stock appreciation rights, dividend equivalents and stock payments to employees, non-employee directors and consultants. The 2015 Plan was amended by the Compensation Committee in February 2017 to revise the provisions with respect to net settlement of awards in response to change in regulations, and to establish standard periods for exercise of vested stock options following termination of service events.
Administration. The Compensation Committee administers the 2015 Plan, including the determination of the recipient of an award, the number of shares or amount of cash subject to each award, whether an option is to be classified as an incentive stock option or non-qualified stock option, and the terms and conditions of each award, including the exercise and purchase prices and the vesting and duration of the award. Our Board may appoint one or more separate committees of our Board, each consisting of one or more members of our Board, to administer our 2015 Plan with respect to employees who are not subject to Section 16 of the Exchange Act. Subject to applicable law, our Board may also authorize one or more officers to designate employees, other than employees who are subject to Section 16 of the Exchange Act, to receive awards under our 2015 Plan and/or determine the number of such awards to be received by such employees subject to limits specified by our Board.
Authorized shares. Under our 2015 Plan, the aggregate number of shares of our common stock authorized for issuance may not exceed (1) 54,200 plus (2) the sum of the number of shares subject to outstanding awards under the 2008 Plan as of the 2015 Plan's effective date that are subsequently forfeited or terminated for any reason before being exercised or settled, plus the number of shares subject to vesting restrictions under the 2008 Plan on the 2015 Plan's effective date that are subsequently forfeited. In addition, the number of shares that have been authorized for issuance under the 2015 Plan are automatically increased on the first day of each fiscal year beginning on January 1, 2016 and ending on (and including) January 1, 2025, in an amount equal to the lesser of (i) 4% of the outstanding shares of our common stock on the last day of the immediately preceding fiscal year, and (ii) another lesser amount determined by our Board. As of January 1, 2018, 123,023 shares remain available for future awards under the 2015 Plan.
Shares subject to awards granted under the 2015 Plan that are forfeited or terminated before being exercised or settled, or are not delivered to the participant because such award is settled in cash, will again become available for issuance under the 2015 Plan. However, shares that have actually been issued shall not again become available unless forfeited. No more than 160,000 shares may be delivered upon the exercise of incentive stock options granted under the 2015 Plan.
Types of awards
Stock options. A stock option is the right to purchase a certain number of shares of stock, at a certain exercise price, in the future. Under our 2015 Plan, incentive stock options and non-qualified options must be granted with an exercise price of at least 100% of the fair market value of our common stock on the date of grant. Incentive stock options granted to any holder of more than 10% of our voting shares must have an exercise price of at least 110% of the fair market value of our common stock on the date of grant. The stock option agreement specifies the date when all or any installment of the option is to become exercisable. Payment of the exercise price may be made in cash or, if provided for in the stock option agreement evidencing the award, (1) by surrendering, or attesting to the ownership of, shares which have already been owned by the optionee, (2) by delivery of an irrevocable direction to a securities broker to sell shares and to deliver all or part of the sale proceeds to us in payment of the aggregate exercise price, (3) by a "net exercise" arrangement, or (4) by any other form that is consistent with applicable laws, regulations and rules.
97
Restricted stock. Restricted stock is a share award that may be subject to vesting conditioned upon continued service, the achievement of performance objectives or the satisfaction of any other condition as specified in a restricted stock agreement. Participants who are granted restricted stock awards generally have all of the rights of a stockholder with respect to such stock, other than the right to transfer such stock prior to vesting.
Restricted stock units. Restricted stock units give recipients the right to acquire a specified number of shares of stock at a future date upon the satisfaction of certain conditions, including any vesting arrangement, established by our Compensation Committee and as set forth in a restricted stock unit agreement. Unlike restricted stock, the stock underlying restricted stock units will not be issued until the restricted stock units have vested and are settled, and recipients of restricted stock units generally will have no voting or dividend rights prior to the time the vesting conditions are satisfied and the award is settled.
Dividend equivalents. At our Compensation Committee's discretion, performance-based restricted stock or restricted stock unit awards may provide for the right to dividend equivalents. Subject to the terms of the 2015 Plan, our Compensation Committee will determine the terms and conditions of any stock unit award, which will be set forth in a stock unit agreement to be entered into between us and each recipient.
Stock appreciation rights. Stock appreciation rights typically will provide for payments to the recipient based upon increases in the price of our common stock over the exercise price of the stock appreciation right. The exercise price of a stock appreciation right will be determined by our Compensation Committee, which shall not be less than the fair market value of our common stock on the date of grant. Our Compensation Committee may elect to pay stock appreciation rights in cash or in common stock or in a combination of cash and common stock.
Performance-based awards. Awards under our 2015 Plan may be made subject to the attainment of performance goals.
Other plan features
No Transfer. Unless the agreement evidencing an award expressly provides otherwise, no award granted under the 2015 Plan may be transferred in any manner (prior to the vesting and lapse of any and all restrictions applicable to shares issued under such award), other than by will or the laws of descent and distribution, provided, however, that an incentive stock option may be transferred or assigned only to the extent consistent with Section 422 of the Code.
Adjustments. In the event of a recapitalization, stock split or similar capital transaction, our Compensation Committee will make appropriate and equitable adjustments to the number of shares reserved for issuance under the 2015 Plan, the limitations regarding the total number of shares underlying awards given to an individual participant in any calendar year, the number of shares that can be issued as incentive stock options, the number of shares subject to outstanding awards and the exercise price under each outstanding option or stock appreciation right.
Change in Control. If we are involved in a merger or other reorganization, outstanding awards will be subject to the agreement of merger or reorganization. Such agreement will provide for (1) the continuation of the outstanding awards by us if we are the surviving corporation, (2) the assumption or substitution of the outstanding awards by the surviving corporation or its parent or subsidiary, (3) immediate vesting, exercisability and settlement of the outstanding awards followed by their cancellation, or (4) settlement of the intrinsic value of the outstanding awards (whether or not vested or exercisable) in cash, cash equivalents, or equity (including cash or equity subject to deferred vesting and delivery consistent with the vesting restrictions applicable to such award or the underlying shares) followed by cancellation of such awards.
Termination or Amendment. Our Board may amend or terminate the 2015 Plan at any time, subject to stockholder approval where required by applicable law. Any amendment or termination may not materially impair the rights of holders of outstanding awards without their consent. No incentive stock option may be granted after the tenth anniversary of the date the 2015 Plan was adopted by our Board.
Effective Date. The 2015 Plan was initially adopted by our Board and subsequently approved by our stockholders in April 2015. The 2015 Plan became effective on May 4, 2015. Awards may be granted under the 2015 Plan until April 1, 2025.
98
CERTAIN RELATIONSHIPS AND RELATED PERSON TRANSACTIONS
Other than compensation arrangements, we describe below the transactions and series of similar transactions, during our last three fiscal years, to which we were a party or will be a party, in which:
| · | the amounts involved exceeded or will exceed the lesser of $120,000 or one percent of the average of the Company's total assets at year end for the past two completed fiscal years; and |
| · | any of our directors, executive officers or holders of more than 5% of our capital stock, or any member of the immediate family of the foregoing persons, had or will have a direct or indirect material interest. |
Compensation arrangements for our directors and named executive officers are described elsewhere in this prospectus.
Contractual Relationships
In March 2014, the Company entered into a supply agreement with Fluidigm Corporation ("Fluidigm") under which Fluidigm supplies the Company with its microfluidic test platform for use in manufacturing the Acuitas MDRO Gene Test. The Company's CEO and Chairman of the Board of Directors is a director of Fluidigm. On July 12, 2015, the Company entered into a letter agreement (the "Fluidigm Agreement") with Fluidigm to expand the companies' existing relationship to include collaborating on the development of test kits and custom analytic instruments for identification, screening and surveillance testing of MDROs. The Fluidigm Agreement also expands the existing Supply Agreement between the Company and Fluidigm, and provides for expansion of the gene targets and organisms to be tested on the Company's existing CLIA lab-based tests, the Acuitas MDRO Gene Test and the Acuitas Resistome Test, using Fluidigm technologies and products. Additionally, Fluidigm has agreed not to develop or directly collaborate with any third party to develop an FDA approved or CE marked diagnostic test for the purpose of detecting resistance genes for identified MDROs if the Company meets certain minimum purchase commitments and other requirements. The initial term of the Fluidigm Agreement is five years. Both parties have the ability to extend the term for an additional five years. Under the expanded Supply Agreement, the term was extended until March 17, 2018, and the Company has the right to extend the term of the Supply Agreement for up to two additional three-year terms. The Company paid $123,067 related to these agreements in the year ended December 31, 2017. The Company paid $183,713 related to these agreements in the year ended December 31, 2016.
Under the agreements with Fluidigm, the Company had purchases of $135,415 in the year ended December 31, 2017. The Company had purchases of $91,399 related to these agreements in the year ended December 31, 2016.
In addition, the Company has several capital lease arrangements for laboratory equipment manufactured by Fluidigm. The Company paid $91,882 related to the leased equipment in the year ended December 31, 2017. The Company paid $175,475 related to the leased equipment in the year ended December 31, 2016.
In October 2016, the Company entered into an agreement with Merck Sharp & Dohme, a wholly-owned subsidiary of Merck Co. & Inc. ("Merck"), an affiliate of MGHIF, a principal stockholder of the Company and a related party to the Company. Under the agreement, Merck provided access to its archive of over 200,000 bacterial pathogens. The Company is initially performing molecular analyses on up to 10,000 pathogens to identify markers of resistance to support rapid decision making using the Acuitas Lighthouse, and to speed development of its rapid diagnostic products. Merck gains access to the high-resolution genotype data for the isolates as well as access to the Acuitas Lighthouse informatics to support internal research and development programs. The Company is required to expend up to $175,000 for the procurement of materials related to the activities contemplated by the agreement. Contract life-to-date, the Company has incurred $146,177 of procurement costs which have been recognized as research and development expense, including $113,907 and $32,270 during the years ended December 31, 2017 and 2016.
In December 2017, we entered into a subcontractor agreement with ILÚM Health Solutions, LLC, an entity created by Merck's Healthcare Services and Solutions division, whereby ILÚM Health Solutions will provide services to the Company in the performance of the Company's CDC contract to deploy ILÚM's commercially-available cloud- and mobile-based software platform for infectious disease management in up to three medical sites in Colombia with the aim of improving antibiotic use in resource-limited settings. During the year ended December 31, 2017, the Company recognized $210,180 of cost of services expense related to the contract.
99
Sales and Purchases of Securities
On May 19, 2016 and June 27, 2016, the Company offered and sold units in a private offering to members of management and employees and to accredited investors, including MGHIF and jVen Capital, each unit consisting of either (i) one twenty-fifth of a share of common stock and a detachable stock purchase warrant to purchase an additional 0.03 of one share of common stock, or (ii) one share of non-voting convertible preferred stock a detachable stock purchase warrant to purchase an additional 0.03 of one share of common stock, at a price of $1.14 per unit. The total net proceeds to the Company, after deducting offering commissions and expenses was $9.5 million. The Company is using the proceeds for working capital and general corporate purposes. Pursuant to the private offering the Company issued 269,765 shares of common stock, 2,309,428 shares of Series A non-voting convertible preferred stock and stock purchase warrants to acquire an additional 271,606 shares of common stock. Each share of non-voting convertible preferred stock was convertible at the option of the holder in whole or in part and from time to time into one twenty-fifth of a share of common stock, is entitled to dividends on as "as converted basis" when and if dividends are issued to common stockholders, and participates in liquidation on a pari passu basis with common stockholders. Holders of the Series A non-voting convertible preferred stock subsequently converted all 2,309,428 shares of preferred stock into 92,377 shares of common stock. The stock purchase warrants issued as part of the units are exercisable $32.8125 per share beginning 90 days after closing for five years, expiring on May 18, 2021. Evan Jones, our Chief Executive Officer and Chairman of the Board is a managing member of jVen Capital, LLC and has voting and investment authority over the shares owned by jVen Capital; Timothy Harris, a director of the Company; and Timothy Dec and Vadim Sapiro, officers of the Company, were all investors in these offerings.
On May 31, 2017, the Company entered into the Note Purchase Agreement with jVen Capital, under which jVen Capital agreed to lend bridge financing in an aggregate principal amount of up to $1,500,000 to the Company in the form of three $500,000 secured convertible promissory notes. On June 14, 2017, the Company drew down on the first of three Bridge Financing Notes, with $1 million remaining capacity available. The Company drew down on the second Bridge Financing Note on July 5, 2017 and the third Bridge Financing Note was never issued. The Company issued warrants to purchase an aggregate 25,102 shares of common stock to jVen Capital and MGHIF in connection with the Bridge Financing. The outstanding Bridge Financing Notes were repaid in full upon the closing of the July 2017 Public Offering.
jVen Capital and three employees of the Company participated in the July 2017 Public Offering in an aggregate amount of $816,000: (i) jVen Capital participated for $750,000; (ii) Timothy C. Dec, Chief Financial Officer of the Company participated for $26,000; and (iii) Vadim Sapiro, Chief Information Officer of the Company, participated $10,000. One non-executive officer of the Company also participated in the July 2017 Public Offering.
Policies for Approval of Related Person Transactions
We have adopted a written policy that transactions with directors, officers and holders of 5% or more of our voting securities and their affiliates, each, a related person, must be approved by our Audit Committee.
100
SECURITY OWNERSHIP OF CERTAIN BENEFICIAL OWNERS
The number of shares of the Company's common stock outstanding at the close of business on April 2, 2018 was 5,289,919 shares. The following table sets forth the beneficial ownership of the Company's common stock as of April 2, 2018 by each Company director and executive officer, by all directors and executive officers as a group, and by each person who owned of record, or was known to own beneficially, more than 5% of the outstanding shares of our common stock. Beneficial ownership is determined in accordance with Rule 13d-3 under the Exchange Act. In computing the number of shares beneficially owned by a person or a group and the percentage ownership of that person or group, shares of our common stock subject to options and warrants currently exercisable or exercisable within 60 days after April 2, 2018 are deemed outstanding, but are not deemed outstanding for the purpose of computing the percentage ownership of any other person. To the knowledge of the directors and executive officers of the Company, as of April 2, 2018, there are no persons and/or companies who or which beneficially own, directly or indirectly, shares representing more than 5% of the voting rights attached to all outstanding shares of the Company, other than as set forth below. Unless otherwise indicated, the address of each beneficial owner listed below is c/o OpGen, Inc., 708 Quince Orchard Road, Suite 205, Gaithersburg, MD 20878.
| Name and Address of Beneficial Owner | Number of Shares of Common Stock | Percentage of Outstanding Common Shares | ||||||
| Directors and Named Executive Officers | ||||||||
| Evan Jones (1) | 397,410 | 4.4 | % | |||||
| Harry D'Andrea (2) | 3,371 | * | ||||||
| Timothy J.R. Harris, Ph.D., D.Sc. (3) | 7,730 | * | ||||||
| Tina S. Nova, Ph.D.(4) | 900 | * | ||||||
| David M. Rubin, Ph.D. (5) | - | - | ||||||
| Misti Ushio, Ph.D. (6) | 2,571 | * | ||||||
| Timothy C. Dec (7) | 17,208 | * | ||||||
| Vadim Sapiro (8) | 8,630 | * | ||||||
| All current Directors and Executive Officers as a group (8 individuals) (9) | 437,941 | 8.0 | % | |||||
* Constitutes less than 1%
| (1) | Consists of (i) 227,138 shares of common stock and currently exercisable warrants to acquire an additional 134,317 shares of common stock beneficially owned by jVen Capital, LLC, (ii) 5,246 shares of common stock and currently exercisable warrants to acquire an additional 834 shares of common stock owned by Mr. Jones' spouse, and (iii) stock options to purchase 29,875 shares of common stock that are currently vested or that will become vested within 60 days. Mr. Jones is a managing member of jVen Capital, LLC and has voting and investment authority over the shares owned by that entity. |
| (2) | Consists of (i) 1,571 shares of common stock and (ii) stock options to purchase 1,800 shares of common stock that are currently vested or that will become vested within 60 days. |
| (3) | Consists of (i) 2,587 shares of common stock, (ii) currently exercisable warrants to acquire an additional 1,567 shares of common stock, and (iii) stock options to purchase 2,606 shares of common stock that are currently vested or that will become vested within 60 days. |
| (4) | Consists of stock options to purchase 900 shares of common stock that are currently vested or that will become vested within 60 days. |
| (5) | Dr. Rubin is the managing director of MGHIF, but does not have nor share voting power over the shares of our common stock owned by MGHIF. |
| (6) | Consists of (i) 1,571 shares of common stock and (ii) stock options to purchase 1,000 shares of common stock that are currently vested or that will become vested within 60 days. |
101
| (7) | Consists of (i) 6,408 shares of common stock, (ii) currently exercisable warrants to acquire an additional 4,071 shares of common stock, and (iii) stock options to purchase 6,729 shares of common stock that are currently vested or that will become vested within 60 days. |
| (8) | Consists of (i) 3,004 shares of common stock, (ii) currently exercisable warrants to acquire an additional 1,393 shares of common stock, and (iii) stock options to purchase 4,233 shares of common stock that are currently vested or that will become vested within 60 days. |
| (9) | See the beneficial ownership described in footnotes (1) through (8). |
LEGAL MATTERS
The validity of the securities offered by this prospectus will be passed upon for us by Ballard Spahr LLP, Philadelphia, Pennsylvania.
EXPERTS
The consolidated financial statements as of December 31, 2017 and 2016 and for the years then ended included in this prospectus have been audited by CohnReznick LLP, an independent registered public accounting firm, as stated in their report, which includes an explanatory paragraph relating to our ability to continue as a going concern, appearing elsewhere in this prospectus. Such financial statements are included in reliance upon the report of such firm given on the authority of said firm as experts in accounting and auditing.
WHERE YOU CAN FIND ADDITIONAL INFORMATION
We filed with the Securities and Exchange Commission a registration statement under the Securities Act of 1933 for the shares of common stock in this offering. This prospectus does not contain all of the information in the registration statement and the exhibits and schedule that were filed with the registration statement. For further information with respect to us and our common stock, we refer you to the registration statement and the exhibits and schedule that were filed with the registration statement. Statements contained in this prospectus about the contents of any contract or any other document that is filed as an exhibit to the registration statement are not necessarily complete, and we refer you to the full text of the contract or other document filed as an exhibit to the registration statement. A copy of the registration statement and the exhibits and schedules that were filed with the registration statement may be inspected without charge at the Public Reference Room maintained by the Securities and Exchange Commission at 100 F Street, N.E. Washington, DC 20549, and copies of all or any part of the registration statement may be obtained from the Securities and Exchange Commission upon payment of the prescribed fee. Information regarding the operation of the Public Reference Room may be obtained by calling the Securities and Exchange Commission at 1-800-SEC-0330. The Securities and Exchange Commission maintains a website that contains reports, proxy and information statements, and other information regarding registrants that file electronically with the SEC. The address of the website is www.sec.gov.
We file periodic reports under the Securities Exchange Act of 1934, including annual, quarterly and special reports, and other information with the Securities and Exchange Commission. These periodic reports and other information are available for inspection and copying at the regional offices, public reference facilities and website of the Securities and Exchange Commission referred to above.
We make available free of charge on or through our internet website our annual reports on Form 10-K, quarterly reports on Form 10-Q, current reports on Form 8-K, and amendments to those reports filed or furnished pursuant to Section 13(a) or 15(d) of the Securities Exchange Act of 1934 as soon as reasonably practicable after we electronically file such material with, or furnish it to, the Securities and Exchange Commission.
102
OPGEN, INC.
Index to Consolidated Financial Statements
Report of Independent Registered Public Accounting Firm | F-2 |
Consolidated Balance Sheets | F-3 |
Consolidated Statements of Operations and Comprehensive Loss | F-4 |
Consolidated Statements of Stockholders' Equity | F-5 |
Consolidated Statements of Cash Flows | F-6 |
Notes to Consolidated Financial Statements | F-7 |
F-1
REPORT OF INDEPENDENT REGISTERED PUBLIC ACCOUNTING FIRM
The Board of Directors and Stockholders
OpGen, Inc.
Opinion on the Consolidated Financial Statements
We have audited the accompanying consolidated balance sheets of OpGen, Inc. (the "Company") as of December 31, 2017 and 2016, and the related consolidated statements of operations and comprehensive loss, stockholders' equity and cash flows for the years then ended and the related notes (collectively referred to as the "financial statements"). In our opinion, the consolidated financial statements referred to above present fairly, in all material respects, the financial position of the Company as of December 31, 2017 and 2016, and the results of their operations and their cash flows for the years then ended in conformity with accounting principles generally accepted in the United States of America.
The Company's Ability to Continue as a Going Concern.
The consolidated financial statements have been prepared assuming that the Company will continue as a going concern. As discussed in Note 1 to the consolidated financial statements, the Company has incurred losses from operations since inception and will need additional capital to fund future operations. These conditions raise substantial doubt about the Company's ability to continue as a going concern. The consolidated financial statements do not include any adjustments that might result from the outcome of this uncertainty.
Basis for Opinion
These consolidated financial statements are the responsibility of the Company's management. Our responsibility is to express an opinion on the Company's consolidated financial statements based on our audits. We are a public accounting firm registered with the Public Company Accounting Oversight Board (United States) ("PCAOB") and are required to be independent with respect to the Company in accordance with the U.S. federal securities laws and the applicable rules and regulations of the Securities and Exchange Commission and the PCAOB.
We conducted our audits in accordance with the standards of the PCAOB. Those standards require that we plan and perform the audit to obtain reasonable assurance about whether the consolidated financial statements are free of material misstatement whether due to error or fraud. The Company is not required to have, nor were we engaged to perform, an audit of its internal control over financial reporting. As part of our audits, we are required to obtain an understanding of internal control over financial reporting but not for the purpose of expressing an opinion on the effectiveness of the Company's internal control over financial reporting. Accordingly, we express no such opinion.
Our audits included performing procedures to assess the risks of material misstatement of the consolidated financial statements, whether due to error or fraud, and performing procedures that respond to those risks. Such procedures included examining, on a test basis, evidence regarding the amounts and disclosures in the consolidated financial statements. Our audits also included evaluating the accounting principles used and significant estimates made by management, as well as evaluating the overall presentation of the consolidated financial statements. We believe that our audits provide a reasonable basis for our opinion.
/s/ CohnReznick LLP
We have served as the Company's auditor since 2014.
Vienna, Virginia
March 29, 2018
F-2
OpGen, Inc.
Consolidated Balance Sheets
As of December 31,
| 2017 | 2016 | |||||||
Assets | ||||||||
| Current assets | ||||||||
| Cash and cash equivalents | $ | 1,847,171 | $ | 4,117,324 | ||||
| Accounts receivable, net | 809,540 | 542,420 | ||||||
| Inventory, net | 533,425 | 692,368 | ||||||
| Prepaid expenses and other current assets | 311,644 | 329,646 | ||||||
| Total current assets | 3,501,780 | 5,681,758 | ||||||
| Property and equipment, net | 835,537 | 800,723 | ||||||
| Goodwill | 600,814 | 600,814 | ||||||
| Intangible assets, net | 1,353,182 | 1,620,998 | ||||||
| Other noncurrent assets | 328,601 | 279,752 | ||||||
| Total assets | $ | 6,619,914 | $ | 8,984,045 | ||||
Liabilities and Stockholders' Equity | ||||||||
| Current liabilities | ||||||||
| Accounts payable | $ | 1,691,712 | $ | 2,232,563 | ||||
| Accrued compensation and benefits | 746,924 | 578,480 | ||||||
| Accrued liabilities | 1,160,714 | 1,215,283 | ||||||
| Deferred revenue | 24,442 | 37,397 | ||||||
| Short-term notes payable | 1,010,961 | 1,023,815 | ||||||
| Current maturities of long-term capital lease obligation | 154,839 | 184,399 | ||||||
| Total current liabilities | 4,789,592 | 5,271,937 | ||||||
| Deferred rent | 290,719 | 398,084 | ||||||
| Warrant liability | 8,453 | — | ||||||
| Long-term capital lease obligation and other noncurrent liabilities | 130,153 | 146,543 | ||||||
| Total liabilities | 5,218,917 | 5,816,564 | ||||||
| Commitments (Note 8) | ||||||||
| Stockholders' equity | ||||||||
Common stock, $0.01 par value; 200,000,000 shares authorized; 2,265,320 and 1,012,171 shares issued and outstanding at December 31, 2017 and December 31, 2016, respectively | 22,653 | 10,122 | ||||||
Preferred stock, $0.01 par value; 10,000,000 shares authorized; none issued and outstanding at December 31, 2017 and December 31, 2016, respectively | — | — | ||||||
| Additional paid-in capital | 150,114,671 | 136,442,302 | ||||||
| Accumulated other comprehensive (loss)/income | (25,900 | ) | 6,176 | |||||
| Accumulated deficit | (148,710,427 | ) | (133,291,119 | ) | ||||
| Total stockholders' equity | 1,400,997 | 3,167,481 | ||||||
| Total liabilities and stockholders' equity | $ | 6,619,914 | $ | 8,984,045 | ||||
See accompanying notes to consolidated financial statements.
F-3
OpGen, Inc.
Consolidated Statements of Operations and Comprehensive Loss
For The Years Ended December 31,
| 2017 | 2016 | |||||||
| Revenue | ||||||||
| Product sales | $ | 2,771,869 | $ | 3,524,178 | ||||
| Laboratory services | 41,960 | 228,904 | ||||||
| Collaboration revenue | 397,178 | 272,603 | ||||||
| Total revenue | 3,211,007 | 4,025,685 | ||||||
| Operating expenses | ||||||||
| Cost of products sold | 1,612,838 | 1,658,571 | ||||||
| Cost of services | 520,338 | 631,333 | ||||||
| Research and development | 6,883,293 | 8,613,236 | ||||||
| General and administrative | 6,692,659 | 6,602,608 | ||||||
| Sales and marketing | 2,767,670 | 5,529,274 | ||||||
| Total operating expenses | 18,476,798 | 23,035,022 | ||||||
| Operating loss | (15,265,791 | ) | (19,009,337 | ) | ||||
| Other income/(expense) | ||||||||
| Interest and other expense | (87,255 | ) | (5,967 | ) | ||||
| Interest expense | (233,505 | ) | (143,347 | ) | ||||
| Foreign currency transaction gains/(losses) | 23,179 | (8,102 | ) | |||||
| Change in fair value of derivative financial instruments | 144,064 | — | ||||||
| Total other expense | (153,517 | ) | (157,416 | ) | ||||
| Loss before income taxes | (15,419,308 | ) | (19,166,753 | ) | ||||
| Provision for income taxes | — | — | ||||||
| Net loss | (15,419,308 | ) | (19,166,753 | ) | ||||
| Preferred stock dividends and beneficial conversion | — | (332,550 | ) | |||||
| Net loss available to common stockholders | $ | (15,419,308 | ) | $ | (19,499,303 | ) | ||
| Net loss per common share - basic and diluted | $ | (9.80 | ) | $ | (27.59 | ) | ||
| Weighted average shares outstanding - basic and diluted | 1,573,769 | 706,702 | ||||||
| Net loss | $ | (15,419,308 | ) | $ | (19,166,753 | ) | ||
| Other comprehensive (loss)/income - foreign currency translation | (32,076 | ) | 7,235 | |||||
| Comprehensive loss | $ | (15,451,384 | ) | $ | (19,159,518 | ) | ||
See accompanying notes to consolidated financial statements.
F-4
OpGen, Inc.
Consolidated Statements of Stockholders' Equity
| Common Stock | Preferred Stock | Additional | Accumulated Other | |||||||||||||||||||||||||||||
Number of Shares | Amount | Number of Shares | Amount | Paid- in Capital | Comprehensive (Loss) / Income | Accumulated Deficit | Total | |||||||||||||||||||||||||
| Balances at December 31, 2015 | 501,907 | $ | 5,019 | — | — | $ | 121,611,452 | $ | (1,059 | ) | $ | (114,124,366 | ) | $ | 7,491,046 | |||||||||||||||||
| Stock option exercises | 2,660 | 27 | — | — | 23,744 | — | — | 23,771 | ||||||||||||||||||||||||
| Private offering of common stock, preferred stock and warrants, net of issuance costs | 269,765 | 2,697 | 2,309,428 | 23,094 | 9,434,958 | — | — | 9,460,749 | ||||||||||||||||||||||||
| Preferred stock conversion | 92,377 | 924 | (2,309,428 | ) | (23,094 | ) | 22,170 | — | — | — | ||||||||||||||||||||||
| At the market offering, net of offering costs | 144,795 | 1,448 | — | — | 4,404,525 | — | — | 4,405,973 | ||||||||||||||||||||||||
| Issuance of RSUs | 667 | 7 | — | — | (8 | ) | — | — | (1 | ) | ||||||||||||||||||||||
| Stock compensation expense | — | — | — | — | 945,461 | — | — | 945,461 | ||||||||||||||||||||||||
| Foreign currency translation | — | — | — | — | — | 7,235 | — | 7,235 | ||||||||||||||||||||||||
| Net loss | — | — | — | — | — | — | (19,166,753 | ) | (19,166,753 | ) | ||||||||||||||||||||||
| Balances at December 31, 2016 | 1,012,171 | 10,122 | — | — | 136,442,302 | 6,176 | (133,291,119 | ) | 3,167,481 | |||||||||||||||||||||||
| Stock option exercises | 1,167 | 12 | — | — | 8,168 | — | — | 8,180 | ||||||||||||||||||||||||
| Public offering of common stock and warrants, net of issuance costs | 1,000,000 | 10,000 | — | — | 8,813,242 | — | — | 8,823,242 | ||||||||||||||||||||||||
| At the market offering, net of offering costs | 227,216 | 2,272 | — | — | 3,806,564 | — | — | 3,808,836 | ||||||||||||||||||||||||
| Issuance of RSUs | 6,025 | 60 | — | — | (60 | ) | — | — | — | |||||||||||||||||||||||
| Stock compensation expense | — | — | — | — | 911,398 | — | — | 911,398 | ||||||||||||||||||||||||
| Legal settlement in common stock | 15,843 | 158 | — | — | 109,841 | — | — | 109,999 | ||||||||||||||||||||||||
| Vendor payment in common stock | 2,898 | 29 | — | — | 23,216 | — | — | 23,245 | ||||||||||||||||||||||||
| Foreign currency translation | — | — | — | — | — | (32,076 | ) | — | (32,076 | ) | ||||||||||||||||||||||
| Net loss | — | — | — | — | — | — | (15,419,308 | ) | (15,419,308 | ) | ||||||||||||||||||||||
| Balances at December 31, 2017 | 2,265,320 | $ | 22,653 | — | $ | — | $ | 150,114,671 | $ | (25,900 | ) | $ | (148,710,427 | ) | $ | 1,400,997 | ||||||||||||||||
See accompanying notes to consolidated financial statements.
F-5
OpGen, Inc.
Consolidated Statements of Cash Flows
Years Ended December 31,
| 2017 | 2016 | |||||||
| Cash flows from operating activities | ||||||||
| Net loss | $ | (15,419,308 | ) | $ | (19,166,753 | ) | ||
| Adjustments to reconcile net loss to net cash used in operating activities | ||||||||
| Depreciation and amortization | 669,088 | 656,047 | ||||||
| Loss on disposal of property and equipment | — | 6,309 | ||||||
| Noncash interest expense | 185,294 | 4,527 | ||||||
| Share-based compensation | 911,398 | 945,461 | ||||||
| Inventory obsolescence | — | 113,465 | ||||||
| Change in fair value of warrant liabilities | (144,064 | ) | — | |||||
| Unamortized discount on bridge loan at repayment | 85,932 | — | ||||||
| Changes in operating assets and liabilities: | ||||||||
| Accounts receivable | (260,471 | ) | 136,226 | |||||
| Inventory | 161,027 | 20,179 | ||||||
| Other assets | (315,688 | ) | 263,882 | |||||
| Accounts payable | (563,357 | ) | (53,229 | ) | ||||
| Accrued compensation and other liabilities | 399,224 | (163,223 | ) | |||||
| Deferred revenue | (12,955 | ) | (13,528 | ) | ||||
| Net cash used in operating activities | (14,303,880 | ) | (17,250,637 | ) | ||||
| Cash flows from investing activities | ||||||||
| Purchases of property and equipment (net of proceeds on disposals) | (276,950 | ) | (123,514 | ) | ||||
| Net cash used in investing activities | (276,950 | ) | (123,514 | ) | ||||
| Cash flows from financing activities | ||||||||
| Proceeds from issuance of common stock, net of issuance costs | 3,808,836 | 4,405,973 | ||||||
| Proceeds from issuance of promissory notes, net of issuance costs | — | 204,895 | ||||||
| Proceeds from private offering of common stock, preferred stock and warrants, net of issuance costs | — | 9,460,749 | ||||||
| Proceeds from issuance of units, net of selling costs | 8,754,882 | — | ||||||
| Proceeds from exercise of stock options and warrants | 76,537 | 23,771 | ||||||
| Proceeds from debt, net of issuance costs | 1,168,222 | — | ||||||
| Payments on debt | (1,255,198 | ) | (178,997 | ) | ||||
| Payments on capital lease obligations | (205,085 | ) | (251,701 | ) | ||||
| Net cash provided by financing activities | 12,348,194 | 13,664,690 | ||||||
| Effects of exchange rates on cash | (37,517 | ) | 12,565 | |||||
| Net decrease in cash and cash equivalents | (2,270,153 | ) | (3,696,896 | ) | ||||
| Cash and cash equivalents at beginning of year | 4,117,324 | 7,814,220 | ||||||
| Cash and cash equivalents at end of year | $ | 1,847,171 | $ | 4,117,324 | ||||
| Supplemental disclosure of cash flow information | ||||||||
| Cash paid for interest | $ | 48,211 | $ | 58,564 | ||||
| Supplemental disclosures of noncash investing and financing activities: | ||||||||
| Unpaid deferred offering costs | $ | 48,398 | $ | — | ||||
| Shares issued to settle obligations | $ | 133,245 | $ | — | ||||
| Issuance of placement agent warrant | $ | 93,677 | $ | — | ||||
See accompanying notes to consolidated financial statements.
F-6
OpGen, Inc.
Notes to Consolidated Financial Statements
Note 1 – Organization
OpGen, Inc. ("OpGen" or the "Company") was incorporated in Delaware in 2001. References in this report to the "Company" include OpGen and its wholly-owned subsidiaries. The Company's headquarters are in Gaithersburg, Maryland, and its principal operations are in Gaithersburg, Maryland and Woburn, Massachusetts. The Company also has operations in Copenhagen, Denmark. The Company operates in one business segment.
OpGen is a precision medicine company using molecular diagnostics and informatics to help combat infectious disease. The Company is developing molecular information products and services for global healthcare settings, helping to guide clinicians with more rapid and actionable information about life threatening infections, improve patient outcomes, and decrease the spread of infections caused by multidrug-resistant microorganisms, or MDROs. Its proprietary DNA tests and informatics address the rising threat of antibiotic resistance by helping physicians and other healthcare providers optimize care decisions for patients with acute infections.
The Company's molecular diagnostics and informatics offerings combine its Acuitas DNA tests and Acuitas Lighthouse informatics platform for use with its proprietary, curated MDRO knowledgebase. The Company is working to deliver our products and services, some in development, to a global network of customers and partners. These include:
| · | Its Acuitas DNA tests provide rapid microbial identification and antibiotic resistance gene information. These products include our Acuitas Rapid Test for complicated urinary tract infection in development, the QuickFISH family of FDA-cleared and CE-marked diagnostics used to rapidly detect pathogens in positive blood cultures, and its Acuitas Resistome Tests for genetic analysis of hospital surveillance isolates. |
| · | Its Acuitas Lighthouse informatics systems are cloud-based HIPAA compliant informatics offerings that combine clinical lab test results with patient and hospital information to provide analytics and actionable insights to help manage MDROs in the hospital and patient care environment. Components of its informatics systems are the Acuitas Lighthouse Knowledgebase, a proprietary data warehouse of genomic data matched with antibiotic susceptibility information for bacterial pathogens and its Acuitas Lighthouse informatics, which can be specific to a healthcare facility or collaborator, such as a pharmaceutical company. |
The Company's operations are subject to certain risks and uncertainties. The risks include rapid technology changes, the need to manage growth, the need to retain key personnel, the need to protect intellectual property and the need to raise additional capital financing on terms acceptable to the Company. The Company's success depends, in part, on its ability to develop and commercialize its proprietary technology as well as raise additional capital.
Note 2 - Going Concern and Management's Plans
The accompanying consolidated financial statements have been prepared on a going-concern basis, which contemplates the realization of assets and satisfaction of liabilities in the normal course of business. Since inception, the Company has incurred, and continues to incur, significant losses from operations. The Company has funded its operations primarily through external investor financing arrangements and significant actions taken by the Company to reduce costs, including:
On February 6, 2018, the Company closed a public offering (the "February 2018 Public Offering") of 2,841,152 units at $3.25 per unit, and 851,155 pre-funded units at $3.24 per pre-funded unit, raising gross proceeds of approximately $12 million and net proceeds of approximately $10.7 million. Each unit included one share of common stock and one common warrant to purchase 0.5 share of common stock at an exercise price of $3.25 per share. Each pre-funded unit included one pre-funded warrant to purchase one share of common stock for an exercise price of $0.01 per share, and one common warrant to purchase 0.5 share of common stock at an exercise price of $3.25 per share. The common warrants are exercisable immediately and have a five-year term from the date of issuance.
F-7
On July 18, 2017, the Company closed a public offering (the "July 2017 Public Offering") of 18,164,195 units at $0.40 per unit, and 6,835,805 pre-funded units at $0.39 per pre-funded unit, raising gross proceeds of approximately $10 million and net proceeds of approximately $8.8 million. jVen Capital, LLC ("jVen Capital") was one of the investors participating in the offering. jVen Capital is an affiliate of Evan Jones, the Company's Chairman of the Board and Chief Executive Officer. Each unit included one twenty-fifth of a share of common stock and one common warrant to purchase one twenty-fifth of a share of common stock at an exercise price of $10.625 per share. Each pre-funded unit included one pre-funded warrant to purchase one twenty-fifth of a share of common stock for an exercise price of $0.25 per share, and one common warrant to purchase one twenty-fifth of a share of common stock at an exercise price of $10.625 per share. The common warrants are exercisable immediately and have a five-year term from the date of issuance. Approximately $1 million of the gross proceeds was used to repay the outstanding Bridge Financing Notes to jVen Capital in July 2017.
In early June 2017, the Company commenced a restructuring of its operations to improve efficiency and reduce its cost structure. The restructuring plans anticipate that the Company will consolidate operations for FDA-cleared and CE marked products and research and development activities for the Acuitas Rapid Test in Gaithersburg, Maryland, and reduce the size of its commercial organization while the Company works to complete the development of its Acuitas Rapid Test and Acuitas Lighthouse Knowledgebase products and services in development.
On May 31, 2017, the Company entered into a Note Purchase Agreement with jVen Capital, under which jVen Capital agreed to provide bridge financing in an aggregate principal amount of up to $1,500,000 to the Company in up to three separate tranches of $500,000. The interest rate on each Bridge Financing Note was ten percent (10%) per annum (subject to increase upon an event of default). The Bridge Financing Notes were prepayable by the Company at any time without penalty, and had a maturity date of September 30, 2017, which could be accelerated upon the closing of a qualified financing (any equity or debt financing that raised net proceeds of $5 million or more). The Bridge Financing Notes were contingently convertible at the option of the holder upon an event of default into shares of the Company's convertible Series B preferred stock. In connection with the issuance of Bridge Financing Notes, in June and July 2017, the Company issued jVen Capital stock purchase warrants to acquire 5,634 shares with an exercise price of $19.50 per share, and warrants to acquire 6,350 shares with an exercise price of $17.25 per share. The Company drew down on two of three Bridge Financing Notes during June and July, and repaid such outstanding Bridge Financing Notes in full upon the closing of the July 2017 Public Offering.
As a condition to the receipt of the bridge financing, the Company issued an amended and restated Senior Secured Promissory Note to Merck Global Health Innovation Fund ("MGHIF"), an affiliate of Merck & Co., Inc. ("Merck"), which extended the maturity date of the promissory note from July 14, 2017 to July 14, 2018. In return for MGHIF's consent to such extension, the Company increased the interest rate of the MGHIF Note to 10% per annum and issued warrants to purchase shares of common stock to MGHIF equal to 20% of the principal balance of the MGHIF Note, plus interest accrued thereon, as of June 28, 2017.
On September 13, 2016, the Company entered into the Sales Agreement with Cowen pursuant to which the Company may offer and sell from time to time, up to an aggregate of $25 million of shares of its common stock through Cowen, as sales agent, with initial sales limited to an aggregate of $11.5 million. Pursuant to the Sales Agreement, Cowen may sell the shares of common stock by any method permitted by law deemed to be an "at the market" offering as defined in Rule 415 of the Securities Act, including, without limitation, sales made by means of ordinary brokers' transactions on The Nasdaq Capital Market or otherwise at market prices prevailing at the time of sale, in block transactions, or as otherwise directed by the Company. The Company pays Cowen compensation equal to 3.0% of the gross proceeds from the sales of common stock pursuant to the terms of the Sales Agreement. As of December 31, 2017, the Company has sold an aggregate of approximately 372 thousand shares of its common stock under this at the market offering resulting in aggregate net proceeds to the Company of approximately $8.2 million, and gross proceeds of $8.8 million. As of December 31, 2017, under the initial sales agreement, remaining availability under the at the market offering is $2.7 million.
F-8
In May and June 2016, the Company offered and sold units in a private offering to members of management and employees and to accredited investors, including MGHIF and jVen Capital, each unit consisting of either (i) one twenty-fifth of a share of common stock and a detachable stock purchase warrant to purchase an additional 0.03 shares of common stock, or (ii) one share of non-voting convertible preferred stock and a detachable stock purchase warrant to purchase an additional 0.03 shares of common stock, at a price of $1.14 per unit. The total net proceeds to the Company, after deducting offering commissions and expenses, was $9.5 million. Pursuant to the private placement the Company issued 269,765 shares of common stock, 2,309,428 of Series A non-voting convertible preferred stock and stock purchase warrants to acquire an additional 271,606 shares of common stock. Under the purchase agreement, the Company granted registration rights to the investors in the private financing.
To meet its capital needs, the Company is considering multiple alternatives, including, but not limited to, strategic financings or other transactions, additional equity financings, debt financings and other funding transactions, licensing and/or partnering arrangements and business combination transactions. There can be no assurance that the Company will be able to complete any such transaction on acceptable terms or otherwise. The Company believes that current cash on hand including the February 2018 Public Offering will be sufficient to fund operations into the first quarter of 2019. This has led management to conclude that substantial doubt about the Company's ability to continue as a going concern exists. In the event the Company is unable to successfully raise additional capital during or before the first quarter of 2019, the Company will not have sufficient cash flows and liquidity to finance its business operations as currently contemplated. Accordingly, in such circumstances the Company would be compelled to immediately reduce general and administrative expenses and delay research and development projects, including the purchase of scientific equipment and supplies, until it is able to obtain sufficient financing. If such sufficient financing is not received on a timely basis, the Company would then need to pursue a plan to license or sell its assets, seek to be acquired by another entity, cease operations and/or seek bankruptcy protection.
Note 3 - Summary of Significant Accounting Policies
Basis of Presentation
The accompanying consolidated financial statements are prepared in accordance with generally accepted accounting standards in the United States ("U.S. GAAP"). The consolidated financial statements consolidate the operations of all controlled subsidiaries; all intercompany activity is eliminated.
Foreign Currency
One of the Company's subsidiaries is located in Copenhagen, Denmark and uses the Danish Krone as its functional currency. As a result, all assets and liabilities are translated into U.S. dollars based on exchange rates at the end of the reporting period. Income and expense items are translated at the average exchange rates prevailing during the reporting period. Translation adjustments are reported in accumulated other comprehensive (loss)/income, a component of stockholders' equity. Foreign currency translation adjustments are the sole component of accumulated other comprehensive (loss)/income at December 31, 2017 and 2016.
Foreign currency transaction gains and losses, excluding gains and losses on intercompany balances where there is no current intent to settle such amounts in the foreseeable future, are included in the determination of net loss. Unless otherwise noted, all references to "$" or "dollar" refer to the United States dollar.
Use of Estimates
In preparing financial statements in conformity with GAAP, management is required to make estimates and assumptions that affect the reported amounts of assets and liabilities and the disclosure of contingent assets and liabilities at the date of the financial statements and the reported amounts of revenues and expenses during the reporting period. In the accompanying consolidated financial statements, estimates are used for, but not limited to, share-based compensation, allowances for doubtful accounts and inventory obsolescence, valuation of derivative financial instruments, beneficial conversion features of convertible debt, deferred tax assets and liabilities and related valuation allowance, and depreciation and amortization and estimated useful lives of long-lived assets. Actual results could differ from those estimates.
F-9
Fair value of financial instruments
All financial instruments classified as current assets and liabilities are carried at cost, which approximates fair value, because of the short-term maturities of those instruments.
For additional fair value disclosures, see Note 11.
Cash and cash equivalents and restricted cash
The Company considers all highly liquid instruments with original maturities of three months or less to be cash equivalents. The Company has cash and cash equivalents deposited in financial institutions in which the balances occasionally exceed the federal government agency (FDIC) insured limits of $250,000. The Company has not experienced any losses in such accounts and management believes it is not exposed to any significant credit risk.
As of December 31, 2017 and 2016, the Company has funds totaling $243,380, which are required as collateral for letters of credit benefiting its landlords and for credit card processors. These funds are reflected in other noncurrent assets on the accompanying consolidated balance sheets.
Accounts Receivable
The Company's accounts receivable result from revenues earned but not collected from customers. Credit is extended based on an evaluation of a customer's financial condition and, generally, collateral is not required. Accounts receivable are due within 30 to 60 days and are stated at amounts due from customers. The Company evaluates if an allowance is necessary by considering a number of factors, including the length of time accounts receivable are past due, the Company's previous loss history and the customer's current ability to pay its obligation. If amounts become uncollectible, they are charged to operations when that determination is made. The allowance for doubtful accounts was $31,278 and $26,716 as of December 31, 2017 and 2016, respectively.
At December 31, 2017, the Company had accounts receivable from one customer which individually represented 41% of total accounts receivable. At December 31, 2016, the Company had accounts receivable from one customer which individually represent 25% of total accounts receivable. For the year ended December 31, 2017, revenue earned from one customer represented 11% of total revenues. No individual customer represented in excess of 10% of revenues for year ended December 31, 2016.
Inventory
Inventories are valued using the first-in, first-out method and stated at the lower of cost or market and consist of the following:
| December 31, | ||||||||
| 2017 | 2016 | |||||||
| Raw materials and supplies | $ | 360,134 | $ | 479,479 | ||||
| Work-in process | 51,233 | 27,422 | ||||||
| Finished goods | 122,058 | 185,467 | ||||||
| Total | $ | 533,425 | $ | 692,368 | ||||
Inventory includes reagents and components for QuickFISH and PNA FISH kit products, and reagents and supplies used for the Company's laboratory services. Inventory reserves for obsolescence and expirations were $155,507 and $704,516 at December 31, 2017 and 2016, respectively. The primary driver of the decrease in the inventory reserves for obsolescence and expirations is the disposal of legacy Argus Whole Genome Mapping System ("Argus") and the portion of the reagents and supplies used for Argus consumable kits. All items disposed in the year ended December 31, 2017 related to Argus were fully reserved for as of December 31, 2016.
F-10
Long-lived assets
Property and equipment
Property and equipment is stated at cost and depreciated on a straight-line basis over the estimated useful lives of the related assets. The estimated service lives approximate three to five years. Depreciation expense was $401,272 and $388,231 for the years ended December 31, 2017 and 2016, respectively. Property and equipment consisted of the following at December 31, 2017 and 2016:
| December 31, | ||||||||
| 2017 | 2016 | |||||||
| Laboratory and manufacturing equipment | $ | 4,109,367 | $ | 3,785,133 | ||||
| Office furniture and equipment | 700,299 | 688,952 | ||||||
| Computers and network equipment | 1,505,651 | 1,472,144 | ||||||
| Leasehold improvements | 729,504 | 662,506 | ||||||
| 7,044,821 | 6,608,735 | |||||||
| Less accumulated depreciation | (6,209,284 | ) | (5,808,012 | ) | ||||
| Property and equipment, net | $ | 835,537 | $ | 800,723 | ||||
Property and equipment is reviewed for impairment whenever events or changes in circumstances indicate that the carrying amount of an asset may not be recoverable. Recoverability of assets to be held and used is measured by a comparison of the carrying amount of an asset to future undiscounted net cash flows expected to be generated by the asset. Recoverability measurement and estimating of undiscounted cash flows is done at the lowest possible level for which we can identify assets. If such assets are considered to be impaired, impairment is recognized as the amount by which the carrying amount of assets exceeds the fair value of the assets. During the years ended December 31, 2017 and 2016, the Company determined that its property and equipment was not impaired.
Intangible assets and goodwill
Intangible assets and goodwill as of December 31, 2017 and 2016 were acquired as part of a July 2015 merger transaction in which the Company acquired AdvanDx, Inc. and its subsidiary (the "Merger") and consist of finite-lived intangible assets and goodwill.
Finite-lived intangible assets
Finite-lived intangible assets include trademarks, developed technology and customer relationships, and consisted of the following as of December 31, 2017 and 2016:
| December 31, 2017 | December 31, 2016 | |||||||||||||||||||
| Cost | Accumulated Amortization | Net Balance | Accumulated Amortization | Net Balance | ||||||||||||||||
| Trademarks and tradenames | $ | 461,000 | $ | (113,679 | ) | $ | 347,321 | $ | (67,575 | ) | $ | 393,425 | ||||||||
| Developed technology | 458,000 | (161,322 | ) | 296,678 | (95,898 | ) | 362,102 | |||||||||||||
| Customer relationships | 1,094,000 | (384,817 | ) | 709,183 | (228,529 | ) | 865,471 | |||||||||||||
| $ | 2,013,000 | $ | (659,818 | ) | $ | 1,353,182 | $ | (392,002 | ) | $ | 1,620,998 | |||||||||
Finite-lived intangible assets are amortized over their estimated useful lives. The estimated useful life of trademarks is 10 years, developed technology is 7 years, and customer relationships is 7 years. The Company reviews the useful lives of intangible assets when events or changes in circumstances occur which may potentially impact the estimated useful life of the intangible assets.
F-11
Total amortization expense of intangible assets was $267,816 and $267,816 for the years ended December 31, 2017 and 2016, respectively. Expected amortization of intangible assets for each of the next five fiscal years is as follows.
| Year Ending December 31, | ||||
| 2018 | $ | 267,816 | ||
| 2019 | 267,816 | |||
| 2020 | 267,816 | |||
| 2021 | 267,816 | |||
| 2022 | 165,117 | |||
| Thereafter | 116,801 | |||
| Total | $ | 1,353,182 | ||
Finite-lived intangible assets are reviewed for impairment whenever events or changes in circumstances indicate that the carrying amount of the asset may not be recoverable. If any indicators were present, the Company would test for recoverability by comparing the carrying amount of the asset to the net undiscounted cash flows expected to be generated from the asset. If those net undiscounted cash flows do not exceed the carrying amount (i.e., the asset is not recoverable), the Company would perform the next step, which is to determine the fair value of the asset and record an impairment loss, if any. During the years ended December 31, 2017 and 2016, the Company determined that its finite-lived intangible assets were not impaired.
In accordance with ASC 360-10, the Company records impairment losses on long-lived assets used in operations when events and circumstances indicate that long-lived assets might be impaired and the undiscounted cash flows estimated to be generated by those assets are less than the carrying amounts of those assets. During the fourth quarter of 2017, events and circumstances indicated the Company's intangible assets might be impaired. However, management's estimate of undiscounted cash flows indicated that such carrying amounts were expected to be recovered. Nonetheless, it is reasonably possible that the estimate of undiscounted cash flows may change in the near term resulting in the need to write down those assets to fair value.
Goodwill
Goodwill represents the excess of the purchase price for AdvanDx, Inc. and subsidiary (collectively, "AdvanDx") over the fair values of the acquired tangible or intangible assets and assumed liabilities. Goodwill is not tax deductible in any relevant jurisdictions.
The Company conducts an impairment test of goodwill on an annual basis as of October 1 of each year, and will also conduct tests if events occur or circumstances change that would, more likely than not, reduce the Company's fair value below its net equity value. As of December 31, 2017, the Company determined that its goodwill was not impaired.
Deferred rent
Deferred rent is recorded and amortized to the extent the total minimum rental payments allocated to the current period on a straight-line basis exceed or are less than the cash payments required.
Revenue recognition
The Company recognizes revenue primarily from sales of its products and services when the following criteria are met: persuasive evidence of an arrangement exists; delivery has occurred; the selling price is fixed or determinable; and collectability is reasonably assured. At times, the Company sells products and services, or performs software development, under multiple-element arrangements with separate units of accounting; in these situations, total consideration is allocated to the identified units of accounting based on their relative selling prices and revenue is then recognized for each unit based on its specific characteristics.
Amounts billed to customers for shipping and handling are included in revenue when the related product or service revenue is recognized. Shipping and handling costs are included in cost of products sold.
F-12
Revenue from sales of QuickFISH and PNA FISH diagnostic test products
Revenue is recognized upon shipment to the customer.
Revenue from providing laboratory services
The Company recognizes revenue associated with laboratory services contracts when the service has been performed and reports are made available to the customer.
Revenue from funded software development arrangements
The Company's funded software development arrangements generally consist of multiple elements. Total arrangement consideration is allocated to the identified units of accounting based on their relative selling prices and revenue is then recognized for each unit based on its specific characteristics. When funded software development arrangements include substantive research and development milestones, revenue is recognized for each such milestone when the milestone is achieved and is due and collectible. Milestones are considered substantive if all of the following conditions are met: (1) the milestone is nonrefundable; (2) achievement of the milestone was not reasonably assured at the inception of the arrangement; (3) substantive effort is involved to achieve the milestone; and (4) the amount of the milestone appears reasonable in relation to the effort expended, the other milestones in the arrangement and the related risk associated with achievement of the milestone.
For any non-substantive milestones, the Company recognizes revenue as the underlying services are performed, using a proportional performance method based on inputs (cost to cost method percentage of completion method).
Revenue from license arrangements
The Company recognizes revenue from licenses of its technologies over the applicable license term.
Revenue from sales of the reagents and supplies used for Argus consumable kits
Revenue is recognized for sales of the reagents and supplies used for Argus consumable kits upon shipment to the customer.
Research and development costs
Research and development costs are expensed as incurred. Research and development costs primarily consist of salaries and related expenses for personnel, other resources, laboratory supplies, fees paid to consultants and outside service partners.
Share-based compensation
Share-based compensation expense is recognized at fair value. The fair value of share-based compensation to employees and directors is estimated, on the date of grant, using the Black-Scholes model. The resulting fair value is recognized ratably over the requisite service period, which is generally the vesting period of the option. For all time-vesting awards granted, expense is amortized using the straight-line attribution method. The Company accounts for forfeitures as they occur.
Option valuation models, including the Black-Scholes model, require the input of highly subjective assumptions, and changes in the assumptions used can materially affect the grant-date fair value of an award. These assumptions include the risk-free rate of interest, expected dividend yield, expected volatility and the expected life of the award. A discussion of management's methodology for developing each of the assumptions used in the Black-Scholes model is as follows:
Fair value of common stock
For periods prior to the Company's IPO, given the lack of an active public market for the common stock, the Company's board of directors determined the fair value of the common stock. In the absence of a public market, and as an emerging company with no significant revenues, the Company believed that it was appropriate to consider a range of factors to determine the fair market value of the common stock at each grant date. The factors included: (1) the achievement of clinical and operational milestones by the Company; (2) the status of strategic relationships with collaborators; (3) the significant risks associated with the Company's stage of development; (4) capital market conditions for life science and medical diagnostic companies, particularly similarly situated, privately held, early stage companies; (5) the Company's available cash, financial condition and results of operations; (6) the most recent sales of the Company's preferred stock; and (7) the preferential rights of the outstanding preferred stock. Since the IPO, the Company uses the quoted market price of its common stock as its fair value.
F-13
Expected volatility
Volatility is a measure of the amount by which a financial variable such as a share price has fluctuated (historical volatility) or is expected to fluctuate (expected volatility) during a period. Until a significant trading history for its common stock develops, the Company has identified several public entities of similar size, complexity and stage of development; accordingly, historical volatility has been calculated using the volatility of this peer group.
Expected dividend yield
The Company has never declared or paid dividends on its common stock and has no plans to do so in the foreseeable future.
Risk-free interest rate
This is the U.S. Treasury rate for the day of each option grant during the year, having a term that most closely resembles the expected term of the option.
Expected term
This is the period of time that the options granted are expected to remain unexercised. Options granted have a maximum term of 10 years. The Company estimates the expected term of the option to be 6.25 years for options with a standard four-year vesting period, using the simplified method. Over time, management will track actual terms of the options and adjust their estimate accordingly so that estimates will approximate actual behavior for similar options.
Income taxes
Income taxes are accounted for under the asset and liability method. Deferred tax assets and liabilities are recognized for the expected future tax consequences attributable to temporary differences between financial statement carrying amounts of existing assets and liabilities and their respective tax basis. Deferred tax assets and liabilities are measured using enacted tax rates expected to apply to taxable income in the years in which those temporary differences are expected to be recovered or settled. The effect on deferred tax assets and liabilities of a change in tax rates is recognized in income in the period that includes the enactment date. A valuation allowance is established when necessary to reduce deferred income tax assets to the amount expected to be realized.
Tax benefits are initially recognized in the financial statements when it is more likely than not the position will be sustained upon examination by the tax authorities. Such tax positions are initially, and subsequently, measured as the largest amount of tax benefit that is greater than 50% likely of being realized upon ultimate settlement with the tax authority, assuming full knowledge of the position and all relevant facts.
The Company had federal net operating loss ("NOL") carryforwards of $165,544,893 and $150,950,436 at December 31, 2017 and 2016, respectively. Despite the NOL carryforwards, which begin to expire in 2022, the Company may have future tax liability due to alternative minimum tax or state tax requirements. Also, use of the NOL carryforwards may be subject to an annual limitation as provided by Section 382 of the Internal Revenue Code of 1986, as amended (the "Code"). To date, the Company has not performed a formal study to determine if any of its remaining NOL and credit attributes might be further limited due to the ownership change rules of Section 382 or Section 383 of the Code. The Company will continue to monitor this matter going forward. There can be no assurance that the NOL carryforwards will ever be fully utilized.
F-14
Loss per share
Basic loss per share is computed by dividing net loss available to common stockholders by the weighted average number of shares of common stock outstanding during the period.
For periods of net income, and when the effects are not anti-dilutive, diluted earnings per share is computed by dividing net income available to common stockholders by the weighted-average number of shares outstanding plus the impact of all potential dilutive common shares, consisting primarily of common stock options and stock purchase warrants using the treasury stock method, and convertible preferred stock and convertible debt using the if-converted method.
For periods of net loss, diluted loss per share is calculated similarly to basic loss per share because the impact of all dilutive potential common shares is anti-dilutive. The number of anti-dilutive shares, consisting of (i) common stock options, (ii) stock purchase warrants, and (iii) restricted stock units representing the right to acquire shares of common stock which have been excluded from the computation of diluted loss per share, was 1.6 million shares and 0.5 million shares as of December 31, 2017 and 2016, respectively.
Recent accounting pronouncements
In May 2014, the FASB issued an Accounting Standards Update ("ASU") for revenue recognition for contracts, superseding the previous revenue recognition requirements, along with most existing industry-specific guidance. The guidance requires an entity to review contracts in five steps: 1) identify the contract, 2) identify performance obligations, 3) determine the transaction price, 4) allocate the transaction price, and 5) recognize revenue. The new standard will result in enhanced disclosures regarding the nature, amount, timing, and uncertainty of revenue arising from contracts with customers. In August 2015, the FASB issued guidance approving a one-year deferral, making the standard effective for reporting periods beginning after December 15, 2017, with early adoption permitted only for reporting periods beginning after December 15, 2016. In March 2016, the FASB issued guidance to clarify the implementation guidance on principal versus agent considerations for reporting revenue gross rather than net, with the same deferred effective date. In April 2016, the FASB issued guidance to clarify the identification of performance obligations and licensing arrangements. In May 2016, the FASB issued guidance addressing the presentation of sales and other similar taxes collected from customers, providing clarification of the collectability criterion assessment, as well as clarifying certain transition requirements. The Company has identified its major revenue streams and has completed its formal contract review and the Company will adopt this guidance effective January 1, 2018. The Company will adopt this guidance using the modified retrospective method. The adoption of this new guidance will not have a material impact on the Company's consolidated financial statements.
In July 2015, the FASB issued accounting guidance for inventory. Under the guidance, an entity should measure inventory within the scope of this guidance at the lower of cost and net realizable value, except when inventory is measured using LIFO or the retail inventory method. Net realizable value is the estimated selling price in the ordinary course of business, less reasonably predictable costs of completion, disposal, and transportation. In addition, the FASB has amended some of the other inventory guidance to more clearly articulate the requirements for the measurement and disclosure of inventory. The standard is effective for reporting periods beginning after December 15, 2016. The amendments in this pronouncement should be applied prospectively, with earlier application permitted. The Company adopted this guidance effective January 1, 2017 on a prospective basis. The adoption of this new guidance did not have a material impact on the Company's consolidated financial statements.
In February 2016, the FASB issued guidance for the accounting for leases. The guidance requires lessees to recognize assets and liabilities related to long-term leases on the consolidated balance sheets and expands disclosure requirements regarding leasing arrangements. The guidance is effective for reporting periods beginning after December 15, 2018 and early adoption is permitted. The guidance must be adopted on a modified retrospective basis and provides for certain practical expedients. The Company is currently evaluating the impact, if any, that this new accounting pronouncement will have on its consolidated financial statements.
The Company has evaluated all other issued and unadopted ASUs and believes the adoption of these standards will not have a material impact on its results of operations, financial position or cash flows.
F-15
Note 4 – MGHIF Financing
In July 2015, in connection with the Merger, the Company entered into a Purchase Agreement with MGHIF, pursuant to which MGHIF purchased 45,454 shares of common stock of the Company at $110.00 per share for gross proceeds of $5.0 million. Pursuant to the Purchase Agreement, the Company also issued to MGHIF an 8% Senior Secured Promissory Note (the "MGHIF Note") in the principal amount of $1.0 million with a two-year maturity date from the date of issuance. The Company's obligations under the MGHIF Note are secured by a lien on all of the Company's assets. Under the Purchase Agreement, MGHIF has the right to participate in future securities offerings made by the Company. Also in July 2015, the Company entered into a Registration Rights Agreement with MGHIF and certain stockholders, which will require the Company to register for resale by such holders in the future, such shares of Company common stock that cannot be sold under an exemption from such registration.
The Company incurred issuance costs of approximately $50,000 related to the financing. Approximately $8,000 of the issuance costs were deferred as debt issuance costs and netted against notes payable in the accompanying condensed consolidated balance sheets as a result of the Company's adoption of the new accounting guidance in 2016, and are being amortized as interest expense over the life of the MGHIF Note. The remaining $42,000 of issuance costs were charged to additional paid-in capital.
On June 28, 2017, the MGHIF Note was amended and restated, and the maturity date of the MGHIF Note was extended by one year to July 14, 2018. As consideration for the agreement to extend the maturity date, the Company issued an amended and restated secured promissory note to MGHIF that (1) increased the interest rate to ten percent (10%) per annum and (2) provided for the issuance of common stock warrants to purchase 13,120 shares of its common stock to MGHIF. The warrants issued to MGHIF each have a five year term from issuance, are first exercisable on the date that is six months after the date of issuance and have an exercise price equal to $19.50 which represents 110% of the closing price of the Company's common stock on the date of issuance.
The MGHIF Note, as amended and restated was treated as a debt modification and as such the issuance date fair value of the warrants is deferred and amortized as incremental interest expense over the term of the MGHIF Note. The warrants are classified as mark to market liabilities under ASC 480, Distinguishing Liabilities from Equity, due to certain put features that allow the holder to put the warrant back to the Company for cash equal to the Black-Scholes value of the warrant upon a change of control or fundamental transaction, as defined in the agreement. The warrants had an issuance date fair value of approximately $0.1 million which was calculated using the Black-Scholes model.
The estimated fair value of the MGHIF Note was $1.0 million as of December 31, 2017 and 2016 which approximates the carrying value given the short time lapse since modification, prevailing interest rates and maturity date.
Note 5 – Debt
As of December 31, 2017, the Company's outstanding short-term debt consisted of the $1.0 million MGHIF Note, net of discounts and financing costs (see Note 4 " MGHIF Financing ") as well as, the financing arrangements for the Company's insurance with note balances of approximately $0.1 million with a final payment scheduled for April 2018. Total principal payments of $1.1 million are due in 2018. As of December 31, 2016, the Company's outstanding long-term debt consisted of the $1.0 million MGHIF Note, net of discounts and financing costs.
The Company drew down on two of three Bridge Financing Notes (see discussion in Note 2 "Going Concern and Management's Plans") during June and July of 2017. The outstanding Bridge Financing Notes were repaid in full subsequent to the closing of the July 2017 Public Offering.
The Company accounted for the embedded conversion option granted to jVen Capital in the Bridge Financing Notes as a mark-to-market derivative financial instrument carried at fair value. Changes in fair value of the embedded conversion option are reflected in earnings during the period of change. The embedded conversion option was expensed along with the remaining unamortized discount at the date of the Bridge Financing Notes repayment. The warrants issued to jVen Capital and MGHIF are classified as mark-to-market liabilities under ASC 480 due to certain put features that allow the holder to put the warrant back to the Company for cash equal to the Black-Scholes value of the warrant upon a change of control or fundamental transaction.
Total interest expense (including amortization of debt discounts and financing fees) on all debt instruments was $233,505 and $143,347 for the years ended December 31, 2017 and 2016, respectively.
F-16
Note 6 - Stockholders' Equity
As of December 31, 2017, the Company has 200,000,000 shares of authorized common shares and 2,265,320 shares issued and outstanding, and 10,000,000 of authorized preferred shares, of which none were issued or outstanding.
In the July 2017 Public Offering, the Company issued 18,164,195 units at $0.40 per unit, and 6,835,805 pre-funded units at $0.39 per pre-funded unit, raising gross proceeds of approximately $10 million and net proceeds of approximately $8.8 million. jVen Capital was one of the investors participating in the offering. Each unit included one twenty-fifth of a share of common stock and one common warrant to purchase one twenty-fifth of a share of common stock at an exercise price of $10.625 per share. Each pre-funded unit included one pre-funded warrant to purchase one twenty-fifth of a share of common stock for an exercise price of $0.25 per share, and one common warrant to purchase one twenty-fifth of a share of common stock at an exercise price of $10.625 per share. The common warrants are exercisable immediately and have a five-year term from the date of issuance. At closing, the outstanding Bridge Financing Notes issued to jVen Capital, were repaid in the principal amount of $1 million plus accrued interest of $6,438. All pre-funded warrants were exercised during the year ended December 31, 2017.
In connection with the July 2017 Public Offering, the Company issued to its placement agent 50,000 shares of common stock. The warrants issued to the Placement Agent have an exercise price of $12.50 per share and are exercisable for five years.
In September 2017, the Company issued 15,842 shares of its common stock with an aggregate value of $110,000 to settle a dispute related to pre-Merger AdvanDx activities. In October 2017, the Company issued 2,898 shares of its common stock with an aggregate value of $23,245 to a vendor in exchange for consulting services.
On September 13, 2016, the Company entered into the Sales Agreement with Cowen pursuant to which the Company may offer and sell from time to time, up to an aggregate of $25 million of shares of its common stock through Cowen, as sales agent, with initial sales limited to an aggregate of $11.5 million. Pursuant to the Sales Agreement, Cowen may sell the shares of common stock by any method permitted by law deemed to be an "at the market" offering as defined in Rule 415 of the Securities Act, including, without limitation, sales made by means of ordinary brokers' transactions on The Nasdaq Capital Market or otherwise at market prices prevailing at the time of sale, in block transactions, or as otherwise directed by the Company. The Company pays Cowen compensation equal to 3.0% of the gross proceeds from the sales of common stock pursuant to the terms of the Sales Agreement. As of December 31, 2017, the Company has sold an aggregate of approximately 372 thousand shares of its common stock under this at the market offering resulting in aggregate net proceeds to the Company of approximately $8.2 million, and gross proceeds of $8.8 million. As of December 31, 2017, remaining availability under the at the market offering is $2.7 million.
In May and June 2016, the Company offered and sold units in a private offering to members of management and employees and to accredited investors, including MGHIF and jVen Capital, each unit consisting of either (i) one twenty-fifth of a share of common stock and a detachable stock purchase warrant to purchase an additional 0.03 shares of common stock, or (ii) one share of non-voting convertible preferred stock and a detachable stock purchase warrant to purchase an additional 0.03 shares of common stock, at a price of $1.14 per unit. The total net proceeds to the Company, after deducting offering commissions and expenses was $9.5 million. Pursuant to the private placement the Company issued 269,765 shares of common stock, 2,309,428 of Series A non-voting convertible preferred stock and stock purchase warrants to acquire an additional 271,606 shares of common stock. Under the purchase agreement, the Company granted registration rights to the investors in the private financing.
Each share of Series A non-voting convertible preferred stock was convertible at the option of the holder in whole or in part and from time to time into one twenty-fifth of a share of common stock, was entitled to dividends on an "as converted basis" when and if dividends are issued to common stockholders, and would have participated in liquidation on a pari passu basis with common stockholders. The preferred stock was classified as permanent equity. The stock purchase warrants issued as part of the units are exercisable at $32.8125 per share beginning 90 days after closing for five years, expiring on May 18, 2021. The warrants are classified as permanent equity at December 31, 2017. In connection with the issuance of Series A non-voting convertible preferred stock, the Company recognized a beneficial conversion feature of $332,550 as a deemed dividend to the preferred shareholders. Holders of the Series A non-voting convertible preferred stock subsequently converted all 2,309,428 shares of preferred stock into 92,377 shares of common stock.
The Company filed a registration statement on Form S-3 on June 13, 2016 to register for resale by the investors, from time to time, of the shares of common stock acquired, or underlying the warrants issued, in the private offering. On July 20, 2016, the registration statement was declared effective by the SEC.
F-17
Stock options
In 2008, the Board adopted, and the stockholders approved, the 2008 Stock Option and Restricted Stock Plan (the "2008 Plan"), pursuant to which the Company's Board of Directors may grant either incentive or non-qualified stock options or shares of restricted stock to directors, key employees, consultants and advisors.
In April 2015, the Board adopted, and the Company's stockholders approved, the 2015 Equity Incentive Plan (the "2015 Plan"); the 2015 Plan became effective upon the execution and delivery of the underwriting agreement for the Company's IPO. Following the effectiveness of the 2015 Plan, no further grants have been made under the 2008 Plan. The 2015 Plan provides for the granting of incentive stock options within the meaning of Section 422 of the Code to employees and the granting of non-qualified stock options to employees, non-employee directors and consultants. The 2015 Plan also provides for the grants of restricted stock, restricted stock units, stock appreciation rights, dividend equivalents and stock payments to employees, non-employee directors and consultants.
Under the 2015 Plan, the aggregate number of shares of the common stock authorized for issuance may not exceed (1) 54,200 plus (2) the sum of the number of shares subject to outstanding awards under the 2008 Plan as of the 2015 Plan's effective date, that are subsequently forfeited or terminated for any reason before being exercised or settled, plus (3) the number of shares subject to vesting restrictions under the 2008 Plan as of the 2015 Plan's effective date that are subsequently forfeited. In addition, the number of shares that have been authorized for issuance under the 2015 Plan will be automatically increased on the first day of each fiscal year beginning on January 1, 2016 and ending on (and including) January 1, 2025, in an amount equal to the lesser of (1) 4% of the outstanding shares of common stock on the last day of the immediately preceding fiscal year, or (2) another lesser amount determined by the Company's Board of Directors. Shares subject to awards granted under the 2015 Plan that are forfeited or terminated before being exercised or settled, or are not delivered to the participant because such award is settled in cash, will again become available for issuance under the 2015 Plan. However, shares that have actually been issued shall not again become available unless forfeited. As of December 31, 2017, 32,411 shares remain available for issuance under the 2015 Plan.
For the years ended December 31, 2017 and 2016, the Company recognized stock compensation expense as follows:
| Year Ended December 31, | ||||||||
| 2017 | 2016 | |||||||
| Cost of services | $ | 13,776 | $ | 6,003 | ||||
| Research and development | 237,103 | 236,341 | ||||||
| General and administrative | 603,787 | 599,550 | ||||||
| Sales and marketing | 56,732 | 103,567 | ||||||
| $ | 911,398 | $ | 945,461 | |||||
No income tax benefit for stock-based compensation arrangements was recognized in the consolidated statements of operations due to the Company's net loss position.
As of December 31, 2017, the Company had unrecognized expense related to its stock options of $1.3 million, which will be recognized over a weighted average period of 8.3 years.
F-18
A summary of the status of options granted is presented below as of and for the years ended December 31, 2017 and 2016:
Number of Options | Weighted- Average Exercise Price | Weighted- Average Remaining Contractual Life (in years) | Aggregate Intrinsic Value | |||||||||||||
| Outstanding at January 1, 2016 | 86,431 | $ | 65.00 | 9.1 | $ | 1,575,646 | ||||||||||
| Granted | 58,546 | $ | 35.25 | |||||||||||||
| Exercised | (2,660 | ) | $ | 9.00 | $ | 79,406 | ||||||||||
| Forfeited | (22,868 | ) | $ | 99.75 | ||||||||||||
| Expired | (343 | ) | $ | 212.25 | ||||||||||||
| Outstanding at December 31, 2016 | 119,106 | $ | 44.00 | 8.6 | $ | 663,298 | ||||||||||
| Granted | 58,324 | $ | 17.58 | |||||||||||||
| Exercised | (1,167 | ) | $ | 7.01 | $ | 11,256 | ||||||||||
| Forfeited | (24,538 | ) | $ | 36.31 | ||||||||||||
| Expired | (12,330 | ) | $ | 83.49 | ||||||||||||
| Outstanding at December 31, 2017 | 139,395 | $ | 31.16 | 8.3 | $ | 37,339 | ||||||||||
| Vested and expected to vest | 139,395 | $ | 31.16 | 8.3 | $ | 37,339 | ||||||||||
| Exercisable at December 31, 2017 | 63,365 | $ | 4.73 | 7.7 | $ | 33,575 | ||||||||||
The total fair value of options vested in the years ended December 31, 2017 and 2016 was $2,086,843 and $1,088,978, respectively. The fair value of each option grant was estimated at the date of grant using the Black-Scholes option pricing model based on the assumptions below:
| Year Ended December 31, | ||||||||
| 2017 | 2016 | |||||||
| Annual dividend | — | — | ||||||
| Expected life (in years) | 5.25 - 6.25 | 5.25 - 6.25 | ||||||
| Risk free interest rate | 1.8 - 2.3% | 1.2 - 2.2% | ||||||
| Expected volatility | 44.2 - 53.0% | 42.0 - 49.8% | ||||||
Restricted stock units
During the year ended December 31, 2017, the Company granted restricted stock units to acquire 11,175 shares of common stock, with a weighted average grant date fair value of $6.93 per share. 6,025 restricted stock units vested and no restricted stock units were forfeited during the year ended December 31, 2017. The Company had 5,900 total restricted stock units outstanding at December 31, 2017.
F-19
Stock purchase warrants
At December 31, 2017 and 2016, the following warrants to purchase shares of common stock were outstanding:
| Outstanding at December 31, | ||||||||||||||
| Issuance | Exercise Price | Expiration | 2017 | 2016 | ||||||||||
| August 2007 | $ | 197.75 | August 2017 | - | 357 | |||||||||
| March 2008 | $ | 19,763.50 | March 2018 | 2 | 2 | |||||||||
| November 2009 | $ | 197.75 | November 2019 | 267 | 267 | |||||||||
| January 2010 | $ | 197.75 | January 2020 | 267 | 267 | |||||||||
| March 2010 | $ | 197.75 | March 2020 | 51 | 51 | |||||||||
| November 2011 | $ | 197.75 | November 2021 | 209 | 209 | |||||||||
| December 2011 | $ | 197.75 | December 2021 | 27 | 27 | |||||||||
| March 2012 | $ | 2,747.50 | March 2019 | 165 | 165 | |||||||||
| February 2015 | $ | 165.00 | February 2025 | 9,000 | 9,000 | |||||||||
| May 2015 | $ | 165.00 | May 2020 | 138,310 | 138,310 | |||||||||
| May 2016 | $ | 32.81 | May 2021 | 189,574 | 189,574 | |||||||||
| June 2016 | $ | 32.81 | May 2021 | 82,033 | 82,033 | |||||||||
| June 2017 | $ | 19.50 | June 2022 | 18,754 | - | |||||||||
| July 2017 | $ | 17.25 | July 2022 | 6,349 | - | |||||||||
| July 2017 | $ | 12.50 | July 2022 | 50,000 | - | |||||||||
| July 2017 | $ | 10.63 | July 2022 | 1,000,000 | - | |||||||||
| 1,495,008 | 420,262 | |||||||||||||
The warrants listed above were issued in connection with various equity, debt, preferred stock or development contract agreements.
Note 7 - Income Taxes
At December 31, 2017 and 2016, the Company had net deferred tax assets of $49,251,408 and $63,520,548, respectively, primarily consisting of NOL carryforwards, research and experimental ("R&E") credits, and differences between depreciation and amortization recorded for financial statement and tax purposes. The Company's net deferred tax assets at December 31, 2017 and 2016 have been offset by a valuation allowance of $49,251,408 and $63,520,548, respectively. The valuation allowance has been recorded due to the uncertainty of realization of the deferred tax assets. The Company's deferred tax assets and liabilities as of December 31, 2017 and 2016 are as follows:
| December 31, | ||||||||
| 2017 | 2016 | |||||||
| Deferred tax assets: | ||||||||
| NOL carryforward | $ | 46,326,407 | $ | 60,357,220 | ||||
| R&E credit carryforward | 2,559,479 | 2,559,479 | ||||||
| Share-based compensation | 345,088 | 448,534 | ||||||
| Inventory reserve | 45,338 | 269,708 | ||||||
| Depreciation | 71,756 | 117,629 | ||||||
| Accruals and other | 247,093 | 333,126 | ||||||
| Total deferred tax assets | 49,595,161 | 64,085,696 | ||||||
| Valuation allowance | (49,251,408 | ) | (63,520,548 | ) | ||||
| Deferred tax liabilities: | ||||||||
| Intangible assets | (343,753 | ) | (565,148 | ) | ||||
| Net deferred tax liability | $ | — | $ | — | ||||
F-20
The difference between the Company's expected income tax provision (benefit) from applying federal statutory tax rates to the pre-tax loss and actual income tax provision (benefit) relates to the effect of the following:
| 2017 | 2016 | |||||||
| Federal income tax benefit at statutory rates | 34.0 | % | 34.0 | % | ||||
| State income tax benefit, net of Federal benefit | 6.8 | % | 6.5 | % | ||||
| Tax reform impact | (134.5 | )% | 0.0 | % | ||||
| Change in valuation allowance | 93.0 | % | (37.3 | )% | ||||
| Change in state tax rates and other | 0.7 | % | (3.2 | )% | ||||
| 0.0 | % | 0.0 | % | |||||
The Company has federal NOL carryforwards of $165,544,893 and $150,950,436 at December 31, 2017 and 2016, respectively. The NOL carryforwards begin to expire in 2022. Utilization of the NOL carryforward may be subject to an annual limitation as provided by Section 382 of the Internal Revenue Code. There can be no assurance that the NOL carryforward will ever be fully utilized. To date, the Company has not performed a formal study to determine if any of its remaining NOL and credit attributes might be further limited due to the ownership change rules of Section 382 or Section 383 of the Internal Revenue Code of 1986, as amended. The Company will continue to monitor this matter going forward. There can be no assurance that the NOL carryforwards will ever be fully utilized.
In December 2017, the U.S. government enacted comprehensive tax legislation commonly referred to as the Tax Cuts and Jobs Act (the "Tax Act"). The Tax Act makes broad and complex changes to the U.S. tax code, including, but not limited to: (i) reducing the U.S. federal corporate tax rate from 35 percent to 21 percent; (ii) eliminating the corporate alternative minimum tax (AMT) and changing how existing AMT credits can be realized; (iii) creating a new limitation on deductible interest expense; and (iv) changing rules related to uses and limitations of net operating carryforwards created in tax years beginning after December 31, 2017; and (v) changing the U.S. federal taxation of earnings of foreign subsidiaries.
As a result, the Company believes the most significant impact on its consolidated financial statements will be the reduction of approximately $14.6 million of the deferred tax assets related to net operating losses and other deferred tax assets. Such reduction is offset by a change in the Company's valuation allowance. Additionally, the Company has a foreign subsidiary. At December 31, 2017 and November 2, 2017, the cumulative earnings and profits of this entity was negative. Accordingly, the Company is not liable for the transition tax on foreign earnings enacted under the Tax Act.
The Company has completed the accounting for the impact of the Tax Act as of December 31, 2017 and has recorded no provisional amounts.
Note 8 - Commitments
Operating leases
The Company leases a facility in Woburn, Massachusetts under an operating lease that expires January 30, 2022.
During the second quarter of 2015, the Company extended the term of its Gaithersburg, Maryland office lease, effective May 7, 2015, through January 31, 2021, with one additional five-year renewal at the Company's election. The Company is responsible for all utilities, repairs, insurance, and taxes under this operating lease. Effective July 1, 2015, the Company further modified its lease agreement to add additional leased space to its headquarters. Additionally, the Company leases office space in Denmark; this lease is currently on a month-to-month basis.
Rent expense under the Company's facility operating leases for the year ended December 31, 2017 and 2016 was $949,244 and $1,000,726, respectively.
F-21
Capital leases
The Company leases computer equipment, office furniture, and equipment under various capital leases. The leases expire at various dates through 2021. The leases require monthly principal and interest payments. Following is a schedule by year of the estimated future minimum payments under all operating and capital leases as of December 31, 2017:
| Year ending December 31, | Capital Leases | Operating Leases | Total | |||||||||
| 2018 | $ | 177,464 | $ | 1,041,323 | $ | 1,218,787 | ||||||
| 2019 | 85,393 | 1,054,374 | 1,139,767 | |||||||||
| 2020 | 56,981 | 1,072,748 | 1,129,729 | |||||||||
| 2021 | 1,773 | 482,058 | 483,831 | |||||||||
| 2022 and thereafter | - | 35,647 | 35,647 | |||||||||
| Total | 321,611 | $ | 3,686,150 | $ | 4,007,761 | |||||||
| Less: amount representing interest | (36,619 | ) | ||||||||||
| Net present value of future minimum lease payments | 284,992 | |||||||||||
| Current maturities | (154,839 | ) | ||||||||||
| Long-term maturities | $ | 130,153 | ||||||||||
Assets under capital leases were included in the following balance sheet categories as of December 31:
| 2017 | 2016 | |||||||
| Laboratory and manufacturing equipment | $ | 850,792 | $ | 560,829 | ||||
| Office furniture and equipment | 64,790 | 64,790 | ||||||
| Computers and network equipment | 24,350 | 24,350 | ||||||
| Less accumulated amortization | (454,471 | ) | (270,808 | ) | ||||
| Capital lease assets, net | $ | 485,461 | $ | 379,161 | ||||
Amortization expense associated with equipment under capital leases for the years ended December 31, 2017 and 2016 was $183,663 and $161,606, respectively, and is included within depreciation and amortization expense in the consolidated statements of operations.
Registration and other stockholder rights
In connection with the various investment transactions, the Company entered into registration rights agreements with stockholders, pursuant to which the investors were granted certain demand registration rights and/or piggyback and/or resale registration rights in connection with subsequent registered offerings of the Company's common stock.
Restructuring
In early June 2017, the Company commenced a restructuring of its operations to improve efficiency and reduce its cost structure. The restructuring plans anticipate that the Company will consolidate operations for FDA-cleared and CE marked products and research and development activities for the Acuitas Rapid Test in Gaithersburg, Maryland, and reduce the size of its commercial organization while the Company works to complete the development of its Acuitas Rapid Test and Acuitas Lighthouse Knowledgebase products and services in development.
There were approximately $121,000 of one-time termination benefits that were recognized during the year ended December 31, 2017 related to the restructuring. The Company does not anticipate any further one-time termination benefits related to the restructuring plan. Retention agreements were issued to certain employees in which retention bonuses are earned and paid upon the completion of a designated service period. The service periods ended in December 2017. The Company incurred total retention expense of approximately $68,000 during the year ended December 31, 2017. The future minimum lease payments for the Woburn facility were approximately $1.8 million as of December 31, 2017. A liability for costs that will continue to be incurred under a contract for its remaining term without economic benefit to the entity shall be recognized at the cease-use date. If the contract is an operating lease the fair value of the liability at the cease-use date shall be determined based on the remaining lease rentals, adjusted for the effects of any prepaid or deferred items recognized under the lease, and reduced by estimated sublease rentals that could be reasonably obtained for the property. The Company expects the cease-use date for the Woburn facility to be in the second quarter of 2018. We have not estimated the contract termination costs associated with this lease given that we have not yet reached the cease use date and given that we have only begun sublease pursuit activities. We do not believe there will be significant additional costs related to restructuring outside of what is described herein.
F-22
Note 9 - License Agreements, Research Collaborations and Development Agreements
The Company is a party to one license agreement to acquire certain patent rights and technologies related to its FISH product line. Royalties are incurred upon the sale of a product or service which utilizes the licensed technology. Certain of the agreements require the Company to pay minimum royalties or license maintenance fees. The Company recognized net royalty expense of $257,186 and $290,491 for the years ended December 31, 2017 and 2016, respectively. Annual future minimum royalty fees are $250,000 under these agreements.
In September 2017, the Company was awarded a contract from the Centers for Disease Control and Prevention ("CDC") to develop smartphone-based clinical decision support solutions for antimicrobial stewardship, or AMS, and infection control in low- and middle-income countries. The one-year $860,000 award began September 30, 2017 and funds development and evaluation of cloud-based mobile software. The Company will work with subcontractors Ilúm, LLC, an affiliate of Merck, and Universidad El Bosque ("UEB") of Bogota, Colombia under this CDC contract. During the year ended December 31, 2017, the Company recognized $357,178 of revenue related to the contract.
In June 2016, the Company entered into a license agreement with Hitachi, pursuant to which it resolved various matters with respect to previously delivered milestones under the technology development agreement and provided a development license and commercial products license to certain technology. The license agreement contains non-contingent multiple elements (the licenses) that the Company determined did not have stand alone value, and a contingent substantive milestone. The licenses are treated as a single unit of accounting and the Company will recognize the revenue associated with that unit of accounting over the applicable license period. During the year ended December 31, 2017, the Company recognized $25,000 of revenue related to the license agreement.
Note 10 – Related Party Transactions
In March 2014, the Company entered into a supply agreement with Fluidigm Corporation ("Fluidigm") under which Fluidigm supplies the Company with its microfluidic test platform for use in manufacturing the Acuitas MDRO Gene Test. The Company's CEO and Chairman of the Board of Directors is a director of Fluidigm. On July 12, 2015, the Company entered into a letter agreement (the "Fluidigm Agreement") with Fluidigm to expand the companies' existing relationship to include collaborating on the development of test kits and custom analytic instruments for identification, screening and surveillance testing of MDROs. The Fluidigm Agreement also expands the existing Supply Agreement between the Company and Fluidigm, and provides for expansion of the gene targets and organisms to be tested on the Company's existing CLIA lab-based tests, the Acuitas MDRO Gene Test and the Acuitas Resistome Test, using Fluidigm technologies and products. Additionally, Fluidigm has agreed not to develop or directly collaborate with any third party to develop an FDA approved or CE marked diagnostic test for the purpose of detecting resistance genes for identified MDROs if the Company meets certain minimum purchase commitments and other requirements. The initial term of the Fluidigm Agreement is five years. Both parties have the ability to extend the term for an additional five years. Under the expanded Supply Agreement, the term was extended until March 17, 2018, and the Company has the right to extend the term of the Supply Agreement for up to two additional three-year terms. The Company paid $123,067 related to these agreements in the year ended December 31, 2017. The Company paid $183,713 related to these agreements in the year ended December 31, 2016.
Under the agreements with Fluidigm, the Company had purchases of $135,415 in the year ended December 31, 2017. The Company had purchases of $91,399 related to these agreements in the year ended December 31, 2016.
In addition, the Company has several capital lease arrangements for laboratory equipment manufactured by Fluidigm. The Company paid $91,882 related to the leased equipment in the year ended December 31, 2017. The Company paid $175,475 related to the leased equipment in the year ended December 31, 2016.
In October 2016, the Company entered into an agreement with Merck Sharp & Dohme, a wholly-owned subsidiary of Merck Co. & Inc. ("Merck"), an affiliate of MGHIF, a principal stockholder of the Company and a related party to the Company. Under the agreement, Merck provided access to its archive of over 200,000 bacterial pathogens. The Company is initially performing molecular analyses on up to 10,000 pathogens to identify markers of resistance to support rapid decision making using the Acuitas Lighthouse, and to speed development of its rapid diagnostic products. Merck gains access to the high-resolution genotype data for the isolates as well as access to the Acuitas Lighthouse informatics to support internal research and development programs. The Company is required to expend up to $175,000 for the procurement of materials related to the activities contemplated by the agreement. Contract life-to-date, the Company has incurred $146,177 of procurement costs which have been recognized as research and development expense, including $113,907 and $32,270 during the years ended December 31, 2017 and 2016.
F-23
In December 2017, we entered into a subcontractor agreement with ILÚM Health Solutions, LLC, an entity created by Merck's Healthcare Services and Solutions division, whereby ILÚM Health Solutions will provide services to the Company in the performance of the Company's CDC contract to deploy ILÚM's commercially-available cloud- and mobile-based software platform for infectious disease management in up to three medical sites in Colombia with the aim of improving antibiotic use in resource-limited settings. During the year ended December 31, 2017, the Company recognized $210,180 of cost of services expense related to the contract.
Note 11 – Fair Value Measurements
The Company classifies its financial instruments using a three-tier fair value hierarchy, which prioritizes the inputs used in measuring fair value. These tiers include:
| · | Level 1 - defined as observable inputs such as quoted prices in active markets; |
| · | Level 2 - defined as inputs other than quoted prices in active markets that are either directly or indirectly observable; and |
| · | Level 3 - defined as unobservable inputs in which little or no market data exists, therefore requiring an entity to develop its own assumptions such as expected revenue growth and discount factors applied to cash flow projections. |
Financial assets and liabilities measured at fair value on a recurring basis
The Company evaluates financial assets and liabilities subject to fair value measurements on a recurring basis to determine the appropriate level at which to classify them each reporting period. This determination requires the Company to make subjective judgments as to the significance of inputs used in determining fair value and where such inputs lie within the hierarchy.
As part of the Company's bridge financing and amendment to the MGHIF Note, the Company issued stock purchase warrants that the Company considers to be mark-to-market liabilities due to certain put features that allow the holder to put the warrant back to the Company for cash equal to the Black-Scholes value of the warrant upon a change of control or fundamental transaction. The Company determines the fair value of the warrant liabilities using the Black-Scholes option pricing model. Using this model, level 3 unobservable inputs include the estimated volatility of the Company's common stock, estimated terms of the instruments, and estimated risk-free interest rates.
The Company originally accounted for the conversion option embedded in the Bridge Financing Notes as a mark-to-market derivative financial instrument. The Company determined the fair value of the embedded conversion option liability using a probability-weighted expected return method. Using this method, level 3 unobservable inputs include the probability of default, the probability of a qualified financing, the probability of conversion, the estimated volatility of the Company's common stock, estimated terms of the instruments, and estimated risk-free interest rates, among other inputs. The fair value of the conversion option was expensed at the time of repayment of the Bridge Financing Notes.
The following table sets forth a summary of changes in the fair value of level 3 liabilities measured at fair value on a recurring basis for the year ended December 31, 2017:
| Description | Balance at December 31, 2016 | Established in 2017 | Change in Fair Value | Expensed | Balance at December 31, 2017 | |||||||||||||||
| Embedded conversion option liability | $ | - | $ | 4,500 | $ | - | $ | (4,500 | ) | $ | - | |||||||||
| Warrant liability | $ | - | $ | 152,517 | $ | (144,064 | ) | $ | - | $ | 8,453 | |||||||||
F-24
Financial assets and liabilities carried at fair value on a non-recurring basis
The Company does not have any financial assets and liabilities measured at fair value on a non-recurring basis.
Non-financial assets and liabilities carried at fair value on a recurring basis
The Company does not have any non-financial assets and liabilities measured at fair value on a recurring basis.
Non-financial assets and liabilities carried at fair value on a non-recurring basis
The Company measures its long-lived assets, including property and equipment and intangible assets (including goodwill), at fair value on a non-recurring basis when they are deemed to be impaired. No such fair value impairment was recognized in the year ended December 31, 2017.
Note 12 – Subsequent events
On January 5, 2018, the Company entered into a supply agreement with Life Technologies Corporation. The term of the agreement is three years and the Company must make annual minimum purchases of $100,000 per year.
On January 17, 2018, the Board of Directors of the Company approved a one-for-twenty-five reverse stock split. All share and per share information in these consolidated financial statements, except for par value and authorized shares, have been amended to reflect the reverse stock split.
In addition, on January 17, 2018, the stockholders of the Company approved an Amendment to the Amended and Restated Certificate of Incorporation to reduce the number of authorized shares of common stock from 200,000,000 to 50,000,000.
On February 6, 2018, the Company closed a public offering of 2,841,152 units at $3.25 per unit, and 851,155 pre-funded units at $3.24 per pre-funded unit, raising gross proceeds of approximately $12 million and net proceeds of approximately $10.7 million. Each unit included one share of common stock and one common warrant to purchase 0.5 share of common stock at an exercise price of $3.25 per share. Each pre-funded unit included one pre-funded warrant to purchase one share of common stock for an exercise price of $0.01 per share, and one common warrant to purchase 0.5 share of common stock at an exercise price of $3.25 per share. The common warrants are exercisable immediately and have a five-year term from the date of issuance.
F-25
1,050,000 shares of Common Stock issuable upon the exercise of Warrants
Preliminary Prospectus
Dated April 4, 2018
PART II
Information Not Required in Prospectus
Item 14. Indemnification of Directors and Officers.
The Registrant maintains insurance providing for indemnification of its officers and directors and certain other persons against liabilities and expenses incurred by any of them in certain stated proceedings and under certain stated conditions.
Delaware Corporations
Section 145 of the Delaware General Corporation Law, or DGCL, provides that a corporation may indemnify any person who was or is a party or is threatened to be made a party to any threatened, pending or completed action, suit or proceeding whether civil, criminal, administrative or investigative (other than an action by or in the right of the corporation) by reason of the fact that the person is or was a director, officer, employee or agent of the corporation, or is or was serving at the request of the corporation as a director, officer, employee or agent of another corporation, partnership, joint venture, trust or other enterprise, against expenses (including attorneys' fees)), judgments, fines and amounts paid in settlement actually and reasonably incurred by the person in connection with such action, suit or proceeding if the person acted in good faith and in a manner the person reasonably believed to be in or not opposed to the best interests of the corporation, and, with respect to any criminal action or proceeding, had no reasonable cause to believe his conduct was unlawful. Section 145 further provides that a corporation similarly may indemnify any such person serving in any such capacity who was or is a party or is threatened to be made a party to any threatened, pending or completed action or suit by or in the right of the corporation to procure a judgment in its favor by reason of the fact that the person is or was a director, officer, employee or agent of the corporation or is or was serving at the request of the corporation as a director, officer, employee or agent of another corporation, partnership, joint venture, trust or other enterprise, against expenses (including attorneys' fees) actually and reasonably incurred by the person in connection with the defense or settlement of such action or suit if the person acted in good faith and in a manner the person reasonably believed to be in or not opposed to the best interests of the corporation and except that no indemnification shall be made in respect of any claim, issue or matter as to which such person shall have been adjudged to be liable to the corporation unless and only to the extent that the Delaware Court of Chancery or such other court in which such action or suit was brought shall determine upon application that, despite the adjudication of liability but in view of all of the circumstances of the case, such person is fairly and reasonably entitled to indemnity for such expenses which the Delaware Court of Chancery or such other court shall deem proper.
Certificate of Incorporation and Bylaws
The Registrant's certificate of incorporation, as amended, provides that a director of the Registrant shall not be personally liable to the Registrant or its stockholders for monetary damages for breach of fiduciary duty as a director, except for liability (i) for any breach of the director's duty of loyalty to the Registrant or its stockholders, (ii) for acts or omissions not in good faith or which involve intentional misconduct or a knowing violation of law, (iii) under Section 174 of the DGCL, or (iv) for any transaction from which the director derived an improper personal benefit. If the DGCL is hereafter amended to authorize the further elimination or limitation of the liability of directors, then the liability of the directors of the Registrant, in addition to the limitation on personal liability provided herein, shall be limited to the fullest extent permitted by the amended DGCL. Any repeal or modification of this paragraph by the stockholders of the Registrant shall be prospective only, and shall not adversely affect any limitation on the personal liability of a director of the corporation at the time of such repeal or modification. The Registrant's certificate of incorporation further provides that the Registrant's officers and directors shall be indemnified by the Registrant as provided in the Registrant's bylaws.
II-1
Under the provisions of the Registrant's bylaws, as amended, any person who is or was a party or is threatened to be made a party of any threatened, pending or completed action, suit or proceeding, whether civil, criminal, administrative or investigative (other than an action by or in the right of the Registrant) by reason of the fact that he or she is or was a director, officer, employee or agent of the Registrant or is or was serving at the Registrant's request as a director, officer, employee or agent of another company or other entity shall be indemnified by the Registrant against expenses (including attorneys' fees), judgments, fines and amounts paid in settlement actually and reasonably incurred by him or her in connection with such action, suit or proceeding if he or she acted in good faith and in a manner he or she reasonably believed to be in, or not opposed to, the Registrant's best interests, and, with respect to any criminal action or proceeding, had no reasonable cause to believe his or her conduct was unlawful. The Registrant shall further indemnify any person who was or is a party or is threatened to be made a party to any threatened, pending or completed action or suit by or in the right of the Registrant to procure a judgment in its favor by reason of the fact that he is or was a director, officer, employee or agent of the Registrant or is or was serving at the request of the Registrant as a director, officer, employee or agent of another corporation or other entity against expenses (including attorneys' fees) actually and reasonably incurred by him in connection with the defense or settlement of such action or suit if he acted in good faith and in a manner he reasonably believed to be in or not opposed to the best interests of the Registrant. Notwithstanding the foregoing, no indemnification shall be made in respect of any claim, issue or matter as to which such person shall have been adjudged to be liable to the Registrant unless and only to the extent that the Delaware Court of Chancery or the court in which such action or suit was brought shall determine upon application that, despite the adjudication of liability but in view of all the circumstances of the case, such person is fairly and reasonably entitled to indemnity for such expenses which the Delaware Court of Chancery or such other court shall deem proper.
The termination of any action, suit or proceeding by judgment, order, settlement, conviction, or upon a plea of nolo contendre or its equivalent, shall not, of itself, create a presumption that the person did not act in good faith and in a manner which he or she reasonably believed to be in, or not opposed to, the Registrant's best interests and, with respect to any criminal action or proceeding, had reasonable cause to believe that his or her conduct was unlawful.
In addition, to the extent that such a person is successful on the merits or otherwise in defense of any action, suit, or proceeding brought against him or her by reason of the fact that he or she is the Registrant's director, officer, employee or agent, he or she shall be indemnified against expenses, including attorneys' fees, actually and reasonably incurred in connection therewith.
The Registrant's bylaws, as amended, provide that expenses (including attorneys' fees) incurred by a director or officer in defending a civil, criminal, administrative, or investigative action, suit or proceeding may be paid by the Registrant in advance of the final disposition of such action, suit or proceeding upon receipt of an undertaking by or on behalf of the director or officer to repay such amount if it shall ultimately be determined that he or she is not entitled to be indemnified by the Registrant. Such expenses, including attorneys' fees, incurred by other employees and agents may be paid upon such terms and conditions as the Board of Directors deems appropriate.
Any indemnification under the provisions summarized above (unless ordered by a court) shall be made by the Registrant only as authorized in each specific case upon a determination that indemnification of such person is proper under the circumstances because he or she has met the applicable standard of conduct set forth in the applicable provision. Such determination shall be made (1) by a majority vote of the Registrant's directors who are not parties to the action, suit or proceeding (even though less than a quorum), (2) if there are no such directors, or if such directors so direct, by independent legal counsel in a written opinion, or (3) by the stockholders.
The Registrant maintains director and officer insurance with respect to those claims described above in customary amounts.
The above discussion of the certificate of incorporation and bylaws of the Registrant and the DGCL is not intended to be exhaustive and is qualified in its entirety by such certificates of incorporation, bylaws and the DGCL.
The Registrant has entered into indemnification agreements with each of our directors and executive officers. These agreements provide that we will indemnify each of our directors, such executive officers and, at times, their affiliates to the fullest extent permitted by Delaware law. We will advance expenses, including attorneys' fees (but excluding judgments, fines and settlement amounts), to each indemnified director, executive officer or affiliate in connection with any proceeding in which indemnification is available and we will indemnify our directors and officers for any action or proceeding arising out of that person's services as a director or officer brought on behalf of us and/or in furtherance of our rights. Additionally, each of our directors may have certain rights to indemnification, advancement of expenses and/or insurance provided by their affiliates, which indemnification relates to and might apply to the same proceedings arising out of such director's services as a director referenced herein. Nonetheless, we have agreed in the indemnification agreements that our obligations to those same directors are primary and any obligation of the affiliates of those directors to advance expenses or to provide indemnification for the expenses or liabilities incurred by those directors are secondary.
We also maintain general liability insurance which covers certain liabilities of our directors and officers arising out of claims based on acts or omissions in their capacities as directors or officers, including liabilities under the Securities Act.
II-2
Item 15. Recent Sales of Unregistered Securities.
The following list sets forth information as to all securities we have sold since December 1, 2014, which were not registered under the Securities Act.
(1) In October 2014, the Board of Directors authorized the Company to raise bridge funding up to an aggregate of $2,000,000 pursuant to the issuance and sale of secured demand notes to existing investors. The secured demand notes each have a term of up to four months. The Company drew down an aggregate of $1,800,000 of such bridge funding between October 2014 and January 2015.
(2) In February 2015, the Company issued to existing investors $1.2 million principal amount of convertible notes, or 2015 convertible notes, that are convertible into shares of either common stock or Series A Preferred Stock, depending on whether the public offering contemplated by this prospectus is consummated by June 30, 2015. The 2015 convertible notes were issued pursuant to a Notes Purchase Agreement, dated as of February 11, 2015. Following the initial closing, the Company offered an additional $0.3 million principal of 2015 convertible notes, on the same terms, as a participation offering to existing investors in the Company who are party the Company's Third Amended and Restated Investors' Rights Agreement, as amended. The 2015 convertible note holders were also issued an aggregate of 9,000 warrants, exercisable for shares of common stock at 110% of the initial public offering price. There was no firm commitment on the part of any investor to participate in the 2015 convertible notes offering.
(3) In May and June 2016, the Company offered and sold units in a private offering to members of management and employees and to accredited investors, including Merck Global Health Innovation Fund and jVen Capital, each unit consisting of either (i) one twenty-fifth of a share of common stock and a detachable stock purchase warrant to purchase an additional 0.03 of one share of common stock, or (ii) one share of non-voting convertible preferred stock and a detachable stock purchase warrant to purchase an additional 0.03 of one share of common stock, at a price of $1.14 per unit. The total net proceeds to the Company, after deducting offering commissions and expenses was $9.5 million.
(4) As of September 30, 2017, 0 warrants issued since May 1, 2014 had been exercised or forfeited.
(5) On May 31, 2017, the Company entered into a Note Purchase Agreement with jVen Capital, which Note Purchase Agreement was amended and restated on July 10, 2017, under which jVen Capital agreed to lend bridge financing in an aggregate principal amount of up to $1,500,000 to the Company in the form of three $500,000 secured convertible promissory notes. Pursuant to the terms of the amended and restated Note Purchase Agreement and the underlying bridge financing notes, if a "qualified financing" (offering of debt or equity securities with net proceeds of $5 million or more to the Company) occurs, the Company has the obligation to repay the outstanding bridge financing notes within five business days after the closing of the qualified financing. If a qualified financing does not occur, and an event of default occurs (the Company fails to pay any outstanding bridge financing notes when due, seeks to liquidate the Company, enters into a bankruptcy proceeding, or fails to pay other indebtedness when due), the then-outstanding bridge financing notes would acquire a two times liquidation preference for unpaid principal and interest. Alternatively, jVen Capital may forego the two times liquidation preference and elect to convert the bridge financing notes to Series B Convertible Preferred Stock, or Preferred Stock, at a ratio of one share of non-voting Preferred Stock per $1.00 of principal and interest, which non-voting Preferred Stock would be convertible into 10 shares of voting common stock, otherwise no further preferences are provided to the Preferred Stock. The bridge financing notes contain, and the Certificate of Designation for the Preferred Stock will contain, a blocker provision that prevents any issuance of securities as repayment of the bridge financing notes, or any conversion of the Preferred Stock into common stock if such conversion would violate Nasdaq Listing Rule 5635.
II-3
(6) In connection with the bridge financing transaction described in (6) above, the Company issued warrants to purchase 11,983 shares of common stock to jVen Capital, and warrants to purchase 13,119 shares of common stock the MGHIF.
(7) In September 2017, the Company issued common stock with an aggregate value of $110,000 to settle a dispute related to pre-Merger AdvanDx activities.
We deemed the offers, sales and issuances of the securities described in paragraphs (1), (2), (3), (5), (6) and (7) above to be exempt from registration under the Securities Act, in reliance on Section 4(a)(2) of the Securities Act, including Regulation D and Rule 506 promulgated thereunder, regarding transactions by an issuer not involving a public offering. All purchasers of securities in transactions exempt from registration pursuant to Regulation D represented to us that they were accredited investors and were acquiring the shares for investment purposes only and not with a view to, or for sale in connection with, any distribution thereof and that they could bear the risks of the investment and could hold the securities for an indefinite period of time. The purchasers received written disclosures that the securities had not been registered under the Securities Act and that any resale must be made pursuant to a registration statement or an available exemption from such registration.
All certificates representing the securities issued in the transactions described in this Item 15 included appropriate legends setting forth that the securities had not been offered or sold pursuant to a registration statement and describing the applicable restrictions on transfer of the securities. There were no underwriters employed in connection with any of the transactions set forth in this Item 15.
II-4
Item 16. Exhibits and Financial Statement Schedules.
Exhibit Number |
| Description |
|
|
|
| ||
|
|
|
| ||
|
|
|
| ||
|
|
|
| ||
|
|
|
| ||
|
|
|
| ||
|
|
|
| ||
|
|
|
| ||
|
|
|
| ||
|
|
|
| ||
|
|
|
| ||
|
|
|
| 5.1 * | Opinion of Ballard Spahr LLP | |
| ||
|
|
|
| ||
|
|
|
|
II-5
Exhibit Number |
| Description |
|
| |
|
|
|
| ||
|
|
|
| ||
|
|
|
| ||
|
|
|
| ||
|
|
|
| ||
|
|
|
| ||
|
|
|
| ||
|
|
|
| ||
|
|
|
| ||
|
|
|
| ||
|
|
|
| ||
|
|
|
| ||
|
|
|
| ||
|
|
|
| ||
|
|
|
| ||
|
|
|
| ||
|
|
|
| ||
|
|
|
| ||
|
|
|
|
II-6
Exhibit Number |
| Description |
|
| |
| ||
|
|
|
| ||
|
|
|
| ||
|
|
|
| ||
|
|
|
| ||
|
|
|
| ||
|
|
|
| ||
|
|
|
| ||
|
|
|
| ||
|
|
|
| ||
|
|
|
| ||
|
|
|
| ||
|
|
|
| ||
|
|
|
| ||
|
|
|
| ||
|
|
|
| ||
|
|
|
|
|
|
| 21.1 * | Power of Attorney (including on signature page to Form S-1 Registration Statement, File No. 333-218392 filed on June 1, 2017) | |
|
|
|
101 * |
| Interactive data files pursuant to Rule 405 of Regulation S-T; (i) the Consolidated Balance Sheets, (ii) the Consolidated Statements of Operations and Comprehensive Loss, (iii) the Consolidated Statements of Stockholders’ Equity, (iv) the Consolidated Statements of Cash Flows and (v) the Notes to the Consolidated Financial Statements |
| * | Filed herewith |
| ! | Denotes management compensation plan or contract |
| ± | Confidential treatment has been requested for certain portions of this agreement pursuant to an application for confidential treatment filed with the Securities and Exchange Commission on June 19, 2017. Such provisions have been filed separately with the Commission. |
II-7
Item 17. Undertakings.
The undersigned Registrant hereby undertakes:
(1) To file, during any period in which offers or sales are being made, a post-effective amendment to this registration statement:
(i) To include any prospectus required by Section 10(a)(3) of the Securities Act;
(ii) To reflect in the prospectus any facts or events arising after the effective date of this registration statement (or the most recent post-effective amendment thereof) which, individually or in the aggregate, represent a fundamental change in the information set forth in the registration statement. Notwithstanding the foregoing, any increase or decrease in volume of securities offered (if the total dollar value of securities offered would not exceed that which was registered) and any deviation from the low or high and of the estimated maximum offering range may be reflected in the form of prospectus filed with the Securities and Exchange Commission (the "Commission") pursuant to Rule 424(b) if, in the aggregate, the changes in volume and price represent no more than 20 percent change in the maximum aggregate offering price set forth in the "Calculation of Registration Fee" table in the effective registration statement; and
(iii) To include any material information with respect to the plan of distribution not previously disclosed in this registration statement or any material change to such information in this registration statement;
provided, however, that paragraphs (1)(i), (1)(ii) and (1)(iii) above do not apply if the information required to be included in a post-effective amendment by those paragraphs is contained in reports filed with or furnished to the Commission by the registrant pursuant to Section 13 or Section 15(d) of the Securities Exchange Act of 1934, as amended (the "Exchange Act"), that are incorporated by reference in the registration statement, or is contained in a form of prospectus filed pursuant to Rule 424(b) that is part of the registration statement.
(2) That, for the purpose of determining any liability under the Securities Act, each such post-effective amendment shall be deemed to be a new registration statement relating to the securities offered therein, and the offering of such securities at that time shall be deemed to be the initial bona fide offering thereof.
(3) To remove from registration by means of a post-effective amendment any of the securities being registered which remain unsold at the termination of the offering.
II-8
(4) That, for the purpose of determining liability under the Securities Act to any purchaser:
(i) Each prospectus filed by the registrant pursuant to Rule 424(b)(3) shall be deemed to be part of the registration statement as of the date the filed prospectus was deemed part of and included in the registration statement; and
(ii) Each prospectus required to be filed pursuant to Rule 424(b)(2), (b)(5), or (b)(7) as part of a registration statement in reliance on Rule 430B relating to an offering made pursuant to Rule 415(a)(1)(i), (vii), or (x) for the purpose of providing the information required by section 10(a) of the Securities Act shall be deemed to be part of and included in the registration statement as of the earlier of the date such form of prospectus is first used after effectiveness or date of the first sale of securities in the offering described in the prospectus. As provided in Rule 430B, for liability purposes of the issuer and any person that is at that date an underwriter, such date shall be deemed to be a new effective date of the registration statement relating to the securities in the registration statement to which the prospectus forms a part, and the offering of such securities at that time shall be deemed to be the initial bona fide offering thereof. Provided, however, that no statement made in a registration statement or prospectus that is part of this registration statement or made in a document incorporated or deemed incorporated by reference into this registration statement or prospectus that is a part of this registration statement will, as to a purchaser with a time of contract sale prior to such effective date, supersede or modify any statement that was made in this registration statement or prospectus that was a part of this registration statement or made in any such document immediately prior to such effective date.
(5) That, for the purpose of determining liability of the registrant under the Securities Act to any purchaser in the initial distribution of the securities, in a primary offering of securities of the undersigned registrant pursuant to this registration statement, regardless of the underwriting method used to sell the securities to the purchaser, if the securities are offered or sold to such purchaser by means of any of the following communications, the undersigned registrant will be a seller to the purchaser and will be considered to offer or sell such securities to such purchaser:
(i) any preliminary prospectus or prospectus of the undersigned registrant relating to the offering required to be filed pursuant to Rule 424;
(ii) any free writing prospectus relating to the offering prepared by or on behalf of the undersigned registrant or used or referred to by the undersigned registrant;
(iii) the portion of any other free writing prospectus relating to the offering containing material information about the undersigned registrant or its securities provided by or on behalf of the undersigned registrant; and
(iv) any other communication that is an offer in the offering made by the undersigned registrant to the purchaser.
The undersigned registrant hereby undertakes that, for purposes of determining any liability under the Securities Act of 1933, each filing of the registrant's annual report pursuant to Section 13(a) or Section 15(d) of the Securities Exchange Act of 1934 (and, where applicable, each filing of an employee benefit plan's annual report pursuant to Section 15(d) of the Securities Exchange Act of 1934) that is incorporated by reference in the registration statement shall be deemed to be a new registration statement relating to the securities offered therein, and the offering of such securities at that time shall be deemed to be the initial bona fide offering thereof.
Insofar as indemnification for liabilities arising under the Securities Act may be permitted to directors, officers and controlling persons of the Registrant pursuant to the foregoing provisions, or otherwise, the Registrant has been advised that in the opinion of the SEC such indemnification is against public policy as expressed in the Act and is therefore unenforceable. In the event that a claim for indemnification against such liabilities (other than the payment by the Registrant of expenses incurred or paid by a director, officer or controlling person of the Registrant in the successful defense of any action, suit or proceeding) is asserted by such director, officer or controlling person in connection with the securities being registered, the Registrant will, unless in the opinion of its counsel the matter has been settled by controlling precedent, submit to a court of appropriate jurisdiction the question whether such indemnification by it is against public policy as expressed in the Act and will be governed by the final adjudication of such issue.
II-9
The undersigned registrant hereby undertakes that:
For purposes of determining any liability under the Securities Act of 1933, as amended, the information omitted from a form of prospectus filed as part of this registration statement in reliance upon Rule 430A and contained in the form of prospectus filed by the Registrant pursuant to Rule 424(b)(1) or (4) or 497(h) under the Securities Act of 1933, as amended, shall be deemed to be part of this registration statement as of the time it was declared effective.
For the purpose of determining any liability under the Securities Act of 1933, as amended, each post-effective amendment that contains a form of prospectus shall be deemed to be a new registration statement relating to the securities offered therein, and the offering of such securities at that time shall be deemed to be the initial bona fide offering thereof.
II-10
SIGNATURES
Pursuant to the requirements of the Securities Act of 1933, the registrant has duly caused this Post-Effective Amendment No. 1 to the Registration Statement on Form S-1 to be signed on its behalf by the undersigned, thereunto duly authorized, in the City of Gaithersburg, State of Maryland, on April 4, 2018.
| OPGEN, INC. | |||
| By: | /s/ Evan Jones | ||
| Evan Jones | |||
| Chief Executive Officer | |||
Pursuant to the requirements of the Securities Act of 1933, as amended, this Post-Effective Amendment No. 1 to the Registration Statement has been signed by the following person in the capacities and on the date indicated.
| Signature | Title | Date |
| /s/ Evan Jones | Chief Executive Officer and Director (principal executive officer) | April 4, 2018 |
| Evan Jones | ||
| /s/ Timothy C. Dec | Chief Financial Officer (principal financial officer and | April 4, 2018 |
| Timothy C. Dec | principal accounting officer) | |
| * | Director | April 4, 2018 |
| Harry J. D'Andrea | ||
| * | Director | April 4, 2018 |
| Timothy J.R. Harris | ||
| * | Director | April 4, 2018 |
| Tina S. Nova | ||
| Director | April 4, 2018 | |
| David M. Rubin | ||
| * | Director | April 4, 2018 |
| Misti Ushio | ||
| * /s/ Timothy C. Dec | April 4, 2018 | |
| Timothy C. Dec, as attorney in fact |
II-11