As filed with the Securities and Exchange Commission on December 22, 2016
UNITED STATES
SECURITIES AND EXCHANGE COMMISSION
Washington, D.C. 20549
FORM N-CSR
CERTIFIED SHAREHOLDER REPORT OF REGISTERED
MANAGEMENT INVESTMENT COMPANIES
Investment Company Act file number 811-21597
PRIMECAP Odyssey Funds
(Exact name of registrant as specified in charter)
177 East Colorado Boulevard, 11th Floor
Pasadena, CA 91105
(Address of principal executive offices) (Zip code)
Michael J. Ricks
PRIMECAP Management Company
177 East Colorado Boulevard, 11th Floor
Pasadena, CA 91105
(Name and address of agent for service)
(626) 304-9222
Registrant’s telephone number, including area code
Date of fiscal year end: October 31
Date of reporting period: October 31, 2016
Item 1. Reports to Stockholders.
Item 1. Reports to Stockholders.
ANNUAL REPORT
For the Year Ended October 31, 2016

PRIMECAP ODYSSEY STOCK (POSKX)
PRIMECAP ODYSSEY GROWTH (POGRX)
PRIMECAP ODYSSEY AGGRESSIVE GROWTH (POAGX)
| | |
 | | Table of Contents PRIMECAP Odyssey Funds |
1
| | |
| | Letter to Shareholders PRIMECAP Odyssey Funds |
Dear Fellow Shareholders,
For the fiscal year ended October 31, 2016, the PRIMECAP Odyssey Stock Fund, PRIMECAP Odyssey Growth Fund, and PRIMECAP Odyssey Aggressive Growth Fund produced total returns of +3.52%, +4.31%, and +7.90%, respectively, while the unmanaged S&P 500 Index produced a total return of +4.51%. Sector weightings hurt relative returns in all three funds, while each fund benefitted from stock selection.
The PRIMECAP Odyssey Funds will each distribute capital gains in December 2016. The sizeable gains in the Aggressive Growth Fund are primarily long-term and are mainly due to acquisitions, most notably Dyax and Dreamworks, at substantial premiums to the fund’s cost basis. In addition, the Stock Fund and the Growth Fund have realized capital gains from both acquisitions and sale of stocks. We remain mindful of the tax consequences of our investment decisions. As long-term investors, we typically hold stocks for years, not months, which helps minimize capital gains distributions.
The outperformance of large capitalization growth funds in calendar year 2015, which had largely been driven by a small number of very widely-held stocks such as Amazon and Facebook, came to an end in early 2016 as fears of a global recession resulted in a flight to perceived safe haven investments. Amidst broader market declines, defensive sectors such as consumer staples, telecommunication services, and utilities outperformed. Financials were especially hard hit as investors anticipated lower economic growth and interest rates. As investors grew more confident in the economic outlook, commodity prices rallied, driving energy and materials stocks higher. Towards the end of the fiscal year, information technology stocks led the market as defensive sectors retraced some of their earlier gains. Health care was the worst-performing sector during the fiscal year ended October 31, 2016 with a -4.0% total return, ending a five-year streak of outperformance.
Each of the PRIMECAP Odyssey Funds was overweight in health care, information technology, and, to a lesser extent, industrials stocks throughout the fiscal year. While the S&P 500 health care sector underperformed significantly during fiscal 2016, each fund’s health care holdings outperformed the sector, and the Aggressive Growth Fund’s health care holdings also outperformed the S&P 500 index return. Each fund’s information technology holdings added significantly to returns through the combination of an overweight position (information technology stocks outperformed) and favorable stock selection. Conversely, each fund’s industrials holdings detracted from relative results, largely due to the underperformance of airline stocks during fiscal 2016. This impact was most pronounced in the Aggressive Growth Fund due to its higher weighting in airlines relative to the other two funds.
A more detailed discussion of the results of each PRIMECAP Odyssey Fund follows.
PRIMECAP Odyssey Stock Fund
For the fiscal year ended October 31, 2016, the Stock Fund’s total return of +3.52% lagged the S&P 500’s total return of +4.51%.
2
Letter to Shareholders
PRIMECAP Odyssey Funds
continued
Strong results in information technology, which returned +14.6% compared to the +10.8% index return, were offset by slightly negative relative results in most other sectors. Within information technology, the fund’s semiconductor holdings, led by Texas Instruments (+27%), NVIDIA (+154%), and Applied Materials (+77%), and hardware holdings, led by Hewlett Packard Enterprise (+57%), were partially offset by the fund’s communications equipment holdings, driven by Ericsson (-48%). The worst-performing groups during the fiscal year were specialty retail (-13%), pharmaceuticals (-5%), airlines (-9%), and aerospace and defense (-7%). The most significant negative contributors in these areas included Ascena Retail Group (-63%) and L Brands (-21%) in specialty retail, Eli Lilly (-7%), Roche (-13%), and Novartis (-19%) in pharmaceuticals, Southwest Airlines (-13%) in airlines, and Airbus Group (-13%) in aerospace and defense. Specialty retailers, particularly those with large footprints in shopping malls, are struggling to remain relevant as consumers increasingly purchase apparel and other goods online.
The top 10 holdings, which collectively represented 28.0% of the portfolio at the period end, are listed below:
| | | | |
PRIMECAP Odyssey Stock Fund Top 10 Holdings as of 10/31/16 | | Ending % of
Total Portfolio* | |
JPMorgan Chase & Co. | | | 4.0 | |
Eli Lilly and Company | | | 3.8 | |
Hewlett Packard Enterprise Co. | | | 3.0 | |
FedEx Corporation | | | 2.9 | |
Southwest Airlines Co. | | | 2.6 | |
American Airlines Group, Inc. | | | 2.6 | |
NetApp, Inc. | | | 2.5 | |
Carnival Corporation | | | 2.3 | |
Amgen Inc. | | | 2.2 | |
Wells Fargo & Company | | | 2.1 | |
Total % of Portfolio | | | 28.0 | |
| | * | The percentage is calculated by using the ending market value of the security divided by the ending market value of the total investments of the Fund. |
PRIMECAP Odyssey Growth Fund
For the fiscal year ended October 31, 2016, the Growth Fund’s total return was +4.31%, below the S&P 500’s total return of +4.51% but ahead of the Russell 1000 Growth Index’s total return of +2.28%.
3
Letter to Shareholders
PRIMECAP Odyssey Funds
continued
Strong results in information technology, which returned +13.4% compared to the +10.8% S&P 500 index return, were offset by underperformance in industrials and consumer discretionary. Within information technology, the fund’s semiconductor holdings, led by Texas Instruments (+27%), NVIDIA (+154%), and Applied Materials (+77%), and software holdings, led by Ellie Mae (+45%) and Adobe (+21%), were partially offset by the fund’s communications equipment holdings, driven by Ericsson (-48%). The Growth Fund’s industrials holdings detracted from relative results due to the fund’s overweight position in airlines. Underperformance in consumer discretionary was the result of declines in the fund’s specialty retail (-19%) and leisure (-17%) holdings, which were only partially offset by Dreamworks, which returned +102% as the company was acquired by Comcast. In the leisure area, the fund’s poor performance was driven by its cruise line holdings, especially Norwegian Cruise Lines (-39%). We remain bullish on the cruise line industry due to favorable demographic trends, the strong value proposition cruises offer relative to land-based vacations, an attractive industry structure characterized by a small number of global players, and currently low valuations. The potential entry of Chinese players over the long term represents a risk that we continue to monitor.
The top 10 holdings, which collectively represented 28.8% of the portfolio at the period end, are listed below:
| | | | |
PRIMECAP Odyssey Growth Fund Top 10 Holdings as of 10/31/16 | | Ending % of
Total Portfolio* | |
Seattle Genetics, Inc. | | | 4.4 | |
Eli Lilly and Company | | | 3.6 | |
American Airlines Group, Inc. | | | 3.2 | |
ABIOMED, Inc. | | | 3.0 | |
Amgen Inc. | | | 2.9 | |
Alphabet Inc. | | | 2.8 | |
Biogen Inc. | | | 2.3 | |
Alibaba Group Ltd. Sponsored ADR | | | 2.3 | |
Adobe Systems Incorporated | | | 2.2 | |
Microsoft Corporation | | | 2.1 | |
Total % of Portfolio | | | 28.8 | |
| | * | The percentage is calculated by using the ending market value of the security divided by the ending market value of the total investments of the Fund. |
4
Letter to Shareholders
PRIMECAP Odyssey Funds
continued
PRIMECAP Odyssey Aggressive Growth Fund
For the fiscal year ended October 31, 2016, the Aggressive Growth Fund’s total return of +7.90% exceeded both the S&P 500’s total return of +4.51% and the Russell Midcap Growth Index’s total return of +0.40%.
Strong results in information technology, health care, financials, and consumer discretionary were only partially offset by weak results in industrials. Ellie Mae (+45%) and NVIDIA (+154%) were the most significant positive contributors in information technology and more than offset the decline in comScore (-33%). Dyax (+39%), which was acquired by Shire, and ABIOMED (+43%) accounted for much of the fund’s outperformance in health care, while MarketAxess (+50%) was the key contributor in financials. Dreamworks (+102%) accounted for most of the fund’s outperformance in consumer discretionary.
The top 10 holdings, which collectively represented 29.4% of the portfolio at the period end, are listed below:
| | | | |
PRIMECAP Odyssey Aggressive Growth Fund Top 10 Holdings as of 10/31/16 | | Ending % of
Total Portfolio* | |
Ellie Mae, Inc. | | | 4.0 | |
Sony Corporation Sponsored ADR | | | 3.6 | |
ABIOMED, Inc. | | | 3.3 | |
American Airlines Group, Inc. | | | 3.3 | |
Seattle Genetics, Inc. | | | 3.0 | |
United Continental Holdings, Inc. | | | 2.7 | |
Alphabet Inc. | | | 2.5 | |
Blackberry Limited | | | 2.4 | |
Nektar Therapeutics | | | 2.3 | |
Delta Air Lines, Inc. | | | 2.3 | |
Total % of Portfolio | | | 29.4 | |
| | * | The percentage is calculated by using the ending market value of the security divided by the ending market value of the total investments of the Fund. |
Outlook
With the U.S. elections in the rear-view mirror, we are hopeful that American business leaders will feel more confident in their ability to make long-term investment decisions than they have felt since the end of the financial crisis. Time and time again over the past several years, we have heard management teams tell us that they have been reluctant to commit to long-term investments due to a high degree of uncertainty regarding how they might be affected by new regulations.
5
Letter to Shareholders
PRIMECAP Odyssey Funds
continued
The United States benefits from tremendous advantages, including vast physical assets, a highly diversified economy, an unparalleled military capability, and a culture that encourages risk-taking and applauds success. With these advantages, the U.S. economy should be capable of growing rapidly. While we are concerned by some of the nativist and protectionist policies articulated in the run-up to the recent elections, we are hopeful that the new administration will promote economic growth through policies such as lighter regulation and lower taxes. With likely Congressional support, such policies could realistically be implemented over the next couple of years, which we believe would be favorable for the U.S. economy and stock market.
As previously discussed, each of the PRIMECAP Odyssey Funds is overweight in health care, information technology, and industrials stocks. Within the health care sector, our investments are concentrated in the bio-pharmaceutical, medical device, and life science tool industries. We remain optimistic about the long-term potential of our investments in these industries. The significance of ongoing advances in genomics cannot be overstated, as we expect the more fundamental understanding of disease that will ensue over the coming years to result in far more effective therapies. Personalized medicine, enabled by exponential declines in genetic sequencing costs, is already becoming a reality, and new gene editing technologies appear to hold significant long-term potential. In the shorter term, our optimism in the bio-pharmaceutical area is tempered by unfavorable industry dynamics such as a highly consolidated customer base and a distribution system that encourages artificially high list prices for therapies that in turn invites regulatory scrutiny and political backlash. With these dynamics likely to exert pressure on the prices of existing therapies, we are increasingly focused on companies with truly innovative products in their pipelines that we believe will command prices that reflect the value they provide to patients.
Our investments in information technology reflect our belief that technology will continue to play an increasing role in people’s everyday lives. Companies in virtually all industries are currently “digitizing” their products, services, and processes to incorporate the unprecedented access to real-time information enabled by cloud computing, mobility, and social networking platforms. Looking ahead, we expect rapid advances in artificial intelligence technologies to change the way products and services are developed and consumed, and we are positioning the funds to potentially benefit from these changes.
Last, but not least, we continue to believe that our airline investments have the potential to appreciate substantially from current levels. These stocks trade at extremely low valuations relative to their current and prospective earnings, which suggests that the market believes such earnings are unlikely to be sustained. We have a more sanguine view, as we expect supply to adjust to demand as management teams focus on profit maximization.
As always, we acknowledge that our long-term, bottom-up approach to investing can result in large deviations between the performance of our funds and that of the broader market. We nonetheless continue to believe that this approach can generate superior results for our shareholders over the long term.
Sincerely,
PRIMECAP Management Company
November 18, 2016
6
Letter to Shareholders
PRIMECAP Odyssey Funds
continued
Past performance is not a guarantee of future results.
The funds invest in smaller companies, which involve additional risks such as limited liquidity and greater volatility. All funds may invest in foreign securities, which involves greater volatility and political, economic and currency risks and differences in accounting methods. Mutual fund investing involves risk, and loss of principal is possible. Growth stocks typically are more volatile than value stocks; however, value stocks have a lower expected growth rate in earnings and sales.
Please refer to the Schedule of Investments for details of fund holdings. Fund holdings and sector allocations are subject to change at any time and are not recommendations to buy or sell any security.
The S&P 500 is a market capitalization-weighted index of 500 large-capitalization stocks commonly used to represent the U.S. equity market. The Russell 1000 Growth Index is an index that measures the performance of those Russell 1000 companies with higher price-to-book ratios and higher forecasted growth values (the Russell 1000 Index measures the performance of the large-cap segment of the U.S. equity universe). The Russell Midcap Growth Index measures the performance of those Russell Midcap companies with higher price-to-book ratios and higher forecasted growth values. You cannot invest directly in an index.
Earnings growth is not a prediction of a fund’s future performance.
The information provided herein represents the opinions of PRIMECAP Management Company and is not intended to be a forecast of future events, a guarantee of future results, or investment advice.
Nothing contained on this communication constitutes tax, legal, or investment advice. Investors must consult their tax advisor or legal counsel for advice and information concerning their particular situation.
7
| | |
| | Performance Graphs PRIMECAP Odyssey Stock Fund |
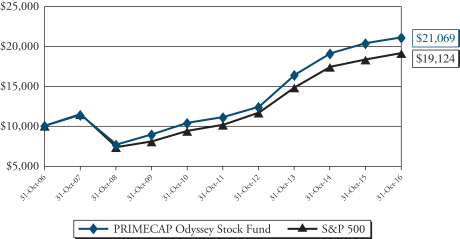
The following chart compares the value of a hypothetical $10,000 investment in the PRIMECAP Odyssey Stock Fund from October 31, 2006 to October 31, 2016, compared to the S&P 500. This chart illustrates the performance of a hypothetical $10,000 investment made October 31, 2006 and is not intended to imply any future performance. The returns shown do not reflect the deduction of taxes that a shareholder would pay on fund distributions or the redemption of fund shares. The chart assumes reinvestment of capital gains and dividends.
| | | | | | | | | | | | | | | | |
| | | Total Return
Period Ended October 31, 2016 | |
| | | 1 Year | | | Annualized
5 Year | | | Annualized
10 Year | | | Annualized
Since Inception^ | |
Stock Fund | | | 3.52% | | | | 13.67% | | | | 7.74% | | | | 9.10% | |
S&P 500* | | | 4.51% | | | | 13.57% | | | | 6.70% | | | | 7.64% | |
Performance data quoted represents past performance and does not guarantee future results. The investment return and principal value of an investment will fluctuate so that an investor’s shares, when redeemed, may be worth more or less than their original cost. Current performance of the fund may be lower or higher than the performance quoted. Performance data current to the most recent month end may be obtained by calling 1-800-729-2307.
| | * | The S&P 500 is a market capitalization-weighted index of 500 large-capitalization stocks commonly used to represent the U.S. equity market. |
8
| | |
| | Performance Graphs PRIMECAP Odyssey Growth Fund |
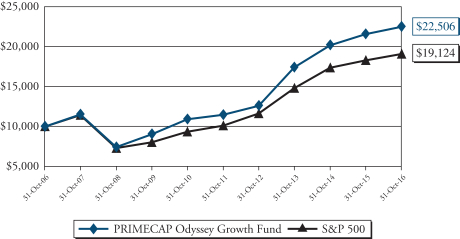
The following chart compares the value of a hypothetical $10,000 investment in the PRIMECAP Odyssey Growth Fund from October 31, 2006 to October 31, 2016, compared to the S&P 500. This chart illustrates the performance of a hypothetical $10,000 investment made October 31, 2006 and is not intended to imply any future performance. The returns shown do not reflect the deduction of taxes that a shareholder would pay on fund distributions or the redemption of fund shares. The chart assumes reinvestment of capital gains and dividends.
| | | | | | | | | | | | | | | | |
| | | Total Return
Period Ended October 31, 2016 | |
| | | 1 Year | | | Annualized
5 Year | | | Annualized
10 Year | | | Annualized
Since Inception^ | |
Growth Fund | | | 4.31% | | | | 14.40% | | | | 8.45% | | | | 9.89% | |
S&P 500* | | | 4.51% | | | | 13.57% | | | | 6.70% | | | | 7.64% | |
Performance data quoted represents past performance and does not guarantee future results. The investment return and principal value of an investment will fluctuate so that an investor’s shares, when redeemed, may be worth more or less than their original cost. Current performance of the fund may be lower or higher than the performance quoted. Performance data current to the most recent month end may be obtained by calling 1-800-729-2307.
| | * | The S&P 500 is a market capitalization-weighted index of 500 large-capitalization stocks commonly used to represent the U.S. equity market. |
9
| | |
| | Performance Graphs PRIMECAP Odyssey Aggressive Growth Fund |
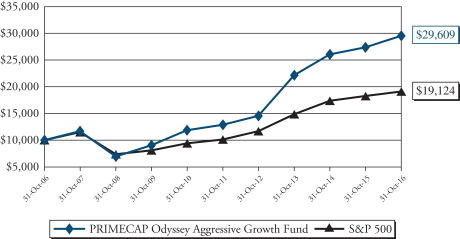
The following chart compares the value of a hypothetical $10,000 investment in the PRIMECAP Odyssey Aggressive Growth Fund from October 31, 2006 to October 31, 2016, compared to the S&P 500. This chart illustrates the performance of a hypothetical $10,000 investment made October 31, 2006 and is not intended to imply any future performance. The returns shown do not reflect the deduction of taxes that a shareholder would pay on fund distributions or the redemption of fund shares. The chart assumes reinvestment of capital gains and dividends.
| | | | | | | | | | | | | | | | |
| | | Total Return
Period Ended October 31, 2016 | |
| | | 1 Year | | | Annualized
5 Year | | | Annualized
10 Year | | | Annualized
Since Inception^ | |
Aggressive Growth Fund | | | 7.90% | | | | 18.15% | | | | 11.47% | | | | 12.53% | |
S&P 500* | | | 4.51% | | | | 13.57% | | | | 6.70% | | | | 7.64% | |
Performance data quoted represents past performance and does not guarantee future results. The investment return and principal value of an investment will fluctuate so that an investor’s shares, when redeemed, may be worth more or less than their original cost. Current performance of the fund may be lower or higher than the performance quoted. Performance data current to the most recent month end may be obtained by calling 1-800-729-2307.
| | * | The S&P 500 is a market capitalization-weighted index of 500 large-capitalization stocks commonly used to represent the U.S. equity market. |
10
| | |
| | Sector Breakdown PRIMECAP Odyssey Funds |
PRIMECAP Odyssey Stock Fund
| | | | |
Consumer Discretionary | | | 12.4% | |
Consumer Staples | | | 1.3% | |
Energy | | | 0.8% | |
Financials | | | 12.4% | |
Health Care | | | 19.6% | |
Industrials | | | 16.6% | |
Information Technology | | | 30.8% | |
Materials | | | 1.2% | |
Telecommunication Services | | | 0.1% | |
Utilities | | | 0.3% | |
Short-Term Investments, net of Other Liabilities | | | 4.5% | |
Total | | | 100.0% | |
PRIMECAP Odyssey Growth Fund
| | | | |
Consumer Discretionary | | | 12.3% | |
Consumer Staples | | | 0.3% | |
Energy | | | 0.4% | |
Financials | | | 7.3% | |
Health Care | | | 31.3% | |
Industrials | | | 11.9% | |
Information Technology | | | 31.6% | |
Materials | | | 0.8% | |
Rights (Health Care) | | | 0.0% | |
Short-Term Investments, net of Other Liabilities | | | 4.1% | |
Total | | | 100.0% | |
The tables above list sector allocations as a percentage of each fund’s total net assets as of October 31, 2016. The management report may make reference to average allocations during the period. As a result, the sector allocations above may differ from those discussed in the management report.
11
Sector Breakdown
PRIMECAP Odyssey Funds
continued
PRIMECAP Odyssey Aggressive Growth Fund
| | | | |
Consumer Discretionary | | | 15.0% | |
Consumer Staples | | | 0.0% | |
Energy | | | 0.5% | |
Financials | | | 3.5% | |
Health Care | | | 28.7% | |
Industrials | | | 14.5% | |
Information Technology | | | 30.9% | |
Materials | | | 0.8% | |
Telecommunication Services | | | 2.1% | |
Rights (Health Care) | | | 0.1% | |
Short-Term Investments, net of Other Liabilities | | | 3.9% | |
Total | | | 100.0% | |
The table above lists sector allocations as a percentage of the fund’s total net assets as of October 31, 2016. The management report may make reference to average allocations during the period. As a result, the sector allocations above may differ from those discussed in the management report.
12
| | |
| | Schedule of Investments PRIMECAP Odyssey Stock Fund October 31, 2016 |
| | | | | | | | |
| Shares | | | | | Value | |
| | COMMON STOCKS – 95.5% | | | | |
| Consumer Discretionary – 12.4% | |
| | 22,550 | | | Adient PLC (a) | | $ | 1,026,251 | |
| | 4,100,000 | | | Ascena Retail Group, Inc. (a) | | | 20,049,000 | |
| | 73,200 | | | Bed Bath & Beyond, Inc. | | | 2,958,744 | |
| | 1,669,100 | | | CarMax, Inc. (a) | | | 83,354,854 | |
| | 2,634,600 | | | Carnival Corp. | | | 129,358,860 | |
| | 221,000 | | | Comcast Corp. – Class A | | | 13,662,220 | |
| | 238,000 | | | Garmin Ltd. | | | 11,509,680 | |
| | 813,600 | | | L Brands, Inc. | | | 58,733,784 | |
| | 595,382 | | | Las Vegas Sands Corp. | | | 34,460,710 | |
| | 10,000 | | | McDonald’s Corp. | | | 1,125,700 | |
| | 1,426,000 | | | Ross Stores, Inc. | | | 89,182,040 | |
| | 381,000 | | | Royal Caribbean Cruises Ltd. | | | 29,287,470 | |
| | 3,719,000 | | | Sony Corp. – ADR | | | 116,516,270 | |
| | 160,000 | | | TJX Cos., Inc. | | | 11,800,000 | |
| | 1,342,200 | | | Tribune Media Co. – Class A | | | 43,755,720 | |
| | 1,816,600 | | | tronc, Inc. | | | 21,853,698 | |
| | 180,000 | | | V.F. Corp. | | | 9,757,800 | |
| | 225,000 | | | Walt Disney Co. (The) | | | 20,855,250 | |
| | 11,994 | | | Whirlpool Corp. | | | 1,796,941 | |
| | | | | | | | |
| | | | | | | 701,044,992 | |
| | | | | | | | |
| Consumer Staples – 1.3% | | | |
| | 283,000 | | | CVS Health Corp. | | | 23,800,300 | |
| | 70,000 | | | Kellogg Co. | | | 5,259,100 | |
| | 150,000 | | | PepsiCo, Inc. | | | 16,080,000 | |
| | 370,000 | | | Tyson Foods, Inc. – Class A | | | 26,214,500 | |
| | | | | | | | |
| | | | | | | 71,353,900 | |
| | | | | | | | |
| Energy – 0.8% | | | |
| | 20,000 | | | EOG Resources, Inc. | | | 1,808,400 | |
| | 95,000 | | | Exxon Mobil Corp. | | | 7,915,400 | |
| | 45,000 | | | National Oilwell Varco, Inc. | | | 1,444,500 | |
| | 60,000 | | | Range Resources Corp. | | | 2,027,400 | |
| | 241,534 | | | Schlumberger Ltd. | | | 18,895,205 | |
| | 825,000 | | | Southwestern Energy Co. (a) | | | 8,571,750 | |
| | 751,300 | | | Transocean Ltd. | | | 7,219,993 | |
| | | | | | | | |
| | | | | | | 47,882,648 | |
| | | | | | | | |
| Financials – 12.4% | | | |
| | 75,000 | | | American Express Co. | | | 4,981,500 | |
| | 3,306,900 | | | Charles Schwab Corp. (The) | | | 104,828,730 | |
The accompanying notes are an integral part of these financial statements.
13
Schedule of Investments
PRIMECAP Odyssey Stock Fund
October 31, 2016 – continued
| | | | | | | | |
| Shares | | | | | Value | |
| Financials (continued) | | | |
| | 387,963 | | | CME Group, Inc. | | $ | 38,835,096 | |
| | 213,400 | | | CNA Financial Corp. | | | 7,804,038 | |
| | 1,398,700 | | | Discover Financial Services | | | 78,788,771 | |
| | 3,291,149 | | | JPMorgan Chase & Co. | | | 227,944,980 | |
| | 484,950 | | | Marsh & McLennan Cos., Inc. | | | 30,740,981 | |
| | 281,600 | | | Mercury General Corp. | | | 15,338,752 | |
| | 469,800 | | | Northern Trust Corp. | | | 34,022,916 | |
| | 1,250,600 | | | Progressive Corp. (The) | | | 39,406,406 | |
| | 2,567,508 | | | Wells Fargo & Co. | | | 118,131,043 | |
| | | | | | | | |
| | | | | | | 700,823,213 | |
| | | | | | | | |
| Health Care – 19.6% | | | |
| | 1,125,900 | | | Abbott Laboratories | | | 44,180,316 | |
| | 238,000 | | | AbbVie, Inc. | | | 13,275,640 | |
| | 1,257,000 | | | Agilent Technologies, Inc. | | | 54,767,490 | |
| | 888,300 | | | Amgen, Inc. | | | 125,392,428 | |
| | 2,678,200 | | | AstraZeneca PLC – ADR | | | 75,846,624 | |
| | 329,400 | | | Biogen, Inc. (a) | | | 92,291,292 | |
| | 117,900 | | | Boston Scientific Corp. (a) | | | 2,593,800 | |
| | 2,922,200 | | | Eli Lilly & Co. | | | 215,775,248 | |
| | 266,735 | | | GlaxoSmithKline PLC – ADR | | | 10,672,067 | |
| | 311,600 | | | Johnson & Johnson | | | 36,142,484 | |
| | 569,600 | | | Medtronic PLC | | | 46,718,592 | |
| | 1,775,000 | | | Merck & Co., Inc. | | | 104,228,000 | |
| | 717,250 | | | Novartis AG – ADR | | | 50,939,095 | |
| | 1,072,391 | | | PerkinElmer, Inc. | | | 54,573,978 | |
| | 435,044 | | | Roche Holding AG – CHF | | | 100,017,695 | |
| | 344,000 | | | Sanofi – ADR | | | 13,378,160 | |
| | 436,000 | | | Thermo Fisher Scientific, Inc. | | | 64,105,080 | |
| | 33,000 | | | Zimmer Biomet Holdings, Inc. | | | 3,478,200 | |
| | | | | | | | |
| | | | | | | 1,108,376,189 | |
| | | | | | | | |
| Industrials – 16.6% | | | |
| | 1,300,000 | | | AECOM (a) | | | 36,205,000 | |
| | 1,443,500 | | | Airbus Group SE – EUR | | | 85,806,603 | |
| | 95,200 | | | Alaska Air Group, Inc. | | | 6,875,344 | |
| | 3,600,000 | | | American Airlines Group, Inc. | | | 146,160,000 | |
| | 45,000 | | | Boeing Co. (The) | | | 6,409,350 | |
| | 81,150 | | | C.H. Robinson Worldwide, Inc. | | | 5,527,938 | |
| | 317,000 | | | Caterpillar, Inc. | | | 26,456,820 | |
| | 370,000 | | | CSX Corp. | | | 11,288,700 | |
The accompanying notes are an integral part of these financial statements.
14
Schedule of Investments
PRIMECAP Odyssey Stock Fund
October 31, 2016 – continued
| | | | | | | | |
| Shares | | | | | Value | |
| Industrials (continued) | | | |
| | 228,000 | | | Curtiss-Wright Corp. | | $ | 20,433,360 | |
| | 1,033,019 | | | Deere & Co. | | | 91,215,578 | |
| | 936,900 | | | FedEx Corp. | | | 163,320,408 | |
| | 103,950 | | | Honeywell International, Inc. | | | 11,401,236 | |
| | 566,400 | | | Jacobs Engineering Group, Inc. (a) | | | 29,214,912 | |
| | 225,500 | | | Johnson Controls International PLC | | | 9,092,160 | |
| | 199,761 | | | Matson, Inc. | | | 7,978,454 | |
| | 275,000 | | | Norfolk Southern Corp. | | | 25,575,000 | |
| | 140,000 | | | Pentair PLC | | | 7,718,200 | |
| | 107,000 | | | Republic Services, Inc. | | | 5,631,410 | |
| | 844,700 | | | Ritchie Bros. Auctioneers, Inc. | | | 29,218,173 | |
| | 53,400 | | | Rockwell Automation, Inc. | | | 6,393,048 | |
| | 165,000 | | | Safran S.A. – EUR | | | 11,344,146 | |
| | 48,000 | | | Siemens AG – EUR | | | 5,451,013 | |
| | 3,690,500 | | | Southwest Airlines Co. | | | 147,804,525 | |
| | 361,300 | | | United Parcel Service, Inc. – Class B | | | 38,933,688 | |
| | 56,000 | | | United Technologies Corp. | | | 5,723,200 | |
| | | | | | | | |
| | | | | | | 941,178,266 | |
| | | | | | | | |
| Information Technology – 30.8% | | | |
| | 1,040,000 | | | Activision Blizzard, Inc. | | | 44,896,800 | |
| | 509,600 | | | Adobe Systems, Inc. (a) | | | 54,787,096 | |
| | 35,000 | | | Alphabet, Inc. – Class A (a) | | | 28,346,500 | |
| | 35,000 | | | Alphabet, Inc. – Class C (a) | | | 27,458,900 | |
| | 651,800 | | | Analog Devices, Inc. | | | 41,780,380 | |
| | 1,690,000 | | | Applied Materials, Inc. | | | 49,145,200 | |
| | 3,527,700 | | | Cisco Systems, Inc. | | | 108,229,836 | |
| | 750,000 | | | Corning, Inc. | | | 17,032,500 | |
| | 80,553 | | | Dell Technologies Inc – Class V (a) | | | 3,954,347 | |
| | 675,000 | | | Diebold, Inc. | | | 14,715,000 | |
| | 3,216,000 | | | eBay, Inc. (a) | | | 91,688,160 | |
| | 7,455,600 | | | Hewlett Packard Enterprise Co. | | | 167,527,332 | |
| | 7,679,800 | | | HP, Inc. | | | 111,280,302 | |
| | 1,474,600 | | | Intel Corp. | | | 51,419,302 | |
| | 2,415,800 | | | Keysight Technologies, Inc. (a) | | | 79,238,240 | |
| | 1,029,500 | | | KLA-Tencor Corp. | | | 77,325,745 | |
| | 8,801,300 | | | L.M. Ericsson Telephone Co. – ADR | | | 42,862,331 | |
| | 1,938,100 | | | Microsoft Corp. | | | 116,130,952 | |
| | 4,218,500 | | | NetApp, Inc. | | | 143,175,890 | |
| | 1,534,924 | | | NeuStar, Inc. – Class A (a) | | | 34,459,044 | |
The accompanying notes are an integral part of these financial statements.
15
Schedule of Investments
PRIMECAP Odyssey Stock Fund
October 31, 2016 – continued
| | | | | | | | |
| Shares | | | | | Value | |
| Information Technology (continued) | | | |
| | 555,000 | | | NVIDIA Corp. | | $ | 39,493,800 | |
| | 1,676,000 | | | PayPal Holdings, Inc. (a) | | | 69,822,160 | |
| | 1,068,405 | | | QUALCOMM, Inc. | | | 73,420,791 | |
| | 515,000 | | | Teradyne, Inc. | | | 11,994,350 | |
| | 1,607,800 | | | Texas Instruments, Inc. | | | 113,912,630 | |
| | 384,400 | | | Visa, Inc. – Class A | | | 31,716,844 | |
| | 2,333,000 | | | Yahoo!, Inc. (a) | | | 96,936,150 | |
| | | | | | | | |
| | | | | | | 1,742,750,582 | |
| | | | | | | | |
| Materials – 1.2% | | | |
| | 2,320 | | | AdvanSix, Inc. (a) | | | 37,027 | |
| | 50,000 | | | Celanese Corp. – Series A | | | 3,646,000 | |
| | 445,000 | | | Dow Chemical Co. (The) | | | 23,945,450 | |
| | 157,800 | | | E.I. du Pont de Nemours & Co. | | | 10,855,062 | |
| | 65,000 | | | Greif, Inc. – Class A | | | 3,045,900 | |
| | 25,000 | | | Lyondellbasell Industries N.V. – Class A | | | 1,988,750 | |
| | 135,900 | | | Monsanto Co. | | | 13,694,643 | |
| | 86,900 | | | Potash Corp. of Saskatchewan, Inc. | | | 1,414,732 | |
| | 180,000 | | | Schweitzer-Mauduit International, Inc. | | | 6,643,800 | |
| | | | | | | | |
| | | | | | | 65,271,364 | |
| | | | | | | | |
| Telecommunication Services – 0.1% | | | |
| | 201,270 | | | AT&T, Inc. | | | 7,404,723 | |
| | | | | | | | |
| Utilities – 0.3% | | | |
| | 372,379 | | | Public Service Enterprise Group, Inc. | | | 15,669,708 | |
| | | | | | | | |
| TOTAL COMMON STOCKS
(Cost $4,283,980,117) | | $ | 5,401,755,585 | |
| | | | | | | | |
| | | | | | | | |
The accompanying notes are an integral part of these financial statements.
16
Schedule of Investments
PRIMECAP Odyssey Stock Fund
October 31, 2016 – continued
| | | | | | | | |
| Shares | | | | | Value | |
| SHORT-TERM INVESTMENTS – 4.6% | | | |
| | 261,152,946 | | | Dreyfus Treasury Securities Cash Management Fund – 0.18% (b) | | $ | 261,152,946 | |
| | | | | | | | |
| TOTAL SHORT-TERM INVESTMENTS
(Cost $261,152,946) | | | 261,152,946 | |
| | | | | | | | |
| TOTAL INVESTMENTS
(Cost $4,545,133,063) – 100.1% | | | 5,662,908,531 | |
| Liabilities in Excess of Other Assets – (0.1)% | | | (8,637,042 | ) |
| | | | | | | | |
| TOTAL NET ASSETS – 100.0% | | $ | 5,654,271,489 | |
| | | | | | | | |
| ADR | American Depository Receipt |
| (b) | Rate quoted is seven-day yield at period end. |
The Global Industry Classification Standard (GICS®) was developed by and is the exclusive property of MSCI Inc. and Standard & Poor’s Financial Services LLC (“S&P”). GICS is a service mark of MSCI and S&P and has been licensed for use by the fund’s administrator.
The accompanying notes are an integral part of these financial statements.
17
| | |
| | Schedule of Investments PRIMECAP Odyssey Growth Fund October 31, 2016 |
| | | | | | | | |
| Shares | | | | | Value | |
| | COMMON STOCKS – 95.9% | | | | |
| Consumer Discretionary – 12.3% | | | |
| | 2,145,000 | | | Ascena Retail Group, Inc. (a) | | $ | 10,489,050 | |
| | 154,200 | | | Bed Bath & Beyond, Inc. | | | 6,232,764 | |
| | 2,303,178 | | | CarMax, Inc. (a) | | | 115,020,709 | |
| | 1,985,746 | | | Carnival Corp. | | | 97,500,128 | |
| | 558,300 | | | Gildan Activewear, Inc. | | | 14,331,561 | |
| | 76,000 | | | Hilton Worldwide Holdings, Inc. | | | 1,717,600 | |
| | 1,510,598 | | | L Brands, Inc. | | | 109,050,070 | |
| | 557,099 | | | Las Vegas Sands Corp. | | | 32,244,890 | |
| | 250,000 | | | MGM Resorts International (a) | | | 6,542,500 | |
| | 1,850,000 | | | Norwegian Cruise Line Holdings Ltd. (a) | | | 71,909,500 | |
| | 136,600 | | | Ross Stores, Inc. | | | 8,542,964 | |
| | 1,656,371 | | | Royal Caribbean Cruises Ltd. | | | 127,325,239 | |
| | 1,658,127 | | | Shutterfly, Inc. (a) | | | 81,248,223 | |
| | 3,916,000 | | | Sony Corp. – ADR | | | 122,688,280 | |
| | 126,000 | | | TJX Cos., Inc. | | | 9,292,500 | |
| | | | | | | | |
| | | | | | | 814,135,978 | |
| | | | | | | | |
| Consumer Staples – 0.3% | | | |
| | 271,300 | | | Blue Buffalo Pet Products, Inc. (a) | | | 6,815,056 | |
| | 151,000 | | | CVS Health Corp. | | | 12,699,100 | |
| | | | | | | | |
| | | | | | | 19,514,156 | |
| | | | | | | | |
| Energy – 0.4% | | | |
| | 15,000 | | | EOG Resources, Inc. | | | 1,356,300 | |
| | 70,000 | | | Frank’s International N.V. | | | 787,500 | |
| | 70,000 | | | National Oilwell Varco, Inc. | | | 2,247,000 | |
| | 70,000 | | | Range Resources Corp. | | | 2,365,300 | |
| | 72,900 | | | Schlumberger Ltd. | | | 5,702,967 | |
| | 850,000 | | | Southwestern Energy Co. (a) | | | 8,831,500 | |
| | 872,000 | | | Transocean Ltd. | | | 8,379,920 | |
| | | | | | | | |
| | | | | | | 29,670,487 | |
| | | | | | | | |
| Financials – 7.3% | | | |
| | 3,543,223 | | | Charles Schwab Corp. (The) | | | 112,320,169 | |
| | 106,000 | | | CME Group, Inc. | | | 10,610,600 | |
| | 810,200 | | | Discover Financial Services | | | 45,638,566 | |
| | 4,900,000 | | | E*TRADE Financial Corp. (a) | | | 137,984,000 | |
| | 1,490,000 | | | JPMorgan Chase & Co. | | | 103,197,400 | |
| | 390,350 | | | Marsh & McLennan Cos., Inc. | | | 24,744,287 | |
| | 557,000 | | | Progressive Corp. (The) | | | 17,551,070 | |
| | 640,000 | | | Wells Fargo & Co. | | | 29,446,400 | |
| | | | | | | | |
| | | | | | | 481,492,492 | |
| | | | | | | | |
The accompanying notes are an integral part of these financial statements.
18
Schedule of Investments
PRIMECAP Odyssey Growth Fund
October 31, 2016 – continued
| | | | | | | | |
| Shares | | | | | Value | |
| Health Care – 31.3% | | | |
| | 852,018 | | | Abbott Laboratories | | $ | 33,433,186 | |
| | 1,893,800 | | | ABIOMED, Inc. (a) | | | 198,830,062 | |
| | 2,952,200 | | | Accuray, Inc. (a) | | | 14,465,780 | |
| | 311,300 | | | Agilent Technologies, Inc. | | | 13,563,341 | |
| | 1,065,000 | | | Alkermes PLC (a) | | | 53,686,650 | |
| | 1,365,000 | | | Amgen, Inc. | | | 192,683,400 | |
| | 1,130,800 | | | AstraZeneca PLC – ADR | | | 32,024,256 | |
| | 538,900 | | | Biogen, Inc. (a) | | | 150,989,002 | |
| | 382,700 | | | BioMarin Pharmaceutical, Inc. (a) | | | 30,815,004 | |
| | 1,053,800 | | | Boston Scientific Corp. (a) | | | 23,183,600 | |
| | 1,061,100 | | | Cepheid, Inc. (a) | | | 56,132,190 | |
| | 3,267,400 | | | Eli Lilly & Co. | | | 241,264,816 | |
| | 2,395,543 | | | Epizyme, Inc. (a) | | | 21,679,664 | |
| | 460,400 | | | Illumina, Inc. (a) | | | 62,678,856 | |
| | 4,509,000 | | | ImmunoGen, Inc. (a) (b) | | | 8,206,380 | |
| | 2,717,421 | | | Insulet Corp. (a) | | | 100,870,668 | |
| | 307,337 | | | Johnson & Johnson | | | 35,648,019 | |
| | 494,150 | | | Medtronic PLC | | | 40,530,183 | |
| | 700,000 | | | Merck & Co., Inc. | | | 41,104,000 | |
| | 578,000 | | | Momenta Pharmaceuticals, Inc. (a) | | | 6,444,700 | |
| | 6,150,656 | | | Nektar Therapeutics (a) | | | 76,268,135 | |
| | 516,350 | | | Novartis AG – ADR | | | 36,671,177 | |
| | 200,000 | | | NuVasive, Inc. (a) | | | 11,946,000 | |
| | 200,000 | | | OraSure Technologies, Inc. (a) | | | 1,502,000 | |
| | 361,000 | | | PerkinElmer, Inc. | | | 18,371,290 | |
| | 3,177,614 | | | QIAGEN N.V. (a) | | | 77,470,229 | |
| | 586,500 | | | Roche Holding AG – CHF | | | 134,837,805 | |
| | 5,698,862 | | | Seattle Genetics, Inc. (a) | | | 294,631,165 | |
| | 316,000 | | | Thermo Fisher Scientific, Inc. | | | 46,461,480 | |
| | 49,200 | | | Waters Corp. (a) | | | 6,845,688 | |
| | 12,500 | | | Zimmer Biomet Holdings, Inc. | | | 1,317,500 | |
| | | | | | | | |
| | | | | | | 2,064,556,226 | |
| | | | | | | | |
| Industrials – 11.9% | | | |
| | 1,325,000 | | | AECOM (a) | | | 36,901,250 | |
| | 737,700 | | | Airbus Group SE – EUR | | | 43,851,424 | |
| | 5,180,201 | | | American Airlines Group, Inc. | | | 210,316,161 | |
| | 430,100 | | | Avis Budget Group, Inc. (a) | | | 13,918,036 | |
| | 55,700 | | | Caterpillar, Inc. | | | 4,648,722 | |
| | 145,000 | | | CIRCOR International, Inc. | | | 7,798,100 | |
The accompanying notes are an integral part of these financial statements.
19
Schedule of Investments
PRIMECAP Odyssey Growth Fund
October 31, 2016 – continued
| | | | | | | | |
| Shares | | | | | Value | |
| Industrials (continued) | | | |
| | 274,000 | | | Curtiss-Wright Corp. | | $ | 24,555,880 | |
| | 1,460,000 | | | Delta Air Lines, Inc. | | | 60,984,200 | |
| | 200,000 | | | FedEx Corp. | | | 34,864,000 | |
| | 177,000 | | | IDEX Corp. | | | 15,299,880 | |
| | 1,150,794 | | | Jacobs Engineering Group, Inc. (a) | | | 59,357,954 | |
| | 1,377,550 | | | JetBlue Airways Corp. (a) | | | 24,079,574 | |
| | 489,000 | | | Ritchie Bros. Auctioneers, Inc. | | | 16,914,510 | |
| | 2,997,700 | | | Southwest Airlines Co. | | | 120,057,885 | |
| | 1,838,900 | | | United Continental Holdings, Inc. (a) | | | 103,401,347 | |
| | 86,000 | | | United Parcel Service, Inc. – Class B | | | 9,267,360 | |
| | | | | | | | |
| | | | | | | 786,216,283 | |
| | | | | | | | |
| Information Technology – 31.6% | | | |
| | 1,328,850 | | | Adobe Systems, Inc. (a) | | | 142,864,663 | |
| | 1,478,000 | | | Alibaba Group Holding Ltd. – ADR (a) | | | 150,297,820 | |
| | 116,067 | | | Alphabet, Inc. – Class A (a) | | | 94,002,663 | |
| | 115,530 | | | Alphabet, Inc. – Class C (a) | | | 90,637,906 | |
| | 137,000 | | | Analog Devices, Inc. | | | 8,781,700 | |
| | 51,700 | | | Applied Materials, Inc. | | | 1,503,436 | |
| | 250,000 | | | ASML Holding N.V. | | | 26,405,000 | |
| | 15,046,850 | | | BlackBerry Ltd. (a) | | | 106,080,293 | |
| | 1,515,900 | | | Cisco Systems, Inc. | | | 46,507,812 | |
| | 350,000 | | | Corning, Inc. | | | 7,948,500 | |
| | 1,320,100 | | | Cree, Inc. (a) | | | 29,438,230 | |
| | 242,818 | | | Dell Technologies Inc – Class V (a) | | | 11,919,936 | |
| | 164,300 | | | eBay, Inc. (a) | | | 4,684,193 | |
| | 235,000 | | | Electronic Arts, Inc. (a) | | | 18,452,200 | |
| | 664,000 | | | Ellie Mae, Inc. (a) | | | 70,310,960 | |
| | 5,058,700 | | | Flextronics International Ltd. (a) | | | 71,782,953 | |
| | 624,718 | | | FormFactor, Inc. (a) | | | 5,606,844 | |
| | 2,950,700 | | | Hewlett Packard Enterprise Co. | | | 66,302,229 | |
| | 3,314,700 | | | HP, Inc. | | | 48,030,003 | |
| | 1,621,200 | | | Intel Corp. | | | 56,531,244 | |
| | 105,000 | | | Intuit, Inc. | | | 11,417,700 | |
| | 725,000 | | | Jabil Circuit, Inc. | | | 15,471,500 | |
| | 993,150 | | | Keysight Technologies, Inc. (a) | | | 32,575,320 | |
| | 742,000 | | | KLA-Tencor Corp. | | | 55,731,620 | |
| | 7,654,600 | | | L.M. Ericsson Telephone Co. – ADR | | | 37,277,902 | |
| | 6,280,000 | | | Micron Technology, Inc. (a) | | | 107,764,800 | |
| | 2,358,100 | | | Microsoft Corp. | | | 141,297,352 | |
The accompanying notes are an integral part of these financial statements.
20
Schedule of Investments
PRIMECAP Odyssey Growth Fund
October 31, 2016 – continued
| | | | | | | | |
| Shares | | | | | Value | |
| Information Technology (continued) | | | |
| | 3,567,354 | | | NetApp, Inc. | | $ | 121,075,995 | |
| | 1,653,100 | | | NeuStar, Inc. – Class A (a) | | | 37,112,095 | |
| | 1,620,000 | | | Nuance Communications, Inc. (a) | | | 22,712,400 | |
| | 683,000 | | | NVIDIA Corp. | | | 48,602,280 | |
| | 1,034,200 | | | QUALCOMM, Inc. | | | 71,070,224 | |
| | 160,000 | | | Rambus, Inc. (a) | | | 1,950,400 | |
| | 2,405,972 | | | Stratasys Ltd. (a) | | | 46,002,185 | |
| | 1,751,395 | | | Texas Instruments, Inc. | | | 124,086,336 | |
| | 893,600 | | | Trimble Navigation Ltd. (a) | | | 24,699,104 | |
| | 810,000 | | | Visa, Inc. – Class A | | | 66,833,100 | |
| | 415,000 | | | VMware, Inc. – Class A (a) | | | 32,619,000 | |
| | 120,380 | | | Western Digital Corp. | | | 7,035,007 | |
| | 585,000 | | | Yahoo!, Inc. (a) | | | 24,306,750 | |
| | | | | | | | |
| | | | | | | 2,087,729,655 | |
| | | | | | | | |
| Materials – 0.8% | | | |
| | 394,500 | | | Monsanto Co. | | | 39,753,765 | |
| | 100,000 | | | Praxair, Inc. | | | 11,706,000 | |
| | | | | | | | |
| | | | | | | 51,459,765 | |
| | | | | | | | |
| TOTAL COMMON STOCKS
(Cost $4,469,867,746) | | $ | 6,334,775,042 | |
| | | | | | | | |
| | RIGHTS – 0.0% | | | | |
| Health Care – 0.0% | | | |
| | 30,000 | | | Dyax Corp. Contingent Value Rights (a) (c) (d) | | | 33,300 | |
| | | | | | | | |
| TOTAL RIGHTS
(Cost $21,191) | | | 33,300 | |
| | | | | | | | |
| SHORT-TERM INVESTMENTS – 4.3% | | | |
| | 284,531,314 | | | Dreyfus Treasury Securities Cash Management Fund – 0.18% (e) | | | 284,531,314 | |
| | | | | | | | |
| TOTAL SHORT-TERM INVESTMENTS
(Cost $284,531,314) | | | 284,531,314 | |
| | | | | | | | |
The accompanying notes are an integral part of these financial statements.
21
Schedule of Investments
PRIMECAP Odyssey Growth Fund
October 31, 2016 – continued
| | | | | | |
| Shares | | | | Value | |
TOTAL INVESTMENTS
(Cost $4,754,420,251) – 100.2% | | $ | 6,619,339,656 | |
Liabilities in Excess of Other Assets – (0.2)% | | | (14,874,935 | ) |
| | | | | | |
TOTAL NET ASSETS – 100.0% | | $ | 6,604,464,721 | |
| | | | | | |
| ADR | American Depository Receipt |
| (b) | Considered an affiliated company of the fund as the fund owns 5% or more of the outstanding voting securities of such company. |
| (e) | Rate quoted is seven-day yield at period end. |
The Global Industry Classification Standard (GICS®) was developed by and is the exclusive property of MSCI Inc. and Standard & Poor’s Financial Services LLC (“S&P”). GICS is a service mark of MSCI and S&P and has been licensed for use by the fund’s administrator.
The accompanying notes are an integral part of these financial statements.
22
| | |
| | Schedule of Investments PRIMECAP Odyssey Aggressive Growth Fund October 31, 2016 |
| | | | | | | | |
| Shares | | | | | Value | |
| | COMMON STOCKS – 96.0% | | | | |
| Consumer Discretionary – 15.0% | | | |
| | 30,000 | | | Aaron’s, Inc. | | $ | 741,300 | |
| | 2,283,600 | | | Ascena Retail Group, Inc. (a) | | | 11,166,804 | |
| | 1,771,489 | | | Boot Barn Holdings, Inc. (a) (b) | | | 22,675,059 | |
| | 2,080,100 | | | CarMax, Inc. (a) | | | 103,880,194 | |
| | 8,618,500 | | | Chegg, Inc. (a) (b) | | | 57,313,025 | |
| | 1,400,400 | | | DHX Media Ltd. – Class A – CAD | | | 7,099,620 | |
| | 535,000 | | | DHX Media Ltd. – Class B – CAD | | | 2,716,283 | |
| | 20,300 | | | Francesca’s Holdings, Corp. (a) | | | 326,221 | |
| | 313,500 | | | Gildan Activewear, Inc. | | | 8,047,545 | |
| | 369,130 | | | IMAX Corp. (a) | | | 11,166,182 | |
| | 105,000 | | | iRobot Corp. (a) | | | 5,323,500 | |
| | 3,425,000 | | | Lions Gate Entertainment Corp. | | | 69,733,000 | |
| | 600,000 | | | Norwegian Cruise Line Holdings, Ltd. (a) | | | 23,322,000 | |
| | 17,700 | | | Ollie’s Bargain Outlet Holdings, Inc. (a) | | | 484,095 | |
| | 2,036,701 | | | Royal Caribbean Cruises Ltd. | | | 156,561,206 | |
| | 2,939,700 | | | Shutterfly, Inc. (a) (b) | | | 144,045,300 | |
| | 7,672,000 | | | Sony Corp. – ADR | | | 240,363,760 | |
| | 246,490 | | | Tesla Motors, Inc. (a) | | | 48,738,468 | |
| | 2,087,500 | | | Tribune Media Co. – Class A | | | 68,052,500 | |
| | 1,395,251 | | | tronc, Inc. | | | 16,784,869 | |
| | 2,256,889 | | | Tuesday Morning Corp. (a) (b) | | | 11,171,601 | |
| | | | | | | | |
| | | | | | | 1,009,712,532 | |
| | | | | | | | |
| Consumer Staples – 0.0% | | | |
| | 12,000 | | | Post Holdings, Inc. (a) | | | 914,760 | |
| | | | | | | | |
| |
| Energy – 0.5% | | | |
| | 545,400 | | | Cabot Oil & Gas Corp. | | | 11,387,952 | |
| | 40,000 | | | EOG Resources, Inc. | | | 3,616,800 | |
| | 85,800 | | | National Oilwell Varco, Inc. | | | 2,754,180 | |
| | 7,000 | | | Range Resources Corp. | | | 236,530 | |
| | 2,700,000 | | | Rex Energy Corp. (a) | | | 1,241,190 | |
| | 3,866 | | | Schlumberger Ltd | | | 302,437 | |
| | 1,100,382 | | | Transocean Ltd. | | | 10,574,671 | |
| | | | | | | | |
| | | | | | | 30,113,760 | |
| | | | | | | | |
| Financials – 3.5% | | | |
| | 243,600 | | | CME Group, Inc. | | | 24,384,360 | |
| | 279,400 | | | Discover Financial Services | | | 15,738,602 | |
| | 1,894,000 | | | E*TRADE Financial Corp. (a) | | | 53,335,040 | |
The accompanying notes are an integral part of these financial statements.
23
Schedule of Investments
PRIMECAP Odyssey Aggressive Growth Fund
October 31, 2016 – continued
| | | | | | | | |
| Shares | | | | | Value | |
| Financials (continued) | | | |
| | 905,820 | | | MarketAxess Holdings, Inc. | | $ | 136,561,423 | |
| | 130,000 | | | Progressive Corp. (The) | | | 4,096,300 | |
| | | | | | | | |
| | | | | | | 234,115,725 | |
| | | | | | | | |
| | Health Care – 28.7% | | | | |
| | 2,147,000 | | | Abaxis, Inc. (b) | | | 102,497,780 | |
| | 1,503,300 | | | Abbott Laboratories | | | 58,989,492 | |
| | 2,100,873 | | | ABIOMED, Inc. (a) | | | 220,570,656 | |
| | 3,630,900 | | | Accuray, Inc. (a) | | | 17,791,410 | |
| | 387,400 | | | Adverum Biotechnologies, Inc. (a) | | | 1,142,830 | |
| | 2,462,000 | | | Alkermes PLC (a) | | | 124,109,420 | |
| | 3,880,000 | | | Arbutus Biopharma Corp. (a) (b) | | | 12,222,000 | |
| | 346,400 | | | Axovant Sciences Ltd. (a) | | | 4,264,184 | |
| | 292,000 | | | Biogen, Inc. (a) | | | 81,812,560 | |
| | 617,500 | | | BioMarin Pharmaceutical, Inc. (a) | | | 49,721,100 | |
| | 99,000 | | | Boston Scientific Corp. (a) | | | 2,178,000 | |
| | 1,048,700 | | | Cepheid, Inc. (a) | | | 55,476,230 | |
| | 7,800,000 | | | Cerus Corp. (a) (b) | | | 37,596,000 | |
| | 372,000 | | | Charles River Laboratories International, Inc. (a) | | | 28,227,360 | |
| | 531,550 | | | Dextera Surgical, Inc. (a) (b) | | | 919,582 | |
| | 1,333,800 | | | Eli Lilly & Co. | | | 98,487,792 | |
| | 3,554,784 | | | Epizyme, Inc. (a) (b) | | | 32,170,795 | |
| | 3,775,000 | | | Exact Sciences Corp. (a) | | | 58,814,500 | |
| | 678,800 | | | Flex Pharma, Inc. (a) | | | 3,298,968 | |
| | 2,892,532 | | | Fluidigm Corp. (a) (b) | | | 13,392,423 | |
| | 113,000 | | | Illumina, Inc. (a) | | | 15,383,820 | |
| | 2,779,167 | | | ImmunoGen, Inc. (a) | | | 5,058,084 | |
| | 2,069,956 | | | Insulet Corp. (a) | | | 76,836,767 | |
| | 1,792,583 | | | Momenta Pharmaceuticals, Inc. (a) | | | 19,987,301 | |
| | 12,680,830 | | | Nektar Therapeutics (a) (b) | | | 157,242,292 | |
| | 5,686,349 | | | Novadaq Technologies, Inc. (a) (b) | | | 63,175,337 | |
| | 505,000 | | | NuVasive, Inc. (a) | | | 30,163,650 | |
| | 1,472,716 | | | OncoMed Pharmaceuticals, Inc. (a) | | | 13,357,534 | |
| | 1,691,900 | | | OraSure Technologies, Inc. (a) | | | 12,706,169 | |
| | 23,200 | | | Penumbra, Inc. (a) | | | 1,530,040 | |
| | 2,330,000 | | | Pfenex, Inc. (a) (b) | | | 18,663,300 | |
| | 5,166,114 | | | QIAGEN N.V. (a) | | | 125,949,859 | |
| | 426,400 | | | Roche Holding AG – CHF | | | 98,030,418 | |
| | 3,953,900 | | | Seattle Genetics, Inc. (a) | | | 204,416,630 | |
The accompanying notes are an integral part of these financial statements.
24
Schedule of Investments
PRIMECAP Odyssey Aggressive Growth Fund
October 31, 2016 – continued
| | | | | | | | |
| Shares | | | | | Value | |
| Health Care (continued) | | | |
| | 3,988,600 | | | Xencor, Inc. (a) (b) | | $ | 84,917,294 | |
| | | | | | | | |
| | | | | | | 1,931,101,577 | |
| | | | | | | | |
| Industrials – 14.5% | | | |
| | 525,000 | | | AECOM (a) | | | 14,621,250 | |
| | 775,000 | | | Alaska Air Group, Inc. | | | 55,970,500 | |
| | 3,500 | | | Allegiant Travel Co. | | | 482,650 | |
| | 5,427,400 | | | American Airlines Group, Inc. | | | 220,352,440 | |
| | 191,000 | | | CIRCOR International, Inc. | | | 10,271,980 | |
| | 21,000 | | | Controladora Vuela Compania de Aviacion, S.A.B. de C.V. – ADR (a) | | | 401,310 | |
| | 171,400 | | | Curtiss-Wright Corp. | | | 15,360,868 | |
| | 3,728,200 | | | Delta Air Lines, Inc. | | | 155,726,914 | |
| | 47,700 | | | Esterline Technologies Corp. (a) | | | 3,503,565 | |
| | 3,000 | | | Fedex Corp. | | | 522,960 | |
| | 652,500 | | | Hawaiian Holdings, Inc. (a) | | | 29,378,812 | |
| | 71,633 | | | Herc Holdings, Inc. (a) | | | 2,155,437 | |
| | 194,900 | | | Hertz Global Holdings, Inc. (a) | | | 6,460,935 | |
| | 977,600 | | | Jacobs Engineering Group, Inc. (a) | | | 50,424,608 | |
| | 6,674,225 | | | JetBlue Airways Corp. (a) | | | 116,665,453 | |
| | 605,000 | | | NCI Building Systems, Inc. (a) | | | 8,712,000 | |
| | 1,121,400 | | | NN, Inc. | | | 19,792,710 | |
| | 568,372 | | | Ritchie Bros. Auctioneers, Inc. | | | 19,659,987 | |
| | 909,000 | | | Southwest Airlines Co. | | | 36,405,450 | |
| | 477,500 | | | Spirit Airlines, Inc. (a) | | | 22,886,575 | |
| | 238,800 | | | TASER International, Inc. (a) | | | 5,344,344 | |
| | 900 | | | TransDigm Group, Inc. (a) | | | 245,214 | |
| | 3,240,850 | | | United Continental Holdings, Inc. (a) | | | 182,232,996 | |
| | | | | | | | |
| | | | | | | 977,578,958 | |
| | | | | | | | |
| Information Technology – 30.9% | | | |
| | 35,000 | | | A10 Networks, Inc. (a) | | | 268,100 | |
| | 1,062,100 | | | Adobe Systems, Inc. (a) | | | 114,186,371 | |
| | 906,200 | | | Alibaba Group Holding Ltd. – ADR (a) | | | 92,151,478 | |
| | 103,370 | | | Alphabet, Inc. – Class A (a) | | | 83,719,363 | |
| | 103,653 | | | Alphabet, Inc. – Class C (a) | | | 81,319,925 | |
| | 30,000 | | | Applied Materials, Inc. | | | 872,400 | |
| | 4,100 | | | Arista Networks, Inc. (a) | | | 347,475 | |
| | 150,000 | | | ASML Holding N.V. | | | 15,843,000 | |
| | 2,907,500 | | | Axcelis Technologies, Inc. (a) (b) | | | 39,687,375 | |
| | 725,000 | | | Barracuda Networks, Inc. (a) | | | 16,907,000 | |
The accompanying notes are an integral part of these financial statements.
25
Schedule of Investments
PRIMECAP Odyssey Aggressive Growth Fund
October 31, 2016 – continued
| | | | | | | | |
| Shares | | | | | Value | |
| Information Technology (continued) | | | |
| | 22,924,918 | | | BlackBerry Ltd. (a) | | $ | 161,620,672 | |
| | 334,747 | | | Brocade Communications Systems, Inc. | | | 3,548,318 | |
| | 4,679,160 | | | comScore, Inc. (a) (b) | | | 134,713,016 | |
| | 163,000 | | | Cray, Inc. (a) | | | 3,390,400 | |
| | 1,675,300 | | | Cree, Inc. (a) | | | 37,359,190 | |
| | 248,730 | | | Dell Technologies Inc – Class V (a) | | | 12,210,156 | |
| | 294,000 | | | Digimarc Corp. (a) | | | 9,290,400 | |
| | 156,900 | | | eBay, Inc. (a) | | | 4,473,219 | |
| | 130,000 | | | Electronic Arts, Inc. (a) | | | 10,207,600 | |
| | 2,572,700 | | | Ellie Mae, Inc. (a) (b) | | | 272,423,203 | |
| | 1,530,322 | | | FARO Technologies, Inc. (a) (b) | | | 51,342,303 | |
| | 300 | | | FireEye, Inc. (a) | | | 3,486 | |
| | 8,421,900 | | | Flextronics International Ltd. (a) | | | 119,506,761 | |
| | 1,382,400 | | | FormFactor, Inc. (a) | | | 12,407,040 | |
| | 3,071,915 | | | Guidance Software, Inc. (a) (b) | | | 15,851,081 | |
| | 438,000 | | | Hewlett Packard Enterprise Co. | | | 9,841,860 | |
| | 510,000 | | | HP, Inc. | | | 7,389,900 | |
| | 501,000 | | | HubSpot, Inc. (a) | | | 26,277,450 | |
| | 224,500 | | | Intuit, Inc. | | | 24,412,130 | |
| | 765,000 | | | Jabil Circuit, Inc. | | | 16,325,100 | |
| | 270,000 | | | Keysight Technologies, Inc. (a) | | | 8,856,000 | |
| | 787,200 | | | KLA-Tencor Corp. | | | 59,126,592 | |
| | 594 | | | Knowles Corp. (a) | | | 8,874 | |
| | 6,769,500 | | | Micron Technology, Inc. (a) | | | 116,164,620 | |
| | 528,377 | | | MINDBODY, Inc. -Class A (a) | | | 10,937,404 | |
| | 21,600 | | | Mobileye N.V. (a) | | | 803,088 | |
| | 2,157,467 | | | NetApp, Inc. | | | 73,224,430 | |
| | 1,414,086 | | | NeuStar, Inc. – Class A (a) | | | 31,746,231 | |
| | 411,900 | | | Nimble Storage, Inc. (a) | | | 3,142,797 | |
| | 2,972,406 | | | Nuance Communications, Inc. (a) | | | 41,673,132 | |
| | 1,323,155 | | | NVIDIA Corp. | | | 94,155,710 | |
| | 316,000 | | | OSI Systems, Inc. (a) | | | 22,161,080 | |
| | 676,300 | | | QUALCOMM, Inc. | | | 46,475,336 | |
| | 172,200 | | | Rambus, Inc. (a) | | | 2,099,118 | |
| | 3,102,726 | | | Rubicon Project, Inc. (The) (a) (b) | | | 23,766,881 | |
| | 8,546,150 | | | ServiceSource International, Inc. (a) (b) | | | 40,594,213 | |
| | 1,847,500 | | | Stratasys Ltd. (a) | | | 35,324,200 | |
| | 920,000 | | | Trimble Navigation Ltd. (a) | | | 25,428,800 | |
| | 450,000 | | | Universal Display Corp. (a) | | | 23,265,000 | |
| | 335,000 | | | VMware, Inc. – Class A (a) | | | 26,331,000 | |
The accompanying notes are an integral part of these financial statements.
26
Schedule of Investments
PRIMECAP Odyssey Aggressive Growth Fund
October 31, 2016 – continued
| | | | | | | | |
| Shares | | | | | Value | |
| Information Technology (continued) | | | |
| | 99,298 | | | Western Digital Corp. | | $ | 5,802,975 | |
| | 139,580 | | | Yahoo!, Inc. (a) | | | 5,799,549 | |
| | | | | | | | |
| | | | | | | 2,074,782,802 | |
| | | | | | | | |
| Materials – 0.8% | | | |
| | 2,325,000 | | | Marrone Bio Innovations, Inc. (a) (b) | | | 4,650,000 | |
| | 284,300 | | | Monsanto Co. | | | 28,648,911 | |
| | 7,697,813 | | | TerraVia Holdings, Inc. (a) (b) | | | 18,089,861 | |
| | | | | | | | |
| | | | | | | 51,388,772 | |
| | | | | | | | |
| Telecom Services – 2.1% | | | |
| | 23,057,000 | | | Sprint Corp. (a) | | | 142,031,120 | |
| | | | | | | | |
| TOTAL COMMON STOCKS
(Cost $4,784,203,159) | | $ | 6,451,740,006 | |
| | | | | | | | |
| | RIGHTS – 0.1% | | | | |
| Health Care – 0.1% | | | |
| | 7,639,720 | | | Dyax Corp. Contingent Value Rights (a) (c) (d) | | | 8,480,090 | |
| | | | | | | | |
| TOTAL RIGHTS
(Cost $675,162) | | | 8,480,090 | |
| | | | | | | | |
| | SHORT-TERM INVESTMENTS- 4.1% | | | | |
| | 278,005,117 | | | Dreyfus Treasury Securities Cash Management Fund – 0.18% (e) | | | 278,005,117 | |
| | | | | | | | |
| TOTAL SHORT-TERM INVESTMENTS
(Cost $278,005,117) | | | 278,005,117 | |
| | | | | | | | |
| TOTAL INVESTMENTS
(Cost $5,062,883,438) – 100.2% | | | 6,738,225,213 | |
| Liabilities in Excess of Other Assets – (0.2)% | | | (16,821,681 | ) |
| | | | | | | | |
| TOTAL NET ASSETS – 100.0% | | $ | 6,721,403,532 | |
| | | | | | | | |
| ADR | American Depository Receipt |
| (b) | Considered an affiliated company of the fund as the fund owns 5% or more of the outstanding voting securities of such company. |
| (e) | Rate quoted is seven-day yield at period end. |
The Global Industry Classification Standard (GICS®) was developed by and is the exclusive property of MSCI Inc. and Standard & Poor’s Financial Services LLC (“S&P”). GICS is a service mark of MSCI and S&P and has been licensed for use by the fund’s administrator.
The accompanying notes are an integral part of these financial statements.
27
| | |
| | Statements of Assets and Liabilities PRIMECAP Odyssey Funds October 31, 2016 |
| | | | | | | | | | | | |
| | | PRIMECAP
Odyssey
Stock Fund | | | PRIMECAP
Odyssey
Growth Fund | | | PRIMECAP
Odyssey Aggressive
Growth Fund | |
ASSETS | | | | | | | | | | | | |
Investments, at cost (unaffiliated) | | $ | 4,545,133,063 | | | $ | 4,720,876,285 | | | $ | 3,783,796,974 | |
Investments, at cost (affiliated) | | | — | | | | 33,543,966 | | | | 1,279,086,464 | |
| | | | | | | | | | | | |
| | $ | 4,545,133,063 | | | $ | 4,754,420,251 | | | $ | 5,062,883,438 | |
| | | | | | | | | | | | |
| | | |
Investments, at value (unaffiliated) | | $ | 5,662,908,531 | | | $ | 6,611,133,276 | | | $ | 5,379,105,492 | |
Investments, at value (affiliated) | | | — | | | | 8,206,380 | | | | 1,359,119,721 | |
| | | | | | | | | | | | |
Total Investments | | $ | 5,662,908,531 | | | $ | 6,619,339,656 | | | $ | 6,738,225,213 | |
| | | | | | | | | | | | |
Cash | | | — | | | | — | | | | 503,326 | |
Receivable for investments sold | | | 481,033 | | | | 2,366,080 | | | | 348,684 | |
Receivable for dividends and interest | | | 4,400,108 | | | | 3,646,255 | | | | 2,632,895 | |
Receivable for fund shares sold | | | 8,318,793 | | | | 8,618,116 | | | | 4,444,879 | |
Prepaid expenses and other assets | | | 83,242 | | | | 94,639 | | | | 57,186 | |
| | | | | | | | | | | | |
Total assets | | | 5,676,191,707 | | | | 6,634,064,746 | | | | 6,746,212,183 | |
| | | | | | | | | | | | |
| | | |
| LIABILITIES | | | | | | | | | | | | |
Payable for investments purchased | | | 7,519,173 | | | | 9,387,777 | | | | 10,034,990 | |
Payable for fund shares repurchased | | | 5,171,600 | | | | 9,875,259 | | | | 4,282,483 | |
Payable to the advisor (Note 6) | | | 8,023,615 | | | | 9,323,107 | | | | 9,590,729 | |
Other accrued expenses and liabilities | | | 1,205,830 | | | | 1,013,882 | | | | 900,449 | |
| | | | | | | | | | | | |
Total liabilities | | | 21,920,218 | | | | 29,600,025 | | | | 24,808,651 | |
| | | | | | | | | | | | |
| | | |
NET ASSETS | | $ | 5,654,271,489 | | | $ | 6,604,464,721 | | | $ | 6,721,403,532 | |
| | | | | | | | | | | | |
| | | |
Number of shares issued and outstanding (unlimited shares authorized, $0.01 par value) | | | 227,626,425 | | | | 236,736,118 | | | | 198,997,068 | |
| | | | | | | | | | | | |
| | | |
NET ASSET VALUE, OFFERING AND REDEMPTION PRICE PER SHARE | | $ | 24.84 | | | $ | 27.90 | | | $ | 33.78 | |
| | | | | | | | | | | | |
| | | |
| COMPONENTS OF NET ASSETS | | | | | | | | | | | | |
Paid-in capital | | $ | 4,379,253,262 | | | $ | 4,514,666,358 | | | $ | 4,501,967,998 | |
Undistributed net investment income | | | 55,784,570 | | | | 26,128,825 | | | | — | |
Accumulated net realized gain | | | 101,538,683 | | | | 198,875,380 | | | | 544,184,850 | |
Net unrealized appreciation | | | 1,117,694,974 | | | | 1,864,794,158 | | | | 1,675,250,684 | |
| | | | | | | | | | | | |
Net assets | | $ | 5,654,271,489 | | | $ | 6,604,464,721 | | | $ | 6,721,403,532 | |
| | | | | | | | | | | | |
The accompanying notes are an integral part of these financial statements.
28
| | |
| | Statements of Operations PRIMECAP Odyssey Funds For the Year Ended October 31, 2016 |
| | | | | | | | | | | | |
| | | PRIMECAP
Odyssey
Stock Fund | | | PRIMECAP
Odyssey
Growth Fund | | | PRIMECAP
Odyssey Aggressive
Growth Fund | |
INVESTMENT INCOME | | | | | | | | | | | | |
Income | | | | | | | | | | | | |
Dividends(1)(2) | | $ | 102,254,684 | | | $ | 71,033,746 | | | $ | 30,294,841 | |
Interest income | | | 506,506 | | | | 401,468 | | | | 358,392 | |
| | | | | | | | | | | | |
Total income | | | 102,761,190 | | | | 71,435,214 | | | | 30,653,233 | |
| | | | | | | | | | | | |
| | | |
Expenses | | | | | | | | | | | | |
Advisory fees | | | 29,974,681 | | | | 35,270,117 | | | | 35,756,439 | |
Shareholder servicing | | | 4,500,976 | | | | 4,373,017 | | | | 3,387,372 | |
Custody | | | 267,530 | | | | 289,829 | | | | 253,193 | |
Trustee fees | | | 91,537 | | | | 91,476 | | | | 91,476 | |
Other | | | 1,425,239 | | | | 1,490,486 | | | | 1,382,785 | |
| | | | | | | | | | | | |
Total expenses | | | 36,259,963 | | | | 41,514,925 | | | | 40,871,265 | |
| | | | | | | | | | | | |
| | | |
Net investment income (loss) | | | 66,501,227 | | | | 29,920,289 | | | | (10,218,032 | ) |
| | | | | | | | | | | | |
| | | |
| REALIZED AND UNREALIZED GAIN (LOSS) ON INVESTMENTS AND FOREIGN CURRENCY | | | | | | | | | | | | |
Net realized gain (loss) on: | | | | | | | | | | | | |
Investments(3) | | | 125,567,072 | | | | 228,594,672 | | | | 612,017,670 | |
Foreign currency transactions | | | (68,983 | ) | | | (7,489 | ) | | | (2,596 | ) |
Change in unrealized appreciation/depreciation on: | | | | | | | | | | | | |
Investments | | | 29,536,919 | | | | 8,261,917 | | | | (105,095,447 | ) |
Foreign currency translations | | | 58,190 | | | | 4,804 | | | | 3,459 | |
| | | | | | | | | | | | |
| | | |
Net realized and unrealized gain on investments and foreign currency | | | 155,093,198 | | | | 236,853,904 | | | | 506,923,086 | |
| | | | | | | | | | | | |
| | | |
NET INCREASE IN NET ASSETS RESULTING FROM OPERATIONS | | $ | 221,594,425 | | | $ | 266,774,193 | | | $ | 496,705,054 | |
| | | | | | | | | | | | |
| | (1) | Net of foreign taxes withheld of $1,978,090, $1,738,704, and $744,419, respectively. |
| | (2) | Includes dividend income from affiliated companies of $317,905, $0, and $1,260,686, respectively. |
| | (3) | Includes net realized gain (loss) on sales of affiliated companies of $0, ($3,270,003), and $476,428,515, respectively. |
The accompanying notes are an integral part of these financial statements.
29
| | |
| | Statements of Changes in Net Assets PRIMECAP Odyssey Stock Fund |
| | | | | | | | |
| | | Year Ended
October 31, 2016 | | | Year Ended
October 31, 2015 | |
INCREASE (DECREASE) IN NET ASSETS FROM: | | | | | | | | |
| | |
| OPERATIONS | | | | | | | | |
Net investment income | | $ | 66,501,227 | | | $ | 59,695,178 | |
Net realized gain (loss) on: | | | | | | | | |
Investments | | | 125,567,072 | | | | 51,744,429 | |
Foreign currency transactions | | | (68,983 | ) | | | (71,444 | ) |
Change in unrealized appreciation/depreciation on: | | | | | | | | |
Investments | | | 29,536,919 | | | | 155,442,989 | |
Foreign currency translations | | | 58,190 | | | | (59,275 | ) |
| | | | | | | | |
Net increase in net assets resulting from operations | | | 221,594,425 | | | | 266,751,877 | |
| | | | | | | | |
| | |
| DISTRIBUTIONS TO SHAREHOLDERS FROM: | | | | | | | | |
Net investment income | | | (51,498,747 | ) | | | (48,367,226 | ) |
Net realized gain on investments | | | (44,633,628 | ) | | | (55,247,855 | ) |
| | | | | | | | |
Net decrease in net assets resulting from distributions paid | | | (96,132,375 | ) | | | (103,615,081 | ) |
| | | | | | | | |
| | |
| CAPITAL SHARE TRANSACTIONS | | | | | | | | |
Proceeds from shares sold | | | 1,680,864,014 | | | | 2,004,472,389 | |
Proceeds from reinvestment of distributions | | | 64,637,312 | | | | 64,917,038 | |
Cost of shares repurchased | | | (1,342,761,828 | ) | | | (639,033,439 | ) |
Other capital contributions | | | 57,188 | | | | — | |
| | | | | | | | |
Net increase from capital share transactions | | | 402,796,686 | | | | 1,430,355,988 | |
| | | | | | | | |
| | |
Total increase in net assets | | | 528,258,736 | | | | 1,593,492,784 | |
| | | | | | | | |
| | |
| NET ASSETS | | | | | | | | |
Beginning of year | | | 5,126,012,753 | | | | 3,532,519,969 | |
| | | | | | | | |
End of year (includes undistributed net investment income of $55,784,570 and $40,851,074, respectively) | | $ | 5,654,271,489 | | | $ | 5,126,012,753 | |
| | | | | | | | |
| | |
| CHANGE IN CAPITAL SHARES | | | | | | | | |
Shares outstanding, beginning of year | | | 209,619,621 | | | | 149,772,161 | |
| | | | | | | | |
Shares sold | | | 72,028,323 | | | | 83,731,435 | |
Shares issued on reinvestment of distributions | | | 2,701,100 | | | | 2,822,480 | |
Shares repurchased | | | (56,722,619 | ) | | | (26,706,455 | ) |
| | | | | | | | |
Increase in capital shares | | | 18,006,804 | | | | 59,847,460 | |
| | | | | | | | |
Shares outstanding, end of year | | | 227,626,425 | | | | 209,619,621 | |
| | | | | | | | |
The accompanying notes are an integral part of these financial statements.
30
| | |
| | Statements of Changes in Net Assets PRIMECAP Odyssey Growth Fund |
| | | | | | | | |
| | | Year Ended
October 31, 2016 | | | Year Ended
October 31, 2015 | |
INCREASE (DECREASE) IN NET ASSETS FROM: | | | | | | | | |
| | |
| OPERATIONS | | | | | | | | |
Net investment income | | $ | 29,920,289 | | | $ | 30,005,329 | |
Net realized gain (loss) on: | | | | | | | | |
Investments | | | 228,594,672 | | | | 66,044,493 | |
Foreign currency transactions | | | (7,489 | ) | | | (138,322 | ) |
Change in unrealized appreciation/depreciation on: | | | | | | | | |
Investments | | | 8,261,917 | | | | 245,975,541 | |
Foreign currency translations | | | 4,804 | | | | 1,335 | |
| | | | | | | | |
Net increase in net assets resulting from operations | | | 266,774,193 | | | | 341,888,376 | |
| | | | | | | | |
| | |
| DISTRIBUTIONS TO SHAREHOLDERS FROM: | | | | | | | | |
Net investment income | | | (23,063,615 | ) | | | (30,191,718 | ) |
Net realized gain on investments | | | (59,508,055 | ) | | | (118,727,114 | ) |
| | | | | | | | |
Net decrease in net assets resulting from distributions paid | | | (82,571,670 | ) | | | (148,918,832 | ) |
| | | | | | | | |
| | |
| CAPITAL SHARE TRANSACTIONS | | | | | | | | |
Proceeds from shares sold | | | 1,708,716,164 | | | | 2,075,669,127 | |
Proceeds from reinvestment of distributions | | | 78,015,380 | | | | 139,731,443 | |
Cost of shares repurchased | | | (1,621,437,544 | ) | | | (850,015,666 | ) |
Other capital contributions | | | 403,379 | | | | — | |
| | | | | | | | |
Net increase from capital share transactions | | | 165,697,379 | | | | 1,365,384,904 | |
| | | | | | | | |
| | |
Total increase in net assets | | | 349,899,902 | | | | 1,558,354,448 | |
| | | | | | | | |
| | |
| NET ASSETS | | | | | | | | |
Beginning of year | | | 6,254,564,819 | | | | 4,696,210,371 | |
| | | | | | | | |
End of year (includes undistributed net investment income of $26,128,825 and $19,279,640, respectively) | | $ | 6,604,464,721 | | | $ | 6,254,564,819 | |
| | | | | | | | |
| | |
| CHANGE IN CAPITAL SHARES | | | | | | | | |
Shares outstanding, beginning of year | | | 230,904,817 | | | | 179,647,788 | |
| | | | | | | | |
Shares sold | | | 64,722,163 | | | | 77,643,893 | |
Shares issued on reinvestment of distributions | | | 2,842,090 | | | | 5,542,699 | |
Shares repurchased | | | (61,732,952 | ) | | | (31,929,563 | ) |
| | | | | | | | |
Increase in capital shares | | | 5,831,301 | | | | 51,257,029 | |
| | | | | | | | |
Shares outstanding, end of year | | | 236,736,118 | | | | 230,904,817 | |
| | | | | | | | |
The accompanying notes are an integral part of these financial statements.
31
| | |
| | Statements of Changes in Net Assets PRIMECAP Odyssey Aggressive Growth Fund |
| | | | | | | | |
| | | Year Ended
October 31, 2016 | | | Year Ended
October 31, 2015 | |
INCREASE (DECREASE) IN NET ASSETS FROM: | | | | | | | | |
| | |
| OPERATIONS | | | | | | | | |
Net investment income (loss) | | $ | (10,218,032 | ) | | $ | 11,214,252 | |
Net realized gain (loss) on: | | | | | | | | |
Investments | | | 612,017,670 | | | | 425,573,920 | |
Foreign currency transactions | | | (2,596 | ) | | | (103,874 | ) |
Change in unrealized appreciation/depreciation on: | | | | | | | | |
Investments | | | (105,095,447 | ) | | | (136,132,060 | ) |
Foreign currency translations | | | 3,459 | | | | (3,239 | ) |
| | | | | | | | |
Net increase in net assets resulting from operations | | | 496,705,054 | | | | 300,548,999 | |
| | | | | | | | |
| | |
| DISTRIBUTIONS TO SHAREHOLDERS FROM: | | | | | | | | |
Net investment income | | | (501,913 | ) | | | (10,605,768 | ) |
Net realized gain on investments | | | (397,235,179 | ) | | | (273,260,143 | ) |
| | | | | | | | |
Net decrease in net assets resulting from distributions paid | | | (397,737,092 | ) | | | (283,865,911 | ) |
| | | | | | | | |
| | |
| CAPITAL SHARE TRANSACTIONS | | | | | | | | |
Proceeds from shares sold | | | 998,407,695 | | | | 1,305,237,495 | |
Proceeds from reinvestment of distributions | | | 373,382,723 | | | | 266,806,818 | |
Cost of shares repurchased | | | (1,252,149,625 | ) | | | (1,048,464,115 | ) |
| | | | | | | | |
Net increase from capital share transactions | | | 119,640,793 | | | | 523,580,198 | |
| | | | | | | | |
| | |
Total increase in net assets | | | 218,608,755 | | | | 540,263,286 | |
| | | | | | | | |
| | |
| NET ASSETS | | | | | | | | |
Beginning of year | | | 6,502,794,777 | | | | 5,962,531,491 | |
| | | | | | | | |
End of year (includes undistributed net investment income of $0 and $503,498, respectively) | | $ | 6,721,403,532 | | | $ | 6,502,794,777 | |
| | | | | | | | |
| | |
| CHANGE IN CAPITAL SHARES | | | | | | | | |
Shares outstanding, beginning of year | | | 195,429,065 | | | | 179,545,427 | |
| | | | | | | | |
Shares sold | | | 31,718,579 | | | | 38,356,506 | |
Shares issued on reinvestment of distributions | | | 11,541,970 | | | | 8,581,757 | |
Shares repurchased | | | (39,692,546 | ) | | | (31,054,625 | ) |
| | | | | | | | |
Increase in capital shares | | | 3,568,003 | | | | 15,883,638 | |
| | | | | | | | |
Shares outstanding, end of year | | | 198,997,068 | | | | 195,429,065 | |
| | | | | | | | |
The accompanying notes are an integral part of these financial statements.
32
| | |
| | Financial Highlights PRIMECAP Odyssey Stock Fund For a capital share outstanding throughout each year. |
| | | | | | | | | | | | | | | | | | | | |
| | | Year
Ended
Oct. 31,
2016 | | | Year
Ended
Oct. 31,
2015 | | | Year
Ended
Oct. 31,
2014 | | | Year
Ended
Oct. 31,
2013 | | | Year
Ended
Oct. 31,
2012 | |
| | | | | |
Net asset value, beginning of the year | | $ | 24.45 | | | $ | 23.59 | | | $ | 20.56 | | | $ | 15.75 | | | $ | 14.32 | |
| | | | | | | | | | | | | | | | | | | | |
Income from investment operations: | | | | | | | | | | | | | | | | | | | | |
Net investment income | | | 0.29 | | | | 0.31 | | | | 0.25 | | | | 0.27 | | | | 0.21 | |
Net realized and unrealized gain on investments and foreign currency | | | 0.55 | | | | 1.21 | | | | 3.09 | | | | 4.79 | | | | 1.40 | |
| | | | | | | | | | | | | | | | | | | | |
Total from investment operations | | | 0.84 | | | | 1.52 | | | | 3.34 | | | | 5.06 | | | | 1.61 | |
| | | | | | | | | | | | | | | | | | | | |
Less: | | | | | | | | | | | | | | | | | | | | |
Dividends from net investment income | | | (0.24 | ) | | | (0.31 | ) | | | (0.24 | ) | | | (0.25 | ) | | | (0.18 | ) |
Distributions from net realized gain | | | (0.21 | ) | | | (0.35 | ) | | | (0.07 | ) | | | — | | | | — | |
| | | | | | | | | | | | | | | | | | | | |
Total distributions | | | (0.45 | ) | | | (0.66 | ) | | | (0.31 | ) | | | (0.25 | ) | | | (0.18 | ) |
| | | | | | | | | | | | | | | | | | | | |
Net asset value, end of year | | $ | 24.84 | | | $ | 24.45 | | | $ | 23.59 | | | $ | 20.56 | | | $ | 15.75 | |
| | | | | | | | | | | | | | | | | | | | |
| | | | | |
Total return | | | 3.52 | % | | | 6.64 | % | | | 16.45 | % | | | 32.55 | % | | | 11.39 | % |
| | | | | |
Ratios/supplemental data: | | | | | | | | | | | | | | | | | | | | |
Net assets, end of year (millions) | | $ | 5,654.3 | | | $ | 5,126.0 | | | $ | 3,532.5 | | | $ | 2,134.7 | | | $ | 1,522.2 | |
| | | | | |
Ratio of expenses to average net assets | | | 0.67 | % | | | 0.65 | % | | | 0.62 | % | | | 0.63 | % | | | 0.66 | % |
| | | | | |
Ratio of net investment income to average net assets | | | 1.22 | % | | | 1.38 | % | | | 1.34 | % | | | 1.65 | % | | | 1.57 | % |
| | | | | |
Portfolio turnover rate | | | 8 | % | | | 7 | % | | | 8 | % | | | 15 | % | | | 11 | % |
The accompanying notes are an integral part of these financial statements.
33
| | |
| | Financial Highlights PRIMECAP Odyssey Growth Fund For a capital share outstanding throughout each year. |
| | | | | | | | | | | | | | | | | | | | |
| | | Year
Ended
Oct. 31,
2016 | | | Year
Ended
Oct. 31,
2015 | | | Year
Ended
Oct. 31,
2014 | | | Year
Ended
Oct. 31,
2013 | | | Year
Ended
Oct. 31,
2012 | |
| | | | | |
Net asset value, beginning of the year | | $ | 27.09 | | | $ | 26.14 | | | $ | 23.09 | | | $ | 16.83 | | | $ | 15.44 | |
| | | | | | | | | | | | | | | | | | | | |
Income from investment operations: | | | | | | | | | | | | | | | | | | | | |
Net investment income | | | 0.12 | | | | 0.14 | | | | 0.13 | | | | 0.10 | | | | 0.09 | |
Net realized and unrealized gain on investments and foreign currency | | | 1.04 | | | | 1.62 | | | | 3.45 | | | | 6.26 | | | | 1.42 | |
| | | | | | | | | | | | | | | | | | | | |
Total from investment operations | | | 1.16 | | | | 1.76 | | | | 3.58 | | | | 6.36 | | | | 1.51 | |
| | | | | | | | | | | | | | | | | | | | |
Less: | | | | | | | | | | | | | | | | | | | | |
Dividends from net investment income | | | (0.10 | ) | | | (0.16 | ) | | | (0.08 | ) | | | (0.10 | ) | | | (0.06 | ) |
Distributions from net realized gain | | | (0.25 | ) | | | (0.65 | ) | | | (0.45 | ) | | | — | | | | (0.06 | ) |
| | | | | | | | | | | | | | | | | | | | |
Total distributions | | | (0.35 | ) | | | (0.81 | ) | | | (0.53 | ) | | | (0.10 | ) | | | (0.12 | ) |
| | | | | | | | | | | | | | | | | | | | |
Net asset value, end of year | | $ | 27.90 | | | $ | 27.09 | | | $ | 26.14 | | | $ | 23.09 | | | $ | 16.83 | |
| | | | | | | | | | | | | | | | | | | | |
| | | | | |
Total return | | | 4.31 | % | | | 6.96 | % | | | 15.82 | % | | | 38.02 | % | | | 9.86 | % |
| | | | | |
Ratios/supplemental data: | | | | | | | | | | | | | | | | | | | | |
Net assets, end of year (millions) | | $ | 6,604.5 | | | $ | 6,254.6 | | | $ | 4,696.2 | | | $ | 3,661.2 | | | $ | 2,201.9 | |
| | | | | |
Ratio of expenses to average net assets | | | 0.65 | % | | | 0.64 | % | | | 0.63 | % | | | 0.65 | % | | | 0.67 | % |
| | | | | |
Ratio of net investment income to average net assets | | | 0.47 | % | | | 0.53 | % | | | 0.54 | % | | | 0.51 | % | | | 0.55 | % |
| | | | | |
Portfolio turnover rate | | | 9 | % | | | 5 | % | | | 10 | % | | | 10 | % | | | 12 | % |
The accompanying notes are an integral part of these financial statements.
34
| | |
| | Financial Highlights PRIMECAP Odyssey Aggressive Growth Fund For a capital share outstanding throughout each year. |
| | | | | | | | | | | | | | | | | | | | |
| | | Year
Ended
Oct. 31,
2016 | | | Year
Ended
Oct. 31,
2015 | | | Year
Ended
Oct. 31,
2014 | | | Year
Ended
Oct. 31,
2013 | | | Year
Ended
Oct. 31,
2012 | |
| | | | | |
Net asset value, beginning of the year | | $ | 33.27 | | | $ | 33.21 | | | $ | 28.71 | | | $ | 18.86 | | | $ | 16.99 | |
| | | | | | | | | | | | | | | | | | | | |
Income from investment operations: | | | | | | | | | | | | | | | | | | | | |
Net investment income (loss) | | | (0.05 | ) | | | 0.06 | | | | (0.03 | ) | | | (0.04 | ) | | | (0.05 | ) |
Net realized and unrealized gain on investments and foreign currency | | | 2.59 | | | | 1.54 | | | | 5.04 | | | | 9.89 | | | | 2.24 | |
| | | | | | | | | | | | | | | | | | | | |
Total from investment operations | | | 2.54 | | | | 1.60 | | | | 5.01 | | | | 9.85 | | | | 2.19 | |
| | | | | | | | | | | | | | | | | | | | |
Less: | | | | | | | | | | | | | | | | | | | | |
Dividends from net investment income | | | (0.00 | )(1) | | | (0.06 | ) | | | — | | | | — | | | | — | |
Distributions from net realized gain | | | (2.03 | ) | | | (1.48 | ) | | | (0.51 | ) | | | — | | | | (0.32 | ) |
| | | | | | | | | | | | | | | | | | | | |
Total distributions | | | (2.03 | ) | | | (1.54 | ) | | | (0.51 | ) | | | — | | | | (0.32 | ) |
| | | | | | | | | | | | | | | | | | | | |
Net asset value, end of year | | $ | 33.78 | | | $ | 33.27 | | | $ | 33.21 | | | $ | 28.71 | | | $ | 18.86 | |
| | | | | | | | | | | | | | | | | | | | |
| | | | | |
Total return | | | 7.90 | % | | | 5.13 | % | | | 17.71 | % | | | 52.23 | % | | | 13.25 | % |
| | | | | |
Ratios/supplemental data: | | | | | | | | | | | | | | | | | | | | |
Net assets, end of year (millions) | | $ | 6,721.4 | | | $ | 6,502.8 | | | $ | 5,962.5 | | | $ | 4,443.1 | | | $ | 1,541.5 | |
| | | | | |
Ratio of expenses to average net assets | | | 0.63 | % | | | 0.62 | % | | | 0.62 | % | | | 0.64 | % | | | 0.68 | % |
| | | | | |
Ratio of net investment income (loss) to average net assets | | | (0.16 | %) | | | 0.17 | % | | | (0.09 | %) | | | (0.23 | %) | | | (0.32 | %) |
| | | | | |
Portfolio turnover rate | | | 15 | % | | | 15 | % | | | 13 | % | | | 11 | % | | | 14 | % |
| | (1) | Less than one cent per share |
The accompanying notes are an integral part of these financial statements.
35
| | |
| | Notes to Financial Statements PRIMECAP Odyssey Funds For the Year Ended October 31, 2016 |
(1) Organization
PRIMECAP Odyssey Funds (the “Trust”) was organized on June 8, 2004 as a Delaware statutory trust and is registered as an open-end management investment company under the Investment Company Act of 1940, as amended (the “1940 Act”). The Trust is comprised of three series: PRIMECAP Odyssey Stock Fund, PRIMECAP Odyssey Growth Fund, and PRIMECAP Odyssey Aggressive Growth Fund (the “Funds”), each of which is diversified within the meaning of the 1940 Act. PRIMECAP Management Company (the “Investment Advisor”) serves as investment advisor to the Funds. Each Fund commenced operations on November 1, 2004.
Each Fund’s investment objective is to achieve long-term capital appreciation. Each Fund is authorized to issue unlimited shares of beneficial interest. All shares of each Fund have equal rights with respect to voting. The PRIMECAP Odyssey Aggressive Growth Fund is closed to most new investors.
(2) Significant Accounting Policies
The Funds consistently follow the accounting policies set forth below which are in conformity with accounting principles generally accepted in the United States of America (“U.S. GAAP”). The Funds are considered investment companies under U.S. GAAP and follow the accounting and reporting guidance applicable to investment companies in the Financial Accounting Standards Board Auditing Standards Codification Topic 946.
Securities traded on a national securities exchange are valued at the last reported sales price at the close of regular trading on each day the exchanges are open for trading. Securities traded on the National Association of Securities Dealers Automated Quotations (“NASDAQ”) are valued at the NASDAQ Official Closing Price, which may not necessarily represent the last sale price. Non-U.S. traded stocks are valued at the last sale price or official closing price in the primary local market where the stock is traded. Securities traded on an exchange for which there have been no sales are valued at the mean between the bid and ask price. Because trading on most non-U.S. exchanges is normally completed before the close of the New York Stock Exchange, the value of securities traded on foreign exchanges can change by the time a Fund calculates its net asset value per share (“NAV”). To address these changes, the Funds may utilize adjustment factors provided by an independent pricing service to systematically value foreign securities at fair value. These adjustment factors are based on statistical analyses of subsequent movement in securities indices, specific security prices, and exchange rates in foreign markets.
Securities for which quotations are not readily available are valued at their respective fair values as determined in good faith by a valuation committee of the Investment Advisor in accordance with procedures approved by the Trust’s Board of Trustees. In determining fair value, the Funds take into account all relevant factors and available information. Consequently, the price of a security used by a Fund to calculate its NAV may differ from quoted or published prices for the same security. Fair value pricing involves
36
Notes to Financial Statements
PRIMECAP Odyssey Funds
For the Year Ended October 31, 2016 – continued
subjective judgments, and there is no single standard for determining a security’s fair value. As a result, different mutual funds could reasonably arrive at a different fair value for the same security. It is possible that the fair value determined for a security is materially different from the value that could be realized upon the sale of that security or from the values that other mutual funds may determine.
Investments in other funds are valued at their respective net asset values as determined by those funds, in accordance with the 1940 Act. In May 2015, the Financial Accounting Standards Board (“FASB”) issued Accounting Standards Update No. 2015-07 (“ASU 2015-07”), “Fair Value Measurement (Topic 820): Disclosures for Investments in Certain Entities that Calculate Net Asset Value per Share (or its Equivalent).” ASU 2015-07 removes the requirement to categorize within the fair value hierarchy all investments for which fair value is measured using net asset value per share as a practical expedient. For public business entities, ASU 2015-07 is effective for fiscal years beginning after December 15, 2015. Early adoption is permitted. The Funds have considered the guidelines and do not expect material impact to the financial statements.
The NAV of a Fund is calculated by dividing the sum of the value of the securities held by the Fund, plus cash or other assets, minus all liabilities (including estimated accrued expenses), by the total number of outstanding shares of the Fund. The result is rounded to the nearest cent. The Funds’ shares will not be priced on the days on which the NYSE is closed for trading.
Securities and other assets and liabilities denominated in foreign currencies are translated into U.S. dollars using exchange rates as of 4 p.m. Eastern time on the valuation date. Purchases and sales of investments and dividend and interest income are converted into U.S. dollars using the spot market rate of exchange prevailing on the respective dates of such translations. Realized foreign exchange gains or losses may arise from 1) sales of foreign currencies; 2) currency gains or losses realized between the trade and settlement dates on securities transactions; and 3) the difference between the recorded amounts of dividends, interest, and foreign withholding taxes and the U.S. dollar equivalent of the amounts actually received or paid. Net unrealized foreign exchange gains and losses arise from changes in foreign exchange rates on foreign denominated assets and liabilities other than investments in securities held at the end of the reporting period. Foreign securities and currency transactions may involve risks not associated with U.S. securities and currency.
Each Fund has elected to be treated as a “regulated investment company” under Subchapter M of the Internal Revenue Code of 1986 (the “IRC”). Each Fund intends to distribute substantially all of its taxable income and any accumulated net realized capital gains. Accordingly, no provision for Federal income taxes has been made in the financial statements.
37
Notes to Financial Statements
PRIMECAP Odyssey Funds
For the Year Ended October 31, 2016 – continued
The Funds may be subject to foreign taxes on income, gains on investments, or currency repatriation, a portion of which may be reclaimed. The Funds will accrue such taxes and reclaims as applicable based upon their current interpretations of the tax rules and regulations that exist in the markets in which they invest.
Each Fund has adopted accounting standards regarding recognition and measurement of tax positions taken or expected to be taken on a tax return. The Funds recognize interest and penalties, if any, related to unrecognized tax benefits as income tax expense in the Statement of Operations. During the year ended October 31, 2016, the Funds did not incur any interest or penalties. As of October 31, 2016, open tax years include the tax years ended October 31, 2013 through October 31, 2016. No Fund is aware of any tax positions for which it is reasonably possible that the total amounts of unrecognized tax benefits will significantly change in the next 12 months.
Each Fund is charged for those expenses directly attributable to it. Expenses that are not directly attributable to a Fund are allocated among the Funds by an appropriate method based on the nature of the expense.
| | F. | Security Transactions, Investment Income, and Distributions |
Security transactions are accounted for on the trade date. Dividend income and distributions to shareholders are recorded on the ex-dividend date, and interest income is recognized on the accrual basis. Realized gains and losses are evaluated on the basis of identified costs. Premiums and discounts on the purchase of securities are amortized/accreted using the effective interest method. U.S. GAAP requires that permanent financial reporting and tax differences be reclassified in the capital accounts.
The preparation of financial statements in conformity with U.S. GAAP requires management to make estimates and assumptions that affect the reported amounts of assets and liabilities and disclosure of contingent assets and liabilities at the date of the financial statements, and the reported amounts of revenues and expenses during the reporting period. Actual results could differ from these estimates, and such differences could be material.
| | H. | Indemnification Obligations |
Under the Trust’s organizational documents, its current and former officers and trustees are indemnified against certain liabilities arising out of the performance of their duties to the Funds. In addition, in the normal course of business, the Funds enter into contracts that contain a variety of representations and warranties that provide general indemnifications. The Funds’ maximum exposure under these arrangements is unknown as this would involve future claims that may be made against the Funds that have not yet occurred. Based on experience, the Funds would expect the risk of loss to be minimal.
38
Notes to Financial Statements
PRIMECAP Odyssey Funds
For the Year Ended October 31, 2016 – continued
(3) Investment Transactions
The cost of purchases and the proceeds from sales of securities, excluding short-term investments, for the year ended October 31, 2016 were as follows:
| | | | | | | | |
Fund | | Purchases | | | Sales | |
Stock Fund | | $ | 1,063,258,382 | | | $ | 379,812,564 | |
Growth Fund | | $ | 904,330,019 | | | $ | 518,928,128 | |
Aggressive Growth Fund | | $ | 910,990,015 | | | $ | 1,068,379,585 | |
(4) Valuation Measurements
The Funds have adopted fair valuation accounting standards which establish an authoritative definition of fair value and set forth a hierarchy for measuring fair value. These standards require additional disclosure about the various inputs and valuation techniques used to develop the measurements of fair value and a discussion of changes in valuation techniques and related inputs during the period. These standards define fair value as the price that would be received in the sale of an asset or paid to transfer a liability in an orderly transaction between market participants on the measurement date. The fair value hierarchy is organized into three levels based upon the assumptions (referred to as “inputs”) used to value the asset or liability. These standards state that “observable inputs” reflect the significant assumptions that market participants would use in valuing an asset or liability based on market data obtained from independent sources. “Unobservable inputs” reflect the Funds’ own assumptions about the inputs market participants would use to value the asset or liability.
Various inputs are used in determining the value of each Fund’s investments, and the lowest level for any significant input determines leveling. These inputs are summarized in the three broad levels below:
| | Level 1 – | Unadjusted quoted prices in active markets for identical securities to which the Trust has access at the date of measurement. | |
| | Level 2 – | Other significant observable inputs (including quoted prices for similar or related securities in both active and inactive markets, interest rates, foreign exchange rates, and fair value estimates for foreign securities indices). | |
| | Level 3 – | Significant unobservable inputs to the extent observable inputs are unavailable (including the Funds’ own assumptions in determining fair value of investments based on the best available information). | |
39
Notes to Financial Statements
PRIMECAP Odyssey Funds
For the Year Ended October 31, 2016 – continued
The following table provides the fair value measurements of applicable Fund assets by level within the fair value hierarchy for each Fund as of October 31, 2016. The Funds’ policy is to recognize transfers between Level 1, Level 2 and Level 3 as of the beginning of the fiscal year. There were no transfers into or out of Level 1, Level 2, or Level 3 during the reporting period. These assets are measured on a recurring basis.
| | | | | | | | | | | | | | | | | | |
Fund | | Description | | Quoted prices
in active
markets for
identical assets
(Level 1) | | | Significant
other
observable
inputs
(Level 2) | | | Significant
unobservable
inputs
(Level 3) | | | Total | |
| | | | | |
| Stock Fund | | Common Stock(1) | | $ | 5,401,755,585 | | | $ | — | | | $ | — | | | $ | 5,401,755,585 | |
| | Short-Term Investments | | $ | 261,152,946 | | | | — | | | | — | | | | 261,152,946 | |
| | | | | | | | | | | | | | | | | | |
| | Total Investments in Securities | | $ | 5,662,908,531 | | | $ | — | | | $ | — | | | $ | 5,662,908,531 | |
| | | | | | | | | | | | | | | | | | |
| | | | | |
| Growth Fund | | Common Stock(1) | | $ | 6,334,775,042 | | | $ | — | | | $ | — | | | $ | 6,334,775,042 | |
| | Rights (Health Care) | | | — | | | | — | | | | 33,300 | | | | 33,300 | |
| | Short-Term Investments | | | 284,531,314 | | | | — | | | | — | | | | 284,531,314 | |
| | | | | | | | | | | | | | | | | | |
| | Total Investments in Securities | | $ | 6,619,306,356 | | | $ | — | | | $ | 33,300 | | | $ | 6,619,339,656 | |
| | | | | | | | | | | | | | | | | | |
| | | | | |
| Aggressive Growth Fund | | Common Stock(1) | | $ | 6,451,740,006 | | | $ | — | | | $ | — | | | $ | 6,451,740,006 | |
| | Rights (Health Care) | | | — | | | | — | | | | 8,480,090 | | | | 8,480,090 | |
| | Short-Term Investments | | | 278,005,117 | | | | — | | | | — | | | | 278,005,117 | |
| | | | | | | | | | | | | | | | | | |
| | Total Investments in Securities | | $ | 6,729,745,123 | | | $ | — | | | $ | 8,480,090 | | | $ | 6,738,225,213 | |
| | | | | | | | | | | | | | | | | | |
| | (1) | Refer to each Fund’s respective Schedule of Investments for the breakdown of major categories. |
Following is a reconciliation of investments in which significant unobservable inputs (Level 3) were used in determining fair value.
| | | | | | | | |
Dyax Corp. Contingent Value Rights | |
| | | Growth Fund | | | Aggressive
Growth Fund | |
Balance at October 31, 2015 | | $ | — | | | $ | — | |
Purchase/Received | | | 33,300 | | | | 8,480,090 | |
Sales | | | — | | | | — | |
Realized Gain (Loss) | | | — | | | | — | |
Change in unrealized appreciation | | | — | | | | — | |
Transfers into (Transfers out of) Level 3 | | | — | | | | — | |
| | | | | | | | |
Balance at October 31, 2016 | | $ | 33,300 | | | $ | 8,480,090 | |
| | | | | | | �� | |
The Growth and Aggressive Growth Funds received Dyax Corp. Contingent Value Rights (“Dyax CVR”) when Dyax Corp. was acquired by Shire PLC. In valuing Dyax CVR, the Funds considered the final trading price of Dyax Corp. prior to the acquisition, the amount of cash
40
Notes to Financial Statements
PRIMECAP Odyssey Funds
For the Year Ended October 31, 2016 – continued
received by Dyax Corp. shareholders, and the terms of the Dyax CVR. Dyax CVR are non-tradable.
(5) Distribution to Shareholders
Net investment income and net realized gains differ for financial statement and tax purposes due to differing treatments of deferred wash sale losses.
As of October 31, 2016, the components of capital on a tax basis were as follows:
| | | | | | | | | | | | |
| | | PRIMECAP
Odyssey
Stock Fund | | | PRIMECAP
Odyssey
Growth Fund | | | PRIMECAP
Odyssey Aggressive
Growth Fund | |
Cost of investments for tax purposes(1) | | $ | 4,548,305,072 | | | $ | 4,761,925,428 | | | $ | 5,071,669,912 | |
| | | | | | | | | | | | |
Gross tax unrealized appreciation | | | 1,361,577,303 | | | | 2,203,953,224 | | | | 2,339,898,595 | |
Gross tax unrealized depreciation | | | (247,054,338 | ) | | | (346,664,243 | ) | | | (673,434,385 | ) |
| | | | | | | | | | | | |
Net tax unrealized appreciation | | | 1,114,522,965 | | | | 1,857,288,981 | | | | 1,666,464,210 | |
| | | | | | | | | | | | |
Undistributed ordinary income | | | 73,512,784 | | | | 72,130,231 | | | | 1,218,306 | |
Undistributed long-term capital gain | | | 86,982,478 | | | | 160,379,151 | | | | 551,753,018 | |
| | | | | | | | | | | | |
Total distributable earnings | | | 160,495,262 | | | | 232,509,382 | | | | 552,971,324 | |
| | | | | | | | | | | | |
Other accumulated gain (loss) | | | — | | | | — | | | | — | |
| | | | | | | | | | | | |
Total accumulated gain | | $ | 1,275,018,227 | | | $ | 2,089,798,363 | | | $ | 2,219,435,534 | |
| | | | | | | | | | | | |
| | (1) | At October 31, 2016 the differences in the basis for federal income tax purposes and financial reporting purposes are due to the tax deferral of losses on wash sales. |
U.S. GAAP requires that permanent book-to-tax differences be reclassified among the components of net assets. These reclassifications have no effect on net assets or NAV. For the fiscal year ended October 31, 2016, the following reclassifications were made:
| | | | | | | | | | | | |
| | | Undistributed
Net Investment
Loss | | | Accumulated
Net Realized
Loss | | | Paid In Capital | |
Stock Fund | | $ | (68,984) | | | $ | (20,725,311) | | | $ | 20,794,295 | |
Growth Fund | | | (7,489) | | | | (25,731,499) | | | | 25,738,988 | |
Aggressive Growth Fund | | | 10,216,447 | | | | (59,039,586) | | | | 48,823,139 | |
The Funds used a tax accounting practice to treat a portion of the price of capital shares redeemed during the year as distributions from net realized capital gains. The PRIMECAP Odyssey Stock
41
Notes to Financial Statements
PRIMECAP Odyssey Funds
For the Year Ended October 31, 2016 – continued
Fund, PRIMECAP Odyssey Growth Fund, and PRIMECAP Odyssey Aggressive Growth Fund reclassified $20,794,295, $25,738,988, and $48,823,139 respectively, from Accumulated Net Realized Gain to Paid In Capital. Other permanent book-to-tax differences that required reclassification among the Funds’ capital accounts related to foreign currency adjustments and net operating losses.
Tax components of dividends paid during the fiscal years ended October 31, 2016 and October 31, 2015 were as follows:
| | | | | | | | | | | | | | | | |
| | | October 31, 2016 | | | October 31, 2015 | |
| | | Ordinary
Income
Distributions | | | Long-Term
Capital Gain
Distributions | | | Ordinary
Income
Distributions | | | Long-Term
Capital Gain
Distributions | |
Stock Fund | | $ | 54,251,996 | | | $ | 41,880,379 | | | $ | 53,436,424 | | | $ | 50,178,657 | |
Growth Fund | | $ | 23,451,144 | | | $ | 59,120,526 | | | $ | 47,607,189 | | | $ | 101,311,643 | |
Aggressive Growth Fund | | $ | 503,498 | | | $ | 397,233,594 | | | $ | 54,284,835 | | | $ | 229,581,076 | |
The Funds designated as long-term capital gain dividends, pursuant to IRC Section 852 (b) (3), the amounts necessary to reduce the earnings and profits of the Funds related to net capital gains to zero for the tax year ended October 31, 2016.
(6) Investment Advisory and Other Agreements
The Trust has entered into an investment management agreement with the Investment Advisor on behalf of each Fund. For its services to the Funds, the Investment Advisor receives a fee paid quarterly at the annual rate of 0.60% of the first $100 million of each Fund’s average daily net assets and 0.55% of each Fund’s average daily net assets in excess of $100 million. For the year ended October 31, 2016, each Fund paid the Investment Advisor at an effective annual rate of 0.55% of its respective average net assets.
The Bank of New York Mellon serves as the Funds’ custodian. U.S. Bancorp Fund Services, LLC (“USBFS”) serves as the administrator, fund accountant, and transfer agent to the Funds. Quasar Distributors, LLC, an affiliate of USBFS, serves as the Funds’ distributor.
During the year ended October 31, 2016, the Advisor reimbursed the Stock Fund $57,188 for net losses realized on the sale of a stock that was not eligible for purchase by the Fund. The transfer agent reimbursed the Growth Fund $403,379 for losses incurred as the result of a shareholder transaction that was recorded incorrectly. These amounts are shown as “Other capital contributions” on each Fund’s respective Statement of Changes in Net Assets.
42
Notes to Financial Statements
PRIMECAP Odyssey Funds
For the Year Ended October 31, 2016 – continued
(7) Other Affiliates
Certain of the Funds’ investments are in companies that are considered to be affiliated companies of a Fund because the Fund owns 5% or more of the outstanding voting securities of the company. Transactions during the period in securities of these companies were as follows:
PRIMECAP Odyssey Stock Fund
| | | | | | | | | | | | | | | | | | | | | | | | |
| | | | | | Current Period Transactions | | | | |
Common Stock | | Market
Value at
October 31,
2015 | | | Purchases
at Cost | | | Proceeds
from
Securities
Sold | | | Dividend
Income | | | Realized
Gain
(Loss) | | | Market
Value at
October 31,
2016 | |
tronc, Inc.(1)(2) | | $ | 17,148,704 | | | $ | — | | | $ | — | | | $ | 317,905 | | | $ | — | | | | N/A | |
| | | | | | | | | | | | | | | | | | | | | | | | |
Total | | $ | 17,148,704 | | | $ | — | | | $ | — | | | $ | 317,905 | | | $ | — | | | $ | — | |
| | | | | | | | | | | | | | | | | | | | | | | | |
PRIMECAP Odyssey Growth Fund
| | | | | | | | | | | | | | | | | | | | | | | | |
| | | | | | Current Period Transactions | | | | |
Common Stock | | Market
Value at
October 31,
2015 | | | Purchases
at Cost | | | Proceeds
from
Securities
Sold | | | Dividend
Income | | | Realized
Gain
(Loss) | | | Market
Value at
October 31,
2016 | |
Boulder Brands, Inc.(2)(3) | | $ | 27,363,321 | | | $ | — | | | $ | 33,971,556 | | | $ | — | | | $ | 7,326,938 | | | | N/A | |
ImmunoGen, Inc. | | | 78,870,332 | | | | — | | | | 10,167,909 | | | | — | | | | (10,596,941 | ) | | $ | 8,206,380 | |
| | | | | | | | | | | | | | | | | | | | | | | | |
Total | | $ | 106,233,653 | | | $ | — | | | $ | 44,139,465 | | | $ | — | | | $ | (3,270,003 | ) | | $ | 8,206,380 | |
| | | | | | | | | | | | | | | | | | | | | | | | |
| | (1) | During the period, Tribune Publishing Co. changed its name to tronc, Inc. Due to an increase in outstanding shares, tronc, Inc. is no longer an affiliate as of October 31, 2016. |
| | (2) | No longer an affiliate as of October 31, 2016. |
| | (3) | Included in “Proceeds from Securities Sold” are proceeds received when Boulder Brands, Inc. was acquired in an all cash transaction. |
43
Notes to Financial Statements
PRIMECAP Odyssey Funds
For the Year Ended October 31, 2016 – continued
PRIMECAP Odyssey Aggressive Growth Fund
| | | | | | | | | | | | | | | | | | | | | | | | |
| | | | | | Current Period Transactions | | | | |
Common Stock | | Market
Value at
October 31,
2015 | | | Purchases at
Cost | | | Proceeds
from
Securities
Sold | | | Dividend
Income | | | Realized
Gain
(Loss) | | | Market
Value at
October 31,
2016 | |
Abaxis, Inc. | | $ | 107,600,030 | | | $ | 194,044 | | | $ | — | | | $ | 986,610 | | | $ | — | | | $ | 102,497,780 | |
ABIOMED, Inc.(2) | | | 194,489,875 | | | | 158,177 | | | | 56,345,612 | | | | — | | | | 46,834,737 | | | | N/A | |
Affymetrix, Inc.(2)(4) | | | 46,064,400 | | | | — | | | | 70,098,287 | | | | — | | | | 36,997,265 | | | | N/A | |
Arbutus Biopharma Corp. | | | 15,609,000 | | | | 3,968,504 | | | | — | | | | — | | | | — | | | | 12,222,000 | |
Axcelis Technologies, Inc. | | | 31,640,000 | | | | 821,044 | | | | — | | | | — | | | | — | | | | 39,687,375 | |
Boot Barn Holdings, Inc. | | | 20,527,500 | | | | 4,620,190 | | | | 343,642 | | | | — | | | | (293,345 | ) | | | 22,675,059 | |
Boulder Brands, Inc.(2)(3) | | | 40,846,274 | | | | — | | | | 50,707,197 | | | | — | | | | 25,394,449 | | | | N/A | |
Cerus Corp | | | 35,775,000 | | | | 1,607,174 | | | | — | | | | — | | | | — | | | | 37,596,000 | |
Chegg, Inc. | | | 59,246,850 | | | | 151,773 | | | | — | | | | — | | | | — | | | | 57,313,025 | |
comScore, Inc. | | | 136,624,775 | | | | 44,152,963 | | | | — | | | | — | | | | — | | | | 134,713,016 | |
Dextera Surgical, Inc.(5) | | | 1,072,668 | | | | — | | | | — | | | | — | | | | — | | | | 919,582 | |
DreamWorks Animation SKG, Inc.(2) | | | 115,503,608 | | | | — | | | | 233,950,304 | | | | — | | | | 110,517,708 | | | | N/A | |
Dyax, Corp.(2)(6) | | | 211,697,992 | | | | — | | | | 286,835,096 | | | | — | | | | 263,822,454 | | | | N/A | |
Ellie Mae, Inc. | | | 202,826,016 | | | | — | | | | 19,340,873 | | | | — | | | | 12,863,778 | | | | 272,423,203 | |
Epizyme, Inc. | | | 35,771,122 | | | | 8,256,772 | | | | 1,377,445 | | | | — | | | | (1,282,024 | ) | | | 32,170,795 | |
FARO Technologies, Inc. | | | 50,560,720 | | | | 1,063,432 | | | | — | | | | — | | | | — | | | | 51,342,303 | |
Fluidigm Corp. | | | 31,036,937 | | | | 180,412 | | | | — | | | | — | | | | — | | | | 13,392,423 | |
Guidance Software, Inc. | | | 16,172,785 | | | | 1,107,870 | | | | — | | | | — | | | | — | | | | 15,851,081 | |
Marrone Bio Innovations, Inc. | | | 5,766,000 | | | | — | | | | — | | | | — | | | | — | | | | 4,650,000 | |
Nektar Therapeutics | | | 138,497,142 | | | | 13,907,564 | | | | — | | | | — | | | | — | | | | 157,242,292 | |
Novadaq Techologies, Inc. | | | 64,781,270 | | | | 7,078,853 | | | | — | | | | — | | | | — | | | | 63,175,337 | |
Pfenex, Inc. | | | 41,547,840 | | | | 380,793 | | | | — | | | | — | | | | — | | | | 18,663,300 | |
Rubicon Project, Inc. (The)(7) | | | N/A | | | | 31,613,455 | | | | 8,623,990 | | | | — | | | | (6,947,867 | ) | | | 23,766,881 | |
ServiceSource International, Inc. | | | 36,245,895 | | | | 295,500 | | | | — | | | | — | | | | — | | | | 40,594,213 | |
Shutterfly, Inc. | | | 127,469,931 | | | | — | | | | 6,097,454 | | | | — | | | | (220,172 | ) | | | 144,045,300 | |
TerraVia Holdings, Inc.(8) | | | 24,920,827 | | | | 253,857 | | | | — | | | | — | | | | — | | | | 18,089,861 | |
tronc, Inc.(1)(2) | | | 14,784,466 | | | | — | | | | 1,199,823 | | | | 274,076 | | | | (2,566,846 | ) | | | N/A | |
Tuesday Morning Corp. | | | 19,900,068 | | | | — | | | | 8,752,112 | | | | — | | | | (8,691,622 | ) | | | 11,171,601 | |
Xencor, Inc.(7) | | | N/A | | | | 25,472,910 | | | | — | | | | — | | | | — | | | | 84,917,294 | |
| | | | | | | | | | | | | | | | | | | | | | | | |
Total | | $ | 1,826,978,991 | | | $ | 145,285,287 | | | $ | 743,671,835 | | | $ | 1,260,686 | | | $ | 476,428,515 | | | $ | 1,359,119,721 | |
| | | | | | | | | | | | | | | | | | | | | | | | |
| | (1) | During the period, Tribune Publishing Co. changed its name to tronc, Inc. Due to an increase in outstanding shares, tronc, Inc. is no longer an affiliate as of October 31, 2016. |
| | (2) | No longer an affiliate as of October 31, 2016. |
| | (3) | Included in “Proceeds from Securities Sold” are proceeds received when Boulder Brands, Inc. was acquired in an all cash transaction. |
| | (4) | Included in “Proceeds from Securities Sold” are proceeds received when Affymetrix, Inc. was acquired in an all cash transaction. |
| | (5) | During the period, Cardica, Inc. changed its name to Dextera Surgical, Inc. |
| | (6) | Included in “Proceeds from Securities Sold” are proceeds received when Dyax, Corp. was acquired. In addition to cash, Dyax Corp. shareholders also received Dyax Corp. Contingent Value Rights. |
| | (7) | As of October 31, 2015, the company was not an affiliate. |
| | (8) | During the period, Solazyme, Inc. changed its name to TerraVia Holdings, Inc. |
44
Notes to Financial Statements
PRIMECAP Odyssey Funds
For the Year Ended October 31, 2016 – continued
(8) Subsequent Events
The Funds have evaluated subsequent events through the issuance of the financial statements and determined that no events have occurred that require disclosure.
45
| | |
| | Report of Independent Registered Public Accounting Firm |
To the Board of Trustees and Shareholders
of the PRIMECAP Odyssey Funds:
In our opinion, the accompanying statements of assets and liabilities, including the schedules of investments, and the related statements of operations and of changes in net assets and the financial highlights present fairly, in all material respects, the financial position of PRIMECAP Odyssey Stock Fund, PRIMECAP Odyssey Growth Fund and PRIMECAP Odyssey Aggressive Growth Fund (the “Funds”) at October 31, 2016, the results of each of their operations for the year then ended, the changes in each of their net assets for each of the two years in the period then ended and the financial highlights for each of the five years in the period then ended, in conformity with accounting principles generally accepted in the United States of America. These financial statements and financial highlights (hereafter referred to as “financial statements”) are the responsibility of the Funds’ management. Our responsibility is to express an opinion on these financial statements based on our audits. We conducted our audits of these financial statements in accordance with the standards of the Public Company Accounting Oversight Board (United States). Those standards require that we plan and perform the audit to obtain reasonable assurance about whether the financial statements are free of material misstatement. An audit includes examining, on a test basis, evidence supporting the amounts and disclosures in the financial statements, assessing the accounting principles used and significant estimates made by management, and evaluating the overall financial statement presentation. We believe that our audits, which included confirmation of securities at October 31, 2016 by correspondence with the custodian and brokers, provide a reasonable basis for our opinion.
PricewaterhouseCoopers LLP
San Francisco, California
December 13, 2016
46
| | |
| | Expense Example PRIMECAP Odyssey Funds (Unaudited) |
As a shareholder of one or more of the Funds, you incur ongoing costs including management fees and other Fund expenses. This expense example is intended to help you understand your ongoing costs (in dollars) of investing in the Funds and to compare these costs with the ongoing costs of investing in other mutual funds.
The expense example is based on an investment of $1,000 invested for a six-month period beginning May 1, 2016 through October 31, 2016.
Actual Expenses
The information in the table adjacent to the heading “Actual Performance” provides actual account values and actual expenses. You may use the information in these columns, together with the amount you invested, to estimate the expenses that you paid over the period. Simply divide your account value by $1,000 (for example, an $8,600 account value divided by $1,000 = 8.6), then multiply the result by the number in the column entitled “Expenses Paid during Period” to estimate the expenses you paid on your account during this period.
Hypothetical Example for Comparison Purposes
The information in the table adjacent to the heading “Hypothetical Performance (5% return before expenses)” provides hypothetical account values and hypothetical expenses based on the Funds’ actual expense ratios and an assumed rate of return of 5% per year before expenses, which are not the Funds’ actual returns. The hypothetical account values and expenses may not be used to estimate the actual ending account balance or expenses you paid for the period. You may use this information to compare the ongoing costs of investing in the Funds and other mutual funds. To do so, compare these 5% hypothetical examples with the 5% hypothetical examples that appear in the shareholder reports of the other mutual funds.
Please note that the expenses shown in the table are meant to highlight your ongoing costs only. Therefore, the information adjacent to the heading “Hypothetical Performance (5% return before expenses)” is useful in comparing ongoing costs only and will not help you determine the relative total costs of owning different mutual funds. In addition, if transactional costs were included, your costs would have been higher.
47
Expense Example
PRIMECAP Odyssey Funds
(Unaudited) – continued
| | | | | | | | | | | | | | | | |
| | | Beginning Account Value (5/1/16) | | | Ending Account Value (10/31/16) | | | Expenses Paid During Period(1) (5/1/16 to 10/31/16) | | | Expense Ratio During Period(1) (5/1/16 to 10/31/16) | |
PRIMECAP Odyssey Stock Fund | |
Actual Performance | | $ | 1,000.00 | | | $ | 1060.20 | | | $ | 3.49 | | | | 0.67% | |
Hypothetical Performance
(5% return before expenses) | | $ | 1,000.00 | | | $ | 1021.75 | | | $ | 3.42 | | | | 0.67% | |
PRIMECAP Odyssey Growth Fund | |
Actual Performance | | $ | 1,000.00 | | | $ | 1078.10 | | | $ | 3.37 | | | | 0.64% | |
Hypothetical Performance
(5% return before expenses) | | $ | 1,000.00 | | | $ | 1021.90 | | | $ | 3.28 | | | | 0.64% | |
PRIMECAP Odyssey Aggressive Growth Fund | |
Actual Performance | | $ | 1,000.00 | | | $ | 1091.10 | | | $ | 3.30 | | | | 0.63% | |
Hypothetical Performance
(5% return before expenses) | | $ | 1,000.00 | | | $ | 1021.99 | | | $ | 3.19 | | | | 0.63% | |
| | (1) | Expenses are equal to a Fund’s annualized expense ratio as indicated, multiplied by the average account value over the period, multiplied by the number of days in the most recent fiscal half-year period (184), then divided by the number of days in the fiscal year (365) to reflect the one-half year period. |
48
| | |
| | Additional Information PRIMECAP Odyssey Funds (Unaudited) |
Additional Tax Information
PRIMECAP Odyssey Stock Fund, PRIMECAP Odyssey Growth Fund, and PRIMECAP Odyssey Aggressive Growth Fund designate 100%, 100%, and 99.03%, respectively, of ordinary income distributions paid during the fiscal year ended October 31, 2016 as qualified dividend income.
PRIMECAP Odyssey Stock Fund, PRIMECAP Odyssey Growth Fund, and PRIMECAP Odyssey Aggressive Growth Fund designate 100%, 96.20%, and 100%, respectively, of ordinary income distributions paid during the fiscal year ended October 31, 2016 as dividends qualifying for the dividends received deduction available for corporate shareholders.
PRIMECAP Odyssey Stock Fund and PRIMECAP Odyssey Growth Fund designate 5.07% and 1.65%, respectively, of ordinary income distributions paid during the fiscal year ended October 31, 2016 as short-term capital gain under Internal Revenue Code 871(k)(2)(C).
Proxy Voting Procedures
The Investment Advisor votes proxies relating to portfolio securities in accordance with procedures that have been approved by the Trust’s Board of Trustees. You may obtain a description of these procedures, free of charge, by calling toll-free 1-800-729-2307. This information is also available through the Securities and Exchange Commission’s (“SEC”) website at www.sec.gov.
Proxy Voting Record
Information regarding how the Funds voted proxies relating to the portfolio securities during the most recent 12-month period ended June 30 is available, without charge, by calling toll-free 1-800-729-2307. This information is also available through the SEC’s website at www.sec.gov.
Form N-Q Disclosure
The Funds file a complete schedule of portfolio holdings with the SEC for the first and third quarters of each fiscal year on Form N-Q. This information is available, without charge, by calling toll-free 1-800-729-2307. The Funds’ Forms N-Q are also available on the SEC’s website at www.sec.gov. The Funds’ Forms N-Q may be reviewed and copied at the Commission’s Public Reference Room in Washington, DC, and information on the operation of the Public Reference Room may be obtained by calling 1-800-SEC-0330.
Board Approval of the Renewal of the Investment Advisory Agreement
The Board of Trustees (the “Board”) of PRIMECAP Odyssey Funds (the “Trust”) is comprised of five Trustees, four of whom are not “interested persons” of the Trust as defined by the Investment Company Act of 1940, as amended (the “Independent Trustees”). In September 2016, the Board of Trustees, including the Independent Trustees, approved a one-year renewal of the Trust’s investment advisory agreement with PRIMECAP Management Company (the “Advisor”) with respect to the series of the Trust (the “Funds”).
49
Additional Information
PRIMECAP Odyssey Funds
(Unaudited) – continued
General Information
As part of the annual contract review process, the Independent Trustees, through Trust counsel, requested and received extensive materials, including information related to the nature, extent, and quality of the services provided to the Funds by the Advisor; the short- and long-term performance of each Fund relative to the performance of market indices and other funds in its category as selected by Morningstar, Inc. (“Morningstar”); the advisory fees paid to the Advisor and the total expense ratio of each Fund compared to the advisory fees and the total expense ratios of other funds in the Fund’s Morningstar category; financial information for the Advisor and information related to the profitability to the Advisor of the investment advisory agreement with the Trust; the extent to which the Advisor expects to achieve economies of scale in connection with the services it provides to each Fund; any ancillary or “fall out” benefits that the Advisor may derive from its relationship with the Funds; and the personnel of the Advisor providing services to the Funds. The Independent Trustees also requested and received information regarding the Advisor’s risk controls, risk evaluation processes, compliance program (including brokerage and trading processes), business continuity plans, and other matters.
The Trust engaged Morningstar to prepare an independent expense and performance analysis for each Fund compared to similar funds managed by other advisors identified by Morningstar. The Board reviewed the Morningstar materials, which included comparisons of the performance and risk profile of each Fund to those of relevant market indices and of other funds in the relevant Morningstar institutional and retail categories and in a smaller group of funds selected by Morningstar (each a “peer group”). The Morningstar materials also included for each Fund comparisons of advisory fees and total expenses to those of other funds in the relevant Morningstar category and peer group.
With respect to investment performance, the Trustees noted that the Advisor had made quarterly presentations to the Board regarding the Funds’ portfolio construction, investment strategies, and results. The Trustees also noted that in addition to meeting with the Funds’ portfolio managers on a quarterly basis, they also received presentations from different analysts throughout the year on specific investment sectors and each Fund’s investments in those sectors. In considering the renewal of the agreement, the Board also took into account other information it had received at past Board and committee meetings with respect to various matters.
The Independent Trustees reviewed information from Trust counsel regarding their responsibilities in considering whether to renew the investment advisory agreement for an additional one-year period. In connection with their deliberations, the Board considered such information and factors that they believed to be relevant. The Board considered renewal of the investment advisory agreement separately for each Fund, although the Board took into account the common interests of all the Funds in its review. In considering these matters, the Board discussed the renewal of the investment advisory agreement with management, and the Independent Trustees met in a private session with Trust counsel at which no employees of the Advisor were present.
In deciding to approve the renewal of the investment advisory agreement, the Board and the Independent Trustees did not identify a single factor that was controlling. The Board and the
50
Additional Information
PRIMECAP Odyssey Funds
(Unaudited) – continued
Independent Trustees concluded that each of the various factors referred to below favored such approval. The following summary describes the key factors considered by the Independent Trustees and their conclusions that formed the basis for approving the renewal of the investment advisory agreement in light of the legal advice furnished by counsel and their own business judgment. This summary is not inclusive of all of the factors considered, and each Board member did not necessarily attribute the same weight to each factor.
Nature, Extent, and Quality of Services
The Board considered the services provided by the Advisor to the Funds under the investment advisory agreement, including the background, education, and experience of the Advisor’s key portfolio management, compliance, and operational personnel; its overall financial strength and stability; its resources and efforts to retain, attract, and motivate capable personnel to serve the Funds; and the overall general quality and depth of its organization. The Board also took into account the experience, capability, and integrity of the Advisor’s senior management, the time that senior management commits to the Funds, and the Advisor’s demonstrated commitment to the Funds; its investment philosophy and processes, including its brokerage and trading practices; its disaster recovery and contingency planning; its oversight of the Funds’ internal control environment with regard to compliance with applicable laws and regulations; and the significant investment by each portfolio manager in the Funds that he manages, which helps align his interests with those of Fund shareholders. The Board and the Independent Trustees concluded that the nature, extent, and quality of services provided under the investment advisory agreement were of a high level and satisfactory.
Investment Performance
The Board assessed the performance of each Fund compared with the performance of its benchmark, the S&P 500 Index, and other funds in the Fund’s Morningstar retail category and peer group for the one-year, three-year, five-year and ten-year periods ended July 31, 2016. The Board made the following observations in reviewing the Funds’ performance:
| | • | | The annualized total returns of the PRIMECAP Odyssey Stock Fund were higher than the returns of the S&P 500 Index during the ten-year and since inception periods ended July 31, 2016. The Fund underperformed the S&P 500 Index for the one-, three-, and five- year periods by 1.85%, 0.21%, and 0.10%, respectively. The Fund’s performance was above the median of funds in the Morningstar Large Cap Blend category for all time periods. |
| | • | | The annualized total returns of the PRIMECAP Odyssey Growth Fund were above those of the S&P 500 Index for the five- and ten-year and since inception periods ended July 31, 2016, but trailed the Index for the one-year period by 3.53% and the three-year period by 0.55%. The Fund’s performance was above the median return of the Morningstar Large Cap Growth category for all periods with the exception of the three-year period, where the Fund ranked in the 51st percentile. |
| | • | | The annualized total returns of the PRIMECAP Odyssey Aggressive Growth Fund outperformed the S&P 500 Index for all time periods ended July 31, 2016, except that the |
51
Additional Information
PRIMECAP Odyssey Funds
(Unaudited) – continued
| | Fund’s performance for the one-year period was below the return of the S&P 500 Index for the one-year period by 2.41%. The Fund’s returns exceeded the median returns of the Morningstar Mid Cap Growth category for all time periods. |
Based on the information provided to them and in consideration of the specific investment objectives and risk profiles of each Fund, the Board and the Independent Trustees concluded that the performance of each Fund was satisfactory.
Advisory Fees and Fund Expenses
The Board reviewed the advisory fees and expenses paid by each Fund compared to those of other funds in the same Morningstar retail category (for the Stock Fund – Large Blend funds; for the Growth Fund – Large Growth funds; and for the Aggressive Growth Fund – Mid-Cap Growth funds), and of other funds in the Fund’s expense peer group, which was selected by Morningstar and was comprised of funds comparable to the Fund with fee structures and characteristics similar to those of the Funds (e.g., no distribution or shareholder servicing fees, and excluding load funds, index and enhanced index funds, funds of funds, and multi-manager funds). The Independent Trustees observed that the advisory fee of each Fund was below the median fees of the funds in the relevant Morningstar retail category and the Fund’s peer group. With respect to the Funds’ total expense ratios, in each case the total expense ratio of the Fund was in the lowest quartile of funds its selected peer group. The total expense ratios for the Growth and Aggressive Growth Funds were in the lowest quartile relative to their respective Morningstar retail categories, while the Stock Fund’s total expense ratio was in the second quartile of its Morningstar retail category.
The Board also reviewed the fees charged by the Advisor to other clients, including other mutual funds for which it provides sub-advisory services. The Board considered that although those fees were lower than those charged by the Advisor to the Funds, the differences appropriately reflected the investment, operational, and regulatory differences between advising other clients and the Funds, noting that mutual funds are subject to certain requirements under the 1940 Act that do not apply to the Advisor’s separate account clients. The Board and the Independent Trustees determined that the advisory fees and expenses charged to the Funds were reasonable in consideration of the services provided.
Costs and Profits of the Advisor
The Board reviewed information regarding the Advisor’s financial position and concluded that the Advisor would be able to continue to provide advisory services to the Funds. The Board also reviewed information relating to the Advisor’s profitability with respect to the investment advisory agreement and concluded that the profit levels were reasonable in light of the nature, extent, and quality of the services provided by the Advisor to the Funds. The Board noted that the Advisor had closed the Aggressive Growth Fund in January 2014 to most new investors, limiting the growth of the Fund and consequently future profits to the Advisor as it relates to the Aggressive Growth Fund. In considering the Advisor’s profitability, the Independent Trustees recognized the importance of the profitability of the Advisor, not only in maintaining its own financial condition, but also in maintaining an environment in which it is able to attract and retain talented investment professionals.
52
Additional Information
PRIMECAP Odyssey Funds
(Unaudited) – continued
Economies of Scale and Other Benefits to the Investment Advisor
The Board and the Independent Trustees noted that the Investment Advisory Agreement provides for a fee breakpoint at $100 million in assets for each Fund and concluded that the Funds had benefitted from economies of scale achieved by the Advisor through the breakpoints and advisory fees that are generally low relative to other actively managed funds with similar investment objectives. The Board also considered the benefits received by the Advisor as a result of its relationship with the Funds other than investment advisory fees, including any research received by broker-dealers providing execution services to the Funds, and the intangible benefits of the Advisor’s association with the Funds generally and any favorable publicity arising in connection with the Funds’ performance.
Conclusions
Based on their review, including their consideration of each of the factors referred to above, the Board and the Independent Trustees concluded that the compensation payable to the Advisor pursuant to the investment advisory agreement with respect to each Fund is fair and reasonable in light of the services being provided by the Advisor to the Fund and its shareholders, and that renewal of the investment advisory agreement with respect to each Fund was in the best interest of the Fund and its shareholders.
53
| | |
| | Management PRIMECAP Odyssey Funds (Unaudited) |
Portfolio Managers
PRIMECAP Management Company has five portfolio managers who together have more than 120 years of investment experience. The portfolio managers primarily responsible for overseeing the Funds’ investments are:
| | | | |
| Name | | Years of Experience | |
Theo A. Kolokotrones | | | 46 | |
Joel P. Fried | | | 31 | |
Alfred W. Mordecai | | | 19 | |
M. Mohsin Ansari | | | 16 | |
James Marchetti | | | 11 | |
Each of these five individuals manages a portion of the PRIMECAP Odyssey Stock Fund, the PRIMECAP Odyssey Growth Fund, and the PRIMECAP Odyssey Aggressive Growth Fund. A portion of each Fund’s assets may be managed by individuals in the Investment Advisor’s research department.
Officers and Trustees
The Trust’s officers, who oversee the Funds’ daily operations, are appointed by the Board of Trustees. The trustees are responsible for the overall management of the Trust, including establishing the Funds’ policies and general supervision and review of their investment activities. The Statement of Additional Information includes additional information about the trustees and is available, without charge, by calling 1-800-729-2307 or at the Funds’ website at www.odysseyfunds.com.
Executive Officers. The table below sets forth certain information about each of the Trust’s executive officers. The address for each officer is 177 East Colorado Boulevard, 11th Floor, Pasadena, CA 91105.
| | | | | | |
Name
(Year of Birth) | | Position(s)
Held
with Trust | | Term of Office;
Length of
Time Served | | Principal Occupation(s)
During Past 5 Years |
Theo A. Kolokotrones (1946) | | Co-Chief Executive Officer | | Indefinite;
Since 09/04 | | Chairman, Director, and Portfolio ManagerPRIMECAP Management Company |
Joel P. Fried (1962) | | Co-Chief Executive Officer and Trustee | | Indefinite;
Since 09/04 | | President, Director, and Portfolio Manager PRIMECAP Management Company |
54
Management
PRIMECAP Odyssey Funds
(Unaudited) – continued
| | | | | | |
Name
(Year of Birth) | | Position(s)
Held
with Trust | | Term of Office;
Length of
Time Served | | Principal Occupation(s)
During Past 5 Years |
Alfred W. Mordecai (1967) | | Co-Chief Executive Officer | | Indefinite;
Since 10/12 | | Vice Chairman, Director, and Portfolio Manager PRIMECAP Management Company |
Michael J. Ricks (1977) | | Chief Financial Officer, Chief Administrative Officer, and Secretary | | Indefinite;
Since 03/11 | | Director of Fund Administration PRIMECAP Management Company |
Karen Chen (1973) | | Vice President of Compliance, Chief Compliance Officer, and AML Officer | | Indefinite;
Since 10/04 | | Chief Compliance Officer, Director of Compliance and Reporting
PRIMECAP Management Company |
“Independent” Trustees. The table below sets forth certain information about each of the trustees of the Trust who is not an “interested person” of the Trust as defined in the 1940 Act (“Independent Trustees”). The address for each independent trustee is 177 East Colorado Boulevard, 11th Floor, Pasadena, CA 91105.
| | | | | | | | | | |
Name
(Year of Birth) | | Position(s)
Held
with Trust | | Term of
Office;
Length of
Time Served | | Principal Occupation(s)
During Past 5 Years | | Number of
Portfolios in
Fund Complex
Overseen by
Trustee(1) | | Other
Director-
ships Held
by Trustee |
Benjamin F. Hammon (1935) | | Chairman of the Board and Trustee | | Indefinite;
Since 09/04 | | Retired; Private investor | | 3 | | None |
Wayne H. Smith (1941) | | Chairman of the Audit Committee and Trustee | | Indefinite;
Since 09/04 | | Retired; Private investor | | 3 | | None |
Joseph G. Uzelac
(1944) | | Trustee | | Indefinite;
Since 10/07 | | Retired; Private investor | | 3 | | None |
Elizabeth D. Obershaw
(1960) | | Trustee | | Indefinite;
Since 06/08 | | Managing Director, Horsley Bridge Partners, an investment advisor (2007-present) | | 3 | | None |
| | (1) | Fund Complex includes any funds, series of funds, or trusts that share the same advisor or that hold themselves out to investors as related companies. |
55
Management
PRIMECAP Odyssey Funds
(Unaudited) – continued
“Interested” Trustees. The table below sets forth certain information about each of the trustees of the Trust who is an “interested person” of the Trust as defined by the 1940 Act. The address for each interested trustee is 177 East Colorado Boulevard, 11th Floor, Pasadena, CA 91105.
| | | | | | | | | | |
Name
(Year of Birth) | | Position(s)
Held
with Trust | | Term of
Office;
Length of
Time Served | | Principal Occupation(s) During Past 5 Years | | Number of
Portfolios in
Fund Complex
Overseen by
Trustee(1) | | Other
Director-
ships Held
by Trustee |
Joel P. Fried(2)
(1962) | | Co-Chief Executive Officer and Trustee | | Indefinite;
Since 09/04 | | President, Director, and Portfolio Manager
PRIMECAP Management Company | | 3 | | None |
| | (1) | Fund Complex includes any funds, series of funds, or trusts that share the same advisor or that hold themselves out to investors as related companies. |
| | (2) | Mr. Fried is an “interested person” of the Trust, as defined by the 1940 Act, because of his employ- ment with PRIMECAP Management Company, the investment advisor to the Trust. |
56
| | |
| | Privacy Notice PRIMECAP Odyssey Funds |
PRIMECAP Management Company
Maintaining the confidentiality of client personal financial information is very important to PRIMECAP Odyssey Funds (the “Trust”) and PRIMECAP Management Company (the “Advisor”). The Advisor and the Trust may collect several types of nonpublic personal information about investors, including:
| | • | | Information from forms that investors may fill out and send to the Advisor or the Trust in connection with an account (such as name, address, and social security number). |
| | • | | Information an investor may give the Advisor or the Trust orally. |
| | • | | Information about the amount investors have invested in an account. |
| | • | | Information about any bank account investors may use for transfers between a bank account and a shareholder account. |
The Advisor and the Trust will not sell or disclose client personal information to anyone except as permitted or required by law. For example, information collected may be shared with the independent auditors in the course of the annual audit of the Advisor or the Trust. The Advisor or the Trust may also share this information with the Advisor’s or the Trust’s legal counsel, as deemed appropriate, and with regulators. Finally, the Advisor or the Trust may disclose information about clients or investors at the client’s or investor’s request (for example, by sending duplicate account statements to someone designated by the client or investor), or as otherwise permitted or required by law.
Within the Advisor and the Trust, access to information about clients and investors is restricted to those employees or service providers who need to know the information to service client accounts. The Advisor’s employees are trained to follow its procedures to protect client privacy and are instructed to access information about clients only when they have a business reason to obtain it.
The Advisor and the Trust reserve the right to change this privacy policy in the future, but we will not disclose investor nonpublic personal information except as required or permitted by law without giving the investor an opportunity to instruct us not to do so.
Investment Advisor
PRIMECAP MANAGEMENT COMPANY
177 East Colorado Boulevard, 11th Floor
Pasadena, California 91105
•
Distributor
QUASAR DISTRIBUTORS, LLC
615 East Michigan Street, 4th Floor
Milwaukee, Wisconsin 53202
•
Custodian
THE BANK OF NEW YORK MELLON
One Wall Street
New York, New York 10286
•
Transfer Agent
U.S. BANCORP FUND SERVICES, LLC
615 East Michigan Street, 3rd Floor
Milwaukee, Wisconsin 53202
•
Administrator
U.S. BANCORP FUND SERVICES, LLC
2020 East Financial Way, Suite 100
Glendora, California 91741
•
Legal Counsel
MORGAN, LEWIS & BOCKIUS LLP
300 South Grand Avenue, Twenty-Second Floor
Los Angeles, California 90071
•
Independent Registered Public Accounting Firm
PRICEWATERHOUSECOOPERS LLP
Three Embarcadero Center
San Francisco, California 94111
This report is intended for the shareholders of the PRIMECAP Odyssey Funds and may not be used as sales literature unless preceded or accompanied by a current prospectus.
Past performance results shown in this report should not be considered a representation of future performance. Share price and returns will fluctuate so that shares, when redeemed, may be worth more or less than their original cost. Statements and other information herein are dated and are subject to change.
PRIMECAP, PRIMECAP Odyssey, and the PRIMECAP Odyssey logo are trademarks of PRIMECAP Management Company.
Item 2. Code of Ethics.
The registrant has adopted a code of ethics that applies to the registrant’s principal executive officers and principal financial officer. The registrant has not made any amendments to its code of ethics during the period covered by this report. The registrant has not granted any waivers from any provisions of the code of ethics during the period covered by this report.
The registrant undertakes to provide to any person without charge, upon request, a copy of its code of ethics by mail when such person calls the registrant at 1-800-729-2307.
Item 3. Audit Committee Financial Expert.
The registrant’s Board of Trustees has determined that there is at least one audit committee financial expert serving on its audit committee. Wayne Smith is the registrant’s “audit committee financial expert” and is considered to be “independent” as each term is defined in Item 3 of Form N-CSR.
Item 4. Principal Accountant Fees and Services.
The registrant has engaged its principal accountant, PricewaterhouseCoopers LLP, to perform audit services, audit-related services, and tax services during the past two fiscal years. “Audit services” refer to performing an audit of the registrant’s annual financial statements or services that are normally provided by the accountant in connection with statutory and regulatory filings or engagements for those fiscal years. “Audit-related services” refer to the assurance and related services by the principal accountant that are reasonably related to the performance of the audit. “Tax services” refer to professional services rendered by the principal accountant for tax compliance, tax advice, and tax planning and specifically relate to the accountant’s review of the registrant’s federal and state tax returns. There were no other services provided by the principal accountant to the registrant during the past two fiscal years. The following table details the aggregate fees billed or expected to be billed to the registrant for each of the last two fiscal years for audit fees, audit-related fees, tax fees and other fees by the principal accountant.
| | | | | | | | |
| | | FYE 10/31/2016 | | | FYE 10/31/2015 | |
Audit Fees | | $ | 117,500 | | | $ | 114,500 | |
Audit-Related Fees | | $ | 0 | | | $ | 0 | |
Tax Fees | | $ | 15,000 | | | $ | 14,655 | |
All Other Fees | | $ | 0 | | | $ | 0 | |
The audit committee has adopted pre-approval policies and procedures that require the audit committee to pre-approve all audit and non-audit services of the registrant, including services provided to any entity affiliated with the registrant.
The percentages of fees billed to the registrant by its principal accountant applicable to non-audit services that were pre-approved by the audit committee were as follows:
| | | | | | | | |
| | | FYE 10/31/2016 | | | FYE 10/31/2015 | |
Audit-Related Fees | | | 100 | % | | | 100 | % |
Tax Fees | | | 100 | % | | | 100 | % |
All Other Fees | | | 100 | % | | | 100 | % |
All of the principal accountant’s hours spent on auditing the registrant’s financial statements were attributed to work performed by full-time permanent employees of the principal accountant.
The following table indicates the aggregate non-audit fees billed or expected to be billed by the registrant’s accountant for services to the registrant and to the registrant’s investment adviser (and any other entity, controlling, controlled by, or under common control with the adviser that provides ongoing services to the registrant), for the last two fiscal years.
| | | | | | | | |
Non-Audit Related Fees | | FYE 10/31/2016 | | | FYE 10/31/2015 | |
Registrant | | $ | 15,000 | | | $ | 14,655 | |
Registrant’s Investment Adviser | | $ | 0 | | | $ | 0 | |
Item 5. Audit Committee of Listed Registrants.
Not applicable to registrants who are not listed issuers (as defined in Rule 10A-3 under the Securities Exchange Act of 1934).
Item 6. Investments.
The registrant’s Schedule of Investments is included as part of the report to shareholders filed under Item 1 of this Form.
Item 7. Disclosure of Proxy Voting Policies and Procedures for Closed-End Management Investment Companies.
Not applicable to open-end investment companies.
Item 8. Portfolio Managers of Closed-End Management Investment Companies.
Not applicable to open-end investment companies.
Item 9. Purchases of Equity Securities by Closed-End Management Investment Company and Affiliated Purchasers.
Not applicable to open-end investment companies.
Item 10. Submission of Matters to a Vote of Security Holders.
There have been no material changes to the procedures by which shareholders may recommend nominees to the registrant’s board of trustees.
Item 11. Controls and Procedures.
| (a) | The registrant’s Co-Chief Executive Officers and Chief Financial Officer have reviewed the registrant’s disclosure controls and procedures (as defined in Rule 30a-3(c) under the Investment Company Act of 1940 (the “Act”)) as of a date within 90 days of the filing of this report, as required by Rule 30a-3(b) under the Act and Rules 13a-15(b) or 15d-15(b) under the Securities Exchange Act of 1934. Based on their review, such officers have concluded that such disclosure controls and procedures are effective in ensuring that information required to be disclosed in this report is appropriately recorded, processed, summarized and reported and made known to them by other officers of the registrant and by the registrant’s service providers. |
| (b) | There were no changes in the registrant’s internal control over financial reporting (as defined in Rule 30a-3(d) under the Act) that occurred during the second fiscal quarter of the period covered by this report that has materially affected, or is reasonably likely to materially affect, the registrant’s internal control over financial reporting. |
Item 12. Exhibits.
| (a) | (1) Any code of ethics or amendment thereto, that is the subject of the disclosure required by Item 2, to the extent that the registrant intends to satisfy Item 2 requirements through filing an exhibit. Incorporated by reference to the Registrant’s Form N-CSR filed January 6, 2006. |
(2) A separate certification for each principal executive and principal financial officer pursuant to Section 302 of the Sarbanes-Oxley Act of 2002. Filed herewith.
(3) Any written solicitation to purchase securities under Rule 23c-1 under the Act sent or given during the period covered by the report by or on behalf of the registrant to 10 or more persons. Not applicable to open-end investment companies.
| (b) | Certifications pursuant to Section 906 of the Sarbanes-Oxley Act of 2002. Furnished herewith. |
SIGNATURES
Pursuant to the requirements of the Securities Exchange Act of 1934 and the Investment Company Act of 1940, the registrant has duly caused this report to be signed on its behalf by the undersigned, thereunto duly authorized.
| | |
| PRIMECAP Odyssey Funds |
| |
| By | | /s/ Joel P. Fried |
| | Joel P. Fried, Co-Chief Executive Officer |
| |
| Date | | December 19, 2016 |
| |
| By | | /s/ Theo A. Kolokotrones |
| | Theo A. Kolokotrones, Co-Chief Executive Officer |
| |
| Date | | December 19, 2016 |
| |
| By | | /s/ Alfred W. Mordecai |
| | Alfred W. Mordecai, Co-Chief Executive Officer |
| |
| Date | | December 19, 2016 |
Pursuant to the requirements of the Securities Exchange Act of 1934 and the Investment Company Act of 1940, this report has been signed below by the following persons on behalf of the registrant and in the capacities and on the dates indicated.
| | |
| By | | /s/ Joel P. Fried |
| | Joel P. Fried, Co-Chief Executive Officer |
| |
| Date | | December 19, 2016 |
| |
| By | | /s/ Theo A. Kolokotrones |
| | Theo A. Kolokotrones, Co-Chief Executive Officer |
| |
| Date | | December 19, 2016 |
| |
| By | | /s/ Alfred W. Mordecai |
| | Alfred W. Mordecai, Co-Chief Executive Officer |
| |
| Date | | December 19, 2016 |
| |
| By | | /s/ Michael J. Ricks |
| | Michael J. Ricks, Chief Financial Officer |
| |
| Date | | December 19, 2016 |