As filed with the Securities and Exchange Commission on June 25, 2018
UNITED STATES
SECURITIES AND EXCHANGE COMMISSION
Washington, D.C. 20549
FORM N-CSR
CERTIFIED SHAREHOLDER REPORT OF REGISTERED
MANAGEMENT INVESTMENT COMPANIES
Investment Company Act file number 811-21597
PRIMECAP Odyssey Funds
(Exact name of registrant as specified in charter)
177 East Colorado Boulevard, 11th Floor
Pasadena, CA 91105
(Address of principal executive offices) (Zip code)
Michael J. Ricks
PRIMECAP Management Company
177 East Colorado Boulevard, 11th Floor
Pasadena, CA 91105
(Name and address of agent for service)
(626) 304-9222
Registrant’s telephone number, including area code
Date of fiscal year end: October 31
Date of reporting period: April 30, 2018
Item 1. Reports to Stockholders.
Item 1. Reports to Stockholders.
SEMIANNUAL REPORT
For the Six Months Ended April 30, 2018

PRIMECAP ODYSSEY STOCK (POSKX)
PRIMECAP ODYSSEY GROWTH (POGRX)
PRIMECAP ODYSSEY AGGRESSIVE GROWTH (POAGX)
| 2 | ||||
| 8 | ||||
| 8 | ||||
| 9 | ||||
| 10 | ||||
| 11 | ||||
| 13 | ||||
| 13 | ||||
| 18 | ||||
| 23 | ||||
| 29 | ||||
| 30 | ||||
| 31 | ||||
| 31 | ||||
| 32 | ||||
| 33 | ||||
| 34 | ||||
| 34 | ||||
| 35 | ||||
| 36 | ||||
| 37 | ||||
| 46 | ||||
| 48 | ||||
| 49 | ||||
1
Dear Fellow Shareholders,
For the six months ended April 30, 2018, the PRIMECAP Odyssey Stock Fund, PRIMECAP Odyssey Growth Fund, and PRIMECAP Odyssey Aggressive Growth Fund produced total returns of +3.64%, +10.82%, and +14.31%, respectively. The unmanaged S&P 500 Index produced a total return of +3.82% during the period.
The six-month period was a tale of two halves. Through late January, the market’s positive sentiment seemed unflappable. The economy finished 2017 on very solid footing. Tax reform legislation passed in December, catalyzing an optimism not seen since before the 2008-2009 recession. Consumer confidence climbed to decade-high levels, and consumption increased at a robust pace in last year’s fourth quarter, buoyed by continued gains in employment levels and household net worth. Industrial production and business investment also increased at a solid pace. Treasury yields rose but remained accommodative, and the U.S. dollar weakened on account of foreign economies’ growth and central bank commentary. The U.S. stock market reacted favorably to these developments, climbing steadily to record highs in late January – and doing so with historically-low levels of volatility.
Sentiment shifted in the second half of the period, starting in late January. Underlying economic measures remained robust, but volatility in the market spiked. Potential regulatory scrutiny of key technology companies and combative trade rhetoric added to the level of uncertainty. Interest rates and energy prices continued to rise, with the U.S. 10-year Treasury yield and Brent crude oil briefly surpassing 3% and 75 dollars per barrel, respectively, during April. Furthermore, the U.S. dollar bottomed in early 2018 before strengthening throughout April. In response to these developments, the U.S. equity market trended lower, finishing the period 8% below January highs.
Despite the second half retreat, cyclicals outperformed during the period, led by the consumer discretionary sector’s 14% total return. Energy (+10%) and information technology (+5%) also outperformed. More defensive sectors underperformed, particularly consumer staples (-4%) and utilities (-5%). The materials and real estate sectors also lost absolute ground during the period.
With over 90% of companies in the S&P 500 having reported, first quarter S&P 500 earnings are expected to have grown 25% year-over-year, enjoying a sizeable boost from tax reform. This result is significantly better than the 17% expected growth at quarter-end and represents the highest earnings growth since the third quarter of 2010. Record percentages of companies are exceeding consensus estimates on both revenues (77%) and earnings (78%).
Each of the PRIMECAP Odyssey Funds continued to be overweight in the health care, information technology, and industrials sectors, and underweight in the financials, energy, consumer staples, materials, utilities, and real estate sectors.
A more detailed discussion of the results of each PRIMECAP Odyssey Fund follows.
2
Letter to Shareholders
PRIMECAP Odyssey Funds
continued
PRIMECAP Odyssey Stock Fund
For the six months ended April 30, 2018, the Stock Fund’s total return of +3.64% slightly trailed the S&P 500’s total return of +3.82%.
Sector allocations modestly boosted relative performance, while unfavorable stock selection detracted from results. In sector allocation, underweight positions in consumer staples and utilities more than offset the fund’s underweight position in energy. Positive stock selection in financials, industrials, and information technology was not sufficient to offset underperformance elsewhere, particularly in consumer discretionary. Within information technology, Top 10 holdings NetApp (+51%) and Hewlett Packard Enterprise (+24%) outperformed, while Micro Focus International (-50%) provided a partial offset. Stock selection struggled most in consumer discretionary, where the portfolio suffered from its CarMax (-17%) and Newell Brands (-31%) holdings and no exposure to surging index heavyweights Amazon (+42%) and Netflix (+59%).
The Stock Fund was heavily invested in industrials stocks with a 20% weighting compared to 10% for the sector in the S&P 500.
The top 10 holdings, which collectively represented 26.5% of the portfolio at the period end, are listed below:
| PRIMECAP Odyssey Stock Fund Top 10 Holdings as of 4/30/18 | Ending % of Total Portfolio* | |||
JPMorgan Chase & Co. | 3.8 | |||
Hewlett Packard Enterprise Co. | 3.0 | |||
Astrazeneca PLC Sponsored ADR | 2.9 | |||
NetApp, Inc. | 2.9 | |||
Eli Lilly and Company | 2.6 | |||
FedEx Corporation | 2.4 | |||
HP Inc. | 2.3 | |||
Southwest Airlines Co. | 2.3 | |||
Discover Financial Services | 2.2 | |||
Sony Corporation Sponsored ADR | 2.1 | |||
Total % of Portfolio | 26.5 | % | ||
| * | The percentage is calculated by using the ending market value of the security divided by the ending market value of the total investments of the Fund. |
3
Letter to Shareholders
PRIMECAP Odyssey Funds
continued
PRIMECAP Odyssey Growth Fund
For the six months ended April 30, 2018, the Growth Fund returned +10.82%, ahead of both the S&P 500’s +3.82% total return and the Russell 1000 Growth Index’s total return of +5.68%.
The Growth Fund’s outperformance was driven by strong stock selection, particularly in the health care sector, where the fund’s holdings returned 20% relative to the benchmark’s 2% total return. Nektar Therapeutics (+247%) was the primary driver. ABIOMED (+56%) also played a helpful role, only partially offset by the underperformance of Seattle Genetics (-17%) and Alkermes (-9%). Elsewhere in the portfolio, strong stock selection in financials and information technology further benefited relative results; E*TRADE (+39%), NetApp (+51%), and Splunk (+53%) all outperformed. Selection in consumer discretionary was the lone significant detractor as the portfolio owned neither Amazon (+42%) nor Netflix (+59%).
The top 10 holdings, which collectively represented 29.1% of the portfolio at the period end, are listed below:
| PRIMECAP Odyssey Growth Fund Top 10 Holdings as of 4/30/18 | Ending % of Total Portfolio* | |||
Nektar Therapeutics | 5.0 | |||
ABIOMED, Inc. | 4.5 | |||
Alkermes Plc | 2.8 | |||
Seattle Genetics, Inc. | 2.6 | |||
United Continental Holdings, Inc. | 2.5 | |||
E*TRADE Financial Corporation | 2.5 | |||
Micron Technology, Inc. | 2.4 | |||
Adobe Systems Incorporated | 2.3 | |||
Alibaba Group Holding Ltd. Sponsored ADR | 2.3 | |||
Eli Lilly and Company | 2.2 | |||
Total % of Portfolio | 29.1 | % | ||
| * | The percentage is calculated by using the ending market value of the security divided by the ending market value of the total investments of the Fund. |
PRIMECAP Odyssey Aggressive Growth Fund
For the six months ended April 30, 2018, the Aggressive Growth Fund’s total return of +14.31% exceeded both the S&P 500’s total return of +3.82% and the Russell Midcap Growth Index’s total return of +5.16%.
4
Letter to Shareholders
PRIMECAP Odyssey Funds
continued
The Aggressive Growth Fund’s significant outperformance was driven almost entirely by its health care holdings, which returned 38% during the period. Nektar Therapeutics, the fund’s largest position, returned +247% and alone generated dramatic portfolio-level outperformance. The rest of the portfolio also contributed in aggregate, with ABIOMED (+56%) and Shutterfly (+90%) further boosting relative results.
The top 10 holdings, which collectively represented 34.2% of the portfolio at the period end, are listed below:
| PRIMECAP Odyssey Aggressive Growth Fund Top 10 Holdings as of 4/30/18 | Ending % of Total Portfolio* | |||
Nektar Therapeutics | 9.7 | |||
ABIOMED | 4.4 | |||
Sony Corporation Sponsored ADR | 3.3 | |||
Micron Technology, Inc. | 3.0 | |||
Alkermes Plc | 2.7 | |||
BlackBerry Limited | 2.3 | |||
United Continental Holdings, Inc. | 2.3 | |||
American Airlines Group, Inc. | 2.3 | |||
Shutterfly, Inc. | 2.1 | |||
Splunk Inc. | 2.1 | |||
Total % of Portfolio | 34.2 | % | ||
| * | The percentage is calculated by using the ending market value of the security divided by the ending market value of the total investments of the Fund. |
Outlook
The current bull market recently eclipsed the 9-year mark, and yet there are reasons for late-cycle optimism. Earnings growth has been exceptional in this year’s first quarter, and earnings strength is expected to continue throughout 2018, driven in part by the substantial corporate tax cut enacted in December 2017. Valuation is not excessive; following its late-period decline, the S&P 500 trades at a forward price/earnings multiple roughly in line with its 25-year historical average (16.1x). And we remain constructive on the U.S. economy, with 2.9% real GDP growth in last year’s fourth quarter and comparable growth expected during 2018 despite the 2.3% initial estimate for the March quarter. U.S. equities thus continue to be attractive, particularly relative to the 3.0% 10-year Treasury yield.
5
Letter to Shareholders
PRIMECAP Odyssey Funds
continued
There are, as always, reasons for concern. Today these include the heightened possibility of a trade war. While legitimate U.S. trade grievances certainly exist, President Trump’s threats are fraught with legal, economic, and geopolitical risks. We remain hopeful that this protectionist impulse will fade.
We are also watching closely the steady rise in oil prices. Our portfolio maintains a meaningful underweight position in the energy sector; additionally, we have large holdings in oil-consuming industries, such as airlines, cruise lines, and transportation companies. In perhaps a 21st century variant of the famous 1980 Julian Simon-Paul Ehrlich wager, our portfolio has consistently been more aligned with Professor Simon’s view of resource scarcity. Put another way, our portfolio suggests a broad preference for ‘mind’ – technology, innovation, and the like – over ‘matter’ – commodities and other real assets. This preference primarily reflects our view of company-level opportunities over the long term relative to current market prices. But rising energy prices clearly pose a multi-pronged risk to our portfolio.
Importantly, many of our holdings have opportunity sets that do not rely on near-term macroeconomic trends. Our largest sector positions are in information technology and health care, and in both sectors the forward P/E ratio is below its 20-year average despite, in our view, strong secular growth trajectories.
As bottom-up stock pickers, we spend our time searching for opportunities to invest in stocks with long-term prospects we find to be materially better than market prices imply. We believe, as Nobel laureate Alexander Fleming said, that it is the “lone worker who makes the first advance” and that “the prime idea is due to enterprise, thought, and perception of an individual.” This approach to stock selection, which drives portfolio composition and thus sector allocation, often results in portfolios that bear little resemblance to market indices, creating the possibility for lengthy periods of relative outperformance or underperformance. We nonetheless believe that this approach can generate superior results for shareholders over the long term.
Sincerely,
PRIMECAP Management Company
May 15, 2018
Past performance is not a guarantee of future results.
The funds invest in smaller companies, which involve additional risks such as limited liquidity and greater volatility. All funds may invest in foreign securities, which involves: 1) greater volatility; 2) political, economic, and currency risks; and 3) differences in accounting methods. Mutual fund investing involves risk, and loss of principal is possible. Growth stocks typically are more volatile than value stocks; however, value stocks have a lower expected growth rate in earnings and sales.
Please refer to the Schedule of Investments for details of fund holdings. Fund holdings and sector allocations are subject to change at any time and are not recommendations to buy or sell any security.
6
Letter to Shareholders
PRIMECAP Odyssey Funds
continued
The S&P 500 Index is a market capitalization-weighted index of 500 large-capitalization stocks commonly used to represent the U.S. equity market. The Russell 1000 Growth Index is an index that measures the performance of those Russell 1000 companies with higher price-to-book ratios and higher forecasted growth values (the Russell 1000 Index measures the performance of the large-cap segment of the U.S. equity universe). The Russell Midcap Growth Index measures the performance of those Russell Midcap companies with higher price-to-book ratios and higher forecasted growth values. You cannot invest directly in an index.
Price-to-earnings ratio is calculated by dividing the current share price of a stock by its earnings per share.
Earnings per share is calculated by taking the total earnings divided by the number of shares outstanding.
Earnings growth is not a prediction of a fund’s future performance.
The information provided herein represents the opinions of PRIMECAP Management Company and is not intended to be a forecast of future events, a guarantee of future results, or investment advice.
7
The following chart compares the value of a hypothetical $10,000 investment in the PRIMECAP Odyssey Stock Fund from October 31, 2007 to April 30, 2018, compared to the S&P 500. This chart illustrates the performance of a hypothetical $10,000 investment made October 31, 2007 and is not intended to imply any future performance. The returns shown do not reflect the deduction of taxes that a shareholder would pay on fund distributions or the redemption of fund shares. The chart assumes reinvestment of capital gains and dividends.
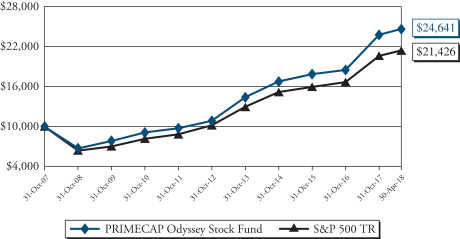
| Total Return Period Ended April 30, 2018 | ||||||||||||||||
| 1 Year | Annualized 5 Year | Annualized 10 Year | Annualized Since Inception^ | |||||||||||||
Stock Fund | 15.27% | 13.89% | 10.62% | 10.37% | ||||||||||||
S&P 500* | 13.27% | 12.96% | 9.02% | 8.76% | ||||||||||||
Performance data quoted represents past performance and does not guarantee future results. The investment return and principal value of an investment will fluctuate so that an investor’s shares, when redeemed, may be worth more or less than their original cost. Current performance of the fund may be lower or higher than the performance quoted. Performance data current to the most recent month end may be obtained by calling 1-800-729-2307.
| * | The S&P 500 is a market capitalization-weighted index of 500 large-capitalization stocks commonly used to represent the U.S. equity market. |
| ^ | November 1, 2004 |
8
The following chart compares the value of a hypothetical $10,000 investment in the PRIMECAP Odyssey Growth Fund from October 31, 2007 to April 30, 2018, compared to the S&P 500. This chart illustrates the performance of a hypothetical $10,000 investment made October 31, 2007 and is not intended to imply any future performance. The returns shown do not reflect the deduction of taxes that a shareholder would pay on fund distributions or the redemption of fund shares. The chart assumes reinvestment of capital gains and dividends.
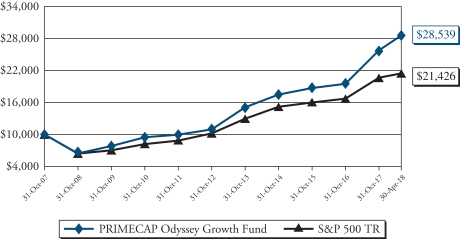
| Total Return Period Ended April 30, 2018 | ||||||||||||||||
| 1 Year | Annualized 5 Year | Annualized 10 Year | Annualized Since Inception^ | |||||||||||||
Growth Fund | 23.96% | 16.21% | 12.54% | 11.86% | ||||||||||||
S&P 500* | 13.27% | 12.96% | 9.02% | 8.76% | ||||||||||||
Performance data quoted represents past performance and does not guarantee future results. The investment return and principal value of an investment will fluctuate so that an investor’s shares, when redeemed, may be worth more or less than their original cost. Current performance of the fund may be lower or higher than the performance quoted. Performance data current to the most recent month end may be obtained by calling 1-800-729-2307.
| * | The S&P 500 is a market capitalization-weighted index of 500 large-capitalization stocks commonly used to represent the U.S. equity market. |
| ^ | November 1, 2004 |
9
The following chart compares the value of a hypothetical $10,000 investment in the PRIMECAP Odyssey Aggressive Growth Fund from October 31, 2007 to April 30, 2018, compared to the S&P 500. This chart illustrates the performance of a hypothetical $10,000 investment made October 31, 2007 and is not intended to imply any future performance. The returns shown do not reflect the deduction of taxes that a shareholder would pay on fund distributions or the redemption of fund shares. The chart assumes reinvestment of capital gains and dividends.
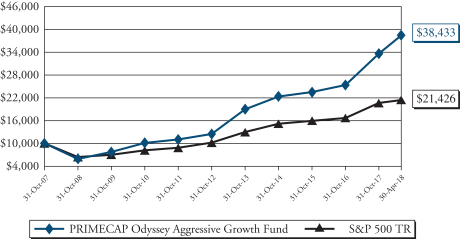
| Total Return Period Ended April 30, 2018 | ||||||||||||||||
| 1 Year | Annualized 5 Year | Annualized 10 Year | Annualized Since Inception^ | |||||||||||||
Aggressive Growth Fund | 27.34% | 20.47% | 16.88% | 14.54% | ||||||||||||
S&P 500* | 13.27% | 12.96% | 9.02% | 8.76% | ||||||||||||
Performance data quoted represents past performance and does not guarantee future results. The investment return and principal value of an investment will fluctuate so that an investor’s shares, when redeemed, may be worth more or less than their original cost. Current performance of the fund may be lower or higher than the performance quoted. Performance data current to the most recent month end may be obtained by calling 1-800-729-2307.
| * | The S&P 500 is a market capitalization-weighted index of 500 large-capitalization stocks commonly used to represent the U.S. equity market. |
| ^ | November 1, 2004 |
10
PRIMECAP Odyssey Stock Fund
Consumer Discretionary | 11.9% | |||
Consumer Staples | 0.6% | |||
Energy | 0.6% | |||
Financials | 12.6% | |||
Health Care | 17.2% | |||
Industrials | 20.3% | |||
Information Technology | 29.2% | |||
Materials | 0.6% | |||
Utilities | 0.2% | |||
Closed-End Funds (Information Technology) | 1.6% | |||
Short-Term Investments, net of Other Liabilities | 5.2% | |||
Total | 100.0% |
PRIMECAP Odyssey Growth Fund
Consumer Discretionary | 10.2% | |||
Consumer Staples | 0.1% | |||
Energy | 0.3% | |||
Financials | 7.3% | |||
Health Care | 32.1% | |||
Industrials | 12.8% | |||
Information Technology | 30.7% | |||
Materials | 0.5% | |||
Closed-End Funds (Information Technology) | 0.3% | |||
Rights (Health Care) | 0.0% | |||
Short-Term Investments, net of Other Liabilities | 5.7% | |||
Total | 100.0% |
The tables above list sector allocations as a percentage of each fund’s total net assets as of April 30, 2018. The management report may make reference to average allocations during the period. As a result, the sector allocations above may differ from those discussed in the management report.
11
Sector Breakdown
PRIMECAP Odyssey Funds
continued
PRIMECAP Odyssey Aggressive Growth Fund
Consumer Discretionary | 14.5% | |||
Consumer Staples | 0.1% | |||
Energy | 0.3% | |||
Financials | 3.9% | |||
Health Care | 35.6% | |||
Industrials | 11.4% | |||
Information Technology | 28.1% | |||
Materials | 0.4% | |||
Telecommunication Services | 1.3% | |||
Preferred Stocks (Financials) | 0.3% | |||
Rights (Health Care) | 0.2% | |||
Closed-End Funds (Information Technology) | 0.1% | |||
Short-Term Investments, net of Other Liabilities | 3.8% | |||
Total | 100.0% |
The table above lists sector allocations as a percentage of the fund’s total net assets as of April 30, 2018. The management report may make reference to average allocations during the period. As a result, the sector allocations above may differ from those discussed in the management report.
12
| Shares | Value | |||||||
| COMMON STOCKS – 93.2% | ||||||||
| Consumer Discretionary – 11.9% | ||||||||
| 13,000 | Adient PLC | $ | 796,770 | |||||
| 4,100,000 | Ascena Retail Group, Inc. (a) | 9,102,000 | ||||||
| 40,600 | Bed Bath & Beyond, Inc. | 708,876 | ||||||
| 1,460,200 | CarMax, Inc. (a) | 91,262,500 | ||||||
| 2,634,600 | Carnival Corp. | 166,137,876 | ||||||
| 385,028 | CBS Corp. – Class B | 18,943,378 | ||||||
| 442,000 | Comcast Corp. – Class A | 13,874,380 | ||||||
| 658,909 | Entercom Communications Corp. – Class A | 6,687,926 | ||||||
| 1,385,700 | L Brands, Inc. | 48,374,787 | ||||||
| 304,982 | Las Vegas Sands Corp. | 22,364,330 | ||||||
| 7,927,800 | Mattel, Inc. | 117,331,440 | ||||||
| 10,000 | McDonald’s Corp. | 1,674,400 | ||||||
| 1,100,000 | MGM Resorts International | 34,562,000 | ||||||
| 1,200,000 | Newell Brands, Inc. | 33,156,000 | ||||||
| 205,000 | Restaurant Brands International, Inc. | 11,156,100 | ||||||
| 1,394,000 | Ross Stores, Inc. | 112,704,900 | ||||||
| 380,000 | Royal Caribbean Cruises Ltd. | 41,112,200 | ||||||
| 4,390,000 | Sony Corp. – ADR | 201,193,700 | ||||||
| 225,000 | Tempur Sealy International, Inc. (a) | 10,068,750 | ||||||
| 160,000 | TJX Cos., Inc. | 13,576,000 | ||||||
| 1,231,200 | Tribune Media Co. – Class A | 46,527,048 | ||||||
| 1,716,600 | tronc, Inc. (a) | 31,516,776 | ||||||
| 310,000 | V.F. Corp. | 25,069,700 | ||||||
| 225,000 | Walt Disney Co. (The) | 22,574,250 | ||||||
| 549,939 | Whirlpool Corp. | 85,213,048 | ||||||
|
| |||||||
| 1,165,689,135 | ||||||||
|
| |||||||
| Consumer Staples – 0.6% | ||||||||
| 300,000 | Altria Group, Inc. | 16,833,000 | ||||||
| 150,000 | Philip Morris International, Inc. | 12,300,000 | ||||||
| 370,000 | Tyson Foods, Inc. – Class A | 25,937,000 | ||||||
|
| |||||||
| 55,070,000 | ||||||||
|
| |||||||
| Energy – 0.6% | ||||||||
| 20,000 | EOG Resources, Inc. | 2,363,400 | ||||||
| 95,000 | Exxon Mobil Corp. | 7,386,250 | ||||||
| 45,000 | National Oilwell Varco, Inc. | 1,740,150 | ||||||
| 955,000 | Range Resources Corp. | 13,226,750 | ||||||
| 246,534 | Schlumberger Ltd. | 16,902,371 | ||||||
The accompanying notes are an integral part of these financial statements.
13
Schedule of Investments
PRIMECAP Odyssey Stock Fund
April 30, 2018 (Unaudited) – continued
| Shares | Value | |||||||
| Energy (continued) | ||||||||
| 2,000,000 | Southwestern Energy Co. (a) | $ | 8,200,000 | |||||
| 751,300 | Transocean Ltd. (a) | 9,293,581 | ||||||
|
| |||||||
| 59,112,502 | ||||||||
|
| |||||||
| Financials – 12.6% | ||||||||
| 75,000 | American Express Co. | 7,406,250 | ||||||
| 1,483,500 | Bank of America Corp. | 44,386,320 | ||||||
| 2,430,200 | Charles Schwab Corp. (The) | 135,313,536 | ||||||
| 1,800,000 | Citigroup, Inc. | 122,886,000 | ||||||
| 387,963 | CME Group, Inc. | 61,174,006 | ||||||
| 103,400 | CNA Financial Corp. | 5,217,564 | ||||||
| 3,081,200 | Discover Financial Services | 219,535,500 | ||||||
| 3,389,400 | JPMorgan Chase & Co. | 368,698,932 | ||||||
| 384,950 | Marsh & McLennan Cos., Inc. | 31,373,425 | ||||||
| 281,600 | Mercury General Corp. | 12,877,568 | ||||||
| 645,800 | Northern Trust Corp. | 68,939,150 | ||||||
| 235,000 | Progressive Corp. (The) | 14,168,150 | ||||||
| 2,785,708 | Wells Fargo & Co. | 144,745,388 | ||||||
|
| |||||||
| 1,236,721,789 | ||||||||
|
| |||||||
| Health Care – 17.2% | ||||||||
| 1,354,400 | Abbott Laboratories | 78,731,272 | ||||||
| 1,362,000 | Agilent Technologies, Inc. | 89,537,880 | ||||||
| 934,000 | Amgen, Inc. | 162,964,320 | ||||||
| 7,985,100 | AstraZeneca PLC – ADR | 283,710,603 | ||||||
| 329,400 | Biogen, Inc. (a) | 90,123,840 | ||||||
| 677,900 | Boston Scientific Corp. (a) | 19,469,288 | ||||||
| 2,489,370 | Bristol-Myers Squibb Co. | 129,770,858 | ||||||
| 286,000 | CVS Health Corp. | 19,971,380 | ||||||
| 3,180,000 | Eli Lilly & Co. | 257,802,600 | ||||||
| 266,735 | GlaxoSmithKline PLC – ADR | 10,698,741 | ||||||
| 11,600 | Johnson & Johnson | 1,467,284 | ||||||
| 429,600 | Medtronic PLC | 34,423,848 | ||||||
| 1,100,000 | Merck & Co., Inc. | 64,757,000 | ||||||
| 1,306,850 | Novartis AG – ADR | 100,222,326 | ||||||
| 1,077,391 | PerkinElmer, Inc. | 79,037,404 | ||||||
| 333,044 | Roche Holding AG – CHF | 73,998,203 | ||||||
| 344,000 | Sanofi – ADR | 13,526,080 | ||||||
| 1,366,000 | Siemens Healthineers AG – EUR (a) (b) | 53,256,663 | ||||||
The accompanying notes are an integral part of these financial statements.
14
Schedule of Investments
PRIMECAP Odyssey Stock Fund
April 30, 2018 (Unaudited) – continued
| Shares | Value | |||||||
| Health Care (continued) | ||||||||
| 437,000 | Thermo Fisher Scientific, Inc. | $ | 91,922,950 | |||||
| 196,400 | Zimmer Biomet Holdings, Inc. | 22,619,388 | ||||||
|
| |||||||
| 1,678,011,928 | ||||||||
|
| |||||||
| Industrials – 20.3% | ||||||||
| 3,119,000 | AECOM (a) | 107,418,360 | ||||||
| 1,553,500 | Airbus Group SE – EUR | 182,354,494 | ||||||
| 95,200 | Alaska Air Group, Inc. | 6,181,336 | ||||||
| 4,665,700 | American Airlines Group, Inc. | 200,298,501 | ||||||
| 45,000 | Boeing Co. (The) | 15,010,200 | ||||||
| 1,150,000 | Caterpillar, Inc. | 166,014,000 | ||||||
| 170,000 | CSX Corp. | 10,096,300 | ||||||
| 233,000 | Curtiss-Wright Corp. | 29,833,320 | ||||||
| 1,036,319 | Deere & Co. | 140,245,050 | ||||||
| 1,475,000 | Delta Air Lines, Inc. | 77,024,500 | ||||||
| 946,900 | FedEx Corp. | 234,073,680 | ||||||
| 103,950 | Honeywell International, Inc. | 15,039,486 | ||||||
| 812,400 | Jacobs Engineering Group, Inc. | 47,192,316 | ||||||
| 199,761 | Matson, Inc. | 5,839,014 | ||||||
| 275,000 | Norfolk Southern Corp. | 39,454,250 | ||||||
| 140,000 | Pentair PLC | 9,419,200 | ||||||
| 807,200 | Ritchie Bros. Auctioneers, Inc. | 26,419,656 | ||||||
| 30,000 | Rockwell Automation, Inc. | 4,935,900 | ||||||
| 50,000 | Rockwell Collins, Inc. | 6,627,000 | ||||||
| 125,000 | Safran S.A. – EUR | 14,661,250 | ||||||
| 1,367,466 | Siemens AG – EUR | 173,660,924 | ||||||
| 4,175,500 | Southwest Airlines Co. | 220,591,665 | ||||||
| 57,000 | Union Pacific Corp. | 7,616,910 | ||||||
| 2,858,900 | United Continental Holdings, Inc. (a) | 193,090,106 | ||||||
| 361,300 | United Parcel Service, Inc. – Class B | 41,007,550 | ||||||
| 56,000 | United Technologies Corp. | 6,728,400 | ||||||
|
| |||||||
| 1,980,833,368 | ||||||||
|
| |||||||
| Information Technology – 29.2% | ||||||||
| 1,040,000 | Activision Blizzard, Inc. | 69,004,000 | ||||||
| 509,600 | Adobe Systems, Inc. (a) | 112,927,360 | ||||||
| 35,000 | Alphabet, Inc. – Class A (a) | 35,650,300 | ||||||
| 35,000 | Alphabet, Inc. – Class C (a) | 35,606,550 | ||||||
| 719,200 | Analog Devices, Inc. | 62,822,120 | ||||||
| 1,690,000 | Applied Materials, Inc. | 83,942,300 | ||||||
| 3,052,700 | Cisco Systems, Inc. | 135,204,083 | ||||||
The accompanying notes are an integral part of these financial statements.
15
Schedule of Investments
PRIMECAP Odyssey Stock Fund
April 30, 2018 (Unaudited) – continued
| Shares | Value | |||||||
| Information Technology (continued) | ||||||||
| 750,000 | Corning, Inc. | $ | 20,265,000 | |||||
| 80,553 | Dell Technologies Inc. – Class V (a) | 5,781,289 | ||||||
| 675,000 | Diebold, Inc. | 10,361,250 | ||||||
| 740,102 | DXC Technology Co. | 76,274,912 | ||||||
| 3,419,300 | eBay, Inc. (a) | 129,523,084 | ||||||
| 6,409,199 | Flex Ltd. (a) | 83,319,587 | ||||||
| 17,447,900 | Hewlett Packard Enterprise Co. | 297,486,695 | ||||||
| 10,409,800 | HP, Inc. | 223,706,602 | ||||||
| 2,300,000 | Intel Corp. | 118,726,000 | ||||||
| 1,724,000 | Keysight Technologies, Inc. (a) | 89,096,320 | ||||||
| 1,229,500 | KLA-Tencor Corp. | 125,089,330 | ||||||
| 13,777,800 | L.M. Ericsson Telephone Co. – ADR | 104,022,390 | ||||||
| 4,081,423 | Micro Focus International PLC – ADR | 70,690,246 | ||||||
| 1,943,100 | Microsoft Corp. | 181,718,712 | ||||||
| 4,218,500 | NetApp, Inc. | 280,867,730 | ||||||
| 477,000 | NVIDIA Corp. | 107,277,300 | ||||||
| 1,470,000 | PayPal Holdings, Inc. (a) | 109,676,700 | ||||||
| 1,712,105 | QUALCOMM, Inc. | 87,334,476 | ||||||
| 640,100 | Teradyne, Inc. | 20,835,255 | ||||||
| 1,563,800 | Texas Instruments, Inc. | 158,616,234 | ||||||
| 136,800 | Visa, Inc. – Class A | 17,357,184 | ||||||
|
| |||||||
| 2,853,183,009 | ||||||||
|
| |||||||
| Materials – 0.6% | ||||||||
| 2,320 | AdvanSix, Inc. (a) | 83,102 | ||||||
| 50,000 | Celanese Corp. – Series A | 5,433,500 | ||||||
| 675,000 | DowDuPont, Inc. | 42,687,000 | ||||||
| 135,900 | Monsanto Co. | 17,037,783 | ||||||
|
| |||||||
| 65,241,385 | ||||||||
|
| |||||||
| Utilities – 0.2% | ||||||||
| 372,379 | Public Service Enterprise Group, Inc. | 19,419,565 | ||||||
|
| |||||||
| | TOTAL COMMON STOCKS | $ | 9,113,282,681 | |||||
|
| |||||||
| CLOSED-END FUNDS – 1.6% | ||||||||
| Information Technology – 1.6% | ||||||||
| 2,190,000 | Altaba, Inc. (a) | 153,475,200 | ||||||
|
| |||||||
| | TOTAL CLOSED-END FUNDS | 153,475,200 | ||||||
|
| |||||||
The accompanying notes are an integral part of these financial statements.
16
Schedule of Investments
PRIMECAP Odyssey Stock Fund
April 30, 2018 (Unaudited) – continued
| Shares | Value | |||||||
| SHORT-TERM INVESTMENTS – 5.3% | ||||||||
| 514,629,580 | Dreyfus Treasury Securities Cash Management | $ | 514,629,580 | |||||
|
| |||||||
| | TOTAL SHORT-TERM INVESTMENTS | 514,629,580 | ||||||
|
| |||||||
| | TOTAL INVESTMENTS IN SECURITIES | 9,781,387,461 | ||||||
| Liabilities in Excess of Other Assets – (0.1)% | (10,194,170 | ) | ||||||
|
| |||||||
TOTAL NET ASSETS – 100.0% | $ | 9,771,193,291 | ||||||
|
| |||||||
| ADR | American Depository Receipt |
| CHF | Swiss Francs |
| EUR | Euros |
| (a) | Non-Income Producing |
| (b) | Restricted security |
| (c) | Rate quoted is seven-day yield at period end. |
The Global Industry Classification Standard (GICS®) was developed by and is the exclusive property of MSCI Inc. and Standard & Poor’s Financial Services LLC (“S&P”). GICS is a service mark of MSCI and S&P and has been licensed for use by the fund’s administrator.
The accompanying notes are an integral part of these financial statements.
17
| Shares | Value | |||||||
| COMMON STOCKS – 94.0% | ||||||||
| Consumer Discretionary – 10.2% | ||||||||
| 2,145,000 | Ascena Retail Group, Inc. (a) | $ | 4,761,900 | |||||
| 2,026,100 | CarMax, Inc. (a) | 126,631,250 | ||||||
| 1,985,746 | Carnival Corp. | 125,221,143 | ||||||
| 282,000 | CBS Corp. – Class B | 13,874,400 | ||||||
| 485,000 | Entercom Communications Corp. – Class A | 4,922,750 | ||||||
| 379,500 | Gildan Activewear, Inc. | 11,054,835 | ||||||
| 125,000 | Hilton Worldwide Holdings, Inc. | 9,855,000 | ||||||
| 2,195,200 | IMAX Corp. (a) | 50,928,640 | ||||||
| 855,000 | iRobot Corp. (a) | 49,897,800 | ||||||
| 2,074,598 | L Brands, Inc. | 72,424,216 | ||||||
| 373,999 | Las Vegas Sands Corp. | 27,425,347 | ||||||
| 5,500,100 | Mattel, Inc. | 81,401,480 | ||||||
| 1,250,000 | MGM Resorts International | 39,275,000 | ||||||
| 1,850,000 | Norwegian Cruise Line Holdings Ltd. (a) | 98,919,500 | ||||||
| 85,000 | Ross Stores, Inc. | 6,872,250 | ||||||
| 1,496,371 | Royal Caribbean Cruises Ltd. | 161,892,378 | ||||||
| 1,523,027 | Shutterfly, Inc. (a) | 123,243,345 | ||||||
| 50,000 | Skechers U.S.A., Inc. – Class A (a) | 1,425,000 | ||||||
| 4,075,000 | Sony Corp. – ADR | 186,757,250 | ||||||
| 43,000 | Tesla, Inc. (a) | 12,637,700 | ||||||
| 126,000 | TJX Cos., Inc. | 10,691,100 | ||||||
| 38,000 | Ulta Beauty, Inc. (a) | 9,534,580 | ||||||
|
| |||||||
| 1,229,646,864 | ||||||||
|
| |||||||
| Consumer Staples – 0.1% | ||||||||
| 200,000 | Altria Group, Inc. | 11,222,000 | ||||||
|
| |||||||
| Energy – 0.3% | ||||||||
| 240,000 | Cabot Oil & Gas Corp. | 5,738,400 | ||||||
| 15,000 | EOG Resources, Inc. | 1,772,550 | ||||||
| 72,900 | Schlumberger Ltd. | 4,998,024 | ||||||
| 3,000,000 | Southwestern Energy Co. (a) | 12,300,000 | ||||||
| 872,000 | Transocean Ltd. (a) | 10,786,640 | ||||||
|
| |||||||
| 35,595,614 | ||||||||
|
| |||||||
| Financials – 7.3% | ||||||||
| 100,000 | Bank of America Corp. | 2,992,000 | ||||||
| 2,318,223 | Charles Schwab Corp. (The) | 129,078,657 | ||||||
| 815,000 | Citigroup, Inc. | 55,640,050 | ||||||
| 106,000 | CME Group, Inc. | 16,714,080 | ||||||
The accompanying notes are an integral part of these financial statements.
18
Schedule of Investments
PRIMECAP Odyssey Growth Fund
April 30, 2018 (Unaudited) – continued
| Shares | Value | |||||||
| Financials (continued) | ||||||||
| 1,219,790 | Discover Financial Services | $ | 86,910,037 | |||||
| 5,015,000 | E*TRADE Financial Corp. (a) | 304,310,200 | ||||||
| 1,500,000 | JPMorgan Chase & Co. | 163,170,000 | ||||||
| 390,350 | Marsh & McLennan Cos., Inc. | 31,813,525 | ||||||
| 12,000 | Moody’s Corp. | 1,946,400 | ||||||
| 285,000 | Northern Trust Corp. | 30,423,750 | ||||||
| 157,000 | Progressive Corp. (The) | 9,465,530 | ||||||
| 788,800 | Wells Fargo & Co. | 40,986,048 | ||||||
|
| |||||||
| 873,450,277 | ||||||||
|
| |||||||
| Health Care – 32.1% | ||||||||
| 852,018 | Abbott Laboratories | 49,527,806 | ||||||
| 1,791,100 | ABIOMED, Inc. (a) | 539,031,545 | ||||||
| 2,783,900 | Accuray, Inc. (a) | 13,919,500 | ||||||
| 411,300 | Agilent Technologies, Inc. | 27,038,862 | ||||||
| 7,644,747 | Alkermes PLC (a) | 338,432,950 | ||||||
| 1,304,900 | Amgen, Inc. | 227,678,952 | ||||||
| 2,871,700 | AstraZeneca PLC – ADR | 102,031,501 | ||||||
| 410,000 | BeiGene Ltd. – ADR (a) | 69,527,800 | ||||||
| 538,900 | Biogen, Inc. (a) | 147,443,040 | ||||||
| 1,707,536 | BioMarin Pharmaceutical, Inc. (a) | 142,596,331 | ||||||
| 1,437,800 | Boston Scientific Corp. (a) | 41,293,616 | ||||||
| 2,257,570 | Bristol-Myers Squibb Co. | 117,687,124 | ||||||
| 151,000 | CVS Health Corp. | 10,544,330 | ||||||
| 3,349,100 | Eli Lilly & Co. | 271,511,537 | ||||||
| 3,339,743 | Epizyme, Inc. (a) | 42,915,697 | ||||||
| 289,300 | Illumina, Inc. (a) | 69,701,049 | ||||||
| 2,400,000 | ImmunoGen, Inc. (a) | 26,376,000 | ||||||
| 2,614,521 | Insulet Corp. (a) | 224,848,806 | ||||||
| 350,900 | Medtronic PLC | 28,117,617 | ||||||
| 400,000 | Merck & Co., Inc. | 23,548,000 | ||||||
| 727,200 | Momenta Pharmaceuticals, Inc. (a) | 15,125,760 | ||||||
| 7,187,959 | Nektar Therapeutics (a) | 601,344,650 | ||||||
| 995,636 | Novartis AG – ADR | 76,355,325 | ||||||
| 200,000 | NuVasive, Inc. (a) | 10,642,000 | ||||||
| 200,000 | OraSure Technologies, Inc. (a) | 3,546,000 | ||||||
| 411,000 | PerkinElmer, Inc. | 30,150,960 | ||||||
| 2,917,961 | QIAGEN N.V. (a) | 95,446,504 | ||||||
| 384,032 | Roche Holding AG – CHF | 85,327,098 | ||||||
| 6,118,700 | Seattle Genetics, Inc. (a) | 313,216,253 | ||||||
The accompanying notes are an integral part of these financial statements.
19
Schedule of Investments
PRIMECAP Odyssey Growth Fund
April 30, 2018 (Unaudited) – continued
| Shares | Value | |||||||
| Health Care (continued) | ||||||||
| 202,200 | Siemens Healthineers AG – EUR (a) (b) | $ | 7,883,234 | |||||
| 315,400 | Thermo Fisher Scientific, Inc. | 66,344,390 | ||||||
| 48,500 | Waters Corp. (a) | 9,137,885 | ||||||
| 954,017 | Xencor, Inc. (a) | 27,656,953 | ||||||
| 64,817 | Zimmer Biomet Holdings, Inc. | 7,464,974 | ||||||
|
| |||||||
| 3,863,414,049 | ||||||||
|
| |||||||
| Industrials – 12.8% | ||||||||
| 2,902,400 | AECOM (a) | 99,958,656 | ||||||
| 737,700 | Airbus Group SE – EUR | 86,593,441 | ||||||
| 5,857,201 | American Airlines Group, Inc. | 251,449,639 | ||||||
| 400,000 | Avis Budget Group, Inc. (a) | 19,764,000 | ||||||
| 450,000 | Caterpillar, Inc. | 64,962,000 | ||||||
| 145,000 | CIRCOR International, Inc. | 6,143,650 | ||||||
| 274,000 | Curtiss-Wright Corp. | 35,082,960 | ||||||
| 1,925,100 | Delta Air Lines, Inc. | 100,528,722 | ||||||
| 200,000 | FedEx Corp. | 49,440,000 | ||||||
| 175,500 | IDEX Corp. | 23,457,330 | ||||||
| 1,425,794 | Jacobs Engineering Group, Inc. | 82,824,373 | ||||||
| 2,727,550 | JetBlue Airways Corp. (a) | 52,341,685 | ||||||
| 489,000 | Ritchie Bros. Auctioneers, Inc. | 16,004,970 | ||||||
| 1,014,932 | Siemens AG – EUR | 128,890,977 | ||||||
| 3,297,700 | Southwest Airlines Co. | 174,217,491 | ||||||
| 560,000 | Textron, Inc. | 34,798,400 | ||||||
| 4,571,200 | United Continental Holdings, Inc. (a) | 308,738,848 | ||||||
| 86,000 | United Parcel Service, Inc. – Class B | 9,761,000 | ||||||
|
| |||||||
| 1,544,958,142 | ||||||||
|
| |||||||
| Information Technology – 30.7% | ||||||||
| 1,252,353 | Adobe Systems, Inc. (a) | 277,521,425 | ||||||
| 1,528,000 | Alibaba Group Holding Ltd. – ADR (a) | 272,809,120 | ||||||
| 132,067 | Alphabet, Inc. – Class A (a) | 134,520,805 | ||||||
| 115,530 | Alphabet, Inc. – Class C (a) | 117,532,135 | ||||||
| 644,400 | Altair Engineering, Inc. – Class A (a) | 18,674,712 | ||||||
| 280,000 | Analog Devices, Inc. | 24,458,000 | ||||||
| 151,700 | Applied Materials, Inc. | 7,534,939 | ||||||
| 213,600 | ASML Holding N.V. | 40,252,920 | ||||||
| 15,211,850 | BlackBerry Ltd. (a) | 159,268,069 | ||||||
| 2,016,100 | Cisco Systems, Inc. | 89,293,069 | ||||||
| 1,255,000 | comScore, Inc. (a) | 26,606,000 | ||||||
| 1,320,100 | Cree, Inc. (a) | 49,266,132 | ||||||
The accompanying notes are an integral part of these financial statements.
20
Schedule of Investments
PRIMECAP Odyssey Growth Fund
April 30, 2018 (Unaudited) – continued
| Shares | Value | |||||||
| Information Technology (continued) | ||||||||
| 255,939 | Dell Technologies Inc. – Class V (a) | $ | 18,368,742 | |||||
| 417,130 | DXC Technology Co. | 42,989,418 | ||||||
| 251,900 | eBay, Inc. (a) | 9,541,972 | ||||||
| 225,000 | Electronic Arts, Inc. (a) | 26,545,500 | ||||||
| 658,595 | Ellie Mae, Inc. (a) | 63,798,098 | ||||||
| 6,624,729 | Flex Ltd. (a) | 86,121,477 | ||||||
| 524,718 | FormFactor, Inc. (a) | 6,021,139 | ||||||
| 9,132,300 | Hewlett Packard Enterprise Co. | 155,705,715 | ||||||
| 3,669,700 | HP, Inc. | 78,861,853 | ||||||
| 1,600,000 | Intel Corp. | 82,592,000 | ||||||
| 100,000 | Intuit, Inc. | 18,479,000 | ||||||
| 725,000 | Jabil Circuit, Inc. | 19,285,000 | ||||||
| 547,150 | Keysight Technologies, Inc. (a) | 28,276,712 | ||||||
| 698,300 | KLA-Tencor Corp. | 71,045,042 | ||||||
| 8,154,600 | L.M. Ericsson Telephone Co. – ADR | 61,567,230 | ||||||
| 1,771,109 | Micro Focus International PLC – ADR | 30,675,608 | ||||||
| 6,315,000 | Micron Technology, Inc. (a) | 290,363,700 | ||||||
| 2,267,100 | Microsoft Corp. | 212,019,192 | ||||||
| 3,567,354 | NetApp, Inc. | 237,514,429 | ||||||
| 1,619,000 | Nuance Communications, Inc. (a) | 23,831,680 | ||||||
| 590,000 | NVIDIA Corp. | 132,691,000 | ||||||
| 1,922,300 | QUALCOMM, Inc. | 98,056,523 | ||||||
| 112,249 | Rambus, Inc. (a) | 1,515,361 | ||||||
| 2,290,000 | Splunk, Inc. (a) | 235,068,500 | ||||||
| 4,914,300 | Stratasys Ltd. (a) (c) | 94,207,131 | ||||||
| 53,100 | Teradyne, Inc. | 1,728,405 | ||||||
| 1,621,395 | Texas Instruments, Inc. | 164,458,095 | ||||||
| 945,600 | Trimble, Inc. (a) | 32,717,760 | ||||||
| 810,000 | Visa, Inc. – Class A | 102,772,800 | ||||||
| 410,000 | VMware, Inc. – Class A (a) | 54,636,600 | ||||||
| 74,900 | Western Digital Corp. | 5,901,371 | ||||||
|
| |||||||
| 3,705,094,379 | ||||||||
|
| |||||||
| Materials – 0.5% | ||||||||
| 394,500 | Monsanto Co. | 49,458,465 | ||||||
| 100,000 | Praxair, Inc. | 15,252,000 | ||||||
|
| |||||||
| 64,710,465 | ||||||||
|
| |||||||
| | TOTAL COMMON STOCKS | $ | 11,328,091,790 | |||||
|
| |||||||
The accompanying notes are an integral part of these financial statements.
21
Schedule of Investments
PRIMECAP Odyssey Growth Fund
April 30, 2018 (Unaudited) – continued
| Shares | Value | |||||||
| CLOSED-END FUNDS – 0.3% | ||||||||
| Information Technology – 0.3% | ||||||||
| 578,000 | Altaba, Inc. (a) | $ | 40,506,240 | |||||
|
| |||||||
| | TOTAL CLOSED-END FUNDS | 40,506,240 | ||||||
|
| |||||||
| RIGHTS – 0.0% | ||||||||
| Health Care – 0.0% | ||||||||
| 30,000 | Dyax Corp. Contingent Value Rights (a) (d) (e) | 90,000 | ||||||
|
| |||||||
| | TOTAL RIGHTS | 90,000 | ||||||
|
| |||||||
| SHORT-TERM INVESTMENTS – 5.8% | ||||||||
| 702,894,833 | Dreyfus Treasury Securities Cash Management Fund – 1.55% (f) | $ | 702,894,833 | |||||
|
| |||||||
| | TOTAL SHORT-TERM INVESTMENTS | 702,894,833 | ||||||
|
| |||||||
| | TOTAL INVESTMENTS IN SECURITIES | 12,071,582,863 | ||||||
Liabilities in Excess of Other Assets – (0.1)% | (16,550,241 | ) | ||||||
|
| |||||||
TOTAL NET ASSETS – 100.0% | $ | 12,055,032,622 | ||||||
|
| |||||||
| ADR | American Depository Receipt |
| CHF | Swiss Francs |
| EUR | Euros |
| (a) | Non-Income Producing |
| (b) | Restricted security |
| (c) | Considered an affiliated company of the fund as the fund owns 5% or more of the outstanding voting securities of such company (Note 7). |
| (d) | Illiquid security |
| (e) | Fair-valued security (Note 4) |
| (f) | Rate quoted is seven-day yield at period end. |
The Global Industry Classification Standard (GICS®) was developed by and is the exclusive property of MSCI Inc. and Standard & Poor’s Financial Services LLC (“S&P”). GICS is a service mark of MSCI and S&P and has been licensed for use by the fund’s administrator.
The accompanying notes are an integral part of these financial statements.
22
| Shares | Value | |||||||
| COMMON STOCKS – 95.6% | ||||||||
| Consumer Discretionary – 14.5% | ||||||||
| 100 | Amazon.com, Inc. (a) | $ | 156,613 | |||||
| 2,248,000 | Ascena Retail Group, Inc. (a) | 4,990,560 | ||||||
| 825,000 | Boot Barn Holdings, Inc. (a) | 16,145,250 | ||||||
| 3,200 | Burlington Stores, Inc. (a) | 434,720 | ||||||
| 1,642,900 | CarMax, Inc. (a) | 102,681,250 | ||||||
| 7,800,900 | Chegg, Inc. (a) (b) | 181,058,889 | ||||||
| 9,521,000 | DHX Media Ltd. – Class A – CAD | 25,953,892 | ||||||
| 510,000 | DHX Media Ltd. – Class B – CAD | 1,370,381 | ||||||
| 9,400 | Entercom Communications Corp. – Class A | 95,410 | ||||||
| 265,000 | Gildan Activewear, Inc. | 7,719,450 | ||||||
| 96,000 | Habit Restaurants, Inc. (The) – Class A (a) | 969,600 | ||||||
| 3,333,700 | IMAX Corp. (a) (b) | 77,341,840 | ||||||
| 835,000 | iRobot Corp. (a) | 48,730,600 | ||||||
| 1,848,186 | Lions Gate Entertainment Corp. – Class A (a) | 46,001,350 | ||||||
| 2,802,500 | Lions Gate Entertainment Corp. – Class B (a) | 64,513,550 | ||||||
| 5,750 | Netflix, Inc. (a) | 1,796,645 | ||||||
| 555,000 | Norwegian Cruise Line Holdings Ltd. (a) | 29,675,850 | ||||||
| 7,400 | Restaurant Brands International, Inc. | 402,708 | ||||||
| 3,500 | Roku, Inc. (a) | 113,890 | ||||||
| 1,646,800 | Royal Caribbean Cruises Ltd. | 178,167,292 | ||||||
| 2,739,700 | Shutterfly, Inc. (a) (b) | 221,696,524 | ||||||
| 7,380,000 | Sony Corp. – ADR | 338,225,400 | ||||||
| 264,490 | Tesla, Inc. (a) | 77,733,611 | ||||||
| 1,034,500 | Tribune Media Co. – Class A | 39,093,755 | ||||||
| 1,031,501 | tronc, Inc. (a) | 18,938,358 | ||||||
| 1,599,000 | Tuesday Morning Corp. (a) | 5,676,450 | ||||||
| 49,700 | Ulta Beauty, Inc. (a) | 12,470,227 | ||||||
|
| |||||||
| 1,502,154,065 | ||||||||
|
| |||||||
| Consumer Staples – 0.1% | ||||||||
| 114,000 | Calavo Growers, Inc. | 10,681,800 | ||||||
|
| |||||||
| Energy – 0.3% | ||||||||
| 581,750 | Cabot Oil & Gas Corp. | 13,909,643 | ||||||
| 40,000 | EOG Resources, Inc. | 4,726,800 | ||||||
| 85,000 | Rex Energy Corp. (a) | �� | 69,700 | |||||
| 1,074,882 | Transocean Ltd. (a) | 13,296,290 | ||||||
|
| |||||||
| 32,002,433 | ||||||||
|
| |||||||
The accompanying notes are an integral part of these financial statements.
23
Schedule of Investments
PRIMECAP Odyssey Aggressive Growth Fund
April 30, 2018 (Unaudited) – continued
| Shares | Value | |||||||
| Financials – 3.9% | ||||||||
| 250,671 | CME Group, Inc. | $ | 39,525,803 | |||||
| 552,013 | Discover Financial Services | 39,330,926 | ||||||
| 2,154,713 | E*TRADE Financial Corp. (a) | 130,747,985 | ||||||
| 755,820 | MarketAxess Holdings, Inc. | 150,128,527 | ||||||
| 2,154,049 | NMI Holdings, Inc. – Class A (a) | 29,833,579 | ||||||
| 139,000 | Progressive Corp. (The) | 8,380,310 | ||||||
|
| |||||||
| 397,947,130 | ||||||||
|
| |||||||
| Health Care – 35.6% | ||||||||
| 2,066,300 | Abaxis, Inc. (b) | 137,553,591 | ||||||
| 1,503,300 | Abbott Laboratories | 87,386,829 | ||||||
| 1,508,873 | ABIOMED, Inc. (a) | 454,095,329 | ||||||
| 1,650,600 | Accuray, Inc. (a) | 8,253,000 | ||||||
| 472,100 | Adverum Biotechnologies, Inc. (a) | 2,950,625 | ||||||
| 6,214,822 | Alkermes PLC (a) | 275,130,170 | ||||||
| 4,000,400 | Arbutus Biopharma Corp. (a) (b) | 22,802,280 | ||||||
| 825,000 | Axovant Sciences Ltd. (a) | 882,750 | ||||||
| 314,647 | BeiGene Ltd. – ADR (a) | 53,357,838 | ||||||
| 284,500 | Biogen, Inc. (a) | 77,839,200 | ||||||
| 1,481,075 | BioMarin Pharmaceutical, Inc. (a) | 123,684,573 | ||||||
| 264,000 | Boston Scientific Corp. (a) | 7,582,080 | ||||||
| 10,300,000 | Cerus Corp. (a) (b) | 53,560,000 | ||||||
| 17,000 | Charles River Laboratories International, Inc. (a) | 1,771,230 | ||||||
| 530,650 | Dextera Surgical, Inc. (a) | 20,695 | ||||||
| 1,588,800 | Eli Lilly & Co. | 128,804,016 | ||||||
| 4,374,484 | Epizyme, Inc. (a) (b) | 56,212,120 | ||||||
| 3,067,900 | Exact Sciences Corp. (a) | 153,425,679 | ||||||
| 1,461,900 | Flex Pharma, Inc. (a) (b) | 7,017,120 | ||||||
| 3,861,932 | Fluidigm Corp. (a) (b) | 22,785,399 | ||||||
| 163,500 | Glaukos Corp. (a) | 5,506,680 | ||||||
| 13,000 | Illumina, Inc. (a) | 3,132,090 | ||||||
| 325,000 | ImmunoGen, Inc. (a) | 3,571,750 | ||||||
| 1,964,956 | Insulet Corp. (a) | 168,986,216 | ||||||
| 1,792,583 | Momenta Pharmaceuticals, Inc. (a) | 37,285,727 | ||||||
| 11,974,776 | Nektar Therapeutics (a) (b) | 1,001,809,760 | ||||||
| 490,000 | NuVasive, Inc. (a) | 26,072,900 | ||||||
| 3,763,700 | OncoMed Pharmaceuticals, Inc. (a) (b) | 11,178,189 | ||||||
| 943,400 | OraSure Technologies, Inc. (a) | 16,726,482 | ||||||
| 14,600 | Penumbra, Inc. (a) | 1,815,510 | ||||||
| 2,297,100 | Pfenex, Inc. (a) (b) | 12,771,876 | ||||||
The accompanying notes are an integral part of these financial statements.
24
Schedule of Investments
PRIMECAP Odyssey Aggressive Growth Fund
April 30, 2018 (Unaudited) – continued
| Shares | Value | |||||||
| Health Care (continued) | ||||||||
| 3,935,573 | QIAGEN N.V. (a) | $ | 128,732,593 | |||||
| 307,700 | Roche Holding AG – CHF | 68,367,084 | ||||||
| 4,205,500 | Seattle Genetics, Inc. (a) | 215,279,545 | ||||||
| 9,465,000 | Spectrum Pharmaceuticals, Inc. (a) (b) | 150,682,800 | ||||||
| 5,081,182 | Xencor, Inc. (a) (b) | 147,303,466 | ||||||
|
| |||||||
| 3,674,337,192 | ||||||||
|
| |||||||
| Industrials – 11.4% | ||||||||
| 555,000 | AECOM (a) | 19,114,200 | ||||||
| 750,000 | Alaska Air Group, Inc. | 48,697,500 | ||||||
| 5,500 | Allegiant Travel Co. | 881,375 | ||||||
| 5,455,400 | American Airlines Group, Inc. | 234,200,322 | ||||||
| 462,000 | Axon Enterprise, Inc. (a) | 19,394,760 | ||||||
| 191,000 | CIRCOR International, Inc. | 8,092,670 | ||||||
| 41,000 | Controladora Vuela Compania de Aviacion, S.A.B. de C.V. – ADR (a) | 255,840 | ||||||
| 188,400 | Curtiss-Wright Corp. | 24,122,736 | ||||||
| 3,970,700 | Delta Air Lines, Inc. | 207,349,954 | ||||||
| 9,900 | Fedex Corp. | 2,447,280 | ||||||
| 149,000 | Gibraltar Industries, Inc. (a) | 5,237,350 | ||||||
| 752,500 | Hawaiian Holdings, Inc. | 31,003,000 | ||||||
| 1,633 | Herc Holdings, Inc. (a) | 85,977 | ||||||
| 101,417 | ICF International, Inc. | 6,805,081 | ||||||
| 1,168,600 | Jacobs Engineering Group, Inc. | 67,883,974 | ||||||
| 6,634,225 | JetBlue Airways Corp. (a) | 127,310,778 | ||||||
| 355,000 | NCI Building Systems, Inc. (a) | 6,212,500 | ||||||
| 1,760,000 | NN, Inc. (b) | 35,728,000 | ||||||
| 22,000 | Old Dominion Freight Line, Inc. | 2,944,920 | ||||||
| 560,372 | Ritchie Bros. Auctioneers, Inc. | 18,340,975 | ||||||
| 4,000 | Ryanair Holdings PLC – ADR (a) | 439,880 | ||||||
| 930,000 | Southwest Airlines Co. | 49,131,900 | ||||||
| 427,500 | Spirit Airlines, Inc. (a) | 15,270,300 | ||||||
| 4,500 | TransDigm Group, Inc. (a) | 1,442,565 | ||||||
| 3,574,450 | United Continental Holdings, Inc. (a) | 241,418,353 | ||||||
|
| |||||||
| 1,173,812,190 | ||||||||
|
| |||||||
| Information Technology – 28.1% | ||||||||
| 805,900 | Adobe Systems, Inc. (a) | 178,587,440 | ||||||
| 908,850 | Alibaba Group Holding Ltd. – ADR (a) | 162,266,079 | ||||||
| 84,520 | Alphabet, Inc. – Class A (a) | 86,090,382 | ||||||
| 84,736 | Alphabet, Inc. – Class C (a) | 86,204,475 | ||||||
The accompanying notes are an integral part of these financial statements.
25
Schedule of Investments
PRIMECAP Odyssey Aggressive Growth Fund
April 30, 2018 (Unaudited) – continued
| Shares | Value | |||||||
| Information Technology (continued) | ||||||||
| 1,500 | Arista Networks, Inc. (a) | $ | 396,825 | |||||
| 100,000 | ASML Holding N.V. | 18,845,000 | ||||||
| 2,510,000 | Axcelis Technologies, Inc. (a) (b) | 55,220,000 | ||||||
| 23,243,918 | BlackBerry Ltd. (a) | 243,363,821 | ||||||
| 5,666,160 | comScore, Inc. (a) (b) | 120,122,592 | ||||||
| 163,000 | Cray, Inc. (a) | 3,887,550 | ||||||
| 1,675,300 | Cree, Inc. (a) | 62,522,196 | ||||||
| 200,000 | Dell Technologies Inc. – Class V (a) | 14,354,000 | ||||||
| 415,000 | Digimarc Corp. (a) | 11,972,750 | ||||||
| 41,233 | DXC Technology Co. | 4,249,473 | ||||||
| 312,100 | eBay, Inc. (a) | 11,822,348 | ||||||
| 125,000 | Electronic Arts, Inc. (a) | 14,747,500 | ||||||
| 2,227,700 | Ellie Mae, Inc. (a) (b) | 215,797,299 | ||||||
| 1,498,322 | FARO Technologies, Inc. (a) (b) | 75,665,261 | ||||||
| 8,896,900 | Flex Ltd. (a) | 115,659,700 | ||||||
| 1,132,800 | FormFactor, Inc. (a) | 12,998,880 | ||||||
| 7,000 | GTT Communications, Inc. (a) | 336,350 | ||||||
| 1,186,000 | Hewlett Packard Enterprise Co. | 20,221,300 | ||||||
| 535,000 | HP, Inc. | 11,497,150 | ||||||
| 466,050 | HubSpot, Inc. (a) | 49,354,695 | ||||||
| 178,000 | Intuit, Inc. | 32,892,620 | ||||||
| 765,000 | Jabil Circuit, Inc. | 20,349,000 | ||||||
| 270,000 | Keysight Technologies, Inc. (a) | 13,953,600 | ||||||
| 764,400 | KLA-Tencor Corp. | 77,770,056 | ||||||
| 42,000 | Materialise NV – ADR (a) | 503,580 | ||||||
| 640,100 | MaxLinear, Inc. – Class A (a) | 14,293,433 | ||||||
| 208,196 | Micro Focus International PLC – ADR | 3,605,955 | ||||||
| 6,670,000 | Micron Technology, Inc. (a) | 306,686,600 | ||||||
| 543,877 | MINDBODY, Inc. – Class A (a) | 21,564,723 | ||||||
| 2,157,467 | NetApp, Inc. | 143,644,153 | ||||||
| 59,100 | nLIGHT, Inc. (a) | 1,473,363 | ||||||
| 1,874,000 | Nuance Communications, Inc. (a) | 27,585,280 | ||||||
| 745,582 | Nutanix, Inc. – Class A (a) | 37,718,993 | ||||||
| 467,945 | NVIDIA Corp. | 105,240,830 | ||||||
| 237,981 | OSI Systems, Inc. (a) | 15,235,544 | ||||||
| 1,232,000 | PROS Holdings, Inc. (a) | 36,368,640 | ||||||
| 1,435,200 | QUALCOMM, Inc. | 73,209,552 | ||||||
| 1,243,600 | Rubicon Project, Inc. (The) (a) | 2,711,048 | ||||||
| 8,822,000 | ServiceSource International, Inc. (a) (b) | 33,435,380 | ||||||
The accompanying notes are an integral part of these financial statements.
26
Schedule of Investments
PRIMECAP Odyssey Aggressive Growth Fund
April 30, 2018 (Unaudited) – continued
| Shares | Value | |||||||
| Information Technology (continued) | ||||||||
| 2,133,200 | Splunk, Inc. (a) | $ | 218,972,980 | |||||
| 2,307,000 | Stratasys Ltd. (a) | 44,225,190 | ||||||
| 740,300 | Trimble, Inc. (a) | 25,614,380 | ||||||
| 280,000 | Universal Display Corp. | 24,654,000 | ||||||
| 325,000 | VMware, Inc. – Class A (a) | 43,309,500 | ||||||
| 64,000 | Western Digital Corp. | 5,042,560 | ||||||
|
| |||||||
| 2,906,244,026 | ||||||||
|
| |||||||
| Materials – 0.4% | ||||||||
| 2,900 | Ingevity Corp. (a) | 222,807 | ||||||
| 2,325,000 | Marrone Bio Innovations, Inc. (a) | 4,068,750 | ||||||
| 284,300 | Monsanto Co. | 35,642,691 | ||||||
| 200,300 | Syrah Resources Ltd. – AUD (a) | 479,556 | ||||||
|
| |||||||
| 40,413,804 | ||||||||
|
| |||||||
| Telecom Services – 1.3% | ||||||||
| 23,430,000 | Sprint Corp. (a) | 131,442,300 | ||||||
|
| |||||||
| | TOTAL COMMON STOCKS | $ | 9,869,034,940 | |||||
|
| |||||||
| PREFERRED STOCKS – 0.3% | ||||||||
| Financials – 0.3% | ||||||||
| 2,473,500 | Fannie Mae Fixed-to-Floating Rate Non-Cumulative Preferred Stock Series S, Perpetual Maturity (a) | 15,830,400 | ||||||
| 2,923,500 | Freddie Mac Fixed-to-Floating Rate Non-Cumulative Preferred Stock Series Z, Perpetual Maturity (a) | 18,973,515 | ||||||
|
| |||||||
| 34,803,915 | ||||||||
|
| |||||||
| | TOTAL PREFERRED STOCKS | 34,803,915 | ||||||
|
| |||||||
| RIGHTS – 0.2% | ||||||||
| Health Care – 0.2% | ||||||||
| 7,639,720 | Dyax Corp. Contingent Value Rights (a) (c) (d) | 22,919,160 | ||||||
|
| |||||||
| | TOTAL RIGHTS | 22,919,160 | ||||||
|
| |||||||
| CLOSED-END FUNDS – 0.1% | ||||||||
| Information Technology – 0.1% | ||||||||
| 141,580 | Altaba, Inc. (a) | 9,921,926 | ||||||
|
| |||||||
| | TOTAL CLOSED-END FUNDS | 9,921,926 | ||||||
|
| |||||||
The accompanying notes are an integral part of these financial statements.
27
Schedule of Investments
PRIMECAP Odyssey Aggressive Growth Fund
April 30, 2018 (Unaudited) – continued
| Shares | Value | |||||||
| SHORT-TERM INVESTMENTS – 3.8% | ||||||||
| 391,315,560 | Dreyfus Treasury Securities Cash Management Fund – 1.55% (e) | $ | 391,315,560 | |||||
|
| |||||||
| | TOTAL SHORT-TERM INVESTMENTS | 391,315,560 | ||||||
|
| |||||||
| | TOTAL INVESTMENTS IN SECURITIES | 10,327,995,501 | ||||||
Liabilities in Excess of Other Assets – (0.0)% | (788,704 | ) | ||||||
|
| |||||||
TOTAL NET ASSETS – 100.0% | $ | 10,327,206,797 | ||||||
|
| |||||||
| ADR | American Depository Receipt |
| AUD | Australian Dollars |
| CAD | Canadian Dollars |
| CHF | Swiss Francs |
| (a) | Non-Income Producing |
| (b) | Considered an affiliated company of the fund as the fund owns 5% or more of the outstanding voting securities of such company (Note 7). |
| (c) | Illiquid security |
| (d) | Fair-valued security (Note 4) |
| (e) | Rate quoted is seven-day yield at period end. |
The Global Industry Classification Standard (GICS®) was developed by and is the exclusive property of MSCI Inc. and Standard & Poor's Financial Services LLC ("S&P"). GICS is a service mark of MSCI and S&P and has been licensed for use by the fund's administrator.
The accompanying notes are an integral part of these financial statements.
28
| PRIMECAP Odyssey Stock Fund | PRIMECAP Odyssey Growth Fund | PRIMECAP Odyssey Aggressive Growth Fund | ||||||||||
ASSETS | ||||||||||||
Investments, at cost (unaffiliated) | $ | 6,958,751,979 | $ | 7,113,472,506 | $ | 4,342,523,859 | ||||||
|
|
|
|
|
| |||||||
Investments, at cost (affiliated) | — | 127,034,487 | 1,341,034,622 | |||||||||
|
|
|
|
|
| |||||||
Investments, at value (unaffiliated) | 9,781,387,461 | 11,977,375,732 | 7,688,253,115 | |||||||||
Investments, at value (affiliated) | — | 94,207,131 | 2,639,742,386 | |||||||||
Cash | 6,508,034 | 4,386,733 | 661,138 | |||||||||
Receivable for investments sold | — | — | 664,798 | |||||||||
Receivable for dividends and interest | 9,540,463 | 8,489,436 | 4,655,209 | |||||||||
Receivable for fund shares sold | 27,922,391 | 29,490,715 | 17,181,238 | |||||||||
Prepaid expenses and other assets | 108,868 | 123,491 | 53,124 | |||||||||
|
|
|
|
|
| |||||||
Total assets | 9,825,467,217 | 12,114,073,238 | 10,351,211,008 | |||||||||
|
|
|
|
|
| |||||||
| LIABILITIES | ||||||||||||
Payable for investments purchased | 29,425,212 | 33,499,736 | 4,140,734 | |||||||||
Payable for fund shares repurchased | 9,524,823 | 6,733,616 | 3,457,725 | |||||||||
Payable to the advisor (Note 6) | 13,216,291 | 16,141,268 | 14,333,877 | |||||||||
Other accrued expenses and liabilities | 2,107,600 | 2,665,996 | 2,071,875 | |||||||||
|
|
|
|
|
| |||||||
Total liabilities | 54,273,926 | 59,040,616 | 24,004,211 | |||||||||
|
|
|
|
|
| |||||||
NET ASSETS | $ | 9,771,193,291 | $ | 12,055,032,622 | $ | 10,327,206,797 | ||||||
|
|
|
|
|
| |||||||
Number of shares issued and outstanding (unlimited shares authorized, $0.01 par value) | 310,471,805 | 309,867,309 | 220,064,177 | |||||||||
|
|
|
|
|
| |||||||
NET ASSET VALUE, OFFERING AND REDEMPTION PRICE PER SHARE | $ | 31.47 | $ | 38.90 | $ | 46.93 | ||||||
|
|
|
|
|
| |||||||
| COMPONENTS OF NET ASSETS | ||||||||||||
Paid-in capital | $ | 6,820,688,989 | $ | 7,094,672,790 | $ | 5,308,773,881 | ||||||
Undistributed net investment income | 36,459,476 | 9,417,802 | — | |||||||||
Accumulated net realized gain | 91,518,202 | 120,021,017 | 374,109,163 | |||||||||
Net unrealized appreciation | 2,822,526,624 | 4,830,921,013 | 4,644,323,753 | |||||||||
|
|
|
|
|
| |||||||
Net assets | $ | 9,771,193,291 | $ | 12,055,032,622 | $ | 10,327,206,797 | ||||||
|
|
|
|
|
| |||||||
The accompanying notes are an integral part of these financial statements.
29
| PRIMECAP Odyssey Stock Fund | PRIMECAP Odyssey Growth Fund | PRIMECAP Odyssey Aggressive Growth Fund | ||||||||||
INVESTMENT INCOME | ||||||||||||
Dividends (unaffiliated)(1) | $ | 80,504,819 | $ | 48,550,322 | $ | 18,343,682 | ||||||
Dividends (affiliated) | — | — | 864,216 | |||||||||
Interest income | 2,627,208 | 2,684,344 | 1,638,548 | |||||||||
|
|
|
|
|
| |||||||
Total investment income | 83,132,027 | 51,234,666 | 20,846,446 | |||||||||
|
|
|
|
|
| |||||||
Expenses | ||||||||||||
Advisory fees | 26,095,550 | 30,876,958 | 27,666,262 | |||||||||
Shareholder servicing | 3,003,404 | 4,208,442 | 3,447,525 | |||||||||
Custody | 231,672 | 196,099 | 154,192 | |||||||||
Trustee fees | 58,562 | 58,561 | 58,561 | |||||||||
Other | 1,128,047 | 1,124,660 | 854,285 | |||||||||
|
|
|
|
|
| |||||||
Total expenses | 30,517,235 | 36,464,720 | 32,180,825 | |||||||||
|
|
|
|
|
| |||||||
Net investment income (loss) | 52,614,792 | 14,769,946 | (11,334,379 | ) | ||||||||
|
|
|
|
|
| |||||||
| REALIZED AND UNREALIZED GAIN (LOSS) ON INVESTMENTS AND FOREIGN CURRENCY | ||||||||||||
Net realized gain (loss) on: | ||||||||||||
Investments (unaffiliated) | 94,834,468 | 126,735,116 | 264,453,816 | |||||||||
Investments (affiliated) | (202,861 | ) | — | 130,497,577 | ||||||||
Foreign currency transactions | (17,475 | ) | (16,339 | ) | (19,857 | ) | ||||||
Change in unrealized appreciation/depreciation on: | ||||||||||||
Investments (unaffiliated) | 142,365,985 | 919,422,178 | 54,292,902 | |||||||||
Investments (affiliated) | 6,862,345 | (16,344,810 | ) | 820,959,051 | ||||||||
Foreign currency translations | (19,828 | ) | (8,488 | ) | (6,882 | ) | ||||||
|
|
|
|
|
| |||||||
Net realized and unrealized gain on investments and foreign currency | 243,822,634 | 1,029,787,657 | 1,270,176,607 | |||||||||
|
|
|
|
|
| |||||||
NET INCREASE IN NET ASSETS RESULTING FROM OPERATIONS | $ | 296,437,426 | $ | 1,044,557,603 | $ | 1,258,842,228 | ||||||
|
|
|
|
|
| |||||||
| (1) | Net of foreign taxes withheld of $2,383,300, $1,524,567, and $660,179, respectively. |
The accompanying notes are an integral part of these financial statements.
30
| Six Months Ended April 30, 2018(1) | Year Ended October 31, 2017 | |||||||
INCREASE (DECREASE) IN NET ASSETS FROM: | ||||||||
| OPERATIONS | ||||||||
Net investment income | $ | 52,614,792 | $ | 85,250,094 | ||||
Net realized gain (loss) on: | ||||||||
Investments | 94,631,607 | 122,367,808 | ||||||
Foreign currency transactions | (17,475 | ) | 18,720 | |||||
Change in unrealized appreciation/depreciation on: | ||||||||
Investments | 149,228,330 | 1,555,631,684 | ||||||
Foreign currency translations | (19,828 | ) | (8,536 | ) | ||||
|
|
|
| |||||
Net increase in net assets resulting from operations | 296,437,426 | 1,763,259,770 | ||||||
|
|
|
| |||||
| DISTRIBUTIONS TO SHAREHOLDERS | ||||||||
Net investment income | (86,731,198 | ) | (70,477,502 | ) | ||||
Net realized gain on investments | (110,178,297 | ) | (104,713,329 | ) | ||||
|
|
|
| |||||
Net decrease in net assets resulting from distributions paid | (196,909,495 | ) | (175,190,831 | ) | ||||
|
|
|
| |||||
| CAPITAL SHARE TRANSACTIONS | ||||||||
Proceeds from shares sold | 1,740,719,069 | 2,546,194,117 | ||||||
Proceeds from reinvestment of distributions | 152,175,213 | 123,145,414 | ||||||
Cost of shares repurchased | (919,814,217 | ) | (1,213,094,664 | ) | ||||
|
|
|
| |||||
Net increase from capital share transactions | 973,080,065 | 1,456,244,867 | ||||||
|
|
|
| |||||
Total increase in net assets | 1,072,607,996 | 3,044,313,806 | ||||||
|
|
|
| |||||
| NET ASSETS | ||||||||
Beginning of period | 8,698,585,295 | 5,654,271,489 | ||||||
|
|
|
| |||||
End of period (includes undistributed net investment income of $36,459,476 and $70,575,882, respectively) | $ | 9,771,193,291 | $ | 8,698,585,295 | ||||
|
|
|
| |||||
| CHANGE IN CAPITAL SHARES | ||||||||
Shares outstanding, beginning of period | 280,436,108 | 227,626,425 | ||||||
|
|
|
| |||||
Shares sold | 53,600,127 | 91,501,127 | ||||||
Shares issued on reinvestment of distributions | 4,748,056 | 4,718,215 | ||||||
Shares repurchased | (28,312,486 | ) | (43,409,659 | ) | ||||
|
|
|
| |||||
Increase in capital shares | 30,035,697 | 52,809,683 | ||||||
|
|
|
| |||||
Shares outstanding, end of period | 310,471,805 | 280,436,108 | ||||||
|
|
|
| |||||
| (1) | Unaudited |
The accompanying notes are an integral part of these financial statements.
31
| Six Months Ended April 30, 2018(1) | Year Ended October 31, 2017 | |||||||
INCREASE (DECREASE) IN NET ASSETS FROM: | ||||||||
| OPERATIONS | ||||||||
Net investment income | $ | 14,769,946 | $ | 32,547,966 | ||||
Net realized gain (loss) on: | ||||||||
Investments | 126,735,116 | 148,020,080 | ||||||
Foreign currency transactions | (16,339 | ) | 18,294 | |||||
Change in unrealized appreciation/depreciation on: | ||||||||
Investments | 903,077,368 | 2,063,079,096 | ||||||
Foreign currency translations | (8,488 | ) | (21,121 | ) | ||||
|
|
|
| |||||
Net increase in net assets resulting from operations | 1,044,557,603 | 2,243,644,315 | ||||||
|
|
|
| |||||
| DISTRIBUTIONS TO SHAREHOLDERS | ||||||||
Net investment income | (31,171,704 | ) | (32,875,526 | ) | ||||
Net realized gain on investments | (129,120,628 | ) | (206,383,770 | ) | ||||
|
|
|
| |||||
Net decrease in net assets resulting from distributions paid | (160,292,332 | ) | (239,259,296 | ) | ||||
|
|
|
| |||||
| CAPITAL SHARE TRANSACTIONS | ||||||||
Proceeds from shares sold | 2,271,894,171 | 2,756,401,466 | ||||||
Proceeds from reinvestment of distributions | 154,711,162 | 231,748,942 | ||||||
Cost of shares repurchased | (957,331,890 | ) | (1,895,506,240 | ) | ||||
|
|
|
| |||||
Net increase from capital share transactions | 1,469,273,443 | 1,092,644,168 | ||||||
|
|
|
| |||||
Total increase in net assets | 2,353,538,714 | 3,097,029,187 | ||||||
|
|
|
| |||||
| NET ASSETS | ||||||||
Beginning of period | 9,701,493,908 | 6,604,464,721 | ||||||
|
|
|
| |||||
End of period (includes undistributed net investment income of $9,417,802 and $25,819,560, respectively) | $ | 12,055,032,622 | $ | 9,701,493,908 | ||||
|
|
|
| |||||
| CHANGE IN CAPITAL SHARES | ||||||||
Shares outstanding, beginning of period | 272,228,484 | 236,736,118 | ||||||
|
|
|
| |||||
Shares sold | 58,041,838 | 87,030,442 | ||||||
Shares issued on reinvestment of distributions | 4,125,631 | 7,947,494 | ||||||
Shares repurchased | (24,528,644 | ) | (59,485,570 | ) | ||||
|
|
|
| |||||
Increase in capital shares | 37,638,825 | 35,492,366 | ||||||
|
|
|
| |||||
Shares outstanding, end of period | 309,867,309 | 272,228,484 | ||||||
|
|
|
| |||||
| (1) | Unaudited |
The accompanying notes are an integral part of these financial statements.
32
| Six Months Ended April 30, 2018(1) | Year Ended October 31, 2017 | |||||||
INCREASE (DECREASE) IN NET ASSETS FROM: | ||||||||
| OPERATIONS | ||||||||
Net investment loss | $ | (11,334,379 | ) | $ | (5,715,831 | ) | ||
Net realized gain (loss) on: | ||||||||
Investments | 394,951,393 | 93,877,627 | ||||||
Foreign currency transactions | (19,857 | ) | 52,988 | |||||
Change in unrealized appreciation/depreciation on: | ||||||||
Investments | 875,251,953 | 2,093,843,292 | ||||||
Foreign currency translations | (6,882 | ) | (15,294 | ) | ||||
|
|
|
| |||||
Net increase in net assets resulting from operations | 1,258,842,228 | 2,182,042,782 | ||||||
|
|
|
| |||||
| DISTRIBUTIONS TO SHAREHOLDERS | ||||||||
Net realized gain on investments | (81,924,081 | ) | (554,428,603 | ) | ||||
|
|
|
| |||||
| CAPITAL SHARE TRANSACTIONS | ||||||||
Proceeds from shares sold | 970,809,001 | 1,098,827,318 | ||||||
Proceeds from reinvestment of distributions | 77,951,618 | 527,670,101 | ||||||
Cost of shares repurchased | (777,948,856 | ) | (1,096,038,243 | ) | ||||
|
|
|
| |||||
Net increase from capital share transactions | 270,811,763 | 530,459,176 | ||||||
|
|
|
| |||||
Total increase in net assets | 1,447,729,910 | 2,158,073,355 | ||||||
|
|
|
| |||||
| NET ASSETS | ||||||||
Beginning of period | 8,879,476,887 | 6,721,403,532 | ||||||
|
|
|
| |||||
End of period (includes undistributed net investment income of $0 and $85,734, respectively) | $ | 10,327,206,797 | $ | 8,879,476,887 | ||||
|
|
|
| |||||
| CHANGE IN CAPITAL SHARES | ||||||||
Shares outstanding, beginning of period | 214,433,583 | 198,997,068 | ||||||
|
|
|
| |||||
Shares sold | 20,484,703 | 29,829,897 | ||||||
Shares issued on reinvestment of distributions | 1,750,935 | 15,483,278 | ||||||
Shares repurchased | (16,605,044 | ) | (29,876,660 | ) | ||||
|
|
|
| |||||
Increase in capital shares | 5,630,594 | 15,436,515 | ||||||
|
|
|
| |||||
Shares outstanding, end of period | 220,064,177 | 214,433,583 | ||||||
|
|
|
| |||||
| (1) | Unaudited |
The accompanying notes are an integral part of these financial statements
33
 | For a capital share outstanding throughout each period. |
| Six Months Ended Apr. 30, 2018(1) | Year Ended Oct. 31, 2017 | Year Ended Oct. 31, 2016 | Year Ended Oct. 31, 2015 | Year Ended Oct. 31, 2014 | Year Ended Oct. 31, 2013 | |||||||||||||||||||
Net asset value, beginning of the period | $ | 31.02 | $ | 24.84 | $ | 24.45 | $ | 23.59 | $ | 20.56 | $ | 15.75 | ||||||||||||
|
|
|
|
|
|
|
|
|
|
|
| |||||||||||||
Income from investment operations: | ||||||||||||||||||||||||
Net investment income | 0.17 | 0.33 | 0.29 | 0.31 | 0.25 | 0.27 | ||||||||||||||||||
Net realized and unrealized gain on investments and foreign currency | 0.97 | 6.61 | 0.55 | 1.21 | 3.09 | 4.79 | ||||||||||||||||||
|
|
|
|
|
|
|
|
|
|
|
| |||||||||||||
Total from investment operations | 1.14 | 6.94 | 0.84 | 1.52 | 3.34 | 5.06 | ||||||||||||||||||
|
|
|
|
|
|
|
|
|
|
|
| |||||||||||||
Less: | ||||||||||||||||||||||||
Dividends from net investment income | (0.30 | ) | (0.31 | ) | (0.24 | ) | (0.31 | ) | (0.24 | ) | (0.25 | ) | ||||||||||||
Distributions from net realized gain | (0.39 | ) | (0.45 | ) | (0.21 | ) | (0.35 | ) | (0.07 | ) | — | |||||||||||||
|
|
|
|
|
|
|
|
|
|
|
| |||||||||||||
Total distributions | (0.69 | ) | (0.76 | ) | (0.45 | ) | (0.66 | ) | (0.31 | ) | (0.25 | ) | ||||||||||||
|
|
|
|
|
|
|
|
|
|
|
| |||||||||||||
Net asset value, end of period | $ | 31.47 | $ | 31.02 | $ | 24.84 | $ | 24.45 | $ | 23.59 | $ | 20.56 | ||||||||||||
|
|
|
|
|
|
|
|
|
|
|
| |||||||||||||
Total return | 3.64 | %(2) | 28.51 | % | 3.52 | % | 6.64 | % | 16.45 | % | 32.55 | % | ||||||||||||
Ratios/supplemental data: | ||||||||||||||||||||||||
Net assets, end of period (millions) | $ | 9,771.2 | $ | 8,698.6 | $ | 5,654.3 | $ | 5,126.0 | $ | 3,532.5 | $ | 2,134.7 | ||||||||||||
Ratio of expenses to average net assets | 0.64 | %(3) | 0.65 | % | 0.67 | % | 0.65 | % | 0.62 | % | 0.63 | % | ||||||||||||
Ratio of net investment income to average net assets | 1.11 | %(3) | 1.18 | % | 1.22 | % | 1.38 | % | 1.34 | % | 1.65 | % | ||||||||||||
Portfolio turnover rate | 3 | %(2) | 6 | % | 8 | % | 7 | % | 8 | % | 15 | % | ||||||||||||
| (1) | Unaudited |
| (2) | Not Annualized |
| (3) | Annualized |
The accompanying notes are an integral part of these financial statements.
34
| Financial Highlights For a capital share outstanding throughout each period. |
| Six Months Ended Apr. 30, 2018(1) | Year Ended Oct. 31, 2017 | Year Ended Oct. 31, 2016 | Year Ended Oct. 31, 2015 | Year Ended Oct. 31, 2014 | Year Ended Oct. 31, 2013 | |||||||||||||||||||
Net asset value, beginning of the period | $ | 35.64 | $ | 27.90 | $ | 27.09 | $ | 26.14 | $ | 23.09 | $ | 16.83 | ||||||||||||
|
|
|
|
|
|
|
|
|
|
|
| |||||||||||||
Income from investment operations: | ||||||||||||||||||||||||
Net investment income | 0.05 | 0.12 | 0.12 | 0.14 | 0.13 | 0.10 | ||||||||||||||||||
Net realized and unrealized gain on investments and foreign currency | 3.78 | 8.62 | 1.04 | 1.62 | 3.45 | 6.26 | ||||||||||||||||||
|
|
|
|
|
|
|
|
|
|
|
| |||||||||||||
Total from investment operations | 3.83 | 8.74 | 1.16 | 1.76 | 3.58 | 6.36 | ||||||||||||||||||
|
|
|
|
|
|
|
|
|
|
|
| |||||||||||||
Less: | ||||||||||||||||||||||||
Dividends from investment income | (0.11 | ) | (0.14 | ) | (0.10 | ) | (0.16 | ) | (0.08 | ) | (0.10 | ) | ||||||||||||
Distributions from net realized gain | (0.46 | ) | (0.86 | ) | (0.25 | ) | (0.65 | ) | (0.45 | ) | — | |||||||||||||
|
|
|
|
|
|
|
|
|
|
|
| |||||||||||||
Total distributions | (0.57 | ) | (1.00 | ) | (0.35 | ) | (0.81 | ) | (0.53 | ) | (0.10 | ) | ||||||||||||
|
|
|
|
|
|
|
|
|
|
|
| |||||||||||||
Net asset value, end of period | $ | 38.90 | $ | 35.64 | $ | 27.90 | $ | 27.09 | $ | 26.14 | $ | 23.09 | ||||||||||||
|
|
|
|
|
|
|
|
|
|
|
| |||||||||||||
Total return | 10.82 | %(2) | 32.12 | % | 4.31 | % | 6.96 | % | 15.82 | % | 38.02 | % | ||||||||||||
Ratios/supplemental data: | ||||||||||||||||||||||||
Net assets, end of period (millions) | $ | 12,055.0 | $ | 9,701.5 | $ | 6,604.5 | $ | 6,254.6 | $ | 4,696.2 | $ | 3,661.2 | ||||||||||||
Ratio of expenses to average net assets | 0.65 | %(3) | 0.66 | % | 0.65 | % | 0.64 | % | 0.63 | % | 0.65 | % | ||||||||||||
Ratio of net investment income to average net assets | 0.26 | %(3) | 0.39 | % | 0.47 | % | 0.53 | % | 0.54 | % | 0.51 | % | ||||||||||||
Portfolio turnover rate | 2 | %(2) | 5 | % | 9 | % | 5 | % | 10 | % | 10 | % | ||||||||||||
| (1) | Unaudited |
| (2) | Not Annualized |
| (3) | Annualized |
The accompanying notes are an integral part of these financial statements.
35
| Financial Highlights PRIMECAP Odyssey Aggressive Growth Fund For a capital share outstanding throughout each period. |
| Six Months Ended Apr. 30, 2018(1) | Year Ended Oct. 31, 2017 | Year Ended Oct. 31, 2016 | Year Ended Oct. 31, 2015 | Year Ended Oct. 31, 2014 | Year Ended Oct. 31, 2013 | |||||||||||||||||||
Net asset value, beginning of the period | $ | 41.41 | $ | 33.78 | $ | 33.27 | $ | 33.21 | $ | 28.71 | $ | 18.86 | ||||||||||||
|
|
|
|
|
|
|
|
|
|
|
| |||||||||||||
Income from investment operations: | ||||||||||||||||||||||||
Net investment income (loss) | (0.05 | ) | (0.03 | ) | (0.05 | ) | 0.06 | (0.03 | ) | (0.04 | ) | |||||||||||||
Net realized and unrealized gain on investments and foreign currency | 5.95 | 10.44 | 2.59 | 1.54 | 5.04 | 9.89 | ||||||||||||||||||
|
|
|
|
|
|
|
|
|
|
|
| |||||||||||||
Total from investment operations | 5.90 | 10.41 | 2.54 | 1.60 | 5.01 | 9.85 | ||||||||||||||||||
|
|
|
|
|
|
|
|
|
|
|
| |||||||||||||
Less: | ||||||||||||||||||||||||
Dividends from investment income | — | — | (0.00 | )(2) | (0.06 | ) | — | — | ||||||||||||||||
Distributions from net realized gain | (0.38 | ) | (2.78 | ) | (2.03 | ) | (1.48 | ) | (0.51 | ) | — | |||||||||||||
|
|
|
|
|
|
|
|
|
|
|
| |||||||||||||
Total distributions | (0.38 | ) | (2.78 | ) | (2.03 | ) | (1.54 | ) | (0.51 | ) | — | |||||||||||||
|
|
|
|
|
|
|
|
|
|
|
| |||||||||||||
Net asset value, end of period | $ | 46.93 | $ | 41.41 | $ | 33.78 | $ | 33.27 | $ | 33.21 | $ | 28.71 | ||||||||||||
|
|
|
|
|
|
|
|
|
|
|
| |||||||||||||
Total return | 14.31 | %(3) | 32.59 | % | 7.90 | % | 5.13 | % | 17.71 | % | 52.23 | % | ||||||||||||
Ratios/supplemental data: | ||||||||||||||||||||||||
Net assets, end of period (millions) | $ | 10,327.2 | $ | 8,879.5 | $ | 6,721.4 | $ | 6,502.8 | $ | 5,962.5 | $ | 4,443.1 | ||||||||||||
Ratio of expenses to average net assets | 0.64 | %(4) | 0.64 | % | 0.63 | % | 0.62 | % | 0.62 | % | 0.64 | % | ||||||||||||
Ratio of net investment income (loss) to average net assets | (0.23 | %)(4) | (0.07 | %) | (0.16 | %) | 0.17 | % | (0.09 | %) | (0.23 | %) | ||||||||||||
Portfolio turnover rate | 7 | %(3) | 9 | % | 15 | % | 15 | % | 13 | % | 11 | % | ||||||||||||
| (1) | Unaudited |
| (2) | Less than one cent per share |
| (3) | Not Annualized |
| (4) | Annualized |
The accompanying notes are an integral part of these financial statements.
36
| PRIMECAP Odyssey Funds For the Six Months Ended April 30, 2018 (Unaudited) |
(1) Organization
PRIMECAP Odyssey Funds (the “Trust”) was organized on June 8, 2004 as a Delaware statutory trust and is registered as an open-end management investment company under the Investment Company Act of 1940, as amended (the “1940 Act”). The Trust is comprised of three series: PRIMECAP Odyssey Stock Fund, PRIMECAP Odyssey Growth Fund, and PRIMECAP Odyssey Aggressive Growth Fund (the “Funds”), each of which is diversified within the meaning of the 1940 Act. PRIMECAP Management Company (the “Investment Advisor”) serves as investment advisor to the Funds. Each Fund commenced operations on November 1, 2004.
Each Fund’s investment objective is to achieve long-term capital appreciation. Each Fund is authorized to issue unlimited shares of beneficial interest. All shares of each Fund have equal rights with respect to voting. The PRIMECAP Odyssey Aggressive Growth Fund is closed to most new investors.
(2) Significant Accounting Policies
The Funds consistently follow the accounting policies set forth below which are in conformity with accounting principles generally accepted in the United States of America (“U.S. GAAP”). The Funds are considered investment companies under U.S. GAAP and follow the accounting and reporting guidance applicable to investment companies in the Financial Accounting Standards Board Auditing Standards Codification Topic 946.
| A. | Security Valuation |
Securities traded on a national securities exchange are valued at the last reported sales price at the close of regular trading on each day the exchanges are open for trading. Securities traded on the National Association of Securities Dealers Automated Quotations (“NASDAQ”) are valued at the NASDAQ Official Closing Price, which may not necessarily represent the last sale price. Non-U.S. traded stocks are valued at the last sale price or official closing price in the primary local market where the stock is traded. Securities traded on an exchange for which there have been no sales are valued at the mean between the bid and ask price. Because trading on most non-U.S. exchanges is normally completed before the close of the New York Stock Exchange, the value of securities traded on foreign exchanges can change by the time a Fund calculates its net asset value per share (“NAV”). To address these changes, the Funds may utilize adjustment factors provided by an independent pricing service to systematically value foreign securities at fair value. These adjustment factors are based on statistical analyses of subsequent movement in securities indices, specific security prices, and exchange rates in foreign markets.
Securities for which quotations are not readily available are valued at their respective fair values as determined in good faith by a valuation committee of the Investment Advisor in accordance with procedures approved by the Trust’s Board of Trustees. In determining fair value, the Funds take into account all relevant factors and available information. Consequently, the price of a security used by a Fund to calculate its NAV may differ from quoted or published prices for the same security. Fair value pricing involves
37
Notes to Financial Statements
PRIMECAP Odyssey Funds
For the Six Months Ended April 30, 2018 (Unaudited) – continued
subjective judgments, and there is no single standard for determining a security’s fair value. As a result, different mutual funds could reasonably arrive at a different fair value for the same security. It is possible that the fair value determined for a security is materially different from the value that could be realized upon the sale of that security or from the values that other mutual funds may determine.
Investments in other funds are valued at their respective net asset values as determined by those funds, in accordance with the 1940 Act.
| B. | Share Valuation |
The NAV of a Fund is calculated by dividing the sum of the value of the securities held by the Fund, plus cash or other assets, minus all liabilities (including estimated accrued expenses), by the total number of outstanding shares of the Fund. The result is rounded to the nearest cent. The Funds’ shares will not be priced on the days on which the NYSE is closed for trading.
| C. | Foreign Currency |
Securities and other assets and liabilities denominated in foreign currencies are translated into U.S. dollars using exchange rates as of 4 p.m. Eastern time on the valuation date. Purchases and sales of investments and dividend and interest income are converted into U.S. dollars using the spot market rate of exchange prevailing on the respective dates of such translations. Realized foreign exchange gains or losses may arise from 1) sales of foreign currencies; 2) currency gains or losses realized between the trade and settlement dates on securities transactions; and 3) the difference between the recorded amounts of dividends, interest, and foreign withholding taxes and the U.S. dollar equivalent of the amounts actually received or paid. Net unrealized foreign exchange gains and losses arise from changes in foreign exchange rates on foreign denominated assets and liabilities other than investments in securities held at the end of the reporting period. Foreign securities and currency transactions may involve risks not associated with U.S. securities and currency.
| D. | Federal Income Taxes |
Each Fund has elected to be treated as a “regulated investment company” under Subchapter M of the Internal Revenue Code of 1986 (the “IRC”). Each Fund intends to distribute substantially all of its taxable income and any accumulated net realized capital gains. Accordingly, no provision for Federal income taxes has been made in the financial statements.
The Funds may be subject to foreign taxes on income, gains on investments, or currency repatriation, a portion of which may be reclaimed. The Funds will accrue such taxes and reclaims as applicable based upon their current interpretations of the tax rules and regulations that exist in the markets in which they invest.
Each Fund has adopted accounting standards regarding recognition and measurement of tax positions taken or expected to be taken on a tax return. The Funds recognize interest and penalties, if any, related to unrecognized tax benefits as income tax
38
Notes to Financial Statements
PRIMECAP Odyssey Funds
For the Six Months Ended April 30, 2018 (Unaudited) – continued
expense in the Statement of Operations. During the six months ended April 30, 2018, the Funds did not incur any interest or penalties. As of April 30, 2018, open tax years include the tax years ended October 31, 2014 through October 31, 2017. No Fund is aware of any tax positions for which it is more likely than not that the total amounts of unrecognized tax benefits or loss will significantly change in the next 12 months.
| E. | Allocation of Expenses |
Each Fund is charged for those expenses directly attributable to it. Expenses that are not directly attributable to a Fund are allocated among the Funds by an appropriate method based on the nature of the expense.
| F. | Security Transactions, Investment Income, and Distributions |
Security transactions are accounted for on the trade date. Dividend income and distributions to shareholders are recorded on the ex-dividend date, and interest income is recognized on the accrual basis. Realized gains and losses are evaluated on the basis of identified costs. Premiums and discounts on the purchase of securities are amortized/accreted using the effective interest method. U.S. GAAP requires that permanent financial reporting and tax differences be reclassified in the capital accounts.
| G. | Use of Estimates |
The preparation of financial statements in conformity with U.S. GAAP requires management to make estimates and assumptions that affect the reported amounts of assets and liabilities and disclosure of contingent assets and liabilities at the date of the financial statements, and the reported amounts of revenues and expenses during the reporting period. Actual results could differ from these estimates, and such differences could be material.
| H. | Indemnification Obligations |
Under the Trust’s organizational documents, its current and former officers and trustees are indemnified against certain liabilities arising out of the performance of their duties to the Funds. In addition, in the normal course of business, the Funds enter into contracts that contain a variety of representations and warranties that provide general indemnifications. The Funds’ maximum exposure under these arrangements is unknown as this would involve future claims that may be made against the Funds that have not yet occurred. Based on experience, the Funds would expect the risk of loss to be minimal.
39
Notes to Financial Statements
PRIMECAP Odyssey Funds
For the Six Months Ended April 30, 2018 (Unaudited) – continued
(3) Investment Transactions
The cost of purchases and the proceeds from sales of securities, excluding short-term investments, for the six months ended April 30, 2018 were as follows:
Fund | Purchases | Sales | ||||||
Stock Fund | $ | 1,008,827,455 | $ | 244,216,090 | ||||
Growth Fund | $ | 1,188,594,465 | $ | 240,234,292 | ||||
Aggressive Growth Fund | $ | 665,457,506 | $ | 696,536,780 | ||||
(4) Valuation Measurements
The Funds have adopted fair valuation accounting standards which establish an authoritative definition of fair value and set forth a hierarchy for measuring fair value. These standards require additional disclosure about the various inputs and valuation techniques used to develop the measurements of fair value and a discussion of changes in valuation techniques and related inputs during the period. These standards define fair value as the price that would be received in the sale of an asset or paid to transfer a liability in an orderly transaction between market participants on the measurement date. The fair value hierarchy is organized into three levels based upon the assumptions (referred to as “inputs”) used to value the asset or liability. These standards state that “observable inputs” reflect the significant assumptions that market participants would use in valuing an asset or liability based on market data obtained from independent sources. “Unobservable inputs” reflect the Funds’ own assumptions about the inputs market participants would use to value the asset or liability.
Various inputs are used in determining the value of each Fund’s investments, and the lowest level for any significant input determines leveling. These inputs are summarized in the three broad levels below:
| Level 1 – | Unadjusted quoted prices in active markets for identical securities to which the Trust has access at the date of measurement. |
| Level 2 – | Other significant observable inputs (including quoted prices for similar or related securities in both active and inactive markets, interest rates, foreign exchange rates, and fair value estimates for foreign securities indices). |
| Level 3 – | Significant unobservable inputs to the extent observable inputs are unavailable (including the Funds’ own assumptions in determining fair value of investments based on the best available information). |
40
Notes to Financial Statements
PRIMECAP Odyssey Funds
For the Six Months Ended April 30, 2018 (Unaudited) – continued
The following table provides the fair value measurements of applicable Fund assets by level within the fair value hierarchy for each Fund as of April 30, 2018. The Funds’ policy is to recognize transfers between Level 1, Level 2, and Level 3 as of the beginning of the fiscal year. These assets are measured on a recurring basis.
Fund | Description | Quoted prices in active markets for identical assets (Level 1) | Significant other observable inputs (Level 2) | Significant unobservable inputs (Level 3) | Total | |||||||||||||
| Stock Fund | Common Stock(1) | $ | 8,668,607,810 | $ | 444,674,871 | $ | — | $ | 9,113,282,681 | |||||||||
Closed-End Funds(2) | 153,475,200 | — | — | 153,475,200 | ||||||||||||||
Short-Term Investments | 514,629,580 | — | — | 514,629,580 | ||||||||||||||
|
|
|
|
|
|
|
| |||||||||||
Total Investments in Securities | $ | 9,336,712,590 | $ | 444,674,871 | $ | — | $ | 9,781,387,461 | ||||||||||
|
|
|
|
|
|
|
| |||||||||||
| Growth Fund | Common Stock(1) | $ | 11,027,280,274 | $ | 300,811,516 | $ | — | $ | 11,328,091,790 | |||||||||
Closed-End Funds(2) | 40,506,240 | — | — | 40,506,240 | ||||||||||||||
Rights(3) | — | — | 90,000 | 90,000 | ||||||||||||||
Short-Term Investments | 702,894,833 | — | — | 702,894,833 | ||||||||||||||
|
|
|
|
|
|
|
| |||||||||||
Total Investments in Securities | $ | 11,770,681,347 | $ | 300,811,516 | $ | 90,000 | $ | 12,071,582,863 | ||||||||||
|
|
|
|
|
|
|
| |||||||||||
Aggressive Growth Fund | Common Stock(1) | $ | 9,800,188,300 | $ | 68,846,640 | $ | — | $ | 9,869,034,940 | |||||||||
Preferred Stock(4) | 34,803,915 | — | — | 34,803,915 | ||||||||||||||
Rights(3) | — | — | 22,919,160 | 22,919,160 | ||||||||||||||
Closed-End Funds(2) | 9,921,926 | — | — | 9,921,926 | ||||||||||||||
Short-Term Investments | 391,315,560 | — | — | 391,315,560 | ||||||||||||||
|
|
|
|
|
|
|
| |||||||||||
Total Investments in Securities | $ | 10,236,229,701 | $ | 68,846,640 | $ | 22,919,160 | $ | 10,327,995,501 | ||||||||||
|
|
|
|
|
|
|
| |||||||||||
| (1) | Refer to each Fund’s respective Schedule of Investments for the breakdown of major categories. |
| (2) | Information Technology |
| (3) | Health Care |
| (4) | Financials |
Following is a schedule of transfers between Level 1 and Level 2 for each Fund.
| Stock Fund | Growth Fund | Aggressive Growth Fund | ||||||||||
Transfers out of Level 1(1) | $ | (444,674,871) | $ | (300,811,516) | $ | (68,846,640) | ||||||
Transfers into Level 2(1) | 444,674,871 | 300,811,516 | 68,846,640 | |||||||||
|
|
|
|
|
| |||||||
Net transfers | $ | — | $ | — | $ | — | ||||||
|
|
|
|
|
| |||||||
| (1) | Transfers between Level 1 and Level 2 for each Fund relate to the use of systematic fair valuation. On days when systematic fair valuation is used, certain non-U.S. dollar denominated securities move from a Level 1 to a Level 2 classification. On April 30, 2018 these securities in each Fund were adjusted using systematic fair valuation. There were no other significant transfers into or out of Level 1 and Level 2 as of April 30, 2018. |
41
Notes to Financial Statements
PRIMECAP Odyssey Funds
For the Six Months Ended April 30, 2018 (Unaudited) – continued
Following is a reconciliation of investments in which significant unobservable inputs (Level 3) were used in determining fair value.
Dyax Corp. Contingent Value Rights | ||||||||
| Growth Fund | Aggressive Growth Fund | |||||||
Balance at October 31, 2017 | $ | 90,000 | $ | 22,919,160 | ||||
Purchase (Received) | — | — | ||||||
Sales | — | — | ||||||
Realized Gain (Loss) | — | — | ||||||
Change in unrealized appreciation | — | — | ||||||
Transfer into (Transfer out of) Level 3 | — | — | ||||||
|
|
|
| |||||
Balance at April 30, 2018 | $ | 90,000 | $ | 22,919,160 | ||||
|
|
|
| |||||
The Growth and Aggressive Growth Funds received Dyax Corp. Contingent Value Rights (“Dyax CVR”) when Dyax Corp. was acquired by Shire PLC in January 2016. Holders of Dyax CVR receive $4 per right upon approval of lanadelumab by the U.S. Food and Drug Administration. If the drug is not approved, rights holders receive nothing. During the six months ended April 30, 2018, the Funds determined the fair value of Dyax CVR considering available information, in addition to previously available information including the results of a phase 3 study of lanadelumab, the final trading price of Dyax Corp. prior to the acquisition, the amount of cash received by Dyax Corp. shareholders, and the terms of the Dyax CVR. Dyax CVR are non-tradeable.
(5) Distribution to Shareholders
Net investment income and net realized gains differ for financial statement and tax purposes due to differing treatments of deferred wash sale losses.
42
Notes to Financial Statements
PRIMECAP Odyssey Funds
For the Six Months Ended April 30, 2018 (Unaudited) – continued
As of October 31, 2017, the components of capital on a tax basis were as follows:
| PRIMECAP Odyssey Stock Fund | PRIMECAP Odyssey Growth Fund | PRIMECAP Odyssey Aggressive Growth Fund | ||||||||||
Cost of investments for tax purposes(1) | $ | 6,017,764,790 | $ | 5,792,532,784 | $ | 5,131,835,978 | ||||||
|
|
|
|
|
| |||||||
Gross tax unrealized appreciation | 2,933,661,542 | 4,197,559,409 | 4,241,083,348 | |||||||||
Gross tax unrealized depreciation | (263,434,651 | ) | (276,401,982 | ) | (481,201,393 | ) | ||||||
|
|
|
|
|
| |||||||
Net tax unrealized appreciation | 2,670,226,891 | 3,921,157,427 | 3,759,881,955 | |||||||||
|
|
|
|
|
| |||||||
Undistributed ordinary income | 79,479,856 | 28,396,401 | 3,604,034 | |||||||||
Undistributed long-term capital gain | 101,269,624 | 126,540,733 | 78,028,780 | |||||||||
|
|
|
|
|
| |||||||
Total distributable earnings | 180,749,480 | 154,937,134 | 81,632,814 | |||||||||
|
|
|
|
|
| |||||||
Other accumulated gain (loss) | — | — | — | |||||||||
|
|
|
|
|
| |||||||
Total accumulated gain | $ | 2,850,976,371 | $ | 4,076,094,561 | $ | 3,841,514,769 | ||||||
|
|
|
|
|
| |||||||
| (1) | At October 31, 2017 the differences in the basis for federal income tax purposes and financial reporting purposes are due to the tax deferral of losses on wash sales. |
Tax components of dividends paid during the six months ended April 30, 2018 and year ended October 31, 2017 were as follows:
| April 30, 2018 | October 31, 2017 | |||||||||||||||
| Ordinary Income Distributions | Long-Term Capital Gain Distributions | Ordinary Income Distributions | Long-Term Capital Gain Distributions | |||||||||||||
Stock Fund | $ | 95,637,597 | $ | 101,271,898 | $ | 88,206,646 | $ | 86,984,185 | ||||||||
Growth Fund | $ | 33,749,308 | $ | 126,543,024 | $ | 78,879,108 | $ | 160,380,188 | ||||||||
Aggressive Growth Fund | $ | 3,605,895 | $ | 78,318,186 | $ | 1,220,270 | $ | 553,208,333 | ||||||||
The Funds designated as long-term capital gain dividends, pursuant to IRC Section 852 (b) (3), the amounts necessary to reduce the earnings and profits of the Funds related to net capital gains to zero for the tax year ended October 31, 2017.
(6) Investment Advisory and Other Agreements
The Trust has entered into an investment management agreement with the Investment Advisor on behalf of each Fund. For its services to the Funds, the Investment Advisor receives a fee paid quarterly at the annual rate of 0.60% of the first $100 million of each Fund’s average daily net assets and 0.55% of each Fund’s average daily net assets in excess of $100 million. For the six months ended April 30, 2018, each Fund paid the Investment Advisor at an effective annual rate of 0.55% of its respective average net assets.
43
Notes to Financial Statements
PRIMECAP Odyssey Funds
For the Six Months Ended April 30, 2018 (Unaudited) – continued
U.S. Bancorp Fund Services, LLC (“USBFS”) serves as the administrator, fund accountant, and transfer agent to the Funds. Quasar Distributors, LLC, an affiliate of USBFS, serves as the Funds’ distributor. U.S. Bank, N.A., an affiliate of USBFS, serves as the Funds’ custodian.
(7) Other Affiliates
Certain of the Funds’ investments are in companies that are considered to be affiliated companies of a Fund because the Fund owns 5% or more of the outstanding voting securities of the company. With respect to each such investment, refer to each Fund’s respective Schedule of Investments for the information on the sector, the number of shares held, and the percentages of net assets held in each sector. Transactions during the period in securities of these companies were as follows:
PRIMECAP Odyssey Stock Fund
| Current Period Transactions | ||||||||||||||||||||||||||||
Common Stock | Market Value at October 31, 2017 | Purchases at Cost | Proceeds from Securities Sold | Dividend Income | Realized Gain (Loss) | Change in Unrealized Gain (Loss) | Market Value at April 30, 2018 | |||||||||||||||||||||
tronc, Inc.(1) | $ | 26,858,431 | $ | — | $ | 2,001,139 | $ | — | $ | (202,861 | ) | $ | 6,862,345 | N/A | ||||||||||||||
|
|
|
|
|
|
|
|
|
|
|
|
|
| |||||||||||||||
Total | $ | 26,858,431 | $ | — | $ | 2,001,139 | $ | — | $ | (202,861 | ) | $ | 6,862,345 | $ | — | |||||||||||||
|
|
|
|
|
|
|
|
|
|
|
|
|
| |||||||||||||||
PRIMECAP Odyssey Growth Fund
|
| |||||||||||||||||||||||||||
| Current Period Transactions | ||||||||||||||||||||||||||||
Common Stock | Market Value at October 31, 2017 | Purchases at Cost | Proceeds from Securities Sold | Dividend Income | Realized Gain (Loss) | Change in Unrealized Gain (Loss) | Market Value at April 30, 2018 | |||||||||||||||||||||
Stratasys Ltd. | $ | 107,629,836 | $ | 2,922,105 | $ | — | $ | — | $ | — | $ | (16,344,810 | ) | $ | 94,207,131 | |||||||||||||
|
|
|
|
|
|
|
|
|
|
|
|
|
| |||||||||||||||
Total | $ | 107,629,836 | $ | 2,922,105 | $ | — | $ | — | $ | — | $ | (16,344,810 | ) | $ | 94,207,131 | |||||||||||||
|
|
|
|
|
|
|
|
|
|
|
|
|
| |||||||||||||||
| (1) | No longer an affiliate as of April 30, 2018. |
44
Notes to Financial Statements
PRIMECAP Odyssey Funds
For the Six Months Ended April 30, 2018 (Unaudited) – continued
PRIMECAP Odyssey Aggressive Growth Fund
| Current Period Transactions | ||||||||||||||||||||||||||||
Common Stock | Market Value at October 31, 2017 | Purchases at Cost | Proceeds from Securities Sold | Dividend Income | Realized Gain (Loss) | Change in Unrealized Gain (Loss) | Market Value at April 30, 2018 | |||||||||||||||||||||
Abaxis, Inc. | $ | 100,008,920 | $ | — | $ | — | $ | 661,216 | $ | — | $ | 37,544,671 | $ | 137,553,591 | ||||||||||||||
Arbutus Biopharma Corp. | 22,602,260 | — | — | — | — | 200,020 | 22,802,280 | |||||||||||||||||||||
Axcelis Technologies, Inc. | 95,064,550 | — | 10,531,616 | — | 6,844,847 | (36,157,781 | ) | 55,220,000 | ||||||||||||||||||||
Cerus Corp | 22,386,000 | 10,575,000 | — | — | — | 20,599,000 | 53,560,000 | |||||||||||||||||||||
Chegg, Inc. | 127,562,429 | — | 6,528,533 | — | 2,990,657 | 57,034,336 | 181,058,889 | |||||||||||||||||||||
comScore, Inc. | 153,626,189 | 11,729,324 | — | — | — | (45,232,921 | ) | 120,122,592 | ||||||||||||||||||||
Ellie Mae, Inc. | 223,621,007 | — | 22,925,818 | — | 15,318,331 | (216,221 | ) | 215,797,299 | ||||||||||||||||||||
Epizyme, Inc. | 72,920,283 | 101,071 | — | — | — | (16,809,234 | ) | 56,212,120 | ||||||||||||||||||||
FARO Technologies, Inc. | 80,721,080 | — | 3,117,312 | — | 479,988 | (2,418,495 | ) | 75,665,261 | ||||||||||||||||||||
Flex Pharma, Inc. | 3,730,292 | 258,795 | — | — | — | 3,028,033 | 7,017,120 | |||||||||||||||||||||
Fluidigm Corp. | 22,330,186 | 76,183 | — | — | — | 379,030 | 22,785,399 | |||||||||||||||||||||
IMAX Corp. | 80,842,225 | — | — | — | — | (3,500,385 | ) | 77,341,840 | ||||||||||||||||||||
Marrone Bio Innovations, Inc.(1) | 2,324,767 | — | — | — | — | 1,743,983 | N/A | |||||||||||||||||||||
Nektar Therapeutics | 324,705,015 | 14,302 | 129,104,745 | — | 102,640,110 | 703,555,078 | 1,001,809,760 | |||||||||||||||||||||
NN, Inc. | 42,847,500 | 7,675,415 | — | 203,000 | — | (14,794,915 | ) | 35,728,000 | ||||||||||||||||||||
OncoMed Pharmaceuticals, Inc. | 15,162,069 | 5,497 | — | — | — | (3,989,377 | ) | 11,178,189 | ||||||||||||||||||||
Pfenex, Inc. | 7,258,836 | — | — | — | — | 5,513,040 | 12,771,876 | |||||||||||||||||||||
ServiceSource International, Inc. | 30,700,560 | — | — | — | — | 2,734,820 | 33,435,380 | |||||||||||||||||||||
Shutterfly, Inc. | 121,797,480 | — | 8,067,422 | — | 2,223,644 | 105,742,822 | 221,696,524 | |||||||||||||||||||||
Spectrum Pharmaceuticals, Inc.(2) | N/A | 113,606,564 | — | — | — | (36,462,665 | ) | 150,682,800 | ||||||||||||||||||||
Xencor, Inc. | 92,803,448 | 12,033,806 | — | — | — | 42,466,212 | 147,303,466 | |||||||||||||||||||||
|
|
|
|
|
|
|
|
|
|
|
|
|
| |||||||||||||||
Total | $ | 1,643,015,096 | $ | 156,075,957 | $ | 180,275,446 | $ | 864,216 | $ | 130,497,577 | $ | 820,959,051 | $ | 2,639,742,386 | ||||||||||||||
|
|
|
|
|
|
|
|
|
|
|
|
|
| |||||||||||||||
| (1) | No longer an affiliate as of April 30, 2018. |
| (2) | As of October 31, 2017, the company was not an affiliate. |
(8) Subsequent Events
The Funds have evaluated subsequent events through the issuance of the financial statements and determined that no events have occurred that require disclosure.
45
As a shareholder of one or more of the Funds, you incur ongoing costs including management fees and other Fund expenses. This expense example is intended to help you understand your ongoing costs (in dollars) of investing in the Funds and to compare these costs with the ongoing costs of investing in other mutual funds.
The expense example is based on an investment of $1,000 invested for a six-month period beginning November 1, 2017 through April 30, 2018.
Actual Expenses
The information in the table adjacent to the heading “Actual Performance” provides actual account values and actual expenses. You may use the information in these columns, together with the amount you invested, to estimate the expenses that you paid over the period. Simply divide your account value by $1,000 (for example, an $8,600 account value divided by $1,000 = 8.6), then multiply the result by the number in the column entitled “Expenses Paid during Period” to estimate the expenses you paid on your account during this period.
Hypothetical Example for Comparison Purposes
The information in the table adjacent to the heading “Hypothetical Performance (5% return before expenses)” provides hypothetical account values and hypothetical expenses based on the Funds’ actual expense ratios and an assumed rate of return of 5% per year before expenses, which are not the Funds’ actual returns. The hypothetical account values and expenses may not be used to estimate the actual ending account balance or expenses you paid for the period. You may use this information to compare the ongoing costs of investing in the Funds and other mutual funds. To do so, compare these 5% hypothetical examples with the 5% hypothetical examples that appear in the shareholder reports of the other mutual funds.
Please note that the expenses shown in the table are meant to highlight your ongoing costs only. Therefore, the information adjacent to the heading “Hypothetical Performance (5% return before expenses)” is useful in comparing ongoing costs only and will not help you determine the relative total costs of owning different mutual funds. In addition, if transactional costs were included, your costs would have been higher.
46
Expense Example
PRIMECAP Odyssey Funds
(Unaudited) – continued
Beginning Account Value (11/1/17) | Ending Account Value (4/30/18) | Expenses Paid During Period(1) (11/1/17 to 4/30/18) | Expense Ratio During Period(1) (11/1/17 to 4/30/18) | |||||||||||||
PRIMECAP Odyssey Stock Fund |
| |||||||||||||||
Actual Performance | $ | 1,000.00 | $ | 1,036.40 | $ | 3.23 | 0.64% | |||||||||
Hypothetical Performance | $ | 1,000.00 | $ | 1,021.62 | $ | 3.21 | 0.64% | |||||||||
PRIMECAP Odyssey Growth Fund |
| |||||||||||||||
Actual Performance | $ | 1,000.00 | $ | 1,108.20 | $ | 3.40 | 0.65% | |||||||||
Hypothetical Performance | $ | 1,000.00 | $ | 1,021.57 | $ | 3.26 | 0.65% | |||||||||
PRIMECAP Odyssey Aggressive Growth Fund |
| |||||||||||||||
Actual Performance | $ | 1,000.00 | $ | 1,143.10 | $ | 3.40 | 0.64% | |||||||||
Hypothetical Performance | $ | 1,000.00 | $ | 1,021.62 | $ | 3.21 | 0.64% | |||||||||
| (1) | Expenses are equal to a Fund’s annualized expense ratio as indicated, multiplied by the average account value over the period, multiplied by the number of days in the most recent fiscal half-year period (181), then divided by the number of days in the fiscal year (365) to reflect the one-half year period. |
47
Proxy Voting Procedures
The Investment Advisor votes proxies relating to portfolio securities in accordance with procedures that have been approved by the Trust’s Board of Trustees. You may obtain a description of these procedures, free of charge, by calling toll-free 1-800-729-2307. This information is also available through the Securities and Exchange Commission’s (“SEC”) website at www.sec.gov.
Proxy Voting Record
Information regarding how the Funds voted proxies relating to the portfolio securities during the most recent 12-month period ended June 30 is available, without charge, by calling toll-free 1-800-729-2307. This information is also available through the SEC’s website at www.sec.gov.
Form N-Q Disclosure
The Funds file a complete schedule of portfolio holdings with the SEC for the first and third quarters of each fiscal year on Form N-Q. This information is available, without charge, by calling toll-free 1-800-729-2307. The Funds’ Forms N-Q are also available on the SEC’s website at www.sec.gov. The Funds’ Forms N-Q may be reviewed and copied at the Commission’s Public Reference Room in Washington, DC, and information on the operation of the Public Reference Room may be obtained by calling 1-800-SEC-0330.
48
Portfolio Managers
PRIMECAP Management Company has five portfolio managers who together have more than 130 years of investment experience. The portfolio managers primarily responsible for overseeing the Funds’ investments are:
| Name | Years of Experience | |||
Theo A. Kolokotrones | 48 | |||
Joel P. Fried | 33 | |||
Alfred W. Mordecai | 21 | |||
M. Mohsin Ansari | 18 | |||
James Marchetti | 13 | |||
Each of these five individuals manages a portion of the PRIMECAP Odyssey Stock Fund, the PRIMECAP Odyssey Growth Fund, and the PRIMECAP Odyssey Aggressive Growth Fund. A portion of each Fund’s assets may be managed by individuals in the Investment Advisor’s research department.
Officers and Trustees
The Trust’s officers, who oversee the Funds’ daily operations, are appointed by the Board of Trustees. The trustees are responsible for the overall management of the Trust, including establishing the Funds’ policies and general supervision and review of their investment activities. The Statement of Additional Information includes additional information about the trustees and is available, without charge, by calling 1-800-729-2307 or at the Funds’ website at www.odysseyfunds.com.
Executive Officers. The table below sets forth certain information about each of the Trust’s executive officers. The address for each officer is 177 East Colorado Boulevard, 11th Floor, Pasadena, CA 91105.
| Name (Year of Birth) | Position(s) Held with Trust | Term of Office; Length of Time Served | Principal Occupation(s) During Past 5 Years | |||
Theo A. Kolokotrones (1946) | Co-Chief Executive Officer | Indefinite; Since 09/04 | Chairman, Director, and Portfolio Manager PRIMECAP Management Company | |||
Joel P. Fried (1962) | Co-Chief Executive Officer and Trustee | Indefinite; Since 09/04 | President, Director, and Portfolio Manager PRIMECAP Management Company |
49
Management
PRIMECAP Odyssey Funds
(Unaudited) – continued
| Name (Year of Birth) | Position(s) Held with Trust | Term of Office; Length of Time Served | Principal Occupation(s) During Past 5 Years | |||
Alfred W. Mordecai (1967) | Co-Chief Executive Officer | Indefinite; Since 10/12 | Vice Chairman, Director, and Portfolio Manager PRIMECAP Management Company | |||
Michael J. Ricks (1977) | Chief Financial Officer, Chief Administrative Officer, and Secretary | Indefinite; Since 03/11 | Director of Fund Administration PRIMECAP Management Company | |||
Karen Chen (1973) | Vice President of Compliance, Chief Compliance Officer, and AML Officer | Indefinite; Since 10/04 | Chief Compliance Officer, Director of Compliance and Reporting PRIMECAP Management Company |
“Independent” Trustees. The table below sets forth certain information about each of the trustees of the Trust who is not an “interested person” of the Trust as defined in the 1940 Act (“Independent Trustees”). The address for each Independent Trustee is 177 East Colorado Boulevard, 11th Floor, Pasadena, CA 91105.
| Name (Year of Birth) | Position(s) Held with Trust | Term of Office; Length of Time Served | Principal Occupation(s) During Past 5 Years | Number of Portfolios in Fund Complex Overseen by Trustee(1) | Other Director- ships Held by Trustee | |||||
Benjamin F. Hammon (1935) | Chairman of the Board and Trustee | Indefinite; Since 09/04 | Retired; Private investor | 3 | None | |||||
Wayne H. Smith (1941) | Chairman of the Audit Committee and Trustee | Indefinite; Since 09/04 | Retired; Private investor | 3 | None | |||||
Joseph G. Uzelac (1944) | Trustee | Indefinite; Since 10/07 | Retired; Private investor | 3 | None | |||||
Elizabeth D. Obershaw (1960) | Trustee | Indefinite; Since 06/08 | Managing Director, Horsley Bridge Partners, an investment advisor (2007-present) | 3 | None |
| (1) | Fund Complex includes any funds, series of funds, or trusts that share the same advisor or that hold themselves out to investors as related companies. |
50
Management
PRIMECAP Odyssey Funds
(Unaudited) – continued
“Interested” Trustees. The table below sets forth certain information about each of the trustees of the Trust who is an “interested person” of the Trust as defined by the 1940 Act. The address for each interested trustee is 177 East Colorado Boulevard, 11th Floor, Pasadena, CA 91105.
| Name (Year of Birth) | Position(s) Held with Trust | Term of Office; Length of Time Served | Principal Occupation(s) During Past 5 Years | Number of Portfolios in Fund Complex Overseen by Trustee(1) | Other Director- ships Held by Trustee | |||||
Joel P. Fried(2) (1962) | Co-Chief Executive Officer and Trustee | Indefinite; Since 09/04 | President, Director, and Portfolio Manager PRIMECAP Management Company | 3 | None |
| (1) | Fund Complex includes any funds, series of funds, or trusts that share the same advisor or that hold themselves out to investors as related companies. |
| (2) | Mr. Fried is an “interested person” of the Trust, as defined by the 1940 Act, because of his employ- ment with PRIMECAP Management Company, the investment advisor to the Trust. |
51
PRIMECAP Management Company
Maintaining the confidentiality of client personal financial information is very important to PRIMECAP Odyssey Funds (the “Trust”) and PRIMECAP Management Company (the “Advisor”). The Advisor and the Trust may collect several types of nonpublic personal information about investors, including:
| • | Information from forms that investors may fill out and send to the Advisor or the Trust in connection with an account (such as name, address, and social security number). |
| • | Information an investor may give the Advisor or the Trust orally. |
| • | Information about the amount investors have invested in an account. |
| • | Information about any bank account investors may use for transfers between a bank account and a shareholder account. |
The Advisor and the Trust will not sell or disclose client personal information to anyone except as permitted or required by law. For example, information collected may be shared with the independent auditors in the course of the annual audit of the Advisor or the Trust. The Advisor or the Trust may also share this information with the Advisor’s or the Trust’s legal counsel, as deemed appropriate, and with regulators. Finally, the Advisor or the Trust may disclose information about clients or investors at the client’s or investor’s request (for example, by sending duplicate account statements to someone designated by the client or investor), or as otherwise permitted or required by law.
Within the Advisor and the Trust, access to information about clients and investors is restricted to those employees or service providers who need to know the information to service client accounts. The Advisor’s employees are trained to follow its procedures to protect client privacy and are instructed to access information about clients only when they have a business reason to obtain it.
The Advisor and the Trust reserve the right to change this privacy policy in the future, but we will not disclose investor nonpublic personal information except as required or permitted by law without giving the investor an opportunity to instruct us not to do so.
Investment Advisor
PRIMECAP MANAGEMENT COMPANY
177 East Colorado Boulevard, 11th Floor
Pasadena, California 91105
•
Distributor
QUASAR DISTRIBUTORS, LLC
777 East Wisconsin Avenue
Milwaukee, Wisconsin 53202
•
Custodian
U.S. BANK, N.A.
1555 North RiverCenter Drive, Suite 302
Milwaukee, WI 53212
•
Transfer Agent
U.S. BANCORP FUND SERVICES, LLC
615 East Michigan Street, 3rd Floor
Milwaukee, Wisconsin 53202
•
Administrator
U.S. BANCORP FUND SERVICES, LLC
2020 East Financial Way, Suite 100
Glendora, California 91741
•
Legal Counsel
MORGAN, LEWIS & BOCKIUS LLP
300 South Grand Avenue, Twenty-Second Floor
Los Angeles, California 90071
•
Independent Registered Public Accounting Firm
PRICEWATERHOUSECOOPERS LLP
Three Embarcadero Center
San Francisco, California 94111
This report is intended for the shareholders of the PRIMECAP Odyssey Funds and may not be used as sales literature unless preceded or accompanied by a current prospectus.
Past performance results shown in this report should not be considered a representation of future performance. Share price and returns will fluctuate so that shares, when redeemed, may be worth more or less than their original cost. Statements and other information herein are dated and are subject to change.
PRIMECAP, PRIMECAP Odyssey, and the PRIMECAP Odyssey logo are trademarks of PRIMECAP Management Company.
Item 2. Code of Ethics.
Not applicable for semi-annual reports.
Item 3. Audit Committee Financial Expert.
Not applicable for semi-annual reports.
Item 4. Principal Accountant Fees and Services.
Not applicable for semi-annual reports.
Item 5. Audit Committee of Listed Registrants.
Not applicable to registrants who are not listed issuers (as defined in Rule 10A-3 under the Securities Exchange Act of 1934).
Item 6. Investments.
| (a) | The registrant’s Schedule of Investments is included as part of the report to shareholders filed under Item 1 of this Form. |
| (b) | Not applicable. |
Item 7. Disclosure of Proxy Voting Policies and Procedures for Closed-End Management Investment Companies.
Not applicable to open-end investment companies.
Item 8. Portfolio Managers of Closed-End Management Investment Companies.
Not applicable to open-end investment companies.
Item 9. Purchases of Equity Securities by Closed-End Management Investment Company and Affiliated Purchasers.
Not applicable to open-end investment companies.
Item 10. Submission of Matters to a Vote of Security Holders.
There have been no material changes to the procedures by which shareholders may recommend nominees to the registrant’s board of trustees.
Item 11. Controls and Procedures.
| (a) | The registrant’s Co-Chief Executive Officers and Chief Financial Officer have reviewed the registrant’s disclosure controls and procedures (as defined in Rule 30a-3(c) under the Investment Company Act of 1940 (the “Act”)) as of a date within 90 days of the filing of this report, as required by Rule 30a-3(b) under the Act and Rules 13a-15(b) or 15d-15(b) under the Securities Exchange Act of 1934. Based on their review, such officers have concluded that such disclosure controls and procedures are effective in ensuring that information required to be disclosed in this report is appropriately recorded, processed, summarized and reported and made known to them by other officers of the registrant and by the registrant’s service providers. |
| (b) | There were no changes in the registrant’s internal control over financial reporting (as defined in Rule 30a-3(d) under the Act) that occurred during the second fiscal quarter of the period covered by this report that has materially affected, or is reasonably likely to materially affect, the registrant’s internal control over financial reporting. |
Item 12. Disclosure of Securities Lending Activities for Closed-End Management Investment Companies
Not applicable to open-end investment companies.
Item 13. Exhibits.
| (a) | (1) Any code of ethics or amendment thereto, that is the subject of the disclosure required by Item 2, to the extent that the registrant intends to satisfy Item 2 requirements through filing an exhibit. Not applicable for semi-annual reports. |
(2) A separate certification for each principal executive and principal financial officer pursuant to Section 302 of the Sarbanes-Oxley Act of 2002. Filed herewith.
(3) Any written solicitation to purchase securities under Rule 23c-1 under the Act sent or given during the period covered by the report by or on behalf of the registrant to 10 or more persons. Not applicable to open-end investment companies.
(4) Change in the registrant’s independent public accountant. There was no change in the registrant’s independent public accountant for the period covered by this report.
| (b) | Certifications pursuant to Section 906 of the Sarbanes-Oxley Act of 2002. Furnished herewith. |
2
SIGNATURES
Pursuant to the requirements of the Securities Exchange Act of 1934 and the Investment Company Act of 1940, the registrant has duly caused this report to be signed on its behalf by the undersigned, thereunto duly authorized.
PRIMECAP Odyssey Funds | ||||
| By | /s/ Joel P. Fried | |||
| Joel P. Fried, Co-Chief Executive Officer | ||||
| Date | June 22, 2018 | |||
| By | /s/ Theo A. Kolokotrones | |||
| Theo A. Kolokotrones, Co-Chief Executive Officer | ||||
| Date | June 22, 2018 | |||
| By | /s/ Alfred W. Mordecai | |||
| Alfred W. Mordecai, Co-Chief Executive Officer | ||||
| Date | June 22, 2018 | |||
Pursuant to the requirements of the Securities Exchange Act of 1934 and the Investment Company Act of 1940, this report has been signed below by the following persons on behalf of the registrant and in the capacities and on the dates indicated.
| By | /s/ Joel P. Fried | |||
| Joel P. Fried, Co-Chief Executive Officer | ||||
| Date | June 22, 2018 | |||
| By | /s/ Theo A. Kolokotrones | |||
| Theo A. Kolokotrones, Co-Chief Executive Officer | ||||
| Date | June 22, 2018 | |||
| By | /s/ Alfred W. Mordecai | |||
| Alfred W. Mordecai, Co-Chief Executive Officer | ||||
| Date | June 22, 2018 | |||
| By | /s/ Michael J. Ricks | |||
| Michael J. Ricks, Chief Financial Officer | ||||
| Date | June 22, 2018 | |||
3