UNITED STATES
SECURITIES AND EXCHANGE COMMISSION
Washington, D.C. 20549
FORM N-CSR
CERTIFIED SHAREHOLDER REPORT OF REGISTERED
MANAGEMENT INVESTMENT COMPANIES
Investment Company Act file number: (811- 21598)
Exact name of registrant as specified in charter: Putnam RetirementReady Funds
Address of principal executive offices: One Post Office Square, Boston, Massachusetts 02109
| Name and address of agent for service: | Beth S. Mazor, Vice President |
| One Post Office Square | |
| Boston, Massachusetts 02109 | |
| Copy to: | John W. Gerstmayr, Esq. |
| Ropes & Gray LLP | |
| One International Place | |
| Boston, Massachusetts 02110 | |
Registrant’s telephone number, including area code: (617) 292-1000
Date of fiscal year end: July 31, 2007
Date of reporting period: August 1, 2006— July 31, 2007
Item 1. Report to Stockholders:
The following is a copy of the report transmitted to stockholders pursuant to Rule 30e-1 under the Investment Company Act of 1940:
What makes
Putnam different?
A time-honored tradition in
money management
Since 1937, our values have been rooted in a profound sense of responsibility for the money entrusted to us.
A prudent approach to investing
We use a research-driven team approach to seek consistent, dependable, superior investment results over time, although there is no guarantee a fund will meet its objectives.
Funds for every investment goal
We offer a broad range of mutual funds and other financial products so investors and their financial representatives can build diversified portfolios.
A commitment to doing what’s right
for investors
With a focus on investment performance, below-average expenses, and in-depth information about our funds, we put the interests of investors first and seek to set the standard for integrity and service.
Industry-leading service
We help investors, along with their financial representatives, make informed investment decisions with confidence.

In 1830, Massachusetts Supreme Judicial Court Justice Samuel Putnam established The Prudent Man Rule, a legal foundation for responsible money management.
THE PRUDENT MAN RULE
All that can be required of a trustee to invest is that he shall conduct himself faithfully and exercise a sound discretion. He is to observe how men of prudence, discretion, and intelligence manage their own affairs, not in regard to speculation, but in regard to the permanent disposition of their funds, considering the probable income, as well as the probable safety of the capital to be invested.

Putnam
RetirementReady®
Funds
7| 31| 07
Annual Report
| Message from the Trustees | 1 |
| About the funds | 2 |
| Performance snapshot | 4 |
| Report from the fund managers | 5 |
| Underlying investments | 7 |
| Performance in depth | 9 |
| Expenses | 21 |
| Your fund’s management | 24 |
| Terms and definitions | 25 |
| Trustee approval of management contract | 26 |
| Other information for shareholders | 31 |
| Financial statements | 32 |
| Federal tax information | 102 |
| Brokerage commissions | 102 |
| Shareholder meeting results | 103 |
| About the Trustees | 104 |
| Officers | 108 |
Message from the Trustees
Dear Fellow Shareholder:
We are pleased to announce that Marsh & McLennan Companies, Inc. recently completed the sale of its ownership interest in Putnam Investments Trust, the parent company of Putnam Management and its affiliates, to Great-West Lifeco Inc. Great-West Lifeco is a financial services holding company with operations in Canada, the United States, and Europe and is a member of the Power Financial Corporation group of companies. With this sale, Putnam becomes part of a successful organization with a long-standing commitment to high-quality investment management and financial services. Please know that the change in ownership is not expected to affect the Putnam funds, the way Putnam manages money, or the funds’ management teams. Putnam will continue to operate as a separate company headquartered in Boston, and there will be no change in your funds’ fees or in the services your funds provide.
We would also like to take this opportunity to announce that Putnam President and Chief Executive Officer Ed Haldeman, one of your fund’s Trustees since 2004, was recently named President of the Funds, assuming this role from George Putnam, III. This change, together with the completion of the transaction with Great-West Lifeco, enables George Putnam to become an independent Trustee of the funds. Both George and Ed will continue serving on the Board of Trustees in our collective role of overseeing the Putnam funds on your behalf.
Lastly, we are pleased to inform you that a new independent Trustee, Robert J. Darretta, has joined your fund’s Board of Trustees. Mr. Darretta brings extensive leadership experience in corporate finance and accounting. He is a former Vice Chairman of the Board of Directors of Johnson & Johnson, one of the leading U.S. health-care and consumer products companies, where he also served as Chief Financial Officer, Executive Vice President, and Treasurer.
In the following pages, members of your fund’s management team discuss the fund’s performance and strategies for the fiscal year ended July 31, 2007, and provide their outlook for the months ahead. As always, we thank you for your support of the Putnam funds.

Putnam RetirementReady Funds: offering one-step diversification
that adjusts automatically over time
Unpredictable markets and the demands of a busy life can make it a challenge to monitor your retirement investments. Using a mix of investments can help you reduce risk and increase your exposure to opportunities in different markets — but it adds to the challenge of keeping your portfolio on track. Putnam RetirementReady Funds provide a one-step approach to investment diversification that gradually shifts toward a more conservative strategy to keep your risk exposure appropriate to your investment time horizon.
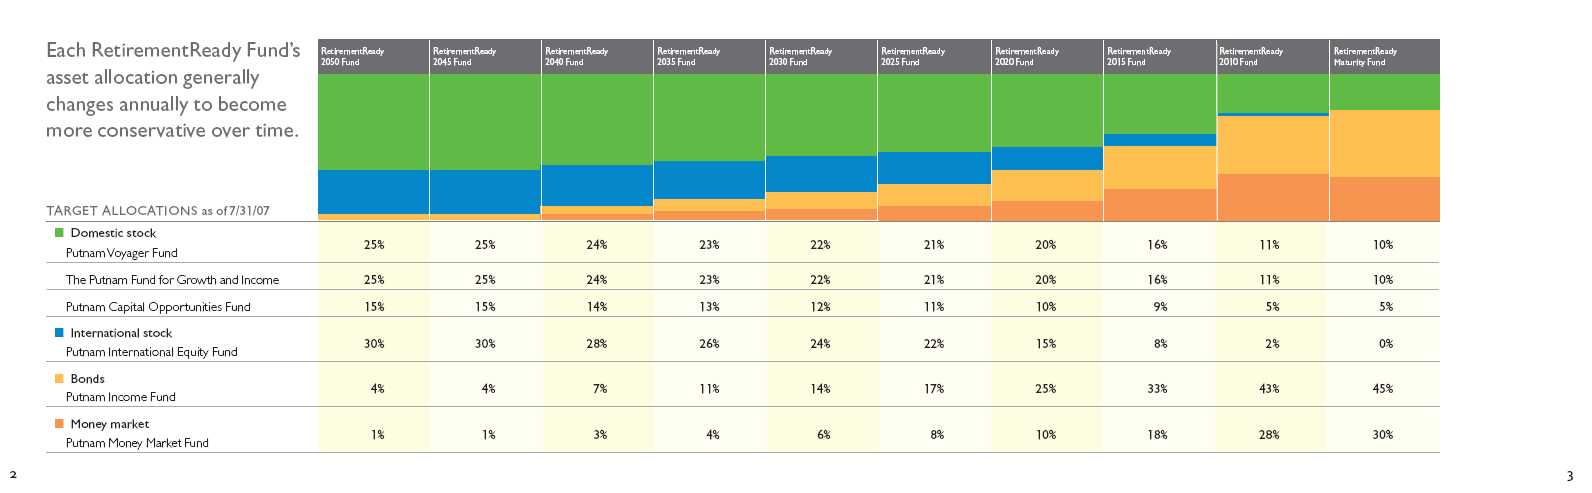
Each RetirementReady Fund invests in a combination of Putnam mutual funds to provide you with exposure to a variety of asset classes and investment styles. The RetirementReady Funds also have different target dates, indicating when investors expect to retire or otherwise begin withdrawing assets. The funds focus more heavily on aggressive, higher-risk investments when their target dates are far off, and emphasize more conservative, lower-risk investments when their target dates are near. Each fund’s asset allocation generally changes annually to become more conservative over time. The Putnam RetirementReady Maturity Fund, which has a constant allocation focused primarily on bonds and money market instruments, is designed for investors who are already retired or who expect to use the invested assets in the near future.
While diversification can help protect your returns from excessive volatility, it can’t protect against market losses. However, by choosing a RetirementReady Fund based on the year you plan to start withdrawing assets— typically in retirement — you can get the advantages of diversification and pursue maximum returns while seeking to maintain a level of risk you are comfortable with — all in one convenient investment.
The underlying Putnam funds can invest in international investments, which involve risks such as currency fluctuations, economic instability, and political developments. The underlying Putnam funds can invest some or all of their assets in small and/or midsize companies and such investments increase the risk of fluctuations in the value of your investment. The underlying Putnam funds can also have a significant portion of their holdings in bonds. Mutual funds that invest in bonds are subject to certain risks, including interest-rate risk, credit risk, and inflation risk. As interest rates rise, the prices of bonds fall. Long-term bonds have more exposure to interest-rate risk than short-term bonds. Lower-rated bonds may offer higher yields in return for more risk. Unlike bonds, bond funds have ongoing fees and expenses. These risks apply to any underlying Putnam fund with a significant portion of its assets invested in bonds. Please see the prospectus for additional information about investment strategies and related risks of the underlying funds.
Money market funds are not insured or guaranteed by the Federal Deposit Insurance Corporation (FDIC) or any other governmental agency. Although Putnam Money Market Fund seeks to maintain a constant share price of $1.00, it is possible to lose money by investing in the fund.
Performance snapshots
Putnam RetirementReady Funds
Average annual total return (%) as of 7/31/07
Fund returns for class A shares before sales charge
| 2050 Fund | 2045 Fund | 2040 Fund | 2035 Fund | 2030 Fund | |
| Life of fund* | 14.40% | 13.21% | 12.90% | 12.27% | 11.72% |
| 1 year | 16.35 | 16.36 | 15.77 | 15.18 | 14.57 |
| 2025 Fund | 2020 Fund | 2015 Fund | 2010 Fund | Maturity Fund | |
| Life of fund* | 11.12% | 9.65% | 7.96% | 5.87% | 4.85% |
| 1 year | 13.91 | 12.36 | 10.37 | 8.11 | 7.43 |
Current performance may be lower or higher than the quoted past performance, which cannot guarantee future results. Share price, principal value, and return will fluctuate, and you may have a gain or a loss when you sell your shares. Performance of class A shares assumes reinvestment of distributions and does not account for taxes. See pages 9–20 for additional performance information. For a portion of the periods, these funds may have limited expenses, without which returns would have been lower. A 1% short-term trading fee may apply. To obtain the most recent month-end performance, visit www.putnam.com.
* With the exception of the Putnam RetirementReady 2050 Fund (inception: 5/2/05), the inception date of all share classes of the RetirementReady Funds is 11/1/04.
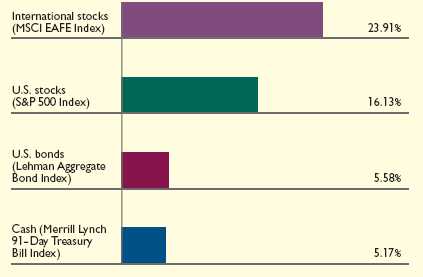
Market sector and fund performance
This comparison shows the returns of different market sectors, as represented by various indexes, for the 12 months ended 7/31/07. See pages 9–20 for fund performance information. Index descriptions can be found on page 25.
“Despite the market’s recent
record-setting levels, we believe
stocks of many U.S. companies
remain attractively valued,
particularly when viewed against
other asset classes such as bonds
or international stocks.”
Jeffrey Knight, Portfolio Leader,
Putnam RetirementReady Funds
4
Report from the fund managers
The year in review

Continuing record-level company earnings helped drive market performance during the 12 months ended July 31, 2007, which marked the end of the 2007 fiscal year for all of the Putnam RetirementReady Funds. U.S. equity markets enjoyed healthy gains, rising to new highs toward the end of the period before a stock sell-off that occurred in the last week of July. This run-up in the markets occurred despite widespread concerns about a slowing U.S. housing market, uncertainty over the effects of problems in the subprime mortgage market, high oil prices, and the threat of possible interest-rate increases. Indeed, these worries lessened as markets rode a wave of merger and acquisition activity, robust corporate earnings growth, and continuing consumer spending to produce substantial gains. The Federal Reserve (the Fed) kept rates steady throughout the fiscal year, despite investor hopes that rates might be lowered in order to stimulate the slowing U.S. economy. Oil prices rose above $70 per barrel late in the second calendar quarter of 2007, but as of the end of the period, neither that factor nor high gasoline prices had shown a measurable impact on consumer confidence or retail spending. By the end of July 2007, the U.S. economy had slowed sufficiently to keep inflation in check, but retained sufficient vitality to support corporate earnings.
Market overview: Equities
For the annual period ended July 31, 2007, the U.S. stock market delivered robust returns. Stocks generally advanced in the second half of calendar 2006, suffered through volatility in the early months of 2007, and went on to regain strength during the remainder of the period. However, a modest pullback occurred in June and a somewhat steeper decline followed at the end of July. As of the end of the period, we expected stocks to remain resilient until the competition from bond yields becomes more formidable; until then, we believe any correction is likely to be short-lived.
Interestingly, the recent positive performance of developed and emerging markets has been comparable. However, we continue to favor stocks from developed markets in the belief that this similar performance potential will continue only if the current benign conditions are not displaced; in the event of a market correction, emerging markets face greater risk of declines. Within developed markets, we still anticipate leadership from core European economies, and eventually from Japan, as economic recovery progresses in that country.
Market overview: Fixed income
Interest rates and volatility in the fixed-income market have stayed atypically low for the past few years, but are now clearly on the rise. In addition, credit spreads, or the difference in yield between higher-quality and lower-quality bonds, have widened. Although the yield premium of higher-yielding instruments in comparison to relatively risk-free U.S. Treasuries has increased partly as a result of subprime mortgage market woes, we believe that higher-yielding bonds are inadequately compensating investors for taking on the additional credit risk they carry. We also believe that the problems in the subprime market are currently reflected in other areas of the bond market. However, the ultimate effect of these problems on the broader bond market is still unclear. We are monitoring the subprime mortgage sector for fallout-related investment opportunities for the funds.
Trends in overseas markets have been similar to those in the United States, with interest rates and credit spreads on the ascent. The economies of Europe and Japan are growing faster than that of the United States, but their central banks have recently been somewhat more aggressive than the Fed in taking steps to ward off inflation. Therefore, we currently
5
prefer heavier tactical allocations to Europe and to Japan versus the U.S. market. Spreads of emerging-market debt recently have slightly widened, but remain very low; we currently maintain a neutral stance in this sector. Regarding currency, we favor the Australian dollar and U.S. dollar, and have a more negative outlook for the Japanese yen.
The outlook for your fund
The following commentary reflects anticipated developments that could affect your fund over the next six months, as well as your management team’s plans for responding to them.
While U.S. stocks delivered solid gains during the funds’ 2007 fiscal year, in the final months of the period, investors were becoming more concerned about the increase in subprime mortgage defaults and their impact on the U.S. housing market. Perennial worries about rising oil prices and the Fed’s future interest-rate policy also dampened market sentiment. However, while the stock market has become a bit more volatile, we currently see reasons for optimism, including strong corporate profits and continued strength in many international economies. And, despite the market’s recent record-setting levels, we believe stocks of many U.S. companies remain attractively valued, particularly when viewed against other asset classes such as bonds or international stocks.
The views expressed in this report are exclusively those of Putnam Management. They are not meant as investment advice.
6
Composition of the funds’
Underlying investments
Each Putnam RetirementReady Fund invests, to varying degrees, in a variety of Putnam mutual funds. This section describes the goals and strategies of the underlying funds.
Putnam Voyager Fund
The fund seeks capital appreciation by investing primarily in growth stocks of midsize and large U.S. companies. Growth stocks are issued by companies that Putnam believes are fast-growing and whose earnings Putnam believes are likely to increase over time. Growth in earnings may lead to an increase in the price of the stock. The fund invests mainly in midsize and large companies, although it can invest in companies of any size.
The Putnam Fund for Growth and Income
The fund seeks capital growth and current income by investing primarily in common stocks of large U.S. companies, with a focus on value stocks that offer the potential for capital growth, current income, or both. Value stocks are stocks that Putnam believes are currently undervalued by the market. The fund’s management team looks for companies undergoing positive change. If the team is correct and other investors recognize the value of the company, the price of the stock may rise.
Putnam Capital Opportunities Fund
The fund seeks long-term growth of capital by investing primarily in common stocks of small and midsize U.S. companies that Putnam believes have favorable investment potential. For example, the fund may purchase stocks of companies whose stock price is lower than the value Putnam places on the company. The fund may also consider other factors that Putnam believes will cause the stock price to rise.
Putnam International Equity Fund
The fund seeks capital appreciation by investing primarily in common stocks of companies outside the United States that Putnam believes have favorable investment potential. For example, the fund may purchase stocks of companies whose stock price is lower than the value Putnam places on the company. The fund may also consider other factors that Putnam believes will cause the stock price to rise. The fund invests mainly in midsize and large companies, although it can invest in companies of any size. Although the fund emphasizes investments in developed countries, it may also invest in companies located in emerging markets.
Putnam Income Fund
The fund seeks high current income consistent with what Putnam believes to be prudent risk. The fund invests mainly in bonds that are obligations of companies and governments worldwide denominated in U.S. dollars, are either investment-grade or below-investment-grade (sometimes referred to as “junk bonds”), and have intermediate-to long-term maturities (three years or longer).
Putnam Money Market Fund
The fund seeks as high a rate of current income as Putnam Management believes is consistent with preservation of capital and maintenance of liquidity. The fund invests mainly in instruments that are high quality and have short-term maturity.
International investing involves certain risks, such as currency fluctuations, economic instability, and political developments. Additional risks may be associated with emerging-market securities, including illiquidity and volatility. The funds invest some or all of their assets in small and/or midsize companies. Such investments increase the risk of greater price fluctuations. The use of derivatives involves special risks and may result in losses. Value investing seeks underpriced stocks, but there is no guarantee that a stock’s price will rise.
Lower-rated bonds may offer higher yields in return for more risk. Funds that invest in government securities are not guaranteed. Mortgage-backed securities are subject to prepayment risk. Funds that invest in bonds are subject to certain risks including interest-rate risk, credit risk, and inflation risk. As interest rates rise, the prices of bonds fall.
7
Long-term bonds are more exposed to interest-rate risk than short-term bonds. Unlike bonds, bond funds have ongoing fees and expenses.
Money market funds are not insured or guaranteed by the Federal Deposit Insurance Corporation (FDIC) or any other governmental agency. Although the fund seeks to maintain a constant share price of $1.00, it is possible to lose money by investing in this fund.
Allocations by fund as of 7/31/07
Percentages based on market value. Portfolio composition will vary over time. Due to rounding, percentages may not equal 100%.
| The Putnam | Putnam Capital | Putnam | Putnam | Putnam | Putnam | ||
| Fund for Growth | Opportunities | International | Voyager | Income | Money Market | ||
| RetirementReady Fund | and Income | Fund | Equity Fund | Fund | Fund | Fund | |
| 2050 Fund | 24.6% | 14.2% | 30.6% | 25.4% | 4.2% | 1.0% | |
| 2045 Fund | 24.6% | 14.2% | 30.6% | 25.4% | 4.2% | 1.0% | |
| 2040 Fund | 23.6% | 13.2% | 28.5% | 24.3% | 7.3% | 3.1% | |
| 2035 Fund | 22.5% | 12.3% | 26.4% | 23.2% | 11.5% | 4.1% | |
| 2030 Fund | 21.5% | 11.3% | 24.3% | 22.1% | 14.6% | 6.2% | |
| 2025 Fund | 20.5% | 10.3% | 22.2% | 21.1% | 17.7% | 8.3% | |
| 2020 Fund | 19.4% | 9.3% | 15.1% | 20.0% | 25.9% | 10.3% | |
| 2015 Fund | 15.4% | 8.3% | 8.0% | 15.9% | 33.9% | 18.5% | |
| 2010 Fund | 10.5% | 4.6% | 2.0% | 10.8% | 43.7% | 28.4% | |
| Maturity Fund | 9.5% | 4.6% | 0.0% | 9.8% | 45.7% | 30.4% | |
Of special interest
In the summer of 2007, the Trustees of the Putnam Funds approved a plan to enhance the diversification of the RetirementReady Funds, to increase the Maturity Fund’s emphasis on income generation, and to extend each target fund’s life five years beyond its target year, during which time there will be increased emphasis on income generation.
In terms of the diversification of the RetirementReady Funds, target fund assets are expected to be allocated among 15 Putnam funds in the coming months. In addition to the six funds whose objectives are outlined on page 7, assets will be allocated among Putnam Equity Income Fund, Putnam Investors Fund, Putnam Vista Fund, Putnam Mid Cap Value Fund, Putnam International New Opportunities Fund, Putnam International Growth and Income Fund, Putnam Diversified Income Trust, Putnam High Yield Advantage Fund, and Putnam Income Strategies Fund.
The second change concerns the Maturity Fund, which is anticipated to gradually shift its target allocation from its current static focus primarily on bonds and money market instruments. In the coming months, this target allocation will incrementally place greater emphasis on income generation until 2010, at which point it will resume a static allocation.
Also in the coming months, after each fund reaches its target date, the term “Maturity” will then be added to its name. (For instance, in 2030, Putnam RetirementReady 2030 Fund will be renamed Putnam RetirementReady 2030 Maturity Fund.) The fund’s target percentages will then continue to change during the next five years to increase emphasis on income and to approach those of the Maturity Fund. When the fund’s target percentages correspond to those of the Maturity Fund, the fund will become part of the Maturity Fund.
8
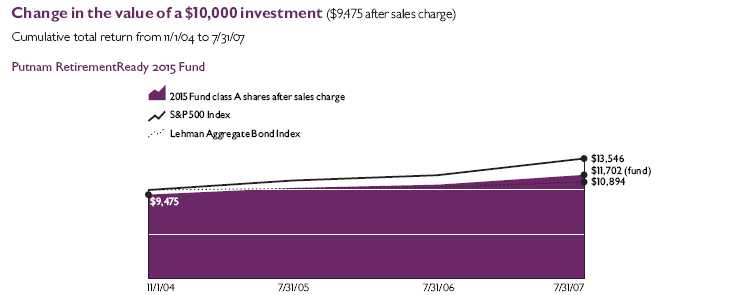
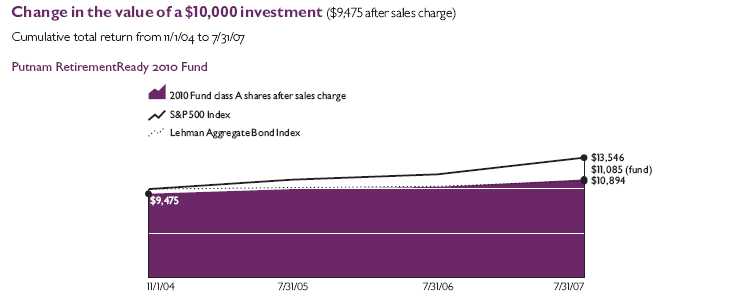
Your fund’s performance
This section shows your fund’s performance for periods ended July 31, 2007, the end of its fiscal year. In accordance with regulatory requirements for mutual funds, we also include performance as of the most recent calendar quarter-end and expense information taken from the fund’s current prospectus. Performance should always be considered in light of a fund’s investment strategy. Data represents past performance. Past performance does not guarantee future results. More recent returns may be less or more than those shown. Investment return and principal value will fluctuate, and you may have a gain or a loss when you sell your shares. For the most recent month-end performance, please visit www.putnam.com or call Putnam at 1-800-225-1581. Class Y shares are generally only available to corporate and institutional clients and clients in other approved programs. See the Terms and Definitions section in this report for definitions of the share classes offered by your fund.
Fund performance Total return for periods ended 7/31/07
| Class A | Class B | Class C | Class M | Class R | Class Y | |||||
| (inception dates) | (11/1/04) | (11/1/04) | (11/1/04) | (11/1/04) | (11/1/04) | (11/1/04) | ||||
| NAV | POP | NAV | CDSC | NAV | CDSC | NAV | POP | NAV | NAV | |
| 2050 Fund* | ||||||||||
| Life of fund | 35.44% | 28.32% | 33.17% | 30.17% | 33.18% | 33.18% | 33.84% | 29.50% | 34.62% | 36.18% |
| Annual average | 14.40 | 11.69 | 13.54 | 12.40 | 13.55 | 13.55 | 13.80 | 12.14 | 14.09 | 14.67 |
| 1 year | 16.35 | 10.24 | 15.50 | 10.50 | 15.49 | 14.49 | 15.74 | 11.98 | 16.08 | 16.65 |
| 2045 Fund† | ||||||||||
| Life of fund | 40.75 | 33.37 | 37.86 | 34.86 | 37.87 | 37.87 | 38.84 | 34.34 | 39.86 | 41.72 |
| Annual average | 13.21 | 11.02 | 12.36 | 11.46 | 12.36 | 12.36 | 12.65 | 11.31 | 12.95 | 13.49 |
| 1 year | 16.36 | 10.27 | 15.49 | 10.49 | 15.48 | 14.48 | 15.79 | 12.04 | 16.09 | 16.66 |
| 2040 Fund† | ||||||||||
| Life of fund | 39.70 | 32.36 | 36.85 | 33.85 | 36.90 | 36.90 | 37.80 | 33.32 | 38.81 | 40.66 |
| Annual average | 12.90 | 10.71 | 12.06 | 11.16 | 12.07 | 12.07 | 12.34 | 11.00 | 12.64 | 13.18 |
| 1 year | 15.77 | 9.69 | 14.91 | 9.91 | 14.92 | 13.92 | 15.19 | 11.46 | 15.49 | 16.06 |
| 2035 Fund | ||||||||||
| Life of fund | 37.57 | 30.35 | 34.79 | 31.79 | 34.85 | 34.85 | 35.71 | 31.30 | 36.49 | 38.54 |
| Annual average | 12.27 | 10.10 | 11.44 | 10.54 | 11.46 | 11.46 | 11.72 | 10.39 | 11.95 | 12.56 |
| 1 year | 15.18 | 9.12 | 14.32 | 9.32 | 14.31 | 13.31 | 14.60 | 10.88 | 14.89 | 15.47 |
| 2030 Fund | ||||||||||
| Life of fund | 35.70 | 28.58 | 32.93 | 29.93 | 32.94 | 32.94 | 33.85 | 29.49 | 34.76 | 36.62 |
| Annual average | 11.72 | 9.55 | 10.88 | 9.97 | 10.89 | 10.89 | 11.16 | 9.83 | 11.43 | 11.99 |
| 1 year | 14.57 | 8.55 | 13.70 | 8.70 | 13.71 | 12.71 | 13.99 | 10.28 | 14.27 | 14.85 |
| 2025 Fund | ||||||||||
| Life of fund | 33.70 | 26.68 | 30.98 | 27.98 | 30.98 | 30.98 | 31.89 | 27.60 | 32.79 | 34.64 |
| Annual average | 11.12 | 8.96 | 10.29 | 9.37 | 10.29 | 10.29 | 10.57 | 9.25 | 10.84 | 11.40 |
| 1 year | 13.91 | 7.94 | 13.06 | 8.06 | 13.07 | 12.07 | 13.34 | 9.67 | 13.64 | 14.20 |
| 2020 Fund | ||||||||||
| Life of fund | 28.91 | 22.14 | 26.28 | 23.28 | 26.27 | 26.27 | 27.16 | 23.02 | 28.12 | 29.78 |
| Annual average | 9.65 | 7.53 | 8.84 | 7.89 | 8.83 | 8.83 | 9.11 | 7.81 | 9.41 | 9.92 |
| 1 year | 12.36 | 6.46 | 11.53 | 6.53 | 11.53 | 10.53 | 11.82 | 8.19 | 12.09 | 12.63 |
| 2015 Fund | ||||||||||
| Life of fund | 23.50 | 17.02 | 21.01 | 18.01 | 21.01 | 21.01 | 21.85 | 17.89 | 22.79 | 24.35 |
| Annual average | 7.96 | 5.87 | 7.17 | 6.19 | 7.17 | 7.17 | 7.44 | 6.16 | 7.74 | 8.23 |
| 1 year | 10.37 | 4.58 | 9.55 | 4.55 | 9.54 | 8.54 | 9.82 | 6.25 | 10.09 | 10.64 |
9
Fund performance Total return for periods ended 7/31/07 (Continued)
| Class A | Class B | Class C | Class M | Class R | Class Y | |||||
| (inception dates) | (11/1/04) | (11/1/04) | (11/1/04) | (11/1/04) | (11/1/04) | (11/1/04) | ||||
| NAV | POP | NAV | CDSC | NAV | CDSC | NAV | POP | NAV | NAV | |
| 2010 Fund | ||||||||||
| Life of fund | 17.01% | 10.85% | 14.63% | 11.63% | 14.63% | 14.63% | 15.43% | 11.69% | 16.27% | 17.81% |
| Annual average | 5.87 | 3.81 | 5.08 | 4.07 | 5.08 | 5.08 | 5.35 | 4.09 | 5.62 | 6.13 |
| 1 year | 8.11 | 2.44 | 7.29 | 2.29 | 7.28 | 6.28 | 7.56 | 4.07 | 7.83 | 8.36 |
| Maturity Fund | ||||||||||
| Life of fund | 13.94 | 7.92 | 11.60 | 8.60 | 11.65 | 11.65 | 12.39 | 8.72 | 13.17 | 14.69 |
| Annual average | 4.85 | 2.80 | 4.06 | 3.04 | 4.08 | 4.08 | 4.33 | 3.08 | 4.59 | 5.10 |
| 1 year | 7.43 | 1.79 | 6.65 | 1.64 | 6.62 | 5.62 | 6.88 | 3.42 | 7.16 | 7.70 |
Current performance may be lower or higher than the quoted past performance, which cannot guarantee future results. After sales charge returns (public offering price, or POP) for class A and M shares reflect a maximum 5.25% and 3.25% load, respectively. Class B share returns reflect the applicable contingent deferred sales charge (CDSC), which is 5% in the first year, declining to 1% in the sixth year, and is eliminated thereafter. Class C shares reflect a 1% CDSC for the first year and is eliminated thereafter. Class R and Y shares have no initial sales charge or CDSC.
For a portion of the period, these funds limited expenses, without which returns would have been lower.
A 1% short-term trading fee may be applied to shares exchanged or sold within 7 days of purchase.
* The inception date of Putnam RetirementReady 2050 Fund is 5/2/05, for all share classes.
† Because no class R shares of the fund were outstanding on 12/20/05 and 12/21/05, class R performance for the period from 12/19/05 to 12/21/05 is based on class A performance, adjusted for the applicable sales charge and the higher operating expenses for class R shares.
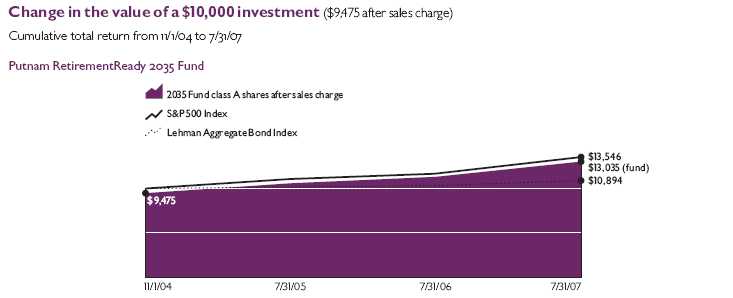
Past performance does not indicate future results. At the end of the same time period, a $10,000 investment in the fund’s class B would have been valued at $13,017 with the contingent deferred sales charges. A $10,000 investment in the fund’s class C shares would have been valued at $13,318 and no contingent deferred sales charges would apply. A $10,000 investment in the fund’s class M shares ($9,675 after sales charge) would have been valued at $12,950 at public offering price. A $10,000 investment in the fund’s class R and Y shares would have been valued at $13,462 and $13,618, respectively. See first page of performance section for performance calculation method.
10
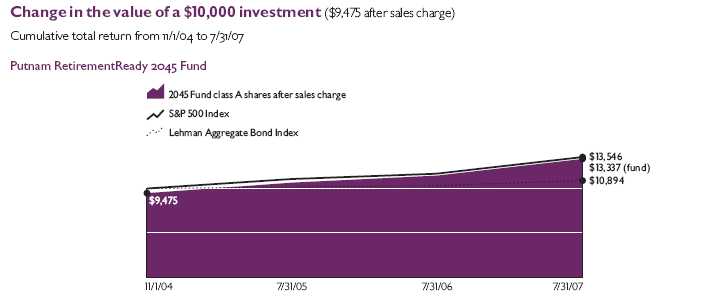
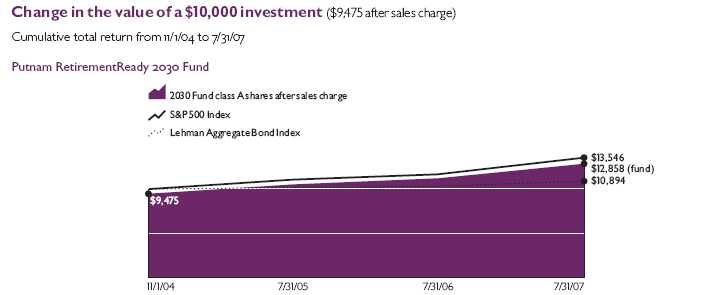
Past performance does not indicate future results. At the end of the same time period, a $10,000 investment in the fund’s class B would have been valued at $13,486 with the contingent deferred sales charges. A $10,000 investment in the fund’s class C shares would have been valued at $13,787 and no contingent deferred sales charges would apply. A $10,000 investment in the fund’s class M shares ($9,675 after sales charge) would have been valued at $13,434 at public offering price. A $10,000 investment in the fund’s class R and Y shares would have been valued at $13,986 and $14,172, respectively. See first page of performance section for performance calculation method.
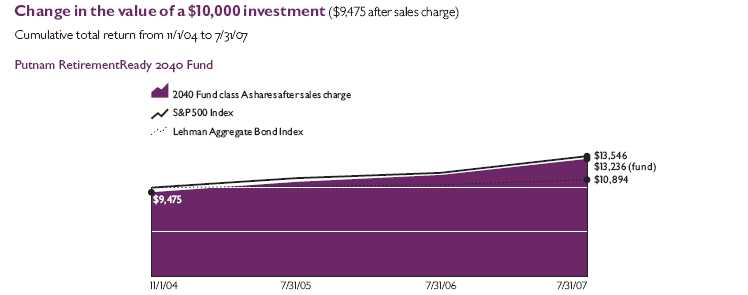
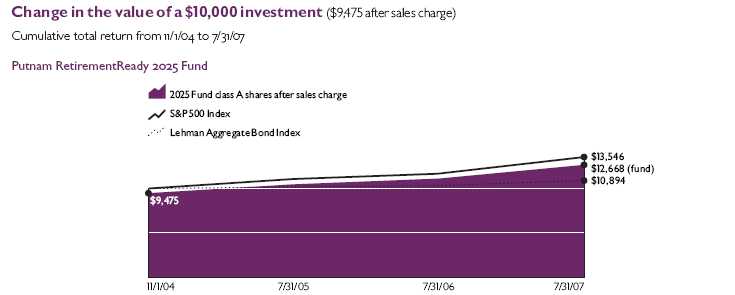
Past performance does not indicate future results. At the end of the same time period, a $10,000 investment in the fund’s class B would have been valued at $13,385 with the contingent deferred sales charges. A $10,000 investment in the fund’s class C shares would have been valued at $13,690 and no contingent deferred sales charges would apply. A $10,000 investment in the fund’s class M shares ($9,675 after sales charge) would have been valued at $13,332 at public offering price. A $10,000 investment in the fund’s class R and Y shares would have been valued at $13,881 and $14,066, respectively. See first page of performance section for performance calculation method.
11
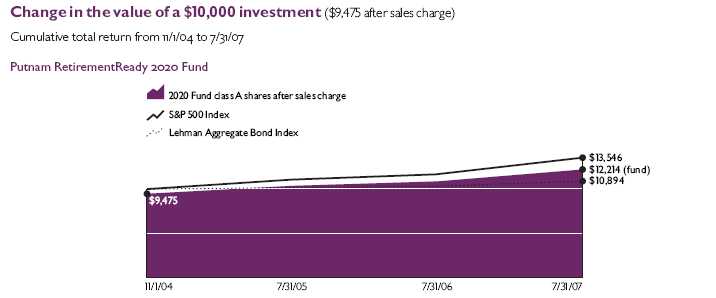
Past performance does not indicate future results. At the end of the same time period, a $10,000 investment in the fund’s class B would have been valued at $13,179 with the contingent deferred sales charges. A $10,000 investment in the fund’s class C shares would have been valued at $13,485 and no contingent deferred sales charges would apply. A $10,000 investment in the fund’s class M shares ($9,675 after sales charge) would have been valued at $13,130 at public offering price. A $10,000 investment in the fund’s class R and Y shares would have been valued at $13,649 and $13,854, respectively. See first page of performance section for performance calculation method.
Past performance does not indicate future results. At the end of the same time period, a $10,000 investment in the fund’s class B would have been valued at $12,993 with the contingent deferred sales charges. A $10,000 investment in the fund’s class C shares would have been valued at $13,294 and no contingent deferred sales charges would apply. A $10,000 investment in the fund’s class M shares ($9,675 after sales charge) would have been valued at $12,949 at public offering price. A $10,000 investment in the fund’s class R and Y shares would have been valued at $13,476 and $13,662, respectively. See first page of performance section for performance calculation method.
12
Past performance does not indicate future results. At the end of the same time period, a $10,000 investment in the fund’s class B would have been valued at $12,798 with the contingent deferred sales charges. A $10,000 investment in the fund’s class C shares would have been valued at $13,098 and no contingent deferred sales charges would apply. A $10,000 investment in the fund’s class M shares ($9,675 after sales charge) would have been valued at $12,760 at public offering price. A $10,000 investment in the fund’s class R and Y shares would have been valued at $13,279 and $13,464, respectively. See first page of performance section for performance calculation method.
Past performance does not indicate future results. At the end of the same time period, a $10,000 investment in the fund’s class B would have been valued at $12,328 with the contingent deferred sales charges. A $10,000 investment in the fund’s class C shares would have been valued at $12,627 and no contingent deferred sales charges would apply. A $10,000 investment in the fund’s class M shares ($9,675 after sales charge) would have been valued at $12,302 at public offering price. A $10,000 investment in the fund’s class R and Y shares would have been valued at $12,812 and $12,978, respectively. See first page of performance section for performance calculation method.
13
Past performance does not indicate future results. At the end of the same time period, a $10,000 investment in the fund’s class B would have been valued at $11,801 with the contingent deferred sales charges. A $10,000 investment in the fund’s class C shares would have been valued at $12,101 and no contingent deferred sales charges would apply. A $10,000 investment in the fund’s class M shares ($9,675 after sales charge) would have been valued at $11,789 at public offering price. A $10,000 investment in the fund’s class R and Y shares would have been valued at $12,279 and $12,435, respectively. See first page of performance section for performance calculation method.
Past performance does not indicate future results. At the end of the same time period, a $10,000 investment in the fund’s class B would have been valued at $11,163 with the contingent deferred sales charges. A $10,000 investment in the fund’s class C shares would have been valued at $11,463 and no contingent deferred sales charges would apply. A $10,000 investment in the fund’s class M shares ($9,675 after sales charge) would have been valued at $11,169 at public offering price. A $10,000 investment in the fund’s class R and Y shares would have been valued at $11,627 and $11,781, respectively. See first page of performance section for performance calculation method.
14
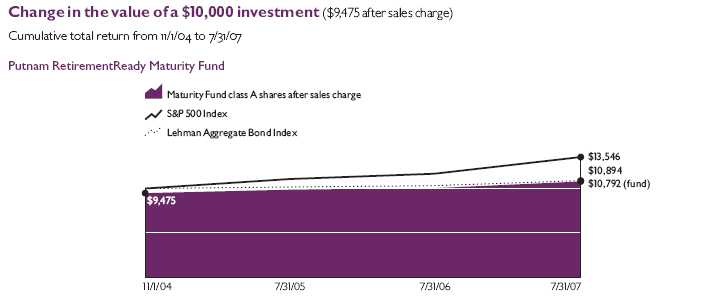
Past performance does not indicate future results. At the end of the same time period, a $10,000 investment in the fund’s class B would have been valued at $10,860 with the contingent deferred sales charges. A $10,000 investment in the fund’s class C shares would have been valued at $11,165 and no contingent deferred sales charges would apply. A $10,000 investment in the fund’s class M shares ($9,675 after sales charge) would have been valued at $10,872 at public offering price. A $10,000 investment in the fund’s class R and Y shares would have been valued at $11,317 and $11,469, respectively. See first page of performance section for performance calculation method.
Comparative index returns For periods ended 7/31/07
| S&P 500 | Lehman Aggregate | |
| Index | Bond Index | |
| Life of fund* | 35.46% | 8.94% |
| Annual average | 11.64 | 3.16 |
| 1 year | 16.13 | 5.58 |
Index results should be compared to fund performance at net asset value.
* Life-of-fund period begins at 11/1/04, the inception date of all the Putnam RetirementReady Funds with the exception of the Putnam RetirementReady 2050 Fund (inception: 5/2/05).
Fund price and distribution information For the 12-month period ended 7/31/07
| 2050 Fund | ||||||||
| Distributions | Class A | Class B | Class C | Class M | Class R | Class Y | ||
| Number | 1 | 1 | 1 | 1 | 1 | 1 | ||
| Income | $0.985 | $0.703 | $0.430 | $0.662 | $0.934 | $1.060 | ||
| Capital gains | ||||||||
| Long-term | 0.180 | 0.180 | 0.180 | 0.180 | 0.180 | 0.180 | ||
| Short-term | 0.837 | 0.837 | 0.837 | 0.837 | 0.837 | 0.837 | ||
| Total | $2.002 | $1.720 | $1.447 | $1.679 | $1.951 | $2.077 | ||
| Share value: | NAV | POP | NAV | NAV | NAV | POP | NAV | NAV |
| 7/31/06 | $56.44 | $59.57 | $56.18 | $56.21 | $56.28 | $58.17 | $56.37 | $56.57 |
| 7/31/07 | 63.60 | 67.12 | 63.12 | 63.43 | 63.41 | 65.54 | 63.42 | 63.84 |
15
Fund price and distribution information For the 12-month period ended 7/31/07 (Continued)
| 2045 Fund | ||||||||
| Distributions | Class A | Class B | Class C | Class M | Class R | Class Y | ||
| Number | 1 | 1 | 1 | 1 | 1 | 1 | ||
| Income | $1.317 | $0.957 | $0.784 | $0.771 | $1.383 | $1.461 | ||
| Capital gains | ||||||||
| Long-term | 2.927 | 2.927 | 2.927 | 2.927 | 2.927 | 2.927 | ||
| Short-term | 0.471 | 0.471 | 0.471 | 0.471 | 0.471 | 0.471 | ||
| Total | $4.715 | $4.355 | $4.182 | $4.169 | $4.781 | $4.859 | ||
| Share value: | NAV | POP | NAV | NAV | NAV | POP | NAV | NAV |
| 7/31/06 | $72.28 | $76.28 | $69.98 | $70.27 | $70.38 | $72.74 | $73.67 | $78.94 |
| 7/31/07 | 79.24 | 83.63 | 76.34 | 76.85 | 77.20 | 79.79 | 80.59 | 87.06 |
| 2040 Fund | ||||||||
| Distributions | Class A | Class B | Class C | Class M | Class R | Class Y | ||
| Number | 1 | 1 | 1 | 1 | 1 | 1 | ||
| Income | $1.387 | $1.104 | $1.059 | $1.158 | $1.339 | $1.536 | ||
| Capital gains | ||||||||
| Long-term | 3.201 | 3.201 | 3.201 | 3.201 | 3.201 | 3.201 | ||
| Short-term | 0.363 | 0.363 | 0.363 | 0.363 | 0.363 | 0.363 | ||
| Total | $4.951 | $4.668 | $4.623 | $4.722 | $4.903 | $5.100 | ||
| Share value: | NAV | POP | NAV | NAV | NAV | POP | NAV | NAV |
| 7/31/06 | $72.11 | $76.11 | $69.82 | $70.00 | $70.03 | $72.38 | $73.56 | $78.47 |
| 7/31/07 | 78.37 | 82.71 | 75.43 | 75.69 | 75.81 | 78.36 | 79.90 | 85.80 |
| 2035 Fund | ||||||||
| Distributions | Class A | Class B | Class C | Class M | Class R | Class Y | ||
| Number | 1 | 1 | 1 | 1 | 1 | 1 | ||
| Income | $1.455 | $1.091 | $1.418 | $1.161 | $1.510 | $1.608 | ||
| Capital gains | ||||||||
| Long-term | 3.896 | 3.896 | 3.896 | 3.896 | 3.896 | 3.896 | ||
| Short-term | 0.003 | 0.003 | 0.003 | 0.003 | 0.003 | 0.003 | ||
| Total | $5.354 | $4.990 | $5.317 | $5.060 | $5.409 | $5.507 | ||
| Share value: | NAV | POP | NAV | NAV | NAV | POP | NAV | NAV |
| 7/31/06 | $70.33 | $74.23 | $67.68 | $68.13 | $68.10 | $70.39 | $69.31 | $76.67 |
| 7/31/07 | 75.48 | 79.66 | 72.25 | 72.42 | 72.84 | 75.29 | 74.06 | 82.84 |
16
Fund price and distribution information For the 12-month period ended 7/31/07 (Continued)
| 2030 Fund | ||||||||
| Distributions | Class A | Class B | Class C | Class M | Class R | Class Y | ||
| Number | 1 | 1 | 1 | 1 | 1 | 1 | ||
| Income | $1.523 | $1.118 | $0.631 | $1.382 | $1.426 | $1.674 | ||
| Capital gains | ||||||||
| Long-term | 3.761 | 3.761 | 3.761 | 3.761 | 3.761 | 3.761 | ||
| Short-term | 0.002 | 0.002 | 0.002 | 0.002 | 0.002 | 0.002 | ||
| Total | $5.286 | $4.881 | $4.394 | $5.145 | $5.189 | $5.437 | ||
| Share value: | NAV | POP | NAV | NAV | NAV | POP | NAV | NAV |
| 7/31/06 | $69.46 | $73.31 | $67.56 | $67.43 | $67.73 | $70.01 | $67.75 | $75.11 |
| 7/31/07 | 74.13 | 78.24 | 71.81 | 72.17 | 71.92 | 74.34 | 72.08 | 80.65 |
| 2025 Fund | ||||||||
| Distributions | Class A | Class B | Class C | Class M | Class R | Class Y | ||
| Number | 1 | 1 | 1 | 1 | 1 | 1 | ||
| Income | $1.641 | $1.281 | $1.211 | $1.297 | $1.657 | $1.810 | ||
| Capital gains | ||||||||
| Long-term | 4.301 | 4.301 | 4.301 | 4.301 | 4.301 | 4.301 | ||
| Short-term | — | — | — | — | — | — | ||
| Total | $5.942 | $5.582 | $5.512 | $5.598 | $5.958 | $6.111 | ||
| Share value: | NAV | POP | NAV | NAV | NAV | POP | NAV | NAV |
| 7/31/06 | $72.98 | $77.02 | $70.26 | $70.43 | $70.55 | $72.92 | $70.70 | $73.28 |
| 7/31/07 | 77.02 | 81.29 | 73.72 | 73.99 | 74.22 | 76.71 | 74.22 | 77.39 |
| 2020 Fund | ||||||||
| Distributions | Class A | Class B | Class C | Class M | Class R | Class Y | ||
| Number | 1 | 1 | 1 | 1 | 1 | 1 | ||
| Income | $1.682 | $1.339 | $1.136 | $1.405 | $1.577 | $1.833 | ||
| Capital gains | ||||||||
| Long-term | 3.374 | 3.374 | 3.374 | 3.374 | 3.374 | 3.374 | ||
| Short-term | 0.001 | 0.001 | 0.001 | 0.001 | 0.001 | 0.001 | ||
| Total | $5.057 | $4.714 | $4.511 | $4.780 | $4.952 | $5.208 | ||
| Share value: | NAV | POP | NAV | NAV | NAV | POP | NAV | NAV |
| 7/31/06 | $66.20 | $69.87 | $64.77 | $64.89 | $64.99 | $67.17 | $65.08 | $70.95 |
| 7/31/07 | 69.20 | 73.03 | 67.43 | 67.77 | 67.79 | 70.07 | 67.88 | 74.57 |
17
Fund price and distribution information For the 12-month period ended 7/31/07 (Continued)
| 2015 Fund | ||||||||
| Distributions | Class A | Class B | Class C | Class M | Class R | Class Y | ||
| Number | 1 | 1 | 1 | 1 | 1 | 1 | ||
| Income | $1.726 | $1.427 | $1.270 | $1.372 | $1.576 | $1.857 | ||
| Capital gains | ||||||||
| Long-term | 2.813 | 2.813 | 2.813 | 2.813 | 2.813 | 2.813 | ||
| Short-term | 0.011 | 0.011 | 0.011 | 0.011 | 0.011 | 0.011 | ||
| Total | $4.550 | $4.251 | $4.094 | $4.196 | $4.400 | $4.681 | ||
| Share value: | NAV | POP | NAV | NAV | NAV | POP | NAV | NAV |
| 7/31/06 | $65.72 | $69.36 | $64.39 | $64.37 | $64.67 | $66.84 | $64.74 | $65.95 |
| 7/31/07 | 67.89 | 71.65 | 66.22 | 66.35 | 66.75 | 68.99 | 66.79 | 68.18 |
| 2010 Fund | ||||||||
| Distributions | Class A | Class B | Class C | Class M | Class R | Class Y | ||
| Number | 1 | 1 | 1 | 1 | 1 | 1 | ||
| Income | $2.083 | $1.793 | $1.671 | $1.814 | $1.921 | $2.227 | ||
| Capital gains | ||||||||
| Long-term | 2.056 | 2.056 | 2.056 | 2.056 | 2.056 | 2.056 | ||
| Short-term | 0.022 | 0.022 | 0.022 | 0.022 | 0.022 | 0.022 | ||
| Total | $4.161 | $3.871 | $3.749 | $3.892 | $3.999 | $4.305 | ||
| Share value: | NAV | POP | NAV | NAV | NAV | POP | NAV | NAV |
| 7/31/06 | $58.69 | $61.94 | $57.57 | $57.30 | $57.46 | $59.39 | $57.56 | $61.41 |
| 7/31/07 | 59.21 | 62.49 | 57.84 | 57.67 | 57.85 | 59.79 | 58.00 | 62.15 |
| Maturity Fund | ||||||||
| Distributions | Class A | Class B | Class C | Class M | Class R | Class Y | ||
| Number | 12 | 12 | 11 | 12 | 12 | 12 | ||
| Income | $2.131 | $1.705 | $1.627 | $1.719 | $1.994 | $2.280 | ||
| Capital gains | ||||||||
| Long-term | 0.798 | 0.798 | 0.798 | 0.798 | 0.798 | 0.798 | ||
| Short-term | 0.023 | 0.023 | 0.023 | 0.023 | 0.023 | 0.023 | ||
| Total | $2.952 | $2.526 | $2.448 | $2.540 | $2.815 | $3.101 | ||
| Share value: | NAV | POP | NAV | NAV | NAV | POP | NAV | NAV |
| 7/31/06 | $55.97 | $59.07 | $56.01 | $56.04 | $55.99 | $57.87 | $55.99 | $56.11 |
| 7/31/07 | 57.13 | 60.30 | 57.17 | 57.27 | 57.27 | 59.19 | 57.15 | 57.27 |
18
Fund performance for most recent calendar quarter Total return for periods ended 6/30/07
| Class A | Class B | Class C | Class M | Class R | Class Y | |||||
| (inception dates) | (11/1/04) | (11/1/04) | (11/1/04) | (11/1/04) | (11/1/04) | (11/1/04) | ||||
| NAV | POP | NAV | CDSC | NAV | CDSC | NAV | POP | NAV | NAV | |
| 2050 Fund* | ||||||||||
| Life of fund | 41.31% | 33.89% | 39.02% | 36.02% | 39.04% | 39.04% | 39.71% | 35.17% | 40.48% | 42.05% |
| Annual average | 17.28 | 14.40 | 16.40 | 15.24 | 16.41 | 16.41 | 16.67 | 14.90 | 16.96 | 17.56 |
| 1 year | 20.29 | 13.97 | 19.38 | 14.38 | 19.38 | 18.38 | 19.67 | 15.77 | 19.98 | 20.59 |
| 2045 Fund† | ||||||||||
| Life of fund | 46.85 | 39.14 | 43.93 | 40.93 | 43.93 | 43.93 | 44.94 | 40.24 | 45.94 | 47.84 |
| Annual average | 15.48 | 13.17 | 14.62 | 13.72 | 14.62 | 14.62 | 14.92 | 13.51 | 15.21 | 15.77 |
| 1 year | 20.29 | 13.98 | 19.39 | 14.39 | 19.39 | 18.39 | 19.73 | 15.82 | 19.99 | 20.61 |
| 2040 Fund† | ||||||||||
| Life of fund | 45.36 | 37.73 | 42.50 | 39.50 | 42.54 | 42.54 | 43.44 | 38.77 | 44.47 | 46.33 |
| Annual average | 15.04 | 12.74 | 14.19 | 13.28 | 14.20 | 14.20 | 14.47 | 13.06 | 14.78 | 15.33 |
| 1 year | 19.45 | 13.18 | 18.57 | 13.57 | 18.59 | 17.59 | 18.86 | 15.01 | 19.16 | 19.77 |
| 2035 Fund | ||||||||||
| Life of fund | 42.78 | 35.29 | 39.98 | 36.98 | 40.04 | 40.04 | 40.89 | 36.31 | 41.69 | 43.74 |
| Annual average | 14.27 | 11.99 | 13.43 | 12.51 | 13.45 | 13.45 | 13.70 | 12.30 | 13.94 | 14.56 |
| 1 year | 18.64 | 12.41 | 17.76 | 12.76 | 17.76 | 16.76 | 18.04 | 14.19 | 18.34 | 18.95 |
| 2030 Fund | ||||||||||
| Life of fund | 40.46 | 33.09 | 37.69 | 34.69 | 37.69 | 37.69 | 38.60 | 34.08 | 39.51 | 41.38 |
| Annual average | 13.57 | 11.30 | 12.73 | 11.80 | 12.73 | 12.73 | 13.01 | 11.61 | 13.28 | 13.85 |
| 1 year | 17.82 | 11.64 | 16.96 | 11.96 | 16.95 | 15.95 | 17.24 | 13.43 | 17.53 | 18.13 |
| 2025 Fund | ||||||||||
| Life of fund | 38.04 | 30.79 | 35.31 | 32.31 | 35.30 | 35.30 | 36.23 | 31.79 | 37.12 | 38.97 |
| Annual average | 12.84 | 10.58 | 12.00 | 11.06 | 11.99 | 11.99 | 12.28 | 10.89 | 12.55 | 13.12 |
| 1 year | 16.97 | 10.83 | 16.10 | 11.10 | 16.09 | 15.09 | 16.38 | 12.60 | 16.67 | 17.26 |
| 2020 Fund | ||||||||||
| Life of fund | 32.54 | 25.58 | 29.91 | 26.91 | 29.90 | 29.90 | 30.78 | 26.52 | 31.75 | 33.42 |
| Annual average | 11.13 | 8.91 | 10.30 | 9.34 | 10.30 | 10.30 | 10.58 | 9.21 | 10.88 | 11.41 |
| 1 year | 15.01 | 8.97 | 14.16 | 9.15 | 14.16 | 13.16 | 14.45 | 10.73 | 14.71 | 15.30 |
| 2015 Fund | ||||||||||
| Life of fund | 26.10 | 19.48 | 23.62 | 20.62 | 23.62 | 23.62 | 24.46 | 20.41 | 25.40 | 26.94 |
| Annual average | 9.08 | 6.89 | 8.27 | 7.28 | 8.27 | 8.27 | 8.54 | 7.21 | 8.85 | 9.35 |
| 1 year | 12.35 | 6.46 | 11.51 | 6.51 | 11.49 | 10.49 | 11.77 | 8.15 | 12.06 | 12.61 |
| 2010 Fund | ||||||||||
| Life of fund | 18.19 | 11.98 | 15.86 | 12.86 | 15.88 | 15.88 | 16.65 | 12.87 | 17.48 | 18.98 |
| Annual average | 6.46 | 4.33 | 5.67 | 4.64 | 5.68 | 5.68 | 5.94 | 4.64 | 6.22 | 6.73 |
| 1 year | 9.28 | 3.54 | 8.46 | 3.46 | 8.47 | 7.47 | 8.73 | 5.20 | 9.00 | 9.57 |
| Maturity Fund | ||||||||||
| Life of fund | 14.92 | 8.85 | 12.62 | 9.62 | 12.68 | 12.68 | 13.39 | 9.70 | 14.15 | 15.66 |
| Annual average | 5.35 | 3.23 | 4.55 | 3.50 | 4.57 | 4.57 | 4.82 | 3.53 | 5.08 | 5.60 |
| 1 year | 8.59 | 2.89 | 7.77 | 2.77 | 7.76 | 6.76 | 8.03 | 4.53 | 8.28 | 8.85 |
* The inception date of Putnam RetirementReady 2050 Fund is 5/2/05, for all share classes.
† Because no class R shares of the fund were outstanding on 12/20/05 and 12/21/05, class R performance for the period from 12/19/05 to 12/21/05 is based on class A performance,
adjusted for the applicable sales charge and the higher operating expenses for class R shares.
19
Total annual operating expenses For the fiscal year ended 7/31/06
| Class A | Class B | Class C | Class M | Class R | Class Y | ||
| 2050 Fund (total expenses)* | 1.31% | 2.06% | 2.06% | 1.81% | 1.56% | 1.06% | |
| 2050 Fund (net expenses) | 1.21 | 1.96 | 1.96 | 1.71 | 1.46 | 0.96 | |
| 2045 Fund | 1.20 | 1.95 | 1.95 | 1.70 | 1.45 | 0.95 | |
| 2040 Fund | 1.19 | 1.94 | 1.94 | 1.69 | 1.44 | 0.94 | |
| 2035 Fund | 1.18 | 1.93 | 1.93 | 1.68 | 1.43 | 0.93 | |
| 2030 Fund | 1.16 | 1.91 | 1.91 | 1.66 | 1.41 | 0.91 | |
| 2025 Fund | 1.14 | 1.89 | 1.89 | 1.64 | 1.39 | 0.89 | |
| 2020 Fund | 1.12 | 1.87 | 1.87 | 1.62 | 1.37 | 0.87 | |
| 2015 Fund | 1.08 | 1.83 | 1.83 | 1.58 | 1.33 | 0.83 | |
| 2010 Fund | 1.03 | 1.78 | 1.78 | 1.53 | 1.28 | 0.78 | |
| Maturity Fund | 1.02 | 1.77 | 1.77 | 1.52 | 1.27 | 0.77 | |
Expense information in this table is taken from the most recent prospectus, which includes expenses from the underlying funds, is subject to change, and may differ from that
shown in the next section and in the financial highlights of this report. Expenses are shown as a percentage of average net assets.
* RetirementReady 2050 Fund reflects Putnam Management’s decision to contractually limit expenses through 7/31/08.
20
Your fund’s expenses
As a mutual fund investor, you pay ongoing expenses, such as management fees, distribution fees (12b-1 fees), and other expenses. Using the information below, you can estimate how these expenses affect your investment and compare them with the expenses of other funds. You may also pay one-time transaction expenses, including sales charges (loads) and redemption fees, which are not shown in this section and would have resulted in higher total expenses. Expense information also does not include the fees and expenses of the underlying Putnam mutual funds in which the RetirementReady Funds invest. For more information, see your fund’s prospectus or talk to your financial representative.
Review your fund’s expenses
The first table in this section shows the expenses you would have paid on a $1,000 investment in each of the RetirementReady Funds from February 1, 2007, to July 31, 2007. It also shows how much a $1,000 investment would be worth at the close of the period, assuming actual returns and expenses. You may use the information in this table to estimate the expenses that you paid over the period. Simply divide your account value by $1,000, and then multiply the result by the number in the first line (“Expenses paid per $1,000) for the class of shares you own.
| Class A | Class B | Class C | Class M | Class R | Class Y | ||||||||
| 2050 Fund | |||||||||||||
| Expenses paid per $1,000*† | $1.74 | $ 5.47 | $ 5.47 | $ 4.23 | $ 2.99 | $ 0.50 | |||||||
| Ending value (after expenses) | $1,010.70 | $1,006.90 | $1,006.80 | $1,008.00 | $1,009.40 | $1,011.90 | |||||||
| 2045 Fund | |||||||||||||
| Expenses paid per $1,000* | $ 1.70 | $ 5.42 | $ 5.42 | $ 4.18 | $ 2.94 | $ 0.45 | |||||||
| Ending value (after expenses) | $1,010.70 | $1,006.90 | $1,007.00 | $1,008.20 | $1,009.60 | $1,011.90 | |||||||
| 2040 Fund | |||||||||||||
| Expenses paid per $1,000*† | $ 1.70 | $ 5.42 | $ 5.42 | $ 4.18 | $ 2.94 | $ 0.45 | |||||||
| Ending value (after expenses) | $1,011.00 | $1,007.20 | $1,007.30 | $1,008.50 | $1,009.70 | $1,012.30 | |||||||
| 2035 Fund | |||||||||||||
| Expenses paid per $1,000* | $ 1.70 | $ 5.43 | $ 5.43 | $ 4.18 | $ 2.94 | $ 0.45 | |||||||
| Ending value (after expenses) | $1,011.30 | $1,007.70 | $1,007.50 | $1,008.80 | $1,010.10 | $1,012.70 | |||||||
| 2030 Fund | |||||||||||||
| Expenses paid per $1,000* | $ 1.65 | $ 5.38 | $ 5.38 | $ 4.13 | $ 2.89 | $ 0.40 | |||||||
| Ending value (after expenses) | $1,011.70 | $1,007.90 | $1,007.90 | $1,009.10 | $1,010.50 | $1,013.00 | |||||||
| 2025 Fund | |||||||||||||
| Expenses paid per $1,000* | $ 1.65 | $ 5.38 | $ 5.38 | $ 4.14 | $ 2.89 | $ 0.40 | |||||||
| Ending value (after expenses) | $1,012.00 | $1,008.20 | $1,008.30 | $1,009.50 | $1,010.70 | $1,013.30 | |||||||
| 2020 Fund | |||||||||||||
| Expenses paid per $1,000* | $ 1.64 | $ 5.37 | $ 5.37 | $ 4.13 | $ 2.89 | $ 0.40 | |||||||
| Ending value (after expenses) | $1,009.60 | $1,006.10 | $1,005.90 | $1,007.30 | $1,008.50 | $1,011.00 | |||||||
| 2015 Fund | |||||||||||||
| Expenses paid per $1,000* | $ 1.64 | $ 5.37 | $ 5.37 | $ 4.13 | $ 2.89 | $ 0.40 | |||||||
| Ending value (after expenses) | $1,009.70 | $1,006.00 | $1,005.90 | $1,007.10 | $1,008.50 | $1,010.80 | |||||||
| 2010 Fund | |||||||||||||
| Expenses paid per $1,000* | $ 1.65 | $ 5.38 | $ 5.38 | $ 4.14 | $ 2.89 | $ 0.40 | |||||||
| Ending value (after expenses) | $1,012.30 | $1,008.60 | $1,008.40 | $1,009.80 | $1,011.00 | $1,013.40 | |||||||
| Maturity Fund | |||||||||||||
| Expenses paid per $1,000* | $ 1.65 | $ 5.38 | $ 5.38 | $ 4.14 | $ 2.89 | $ 0.40 | |||||||
| Ending value (after expenses) | $1,012.10 | $1,008.30 | $1,008.00 | $1,009.40 | $1,010.80 | $1,013.10 | |||||||
* Expenses for each share class are calculated using each fund’s annualized expense ratio for each class, which represents the ongoing expenses as a percentage of average net assets for the six months ended 7/31/07. The expense ratio may differ for each share class (see the next table in this section). Expenses are calculated by multiplying the expense ratio by the average account value for the period; then multiplying the result by the number of days in the period; and then dividing that result by the number of days in the year.
† In the most recent six-month period, these funds limited these expenses; had it not done so, expenses would have been higher.
21
Compare expenses using the SEC’s method and industry averages
The Securities and Exchange Commission (SEC) has established guidelines to help investors assess fund expenses. Per these guidelines, the table below shows your fund’s expenses based on a $1,000 investment, assuming a hypothetical 5% annualized return. You can use this information to compare the ongoing expenses (but not transaction expenses or total costs) of investing in the fund with those of other funds. All mutual fund shareholder reports will provide this information to help you make this comparison. Please note that you cannot use this information to estimate your actual ending account balance and expenses paid during the period.
You can also compare your fund’s expenses with the average of its peer group, as defined by Lipper, an independent fund-rating agency that ranks funds relative to others that Lipper considers to have similar investment styles or objectives. We include this information in the table to provide an additional method for comparing your fund’s expenses with the expenses of other funds.
| Class A | Class B | Class C | Class M | Class R | Class Y | |
| 2050 Fund | ||||||
| Expenses paid per $1,000*† | $ 1.76 | $ 5.51 | $ 5.51 | $ 4.26 | $ 3.01 | $ 0.50 |
| Ending value (after expenses) | $1,023.06 | $1,019.34 | $1,019.34 | $1,020.58 | $1,021.82 | $1,024.30 |
| Annualized expense ratio** | 0.35% | 1.10% | 1.10% | 0.85% | 0.60% | 0.10% |
| Lipper peer group Avg. expense ratio*** | 0.45% | 1.20% | 1.20% | 0.95% | 0.70% | 0.20% |
| 2045 Fund | ||||||
| Expenses paid per $1,000* | $ 1.71 | $ 5.46 | $ 5.46 | $ 4.21 | $ 2.96 | $ 0.45 |
| Ending value (after expenses) | $1,023.11 | $1,019.39 | $1,019.39 | $1,020.63 | $1,021.87 | $1,024.35 |
| Annualized expense ratio** | 0.34% | 1.09% | 1.09% | 0.84% | 0.59% | 0.09% |
| Lipper peer group Avg. expense ratio*** | 0.45% | 1.20% | 1.20% | 0.95% | 0.70% | 0.20% |
| 2040 Fund | ||||||
| Expenses paid per $1,000*† | $ 1.71 | $ 5.46 | $ 5.46 | $ 4.21 | $ 2.96 | $ 0.45 |
| Ending value (after expenses) | $1,023.11 | $1,019.39 | $1,019.39 | $1,020.63 | $1,021.87 | $1,024.35 |
| Annualized expense ratio** | 0.34% | 1.09% | 1.09% | 0.84% | 0.59% | 0.09% |
| Lipper peer group Avg. expense ratio*** | 0.45% | 1.20% | 1.20% | 0.95% | 0.70% | 0.20% |
| 2035 Fund | ||||||
| Expenses paid per $1,000* | $ 1.71 | $ 5.46 | $ 5.46 | $ 4.21 | $ 2.96 | $ 0.45 |
| Ending value (after expenses) | $1,023.11 | $1,019.39 | $1,019.39 | $1,020.63 | $1,021.87 | $1,024.35 |
| Annualized expense ratio** | 0.34% | 1.09% | 1.09% | 0.84% | 0.59% | 0.09% |
| Lipper peer group Avg. expense ratio*** | 0.45% | 1.20% | 1.20% | 0.95% | 0.70% | 0.20% |
| 2030 Fund | ||||||
| Expenses paid per $1,000* | $ 1.66 | $ 5.41 | $ 5.41 | $ 4.16 | $ 2.91 | $ 0.40 |
| Ending value (after expenses) | $1,023.16 | $1,019.44 | $1,019.44 | $1,020.68 | $1,021.92 | $1,024.40 |
| Annualized expense ratio** | 0.33% | 1.08% | 1.08% | 0.83% | 0.58% | 0.08% |
| Lipper peer group Avg. expense ratio*** | 0.47% | 1.22% | 1.22% | 0.97% | 0.72% | 0.22% |
| 2025 Fund | ||||||
| Expenses paid per $1,000* | $ 1.66 | $ 5.41 | $ 5.41 | $ 4.16 | $ 2.91 | $ 0.40 |
| Ending value (after expenses) | $1,023.16 | $1,019.44 | $1,019.44 | $1,020.68 | $1,021.92 | $1,024.40 |
| Annualized expense ratio** | 0.33% | 1.08% | 1.08% | 0.83% | 0.58% | 0.08% |
| Lipper peer group Avg. expense ratio*** | 0.47% | 1.22% | 1.22% | 0.97% | 0.72% | 0.22% |
| 2020 Fund | ||||||
| Expenses paid per $1,000* | $ 1.66 | $ 5.41 | $ 5.41 | $ 4.16 | $ 2.91 | $ 0.40 |
| Ending value (after expenses) | $1,023.16 | $1,019.44 | $1,019.44 | $1,020.68 | $1,021.92 | $1,024.40 |
| Annualized expense ratio** | 0.33% | 1.08% | 1.08% | 0.83% | 0.58% | 0.08% |
| Lipper peer group Avg. expense ratio*** | 0.45% | 1.20% | 1.20% | 0.95% | 0.70% | 0.20% |
22
Compare expenses using the SEC’s method and industry averages (Continued)
| Class A | Class B | Class C | Class M | Class R | Class Y | |
| 2015 Fund | ||||||
| Expenses paid per $1,000* | $ 1.66 | $ 5.41 | $ 5.41 | $ 4.16 | $ 2.91 | $ 0.40 |
| Ending value (after expenses) | $1,023.16 | $1,019.44 | $1,019.44 | $1,020.68 | $1,021.92 | $1,024.40 |
| Annualized expense ratio** | 0.33% | 1.08% | 1.08% | 0.83% | 0.58% | 0.08% |
| Lipper peer group Avg. expense ratio*** | 0.45% | 1.20% | 1.20% | 0.95% | 0.70% | 0.20% |
| 2010 Fund | ||||||
| Expenses paid per $1,000* | $ 1.66 | $ 5.41 | $ 5.41 | $ 4.16 | $ 2.91 | $ 0.40 |
| Ending value (after expenses) | $1,023.16 | $1,019.44 | $1,019.44 | $1,020.68 | $1,021.92 | $1,024.40 |
| Annualized expense ratio** | 0.33% | 1.08% | 1.08% | 0.83% | 0.58% | 0.08% |
| Lipper peer group Avg. expense ratio*** | 0.49% | 1.24% | 1.24% | 0.99% | 0.74% | 0.24% |
| Maturity Fund | ||||||
| Expenses paid per $1,000* | $ 1.66 | $ 5.41 | $ 5.41 | $ 4.16 | $ 2.91 | $ 0.40 |
| Ending value (after expenses) | $1,023.16 | $1,019.44 | $1,019.44 | $1,020.68 | $1,021.92 | $1,024.40 |
| Annualized expense ratio** | 0.33% | 1.08% | 1.08% | 0.83% | 0.58% | 0.08% |
| Lipper peer group Avg. expense ratio*** | 0.51% | 1.26% | 1.26% | 1.01% | 0.76% | 0.26% |
* Expenses for each share class are calculated using each fund’s annualized expense ratio for each class, which represents the ongoing expenses as a percentage of average net assets for the six months ended 7/31/07. The expense ratio may differ for each share class. Expenses are calculated by multiplying the expense ratio by the average account value for the period; then multiplying the result by the number of days in the period; and the dividing that result by the number of days in the year.
** For each fund’s most recent fiscal half year: may differ from expense ratios based on one-year data in the financial highlights.
*** The Lipper category for each fund is specified in the table below. The peer group may include funds that are significantly larger than the fund, which may limit the comparability of the fund’s expenses to the simple average, which is typically higher than the asset-weighted average.
† In the most recent six-month period, these funds limited these expenses; had it not done so, expenses would have been higher.
| Putnam RetirementReady Fund | Lipper category |
| RetirementReady 2050 Fund | Mixed-Asset Target 2030+ |
| RetirementReady 2045 Fund | Mixed-Asset Target 2030+ |
| RetirementReady 2040 Fund | Mixed-Asset Target 2030+ |
| RetirementReady 2035 Fund | Mixed-Asset Target 2030+ |
| RetirementReady 2030 Fund | Mixed-Asset Target 2030 |
| RetirementReady 2025 Fund | Mixed-Asset Target 2030 |
| RetirementReady 2020 Fund | Mixed-Asset Target 2020 |
| RetirementReady 2015 Fund | Mixed-Asset Target 2020 |
| RetirementReady 2010 Fund | Mixed-Asset Target 2010 |
| RetirementReady Maturity Fund | Mixed-Asset Target Allocation Conservative |
23
Your fund’s management
Your fund is managed by the members of the Global Asset Allocation Team. Jeffrey Knight is the Portfolio Leader, and Robert Kea and Robert Schoen are Portfolio Members. The Portfolio Leader and Portfolio Members coordinate the team’s management of the fund.
For a complete listing of the members of the Global Asset Allocation Team, including those who are not Portfolio Leaders or Portfolio Members of your fund, visit Putnam’s Individual Investor Web site at www.putnam.com.
Investment team fund ownership
The funds’ Portfolio Leader and Portfolio Members each invest in one or more of the six mutual funds that underlie the Putnam RetirementReady Funds as of July 31, 2007. The table below shows how much the funds’ current Portfolio Leader and Portfolio Members have invested in all Putnam mutual funds (in dollar ranges). Information shown is as of July 31, 2007, and July 31, 2006.
| $1 – | $10,001 – | $50,001 – | $100,001 – | $500,001 – | $1,000,001 | ||||
| Year | $0 | $10,000 | $50,000 | $100,000 | $500,000 | $1,000,000 | and over | ||
| Jeffrey Knight | 2007 | • | |||||||
| Portfolio Leader | 2006 | • | |||||||
| Robert Kea | 2007 | • | |||||||
| Portfolio Member | 2006 | • | |||||||
| Robert Schoen | 2007 | • | |||||||
| Portfolio Member | 2006 | • | |||||||
Trustee and Putnam employee fund ownership
As of July 31, 2007, 11 of the 13 Trustees of the Putnam funds owned shares of at least one of the Putnam RetirementReady Funds, and 12 of the Trustees owned shares of all six Putnam mutual funds that underlie the Putnam RetirementReady Funds. The table below shows the approximate value of investments in the Putnam RetirementReady Funds and all Putnam funds as of that date by the Trustees and Putnam employees. These amounts include investments by the Trustees’ and employees’ immediate family members and investments through retirement and deferred compensation plans.
| Total assets in | ||
| Assets in the fund | all Putnam funds | |
| Trustees | $ 208,000 | $ 92,000,000 |
| Putnam employees | $6,515,000 | $446,000,000 |
Other Putnam funds managed by the Portfolio Leader and Portfolio Members
Jeffrey Knight is also a Portfolio Leader of the Putnam Asset Allocation Funds: Growth, Balanced, and Conservative Portfolios, a Portfolio Leader of Putnam Income Strategies Fund, and a Portfolio Member of The George Putnam Fund of Boston.
Robert Kea and Robert Schoen are also Portfolio Members of the Putnam Asset Allocation Funds: Growth, Balanced, and Conservative Portfolios, as well as Putnam Income Strategies Fund.
Jeffrey Knight, Robert Kea, and Robert Schoen may also manage other accounts and variable trust funds advised by Putnam Management or an affiliate.
24
Terms and definitions
Important terms
Total return shows how the value of the fund’s shares changed over time, assuming you held the shares through the entire period and reinvested all distributions in the fund.
Net asset value (NAV) is the price, or value, of one share of a mutual fund, without a sales charge. NAVs fluctuate with market conditions. NAV is calculated by dividing the net assets of each class of shares by the number of outstanding shares in the class.
Public offering price (POP) is the price of a mutual fund share plus the maximum sales charge levied at the time of purchase. POP performance figures shown here assume the 5.25% maximum sales charge for class A shares and 3.25% for class M shares.
Contingent deferred sales charge (CDSC) is generally a charge applied at the time of the redemption of class B or C shares and assumes redemption at the end of the period. Your fund’s class B CDSC declines from a 5% maximum during the first year to 1% during the sixth year. After the sixth year, the CDSC no longer applies. The CDSC for class C shares is 1% for one year after purchase.
Share classes
Class A shares are generally subject to an initial sales charge and no CDSC (except on certain redemptions of shares bought without an initial sales charge).
Class B shares are not subject to an initial sales charge. They may be subject to a CDSC.
Class C shares are not subject to an initial sales charge and are subject to a CDSC only if the shares are redeemed during the first year.
Class M shares have a lower initial sales charge and a higher 12b-1 fee than class A shares and no CDSC (except on certain redemptions of shares bought without an initial sales charge).
Class R shares are not subject to an initial sales charge or CDSC and are available only to certain defined contribution plans.
Class Y shares are not subject to an initial sales charge or CDSC, and carry no 12b-1 fee. They are only available to eligible purchasers, including eligible defined contribution plans or corporate IRAs.
Comparative indexes
Lehman Aggregate Bond Index is an unmanaged index of U.S. investment-grade fixed-income securities.
Merrill Lynch 91-Day Treasury Bill Index is an unmanaged index that seeks to measure the performance of U.S. Treasury bills available in the marketplace.
Morgan Stanley Capital International (MSCI) EAFE Index is an unmanaged index of equity securities from developed countries in Western Europe, the Far East, and Australasia.
S&P 500 Index is an unmanaged index of common stock performance.
Indexes assume reinvestment of all distributions and do not account for fees. Securities and performance of a fund and an index will differ. You cannot invest directly in an index.
25
Trustee approval
of management contract
General conclusions
The Board of Trustees of the Putnam funds oversees the management of each fund and, as required by law, determines annually whether to approve the continuance of your fund’s management contract with Putnam Investment Management (“Putnam Management”). In this regard, the Board of Trustees, with the assistance of its Contract Committee consisting solely of Trustees who are not “interested persons” (as such term is defined in the Investment Company Act of 1940, as amended) of the Putnam funds (the “Independent Trustees”), requests and evaluates all information it deems reasonably necessary under the circumstances. Over the course of several months ending in June 2007, the Contract Committee met several times to consider the information provided by Putnam Management and other information developed with the assistance of the Board’s independent counsel and independent staff. The Contract Committee revie wed and discussed key aspects of this information with all of the Independent Trustees. The Contract Committee recommended, and the Independent Trustees approved, the continuance of your fund’s management contract, effective July 1, 2007.
In addition, in anticipation of the sale of Putnam Investments to Great-West Lifeco, at a series of meetings ending in March 2007, the Trustees reviewed and approved new management and distribution arrangements to take effect upon the change of control. Shareholders of all funds approved the management contracts in May 2007, and the change of control transaction was completed on August 3, 2007. Upon the change of control, the management contracts that were approved by the Trustees in June 2007 automatically terminated and were replaced by new contracts that had been approved by shareholders. In connection with their review for the June 2007 continuance of the Putnam funds’ management contracts, the Trustees did not identify any facts or circumstances that would alter the substance of the conclusions and recommendations they made in their review of the contracts to take effect upon the change of control.
The Independent Trustees’ approval was based on the following conclusions:
• That the fee schedule in effect for your fund represented reasonable compensation in light of the nature and quality of the services being provided to the fund, the fees paid by competitive funds and the costs incurred by Putnam Management in providing such services, and
• That this fee schedule represented an appropriate sharing between fund shareholders and Putnam Management of such economies of scale as may exist in the management of the fund at current asset levels.
These conclusions were based on a comprehensive consideration of all information provided to the Trustees and were not the result of any single factor. Some of the factors that figured particularly in the Trustees’ deliberations and how the Trustees considered these factors are described below, although individual Trustees may have evaluated the information presented differently, giving different weights to various factors. It is also important to recognize that the fee arrangements for your fund and the other Putnam funds are the result of many years of review and discussion between the Independent Trustees and Putnam Management, that certain aspects of such arrangements may receive greater scrutiny in some years than others, and that the Trustees’ conclusions may be based, in part, on their consideration of these same arrangements in prior years.
Management fee schedules and categories; total expenses
The Trustees reviewed the management fee schedules in effect for all Putnam funds, including fee levels and breakpoints, and the assignment of funds to particular fee categories. In reviewing fees and expenses, the Trustees generally focused their attention on material changes in circumstances — for example, changes in a fund’s size or investment style, changes in Putnam Management’s operating costs or responsibilities, or changes in competitive practices in the mutual fund industry — that suggest that consideration of fee changes might be warranted. The Trustees concluded that the circumstances did not warrant changes to the management fee structure of your fund, which had been carefully developed over the years, re-examined on many occasions and adjusted where appropriate. The Trustees focused on two areas of particular interest, as discussed further b elow:
• Competitiveness. The Trustees reviewed comparative fee and expense information for competitive funds, which indicated that, in a custom peer group of competitive funds selected by Lipper Inc., each Putnam RetirementReady Fund ranked in the following percentiles in management fees and total expenses (less any applicable 12b-1 fees) as of December 31, 2006 (the first percentile being the least expensive funds and the 100th percentile being the most expensive funds).
26
| Actual Management | Total Expenses | |||
| Fee (percentile) | (percentile) | |||
| Putnam RetirementReady Maturity Fund | 1st | 17th | ||
| Putnam RetirementReady 2010 Fund | 99th | 57th | ||
| Putnam RetirementReady 2015 Fund | 99th | 57th | ||
| Putnam RetirementReady 2020 Fund | 99th | 57th | ||
| Putnam RetirementReady 2025 Fund | 99th | 71st | ||
| Putnam RetirementReady 2030 Fund | 99th | 71st | ||
| Putnam RetirementReady 2035 Fund | 99th | 67th | ||
| Putnam RetirementReady 2040 Fund | 1st | 67th | ||
| Putnam RetirementReady 2045 Fund | 1st | 67th | ||
| Putnam RetirementReady 2050 Fund | 1st | 67th | ||
(The comparative fee and expense information for each Putnam RetirementReady Fund excludes the fees and expenses of the underlying Putnam funds in which a Putnam RetirementReady Fund invests, as well as the fees and expenses of the underlying funds in which other funds in the Lipper peer group invest. In addition, because each Putnam RetirementReady Fund’s custom peer group is smaller than the fund’s broad Lipper Inc. peer group, this expense information may differ from the Lipper peer expense information found elsewhere in this report.) The Trustees noted that expense ratios for a number of Putnam funds, which show the percentage of fund assets used to pay for management and administrative services, distribution (12b-1) fees and other expenses, had been increasing recently as a result of declining net assets and the natural operation of fee breakpoints.
The Trustees noted that the expense ratio increases described above were currently being controlled by expense limitations implemented in January 2004 and which Putnam Management had committed to maintain at least through 2007. In anticipation of the change of control of Putnam Investments, the Trustees requested, and received a commitment from Putnam Management and Great-West Lifeco, to extend this program through at least June 30, 2009. These expense limitations give effect to a commitment by Putnam Management that the expense ratio of each open-end fund would be no higher than the average expense ratio of the competitive funds included in the fund’s relevant Lipper universe (exclusive of any applicable 12b-1 charges in each case). The Trustees observed that this commitment to limit fund expenses has served shareholders well since its inception.
In order to ensure that the expenses of the Putnam funds continue to meet evolving competitive standards, the Trustees requested, and Putnam Management agreed, to extend for the twelve months beginning July 1, 2007, an additional expense limitation for certain funds at an amount equal to the average expense ratio (exclusive of 12b-1 charges) of a custom peer group of competitive funds selected by Lipper to correspond to the size of the fund. This additional expense limitation will be applied to those open-end funds that had above-average expense ratios (exclusive of 12b-1 charges) based on the custom peer group data for the period ended December 31, 2006. This additional expense limitation will not be applied to the Putnam RetirementReady Funds because each had a below-average expense ratio relative to its custom peer group.
• Economies of scale. The Trustees considered that most Putnam funds currently have the benefit of breakpoints in their management fees that provide shareholders with significant economies of scale, which means that the effective management fee rate of a fund (as a percentage of fund assets) declines as a fund grows in size and crosses specified asset thresholds. Conversely, as a fund shrinks in size — as has been the case for many Putnam funds in recent years — these breakpoints result in increasing fee levels. In recent years, the Trustees have examined the operation of the existing breakpoint structure during periods of both growth and decline in asset levels. The Trustees concluded that the fee schedules in effect for th e funds represented an appropriate sharing of economies of scale at current asset levels. In reaching this conclusion, the Trustees considered the Contract Committee’s stated intent to continue to work with Putnam Management to plan for an eventual resumption in the growth of assets, and to consider the potential economies that might be produced under various growth assumptions.
In connection with their review of the management fees and total expenses of the Putnam funds, the Trustees also reviewed the costs of the services to be provided and profits to be realized by Putnam Management and its affiliates from the relationship with the funds. This information included trends in revenues, expenses
27
and profitability of Putnam Management and its affiliates relating to the investment management and distribution services provided to the funds. In this regard, the Trustees also reviewed an analysis of Putnam Management’s revenues, expenses and profitability with respect to the funds’ management contracts, allocated on a fund-by-fund basis.
Investment performance
The quality of the investment process provided by Putnam Management represented a major factor in the Trustees’ evaluation of the quality of services provided by Putnam Management under your fund’s management contract. The Trustees were assisted in their review of the Putnam funds’ investment process and performance by the work of the Investment Process Committee of the Trustees and the Investment Oversight Committees of the Trustees, which had met on a regular monthly basis with the funds’ portfolio teams throughout the year. The Trustees concluded that Putnam Management generally provides a high-quality investment process — as measured by the experience and skills of the individuals assigned to the management of fund portfolios, the resources made available to such personnel, and in general the ability of Putnam Management to attract and retain high-quality personnel — but also recognized that this does no t guarantee favorable investment results for every fund in every time period. The Trustees considered the investment performance of each fund over multiple time periods and considered information comparing each fund’s performance with various benchmarks and with the performance of competitive funds.
The Trustees noted the satisfactory investment performance of many Putnam funds. They also noted the disappointing investment performance of certain funds in recent years and discussed with senior management of Putnam Management the factors contributing to such underperformance and actions being taken to improve performance. The Trustees recognized that, in recent years, Putnam Management has made significant changes in its investment personnel and processes and in the fund product line to address areas of underperformance. In particular, they noted the important contributions of Putnam Management’s leadership in attracting, retaining and supporting high-quality investment professionals and in systematically implementing an investment process that seeks to merge the best features of fundamental and quantitative analysis. The Trustees indicated their intention to contin ue to monitor performance trends to assess the effectiveness of these changes and to evaluate whether additional changes to address areas of underperformance are warranted.
In the case of the Putnam RetirementReady Funds, the Trustees considered the Lipper peer group percentile rankings for each fund’s class A share cumulative total return performance results at net asset value for the one-year period ended December 31, 2006. This information is shown in the following table. (Because of the passage of time, these performance results may differ from the performance results for more recent periods shown elsewhere in this report.) Where applicable, the table also shows the number of funds in the peer groups for the respective periods; this number is indicated in parentheses following the percentile. Note that the first percentile denotes the best-performing funds and the 100th percentile denotes the worst-performing funds. Past performance is no guarantee of future returns.
| One-year period rank (# of funds in category) | |
| Putnam RetirementReady Maturity Fund | |
| Lipper Mixed-Asset Target Allocation Conservative Funds | 69th (337) |
| Putnam RetirementReady 2010 Fund | |
| Lipper Mixed-Asset Target 2010 Funds | 83rd (97) |
| Putnam RetirementReady 2015 Fund | |
| Lipper Mixed-Asset Target 2020 Funds | 83rd (116) |
| Putnam RetirementReady 2020 Fund | |
| Lipper Mixed-Asset Target 2020 Funds | 53rd (116) |
| Putnam RetirementReady 2025 Fund | |
| Lipper Mixed-Asset Target 2030 Funds | 52nd (105) |
| Putnam RetirementReady 2030 Fund | |
| Lipper Mixed-Asset Target 2030 Funds | 44th (105) |
| Putnam RetirementReady 2035 Fund | |
| Lipper Mixed-Asset Target 2030+ Funds | 61st (129) |
28
| One-year period rank (# of funds in category) | |
| Putnam RetirementReady 2040 Fund | |
| Lipper Mixed-Asset Target 2030+ Funds | 42nd (129) |
| Putnam RetirementReady 2045 Fund | |
| Lipper Mixed-Asset Target 2030+ Funds | 31st (129) |
| Putnam RetirementReady 2050 Fund | |
| Lipper Mixed-Asset Target 2030+ Funds | 34th (129) |
See page 30 for more recent Lipper performance ranking information for the funds. Past performance is no guarantee of future results.
As a general matter, the Trustees concluded that cooperative efforts between the Trustees and Putnam Management represent the most effective way to address investment performance problems. The Trustees noted that investors in the Putnam funds have, in effect, placed their trust in the Putnam organization, under the oversight of the funds’ Trustees, to make appropriate decisions regarding the management of the funds. Based on the responsiveness of Putnam Management in the recent past to Trustee concerns about investment performance, the Trustees concluded that it is preferable to seek change within Putnam Management to address performance shortcomings. In the Trustees’ view, the alternative of terminating a management contract and engaging a new investment adviser for an underperforming fund would entail significant disruptions and would not provide any great er assurance of improved investment performance.
Brokerage and soft-dollar allocations; other benefits
The Trustees considered various potential benefits that Putnam Management may receive in connection with the services it provides under the management contract with your fund. These include benefits related to brokerage and soft-dollar allocations, whereby a portion of the commissions paid by a fund for brokerage may be used to acquire research services that may be useful to Putnam Management in managing the assets of the fund and of other clients. The Trustees indicated their continued intent to monitor the potential benefits associated with the allocation of fund brokerage to ensure that the principle of seeking “best price and execution” remains paramount in the portfolio trading process.
The Trustees’ annual review of your fund’s management contract also included the review of its distributor’s contract and distribution plan with Putnam Retail Management Limited Partnership and the custodian agreement and investor servicing agreement with Putnam Fiduciary Trust Company (“PFTC”), each of which provides benefits to affiliates of Putnam Management. In the case of the custodian agreement, the Trustees considered that, effective January 1, 2007, the Putnam funds had engaged State Street Bank and Trust Company as custodian and began to transition the responsibility for providing custody services away from PFTC.
Comparison of retail and institutional fee schedules
The information examined by the Trustees as part of their annual contract review has included for many years information regarding fees charged by Putnam Management and its affiliates to institutional clients such as defined benefit pension plans, college endowments, etc. This information included comparison of such fees with fees charged to the funds, as well as a detailed assessment of the differences in the services provided to these two types of clients. The Trustees observed, in this regard, that the differences in fee rates between institutional clients and the funds are by no means uniform when examined by individual asset sectors, suggesting that differences in the pricing of investment management services to these types of clients reflect to a substantial degree historical competitive forces operating in separate market places. The Trustees considered the fact that fee rates across all asset sectors are higher on average for funds than for institutional clients, as well as the differences between the services that Putnam Management provides to the Putnam funds and those that it provides to institutional clients of the firm, but did not rely on such comparisons to any significant extent in concluding that the management fees paid by your fund are reasonable.
29
More recent peer group rankings
More recent Lipper percentile rankings are shown for the funds in the following table. Note that this information was not available to the Trustees when they approved the continuance of the funds’ management contract. The table shows the Lipper peer group percentile rankings of the funds’ class A share total return performance at net asset value. These rankings were determined on an annualized basis and are for the one-year period ended on the most recent calendar quarter (June 30, 2007). Where applicable, the table also shows the fund’s rank among the total number of funds in its peer group for the respective periods; this information is indicated in parentheses following the percentile. Note that the first percentile denotes the best-performing funds and the 100th percentile denotes the worst-performing funds.
| One-year period rank (# of funds in category) | |
| Putnam RetirementReady Maturity Fund | |
| Lipper Mixed-Asset Target Allocation Conservative Funds | 65th (380) |
| Putnam RetirementReady 2010 Fund | |
| Lipper Mixed-Asset Target 2010 Funds | 88th (116) |
| Putnam RetirementReady 2015 Fund | |
| Lipper Mixed-Asset Target 2020 Funds | 91st (145) |
| Putnam RetirementReady 2020 Fund | |
| Lipper Mixed-Asset Target 2020 Funds | 59th (145) |
| Putnam RetirementReady 2025 Fund | |
| Lipper Mixed-Asset Target 2030 Funds | 74th (129) |
| Putnam RetirementReady 2030 Fund | |
| Lipper Mixed-Asset Target 2030 Funds | 57th (129) |
| Putnam RetirementReady 2035 Fund | |
| Lipper Mixed-Asset Target 2030+ Funds | 81st (170) |
| Putnam RetirementReady 2040 Fund | |
| Lipper Mixed-Asset Target 2030+ Funds | 61st (170) |
| Putnam RetirementReady 2045 Fund | |
| Lipper Mixed-Asset Target 2030+ Funds | 44th (170) |
| Putnam RetirementReady 2050 Fund | |
| Lipper Mixed-Asset Target 2030+ Funds | 44th (170) |
30
Other information for shareholders
Putnam’s policy on confidentiality
In order to conduct business with our shareholders, we must obtain certain personal information such as account holders’ addresses, telephone numbers, Social Security numbers, and the names of their financial advisors. We use this information to assign an account number and to help us maintain accurate records of transactions and account balances. It is our policy to protect the confidentiality of your information, whether or not you currently own shares of our funds, and in particular, not to sell information about you or your accounts to outside marketing firms. We have safeguards in place designed to prevent unauthorized access to our computer systems and procedures to protect personal information from unauthorized use. Under certain circumstances, we share this information with outside vendors who provide services to us, such as mailing and proxy solicitation. In t hose cases, the service providers enter into confidentiality agreements with us, and we provide only the information necessary to process transactions and perform other services related to your account. We may also share this information with our Putnam affiliates to service your account or provide you with information about other Putnam products or services. It is also our policy to share account information with your financial advisor, if you’ve listed one on your Putnam account. If you would like clarification about our confidentiality policies or have any questions or concerns, please don’t hesitate to contact us at 1-800-225-1581, Monday through Friday, 8:30 a.m. to 7:00 p.m., or Saturdays from 9:00 a.m. to 5:00 p.m. Eastern Time.
Proxy voting
Putnam is committed to managing our mutual funds in the best interests of our shareholders. The Putnam funds’ proxy voting guidelines and procedures, as well as information regarding how your fund voted proxies relating to portfolio securities during the 12-month period ended June 30, 2007, are available on the Putnam Individual Investor Web site, www.putnam.com/individual, and on the SEC’s Web site, www.sec.gov. If you have questions about finding forms on the SEC’s Web site, you may call the SEC at 1-800-SEC-0330. You may also obtain the Putnam funds’ proxy voting guidelines and procedures at no charge by calling Putnam’s Shareholder Services at 1-800-225-1581.
Fund portfolio holdings
The fund will file a complete schedule of its portfolio holdings with the SEC for the first and third quarters of each fiscal year on Form N-Q. Shareholders may obtain the fund’s Forms N-Q on the SEC’s Web site at www.sec.gov. In addition, the fund’s Forms N-Q may be reviewed and copied at the SEC’s Public Reference Room in Washington, D.C. You may call the SEC at 1-800-SEC-0330 for information about the SEC’s Web site or the operation of the Public Reference Room.
31
Financial statements
These sections of the report, as well as the accompanying Notes, preceded by the Report of Independent Registered Public Accounting Firm, constitute the fund’s financial statements.
The fund’s portfolio lists all the fund’s investments and their values as of the last day of the reporting period. Holdings are organized by asset type and industry sector, country, or state to show areas of concentration and diversification.
Statement of assets and liabilities shows how the fund’s net assets and share price are determined. All investment and non-investment assets are added together. Any unpaid expenses and other liabilities are subtracted from this total. The result is divided by the number of shares to determine the net asset value per share, which is calculated separately for each class of shares. (For funds with preferred shares, the amount subtracted from total assets includes the liquidation preference of preferred shares.)
Statement of operations shows the fund’s net investment gain or loss. This is done by first adding up all the fund’s earnings — from dividends and interest income — and subtracting its operating expenses to determine net investment income (or loss). Then, any net gain or loss the fund realized on the sales of its holdings — as well as any unrealized gains or losses over the period — is added to or subtracted from the net investment result to determine the fund’s net gain or loss for the fiscal year.
Statement of changes in net assets shows how the fund’s net assets were affected by the fund’s net investment gain or loss, by distributions to shareholders, and by changes in the number of the fund’s shares. It lists distributions and their sources (net investment income or realized capital gains) over the current reporting period and the most recent fiscal year-end. The distributions listed here may not match the sources listed in the Statement of operations because the distributions are determined on a tax basis and may be paid in a different period from the one in which they were earned.
Financial highlights provide an overview of the fund’s investment results, per-share distributions, expense ratios, net investment income ratios, and portfolio turnover in one summary table, reflecting the five most recent reporting periods. In a semiannual report, the highlight table also includes the current reporting period.
32
Report of Independent Registered Public Accounting Firm
To the Trustees and Shareholders of
Putnam RetirementReady Funds:
In our opinion, the accompanying statement of assets and liabilities, including the funds’ portfolios, and the related statements of operations and of changes in net assets and the financial highlights present fairly, in all material respects, the financial position of each of the Putnam RetirementReady Funds (the “trust”) at July 31, 2007, and the results of each of their operations, the changes in each of their net assets and the financial highlights for each of the periods indicated, in conformity with accounting principles generally accepted in the United States of America. These financial statements and financial highlights (hereafter referred to as “financial statements”) are the responsibility of the trust’s management; our responsibility is to express an opinion on these financial statements based on our audits. We conducted our audits of these financial statements in accordance with the standards of the Public Company Accounting Oversight Board (United States). Those standards require that we plan and perform the audit to obtain reasonable assurance about whether the financial statements are free of material misstatement. An audit includes examining, on a test basis, evidence supporting the amounts and disclosures in the financial statements, assessing the accounting principles used and significant estimates made by management, and evaluating the overall financial statement presentation. We believe that our audits, which included confirmation of investments owned at July 31, 2007 by correspondence with the transfer agent, provide a reasonable basis for our opinion.
PricewaterhouseCoopers LLP
Boston, Massachusetts
September 13, 2007
33
The funds’ portfolios 7/31/07
| 2050 Fund | |||
| EQUITY FUNDS* 94.8% | Shares | Value | |
| Putnam Capital Opportunities Fund (Class Y) | 185,860 | $ | 2,196,862 |
| Putnam Fund for Growth and Income (Class Y) | 189,950 | 3,800,905 | |
| Putnam International Equity Fund (Class Y) | 137,240 | 4,716,934 | |
| Putnam Voyager Fund (Class Y) | 203,739 | 3,913,823 | |
| Total Equity Funds (cost $14,695,405) | $14,628,524 | ||
| FIXED INCOME FUNDS* 5.2% | Shares | Value | |
| Putnam Income Fund (Class Y) | 96,235 | $ | 648,626 |
| Putnam Money Market Fund (Class A) | 154,982 | 154,982 | |
| Total Fixed Income Funds (cost $807,643) | $ | 803,608 | |
| TOTAL INVESTMENTS | |||
| Total investments (cost $15,503,048) | $15,432,132 | ||
| * Percentages indicated are based on net assets of $15,424,448 | |||
| 2045 Fund | |||
| EQUITY FUNDS* 94.8% | Shares | Value | |
| Putnam Capital Opportunities Fund (Class Y) | 421,036 | $ | 4,976,648 |
| Putnam Fund for Growth and Income (Class Y) | 430,606 | 8,616,426 | |
| Putnam International Equity Fund (Class Y) | 311,334 | 10,700,556 | |
| Putnam Voyager Fund (Class Y) | 462,125 | 8,877,429 | |
| Total Equity Funds (cost $32,782,159) | $33,171,059 | ||
| FIXED INCOME FUNDS* 5.2% | Shares | Value | |
| Putnam Income Fund (Class Y) | 218,302 | $ | 1,471,353 |
| Putnam Money Market Fund (Class A) | 349,313 | 349,313 | |
| Total Fixed Income Funds (cost $1,827,569) | $ | 1,820,666 | |
| TOTAL INVESTMENTS | |||
| Total investments (cost $34,609,728) | $ | 34,991,725 | |
* Percentages indicated are based on net assets of $34,974,213
The accompanying notes are an integral part of these financial statements.
34
The funds’ portfolios 7/31/07 (Continued)
| 2040 Fund | |||
| EQUITY FUNDS* 89.6% | Shares | Value | |
| Putnam Capital Opportunities Fund (Class Y) | 532,967 | $ | 6,299,673 |
| Putnam Fund for Growth and Income (Class Y) | 560,689 | 11,219,392 | |
| Putnam International Equity Fund (Class Y) | 394,091 | 13,544,918 | |
| Putnam Voyager Fund (Class Y) | 601,750 | 11,559,613 | |
| Total Equity Funds (cost $41,671,104) | $42,623,596 | ||
| FIXED INCOME FUNDS* 10.4% | Shares | Value | |
| Putnam Income Fund (Class Y) | 518,323 | $ | 3,493,495 |
| Putnam Money Market Fund (Class A) | 1,473,526 | 1,473,526 | |
| Total Fixed Income Funds (cost $4,975,489) | $ | 4,967,021 | |
| TOTAL INVESTMENTS | |||
| Total investments (cost $46,646,593) | $47,590,617 | ||
| * Percentages indicated are based on net assets of $47,567,103 | |||
| 2035 Fund | |||
| EQUITY FUNDS* 84.4% | Shares | Value | |
| Putnam Capital Opportunities Fund (Class Y) | 763,566 | $ | 9,025,348 |
| Putnam Fund for Growth and Income (Class Y) | 828,909 | 16,586,459 | |
| Putnam International Equity Fund (Class Y) | 564,528 | 19,402,837 | |
| Putnam Voyager Fund (Class Y) | 889,564 | 17,088,524 | |
| Total Equity Funds (cost $60,460,895) | $62,103,168 | ||
| FIXED INCOME FUNDS* 15.6% | Shares | Value | |
| Putnam Income Fund (Class Y) | 1,256,342 | $ | 8,467,748 |
| Putnam Money Market Fund (Class A) | 3,046,427 | 3,046,427 | |
| Total Fixed Income Funds (cost $11,527,768) | $11,514,175 | ||
| TOTAL INVESTMENTS | |||
| Total investments (cost $71,988,663) | $ | 73,617,343 | |
* Percentages indicated are based on net assets of $73,582,408
The accompanying notes are an integral part of these financial statements.
35
The funds’ portfolios 7/31/07 (Continued)
| 2030 Fund | |||
| EQUITY FUNDS* 79.2% | Shares | Value | |
| Putnam Capital Opportunities Fund (Class Y) | 891,428 | $ | 10,536,682 |
| Putnam Fund for Growth and Income (Class Y) | 1,002,914 | 20,068,317 | |
| Putnam International Equity Fund (Class Y) | 659,202 | 22,656,772 | |
| Putnam Voyager Fund (Class Y) | 1,076,411 | 20,677,846 | |
| Total Equity Funds (cost $71,895,293) | $ | 73,939,617 | |
| FIXED INCOME FUNDS* 20.8% | Shares | Value | |
| Putnam Income Fund (Class Y) | 2,022,617 | $ | 13,632,436 |
| Putnam Money Market Fund (Class A) | 5,800,591 | 5,800,591 | |
| Total Fixed Income Funds (cost $19,442,573) | $ | 19,433,027 | |
| TOTAL INVESTMENTS | |||
| Total investments (cost $91,337,866) | $ | 93,372,644 | |
| * Percentages indicated are based on net assets of $93,326,621 | |||
| 2025 Fund | |||
| EQUITY FUNDS* 74.1% | Shares | Value | |
| Putnam Capital Opportunities Fund (Class Y) | 1,069,804 | $ | 12,645,081 |
| Putnam Fund for Growth and Income (Class Y) | 1,253,436 | 25,081,250 | |
| Putnam International Equity Fund (Class Y) | 791,207 | 27,193,796 | |
| Putnam Voyager Fund (Class Y) | 1,345,368 | 25,844,512 | |
| Total Equity Funds (cost $88,099,366) | $ | 90,764,639 | |
| FIXED INCOME FUNDS* 26.0% | Shares | Value | |
| Putnam Income Fund (Class Y) | 3,216,538 | $ | 21,679,467 |
| Putnam Money Market Fund (Class A) | 10,152,145 | 10,152,145 | |
| Total Fixed Income Funds (cost $31,863,583) | $ | 31,831,612 | |
| TOTAL INVESTMENTS | |||
| Total investments (cost $119,962,949) | $ | 122,596,251 | |
* Percentages indicated are based on net assets of $122,537,038
The accompanying notes are an integral part of these financial statements.
36
The funds’ portfolios 7/31/07 (Continued)
| 2020 Fund | |||
| EQUITY FUNDS* 63.8% | Shares | Value | |
| Putnam Capital Opportunities Fund (Class Y) | 1,134,394 | $ | 13,408,533 |
| Putnam Fund for Growth and Income (Class Y) | 1,392,181 | 27,857,539 | |
| Putnam International Equity Fund (Class Y) | 629,133 | 21,623,309 | |
| Putnam Voyager Fund (Class Y) | 1,494,198 | 28,703,547 | |
| Total Equity Funds (cost $89,125,711) | $ | 91,592,928 | |
| FIXED INCOME FUNDS* 36.2% | Shares | Value | |
| Putnam Income Fund (Class Y) | 5,514,033 | $ | 37,164,584 |
| Putnam Money Market Fund (Class A) | 14,806,164 | 14,806,164 | |
| Total Fixed Income Funds (cost $52,028,236) | $ | 51,970,748 | |
| TOTAL INVESTMENTS | |||
| Total investments (cost $141,153,947) | $143,563,676 | ||
| * Percentages indicated are based on net assets of $143,494,226 | |||
| 2015 Fund | |||
| EQUITY FUNDS* 47.6% | Shares | Value | |
| Putnam Capital Opportunities Fund (Class Y) | 919,694 | $ | 10,870,785 |
| Putnam Fund for Growth and Income (Class Y) | 1,003,106 | 20,072,146 | |
| Putnam International Equity Fund (Class Y) | 302,179 | 10,385,896 | |
| Putnam Voyager Fund (Class Y) | 1,076,436 | 20,678,334 | |
| Total Equity Funds (cost $61,113,608) | $ | 62,007,161 | |
| FIXED INCOME FUNDS* 52.4% | Shares | Value | |
| Putnam Income Fund (Class Y) | 6,554,693 | $ | 44,178,634 |
| Putnam Money Market Fund (Class A) | 24,055,100 | 24,055,100 | |
| Total Fixed Income Funds (cost $68,268,819) | $ | 68,233,734 | |
| TOTAL INVESTMENTS | |||
| Total investments (cost $129,382,427) | $ | 130,240,895 | |
| * Percentages indicated are based on net assets of $130,180,287 | |||
The accompanying notes are an integral part of these financial statements.
37
The funds’ portfolios 7/31/07 (Continued)
| 2010 Fund | |||
| EQUITY FUNDS* 27.8% | Shares | Value | |
| Putnam Capital Opportunities Fund (Class Y) | 252,341 | $ | 2,982,675 |
| Putnam Fund for Growth and Income (Class Y) | 340,582 | 6,815,049 | |
| Putnam International Equity Fund (Class Y) | 37,311 | 1,282,369 | |
| Putnam Voyager Fund (Class Y) | 365,490 | 7,021,058 | |
| Total Equity Funds (cost $17,914,417) | $ | 18,101,151 | |
| FIXED INCOME FUNDS* 72.2% | Shares | Value | |
| Putnam Income Fund (Class Y) | 4,218,432 | $ | 28,432,232 |
| Putnam Money Market Fund (Class A) | 18,501,053 | 18,501,053 | |
| Total Fixed Income Funds (cost $46,925,110) | $ | 46,933,285 | |
| TOTAL INVESTMENTS | |||
| Total investments (cost $64,839,527) | $ | 65,034,436 | |
| * Percentages indicated are based on net assets of $65,002,769 | |||
| Maturity Fund | |||
| EQUITY FUNDS* 23.9% | Shares | Value | |
| Putnam Capital Opportunities Fund (Class Y) | 126,668 | $ | 1,497,220 |
| Putnam Fund for Growth and Income (Class Y) | 155,457 | 3,110,703 | |
| Putnam International Equity Fund (Class Y) | — | — | |
| Putnam Voyager Fund (Class Y) | 166,826 | 3,204,735 | |
| Total Equity Funds (cost $7,857,321) | $ | 7,812,658 | |
| FIXED INCOME FUNDS* 76.2% | Shares | Value | |
| Putnam Income Fund (Class Y) | 2,217,458 | $ | 14,945,670 |
| Putnam Money Market Fund (Class A) | 9,953,555 | 9,953,555 | |
| Total Fixed Income Funds (cost $24,915,923) | $ | 24,899,225 | |
| TOTAL INVESTMENTS | |||
| Total investments (cost $32,773,244) | $ | 32,711,883 | |
| * Percentages indicated are based on net assets of $32,695,884 | |||
The accompanying notes are an integral part of these financial statements.
38
Statement of assets and liabilities 7/31/07
| ASSETS | 2050 Fund | 2045 Fund |
| Investments in affiliated underlying Putnam Funds, at value (Notes 1 and 5) | $15,432,132 | $34,991,725 |
| Interest receivable | 676 | 1,565 |
| Receivable for shares of the fund sold | 121,119 | 37,581 |
| Receivable for securities sold | 16,166 | 127,800 |
| Total assets | 15,570,093 | 35,158,671 |
| LIABILITIES | ||
| Payable for shares of the fund repurchased | 16,166 | 127,800 |
| Payable for securities purchased | 121,775 | 39,101 |
| Payable for compensation of Manager (Note 2) | 389 | 3,198 |
| Payable for distribution fees (Note 2) | 2,370 | 5,222 |
| Payable for shareholder expense | 2,263 | 1,906 |
| Payable for audit expense | 1,984 | 6,684 |
| Other accrued expenses | 698 | 547 |
| Total liabilities | 145,645 | 184,458 |
| Net assets | $15,424,448 | $34,974,213 |
| REPRESENTED BY | ||
| Paid-in-capital (unlimited shares authorized) (Notes 1 and 4) | $14,697,071 | $30,885,343 |
| Undistributed net investment income (Note 1) | 12,539 | 48,295 |
| Accumulated net realized gain on investments (Note 1) | 785,754 | 3,658,578 |
| Net unrealized appreciation (depreciation) of investments | (70,916) | 381,997 |
| Total — Representing net assets applicable to capital outstanding | $15,424,448 | $34,974,213 |
(Continued on next page)
39
Statement of assets and liabilities 7/31/07 (Continued)
| COMPUTATION OF NET ASSET VALUE AND OFFERING PRICE | 2050 Fund | 2045 Fund |
| Computation of net asset value, offering price and redemption price Class A | ||
| Net Assets | $10,042,114 | $22,590,403 |
| Number of shares outstanding | 157,892 | 285,083 |
| Net asset value and redemption price | $63.60 | $79.24 |
| Offering price per class A share (100/94.75 of Class A net asset value)* | $67.12 | $83.63 |
| Computation of net asset value and offering price Class B | ||
| Net Assets | $143,178 | $157,615 |
| Number of shares outstanding | 2,269 | 2,065 |
| Net asset value and offering price** | $63.12 | $76.34 |
| Computation of net asset value and offering price Class C | ||
| Net Assets | $15,719 | $17,157 |
| Number of shares outstanding | 248 | 223 |
| Net asset value and offering price** | $63.43 | $76.85 |
| Computation of net asset value, offering price and redemption price Class M | ||
| Net Assets | $28,935 | $1,018 |
| Number of shares outstanding | 456 | 13 |
| Net asset value and redemption price | $63.41 | $77.20 |
| Offering price per class M share (100/96.75 of Class M net asset value)* | $65.54 | $79.79 |
| Computation of net asset value, offering price and redemption price Class R | ||
| Net Assets | $66,020 | $193,425 |
| Number of shares outstanding | 1,041 | 2,400 |
| Net asset value, offering price and redemption value | $63.42 | $80.59 |
| Computation of net asset value, offering price and redemption price Class Y | ||
| Net Assets | $5,128,482 | $12,014,595 |
| Number of shares outstanding | 80,333 | 137,997 |
| Net asset value, offering price and redemption value | $63.84 | $87.06 |
| Cost of investments (Note 1) | $15,503,048 | $34,609,728 |
* On retail sales of less than $50,000. On sales of $50,000 or more the offering price is reduced.
** Redemption price per share is equal to the net asset value less any applicable contingent deferred sales charge.
The accompanying notes are an integral part of these financial statements.
40
Statement of assets and liabilities 7/31/07 (Continued)
| ASSETS | 2040 Fund | 2035 Fund |
| Investments in affiliated underlying Putnam Funds, at value (Notes 1 and 5) | $47,590,617 | $73,617,343 |
| Interest receivable | 6,455 | 13,270 |
| Receivable for shares of the fund sold | 45,591 | 135,438 |
| Receivable for securities sold | 102,358 | 254,030 |
| Total assets | 47,745,021 | 74,020,081 |
| LIABILITIES | ||
| Payable for shares of the fund repurchased | 102,358 | 254,030 |
| Payable for securities purchased | 51,855 | 148,312 |
| Payable for compensation of Manager (Note 2) | 4,283 | 6,579 |
| Payable for distribution fees (Note 2) | 7,131 | 10,163 |
| Payable for shareholder expense | 2,706 | 3,874 |
| Payable for audit expense | 8,806 | 13,727 |
| Other accrued expenses | 779 | 988 |
| Total liabilities | 177,918 | 437,673 |
| Net assets | $47,567,103 | $73,582,408 |
| REPRESENTED BY | ||
| Paid-in-capital (unlimited shares authorized) (Notes 1 and 4) | $42,278,116 | $65,239,822 |
| Undistributed net investment income (Note 1) | 124,991 | 296,868 |
| Accumulated net realized gain on investments (Note 1) | 4,219,972 | 6,417,038 |
| Net unrealized appreciation of investments | 944,024 | 1,628,680 |
| Total — Representing net assets applicable to capital outstanding | $47,567,103 | $73,582,408 |
(Continued on next page)
41
Statement of assets and liabilities 7/31/07 (Continued)
| COMPUTATION OF NET ASSET VALUE AND OFFERING PRICE | 2040 Fund | 2035 Fund |
| Computation of net asset value, offering price and redemption price Class A | ||
| Net Assets | $30,801,964 | $43,168,738 |
| Number of shares outstanding | 393,029 | 571,894 |
| Net asset value and redemption price | $78.37 | $75.48 |
| Offering price per class A share (100/94.75 of Class A net asset value)* | $82.71 | $79.66 |
| Computation of net asset value and offering price Class B | ||
| Net Assets | $277,926 | $509,736 |
| Number of shares outstanding | 3,684 | 7,055 |
| Net asset value and offering price** | $75.43 | $72.25 |
| Computation of net asset value and offering price Class C | ||
| Net Assets | $17,796 | $83,482 |
| Number of shares outstanding | 235 | 1,153 |
| Net asset value and offering price** | $75.69 | $72.42 |
| Computation of net asset value, offering price and redemption price Class M | ||
| Net Assets | $13,566 | $62,764 |
| Number of shares outstanding | 179 | 862 |
| Net asset value and redemption price | $75.81 | $72.84 |
| Offering price per class M share (100/96.75 of Class M net asset value)* | $78.36 | $75.29 |
| Computation of net asset value, offering price and redemption price Class R | ||
| Net Assets | $158,154 | $302,177 |
| Number of shares outstanding | 1,979 | 4,080 |
| Net asset value, offering price and redemption value | $79.90 | $74.06 |
| Computation of net asset value, offering price and redemption price Class Y | ||
| Net Assets | $16,297,697 | $29,455,511 |
| Number of shares outstanding | 189,946 | 355,590 |
| Net asset value, offering price and redemption value | $85.80 | $82.84 |
| Cost of investments (Note 1) | $46,646,593 | $71,988,663 |
* On retail sales of less than $50,000. On sales of $50,000 or more the offering price is reduced.
** Redemption price per share is equal to the net asset value less any applicable contingent deferred sales charge.
The accompanying notes are an integral part of these financial statements.
42
Statement of assets and liabilities 7/31/07 (Continued)
| ASSETS | 2030 Fund | 2025 Fund |
| Investments in affiliated underlying Putnam Funds, at value (Notes 1 and 5) | $93,372,644 | $122,596,251 |
| Interest receivable | 25,332 | 44,284 |
| Receivable for shares of the fund sold | 228,187 | 161,828 |
| Receivable for securities sold | 398,638 | 600,311 |
| Total assets | 94,024,801 | 123,402,674 |
| LIABILITIES | ||
| Payable for shares of the fund repurchased | 398,638 | 600,311 |
| Payable for securities purchased | 252,765 | 204,761 |
| Payable for compensation of Manager (Note 2) | 8,459 | 11,190 |
| Payable for distribution fees (Note 2) | 13,414 | 16,597 |
| Payable for shareholder expense | 4,674 | 5,891 |
| Payable for audit expense | 19,415 | 25,823 |
| Other accrued expenses | 815 | 1,063 |
| Total liabilities | 698,180 | 865,636 |
| Net assets | $93,326,621 | $122,537,038 |
| REPRESENTED BY | ||
| Paid-in-capital (unlimited shares authorized) (Notes 1 and 4) | $81,011,273 | $106,583,124 |
| Undistributed net investment income (Note 1) | 547,254 | 913,377 |
| Accumulated net realized gain on investments (Note 1) | 9,733,316 | 12,407,235 |
| Net unrealized appreciation of investments | 2,034,778 | 2,633,302 |
| Total — Representing net assets applicable to capital outstanding | $93,326,621 | $122,537,038 |
(Continued on next page)
43
Statement of assets and liabilities 7/31/07 (Continued)
| COMPUTATION OF NET ASSET VALUE AND OFFERING PRICE | 2030 Fund | 2025 Fund |
| Computation of net asset value, offering price and redemption price Class A | ||
| Net Assets | $55,377,740 | $68,995,834 |
| Number of shares outstanding | 747,030 | 895,801 |
| Net asset value and redemption price | $74.13 | $77.02 |
| Offering price per class A share (100/94.75 of Class A net asset value)* | $78.24 | $81.29 |
| Computation of net asset value and offering price Class B | ||
| Net Assets | $608,897 | $1,143,692 |
| Number of shares outstanding | 8,479 | 15,513 |
| Net asset value and offering price** | $71.81 | $73.72 |
| Computation of net asset value and offering price Class C | ||
| Net Assets | $90,408 | $180,857 |
| Number of shares outstanding | 1,253 | 2,444 |
| Net asset value and offering price** | $72.17 | $73.99 |
| Computation of net asset value, offering price and redemption price Class M | ||
| Net Assets | $775,926 | $295,401 |
| Number of shares outstanding | 10,789 | 3,980 |
| Net asset value and redemption price | $71.92 | $74.22 |
| Offering price per class M share (100/96.75 of Class M net asset value)* | $74.34 | $76.71 |
| Computation of net asset value, offering price and redemption price Class R | ||
| Net Assets | $245,506 | $283,625 |
| Number of shares outstanding | 3,406 | 3,821 |
| Net asset value, offering price and redemption value | $72.08 | $74.22 |
| Computation of net asset value, offering price and redemption price Class Y | ||
| Net Assets | $36,228,144 | $51,637,629 |
| Number of shares outstanding | 449,192 | 667,257 |
| Net asset value, offering price and redemption value | $80.65 | $77.39 |
| Cost of investments (Note 1) | $91,337,866 | $119,962,949 |
* On retail sales of less than $50,000. On sales of $50,000 or more the offering price is reduced.
** Redemption price per share is equal to the net asset value less any applicable contingent deferred sales charge.
The accompanying notes are an integral part of these financial statements.
44
Statement of assets and liabilities 7/31/07 (Continued)
| ASSETS | 2020 Fund | 2015 Fund |
| Investments in affiliated underlying Putnam Funds, at value (Notes 1 and 5) | $143,563,676 | $130,240,895 |
| Interest receivable | 64,634 | 104,092 |
| Receivable for shares of the fund sold | 269,225 | 353,898 |
| Receivable for securities sold | 176,877 | 600,925 |
| Total assets | 144,074,412 | 131,299,810 |
| LIABILITIES | ||
| Payable for shares of the fund repurchased | 176,877 | 600,925 |
| Payable for securities purchased | 331,910 | 454,766 |
| Payable for compensation of Manager (Note 2) | 13,042 | 11,488 |
| Payable for distribution fees (Note 2) | 20,901 | 18,916 |
| Payable for shareholder expense | 5,387 | 4,649 |
| Payable for audit expense | 31,098 | 27,949 |
| Other accrued expenses | 971 | 830 |
| Total liabilities | 580,186 | 1,119,523 |
| Net assets | $143,494,226 | $130,180,287 |
| REPRESENTED BY | ||
| Paid-in-capital (unlimited shares authorized) (Notes 1 and 4) | $127,837,507 | $119,911,628 |
| Undistributed net investment income (Note 1) | 1,508,126 | 1,968,901 |
| Accumulated net realized gain on investments (Note 1) | 11,738,864 | 7,441,290 |
| Net unrealized appreciation of investments | 2,409,729 | 858,468 |
| Total — Representing net assets applicable to capital outstanding | $143,494,226 | $130,180,287 |
(Continued on next page)
45
Statement of assets and liabilities 7/31/07 (Continued)
| COMPUTATION OF NET ASSET VALUE AND OFFERING PRICE | 2020 Fund | 2015 Fund |
| Computation of net asset value, offering price and redemption price Class A | ||
| Net Assets | $88,758,689 | $83,237,998 |
| Number of shares outstanding | 1,282,571 | 1,226,080 |
| Net asset value and redemption price | $69.20 | $67.89 |
| Offering price per class A share (100/94.75 of Class A net asset value)* | $73.03 | $71.65 |
| Computation of net asset value and offering price Class B | ||
| Net Assets | $749,525 | $780,870 |
| Number of shares outstanding | 11,116 | 11,793 |
| Net asset value and offering price** | $67.43 | $66.22 |
| Computation of net asset value and offering price Class C | ||
| Net Assets | $178,455 | $168,079 |
| Number of shares outstanding | 2,633 | 2,533 |
| Net asset value and offering price** | $67.77 | $66.35 |
| Computation of net asset value, offering price and redemption price Class M | ||
| Net Assets | $1,055,830 | $155,899 |
| Number of shares outstanding | 15,576 | 2,336 |
| Net asset value and redemption price | $67.79 | $66.75 |
| Offering price per class M share (100/96.75 of Class M net asset value)* | $70.07 | $68.99 |
| Computation of net asset value, offering price and redemption price Class R | ||
| Net Assets | $232,239 | $112,361 |
| Number of shares outstanding | 3,421 | 1,682 |
| Net asset value, offering price and redemption value | $67.88 | $66.79 |
| Computation of net asset value, offering price and redemption price Class Y | ||
| Net Assets | $52,519,488 | $45,725,080 |
| Number of shares outstanding | 704,252 | 670,608 |
| Net asset value, offering price and redemption value | $74.57 | $68.18 |
| Cost of investments (Note 1) | $141,153,947 | $129,382,427 |
* On retail sales of less than $50,000. On sales of $50,000 or more the offering price is reduced.
** Redemption price per share is equal to the net asset value less any applicable contingent deferred sales charge.
The accompanying notes are an integral part of these financial statements.
46
Statement of assets and liabilities 7/31/07 (Continued)
| ASSETS | 2010 Fund | Maturity Fund |
| Investments in affiliated underlying Putnam Funds, at value (Notes 1 and 5) | $65,034,436 | $32,711,883 |
| Interest receivable | 80,032 | 43,052 |
| Receivable for shares of the fund sold | 117,996 | 73,847 |
| Receivable for securities sold | 391,893 | 10,280 |
| Total assets | 65,624,357 | 32,839,062 |
| LIABILITIES | ||
| Payable for shares of the fund repurchased | 391,893 | 10,280 |
| Payable for securities purchased | 195,616 | 115,609 |
| Payable for compensation of Manager (Note 2) | 5,781 | 2,793 |
| Payable for distribution fees (Note 2) | 9,233 | 5,091 |
| Payable for shareholder expense | 3,235 | 1,033 |
| Payable for audit expense | 15,207 | 8,160 |
| Other accrued expenses | 623 | 212 |
| Total liabilities | 621,588 | 143,178 |
| Net assets | $65,002,769 | $32,695,884 |
| REPRESENTED BY | ||
| Paid-in-capital (unlimited shares authorized) (Notes 1 and 4) | $61,661,068 | $31,909,957 |
| Undistributed net investment income (Note 1) | 1,397,627 | 15,608 |
| Accumulated net realized gain on investments (Note 1) | 1,749,165 | 831,680 |
| Net unrealized appreciation (depreciation) of investments | 194,909 | (61,361) |
| Total — Representing net assets applicable to capital outstanding | $65,002,769 | $32,695,884 |
(Continued on next page)
47
Statement of assets and liabilities 7/31/07 (Continued)
| COMPUTATION OF NET ASSET VALUE AND OFFERING PRICE | 2010 Fund | Maturity Fund |
| Computation of net asset value, offering price and redemption price Class A | ||
| Net Assets | $40,695,882 | $22,651,241 |
| Number of shares outstanding | 687,335 | 396,477 |
| Net asset value and redemption price | $59.21 | $57.13 |
| Offering price per class A share (100/94.75 of Class A net asset value)* | $62.49 | $60.30 |
| Computation of net asset value and offering price Class B | ||
| Net Assets | $252,909 | $219,019 |
| Number of shares outstanding | 4,373 | 3,831 |
| Net asset value and offering price** | $57.84 | $57.17 |
| Computation of net asset value and offering price Class C | ||
| Net Assets | $90,822 | $1,116 |
| Number of shares outstanding | 1,575 | 19 |
| Net asset value and offering price** | $57.67 | $57.27 |
| Computation of net asset value, offering price and redemption price Class M | ||
| Net Assets | $126,462 | $14,236 |
| Number of shares outstanding | 2,186 | 249 |
| Net asset value and redemption price | $57.85 | $57.27 |
| Offering price per class M share (100/96.75 of Class M net asset value)* | $59.79 | $59.19 |
| Computation of net asset value, offering price and redemption price Class R | ||
| Net Assets | $216,165 | $81,017 |
| Number of shares outstanding | 3,727 | 1,418 |
| Net asset value, offering price and redemption value | $58.00 | $57.15 |
| Computation of net asset value, offering price and redemption price Class Y | ||
| Net Assets | $23,620,529 | $9,729,255 |
| Number of shares outstanding | 380,034 | 169,880 |
| Net asset value, offering price and redemption value | $62.15 | $57.27 |
| Cost of investments (Note 1) | $64,839,527 | $32,773,244 |
* On retail sales of less than $50,000. On sales of $50,000 or more the offering price is reduced.
** Redemption price per share is equal to the net asset value less any applicable contingent deferred sales charge.
The accompanying notes are an integral part of these financial statements.
48
Statement of operations
For the year ended 7/31/07
| INVESTMENT INCOME | 2050 Fund | 2045 Fund |
| Income distributions from underlying Putnam Funds | $111,781 | $ 436,893 |
| EXPENSES (NOTE 2) | ||
| Compensation of Manager (Note 2) | 5,057 | 17,032 |
| Distribution fees — Class A (Note 2) | 17,949 | 54,082 |
| Distribution fees — Class B (Note 2) | 1,101 | 1,269 |
| Distribution fees — Class C (Note 2) | 58 | 128 |
| Distribution fees — Class M (Note 2) | 98 | 50 |
| Distribution fees — Class R (Note 2) | 165 | 480 |
| Audit fees | 1,983 | 6,684 |
| Reports to shareholder | 5,160 | 4,650 |
| Other fees | 886 | 772 |
| Fees waived and reimbursed by Manager (Note 2) | (3,885) | (2,496) |
| Total expenses | 28,572 | 82,651 |
| Net investment income | 83,209 | 354,242 |
| Net realized gain on sale of underlying Putnam Fund shares (Notes 1 and 3) | 440,164 | 2,343,332 |
| Capital gain distributions from underlying Putnam Fund shares | 441,264 | 1,938,988 |
| Net unrealized appreciation (depreciation) of underlying Putnam Fund shares during the year | (9,729) | 12,371 |
| Net gain on investments | 871,699 | 4,294,691 |
| Net increase in net assets resulting from operations | $954,908 | $4,648,933 |
The accompanying notes are an integral part of these financial statements.
49
Statement of operations (Continued)
For the year ended 7/31/07
| INVESTMENT INCOME | 2040 Fund | 2035 Fund |
| Income distributions from underlying Putnam Funds | $ 649,619 | $1,140,624 |
| EXPENSES (NOTE 2) | ||
| Compensation of Manager (Note 2) | 22,436 | 34,959 |
| Distribution fees — Class A (Note 2) | 74,111 | 103,468 |
| Distribution fees — Class B (Note 2) | 2,072 | 4,163 |
| Distribution fees — Class C (Note 2) | 60 | 486 |
| Distribution fees — Class M (Note 2) | 196 | 403 |
| Distribution fees — Class R (Note 2) | 449 | 603 |
| Audit fees | 8,806 | 13,727 |
| Reports to shareholder | 6,690 | 9,522 |
| Other fees | 1,087 | 1,377 |
| Fees waived and reimbursed by Manager (Note 2) | (3,468) | (5,264) |
| Total expenses | 112,439 | 163,444 |
| Net investment income | 537,180 | 977,180 |
| Net realized gain on sale of underlying Putnam Fund shares (Notes 1 and 3) | 2,637,866 | 4,182,042 |
| Capital gain distributions from underlying Putnam Fund shares | 2,418,625 | 3,535,257 |
| Net unrealized appreciation of underlying Putnam Fund shares during the year | 400,403 | 448,665 |
| Net gain on investments | 5,456,894 | 8,165,964 |
| Net increase in net assets resulting from operations | $5,994,074 | $9,143,144 |
The accompanying notes are an integral part of these financial statements.
50
Statement of operations (Continued)
For the year ended 7/31/07
| INVESTMENT INCOME | 2030 Fund | 2025 Fund |
| Income distributions from underlying Putnam Funds | $ 1,815,018 | $ 2,643,608 |
| EXPENSES (NOTE 2) | ||
| Compensation of Manager (Note 2) | 49,439 | 65,742 |
| Distribution fees — Class A (Note 2) | 144,092 | 185,035 |
| Distribution fees — Class B (Note 2) | 5,392 | 9,646 |
| Distribution fees — Class C (Note 2) | 565 | 1,427 |
| Distribution fees — Class M (Note 2) | 5,491 | 2,231 |
| Distribution fees — Class R (Note 2) | 796 | 887 |
| Audit fees | 19,415 | 25,823 |
| Reports to shareholder | 11,463 | 15,034 |
| Other fees | 1,292 | 1,290 |
| Fees waived and reimbursed by Manager (Note 2) | (9,617) | (12,344) |
| Total expenses | 228,328 | 294,771 |
| Net investment income | 1,586,690 | 2,348,837 |
| Net realized gain on sale of underlying Putnam Fund shares (Notes 1 and 3) | 6,759,075 | 8,773,804 |
| Capital gain distributions from underlying Putnam Fund shares | 4,927,112 | 6,146,601 |
| Net unrealized depreciation of underlying Putnam Fund shares during the year | (50,806) | (275,035) |
| Net gain on investments | 11,635,381 | 14,645,370 |
| Net increase in net assets resulting from operations | $13,222,071 | $16,994,207 |
The accompanying notes are an integral part of these financial statements.

Statement of operations (Continued)
For the year ended 7/31/07
| INVESTMENT INCOME | 2020 Fund | 2015 Fund |
| Income distributions from underlying Putnam Funds | $ 3,674,175 | $ 4,069,349 |
| EXPENSES (NOTE 2) | ||
| Compensation of Manager (Note 2) | 79,161 | 71,181 |
| Distribution fees — Class A (Note 2) | 239,846 | 220,348 |
| Distribution fees — Class B (Note 2) | 6,745 | 6,967 |
| Distribution fees — Class C (Note 2) | 1,289 | 2,175 |
| Distribution fees — Class M (Note 2) | 5,464 | 1,154 |
| Distribution fees — Class R (Note 2) | 789 | 202 |
| Audit fees | 31,098 | 27,949 |
| Reports to shareholder | 13,586 | 11,882 |
| Other fees | 1,143 | 1,048 |
| Fees waived and reimbursed by Manager (Note 2) | (13,670) | (12,260) |
| Total expenses | 365,451 | 330,646 |
| Net investment income | 3,308,724 | 3,738,703 |
| Net realized gain on sale of underlying Putnam Fund shares (Notes 1 and 3) | 7,973,233 | 4,879,887 |
| Capital gain distributions from underlying Putnam Fund shares | 6,646,746 | 4,895,767 |
| Net unrealized appreciation of underlying Putnam Fund shares during the year | 794,587 | 631,826 |
| Net gain on investments | 15,414,566 | 10,407,480 |
| Net increase in net assets resulting from operations | $18,723,290 | $14,146,183 |
The accompanying notes are an integral part of these financial statements.
52
Statement of operations (Continued)
For the year ended 7/31/07
| INVESTMENT INCOME | 2010 Fund | Maturity Fund |
| Income distributions from underlying Putnam Funds | $2,783,844 | $1,568,524 |
| EXPENSES (NOTE 2) | ||
| Compensation of Manager (Note 2) | 38,687 | 20,779 |
| Distribution fees — Class A (Note 2) | 114,595 | 76,606 |
| Distribution fees — Class B (Note 2) | 2,708 | 1,794 |
| Distribution fees — Class C (Note 2) | 585 | 174 |
| Distribution fees — Class M (Note 2) | 1,003 | 550 |
| Distribution fees — Class R (Note 2) | 759 | 349 |
| Audit fees | 15,207 | 8,160 |
| Reports to shareholder | 8,511 | 2,711 |
| Other fees | 1,049 | 336 |
| Fees waived and reimbursed by Manager (Note 2) | (13,381) | — |
| Total expenses | 169,723 | 111,459 |
| Net investment income | 2,614,121 | 1,457,065 |
| Net realized gain on sale of underlying Putnam Fund shares (Notes 1 and 3) | 1,358,287 | 390,551 |
| Capital gain distributions from underlying Putnam Fund shares | 1,623,931 | 856,526 |
| Net unrealized appreciation of underlying Putnam Fund shares during the year | 856,306 | 541,555 |
| Net gain on investments | 3,838,524 | 1,788,632 |
| Net increase in net assets resulting from operations | $6,452,645 | $3,245,697 |
The accompanying notes are an integral part of these financial statements.
53
Statement of changes in net assets
| 2050 Fund | ||
| INCREASE IN NET ASSETS | ||
| Year ended | Year ended | |
| 7/31/07 | 7/31/06 | |
| Operations: | ||
| Net investment income | $ 83,209 | $ 16,645 |
| Net realized gain on underlying Putnam Fund shares | 881,428 | 102,446 |
| Net unrealized depreciation on underlying Putnam Fund shares | (9,729) | (72,415) |
| Net increase in net assets resulting from operations | 954,908 | 46,676 |
| Distributions to shareholders (Note 1) | ||
| From ordinary income | ||
| Net investment income | ||
| Class A | (94,430) | (12,282) |
| Class B | (1,103) | (331) |
| Class C | (9) | (39) |
| Class M | (41) | (35) |
| Class R | (298) | (13) |
| Class Y | (29,289) | (4,084) |
| Net realized short-term gain on investments | ||
| Class A | (80,242) | (14,240) |
| Class B | (1,314) | (588) |
| Class C | (17) | (73) |
| Class M | (52) | (55) |
| Class R | (268) | (19) |
| Class Y | (23,127) | (4,516) |
| From net realized long-term gain on investments | ||
| Class A | (17,256) | — |
| Class B | (282) | — |
| Class C | (4) | — |
| Class M | (11) | — |
| Class R | (57) | — |
| Class Y | (4,974) | — |
| Redemption fees (Note 1) | 15 | 77 |
| Increase from capital share transactions (Note 4) | 10,764,823 | 3,499,920 |
| Total increase in net assets | 11,466,972 | 3,510,398 |
| NET ASSETS | ||
| Beginning of year | 3,957,476 | 447,078 |
| End of year | $15,424,448 | $3,957,476 |
| Undistributed net investment income, end of year | $ 12,541 | $ 3,567 |
The accompanying notes are an integral part of these financial statements.
54
Statement of changes in net assets (Continued)
| 2045 Fund | ||
| INCREASE IN NET ASSETS | ||
| Year ended | Year ended | |
| 7/31/07 | 7/31/06 | |
| Operations: | ||
| Net investment income | $ 354,242 | $ 249,622 |
| Net realized gain on underlying Putnam Fund shares | 4,282,320 | 1,263,206 |
| Net unrealized appreciation (depreciation) on underlying Putnam Fund shares | 12,371 | (335,452) |
| Net increase in net assets resulting from operations | 4,648,933 | 1,177,376 |
| Distributions to shareholders (Note 1) | ||
| From ordinary income | ||
| Net investment income | ||
| Class A | (339,437) | (166,913) |
| Class B | (1,443) | (218) |
| Class C | (113) | (78) |
| Class M | (67) | (87) |
| Class R | (1,222) | — |
| Class Y | (211,147) | (126,139) |
| Net realized short-term gain on investments | ||
| Class A | (121,393) | (349,962) |
| Class B | (710) | (603) |
| Class C | (68) | (314) |
| Class M | (41) | (271) |
| Class R | (416) | — |
| Class Y | (68,070) | (238,800) |
| From net realized long-term gain on investments | ||
| Class A | (754,391) | — |
| Class B | (4,414) | — |
| Class C | (421) | — |
| Class M | (253) | — |
| Class R | (2,586) | — |
| Class Y | (423,018) | — |
| Redemption fees (Note 1) | 261 | 401 |
| Increase from capital share transactions (Note 4) | 6,674,695 | 9,186,199 |
| Total increase in net assets | 9,394,679 | 9,480,591 |
| NET ASSETS | ||
| Beginning of year | 25,579,534 | 16,098,943 |
| End of year | $34,974,213 | $25,579,534 |
| Undistributed net investment income, end of year | $ 48,295 | $ 23,791 |
The accompanying notes are an integral part of these financial statements.
55
Statement of changes in net assets (Continued)
| 2040 Fund | ||
| INCREASE IN NET ASSETS | ||
| Year ended | Year ended | |
| 7/31/07 | 7/31/06 | |
| Operations: | ||
| Net investment income | $ 537,180 | $ 353,517 |
| Net realized gain on underlying Putnam Fund shares | 5,056,491 | 1,776,972 |
| Net unrealized appreciation (depreciation) on underlying Putnam Fund shares | 400,403 | (538,066) |
| Net increase in net assets resulting from operations | 5,994,074 | 1,592,423 |
| Distributions to shareholders (Note 1) | ||
| From ordinary income | ||
| Net investment income | ||
| Class A | (491,393) | (234,538) |
| Class B | (2,750) | (483) |
| Class C | (43) | (10) |
| Class M | (464) | (131) |
| Class R | (1,253) | — |
| Class Y | (262,203) | (146,479) |
| Net realized short-term gain on investments | ||
| Class A | (128,605) | (534,325) |
| Class B | (904) | (1,625) |
| Class C | (15) | (43) |
| Class M | (146) | (423) |
| Class R | (340) | — |
| Class Y | (61,966) | (299,882) |
| From net realized long-term gain on investments | ||
| Class A | (1,134,064) | — |
| Class B | (7,972) | — |
| Class C | (128) | — |
| Class M | (1,284) | — |
| Class R | (2,994) | — |
| Class Y | (546,427) | — |
| Redemption fees (Note 1) | 15 | 368 |
| Increase from capital share transactions (Note 4) | 9,641,624 | 12,936,322 |
| Total increase in net assets | 12,992,762 | 13,311,174 |
| NET ASSETS | ||
| Beginning of year | 34,574,341 | 21,263,167 |
| End of year | $47,567,103 | $34,574,341 |
| Undistributed net investment income, end of year | $ 124,991 | $ 70,989 |
The accompanying notes are an integral part of these financial statements.
56
Statement of changes in net assets (Continued)
| 2035 Fund | ||
| INCREASE IN NET ASSETS | ||
| Year ended | Year ended | |
| 7/31/07 | 7/31/06 | |
| Operations: | ||
| Net investment income | $ 977,180 | $ 742,955 |
| Net realized gain on underlying Putnam Fund shares | 7,717,299 | 3,272,167 |
| Net unrealized appreciation (depreciation) on underlying Putnam Fund shares | 448,665 | (1,048,506) |
| Net increase in net assets resulting from operations | 9,143,144 | 2,966,616 |
| Distributions to shareholders (Note 1) | ||
| From ordinary income | ||
| Net investment income | ||
| Class A | (739,867) | (415,033) |
| Class B | (5,989) | (2,451) |
| Class C | (935) | (12) |
| Class M | (725) | (327) |
| Class R | (1,577) | — |
| Class Y | (520,626) | (359,130) |
| Net realized short-term gain on investments | ||
| Class A | (1,525) | (872,564) |
| Class B | (16) | (5,959) |
| Class C | (2) | (43) |
| Class M | (2) | (885) |
| Class R | (3) | (6) |
| Class Y | (971) | (679,478) |
| From net realized long-term gain on investments | ||
| Class A | (1,981,115) | (5,644) |
| Class B | (21,388) | (39) |
| Class C | (2,568) | — |
| Class M | (2,432) | (6) |
| Class R | (4,068) | — |
| Class Y | (1,261,419) | (4,395) |
| Redemption fees (Note 1) | 192 | 5 |
| Increase from capital share transactions (Note 4) | 10,444,079 | 15,826,585 |
| Total increase in net assets | 15,042,187 | 16,447,234 |
| NET ASSETS | ||
| Beginning of year | 58,540,221 | 42,092,987 |
| End of year | $73,582,408 | $58,540,221 |
| Undistributed net investment income, end of year | $ 296,868 | $ 188,487 |
The accompanying notes are an integral part of these financial statements.
57
Statement of changes in net assets (Continued)
| 2030 Fund | ||
| INCREASE IN NET ASSETS | ||
| Year ended | Year ended | |
| 7/31/07 | 7/31/06 | |
| Operations: | ||
| Net investment income | $ 1,586,690 | $ 1,297,288 |
| Net realized gain on underlying Putnam Fund shares | 11,686,187 | 4,688,975 |
| Net unrealized depreciation on underlying Putnam Fund shares | (50,806) | (1,426,516) |
| Net increase in net assets resulting from operations | 13,222,071 | 4,559,747 |
| Distributions to shareholders (Note 1) | ||
| From ordinary income | ||
| Net investment income | ||
| Class A | (1,131,581) | (645,707) |
| Class B | (8,130) | (4,028) |
| Class C | (265) | (639) |
| Class M | (15,295) | (779) |
| Class R | (2,298) | (844) |
| Class Y | (836,925) | (651,675) |
| Net realized short-term gain on investments | ||
| Class A | (1,486) | (1,184,385) |
| Class B | (15) | (9,681) |
| Class C | (1) | (1,367) |
| Class M | (22) | (1,738) |
| Class R | (3) | (1,482) |
| Class Y | (1,000) | (1,079,684) |
| From net realized long-term gain on investments | ||
| Class A | (2,794,404) | (11,612) |
| Class B | (27,354) | (95) |
| Class C | (1,578) | (13) |
| Class M | (41,645) | (17) |
| Class R | (6,061) | (15) |
| Class Y | (1,880,333) | (10,585) |
| Redemption fees (Note 1) | 80 | 920 |
| Increase (decrease) from capital share transactions (Note 4) | (2,876,149) | 18,421,092 |
| Total increase in net assets | 3,597,606 | 19,377,413 |
| NET ASSETS | ||
| Beginning of year | 89,729,015 | 70,351,602 |
| End of year | $93,326,621 | $89,729,015 |
| Undistributed net investment income, end of year | $ 547,254 | $ 400,912 |
The accompanying notes are an integral part of these financial statements.
58
Statement of changes in net assets (Continued)
| 2025 Fund | ||
| INCREASE (DECREASE) IN NET ASSETS | ||
| Year ended | Year ended | |
| 7/31/07 | 7/31/06 | |
| Operations: | ||
| Net investment income | $ 2,348,837 | $ 2,057,344 |
| Net realized gain on underlying Putnam Fund shares | 14,920,405 | 7,562,091 |
| Net unrealized depreciation on underlying Putnam Fund shares | (275,035) | (2,964,957) |
| Net increase in net assets resulting from operations | 16,994,207 | 6,654,478 |
| Distributions to shareholders (Note 1) | ||
| From ordinary income | ||
| Net investment income | ||
| Class A | (1,476,514) | (980,942) |
| Class B | (15,423) | (4,935) |
| Class C | (2,156) | (705) |
| Class M | (4,808) | (3,000) |
| Class R | (2,938) | (37) |
| Class Y | (1,317,622) | (1,051,074) |
| Net realized short-term gain on investments | ||
| Class A | — | (1,681,714) |
| Class B | — | (10,597) |
| Class C | — | (1,682) |
| Class M | — | (6,352) |
| Class R | — | (70) |
| Class Y | — | (1,624,261) |
| From net realized long-term gain on investments | ||
| Class A | (3,869,888) | (2,161) |
| Class B | (51,783) | (14) |
| Class C | (7,656) | (2) |
| Class M | (15,943) | (8) |
| Class R | (7,627) | — |
| Class Y | (3,130,990) | (2,087) |
| Redemption fees (Note 1) | 611 | 821 |
| Increase (decrease) from capital share transactions (Note 4) | (7,229,769) | 11,762,047 |
| Total increase (decrease) in net assets | (138,299) | 13,047,705 |
| NET ASSETS | ||
| Beginning of year | 122,675,337 | 109,627,632 |
| End of year | $122,537,038 | $122,675,337 |
| Undistributed net investment income, end of year | $ 913,377 | $ 699,063 |
The accompanying notes are an integral part of these financial statements.
59
Statement of changes in net assets (Continued)
| 2020 Fund | ||
| INCREASE (DECREASE) IN NET ASSETS | ||
| Year ended | Year ended | |
| 7/31/07 | 7/31/06 | |
| Operations: | ||
| Net investment income | $ 3,308,724 | $ 2,784,060 |
| Net realized gain on underlying Putnam Fund shares | 14,619,979 | 7,015,353 |
| Net unrealized appreciation (depreciation) on underlying Putnam Fund shares | 794,587 | (3,925,439) |
| Net increase in net assets resulting from operations | 18,723,290 | 5,873,974 |
| Distributions to shareholders (Note 1) | ||
| From ordinary income | ||
| Net investment income | ||
| Class A | (2,219,236) | (1,169,602) |
| Class B | (12,653) | (5,464) |
| Class C | (1,638) | (1,091) |
| Class M | (12,118) | (6,518) |
| Class R | (2,995) | (1,096) |
| Class Y | (1,513,866) | (1,260,545) |
| Net realized short-term gain on investments | ||
| Class A | (1,319) | (1,497,711) |
| Class B | (9) | (8,487) |
| Class C | (1) | (1,862) |
| Class M | (9) | (9,658) |
| Class R | (2) | (1,305) |
| Class Y | (826) | (1,466,727) |
| From net realized long-term gain on investments | ||
| Class A | (4,451,666) | (3,510) |
| Class B | (31,883) | (20) |
| Class C | (4,866) | (4) |
| Class M | (29,101) | (23) |
| Class R | (6,407) | (3) |
| Class Y | (2,786,572) | (3,437) |
| Redemption fees (Note 1) | 126 | 353 |
| Increase (decrease) from capital share transactions (Note 4) | (20,049,758) | 35,018,689 |
| Total increase (decrease) in net assets | (12,401,509) | 35,455,953 |
| NET ASSETS | ||
| Beginning of year | 155,895,735 | 120,439,782 |
| End of year | $143,494,226 | $155,895,735 |
| Undistributed net investment income, end of year | $ 1,508,126 | $ 1,240,367 |
The accompanying notes are an integral part of these financial statements.
60
Statement of changes in net assets (Continued)
| 2015 Fund | ||
| DECREASE IN NET ASSETS | ||
| Year ended | Year ended | |
| 7/31/07 | 7/31/06 | |
| Operations: | ||
| Net investment income | $ 3,738,703 | $ 2,978,581 |
| Net realized gain on underlying Putnam Fund shares | 9,775,654 | 7,232,417 |
| Net unrealized appreciation (depreciation) on underlying Putnam Fund shares | 631,826 | (5,734,750) |
| Net increase in net assets resulting from operations | 14,146,183 | 4,476,248 |
| Distributions to shareholders (Note 1) | ||
| From ordinary income | ||
| Net investment income | ||
| Class A | (2,262,336) | (1,340,947) |
| Class B | (14,895) | (3,935) |
| Class C | (4,122) | (2,633) |
| Class M | (3,083) | (3,386) |
| Class R | (268) | (720) |
| Class Y | (1,454,848) | (1,424,368) |
| Net realized short-term gain on investments | ||
| Class A | (14,418) | (2,034,022) |
| Class B | (115) | (6,839) |
| Class C | (36) | (4,596) |
| Class M | (25) | (5,918) |
| Class R | (2) | (1,037) |
| Class Y | (8,618) | (1,977,837) |
| From net realized long-term gain on investments | ||
| Class A | (3,687,110) | (2,511) |
| Class B | (29,361) | (8) |
| Class C | (9,131) | (6) |
| Class M | (6,322) | (7) |
| Class R | (479) | (1) |
| Class Y | (2,203,814) | (2,442) |
| Redemption fees (Note 1) | 27 | 36 |
| Decrease from capital share transactions (Note 4) | (4,531,037) | (8,359,668) |
| Total decrease in net assets | (83,810) | (10,694,597) |
| NET ASSETS | ||
| Beginning of year | 130,264,097 | 140,958,694 |
| End of year | $130,180,287 | $130,264,097 |
| Undistributed net investment income, end of year | $ 1,968,901 | $ 1,430,044 |
The accompanying notes are an integral part of these financial statements.
61
Statement of changes in net assets (Continued)
| 2010 Fund | ||
| INCREASE (DECREASE) IN NET ASSETS | ||
| Year ended | Year ended | |
| 7/31/07 | 7/31/06 | |
| Operations: | ||
| Net investment income | $ 2,614,121 | $ 2,464,799 |
| Net realized gain on underlying Putnam Fund shares | 2,982,218 | 2,454,626 |
| Net unrealized appreciation (depreciation) on underlying Putnam Fund shares | 856,306 | (2,804,430) |
| Net increase in net assets resulting from operations | 6,452,645 | 2,114,995 |
| Distributions to shareholders (Note 1) | ||
| From ordinary income | ||
| Net investment income | ||
| Class A | (1,619,352) | (1,011,730) |
| Class B | (8,771) | (1,365) |
| Class C | (1,130) | (720) |
| Class M | (4,082) | (2,636) |
| Class R | (2,705) | (2,459) |
| Class Y | (1,140,275) | (1,004,002) |
| Net realized short-term gain on investments | ||
| Class A | (17,103) | (665,612) |
| Class B | (108) | (1,306) |
| Class C | (15) | (535) |
| Class M | (50) | (1,823) |
| Class R | (31) | (1,537) |
| Class Y | (11,264) | (608,118) |
| From net realized long-term gain on investments | ||
| Class A | (1,598,362) | (9,984) |
| Class B | (10,058) | (20) |
| Class C | (1,390) | (8) |
| Class M | (4,626) | (27) |
| Class R | (2,895) | (23) |
| Class Y | (1,052,719) | (9,122) |
| Redemption fees (Note 1) | 1,258 | 1,403 |
| Increase (decrease) from capital share transactions (Note 4) | (22,502,346) | 3,792,860 |
| Total increase (decrease) in net assets | (21,523,379) | 2,588,231 |
| NET ASSETS | ||
| Beginning of year | 86,526,148 | 83,937,917 |
| End of year | $ 65,002,769 | $86,526,148 |
| Undistributed net investment income, end of year | $ 1,397,627 | $ 1,393,304 |
The accompanying notes are an integral part of these financial statements.
62
Statement of changes in net assets (Continued)
| Maturity Fund | ||
| DECREASE IN NET ASSETS | ||
| Year ended | Year ended | |
| 7/31/07 | 7/31/06 | |
| Operations: | ||
| Net investment income | $ 1,457,065 | $ 1,420,408 |
| Net realized gain on underlying Putnam Fund shares | 1,247,077 | 726,852 |
| Net unrealized appreciation (depreciation) on underlying Putnam Fund shares | 541,555 | (1,309,034) |
| Net increase in net assets resulting from operations | 3,245,697 | 838,226 |
| Distributions to shareholders (Note 1) | ||
| From ordinary income | ||
| Net investment income | ||
| Class A | (1,151,724) | (946,095) |
| Class B | (5,222) | (2,943) |
| Class C | (579) | (26) |
| Class M | (2,339) | (416) |
| Class R | (2,487) | (183) |
| Class Y | (418,150) | (536,359) |
| Net realized short-term gain on investments | ||
| Class A | (14,502) | (384,904) |
| Class B | (61) | (1,631) |
| Class C | (11) | (13) |
| Class M | (37) | (40) |
| Class R | (32) | (13) |
| Class Y | (4,384) | (186,875) |
| From net realized long-term gain on investments | ||
| Class A | (503,150) | — |
| Class B | (2,123) | — |
| Class C | (370) | — |
| Class M | (1,276) | — |
| Class R | (1,098) | — |
| Class Y | (152,111) | — |
| Redemption fees (Note 1) | 579 | 445 |
| Decrease from capital share transactions (Note 4) | (13,515,229) | (1,202,495) |
| Total decrease in net assets | (12,528,609) | (2,423,322) |
| NET ASSETS | ||
| Beginning of year | 45,224,493 | 47,647,815 |
| End of year | $ 32,695,884 | $45,224,493 |
| Undistributed net investment income, end of year | $ 15,608 | $ 50,188 |
The accompanying notes are an integral part of these financial statements.
63
Financial highlights (For a common share outstanding throughout the period)
| INVESTMENT OPERATIONS: | LESS DISTRIBUTIONS: | RATIOS AND SUPPLEMENTAL DATA: | ||||||||||||
| Net | Total | Ratio of net | ||||||||||||
| Net asset | realized and | Total | From | From | Net asset | return | Net | Ratio of | investment | |||||
| value, | Net | unrealized | from | net | net realized | value, | at net | assets, | expenses to | income (loss) | Portfolio | |||
| beginning | investment | gain (loss) on | investment | investment | gain on | Total | Redemption | end | asset | end of period | average net | to average | turnover | |
| Period ended | of period | income (loss)(a) | investments | operations | income | investments | distributions | fees | of period | value (%)(b) | (in thousands) | assets (%)(c) | net assets (%) | (%) |
| Putnam RetirementReady 2050 Fund | ||||||||||||||
| CLASS A | ||||||||||||||
| July 31, 2007 | $56.44 | .52(d) | 8.65 | 9.17 | (.99) | (1.02) | (2.01) | —(e) | $63.60 | 16.35 | $10,042 | .34(d) | .81(d) | 67.99 |
| July 31, 2006 | 54.36 | .48(d,f) | 3.33 | 3.81 | (.80) | (.93) | (1.73) | —(e) | 56.44 | 7.07 | 2,852 | .35(d) | .86(d,f) | 96.90 |
| July 31, 2005** | 50.00 | (.01)(d) | 4.37 | 4.36 | — | — | — | — | 54.36 | 8.72* | 274 | .09*(d) | (.02)*(d) | 24.76* |
| CLASS B | ||||||||||||||
| July 31, 2007 | $56.18 | .07(d) | 8.59 | 8.66 | (.70) | (1.02) | (1.72) | —(e) | $63.12 | 15.50 | $143 | 1.09(d) | .12(d) | 67.99 |
| July 31, 2006 | 54.25 | .24(d,f) | 3.14 | 3.38 | (.52) | (.93) | (1.45) | —(e) | 56.18 | 6.26 | 45 | 1.10(d) | .43(d,f) | 96.90 |
| July 31, 2005** | 50.00 | (.08)(d) | 4.33 | 4.25 | — | — | — | — | 54.25 | 8.50* | 31 | .28*(d) | (.16)*(d) | 24.76* |
| CLASS C | ||||||||||||||
| July 31, 2007 | $56.21 | (.29)(d) | 8.96 | 8.67 | (.43) | (1.02) | (1.45) | —(e) | $63.43 | 15.49 | $16 | 1.09(d) | (.44)(d) | 67.99 |
| July 31, 2006 | 54.25 | .73(d,f) | 2.66 | 3.39 | (.50) | (.93) | (1.43) | —(e) | 56.21 | 6.29 | 1 | 1.10(d) | 1.31(d,f) | 96.90 |
| July 31, 2005** | 50.00 | (.08)(d) | 4.33 | 4.25 | — | — | — | — | 54.25 | 8.50* | 4 | .28*(d) | (.16)*(d) | 24.76* |
| CLASS M | ||||||||||||||
| July 31, 2007 | $56.28 | (.07)(d) | 8.88 | 8.81 | (.66) | (1.02) | (1.68) | —(e) | $63.41 | 15.74 | $29 | .84(d) | (.11)(d) | 67.99 |
| July 31, 2006 | 54.28 | .45(d,f) | 3.07 | 3.52 | (.59) | (.93) | (1.52) | —(e) | 56.28 | 6.52 | 3 | .85(d) | .78(d,f) | 96.90 |
| July 31, 2005** | 50.00 | (.05)(d) | 4.33 | 4.28 | — | — | — | — | 54.28 | 8.56* | 3 | .22*(d) | (.09)*(d) | 24.76* |
| CLASS R | ||||||||||||||
| July 31, 2007 | $56.37 | .24(d) | 8.76 | 9.00 | (.93) | (1.02) | (1.95) | —(e) | $63.42 | 16.08 | $66 | .59(d) | .38(d) | 67.99 |
| July 31, 2006 | 54.32 | .22(d,f) | 3.43 | 3.65 | (.67) | (.93) | (1.60) | —(e) | 56.37 | 6.75 | 10 | .60(d) | .40(d,f) | 96.90 |
| July 31, 2005** | 50.00 | (.02)(d) | 4.34 | 4.32 | — | — | — | — | 54.32 | 8.64* | 1 | .15*(d) | (.04)*(d) | 24.76* |
| CLASS Y | ||||||||||||||
| July 31, 2007 | $56.57 | .58(d) | 8.77 | 9.35 | (1.06) | (1.02) | (2.08) | —(e) | $63.84 | 16.65 | $5,128 | .09(d) | .90(d) | 67.99 |
| July 31, 2006 | 54.38 | .62(d,f) | 3.34 | 3.96 | (.84) | (.93) | (1.77) | —(e) | 56.57 | 7.34 | 1,047 | .10(d) | 1.09(d,f) | 96.90 |
| July 31, 2005** | 50.00 | .03(d) | 4.35 | 4.38 | — | — | — | — | 54.38 | 8.76* | 134 | .03*(d) | .05*(d) | 24.76* |
See page 84 for Notes to Financial Highlights.
The accompanying notes are an integral part of these financial statements.
| 64 | 65 |
Financial highlights (For a common share outstanding throughout the period) (Continued)
| INVESTMENT OPERATIONS: | LESS DISTRIBUTIONS: | RATIOS AND SUPPLEMENTAL DATA: | ||||||||||||
| Net | Total | Ratio of net | ||||||||||||
| Net asset | realized and | Total | From | From | Net asset | return | Net | Ratio of | investment | |||||
| value, | Net | unrealized | from | net | net realized | value, | at net | assets, | expenses to | income (loss) | Portfolio | |||
| beginning | investment | gain (loss) on | investment | investment | gain on | Total | Redemption | end | asset | end of period | average net | to average | turnover | |
| Period ended | of period | income (loss)(a) | investments | operations | income | investments | distributions | fees | of period | value (%)(b) | (in thousands) | assets (%)(c) | net assets (%) | (%) |
| Putnam RetirementReady 2045 Fund | ||||||||||||||
| CLASS A | ||||||||||||||
| July 31, 2007 | $72.28 | .74(d) | 10.94 | 11.68 | (1.32) | (3.40) | (4.72) | —(e) | $79.24 | 16.36 | $22,590 | .33(d) | .93(d) | 78.06 |
| July 31, 2006 | 70.75 | .83(d,f) | 4.42 | 5.25 | (1.20) | (2.52) | (3.72) | —(e) | 72.28 | 7.50 | 15,085 | .35(d) | 1.14(d,f) | 55.76 |
| July 31, 2005*** | 63.42 | .28(d) | 7.63 | 7.91 | (.58) | — | (.58) | — | 70.75 | 12.51* | 8,136 | .26*(d) | .41*(d) | 42.17* |
| CLASS B | ||||||||||||||
| July 31, 2007 | $69.98 | .12(d) | 10.60 | 10.72 | (.96) | (3.40) | (4.36) | —(e) | $76.34 | 15.49 | $158 | 1.08(d) | .16(d) | 78.06 |
| July 31, 2006 | 68.83 | (.01)(d,f) | 4.59 | 4.58 | (.91) | (2.52) | (3.43) | —(e) | 69.98 | 6.71 | 81 | 1.10(d) | (.01)(d,f) | 55.76 |
| July 31, 2005*** | 62.00 | (.24)(d) | 7.58 | 7.34 | (.51) | — | (.51) | — | 68.83 | 11.87* | 17 | .82*(d) | (.37)*(d) | 42.17* |
| CLASS C | ||||||||||||||
| July 31, 2007 | $70.27 | .09(d) | 10.67 | 10.76 | (.78) | (3.40) | (4.18) | —(e) | $76.85 | 15.48 | $17 | 1.08(d) | .12(d) | 78.06 |
| July 31, 2006 | 68.84 | .32(d,f) | 4.26 | 4.58 | (.63) | (2.52) | (3.15) | —(e) | 70.27 | 6.70 | 9 | 1.10(d) | .46(d,f) | 55.76 |
| July 31, 2005*** | 62.00 | (.26)(d) | 7.61 | 7.35 | (.51) | — | (.51) | — | 68.84 | 11.89* | 10 | .82*(d) | (.39)*(d) | 42.17* |
| CLASS M | ||||||||||||||
| July 31, 2007 | $70.38 | .42(d) | 10.57 | 10.99 | (.77) | (3.40) | (4.17) | —(e) | $77.20 | 15.79 | $1 | .83(d) | .54(d) | 78.06 |
| July 31, 2006 | 68.94 | .51(d,f) | 4.26 | 4.77 | (.81) | (2.52) | (3.33) | —(e) | 70.38 | 6.97 | 8 | .85(d) | .72(d,f) | 55.76 |
| July 31, 2005*** | 62.00 | (.06)(d) | 7.54 | 7.48 | (.54) | — | (.54) | — | 68.94 | 12.09* | 9 | .64*(d) | (.09)*(d) | 42.17* |
| CLASS R | ||||||||||||||
| July 31, 2007 | $73.67 | .42(d) | 11.28 | 11.70 | (1.38) | (3.40) | (4.78) | —(e) | $80.59 | 16.09 | $193 | .58(d) | .52(d) | 78.06 |
| July 31, 2006 (1) | 72.20 | (.06)(d,f) | 1.53 | 1.47 | — | — | — | —(e) | 73.67 | 2.04* | 19 | .36*(d) | (.09)*(d,f) | 55.76 |
| December 19, 2005 (2) | 69.06 | 1.48(d) | 1.66 | 3.14 | — | — | — | — | 72.20 | 4.55* | — | .23*(d) | 2.12*(d) | 36.08* |
| July 31, 2005*** | 62.00 | .30(d) | 7.32 | 7.62 | (.56) | — | (.56) | — | 69.06 | 12.33* | 1 | .45*(d) | .45*(d) | 42.17* |
| CLASS Y | ||||||||||||||
| July 31, 2007 | $78.94 | 1.08(d) | 11.90 | 12.98 | (1.46) | (3.40) | (4.86) | —(e) | $87.06 | 16.66 | $12,015 | .08(d) | 1.25(d) | 78.06 |
| July 31, 2006 | 76.88 | 1.09(d,f) | 4.82 | 5.91 | (1.33) | (2.52) | (3.85) | —(e) | 78.94 | 7.77 | 10,378 | .10(d) | 1.37(d,f) | 36.08 |
| July 31, 2005*** | 68.76 | .46(d) | 8.26 | 8.72 | (.60) | — | (.60) | — | 76.88 | 12.72* | 7,926 | .07*(d) | .63*(d) | 42.17* |
See page 84 for Notes to Financial Highlights.
The accompanying notes are an integral part of these financial statements.
| 66 | 67 |
Financial highlights (For a common share outstanding throughout the period) (Continued)
| INVESTMENT OPERATIONS: | LESS DISTRIBUTIONS: | RATIOS AND SUPPLEMENTAL DATA: | ||||||||||||
| Net | Total | Ratio of net | ||||||||||||
| Net asset | realized and | Total | From | From | Net asset | return | Net | Ratio of | investment | |||||
| value, | Net | unrealized | from | net | net realized | value, | at net | assets, | expenses to | income (loss) | Portfolio | |||
| beginning | investment | gain (loss) on | investment | investment | gain on | Total | Redemption | end | asset | end of period | average net | to average | turnover | |
| Period ended | of period | income (loss)(a) | investments | operations | income | investments | distributions | fees | of period | value (%)(b) | (in thousands) | assets (%)(c) | net assets (%) | (%) |
| Putnam RetirementReady 2040 Fund | ||||||||||||||
| CLASS A | ||||||||||||||
| July 31, 2007 | $72.11 | .87(d) | 10.34 | 11.21 | (1.39) | (3.56) | (4.95) | —(e) | $78.37 | 15.77 | $30,802 | .33(d) | 1.11(d) | 60.17 |
| July 31, 2006 | 70.81 | .89(d,f) | 4.28 | 5.17 | (1.18) | (2.69) | (3.87) | —(e) | 72.11 | 7.38 | 21,829 | .35(d) | 1.24(d,f) | 54.52 |
| July 31, 2005*** | 63.50 | .32(d) | 7.51 | 7.83 | (.52) | — | (.52) | —(e) | 70.81 | 12.37* | 12,230 | .26*(d) | .48*(d) | 39.79* |
| CLASS B | ||||||||||||||
| July 31, 2007 | $69.82 | .23(d) | 10.04 | 10.27 | (1.10) | (3.56) | (4.66) | —(e) | $75.43 | 14.91 | $278 | 1.08(d) | .30(d) | 60.17 |
| July 31, 2006 | 68.82 | .15(d,f) | 4.34 | 4.49 | (.80) | (2.69) | (3.49) | —(e) | 69.82 | 6.58 | 127 | 1.10(d) | .22(d,f) | 54.52 |
| July 31, 2005*** | 62.00 | (.25)(d) | 7.52 | 7.27 | (.45) | — | (.45) | —(e) | 68.82 | 11.75* | 37 | .82*(d) | (.38)*(d) | 39.79* |
| CLASS C | ||||||||||||||
| July 31, 2007 | $70.00 | .03(d) | 10.28 | 10.31 | (1.06) | (3.56) | (4.62) | —(e) | $75.69 | 14.92 | $18 | 1.08(d) | .05(d) | 60.17 |
| July 31, 2006 | 68.83 | .32(d,f) | 4.18 | 4.50 | (.64) | (2.69) | (3.33) | —(e) | 70.00 | 6.60 | 2 | 1.10(d) | .46(d,f) | 54.52 |
| July 31, 2005*** | 62.00 | .06(d) | 7.22 | 7.28 | (.45) | — | (.45) | —(e) | 68.83 | 11.77* | 1 | .82*(d) | .09*(d) | 39.79* |
| CLASS M | ||||||||||||||
| July 31, 2007 | $70.03 | .57(d) | 9.93 | 10.50 | (1.16) | (3.56) | (4.72) | —(e) | $75.81 | 15.19 | $14 | .83(d) | .76(d) | 60.17 |
| July 31, 2006 | 68.88 | .45(d,f) | 4.22 | 4.67 | (.83) | (2.69) | (3.52) | —(e) | 70.03 | 6.85 | 23 | .85(d) | .64(d,f) | 54.52 |
| July 31, 2005*** | 62.00 | .07(d) | 7.33 | 7.40 | (.52) | — | (.52) | —(e) | 68.88 | 11.96* | 11 | .64*(d) | .11*(d) | 39.79* |
| CLASS R | ||||||||||||||
| July 31, 2007 | $73.56 | .61(d) | 10.63 | 11.24 | (1.34) | (3.56) | (4.90) | —(e) | $79.90 | 15.49 | $158 | .58(d) | .75(d) | 60.17 |
| July 31, 2006 (1) | 72.11 | .04(d,f) | 1.41 | 1.45 | — | — | — | —(e) | 73.56 | 2.01* | 46 | .36*(d) | .05*(d,f) | 54.52 |
| December 19, 2005 (2) | 69.04 | 1.47(d) | 1.60 | 3.07 | — | — | — | — | 72.11 | 4.45* | — | .23*(d) | 2.10*(d) | 39.73* |
| July 31, 2005*** | 62.00 | .31(d) | 7.23 | 7.54 | (.50) | — | (.50) | —(e) | 69.04 | 12.20* | 1 | .45*(d) | .47*(d) | 39.79* |
| CLASS Y | ||||||||||||||
| July 31, 2007 | $78.47 | 1.19(d) | 11.24 | 12.43 | (1.54) | (3.56) | (5.10) | —(e) | $85.80 | 16.06 | $16,298 | .08(d) | 1.39(d) | 60.17 |
| July 31, 2006 | 76.67 | 1.15(d,f) | 4.65 | 5.80 | (1.31) | (2.69) | (4.00) | —(e) | 78.47 | 7.66 | 12,548 | .10(d) | 1.46(d,f) | 54.52 |
| July 31, 2005*** | 68.61 | .50(d) | 8.10 | 8.60 | (.54) | — | (.54) | —(e) | 76.67 | 12.58* | 8,983 | .07*(d) | .68*(d) | 39.79* |
See page 84 for Notes to Financial Highlights.
The accompanying notes are an integral part of these financial statements.
| 68 | 69 |
Financial highlights (For a common share outstanding throughout the period) (Continued)
| INVESTMENT OPERATIONS: | LESS DISTRIBUTIONS: | RATIOS AND SUPPLEMENTAL DATA: | ||||||||||||
| Net | Total | Ratio of net | ||||||||||||
| Net asset | realized and | Total | From | From | Net asset | return | Net | Ratio of | investment | |||||
| value, | Net | unrealized | from | net | net realized | value, | at net | assets, | expenses to | income (loss) | Portfolio | |||
| beginning | investment | gain (loss) on | investment | investment | gain on | Total | Redemption | end | asset | end of period | average net | to average | turnover | |
| Period ended | of period | income (loss)(a) | investments | operations | income | investments | distributions | fees | of period | value (%)(b) | (in thousands) | assets (%)(c) | net assets (%) | (%) |
| Putnam RetirementReady 2035 Fund | ||||||||||||||
| CLASS A | ||||||||||||||
| July 31, 2007 | $70.33 | .98(d) | 9.53 | 10.51 | (1.46) | (3.90) | (5.36) | —(e) | $75.48 | 15.18 | $43,169 | .33(d) | 1.30(d) | 58.16 |
| July 31, 2006 | 69.50 | 1.00(d,f) | 3.73 | 4.73 | (1.25) | (2.65) | (3.90) | —(e) | 70.33 | 6.87 | 31,513 | .35(d) | 1.41(d,f) | 51.70 |
| July 31, 2005*** | 62.61 | .38(d) | 6.96 | 7.34 | (.45) | — | (.45) | — | 69.50 | 11.76* | 21,274 | .26*(d) | .58*(d) | 36.45* |
| CLASS B | ||||||||||||||
| July 31, 2007 | $67.68 | .40(d) | 9.16 | 9.56 | (1.09) | (3.90) | (4.99) | —(e) | $72.25 | 14.32 | $510 | 1.08(d) | .55(d) | 58.16 |
| July 31, 2006 | 67.35 | .38(d,f) | 3.68 | 4.06 | (1.08) | (2.65) | (3.73) | —(e) | 67.68 | 6.08 | 308 | 1.10(d) | .55(d,f) | 51.70 |
| July 31, 2005*** | 61.00 | (.08)(d) | 6.87 | 6.79 | (.44) | — | (.44) | — | 67.35 | 11.15* | 67 | .82*(d) | (.13)*(d) | 36.45* |
| CLASS C | ||||||||||||||
| July 31, 2007 | $68.13 | .42(d) | 9.19 | 9.61 | (1.42) | (3.90) | (5.32) | —(e) | $72.42 | 14.31 | $83 | 1.08(d) | .58(d) | 58.16 |
| July 31, 2006 | 67.41 | .18(d,f) | 3.92 | 4.10 | (.73) | (2.65) | (3.38) | —(e) | 68.13 | 6.13 | 7 | 1.10(d) | .26(d,f) | 51.70 |
| July 31, 2005*** | 61.00 | .10(d) | 6.69 | 6.79 | (.38) | — | (.38) | — | 67.41 | 11.15* | 1 | .82*(d) | .15*(d) | 36.45* |
| CLASS M | ||||||||||||||
| July 31, 2007 | $68.10 | .54(d) | 9.26 | 9.80 | (1.16) | (3.90) | (5.06) | —(e) | $72.84 | 14.60 | $63 | .83(d) | .74(d) | 58.16 |
| July 31, 2006 | 67.47 | .56(d,f) | 3.69 | 4.25 | (.97) | (2.65) | (3.62) | —(e) | 68.10 | 6.35 | 37 | .85(d) | .82(d,f) | 51.70 |
| July 31, 2005*** | 61.00 | (.01)(d) | 6.92 | 6.91 | (.44) | — | (.44) | — | 67.47 | 11.35* | 20 | .64*(d) | (.02)*(d) | 36.45* |
| CLASS R | ||||||||||||||
| July 31, 2007 | $69.31 | .63(d) | 9.53 | 10.16 | (1.51) | (3.90) | (5.41) | —(e) | $74.06 | 14.89 | $302 | .58(d) | .83(d) | 58.16 |
| July 31, 2006 | 67.61 | .65(d,f) | 3.70 | 4.35 | — | (2.65) | (2.65) | —(e) | 69.31 | 6.48 | 25 | .60(d) | .96(d,f) | 51.70 |
| July 31, 2005*** | 61.00 | .35(d) | 6.70 | 7.05 | (.44) | — | (.44) | — | 67.61 | 11.58* | 1 | .45*(d) | .52*(d) | 36.45* |
| CLASS Y | ||||||||||||||
| July 31, 2007 | $76.67 | 1.30(d) | 10.38 | 11.68 | (1.61) | (3.90) | (5.51) | —(e) | $82.84 | 15.47 | $29,456 | .08(d) | 1.57(d) | 58.16 |
| July 31, 2006 | 75.37 | 1.25(d,f) | 4.09 | 5.34 | (1.39) | (2.65) | (4.04) | —(e) | 76.67 | 7.16 | 26,650 | .10(d) | 1.63(d,f) | 51.70 |
| July 31, 2005*** | 67.76 | .56(d) | 7.52 | 8.08 | (.47) | — | (.47) | — | 75.37 | 11.96* | 20,730 | .07*(d) | .77*(d) | 36.45* |
See page 84 for Notes to Financial Highlights.
The accompanying notes are an integral part of these financial statements.
| 70 | 71 |
Financial highlights (For a common share outstanding throughout the period) (Continued)
| INVESTMENT OPERATIONS: | LESS DISTRIBUTIONS: | RATIOS AND SUPPLEMENTAL DATA: | ||||||||||||
| Net | Total | Ratio of net | ||||||||||||
| Net asset | realized and | Total | From | From | Net asset | return | Net | Ratio of | investment | |||||
| value, | Net | unrealized | from | net | net realized | value, | at net | assets, | expenses to | income (loss) | Portfolio | |||
| beginning | investment | gain (loss) on | investment | investment | gain on | Total | Redemption | end | asset | end of period | average net | to average | turnover | |
| Period ended | of period | income (loss)(a) | investments | operations | income | investments | distributions | fees | of period | value (%)(b) | (in thousands) | assets (%)(c) | net assets (%) | (%) |
| Putnam RetirementReady 2030 Fund | ||||||||||||||
| CLASS A | ||||||||||||||
| July 31, 2007 | $69.46 | 1.11(d) | 8.84 | 9.95 | (1.52) | (3.76) | (5.28) | —(e) | $74.13 | 14.57 | $55,378 | .32(d) | 1.50(d) | 65.00 |
| July 31, 2006 | 68.65 | 1.10(d,f) | 3.36 | 4.46 | (1.28) | (2.37) | (3.65) | —(e) | 69.46 | 6.57 | 46,153 | .35(d) | 1.57(d,f) | 48.81 |
| July 31, 2005*** | 62.16 | .44(d) | 6.47 | 6.91 | (.42) | — | (.42) | — | 68.65 | 11.14* | 32,720 | .26*(d) | .66*(d) | 34.59* |
| CLASS B | ||||||||||||||
| July 31, 2007 | $67.56 | .53(d) | 8.60 | 9.13 | (1.12) | (3.76) | (4.88) | —(e) | $71.81 | 13.70 | $609 | 1.07(d) | .74(d) | 65.00 |
| July 31, 2006 | 67.07 | .59(d,f) | 3.25 | 3.84 | (.98) | (2.37) | (3.35) | —(e) | 67.56 | 5.77 | 302 | 1.10(d) | .86(d,f) | 48.81 |
| July 31, 2005*** | 61.00 | (.13)(d) | 6.55 | 6.42 | (.35) | — | (.35) | — | 67.07 | 10.54* | 225 | .82*(d) | (.20)*(d) | 34.59* |
| CLASS C | ||||||||||||||
| July 31, 2007 | $67.43 | .33(d) | 8.80 | 9.13 | (.63) | (3.76) | (4.39) | —(e) | $72.17 | 13.71 | $90 | 1.07(d) | .45(d) | 65.00 |
| July 31, 2006 | 67.06 | .64(d,f) | 3.20 | 3.84 | (1.10) | (2.37) | (3.47) | —(e) | 67.43 | 5.77 | 43 | 1.10(d) | .95(d,f) | 48.81 |
| July 31, 2005*** | 61.00 | (.06)(d) | 6.47 | 6.41 | (.35) | — | (.35) | — | 67.06 | 10.52* | 22 | .82*(d) | (.10)*(d) | 34.59* |
| CLASS M | ||||||||||||||
| July 31, 2007 | $67.73 | .75(d) | 8.58 | 9.33 | (1.38) | (3.76) | (5.14) | —(e) | $71.92 | 13.99 | $776 | .82(d) | 1.04(d) | 65.00 |
| July 31, 2006 | 67.14 | .37(d,f) | 3.64 | 4.01 | (1.05) | (2.37) | (3.42) | —(e) | 67.73 | 6.03 | 604 | .85(d) | .54(d,f) | 48.81 |
| July 31, 2005*** | 61.00 | .02(d) | 6.52 | 6.54 | (.40) | — | (.40) | — | 67.14 | 10.74* | 43 | .64*(d) | .03*(d) | 34.59* |
| CLASS R | ||||||||||||||
| July 31, 2007 | $67.75 | .80(d) | 8.72 | 9.52 | (1.43) | (3.76) | (5.19) | —(e) | $72.08 | 14.27 | $246 | .57(d) | 1.10(d) | 65.00 |
| July 31, 2006 | 67.27 | .87(d,f) | 3.31 | 4.18 | (1.33) | (2.37) | (3.70) | —(e) | 67.75 | 6.29 | 81 | .60(d) | 1.28(d,f) | 48.81 |
| July 31, 2005*** | 61.00 | .39(d) | 6.28 | 6.67 | (.40) | — | (.40) | — | 67.27 | 10.96* | 1 | .45*(d) | .58*(d) | 34.59* |
| CLASS Y | ||||||||||||||
| July 31, 2007 | $75.11 | 1.43(d) | 9.54 | 10.97 | (1.67) | (3.76) | (5.43) | —(e) | $80.65 | 14.85 | $36,228 | .07(d) | 1.78(d) | 65.00 |
| July 31, 2006 | 73.90 | 1.35(d,f) | 3.65 | 5.00 | (1.42) | (2.37) | (3.79) | —(e) | 75.11 | 6.84 | 42,547 | .10(d) | 1.79(d,f) | 48.81 |
| July 31, 2005*** | 66.78 | .57(d) | 6.99 | 7.56 | (.44) | — | (.44) | — | 73.90 | 11.35* | 37,340 | .07*(d) | .81*(d) | 34.59* |
See page 84 for Notes to Financial Highlights.
The accompanying notes are an integral part of these financial statements.
| 72 | 73 |
Financial highlights (For a common share outstanding throughout the period) (Continued)
| INVESTMENT OPERATIONS: | LESS DISTRIBUTIONS: | RATIOS AND SUPPLEMENTAL DATA: | ||||||||||||
| Net | Total | Ratio of net | ||||||||||||
| Net asset | realized and | Total | From | From | Net asset | return | Net | Ratio of | investment | |||||
| value, | Net | unrealized | from | net | net realized | value, | at net | assets, | expenses to | income (loss) | Portfolio | |||
| beginning | investment | gain (loss) on | investment | investment | gain on | Total | Redemption | end | asset | end of period | average net | to average | turnover | |
| Period ended | of period | income (loss)(a) | investments | operations | income | investments | distributions | fees | of period | value (%)(b) | (in thousands) | assets (%)(c) | net assets (%) | (%) |
| Putnam RetirementReady 2025 Fund | ||||||||||||||
| CLASS A | ||||||||||||||
| July 31, 2007 | $72.98 | 1.29(d) | 8.69 | 9.98 | (1.64) | (4.30) | (5.94) | —(e) | $77.02 | 13.91 | $68,996 | .32(d) | 1.67(d) | 62.81 |
| July 31, 2006 | 72.26 | 1.27(d,f) | 3.15 | 4.42 | (1.36) | (2.34) | (3.70) | —(e) | 72.98 | 6.19 | 61,670 | .35(d) | 1.74(d,f) | 53.14 |
| July 31, 2005*** | 65.75 | .52(d) | 6.39 | 6.91 | (.40) | — | (.40) | —(e) | 72.26 | 10.53* | 48,529 | .26*(d) | .75*(d) | 25.48* |
| CLASS B | ||||||||||||||
| July 31, 2007 | $70.26 | .67(d) | 8.37 | 9.04 | (1.28) | (4.30) | (5.58) | —(e) | $73.72 | 13.06 | $1,144 | 1.07(d) | .90(d) | 62.81 |
| July 31, 2006 | 69.94 | .59(d,f) | 3.16 | 3.75 | (1.09) | (2.34) | (3.43) | —(e) | 70.26 | 5.40 | 717 | 1.10(d) | .84(d,f) | 53.14 |
| July 31, 2005*** | 64.00 | (.05)(d) | 6.38 | 6.33 | (.39) | — | (.39) | —(e) | 69.94 | 9.91* | 211 | .82*(d) | (.08)*(d) | 25.48* |
| CLASS C | ||||||||||||||
| July 31, 2007 | $70.43 | .68(d) | 8.39 | 9.07 | (1.21) | (4.30) | (5.51) | —(e) | $73.99 | 13.07 | $181 | 1.07(d) | .91(d) | 62.81 |
| July 31, 2006 | 70.00 | .53(d,f) | 3.22 | 3.75 | (.98) | (2.34) | (3.32) | —(e) | 70.43 | 5.41 | 103 | 1.10(d) | .74(d,f) | 53.14 |
| July 31, 2005*** | 64.00 | (.04)(d) | 6.36 | 6.32 | (.32) | — | (.32) | —(e) | 70.00 | 9.89* | 45 | .82*(d) | (.05)*(d) | 25.48* |
| CLASS M | ||||||||||||||
| July 31, 2007 | $70.55 | .87(d) | 8.40 | 9.27 | (1.30) | (4.30) | (5.60) | —(e) | $74.22 | 13.34 | $295 | .82(d) | 1.16(d) | 62.81 |
| July 31, 2006 | 70.06 | .84(d,f) | 3.09 | 3.93 | (1.10) | (2.34) | (3.44) | —(e) | 70.55 | 5.66 | 264 | .85(d) | 1.19(d,f) | 53.14 |
| July 31, 2005*** | 64.00 | .11(d) | 6.35 | 6.46 | (.40) | — | (.40) | —(e) | 70.06 | 10.12* | 173 | .64*(d) | .17*(d) | 25.48* |
| CLASS R | ||||||||||||||
| July 31, 2007 | $70.70 | .98(d) | 8.50 | 9.48 | (1.66) | (4.30) | (5.96) | —(e) | $74.22 | 13.64 | $284 | .57(d) | 1.31(d) | 62.81 |
| July 31, 2006 | 70.21 | .65(d,f) | 3.47 | 4.12 | (1.29) | (2.34) | (3.63) | —(e) | 70.70 | 5.93 | 111 | .60(d) | .97(d,f) | 53.14 |
| July 31, 2005*** | 64.00 | .42(d) | 6.17 | 6.59 | (.38) | — | (.38) | —(e) | 70.21 | 10.31* | 1 | .45*(d) | .64*(d) | 25.48* |
| CLASS Y | ||||||||||||||
| July 31, 2007 | $73.28 | 1.52(d) | 8.70 | 10.22 | (1.81) | (4.30) | (6.11) | —(e) | $77.39 | 14.20 | $51,638 | .07(d) | 1.96(d) | 62.81 |
| July 31, 2006 | 72.50 | 1.42(d,f) | 3.21 | 4.63 | (1.51) | (2.34) | (3.85) | —(e) | 73.28 | 6.47 | 59,810 | .10(d) | 1.93(d,f) | 53.14 |
| July 31, 2005*** | 65.87 | .63(d) | 6.42 | 7.05 | (.42) | — | (.42) | —(e) | 72.50 | 10.72* | 60,668 | .07*(d) | .90*(d) | 25.48* |
See page 84 for Notes to Financial Highlights.
The accompanying notes are an integral part of these financial statements.
| 74 | 75 |
Financial highlights (For a common share outstanding throughout the period) (Continued)
| INVESTMENT OPERATIONS: | LESS DISTRIBUTIONS: | RATIOS AND SUPPLEMENTAL DATA: | ||||||||||||
| Net | Total | Ratio of net | ||||||||||||
| Net asset | realized and | Total | From | From | Net asset | return | Net | Ratio of | investment | |||||
| value, | Net | unrealized | from | net | net realized | value, | at net | assets, | expenses to | income (loss) | Portfolio | |||
| beginning | investment | gain (loss) on | investment | investment | gain on | Total | Redemption | end | asset | end of period | average net | to average | turnover | |
| Period ended | of period | income (loss)(a) | investments | operations | income | investments | distributions | fees | of period | value (%)(b) | (in thousands) | assets (%)(c) | net assets (%) | (%) |
| Putnam RetirementReady 2020 Fund | ||||||||||||||
| CLASS A | ||||||||||||||
| July 31, 2007 | $66.20 | 1.39(d) | 6.67 | 8.06 | (1.68) | (3.38) | (5.06) | —(e) | $69.20 | 12.36 | $88,759 | .32(d) | 1.99(d) | 56.03 |
| July 31, 2006 | 66.06 | 1.28(d,f) | 1.90 | 3.18 | (1.33) | (1.71) | (3.04) | —(e) | 66.20 | 4.86 | 81,232 | .35(d) | 1.93(d,f) | 46.91 |
| July 31, 2005*** | 60.69 | .54(d) | 5.16 | 5.70 | (.33) | — | (.33) | — | 66.06 | 9.41* | 53,180 | .26*(d) | .85*(d) | 30.16* |
| CLASS B | ||||||||||||||
| July 31, 2007 | $64.77 | .84(d) | 6.54 | 7.38 | (1.34) | (3.38) | (4.72) | —(e) | $67.43 | 11.53 | $750 | 1.07(d) | 1.23(d) | 56.03 |
| July 31, 2006 | 64.94 | .77(d,f) | 1.87 | 2.64 | (1.10) | (1.71) | (2.81) | —(e) | 64.77 | 4.08 | 543 | 1.10(d) | 1.18(d,f) | 46.91 |
| July 31, 2005*** | 60.00 | .08(d) | 5.18 | 5.26 | (.32) | — | (.32) | — | 64.94 | 8.79* | 241 | .82*(d) | .12*(d) | 30.16* |
| CLASS C | ||||||||||||||
| July 31, 2007 | $64.89 | .80(d) | 6.60 | 7.40 | (1.14) | (3.38) | (4.52) | —(e) | $67.77 | 11.53 | $178 | 1.07(d) | 1.16(d) | 56.03 |
| July 31, 2006 | 64.97 | .76(d,f) | 1.87 | 2.63 | (1.00) | (1.71) | (2.71) | —(e) | 64.89 | 4.06 | 109 | 1.10(d) | 1.16(d,f) | 46.91 |
| July 31, 2005** | 60.00 | .08(d) | 5.19 | 5.27 | (.30) | — | (.30) | — | 64.97 | 8.79* | 61 | .82*(d) | .12*(d) | 30.16* |
| CLASS M | ||||||||||||||
| July 31, 2007 | $64.99 | .99(d) | 6.60 | 7.59 | (1.41) | (3.38) | (4.79) | —(e) | $67.79 | 11.82 | $1,056 | .82(d) | 1.44(d) | 56.03 |
| July 31, 2006 | 65.05 | .97(d,f) | 1.83 | 2.80 | (1.15) | (1.71) | (2.86) | —(e) | 64.99 | 4.34 | 535 | .85(d) | 1.49(d,f) | 46.91 |
| July 31, 2005*** | 60.00 | .19(d) | 5.20 | 5.39 | (.34) | — | (.34) | — | 65.05 | 9.00* | 276 | .64*(d) | .30*(d) | 30.16* |
| CLASS R | ||||||||||||||
| July 31, 2007 | $65.08 | 1.16(d) | 6.60 | 7.76 | (1.58) | (3.38) | (4.96) | —(e) | $67.88 | 12.09 | $232 | .57(d) | 1.69(d) | 56.03 |
| July 31, 2006 | 65.23 | 1.18(d,f) | 1.81 | 2.99 | (1.43) | (1.71) | (3.14) | —(e) | 65.08 | 4.62 | 102 | .60(d) | 1.81(d,f) | 46.91 |
| July 31, 2005*** | 60.00 | .44(d) | 5.10 | 5.54 | (.31) | — | (.31) | — | 65.23 | 9.25* | 1 | .45*(d) | .71*(d) | 30.16* |
| CLASS Y | ||||||||||||||
| July 31, 2007 | $70.95 | 1.69(d) | 7.14 | 8.83 | (1.83) | (3.38) | (5.21) | —(e) | $74.57 | 12.63 | $52,519 | .07(d) | 2.26(d) | 56.03 |
| July 31, 2006 | 70.54 | 1.56(d,f) | 2.03 | 3.59 | (1.47) | (1.71) | (3.18) | —(e) | 70.95 | 5.13 | 73,375 | .10(d) | 2.18(d,f) | 46.91 |
| July 31, 2005*** | 64.69 | .68(d) | 5.52 | 6.20 | (.35) | — | (.35) | — | 70.54 | 9.60* | 66,682 | .07*(d) | 1.01*(d) | 30.16* |
See page 84 for Notes to Financial Highlights.
The accompanying notes are an integral part of these financial statements.
| 76 | 77 |
Financial highlights (For a common share outstanding throughout the period) (Continued)
| INVESTMENT OPERATIONS: | LESS DISTRIBUTIONS: | RATIOS AND SUPPLEMENTAL DATA: | ||||||||||||
| Net | Total | Ratio of net | ||||||||||||
| Net asset | realized and | Total | From | From | Net asset | return | Net | Ratio of | investment | |||||
| value, | Net | unrealized | from | net | net realized | value, | at net | assets, | expenses to | income (loss) | Portfolio | |||
| beginning | investment | gain (loss) on | investment | investment | gain on | Total | Redemption | end | asset | end of period | average net | to average | turnover | |
| Period ended | of period | income (loss)(a) | investments | operations | income | investments | distributions | fees | of period | value (%)(b) | (in thousands) | assets (%)(c) | net assets (%) | (%) |
| Putnam RetirementReady 2015 Fund | ||||||||||||||
| CLASS A | ||||||||||||||
| July 31, 2007 | $65.72 | 1.74(d) | 4.98 | 6.72 | (1.73) | (2.82) | (4.55) | —(e) | $67.89 | 10.37 | $83,238 | .32(d) | 2.55(d) | 68.94 |
| July 31, 2006 | 67.28 | 1.54(d,f) | .93 | 2.47 | (1.60) | (2.43) | (4.03) | —(e) | 65.72 | 3.71 | 66,033 | .35(d) | 2.31(d,f) | 62.70 |
| July 31, 2005*** | 62.62 | .66(d) | 4.28 | 4.94 | (.28) | — | (.28) | — | 67.28 | 7.90* | 56,457 | .26*(d) | 1.01*(d) | 26.37* |
| CLASS B | ||||||||||||||
| July 31, 2007 | $64.39 | 1.20(d) | 4.88 | 6.08 | (1.43) | (2.82) | (4.25) | —(e) | $66.22 | 9.55 | $781 | 1.07(d) | 1.80(d) | 68.94 |
| July 31, 2006 | 66.27 | .95(d,f) | 1.00 | 1.95 | (1.40) | (2.43) | (3.83) | —(e) | 64.39 | 2.95 | 372 | 1.10(d) | 1.46(d,f) | 62.70 |
| July 31, 2005*** | 62.00 | .22(d) | 4.30 | 4.52 | (.25) | — | (.25) | — | 66.27 | 7.30* | 165 | .82*(d) | .35*(d) | 26.37* |
| CLASS C | ||||||||||||||
| July 31, 2007 | $64.37 | 1.18(d) | 4.89 | 6.07 | (1.27) | (2.82) | (4.09) | —(e) | $66.35 | 9.54 | $168 | 1.07(d) | 1.77(d) | 68.94 |
| July 31, 2006 | 66.25 | 1.01(d,f) | .93 | 1.94 | (1.39) | (2.43) | (3.82) | —(e) | 64.37 | 2.93 | 231 | 1.10(d) | 1.56(d,f) | 62.70 |
| July 31, 2005*** | 62.00 | .25(d) | 4.28 | 4.53 | (.28) | — | (.28) | — | 66.25 | 7.32* | 90 | .82*(d) | .38*(d) | 26.37* |
| CLASS M | ||||||||||||||
| July 31, 2007 | $64.67 | 1.37(d) | 4.90 | 6.27 | (1.37) | (2.82) | (4.19) | —(e) | $66.75 | 9.82 | $156 | .82(d) | 2.03(d) | 68.94 |
| July 31, 2006 | 66.38 | 1.24(d,f) | .87 | 2.11 | (1.39) | (2.43) | (3.82) | —(e) | 64.67 | 3.19 | 139 | .85(d) | 1.89(d,f) | 62.70 |
| July 31, 2005*** | 62.00 | .35(d) | 4.30 | 4.65 | (.27) | — | (.27) | — | 66.38 | 7.52* | 142 | .64*(d) | .54*(d) | 26.37* |
| CLASS R | ||||||||||||||
| July 31, 2007 | $64.74 | 1.48(d) | 4.97 | 6.45 | (1.58) | (2.82) | (4.40) | —(e) | $66.79 | 10.09 | $112 | .57(d) | 2.16(d) | 68.94 |
| July 31, 2006 | 66.54 | 1.82(d,f) | .50 | 2.32 | (1.69) | (2.43) | (4.12) | —(e) | 64.74 | 3.51 | 4 | .60(d) | 2.82(d,f) | 62.70 |
| July 31, 2005*** | 62.00 | .55(d) | 4.25 | 4.80 | (.26) | — | (.26) | — | 66.54 | 7.75* | 1 | .45*(d) | .84*(d) | 26.37* |
| CLASS Y | ||||||||||||||
| July 31, 2007 | $65.95 | 1.90(d) | 5.01 | 6.91 | (1.86) | (2.82) | (4.68) | —(e) | $68.18 | 10.64 | $45,725 | .07(d) | 2.78(d) | 68.94 |
| July 31, 2006 | 67.48 | 1.67(d,f) | .98 | 2.65 | (1.75) | (2.43) | (4.18) | —(e) | 65.95 | 3.97 | 63,487 | .10(d) | 2.49(d,f) | 62.70 |
| July 31, 2005*** | 62.71 | .77(d) | 4.30 | 5.07 | (.30) | — | (.30) | — | 67.48 | 8.10* | 84,103 | .07*(d) | 1.18*(d) | 26.37* |
See page 84 for Notes to Financial Highlights.
The accompanying notes are an integral part of these financial statements.
| 78 | 79 |
Financial highlights (For a common share outstanding throughout the period) (Continued)
| INVESTMENT OPERATIONS: | LESS DISTRIBUTIONS: | RATIOS AND SUPPLEMENTAL DATA: | ||||||||||||
| Net | Total | Ratio of net | ||||||||||||
| Net asset | realized and | Total | From | From | Net asset | return | Net | Ratio of | investment | |||||
| value, | Net | unrealized | from | net | net realized | value, | at net | assets, | expenses to | income (loss) | Portfolio | |||
| beginning | investment | gain (loss) on | investment | investment | gain on | Total | Redemption | end | asset | end of period | average net | to average | turnover | |
| Period ended | of period | income (loss)(a) | investments | operations | income | investments | distributions | fees | of period | value (%)(b) | (in thousands) | assets (%)(c) | net assets (%) | (%) |
| Putnam RetirementReady 2010 Fund | ||||||||||||||
| CLASS A | ||||||||||||||
| July 31, 2007 | $58.69 | 1.96(d) | 2.72 | 4.68 | (2.08) | (2.08) | (4.16) | —(e) | $59.21 | 8.11 | $40,696 | .31(d) | 3.29(d) | 56.75 |
| July 31, 2006 | 59.72 | 1.68(d,f) | (.17) | 1.51 | (1.52) | (1.02) | (2.54) | —(e) | 58.69 | 2.54 | 44,579 | .34(d) | 2.84(d,f) | 61.79 |
| July 31, 2005*** | 56.79 | .73(d) | 2.42 | 3.15 | (.22) | — | (.22) | — | 59.72 | 5.55* | 39,291 | .26*(d) | 1.26*(d) | 33.53* |
| CLASS B | ||||||||||||||
| July 31, 2007 | $57.57 | 1.49(d) | 2.65 | 4.14 | (1.79) | (2.08) | (3.87) | —(e) | $57.84 | 7.29 | $253 | 1.06(d) | 2.55(d) | 56.75 |
| July 31, 2006 | 58.59 | 1.20(d,f) | (.15) | 1.05 | (1.05) | (1.02) | (2.07) | —(e) | 57.57 | 1.78 | 228 | 1.09(d) | 2.08(d,f) | 61.79 |
| July 31, 2005*** | 56.00 | .37(d) | 2.42 | 2.79 | (.20) | — | (.20) | — | 58.59 | 4.98* | 84 | .82*(d) | .65*(d) | 33.53* |
| CLASS C | ||||||||||||||
| July 31, 2007 | $57.30 | 1.49(d) | 2.63 | 4.12 | (1.67) | (2.08) | (3.75) | —(e) | $57.67 | 7.28 | $91 | 1.06(d) | 2.55(d) | 56.75 |
| July 31, 2006 | 58.62 | 1.23(d,f) | (.18) | 1.05 | (1.35) | (1.02) | (2.37) | —(e) | 57.30 | 1.78 | 36 | 1.09(d) | 2.12(d,f) | 61.79 |
| July 31, 2005*** | 56.00 | .41(d) | 2.38 | 2.79 | (.17) | — | (.17) | — | 58.62 | 4.98* | 15 | .82*(d) | .71*(d) | 33.53* |
| CLASS M | ||||||||||||||
| July 31, 2007 | $57.46 | 1.63(d) | 2.65 | 4.28 | (1.81) | (2.08) | (3.89) | —(e) | $57.85 | 7.56 | $126 | .81(d) | 2.79(d) | 56.75 |
| July 31, 2006 | 58.73 | 1.38(d,f) | (.18) | 1.20 | (1.45) | (1.02) | (2.47) | —(e) | 57.46 | 2.03 | 124 | .84(d) | 2.39(d,f) | 61.79 |
| July 31, 2005*** | 56.00 | .56(d) | 2.34 | 2.90 | (.17) | — | (.17) | — | 58.73 | 5.19* | 55 | .64*(d) | .97*(d) | 33.53* |
| CLASS R | ||||||||||||||
| July 31, 2007 | $57.56 | 1.78(d) | 2.66 | 4.44 | (1.92) | (2.08) | (4.00) | —(e) | $58.00 | 7.83 | $216 | .56(d) | 3.05(d) | 56.75 |
| July 31, 2006 | 58.83 | 1.60(d,f) | (.25) | 1.35 | (1.60) | (1.02) | (2.62) | —(e) | 57.56 | 2.30 | 80 | .59(d) | 2.80(d,f) | 61.79 |
| July 31, 2005*** | 56.00 | .59(d) | 2.43 | 3.02 | (.19) | — | (.19) | — | 58.83 | 5.41* | 1 | .45*(d) | 1.06*(d) | 33.53* |
| CLASS Y | ||||||||||||||
| July 31, 2007 | $61.41 | 2.20(d) | 2.85 | 5.05 | (2.23) | (2.08) | (4.31) | —(e) | $62.15 | 8.36 | $23,621 | .06(d) | 3.52(d) | 56.75 |
| July 31, 2006 | 62.35 | 1.90(d,f) | (.17) | 1.73 | (1.65) | (1.02) | (2.67) | —(e) | 61.41 | 2.79 | 41,478 | .09(d) | 3.07(d,f) | 61.79 |
| July 31, 2005*** | 59.18 | .86(d) | 2.54 | 3.40 | (.23) | — | (.23) | — | 62.35 | 5.76* | 44,492 | .07*(d) | 1.42*(d) | 33.53* |
See page 84 for Notes to Financial Highlights.
The accompanying notes are an integral part of these financial statements.
| 80 | 81 |
Financial highlights (For a common share outstanding throughout the period) (Continued)
| INVESTMENT OPERATIONS: | LESS DISTRIBUTIONS: | RATIOS AND SUPPLEMENTAL DATA: | ||||||||||||
| Net | Total | Ratio of net | ||||||||||||
| Net asset | realized and | Total | From | From | Net asset | return | Net | Ratio of | investment | |||||
| value, | Net | unrealized | from | net | net realized | value, | at net | assets, | expenses to | income (loss) | Portfolio | |||
| beginning | investment | gain (loss) on | investment | investment | gain on | Total | Redemption | end | asset | end of period | average net | to average | turnover | |
| Period ended | of period | income (loss)(a) | investments | operations | income | investments | distributions | fees | of period | value (%)(b) | (in thousands) | assets (%)(c) | net assets (%) | (%) |
| Putnam RetirementReady Maturity Fund | ||||||||||||||
| CLASS A | ||||||||||||||
| July 31, 2007 | $55.97 | 1.98(d) | 2.13 | 4.11 | (2.13) | (.82) | (2.95) | —(e) | $57.13 | 7.43 | $22,651 | .33(d) | 3.45(d) | 62.34 |
| July 31, 2006 | 57.51 | 1.74(d,f) | (.70) | 1.04 | (1.83) | (.75) | (2.58) | —(e) | 55.97 | 1.82 | 31,206 | .35(d) | 3.07(d,f) | 61.89 |
| July 31, 2005*** | 55.96 | .80(d) | 1.50 | 2.30 | (.75) | — | (.75) | — | 57.51 | 4.15* | 25,732 | .26*(d) | 1.41*(d) | 41.89* |
| CLASS B | ||||||||||||||
| July 31, 2007 | $56.01 | 1.56(d) | 2.13 | 3.69 | (1.71) | (.82) | (2.53) | —(e) | $57.17 | 6.65 | $219 | 1.08(d) | 2.70(d) | 62.34 |
| July 31, 2006 | 57.54 | 1.31(d,f) | (.70) | .61 | (1.39) | (.75) | (2.14) | —(e) | 56.01 | 1.06 | 138 | 1.10(d) | 2.31(d,f) | 61.89 |
| July 31, 2005*** | 56.00 | .47(d) | 1.51 | 1.98 | (.44) | — | (.44) | — | 57.54 | 3.55* | 124 | .82*(d) | .83*(d) | 41.89* |
| CLASS C | ||||||||||||||
| July 31, 2007 | $56.04 | 1.58(d) | 2.10 | 3.68 | (1.63) | (.82) | (2.45) | —(e) | $57.27 | 6.62 | $1 | 1.08(d) | 2.77(d) | 62.34 |
| July 31, 2006 | 57.56 | 1.36(d,f) | (.73) | .63 | (1.40) | (.75) | (2.15) | —(e) | 56.04 | 1.09 | 1 | 1.10(d) | 2.31(d,f) | 61.89 |
| July 31, 2005*** | 56.00 | .46(d) | 1.54 | 2.00 | (.44) | — | (.44) | — | 57.56 | 3.59* | 1 | .82*(d) | .81*(d) | 41.89* |
| CLASS M | ||||||||||||||
| July 31, 2007 | $55.99 | 1.69(d) | 2.13 | 3.82 | (1.72) | (.82) | (2.54) | —(e) | $57.27 | 6.88 | $14 | .83(d) | 2.94(d) | 62.34 |
| July 31, 2006 | 57.54 | 1.57(d,f) | (.81) | .76 | (1.56) | (.75) | (2.31) | —(e) | 55.99 | 1.33 | 75 | .85(d) | 2.86(d,f) | 61.89 |
| July 31, 2005*** | 56.00 | .61(d) | 1.49 | 2.10 | (.56) | — | (.56) | — | 57.54 | 3.76* | 2 | .64*(d) | 1.07*(d) | 41.89* |
| CLASS R | ||||||||||||||
| July 31, 2007 | $55.99 | 1.85(d) | 2.12 | 3.97 | (1.99) | (.82) | (2.81) | —(e) | $57.15 | 7.16 | $81 | .58(d) | 3.22(d) | 62.34 |
| July 31, 2006 | 57.56 | 1.62(d,f) | (.73) | .89 | (1.71) | (.75) | (2.46) | —(e) | 55.99 | 1.56 | 48 | .60(d) | 2.97(d,f) | 61.89 |
| July 31, 2005** | 56.00 | .67(d) | 1.54 | 2.21 | (.65) | — | (.65) | — | 57.56 | 3.97* | 1 | .45*(d) | 1.19*(d) | 41.89* |
| CLASS Y | ||||||||||||||
| July 31, 2007 | $56.11 | 2.13(d) | 2.13 | 4.26 | (2.28) | (.82) | (3.10) | —(e) | $57.27 | 7.70 | $9,729 | .08(d) | 3.70(d) | 62.34 |
| July 31, 2006 | 57.65 | 1.86(d,f) | (.68) | 1.18 | (1.97) | (.75) | (2.72) | —(e) | 56.11 | 2.07 | 13,756 | .10(d) | 3.26(d,f) | 61.89 |
| July 31, 2005*** | 56.08 | .89(d) | 1.53 | 2.42 | (.85) | — | (.85) | — | 57.65 | 4.34* | 21,787 | .07*(d) | 1.56*(d) | 41.89* |
See page 84 for Notes to Financial Highlights.
The accompanying notes are an integral part of these financial statements.
| 82 | 83 |
Financial highlights (Continued)
* Not annualized.
** For the period May 2, 2005 (commencement of operations) to July 31, 2005.
*** For the period November 1, 2004 (commencement of operations) to July 31, 2005.
(a) Per share net investment income (loss) has been determined on the basis of the weighted average number of shares outstanding during the period.
(b) Total return does not reflect the effect of sales charges.
(c) Expense ratios do not include expenses of the underlying funds.
(d) Reflects an involuntary contractual expense limitation in effect during the period. As a result of such limitation the expenses for the following periods reflect a reduction of the
following based on each funds’ average net assets (Note 2).
| 7/31/07 | 7/31/06 | 7/31/05 | |
| Putnam RetirementReady 2050 Fund | 0.04% | 3.23% | 12.75% |
| Putnam RetirementReady 2045 Fund | 0.01 | 0.10 | 0.57 |
| Putnam RetirementReady 2040 Fund | 0.01 | 0.08 | 0.40 |
| Putnam RetirementReady 2035 Fund | 0.01 | 0.04 | 0.20 |
| Putnam RetirementReady 2030 Fund | 0.01 | 0.02 | 0.13 |
| Putnam RetirementReady 2025 Fund | 0.01 | 0.01 | 0.08 |
| Putnam RetirementReady 2020 Fund | 0.01 | <0.01 | 0.07 |
| Putnam RetirementReady 2015 Fund | 0.01 | <0.01 | 0.06 |
| Putnam RetirementReady 2010 Fund | 0.02 | 0.01 | 0.09 |
| Putnam RetirementReady Maturity Fund | 0.00 | 0.05 | 0.28 |
(e) Amount represents less than $0.01 per share.
(f) The net investment income ratios and per share amounts shown for the period ending July 31, 2006 may not correspond with the expected class specific differences for the period
due to the timing of sales and repurchases of fund shares in relation to when distributions from the underlying Putnam funds were received.
(1) For the period December 22, 2005 to July 31, 2006.
(2) For the period August 1, 2005 to December 19, 2005. All class R shares for Fund 2045 and Fund 2040 were liquidated on December 19, 2005.
The accompanying notes are an integral part of these financial statements.
84
Notes to financial statements 7/31/07
Note 1: Significant accounting policies
Each of Putnam RetirementReady Funds: Putnam RetirementReady 2050 Fund, Putnam RetirementReady 2045 Fund, Putnam RetirementReady 2040 Fund, Putnam RetirementReady 2035 Fund, Putnam RetirementReady 2030 Fund, Putnam RetirementReady 2025 Fund, Putnam RetirementReady 2020 Fund, Putnam RetirementReady 2015 Fund, Putnam RetirementReady 2010 Fund and Putnam RetirementReady Maturity Fund, (collectively the “funds”) is a series of Putnam RetirementReady Funds, a Massachusetts business trust organized on June 8, 2004 (the “Trust”). Each fund is a diversified open-end investment company under the Investment Company Act of 1940, as amended, each of which is represented by a series of shares of beneficial interest. Each fund, except the Putnam RetirementReady Maturity Fund, seeks capital appreciation and current income consistent with a decreasing emphasis on capital appreciation and an increasing emphasis on current income as it approaches its target date. The Putnam RetirementReady Maturity Fund seeks as high a rate of current income as Putnam Investment Management, LLC (“Putnam Management”), the funds’ manager, an indirect wholly-owned subsidiary of Putnam, LLC., believes is consistent with preservation of capital.
Currently there are ten separate funds, of which nine have a target date specified by the calendar year in the name of each fund. The target dates are in five-year increments beginning with the year 2010. The tenth fund is named Putnam RetirementReady Maturity Fund. In July 2007 the Trustees approved a plan to extend each target date fund’s life an additional five years past the current target date. Beginning with the target date each fund will be renamed to include “Maturity.” At the end of the five years each fund will merge into the Putnam RetirementReady Maturity Fund.
These financial statements report on each fund which may invest in the following Putnam Funds: Putnam Income Fund, Putnam Capital Opportunities Fund, The Putnam Fund for Growth and Income, Putnam Money Market Fund, Putnam International Equity Fund and Putnam Voyager Fund (the “underlying Putnam Funds”), which are managed by Putnam Management. In July 2007 the Trustees approved a plan to add the following nine underlying funds to each portfolio: Putnam Diversified Income Trust, Putnam Equity Income Fund, Putnam High Yield Advantage Fund, Putnam Income Strategies Fund, Putnam International Growth and Income Fund, Putnam International New Opportunities Fund, Putnam Vista Fund, Putnam Mid Cap Value Fund and Putnam Investors Fund. The financial statements of the underlying Putnam Funds contain additional information about the expenses and investments of the underlying Putnam Funds and are available upon request.
Each fund offers class A, class B, class C, class M, class R and class Y shares. Class A and class M shares are sold with a maximum front-end sales charge of 5.25% and 3.25%, respectively, and generally do not pay a contingent deferred sales charge. Class B shares, which convert to class A shares after approximately eight years, do not pay a front-end sales charge and are subject to a contingent deferred sales charge, if those shares are redeemed within six years of purchase. Class C shares have a one-year 1.00% contingent deferred sales charge and do not convert to class A shares. Class R shares, which are offered to qualified employee benefit plans, are sold without a front-end sales charge or a contingent deferred sales charge. The expenses for class A, class B, class C, class M and class R shares may differ based on the distribution fee of each class, which is identified in Note 2. Class Y shares, which are sold at net asset value, a re generally subject to the same expenses as class A, class B, class C, class M and class R shares, but do not bear a distribution fee. Class Y shares are sold to certain eligible purchasers including certain defined contribution plans (including corporate IRAs), bank trust departments and trust companies.
Effective October 2, 2006, a 1.00% redemption fee may apply on any shares purchased on or after such date that are redeemed (either by selling or exchanging into another fund) within 7 days of purchase. The redemption fee is accounted for as an addition to paid-in-capital. Prior to October 2, 2006, a 2.00% redemption fee applied to any shares that were redeemed (either by selling or exchanging into another fund) within 5 days of purchase.
Investment income, realized and unrealized gains and losses and expenses of each fund are borne pro-rata based on the relative net assets of each class to the total net assets of each fund, except that each class bears expenses unique to that class (including the distribution fees applicable to such classes). Each class votes as a class only with respect to its own distribution plan or other matters on which a class vote is required by law or determined by the Trustees. Shares of each class would receive their pro-rata share of the net assets of the fund, if that fund were liquidated. In addition, the Trustees declare separate dividends on each class of shares.
In the normal course of business, each fund enters into contracts that may include agreements to indemnify another party under given circumstances. Each fund’s maximum exposure under these arrangements is unknown as this would involve future claims that may be, but have not yet been, made against each fund. However, each fund expects the risk of material loss to be remote.
The following is a summary of significant accounting policies consistently followed by the funds in the preparation of their financial statements. The preparation of financial statements is in conformity with accounting principles generally accepted in the United States of America and requires management to make estimates and assumptions that affect the reported amounts of assets and liabilities in the financial statements and the reported amounts of increases and decreases in net assets from operations during the reporting period. Actual results could differ from those estimates.
A) Security valuation The price of each fund’s shares is based on its net asset value (NAV), which is in turn based on the NAV’s of the underlying Putnam Funds in which it invests. The NAV per share of each class equals the total value of its assets, less its liabilities, divided by the number of its outstanding shares. Shares are only valued as of the close of regular trading on the New York Stock Exchange each day the exchange is open. Each underlying Putnam Fund values its investments for which market quotations are readily available at the last reported sales price on their principal exchange, or official closing price for certain markets. If no sales are reported — as in the case of some securities traded over-the-counter — a security is valued at its last reported bid price. Many securities markets and exchanges outside the U.S. close prior to the close of the New York Stock Exchange and therefore the closing prices for securities in such markets or on such exchanges may not fully reflect events that occur after such close but before the close of the New York Stock Exchange. Accordingly, on certain days, each underlying Putnam Fund will fair value foreign equity securities taking into account multiple factors, including movements in the U.S. securities markets. The number of days on which fair value prices will be used will depend on market activity and it is possible that fair value prices will be used by each underlying Putnam
85
fund to a significant extent. Securities quoted in foreign currencies, if any, are translated into U.S. dollars at the current exchange rate. Certain investments, including certain restricted securities, are valued at fair value following procedures approved by the Trustees. Such valuations and procedures are reviewed periodically by the Trustees. The fair value of securities is generally determined as the amount that each underlying Putnam Fund could reasonably expect to realize from an orderly disposition of such securities over a reasonable period of time. By its nature, a fair value price is a good faith estimate of the value of a security at a given point in time and does not reflect an actual market price, which may be different by a material amount.
B) Security transactions and related investment income Security transactions, which consist of shares of the underlying Putnam Funds, are recorded on the trade date (date the order to buy or sell is executed). Gains or losses from the sale of the underlying Putnam Funds are determined on the identified cost basis. Income and capital gain distributions from the underlying Putnam Funds are recorded on the ex-dividend date.
C) Federal taxes It is the policy of each fund to distribute all of its taxable income within the prescribed time and otherwise comply with the provisions of the Internal Revenue Code of 1986 (the “Code”) applicable to regulated investment companies. It is also the intention of each fund to distribute an amount sufficient to avoid imposition of any excise tax under Section 4982 of the Code, as amended. Therefore, no provision has been made for federal taxes on income, capital gains or unrealized appreciation on securities held nor for excise tax on income and capital gains.
D) Distributions to shareholders Each fund normally distributes any net investment income and any realized capital gains, annually, except the Putnam RetirementReady Maturity Fund, which normally distributes any net investment income monthly and any net realized capital gains annually. The amount and character of income and gains to be distributed are determined in accordance with income tax regulations, which may differ from generally accepted accounting principles. For each fund these differences include temporary and/or permanent differences of losses on wash sale transactions and short-term capital gain distributions from underlying Putnam Fund shares for all funds. Reclassifications are made to the fund’s capital accounts to reflect income and gains available for distribution (or available capital loss carryovers) under income tax regulations. For the year ended July 31, 2007 the funds reclassified the following amounts:
| Accumulated | |||
| Undistributed | Net Realized | ||
| Net | Gain/(Loss) On | ||
| Investment | Investment | Paid-in | |
| Income | Transactions | Capital | |
| RetirementReady | |||
| 2050 Fund | $ 50,933 | $ (50,933) | $— |
| 2045 Fund | 223,691 | (223,691) | — |
| 2040 Fund | 274,928 | (274,928) | — |
| 2035 Fund | 400,920 | (400,920) | — |
| 2030 Fund | 554,146 | (554,146) | — |
| 2025 Fund | 684,938 | (684,938) | — |
| 2020 Fund | 721,541 | (721,541) | — |
| 2015 Fund | 539,706 | (539,706) | — |
| 2010 Fund | 166,517 | (166,517) | — |
| Maturity Fund | 88,856 | (88,856) | — |
The tax basis components of distributable earnings and the federal tax cost as of July 31, 2007 were as follows:
| Net | Cost for | ||||||
| Unrealized | Undistributed | Undistributed | Undistributed | Federal | |||
| Unrealized | Unrealized | Appreciation | Ordinary | Short-term | Long-term | Income Tax | |
| Appreciation | (Depreciation) | (Depreciation) | Income | Gain | Gain | Purposes | |
| RetirementReady | |||||||
| 2050 Fund | $ 230,958 | $ (334,093) | $ (103,135) | $ 12,539 | $414,864 | $ 403,110 | $ 15,535,267 |
| 2045 Fund | 963,723 | (645,189) | 318,534 | 48,292 | 17,140 | 3,704,905 | 34,673,191 |
| 2040 Fund | 1,588,029 | (748,855) | 839,174 | 124,991 | — | 4,324,822 | 46,751,443 |
| 2035 Fund | 2,467,895 | (1,044,476) | 1,423,419 | 296,868 | — | 6,622,298 | 72,193,924 |
| 2030 Fund | 2,939,665 | (1,207,315) | 1,732,350 | 547,254 | — | 10,035,741 | 91,640,294 |
| 2025 Fund | 3,670,956 | (1,489,169) | 2,181,787 | 913,377 | — | 12,858,750 | 120,414,464 |
| 2020 Fund | 3,228,397 | (1,488,164) | 1,740,233 | 1,508,126 | — | 12,408,363 | 141,823,443 |
| 2015 Fund | 1,485,723 | (1,389,291) | 96,432 | 1,968,901 | — | 8,203,329 | 130,144,463 |
| 2010 Fund | 58,771 | (446,093) | (387,322) | 1,397,627 | — | 2,331,394 | 65,421,758 |
| Maturity Fund | — | (364,499) | (364,499) | 15,608 | — | 1,134,818 | 33,076,382 |
86
E) Expenses of the Trust Expenses directly charged or attributable to any fund will be paid from the assets of that fund. Generally, expenses of the Trust will be allocated among and charged to the assets of each fund on a basis that the Trustees deem fair and equitable, which may be based on the relative assets of each fund or the nature of the services performed and relative applicability to each fund.
Note 2: Management fee, administrative services and other transactions
Putnam Management is paid for management and investment advisory services monthly at an annual rate of 0.05% based on the average net assets of each fund.
Putnam Management has agreed to waive fees and reimburse expenses of each fund through June 30, 2009, to the extent necessary to ensure that each fund’s expenses (exclusive of the underlying Putnam Fund expenses) do not exceed the simple average of the expenses of all front-end load funds viewed by Lipper Inc. as having the same investment classification or objective as the funds. The expense reimbursement is based on a comparison of each funds’ expenses with the average annualized operating expenses of the funds in its Lipper peer group for each calendar quarter during the last fiscal year, excluding 12b-1 fees and without giving effect to any expense offset and brokerage service arrangements that may reduce fund expenses.
Putnam Management has agreed to limit its compensation (and, to the extent necessary, bear other expenses) through July 31, 2008, to the extent that expenses of each fund (exclusive of brokerage commissions, interest, taxes and extraordinary expenses, fees and expenses of the underlying funds in which each fund invests, and payments under the fund’s distribution plan) would exceed an annual rate of 0.10% of each fund’s average net assets.
For the year ended July 31, 2007, each fund’s expenses were limited to the lower of the limits specified above and accordingly, Putnam Management waived the following of its management fee from each fund:
| Fees waived and reimbursed | |
| by the Manager | |
| RetirementReady | |
| 2050 Fund | $ 3,885 |
| 2045 Fund | 2,496 |
| 2040 Fund | 3,468 |
| 2035 Fund | 5,264 |
| 2030 Fund | 9,617 |
| 2025 Fund | 12,344 |
| 2020 Fund | 13,670 |
| 2015 Fund | 12,260 |
| 2010 Fund | 13,381 |
| Maturity Fund | — |
Effective August 3, 2007, Marsh & McLennan Companies, Inc. sold its ownership interest in Putnam Management, its parent companies and affiliates to a wholly-owned subsidiary of Great-West Lifeco, Inc. Each fund's shareholders have approved a new management contract for the fund that became effective upon the sale.
Each fund has adopted distribution plans (the “Plans”) with respect to its class A, class B, class C, class M and class R shares pursuant to Rule 12b-1 under the Investment Company Act of 1940. The purpose of the Plans is to compensate Putnam Retail Management, a wholly-owned subsidiary of Putnam, LLC and Putnam Retail Management GP, Inc., for services provided and expenses incurred in distributing shares of the funds. The Plans provide for payments by each fund to Putnam Retail Management at an annual rate of up to 0.35%, 1.00%, 1.00%, 1.00% and 1.00% of the average net assets attributable to class A, class B, class C, class M and class R shares, respectively. The Trustees have approved payment by the funds’ at an annual rate of 0.25%, 1.00%, 1.00%, 0.75% and 0.50% of the average net assets attributable to class A, class B, class C, class M, and class R shares, respectively.
For the year ended July 31, 2007, Putnam Retail Management, acting as underwriter, received net commissions from the sale of class A and class M shares, and received contingent deferred sales charges (CDSC) from redemptions of class B and class C shares, in the following amounts:
| Class A | Class M | |||
| Net | Net | Class B | Class C | |
| Commissions | Commissions | CDSC | CDSC | |
| RetirementReady | ||||
| 2050 Fund | $ 1,738 | $ — | $ — | $ — |
| 2045 Fund | 739 | 32 | 193 | — |
| 2040 Fund | 1,406 | — | 410 | — |
| 2035 Fund | 1,334 | 17 | 681 | — |
| 2030 Fund | 3,688 | 15 | 206 | 66 |
| 2025 Fund | 3,226 | 213 | 344 | — |
| 2020 Fund | 1,349 | 1,962 | 717 | — |
| 2015 Fund | 2,428 | 196 | 383 | — |
| 2010 Fund | 371 | 11 | 504 | 2 |
| Maturity Fund | 88 | — | — | 250 |
| Total | $16,367 | $2,446 | $3,438 | $318 |
87
A deferred sales charge of up to 1.00% and 0.65% is assessed on certain redemptions of class A and class M shares, respectively. For the year ended July 31, 2007, Putnam Retail Management, acting as underwriter, received no monies on class A and class M redemptions, respectively.
Note 3: Purchases and sales of securities
During the year ended July 31, 2007, cost of purchases and proceeds from sales of underlying Putnam Funds were as follows:
| Purchase cost | Sale proceeds | |
| RetirementReady | ||
| 2050 Fund | $17,926,938 | $ 6,884,763 |
| 2045 Fund | 33,436,460 | 26,390,055 |
| 2040 Fund | 36,801,072 | 26,837,582 |
| 2035 Fund | 50,955,767 | 40,534,041 |
| 2030 Fund | 63,967,159 | 67,068,613 |
| 2025 Fund | 82,419,681 | 91,046,834 |
| 2020 Fund | 88,511,931 | 109,675,063 |
| 2015 Fund | 97,958,533 | 103,522,363 |
| 2010 Fund | 44,019,447 | 67,758,841 |
| Maturity Fund | 25,961,433 | 39,425,933 |
Note 4: Capital shares
At July 31, 2007, there was an unlimited number of shares of beneficial interest authorized. Transactions in capital shares were as follows:
RetirementReady 2050 Fund
| Year ended 7/31/07: | Year ended 7/31/06: | |||
| CLASS A | Shares | Amount | Shares | Amount |
| Shares sold | 179,319 | $11,267,448 | 64,652 | $ 3,672,572 |
| Shares issued in connection with reinvestment of distributions | 3,118 | 191,928 | 477 | 26,522 |
| 182,437 | 11,459,376 | 65,129 | 3,699,094 | |
| Shares repurchased | (75,085) | (4,810,497) | (19,621) | (1,130,209) |
| Net increase | 107,352 | $ 6,648,879 | 45,508 | $ 2,568,885 |
| Year ended 7/31/07: | Year ended 7/31/06: | |||
| CLASS B | Shares | Amount | Shares | Amount |
| Shares sold | 1,984 | $121,240 | 393 | $ 21,983 |
| Shares issued in connection with reinvestment of distributions | 44 | 2,685 | 17 | 919 |
| 2,028 | 123,925 | 410 | 22,902 | |
| Shares repurchased | (558) | (34,718) | (191) | (10,895) |
| Net increase | 1,470 | $ 89,207 | 219 | $ 12,007 |
| Year ended 7/31/07: | Year ended 7/31/06: | |||
| CLASS C | Shares | Amount | Shares | Amount |
| Shares sold | 404 | $ 26,008 | — | $ — |
| Shares issued in connection with reinvestment of distributions | —* | 30 | 2 | 112 |
| 404 | 26,038 | 2 | 112 | |
| Shares repurchased | (177) | (11,501) | (59) | (3,350) |
| Net increase (decrease) | 227 | $ 14,537 | (57) | $(3,238) |
| Year ended 7/31/07: | Year ended 7/31/06: | |||
| CLASS M | Shares | Amount | Shares | Amount |
| Shares sold | 481 | $30,088 | — | $ — |
| Shares issued in connection with reinvestment of distributions | 2 | 104 | 2 | 90 |
| 483 | 30,192 | 2 | 90 | |
| Shares repurchased | (82) | (5,312) | (6) | (364) |
| Net increase (decrease) | 401 | $24,880 | (4) | $(274) |
| Year ended 7/31/07: | Year ended 7/31/06: | |||
| CLASS R | Shares | Amount | Shares | Amount |
| Shares sold | 914 | $57,678 | 148 | $8,716 |
| Shares issued in connection with reinvestment of distributions | 10 | 623 | 1 | 32 |
| 924 | 58,301 | 149 | 8,748 | |
| Shares repurchased | (52) | (3,429) | —* | (16) |
| Net increase | 872 | $54,872 | 149 | $8,732 |
88
| Year ended 7/31/07: | Year ended 7/31/06: | |||
| CLASS Y | Shares | Amount | Shares | Amount |
| Shares sold | 83,798 | $ 5,313,786 | 23,536 | $1,333,220 |
| Shares issued in connection with reinvestment of distributions | 930 | 57,390 | 155 | 8,600 |
| 84,728 | 5,371,176 | 23,691 | 1,341,820 | |
| Shares repurchased | (22,895) | (1,438,728) | (7,646) | (428,012) |
| Net increase | 61,833 | $ 3,932,448 | 16,045 | $ 913,808 |
| RetirementReady 2045 Fund | ||||
| Year ended 7/31/07: | Year ended 7/31/06: | |||
| CLASS A | Shares | Amount | Shares | Amount |
| Shares sold | 221,201 | $ 17,486,899 | 163,725 | $11,892,306 |
| Shares issued in connection with reinvestment of distributions | 15,844 | 1,215,221 | 7,269 | 516,875 |
| 237,045 | 18,702,120 | 170,994 | 12,409,181 | |
| Shares repurchased | (160,661) | (12,909,326) | (77,294) | (5,594,554) |
| Net increase | 76,384 | $ 5,792,794 | 93,700 | $ 6,814,627 |
| Year ended 7/31/07: | Year ended 7/31/06: | |||
| CLASS B | Shares | Amount | Shares | Amount |
| Shares sold | 1,183 | $ 87,778 | 1,099 | $ 77,943 |
| Shares issued in connection with reinvestment of distributions | 88 | 6,567 | 12 | 821 |
| 1,271 | 94,345 | 1,111 | 78,764 | |
| Shares repurchased | (364) | (26,790) | (202) | (13,982) |
| Net increase | 907 | $ 67,555 | 909 | $ 64,782 |
| Year ended 7/31/07: | Year ended 7/31/06: | |||
| CLASS C | Shares | Amount | Shares | Amount |
| Shares sold | 82 | $6,400 | 4 | $ 350 |
| Shares issued in connection with reinvestment of distributions | 9 | 602 | 6 | 392 |
| 91 | 7,002 | 10 | 742 | |
| Shares repurchased | (2) | (71) | (16) | (1,178) |
| Net increase (decrease) | 89 | $6,931 | (6) | $ (436) |
| Year ended 7/31/07: | Year ended 7/31/06: | |||
| CLASS M | Shares | Amount | Shares | Amount |
| Shares sold | 133 | $ 10,424 | 2 | $ 100 |
| Shares issued in connection with reinvestment of distributions | 5 | 361 | 5 | 358 |
| 138 | 10,785 | 7 | 458 | |
| Shares repurchased | (234) | (18,727) | (22) | (1,562) |
| Net decrease | (96) | $ (7,942) | (15) | $(1,104) |
| Year ended 7/31/07: | Year ended 7/31/06: | |||
| CLASS R | Shares | Amount | Shares | Amount |
| Shares sold | 2,296 | $186,690 | 421 | $ 29,866 |
| Shares issued in connection with reinvestment of distributions | 54 | 4,224 | — | — |
| 2,350 | 190,914 | 421 | 29,866 | |
| Shares repurchased | (203) | (16,979) | (184) | (13,288) |
| Net increase | 2,147 | $173,935 | 237 | $ 16,578 |
| Year ended 7/31/07: | Year ended 7/31/06: | |||
| CLASS Y | Shares | Amount | Shares | Amount |
| Shares sold | 119,221 | $ 10,282,381 | 71,420 | $ 5,689,901 |
| Shares issued in connection with reinvestment of distributions | 8,346 | 702,235 | 4,706 | 364,939 |
| 127,567 | 10,984,616 | 76,126 | 6,054,840 | |
| Shares repurchased | (121,032) | (10,343,194) | (47,764) | (3,763,088) |
| Net increase | 6,535 | $ 641,422 | 28,362 | $ 2,291,752 |
89
| RetirementReady 2040 Fund | ||||
| Year ended 7/31/07: | Year ended 7/31/06: | |||
| CLASS A | Shares | Amount | Shares | Amount |
| Shares sold | 239,293 | $ 18,657,424 | 213,210 | $15,454,374 |
| Shares issued in connection with reinvestment of distributions | 23,105 | 1,754,062 | 10,838 | 768,863 |
| 262,398 | 20,411,486 | 224,048 | 16,223,237 | |
| Shares repurchased | (172,078) | (13,659,572) | (94,047) | (6,795,750) |
| Net increase | 90,320 | $ 6,751,914 | 130,001 | $ 9,427,487 |
| Year ended 7/31/07: | Year ended 7/31/06: | |||
| CLASS B | Shares | Amount | Shares | Amount |
| Shares sold | 2,423 | $184,052 | 1,392 | $ 99,628 |
| Shares issued in connection with reinvestment of distributions | 144 | 10,534 | 31 | 2,108 |
| 2,567 | 194,586 | 1,423 | 101,736 | |
| Shares repurchased | (704) | (52,960) | (145) | (10,278) |
| Net increase | 1,863 | $141,626 | 1,278 | $ 91,458 |
| Year ended 7/31/07: | Year ended 7/31/06: | |||
| CLASS C | Shares | Amount | Shares | Amount |
| Shares sold | 206 | $16,187 | 10 | $742 |
| Shares issued in connection with reinvestment of distributions | 3 | 186 | 1 | 53 |
| 209 | 16,373 | 11 | 795 | |
| Shares repurchased | (1) | (40) | — | — |
| Net increase | 208 | $16,333 | 11 | $795 |
| Year ended 7/31/07: | Year ended 7/31/06: | |||
| CLASS M | Shares | Amount | Shares | Amount |
| Shares sold | 341 | $ 25,782 | 286 | $20,827 |
| Shares issued in connection with reinvestment of distributions | 25 | 1,894 | 8 | 554 |
| 366 | 27,676 | 294 | 21,381 | |
| Shares repurchased | (512) | (38,957) | (133) | (9,256) |
| Net increase (decrease) | (146) | $(11,281) | 161 | $12,125 |
| Year ended 7/31/07: | Year ended 7/31/06: | |||
| CLASS R | Shares | Amount | Shares | Amount |
| Shares sold | 1,574 | $128,022 | 753 | $ 55,814 |
| Shares issued in connection with reinvestment of distributions | 59 | 4,587 | — | — |
| 1,633 | 132,609 | 753 | 55,814 | |
| Shares repurchased | (276) | (22,091) | (147) | (10,631) |
| Net increase | 1,357 | $110,518 | 606 | $ 45,183 |
| Year ended 7/31/07: | Year ended 7/31/06: | |||
| CLASS Y | Shares | Amount | Shares | Amount |
| Shares sold | 119,748 | $10,205,105 | 93,045 | $ 7,301,334 |
| Shares issued in connection with reinvestment of distributions | 10,490 | 870,596 | 5,791 | 446,361 |
| 130,238 | 11,075,701 | 98,836 | 7,747,695 | |
| Shares repurchased | (100,194) | (8,443,187) | (56,087) | (4,388,421) |
| Net increase | 30,044 | $ 2,632,514 | 42,749 | $ 3,359,274 |
90
| RetirementReady 2035 Fund | ||||
| Year ended 7/31/07: | Year ended 7/31/06: | |||
| CLASS A | Shares | Amount | Shares | Amount |
| Shares sold | 327,462 | $ 24,804,881 | 275,372 | $ 19,451,653 |
| Shares issued in connection with reinvestment of distributions | 37,192 | 2,722,507 | 18,656 | 1,293,241 |
| 364,654 | 27,527,388 | 294,028 | 20,744,894 | |
| Shares repurchased | (240,818) | (18,471,483) | (152,080) | (10,727,902) |
| Net increase | 123,836 | $ 9,055,905 | 141,948 | $ 10,016,992 |
| Year ended 7/31/07: | Year ended 7/31/06: | |||
| CLASS B | Shares | Amount | Shares | Amount |
| Shares sold | 3,203 | $235,740 | 4,100 | $280,021 |
| Shares issued in connection with reinvestment of distributions | 367 | 25,891 | 127 | 8,449 |
| 3,570 | 261,631 | 4,227 | 288,470 | |
| Shares repurchased | (1,064) | (77,712) | (669) | (46,052) |
| Net increase | 2,506 | $183,919 | 3,558 | $242,418 |
| Year ended 7/31/07: | Year ended 7/31/06: | |||
| CLASS C | Shares | Amount | Shares | Amount |
| Shares sold | 1,019 | $74,371 | 87 | $6,076 |
| Shares issued in connection with reinvestment of distributions | 49 | 3,505 | 1 | 55 |
| 1,068 | 77,876 | 88 | 6,131 | |
| Shares repurchased | (19) | (1,445) | — | — |
| Net increase | 1,049 | $76,431 | 88 | $6,131 |
| Year ended 7/31/07: | Year ended 7/31/06: | |||
| CLASS M | Shares | Amount | Shares | Amount |
| Shares sold | 427 | $ 30,815 | 271 | $18,607 |
| Shares issued in connection with reinvestment of distributions | 44 | 3,159 | 18 | 1,218 |
| 471 | 33,974 | 289 | 19,825 | |
| Shares repurchased | (155) | (11,771) | (47) | (3,357) |
| Net increase | 316 | $ 22,203 | 242 | $16,468 |
| Year ended 7/31/07: | Year ended 7/31/06: | |||
| CLASS R | Shares | Amount | Shares | Amount |
| Shares sold | 4,195 | $317,255 | 892 | $ 60,919 |
| Shares issued in connection with reinvestment of distributions | 79 | 5,648 | —* | 6 |
| 4,274 | 322,903 | 892 | 60,925 | |
| Shares repurchased | (562) | (40,498) | (541) | (36,845) |
| Net increase | 3,712 | $282,405 | 351 | $ 24,080 |
| Year ended 7/31/07: | Year ended 7/31/06: | |||
| CLASS Y | Shares | Amount | Shares | Amount |
| Shares sold | 161,525 | $ 13,340,407 | 167,410 | $12,826,136 |
| Shares issued in connection with reinvestment of distributions | 22,233 | 1,783,016 | 13,824 | 1,043,003 |
| 183,758 | 15,123,423 | 181,234 | 13,869,139 | |
| Shares repurchased | (175,775) | (14,300,207) | (108,649) | (8,348,643) |
| Net increase | 7,983 | $ 823,216 | 72,585 | $ 5,520,496 |
91
| RetirementReady 2030 Fund | ||||
| Year ended 7/31/07: | Year ended 7/31/06: | |||
| CLASS A | Shares | Amount | Shares | Amount |
| Shares sold | 390,809 | $ 29,041,086 | 370,745 | $ 25,892,322 |
| Shares issued in connection with reinvestment of distributions | 54,526 | 3,923,114 | 26,897 | 1,841,348 |
| 445,335 | 32,964,200 | 397,642 | 27,733,670 | |
| Shares repurchased | (362,737) | (27,307,535) | (209,795) | (14,637,787) |
| Net increase | 82,598 | $ 5,656,665 | 187,847 | $ 13,095,883 |
| Year ended 7/31/07: | Year ended 7/31/06: | |||
| CLASS B | Shares | Amount | Shares | Amount |
| Shares sold | 5,545 | $ 395,532 | 2,296 | $156,819 |
| Shares issued in connection with reinvestment of distributions | 464 | 32,513 | 206 | 13,804 |
| 6,009 | 428,045 | 2,502 | 170,623 | |
| Shares repurchased | (1,993) | (146,412) | (1,396) | (95,815) |
| Net increase | 4,016 | $ 281,633 | 1,106 | $ 74,808 |
| Year ended 7/31/07: | Year ended 7/31/06: | |||
| CLASS C | Shares | Amount | Shares | Amount |
| Shares sold | 1,153 | $ 81,439 | 944 | $ 63,856 |
| Shares issued in connection with reinvestment of distributions | 26 | 1,844 | 31 | 2,019 |
| 1,179 | 83,283 | 975 | 65,875 | |
| Shares repurchased | (564) | (40,032) | (669) | (46,052) |
| Net increase | 615 | $ 43,251 | 306 | $ 19,823 |
| Year ended 7/31/07: | Year ended 7/31/06: | |||
| CLASS M | Shares | Amount | Shares | Amount |
| Shares sold | 3,250 | $ 238,774 | 9,524 | $672,494 |
| Shares issued in connection with reinvestment of distributions | 813 | 56,962 | 38 | 2,534 |
| 4,063 | 295,736 | 9,562 | 675,028 | |
| Shares repurchased | (2,192) | (156,021) | (1,285) | (90,490) |
| Net increase | 1,871 | $ 139,715 | 8,277 | $584,538 |
| Year ended 7/31/07: | Year ended 7/31/06: | |||
| CLASS R | Shares | Amount | Shares | Amount |
| Shares sold | 2,900 | $212,070 | 1,156 | $78,424 |
| Shares issued in connection with reinvestment of distributions | 120 | 8,362 | 35 | 2,341 |
| 3,020 | 220,432 | 1,191 | 80,765 | |
| Shares repurchased | (802) | (60,244) | (19) | (1,318) |
| Net increase | 2,218 | $160,188 | 1,172 | $79,447 |
| Year ended 7/31/07: | Year ended 7/31/06: | |||
| CLASS Y | Shares | Amount | Shares | Amount |
| Shares sold | 199,282 | $ 15,994,811 | 205,779 | $ 15,452,168 |
| Shares issued in connection with reinvestment of distributions | 34,778 | 2,718,258 | 23,565 | 1,741,944 |
| 234,060 | 18,713,069 | 229,344 | 17,194,112 | |
| Shares repurchased | (351,336) | (27,870,670)�� | (168,124) | (12,627,519) |
| Net increase (decrease) | (117,276) | $ (9,157,601) | 61,220 | $ 4,566,593 |
92
| RetirementReady 2025 Fund | ||||
| Year ended 7/31/07: | Year ended 7/31/06: | |||
| CLASS A | Shares | Amount | Shares | Amount |
| Shares sold | 480,827 | $ 37,320,545 | 407,888 | $ 29,844,516 |
| Shares issued in connection with reinvestment of distributions | 71,387 | 5,341,148 | 36,976 | 2,661,545 |
| 552,214 | 42,661,693 | 444,864 | 32,506,061 | |
| Shares repurchased | (501,490) | (39,320,045) | (271,412) | (19,895,127) |
| Net increase | 50,724 | $ 3,341,648 | 173,452 | $ 12,610,934 |
| Year ended 7/31/07: | Year ended 7/31/06: | |||
| CLASS B | Shares | Amount | Shares | Amount |
| Shares sold | 5,591 | $416,293 | 9,062 | $ 636,921 |
| Shares issued in connection with reinvestment of distributions | 916 | 65,893 | 223 | 15,546 |
| 6,507 | 482,186 | 9,285 | 652,467 | |
| Shares repurchased | (1,192) | (88,614) | (2,108) | (149,078) |
| Net increase | 5,315 | $393,572 | 7,177 | $ 503,389 |
| Year ended 7/31/07: | Year ended 7/31/06: | |||
| CLASS C | Shares | Amount | Shares | Amount |
| Shares sold | 858 | $64,183 | 982 | $ 68,590 |
| Shares issued in connection with reinvestment of distributions | 136 | 9,803 | 34 | 2,389 |
| 994 | 73,986 | 1,016 | 70,979 | |
| Shares repurchased | (19) | (1,441) | (190) | (13,462) |
| Net increase | 975 | $72,545 | 826 | $ 57,517 |
| Year ended 7/31/07: | Year ended 7/31/06: | |||
| CLASS M | Shares | Amount | Shares | Amount |
| Shares sold | 1,565 | $ 117,469 | 3,061 | $ 217,680 |
| Shares issued in connection with reinvestment of distributions | 286 | 20,751 | 134 | 9,360 |
| 1,851 | 138,220 | 3,195 | 227,040 | |
| Shares repurchased | (1,620) | (122,811) | (1,908) | (135,302) |
| Net increase | 231 | $ 15,409 | 1,287 | $ 91,738 |
| Year ended 7/31/07: | Year ended 7/31/06: | |||
| CLASS R | Shares | Amount | Shares | Amount |
| Shares sold | 2,154 | $161,701 | 1,546 | $107,082 |
| Shares issued in connection with reinvestment of distributions | 147 | 10,565 | 2 | 107 |
| 2,301 | 172,266 | 1,548 | 107,189 | |
| Shares repurchased | (44) | (3,328) | (1) | (32) |
| Net increase | 2,257 | $168,938 | 1,547 | $107,157 |
| Year ended 7/31/07: | Year ended 7/31/06: | |||
| CLASS Y | Shares | Amount | Shares | Amount |
| Shares sold | 248,767 | $ 19,295,928 | 275,688 | $ 20,166,475 |
| Shares issued in connection with reinvestment of distributions | 59,267 | 4,448,612 | 37,104 | 2,677,422 |
| 308,034 | 23,744,540 | 312,792 | 22,843,897 | |
| Shares repurchased | (457,014) | (34,966,421) | (333,322) | (24,452,585) |
| Net decrease | (148,980) | $(11,221,881) | (20,530) | $ (1,608,688) |
93
| RetirementReady 2020 Fund | ||||
| Year ended 7/31/07: | Year ended 7/31/06: | |||
| CLASS A | Shares | Amount | Shares | Amount |
| Shares sold | 559,546 | $ 38,918,335 | 719,907 | $ 47,935,826 |
| Shares issued in connection with reinvestment of distributions | 98,782 | 6,671,753 | 40,617 | 2,667,365 |
| 658,328 | 45,590,088 | 760,524 | 50,603,191 | |
| Shares repurchased | (602,866) | (42,348,611) | (338,491) | (22,549,870) |
| Net increase | 55,462 | $ 3,241,477 | 422,033 | $ 28,053,321 |
| Year ended 7/31/07: | Year ended 7/31/06: | |||
| CLASS B | Shares | Amount | Shares | Amount |
| Shares sold | 4,659 | $ 320,383 | 5,957 | $391,792 |
| Shares issued in connection with reinvestment of distributions | 638 | 42,235 | 212 | 13,699 |
| 5,297 | 362,618 | 6,169 | 405,491 | |
| Shares repurchased | (2,567) | (175,491) | (1,489) | (97,626) |
| Net increase | 2,730 | $ 187,127 | 4,680 | $307,865 |
| Year ended 7/31/07: | Year ended 7/31/06: | |||
| CLASS C | Shares | Amount | Shares | Amount |
| Shares sold | 1,357 | $ 91,484 | 892 | $ 57,848 |
| Shares issued in connection with reinvestment of distributions | 98 | 6,505 | 46 | 2,957 |
| 1,455 | 97,989 | 938 | 60,805 | |
| Shares repurchased | (497) | (33,140) | (198) | (13,000) |
| Net increase | 958 | $ 64,849 | 740 | $ 47,805 |
| Year ended 7/31/07: | Year ended 7/31/06: | |||
| CLASS M | Shares | Amount | Shares | Amount |
| Shares sold | 17,809 | $1,223,630 | 5,414 | $ 354,513 |
| Shares issued in connection with reinvestment of distributions | 622 | 41,228 | 251 | 16,199 |
| 18,431 | 1,264,858 | 5,665 | 370,712 | |
| Shares repurchased | (11,084) | (762,568) | (1,674) | (110,026) |
| Net increase | 7,347 | $ 502,290 | 3,991 | $ 260,686 |
| Year ended 7/31/07: | Year ended 7/31/06: | |||
| CLASS R | Shares | Amount | Shares | Amount |
| Shares sold | 1,739 | $119,596 | 1,534 | $101,025 |
| Shares issued in connection with reinvestment of distributions | 142 | 9,404 | 37 | 2,404 |
| 1,881 | 129,000 | 1,571 | 103,429 | |
| Shares repurchased | (30) | (2,047) | (18) | (1,195) |
| Net increase | 1,851 | $126,953 | 1,553 | $102,234 |
| Year ended 7/31/07: | Year ended 7/31/06: | |||
| CLASS Y | Shares | Amount | Shares | Amount |
| Shares sold | 253,031 | $ 18,843,101 | 373,901 | $ 26,497,931 |
| Shares issued in connection with reinvestment of distributions | 59,189 | 4,301,264 | 38,855 | 2,730,709 |
| 312,220 | 23,144,365 | 412,756 | 29,228,640 | |
| Shares repurchased | (642,219) | (47,316,819) | (323,785) | (22,981,862) |
| Net increase (decrease) | (329,999) | $(24,172,454) | 88,971 | $ 6,246,778 |
94
| RetirementReady 2015 Fund | ||||
| Year ended 7/31/07: | Year ended 7/31/06: | |||
| CLASS A | Shares | Amount | Shares | Amount |
| Shares sold | 753,679 | $ 51,490,200 | 500,567 | $ 33,271,733 |
| Shares issued in connection with reinvestment of distributions | 89,656 | 5,962,149 | 51,641 | 3,377,298 |
| 843,335 | 57,452,349 | 552,208 | 36,649,031 | |
| Shares repurchased | (622,017) | (42,641,666) | (386,600) | (25,763,157) |
| Net increase | 221,318 | $ 14,810,683 | 165,608 | $ 10,885,874 |
| Year ended 7/31/07: | Year ended 7/31/06: | |||
| CLASS B | Shares | Amount | Shares | Amount |
| Shares sold | 7,885 | $ 520,187 | 6,506 | $ 423,755 |
| Shares issued in connection with reinvestment of distributions | 655 | 42,664 | 168 | 10,782 |
| 8,540 | 562,851 | 6,674 | 434,537 | |
| Shares repurchased | (2,519) | (167,969) | (3,394) | (220,823) |
| Net increase | 6,021 | $ 394,882 | 3,280 | $ 213,714 |
| Year ended 7/31/07: | Year ended 7/31/06: | |||
| CLASS C | Shares | Amount | Shares | Amount |
| Shares sold | 375 | $ 25,108 | 2,359 | $154,370 |
| Shares issued in connection with reinvestment of distributions | 203 | 13,289 | 113 | 7,235 |
| 578 | 38,397 | 2,472 | 161,605 | |
| Shares repurchased | (1,627) | (109,060) | (251) | (16,547) |
| Net increase (decrease) | (1,049) | $ (70,663) | 2,221 | $145,058 |
| Year ended 7/31/07: | Year ended 7/31/06: | |||
| CLASS M | Shares | Amount | Shares | Amount |
| Shares sold | 2,520 | $ 165,828 | 2,202 | $ 146,369 |
| Shares issued in connection with reinvestment of distributions | 106 | 6,926 | 144 | 9,311 |
| 2,626 | 172,754 | 2,346 | 155,680 | |
| Shares repurchased | (2,437) | (163,250) | (2,345) | (155,420) |
| Net increase | 189 | $ 9,504 | 1 | $ 260 |
| Year ended 7/31/07: | Year ended 7/31/06: | |||
| CLASS R | Shares | Amount | Shares | Amount |
| Shares sold | 1,713 | $115,132 | 507 | $ 33,440 |
| Shares issued in connection with reinvestment of distributions | 11 | 749 | 27 | 1,758 |
| 1,724 | 115,881 | 534 | 35,198 | |
| Shares repurchased | (98) | (6,701) | (494) | (32,350) |
| Net increase | 1,626 | $109,180 | 40 | $ 2,848 |
| Year ended 7/31/07: | Year ended 7/31/06: | |||
| CLASS Y | Shares | Amount | Shares | Amount |
| Shares sold | 239,504 | $ 16,341,840 | 324,159 | $ 21,518,681 |
| Shares issued in connection with reinvestment of distributions | 54,998 | 3,667,280 | 51,956 | 3,404,647 |
| 294,502 | 20,009,120 | 376,115 | 24,923,328 | |
| Shares repurchased | (586,552) | (39,793,743) | (659,792) | (44,530,750) |
| Net decrease | (292,050) | $(19,784,623) | (283,677) | $(19,607,422) |
95
| RetirementReady 2010 Fund | ||||
| Year ended 7/31/07: | Year ended 7/31/06: | |||
| CLASS A | Shares | Amount | Shares | Amount |
| Shares sold | 320,011 | $ 19,076,702 | 463,948 | $ 27,381,349 |
| Shares issued in connection with reinvestment of distributions | 55,657 | 3,234,777 | 28,873 | 1,687,326 |
| 375,668 | 22,311,479 | 492,821 | 29,068,675 | |
| Shares repurchased | (447,867) | (26,575,033) | (391,177) | (23,091,112) |
| Net increase (decrease) | (72,199) | $ (4,263,554) | 101,644 | $ 5,977,563 |
| Year ended 7/31/07: | Year ended 7/31/06: | |||
| CLASS B | Shares | Amount | Shares | Amount |
| Shares sold | 3,511 | $ 206,477 | 5,253 | $ 304,449 |
| Shares issued in connection with reinvestment of distributions | 332 | 18,937 | 47 | 2,691 |
| 3,843 | 225,414 | 5,300 | 307,140 | |
| Shares repurchased | (3,426) | (199,682) | (2,777) | (160,695) |
| Net increase | 417 | $ 25,732 | 2,523 | $ 146,445 |
| Year ended 7/31/07: | Year ended 7/31/06: | |||
| CLASS C | Shares | Amount | Shares | Amount |
| Shares sold | 2,023 | $116,953 | 457 | $26,618 |
| Shares issued in connection with reinvestment of distributions | 45 | 2,535 | 22 | 1,263 |
| 2,068 | 119,488 | 479 | 27,881 | |
| Shares repurchased | (1,129) | (66,260) | (92) | (5,356) |
| Net increase | 939 | $ 53,228 | 387 | $22,525 |
| Year ended 7/31/07: | Year ended 7/31/06: | |||
| CLASS M | Shares | Amount | Shares | Amount |
| Shares sold | 858 | $ 49,935 | 1,477 | $ 86,324 |
| Shares issued in connection with reinvestment of distributions | 154 | 8,758 | 78 | 4,486 |
| 1,012 | 58,693 | 1,555 | 90,810 | |
| Shares repurchased | (987) | (57,675) | (322) | (18,715) |
| Net increase | 25 | $ 1,018 | 1,233 | $ 72,095 |
| Year ended 7/31/07: | Year ended 7/31/06: | |||
| CLASS R | Shares | Amount | Shares | Amount |
| Shares sold | 3,637 | $209,326 | 1,719 | $ 99,897 |
| Shares issued in connection with reinvestment of distributions | 98 | 5,631 | 70 | 4,019 |
| 3,735 | 214,957 | 1,789 | 103,916 | |
| Shares repurchased | (1,403) | (81,082) | (412) | (24,065) |
| Net increase | 2,332 | $133,875 | 1,377 | $ 79,851 |
| Year ended 7/31/07: | Year ended 7/31/06: | |||
| CLASS Y | Shares | Amount | Shares | Amount |
| Shares sold | 147,962 | $ 9,238,326 | 229,493 | $ 14,132,242 |
| Shares issued in connection with reinvestment of distributions | 36,183 | 2,204,258 | 26,556 | 1,621,242 |
| 184,145 | 11,442,584 | 256,049 | 15,753,484 | |
| Shares repurchased | (479,577) | (29,895,229) | (294,224) | (18,259,103) |
| Net decrease | (295,432) | $(18,452,645) | (38,175) | $ (2,505,619) |
96
| RetirementReady Maturity Fund | ||||
| Year ended 7/31/07: | Year ended 7/31/06: | |||
| CLASS A | Shares | Amount | Shares | Amount |
| Shares sold | 254,298 | $ 14,678,621 | 284,325 | $ 16,176,384 |
| Shares issued in connection with reinvestment of distributions | 29,075 | 1,668,732 | 23,475 | 1,330,584 |
| 283,373 | 16,347,353 | 307,800 | 17,506,968 | |
| Shares repurchased | (444,444) | (25,617,268) | (197,660) | (11,228,688) |
| Net increase (decrease) | (161,071) | $ (9,269,915) | 110,140 | $ 6,278,280 |
| Year ended 7/31/07: | Year ended 7/31/06: | |||
| CLASS B | Shares | Amount | Shares | Amount |
| Shares sold | 1,374 | $78,973 | 672 | $ 37,838 |
| Shares issued in connection with reinvestment of distributions | 129 | 7,406 | 81 | 4,574 |
| 1,503 | 86,379 | 753 | 42,412 | |
| Shares repurchased | (135) | (7,767) | (453) | (25,762) |
| Net increase | 1,368 | $78,612 | 300 | $ 16,650 |
| Year ended 7/31/07: | Year ended 7/31/06: | |||
| CLASS C | Shares | Amount | Shares | Amount |
| Shares sold | 442 | $ 25,000 | — | $ — |
| Shares issued in connection with reinvestment of distributions | 16 | 901 | 1 | 39 |
| 458 | 25,901 | 1 | 39 | |
| Shares repurchased | (458) | (26,476) | — | — |
| Net increase (decrease) | —* | $ (575) | 1 | $39 |
| Year ended 7/31/07: | Year ended 7/31/06: | |||
| CLASS M | Shares | Amount | Shares | Amount |
| Shares sold | 300 | $ 17,111 | 1,319 | $74,164 |
| Shares issued in connection with reinvestment of distributions | 64 | 3,652 | 8 | 456 |
| 364 | 20,763 | 1,327 | 74,620 | |
| Shares repurchased | (1,460) | (85,149) | (18) | (1,017) |
| Net increase (decrease) | (1,096) | $(64,386) | 1,309 | $73,603 |
| Year ended 7/31/07: | Year ended 7/31/06: | |||
| CLASS R | Shares | Amount | Shares | Amount |
| Shares sold | 734 | $ 42,531 | 839 | $46,798 |
| Shares issued in connection with reinvestment of distributions | 63 | 3,617 | 3 | 183 |
| 797 | 46,148 | 842 | 46,981 | |
| Shares repurchased | (239) | (13,765) | — | — |
| Net increase | 558 | $ 32,383 | 842 | $46,981 |
| Year ended 7/31/07: | Year ended 7/31/06: | |||
| CLASS Y | Shares | Amount | Shares | Amount |
| Shares sold | 87,305 | $ 5,044,556 | 114,640 | $ 6,536,020 |
| Shares issued in connection with reinvestment of distributions | 9,991 | 574,622 | 12,721 | 723,234 |
| 97,296 | 5,619,178 | 127,361 | 7,259,254 | |
| Shares repurchased | (172,595) | (9,910,526) | (260,138) | (14,877,302) |
| Net decrease | (75,299) | $(4,291,348) | (132,777) | $ (7,618,048) |
* Represents fractional shares.
97
At July 31, 2007, Putnam LLC and its affiliates owned the following shares of each fund:
| Percentage | |||
| of shares | Value at | ||
| Shares owned | outstanding | July 31, 2007 | |
| RetirementReady | |||
| 2050 Fund class C | 21 | 8.50% | $ 1,332 |
| 2050 Fund class M | 21 | 4.63% | 1,338 |
| 2045 Fund class C | 1 | 0.60% | 108 |
| 2045 Fund class M | 13 | 100.00% | 1,018 |
| 2040 Fund class C | 18 | 7.70% | 1,369 |
| 2040 Fund class M | 1 | 0.80% | 109 |
| Maturity Fund class B | 1,855 | 48.40% | 106,044 |
| Maturity Fund class C | 19 | 100.00% | 1,116 |
| Maturity Fund class M | 20 | 7.90% | 1,124 |
Note 5: Transactions with affiliated issuers
Transactions during the year with companies in which a fund owned at least 5% or more of the outstanding voting securities, or a company which is under common ownership or control of such fund were as follows:
| RetirementReady 2050 Fund | |||||
| Affiliates | Purchase cost | Sale proceeds | Investment income | Market value | |
| Putnam Capital Opportunities Fund | $ | 2,724,969 | $1,027,977 | $ 2,587 | $ 2,196,862 |
| Putnam Fund for Growth and Income | 4,556,626 | 1,663,029 | 29,191 | 3,800,905 | |
| Putnam International Equity Fund | 5,288,693 | 2,195,438 | 55,788 | 4,716,934 | |
| Putnam Voyager Fund | 4,398,866 | 1,644,973 | — | 3,913,823 | |
| Putnam Income Fund | 751,445 | 263,287 | 19,547 | 648,626 | |
| Putnam Money Market Fund | 206,339 | 90,059 | 4,668 | 154,982 | |
| Totals | $17,926,938 | $6,884,763 | $ 111,781 | $15,432,132 | |
| Market values are shown for those securities affiliated at period end. | |||||
| RetirementReady 2045 Fund | |||||
| Affiliates | Purchase cost | Sale proceeds | Investment income | Market value | |
| Putnam Capital Opportunities Fund | $ | 5,220,447 | $ 3,935,033 | $ 11,451 | $ 4,976,648 |
| Putnam Fund for Growth and Income | 8,705,099 | 6,422,276 | 103,832 | 8,616,426 | |
| Putnam International Equity Fund | 9,697,637 | 8,369,350 | 240,445 | 10,700,556 | |
| Putnam Voyager Fund | 7,951,533 | 6,316,305 | — | 8,877,429 | |
| Putnam Income Fund | 1,428,456 | 1,013,101 | 65,601 | 1,471,353 | |
| Putnam Money Market Fund | 433,288 | 333,990 | 15,564 | 349,313 | |
| Totals | $33,436,460 | $26,390,055 | $436,893 | $34,991,725 | |
| Market values are shown for those securities affiliated at period end. | |||||
| RetirementReady 2040 Fund | |||||
| Affiliates | Purchase cost | Sale proceeds | Investment income | Market value | |
| Putnam Capital Opportunities Fund | $ | 5,315,424 | $ 3,667,911 | $ 14,153 | $ 6,299,673 |
| Putnam Fund for Growth and Income | 9,144,852 | 6,155,733 | 131,011 | 11,219,392 | |
| Putnam International Equity Fund | 9,824,578 | 8,444,389 | 291,728 | 13,544,918 | |
| Putnam Voyager Fund | 8,138,970 | 5,984,046 | — | 11,559,613 | |
| Putnam Income Fund | 3,080,145 | 1,722,692 | 148,449 | 3,493,495 | |
| Putnam Money Market Fund | 1,297,103 | 862,811 | 64,278 | 1,473,526 | |
| Totals | $36,801,072 | $26,837,582 | $649,619 | $47,590,617 | |
98
Market values are shown for those securities affiliated at period end.
| RetirementReady 2035 Fund | ||||
| Affiliates | Purchase cost | Sale proceeds | Investment income | Market value |
| Putnam Capital Opportunities Fund | $ 6,836,748 | $ 5,153,893 | $ 20,370 | $ 9,025,348 |
| Putnam Fund for Growth and Income | 12,178,898 | 9,622,710 | 198,933 | 16,586,459 |
| Putnam International Equity Fund | 12,487,889 | 11,393,125 | 419,829 | 19,402,837 |
| Putnam Voyager Fund | 10,574,327 | 8,617,722 | — | 17,088,524 |
| Putnam Income Fund | 6,512,646 | 4,073,274 | 366,002 | 8,467,748 |
| Putnam Money Market Fund | 2,365,259 | 1,673,317 | 135,490 | 3,046,427 |
| Totals | $50,955,767 | $40,534,041 | $1,140,624 | $73,617,343 |
| Market values are shown for those securities affiliated at period end. | ||||
| RetirementReady 2030 Fund | ||||
| Affiliates | Purchase cost | Sale proceeds | Investment income | Market value |
| Putnam Capital Opportunities Fund | $ 7,965,808 | $ 7,935,922 | $ 27,878 | $10,536,682 |
| Putnam Fund for Growth and Income | 14,629,090 | 14,332,599 | 269,371 | 20,068,317 |
| Putnam International Equity Fund | 14,380,802 | 18,330,153 | 575,863 | 22,656,772 |
| Putnam Voyager Fund | 12,334,070 | 13,780,174 | — | 20,677,846 |
| Putnam Income Fund | 9,450,372 | 8,766,737 | 666,930 | 13,632,436 |
| Putnam Money Market Fund | 5,207,017 | 3,923,028 | 274,976 | 5,800,591 |
| Totals | $63,967,159 | $67,068,613 | $1,815,018 | $93,372,644 |
| Market values are shown for those securities affiliated at period end. | ||||
| RetirementReady 2025 Fund | ||||
| Affiliates | Purchase cost | Sale proceeds | Investment income | Market value |
| Putnam Capital Opportunities Fund | $ 9,410,439 | $ 9,935,655 | $ 34,148 | $ 12,645,081 |
| Putnam Fund for Growth and Income | 17,980,302 | 18,708,439 | 343,759 | 25,081,250 |
| Putnam International Equity Fund | 16,893,781 | 23,038,241 | 697,928 | 27,193,796 |
| Putnam Voyager Fund | 15,042,578 | 17,991,073 | — | 25,844,512 |
| Putnam Income Fund | 15,732,703 | 14,266,730 | 1,066,345 | 21,679,467 |
| Putnam Money Market Fund | 7,359,878 | 7,106,696 | 501,428 | 10,152,145 |
| Totals | $82,419,681 | $91,046,834 | $2,643,608 | $122,596,251 |
| Market values are shown for those securities affiliated at period end. | ||||
| RetirementReady 2020 Fund | ||||
| Affiliates | Purchase cost | Sale proceeds | Investment income | Market value |
| Putnam Capital Opportunities Fund | $ 9,254,498 | $ 11,098,080 | $ 38,023 | $ 13,408,533 |
| Putnam Fund for Growth and Income | 18,455,383 | 21,894,131 | 397,655 | 27,857,539 |
| Putnam International Equity Fund | 12,289,658 | 19,878,875 | 582,968 | 21,623,309 |
| Putnam Voyager Fund | 15,010,151 | 21,024,209 | — | 28,703,547 |
| Putnam Income Fund | 23,834,988 | 25,193,113 | 1,898,262 | 37,164,584 |
| Putnam Money Market Fund | 9,667,253 | 10,586,655 | 757,267 | 14,806,164 |
| Totals | $88,511,931 | $109,675,063 | $ 3,674,175 | $143,563,676 |
Market values are shown for those securities affiliated at period end.
99
| RetirementReady 2015 Fund | ||||
| Affiliates | Purchase cost | Sale proceeds | Investment income | Market value |
| Putnam Capital Opportunities Fund | $ 8,830,082 | $ 10,678,916 | $ 32,175 | $ 10,870,785 |
| Putnam Fund for Growth and Income | 15,988,241 | 18,030,291 | 288,925 | 20,072,146 |
| Putnam International Equity Fund | 7,306,898 | 10,683,310 | 292,071 | 10,385,896 |
| Putnam Voyager Fund | 13,168,130 | 17,190,308 | — | 20,678,334 |
| Putnam Income Fund | 32,898,757 | 30,216,124 | 2,254,859 | 44,178,634 |
| Putnam Money Market Fund | 19,766,425 | 16,723,414 | 1,201,319 | 24,055,100 |
| Totals | $97,958,533 | $103,522,363 | $4,069,349 | $130,240,895 |
| Market values are shown for those securities affiliated at period end. | ||||
| RetirementReady 2010 Fund | ||||
| Affiliates | Purchase cost | Sale proceeds | Investment income | Market value |
| Putnam Capital Opportunities Fund | $ 2,229,855 | $ 4,348,730 | $ 9,946 | $ 2,982,675 |
| Putnam Fund for Growth and Income | 5,032,033 | 8,649,830 | 112,584 | 6,815,049 |
| Putnam International Equity Fund | 833,036 | 2,457,795 | 40,517 | 1,282,369 |
| Putnam Voyager Fund | 3,943,329 | 8,290,364 | — | 7,021,058 |
| Putnam Income Fund | 18,648,256 | 26,569,859 | 1,602,350 | 28,432,232 |
| Putnam Money Market Fund | 13,332,938 | 17,442,263 | 1,018,447 | 18,501,053 |
| Totals | $44,019,447 | $67,758,841 | $2,783,844 | $65,034,436 |
| Market values are shown for those securities affiliated at period end. | ||||
| RetirementReady Maturity Fund | ||||
| Affiliates | Purchase cost | Sale proceeds | Investment income | Market value |
| Putnam Capital Opportunities Fund | $ 1,439,329 | $ 2,139,335 | $ 5,867 | $ 1,497,220 |
| Putnam Fund for Growth and Income | 2,871,944 | 4,270,035 | 52,871 | 3,110,703 |
| Putnam International Equity Fund | — | — | — | — |
| Putnam Voyager Fund | 2,317,910 | 4,120,653 | — | 3,204,735 |
| Putnam Income Fund | 11,438,813 | 17,338,409 | 906,962 | 14,945,670 |
| Putnam Money Market Fund | 7,893,437 | 11,557,501 | 602,824 | 9,953,555 |
| Totals | $25,961,433 | $39,425,933 | $1,568,524 | $32,711,883 |
Market values are shown for those securities affiliated at period end.
Note 6: Regulatory matters and litigation
In late 2003 and 2004, Putnam Management settled charges brought by the Securities and Exchange Commission (the “SEC”) and the Massachusetts Securities Division in connection with excessive short-term trading in Putnam funds. Payments from Putnam Management will be distributed to certain open-end Putnam funds and their shareholders. These allegations and related matters have served as the general basis for certain lawsuits, including purported class action lawsuits against Putnam Management and, in a limited number of cases, some Putnam funds. Putnam Management believes that these lawsuits will have no material adverse effect on the funds or on Putnam Management’s ability to provide investment management services. In addition, Putnam Management has agreed to bear any costs incurred by the Putnam funds as a result of these matters.
Putnam Management and Putnam Retail Management are named as defendants in a civil suit in which the plaintiffs allege that the management and distribution fees paid by certain Putnam funds were excessive and seek recovery under the Investment Company Act of 1940. Putnam Management and Putnam Retail Management have contested the plaintiffs’ claims and the matter is currently pending in the U.S. District Court for the District of Massachusetts. Based on currently available information, Putnam Management believes that this action is without merit and that it is unlikely to have a material effect on Putnam Management’s and Putnam Retail Management’s ability to provide services to their clients, including the Trust.
Note 7: New accounting pronouncement
In June 2006, the Financial Accounting Standards Board (“FASB”) issued Interpretation No. 48, Accounting for Uncertainty in Income Taxes (the “Interpretation”). The Interpretation prescribes a minimum threshold for financial statement recognition of the benefit of a tax position taken or expected to be taken by a filer in the filer’s tax return. The Interpretation is not expected to have a material effect on the funds’ financial statements. However, the conclusions regarding the Interpretation may be subject to review and adjustment at a later date based on factors including, but not limited to, further implementation guidance expected
100
from the FASB, and on-going analysis of tax laws, regulations and interpretations thereof.
In September 2006, the FASB issued Statement of Financial Accounting Standards No. 157, Fair Value Measurements (the “Standard”). The Standard defines fair value, sets out a framework for measuring fair value and requires additional disclosures about fair value measurements. The Standard applies to fair value measurements already required or permitted by existing standards. The Standard is effective for financial statements issued for fiscal years beginning after November 15, 2007 and interim periods within those fiscal years. Putnam Management is currently evaluating what impact the adoption of the Standard will have on the funds’ financial statements.
101
Federal tax information and brokerage
commissions (unaudited)
Federal tax information
Each fund has designated the following percentages of that fund’s distributions from net investment income as qualifying for the dividends received deduction for corporations.
Pursuant to Section 852 of the Internal Revenue Code, as amended, each fund hereby designates the following amounts as long term capital gains, for its taxable year ended July 31, 2007.
| Fund Name | Qualifying % |
| RetirementReady | |
| 2050 Fund | 5.20% |
| 2045 Fund | 19.84 |
| 2040 Fund | 18.32 |
| 2035 Fund | 16.17 |
| 2030 Fund | 14.32 |
| 2025 Fund | 12.81 |
| 2020 Fund | 11.11 |
| 2015 Fund | 7.93 |
| 2010 Fund | 4.50 |
| Maturity Fund | 4.13 |
For its tax year ended July 31, 2007, each fund hereby designates the following amounts or the maximum amount allowable, of its net taxable income as qualified dividends taxed at individual net capital gain rates.
| Fund Name | Qualifying % |
| RetirementReady | |
| 2050 Fund | 20.37% |
| 2045 Fund | 82.59 |
| 2040 Fund | 74.53 |
| 2035 Fund | 64.26 |
| 2030 Fund | 56.86 |
| 2025 Fund | 49.55 |
| 2020 Fund | 36.09 |
| 2015 Fund | 21.37 |
| 2010 Fund | 9.11 |
| Maturity Fund | 6.70 |
| Fund Name | Amount |
| RetirementReady | |
| 2050 Fund | $ 403,648 |
| 2045 Fund | 4,076,278 |
| 2040 Fund | 4,838,062 |
| 2035 Fund | 7,439,040 |
| 2030 Fund | 11,278,834 |
| 2025 Fund | 14,499,739 |
| 2020 Fund | 14,262,453 |
| 2015 Fund | 9,615,081 |
| 2010 Fund | 2,947,152 |
| Maturity Fund | 1,216,642 |
The Form 1099 you receive in January 2008 will show the tax status of all distributions paid to your account for calendar 2007.
Brokerage commissions
Brokerage commissions are paid to firms that execute trades on behalf of your fund. When choosing these firms, Putnam is required by law to seek the best execution of the trades, taking all relevant factors into consideration, including expected quality of execution and commission rate. The Putnam RetirementReady Funds, however, invest in shares of other Putnam mutual funds, rather than in stocks and bonds. For that reason, the funds do not incur brokerage charges.
102
Shareholder meeting
results (unaudited)
May 15, 2007 meeting
A proposal to approve a new management contract between each fund and Putnam Investment Management, LLC was approved as follows:
| Fund Name | Votes for | Votes against | Abstentions |
| RetirementReady | |||
| 2050 Fund | 106,974 | 173 | 12,726 |
| 2045 Fund | 242,444 | 3,151 | 47,955 |
| 2040 Fund | 344,489 | 3,848 | 56,083 |
| 2035 Fund | 534,711 | 4,157 | 85,699 |
| 2030 Fund | 761,658 | 11,041 | 140,488 |
| 2025 Fund | 1,045,069 | 20,758 | 217,954 |
| 2020 Fund | 1,304,246 | 14,318 | 243,901 |
| 2015 Fund | 1,349,812 | 5,777 | 204,987 |
| 2010 Fund | 754,237 | 10,256 | 121,593 |
| Maturity Fund | 522,922 | 5,766 | 44,745 |
All tabulations are rounded to the nearest whole number.
103
About the Trustees
Jameson A. Baxter (Born 1943), Trustee since 1994, Vice Chairman since 2005
Ms. Baxter is the President of Baxter Associates, Inc., a private investment firm.
Ms. Baxter serves as a Director of ASHTA Chemicals, Inc., Ryerson, Inc. (a metals service corporation), the Mutual Fund Directors Forum, and Advocate Health Care. She is Chairman Emeritus of the Board of Trustees, Mount Holyoke College, having served as Chairman for five years. Until 2007, she was a Director of Banta Corporation (a printing and supply chain management company). Until 2004, she was a Director of BoardSource (formerly the National Center for Nonprofit Boards), and until 2002, she was a Director of Intermatic Corporation (a manufacturer of energy control products).
Ms. Baxter has held various positions in investment banking and corporate finance, including Vice President and Principal of the Regency Group, and Vice President of and Consultant to First Boston Corporation. She is a graduate of Mount Holyoke College
Charles B. Curtis (Born 1940), Trustee since 2001
Mr. Curtis is President and Chief Operating Officer of the Nuclear Threat Initiative (a private foundation dealing with national security issues) and serves as Senior Advisor to the United Nations Foundation.
Mr. Curtis is a member of the Council on Foreign Relations and serves as a Director of Edison International and Southern California Edison. Until 2006, Mr. Curtis served as a member of the Trustee Advisory Council of the Applied Physics Laboratory, Johns Hopkins University. Until 2003, Mr. Curtis was a member of the Electric Power Research Institute Advisory Council and the University of Chicago Board of Governors for Argonne National Laboratory. Prior to 2002, Mr. Curtis was a Member of the Board of Directors of the Gas Technology Institute and the Board of Directors of the Environment and Natural Resources Program Steering Committee, John F. Kennedy School of Government, Harvard University. Until 2001, Mr. Curtis was a member of the Department of Defense Policy Board and Director of EG&G Technical Services, Inc. (a fossil energy research and development support company).
From August 1997 to December 1999, Mr. Curtis was a Partner at Hogan & Hartson L.L.P., a Washington, D.C. law firm. Prior to May 1997, Mr. Curtis was Deputy Secretary of Energy and Under Secretary of the U.S. Department of Energy. He served as Chairman of the Federal Energy Regulatory Commission from 1977 to 1981 and has held positions on the staff of the U.S. House of Representatives, the U.S. Treasury Department, and the SEC.
Robert J. Darretta (Born 1946), Trustee since 2007
Mr. Darretta serves as Director of UnitedHealth Group, a diversified health-care conglomerate.
Until April 2007, Mr. Darretta was Vice Chairman of the Board of Directors of Johnson & Johnson, a diversified health-care conglomerate. Prior to 2007, Mr. Darretta held several accounting and finance positions with Johnson & Johnson, including Chief Financial Officer, Executive Vice President, and Treasurer.
Mr. Darretta received a B.S. in Economics from Villanova University.
Myra R. Drucker (Born 1948), Trustee since 2004
Ms. Drucker is Chair of the Board of Trustees of Commonfund (a not-for-profit firm specializing in asset management for educational endowments and foundations), Vice Chair of the Board of Trustees of Sarah Lawrence College, and a member of the Investment Committee of the Kresge Foundation (a charitable trust). She is also a director of New York Stock Exchange LLC, a wholly-owned subsidiary of the publicly-traded NYSE Group, Inc., a director of Interactive Data Corporation (a provider of financial market data, analytics, and related services to financial institutions and individual investors), and an advisor to RCM Capital Management (an investment management firm).
Ms. Drucker is an ex-officio member of the New York Stock Exchange (NYSE) Pension Managers Advisory Committee, having served as Chair for seven years.
Until August 31, 2004, Ms. Drucker was Managing Director and a member of the Board of Directors of General Motors Asset Management and Chief Investment Officer of General Motors Trust Bank. Ms. Drucker also served as a member of the NYSE Corporate Accountability and Listing Standards Committee and the NYSE/NASD IPO Advisory Committee.
Prior to joining General Motors Asset Management in 2001, Ms. Drucker held various executive positions in the investment management industry. Ms. Drucker served as Chief Investment Officer of Xerox Corporation (a technology and service company in the document industry), where she was responsible for the investment of the company’s pension assets. Ms. Drucker was also Staff Vice President and Director of Trust Investments for International Paper (a paper products, paper distribution, packaging and forest products company) and previously served as Manager of Trust Investments for Xerox Corporation. Ms. Drucker received a B.A. degree in Literature and Psychology from Sarah Lawrence College and pursued graduate studies in economics, statistics and portfolio theory at Temple University.
104
John A. Hill (Born 1942), Trustee since 1985 and Chairman since 2000
Mr. Hill is Vice Chairman of First Reserve Corporation, a private equity buyout firm that specializes in energy investments in the diversified worldwide energy industry.
Mr. Hill is a Director of Devon Energy Corporation and various private companies controlled by First Reserve Corporation, as well as Chairman of TH Lee, Putnam Investment Trust (a closed-end investment company advised by an affiliate of Putnam Management). He is also a Trustee of Sarah Lawrence College. Until 2005, he was a Director of Continuum Health Partners of New York.
Prior to acquiring First Reserve Corporation in 1983, Mr. Hill held executive positions in investment banking and investment management with several firms and with the federal government, including Deputy Associate Director of the Office of Management and Budget and Deputy Director of the Federal Energy Administration. He is active in various business associations, including the Economic Club of New York, and lectures on energy issues in the United States and Europe. Mr. Hill holds a B.A. degree in Economics from Southern Methodist University and pursued graduate studies there as a Woodrow Wilson Fellow.
Paul L. Joskow (Born 1947), Trustee since 1997
Dr. Joskow is the Elizabeth and James Killian Professor of Economics and Management, and Director of the Center for Energy and Environmental Policy Research at the Massachusetts Institute of Technology.
Dr. Joskow serves as a Director of National Grid (a UK-based holding company with interests in electric and gas transmission and distribution and telecommunications infrastructure), a Director of TransCanada Corporation (an energy company focused on natural gas transmission and power services), a Director of Exelon Corporation (an energy company focused on power services), and a Member of the Board of Overseers of the Boston Symphony Orchestra. Prior to July 2006, he served as President of the Yale University Council and continues to serve as a Member of the Council. Prior to February 2005, he served on the board of the Whitehead Institute for Biomedical Research (a non-profit research institution). Prior to February 2002, he was a Director of State Farm Indemnity Company (an automobile insurance company), and prior to March 2000, he was a Director of New England Electric System (a public utility holding company).
Dr. Joskow has published six books and numerous articles on topics in industrial organization, government regulation of industry, and competition policy. He is active in industry restructuring, environmental, energy, competition and privatization policies — serving as an advisor to governments and corporations worldwide. Dr. Joskow holds a Ph.D. and M. Phil from Yale University and a B.A. from Cornell University.
Elizabeth T. Kennan (Born 1938), Trustee since 1992
Dr. Kennan is a Partner of Cambus-Kenneth Farm (thoroughbred horse and cattle breeding). She is President Emeritus of Mount Holyoke College.
Dr. Kennan served as Chairman and is now Lead Director of Northeast Utilities. She is a Trustee of the National Trust for Historic Preservation, of Centre College and of Midway College in Midway, Kentucky. Until 2006, she was a member of The Trustees of Reservations. Prior to 2001, Dr. Kennan served on the oversight committee of the Folger Shakespeare Library. Prior to June 2005, she was a Director of Talbots, Inc., and she has served as Director on a number of other boards, including Bell Atlantic, Chastain Real Estate, Shawmut Bank, Berkshire Life Insurance, and Kentucky Home Life Insurance. Dr. Kennan has also served as President of Five Colleges Incorporated, as a Trustee of Notre Dame University and is active in various educational and civic associations.
As a member of the faculty of Catholic University for twelve years, until 1978, Dr. Kennan directed the post-doctoral program in Patristic and Medieval Studies, taught history and published numerous articles. Dr. Kennan holds a Ph.D. from the University of Washington in Seattle, an M.S. from St. Hilda’s College at Oxford University and an A.B. from Mount Holyoke College. She holds several honorary doctorates.
Kenneth R. Leibler (Born 1949), Trustee since 2006
Mr. Leibler is a founding partner and former Chairman of the Boston Options Exchange, an electronic marketplace for the trading of listed derivative securities.
Mr. Leibler currently serves as a Trustee of Beth Israel Deaconess Hospital in Boston. He is also lead director of Ruder Finn Group, a global communications and advertising firm and a director of Northeast Utilities, which operates New England’s largest energy delivery system. Prior to December 2006, he served as a director of the Optimum Funds group. Prior to October 2006, he served as a director of ISO New England, the organization responsible for the operation of the electric generation system in the New England states. Prior to 2000, Mr. Leibler was a director of the Investment Company Institute in Washington, D.C.
105
Prior to January 2005, Mr. Leibler served as Chairman and Chief Executive Officer of the Boston Stock Exchange. Prior to January 2000, he served as President and Chief Executive Officer of Liberty Financial Companies, a publicly traded diversified asset management organization. Prior to June 1990, he served as President and Chief Operating Officer of the American Stock Exchange, and is the youngest person in Exchange history to hold the title of President. Prior to serving as Amex President, he held the position of Chief Financial Officer and headed its management and marketing operations. Mr. Leibler graduated magna cum laude with a degree in economics from Syracuse University, where he was elected Phi Beta Kappa.
Robert E. Patterson (Born 1945), Trustee since 1984
Mr. Patterson is Senior Partner of Cabot Properties, L.P. and Chairman of Cabot Properties, Inc. (a private equity firm investing in commercial real estate).
Mr. Patterson serves as Chairman Emeritus and Trustee of the Joslin Diabetes Center. Prior to June 2003, he was a Trustee of Sea Education Association. Prior to December 2001, he was President and Trustee of Cabot Industrial Trust (a publicly traded real estate investment trust). Prior to February 1998, he was Executive Vice President and Director of Acquisitions of Cabot Partners Limited Partnership (a registered investment adviser involved in institutional real estate investments).
Prior to 1990, he served as Executive Vice President of Cabot, Cabot & Forbes Realty Advisors, Inc. (the predecessor company of Cabot Partners). Mr. Patterson practiced law and held various positions in state government and was the founding Executive Director of the Massachusetts Industrial Finance Agency. Mr. Patterson is a graduate of Harvard College and Harvard Law School.
George Putnam, III (Born 1951), Trustee since 1984
Mr. Putnam is Chairman of New Generation Research, Inc. (a publisher of financial advisory and other research services), and President of New Generation Advisers, Inc. (a registered investment advisor to private funds). Mr. Putnam founded the New Generation companies in 1986.
Mr. Putnam is a Director of The Boston Family Office, LLC (a registered investment adviser). He is a Trustee of St. Mark’s School. Until 2006, he was a Trustee of Shore Country Day School, and until 2002 was a Trustee of the Sea Education Association.
Mr. Putnam previously worked as an attorney with the law firm of Dechert LLP (formerly known as Dechert Price & Rhoads) in Philadelphia. He is a graduate of Harvard College, Harvard Business School and Harvard Law School.
W. Thomas Stephens (Born 1942), Trustee since 1997
Mr. Stephens is Chairman and Chief Executive Officer of Boise Cascade, L.L.C. (a paper, forest products and timberland assets company).
Mr. Stephens is a Director of TransCanadaPipelines, Ltd. Until 2004, Mr. Stephens was a Director of Xcel Energy Incorporated (a public utility company), Qwest Communications, and Norske Canada, Inc. (a paper manufacturer). Until 2003, Mr. Stephens was a Director of Mail-Well, Inc. (a diversified printing company). He served as Chairman of Mail-Well until 2001 and as CEO of MacMillan-Bloedel, Ltd. (a forest products company) until 1999.
Prior to 1996, Mr. Stephens was Chairman and Chief Executive Officer of Johns Manville Corporation. He holds B.S. and M.S. degrees from the University of Arkansas.
Richard B. Worley (Born 1945), Trustee since 2004
Mr. Worley is Managing Partner of Permit Capital LLC, an investment management firm.
Mr. Worley serves as a Trustee of the University of Pennsylvania Medical Center, The Robert Wood Johnson Foundation (a philanthropic organization devoted to health care issues), and the National Constitution Center. He is also a Director of The Colonial Williamsburg Foundation (a historical preservation organization) and the Philadelphia Orchestra Association. Mr. Worley also serves on the investment committees of Mount Holyoke College and World Wildlife Fund (a wildlife conservation organization).
Prior to joining Permit Capital LLC in 2002, Mr. Worley served as Chief Strategic Officer of Morgan Stanley Investment Management. He previously served as President, Chief Executive Officer and Chief Investment Officer of Morgan Stanley Dean Witter Investment Management and as a Managing Director of Morgan Stanley, a financial services firm. Mr. Worley also was the Chairman of Miller Anderson & Sherrerd, an investment management firm.
Mr. Worley holds a B.S. degree from the University of Tennessee and pursued graduate studies in economics at the University of Texas.
106
Charles E. Haldeman, Jr.* (Born 1948), Trustee since 2004 and President of the Funds since 2007
Mr. Haldeman is President and Chief Executive Officer of Putnam, LLC (“Putnam Investments”) and President of the Putnam Funds. He is a member of Putnam Investments’ Executive Board of Directors and Advisory Council. Prior to November 2003, Mr. Haldeman served as Co-Head of Putnam Investments’ Investment Division.
Prior to joining Putnam Investments in 2002, Mr. Haldeman held executive positions in the investment management industry. He previously served as Chief Executive Officer of Delaware Investments and President and Chief Operating Officer of United Asset Management. Mr. Haldeman was also a partner and director of Cooke & Bieler, Inc. (an investment management firm). Mr. Haldeman currently serves on the Board of Governors of the Investment Company Institute and as Chair of the Board of Trustees of Dartmouth College. He also serves on the Partners HealthCare Investment Committee, the Tuck School of Business and Dartmouth College Board of Overseers, and the Harvard Business School Board of Dean’s Advisors. He is a graduate of Dartmouth College, Harvard Law School and Harvard Business School. Mr. Haldeman is also a Chartered Financial Analyst (CFA) charterholder.
The address of each Trustee is One Post Office Square, Boston, MA 02109.
As of July 31, 2007, there were 104 Putnam Funds. All Trustees serve as Trustees of all Putnam funds.
Each Trustee serves for an indefinite term, until his or her resignation, retirement at age 72, death, or removal.
* Trustee who is or may be deemed to be an "interested person" (as defined in the Investment Company Act of 1940) of the fund, Putnam Management, and/or Putnam Retail
Management. Mr. Haldeman is the President of your fund and each of the other Putnam funds, and is President and Chief Executive Officer of Putnam Investments.
107
Officers
In addition to Charles E. Haldeman, Jr., the other officers of the fund are shown below:
| Charles E. Porter (Born 1938) | Richard S. Robie, III (Born 1960) |
| Executive Vice President, Principal Executive Officer, Associate | Vice President |
| Treasurer, and Compliance Liaison | Since 2004 |
| Since 1989 | |
| Senior Managing Director, Putnam Investments, Putnam Management | |
| Jonathan S. Horwitz (Born 1955) | and Putnam Retail Management. Prior to 2003, Senior Vice President, |
| Senior Vice President and Treasurer | United Asset Management Corporation |
| Since 2004 | |
| Francis J. McNamara, III (Born 1955) | |
| Prior to 2004, Managing Director, | Vice President and Chief Legal Officer |
| Putnam Investments | Since 2004 |
| Steven D. Krichmar (Born 1958) | Senior Managing Director, Putnam Investments, Putnam Management |
| Vice President and Principal Financial Officer | and Putnam Retail Management. Prior to 2004, General Counsel, |
| Since 2002 | State Street Research & Management Company |
| Senior Managing Director, Putnam Investments | Robert R. Leveille (Born 1969) |
| Vice President and Chief Compliance Officer | |
| Janet C. Smith (Born 1965) | Since 2007 |
| Vice President, Principal Accounting Officer and Assistant Treasurer | |
| Since 2007 | Managing Director, Putnam Investments, Putnam Management, |
| and Putnam Retail Management. Prior to 2005, member of Bell | |
| Managing Director, Putnam Investments and Putnam Management | Boyd & Lloyd LLC. Prior to 2003, Vice President and Senior Counsel, |
| Liberty Funds Group LLC | |
| Susan G. Malloy (Born 1957) | |
| Vice President and Assistant Treasurer | Mark C. Trenchard (Born 1962) |
| Since 2007 | Vice President and BSA Compliance Officer |
| Since 2002 | |
| Managing Director, Putnam Investments | |
| Managing Director, Putnam Investments | |
| Beth S. Mazor (Born 1958) | |
| Vice President | Judith Cohen (Born 1945) |
| Since 2002 | Vice President, Clerk and Assistant Treasurer |
| Since 1993 | |
| Managing Director, Putnam Investments | |
| Wanda M. McManus (Born 1947) | |
| James P. Pappas (Born 1953) | Vice President, Senior Associate Treasurer and Assistant Clerk |
| Vice President | Since 2005 |
| Since 2004 | |
| Nancy E. Florek (Born 1957) | |
| Managing Director, Putnam Investments and Putnam Management. | Vice President, Assistant Clerk, Assistant Treasurer |
| During 2002, Chief Operating Officer, Atalanta/Sosnoff | and Proxy Manager |
| Management Corporation | Since 2005 |
The address of each Officer is One Post Office Square, Boston, MA 02109.
108
The Putnam Family of Funds
The following is a list of Putnam’s open-end mutual funds offered to the public. Investors should carefully consider the investment objective, risks, charges, and expenses of a fund before investing. For a prospectus containing this and other information for any Putnam fund or product, call your financial advisor at 1-800-225-1581 and ask for a prospectus. Please read the prospectus carefully before investing.
Growth funds
Discovery Growth Fund
Growth Opportunities Fund
Health Sciences Trust
International New Opportunities Fund*
New Opportunities Fund
OTC & Emerging Growth Fund
Small Cap Growth Fund*
Vista Fund
Voyager Fund
Blend funds
Capital Appreciation Fund
Capital Opportunities Fund*
Europe Equity Fund*
Global Equity Fund*
Global Natural Resources Fund*
International Capital Opportunities Fund*
International Equity Fund*
Investors Fund
Research Fund
Tax Smart Equity Fund®
Utilities Growth and Income Fund
Value funds
Classic Equity Fund
Convertible Income-Growth Trust
Equity Income Fund
The George Putnam Fund of Boston
The Putnam Fund for Growth and Income
International Growth and Income Fund*
Mid Cap Value Fund
New Value Fund
Small Cap Value Fund*
Income funds
American Government Income Fund
Diversified Income Trust
Floating Rate Income Fund
Global Income Trust*
High Yield Advantage Fund*
High Yield Trust*
Income Fund
Limited Duration Government Income Fund
Money Market Fund†
U.S. Government Income Trust
Tax-free income funds
AMT-Free Insured Municipal Fund
Tax Exempt Income Fund
Tax Exempt Money Market Fund§
Tax-Free High Yield Fund
State tax-free income funds:
Arizona, California, Massachusetts, Michigan, Minnesota,
New Jersey, New York, Ohio, and Pennsylvania
Asset allocation funds
Income Strategies Fund
Putnam Asset Allocation Funds — three investment portfolios that
spread your money across a variety of stocks, bonds, and money
market investments.
The three portfolios:
Asset Allocation: Balanced Portfolio
Asset Allocation: Conservative Portfolio
Asset Allocation: Growth Portfolio
Putnam RetirementReady® Funds
Putnam RetirementReady Funds — ten investment portfolios that
offer diversification among stocks, bonds, and money market instru-
ments and adjust to become more conservative over time based on a
target date for withdrawing assets.
The ten funds:
Putnam RetirementReady 2050 Fund
Putnam RetirementReady 2045 Fund
Putnam RetirementReady 2040 Fund
Putnam RetirementReady 2035 Fund
Putnam RetirementReady 2030 Fund
Putnam RetirementReady 2025 Fund
Putnam RetirementReady 2020 Fund
Putnam RetirementReady 2015 Fund
Putnam RetirementReady 2010 Fund
Putnam RetirementReady Maturity Fund
* A 1% redemption fee on total assets redeemed or exchanged within 90 days
of purchase may be imposed for all share classes of these funds.
† An investment in a money market fund is not insured or guaranteed by the Federal
Deposit Insurance Corporation or any other government agency. Although the fund
seeks to preserve your investment at $1.00 per share, it is possible to lose money by
investing in the fund.
With the exception of money market funds, a 1% redemption fee may be applied
to shares exchanged or sold within 7 days of purchase (90 days, for certain funds).
Check your account balances and the most recent month-end performance at
www.putnam.com.
109
Services for shareholders
Investor services
Help your investment grow Set up a program for systematic investing from a Putnam fund or from your own savings or checking account. (Regular investing does not guarantee a profit or protect against loss in a declining market.)
Switch funds easily You can move money from one Putnam fund to another within the same class of shares without a service charge.
This privilege is subject to change or termination. An exchange of funds may result in a taxable event. In addition, a 1% redemption fee will be applied to shares exchanged or sold within 7 days of purchase, and, for certain funds, this fee applies on total assets redeemed or exchanged within 90 days of purchase.
Access your money easily You can have checks sent regularly or redeem shares any business day at the then-current net asset value, which may be more or less than the original cost of the shares. Class B and class C shares carry a sales charge that is applied to certain withdrawals.
How to buy additional shares You may buy shares through your financial advisor or directly from Putnam. To open an account by mail, send a check made payable to the name of the fund along with a completed fund application. To add to an existing account, complete the investment slip found at the top of your Confirmation of Activity statement and return it with a check payable to your fund.
For more information
Visit www.putnam.com A secure section of our Web site contains complete information on your account, including balances and transactions, updated daily. You may also conduct transactions, such as exchanges, additional investments, and address changes. Log on today to get your password.
Call us toll free at 1-800-225-1581 Ask a helpful Putnam representative or your financial advisor for details about any of these or other services, or see your prospectus.
110
Putnam puts your interests first
In January 2004, Putnam began introducing a number of voluntary initiatives designed to reduce fund expenses, provide investors with more useful information, and help safeguard the interests of all Putnam investors. Visit www.putnam.com for details.
Cost-cutting initiatives
Reduced sales charges The maximum sales charge for class A shares has been reduced to 5.25% for equity funds (formerly 5.75%) and 3.75% for most income funds (formerly 4.50%) . The maximum sales charge for class M shares has been reduced to 3.25% for equity funds (formerly 3.50%) .
* Lower class B purchase limit To help ensure that investors are in the most cost-effective share class, the maximum amount that can be invested in class B shares has been reduced to $100,000. (Larger trades or accumulated amounts will be refused.)
Ongoing expenses will be limited Through calendar 2007, total ongoing expenses, including management fees for all funds, will be maintained at or below the average of each fund’s industry peers in its Lipper load-fund universe. For more information, please see the Statement of Additional information.
Improved disclosure
Putnam fund prospectuses and shareholder reports have been revised to disclose additional information that will help shareholders compare funds and weigh their costs and risks along with their potential benefits. Shareholders will find easy-to-understand information about fund expense ratios, portfolio manager compensation, risk comparisons, turnover comparisons, brokerage commissions, and employee and trustee ownership of Putnam funds. Disclosure of breakpoint discounts has also been enhanced to alert investors to potential cost savings.
Protecting investors’ interests
Short-term trading fee introduced To discourage short-term trading, which can interfere with a fund’s long-term strategy, a 1% short-term trading fee may be imposed on any Putnam fund shares (other than money market funds) redeemed or exchanged within seven calendar days of purchase (for certain funds, this fee applies for 90 days).
* The maximum sales charge for class A shares of Putnam Limited Duration Government Income Fund and Putnam Floating Rate Income Fund remains 3.25% .
111
Fund information
Founded nearly 70 years ago, Putnam Investments was built around the concept that a balance between risk and reward is the hallmark of a well-rounded financial program. We manage over 100 mutual funds in growth, value, blend, fixed income, and international.
| Investment Manager | Officers | Mark C. Trenchard |
| Putnam Investment | Charles E. Haldeman, Jr. | Vice President and BSA Compliance Officer |
| Management, LLC | President | |
| One Post Office Square | Judith Cohen | |
| Boston, MA 02109 | Charles E. Porter | Vice President, Clerk and Assistant Treasurer |
| Executive Vice President, Principal | ||
| Marketing Services | Executive Officer, Associate Treasurer | Wanda M. McManus |
| Putnam Retail Management | and Compliance Liaison | Vice President, Senior Associate Treasurer |
| One Post Office Square | and Assistant Clerk | |
| Boston, MA 02109 | Jonathan S. Horwitz | |
| Senior Vice President and Treasurer | Nancy E. Florek | |
| Custodian | Vice President, Assistant Clerk, | |
| State Street Bank and Trust Company | Steven D. Krichmar | Assistant Treasurer and Proxy Manager |
| Vice President and Principal Financial Officer | ||
| Legal Counsel | ||
| Ropes & Gray LLP | Janet C. Smith | |
| Vice President, Principal Accounting Officer | ||
| Independent Registered Public | and Assistant Treasurer | |
| Accounting Firm | ||
| PricewaterhouseCoopers LLP | Susan G. Malloy | |
| Vice President and Assistant Treasurer | ||
| Trustees | ||
| John A. Hill, Chairman | Beth S. Mazor | |
| Jameson Adkins Baxter, Vice Chairman | Vice President | |
| Charles B. Curtis | ||
| Robert J. Darretta | James P. Pappas | |
| Myra R. Drucker | Vice President | |
| Charles E. Haldeman, Jr. | ||
| Paul L. Joskow | Richard S. Robie, III | |
| Elizabeth T. Kennan | Vice President | |
| Kenneth R. Leibler | ||
| Robert E. Patterson | Francis J. McNamara, III | |
| George Putnam, III | Vice President and Chief Legal Officer | |
| W. Thomas Stephens | ||
| Richard B. Worley | Robert R. Leveille | |
| Vice President and Chief Compliance Officer | ||
This report is for the information of shareholders of Putnam RetirementReady Funds. It may also be used as sales literature when preceded or accompanied by the current prospectus, the most recent copy of Putnam's Quarterly Performance Summary, and Putnam's Quarterly Ranking Summary. For more recent performance, please visit www.putnam.com. Investors should carefully consider the investment objective, risks, charges, and expenses of a fund, which are described in its prospectus. For this and other information or to request a prospectus, call 1-800-225-1581 toll free. Please read the prospectus carefully before investing. The fund's Statement of Additional Information contains additional information about the fund's Trustees and is available without charge upon request by calling 1-800-225-1581.

Item 2. Code of Ethics:
(a) The fund’s principal executive, financial and accounting officers are employees of Putnam Investment Management, LLC, the Fund's investment manager. As such they are subject to a comprehensive Code of Ethics adopted and administered by Putnam Investments which is designed to protect the interests of the firm and its clients. The Fund has adopted a Code of Ethics which incorporates the Code of Ethics of Putnam Investments with respect to all of its officers and Trustees who are employees of Putnam Investment Management, LLC. For this reason, the Fund has not adopted a separate code of ethics governing its principal executive, financial and accounting officers.
(c) None
Item 3. Audit Committee Financial Expert:
The Funds' Audit and Compliance Committee is comprised solely of Trustees who are "independent" (as such term has been defined by the Securities and Exchange Commission ("SEC") in regulations implementing Section 407 of the Sarbanes-Oxley Act (the "Regulations")). The Trustees believe that each of the members of the Audit and Compliance Committee also possess a combination of knowledge and experience with respect to financial accounting matters, as well as other attributes, that qualify them for service on the Committee. In addition, the Trustees have determined that each of Mr. Patterson, Mr. Stephens, Mr. Leibler, Mr. Hill and Mr. Darretta meets the financial literacy requirements of the New York Stock Exchange's rules and qualifies as an "audit committee financial expert" (as such term has been defined by the Regulations) based on their review of his pertinent experience and education. Certain other Trustees, although not on the Audit and Compliance Committee, would also qualify as "audit committee financial experts." The SEC has stated that the designation or identification of a person as an audit committee financial expert pursuant to this Item 3 of Form N-CSR does not impose on such person any duties, obligations or liability that are greater than the duties, obligations and liability imposed on such person as a member of the Audit and Compliance Committee and the Board of Trustees in the absence of such designation or identification.
Item 4. Principal Accountant Fees and Services:
The following table presents fees billed in each of the last two fiscal years for services rendered to the fund by the fund’s independent auditor:
| Fiscal | Audit- | |||
| year | Audit | Related | Tax | All Other |
| ended | Fees | Fees | Fees | Fees |
| July 31, 2007 | $130,587 | $- | $28,266 | $- |
| July 31, 2006 | $119,053 | $-- | $23,561 | $ - |
For the fiscal years ended July 31, 2007and July 31, 2006, the fund’s independent auditor billed aggregate non-audit fees in the amounts of $ 143,482 and $293,232 respectively, to the fund, Putnam Management and any entity controlling, controlled by or under common control with Putnam Management that provides ongoing services to the fund.
Audit Fees represent fees billed for the fund’s last two fiscal years.
Audit-Related Fees represent fees billed in the fund’s last two fiscal years for services traditionally performed by the fund’s auditor, including accounting consultation for proposed transactions or concerning financial accounting and reporting standards and other audit or attest services not required by statute or regulation.
Tax Fees represent fees billed in the fund’s last two fiscal years for tax compliance, tax planning and tax advice services. Tax planning and tax advice services include assistance with tax audits, employee benefit plans and requests for rulings or technical advice from taxing authorities.
All Other Fees represent fees billed for services relating to an analysis of recordkeeping fees.
Pre-Approval Policies of the Audit and Compliance Committee. The Audit and Compliance Committee of the Putnam funds has determined that, as a matter of policy, all work performed for the funds by the funds’ independent auditors will be pre-approved by the Committee itself and thus will generally not be subject to pre-approval procedures.
The Audit and Compliance Committee also has adopted a policy to pre-approve the engagement by Putnam Management and certain of its affiliates of the funds’ independent auditors, even in circumstances where pre-approval is not required by applicable law. Any such requests by Putnam Management or certain of its affiliates are typically submitted in writing to the Committee and explain, among other things, the nature of the proposed engagement, the estimated fees, and why this work should be performed by that particular audit firm as opposed to another one. In reviewing such requests, the Committee considers, among other things, whether the provision of such services by the audit firm are compatible with the independence of the audit firm.
The following table presents fees billed by the fund’s independent auditor for services required to be approved pursuant to paragraph (c)(7)(ii) of Rule 2-01 of Regulation S-X.
| Fiscal | Audit- | All | Total | |
| year | Related | Tax | Other | Non-Audit |
| ended | Fees | Fees | Fees | Fees |
| July 31, | ||||
| 2007 | $ - | $ 26,129 | $ - | $ - |
| July 31, | ||||
| 2006 | $ - | $ 153,160 | $ - | $ - |
Item 5. Audit Committee of Listed Registrants
Not applicable
Item 6. Schedule of Investments:
The registrant’s schedule of investments in unaffiliated issuers is included in the report shareholders in Item 1 above.
Item 7. Disclosure of Proxy Voting Policies and Procedures For Closed-End Management Investment Companies:
Not applicable
Item 8. Portfolio Managers of Closed-End Investment Companies
Not Applicable
Item 9. Purchases of Equity Securities by Closed-End Management Investment Companies and Affiliated Purchasers:
Not applicable
Item 10. Submission of Matters to a Vote of Security Holders:
Not applicable
Item 11. Controls and Procedures:
(a) The registrant's principal executive officer and principal financial officer have concluded, based on their evaluation of the effectiveness of the design and operation of the registrant's disclosure controls and procedures as of a date within 90 days of the filing date of this report, that the design and operation of such procedures are generally effective to provide reasonable assurance that information required to be disclosed by the registrant in this report is recorded, processed, summarized and reported within the time periods specified in the Commission's rules and forms.
(b) Changes in internal control over financial reporting: Not applicable
Item 12. Exhibits:
(a)(1) The Code of Ethics of The Putnam Funds, which incorporates the Code of Ethics of Putnam Investments, is filed herewith.
(a)(2) Separate certifications for the principal executive officer and principal financial officer of the registrant as required by Rule 30a-2(a) under the Investment Company Act of 1940, as amended, are filed herewith.
(b) The certifications required by Rule 30a-2(b) under the Investment Company Act of 1940, as amended, are filed herewith.
SIGNATURES
Pursuant to the requirements of the Securities Exchange Act of 1934 and the Investment Company Act of 1940, the registrant has duly caused this report to be signed on its behalf by the undersigned, thereunto duly authorized.
Putnam RetirementReady Funds
By (Signature and Title):
/s/Janet C. Smith
Janet C. Smith
Principal Accounting Officer
Date: September 28, 2007
Pursuant to the requirements of the Securities Exchange Act of 1934 and the Investment Company Act of 1940, this report has been signed below by the following persons on behalf of the registrant and in the capacities and on the dates indicated.
By (Signature and Title):
/s/Charles E. Porter
Charles E. Porter
Principal Executive Officer
Date: September 28, 2007
By (Signature and Title):
/s/Steven D. Krichmar
Steven D. Krichmar
Principal Financial Officer
Date: September 28, 2007