| UNITED STATES SECURITIES AND EXCHANGE COMMISSION | ||
| Washington, D.C. 20549 | ||
FORM N-CSR | ||
| CERTIFIED SHAREHOLDER REPORT OF REGISTERED MANAGEMENT INVESTMENT COMPANIES | ||
| Investment Company Act file number: | (811-21598) |
| Exact name of registrant as specified in charter: | Putnam RetirementReady Funds |
| Address of principal executive offices: | One Post Office Square, Boston, Massachusetts 02109 |
| Name and address of agent for service: | Robert T. Burns, Vice President One Post Office Square Boston, Massachusetts 02109 |
| Copy to: | Bryan Chegwidden, Esq. Ropes & Gray LLP 1211 Avenue of the Americas New York, New York 10036 |
| Registrant's telephone number, including area code: | (617) 292-1000 |
| Date of fiscal year end: | July 31, 2018 |
| Date of reporting period : | August 1, 2017 — July 31, 2018 |
Item 1. Report to Stockholders: |
| The following is a copy of the report transmitted to stockholders pursuant to Rule 30e-1 under the Investment Company Act of 1940: | |||
Putnam
RetirementReady®
Funds
| Putnam RetirementReady 2060 Fund | Putnam RetirementReady 2035 Fund |
| Putnam RetirementReady 2055 Fund | Putnam RetirementReady 2030 Fund |
| Putnam RetirementReady 2050 Fund | Putnam RetirementReady 2025 Fund |
| Putnam RetirementReady 2045 Fund | Putnam RetirementReady 2020 Fund |
| Putnam RetirementReady 2040 Fund | Putnam Retirement Income Fund Lifestyle 1 |
Annual report
7 | 31 | 18
Consider these risks before investing: Our allocation of assets among permitted asset categories may hurt performance. Stock and bond prices may fall or fail to rise over time for several reasons, including general financial market conditions, changing market perceptions (including, in the case of bonds, perceptions about the risk of default and expectations about monetary policy or interest rates), changes in government intervention in the financial markets, and factors related to a specific issuer or industry. These and other factors may lead to increased volatility and reduced liquidity in the funds’ portfolio holdings. Growth stocks may be more susceptible to earnings disappointments, and value stocks may fail to rebound. Investments in small and/or midsize companies increase the risk of greater price fluctuations. Bond investments are subject to interest-rate risk (the risk of bond prices falling if interest rates rise) and credit risk (the risk of an issuer defaulting on interest or principal payments). Default risk is generally higher for non-qualified mortgages. Interest-rate risk is greater for longer-term bonds, and credit risk is greater for below-investment-grade bonds. Lower-rated bonds may offer higher yields in return for more risk. Funds that invest in government securities are not guaranteed. Mortgage-backed securities are subject to prepayment risk and the risk that they may increase in value less when interest rates decline and decline in value more when interest rates rise. International investing involves currency, economic, and political risks. Emerging-market securities carry illiquidity and volatility risks. Active trading strategies may lose money or not earn a return sufficient to cover trading and other costs. REITs are subject to the risk of economic downturns that have an adverse impact on real estate markets. Commodity-linked notes are subject to the same risks as commodities, such as weather, disease, political, tax and other regulatory developments, and other factors affecting the value of commodities. Risks associated with derivatives include increased investment exposure (which may be considered leverage) and, in the case of over-the-counter instruments, the potential inability to terminate or sell derivatives positions and the potential failure of the other party to the instrument to meet its obligations. Efforts to produce lower volatility returns may not be successful and may make it more difficult at times for the funds to achieve their targeted returns. In addition, under certain market conditions, the funds may accept greater volatility than would typically be the case, in order to seek their targeted returns. There is no guarantee that the funds will provide adequate income at and through an investor’s retirement. You can lose money by investing in the funds.
For the portion invested in Putnam Government Money Market Fund, these risks also apply: You can lose money by investing in the fund. Although the fund seeks to preserve the value of your investment at $1.00 per share, it cannot guarantee it will do so. The fund may impose a fee upon the sale of your shares or may temporarily suspend your ability to sell shares if the fund’s liquidity falls below certain required minimums because of market conditions or other factors. An investment in the fund is not insured or guaranteed by the Federal Deposit Insurance Corporation or any other government agency. The fund’s sponsor has no legal obligation to provide financial support to the fund, and you should not expect that the sponsor will provide financial support to the fund at any time.
The values of money market investments usually rise and fall in response to changes in interest rates. Interest-rate risk is generally lowest for investments with short maturities (a significant part of the fund’s investments). Although the fund only buys high-quality investments, investments backed by a letter of credit have the risk that the provider of the letter of credit will not be able to fulfill its obligations to the issuer. The effects of inflation may erode the value of your investment over time.
The principal value of the fund is not guaranteed at any time, including at the target date.
Message from the Trustees
September 18, 2018
Dear Fellow Shareholder:
During 2018, we have seen conditions for global financial markets become a bit more normal after an extended period of record advances coupled with low volatility. A downturn early in the year pushed stocks into a brief correction, while the subsequent market rally has experienced occasional setbacks. Both stocks and bonds have been somewhat more volatile, due in part to uncertainty surrounding trade policy and U.S. interest rates. Fortunately, navigating a change in market trends is nothing new to Putnam’s experienced investment professionals, who continue to monitor risks and seek opportunities.
We would like to take this opportunity to extend our thanks to Jameson A. Baxter, who retired from her position as Chair of your Board of Trustees on June 30, 2018. It is hard to express in a few words the extent of Jamie’s commitment to protecting the interests of Putnam shareholders like you. In addition to her professional and directorship experience, Jamie brought intelligence, insight, and compassion to a board she served for decades. Jamie began as a Trustee in 1994, served as Vice Chair for six years, and became Chair in 2011. We are also pleased to announce the appointment of Kenneth R. Leibler as your new Board of Trustees Chair. Ken became a Trustee in 2006, has served as Vice Chair since 2016, and now leads the Board in overseeing your fund and protecting your interests.
Thank you for investing with Putnam.

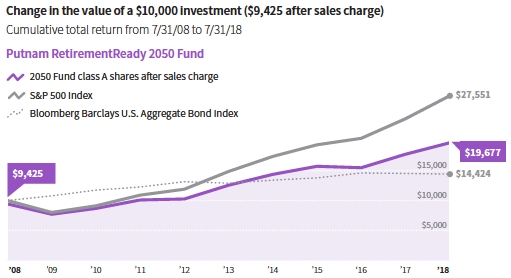
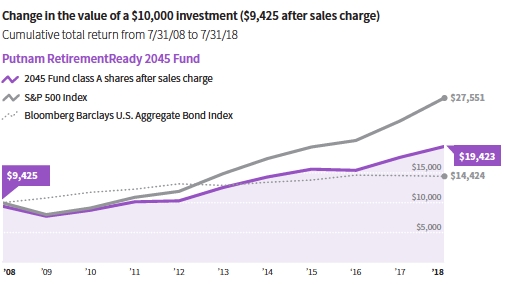
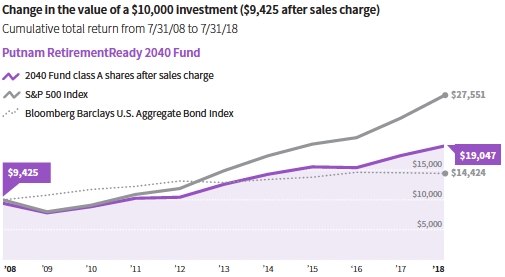
Performance history as of 7/31/18
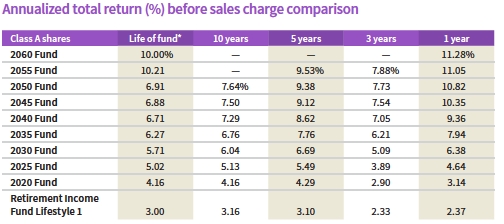
Current performance may be lower or higher than the quoted past performance, which cannot guarantee future results. Share price, principal value, and return will fluctuate, and you may have a gain or a loss when you sell your shares. Performance of class A shares assumes reinvestment of distributions and does not account for taxes. Fund returns in the table above do not reflect a sales charge of 4.00% for Putnam Retirement Income Fund Lifestyle 1 and 5.75% for all other funds; had they, returns would have been lower. See below and pages 10–23 for additional performance information. For a portion of the periods, the funds had expense limitations, without which returns would have been lower. To obtain the most recent month-end performance, visit putnam.com.
* With the exception of Putnam RetirementReady 2050 Fund, 2055 Fund, and 2060 Fund (inceptions: 5/2/05, 11/30/10, and 11/30/15, respectively), the inception of the class A shares of the RetirementReady Funds is 11/1/04.
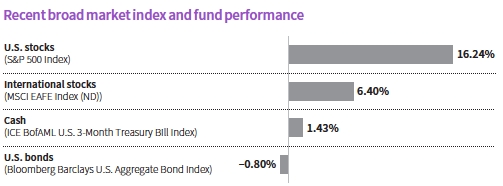
This comparison shows your fund’s performance in the context of broad market indexes for the 12 months ended 7/31/18. See above and pages 10–23 for additional fund performance information. Index descriptions can be found on pages 31–32.
| RetirementReady® Funds 3 |


Jason, how did the funds perform for the 12-month reporting period?
Performance was positive for all of the Putnam RetirementReady portfolios for the 12-month reporting period. As we expected, the funds with greater allocations to stocks had greater returns than the shorter-dated funds. The high exposures to stocks are for investors with decades until retirement. The shorter-dated funds have proportionately higher exposure to bonds and other fixed-income securities as we seek greater stability. Stocks outperformed bonds in the period.
U.S. stocks, as measured by the S&P 500 Index, returned 16.24% for the period, and stocks of non-U.S. developed countries, as measured by the MSCI EAFE Index [ND], returned 6.40%. By contrast, the Bloomberg Barclays U.S. Aggregate Bond Index was down –0.80%. As the Fed raised short-term interest rates during the period, bonds with short and intermediate maturities generally declined in price.
What was the investment environment like during the reporting period?
Market volatility remained subdued during the first half of the period, which was the second
| 4 RetirementReady® Funds |
half of 2017. Volatility returned in 2018 when geopolitical concerns and trade policies weighed on global markets.
Economic conditions remained solid during the period, with U.S. gross domestic product surging to 4.1% in an advance estimate for the second quarter. The unemployment rate also declined. Inflation remained steady despite rising energy prices. In December 2017, the passage of the Tax Cuts and Jobs Act introduced significant tax reductions for corporations. The new law also reduced taxes for multinational companies seeking to repatriate overseas earnings. Corporate earnings were largely positive.
In general, the investment environment was positive for equities. Stocks benefited from the impact of tax reform and continued strong earnings. During the latter part of the period, some geopolitical tensions intensified, and the introduction of trade tariffs set the stage for conflicts between the United States and its major trading partners. However, these policy moves were not broad enough to offset the strength of persistent economic growth in the United States and across the globe.
Fixed-income markets finished the period relatively flat. Long-term bond yields changed much more modestly than did short-term yields. We continue to see muted returns from interest-rate-sensitive investments and expect that to continue. High-yield bonds outperformed other fixed-income sectors, but did not keep pace with equities.
Please explain the philosophy behind the funds’ glide-path strategy?
The glide path governs the way that the funds’ allocations shift over time as investors build their savings. Early in the glide path, as investors are saving for their retirement, the glide path favors larger allocations to equities in order to generate growth. While larger equity allocations can experience periodic downturns, the extended retirement investment horizon typically allows time for recovery, as well as the chance to benefit from the expected long-term upward trajectory of equity markets. A fund’s stock allocations gradually diminish over time in favor of what we consider to be less volatile assets, such as bonds, in an effort to protect capital as investors approach retirement.

As an investor advances toward retirement, the glide path also allocates a growing percentage to our absolute return strategies. Our objective is to reduce market risk across all assets as an investor approaches retirement, while attempting to deliver a more diverse set of risks and returns at the portfolio level.
What strategies for the underlying funds contributed to or detracted from the funds’ absolute performance during the reporting period?
Across the funds, we add value through asset allocation and security selection. Throughout the period, we generally kept the funds’ asset class allocations relatively close to neutral, as we expected markets to perform generally in line with benchmark allocations to stocks, bonds, and other fixed-income securities.
Within asset class allocations, we added value with tactical allocation, most notably with an out-of-benchmark position in commodities. We saw a strong rally in energy, including oil prices, during the period. Over the past year, we’ve intermittently taken a long position across a broad basket of commodities. We maintained the position more consistently during 2018 and this added to returns.
In terms of security selection, we saw some areas of strength. Security selection in U.S. large-cap equities contributed to performance. We also saw positive contribution from an out-of-benchmark position in fixed-income investments, specifically securitized debt. Security selection in emerging markets also contributed to fund performance. Our exposure
| RetirementReady® Funds 5 |
to emerging markets, however, was limited to the longer-dated portfolios.
Weakness in our active currency positioning was one detractor from performance. We typically take positions across various major currencies, seeking to add value. In this period, the mix of positions that we chose was unfavorable.
Performance among our absolute return strategies was mixed. Overall, the absolute return strategies contributed to reducing volatility and improving diversification across the funds.
What is your outlook for the coming months?
Market volatility has re-emerged as a challenge and opportunity in 2018 in our view. Still, we believe that global economic growth and strong corporate earnings will continue to offset short-term setbacks. At the same time, in our view, economic factors are not signaling a recession.
While we believe that the fundamental backdrop remains supportive for stocks, we made some adjustments to positioning at the end of the period. For the first half of 2018, we held overweight positions in equities and commodities. By the end of the reporting period, we dialed back those views somewhat and brought our positions more in line with the benchmark, taking advantage of some gains we made at the start of the year. One of the drivers behind our tactical allocation in equities was the prospect for stock buybacks resulting from the tax reform law. As earnings season progressed, many companies entered blackout periods and the prospects around buybacks temporarily diminished. So, we dialed back our exposure.
Our positioning in commodities enabled us to take advantage of the runup in prices. We took the opportunity recently to reduce exposure given that the forward-looking risk-adjusted return expectation was less than what it was at the start of the year. We believe there is also a potential for an uptick in volatility in
ABOUT DERIVATIVES
Derivatives are an increasingly common type of investment instrument, the performance of which is derived from an underlying security, index, currency, or other area of the capital markets. Derivatives employed by the fund’s managers generally serve one of two main purposes: to implement a strategy that may be difficult or more expensive to invest in through traditional securities, or to hedge unwanted risk associated with a particular position.
For example, the fund’s managers might use currency forward contracts to capitalize on an anticipated change in exchange rates between two currencies. This approach would require a significantly smaller outlay of capital than purchasing traditional bonds denominated in the underlying currencies. In another example, the managers may identify a bond that they believe is undervalued relative to its risk of default, but may seek to reduce the interest-rate risk of that bond by using interest-rate swaps, a derivative through which two parties “swap” payments based on the movement of certain rates. In other examples, the managers may use options and futures contracts to hedge against a variety of risks by establishing a combination of long and short exposures to specific equity markets or sectors.
Like any other investment, derivatives may not appreciate in value and may lose money. Derivatives may amplify traditional investment risks through the creation of leverage and may be less liquid than traditional securities. And because derivatives typically represent contractual agreements between two financial institutions, derivatives entail “counterparty risk,” which is the risk that the other party is unable or unwilling to pay. Putnam monitors the counterparty risks we assume. For example, Putnam often enters into collateral agreements that require the counterparties to post collateral on a regular basis to cover their obligations to the fund. Counterparty risk for exchange-traded futures and centrally cleared swaps is mitigated by the daily exchange of margin and other safeguards against default through their respective clearinghouses.
| 6 RetirementReady® Funds |
commodities due to geopolitical concerns and supply/demand dynamics.
We expect bond yields in the United States and globally to continue rising. The European Central Bank announced in June 2018, however, that its bond-buying program would end in December 2018, and we believe this will keep a short-term lid on global yields.
The global economic growth outlook will also be a factor, in our view, but we believe global growth currently has a solid foundation.
Thank you, Jason, for your time and insights today.
The views expressed in this report are exclusively those of Putnam Management and are subject to change. They are not meant as investment advice.
Please note that the holdings discussed in this report may not have been held by the fund for the entire period. Portfolio composition is subject to review in accordance with the fund’s investment strategy and may vary in the future. Current and future portfolio holdings are subject to risk. Statements in the Q&A concerning the fund’s performance or portfolio composition relative to those of the fund’s Lipper peer group may reference information produced by Lipper Inc. or through a third party.
| RetirementReady® Funds 7 |
Composition of the funds’
underlying investments
Historically, each Putnam RetirementReady® Fund invests, to varying degrees, in a variety of Putnam mutual funds. This section describes the goals and strategies of each of the underlying Putnam funds as of July 31, 2018. For more information, please see the funds’ prospectus.
Putnam Fixed Income Absolute Return Fund and Putnam Multi-Asset Absolute Return Fund
Each fund pursues an “absolute return” strategy that seeks to earn a positive total return over a reasonable period of time regardless of market conditions or general market direction. Putnam Fixed Income Absolute Return Fund (named Putnam Absolute Return 300 Fund prior to April 30, 2018) invests in a broadly diversified portfolio reflecting uncorrelated fixed-income strategies. Putnam Multi-Asset Absolute Return Fund (named Putnam Absolute Return 700 Fund prior to April 30, 2018) combines two independent investment strategies: a beta strategy, which provides broad exposure to investment markets, and an alpha strategy, which seeks returns from active trading. Actual allocations of both funds will vary.
Putnam Dynamic Asset Allocation Equity Fund
The fund’s portfolio invests mainly in common stocks (growth or value stocks or both) of large and midsize companies worldwide and is designed for investors seeking long-term growth. The fund typically allocates approximately 75% of its assets to investments in U.S. companies and 25% of its assets to international companies, but allocations may vary. The Portfolio Managers can adjust allocations based on market conditions.
Putnam Dynamic Asset Allocation Growth Fund
The fund’s portfolio invests mainly in equity securities (growth or value stocks or both) of U.S. and international companies of any size and is designed for investors seeking capital appreciation with moderate risk. The fund’s strategic equity weighting is 80% (the range is 65% to 95%), with the balance invested in a range of fixed-income investments. The Portfolio Managers can adjust allocations based on market conditions.
Putnam Dynamic Asset Allocation Balanced Fund
The fund’s portfolio is diversified across stocks and bonds in global markets and is designed for investors seeking total return. The fund’s strategic equity allocation is 60% (the range is 45% to 75%), with the balance invested in bonds and money market instruments. The Portfolio Managers can adjust the allocations based on market conditions.
Putnam Dynamic Asset Allocation Conservative Fund
The fund’s globally diversified portfolio emphasizes bonds over stocks and is designed for investors who want to protect the value of their investment while receiving regular income and protection against inflation. The strategic fixed-income allocation is 70% (with a range of 55% to 85%), with the balance invested in stocks and money market instruments. The Portfolio Managers can adjust allocations based on market conditions.
Putnam Government Money Market Fund
The fund seeks as high a rate of current income as Putnam Management believes is consistent with preservation of capital and maintenance
| 8 RetirementReady® Funds | |
of liquidity. The fund invests at least 99.5% of its total assets in cash, U.S. government securities, and repurchase agreements that are fully collateralized by U.S. government securities or cash.
You can lose money by investing in the fund. Although the fund seeks to preserve the value of your investment at $1.00 per share, it cannot guarantee it will do so. An investment in the fund is not insured or guaranteed by the Federal Deposit Insurance Corporation or any other government agency. The fund’s sponsor has no legal obligation to provide financial support to the fund, and you should not expect that the sponsor will provide financial support to the fund at any time.
Each RetirementReady Fund has a different target date indicating when the fund’s investors expect to retire and begin withdrawing assets from their account, typically at retirement. The funds are generally weighted more heavily toward more aggressive, higher-risk investments when the target date of the fund is far off, and more conservative, lower-risk investments when the target date of the fund is near. The principal value of the funds is not guaranteed at any time, including the target date.
Allocations by fund as of 7/31/18
| Underlying Putnam Fund | Putnam Retirement- Ready 2060 Fund | Putnam Retirement- Ready 2055 Fund | Putnam Retirement- Ready 2050 Fund | Putnam Retirement- Ready 2045 Fund | Putnam Retirement- Ready2040 Fund | Putnam Retirement- Ready 2035 Fund | Putnam Retirement- Ready 2030 Fund | Putnam Retirement- Ready2025 Fund | Putnam Retirement- Ready2020 Fund | Putnam Retirement Income Fund Lifestyle 1 |
| Putnam Dynamic Asset Allocation | ||||||||||
| Equity Fund | 73.6% | 69.0% | 52.7% | 33.4% | 10.6% | 0.0% | 0.0% | 0.0% | 0.0% | 0.0% |
| Putnam Dynamic Asset Allocation | ||||||||||
| Growth Fund | 16.0% | 20.5% | 36.0% | 54.0% | 68.5% | 53.4% | 17.7% | 0.0% | 0.0% | 0.0% |
| Putnam Dynamic Asset Allocation | ||||||||||
| Balanced Fund | 0.0% | 0.0% | 0.0% | 0.0% | 3.8% | 21.8% | 47.2% | 42.3% | 14.5% | 0.0% |
| Putnam Dynamic Asset Allocation | ||||||||||
| Conservative Fund | 0.0% | 0.0% | 0.0% | 0.0% | 0.0% | 0.0% | 1.0% | 12.1% | 27.6% | 34.3% |
| Putnam Multi-Asset Absolute | ||||||||||
| Return Fund* | 9.5% | 9.5% | 9.4% | 9.6% | 12.7% | 16.8% | 20.6% | 25.6% | 29.4% | 29.8% |
| Putnam Fixed Income Absolute | ||||||||||
| Return Fund† | 0.5% | 0.8% | 1.5% | 2.4% | 2.8% | 5.2% | 9.6% | 15.0% | 22.7% | 29.9% |
| Putnam Government Money | ||||||||||
| Market Fund | 0.4% | 0.2% | 0.4% | 0.6% | 1.6% | 2.8% | 3.7% | 5.0% | 5.8% | 6.0% |
Percentages are based on net assets as of 7/31/18. Portfolio composition may vary over time. Due to rounding, percentages may not equal 100%. Summary information may differ from the portfolio schedule included in the financial statements due to the exclusion of as-of trades.
* Effective April 27, 2018, Putnam Absolute Return 500 Fund® merged with Putnam Absolute Return 700 Fund®, and was renamed Putnam Multi-Asset Absolute Return Fund effective April 30, 2018.
† Prior to April 30, 2018, Putnam Fixed Income Absolute Return Fund was known as Putnam Absolute Return 300 Fund®.
| RetirementReady® Funds 9 |
Your fund’s performance
This section shows your fund’s performance, price, and distribution information for periods ended July 31, 2018, the end of its most recent fiscal year. In accordance with regulatory requirements for mutual funds, we also include performance information as of the most recent calendar quarter-end and expense information taken from the fund’s current prospectus. Performance should always be considered in light of a fund’s investment strategy. Data represent past performance. Past performance does not guarantee future results. More recent returns may be less or more than those shown. Investment return and principal value will fluctuate, and you may have a gain or a loss when you sell your shares. Performance information does not reflect any deduction for taxes a shareholder may owe on fund distributions or on the redemption of fund shares. For the most recent month-end performance, please visit the Individual Investors section at putnam.com or call Putnam at 1-800-225-1581. Class R, R6, and Y shares are not available to all investors. See the Terms and definitions section in this report for definitions of the share classes offered by your fund.
Fund performance Total return for periods ended 7/31/18
| Class A | Class B | Class C | Class M | Class R | Class R6 | Class Y | |||||
| (11/1/04) | (11/1/04) | (11/1/04) | (11/1/04) | (11/1/04) | (9/1/16) | (11/1/04) | |||||
| Before | After | Before | After | Net | Net | Net | |||||
| sales | sales | Before | After | Before | After | sales | sales | asset | asset | asset | |
| charge | charge | CDSC | CDSC | CDSC | CDSC | charge | charge | value | value | value | |
| 2060 Fund* | |||||||||||
| Life of fund | 28.94% | 21.53% | 26.42% | 23.42% | 26.37% | 26.37% | 27.22% | 22.77% | 28.03% | 29.99% | 29.69% |
| Annual average | 10.00 | 7.59 | 9.19 | 8.21 | 9.17 | 9.17 | 9.45 | 8.00 | 9.71 | 10.34 | 10.24 |
| 1 year | 11.28 | 4.88 | 10.54 | 5.54 | 10.41 | 9.41 | 10.75 | 6.87 | 10.97 | 11.71 | 11.46 |
| 2055 Fund† | |||||||||||
| Life of fund | 110.77% | 98.65% | 98.93% | 98.93% | 99.02% | 99.02% | 102.84% | 95.74% | 106.87% | 115.53% | 114.96% |
| Annual average | 10.21 | 9.37 | 9.39 | 9.39 | 9.39 | 9.39 | 9.66 | 9.16 | 9.95 | 10.54 | 10.50 |
| 5 years | 57.62 | 48.56 | 51.78 | 49.78 | 51.89 | 51.89 | 53.78 | 48.40 | 55.78 | 60.15 | 59.72 |
| Annual average | 9.53 | 8.24 | 8.70 | 8.42 | 8.72 | 8.72 | 8.99 | 8.21 | 9.27 | 9.88 | 9.82 |
| 3 years | 25.54 | 18.32 | 22.72 | 19.72 | 22.69 | 22.69 | 23.68 | 19.35 | 24.60 | 26.86 | 26.52 |
| Annual average | 7.88 | 5.77 | 7.06 | 6.18 | 7.05 | 7.05 | 7.34 | 6.07 | 7.61 | 8.25 | 8.16 |
| 1 year | 11.05 | 4.67 | 10.26 | 5.26 | 10.25 | 9.25 | 10.50 | 6.63 | 10.86 | 11.55 | 11.35 |
| 2050 Fund‡ | |||||||||||
| Annual average | |||||||||||
| (life of fund) | 6.91% | 6.43% | 6.43% | 6.43% | 6.30% | 6.30% | 6.37% | 6.08% | 6.64% | 7.19% | 7.17% |
| 10 years | 108.77 | 96.77 | 96.55 | 96.55 | 93.60 | 93.60 | 98.55 | 91.60 | 103.52 | 114.34 | 113.90 |
| Annual average | 7.64 | 7.00 | 6.99 | 6.99 | 6.83 | 6.83 | 7.10 | 6.72 | 7.36 | 7.92 | 7.90 |
| 5 years | 56.58 | 47.58 | 50.77 | 48.77 | 50.77 | 50.77 | 52.71 | 47.37 | 54.64 | 58.85 | 58.52 |
| Annual average | 9.38 | 8.09 | 8.56 | 8.27 | 8.56 | 8.56 | 8.84 | 8.06 | 9.11 | 9.70 | 9.65 |
| 3 years | 25.02 | 17.83 | 22.18 | 19.18 | 22.26 | 22.26 | 23.17 | 18.86 | 24.06 | 26.22 | 25.95 |
| Annual average | 7.73 | 5.62 | 6.90 | 6.02 | 6.93 | 6.93 | 7.19 | 5.93 | 7.45 | 8.07 | 8.00 |
| 1 year | 10.82 | 4.45 | 9.90 | 4.90 | 9.93 | 8.93 | 10.21 | 6.35 | 10.51 | 11.15 | 11.07 |
| 10 RetirementReady® Funds | |
Fund performance Total return for periods ended 7/31/18 cont.
| Class A | Class B | Class C | Class M | Class R | Class R6 | Class Y | |||||
| (11/1/04) | (11/1/04) | (11/1/04) | (11/1/04) | (11/1/04) | (9/1/16) | (11/1/04) | |||||
| Before | After | Before | After | Net | Net | Net | |||||
| sales | sales | Before | After | Before | After | sales | sales | asset | asset | asset | |
| charge | charge | CDSC | CDSC | CDSC | CDSC | charge | charge | value | value | value | |
| 2045 Fund | |||||||||||
| Annual average | |||||||||||
| (life of fund) | 6.88% | 6.42% | 6.42% | 6.42% | 6.30% | 6.30% | 6.35% | 6.08% | 6.62% | 7.17% | 7.15% |
| 10 years | 106.07 | 94.23 | 94.06 | 94.06 | 91.19 | 91.19 | 95.98 | 89.12 | 100.93 | 111.73 | 111.22 |
| Annual average | 7.50 | 6.86 | 6.85 | 6.85 | 6.70 | 6.70 | 6.96 | 6.58 | 7.23 | 7.79 | 7.76 |
| 5 years | 54.75 | 45.85 | 49.06 | 47.06 | 49.01 | 49.01 | 50.89 | 45.61 | 52.80 | 57.04 | 56.66 |
| Annual average | 9.12 | 7.84 | 8.31 | 8.02 | 8.30 | 8.30 | 8.58 | 7.81 | 8.85 | 9.45 | 9.39 |
| 3 years | 24.36 | 17.21 | 21.60 | 18.60 | 21.60 | 21.60 | 22.54 | 18.25 | 23.47 | 25.62 | 25.32 |
| Annual average | 7.54 | 5.44 | 6.74 | 5.85 | 6.74 | 6.74 | 7.01 | 5.75 | 7.28 | 7.90 | 7.81 |
| 1 year | 10.35 | 4.00 | 9.48 | 4.48 | 9.50 | 8.50 | 9.64 | 5.80 | 10.05 | 10.75 | 10.58 |
| 2040 Fund | |||||||||||
| Annual average | |||||||||||
| (life of fund) | 6.71% | 6.25% | 6.24% | 6.24% | 6.13% | 6.13% | 6.17% | 5.90% | 6.44% | 6.99% | 6.97% |
| 10 years | 102.09 | 90.47 | 90.33 | 90.33 | 87.49 | 87.49 | 92.10 | 85.37 | 97.04 | 107.49 | 107.12 |
| Annual average | 7.29 | 6.66 | 6.65 | 6.65 | 6.49 | 6.49 | 6.75 | 6.37 | 7.02 | 7.57 | 7.55 |
| 5 years | 51.19 | 42.50 | 45.57 | 43.57 | 45.65 | 45.65 | 47.44 | 42.28 | 49.35 | 53.40 | 53.13 |
| Annual average | 8.62 | 7.34 | 7.80 | 7.50 | 7.81 | 7.81 | 8.07 | 7.31 | 8.35 | 8.94 | 8.90 |
| 3 years | 22.69 | 15.63 | 19.88 | 16.88 | 19.92 | 19.92 | 20.81 | 16.58 | 21.73 | 23.78 | 23.56 |
| Annual average | 7.05 | 4.96 | 6.23 | 5.34 | 6.24 | 6.24 | 6.50 | 5.25 | 6.77 | 7.37 | 7.31 |
| 1 year | 9.36 | 3.07 | 8.53 | 3.53 | 8.58 | 7.58 | 8.80 | 4.99 | 9.09 | 9.75 | 9.61 |
| 2035 Fund | |||||||||||
| Annual average | |||||||||||
| (life of fund) | 6.27% | 5.81% | 5.80% | 5.80% | 5.69% | 5.69% | 5.74% | 5.46% | 6.00% | 6.55% | 6.53% |
| 10 years | 92.35 | 81.29 | 81.15 | 81.15 | 78.45 | 78.45 | 82.95 | 76.55 | 87.63 | 97.64 | 97.24 |
| Annual average | 6.76 | 6.13 | 6.12 | 6.12 | 5.96 | 5.96 | 6.23 | 5.85 | 6.50 | 7.05 | 7.03 |
| 5 years | 45.34 | 36.98 | 39.97 | 37.97 | 40.07 | 40.07 | 41.78 | 36.82 | 43.59 | 47.48 | 47.19 |
| Annual average | 7.76 | 6.50 | 6.96 | 6.65 | 6.97 | 6.97 | 7.23 | 6.47 | 7.50 | 8.08 | 8.04 |
| 3 years | 19.81 | 12.92 | 17.13 | 14.13 | 17.15 | 17.15 | 18.03 | 13.90 | 18.90 | 20.94 | 20.70 |
| Annual average | 6.21 | 4.13 | 5.41 | 4.50 | 5.42 | 5.42 | 5.68 | 4.43 | 5.94 | 6.54 | 6.47 |
| 1 year | 7.94 | 1.74 | 7.13 | 2.13 | 7.18 | 6.18 | 7.43 | 3.67 | 7.69 | 8.34 | 8.26 |
| 2030 Fund | |||||||||||
| Annual average | |||||||||||
| (life of fund) | 5.71% | 5.25% | 5.24% | 5.24% | 5.13% | 5.13% | 5.18% | 4.91% | 5.44% | 5.98% | 5.97% |
| 10 years | 79.74 | 69.40 | 69.23 | 69.23 | 66.81 | 66.81 | 71.01 | 65.02 | 75.35 | 84.60 | 84.32 |
| Annual average | 6.04 | 5.41 | 5.40 | 5.40 | 5.25 | 5.25 | 5.51 | 5.14 | 5.78 | 6.32 | 6.31 |
| 5 years | 38.24 | 30.29 | 33.22 | 31.22 | 33.24 | 33.24 | 34.94 | 30.21 | 36.56 | 40.24 | 40.02 |
| Annual average | 6.69 | 5.43 | 5.90 | 5.58 | 5.91 | 5.91 | 6.18 | 5.42 | 6.43 | 7.00 | 6.96 |
| 3 years | 16.07 | 9.40 | 13.55 | 10.55 | 13.57 | 13.57 | 14.40 | 10.40 | 15.26 | 17.19 | 17.01 |
| Annual average | 5.09 | 3.04 | 4.33 | 3.40 | 4.33 | 4.33 | 4.59 | 3.35 | 4.85 | 5.43 | 5.38 |
| 1 year | 6.38 | 0.26 | 5.66 | 0.66 | 5.62 | 4.62 | 5.91 | 2.20 | 6.12 | 6.75 | 6.70 |
| RetirementReady® Funds 11 |
Fund performance Total return for periods ended 7/31/18 cont.
| Class A | Class B | Class C | Class M | Class R | Class R6 | Class Y | |||||
| (11/1/04) | (11/1/04) | (11/1/04) | (11/1/04) | (11/1/04) | (9/1/16) | (11/1/04) | |||||
| Before | After | Before | After | Net | Net | Net | |||||
| sales | sales | Before | After | Before | After | sales | sales | asset | asset | asset | |
| charge | charge | CDSC | CDSC | CDSC | CDSC | charge | charge | value | value | value | |
| 2025 Fund | |||||||||||
| Annual average | |||||||||||
| (life of fund) | 5.02% | 4.56% | 4.56% | 4.56% | 4.45% | 4.45% | 4.49% | 4.22% | 4.75% | 5.29% | 5.28% |
| 10 years | 64.87 | 55.39 | 55.24 | 55.24 | 52.99 | 52.99 | 56.84 | 51.35 | 60.81 | 69.38 | 69.04 |
| Annual average | 5.13 | 4.51 | 4.50 | 4.50 | 4.34 | 4.34 | 4.60 | 4.23 | 4.87 | 5.41 | 5.39 |
| 5 years | 30.65 | 23.14 | 25.86 | 23.86 | 25.84 | 25.84 | 27.39 | 22.93 | 28.98 | 32.52 | 32.25 |
| Annual average | 5.49 | 4.25 | 4.71 | 4.37 | 4.70 | 4.70 | 4.96 | 4.22 | 5.22 | 5.79 | 5.75 |
| 3 years | 12.15 | 5.70 | 9.68 | 6.68 | 9.70 | 9.70 | 10.52 | 6.65 | 11.33 | 13.25 | 13.02 |
| Annual average | 3.89 | 1.86 | 3.13 | 2.18 | 3.13 | 3.13 | 3.39 | 2.17 | 3.64 | 4.24 | 4.17 |
| 1 year | 4.64 | –1.38 | 3.90 | –1.10 | 3.89 | 2.89 | 4.14 | 0.49 | 4.38 | 5.00 | 4.91 |
| 2020 Fund | |||||||||||
| Annual average | |||||||||||
| (life of fund) | 4.16% | 3.71% | 3.71% | 3.71% | 3.60% | 3.60% | 3.64% | 3.37% | 3.91% | 4.43% | 4.42% |
| 10 years | 50.29 | 41.65 | 41.62 | 41.62 | 39.51 | 39.51 | 42.95 | 37.94 | 46.59 | 54.31 | 54.14 |
| Annual average | 4.16 | 3.54 | 3.54 | 3.54 | 3.39 | 3.39 | 3.64 | 3.27 | 3.90 | 4.43 | 4.42 |
| 5 years | 23.37 | 16.27 | 18.83 | 16.83 | 18.91 | 18.91 | 20.30 | 16.09 | 21.86 | 25.10 | 24.96 |
| Annual average | 4.29 | 3.06 | 3.51 | 3.16 | 3.53 | 3.53 | 3.77 | 3.03 | 4.03 | 4.58 | 4.56 |
| 3 years | 8.97 | 2.70 | 6.55 | 3.55 | 6.60 | 6.60 | 7.34 | 3.59 | 8.20 | 9.97 | 9.85 |
| Annual average | 2.90 | 0.89 | 2.14 | 1.17 | 2.15 | 2.15 | 2.39 | 1.18 | 2.66 | 3.22 | 3.18 |
| 1 year | 3.14 | –2.79 | 2.38 | –2.62 | 2.43 | 1.43 | 2.64 | –0.95 | 2.90 | 3.50 | 3.46 |
| Retirement | |||||||||||
| Income Fund | |||||||||||
| Lifestyle 1 | |||||||||||
| Annual average | |||||||||||
| (life of fund) | 3.00% | 2.70% | 2.55% | 2.55% | 2.45% | 2.45% | 2.62% | 2.37% | 2.74% | 3.27% | 3.26% |
| 10 years | 36.43 | 30.98 | 28.50 | 28.50 | 26.51 | 26.51 | 32.10 | 27.80 | 33.02 | 40.07 | 39.82 |
| Annual average | 3.16 | 2.74 | 2.54 | 2.54 | 2.38 | 2.38 | 2.82 | 2.48 | 2.89 | 3.43 | 3.41 |
| 5 years | 16.49 | 11.83 | 12.24 | 10.24 | 12.12 | 12.12 | 15.06 | 11.32 | 15.05 | 18.11 | 17.90 |
| Annual average | 3.10 | 2.26 | 2.34 | 1.97 | 2.32 | 2.32 | 2.84 | 2.17 | 2.84 | 3.38 | 3.35 |
| 3 years | 7.14 | 2.85 | 4.77 | 1.82 | 4.75 | 4.75 | 6.38 | 2.92 | 6.34 | 8.10 | 7.91 |
| Annual average | 2.33 | 0.94 | 1.57 | 0.60 | 1.56 | 1.56 | 2.08 | 0.97 | 2.07 | 2.63 | 2.57 |
| 1 year | 2.37 | –1.73 | 1.64 | –3.33 | 1.58 | 0.58 | 2.16 | –1.16 | 2.10 | 2.71 | 2.62 |
Current performance may be lower or higher than the quoted past performance, which cannot guarantee future results. After-sales-charge returns for class A and M shares reflect the deduction of the maximum 5.75% and 3.50% sales charge, respectively, levied at the time of purchase. The maximum sales charges for Retirement Income Fund Lifestyle 1 class A and M shares are 4.00% and 3.25%, respectively. Class B share returns after the contingent deferred sales charge (CDSC) reflect the applicable CDSC, which is 5% in the first year, declining over time to 1% in the sixth year, and is eliminated thereafter. Class C share returns after CDSC reflect a 1% CDSC for the first year that is eliminated thereafter. Class R, R6, and Y shares have no initial sales charge or CDSC. Performance for class R6 shares prior to their inception is derived from the historical performance of class Y shares and has not been adjusted for the lower investor servicing fees applicable to class R6 shares; had it, returns would have been higher.
For a portion of the periods, these funds had expense limitations, without which returns would have been lower.
For the funds with eight years of performance, class B share performance reflects conversion to class A shares after eight years.
For the funds with 10 years of performance, class C share performance reflects conversion to class A shares after 10 years.
* The inception date of Putnam RetirementReady 2060 Fund is 11/30/15, for all share classes except class R6, which is on 9/1/16.
| 12 RetirementReady® Funds |
† The inception date of Putnam RetirementReady 2055 Fund is 11/30/10, for all share classes except class R6, which is on 9/1/16.
‡ The inception date of Putnam RetirementReady 2050 Fund is 5/2/05, for all share classes except class R6, which is on 9/1/16.
Comparative index returns For periods ended 7/31/18
| Bloomberg Barclays U.S. | ||
| S&P 500 Index | Aggregate Bond Index | |
| Annual average (life of fund) | ||
| (since 11/1/04)* | 9.11% | 3.79% |
| Annual average (life of fund) | ||
| (since 5/2/05)† | 9.20 | 3.86 |
| Life of fund | 180.04 | 21.38 |
| Annual average (since 11/30/10)‡ | 14.38 | 2.56 |
| Life of fund | 42.94 | 4.25 |
| Annual average (since 11/30/15)** | 14.33 | 1.57 |
| 10 years | 175.51 | 44.24 |
| Annual average | 10.67 | 3.73 |
| 5 years | 85.26 | 11.77 |
| Annual average | 13.12 | 2.25 |
| 3 years | 42.46 | 4.55 |
| Annual average | 12.52 | 1.49 |
| 1 year | 16.24 | –0.80 |
Index results should be compared with fund performance before sales charge, before CDSC, or at net asset value.
* Inception date of all the Putnam RetirementReady Funds with the exception of the 2050, 2055, and 2060 Fund.
† Inception date of Putnam RetirementReady 2050 Fund.
‡ Inception date of Putnam RetirementReady 2055 Fund.
** Inception date of Putnam RetirementReady 2060 Fund.
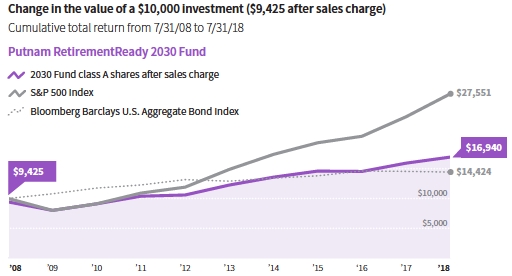
Past performance does not indicate future results. At the end of the same time period, a $10,000 investment in the fund’s class B and C shares would have been valued at $12,642 ($12,342 after contingent deferred sales charge) and $12,637 (contingent deferred sales charge no longer applies). A $10,000 investment in the fund’s class M shares ($9,650 after sales charge) would have been valued at $12,277. A $10,000 investment in the fund’s class R, R6, and Y shares would have been valued at $12,803, $12,999, and $12,969, respectively. See first page of performance section for performance calculation method.
| RetirementReady® Funds 13 |
Past performance does not indicate future results. At the end of the same time period, a $10,000 investment in the fund’s class B and C shares would have been valued at $19,893 and $19,902, respectively, and no contingent deferred sales charges would apply. A $10,000 investment in the fund’s class M shares ($9,650 after sales charge) would have been valued at $19,574. A $10,000 investment in the fund’s class R, R6, and Y shares would have been valued at $20,687, $21,553, and $21,496, respectively. See first page of performance section for performance calculation method.
Past performance does not indicate future results. At the end of the same time period, a $10,000 investment in the fund’s class B and C shares would have been valued at $19,655 and $19,360, respectively, and no contingent deferred sales charges would apply. A $10,000 investment in the fund’s class M shares ($9,650 after sales charge) would have been valued at $19,160. A $10,000 investment in the fund’s class R, R6, and Y shares would have been valued at $20,352, $21,434, and $21,390, respectively. See first page of performance section for performance calculation method.
| 14 RetirementReady® Funds | |
Past performance does not indicate future results. At the end of the same time period, a $10,000 investment in the fund’s class B and C shares would have been valued at $19,406 and $19,119, respectively, and no contingent deferred sales charges would apply. A $10,000 investment in the fund’s class M shares ($9,650 after sales charge) would have been valued at $18,912. A $10,000 investment in the fund’s class R, R6, and Y shares would have been valued at $20,093, $21,173, and $21,122, respectively. See first page of performance section for performance calculation method.
Past performance does not indicate future results. At the end of the same time period, a $10,000 investment in the fund’s class B and C shares would have been valued at $19,033 and $18,749, respectively, and no contingent deferred sales charges would apply. A $10,000 investment in the fund’s class M shares ($9,650 after sales charge) would have been valued at $18,537. A $10,000 investment in the fund’s class R, R6, and Y shares would have been valued at $19,704, $20,749, and $20,712, respectively. See first page of performance section for performance calculation method.
| RetirementReady® Funds 15 |
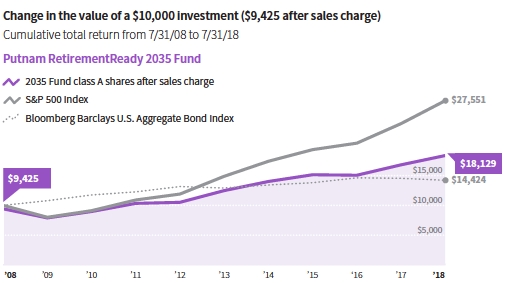
Past performance does not indicate future results. At the end of the same time period, a $10,000 investment in the fund’s class B and C shares would have been valued at $18,115 and $17,845, respectively, and no contingent deferred sales charges would apply. A $10,000 investment in the fund’s class M shares ($9,650 after sales charge) would have been valued at $17,655. A $10,000 investment in the fund’s class R, R6, and Y shares would have been valued at $18,763, $19,764, and $19,724, respectively. See first page of performance section for performance calculation method.
Past performance does not indicate future results. At the end of the same time period, a $10,000 investment in the fund’s class B and C shares would have been valued at $16,923 and $16,681, respectively, and no contingent deferred sales charges would apply. A $10,000 investment in the fund’s class M shares ($9,650 after sales charge) would have been valued at $16,502. A $10,000 investment in the fund’s class R, R6, and Y shares would have been valued at $17,535, $18,460, and $18,432, respectively. See first page of performance section for performance calculation method.
| 16 RetirementReady® Funds | |
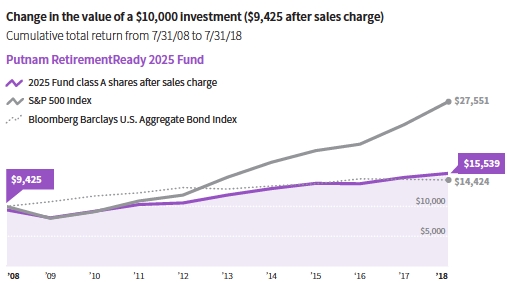
Past performance does not indicate future results. At the end of the same time period, a $10,000 investment in the fund’s class B and C shares would have been valued at $15,524 and $15,299, respectively, and no contingent deferred sales charges would apply. A $10,000 investment in the fund’s class M shares ($9,650 after sales charge) would have been valued at $15,135. A $10,000 investment in the fund’s class R, R6, and Y shares would have been valued at $16,081, $16,938, and $16,904, respectively. See first page of performance section for performance calculation method.
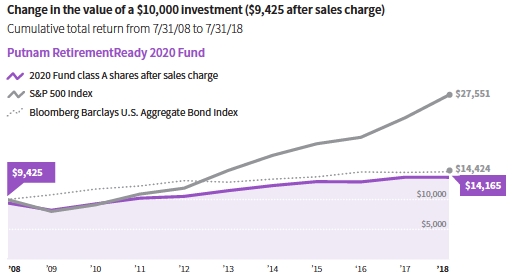
Past performance does not indicate future results. At the end of the same time period, a $10,000 investment in the fund’s class B and C shares would have been valued at $14,162 and $13,951, respectively, and no contingent deferred sales charges would apply. A $10,000 investment in the fund’s class M shares ($9,650 after sales charge) would have been valued at $13,794. A $10,000 investment in the fund’s class R, R6, and Y shares would have been valued at $14,659, $15,431, and $15,414, respectively. See first page of performance section for performance calculation method.
| RetirementReady® Funds 17 |
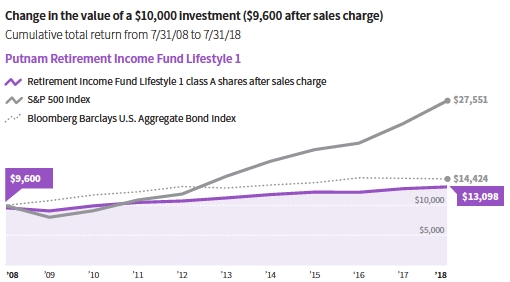
Past performance does not indicate future results. At the end of the same time period, a $10,000 investment in the fund’s class B and C shares would have been valued at $12,850 and $12,651, respectively, and no contingent deferred sales charges would apply. A $10,000 investment in the fund’s class M shares ($9,675 after sales charge) would have been valued at $12,780. A $10,000 investment in the fund’s class R, R6, and Y shares would have been valued at $13,302, $14,007, and $13,982, respectively. See first page of performance section for performance calculation method.
Fund price and distribution information For the 12-month period ended 7/31/18
| Distributions | Class A | Class B | Class C | Class M | Class R | Class R6 | Class Y | ||
| 2060 Fund | |||||||||
| Number | 1 | 1 | 1 | 1 | 1 | 1 | 1 | ||
| Income | $0.447410 | $0.344410 | $0.367410 | $0.378410 | $0.414410 | $0.468410 | $0.460410 | ||
| Capital gains | |||||||||
| Long-term gains | 0.172000 | 0.172000 | 0.172000 | 0.172000 | 0.172000 | 0.172000 | 0.172000 | ||
| Short-term gains | 0.026590 | 0.026590 | 0.026590 | 0.026590 | 0.026590 | 0.026590 | 0.026590 | ||
| Total | $0.646000 | $0.543000 | $0.566000 | $0.577000 | $0.613000 | $0.667000 | $0.659000 | ||
| Before | After | Net | Net | Before | After | Net | Net | Net | |
| sales | sales | asset | asset | sales | sales | asset | asset | asset | |
| Share value | charge | charge | value | value | charge | charge | value | value | value |
| 7/31/17 | $11.11 | $11.79 | $11.05 | $11.03 | $11.08 | $11.48 | $11.10 | $11.15 | $11.14 |
| 7/31/18 | 11.70 | 12.41 | 11.66 | 11.60 | 11.68 | 12.10 | 11.69 | 11.77 | 11.74 |
| 2055 Fund | |||||||||
| Number | 1 | 1 | 1 | 1 | 1 | 1 | 1 | ||
| Income | $0.483 | $0.392 | $0.395 | $0.398 | $0.446 | $0.523 | $0.507 | ||
| Capital gains | |||||||||
| Long-term gains | 0.168 | 0.168 | 0.168 | 0.168 | 0.168 | 0.168 | 0.168 | ||
| Short-term gains | — | — | — | — | — | — | — | ||
| Total | $0.651 | $0.560 | $0.563 | $0.566 | $0.614 | $0.691 | $0.675 | ||
| Before | After | Net | Net | Before | After | Net | Net | Net | |
| sales | sales | asset | asset | sales | sales | asset | asset | asset | |
| Share value | charge | charge | value | value | charge | charge | value | value | value |
| 7/31/17 | $11.92 | $12.65 | $11.81 | $11.66 | $11.89 | $12.32 | $11.86 | $12.03 | $12.01 |
| 7/31/18 | 12.57 | 13.34 | 12.45 | 12.28 | 12.56 | 13.02 | 12.52 | 12.71 | 12.68 |
| 18 RetirementReady® Funds | |
Fund price and distribution information For the 12-month period ended 7/31/18 cont.
| Distributions | Class A | Class B | Class C | Class M | Class R | Class R6 | Class Y | ||
| 2050 Fund | |||||||||
| Number | 1 | 1 | 1 | 1 | 1 | 1 | 1 | ||
| Income | $0.839 | $0.690 | $0.668 | $0.742 | $0.798 | $0.907 | $0.888 | ||
| Capital gains | |||||||||
| Long-term gains | 0.128 | 0.128 | 0.128 | 0.128 | 0.128 | 0.128 | 0.128 | ||
| Short-term gains | — | — | — | — | — | — | — | ||
| Total | $0.967 | $0.818 | $0.796 | $0.870 | $0.926 | $1.035 | $1.016 | ||
| Before | After | Net | Net | Before | After | Net | Net | Net | |
| sales | sales | asset | asset | sales | sales | asset | asset | asset | |
| Share value | charge | charge | value | value | charge | charge | value | value | value |
| 7/31/17 | $19.41 | $20.59 | $19.13 | $18.95 | $19.57 | $20.28 | $19.20 | $19.58 | $19.54 |
| 7/31/18 | 20.52 | 21.77 | 20.19 | 20.02 | 20.68 | 21.43 | 20.27 | 20.70 | 20.66 |
| 2045 Fund | |||||||||
| Number | 1 | 1 | 1 | 1 | 1 | 1 | 1 | ||
| Income | $0.988 | $0.844 | $0.849 | $0.833 | $0.916 | $1.062 | $1.036 | ||
| Capital gains | — | — | — | — | — | — | — | ||
| Total | $0.988 | $0.844 | $0.849 | $0.833 | $0.916 | $1.062 | $1.036 | ||
| Before | After | Net | Net | Before | After | Net | Net | Net | |
| sales | sales | asset | asset | sales | sales | asset | asset | asset | |
| Share value | charge | charge | value | value | charge | charge | value | value | value |
| 7/31/17 | $21.46 | $22.77 | $19.51 | $19.53 | $20.85 | $21.61 | $22.04 | $25.76 | $25.72 |
| 7/31/18 | 22.67 | 24.05 | 20.50 | 20.52 | 22.01 | 22.81 | 23.32 | 27.44 | 27.38 |
| 2040 Fund | |||||||||
| Number | 1 | 1 | 1 | 1 | 1 | 1 | 1 | ||
| Income | $1.101 | $0.938 | $0.954 | $1.070 | $1.001 | $1.176 | $1.157 | ||
| Capital gains | |||||||||
| Long-term gains | 0.019 | 0.019 | 0.019 | 0.019 | 0.019 | 0.019 | 0.019 | ||
| Short-term gains | — | — | — | — | — | — | — | ||
| Total | $1.120 | $0.957 | $0.973 | $1.089 | $1.020 | $1.195 | $1.176 | ||
| Before | After | Net | Net | Before | After | Net | Net | Net | |
| sales | sales | asset | asset | sales | sales | asset | asset | asset | |
| Share value | charge | charge | value | value | charge | charge | value | value | value |
| 7/31/17 | $23.21 | $24.63 | $21.35 | $21.06 | $21.78 | $22.57 | $23.95 | $27.29 | $27.26 |
| 7/31/18 | 24.24 | 25.72 | 22.20 | 21.88 | 22.59 | 23.41 | 25.09 | 28.73 | 28.68 |
| 2035 Fund | |||||||||
| Number | 1 | 1 | 1 | 1 | 1 | 1 | 1 | ||
| Income | $0.843 | $0.645 | $0.669 | $0.732 | $0.801 | $0.920 | $0.895 | ||
| Capital gains | — | — | — | — | — | — | — | ||
| Total | $0.843 | $0.645 | $0.669 | $0.732 | $0.801 | $0.920 | $0.895 | ||
| Before | After | Net | Net | Before | After | Net | Net | Net | |
| sales | sales | asset | asset | sales | sales | asset | asset | asset | |
| Share value | charge | charge | value | value | charge | charge | value | value | value |
| 7/31/17 | $23.10 | $24.51 | $21.21 | $21.12 | $22.23 | $23.04 | $22.26 | $27.03 | $26.98 |
| 7/31/18 | 24.08 | 25.55 | 22.07 | 21.96 | 23.14 | 23.98 | 23.16 | 28.35 | 28.30 |
| RetirementReady® Funds 19 |
Fund price and distribution information For the 12-month period ended 7/31/18 cont.
| Distributions | Class A | Class B | Class C | Class M | Class R | Class R6 | Class Y | ||
| 2030 Fund | |||||||||
| Number | 1 | 1 | 1 | 1 | 1 | 1 | 1 | ||
| Income | $0.719 | $0.546 | $0.576 | $0.618 | $0.673 | $0.795 | $0.779 | ||
| Capital gains | — | — | — | — | — | — | — | ||
| Total | $0.719 | $0.546 | $0.576 | $0.618 | $0.673 | $0.795 | $0.779 | ||
| Before | After | Net | Net | Before | After | Net | Net | Net | |
| sales | sales | asset | asset | sales | sales | asset | asset | asset | |
| Share value | charge | charge | value | value | charge | charge | value | value | value |
| 7/31/17 | $22.51 | $23.88 | $21.36 | $21.32 | $21.88 | $22.67 | $21.39 | $25.84 | $25.80 |
| 7/31/18 | 23.22 | 24.64 | 22.02 | 21.94 | 22.55 | 23.37 | 22.02 | 26.78 | 26.74 |
| 2025 Fund | |||||||||
| Number | 1 | 1 | 1 | 1 | 1 | 1 | 1 | ||
| Income | $0.486 | $0.333 | $0.329 | $0.324 | $0.448 | $0.563 | $0.542 | ||
| Capital gains | — | — | — | — | — | — | — | ||
| Total | $0.486 | $0.333 | $0.329 | $0.324 | $0.448 | $0.563 | $0.542 | ||
| Before | After | Net | Net | Before | After | Net | Net | Net | |
| sales | sales | asset | asset | sales | sales | asset | asset | asset | |
| Share value | charge | charge | value | value | charge | charge | value | value | value |
| 7/31/17 | $22.36 | $23.72 | $20.84 | $20.78 | $21.13 | $21.90 | $20.97 | $22.55 | $22.50 |
| 7/31/18 | 22.91 | 24.31 | 21.32 | 21.26 | 21.68 | 22.47 | 21.44 | 23.11 | 23.06 |
| 2020 Fund | |||||||||
| Number | 1 | 1 | 1 | 1 | 1 | 1 | 1 | ||
| Income | $0.452 | $0.287 | $0.296 | $0.296 | $0.415 | $0.516 | $0.506 | ||
| Capital gains | — | — | — | — | — | — | — | ||
| Total | $0.452 | $0.287 | $0.296 | $0.296 | $0.415 | $0.516 | $0.506 | ||
| Before | After | Net | Net | Before | After | Net | Net | Net | |
| sales | sales | asset | asset | sales | sales | asset | asset | asset | |
| Share value | charge | charge | value | value | charge | charge | value | value | value |
| 7/31/17 | $19.47 | $20.66 | $18.73 | $18.71 | $19.10 | $19.79 | $18.77 | $21.90 | $21.88 |
| 7/31/18 | 19.63 | 20.83 | 18.89 | 18.87 | 19.31 | 20.01 | 18.90 | 22.15 | 22.13 |
| Retirement Income | |||||||||
| Fund | |||||||||
| Lifestyle 1 | |||||||||
| Number | 12 | 3 | 3 | 12 | 12 | 12 | 12 | ||
| Income | $0.448 | $0.366 | $0.365 | $0.402 | $0.401 | $0.508 | $0.494 | ||
| Capital gains | — | — | — | — | — | — | — | ||
| Total | $0.448 | $0.366 | $0.365 | $0.402 | $0.401 | $0.508 | $0.494 | ||
| Before | After | Net | Net | Before | After | Net | Net | Net | |
| sales | sales | asset | asset | sales | sales | asset | asset | asset | |
| Share value | charge | charge | value | value | charge | charge | value | value | value |
| 7/31/17 | $17.65 | $18.39 | $17.28 | $17.33 | $17.69 | $18.28 | $17.64 | $17.71 | $17.71 |
| 7/31/18 | 17.62 | 18.35 | 17.20 | 17.24 | 17.67 | 18.26 | 17.61 | 17.68 | 17.68 |
The classification of distributions, if any, is an estimate. Before-sales-charge share value and current dividend rate for class A and M shares, if applicable, do not take into account any sales charge levied at the time of purchase. After-sales-charge share value, current dividend rate, and current 30-day SEC yield, if applicable, are calculated assuming that the maximum sales charge (5.75% for class A shares and 3.50% for class M shares for all funds except Retirement Income Fund Lifestyle 1, for which the rates are 4.00% for class A shares and 3.25% for class M shares) was levied at the time of purchase. Final distribution information will appear on your year-end tax forms.
| 20 RetirementReady® Funds |
Fund performance as of most recent calendar quarter Total return for periods ended 6/30/18
| Class A | Class B | Class C | Class M | Class R | Class R6 | Class Y | |||||
| (11/1/04) | (11/1/04) | (11/1/04) | (11/1/04) | (11/1/04) | (9/1/16) | (11/1/04) | |||||
| Before | After | Before | After | Net | Net | Net | |||||
| sales | sales | Before | After | Before | After | sales | sales | asset | asset | asset | |
| charge | charge | CDSC | CDSC | CDSC | CDSC | charge | charge | value | value | value | |
| 2060 Fund* | |||||||||||
| Life of fund | 25.19% | 18.00% | 22.84% | 19.84% | 22.78% | 22.78% | 23.63% | 19.30% | 24.41% | 26.24% | 26.05% |
| Annual average | 9.09 | 6.62 | 8.29 | 7.26 | 8.27 | 8.27 | 8.56 | 7.07 | 8.82 | 9.44 | 9.37 |
| 1 year | 10.53 | 4.18 | 9.80 | 4.80 | 9.66 | 8.66 | 10.00 | 6.15 | 10.33 | 10.97 | 10.82 |
| 2055 Fund† | |||||||||||
| Life of fund | 104.73% | 92.96% | 93.49% | 93.49% | 93.51% | 93.51% | 97.19% | 90.29% | 101.09% | 109.26% | 108.85% |
| Annual average | 9.91 | 9.05 | 9.09 | 9.09 | 9.10 | 9.10 | 9.37 | 8.85 | 9.65 | 10.23 | 10.20 |
| 5 years | 60.54 | 51.30 | 54.69 | 52.69 | 54.65 | 54.65 | 56.62 | 51.14 | 58.64 | 63.01 | 62.70 |
| Annual average | 9.93 | 8.64 | 9.12 | 8.83 | 9.11 | 9.11 | 9.39 | 8.61 | 9.67 | 10.27 | 10.22 |
| 3 years | 23.44 | 16.34 | 20.73 | 17.73 | 20.78 | 20.78 | 21.70 | 17.45 | 22.60 | 24.77 | 24.53 |
| Annual average | 7.27 | 5.17 | 6.48 | 5.59 | 6.49 | 6.49 | 6.77 | 5.51 | 7.03 | 7.66 | 7.59 |
| 1 year | 10.37 | 4.03 | 9.57 | 4.57 | 9.54 | 8.54 | 9.82 | 5.98 | 10.18 | 10.79 | 10.68 |
| 2050 Fund‡ | |||||||||||
| Annual average | |||||||||||
| (life of fund) | 6.73% | 6.25% | 6.25% | 6.25% | 6.12% | 6.12% | 6.20% | 5.91% | 6.46% | 7.01% | 6.99% |
| 10 years | 99.26 | 87.80 | 87.57 | 87.57 | 84.83 | 84.83 | 89.54 | 82.91 | 94.36 | 104.69 | 104.25 |
| Annual average | 7.14 | 6.51 | 6.49 | 6.49 | 6.34 | 6.34 | 6.60 | 6.22 | 6.87 | 7.43 | 7.40 |
| 5 years | 59.65 | 50.47 | 53.76 | 51.76 | 53.77 | 53.77 | 55.74 | 50.29 | 57.67 | 61.98 | 61.64 |
| Annual average | 9.81 | 8.51 | 8.98 | 8.70 | 8.99 | 8.99 | 9.27 | 8.49 | 9.53 | 10.13 | 10.08 |
| 3 years | 23.14 | 16.06 | 20.42 | 17.42 | 20.41 | 20.41 | 21.32 | 17.07 | 22.23 | 24.34 | 24.08 |
| Annual average | 7.19 | 5.09 | 6.39 | 5.50 | 6.39 | 6.39 | 6.65 | 5.40 | 6.92 | 7.53 | 7.46 |
| 1 year | 10.18 | 3.85 | 9.36 | 4.36 | 9.33 | 8.33 | 9.63 | 5.80 | 9.91 | 10.62 | 10.43 |
| 2045 Fund | |||||||||||
| Annual average | |||||||||||
| (life of fund) | 6.73% | 6.27% | 6.26% | 6.26% | 6.15% | 6.15% | 6.20% | 5.92% | 6.47% | 7.01% | 6.99% |
| 10 years | 97.17 | 85.83 | 85.67 | 85.67 | 82.97 | 82.97 | 87.60 | 81.03 | 92.30 | 102.56 | 102.13 |
| Annual average | 7.02 | 6.39 | 6.38 | 6.38 | 6.23 | 6.23 | 6.49 | 6.11 | 6.76 | 7.31 | 7.29 |
| 5 years | 57.92 | 48.84 | 52.12 | 50.12 | 52.15 | 52.15 | 54.07 | 48.68 | 56.01 | 60.26 | 59.92 |
| Annual average | 9.57 | 8.28 | 8.75 | 8.47 | 8.76 | 8.76 | 9.03 | 8.26 | 9.30 | 9.89 | 9.84 |
| 3 years | 22.68 | 15.62 | 19.98 | 16.98 | 19.97 | 19.97 | 20.87 | 16.64 | 21.80 | 23.91 | 23.65 |
| Annual average | 7.05 | 4.96 | 6.26 | 5.37 | 6.26 | 6.26 | 6.52 | 5.26 | 6.79 | 7.41 | 7.33 |
| 1 year | 9.88 | 3.56 | 9.05 | 4.05 | 9.00 | 8.00 | 9.31 | 5.48 | 9.60 | 10.28 | 10.15 |
| 2040 Fund | |||||||||||
| Annual average | |||||||||||
| (life of fund) | 6.58% | 6.12% | 6.11% | 6.11% | 6.00% | 6.00% | 6.04% | 5.77% | 6.31% | 6.85% | 6.84% |
| 10 years | 94.04 | 82.88 | 82.78 | 82.78 | 79.99 | 79.99 | 84.49 | 78.04 | 89.23 | 99.29 | 98.92 |
| Annual average | 6.85 | 6.22 | 6.22 | 6.22 | 6.05 | 6.05 | 6.32 | 5.94 | 6.59 | 7.14 | 7.12 |
| 5 years | 54.57 | 45.68 | 48.89 | 46.89 | 48.88 | 48.88 | 50.76 | 45.48 | 52.67 | 56.80 | 56.51 |
| Annual average | 9.10 | 7.82 | 8.29 | 7.99 | 8.28 | 8.28 | 8.56 | 7.79 | 8.83 | 9.41 | 9.37 |
| 3 years | 21.32 | 14.35 | 18.56 | 15.56 | 18.57 | 18.57 | 19.50 | 15.32 | 20.39 | 22.45 | 22.23 |
| Annual average | 6.66 | 4.57 | 5.84 | 4.94 | 5.84 | 5.84 | 6.12 | 4.87 | 6.38 | 6.99 | 6.92 |
| 1 year | 9.08 | 2.81 | 8.26 | 3.26 | 8.26 | 7.26 | 8.53 | 4.73 | 8.84 | 9.51 | 9.37 |
| RetirementReady® Funds 21 |
Fund performance as of most recent calendar quarter
Total return for periods ended 6/30/18 cont.
| Class A | Class B | Class C | Class M | Class R | Class R6 | Class Y | |||||
| (11/1/04) | (11/1/04) | (11/1/04) | (11/1/04) | (11/1/04) | (9/1/16) | (11/1/04) | |||||
| Before | After | Before | After | Net | Net | Net | |||||
| sales | sales | Before | After | Before | After | sales | sales | asset | asset | asset | |
| charge | charge | CDSC | CDSC | CDSC | CDSC | charge | charge | value | value | value | |
| 2035 Fund | |||||||||||
| Annual average | |||||||||||
| (life of fund) | 6.16% | 5.70% | 5.69% | 5.69% | 5.58% | 5.58% | 5.63% | 5.36% | 5.89% | 6.44% | 6.43% |
| 10 years | 85.53 | 74.86 | 74.65 | 74.65 | 72.07 | 72.07 | 76.48 | 70.31 | 80.94 | 90.56 | 90.17 |
| Annual average | 6.38 | 5.75 | 5.73 | 5.73 | 5.58 | 5.58 | 5.84 | 5.47 | 6.11 | 6.66 | 6.64 |
| 5 years | 48.63 | 40.09 | 43.25 | 41.25 | 43.19 | 43.19 | 45.03 | 39.96 | 46.85 | 50.82 | 50.51 |
| Annual average | 8.25 | 6.97 | 7.45 | 7.15 | 7.44 | 7.44 | 7.72 | 6.95 | 7.99 | 8.56 | 8.52 |
| 3 years | 18.90 | 12.06 | 16.23 | 13.23 | 16.25 | 16.25 | 17.13 | 13.03 | 18.00 | 19.98 | 19.74 |
| Annual average | 5.94 | 3.87 | 5.14 | 4.23 | 5.15 | 5.15 | 5.41 | 4.17 | 5.67 | 6.26 | 6.19 |
| 1 year | 7.84 | 1.64 | 7.05 | 2.05 | 7.05 | 6.05 | 7.31 | 3.55 | 7.57 | 8.24 | 8.12 |
| 2030 Fund | |||||||||||
| Annual average | |||||||||||
| (life of fund) | 5.63% | 5.17% | 5.16% | 5.16% | 5.05% | 5.05% | 5.10% | 4.83% | 5.37% | 5.90% | 5.89% |
| 10 years | 74.11 | 64.10 | 63.96 | 63.96 | 61.50 | 61.50 | 65.61 | 59.82 | 69.86 | 78.76 | 78.48 |
| Annual average | 5.70 | 5.08 | 5.07 | 5.07 | 4.91 | 4.91 | 5.17 | 4.80 | 5.44 | 5.98 | 5.96 |
| 5 years | 41.25 | 33.13 | 36.07 | 34.07 | 36.00 | 36.00 | 37.78 | 32.95 | 39.50 | 43.21 | 42.99 |
| Annual average | 7.15 | 5.89 | 6.35 | 6.04 | 6.34 | 6.34 | 6.62 | 5.86 | 6.88 | 7.45 | 7.41 |
| 3 years | 15.73 | 9.07 | 13.13 | 10.13 | 13.14 | 13.14 | 13.99 | 10.00 | 14.89 | 16.74 | 16.56 |
| Annual average | 4.99 | 2.94 | 4.20 | 3.27 | 4.20 | 4.20 | 4.46 | 3.23 | 4.73 | 5.30 | 5.24 |
| 1 year | 6.38 | 0.26 | 5.56 | 0.56 | 5.57 | 4.57 | 5.86 | 2.15 | 6.11 | 6.73 | 6.63 |
| 2025 Fund | |||||||||||
| Annual average | |||||||||||
| (life of fund) | 4.97% | 4.51% | 4.51% | 4.51% | 4.39% | 4.39% | 4.44% | 4.17% | 4.70% | 5.24% | 5.23% |
| 10 years | 60.59 | 51.36 | 51.21 | 51.21 | 48.97 | 48.97 | 52.73 | 47.38 | 56.63 | 64.97 | 64.63 |
| Annual average | 4.85 | 4.23 | 4.22 | 4.22 | 4.07 | 4.07 | 4.33 | 3.95 | 4.59 | 5.13 | 5.11 |
| 5 years | 33.19 | 25.54 | 28.23 | 26.23 | 28.27 | 28.27 | 29.90 | 25.36 | 31.57 | 35.11 | 34.83 |
| Annual average | 5.90 | 4.65 | 5.10 | 4.77 | 5.10 | 5.10 | 5.37 | 4.62 | 5.64 | 6.20 | 6.16 |
| 3 years | 12.26 | 5.81 | 9.79 | 6.79 | 9.76 | 9.76 | 10.63 | 6.76 | 11.45 | 13.33 | 13.09 |
| Annual average | 3.93 | 1.90 | 3.16 | 2.22 | 3.15 | 3.15 | 3.42 | 2.20 | 3.68 | 4.26 | 4.19 |
| 1 year | 4.76 | –1.26 | 3.93 | –1.07 | 3.97 | 2.97 | 4.22 | 0.57 | 4.51 | 5.12 | 4.99 |
| 2020 Fund | |||||||||||
| Annual average | |||||||||||
| (life of fund) | 4.14% | 3.69% | 3.68% | 3.68% | 3.57% | 3.57% | 3.62% | 3.35% | 3.88% | 4.41% | 4.40% |
| 10 years | 47.31 | 38.84 | 38.78 | 38.78 | 36.67 | 36.67 | 40.11 | 35.21 | 43.70 | 51.19 | 51.03 |
| Annual average | 3.95 | 3.34 | 3.33 | 3.33 | 3.17 | 3.17 | 3.43 | 3.06 | 3.69 | 4.22 | 4.21 |
| 5 years | 25.45 | 18.24 | 20.82 | 18.82 | 20.83 | 20.83 | 22.29 | 18.01 | 23.91 | 27.17 | 27.03 |
| Annual average | 4.64 | 3.41 | 3.85 | 3.51 | 3.86 | 3.86 | 4.11 | 3.37 | 4.38 | 4.92 | 4.90 |
| 3 years | 9.39 | 3.10 | 7.03 | 4.03 | 6.97 | 6.97 | 7.76 | 3.99 | 8.63 | 10.36 | 10.24 |
| Annual average | 3.04 | 1.02 | 2.29 | 1.33 | 2.27 | 2.27 | 2.52 | 1.31 | 2.80 | 3.34 | 3.30 |
| 1 year | 3.42 | –2.53 | 2.72 | –2.28 | 2.66 | 1.66 | 2.92 | –0.68 | 3.18 | 3.75 | 3.71 |
| 22 RetirementReady® Funds | |
Fund performance as of most recent calendar quarter
Total return for periods ended 6/30/18 cont.
| Class A | Class B | Class C | Class M | Class R | Class R6 | Class Y | |||||
| (11/1/04) | (11/1/04) | (11/1/04) | (11/1/04) | (11/1/04) | (9/1/16) | (11/1/04) | |||||
| Before | After | Before | After | Net | Net | Net | |||||
| sales | sales | Before | After | Before | After | sales | sales | asset | asset | asset | |
| charge | charge | CDSC | CDSC | CDSC | CDSC | charge | charge | value | value | value | |
| Retirement | |||||||||||
| Income Fund | |||||||||||
| Lifestyle 1 | |||||||||||
| Annual average | |||||||||||
| (life of fund) | 2.98% | 2.68% | 2.53% | 2.53% | 2.43% | 2.43% | 2.60% | 2.35% | 2.73% | 3.25% | 3.24% |
| 10 years | 35.04 | 29.64 | 27.15 | 27.15 | 25.29 | 25.29 | 30.75 | 26.50 | 31.69 | 38.67 | 38.43 |
| Annual average | 3.05 | 2.63 | 2.43 | 2.43 | 2.28 | 2.28 | 2.72 | 2.38 | 2.79 | 3.32 | 3.31 |
| 5 years | 17.44 | 12.74 | 13.10 | 11.10 | 13.12 | 13.12 | 15.99 | 12.22 | 15.92 | 19.05 | 18.85 |
| Annual average | 3.27 | 2.43 | 2.49 | 2.13 | 2.50 | 2.50 | 3.01 | 2.33 | 3.00 | 3.55 | 3.51 |
| 3 years | 7.52 | 3.22 | 5.11 | 2.14 | 5.15 | 5.15 | 6.76 | 3.29 | 6.72 | 8.54 | 8.36 |
| Annual average | 2.45 | 1.06 | 1.68 | 0.71 | 1.69 | 1.69 | 2.21 | 1.09 | 2.19 | 2.77 | 2.71 |
| 1 year | 2.61 | –1.49 | 1.86 | –3.13 | 1.85 | 0.85 | 2.41 | –0.92 | 2.41 | 2.95 | 2.87 |
* The inception date of Putnam RetirementReady 2060 Fund is 11/30/15, for all share classes except class R6, which is on 9/1/16.
† The inception date of Putnam RetirementReady 2055 Fund is 11/30/10, for all share classes except class R6, which is on 9/1/16.
‡ The inception date of Putnam RetirementReady 2050 Fund is 5/2/05, for all share classes except class R6, which is on 9/1/16.
See the discussion following the fund performance tables on page 10 for information about the calculation of fund performance.
| RetirementReady® Funds 23 |
Your fund’s expenses
As a mutual fund investor, you pay ongoing expenses, such as management fees, distribution fees (12b-1 fees), and other expenses. In the most recent six-month period your fund’s expenses were limited; had expenses not been limited, they would have been higher. Using the following information, you can estimate how these expenses affect your investment and compare them with the expenses of other funds. You may also pay one-time transaction expenses, including sales charges (loads) and redemption fees, which are not shown in this section and would have resulted in higher total expenses. For more information, see your fund’s prospectus or talk to your financial representative.
Expense ratios
| Class A | Class B | Class C | Class M | Class R | Class R6 | Class Y | |
| Putnam RetirementReady 2060 Fund | |||||||
| Net expenses for the fiscal year | |||||||
| ended 7/31/17* | 1.05% | 1.80% | 1.80% | 1.55% | 1.30% | 0.69% | 0.80% |
| Total annual operating expenses for the | |||||||
| fiscal year ended 7/31/17 | 50.74% | 51.49% | 51.49% | 51.24% | 50.99% | 50.38% | 50.49% |
| Annualized expense ratio for the six-month | |||||||
| period ended 7/31/18# | 0.37% | 1.12% | 1.12% | 0.87% | 0.62% | 0.05% | 0.12% |
| Putnam RetirementReady 2055 Fund | |||||||
| Net expenses for the fiscal year | |||||||
| ended 7/31/17** | 1.11% | 1.86% | 1.86% | 1.61% | 1.36% | 0.69% | 0.86% |
| Total annual operating expenses for the | |||||||
| fiscal year ended 7/31/17 | 1.99% | 2.74% | 2.74% | 2.49% | 2.24% | 1.57% | 1.74% |
| Annualized expense ratio for the six-month | |||||||
| period ended 7/31/18# | 0.43% | 1.18% | 1.18% | 0.93% | 0.68% | 0.05% | 0.18% |
| Putnam RetirementReady 2050 Fund | |||||||
| Net expenses for the fiscal year | |||||||
| ended 7/31/17** | 1.08% | 1.83% | 1.83% | 1.58% | 1.33% | 0.70% | 0.83% |
| Total annual operating expenses for the | |||||||
| fiscal year ended 7/31/17 | 1.35% | 2.10% | 2.10% | 1.85% | 1.60% | 0.97% | 1.10% |
| Annualized expense ratio for the six-month | |||||||
| period ended 7/31/18# | 0.40% | 1.15% | 1.15% | 0.90% | 0.65% | 0.05% | 0.15% |
| Putnam RetirementReady 2045 Fund | |||||||
| Net expenses for the fiscal year | |||||||
| ended 7/31/17** | 1.09% | 1.84% | 1.84% | 1.59% | 1.34% | 0.70% | 0.84% |
| Total annual operating expenses for the | |||||||
| fiscal year ended 7/31/17 | 1.34% | 2.09% | 2.09% | 1.84% | 1.59% | 0.95% | 1.09% |
| Annualized expense ratio for the six-month | |||||||
| period ended 7/31/18# | 0.41% | 1.16% | 1.16% | 0.91% | 0.66% | 0.05% | 0.16% |
| Putnam RetirementReady 2040 Fund | |||||||
| Net expenses for the fiscal year | |||||||
| ended 7/31/17** | 1.05% | 1.80% | 1.80% | 1.55% | 1.30% | 0.70% | 0.80% |
| Total annual operating expenses for the | |||||||
| fiscal year ended 7/31/17 | 1.18% | 1.93% | 1.93% | 1.68% | 1.43% | 0.83% | 0.93% |
| Annualized expense ratio for the six-month | |||||||
| period ended 7/31/18# | 0.38% | 1.13% | 1.13% | 0.88% | 0.63% | 0.05% | 0.13% |
| 24 RetirementReady® Funds |
Expense ratios cont.
| Class A | Class B | Class C | Class M | Class R | Class R6 | Class Y | |
| Putnam RetirementReady 2035 Fund | |||||||
| Net expenses for the fiscal year | |||||||
| ended 7/31/17** | 1.07% | 1.82% | 1.82% | 1.57% | 1.32% | 0.69% | 0.82% |
| Total annual operating expenses for the | |||||||
| fiscal year ended 7/31/17 | 1.24% | 1.99% | 1.99% | 1.74% | 1.49% | 0.86% | 0.99% |
| Annualized expense ratio for the six-month | |||||||
| period ended 7/31/18# | 0.40% | 1.15% | 1.15% | 0.90% | 0.65% | 0.05% | 0.15% |
| Putnam RetirementReady 2030 Fund | |||||||
| Net expenses for the fiscal year | |||||||
| ended 7/31/17** | 1.01% | 1.76% | 1.76% | 1.51% | 1.26% | 0.66% | 0.76% |
| Total annual operating expenses for the | |||||||
| fiscal year ended 7/31/17 | 1.12% | 1.87% | 1.87% | 1.62% | 1.37% | 0.77% | 0.87% |
| Annualized expense ratio for the six-month | |||||||
| period ended 7/31/18# | 0.38% | 1.13% | 1.13% | 0.88% | 0.63% | 0.05% | 0.13% |
| Putnam RetirementReady 2025 Fund | |||||||
| Net expenses for the fiscal year | |||||||
| ended 7/31/17** | 1.03% | 1.78% | 1.78% | 1.53% | 1.28% | 0.65% | 0.78% |
| Total annual operating expenses for the | |||||||
| fiscal year ended 7/31/17 | 1.19% | 1.94% | 1.94% | 1.69% | 1.44% | 0.81% | 0.94% |
| Annualized expense ratio for the six-month | |||||||
| period ended 7/31/18# | 0.40% | 1.15% | 1.15% | 0.90% | 0.65% | 0.05% | 0.15% |
| Putnam RetirementReady 2020 Fund | |||||||
| Net expenses for the fiscal year | |||||||
| ended 7/31/17** | 0.96% | 1.71% | 1.71% | 1.46% | 1.21% | 0.63% | 0.71% |
| Total annual operating expenses for the | |||||||
| fiscal year ended 7/31/17 | 1.09% | 1.84% | 1.84% | 1.59% | 1.34% | 0.76% | 0.84% |
| Annualized expense ratio for the six-month | |||||||
| period ended 7/31/18# | 0.38% | 1.13% | 1.13% | 0.88% | 0.63% | 0.05% | 0.13% |
| Putnam Retirement Income Fund | |||||||
| Lifestyle 1 | |||||||
| Net expenses for the fiscal year | |||||||
| ended 7/31/17** | 0.95% | 1.70% | 1.70% | 1.20% | 1.20% | 0.61% | 0.70% |
| Total annual operating expenses for the | |||||||
| fiscal year ended 7/31/17 | 1.14% | 1.89% | 1.89% | 1.39% | 1.39% | 0.80% | 0.89% |
| Annualized expense ratio for the six-month | |||||||
| period ended 7/31/18# | 0.38% | 1.13% | 1.13% | 0.63% | 0.63% | 0.05% | 0.13% |
Fiscal year expense information in this table is taken from the most recent prospectus, is subject to change, and differs from that shown for the annualized expense ratio and in the financial highlights of this report.
Expenses are shown as a percentage of average net assets.
| RetirementReady® Funds 25 |
Expense ratios cont.
Prospectus expense information also includes the impact of acquired fund fees and expense in which each fund invests (see table below), which are not included in financial highlights or annualized expense ratios. Restated to reflect (1) current fees resulting from a change in the fund’s and the underlying funds’ investor servicing arrangements; and (2) investment by the fund in class G shares of Putnam Government Money Market Fund and class P shares of the other underlying funds.
| Putnam RetirementReady 2060 Fund | 0.64% | ||
| Putnam RetirementReady 2055 Fund | 0.64% | ||
| Putnam RetirementReady 2050 Fund | 0.65% | ||
| Putnam RetirementReady 2045 Fund | 0.65% | ||
| Putnam RetirementReady 2040 Fund | 0.65% | ||
| Putnam RetirementReady 2035 Fund | 0.64% | ||
| Putnam RetirementReady 2030 Fund | 0.61% | ||
| Putnam RetirementReady 2025 Fund | 0.60% | ||
| Putnam RetirementReady 2020 Fund | 0.58% | ||
| Putnam Retirement Income Fund Lifestyle 1 | 0.56% |
* Reflects Putnam Management’s decision to contractually limit expenses through 11/30/27.
** Reflects Putnam Management’s decision to contractually limit expenses through 11/30/18.
# Excludes the expense ratio of the underlying Putnam mutual funds.
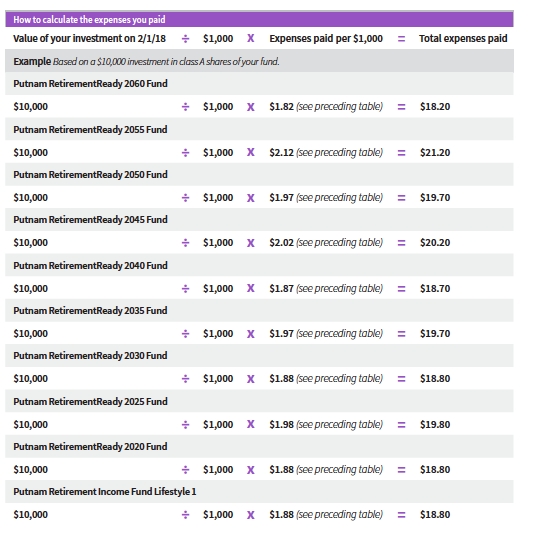
Expenses per $1,000
The following table shows the expenses you would have paid on a $1,000 investment in each fund from 2/1/18 to 7/31/18. It also shows how much a $1,000 investment would be worth at the close of the period, assuming actual returns and expenses.
| Class A | Class B | Class C | Class M | Class R | Class R6 | Class Y | |
| Putnam RetirementReady | |||||||
| 2060 Fund | |||||||
| Expenses paid per $1,000*† | $1.82 | $5.50 | $5.50 | $4.28 | $3.05 | $0.25 | $0.59 |
| Ending value (after expenses) | $984.80 | $981.50 | $981.40 | $982.30 | $983.20 | $986.60 | $985.70 |
| Putnam RetirementReady | |||||||
| 2055 Fund | |||||||
| Expenses paid per $1,000*† | $2.12 | $5.80 | $5.80 | $4.57 | $3.34 | $0.25 | $0.89 |
| Ending value (after expenses) | $984.30 | $981.10 | $980.80 | $982.00 | $983.50 | $986.80 | $986.00 |
| Putnam RetirementReady | |||||||
| 2050 Fund | |||||||
| Expenses paid per $1,000*† | $1.97 | $5.65 | $5.65 | $4.42 | $3.20 | $0.25 | $0.74 |
| Ending value (after expenses) | $985.60 | $981.50 | $981.40 | $982.90 | $984.00 | $987.10 | $986.20 |
| Putnam RetirementReady | |||||||
| 2045 Fund | |||||||
| Expenses paid per $1,000*† | $2.02 | $5.70 | $5.70 | $4.48 | $3.25 | $0.25 | $0.79 |
| Ending value (after expenses) | $986.10 | $982.30 | $982.30 | $983.50 | $984.80 | $987.80 | $987.00 |
| Putnam RetirementReady | |||||||
| 2040 Fund | |||||||
| Expenses paid per $1,000*† | $1.87 | $5.56 | $5.56 | $4.33 | $3.10 | $0.25 | $0.64 |
| Ending value (after expenses) | $987.00 | $982.70 | $983.40 | $984.30 | $985.50 | $988.30 | $987.90 |
| Putnam RetirementReady | |||||||
| 2035 Fund | |||||||
| Expenses paid per $1,000*† | $1.97 | $5.66 | $5.66 | $4.43 | $3.20 | $0.25 | $0.74 |
| Ending value (after expenses) | $988.10 | $984.40 | $984.80 | $985.90 | $987.20 | $990.20 | $989.50 |
| 26 RetirementReady® Funds |
Expense per $1,000 cont.
| Class A | Class B | Class C | Class M | Class R | Class R6 | Class Y | |
| Putnam RetirementReady | |||||||
| 2030 Fund | |||||||
| Expenses paid per $1,000*† | $1.88 | $5.57 | $5.57 | $4.34 | $3.11 | $0.25 | $0.64 |
| Ending value (after expenses) | $990.60 | $987.40 | $987.00 | $988.60 | $989.20 | $992.20 | $991.80 |
| Putnam RetirementReady | |||||||
| 2025 Fund | |||||||
| Expenses paid per $1,000*† | $1.98 | $5.67 | $5.67 | $4.44 | $3.21 | $0.25 | $0.74 |
| Ending value (after expenses) | $991.80 | $988.40 | $988.40 | $989.50 | $990.80 | $993.60 | $993.10 |
| Putnam RetirementReady | |||||||
| 2020 Fund | |||||||
| Expenses paid per $1,000*† | $1.88 | $5.57 | $5.57 | $4.34 | $3.11 | $0.25 | $0.64 |
| Ending value (after expenses) | $992.40 | $989.00 | $989.50 | $990.30 | $991.60 | $994.20 | $994.20 |
| Putnam Retirement Income | |||||||
| Fund Lifestyle 1 | |||||||
| Expenses paid per $1,000*† | $1.88 | $5.58 | $5.58 | $3.11 | $3.11 | $0.25 | $0.64 |
| Ending value (after expenses) | $994.30 | $990.40 | $990.40 | $993.00 | $993.00 | $995.90 | $995.60 |
* Expenses for each share class are calculated using the fund’s annualized expense ratio for each class, which represents the ongoing expenses as a percentage of average net assets for the six months ended 7/31/18. The expense ratio may differ for each share class.
† Expenses are calculated by multiplying the expense ratio by the average account value for the period; then multiplying the result by the number of days in the period; and then dividing that result by the number of days in the year.
| RetirementReady® Funds 27 |
Estimate the expenses you paid
To estimate the expenses you paid for the six months ended 7/31/18, use the following calculation method. To find the value of your investment on 2/1/18, call Putnam at 1-800-225-1581.
| 28 RetirementReady® Funds | |
Compare expenses using the SEC’s method
The Securities and Exchange Commission (SEC) has established guidelines to help investors assess fund expenses. Per these guidelines, the following table shows your fund’s expenses based on a $1,000 investment, assuming a hypothetical 5% annualized return. You can use this information to compare the ongoing expenses (but not transaction expenses or total costs) of investing in each of the RetirementReady Funds with those of other funds. All mutual fund shareholder reports will provide this information to help you make this comparison. Please note that you cannot use this information to estimate your actual ending account balance and expenses paid during the period.
| Class A | Class B | Class C | Class M | Class R | Class R6 | Class Y | |
| Putnam RetirementReady | |||||||
| 2060 Fund | |||||||
| Expenses paid per $1,000*† | $1.86 | $5.61 | $5.61 | $4.36 | $3.11 | $0.25 | $0.60 |
| Ending value (after expenses) | $1,022.96 | $1,019.24 | $1,019.24 | $1,020.48 | $1,021.72 | $1,024.55 | $1,024.20 |
| Putnam RetirementReady | |||||||
| 2055 Fund | |||||||
| Expenses paid per $1,000*† | $2.16 | $5.91 | $5.91 | $4.66 | $3.41 | $0.25 | $0.90 |
| Ending value (after expenses) | $1,022.66 | $1,018.94 | $1,018.94 | $1,020.18 | $1,021.42 | $1,024.55 | $1,023.90 |
| Putnam RetirementReady | |||||||
| 2050 Fund | |||||||
| Expenses paid per $1,000*† | $2.01 | $5.76 | $5.76 | $4.51 | $3.26 | $0.25 | $0.75 |
| Ending value (after expenses) | $1,022.81 | $1,019.09 | $1,019.09 | $1,020.33 | $1,021.57 | $1,024.55 | $1,024.05 |
| Putnam RetirementReady | |||||||
| 2045 Fund | |||||||
| Expenses paid per $1,000*† | $2.06 | $5.81 | $5.81 | $4.56 | $3.31 | $0.25 | $0.80 |
| Ending value (after expenses) | $1,022.76 | $1,019.04 | $1,019.04 | $1,020.28 | $1,021.52 | $1,024.55 | $1,024.00 |
| Putnam RetirementReady | |||||||
| 2040 Fund | |||||||
| Expenses paid per $1,000*† | $1.91 | $5.66 | $5.66 | $4.41 | $3.16 | $0.25 | $0.65 |
| Ending value (after expenses) | $1,022.91 | $1,019.19 | $1,019.19 | $1,020.43 | $1,021.67 | $1,024.55 | $1,024.15 |
| Putnam RetirementReady | |||||||
| 2035 Fund | |||||||
| Expenses paid per $1,000*† | $2.01 | $5.76 | $5.76 | $4.51 | $3.26 | $0.25 | $0.75 |
| Ending value (after expenses) | $1,022.81 | $1,019.09 | $1,019.09 | $1,020.33 | $1,021.57 | $1,024.55 | $1,024.05 |
| Putnam RetirementReady | |||||||
| 2030 Fund | |||||||
| Expenses paid per $1,000*† | $1.91 | $5.66 | $5.66 | $4.41 | $3.16 | $0.25 | $0.65 |
| Ending value (after expenses) | $1,022.91 | $1,019.19 | $1,019.19 | $1,020.43 | $1,021.67 | $1,024.55 | $1,024.15 |
| Putnam RetirementReady | |||||||
| 2025 Fund | |||||||
| Expenses paid per $1,000*† | $2.01 | $5.76 | $5.76 | $4.51 | $3.26 | $0.25 | $0.75 |
| Ending value (after expenses) | $1,022.81 | $1,019.09 | $1,019.09 | $1,020.33 | $1,021.57 | $1,024.55 | $1,024.05 |
| Putnam RetirementReady | |||||||
| 2020 Fund | |||||||
| Expenses paid per $1,000*† | $1.91 | $5.66 | $5.66 | $4.41 | $3.16 | $0.25 | $0.65 |
| Ending value (after expenses) | $1,022.91 | $1,019.19 | $1,019.19 | $1,020.43 | $1,021.67 | $1,024.55 | $1,024.15 |
| RetirementReady® Funds 29 |
Compare expenses using the SEC’s method cont.
| Class A | Class B | Class C | Class M | Class R | Class R6 | Class Y | |
| Putnam Retirement Income | |||||||
| Fund Lifestyle 1 | |||||||
| Expenses paid per $1,000*† | $1.91 | $5.66 | $5.66 | $3.16 | $3.16 | $0.25 | $0.65 |
| Ending value (after expenses) | $1,022.91 | $1,019.19 | $1,019.19 | $1,021.67 | $1,021.67 | $1,024.55 | $1,024.15 |
* Expenses for each share class are calculated using the fund’s annualized expense ratio for each class, which represents the ongoing expenses as a percentage of average net assets for the six months ended 7/31/18. The expense ratio may differ for each share class.
† Expenses are calculated by multiplying the expense ratio by the average account value for the six-month period; then multiplying the result by the number of days in the six-month period; and then dividing that result by the number of days in the year.
| 30 RetirementReady® Funds | |
Terms and definitions
Important terms
Total return shows how the value of the fund’s shares changed over time, assuming you held the shares through the entire period and reinvested all distributions in the fund.
Before sales charge, or net asset value, is the price, or value, of one share of a mutual fund, without a sales charge. Before-sales-charge figures fluctuate with market conditions, and are calculated by dividing the net assets of each class of shares by the number of outstanding shares in the class.
After sales charge is the price of a mutual fund share plus the maximum sales charge levied at the time of purchase. After-sales-charge performance figures shown here assume the 5.75% maximum sales charge for class A shares and 3.50% for class M shares (4.00% for class A shares and 3.25% for class M shares of Retirement Income Fund Lifestyle 1).
Contingent deferred sales charge (CDSC) is generally a charge applied at the time of the redemption of class B or C shares and assumes redemption at the end of the period. Your fund’s class B CDSC declines over time from a 5% maximum during the first year to 1% during the sixth year. After the sixth year, the CDSC no longer applies. The CDSC for class C shares is 1% for one year after purchase.
Share classes
Class A shares are generally subject to an initial sales charge and no CDSC (except on certain redemptions of shares bought without an initial sales charge).
Class B shares are closed to new investments and are only available by exchange from another Putnam fund or through dividend and/or capital gains reinvestment. They are not subject to an initial sales charge and may be subject to a CDSC.
Class C shares are not subject to an initial sales charge and are subject to a CDSC only if the shares are redeemed during the first year.
Class M shares have a lower initial sales charge and a higher 12b-1 fee than class A shares and no CDSC.
Class R shares are not subject to an initial sales charge or CDSC and are only available to employer-sponsored retirement plans.
Class R6 shares are not subject to an initial sales charge or CDSC, and carry no 12b-1 fee. They are generally only available to employer-sponsored retirement plans, corporate and institutional clients, and clients in other approved programs.
Class Y shares are not subject to an initial sales charge or CDSC and carry no 12b-1 fee. They are generally only available to corporate and institutional clients and clients in other approved programs.
Comparative indexes
Bloomberg Barclays U.S. Aggregate Bond Index is an unmanaged index of U.S. investment-grade fixed-income securities.
ICE BofAML (Intercontinental Exchange Bank of America Merrill Lynch) 3-Month Treasury Bill Index is an unmanaged index that seeks to measure the performance of U.S. Treasury bills available in the marketplace.
MSCI EAFE (Europe, Australasia, Far East) Index (ND) is a free float-adjusted market capitalization index that is designed to measure the equity market performance of developed markets, excluding the U.S. and Canada. Calculated with net dividends (ND), this total return index reflects the reinvestment of dividends after the deduction of withholding taxes, using a tax rate applicable to non-resident institutional investors who do not benefit from double taxation treaties.
| RetirementReady® Funds 31 |
S&P 500 Index is an unmanaged index of common stock performance.
ICE Data Indices, LLC (“ICE BofAML”), used with permission. ICE BofAML permits use of the ICE BofAML indices and related data on an “as is” basis; makes no warranties regarding same; does not guarantee the suitability, quality, accuracy, timeliness, and/or completeness of the ICE BofAML indices or any data included in, related to, or derived therefrom; assumes no liability in connection with the use of the foregoing; and does not sponsor, endorse, or recommend Putnam Investments, or any of its products or services.
Indexes assume reinvestment of all distributions and do not account for fees. Securities and performance of a fund and an index will differ. You cannot invest directly in an index.
Lipper is a third-party industry-ranking entity that ranks mutual funds. Its rankings do not reflect sales charges. Lipper rankings are based on total return at net asset value relative to other funds that have similar current investment styles or objectives as determined by Lipper. Lipper may change a fund’s category assignment at its discretion. Lipper category averages reflect performance trends for funds within a category.
Other information for shareholders
Proxy voting
Putnam is committed to managing our mutual funds in the best interests of our shareholders. The Putnam funds’ proxy voting guidelines and procedures, as well as information regarding how your fund voted proxies relating to portfolio securities during the 12-month period ended June 30, 2018, are available in the Individual Investors section of putnam.com and on the Securities and Exchange Commission (SEC) website, www.sec.gov. If you have questions about finding forms on the SEC’s website, you may call the SEC at 1-800-SEC-0330. You may also obtain the Putnam funds’ proxy voting guidelines and procedures at no charge by calling Putnam’s Shareholder Services at 1-800-225-1581.
Fund portfolio holdings
The funds will file a complete schedule of their portfolio holdings with the SEC for the first and third quarters of each fiscal year on Form N-Q. Shareholders may obtain the funds’ Form N-Q on the SEC’s website at www.sec.gov. In addition, the funds’ Form N-Q may be reviewed and copied at the SEC’s Public Reference Room in Washington, D.C. You may call the SEC at 1-800-SEC-0330 for information about the SEC’s website or the operation of the Public Reference Room.
Trustee and employee fund ownership
Putnam employees and members of the Board of Trustees place their faith, confidence, and, most importantly, investment dollars in Putnam mutual funds. As of July 31, 2018, Putnam employees had approximately $523,000,000 and the Trustees had approximately $69,000,000 invested in Putnam mutual funds. These amounts include investments by the Trustees’ and employees’ immediate family members as well as investments through retirement and deferred compensation plans.
| 32 RetirementReady® Funds |
Important notice regarding Putnam’s privacy policy
In order to conduct business with our shareholders, we must obtain certain personal information such as account holders’ names, addresses, Social Security numbers, and dates of birth. Using this information, we are able to maintain accurate records of accounts and transactions.
It is our policy to protect the confidentiality of our shareholder information, whether or not a shareholder currently owns shares of our funds. In particular, it is our policy not to sell information about you or your accounts to outside marketing firms. We have safeguards in place designed to prevent unauthorized access to our computer systems and procedures to protect personal information from unauthorized use.
Under certain circumstances, we must share account information with outside vendors who provide services to us, such as mailings and proxy solicitations. In these cases, the service providers enter into confidentiality agreements with us, and we provide only the information necessary to process transactions and perform other services related to your account. Finally, it is our policy to share account information with your financial representative, if you’ve listed one on your Putnam account.
| RetirementReady® Funds 33 |
Trustee approval of management contract
General conclusions
The Board of Trustees of The Putnam Funds oversees the management of each fund and, as required by law, determines annually whether to approve the continuance of your fund’s management contract with Putnam Investment Management, LLC (“Putnam Management”) and the sub-management contract with respect to your fund between Putnam Management and its affiliate, Putnam Investments Limited (“PIL”). The Board, with the assistance of its Contract Committee, requests and evaluates all information it deems reasonably necessary under the circumstances in connection with its annual contract review. The Contract Committee consists solely of Trustees who are not “interested persons” (as this term is defined in the Investment Company Act of 1940, as amended (the “1940 Act”)) of The Putnam Funds (“Independent Trustees”).
At the outset of the review process, members of the Board’s independent staff and independent legal counsel discussed with representatives of Putnam Management the annual contract review materials furnished to the Contract Committee during the course of the previous year’s review, identifying possible changes in these materials that might be necessary or desirable for the coming year. Following these discussions and in consultation with the Contract Committee, the Independent Trustees’ independent legal counsel requested that Putnam Management and its affiliates furnish specified information, together with any additional information that Putnam Management considered relevant, to the Contract Committee. Over the course of several months ending in June 2018, the Contract Committee met on a number of occasions with representatives of Putnam Management, and separately in executive session, to consider the information that Putnam Management provided. Throughout this process, the Contract Committee was assisted by the members of the Board’s independent staff and by independent legal counsel for The Putnam Funds and the Independent Trustees.
In May 2018, the Contract Committee met in executive session to discuss and consider its recommendations with respect to the continuance of the contracts. At the Trustees’ June 2018 meeting, the Contract Committee met in executive session with the other Independent Trustees to review a summary of the key financial, performance and other data that the Contract Committee considered in the course of its review. The Contract Committee then presented its written report, which summarized the key factors that the Committee had considered and set forth its recommendations. The Contract Committee recommended, and the Independent Trustees approved, the continuance of your fund’s management and sub-management contracts, effective July 1, 2018. (Because PIL is an affiliate of Putnam Management and Putnam Management remains fully responsible for all services provided by PIL, the Trustees have not attempted to evaluate PIL as a separate entity, and all subsequent references to Putnam Management below should be deemed to include reference to PIL as necessary or appropriate in the context.)
The Independent Trustees’ approval was based on the following conclusions:
• That the fee schedule in effect for your fund represented reasonable compensation in light of the nature and quality of the services being provided to the fund, the fees paid by competitive funds, the costs incurred by Putnam Management in providing services to the fund, and the application of certain reductions and waivers noted below; and
• That the fee schedule in effect for your fund represented an appropriate sharing between fund shareholders and Putnam Management of such economies of scale as may exist in the management of the fund at current asset levels.
These conclusions were based on a comprehensive consideration of all information provided to the Trustees and were not the result of any single factor. Some of the factors that figured particularly in the Trustees’ deliberations and how the Trustees considered these factors are described below, although individual Trustees may have evaluated the information presented differently, giving different weights to various factors. It is also important to recognize that the management arrangements for your fund and the other Putnam funds are the result of many years of review and discussion between the Independent Trustees and Putnam Management, that some aspects of the arrangements may receive greater scrutiny in some years than others, and that the Trustees’ conclusions may be based, in part, on their consideration of fee arrangements in previous
| 34 RetirementReady® Funds | |
years. For example, with some minor exceptions, the funds’ current fee arrangements under the management contracts were first implemented at the beginning of 2010 following extensive review by the Contract Committee and discussions with representatives of Putnam Management, as well as approval by shareholders.
Management fee schedules and total expenses
The Trustees considered your fund’s management fee schedule and considered that, although the fund pays no management fee to Putnam Management, Putnam Management receives management fees from the underlying Putnam funds in which your fund invests. The Trustees noted that the fee schedule was consistent with the current fee schedules of other Putnam funds that pursued their objectives by investing substantially all of their assets in other Putnam funds, which have been carefully developed over the years and re-examined on many occasions and adjusted where appropriate.
The Trustees also reviewed the management fee schedules in effect for all Putnam funds (including the underlying Putnam funds in which your fund invests), including fee levels and breakpoints. The Trustees also reviewed the total expenses of each Putnam fund, recognizing that in most cases management fees represented the major, but not the sole, determinant of total costs to fund shareholders. (In a few instances, funds have implemented so-called “all-in” management fees covering substantially all routine fund operating costs.) In reviewing fees and expenses, the Trustees generally focus their attention on material changes in circumstances — for example, changes in assets under management, changes in a fund’s investment strategy, changes in Putnam Management’s operating costs or profitability, or changes in competitive practices in the mutual fund industry — that suggest that consideration of fee changes might be warranted. The Trustees concluded that the circumstances did not indicate that changes to the management fee structure for your fund would be appropriate at this time.
Under their management contracts, the underlying Putnam funds in which your fund invests have the benefit of breakpoints in their management fee schedules that provide shareholders with economies of scale in the form of reduced fee rates as assets under management in the Putnam family of funds increase. Some of the underlying Putnam funds’ management contracts also provide for performance fees. The Trustees concluded that the fee schedules in effect for the underlying Putnam funds in which your fund invests represented an appropriate sharing of economies of scale between fund shareholders and Putnam Management.
As in the past, the Trustees also focused on the competitiveness of each fund’s total expense ratio. In order to support the effort to have fund expenses meet competitive standards, the Trustees and Putnam Management have implemented an expense limitation that was in effect during your fund’s fiscal year ending in 2017. This expense limitation was a contractual expense limitation applicable to all open-end funds of 25 basis points on investor servicing fees and expenses. This expense limitation attempts to maintain competitive expense levels for the funds. Most funds, including your fund, had sufficiently low expenses that this expense limitation was not operative during their fiscal years ending in 2017. Putnam Management has agreed to maintain this expense limitation until at least November 30, 2019. In addition, Putnam Management has agreed to reimburse all so-called “other expenses” of your fund (i.e., all expenses excluding payments under the fund’s distribution plans, brokerage, interest, taxes, investment-related expenses, extraordinary expenses, and acquired fund fees and expenses) through at least November 30, 2019 (for RetirementReady 2060 Fund, through at least November 30, 2028). Putnam Management’s support for these expense limitation arrangements was an important factor in the Trustees’ decision to approve the continuance of your fund’s management and sub-management contracts.
The Trustees reviewed comparative fee and expense information for a custom group of competitive funds selected by Broadridge Financial Solutions, Inc. (“Broadridge”). This comparative information included your fund’s percentile ranking for total expenses (excluding any applicable 12b-1 fee), which provides a general indication of your fund’s relative standing. In the custom peer group, your fund ranked in the following quintiles in total expenses (excluding any applicable 12b-1 fees) as of December 31, 2017. The first quintile represents the least expensive funds and the fifth quintile the most expensive funds. The fee and expense data reported by Broadridge as of December 31, 2017 reflected
| RetirementReady® Funds 35 |
the most recent fiscal year-end data available in Broadridge’s database at that time.
| Total expenses (quintile) | |
| Putnam RetirementReady | |
| 2060 Fund (“2060 Fund”) | 3rd |
| Putnam RetirementReady | |
| 2055 Fund (“2055 Fund”) | 4th |
| Putnam RetirementReady | |
| 2050 Fund (“2050 Fund”) | 3rd |
| Putnam RetirementReady | |
| 2045 Fund (“2045 Fund”) | 3rd |
| Putnam RetirementReady | |
| 2040 Fund (“2040 Fund”) | 3rd |
| Putnam RetirementReady | |
| 2035 Fund (“2035 Fund”) | 3rd |
| Putnam RetirementReady | |
| 2030 Fund (“2030 Fund”) | 3rd |
| Putnam RetirementReady | |
| 2025 Fund (“2025 Fund”) | 4th |
| Putnam RetirementReady | |
| 2020 Fund (“2020 Fund”) | 3rd |
| Putnam Retirement Income Fund | |
| Lifestyle 1 (“Lifestyle 1 Fund”) | 4th |
(Total expenses reflect the fees and expenses borne directly by the Putnam RetirementReady® Funds and the competitive funds included in the custom Lipper peer groups, as well as the underlying funds’ net fees and expenses, which the Putnam RetirementReady® Funds and the funds included in the custom Lipper peer groups bear indirectly.) In connection with their review of fund management fees and total expenses, the Trustees also reviewed the costs of the services provided and the profits realized by Putnam Management and its affiliates from their contractual relationships with the funds. This information included trends in revenues, expenses and profitability of Putnam Management and its affiliates relating to the investment management, investor servicing and distribution services provided to the funds. In this regard, the Trustees also reviewed an analysis of Putnam Management’s revenues, expenses and profitability, allocated on a fund-by-fund basis, with respect to the funds’ management, distribution, and investor servicing contracts. For each fund, the analysis presented information about revenues, expenses and profitability for each of the agreements separately and for the agreements taken together on a combined basis. The Trustees concluded that, at current asset levels, the fee schedules in place represented reasonable compensation for the services being provided and represented an appropriate sharing between fund shareholders and Putnam Management of such economies of scale as may exist in the management of the Putnam funds at that time.
The information examined by the Trustees in connection with their annual contract review for the Putnam funds included information regarding fees charged by Putnam Management and its affiliates to institutional clients, including defined benefit pension and profit-sharing plans and sub-advised mutual funds. This information included, in cases where an institutional product’s investment strategy corresponds with a fund’s strategy, comparisons of those fees with fees charged to the Putnam funds, as well as an assessment of the differences in the services provided to these different types of clients as compared to the services provided to the Putnam funds. The Trustees observed that the differences in fee rates between these clients and the Putnam funds are by no means uniform when examined by individual asset sectors, suggesting that differences in the pricing of investment management services to these types of clients may reflect, among other things, historical competitive forces operating in separate markets. The Trustees considered the fact that in many cases fee rates across different asset classes are higher on average for mutual funds than for institutional clients, as well as the differences between the services that Putnam Management provides to the Putnam funds and those that it provides to its other clients. The Trustees did not rely on these comparisons to any significant extent in concluding that the management fees paid by your fund are reasonable.
Investment performance
The quality of the investment process provided by Putnam Management represented a major factor in the Trustees’ evaluation of the quality of services provided by Putnam Management under your fund’s management contract. The Trustees were assisted in their review of the Putnam funds’ investment process and performance by the work of the investment oversight committees of the Trustees and the full Board of Trustees, which meet on a regular basis with the funds’ portfolio teams and with the Chief Investment Officers and other senior members of Putnam Management’s Investment Division throughout the year. The Trustees concluded that Putnam Management generally provides a high-quality investment process — based on the experience and skills of
| 36 RetirementReady® Funds | |
the individuals assigned to the management of fund portfolios, the resources made available to them, and in general Putnam Management’s ability to attract and retain high-quality personnel — but also recognized that this does not guarantee favorable investment results for every fund in every time period.
The Trustees considered that 2017 was a strong year for the performance of the Putnam funds, with generally favorable results for most asset classes, including U.S. equity, international and global equity, taxable and tax exempt fixed income, and global asset allocation Funds. In this regard, the Trustees considered that, for the one-year period ended December 31, 2017, the Putnam open-end Funds’ performance, on an asset-weighted basis, ranked in the 32nd percentile of their Lipper peers (excluding those Putnam funds that are evaluated based on their total returns and/or comparisons of those returns versus selected investment benchmarks or targeted annual returns). The Trustees observed that this strong performance has continued a positive trend that began in mid-year 2016 across most Putnam funds. They noted that the longer-term performance of the Putnam funds continued to be strong, exemplified by the fact that the Putnam funds were ranked by the Barron’s/Lipper Fund Families survey as the 7th-best performing mutual fund complex out of 55 complexes for the five-year period ended December 31, 2017 and the 9th-best performing mutual fund complex out of 50 complexes for the ten-year period ended 2017. In addition, the survey ranked the Putnam funds 7th out of 59 mutual fund complexes for the one-year period ended 2017; the Putnam funds have ranked 1st or 2nd in the survey for the one-year period three times since 2009 (most recently in 2013). They also noted, however, the disappointing investment performance of some funds for periods ended December 31, 2017 and considered information provided by Putnam Management regarding the factors contributing to the underperformance and actions being taken to improve the performance of these particular funds. The Trustees indicated their intention to continue to monitor closely the performance of those funds, including the effectiveness of any efforts Putnam Management has undertaken to address underperformance and whether additional actions to address areas of underperformance are warranted.
For purposes of the Trustees’ evaluation of the Putnam Funds’ investment performance, the Trustees generally focus on a competitive industry ranking of each fund’s total net return over a one-year, three-year and five-year period. For a number of Putnam funds with relatively unique investment mandates for which Putnam Management informed the Trustees that meaningful competitive performance rankings are not considered to be available, the Trustees evaluated performance based on their total gross and net returns and, in most cases, comparisons of those returns with the returns of selected investment benchmarks. In the case of the Lifestyle 1 Fund, the Trustees considered that the fund’s class A shares net return was positive over the one-year, three-year, and five-year periods ended December 31, 2017. In the case of the 2060 Fund (which commenced operations on November 30, 2015 and had a track record of only twenty-five months), the Trustees considered that the fund’s class A share net return was positive and exceeded the return of its internal benchmark over the one-year period ended December 31, 2017. In the case of each of the other Putnam RetirementReady® Funds, the Trustees considered information about the fund’s total return and its performance relative to its internal benchmark for the one-year, three-year, and five-year periods ended December 31, 2017. Over the one-year period, each fund’s class A share net return was positive and exceeded the return of its internal benchmark. Over the three-year period, the class A share net return was positive for each fund; exceeded the internal benchmark return for the 2020 Fund, 2025 Fund, 2030 Fund and 2035 Fund; approximated the internal benchmark return for the 2040 Fund; and lagged the internal benchmark for the 2045 Fund, 2050 Fund and 2055 Fund. Over the five-year period, each fund’s class A share net return was positive and exceeded the return of its internal benchmark. (When considering performance information, shareholders should be mindful that past performance is not a guarantee of future results.) The Trustees considered Putnam Management’s continued efforts to support fund performance through initiatives including structuring compensation for portfolio managers and research analysts to enhance accountability for fund performance, emphasizing accountability in the portfolio management process, and affirming its commitment to a fundamental-driven approach to investing. The Trustees noted further that Putnam Management continued to strengthen its
| RetirementReady® Funds 37 |
fundamental research capabilities by adding new investment personnel.
Brokerage and soft-dollar allocations; investor servicing
The Trustees considered various potential benefits that Putnam Management may receive in connection with the services it provides under the management contract with your fund. These include benefits related to brokerage allocation and the use of soft dollars, whereby a portion of the commissions paid by a fund for brokerage may be used to acquire research services that are expected to be useful to Putnam Management in managing the assets of the fund and of other clients. Subject to policies established by the Trustees, soft dollars generated by these means are used predominantly to acquire brokerage and research services (including third-party research and market data) that enhance Putnam Management’s investment capabilities and supplement Putnam Management’s internal research efforts. However, the Trustees noted that a portion of available soft dollars continues to be used to pay fund expenses. The Trustees indicated their continued intent to monitor regulatory and industry developments in this area with the assistance of their Brokerage Committee. The Trustees also indicated their continued intent to monitor the allocation of the Putnam funds’ brokerage in order to ensure that the principle of seeking best price and execution remains paramount in the portfolio trading process.
Putnam Management may also receive benefits from payments that the funds make to Putnam Management’s affiliates for investor or distribution services. In conjunction with the annual review of your fund’s management and sub-management contracts, the Trustees reviewed your fund’s investor servicing agreement with Putnam Investor Services, Inc. (“PSERV”) and its distributor’s contracts and distribution plans with Putnam Retail Management Limited Partnership (“PRM”), both of which are affiliates of Putnam Management. The Trustees concluded that the fees payable by the funds to PSERV and PRM, as applicable, for such services are fair and reasonable in relation to the nature and quality of such services, the fees paid by competitive funds, and the costs incurred by PSERV and PRM, as applicable, in providing such services. Furthermore, the Trustees were of the view that the services provided were required for the operation of the funds, and that they were of a quality at least equal to those provided by other providers.
| 38 RetirementReady® Funds | |
Financial statements
These sections of the report, as well as the accompanying Notes, preceded by the Report of Independent Registered Public Accounting Firm, constitute the fund’s financial statements.
The fund’s portfolio lists all the fund’s investments and their values as of the last day of the reporting period. Holdings are organized by asset type and industry sector, country, or state to show areas of concentration and diversification.
Statement of assets and liabilities shows how the fund’s net assets and share price are determined. All investment and non-investment assets are added together. Any unpaid expenses and other liabilities are subtracted from this total. The result is divided by the number of shares to determine the net asset value per share, which is calculated separately for each class of shares. (For funds with preferred shares, the amount subtracted from total assets includes the liquidation preference of preferred shares.)
Statement of operations shows the fund’s net investment gain or loss. This is done by first adding up all the fund’s earnings — from dividends and interest income — and subtracting its operating expenses to determine net investment income (or loss). Then, any net gain or loss the fund realized on the sales of its holdings — as well as any unrealized gains or losses over the period — is added to or subtracted from the net investment result to determine the fund’s net gain or loss for the fiscal year.
Statement of changes in net assets shows how the fund’s net assets were affected by the fund’s net investment gain or loss, by distributions to shareholders, and by changes in the number of the fund’s shares. It lists distributions and their sources (net investment income or realized capital gains) over the current reporting period and the most recent fiscal year-end. The distributions listed here may not match the sources listed in the Statement of operations because the distributions are determined on a tax basis and may be paid in a different period from the one in which they were earned.
Financial highlights provide an overview of the fund’s investment results, per-share distributions, expense ratios, net investment income ratios, and portfolio turnover in one summary table, reflecting the five most recent reporting periods. In a semiannual report, the highlights table also includes the current reporting period.
| RetirementReady® Funds 39 |
Report of Independent Registered Public Accounting Firm
| To the Trustees of Putnam RetirementReady® Funds and Shareholders of |
| Putnam RetirementReady 2060 Fund, Putnam RetirementReady 2055 Fund, |
| Putnam RetirementReady 2050 Fund, Putnam RetirementReady 2045 Fund, |
| Putnam RetirementReady 2040 Fund, Putnam RetirementReady 2035 Fund, |
| Putnam RetirementReady 2030 Fund, Putnam RetirementReady 2025 Fund, |
| Putnam RetirementReady 2020 Fund, and Putnam Retirement Income Fund Lifestyle 1 |
Opinion on the Financial Statements
We have audited the accompanying statements of assets and liabilities, including the funds’ portfolios, of the Putnam RetirementReady 2060 Fund, Putnam RetirementReady 2055 Fund, Putnam RetirementReady 2050 Fund, Putnam RetirementReady 2045 Fund, Putnam RetirementReady 2040 Fund, Putnam RetirementReady 2035 Fund, Putnam RetirementReady 2030 Fund, Putnam RetirementReady 2025 Fund, Putnam RetirementReady 2020 Fund, and Putnam Retirement Income Fund Lifestyle 1 (constituting the Putnam RetirementReady Funds, hereafter collectively referred to as the “Funds”) as of July 31, 2018, the related statements of operations for the year ended July 31, 2018, the statements of changes in net assets for each of the two years in the period ended July 31, 2018, including the related notes, and the financial highlights for each of the periods indicated therein (collectively referred to as the “financial statements”). In our opinion, the financial statements present fairly, in all material respects, the financial position of each of the Funds as of July 31, 2018, the results of each of their operations for the year then ended, the changes in each of their net assets for each of the two years in the period ended July 31, 2018 and each of the financial highlights for each of the periods indicated therein in conformity with accounting principles generally accepted in the United States of America.
Basis for Opinions
These financial statements are the responsibility of the Funds’ management. Our responsibility is to express an opinion on the Funds’ financial statements based on our audits. We are a public accounting firm registered with the Public Company Accounting Oversight Board (United States) (“PCAOB”) and are required to be independent with respect to the Funds in accordance with the U.S. federal securities laws and the applicable rules and regulations of the Securities and Exchange Commission and the PCAOB.
We conducted our audits of these financial statements in accordance with the standards of the PCAOB. Those standards require that we plan and perform the audit to obtain reasonable assurance about whether the financial statements are free of material misstatement, whether due to error or fraud.
Our audits included performing procedures to assess the risks of material misstatement of the financial statements, whether due to error or fraud, and performing procedures that respond to those risks. Such procedures included examining, on a test basis, evidence regarding the amounts and disclosures in the financial statements. Our audits also included evaluating the accounting principles used and significant estimates made by management, as well as evaluating the overall presentation of the financial statements. Our procedures included confirmation of securities owned as of July 31, 2018 by correspondence with the transfer agent. We believe that our audits provide a reasonable basis for our opinions.
PricewaterhouseCoopers LLP
Boston, Massachusetts
September 18, 2018
We have served as the auditor of one or more investment companies in the Putnam Investments family of mutual funds since at least 1957. We have not been able to determine the specific year we began serving as auditor.
| 40 RetirementReady® Funds | |
The funds’ portfolios 7/31/18
| Putnam RetirementReady 2060 Fund | Shares | Value |
| Absolute Return Funds (10.3%)* | ||
| Putnam Fixed Income Absolute Return Fund Class P ††† | 531 | $5,237 |
| Putnam Multi-Asset Absolute Return Fund Class P ††† | 7,115 | 84,524 |
| Total Absolute Return Funds (cost $91,927) | $89,761 | |
| Asset Allocation Funds (91.7%)* | ||
| Putnam Dynamic Asset Allocation Equity Fund Class P ††† | 48,156 | $658,293 |
| Putnam Dynamic Asset Allocation Growth Fund Class P ††† | 8,051 | 142,910 |
| Total Asset Allocation Funds (cost $791,718) | $801,203 | |
| Fixed Income Funds (0.5%)* | ||
| Putnam Government Money Market Fund Class G ††† | 4,120 | $4,120 |
| Total Fixed Income Funds (cost $4,120) | $4,120 | |
| TOTAL INVESTMENTS | ||
| Total Investments (cost $887,765) | $895,084 | |
| * Percentages indicated are based on net assets of $873,727. | ||
| Putnam RetirementReady 2055 Fund | Shares | Value |
| Absolute Return Funds (10.2%)* | ||
| Putnam Fixed Income Absolute Return Fund Class P ††† | 18,834 | $185,894 |
| Putnam Multi-Asset Absolute Return Fund Class P ††† | 189,542 | 2,251,756 |
| Total Absolute Return Funds (cost $2,459,108) | $2,437,650 | |
| Asset Allocation Funds (89.4%)* | ||
| Putnam Dynamic Asset Allocation Equity Fund Class P ††† | 1,203,079 | $16,446,088 |
| Putnam Dynamic Asset Allocation Growth Fund Class P ††† | 275,276 | 4,886,147 |
| Total Asset Allocation Funds (cost $20,076,290) | $21,332,235 | |
| Fixed Income Funds (0.5%)* | ||
| Putnam Government Money Market Fund Class G ††† | 107,651 | $107,651 |
| Total Fixed Income Funds (cost $107,651) | $107,651 | |
| TOTAL INVESTMENTS | ||
| Total Investments (cost $22,643,049) | $23,877,536 | |
* Percentages indicated are based on net assets of $23,871,375.
| RetirementReady® Funds 41 |
The funds’ portfolios 7/31/18 cont.
| Putnam RetirementReady 2050 Fund | Shares | Value |
| Absolute Return Funds (10.9%)* | ||
| Putnam Fixed Income Absolute Return Fund Class P ††† | 91,588 | $903,978 |
| Putnam Multi-Asset Absolute Return Fund Class P ††† | 491,569 | 5,839,835 |
| Total Absolute Return Funds (cost $6,705,765) | $6,743,813 | |
| Asset Allocation Funds (88.7%)* | ||
| Putnam Dynamic Asset Allocation Equity Fund Class P ††† | 2,383,210 | $32,578,477 |
| Putnam Dynamic Asset Allocation Growth Fund Class P ††† | 1,254,115 | 22,260,546 |
| Total Asset Allocation Funds (cost $50,565,153) | $54,839,023 | |
| Fixed Income Funds (0.4%)* | ||
| Putnam Government Money Market Fund Class G ††† | 271,513 | $271,513 |
| Total Fixed Income Funds (cost $271,513) | $271,513 | |
| TOTAL INVESTMENTS | ||
| Total Investments (cost $57,542,431) | $61,854,349 | |
| * Percentages indicated are based on net assets of $61,825,016. | ||
| Putnam RetirementReady 2045 Fund | Shares | Value |
| Absolute Return Funds (12.1%)* | ||
| Putnam Fixed Income Absolute Return Fund Class P ††† | 172,191 | $1,699,524 |
| Putnam Multi-Asset Absolute Return Fund Class P ††† | 565,955 | 6,723,543 |
| Total Absolute Return Funds (cost $8,422,872) | $8,423,067 | |
| Asset Allocation Funds (87.5%)* | ||
| Putnam Dynamic Asset Allocation Equity Fund Class P ††† | 1,706,310 | $23,325,258 |
| Putnam Dynamic Asset Allocation Growth Fund Class P ††† | 2,117,835 | 37,591,573 |
| Total Asset Allocation Funds (cost $57,115,190) | $60,916,831 | |
| Fixed Income Funds (0.4%)* | ||
| Putnam Government Money Market Fund Class G ††† | 307,850 | $307,850 |
| Total Fixed Income Funds (cost $307,850) | $307,850 | |
| TOTAL INVESTMENTS | ||
| Total Investments (cost $65,845,912) | $69,647,748 | |
* Percentages indicated are based on net assets of $69,613,470.
| 42 RetirementReady® Funds | |
The funds’ portfolios 7/31/18 cont.
| Putnam RetirementReady 2040 Fund | Shares | Value |
| Absolute Return Funds (15.6%)* | ||
| Putnam Fixed Income Absolute Return Fund Class P ††† | 446,537 | $4,407,324 |
| Putnam Multi-Asset Absolute Return Fund Class P ††† | 1,661,379 | 19,737,186 |
| Total Absolute Return Funds (cost $24,080,846) | $24,144,510 | |
| Asset Allocation Funds (82.8%)* | ||
| Putnam Dynamic Asset Allocation Balanced Fund Class P ††† | 379,719 | $5,897,029 |
| Putnam Dynamic Asset Allocation Equity Fund Class P ††† | 1,206,326 | 16,490,472 |
| Putnam Dynamic Asset Allocation Growth Fund Class P ††† | 5,972,797 | 106,017,147 |
| Total Asset Allocation Funds (cost $118,784,598) | $128,404,648 | |
| Fixed Income Funds (1.7%)* | ||
| Putnam Government Money Market Fund Class G ††† | 2,660,193 | $2,660,193 |
| Total Fixed Income Funds (cost $2,660,193) | $2,660,193 | |
| TOTAL INVESTMENTS | ||
| Total Investments (cost $145,525,637) | $155,209,351 | |
* Percentages indicated are based on net assets of $155,135,390.
| Putnam RetirementReady 2035 Fund | Shares | Value |
| Absolute Return Funds (22.0%)* | ||
| Putnam Fixed Income Absolute Return Fund Class P ††† | 656,933 | $6,483,928 |
| Putnam Multi-Asset Absolute Return Fund Class P ††† | 1,759,161 | 20,898,834 |
| Total Absolute Return Funds (cost $27,367,886) | $27,382,762 | |
| Asset Allocation Funds (75.1%)* | ||
| Putnam Dynamic Asset Allocation Balanced Fund Class P ††† | 1,745,683 | $27,110,465 |
| Putnam Dynamic Asset Allocation Growth Fund Class P ††† | 3,740,782 | 66,398,884 |
| Total Asset Allocation Funds (cost $88,556,873) | $93,509,349 | |
| Fixed Income Funds (2.9%)* | ||
| Putnam Government Money Market Fund Class G ††† | 3,619,601 | $3,619,601 |
| Total Fixed Income Funds (cost $3,619,601) | $3,619,601 | |
| TOTAL INVESTMENTS | ||
| Total Investments (cost $119,544,360) | $124,511,712 | |
* Percentages indicated are based on net assets of $124,451,703.
| RetirementReady® Funds 43 |
The funds’ portfolios 7/31/18 cont.
| Putnam RetirementReady 2030 Fund | Shares | Value |
| Absolute Return Funds (30.2%)* | ||
| Putnam Fixed Income Absolute Return Fund Class P ††† | 1,909,902 | $18,850,733 |
| Putnam Multi-Asset Absolute Return Fund Class P ††† | 3,415,481 | 40,575,918 |
| Total Absolute Return Funds (cost $59,125,157) | $59,426,651 | |
| Asset Allocation Funds (66.0%)* | ||
| Putnam Dynamic Asset Allocation Balanced Fund Class P ††† | 5,993,655 | $93,081,454 |
| Putnam Dynamic Asset Allocation Conservative Fund Class P ††† | 181,274 | 1,966,822 |
| Putnam Dynamic Asset Allocation Growth Fund Class P ††† | 1,965,906 | 34,894,836 |
| Total Asset Allocation Funds (cost $122,220,675) | $129,943,112 | |
| Fixed Income Funds (3.9%)* | ||
| Putnam Government Money Market Fund Class G ††† | 7,680,889 | $7,680,889 |
| Total Fixed Income Funds (cost $7,680,889) | $7,680,889 | |
| TOTAL INVESTMENTS | ||
| Total Investments (cost $189,026,721) | $197,050,652 | |
* Percentages indicated are based on net assets of $196,892,760.
| Putnam RetirementReady 2025 Fund | Shares | Value |
| Absolute Return Funds (40.5%)* | ||
| Putnam Fixed Income Absolute Return Fund Class P ††† | 1,955,733 | $19,303,082 |
| Putnam Multi-Asset Absolute Return Fund Class P ††† | 2,773,418 | 32,948,207 |
| Total Absolute Return Funds (cost $52,347,146) | $52,251,289 | |
| Asset Allocation Funds (54.4%)* | ||
| Putnam Dynamic Asset Allocation Balanced Fund Class P ††† | 3,513,154 | $54,559,282 |
| Putnam Dynamic Asset Allocation Conservative Fund Class P ††† | 1,442,662 | 15,652,880 |
| Total Asset Allocation Funds (cost $67,112,734) | $70,212,162 | |
| Fixed Income Funds (5.1%)* | ||
| Putnam Government Money Market Fund Class G ††† | 6,596,600 | $6,596,600 |
| Total Fixed Income Funds (cost $6,596,600) | $6,596,600 | |
| TOTAL INVESTMENTS | ||
| Total Investments (cost $126,056,480) | $129,060,051 | |
* Percentages indicated are based on net assets of $128,999,602.
| 44 RetirementReady® Funds | |
The funds’ portfolios 7/31/18 cont.
| Putnam RetirementReady 2020 Fund | Shares | Value |
| Absolute Return Funds (52.0%)* | ||
| Putnam Fixed Income Absolute Return Fund Class P ††† | 4,587,758 | $45,281,168 |
| Putnam Multi-Asset Absolute Return Fund Class P ††† | 4,926,704 | 58,529,242 |
| Total Absolute Return Funds (cost $104,556,912) | $103,810,410 | |
| Asset Allocation Funds (42.1%)* | ||
| Putnam Dynamic Asset Allocation Balanced Fund Class P ††† | 1,867,577 | $29,003,467 |
| Putnam Dynamic Asset Allocation Conservative Fund Class P ††† | 5,075,898 | 55,073,497 |
| Total Asset Allocation Funds (cost $81,134,970) | $84,076,964 | |
| Fixed Income Funds (5.9%)* | ||
| Putnam Government Money Market Fund Class G ††† | 11,814,897 | $11,814,897 |
| Total Fixed Income Funds (cost $11,814,897) | $11,814,897 | |
| TOTAL INVESTMENTS | ||
| Total Investments (cost $197,506,779) | $199,702,271 | |
* Percentages indicated are based on net assets of $199,611,000.
| Putnam Retirement Income Fund Lifestyle 1 | Shares | Value |
| Absolute Return Funds (59.8%)* | ||
| Putnam Fixed Income Absolute Return Fund Class P ††† | 3,150,401 | $31,094,455 |
| Putnam Multi-Asset Absolute Return Fund Class P ††† | 2,614,874 | 31,064,700 |
| Total Absolute Return Funds (cost $62,515,166) | $62,159,155 | |
| Asset Allocation Funds (34.3%)* | ||
| Putnam Dynamic Asset Allocation Conservative Fund Class P ††† | 3,286,672 | $35,660,386 |
| Total Asset Allocation Funds (cost $34,472,186) | $35,660,386 | |
| Fixed Income Funds (5.9%)* | ||
| Putnam Government Money Market Fund Class G ††† | 6,169,788 | $6,169,788 |
| Total Fixed Income Funds (cost $6,169,788) | $6,169,788 | |
| TOTAL INVESTMENTS | ||
| Total Investments (cost $103,157,140) | $103,989,329 | |
* Percentages indicated are based on net assets of $103,943,907.
Notes to the fund’s portfolio
Unless noted otherwise, the notes to the funds’ portfolios are for the close of each fund’s reporting period, which ran from August 1, 2017 through July 31, 2018 (the reporting period). Within the following notes to the portfolio, references to “ASC 820” represent Accounting Standards Codification ASC 820 Fair Value Measurements and Disclosures.
††† Affiliated Company (Note 5).
| RetirementReady® Funds 45 |
ASC 820 establishes a three-level hierarchy for disclosure of fair value measurements. The valuation hierarchy is based upon the transparency of inputs to the valuation of each fund’s investments. The three levels are defined as follows:
Level 1 : Valuations based on quoted prices for identical securities in active markets.
Level 2 : Valuations based on quoted prices in markets that are not active or for which all significant inputs are observable, either directly or indirectly.
Level 3 : Valuations based on inputs that are unobservable and significant to the fair value measurement.
The following is a summary of the inputs used to value the funds’ net assets as of the close of the reporting period:
| Valuation inputs | ||||
| Investments in securities: | Level 1 | Level 2 | Level 3 | Total |
| Putnam RetirementReady 2060 Fund | $895,084 | $— | $— | $895,084 |
| Putnam RetirementReady 2055 Fund | 23,877,536 | — | — | 23,877,536 |
| Putnam RetirementReady 2050 Fund | 61,854,349 | — | — | 61,854,349 |
| Putnam RetirementReady 2045 Fund | 69,647,748 | — | — | 69,647,748 |
| Putnam RetirementReady 2040 Fund | 155,209,351 | — | — | 155,209,351 |
| Putnam RetirementReady 2035 Fund | 124,511,712 | — | — | 124,511,712 |
| Putnam RetirementReady 2030 Fund | 197,050,652 | — | — | 197,050,652 |
| Putnam RetirementReady 2025 Fund | 129,060,051 | — | — | 129,060,051 |
| Putnam RetirementReady 2020 Fund | 199,702,271 | — | — | 199,702,271 |
| Putnam Retirement Income Fund | ||||
| Lifestyle 1 | 103,989,329 | — | — | 103,989,329 |
The accompanying notes are an integral part of these financial statements.
| 46 RetirementReady® Funds | |
Statement of assets and liabilities 7/31/18
| Putnam | Putnam | Putnam | Putnam | Putnam | |
| Retirement- | Retirement- | Retirement- | Retirement- | Retirement- | |
| Ready | Ready | Ready | Ready | Ready | |
| ASSETS | 2060 Fund | 2055 Fund | 2050 Fund | 2045 Fund | 2040 Fund |
| Investments in affiliated underlying | |||||
| Putnam Funds, at value (Notes 1 and 5) | $895,084 | $23,877,536 | $61,854,349 | $69,647,748 | $155,209,351 |
| Receivable for income distributions | |||||
| from underlying Putnam Fund shares | — | 161 | 398 | 422 | 3,881 |
| Receivable for shares of the fund sold | 244 | 64,320 | 35,026 | 93,557 | 149,251 |
| Receivable for investments sold | 6,007 | 4,502 | 30,337 | 226,783 | 28,275 |
| Receivable from Manager (Note 2) | 1,612 | 9,017 | 19,715 | 21,244 | 42,464 |
| Total assets | 902,947 | 23,955,536 | 61,939,825 | 69,989,754 | 155,433,222 |
| LIABILITIES | |||||
| Payable for shares of the | |||||
| fund repurchased | — | 2,376 | 29,605 | 226,616 | 22,449 |
| Payable for investments purchased | 27,261 | 60,389 | 34,044 | 91,766 | 157,383 |
| Payable for investor servicing | |||||
| fees (Note 2) | 185 | 8,706 | 20,496 | 24,695 | 47,328 |
| Payable for distribution fees (Note 2) | 164 | 3,673 | 10,949 | 11,964 | 28,209 |
| Payable for auditing and tax fee | 136 | 4,911 | 14,198 | 15,516 | 35,477 |
| Other accrued expenses | 1,474 | 4,106 | 5,517 | 5,727 | 6,986 |
| Total liabilities | 29,220 | 84,161 | 114,809 | 376,284 | 297,832 |
| Net assets | $873,727 | $23,871,375 | $61,825,016 | $69,613,470 | $155,135,390 |
| REPRESENTED BY | |||||
| Paid-in-capital | |||||
| (unlimited shares authorized) | |||||
| (Notes 1 and 4) | $825,927 | $21,401,222 | $54,482,348 | $65,032,133 | $139,979,162 |
| Undistributed net investment | |||||
| income (Distributions in excess of net | |||||
| investment income) (Note 1) | — | (40,499) | (109,940) | 159,640 | (185,921) |
| Accumulated net realized gain on | |||||
| investments (Note 1) | 40,481 | 1,276,165 | 3,140,690 | 619,861 | 5,658,435 |
| Net unrealized appreciation | |||||
| of investments | 7,319 | 1,234,487 | 4,311,918 | 3,801,836 | 9,683,714 |
| Total — Representing net assets | |||||
| applicable to capital outstanding | $873,727 | $23,871,375 | $61,825,016 | $69,613,470 | $155,135,390 |
(Continued on next page)
| RetirementReady® Funds 47 |
Statement of assets and liabilities 7/31/18 cont.
| Putnam | Putnam | Putnam | Putnam | Putnam | |
| Retirement- | Retirement- | Retirement- | Retirement- | Retirement- | |
| COMPUTATION OF NET ASSET | Ready | Ready | Ready | Ready | Ready |
| VALUE AND OFFERING PRICE | 2060 Fund | 2055 Fund | 2050 Fund | 2045 Fund | 2040 Fund |
| Computation of net asset value, offering price and redemption price Class A | |||||
| Net Assets | $231,785 | $12,962,167 | $45,447,033 | $47,693,623 | $126,349,683 |
| Number of shares outstanding | 19,814 | 1,031,260 | 2,215,086 | 2,103,823 | 5,212,642 |
| Net asset value and redemption price | $11.70 | $12.57 | $20.52 | $22.67 | $24.24 |
| Offering price per class A share | |||||
| (100/94.25 of Class A | |||||
| net asset value)* | $12.41 | $13.34 | $21.77 | $24.05 | $25.72 |
| Computation of net asset value and offering price Class B | |||||
| Net Assets | $15,504 | $102,911 | $448,831 | $636,147 | $672,251 |
| Number of shares outstanding | 1,330 | 8,265 | 22,226 | 31,028 | 30,275 |
| Net asset value and offering price† | $11.66 | $12.45 | $20.19 | $20.50 | $22.20 |
| Computation of net asset value and offering price Class C | |||||
| Net Assets | $84,764 | $894,839 | $702,692 | $1,018,466 | $993,335 |
| Number of shares outstanding | 7,308 | 72,872 | 35,100 | 49,622 | 45,408 |
| Net asset value and offering price† | $11.60 | $12.28 | $20.02 | $20.52 | $21.88 |
| Computation of net asset value, offering price and redemption price Class M | |||||
| Net Assets | $27,373 | $85,103 | $185,306 | $102,779 | $509,920 |
| Number of shares outstanding | 2,344 | 6,775 | 8,961 | 4,669 | 22,569 |
| Net asset value and redemption price | $11.68 | $12.56 | $20.68 | $22.01 | $22.59 |
| Offering price per class M share | |||||
| (100/96.50 of Class M | |||||
| net asset value)* | $12.10 | $13.02 | $21.43 | $22.81 | $23.41 |
| Computation of net asset value, offering price and redemption price Class R | |||||
| Net Assets | $27,758 | $176,213 | $823,216 | $1,119,569 | $212,143 |
| Number of shares outstanding | 2,374 | 14,078 | 40,606 | 48,002 | 8,455 |
| Net asset value, offering price | |||||
| and redemption value | $11.69 | $12.52 | $20.27 | $23.32 | $25.09 |
| Computation of net asset value, offering price and redemption price Class R6 | |||||
| Net Assets | $435,171 | $5,241,499 | $11,848,331 | $10,434,082 | $22,334,712 |
| Number of shares outstanding | 36,970 | 412,474 | 572,369 | 380,272 | 777,321 |
| Net asset value, offering price | |||||
| and redemption value | $11.77 | $12.71 | $20.70 | $27.44 | $28.73 |
| Computation of net asset value, offering price and redemption price Class Y | |||||
| Net Assets | $51,372 | $4,408,643 | $2,369,607 | $8,608,804 | $4,063,346 |
| Number of shares outstanding | 4,374 | 347,749 | 114,680 | 314,378 | 141,661 |
| Net asset value, offering price | |||||
| and redemption value | $11.74 | $12.68 | $20.66 | $27.38 | $28.68 |
| Cost of investments (Note 1) | $887,765 | $22,643,049 | $57,542,431 | $65,845,912 | $145,525,637 |
* On retail sales of less than $50,000. On sales of $50,000 or more the offering price is reduced.
† Redemption price per share is equal to the net asset value less any applicable contingent deferred sales charge.
The accompanying notes are an integral part of these financial statements.
| 48 RetirementReady® Funds | |
Statement of assets and liabilities 7/31/18 cont.
| Putnam | Putnam | Putnam | Putnam | Putnam | |
| Retirement- | Retirement- | Retirement- | Retirement- | Retirement | |
| Ready | Ready | Ready | Ready | Income Fund | |
| ASSETS | 2035 Fund | 2030 Fund | 2025 Fund | 2020 Fund | Lifestyle 1 |
| Investments in affiliated underlying | |||||
| Putnam Funds, at value (Notes 1 and 5) | $124,511,712 | $197,050,652 | $129,060,051 | $199,702,271 | $103,989,329 |
| Receivable for income distributions | |||||
| from underlying Putnam Fund shares | 5,714 | 14,432 | 12,551 | 27,297 | 16,177 |
| Receivable for shares of the fund sold | 151,569 | 392,569 | 99,029 | 346,041 | 25,100 |
| Receivable for investments sold | 56,535 | 199,038 | 47,909 | 104,434 | 161,176 |
| Receivable from Manager (Note 2) | 34,785 | 53,553 | 36,757 | 52,498 | 30,242 |
| Total assets | 124,760,315 | 197,710,244 | 129,256,297 | 200,232,541 | 104,222,024 |
| LIABILITIES | |||||
| Payable for shares of the | |||||
| fund repurchased | 46,615 | 246,921 | 38,319 | 104,007 | 157,944 |
| Payable for investments purchased | 165,748 | 419,404 | 114,714 | 360,986 | 36,130 |
| Payable for investor servicing | |||||
| fees (Note 2) | 40,689 | 61,211 | 43,973 | 61,831 | 33,045 |
| Payable for distribution fees (Note 2) | 20,776 | 37,152 | 22,932 | 42,219 | 21,404 |
| Payable for auditing and tax fee | 27,544 | 46,299 | 28,433 | 47,345 | 22,988 |
| Other accrued expenses | 7,240 | 6,497 | 8,324 | 5,153 | 6,606 |
| Total liabilities | 308,612 | 817,484 | 256,695 | 621,541 | 278,117 |
| Net assets | $124,451,703 | $196,892,760 | $128,999,602 | $199,611,000 | $103,943,907 |
| REPRESENTED BY | |||||
| Paid-in-capital | |||||
| (unlimited shares authorized) | |||||
| (Notes 1 and 4) | $120,389,207 | $189,932,177 | $126,376,599 | $198,849,493 | $106,949,189 |
| Undistributed net investment | |||||
| income (Note 1) | 721,514 | 1,378,137 | 1,699,921 | 2,250,827 | 6,280 |
| Accumulated net realized loss on | |||||
| investments (Note 1) | (1,626,370) | (2,441,485) | (2,080,489) | (3,684,812) | (3,843,751) |
| Net unrealized appreciation | |||||
| of investments | 4,967,352 | 8,023,931 | 3,003,571 | 2,195,492 | 832,189 |
| Total — Representing net assets | |||||
| applicable to capital outstanding | $124,451,703 | $196,892,760 | $128,999,602 | $199,611,000 | $103,943,907 |
(Continued on next page)
| RetirementReady® Funds 49 |
Statement of assets and liabilities 7/31/18 cont.
| Putnam | Putnam | Putnam | Putnam | Putnam | |
| Retirement- | Retirement- | Retirement- | Retirement- | Retirement | |
| COMPUTATION OF NET ASSET | Ready | Ready | Ready | Ready | Income Fund |
| VALUE AND OFFERING PRICE | 2035 Fund | 2030 Fund | 2025 Fund | 2020 Fund | Lifestyle 1 |
| Computation of net asset value, offering price and redemption price Class A | |||||
| Net Assets | $86,366,966 | $164,246,689 | $93,295,842 | $182,670,214 | $92,361,200 |
| Number of shares outstanding | 3,586,490 | 7,072,077 | 4,071,552 | 9,304,107 | 5,242,706 |
| Net asset value and redemption price | $24.08 | $23.22 | $22.91 | $19.63 | $17.62 |
| Offering price per class A share | |||||
| (100/94.25 of Class A net asset value)* | $25.55 | $24.64 | $24.31 | $20.83 | N/A |
| Offering price per class A share | |||||
| (100/96.00 of Class A net asset value)** | N/A | N/A | N/A | N/A | $18.35 |
| Computation of net asset value and offering price Class B | |||||
| Net Assets | $766,896 | $1,024,782 | $998,227 | $828,580 | $849,205 |
| Number of shares outstanding | 34,741 | 46,548 | 46,831 | 43,861 | 49,384 |
| Net asset value and offering price† | $22.07 | $22.02 | $21.32 | $18.89 | $17.20 |
| Computation of net asset value and offering price Class C | |||||
| Net Assets | $1,495,979 | $1,453,954 | $2,175,170 | $2,197,447 | $1,172,082 |
| Number of shares outstanding | 68,129 | 66,275 | 102,333 | 116,473 | 67,971 |
| Net asset value and offering price† | $21.96 | $21.94 | $21.26 | $18.87 | $17.24 |
| Computation of net asset value, offering price and redemption price Class M | |||||
| Net Assets | $572,133 | $363,292 | $221,612 | $162,943 | $562,161 |
| Number of shares outstanding | 24,725 | 16,113 | 10,222 | 8,437 | 31,822 |
| Net asset value and redemption price | $23.14 | $22.55 | $21.68 | $19.31 | $17.67 |
| Offering price per class M share | |||||
| (100/96.50 of Class M net asset value)* | $23.98 | $23.37 | $22.47 | $20.01 | N/A |
| Offering price per class M share | |||||
| (100/96.75 of Class M net asset value)* | N/A | N/A | N/A | N/A | $18.26 |
| Computation of net asset value, offering price and redemption price Class R | |||||
| Net Assets | $797,436 | $569,843 | $1,045,450 | $2,323,794 | $526,823 |
| Number of shares outstanding | 34,435 | 25,874 | 48,760 | 122,956 | 29,922 |
| Net asset value, offering price | |||||
| and redemption value | $23.16 | $22.02 | $21.44 | $18.90 | $17.61 |
| Computation of net asset value, offering price and redemption price Class R6 | |||||
| Net Assets | $21,366,296 | $21,927,151 | $18,184,594 | $9,690,701 | $3,842,114 |
| Number of shares outstanding | 753,674 | 818,739 | 786,716 | 437,502 | 217,333 |
| Net asset value, offering price | |||||
| and redemption value | $28.35 | $26.78 | $23.11 | $22.15 | $17.68 |
| Computation of net asset value, offering price and redemption price Class Y | |||||
| Net Assets | $13,085,997 | $7,307,049 | $13,078,707 | $1,737,321 | $4,630,322 |
| Number of shares outstanding | 462,441 | 273,260 | 567,094 | 78,519 | 261,890 |
| Net asset value, offering price | |||||
| and redemption value | $28.30 | $26.74 | $23.06 | $22.13 | $17.68 |
| Cost of investments (Note 1) | $119,544,360 | $189,026,721 | $126,056,480 | $197,506,779 | $103,157,140 |
* On retail sales of less than $50,000. On sales of $50,000 or more the offering price is reduced.
** On retail sales of less than $100,000. On sales of $100,000 or more the offering price is reduced.
† Redemption price per share is equal to the net asset value less any applicable contingent deferred sales charge.
The accompanying notes are an integral part of these financial statements.
| 50 RetirementReady® Funds | |
Statement of operations Year ended 7/31/18
| Putnam | Putnam | Putnam | Putnam | Putnam | |
| Retirement- | Retirement- | Retirement- | Retirement- | Retirement- | |
| Ready | Ready | Ready | Ready | Ready | |
| INVESTMENT INCOME | 2060 Fund | 2055 Fund | 2050 Fund | 2045 Fund | 2040 Fund |
| Income distributions from underlying | |||||
| Putnam Fund shares (Note 5) | $12,742 | $450,985 | $1,325,972 | $1,443,825 | $3,259,438 |
| EXPENSES | |||||
| Investor servicing fees (Note 2) | 619 | 33,869 | 87,583 | 100,588 | 198,742 |
| Distribution fees (Note 2) | 1,532 | 40,622 | 130,263 | 138,674 | 333,560 |
| Auditing and tax fees | 136 | 4,911 | 14,198 | 15,516 | 35,477 |
| Blue sky expense | 88,351 | 79,878 | 83,210 | 90,226 | 90,665 |
| Legal | — | — | — | — | 37,660 |
| Other | 3,626 | 7,383 | 10,727 | 10,198 | 15,261 |
| Fees waived and reimbursed | |||||
| by Manager (Note 2) | (92,113) | (92,172) | (108,135) | (115,940) | (179,063) |
| Total expenses | 2,151 | 74,491 | 217,846 | 239,262 | 532,302 |
| Net investment income | 10,591 | 376,494 | 1,108,126 | 1,204,563 | 2,727,136 |
| Net realized gain on sale of underlying | |||||
| Putnam Fund shares (Notes 1 and 3) | 25,864 | 1,075,126 | 3,395,922 | 3,825,226 | 6,747,151 |
| Capital gain distribution | |||||
| from underlying Putnam Fund | |||||
| shares (Note 5) | 35,070 | 1,245,069 | 3,735,908 | 4,169,810 | 9,332,737 |
| Net unrealized depreciation | |||||
| of underlying Putnam Fund shares | |||||
| during the period | (14,726) | (611,886) | (2,177,893) | (2,852,039) | (5,466,557) |
| Net gain on investments | 46,208 | 1,708,309 | 4,953,937 | 5,142,997 | 10,613,331 |
| Net increase in net assets resulting | |||||
| from operations | $56,799 | $2,084,803 | $6,062,063 | $6,347,560 | $13,340,467 |
The accompanying notes are an integral part of these financial statements.
| RetirementReady® Funds 51 |
Statement of operations Year ended 7/31/18 cont.
| Putnam | Putnam | Putnam | Putnam | Putnam | |
| Retirement- | Retirement- | Retirement- | Retirement- | Retirement | |
| Ready | Ready | Ready | Ready | Income Fund | |
| INVESTMENT INCOME | 2035 Fund | 2030 Fund | 2025 Fund | 2020 Fund | Lifestyle 1 |
| Income distributions from underlying | |||||
| Putnam Fund shares (Note 5) | $2,507,763 | $4,310,047 | $2,895,032 | $5,360,373 | $2,786,713 |
| EXPENSES | |||||
| Investor servicing fees (Note 2) | 167,497 | 259,646 | 179,194 | 257,155 | 131,046 |
| Distribution fees (Note 2) | 239,793 | 452,452 | 264,440 | 509,756 | 243,884 |
| Auditing and tax fees | 27,544 | 46,299 | 28,433 | 47,345 | 22,988 |
| Blue sky expense | 91,800 | 90,101 | 90,961 | 54,335 | 82,986 |
| Legal | — | — | — | 54,569 | — |
| Other | 11,187 | 16,882 | 11,464 | 14,530 | 10,957 |
| Fees waived and reimbursed | |||||
| by Manager (Note 2) | (130,531) | (153,282) | (130,858) | (170,779) | (116,931) |
| Total expenses | 407,290 | 712,098 | 443,634 | 766,911 | 374,930 |
| Net investment income | 2,100,473 | 3,597,949 | 2,451,398 | 4,593,462 | 2,411,783 |
| Net realized gain (loss) on sale | |||||
| of underlying Putnam Fund shares | |||||
| (Notes 1 and 3) | 4,482,563 | 7,656,371 | 2,349,947 | 5,273,375 | (343,492) |
| Capital gain distribution | |||||
| from underlying Putnam Fund | |||||
| shares (Note 5) | 6,108,243 | 7,418,782 | 2,961,838 | 3,081,154 | 1,021,625 |
| Net unrealized depreciation | |||||
| of underlying Putnam Fund shares | |||||
| during the period | (3,970,412) | (6,471,687) | (2,445,018) | (6,755,840) | (878,075) |
| Net gain (loss) on investments | 6,620,394 | 8,603,466 | 2,866,767 | 1,598,689 | (199,942) |
| Net increase in net assets resulting | |||||
| from operations | $8,720,867 | $12,201,415 | $5,318,165 | $6,192,151 | $2,211,841 |
The accompanying notes are an integral part of these financial statements.
| 52 RetirementReady® Funds | |
Statement of changes in net assets
| Putnam RetirementReady 2060 Fund — | ||
| TOTAL INCREASE IN NET ASSETS | Year ended 7/31/18 | Year ended 7/31/17 |
| Operations | ||
| Net investment income | $10,591 | $525 |
| Net realized gain on sale of underlying | ||
| Putnam Fund shares | 60,934 | 1,397 |
| Net unrealized appreciation (depreciation) of underlying | ||
| Putnam Fund shares | (14,726) | 22,393 |
| Net increase in net assets resulting from operations | 56,799 | 24,315 |
| Distributions to shareholders (Note 1): | ||
| From ordinary income | ||
| Net investment income | ||
| Class A | (8,230) | (270) |
| Class B | (437) | (19) |
| Class C | (1,902) | (129) |
| Class M | (459) | (33) |
| Class R | (617) | (57) |
| Class R6 | (8,537) | (264) |
| Class Y | (1,572) | (129) |
| Net realized short-term gain on investments | ||
| Class A | (485) | — |
| Class B | (34) | — |
| Class C | (138) | — |
| Class M | (32) | — |
| Class R | (39) | — |
| Class R6 | (483) | — |
| Class Y | (91) | — |
| From net realized long-term gain on investments | ||
| Class A | (3,162) | (320) |
| Class B | (218) | (125) |
| Class C | (891) | (319) |
| Class M | (209) | (106) |
| Class R | (256) | (106) |
| Class R6 | (3,134) | (295) |
| Class Y | (587) | (134) |
| Increase from capital share transactions (Note 4) | 576,308 | 151,256 |
| Total increase in net assets | 601,594 | 173,265 |
| NET ASSETS | ||
| Beginning of year | 272,133 | 98,868 |
| End of year | $873,727 | $272,133 |
The accompanying notes are an integral part of these financial statements.
| RetirementReady® Funds 53 |
Statement of changes in net assets cont.
| Putnam RetirementReady 2055 Fund — | ||
| TOTAL INCREASE IN NET ASSETS | Year ended 7/31/18 | Year ended 7/31/17 |
| Operations | ||
| Net investment income | $376,494 | $76,576 |
| Net realized gain on sale of underlying | ||
| Putnam Fund shares | 2,320,195 | 39,283 |
| Net unrealized appreciation (depreciation) of underlying | ||
| Putnam Fund shares | (611,886) | 1,823,233 |
| Net increase in net assets resulting from operations | 2,084,803 | 1,939,092 |
| Distributions to shareholders (Note 1): | ||
| From ordinary income | ||
| Net investment income | ||
| Class A | (456,467) | (52,906) |
| Class B | (3,392) | (63) |
| Class C | (28,465) | (941) |
| Class M | (2,126) | (224) |
| Class R | (9,616) | (1,788) |
| Class R6 | (162,578) | (19,883) |
| Class Y | (131,049) | (21,327) |
| From net realized long-term gain on investments | ||
| Class A | (158,771) | (11,554) |
| Class B | (1,454) | (149) |
| Class C | (12,107) | (1,278) |
| Class M | (897) | (112) |
| Class R | (3,622) | (548) |
| Class R6 | (52,224) | (3,977) |
| Class Y | (43,425) | (3,896) |
| Increase from capital share transactions (Note 4) | 5,658,495 | 5,698,955 |
| Total increase in net assets | 6,677,105 | 7,519,401 |
| NET ASSETS | ||
| Beginning of year | 17,194,270 | 9,674,869 |
| End of year | $23,871,375 | $17,194,270 |
| Distributions in excess of net investment income, | ||
| respectively, end of period | $(40,499) | $(31,392) |
The accompanying notes are an integral part of these financial statements.
| 54 RetirementReady® Funds | |
Statement of changes in net assets cont.
| Putnam RetirementReady 2050 Fund — | ||
| TOTAL INCREASE IN NET ASSETS | Year ended 7/31/18 | Year ended 7/31/17 |
| Operations | ||
| Net investment income | $1,108,126 | $247,138 |
| Net realized gain on sale of underlying | ||
| Putnam Fund shares | 7,131,830 | 120,711 |
| Net unrealized appreciation (depreciation) of underlying | ||
| Putnam Fund shares | (2,177,893) | 6,438,553 |
| Net increase in net assets resulting from operations | 6,062,063 | 6,806,402 |
| Distributions to shareholders (Note 1): | ||
| From ordinary income | ||
| Net investment income | ||
| Class A | (1,847,849) | (230,942) |
| Class B | (16,523) | — |
| Class C | (25,252) | — |
| Class M | (5,637) | (368) |
| Class R | (34,238) | (5,970) |
| Class R6 | (362,501) | (37,994) |
| Class Y | (177,789) | (23,221) |
| From net realized long-term gain on investments | ||
| Class A | (281,913) | — |
| Class B | (3,065) | — |
| Class C | (4,839) | — |
| Class M | (972) | — |
| Class R | (5,492) | — |
| Class R6 | (51,158) | — |
| Class Y | (25,627) | — |
| Increase from capital share transactions (Note 4) | 2,531,480 | 10,106,705 |
| Total increase in net assets | 5,750,688 | 16,614,612 |
| NET ASSETS | ||
| Beginning of year | 56,074,328 | 39,459,716 |
| End of year | $61,825,016 | $56,074,328 |
| Distributions in excess of net investment income, | ||
| respectively, end of period | $(109,940) | $(51,355) |
The accompanying notes are an integral part of these financial statements.
| RetirementReady® Funds 55 |
Statement of changes in net assets cont.
| Putnam RetirementReady 2045 Fund — | ||
| TOTAL INCREASE IN NET ASSETS | Year ended 7/31/18 | Year ended 7/31/17 |
| Operations | ||
| Net investment income | $1,204,563 | $202,967 |
| Net realized gain on sale of underlying | ||
| Putnam Fund shares | 7,995,036 | 221,132 |
| Net unrealized appreciation (depreciation) of underlying | ||
| Putnam Fund shares | (2,852,039) | 6,627,659 |
| Net increase in net assets resulting from operations | 6,347,560 | 7,051,758 |
| Distributions to shareholders (Note 1): | ||
| From ordinary income | ||
| Net investment income | ||
| Class A | (2,038,021) | (197,906) |
| Class B | (25,629) | — |
| Class C | (40,605) | — |
| Class M | (5,731) | (99) |
| Class R | (42,986) | (4,487) |
| Class R6 | (351,274) | (32,337) |
| Class Y | (271,454) | (26,773) |
| Increase from capital share transactions (Note 4) | 7,837,935 | 6,984,063 |
| Total increase in net assets | 11,409,795 | 13,774,219 |
| NET ASSETS | ||
| Beginning of year | 58,203,675 | 44,429,456 |
| End of year | $69,613,470 | $58,203,675 |
| Undistributed net investment income, respectively, | ||
| end of period | $159,640 | $177,917 |
The accompanying notes are an integral part of these financial statements.
| 56 RetirementReady® Funds | |
Statement of changes in net assets cont.
| Putnam RetirementReady 2040 Fund — | ||
| TOTAL INCREASE IN NET ASSETS | Year ended 7/31/18 | Year ended 7/31/17 |
| Operations | ||
| Net investment income | $2,727,136 | $284,488 |
| Net realized gain on sale of underlying | ||
| Putnam Fund shares | 16,079,888 | 1,015,155 |
| Net unrealized appreciation (depreciation) of underlying | ||
| Putnam Fund shares | (5,466,557) | 14,927,748 |
| Net increase in net assets resulting from operations | 13,340,467 | 16,227,391 |
| Distributions to shareholders (Note 1): | ||
| From ordinary income | ||
| Net investment income | ||
| Class A | (5,568,396) | (326,458) |
| Class B | (30,675) | — |
| Class C | (42,987) | — |
| Class M | (21,710) | — |
| Class R | (54,151) | (817) |
| Class R6�� | (638,826) | (31,012) |
| Class Y | (332,292) | (23,573) |
| From net realized long-term gain on investments | ||
| Class A | (96,094) | — |
| Class B | (621) | — |
| Class C | (856) | — |
| Class M | (386) | — |
| Class R | (1,028) | — |
| Class R6 | (10,321) | — |
| Class Y | (5,457) | — |
| Increase from capital share transactions (Note 4) | 6,114,100 | 24,884,607 |
| Total increase in net assets | 12,650,767 | 40,730,138 |
| NET ASSETS | ||
| Beginning of year | 142,484,623 | 101,754,485 |
| End of year | $155,135,390 | $142,484,623 |
| Distributions in excess of net investment income and | ||
| undistributed net investment income, respectively, | ||
| end of period | $(185,921) | $81,033 |
The accompanying notes are an integral part of these financial statements.
| RetirementReady® Funds 57 |
Statement of changes in net assets cont.
| Putnam RetirementReady 2035 Fund — | ||
| TOTAL INCREASE IN NET ASSETS | Year ended 7/31/18 | Year ended 7/31/17 |
| Operations | ||
| Net investment income | $2,100,473 | $264,424 |
| Net realized gain (loss) on sale of underlying | ||
| Putnam Fund shares | 10,590,806 | (130,606) |
| Net unrealized appreciation (depreciation) of underlying | ||
| Putnam Fund shares | (3,970,412) | 10,150,391 |
| Net increase in net assets resulting from operations | 8,720,867 | 10,284,209 |
| Distributions to shareholders (Note 1): | ||
| From ordinary income | ||
| Net investment income | ||
| Class A | (2,910,085) | (460,224) |
| Class B | (23,923) | — |
| Class C | (47,123) | (449) |
| Class M | (17,439) | (1,204) |
| Class R | (62,418) | (10,443) |
| Class R6 | (621,005) | (82,853) |
| Class Y | (347,054) | (49,994) |
| Increase from capital share transactions (Note 4) | 14,964,796 | 20,759,347 |
| Total increase in net assets | 19,656,616 | 30,438,389 |
| NET ASSETS | ||
| Beginning of year | 104,795,087 | 74,356,698 |
| End of year | $124,451,703 | $104,795,087 |
| Undistributed net investment income, respectively, | ||
| end of period | $721,514 | $250,560 |
The accompanying notes are an integral part of these financial statements.
| 58 RetirementReady® Funds | |
Statement of changes in net assets cont.
| Putnam RetirementReady 2030 Fund — | ||
| TOTAL INCREASE IN NET ASSETS | Year ended 7/31/18 | Year ended 7/31/17 |
| Operations | ||
| Net investment income | $3,597,949 | $1,292,198 |
| Net realized gain (loss) on sale of underlying | ||
| Putnam Fund shares | 15,075,153 | (271,063) |
| Net unrealized appreciation (depreciation) of underlying | ||
| Putnam Fund shares | (6,471,687) | 15,495,629 |
| Net increase in net assets resulting from operations | 12,201,415 | 16,516,764 |
| Distributions to shareholders (Note 1): | ||
| From ordinary income | ||
| Net investment income | ||
| Class A | (5,066,677) | (999,363) |
| Class B | (30,451) | — |
| Class C | (44,587) | (575) |
| Class M | (7,290) | — |
| Class R | (75,875) | (12,490) |
| Class R6 | (511,113) | (73,892) |
| Class Y | (233,627) | (36,267) |
| Increase (decrease) from capital share | ||
| transactions (Note 4) | (5,353,189) | 37,082,742 |
| Total increase in net assets | 878,606 | 52,476,919 |
| NET ASSETS | ||
| Beginning of year | 196,014,154 | 143,537,235 |
| End of year | $196,892,760 | $196,014,154 |
| Undistributed net investment income, respectively, | ||
| end of period | $1,378,137 | $1,076,679 |
The accompanying notes are an integral part of these financial statements.
| RetirementReady® Funds 59 |
Statement of changes in net assets cont.
| Putnam RetirementReady 2025 Fund — | ||
| TOTAL INCREASE IN NET ASSETS | Year ended 7/31/18 | Year ended 7/31/17 |
| Operations | ||
| Net investment income | $2,451,398 | $1,009,618 |
| Net realized gain (loss) on sale of underlying | ||
| Putnam Fund shares | 5,311,785 | (856,873) |
| Net unrealized appreciation (depreciation) of underlying | ||
| Putnam Fund shares | (2,445,018) | 7,136,667 |
| Net increase in net assets resulting from operations | 5,318,165 | 7,289,412 |
| Distributions to shareholders (Note 1): | ||
| From ordinary income | ||
| Net investment income | ||
| Class A | (1,859,246) | (1,009,141) |
| Class B | (18,790) | (7,944) |
| Class C | (31,591) | (17,223) |
| Class M | (3,493) | (3,844) |
| Class R | (63,799) | (32,413) |
| Class R6 | (355,490) | (140,803) |
| Class Y | (279,819) | (132,237) |
| Increase from capital share transactions (Note 4) | 19,109,931 | 17,684,848 |
| Total increase in net assets | 21,815,868 | 23,630,655 |
| NET ASSETS | ||
| Beginning of year | 107,183,734 | 83,553,079 |
| End of year | $128,999,602 | $107,183,734 |
| Undistributed net investment income, respectively, | ||
| end of period | $1,699,921 | $978,082 |
The accompanying notes are an integral part of these financial statements.
| 60 RetirementReady® Funds | |
Statement of changes in net assets cont.
| Putnam RetirementReady 2020 Fund — | ||
| TOTAL INCREASE (DECREASE) IN NET ASSETS | Year ended 7/31/18 | Year ended 7/31/17 |
| Operations | ||
| Net investment income | $4,593,462 | $1,802,639 |
| Net realized gain (loss) on sale of underlying | ||
| Putnam Fund shares | 8,354,529 | (1,477,154) |
| Net unrealized appreciation (depreciation) of underlying | ||
| Putnam Fund shares | (6,755,840) | 10,357,533 |
| Net increase in net assets resulting from operations | 6,192,151 | 10,683,018 |
| Distributions to shareholders (Note 1): | ||
| From ordinary income | ||
| Net investment income | ||
| Class A | (4,208,984) | (1,596,335) |
| Class B | (15,108) | (3,396) |
| Class C | (30,710) | (7,938) |
| Class M | (2,326)�� | (1,249) |
| Class R | (92,656) | (24,081) |
| Class R6 | (200,231) | (32,967) |
| Class Y | (59,117) | (12,828) |
| Increase (decrease) from capital share | ||
| transactions (Note 4) | (1,651,223) | 51,517,763 |
| Total increase (decrease) in net assets | (68,204) | 60,521,987 |
| NET ASSETS | ||
| Beginning of year | 199,679,204 | 139,157,217 |
| End of year | $199,611,000 | $199,679,204 |
| Undistributed net investment income, respectively, | ||
| end of period | $2,250,827 | $1,693,566 |
The accompanying notes are an integral part of these financial statements.
| RetirementReady® Funds 61 |
Statement of changes in net assets cont.
| Putnam Retirement Income Fund Lifestyle 1 — | ||
| TOTAL INCREASE IN NET ASSETS | Year ended 7/31/18 | Year ended 7/31/17 |
| Operations | ||
| Net investment income | $2,411,783 | $941,121 |
| Net realized gain (loss) on sale of underlying | ||
| Putnam Fund shares | 678,133 | (1,414,178) |
| Net unrealized appreciation (depreciation) of underlying | ||
| Putnam Fund shares | (878,075) | 4,435,994 |
| Net increase in net assets resulting from operations | 2,211,841 | 3,962,937 |
| Distributions to shareholders (Note 1): | ||
| From ordinary income | ||
| Net investment income | ||
| Class A | (2,157,640) | (810,027) |
| Class B | (19,321) | (8,533) |
| Class C | (31,012) | (15,091) |
| Class M | (11,858) | (4,840) |
| Class R | (16,169) | (12,229) |
| Class R6 | (107,045) | (34,246) |
| Class Y | (115,351) | (55,219) |
| Increase from capital share transactions (Note 4) | 12,798,660 | 12,408,064 |
| Total increase in net assets | 12,552,105 | 15,430,816 |
| NET ASSETS | ||
| Beginning of year | 91,391,802 | 75,960,986 |
| End of year | $103,943,907 | $91,391,802 |
| Undistributed net investment income, respectively, | ||
| end of period | $6,280 | $7,777 |
The accompanying notes are an integral part of these financial statements.
| 62 RetirementReady® Funds | |
| This page left blank intentionally. |
| RetirementReady® Funds 63 |
Financial highlights (For a common share outstanding throughout the period)
Putnam RetirementReady 2060 Fund
| INVESTMENT OPERATIONS | LESS DISTRIBUTIONS | RATIOS AND SUPPLEMENTAL DATA | |||||||||||
| Ratio of net | |||||||||||||
| Ratio | investment | ||||||||||||
| Net asset | Net realized | From | of expenses | income (loss) | |||||||||
| value, | and unrealized | Total from | net | From | Net asset | Total return | Net assets, | to average | to average | Portfolio | |||
| beginning | Net investment | gain (loss) | investment | investment | net realized gain | Total | value, end | at net asset | end of period | net assets | net assets | turnover | |
| Period ended | of period | income (loss) a,b | on investments | operations | income | on investments | distributions | of period | value (%) c | (in thousands) | (%) d,e | (%) b,e | (%) |
| Class A | |||||||||||||
| July 31, 2018 | $11.11 | .26 | .98 | 1.24 | (.45) | (.20) | (.65) | $11.70 | 11.28 | $232 | .40 | 2.22 | 63 |
| July 31, 2017 | 9.83 | .04 | 1.43 | 1.47 | (.09) | (.10) | (.19) | 11.11 | 15.19 | 77 | .40 | .39 | 15 |
| July 31, 2016‡ | 10.00 | .10 | (.05) | .05 | (.18) | (.04) | (.22) | 9.83 | .59* | 23 | .17* | 1.02* | 4* |
| Class B | |||||||||||||
| July 31, 2018 | $11.05 | .12 | 1.03 | 1.15 | (.34) | (.20) | (.54) | $11.66 | 10.54 | $16 | 1.15 | 1.07 | 63 |
| July 31, 2017 | 9.79 | (.01) | 1.39 | 1.38 | (.02) | (.10) | (.12) | 11.05 | 14.23 | 14 | 1.15 | (.14) | 15 |
| July 31, 2016‡ | 10.00 | .10 | (.09) | .01 | (.18) | (.04) | (.22) | 9.79 | .12* | 11 | .67* | 1.11* | 4* |
| Class C | |||||||||||||
| July 31, 2018 | $11.03 | .09 | 1.05 | 1.14 | (.37) | (.20) | (.57) | $11.60 | 10.41 | $85 | 1.15 | .79 | 63 |
| July 31, 2017 | 9.79 | (.02) | 1.40 | 1.38 | (.04) | (.10) | (.14) | 11.03 | 14.32 | 52 | 1.15 | (.19) | 15 |
| July 31, 2016‡ | 10.00 | .06 | (.05) | .01 | (.18) | (.04) | (.22) | 9.79 | .12* | 22 | .67* | .61* | 4* |
| Class M | |||||||||||||
| July 31, 2018 | $11.08 | .09 | 1.09 | 1.18 | (.38) | (.20) | (.58) | $11.68 | 10.75 | $27 | .90 | .75 | 63 |
| July 31, 2017 | 9.81 | .01 | 1.39 | 1.40 | (.03) | (.10) | (.13) | 11.08 | 14.48 | 12 | .90 | .11 | 15 |
| July 31, 2016‡ | 10.00 | .12 | (.09) | .03 | (.18) | (.04) | (.22) | 9.81 | .34* | 10 | .50 * | 1.31* | 4* |
| Class R | |||||||||||||
| July 31, 2018 | $11.10 | .14 | 1.06 | 1.20 | (.41) | (.20) | (.61) | $11.69 | 10.97 | $28 | .65 | 1.23 | 63 |
| July 31, 2017 | 9.82 | .04 | 1.40 | 1.44 | (.06) | (.10) | (.16) | 11.10 | 14.83 | 13 | .65 | .36 | 15 |
| July 31, 2016‡ | 10.00 | .14 | (.10) | .04 | (.18) | (.04) | (.22) | 9.82 | .47* | 10 | .33* | 1.47* | 4* |
| Class R6 | |||||||||||||
| July 31, 2018 | $11.15 | .23 | 1.06 | 1.29 | (.47) | (.20) | (.67) | $11.77 | 11.71 | $435 | .05 | 2.00 | 63 |
| July 31, 2017† | 9.86 | .07 | 1.41 | 1.48 | (.09) | (.10) | (.19) | 11.15 | 15.31* | 80 | .05* | .69* | 15 |
| Class Y | |||||||||||||
| July 31, 2018 | $11.14 | .26 | 1.00 | 1.26 | (.46) | (.20) | (.66) | $11.74 | 11.46 | $51 | .15 | 2.22 | 63 |
| July 31, 2017 | 9.85 | .06 | 1.43 | 1.49 | (.10) | (.10) | (.20) | 11.14 | 15.41 | 24 | .15 | .60 | 15 |
| July 31, 2016‡ | 10.00 | .11 | (.03) | .08 | (.19) | (.04) | (.23) | 9.85 | .82* | 23 | — * | 1.20 * | 4* |
See page 84 for notes to financial highlights.
The accompanying notes are an integral part of these financial statements.
| 64 RetirementReady® Funds | RetirementReady® Funds 65 |
Financial highlights (For a common share outstanding throughout the period)
Putnam RetirementReady 2055 Fund
| INVESTMENT OPERATIONS | LESS DISTRIBUTIONS | RATIOS AND SUPPLEMENTAL DATA | |||||||||||
| Ratio of net | |||||||||||||
| Ratio | investment | ||||||||||||
| Net asset | Net realized | From | of expenses | income (loss) | |||||||||
| value, | and unrealized | Total from | net | From | Net asset | Total return | Net assets, | to average | to average | Portfolio | |||
| beginning | Net investment | gain (loss) | investment | investment | net realized gain | Total | value, end | at net asset | end of period | net assets | net assets | turnover | |
| Period ended | of period | income (loss) a,b | on investments | operations | income | on investments | distributions | of period | value (%) c | (in thousands) | (%) d,e | (%) b,e | (%) |
| Class A | |||||||||||||
| July 31, 2018 | $11.92 | .22 | 1.08 | 1.30 | (.48) | (.17) | (.65) | $12.57 | 11.05 | $12,962 | .44 | 1.80 | 34 |
| July 31, 2017 | 10.46 | .05 | 1.52 | 1.57 | (.09) | (.02) | (.11) | 11.92 | 15.08 | 10,030 | .45 | .49 | 30 |
| July 31, 2016 | 11.60 | .15 | (.39) | (.24) | (.24) | (.66) | (.90) | 10.46 | (1.77) | 4,783 | .25 | 1.41 | 38 |
| July 31, 2015 | 12.02 | .11 | .97 | 1.08 | (.61) | (.89) | (1.50) | 11.60 | 9.56 | 2,647 | .25 | .95 | 69g |
| July 31, 2014 | 11.67 | .09 | 1.56 | 1.65 | (.33) | (.97) | (1.30) | 12.02 | 14.60 | 568 | .25 | .76 | 71g |
| Class B | |||||||||||||
| July 31, 2018 | $11.81 | .11 | 1.09 | 1.20 | (.39) | (.17) | (.56) | $12.45 | 10.26 | $103 | 1.19 | .94 | 34 |
| July 31, 2017 | 10.37 | (.02) | 1.49 | 1.47 | (.01) | (.02) | (.03) | 11.81 | 14.17 | 98 | 1.20 | (.21) | 30 |
| July 31, 2016 | 11.50 | .09 | (.40) | (.31) | (.16) | (.66) | (.82) | 10.37 | (2.51) | 77 | 1.00 | .86 | 38 |
| July 31, 2015 | 11.93 | .06 | .93 | .99 | (.53) | (.89) | (1.42) | 11.50 | 8.81 | 81 | 1.00 | .54 | 69g |
| July 31, 2014 | 11.62 | (.03) | 1.58 | 1.55 | (.27) | (.97) | (1.24) | 11.93 | 13.67 | 55 | 1.00 | (.23) | 71g |
| Class C | |||||||||||||
| July 31, 2018 | $11.66 | .13 | 1.06 | 1.19 | (.40) | (.17) | (.57) | $12.28 | 10.25 | $895 | 1.19 | 1.08 | 34 |
| July 31, 2017 | 10.25 | (.02) | 1.46 | 1.44 | (.01) | (.02) | (.03) | 11.66 | 14.11 | 812 | 1.20 | (.19) | 30 |
| July 31, 2016 | 11.38 | .07 | (.38) | (.31) | (.16) | (.66) | (.82) | 10.25 | (2.48) | 655 | 1.00 | .71 | 38 |
| July 31, 2015 | 11.83 | .06 | .92 | .98 | (.54) | (.89) | (1.43) | 11.38 | 8.81 | 545 | 1.00 | .50 | 69g |
| July 31, 2014 | 11.54 | (.04) | 1.59 | 1.55 | (.29) | (.97) | (1.26) | 11.83 | 13.78 | 391 | 1.00 | (.35) | 71g |
| Class M | |||||||||||||
| July 31, 2018 | $11.89 | .12 | 1.12 | 1.24 | (.40) | (.17) | (.57) | $12.56 | 10.50 | $85 | .94 | 1.00 | 34 |
| July 31, 2017 | 10.44 | —f | 1.51 | 1.51 | (.04) | (.02) | (.06) | 11.89 | 14.49 | 79 | .95 | .03 | 30 |
| July 31, 2016 | 11.58 | .10 | (.39) | (.29) | (.19) | (.66) | (.85) | 10.44 | (2.24) | 57 | .75 | .95 | 38 |
| July 31, 2015 | 11.98 | .09 | .94 | 1.03 | (.54) | (.89) | (1.43) | 11.58 | 9.05 | 64 | .75 | .79 | 69g |
| July 31, 2014 | 11.65 | .02 | 1.57 | 1.59 | (.29) | (.97) | (1.26) | 11.98 | 14.02 | 30 | .75 | .18 | 71g |
| Class R | |||||||||||||
| July 31, 2018 | $11.86 | .23 | 1.05 | 1.28 | (.45) | (.17) | (.62) | $12.52 | 10.86 | $176 | .69 | 1.91 | 34 |
| July 31, 2017 | 10.42 | .06 | 1.46 | 1.52 | (.06) | (.02) | (.08) | 11.86 | 14.68 | 253 | .70 | .55 | 30 |
| July 31, 2016 | 11.55 | .13 | (.39) | (.26) | (.21) | (.66) | (.87) | 10.42 | (2.00) | 273 | .50 | 1.25 | 38 |
| July 31, 2015 | 11.98 | .20 | .85 | 1.05 | (.59) | (.89) | (1.48) | 11.55 | 9.34 | 253 | .50 | 1.65 | 69g |
| July 31, 2014 | 11.65 | .03 | 1.59 | 1.62 | (.32) | (.97) | (1.29) | 11.98 | 14.35 | 282 | .50 | .21 | 71g |
| Class R6 | |||||||||||||
| July 31, 2018 | $12.03 | .25 | 1.12 | 1.37 | (.52) | (.17) | (.69) | $12.71 | 11.55 | $5,241 | .05 | 2.03 | 34 |
| July 31, 2017† | 10.55 | .11 | 1.49 | 1.60 | (.10) | (.02) | (.12) | 12.03 | 15.23* | 3,339 | .05* | .96* | 30 |
| Class Y | |||||||||||||
| July 31, 2018 | $12.01 | .22 | 1.13 | 1.35 | (.51) | (.17) | (.68) | $12.68 | 11.35 | $4,409 | .19 | 1.80 | 34 |
| July 31, 2017 | 10.53 | .08 | 1.52 | 1.60 | (.10) | (.02) | (.12) | 12.01 | 15.36 | 2,583 | .20 | .67 | 30 |
| July 31, 2016 | 11.66 | .17 | (.38) | (.21) | (.26) | (.66) | (.92) | 10.53 | (1.50) | 3,831 | — | 1.64 | 38 |
| July 31, 2015 | 12.06 | .17 | .95 | 1.12 | (.63) | (.89) | (1.52) | 11.66 | 9.89 | 1,730 | — | 1.42 | 69g |
| July 31, 2014 | 11.70 | .13 | 1.56 | 1.69 | (.36) | (.97) | (1.33) | 12.06 | 14.88 | 1,013 | — | 1.13 | 71g |
See page 84 for notes to financial highlights.
The accompanying notes are an integral part of these financial statements.
| 66 RetirementReady® Funds | RetirementReady® Funds 67 |
Financial highlights (For a common share outstanding throughout the period)
Putnam RetirementReady 2050 Fund
| INVESTMENT OPERATIONS | LESS DISTRIBUTIONS | RATIOS AND SUPPLEMENTAL DATA | |||||||||||
| Ratio of net | |||||||||||||
| Ratio | investment | ||||||||||||
| Net asset | Net realized | From | of expenses | income (loss) | |||||||||
| value, | and unrealized | Total from | net | From | Net asset | Total return | Net assets, | to average | to average | Portfolio | |||
| beginning | Net investment | gain (loss) | investment | investment | net realized gain | Total | value, end | at net asset | end of period | net assets | net assets | turnover | |
| Period ended | of period | income (loss) a,b | on investments | operations | income | on investments | distributions | of period | value (%) c | (in thousands) | (%) d,e | (%) b,e | (%) |
| Class A | |||||||||||||
| July 31, 2018 | $19.41 | .36 | 1.72 | 2.08 | (.84) | (.13) | (.97) | $20.52 | 10.82 | $45,447 | .41 | 1.81 | 38 |
| July 31, 2017 | 17.05 | .09 | 2.38 | 2.47 | (.11) | — | (.11) | 19.41 | 14.58 | 43,088 | .41 | .48 | 37 |
| July 31, 2016 | 17.69 | .25 | (.53) | (.28) | (.36) | — | (.36) | 17.05 | (1.54) | 29,339 | .25 | 1.54 | 41 |
| July 31, 2015 | 16.99 | .19 | 1.37 | 1.56 | (.86) | — | (.86) | 17.69 | 9.43 | 16,701 | .25 | 1.11 | 40g |
| July 31, 2014 | 15.22 | .12 | 2.06 | 2.18 | (.41) | — | (.41) | 16.99 | 14.45 | 4,423 | .25 | .76 | 54g |
| Class B | |||||||||||||
| July 31, 2018 | $19.13 | .23 | 1.65 | 1.88 | (.69) | (.13) | (.82) | $20.19 | 9.90 | $449 | 1.16 | 1.16 | 38 |
| July 31, 2017 | 16.81 | (.04) | 2.36 | 2.32 | — | — | — | 19.13 | 13.80 | 470 | 1.16 | (.24) | 37 |
| July 31, 2016 | 17.45 | .13 | (.54) | (.41) | (.23) | — | (.23) | 16.81 | (2.31) | 453 | 1.00 | .78 | 41 |
| July 31, 2015 | 16.76 | .10 | 1.32 | 1.42 | (.73) | — | (.73) | 17.45 | 8.65 | 334 | 1.00 | .61 | 40g |
| July 31, 2014 | 15.05 | —f | 2.03 | 2.03 | (.32) | — | (.32) | 16.76 | 13.57 | 284 | 1.00 | (.01) | 54g |
| Class C | |||||||||||||
| July 31, 2018 | $18.95 | .27 | 1.60 | 1.87 | (.67) | (.13) | (.80) | $20.02 | 9.93 | $703 | 1.16 | 1.40 | 38 |
| July 31, 2017 | 16.65 | (.05) | 2.35 | 2.30 | — | — | — | 18.95 | 13.81 | 868 | 1.16 | (.27) | 37 |
| July 31, 2016 | 17.29 | .14 | (.54) | (.40) | (.24) | — | (.24) | 16.65 | (2.29) | 664 | 1.00 | .85 | 41 |
| July 31, 2015 | 16.64 | .10 | 1.30 | 1.40 | (.75) | — | (.75) | 17.29 | 8.58 | 575 | 1.00 | .60 | 40g |
| July 31, 2014 | 14.96 | .01 | 2.01 | 2.02 | (.34) | — | (.34) | 16.64 | 13.58 | 409 | 1.00 | .04 | 54g |
| Class M | |||||||||||||
| July 31, 2018 | $19.57 | .24 | 1.74 | 1.98 | (.74) | (.13) | (.87) | $20.68 | 10.21 | $185 | .91 | 1.18 | 38 |
| July 31, 2017 | 17.20 | .01 | 2.40 | 2.41 | (.04) | — | (.04) | 19.57 | 14.06 | 137 | .91 | .04 | 37 |
| July 31, 2016 | 17.84 | .16 | (.53) | (.37) | (.27) | — | (.27) | 17.20 | (2.02) | 124 | .75 | .96 | 41 |
| July 31, 2015 | 17.14 | .14 | 1.35 | 1.49 | (.79) | — | (.79) | 17.84 | 8.90 | 87 | .75 | .77 | 40g |
| July 31, 2014 | 15.37 | .03 | 2.09 | 2.12 | (.35) | — | (.35) | 17.14 | 13.85 | 52 | .75 | .15 | 54g |
| Class R | |||||||||||||
| July 31, 2018 | $19.20 | .34 | 1.66 | 2.00 | (.80) | (.13) | (.93) | $20.27 | 10.51 | $823 | .66 | 1.69 | 38 |
| July 31, 2017 | 16.86 | .12 | 2.29 | 2.41 | (.07) | — | (.07) | 19.20 | 14.34 | 731 | .66 | .69 | 37 |
| July 31, 2016 | 17.41 | .19 | (.51) | (.32) | (.23) | — | (.23) | 16.86 | (1.81) | 1,365 | .50 | 1.17 | 41 |
| July 31, 2015 | 16.72 | .20 | 1.31 | 1.51 | (.82) | — | (.82) | 17.41 | 9.22 | 3,088 | .50 | 1.16 | 40g |
| July 31, 2014 | 15.00 | .07 | 2.03 | 2.10 | (.38) | — | (.38) | 16.72 | 14.13 | 2,553 | .50 | .43 | 54g |
| Class R6 | |||||||||||||
| July 31, 2018 | $19.58 | .42 | 1.74 | 2.16 | (.91) | (.13) | (1.04) | $20.70 | 11.15 | $11,848 | .05 | 2.08 | 38 |
| July 31, 2017† | 17.17 | .16 | 2.38 | 2.54 | (.13) | — | (.13) | 19.58 | 14.86* | 7,136 | .05* | .88 * | 37 |
| Class Y | |||||||||||||
| July 31, 2018 | $19.54 | .40 | 1.74 | 2.14 | (.89) | (.13) | (1.02) | $20.66 | 11.07 | $2,370 | .16 | 1.99 | 38 |
| July 31, 2017 | 17.14 | .09 | 2.45 | 2.54 | (.14) | — | (.14) | 19.54 | 14.91 | 3,645 | .16 | .51 | 37 |
| July 31, 2016 | 17.77 | .31 | (.56) | (.25) | (.38) | — | (.38) | 17.14 | (1.31) | 7,514 | — | 1.88 | 41 |
| July 31, 2015 | 17.05 | .27 | 1.34 | 1.61 | (.89) | — | (.89) | 17.77 | 9.69 | 5,574 | — | 1.54 | 40g |
| July 31, 2014 | 15.27 | .18 | 2.05 | 2.23 | (.45) | — | (.45) | 17.05 | 14.73 | 4,450 | — | 1.08 | 54g |
See page 84 for notes to financial highlights.
The accompanying notes are an integral part of these financial statements.
| 68 RetirementReady® Funds | RetirementReady® Funds 69 |
Financial highlights (For a common share outstanding throughout the period)
Putnam RetirementReady 2045 Fund
| INVESTMENT OPERATIONS | LESS DISTRIBUTIONS | RATIOS AND SUPPLEMENTAL DATA | ||||||||||
| Ratio | ||||||||||||
| Net realized | of net investment | |||||||||||
| Net asset value, | and unrealized | Total from | From | Total return | Net assets, | Ratio of expenses | income (loss) | |||||
| beginning | Net investment | gain (loss) | investment | net investment | Total | Net asset value, | at net asset value | end of period | to average | to average | Portfolio | |
| Period ended | of period | income (loss) a,b | on investments | operations | income | distributions | end of period | (%) c | (in thousands) | net assets (%) d,e | net assets (%) b,e | turnover (%) |
| Class A | ||||||||||||
| July 31, 2018 | $21.46 | .40 | 1.80 | 2.20 | (.99) | (.99) | $22.67 | 10.35 | $47,694 | .42 | 1.79 | 43 |
| July 31, 2017 | 18.91 | .07 | 2.59 | 2.66 | (.11) | (.11) | 21.46 | 14.10 | 42,236 | .42 | .35 | 37 |
| July 31, 2016 | 19.58 | .30 | (.55) | (.25) | (.42) | (.42) | 18.91 | (1.23) | 31,243 | .25 | 1.62 | 38 |
| July 31, 2015 | 18.86 | .25 | 1.43 | 1.68 | (.96) | (.96) | 19.58 | 9.14 | 20,065 | .25 | 1.30 | 38g |
| July 31, 2014 | 16.77 | .15 | 2.19 | 2.34 | (.25) | (.25) | 18.86 | 14.01 | 9,373 | .25 | .84 | 55g |
| Class B | ||||||||||||
| July 31, 2018 | $19.51 | .21 | 1.62 | 1.83 | (.84) | (.84) | $20.50 | 9.48 | $636 | 1.17 | 1.05 | 43 |
| July 31, 2017 | 17.22 | (.07) | 2.36 | 2.29 | — | — | 19.51 | 13.30 | 605 | 1.17 | (.41) | 37 |
| July 31, 2016 | 17.89 | .14 | (.50) | (.36) | (.31) | (.31) | 17.22 | (1.97) | 547 | 1.00 | .86 | 38 |
| July 31, 2015 | 17.31 | .12 | 1.29 | 1.41 | (.83) | (.83) | 17.89 | 8.31 | 420 | 1.00 | .67 | 38g |
| July 31, 2014 | 15.43 | .03 | 2.00 | 2.03 | (.15) | (.15) | 17.31 | 13.17 | 274 | 1.00 | .19 | 55g |
| Class C | ||||||||||||
| July 31, 2018 | $19.53 | .22 | 1.62 | 1.84 | (.85) | (.85) | $20.52 | 9.50 | $1,018 | 1.17 | 1.07 | 43 |
| July 31, 2017 | 17.25 | (.07) | 2.35 | 2.28 | — | — | 19.53 | 13.22 | 918 | 1.17 | (.40) | 37 |
| July 31, 2016 | 17.93 | .14 | (.49) | (.35) | (.33) | (.33) | 17.25 | (1.91) | 1,098 | 1.00 | .87 | 38 |
| July 31, 2015 | 17.38 | .11 | 1.31 | 1.42 | (.87) | (.87) | 17.93 | 8.33 | 864 | 1.00 | .59 | 38g |
| July 31, 2014 | 15.51 | .01 | 2.02 | 2.03 | (.16) | (.16) | 17.38 | 13.12 | 401 | 1.00 | .07 | 55g |
| Class M | ||||||||||||
| July 31, 2018 | $20.85 | .36 | 1.63 | 1.99 | (.83) | (.83) | $22.01 | 9.64 | $103 | .92 | 1.68 | 43 |
| July 31, 2017 | 18.35 | (.04) | 2.55 | 2.51 | (.01) | (.01) | 20.85 | 13.69 | 124 | .92 | (.22) | 37 |
| July 31, 2016 | 19.00 | .22 | (.55) | (.33) | (.32) | (.32) | 18.35 | (1.69) | 167 | .75 | 1.24 | 38 |
| July 31, 2015 | 18.36 | .17 | 1.37 | 1.54 | (.90) | (.90) | 19.00 | 8.56 | 161 | .75 | .89 | 38g |
| July 31, 2014 | 16.34 | (.04) | 2.23 | 2.19 | (.17) | (.17) | 18.36 | 13.43 | 128 | .75 | (.23) | 55g |
| Class R | ||||||||||||
| July 31, 2018 | $22.04 | .35 | 1.85 | 2.20 | (.92) | (.92) | $23.32 | 10.05 | $1,120 | .67 | 1.53 | 43 |
| July 31, 2017 | 19.41 | .07 | 2.61 | 2.68 | (.05) | (.05) | 22.04 | 13.85 | 1,169 | .67 | .33 | 37 |
| July 31, 2016 | 20.00 | .25 | (.55) | (.30) | (.29) | (.29) | 19.41 | (1.46) | 1,573 | .50 | 1.35 | 38 |
| July 31, 2015 | 19.25 | .25 | 1.41 | 1.66 | (.91) | (.91) | 20.00 | 8.83 | 3,175 | .50 | 1.26 | 38g |
| July 31, 2014 | 17.13 | .12 | 2.22 | 2.34 | (.22) | (.22) | 19.25 | 13.72 | 2,784 | .50 | .65 | 55g |
| Class R6 | ||||||||||||
| July 31, 2018 | $25.76 | .58 | 2.16 | 2.74 | (1.06) | (1.06) | $27.44 | 10.75 | $10,434 | .05 | 2.17 | 43 |
| July 31, 2017† | 22.65 | .19 | 3.04 | 3.23 | (.12) | (.12) | 25.76 | 14.32* | 7,355 | .05* | .77* | 37 |
| Class Y | ||||||||||||
| July 31, 2018 | $25.72 | .51 | 2.19 | 2.70 | (1.04) | (1.04) | $27.38 | 10.58 | $8,609 | .17 | 1.89 | 43 |
| July 31, 2017 | 22.61 | .10 | 3.15 | 3.25 | (.14) | (.14) | 25.72 | 14.42 | 5,797 | .17 | .43 | 37 |
| July 31, 2016 | 23.30 | .42 | (.66) | (.24) | (.45) | (.45) | 22.61 | (.95) | 9,802 | — | 1.95 | 38 |
| July 31, 2015 | 22.25 | .40 | 1.65 | 2.05 | (1.00) | (1.00) | 23.30 | 9.41 | 6,556 | — | 1.73 | 38g |
| July 31, 2014 | 19.74 | .27 | 2.53 | 2.80 | (.29) | (.29) | 22.25 | 14.25 | 5,544 | — | 1.25 | 55g |
See page 84 for notes to financial highlights.
The accompanying notes are an integral part of these financial statements.
| 70 RetirementReady® Funds | RetirementReady® Funds 71 |
Financial highlights (For a common share outstanding throughout the period)
Putnam RetirementReady 2040 Fund
| INVESTMENT OPERATIONS | LESS DISTRIBUTIONS | RATIOS AND SUPPLEMENTAL DATA | |||||||||||
| Ratio of net | |||||||||||||
| Ratio | investment | ||||||||||||
| Net asset | Net realized | From | of expenses | income (loss) | |||||||||
| value, | and unrealized | Total from | net | From | Net asset | Total return | Net assets, | to average | to average | Portfolio | |||
| beginning | Net investment | gain (loss) | investment | investment | net realized gain | Total | value, end | at net asset | end of period | net assets | net assets | turnover | |
| Period ended | of period | income (loss) a,b | on investments | operations | income | on investments | distributions | of period | value (%) c | (in thousands) | (%) d,e | (%) b,e | (%) |
| Class A | |||||||||||||
| July 31, 2018 | $23.21 | .42 | 1.73 | 2.15 | (1.10) | (.02) | (1.12) | $24.24 | 9.36 | $126,350 | .39 | 1.77 | 39 |
| July 31, 2017 | 20.58 | .04 | 2.66 | 2.70 | (.07) | — | (.07) | 23.21 | 13.13 | 119,021 | .39 | .20 | 39 |
| July 31, 2016 | 21.26 | .38 | (.57) | (.19) | (.49) | — | (.49) | 20.58 | (.83) | 84,164 | .25 | 1.90 | 48 |
| July 31, 2015 | 20.51 | .28 | 1.46 | 1.74 | (.99) | — | (.99) | 21.26 | 8.65 | 49,628 | .25 | 1.34 | 51g |
| July 31, 2014 | 18.34 | .21 | 2.24 | 2.45 | (.28) | — | (.28) | 20.51 | 13.42 | 12,384 | .25 | 1.04 | 47g |
| Class B | |||||||||||||
| July 31, 2018 | $21.35 | .23 | 1.58 | 1.81 | (.94) | (.02) | (.96) | $22.20 | 8.53 | $672 | 1.14 | 1.05 | 39 |
| July 31, 2017 | 19.02 | (.11) | 2.44 | 2.33 | — | — | — | 21.35 | 12.25 | 735 | 1.14 | (.56) | 39 |
| July 31, 2016 | 19.69 | .23 | (.55) | (.32) | (.35) | — | (.35) | 19.02 | (1.59) | 764 | 1.00 | 1.23 | 48 |
| July 31, 2015 | 19.01 | .16 | 1.32 | 1.48 | (.80) | — | (.80) | 19.69 | 7.92 | 666 | 1.00 | .82 | 51g |
| July 31, 2014 | 17.04 | .07 | 2.06 | 2.13 | (.16) | — | (.16) | 19.01 | 12.52 | 698 | 1.00 | .40 | 47g |
| Class C | |||||||||||||
| July 31, 2018 | $21.06 | .22 | 1.57 | 1.79 | (.95) | (.02) | (.97) | $21.88 | 8.58 | $993 | 1.14 | 1.02 | 39 |
| July 31, 2017 | 18.76 | (.11) | 2.41 | 2.30 | — | — | — | 21.06 | 12.26 | 985 | 1.14 | (.54) | 39 |
| July 31, 2016 | 19.44 | .22 | (.55) | (.33) | (.35) | — | (.35) | 18.76 | (1.62) | 826 | 1.00 | 1.20 | 48 |
| July 31, 2015 | 18.83 | .15 | 1.31 | 1.46 | (.85) | — | (.85) | 19.44 | 7.91 | 805 | 1.00 | .78 | 51g |
| July 31, 2014 | 16.92 | .04 | 2.08 | 2.12 | (.21) | — | (.21) | 18.83 | 12.55 | 632 | 1.00 | .23 | 47g |
| Class M | |||||||||||||
| July 31, 2018 | $21.78 | .35 | 1.55 | 1.90 | (1.07) | (.02) | (1.09) | $22.59 | 8.80 | $510 | .89 | 1.56 | 39 |
| July 31, 2017 | 19.35 | (.07) | 2.50 | 2.43 | — | — | — | 21.78 | 12.56 | 282 | .89 | (.34) | 39 |
| July 31, 2016 | 20.02 | .21 | (.49) | (.28) | (.39) | — | (.39) | 19.35 | (1.35) | 160 | .75 | 1.10 | 48 |
| July 31, 2015 | 19.37 | .22 | 1.33 | 1.55 | (.90) | — | (.90) | 20.02 | 8.16 | 114 | .75 | 1.11 | 51g |
| July 31, 2014 | 17.36 | .09 | 2.13 | 2.22 | (.21) | — | (.21) | 19.37 | 12.84 | 78 | .75 | .50 | 47g |
| Class R | |||||||||||||
| July 31, 2018 | $23.95 | .59 | 1.57 | 2.16 | (1.00) | (.02) | (1.02) | $25.09 | 9.09 | $212 | .64 | 2.38 | 39 |
| July 31, 2017 | 21.23 | .01 | 2.72 | 2.73 | (.01) | — | (.01) | 23.95 | 12.85 | 1,673 | .64 | .08 | 39 |
| July 31, 2016 | 21.80 | .28 | (.54) | (.26) | (.31) | — | (.31) | 21.23 | (1.13) | 2,034 | .50 | 1.38 | 48 |
| July 31, 2015 | 20.98 | .29 | 1.45 | 1.74 | (.92) | — | (.92) | 21.80 | 8.45 | 4,726 | .50 | 1.35 | 51g |
| July 31, 2014 | 18.76 | .16 | 2.30 | 2.46 | (.24) | — | (.24) | 20.98 | 13.13 | 3,894 | .50 | .79 | 47g |
| Class R6 | |||||||||||||
| July 31, 2018 | $27.29 | .59 | 2.05 | 2.64 | (1.18) | (.02) | (1.20) | $28.73 | 9.75 | $22,335 | .05 | 2.10 | 39 |
| July 31, 2017† | 24.17 | .14 | 3.06 | 3.20 | (.08) | — | (.08) | 27.29 | 13.28* | 12,731 | .05* | .56* | 39 |
| Class Y | |||||||||||||
| July 31, 2018 | $27.26 | .61 | 1.99 | 2.60 | (1.16) | (.02) | (1.18) | $28.68 | 9.61 | $4,063 | .14 | 2.16 | 39 |
| July 31, 2017 | 24.13 | .08 | 3.15 | 3.23 | (.10) | — | (.10) | 27.26 | 13.40 | 7,058 | .14 | .33 | 39 |
| July 31, 2016 | 24.82 | .52 | (.69) | (.17) | (.52) | — | (.52) | 24.13 | (.60) | 13,806 | — | 2.23 | 48 |
| July 31, 2015 | 23.75 | .44 | 1.65 | 2.09 | (1.02) | — | (1.02) | 24.82 | 8.96 | 9,215 | — | 1.79 | 51g |
| July 31, 2014 | 21.18 | .32 | 2.58 | 2.90 | (.33) | — | (.33) | 23.75 | 13.74 | 7,284 | — | 1.40 | 47g |
See page 84 for notes to financial highlights.
The accompanying notes are an integral part of these financial statements.
| 72 RetirementReady® Funds | RetirementReady® Funds 73 |
Financial highlights (For a common share outstanding throughout the period)
Putnam RetirementReady 2035 Fund
| INVESTMENT OPERATIONS | LESS DISTRIBUTIONS | RATIOS AND SUPPLEMENTAL DATA | ||||||||||
| Ratio | ||||||||||||
| Net realized | of net investment | |||||||||||
| Net asset value, | and unrealized | Total from | From | Total return | Net assets, | Ratio of expenses | income (loss) | |||||
| beginning | Net investment | gain (loss) | investment | net investment | Total | Net asset value, | at net asset value | end of period | to average | to average | Portfolio | |
| Period ended | of period | income (loss) a,b | on investments | operations | income | distributions | end of period | (%) c | (in thousands) | net assets (%) d,e | net assets (%) b,e | turnover (%) |
| Class A | ||||||||||||
| July 31, 2018 | $23.10 | .41 | 1.41 | 1.82 | (.84) | (.84) | $24.08 | 7.94 | $86,367 | .41 | 1.73 | 43 |
| July 31, 2017 | 20.85 | .06 | 2.34 | 2.40 | (.15) | (.15) | 23.10 | 11.60 | 76,081 | .41 | .25 | 37 |
| July 31, 2016 | 21.53 | .45 | (.59) | (.14) | (.54) | (.54) | 20.85 | (.54) | 51,869 | .25 | 2.20 | 38 |
| July 31, 2015 | 20.66 | .31 | 1.33 | 1.64 | (.77) | (.77) | 21.53 | 8.07 | 37,097 | .25 | 1.45 | 31g |
| July 31, 2014 | 18.55 | .24 | 2.03 | 2.27 | (.16) | (.16) | 20.66 | 12.25 | 17,699 | .25 | 1.21 | 45g |
| Class B | ||||||||||||
| July 31, 2018 | $21.21 | .23 | 1.28 | 1.51 | (.65) | (.65) | $22.07 | 7.13 | $767 | 1.16 | 1.04 | 43 |
| July 31, 2017 | 19.15 | (.10) | 2.16 | 2.06 | — | — | 21.21 | 10.76 | 827 | 1.16 | (.49) | 37 |
| July 31, 2016 | 19.81 | .28 | (.55) | (.27) | (.39) | (.39) | 19.15 | (1.28) | 1,167 | 1.00 | 1.49 | 38 |
| July 31, 2015 | 19.07 | .19 | 1.18 | 1.37 | (.63) | (.63) | 19.81 | 7.28 | 1,235 | 1.00 | .95 | 31g |
| July 31, 2014 | 17.17 | .10 | 1.85 | 1.95 | (.05) | (.05) | 19.07 | 11.39 | 1,061 | 1.00 | .55 | 45g |
| Class C | ||||||||||||
| July 31, 2018 | $21.12 | .21 | 1.30 | 1.51 | (.67) | (.67) | $21.96 | 7.18 | $1,496 | 1.16 | .98 | 43 |
| July 31, 2017 | 19.08 | (.10) | 2.15 | 2.05 | (.01) | (.01) | 21.12 | 10.73 | 1,625 | 1.16 | (.50) | 37 |
| July 31, 2016 | 19.78 | .26 | (.53) | (.27) | (.43) | (.43) | 19.08 | (1.28) | 1,549 | 1.00 | 1.40 | 38 |
| July 31, 2015 | 19.08 | .18 | 1.19 | 1.37 | (.67) | (.67) | 19.78 | 7.30 | 1,147 | 1.00 | .91 | 31g |
| July 31, 2014 | 17.17 | .09 | 1.87 | 1.96 | (.05) | (.05) | 19.08 | 11.44 | 655 | 1.00 | .51 | 45g |
| Class M | ||||||||||||
| July 31, 2018 | $22.23 | .29 | 1.35 | 1.64 | (.73) | (.73) | $23.14 | 7.43 | $572 | .91 | 1.26 | 43 |
| July 31, 2017 | 20.07 | (.05) | 2.26 | 2.21 | (.05) | (.05) | 22.23 | 11.04 | 529 | .91 | (.25) | 37 |
| July 31, 2016 | 20.74 | .34 | (.57) | (.23) | (.44) | (.44) | 20.07 | (1.05) | 473 | .75 | 1.72 | 38 |
| July 31, 2015 | 19.92 | .16 | 1.32 | 1.48 | (.66) | (.66) | 20.74 | 7.54 | 460 | .75 | .79 | 31g |
| July 31, 2014 | 17.93 | .14 | 1.96 | 2.10 | (.11) | (.11) | 19.92 | 11.70 | 298 | .75 | .73 | 45g |
| Class R | ||||||||||||
| July 31, 2018 | $22.26 | .46 | 1.24 | 1.70 | (.80) | (.80) | $23.16 | 7.69 | $797 | .66 | 2.00 | 43 |
| July 31, 2017 | 20.10 | .02 | 2.24 | 2.26 | (.10) | (.10) | 22.26 | 11.30 | 1,369 | .66 | .11 | 37 |
| July 31, 2016 | 20.67 | .32 | (.50) | (.18) | (.39) | (.39) | 20.10 | (.80) | 2,000 | .50 | 1.66 | 38 |
| July 31, 2015 | 19.85 | .30 | 1.24 | 1.54 | (.72) | (.72) | 20.67 | 7.86 | 4,657 | .50 | 1.49 | 31g |
| July 31, 2014 | 17.84 | .19 | 1.94 | 2.13 | (.12) | (.12) | 19.85 | 11.96 | 4,334 | .50 | 1.01 | 45g |
| Class R6 | ||||||||||||
| July 31, 2018 | $27.03 | .60 | 1.64 | 2.24 | (.92) | (.92) | $28.35 | 8.34 | $21,366 | .05 | 2.14 | 43 |
| July 31, 2017† | 24.34 | .16 | 2.70 | 2.86 | (.17) | (.17) | 27.03 | 11.81* | 15,359 | .05* | .63* | 37 |
| Class Y | ||||||||||||
| July 31, 2018 | $26.98 | .55 | 1.67 | 2.22 | (.90) | (.90) | $28.30 | 8.26 | $13,086 | .16 | 1.97 | 43 |
| July 31, 2017 | 24.30 | .10 | 2.76 | 2.86 | (.18) | (.18) | 26.98 | 11.85 | 9,005 | .16 | .38 | 37 |
| July 31, 2016 | 24.99 | .56 | (.66) | (.10) | (.59) | (.59) | 24.30 | (.33) | 17,298 | — | 2.40 | 38 |
| July 31, 2015 | 23.84 | .46 | 1.50 | 1.96 | (.81) | (.81) | 24.99 | 8.35 | 12,853 | — | 1.88 | 31g |
| July 31, 2014 | 21.37 | .37 | 2.30 | 2.67 | (.20) | (.20) | 23.84 | 12.55 | 11,300 | — | 1.64 | 45g |
See page 84 for notes to financial highlights.
The accompanying notes are an integral part of these financial statements.
| 74 RetirementReady® Funds | RetirementReady® Funds 75 |
Financial highlights (For a common share outstanding throughout the period)
Putnam RetirementReady 2030 Fund
| INVESTMENT OPERATIONS | LESS DISTRIBUTIONS | RATIOS AND SUPPLEMENTAL DATA | ||||||||||
| Ratio | ||||||||||||
| Net realized | of net investment | |||||||||||
| Net asset value, | and unrealized | Total from | From | Total return | Net assets, | Ratio of expenses | income (loss) | |||||
| beginning | Net investment | gain (loss) | investment | net investment | Total | Net asset value, | at net asset value | end of period | to average | to average | Portfolio | |
| Period ended | of period | income (loss) a,b | on investments | operations | income | distributions | end of period | (%) c | (in thousands) | net assets (%) d,e | net assets (%) b,e | turnover (%) |
| Class A | ||||||||||||
| July 31, 2018 | $22.51 | .41 | 1.02 | 1.43 | (.72) | (.72) | $23.22 | 6.38 | $164,247 | .39 | 1.80 | 46 |
| July 31, 2017 | 20.68 | .16 | 1.82 | 1.98 | (.15) | (.15) | 22.51 | 9.61 | 169,766 | .39 | .73 | 41 |
| July 31, 2016 | 21.38 | .47 | (.59) | (.12) | (.58) | (.58) | 20.68 | (.45) | 122,277 | .25 | 2.35 | 47 |
| July 31, 2015 | 20.35 | .29 | 1.23 | 1.52 | (.49) | (.49) | 21.38 | 7.53 | 72,342 | .25 | 1.36 | 40g |
| July 31, 2014 | 18.52 | .26 | 1.73 | 1.99 | (.16) | (.16) | 20.35 | 10.75 | 23,180 | .25 | 1.32 | 44g |
| Class B | ||||||||||||
| July 31, 2018 | $21.36 | .26 | .95 | 1.21 | (.55) | (.55) | $22.02 | 5.66 | $1,025 | 1.14 | 1.17 | 46 |
| July 31, 2017 | 19.64 | —f | 1.72 | 1.72 | — | — | 21.36 | 8.76 | 1,299 | 1.14 | —h | 41 |
| July 31, 2016 | 20.32 | .33 | (.58) | (.25) | (.43) | (.43) | 19.64 | (1.18) | 1,251 | 1.00 | 1.74 | 47 |
| July 31, 2015 | 19.35 | .16 | 1.13 | 1.29 | (.32) | (.32) | 20.32 | 6.71 | 1,325 | 1.00 | .80 | 40g |
| July 31, 2014 | 17.62 | .11 | 1.64 | 1.75 | (.02) | (.02) | 19.35 | 9.94 | 1,231 | 1.00 | .58 | 44g |
| Class C | ||||||||||||
| July 31, 2018 | $21.32 | .25 | .95 | 1.20 | (.58) | (.58) | $21.94 | 5.62 | $1,454 | 1.14 | 1.16 | 46 |
| July 31, 2017 | 19.60 | —f | 1.73 | 1.73 | (.01) | (.01) | 21.32 | 8.81 | 1,544 | 1.14 | .01 | 41 |
| July 31, 2016 | 20.29 | .31 | (.56) | (.25) | (.44) | (.44) | 19.60 | (1.19) | 1,515 | 1.00 | 1.61 | 47 |
| July 31, 2015 | 19.36 | .17 | 1.11 | 1.28 | (.35) | (.35) | 20.29 | 6.68 | 1,313 | 1.00 | .84 | 40g |
| July 31, 2014 | 17.64 | .10 | 1.66 | 1.76 | (.04) | (.04) | 19.36 | 9.98 | 1,060 | 1.00 | .51 | 44g |
| Class M | ||||||||||||
| July 31, 2018 | $21.88 | .26 | 1.03 | 1.29 | (.62) | (.62) | $22.55 | 5.91 | $363 | .89 | 1.16 | 46 |
| July 31, 2017 | 20.06 | .03 | 1.79 | 1.82 | — | — | 21.88 | 9.07 | 259 | .89 | .15 | 41 |
| July 31, 2016 | 20.75 | .38 | (.59) | (.21) | (.48) | (.48) | 20.06 | (.96) | 273 | .75 | 1.93 | 47 |
| July 31, 2015 | 19.75 | .20 | 1.17 | 1.37 | (.37) | (.37) | 20.75 | 6.99 | 248 | .75 | .97 | 40g |
| July 31, 2014 | 18.03 | .19 | 1.65 | 1.84 | (.12) | (.12) | 19.75 | 10.24 | 222 | .75 | .98 | 44g |
| Class R | ||||||||||||
| July 31, 2018 | $21.39 | .44 | .86 | 1.30 | (.67) | (.67) | $22.02 | 6.12 | $570 | .64 | 2.02 | 46 |
| July 31, 2017 | 19.64 | .11 | 1.73 | 1.84 | (.09) | (.09) | 21.39 | 9.39 | 2,543 | .64 | .53 | 41 |
| July 31, 2016 | 20.23 | .37 | (.53) | (.16) | (.43) | (.43) | 19.64 | (.71) | 2,916 | .50 | 1.94 | 47 |
| July 31, 2015 | 19.28 | .25 | 1.13 | 1.38 | (.43) | (.43) | 20.23 | 7.22 | 8,425 | .50 | 1.26 | 40g |
| July 31, 2014 | 17.56 | .20 | 1.64 | 1.84 | (.12) | (.12) | 19.28 | 10.51 | 7,296 | .50 | 1.07 | 44g |
| Class R6 | ||||||||||||
| July 31, 2018 | $25.84 | .57 | 1.17 | 1.74 | (.80) | (.80) | $26.78 | 6.75 | $21,927 | .05 | 2.16 | 46 |
| July 31, 2017† | 23.67 | .25 | 2.08 | 2.33 | (.16) | (.16) | 25.84 | 9.90* | 13,797 | .05* | 1.02* | 41 |
| Class Y | ||||||||||||
| July 31, 2018 | $25.80 | .54 | 1.18 | 1.72 | (.78) | (.78) | $26.74 | 6.70 | $7,307 | .14 | 2.03 | 46 |
| July 31, 2017 | 23.65 | .21 | 2.11 | 2.32 | (.17) | (.17) | 25.80 | 9.88 | 6,806 | .14 | .86 | 41 |
| July 31, 2016 | 24.34 | .62 | (.69) | (.07) | (.62) | (.62) | 23.65 | (.19) | 15,306 | — | 2.71 | 47 |
| July 31, 2015 | 23.09 | .43 | 1.34 | 1.77 | (.52) | (.52) | 24.34 | 7.76 | 13,241 | — | 1.79 | 40g |
| July 31, 2014 | 20.98 | .38 | 1.93 | 2.31 | (.20) | (.20) | 23.09 | 11.05 | 11,725 | — | 1.70 | 44g |
See page 84 for notes to financial highlights.
The accompanying notes are an integral part of these financial statements.
| 76 RetirementReady® Funds | RetirementReady® Funds 77 |
Financial highlights (For a common share outstanding throughout the period)
Putnam RetirementReady 2025 Fund
| INVESTMENT OPERATIONS | LESS DISTRIBUTIONS | RATIOS AND SUPPLEMENTAL DATA | ||||||||||
| Ratio | ||||||||||||
| Net realized | of net investment | |||||||||||
| Net asset value, | and unrealized | Total from | From | Total return | Net assets, | Ratio of expenses | income (loss) | |||||
| beginning | Net investment | gain (loss) | investment | net investment | Total | Net asset value, | at net asset value | end of period | to average | to average | Portfolio | |
| Period ended | of period | income (loss) a,b | on investments | operations | income | distributions | end of period | (%) c | (in thousands) | net assets (%) d,e | net assets (%) b,e | turnover (%) |
| Class A | ||||||||||||
| July 31, 2018 | $22.36 | .45 | .59 | 1.04 | (.49) | (.49) | $22.91 | 4.64 | $93,296 | .41 | 1.99 | 52 |
| July 31, 2017 | 21.08 | .22 | 1.36 | 1.58 | (.30) | (.30) | 22.36 | 7.60 | 80,908 | .41 | 1.02 | 37 |
| July 31, 2016 | 21.73 | .55 | (.65) | (.10) | (.55) | (.55) | 21.08 | (.40) | 60,363 | .25 | 2.66 | 42 |
| July 31, 2015 | 20.62 | .31 | 1.07 | 1.38 | (.27) | (.27) | 21.73 | 6.72 | 40,668 | .25 | 1.44 | 30g |
| July 31, 2014 | 19.06 | .29 | 1.45 | 1.74 | (.18) | (.18) | 20.62 | 9.16 | 27,543 | .25 | 1.44 | 41g |
| Class B | ||||||||||||
| July 31, 2018 | $20.84 | .28 | .53 | .81 | (.33) | (.33) | $21.32 | 3.90 | $998 | 1.16 | 1.31 | 52 |
| July 31, 2017 | 19.66 | .05 | 1.28 | 1.33 | (.15) | (.15) | 20.84 | 6.81 | 1,200 | 1.16 | .26 | 37 |
| July 31, 2016 | 20.29 | .37 | (.62) | (.25) | (.38) | (.38) | 19.66 | (1.17) | 1,082 | 1.00 | 1.90 | 42 |
| July 31, 2015 | 19.28 | .14 | 1.00 | 1.14 | (.13) | (.13) | 20.29 | 5.91 | 1,128 | 1.00 | .72 | 30g |
| July 31, 2014 | 17.84 | .13 | 1.36 | 1.49 | (.05) | (.05) | 19.28 | 8.35 | 982 | 1.00 | .71 | 41g |
| Class C | ||||||||||||
| July 31, 2018 | $20.78 | .25 | .56 | .81 | (.33) | (.33) | $21.26 | 3.89 | $2,175 | 1.16 | 1.19 | 52 |
| July 31, 2017 | 19.62 | .06 | 1.27 | 1.33 | (.17) | (.17) | 20.78 | 6.84 | 1,972 | 1.16 | .29 | 37 |
| July 31, 2016 | 20.27 | .36 | (.61) | (.25) | (.40) | (.40) | 19.62 | (1.17) | 1,851 | 1.00 | 1.86 | 42 |
| July 31, 2015 | 19.27 | .14 | .99 | 1.13 | (.13) | (.13) | 20.27 | 5.90 | 1,532 | 1.00 | .68 | 30g |
| July 31, 2014 | 17.87 | .13 | 1.36 | 1.49 | (.09) | (.09) | 19.27 | 8.32 | 1,244 | 1.00 | .67 | 41g |
| Class M | ||||||||||||
| July 31, 2018 | $21.13 | .31 | .56 | .87 | (.32) | (.32) | $21.68 | 4.14 | $222 | .91 | 1.45 | 52 |
| July 31, 2017 | 19.96 | .11 | 1.30 | 1.41 | (.24) | (.24) | 21.13 | 7.11 | 262 | .91 | .55 | 37 |
| July 31, 2016 | 20.60 | .41 | (.61) | (.20) | (.44) | (.44) | 19.96 | (.92) | 240 | .75 | 2.08 | 42 |
| July 31, 2015 | 19.57 | .20 | 1.00 | 1.20 | (.17) | (.17) | 20.60 | 6.16 | 205 | .75 | 1.00 | 30g |
| July 31, 2014 | 18.09 | .17 | 1.38 | 1.55 | (.07) | (.07) | 19.57 | 8.57 | 188 | .75 | .88 | 41g |
| Class R | ||||||||||||
| July 31, 2018 | $20.97 | .45 | .47 | .92 | (.45) | (.45) | $21.44 | 4.38 | $1,045 | .66 | 2.13 | 52 |
| July 31, 2017 | 19.78 | .16 | 1.29 | 1.45 | (.26) | (.26) | 20.97 | 7.39 | 2,734 | .66 | .79 | 37 |
| July 31, 2016 | 20.29 | .36 | (.51) | (.15) | (.36) | (.36) | 19.78 | (.69) | 2,458 | .50 | 1.87 | 42 |
| July 31, 2015 | 19.28 | .23 | 1.00 | 1.23 | (.22) | (.22) | 20.29 | 6.42 | 6,829 | .50 | 1.18 | 30g |
| July 31, 2014 | 17.85 | .22 | 1.36 | 1.58 | (.15) | (.15) | 19.28 | 8.88 | 5,442 | .50 | 1.19 | 41g |
| Class R6 | ||||||||||||
| July 31, 2018 | $22.55 | .54 | .58 | 1.12 | (.56) | (.56) | $23.11 | 5.00 | $18,185 | .05 | 2.36 | 52 |
| July 31, 2017† | 21.20 | .28 | 1.39 | 1.67 | (.32) | (.32) | 22.55 | 7.98* | 11,072 | .05* | 1.30 * | 37 |
| Class Y | ||||||||||||
| July 31, 2018 | $22.50 | .51 | .59 | 1.10 | (.54) | (.54) | $23.06 | 4.91 | $13,079 | .16 | 2.23 | 52 |
| July 31, 2017 | 21.19 | .27 | 1.38 | 1.65 | (.34) | (.34) | 22.50 | 7.90 | 9,036 | .16 | 1.22 | 37 |
| July 31, 2016 | 21.83 | .61 | (.66) | (.05) | (.59) | (.59) | 21.19 | (.15) | 17,559 | — | 2.91 | 42 |
| July 31, 2015 | 20.72 | .37 | 1.05 | 1.42 | (.31) | (.31) | 21.83 | 6.92 | 12,152 | — | 1.70 | 30g |
| July 31, 2014 | 19.15 | .38 | 1.42 | 1.80 | (.23) | (.23) | 20.72 | 9.44 | 9,870 | — | 1.91 | 41g |
See page 84 for notes to financial highlights.
The accompanying notes are an integral part of these financial statements.
| 78 RetirementReady® Funds | RetirementReady® Funds 79 |
Financial highlights (For a common share outstanding throughout the period)
Putnam RetirementReady 2020 Fund
| INVESTMENT OPERATIONS | LESS DISTRIBUTIONS | RATIOS AND SUPPLEMENTAL DATA | ||||||||||
| Ratio | ||||||||||||
| Net realized | of net investment | |||||||||||
| Net asset value, | and unrealized | Total from | From | Total return | Net assets, | Ratio of expenses | income (loss) | |||||
| beginning | Net investment | gain (loss) | investment | net investment | Total | Net asset value, | at net asset value | end of period | to average | to average | Portfolio | |
| Period ended | of period | income (loss) a,b | on investments | operations | income | distributions | end of period | (%) c | (in thousands) | net assets (%) d,e | net assets (%) b,e | turnover (%) |
| Class A | ||||||||||||
| July 31, 2018 | $19.47 | .45 | .16 | .61 | (.45) | (.45) | $19.63 | 3.14 | $182,670 | .38 | 2.27 | 69 |
| July 31, 2017 | 18.55 | .20 | .91 | 1.11 | (.19) | (.19) | 19.47 | 6.05 | 186,299 | .37 | 1.05 | 49 |
| July 31, 2016 | 19.18 | .52 | (.61) | (.09) | (.54) | (.54) | 18.55 | (.38) | 127,482 | .25 | 2.82 | 47 |
| July 31, 2015 | 18.40 | .27 | .73 | 1.00 | (.22) | (.22) | 19.18 | 5.44 | 71,290 | .25 | 1.43 | 45g |
| July 31, 2014 | 17.31 | .29 | .98 | 1.27 | (.18) | (.18) | 18.40 | 7.37 | 25,336 | .25 | 1.60 | 42g |
| Class B | ||||||||||||
| July 31, 2018 | $18.73 | .30 | .15 | .45 | (.29) | (.29) | $18.89 | 2.38 | $829 | 1.13 | 1.56 | 69 |
| July 31, 2017 | 17.85 | .06 | .87 | .93 | (.05) | (.05) | 18.73 | 5.24 | 1,106 | 1.12 | .34 | 49 |
| July 31, 2016 | 18.45 | .38 | (.59) | (.21) | (.39) | (.39) | 17.85 | (1.11) | 1,151 | 1.00 | 2.15 | 47 |
| July 31, 2015 | 17.68 | .14 | .68 | .82 | (.05) | (.05) | 18.45 | 4.65 | 1,123 | 1.00 | .80 | 45g |
| July 31, 2014 | 16.66 | .15 | .94 | 1.09 | (.07) | (.07) | 17.68 | 6.56 | 1,380 | 1.00 | .84 | 42g |
| Class C | ||||||||||||
| July 31, 2018 | $18.71 | .27 | .19 | .46 | (.30) | (.30) | $18.87 | 2.43 | $2,197 | 1.13 | 1.41 | 69 |
| July 31, 2017 | 17.84 | .07 | .86 | .93 | (.06) | (.06) | 18.71 | 5.25 | 2,063 | 1.12 | .37 | 49 |
| July 31, 2016 | 18.46 | .38 | (.59) | (.21) | (.41) | (.41) | 17.84 | (1.12) | 2,092 | 1.00 | 2.15 | 47 |
| July 31, 2015 | 17.74 | .15 | .67 | .82 | (.10) | (.10) | 18.46 | 4.63 | 1,842 | 1.00 | .80 | 45g |
| July 31, 2014 | 16.71 | .15 | .95 | 1.10 | (.07) | (.07) | 17.74 | 6.62 | 1,587 | 1.00 | .89 | 42g |
| Class M | ||||||||||||
| July 31, 2018 | $19.10 | .32 | .19 | .51 | (.30) | (.30) | $19.31 | 2.64 | $163 | .88 | 1.67 | 69 |
| July 31, 2017 | 18.21 | .10 | .90 | 1.00 | (.11) | (.11) | 19.10 | 5.51 | 258 | .87 | .55 | 49 |
| July 31, 2016 | 18.82 | .42 | (.60) | (.18) | (.43) | (.43) | 18.21 | (.89) | 180 | .75 | 2.33 | 47 |
| July 31, 2015 | 18.05 | .19 | .70 | .89 | (.12) | (.12) | 18.82 | 4.93 | 180 | .75 | 1.02 | 45g |
| July 31, 2014 | 16.99 | .20 | .96 | 1.16 | (.10) | (.10) | 18.05 | 6.81 | 154 | .75 | 1.12 | 42g |
| Class R | ||||||||||||
| July 31, 2018 | $18.77 | .43 | .12 | .55 | (.42) | (.42) | $18.90 | 2.90 | $2,324 | .63 | 2.28 | 69 |
| July 31, 2017 | 17.88 | .15 | .88 | 1.03 | (.14) | (.14) | 18.77 | 5.79 | 4,442 | .62 | .80 | 49 |
| July 31, 2016 | 18.44 | .44 | (.56) | (.12) | (.44) | (.44) | 17.88 | (.60) | 3,269 | .50 | 2.47 | 47 |
| July 31, 2015 | 17.69 | .23 | .68 | .91 | (.16) | (.16) | 18.44 | 5.17 | 5,716 | .50 | 1.29 | 45g |
| July 31, 2014 | 16.67 | .23 | .95 | 1.18 | (.16) | (.16) | 17.69 | 7.09 | 5,348 | .50 | 1.35 | 42g |
| Class R6 | ||||||||||||
| July 31, 2018 | $21.90 | .66 | .11 | .77 | (.52) | (.52) | $22.15 | 3.50 | $9,691 | .05 | 2.97 | 69 |
| July 31, 2017† | 20.80 | .30 | 1.01 | 1.31 | (.21) | (.21) | 21.90 | 6.34* | 3,838 | .05* | 1.41* | 49 |
| Class Y | ||||||||||||
| July 31, 2018 | $21.88 | .64 | .12 | .76 | (.51) | (.51) | $22.13 | 3.46 | $1,737 | .13 | 2.89 | 69 |
| July 31, 2017 | 20.79 | .23 | 1.07 | 1.30 | (.21) | (.21) | 21.88 | 6.32 | 1,673 | .12 | 1.11 | 49 |
| July 31, 2016 | 21.41 | .65 | (.69) | (.04) | (.58) | (.58) | 20.79 | (.13) | 4,982 | — | 3.15 | 47 |
| July 31, 2015 | 20.49 | .37 | .80 | 1.17 | (.25) | (.25) | 21.41 | 5.72 | 5,325 | — | 1.75 | 45g |
| July 31, 2014 | 19.26 | .44 | 1.02 | 1.46 | (.23) | (.23) | 20.49 | 7.60 | 5,125 | — | 2.20 | 42g |
See page 84 for notes to financial highlights.
The accompanying notes are an integral part of these financial statements.
| 80 RetirementReady® Funds | RetirementReady® Funds 81 |
Financial highlights (For a common share outstanding throughout the period)
Putnam Retirement Income Fund Lifestyle 1
| INVESTMENT OPERATIONS | LESS DISTRIBUTIONS | RATIOS AND SUPPLEMENTAL DATA | ||||||||||
| Ratio | ||||||||||||
| Net realized | of net investment | |||||||||||
| Net asset value, | and unrealized | Total from | From | Total return | Net assets, | Ratio of expenses | income (loss) | |||||
| beginning | Net investment | gain (loss) | investment | net investment | Total | Net asset value, | at net asset value | end of period | to average | to average | Portfolio | |
| Period ended | of period | income (loss) a,b | on investments | operations | income | distributions | end of period | (%) c | (in thousands) | net assets (%) d,e | net assets (%) b,e | turnover (%) |
| Class A | ||||||||||||
| July 31, 2018 | $17.65 | .44 | (.02) | .42 | (.45) | (.45) | $17.62 | 2.37 | $92,361 | .39 | 2.47 | 68 |
| July 31, 2017 | 17.02 | .20 | .63 | .83 | (.20) | (.20) | 17.65 | 4.94 | 80,263 | .38 | 1.14 | 39 |
| July 31, 2016 | 17.69 | .64 | (.70) | (.06) | (.61) | (.61) | 17.02 | (.27) | 63,447 | .25 | 3.83 | 33 |
| July 31, 2015 | 17.49 | .30 | .31 | .61 | (.41) | (.41) | 17.69 | 3.52 | 17,655 | .25 | 1.71 | 28g |
| July 31, 2014 | 16.98 | .33 | .52 | .85 | (.34) | (.34) | 17.49 | 5.04 | 15,527 | .25 | 1.90 | 39g |
| Class B | ||||||||||||
| July 31, 2018 | $17.28 | .31 | (.02) | .29 | (.37) | (.37) | $17.20 | 1.64 | $849 | 1.14 | 1.78 | 68 |
| July 31, 2017 | 16.74 | .07 | .61 | .68 | (.14) | (.14) | 17.28 | 4.11 | 981 | 1.13 | .43 | 39 |
| July 31, 2016 | 17.45 | .52 | (.70) | (.18) | (.53) | (.53) | 16.74 | (.99) | 1,094 | 1.00 | 3.11 | 33 |
| July 31, 2015 | 17.32 | .15 | .31 | .46 | (.33) | (.33) | 17.45 | 2.68 | 368 | 1.00 | .88 | 28g |
| July 31, 2014 | 16.86 | .17 | .55 | .72 | (.26) | (.26) | 17.32 | 4.32 | 274 | 1.00 | 1.01 | 39g |
| Class C | ||||||||||||
| July 31, 2018 | $17.33 | .31 | (.03) | .28 | (.37) | (.37) | $17.24 | 1.58 | $1,172 | 1.14 | 1.81 | 68 |
| July 31, 2017 | 16.79 | .07 | .61 | .68 | (.14) | (.14) | 17.33 | 4.09 | 1,681 | 1.13 | .44 | 39 |
| July 31, 2016 | 17.49 | .44 | (.61) | (.17) | (.53) | (.53) | 16.79 | (.93) | 1,852 | 1.00 | 2.63 | 33 |
| July 31, 2015 | 17.36 | .17 | .29 | .46 | (.33) | (.33) | 17.49 | 2.68 | 814 | 1.00 | .98 | 28g |
| July 31, 2014 | 16.91 | .20 | .51 | .71 | (.26) | (.26) | 17.36 | 4.25 | 710 | 1.00 | 1.16 | 39g |
| Class M | ||||||||||||
| July 31, 2018 | $17.69 | .39 | (.01) | .38 | (.40) | (.40) | $17.67 | 2.16 | $562 | .64 | 2.21 | 68 |
| July 31, 2017 | 17.07 | .16 | .62 | .78 | (.16) | (.16) | 17.69 | 4.62 | 506 | .63 | .94 | 39 |
| July 31, 2016 | 17.73 | .52 | (.61) | (.09) | (.57) | (.57) | 17.07 | (.46) | 528 | .50 | 3.05 | 33 |
| July 31, 2015 | 17.54 | .25 | .30 | .55 | (.36) | (.36) | 17.73 | 3.18 | 396 | .50 | 1.42 | 28g |
| July 31, 2014 | 17.02 | .31 | .50 | .81 | (.29) | (.29) | 17.54 | 4.82 | 332 | .50 | 1.77 | 39g |
| Class R | ||||||||||||
| July 31, 2018 | $17.64 | .43 | (.06) | .37 | (.40) | (.40) | $17.61 | 2.10 | $527 | .64 | 2.42 | 68 |
| July 31, 2017 | 17.01 | .19 | .60 | .79 | (.16) | (.16) | 17.64 | 4.70 | 730 | .63 | 1.12 | 39 |
| July 31, 2016 | 17.68 | .61 | (.71) | (.10) | (.57) | (.57) | 17.01 | (.53) | 1,439 | .50 | 3.62 | 33 |
| July 31, 2015 | 17.48 | .24 | .33 | .57 | (.37) | (.37) | 17.68 | 3.26 | 854 | .50 | 1.34 | 28g |
| July 31, 2014 | 16.97 | .30 | .51 | .81 | (.30) | (.30) | 17.48 | 4.78 | 1,069 | .50 | 1.75 | 39g |
| Class R6 | ||||||||||||
| July 31, 2018 | $17.71 | .50 | (.02) | .48 | (.51) | (.51) | $17.68 | 2.71 | $3,842 | .05 | 2.83 | 68 |
| July 31, 2017† | 17.08 | .25 | .63 | .88 | (.25) | (.25) | 17.71 | 5.20* | 3,711 | .05* | 1.42* | 39 |
| Class Y | ||||||||||||
| July 31, 2018 | $17.71 | .48 | (.02) | .46 | (.49) | (.49) | $17.68 | 2.62 | $4,630 | .14 | 2.70 | 68 |
| July 31, 2017 | 17.08 | .27 | .60 | .87 | (.24) | (.24) | 17.71 | 5.17 | 3,519 | .13 | 1.56 | 39 |
| July 31, 2016 | 17.75 | .72 | (.73) | (.01) | (.66) | (.66) | 17.08 | (.02) | 7,602 | — | 4.24 | 33 |
| July 31, 2015 | 17.55 | .34 | .32 | .66 | (.46) | (.46) | 17.75 | 3.78 | 1,460 | — | 1.90 | 28g |
| July 31, 2014 | 17.04 | .68 | .21 | .89 | (.38) | (.38) | 17.55 | 5.28 | 1,203 | — | 3.96 | 39g |
See page 84 for notes to financial highlights.
The accompanying notes are an integral part of these financial statements.
| 82 RetirementReady® Funds | RetirementReady® Funds 83 |
Financial highlights cont.
* Not annualized.
† For the period September 2, 2016 (commencement of operations) to July 31, 2017.
‡ For the period November 30, 2015 (commencement of operations) to July 31, 2016.
a Per share net investment income (loss) has been determined on the basis of the weighted average number of shares outstanding during the period.
b The ratio of net investment income and net investment income per share amounts shown may not correspond with the expected class specific difference due to the timing of income received from the underlying Putnam Funds and the timing of subscriptions/redemption to the class.
c Total return does not reflect the effect of sales charges.
d Expense ratios do not include expenses of the underlying funds.
e Reflects an involuntary contractual expense limitation in effect during the period. As a result of such limitation the expenses for the following periods reflect a reduction of the following based on each fund’s average net assets (Note 2):
| 7/31/18 | 7/31/17 | 7/31/16 | 7/31/15 | 7/31/14 | |
| Putnam RetirementReady 2060 Fund | |||||
| Class A, B, C, M, R, Y | 16.06% | 73.93% | 114.41% | N/A | N/A |
| Class R6 | 16.06% | 60.14% | N/A | N/A | N/A |
| Putnam RetirementReady 2055 Fund | |||||
| Class A, B, C, M, R, Y | 0.44 | 0.88 | 1.13 | 2.09% | 3.14% |
| Class R6 | 0.44 | 0.80 | N/A | N/A | N/A |
| Putnam RetirementReady 2050 Fund | |||||
| Class A, B, C, M, R, Y | 0.18 | 0.27 | 0.28 | 0.46 | 0.45 |
| Class R6 | 0.18 | 0.25 | N/A | N/A | N/A |
| Putnam RetirementReady 2045 Fund | |||||
| Class A, B, C, M, R, Y | 0.18 | 0.25 | 0.26 | 0.36 | 0.45 |
| Class R6 | 0.18 | 0.24 | N/A | N/A | N/A |
| Putnam RetirementReady 2040 Fund | |||||
| Class A, B, C, M, R, Y | 0.12 | 0.13 | 0.14 | 0.23 | 0.35 |
| Class R6 | 0.12 | 0.13 | N/A | N/A | N/A |
| Putnam RetirementReady 2035 Fund | |||||
| Class A, B, C, M, R, Y | 0.11 | 0.17 | 0.17 | 0.22 | 0.27 |
| Class R6 | 0.11 | 0.16 | N/A | N/A | N/A |
| Putnam RetirementReady 2030 Fund | |||||
| Class A, B, C, M, R, Y | 0.08 | 0.11 | 0.11 | 0.17 | 0.23 |
| Class R6 | 0.08 | 0.11 | N/A | N/A | N/A |
| Putnam RetirementReady 2025 Fund | |||||
| Class A, B, C, M, R, Y | 0.11 | 0.16 | 0.15 | 0.20 | 0.23 |
| Class R6 | 0.11 | 0.15 | N/A | N/A | N/A |
| Putnam RetirementReady 2020 Fund | |||||
| Class A, B, C, M, R, Y | 0.09 | 0.13 | 0.11 | 0.18 | 0.25 |
| Class R6 | 0.09 | 0.13 | N/A | N/A | N/A |
| 84 RetirementReady® Funds |
| 7/31/18 | 7/31/17 | 7/31/16 | 7/31/15 | 7/31/14 | |
| Putnam Retirement Income Fund Lifestyle 1 | |||||
| Class A, B, C, M, R, Y | 0.12 | 0.19 | 0.21 | 0.55 | 0.37 |
| Class R6 | 0.12 | 0.17 | N/A | N/A | N/A |
f Amount represents less than $0.01 per share.
g Reflects revision of portfolio turnover rate. The portfolio turnover rates previously reported were the following:
| 7/31/15 | 7/31/14 | |
| Putnam RetirementReady 2055 Fund | 249% | 202% |
| Putnam RetirementReady 2050 Fund | 158 | 100 |
| Putnam RetirementReady 2045 Fund | 116 | 92 |
| Putnam RetirementReady 2040 Fund | 204 | 90 |
| Putnam RetirementReady 2035 Fund | 101 | 79 |
| Putnam RetirementReady 2030 Fund | 157 | 77 |
| Putnam RetirementReady 2025 Fund | 71 | 74 |
| Putnam RetirementReady 2020 Fund | 160 | 75 |
| Putnam Retirement Income Fund Lifestyle 1 | 39 | 98 |
h Amount represents less than 0.01% of average net assets.
The accompanying notes are an integral part of these financial statements.
| RetirementReady® Funds 85 |
Notes to financial statements 7/31/18
Within the following Notes to financial statements, references to “State Street” represent State Street Bank and Trust Company, references to “the SEC” represent the Securities and Exchange Commission and references to “Putnam Management” represent Putnam Investment Management, LLC, the fund’s manager, an indirect wholly-owned subsidiary of Putnam Investments, LLC. Unless otherwise noted, the “reporting period” represents the period from August 1, 2017 through July 31, 2018.
Each of the Putnam RetirementReady® Funds: Putnam RetirementReady 2060 Fund, Putnam RetirementReady 2055 Fund, Putnam RetirementReady 2050 Fund, Putnam RetirementReady 2045 Fund, Putnam RetirementReady 2040 Fund, Putnam RetirementReady 2035 Fund, Putnam RetirementReady 2030 Fund, Putnam RetirementReady 2025 Fund, Putnam RetirementReady 2020 Fund, and Putnam Retirement Income Fund Lifestyle 1 (collectively the funds) is a diversified series of Putnam RetirementReady® Funds (the Trust), a Massachusetts business trust registered under the Investment Company Act of 1940, as amended, as an open-end investment company. Each fund, except the Putnam Retirement Income Fund Lifestyle 1, seeks capital appreciation and current income consistent with a decreasing emphasis on capital appreciation and an increasing emphasis on current income as it approaches its target date. Putnam Retirement Income Fund Lifestyle 1 seeks as high a rate of current income as Putnam Management believes is consistent with preservation of capital.
Currently there are ten separate funds, of which nine have a target date specified by the calendar year in the name of each fund. The target dates are in five-year increments beginning with the year 2020. The tenth fund is named Putnam Retirement Income Fund Lifestyle 1. Amounts invested in each target date fund are allocated among underlying Putnam funds based on the fund’s target date. The target percentages for each target date fund gradually change over time based on the number of years that remain until the target date of the fund so that a fund’s asset allocation will become more conservative as the fund approaches its target date. The asset allocation of each target date fund is designed to provide an investment that Putnam Management believes is neither overly aggressive nor overly conservative for a typical investor planning to retire (or otherwise begin using the invested funds) in the target year. When a fund’s target percentages correspond to those of the Putnam Retirement Income Fund Lifestyle 1, which currently is expected to occur during the latter part of the target year, the fund will be merged into Putnam Retirement Income Fund Lifestyle 1.
These financial statements report on each fund, which may invest in certain Putnam Funds which are managed by Putnam Management. As of July 31, 2018, each fund invests in the following diversified funds: Putnam Fixed Income Absolute Return Fund, Putnam Multi-Asset Absolute Return Fund, Putnam Dynamic Asset Allocation Balanced Fund, Putnam Dynamic Asset Allocation Conservative Fund, Putnam Dynamic Asset Allocation Equity Fund, Putnam Dynamic Asset Allocation Growth Fund and Putnam Government Money Market Fund (the underlying Putnam Funds). Effective 4/20/18, Putnam Absolute Return 100 Fund was removed from the Putnam RetirementReady Fund suite of funds. Effective 4/30/18, Putnam Absolute Return 300 Fund was renamed Putnam Fixed Income Absolute Return Fund. Effective 4/30/18, Putnam Absolute Return 500 Fund merged into Putnam Absolute Return 700 Fund. Effective 4/30/18, Putnam Absolute Return 700 Fund was renamed Putnam Multi-Asset Absolute Return Fund. The financial statements of the underlying Putnam Funds contain additional information about the expenses and investments of the underlying Putnam Funds and are available upon request.
Each fund offers class A, class B, class C, class M, class R, class R6 and class Y shares. Purchases of class B shares are closed to new and existing investors except by exchange from class B shares of another Putnam fund or through dividend and/or capital gains reinvestment. Class A and class M shares are sold with a maximum front-end sales charge of 5.75% (4.00% for Putnam Retirement Income Fund Lifestyle 1) and 3.50% (3.25% for Putnam Retirement Income Fund Lifestyle 1), respectively. Class A shares generally are not subject to a contingent deferred sales charge and class M, class R, class R6, and class Y are not subject to a contingent deferred sales charge. Class B shares, which convert to class A shares after approximately eight years, are not subject to a front-end sales charge and are subject to a contingent deferred sales charge if those shares are redeemed within six years of purchase. Class C shares are subject to a one-year 1.00% contingent deferred sales charge and do not convert to class A shares. Class R shares, which are not available to all investors, are sold at net asset value. The expenses for class A, class B, class C, class M and class R shares may differ based on the distribution fee of each class, which is identified in Note 2. Class R6 and class Y shares, which are sold at net asset value, are generally subject to the same expenses as class A, class B, class C, class M and class R shares, but do not bear a distribution fee and in the case of class R6 shares, bear a lower investor servicing fee, which is identified in Note 2. Class R6 and class Y shares are not available to all investors.
In the normal course of business, each fund enters into contracts that may include agreements to indemnify another party under given circumstances. Each fund’s maximum exposure under these arrangements is unknown
| 86 RetirementReady® Funds | |
as this would involve future claims that may be, but have not yet been, made against each fund. However, each fund’s management team expects the risk of material loss to be remote.
Each fund has entered into contractual arrangements with an investment adviser, administrator, distributor, shareholder servicing agent and custodian, who each provide services to the fund. Unless expressly stated otherwise, shareholders are not parties to, or intended beneficiaries of these contractual arrangements, and these contractual arrangements are not intended to create any shareholder right to enforce them against the service providers or to seek any remedy under them against the service providers, either directly or on behalf of the fund.
Under each fund’s Agreement and Declaration of Trust, any claims asserted against or on behalf of the Putnam Funds, including claims against Trustees and Officers, must be brought in state and federal courts located within the Commonwealth of Massachusetts.
Note 1: Significant accounting policies
The following is a summary of significant accounting policies consistently followed by each fund in the preparation of its financial statements. The preparation of financial statements is in conformity with accounting principles generally accepted in the United States of America and requires management to make estimates and assumptions that affect the reported amounts of assets and liabilities in the financial statements and the reported amounts of increases and decreases in net assets from operations. Actual results could differ from those estimates. Subsequent events after the Statement of assets and liabilities date through the date that the financial statements were issued have been evaluated in the preparation of the financial statements.
Investment income, realized and unrealized gains and losses and expenses of each fund are borne pro-rata based on the relative net assets of each class to the total net assets of each fund, except that each class bears expenses unique to that class (including the distribution fees applicable to such classes). Each class votes as a class only with respect to its own distribution plan or other matters on which a class vote is required by law or determined by the Trustees. Shares of each class would receive their pro-rata share of the net assets of the fund, if that fund were liquidated. In addition, the Trustees declare separate dividends on each class of shares.
Security valuation The price of each fund’s shares is based on its net asset value (NAV), which is in turn based on the NAVs of the underlying Putnam Funds in which it invests, which are classified as Level 1 securities under Accounting Standards Codification 820 Fair Value Measurements and Disclosures (ASC 820). The NAVs of the underlying Putnam Funds are determined based on the policies contained in each underlying Putnam Fund’s financial statements. The NAV per share of each class equals the total value of its assets, less its liabilities, divided by the number of its outstanding shares. Shares are only valued as of the scheduled close of regular trading on the New York Stock Exchange each day the exchange is open.
Security transactions and related investment income Security transactions, which consist of shares of the underlying Putnam Funds, are recorded on the trade date (date the order to buy or sell is executed). Gains or losses from the sale of the underlying Putnam Funds are determined on the identified cost basis. Income and capital gain distributions from the underlying Putnam Funds are recorded on the ex-dividend date.
Interfund lending Each fund, along with other Putnam funds, may participate in an interfund lending program pursuant to an exemptive order issued by the SEC. This program allows the funds to borrow from or lend to other Putnam funds that permit such transactions. Interfund lending transactions are subject to each fund’s investment policies and borrowing and lending limits. Interest earned or paid on the interfund lending transaction will be based on the average of certain current market rates. During the reporting period, the funds did not utilize the program.
Federal taxes It is the policy of each fund to distribute all of its taxable income within the prescribed time period and otherwise comply with the provisions of the Internal Revenue Code of 1986, as amended (the Code), applicable to regulated investment companies. It is also the intention of each fund to distribute an amount sufficient to avoid imposition of any excise tax under Section 4982 of the Code.
Each fund is subject to the provisions of Accounting Standards Codification 740 Income Taxes (ASC 740). ASC 740 sets forth a minimum threshold for financial statement recognition of the benefit of a tax position taken or expected to be taken in a tax return. The funds did not have a liability to record for any unrecognized tax benefits in the accompanying financial statements. No provision has been made for federal taxes on income, capital gains or unrealized appreciation on securities held nor for excise tax on income and capital gains. Each of the funds’ federal tax returns for the prior three fiscal years, or life of the fund, if shorter, remain subject to examination by the Internal Revenue Service.
| RetirementReady® Funds 87 |
Pursuant to federal income tax regulations applicable to regulated investment companies, the following funds have elected to defer the following amounts of certain capital losses recognized during the period between November 1, 2017 and July 31, 2018 to its fiscal year ending July 31, 2019.
| Post-October loss | |
| Putnam RetirementReady 2035 Fund | $3,575 |
| Putnam RetirementReady 2025 Fund | 7,430 |
| Putnam RetirementReady 2020 Fund | 11,494 |
| Putnam Retirement Income Fund Lifestyle 1 | 1,188 |
Pursuant to federal income tax regulations applicable to regulated investment companies, the following funds have elected to defer the following amounts to their fiscal year ending July 31, 2019 late year ordinary losses ((i) ordinary losses recognized between January 1, 2018 and July 31, 2018, and (ii) specified ordinary and currency losses recognized between November 1, 2017 and July 31, 2018).
| Late year ordinary loss deferral | |
| Putnam RetirementReady 2055 Fund | $40,498 |
| Putnam RetirementReady 2050 Fund | 109,941 |
| Putnam RetirementReady 2040 Fund | 185,918 |
Distributions to shareholders Each fund normally distributes any net investment income and any net realized capital gains annually, except Putnam Retirement Income Fund Lifestyle 1, which normally distributes any net investment income monthly and any net realized capital gains annually. The amount and character of income and gains to be distributed are determined in accordance with income tax regulations, which may differ from generally accepted accounting principles. These differences include the following temporary and/or permanent difference for the following funds:
| Differences during the period | |
| losses on wash sale transactions, redesignation of taxable | |
| distributions, reclass of short-term capital gain distributions from | |
| Putnam RetirementReady 2060 Fund | underlying Putnam funds |
| losses on wash sale transactions, late year loss deferrals, reclass of | |
| Putnam RetirementReady 2055 Fund | short-term capital gain distributions from underlying Putnam funds |
| losses on wash sale transactions, late year loss deferrals, reclass of | |
| Putnam RetirementReady 2050 Fund | short-term capital gain distributions from underlying Putnam funds |
| losses on wash sale transactions, reclass of short-term capital gain | |
| Putnam RetirementReady 2045 Fund | distributions from underlying Putnam funds |
| losses on wash sale transactions, late year loss deferrals, reclass of | |
| Putnam RetirementReady 2040 Fund | short-term capital gain distributions from underlying Putnam funds |
| losses on wash sale transactions, the expiration of a capital loss | |
| carryover, reclass of short-term capital gain distributions from | |
| Putnam RetirementReady 2035 Fund | underlying Putnam funds |
| losses on wash sale transactions, reclass of short-term capital gain | |
| Putnam RetirementReady 2030 Fund | distributions from underlying Putnam funds |
| losses on wash sale transactions, the expiration of a capital loss | |
| carryover, reclass of short-term capital gain distributions from | |
| Putnam RetirementReady 2025 Fund | underlying Putnam funds |
| losses on wash sale transactions, the expiration of a capital loss | |
| carryover, reclass of short-term capital gain distributions from | |
| Putnam RetirementReady 2020 Fund | underlying Putnam funds |
| losses on wash sale transactions, the expiration of a capital loss | |
| carryover, reclass of short-term capital gain distributions from | |
| Putnam Retirement Income Fund Lifestyle 1 | underlying Putnam funds |
| 88 RetirementReady® Funds |
Reclassifications, if any, are made to the fund’s capital accounts to reflect income and gains available for distribution (or available capital loss carryovers) under income tax regulations. At the close of the reporting period, the following funds reclassified the following amounts:
| Accumulated net | |||
| realized gain/(loss) on | |||
| Undistributed net | investment | ||
| investment income | transactions | Paid-in-capital | |
| Putnam RetirementReady 2060 Fund | $11,163 | $(11,163) | $— |
| Putnam RetirementReady 2055 Fund | 408,092 | (408,092) | — |
| Putnam RetirementReady 2050 Fund | 1,303,078 | (1,303,078) | — |
| Putnam RetirementReady 2045 Fund | 1,552,860 | (1,552,860) | — |
| Putnam RetirementReady 2040 Fund | 3,694,947 | (3,694,947) | — |
| Putnam RetirementReady 2035 Fund | 2,399,528 | (2,120,955) | (278,573) |
| Putnam RetirementReady 2030 Fund | 2,673,129 | (2,673,129) | — |
| Putnam RetirementReady 2025 Fund | 882,669 | 12,849,585 | (13,732,254) |
| Putnam RetirementReady 2020 Fund | 572,931 | 15,174,975 | (15,747,906) |
| Putnam Retirement Income Fund | |||
| Lifestyle 1 | 45,116 | 191,234 | (236,350) |
| RetirementReady® Funds 89 |
| Tax cost of investments includes adjustments to net unrealized appreciation (depreciation) which may not neces- | Distributions to shareholders cont. | ||||||||
| sarily be final tax cost basis adjustments, but closely approximate the tax basis unrealized gains and losses that | |||||||||
| may be realized and distributed to shareholders. The tax basis components of distributable earnings and the | |||||||||
| federal tax cost as of the close of the reporting period were as follows: | |||||||||
| Net unrealized | Undistributed | Late year | Cost for federal | ||||||
| Unrealized | Unrealized | appreciation/ | ordinary | Undistributed | Undistributed | Post-October | ordinary | income | |
| appreciation | (depreciation) | (depreciation) | income | short-term gain | long-term gain | loss | loss deferral | tax purposes | |
| Putnam RetirementReady 2060 Fund | $15,509 | $(8,804) | $6,705 | $— | $4,050 | $37,046 | $— | $— | $888,379 |
| Putnam RetirementReady 2055 Fund | 1,090,329 | (127,298) | 963,031 | — | — | 1,547,625 | — | (40,498) | 22,914,505 |
| Putnam RetirementReady 2050 Fund | 3,297,909 | (202,486) | 3,095,423 | — | — | 4,357,185 | — | (109,941) | 58,758,926 |
| Putnam RetirementReady 2045 Fund | 3,349,704 | (342,103) | 3,007,601 | 159,639 | — | 1,414,097 | — | — | 66,640,147 |
| Putnam RetirementReady 2040 Fund | 6,885,496 | (622,414) | 6,263,082 | — | — | 9,079,069 | — | (185,918) | 148,946,269 |
| Putnam RetirementReady 2035 Fund | 4,061,691 | (717,134) | 3,344,557 | 721,514 | — | — | (3,575) | — | 121,167,155 |
| Putnam RetirementReady 2030 Fund | 5,166,687 | (925,480) | 4,241,207 | 1,378,130 | — | 1,341,240 | — | — | 192,809,445 |
| Putnam RetirementReady 2025 Fund | 1,926,287 | (995,773) | 930,514 | 1,699,921 | — | — | (7,430) | — | 128,129,537 |
| Putnam RetirementReady 2020 Fund | 549,146 | (2,026,972) | (1,477,826) | 2,250,827 | — | — | (11,494) | — | 201,180,097 |
| Putnam Retirement Income Fund Lifestyle 1 | 1,984,907 | (4,995,281) | (3,010,374) | 6,280 | — | — | (1,188) | — | 106,999,703 |
Expenses of the Trust Expenses directly charged or attributable to any fund will be paid from the assets of that fund. Generally, expenses of the Trust will be allocated among and charged to the assets of each fund on a basis that the Trustees deem fair and equitable, which may be based on the relative assets of each fund or the nature of the services performed and relative applicability to each fund.
Note 2: Management fee, administrative services and other transactions
The funds do not pay a monthly management fee to Putnam Management.
Putnam Management has contractually agreed through November 30, 2019 for all the funds with the exception of Putnam RetirementReady 2060 Fund, where the contractual agreement is through November 30, 2028, to reimburse each fund for other expenses (excluding payments under each fund’s distribution plans, payments under the investor servicing contract, brokerage, interest, taxes, investment-related expenses, extraordinary expenses, and acquired fund fees and expenses). During the reporting period, each fund’s expenses were reduced by the following amounts as a result of this limit.
| Fees waived and reimbursed | |
| by the Manager | |
| Putnam RetirementReady 2060 Fund | $ 92,113 |
| Putnam RetirementReady 2055 Fund | 92,172 |
| Putnam RetirementReady 2050 Fund | 108,135 |
| Putnam RetirementReady 2045 Fund | 115,940 |
| Putnam RetirementReady 2040 Fund | 179,063 |
| Putnam RetirementReady 2035 Fund | 130,531 |
| Putnam RetirementReady 2030 Fund | 153,282 |
| Putnam RetirementReady 2025 Fund | 130,858 |
| Putnam RetirementReady 2020 Fund | 170,779 |
| Putnam Retirement Income Fund Lifestyle 1 | 116,931 |
Putnam Investments Limited (PIL), an affiliate of Putnam Management, is authorized by the Trustees to manage a separate portion of the assets of each fund as determined by Putnam Management from time to time. PIL did not manage any portion of the assets of the fund during the reporting period. If Putnam Management were to engage the services of PIL, Putnam Management would pay a quarterly sub-management fee to PIL for its services at an annual rate of 0.35% of the average net assets of the portion of the fund managed by PIL.
| 90 RetirementReady® Funds | RetirementReady® Funds 91 |
Putnam Investor Services, Inc., an affiliate of Putnam Management, provides investor servicing agent functions to each fund and received fees for investor servicing (for class A, B, C, M, R and Y) that include (1) a specified rate of the fund’s assets attributable to defined contribution plan accounts; and (2) a specified rate based on the average net assets attributable to direct and underlying non-defined contribution accounts. Putnam Investor Services, Inc. has agreed that the aggregate investor servicing fees for each fund’s defined and non-defined contribution accounts for these share classes will not exceed an annual rate of 0.25% of the fund’s average assets attributable to such accounts. Class R6 shares will pay a monthly fee for investor servicing based on the average net assets of class R6 shares at an annual rate of 0.05%. During the reporting period, the expenses for each class of shares related to investor servicing fees for each fund were as follows:
| Class A | Class B | Class C | Class M | Class R | Class R6 | Class Y | Total | |
| Putnam | ||||||||
| RetirementReady | ||||||||
| 2060 Fund | $268 | $22 | $100 | $28 | $30 | $116 | $55 | $619 |
| Putnam | ||||||||
| RetirementReady | ||||||||
| 2055 Fund | 22,489 | 201 | 1,679 | 145 | 446 | 2,162 | 6,747 | 33,869 |
| Putnam | ||||||||
| RetirementReady | ||||||||
| 2050 Fund | 72,915 | 746 | 1,264 | 260 | 1,302 | 4,333 | 6,763 | 87,583 |
| Putnam | ||||||||
| RetirementReady | ||||||||
| 2045 Fund | 78,670 | 1,063 | 1,648 | 217 | 1,955 | 4,512 | 12,523 | 100,588 |
| Putnam | ||||||||
| RetirementReady | ||||||||
| 2040 Fund | 175,166 | 1,036 | 1,406 | 630 | 1,389 | 7,963 | 11,152 | 198,742 |
| Putnam | ||||||||
| RetirementReady | ||||||||
| 2035 Fund | 132,766 | 1,315 | 2,556 | 898 | 2,276 | 9,543 | 18,143 | 167,497 |
| Putnam | ||||||||
| RetirementReady | ||||||||
| 2030 Fund | 232,440 | 1,693 | 2,292 | 432 | 2,326 | 8,658 | 11,805 | 259,646 |
| Putnam | ||||||||
| RetirementReady | ||||||||
| 2025 Fund | 143,208 | 1,848 | 3,378 | 392 | 3,471 | 7,392 | 19,505 | 179,194 |
| Putnam | ||||||||
| RetirementReady | ||||||||
| 2020 Fund | 241,817 | 1,274 | 2,684 | 213 | 4,683 | 3,635 | 2,849 | 257,155 |
| Putnam | ||||||||
| Retirement | ||||||||
| Income Fund | ||||||||
| Lifestyle 1 | 118,412 | 1,260 | 1,993 | 741 | 956 | 1,921 | 5,763 | 131,046 |
| 92 RetirementReady® Funds |
Each fund has adopted distribution plans (the Plans) with respect to the following share classes pursuant to Rule 12b–1 under the Investment Company Act of 1940. The purpose of the Plans is to compensate Putnam Retail Management Limited Partnership, an indirect wholly-owned subsidiary of Putnam Investments, LLC, for services provided and expenses incurred in distributing shares of the funds. The Plans provide for payments by each fund to Putnam Retail Management Limited Partnership at an annual rate of up to the following amounts (“Maximum %”) of the average net assets attributable to each class. The Trustees have approved payment by the funds at the following annual rates (“Approved %”) of the average net assets attributable to each class. During the reporting period, the class-specific expenses related to distribution fees for each fund were as follows:
| Class A | Class B | Class C | Class M | Class R | Total | |
| Maximum % | 0.35% | 1.00% | 1.00% | 1.00% | 1.00% | |
| Approved % | 0.25% | 1.00% | 1.00% | 0.75% | 0.50% | |
| Putnam RetirementReady 2060 Fund | $452 | $150 | $683 | $144 | $103 | $1,532 |
| Putnam RetirementReady 2055 Fund | 29,195 | 1,039 | 8,692 | 563 | 1,133 | 40,622 |
| Putnam RetirementReady 2050 Fund | 112,676 | 4,598 | 7,778 | 1,211 | 4,000 | 130,263 |
| Putnam RetirementReady 2045 Fund | 115,995 | 6,264 | 9,712 | 949 | 5,754 | 138,674 |
| Putnam RetirementReady 2040 Fund | 308,306 | 7,279 | 9,891 | 3,349 | 4,735 | 333,560 |
| Putnam RetirementReady 2035 Fund | 204,973 | 8,086 | 15,700 | 4,157 | 6,877 | 239,793 |
| Putnam RetirementReady 2030 Fund | 413,691 | 12,032 | 16,297 | 2,318 | 8,114 | 452,452 |
| Putnam RetirementReady 2025 Fund | 220,159 | 11,304 | 20,770 | 1,799 | 10,408 | 264,440 |
| Putnam RetirementReady 2020 Fund | 460,638 | 9,696 | 20,458 | 1,217 | 17,747 | 509,756 |
| Class A | Class B | Class C | Class M | Class R | Total | |
| Maximum % | 0.35% | 1.00% | 1.00% | 1.00% | 1.00% | |
| Approved % | 0.25% | 1.00% | 1.00% | 0.50% | 0.50% | |
| Putnam Retirement Income Fund | ||||||
| Lifestyle 1 | $214,293 | $9,100 | $14,366 | $2,682 | $3,443 | $243,884 |
For the reporting period, Putnam Retail Management Limited Partnership, acting as underwriter, received net commissions from the sale of class A and class M shares, and received contingent deferred sales charges from redemptions of class B and class C shares, in the following amounts:
| Class A net | Class M net | |||
| commissions | commissions | Class B CDSC | Class C CDSC | |
| Putnam RetirementReady 2060 Fund | $995 | $2 | $— | $— |
| Putnam RetirementReady 2055 Fund | 4,420 | 105 | 157 | 221 |
| Putnam RetirementReady 2050 Fund | 4,798 | 211 | 608 | 188 |
| Putnam RetirementReady 2045 Fund | 7,339 | 88 | — | 68 |
| Putnam RetirementReady 2040 Fund | 7,357 | 2,806 | 1 | 11 |
| Putnam RetirementReady 2035 Fund | 12,554 | 53 | — | 167 |
| Putnam RetirementReady 2030 Fund | 12,016 | 264 | 946 | 173 |
| Putnam RetirementReady 2025 Fund | 10,477 | 113 | 834 | 71 |
| Putnam RetirementReady 2020 Fund | 4,784 | 473 | 2,705 | 459 |
| Putnam Retirement Income Fund | ||||
| Lifestyle 1 | 2,866 | 5 | 12 | 3 |
| RetirementReady® Funds 93 |
A deferred sales charge of up to 1.00% is assessed on certain redemptions of class A shares. For the reporting period, Putnam Retail Management Limited Partnership, acting as underwriter, received the following amounts on class A redemptions:
| Class A CDSC | |
| Putnam RetirementReady 2060 Fund | $1 |
| Putnam RetirementReady 2055 Fund | 19 |
| Putnam RetirementReady 2050 Fund | 61 |
| Putnam RetirementReady 2045 Fund | — |
| Putnam RetirementReady 2040 Fund | 84 |
| Putnam RetirementReady 2035 Fund | — |
| Putnam RetirementReady 2030 Fund | 29 |
| Putnam RetirementReady 2025 Fund | — |
| Putnam RetirementReady 2020 Fund | 10 |
| Putnam Retirement Income Fund Lifestyle 1 | — |
Note 3: Purchases and sales of securities
During the reporting period, cost of purchases and proceeds from sales of underlying Putnam Funds were as follows:
| Cost of purchases | Proceeds from sales | |
| Putnam RetirementReady 2060 Fund | $971,933 | $360,270 |
| Putnam RetirementReady 2055 Fund | 13,349,558 | 7,138,060 |
| Putnam RetirementReady 2050 Fund | 27,638,217 | 23,105,113 |
| Putnam RetirementReady 2045 Fund | 38,411,504 | 27,970,448 |
| Putnam RetirementReady 2040 Fund | 69,409,928 | 58,043,004 |
| Putnam RetirementReady 2035 Fund | 69,612,189 | 50,462,423 |
| Putnam RetirementReady 2030 Fund | 90,703,184 | 90,961,080 |
| Putnam RetirementReady 2025 Fund | 85,431,138 | 63,527,857 |
| Putnam RetirementReady 2020 Fund | 139,973,022 | 138,574,039 |
| Putnam Retirement Income Fund Lifestyle 1 | 80,331,845 | 66,584,083 |
Note 4: Capital shares
At the close of the reporting period, there were an unlimited number of shares of beneficial interest authorized. Transactions, including, if applicable, direct exchanges pursuant to share conversions, in capital shares were as follows:
| YEAR ENDED 7/31/18 | YEAR ENDED 7/31/17 | |||
| Class A | Shares | Amount | Shares | Amount |
| Shares sold | 23,049 | $262,489 | 4,815 | $50,848 |
| Shares issued in connection with | ||||
| reinvestment of distributions | 1,042 | 11,877 | 59 | 590 |
| 24,091 | 274,366 | 4,874 | 51,438 | |
| Shares repurchased | (11,198) | (131,358) | (254) | (2,766) |
| Net increase | 12,893 | $143,008 | 4,620 | $48,672 |
| 94 RetirementReady® Funds |
| YEAR ENDED 7/31/18 | YEAR ENDED 7/31/17 | |||
| Class B | Shares | Amount | Shares | Amount |
| Shares sold | — | $— | 161 | $1,600 |
| Shares issued in connection with | ||||
| reinvestment of distributions | 60 | 689 | 14 | 144 |
| 60 | 689 | 175 | 1,744 | |
| Shares repurchased | — | — | (2) | (25) |
| Net increase | 60 | $689 | 173 | $1,719 |
| YEAR ENDED 7/31/18 | YEAR ENDED 7/31/17 | |||
| Class C | Shares | Amount | Shares | Amount |
| Shares sold | 5,317 | $60,171 | 2,521 | $26,240 |
| Shares issued in connection with | ||||
| reinvestment of distributions | 258 | 2,931 | 45 | 448 |
| 5,575 | 63,102 | 2,566 | 26,688 | |
| Shares repurchased | (3,019) | (34,271) | (64) | (671) |
| Net increase | 2,556 | $28,831 | 2,502 | $26,017 |
| YEAR ENDED 7/31/18 | YEAR ENDED 7/31/17 | |||
| Class M | Shares | Amount | Shares | Amount |
| Shares sold | 1,158 | $13,293 | 92 | $986 |
| Shares issued in connection with | ||||
| reinvestment of distributions | 61 | 700 | 14 | 139 |
| 1,219 | 13,993 | 106 | 1,125 | |
| Shares repurchased | (2) | (25) | (2) | (25) |
| Net increase | 1,217 | $13,968 | 104 | $1,100 |
| YEAR ENDED 7/31/18 | YEAR ENDED 7/31/17 | |||
| Class R | Shares | Amount | Shares | Amount |
| Shares sold | 1,183 | $13,728 | 90 | $959 |
| Shares issued in connection with | ||||
| reinvestment of distributions | 66 | 755 | 16 | 163 |
| 1,249 | 14,483 | 106 | 1,122 | |
| Shares repurchased | (4) | (40) | — | — |
| Net increase | 1,245 | $14,443 | 106 | $1,122 |
| FOR THE PERIOD 9/2/16 | ||||
| (COMMENCEMENT OF OPERATIONS) | ||||
| YEAR ENDED 7/31/18 | TO 7/31/17 | |||
| Class R6 | Shares | Amount | Shares | Amount |
| Shares sold | 32,208 | $376,949 | 7,664 | $79,226 |
| Shares issued in connection with | ||||
| reinvestment of distributions | 1,062 | 12,154 | 56 | 559 |
| 33,270 | 389,103 | 7,720 | 79,785 | |
| Shares repurchased | (3,481) | (39,682) | (539) | (5,559) |
| Net increase | 29,789 | $349,421 | 7,181 | $74,226 |
| RetirementReady® Funds 95 |
| YEAR ENDED 7/31/18 | YEAR ENDED 7/31/17 | |||
| Class Y | Shares | Amount | Shares | Amount |
| Shares sold | 8,781 | $99,939 | 2,399 | $25,490 |
| Shares issued in connection with | ||||
| reinvestment of distributions | 197 | 2,250 | 26 | 263 |
| 8,978 | 102,189 | 2,425 | 25,753 | |
| Shares repurchased | (6,736) | (76,241) | (2,669) | (27,353) |
| Net increase | 2,242 | $25,948 | (244) | $(1,600) |
Putnam RetirementReady 2055 Fund
| YEAR ENDED 7/31/18 | YEAR ENDED 7/31/17 | |||
| Class A | Shares | Amount | Shares | Amount |
| Shares sold | 421,158 | $5,219,947 | 539,161 | $5,953,708 |
| Shares issued in connection with | ||||
| reinvestment of distributions | 49,838 | 611,013 | 5,971 | 64,007 |
| 470,996 | 5,830,960 | 545,132 | 6,017,715 | |
| Shares repurchased | (281,531) | (3,471,971) | (160,388) | (1,771,005) |
| Net increase | 189,465 | $2,358,989 | 384,744 | $4,246,710 |
| YEAR ENDED 7/31/18 | YEAR ENDED 7/31/17 | |||
| Class B | Shares | Amount | Shares | Amount |
| Shares sold | 375 | $4,659 | 1,825 | $19,711 |
| Shares issued in connection with | ||||
| reinvestment of distributions | 397 | 4,846 | 20 | 212 |
| 772 | 9,505 | 1,845 | 19,923 | |
| Shares repurchased | (798) | (9,756) | (983) | (10,850) |
| Net increase (decrease) | (26) | $(251) | 862 | $9,073 |
| YEAR ENDED 7/31/18 | YEAR ENDED 7/31/17 | |||
| Class C | Shares | Amount | Shares | Amount |
| Shares sold | 15,018 | $182,904 | 11,233 | $121,476 |
| Shares issued in connection with | ||||
| reinvestment of distributions | 3,373 | 40,572 | 211 | 2,219 |
| 18,391 | 223,476 | 11,444 | 123,695 | |
| Shares repurchased | (15,152) | (183,540) | (5,732) | (63,107) |
| Net increase | 3,239 | $39,936 | 5,712 | $60,588 |
| YEAR ENDED 7/31/18 | YEAR ENDED 7/31/17 | |||
| Class M | Shares | Amount | Shares | Amount |
| Shares sold | 1,619 | $20,026 | 1,179 | $12,938 |
| Shares issued in connection with | ||||
| reinvestment of distributions | 246 | 3,023 | 31 | 336 |
| 1,865 | 23,049 | 1,210 | 13,274 | |
| Shares repurchased | (1,699) | (21,101) | (29) | (310) |
| Net increase | 166 | $1,948 | 1,181 | $12,964 |
| 96 RetirementReady® Funds | |
| YEAR ENDED 7/31/18 | YEAR ENDED 7/31/17 | |||
| Class R | Shares | Amount | Shares | Amount |
| Shares sold | 9,257 | $112,525 | 16,914 | $186,834 |
| Shares issued in connection with | ||||
| reinvestment of distributions | 575 | 7,028 | 211 | 2,253 |
| 9,832 | 119,553 | 17,125 | 189,087 | |
| Shares repurchased | (17,123) | (209,774) | (21,916) | (238,000) |
| Net decrease | (7,291) | $(90,221) | (4,791) | $(48,913) |
| FOR THE PERIOD 9/2/16 | ||||
| (COMMENCEMENT OF OPERATIONS) | ||||
| YEAR ENDED 7/31/18 | TO 7/31/17 | |||
| Class R6 | Shares | Amount | Shares | Amount |
| Shares sold | 189,268 | $2,375,618 | 317,503 | $3,419,927 |
| Shares issued in connection with | ||||
| reinvestment of distributions | 17,365 | 214,802 | 2,209 | 23,860 |
| 206,633 | 2,590,420 | 319,712 | 3,443,787 | |
| Shares repurchased | (71,679) | (903,655) | (42,192) | (474,557) |
| Net increase | 134,954 | $1,686,765 | 277,520 | $2,969,230 |
| YEAR ENDED 7/31/18 | YEAR ENDED 7/31/17 | |||
| Class Y | Shares | Amount | Shares | Amount |
| Shares sold | 189,344 | $2,366,766 | 132,648 | $1,460,096 |
| Shares issued in connection with | ||||
| reinvestment of distributions | 14,125 | 174,442 | 2,338 | 25,223 |
| 203,469 | 2,541,208 | 134,986 | 1,485,319 | |
| Shares repurchased | (70,895) | (879,879) | (283,524) | (3,036,016) |
| Net increase (decrease) | 132,574 | $1,661,329 | (148,538) | $(1,550,697) |
Putnam RetirementReady 2050 Fund
| YEAR ENDED 7/31/18 | YEAR ENDED 7/31/17 | |||
| Class A | Shares | Amount | Shares | Amount |
| Shares sold | 501,844 | $10,131,226 | 1,205,088 | $21,397,931 |
| Shares issued in connection with | ||||
| reinvestment of distributions | 106,244 | 2,128,074 | 13,160 | 230,425 |
| 608,088 | 12,259,300 | 1,218,248 | 21,628,356 | |
| Shares repurchased | (612,353) | (12,350,267) | (720,050) | (12,883,977) |
| Net increase (decrease) | (4,265) | $(90,967) | 498,198 | $8,744,379 |
| YEAR ENDED 7/31/18 | YEAR ENDED 7/31/17 | |||
| Class B | Shares | Amount | Shares | Amount |
| Shares sold | 813 | $15,998 | 4,034 | $68,027 |
| Shares issued in connection with | ||||
| reinvestment of distributions | 989 | 19,588 | — | — |
| 1,802 | 35,586 | 4,034 | 68,027 | |
| Shares repurchased | (4,141) | (81,334) | (6,446) | (110,992) |
| Net decrease | (2,339) | $(45,748) | (2,412) | $(42,965) |
| RetirementReady® Funds 97 |
| YEAR ENDED 7/31/18 | YEAR ENDED 7/31/17 | |||
| Class C | Shares | Amount | Shares | Amount |
| Shares sold | 9,571 | $188,258 | 9,919 | $173,291 |
| Shares issued in connection with | ||||
| reinvestment of distributions | 1,517 | 29,776 | — | — |
| 11,088 | 218,034 | 9,919 | 173,291 | |
| Shares repurchased | (21,803) | (426,770) | (4,003) | (70,608) |
| Net increase (decrease) | (10,715) | $(208,736) | 5,916 | $102,683 |
| YEAR ENDED 7/31/18 | YEAR ENDED 7/31/17 | |||
| Class M | Shares | Amount | Shares | Amount |
| Shares sold | 1,660 | $33,820 | 2,210 | $39,654 |
| Shares issued in connection with | ||||
| reinvestment of distributions | 326 | 6,609 | 21 | 368 |
| 1,986 | 40,429 | 2,231 | 40,022 | |
| Shares repurchased | (31) | (648) | (2,446) | (45,968) |
| Net increase (decrease) | 1,955 | $39,781 | (215) | $(5,946) |
| YEAR ENDED 7/31/18 | YEAR ENDED 7/31/17 | |||
| Class R | Shares | Amount | Shares | Amount |
| Shares sold | 22,906 | $449,918 | 33,556 | $601,146 |
| Shares issued in connection with | ||||
| reinvestment of distributions | 1,634 | 32,376 | 327 | 5,664 |
| 24,540 | 482,294 | 33,883 | 606,810 | |
| Shares repurchased | (22,006) | (437,329) | (76,770) | (1,353,380) |
| Net increase (decrease) | 2,534 | $44,965 | (42,887) | $(746,570) |
| FOR THE PERIOD 9/2/16 | ||||
| (COMMENCEMENT OF OPERATIONS) | ||||
| YEAR ENDED 7/31/18 | TO 7/31/17 | |||
| Class R6 | Shares | Amount | Shares | Amount |
| Shares sold | 255,214 | $5,209,738 | 394,216 | $6,875,128 |
| Shares issued in connection with | ||||
| reinvestment of distributions | 20,509 | 413,659 | 2,156 | 37,994 |
| 275,723 | 5,623,397 | 396,372 | 6,913,122 | |
| Shares repurchased | (67,881) | (1,373,106) | (31,845) | (573,795) |
| Net increase | 207,842 | $4,250,291 | 364,527 | $6,339,327 |
| YEAR ENDED 7/31/18 | YEAR ENDED 7/31/17 | |||
| Class Y | Shares | Amount | Shares | Amount |
| Shares sold | 79,119 | $1,617,214 | 81,287 | $1,454,760 |
| Shares issued in connection with | ||||
| reinvestment of distributions | 10,034 | 202,082 | 1,319 | 23,210 |
| 89,153 | 1,819,296 | 82,606 | 1,477,970 | |
| Shares repurchased | (160,968) | (3,277,402) | (334,486) | (5,762,173) |
| Net decrease | (71,815) | $(1,458,106) | (251,880) | $(4,284,203) |
| 98 RetirementReady® Funds |
Putnam RetirementReady 2045 Fund
| YEAR ENDED 7/31/18 | YEAR ENDED 7/31/17 | |||
| Class A | Shares | Amount | Shares | Amount |
| Shares sold | 767,723 | $17,072,176 | 915,140 | $18,001,185 |
| Shares issued in connection with | ||||
| reinvestment of distributions | 91,405 | 2,025,536 | 10,039 | 194,847 |
| 859,128 | 19,097,712 | 925,179 | 18,196,032 | |
| Shares repurchased | (723,059) | (16,163,814) | (609,541) | (12,120,532) |
| Net increase | 136,069 | $2,933,898 | 315,638 | $6,075,500 |
| YEAR ENDED 7/31/18 | YEAR ENDED 7/31/17 | |||
| Class B | Shares | Amount | Shares | Amount |
| Shares sold | — | $— | 2,475 | $44,771 |
| Shares issued in connection with | ||||
| reinvestment of distributions | 1,273 | 25,629 | — | — |
| 1,273 | 25,629 | 2,475 | 44,771 | |
| Shares repurchased | (1,248) | (25,260) | (3,213) | (57,426) |
| Net increase (decrease) | 25 | $369 | (738) | $(12,655) |
| YEAR ENDED 7/31/18 | YEAR ENDED 7/31/17 | |||
| Class C | Shares | Amount | Shares | Amount |
| Shares sold | 12,604 | $255,144 | 6,794 | $123,920 |
| Shares issued in connection with | ||||
| reinvestment of distributions | 2,015 | 40,605 | — | — |
| 14,619 | 295,749 | 6,794 | 123,920 | |
| Shares repurchased | (12,015) | (237,859) | (23,419) | (412,948) |
| Net increase (decrease) | 2,604 | $57,890 | (16,625) | $(289,028) |
| YEAR ENDED 7/31/18 | YEAR ENDED 7/31/17 | |||
| Class M | Shares | Amount | Shares | Amount |
| Shares sold | 1,646 | $35,117 | 3,674 | $72,734 |
| Shares issued in connection with | ||||
| reinvestment of distributions | 266 | 5,731 | 5 | 99 |
| 1,912 | 40,848 | 3,679 | 72,833 | |
| Shares repurchased | (3,203) | (70,124) | (6,840) | (140,874) |
| Net decrease | (1,291) | $(29,276) | (3,161) | $(68,041) |
| YEAR ENDED 7/31/18 | YEAR ENDED 7/31/17 | |||
| Class R | Shares | Amount | Shares | Amount |
| Shares sold | 21,635 | $502,618 | 34,963 | $724,116 |
| Shares issued in connection with | ||||
| reinvestment of distributions | 1,483 | 33,851 | 216 | 4,305 |
| 23,118 | 536,469 | 35,179 | 728,421 | |
| Shares repurchased | (28,135) | (638,578) | (63,167) | (1,285,128) |
| Net decrease | (5,017) | $(102,109) | (27,988) | $(556,707) |
| RetirementReady® Funds 99 |
| FOR THE PERIOD 9/2/16 | ||||
| (COMMENCEMENT OF OPERATIONS) | ||||
| YEAR ENDED 7/31/18 | TO 7/31/17 | |||
| Class R6 | Shares | Amount | Shares | Amount |
| Shares sold | 148,082 | $3,996,787 | 322,161 | $7,381,443 |
| Shares issued in connection with | ||||
| reinvestment of distributions | 13,122 | 351,274 | 1,391 | 32,337 |
| 161,204 | 4,348,061 | 323,552 | 7,413,780 | |
| Shares repurchased | (66,409) | (1,774,274) | (38,075) | (927,010) |
| Net increase | 94,795 | $2,573,787 | 285,477 | $6,486,770 |
| YEAR ENDED 7/31/18 | YEAR ENDED 7/31/17 | |||
| Class Y | Shares | Amount | Shares | Amount |
| Shares sold | 156,308 | $4,218,798 | 112,740 | $2,672,727 |
| Shares issued in connection with | ||||
| reinvestment of distributions | 10,051 | 268,671 | 1,152 | 26,754 |
| 166,359 | 4,487,469 | 113,892 | 2,699,481 | |
| Shares repurchased | (77,367) | (2,084,093) | (322,006) | (7,351,257) |
| Net increase (decrease) | 88,992 | $2,403,376 | (208,114) | $(4,651,776) |
Putnam RetirementReady 2040 Fund
| YEAR ENDED 7/31/18 | YEAR ENDED 7/31/17 | |||
| Class A | Shares | Amount | Shares | Amount |
| Shares sold | 1,113,139 | $26,666,589 | 2,774,023 | $58,917,310 |
| Shares issued in connection with | ||||
| reinvestment of distributions | 237,462 | 5,646,854 | 15,444 | 326,020 |
| 1,350,601 | 32,313,443 | 2,789,467 | 59,243,330 | |
| Shares repurchased | (1,266,771) | (30,286,883) | (1,750,565) | (37,728,192) |
| Net increase | 83,830 | $2,026,560 | 1,038,902 | $21,515,138 |
| YEAR ENDED 7/31/18 | YEAR ENDED 7/31/17 | |||
| Class B | Shares | Amount | Shares | Amount |
| Shares sold | — | $— | 4,552 | $88,809 |
| Shares issued in connection with | ||||
| reinvestment of distributions | 1,413 | 30,922 | — | — |
| 1,413 | 30,922 | 4,552 | 88,809 | |
| Shares repurchased | (5,557) | (123,298) | (10,294) | (199,754) |
| Net decrease | (4,144) | $(92,376) | (5,742) | $(110,945) |
| YEAR ENDED 7/31/18 | YEAR ENDED 7/31/17 | |||
| Class C | Shares | Amount | Shares | Amount |
| Shares sold | 7,520 | $162,914 | 17,527 | $346,143 |
| Shares issued in connection with | ||||
| reinvestment of distributions | 2,034 | 43,843 | — | — |
| 9,554 | 206,757 | 17,527 | 346,143 | |
| Shares repurchased | (10,905) | (234,996) | (14,776) | (291,215) |
| Net increase (decrease) | (1,351) | $(28,239) | 2,751 | $54,928 |
| 100 RetirementReady® Funds |
| YEAR ENDED 7/31/18 | YEAR ENDED 7/31/17 | |||
| Class M | Shares | Amount | Shares | Amount |
| Shares sold | 10,644 | $241,443 | 4,854 | $102,788 |
| Shares issued in connection with | ||||
| reinvestment of distributions | 994 | 22,096 | — | — |
| 11,638 | 263,539 | 4,854 | 102,788 | |
| Shares repurchased | (2,011) | (45,615) | (181) | (3,537) |
| Net increase | 9,627 | $217,924 | 4,673 | $99,251 |
| YEAR ENDED 7/31/18 | YEAR ENDED 7/31/17 | |||
| Class R | Shares | Amount | Shares | Amount |
| Shares sold | 9,940 | $241,813 | 20,589 | $454,924 |
| Shares issued in connection with | ||||
| reinvestment of distributions | 1,948 | 48,015 | 36 | 788 |
| 11,888 | 289,828 | 20,625 | 455,712 | |
| Shares repurchased | (73,279) | (1,803,888) | (46,593) | (1,032,489) |
| Net decrease | (61,391) | $(1,514,060) | (25,968) | $(576,777) |
| FOR THE PERIOD 9/2/16 | ||||
| (COMMENCEMENT OF OPERATIONS) | ||||
| YEAR ENDED 7/31/18 | TO 7/31/17 | |||
| Class R6 | Shares | Amount | Shares | Amount |
| Shares sold | 357,796 | $10,177,067 | 500,362 | $12,306,331 |
| Shares issued in connection with | ||||
| reinvestment of distributions | 23,077 | 649,147 | 1,251 | 31,012 |
| 380,873 | 10,826,214 | 501,613 | 12,337,343 | |
| Shares repurchased | (70,029) | (1,996,864) | (35,136) | (902,454) |
| Net increase | 310,844 | $8,829,350 | 466,477 | $11,434,889 |
| YEAR ENDED 7/31/18 | YEAR ENDED 7/31/17 | |||
| Class Y | Shares | Amount | Shares | Amount |
| Shares sold | 89,179 | $2,505,318 | 101,769 | $2,536,953 |
| Shares issued in connection with | ||||
| reinvestment of distributions | 12,020 | 337,749 | 952 | 23,570 |
| 101,199 | 2,843,067 | 102,721 | 2,560,523 | |
| Shares repurchased | (218,503) | (6,168,126) | (416,010) | (10,092,400) |
| Net decrease | (117,304) | $(3,325,059) | (313,289) | $(7,531,877) |
Putnam RetirementReady 2035 Fund
| YEAR ENDED 7/31/18 | YEAR ENDED 7/31/17 | |||
| Class A | Shares | Amount | Shares | Amount |
| Shares sold | 1,137,032 | $27,039,902 | 1,570,728 | $33,771,033 |
| Shares issued in connection with | ||||
| reinvestment of distributions | 121,855 | 2,892,843 | 21,568 | 457,677 |
| 1,258,887 | 29,932,745 | 1,592,296 | 34,228,710 | |
| Shares repurchased | (966,370) | (22,923,372) | (785,907) | (17,023,875) |
| Net increase | 292,517 | $7,009,373 | 806,389 | $17,204,835 |
| RetirementReady® Funds 101 |
| YEAR ENDED 7/31/18 | YEAR ENDED 7/31/17 | |||
| Class B | Shares | Amount | Shares | Amount |
| Shares sold | 542 | $11,677 | 3,138 | $61,018 |
| Shares issued in connection with | ||||
| reinvestment of distributions | 1,060 | 23,169 | — | — |
| 1,602 | 34,846 | 3,138 | 61,018 | |
| Shares repurchased | (5,860) | (128,194) | (25,062) | (503,850) |
| Net decrease | (4,258) | $(93,348) | (21,924) | $(442,832) |
| YEAR ENDED 7/31/18 | YEAR ENDED 7/31/17 | |||
| Class C | Shares | Amount | Shares | Amount |
| Shares sold | 7,684 | $166,528 | 13,136 | $260,316 |
| Shares issued in connection with | ||||
| reinvestment of distributions | 2,127 | 46,237 | 23 | 441 |
| 9,811 | 212,765 | 13,159 | 260,757 | |
| Shares repurchased | (18,631) | (405,331) | (17,404) | (338,417) |
| Net decrease | (8,820) | $(192,566) | (4,245) | $(77,660) |
| YEAR ENDED 7/31/18 | YEAR ENDED 7/31/17 | |||
| Class M | Shares | Amount | Shares | Amount |
| Shares sold | 442 | $10,115 | 436 | $9,080 |
| Shares issued in connection with | ||||
| reinvestment of distributions | 763 | 17,439 | 59 | 1,204 |
| 1,205 | 27,554 | 495 | 10,284 | |
| Shares repurchased | (263) | (5,982) | (286) | (5,895) |
| Net increase | 942 | $21,572 | 209 | $4,389 |
| YEAR ENDED 7/31/18 | YEAR ENDED 7/31/17 | |||
| Class R | Shares | Amount | Shares | Amount |
| Shares sold | 28,317 | $641,881 | 34,726 | $731,318 |
| Shares issued in connection with | ||||
| reinvestment of distributions | 2,317 | 52,966 | 492 | 10,079 |
| 30,634 | 694,847 | 35,218 | 741,397 | |
| Shares repurchased | (57,731) | (1,316,348) | (73,216) | (1,526,490) |
| Net decrease | (27,097) | $(621,501) | (37,998) | $(785,093) |
| FOR THE PERIOD 9/2/16 | ||||
| (COMMENCEMENT OF OPERATIONS) | ||||
| YEAR ENDED 7/31/18 | TO 7/31/17 | |||
| Class R6 | Shares | Amount | Shares | Amount |
| Shares sold | 226,586 | $6,382,951 | 629,127 | $15,501,445 |
| Shares issued in connection with | ||||
| reinvestment of distributions | 22,266 | 621,005 | 3,344 | 82,853 |
| 248,852 | 7,003,956 | 632,471 | 15,584,298 | |
| Shares repurchased | (63,460) | (1,781,017) | (64,189) | (1,653,225) |
| Net increase | 185,392 | $5,222,939 | 568,282 | $13,931,073 |
| 102 RetirementReady® Funds |
| YEAR ENDED 7/31/18 | YEAR ENDED 7/31/17 | |||
| Class Y | Shares | Amount | Shares | Amount |
| Shares sold | 220,019 | $6,156,470 | 170,802 | $4,342,380 |
| Shares issued in connection with | ||||
| reinvestment of distributions | 12,458 | 346,950 | 2,019 | 49,994 |
| 232,477 | 6,503,420 | 172,821 | 4,392,374 | |
| Shares repurchased | (103,745) | (2,885,093) | (550,820) | (13,467,739) |
| Net increase (decrease) | 128,732 | $3,618,327 | (377,999) | $(9,075,365) |
Putnam RetirementReady 2030 Fund
| YEAR ENDED 7/31/18 | YEAR ENDED 7/31/17 | |||
| Class A | Shares | Amount | Shares | Amount |
| Shares sold | 1,249,347 | $28,768,089 | 3,791,748 | $80,302,792 |
| Shares issued in connection with | ||||
| reinvestment of distributions | 220,018 | 5,060,413 | 47,646 | 998,181 |
| 1,469,365 | 33,828,502 | 3,839,394 | 81,300,973 | |
| Shares repurchased | (1,940,004) | (44,685,804) | (2,210,825) | (47,152,825) |
| Net increase (decrease) | (470,639) | $(10,857,302) | 1,628,569 | $34,148,148 |
| YEAR ENDED 7/31/18 | YEAR ENDED 7/31/17 | |||
| Class B | Shares | Amount | Shares | Amount |
| Shares sold | 110 | $2,412 | 10,268 | $208,339 |
| Shares issued in connection with | ||||
| reinvestment of distributions | 1,391 | 30,451 | — | — |
| 1,501 | 32,863 | 10,268 | 208,339 | |
| Shares repurchased | (15,751) | (345,551) | (13,171) | (269,732) |
| Net decrease | (14,250) | $(312,688) | (2,903) | $(61,393) |
| YEAR ENDED 7/31/18 | YEAR ENDED 7/31/17 | |||
| Class C | Shares | Amount | Shares | Amount |
| Shares sold | 20,608 | $448,673 | 20,219 | $408,097 |
| Shares issued in connection with | ||||
| reinvestment of distributions | 2,043 | 44,587 | 29 | 575 |
| 22,651 | 493,260 | 20,248 | 408,672 | |
| Shares repurchased | (28,808) | (627,397) | (25,085) | (512,130) |
| Net decrease | (6,157) | $(134,137) | (4,837) | $(103,458) |
| YEAR ENDED 7/31/18 | YEAR ENDED 7/31/17 | |||
| Class M | Shares | Amount | Shares | Amount |
| Shares sold | 5,212 | $118,148 | 6,656 | $140,052 |
| Shares issued in connection with | ||||
| reinvestment of distributions | 326 | 7,290 | — | — |
| 5,538 | 125,438 | 6,656 | 140,052 | |
| Shares repurchased | (1,269) | (28,296) | (8,439) | (174,702) |
| Net increase (decrease) | 4,269 | $97,142 | (1,783) | $(34,650) |
| RetirementReady® Funds 103 |
| YEAR ENDED 7/31/18 | YEAR ENDED 7/31/17 | |||
| Class R | Shares | Amount | Shares | Amount |
| Shares sold | 15,700 | $341,955 | 55,443 | $1,136,140 |
| Shares issued in connection with | ||||
| reinvestment of distributions | 3,145 | 68,680 | 602 | 11,991 |
| 18,845 | 410,635 | 56,045 | 1,148,131 | |
| Shares repurchased | (111,896) | (2,424,057) | (85,575) | (1,724,705) |
| Net decrease | (93,051) | $(2,013,422) | (29,530) | $(576,574) |
| FOR THE PERIOD 9/2/16 | ||||
| (COMMENCEMENT OF OPERATIONS) | ||||
| YEAR ENDED 7/31/18 | TO 7/31/17 | |||
| Class R6 | Shares | Amount | Shares | Amount |
| Shares sold | 295,816 | $7,880,145 | 577,584 | $13,810,694 |
| Shares issued in connection with | ||||
| reinvestment of distributions | 19,309 | 511,113 | 3,079 | 73,892 |
| 315,125 | 8,391,258 | 580,663 | 13,884,586 | |
| Shares repurchased | (30,406) | (806,792) | (46,643) | (1,161,754) |
| Net increase | 284,719 | $7,584,466 | 534,020 | $12,722,832 |
| YEAR ENDED 7/31/18 | YEAR ENDED 7/31/17 | |||
| Class Y | Shares | Amount | Shares | Amount |
| Shares sold | 150,549 | $4,004,307 | 129,488 | $3,178,358 |
| Shares issued in connection with | ||||
| reinvestment of distributions | 8,706 | 230,176 | 1,512 | 36,267 |
| 159,255 | 4,234,483 | 131,000 | 3,214,625 | |
| Shares repurchased | (149,748) | (3,951,731) | (514,397) | (12,226,788) |
| Net increase (decrease) | 9,507 | $282,752 | (383,397) | $(9,012,163) |
Putnam RetirementReady 2025 Fund
| YEAR ENDED 7/31/18 | YEAR ENDED 7/31/17 | |||
| Class A | Shares | Amount | Shares | Amount |
| Shares sold | 1,349,052 | $30,706,949 | 1,529,898 | $32,767,323 |
| Shares issued in connection with | ||||
| reinvestment of distributions | 81,133 | 1,851,453 | 47,674 | 1,004,973 |
| 1,430,185 | 32,558,402 | 1,577,572 | 33,772,296 | |
| Shares repurchased | (976,388) | (22,218,910) | (823,922) | (17,684,751) |
| Net increase | 453,797 | $10,339,492 | 753,650 | $16,087,545 |
| YEAR ENDED 7/31/18 | YEAR ENDED 7/31/17 | |||
| Class B | Shares | Amount | Shares | Amount |
| Shares sold | 1,592 | $33,599 | 11,619 | $234,714 |
| Shares issued in connection with | ||||
| reinvestment of distributions | 881 | 18,790 | 403 | 7,944 |
| 2,473 | 52,389 | 12,022 | 242,658 | |
| Shares repurchased | (13,235) | (281,927) | (9,474) | (189,261) |
| Net increase (decrease) | (10,762) | $(229,538) | 2,548 | $53,397 |
| 104 RetirementReady® Funds |
| YEAR ENDED 7/31/18 | YEAR ENDED 7/31/17 | |||
| Class C | Shares | Amount | Shares | Amount |
| Shares sold | 25,680 | $543,735 | 20,796 | $417,469 |
| Shares issued in connection with | ||||
| reinvestment of distributions | 1,478 | 31,416 | 871 | 17,133 |
| 27,158 | 575,151 | 21,667 | 434,602 | |
| Shares repurchased | (19,702) | (417,810) | (21,112) | (427,777) |
| Net increase | 7,456 | $157,341 | 555 | $6,825 |
| YEAR ENDED 7/31/18 | YEAR ENDED 7/31/17 | |||
| Class M | Shares | Amount | Shares | Amount |
| Shares sold | 507 | $10,937 | 5,371 | $106,913 |
| Shares issued in connection with | ||||
| reinvestment of distributions | 161 | 3,493 | 192 | 3,844 |
| 668 | 14,430 | 5,563 | 110,757 | |
| Shares repurchased | (2,852) | (61,579) | (5,160) | (107,388) |
| Net increase (decrease) | (2,184) | $(47,149) | 403 | $3,369 |
| YEAR ENDED 7/31/18 | YEAR ENDED 7/31/17 | |||
| Class R | Shares | Amount | Shares | Amount |
| Shares sold | 24,035 | $511,340 | 53,719 | $1,090,424 |
| Shares issued in connection with | ||||
| reinvestment of distributions | 2,033 | 43,496 | 1,444 | 28,585 |
| 26,068 | 554,836 | 55,163 | 1,119,009 | |
| Shares repurchased | (107,701) | (2,288,585) | (49,029) | (981,387) |
| Net increase (decrease) | (81,633) | $(1,733,749) | 6,134 | $137,622 |
| FOR THE PERIOD 9/2/16 | ||||
| (COMMENCEMENT OF OPERATIONS) | ||||
| YEAR ENDED 7/31/18 | TO 7/31/17 | |||
| Class R6 | Shares | Amount | Shares | Amount |
| Shares sold | 332,539 | $7,677,081 | 539,559 | $11,508,262 |
| Shares issued in connection with | ||||
| reinvestment of distributions | 15,476 | 355,490 | 6,639 | 140,803 |
| 348,015 | 8,032,571 | 546,198 | 11,649,065 | |
| Shares repurchased | (52,319) | (1,207,051) | (55,178) | (1,216,126) |
| Net increase | 295,696 | $6,825,520 | 491,020 | $10,432,939 |
| YEAR ENDED 7/31/18 | YEAR ENDED 7/31/17 | |||
| Class Y | Shares | Amount | Shares | Amount |
| Shares sold | 285,613 | $6,548,156 | 128,196 | $2,768,820 |
| Shares issued in connection with | ||||
| reinvestment of distributions | 12,193 | 279,712 | 6,242 | 132,203 |
| 297,806 | 6,827,868 | 134,438 | 2,901,023 | |
| Shares repurchased | (132,216) | (3,029,854) | (561,566) | (11,937,872) |
| Net increase (decrease) | 165,590 | $3,798,014 | (427,128) | $(9,036,849) |
| RetirementReady® Funds 105 |
Putnam RetirementReady 2020 Fund
| YEAR ENDED 7/31/18 | YEAR ENDED 7/31/17 | |||
| Class A | Shares | Amount | Shares | Amount |
| Shares sold | 2,129,950 | $41,813,235 | 5,638,470 | $105,835,491 |
| Shares issued in connection with | ||||
| reinvestment of distributions | 213,746 | 4,197,962 | 85,900 | 1,591,714 |
| 2,343,696 | 46,011,197 | 5,724,370 | 107,427,205 | |
| Shares repurchased | (2,609,365) | (51,183,656) | (3,026,147) | (57,026,841) |
| Net increase (decrease) | (265,669) | $(5,172,459) | 2,698,223 | $50,400,364 |
| YEAR ENDED 7/31/18 | YEAR ENDED 7/31/17 | |||
| Class B | Shares | Amount | Shares | Amount |
| Shares sold | 3,565 | $67,281 | 10,634 | $192,403 |
| Shares issued in connection with | ||||
| reinvestment of distributions | 795 | 15,097 | 190 | 3,396 |
| 4,360 | 82,378 | 10,824 | 195,799 | |
| Shares repurchased | (19,537) | (370,889) | (16,298) | (295,771) |
| Net decrease | (15,177) | $(288,511) | (5,474) | $(99,972) |
| YEAR ENDED 7/31/18 | YEAR ENDED 7/31/17 | |||
| Class C | Shares | Amount | Shares | Amount |
| Shares sold | 34,038 | $640,963 | 22,707 | $408,883 |
| Shares issued in connection with | ||||
| reinvestment of distributions | 1,621 | 30,710 | 443 | 7,930 |
| 35,659 | 671,673 | 23,150 | 416,813 | |
| Shares repurchased | (29,463) | (556,024) | (30,125) | (550,349) |
| Net increase (decrease) | 6,196 | $115,649 | (6,975) | $(133,536) |
| YEAR ENDED 7/31/18 | YEAR ENDED 7/31/17 | |||
| Class M | Shares | Amount | Shares | Amount |
| Shares sold | 1,005 | $19,409 | 4,710 | $87,121 |
| Shares issued in connection with | ||||
| reinvestment of distributions | 120 | 2,326 | 68 | 1,249 |
| 1,125 | 21,735 | 4,778 | 88,370 | |
| Shares repurchased | (6,183) | (118,064) | (1,162) | (21,586) |
| Net increase (decrease) | (5,058) | $(96,329) | 3,616 | $66,784 |
| YEAR ENDED 7/31/18 | YEAR ENDED 7/31/17 | |||
| Class R | Shares | Amount | Shares | Amount |
| Shares sold | 15,638 | $295,915 | 171,352 | $3,135,035 |
| Shares issued in connection with | ||||
| reinvestment of distributions | 4,830 | 91,430 | 1,321 | 23,624 |
| 20,468 | 387,345 | 172,673 | 3,158,659 | |
| Shares repurchased | (134,242) | (2,524,063) | (118,789) | (2,150,383) |
| Net increase (decrease) | (113,774) | $(2,136,718) | 53,884 | $1,008,276 |
| 106 RetirementReady® Funds |
| FOR THE PERIOD 9/2/16 | ||||
| (COMMENCEMENT OF OPERATIONS) | ||||
| YEAR ENDED 7/31/18 | TO 7/31/17 | |||
| Class R6 | Shares | Amount | Shares | Amount |
| Shares sold | 341,753 | $7,618,254 | 209,836 | $4,403,437 |
| Shares issued in connection with | ||||
| reinvestment of distributions | 9,056 | 200,231 | 1,584 | 32,967 |
| 350,809 | 7,818,485 | 211,420 | 4,436,404 | |
| Shares repurchased | (88,580) | (1,962,913) | (36,147) | (772,907) |
| Net increase | 262,229 | $5,855,572 | 175,273 | $3,663,497 |
| YEAR ENDED 7/31/18 | YEAR ENDED 7/31/17 | |||
| Class Y | Shares | Amount | Shares | Amount |
| Shares sold | 60,162 | $1,344,882 | 36,430 | $773,076 |
| Shares issued in connection with | ||||
| reinvestment of distributions | 2,673 | 59,066 | 617 | 12,828 |
| 62,835 | 1,403,948 | 37,047 | 785,904 | |
| Shares repurchased | (60,763) | (1,332,375) | (200,197) | (4,173,554) |
| Net increase (decrease) | 2,072 | $71,573 | (163,150) | $(3,387,650) |
Putnam Retirement Income Fund Lifestyle 1
| YEAR ENDED 7/31/18 | YEAR ENDED 7/31/17 | |||
| Class A | Shares | Amount | Shares | Amount |
| Shares sold | 1,740,133 | $30,843,973 | 1,956,942 | $33,678,424 |
| Shares issued in connection with | ||||
| reinvestment of distributions | 121,015 | 2,143,157 | 47,239 | 804,187 |
| 1,861,148 | 32,987,130 | 2,004,181 | 34,482,611 | |
| Shares repurchased | (1,166,532) | (20,676,771) | (1,183,031) | (20,313,533) |
| Net increase | 694,616 | $12,310,359 | 821,150 | $14,169,078 |
| YEAR ENDED 7/31/18 | YEAR ENDED 7/31/17 | |||
| Class B | Shares | Amount | Shares | Amount |
| Shares sold | 1 | $22 | 1,979 | $33,327 |
| Shares issued in connection with | ||||
| reinvestment of distributions | 1,097 | 19,005 | 505 | 8,409 |
| 1,098 | 19,027 | 2,484 | 41,736 | |
| Shares repurchased | (8,494) | (147,052) | (11,036) | (185,862) |
| Net decrease | (7,396) | $(128,025) | (8,552) | $(144,126) |
| YEAR ENDED 7/31/18 | YEAR ENDED 7/31/17 | |||
| Class C | Shares | Amount | Shares | Amount |
| Shares sold | 6,637 | $115,997 | 8,984 | $151,873 |
| Shares issued in connection with | ||||
| reinvestment of distributions | 1,781 | 30,944 | 903 | 15,064 |
| 8,418 | 146,941 | 9,887 | 166,937 | |
| Shares repurchased | (37,432) | (649,590) | (23,231) | (392,796) |
| Net decrease | (29,014) | $(502,649) | (13,344) | $(225,859) |
| RetirementReady® Funds 107 |
| YEAR ENDED 7/31/18 | YEAR ENDED 7/31/17 | |||
| Class M | Shares | Amount | Shares | Amount |
| Shares sold | 3,173 | $56,412 | 3,243 | $56,010 |
| Shares issued in connection with | ||||
| reinvestment of distributions | 668 | 11,858 | 284 | 4,840 |
| 3,841 | 68,270 | 3,527 | 60,850 | |
| Shares repurchased | (595) | (10,574) | (5,857) | (100,858) |
| Net increase (decrease) | 3,246 | $57,696 | (2,330) | $(40,008) |
| YEAR ENDED 7/31/18 | YEAR ENDED 7/31/17 | |||
| Class R | Shares | Amount | Shares | Amount |
| Shares sold | 31,918 | $559,273 | 10,753 | $184,326 |
| Shares issued in connection with | ||||
| reinvestment of distributions | 913 | 16,169 | 721 | 12,228 |
| 32,831 | 575,442 | 11,474 | 196,554 | |
| Shares repurchased | (44,323) | (779,677) | (54,624) | (935,747) |
| Net decrease | (11,492) | $(204,235) | (43,150) | $(739,193) |
| FOR THE PERIOD 9/2/16 | ||||
| (COMMENCEMENT OF OPERATIONS) | ||||
| YEAR ENDED 7/31/18 | TO 7/31/17 | |||
| Class R6 | Shares | Amount | Shares | Amount |
| Shares sold | 36,022 | $639,353 | 221,672 | $3,823,086 |
| Shares issued in connection with | ||||
| reinvestment of distributions | 6,024 | 107,045 | 1,996 | 34,246 |
| 42,046 | 746,398 | 223,668 | 3,857,332 | |
| Shares repurchased | (34,305) | (611,303) | (14,076) | (245,254) |
| Net increase | 7,741 | $135,095 | 209,592 | $3,612,078 |
| YEAR ENDED 7/31/18 | YEAR ENDED 7/31/17 | |||
| Class Y | Shares | Amount | Shares | Amount |
| Shares sold | 130,494 | $2,325,432 | 62,879 | $1,084,247 |
| Shares issued in connection with | ||||
| reinvestment of distributions | 6,490 | 115,351 | 3,227 | 55,219 |
| 136,984 | 2,440,783 | 66,106 | 1,139,466 | |
| Shares repurchased | (73,797) | (1,310,364) | (312,433) | (5,363,372) |
| Net increase (decrease) | 63,187 | $1,130,419 | (246,327) | $(4,223,906) |
| 108 RetirementReady® Funds |
At the close of the reporting period, Putnam Investments, LLC owned the following shares of each fund:
| Percentage of | Fair value at the | ||
| shares | end of the | ||
| Shares owned | outstanding | reporting period | |
| Putnam RetirementReady 2060 Fund class B | 1,084 | 81.50% | $12,639 |
| Putnam RetirementReady 2060 Fund class M | 1,089 | 46.46 | 12,720 |
| Putnam RetirementReady 2060 Fund class R | 1,095 | 46.12 | 12,801 |
| Putnam RetirementReady 2060 Fund class R6 | 1,094 | 2.96 | 12,876 |
| Putnam RetirementReady 2060 Fund class Y | 1,105 | 25.26 | 12,973 |
At the close of the reporting period, the following funds’ had shareholders of record that owned the following percentages of the outstanding shares of the fund.
| Putnam RetirementReady 2060 Fund | 40.3%, 5.3% |
| Putnam RetirementReady 2055 Fund | 18.2%, 11.8% |
| Putnam RetirementReady 2050 Fund | 11.6% |
| Putnam RetirementReady 2045 Fund | 10.0%, 6.9% |
| Putnam RetirementReady 2040 Fund | 7.3% |
| Putnam RetirementReady 2035 Fund | 12.5% |
| Putnam RetirementReady 2030 Fund | 6.4% |
| Putnam RetirementReady 2025 Fund | 9.3%, 6.2% |
| RetirementReady® Funds 109 |
Note 5: Transactions with affiliated issuers
Transactions during the reporting period with a company which is under common ownership or control, or involving securities of companies in which a fund owned at least 5% of the outstanding voting securities, were as follows:
Putnam RetirementReady 2060 Fund
| Change in | |||||||||
| unrealized | Shares | ||||||||
| Fair value | Purchase | Sale | Investment | Capital gain | Realized | appreciation | outstanding | Fair value | |
| Affiliates | as of 7/31/17 | cost | proceeds | income | distributions | gain (loss) | (depreciation) | as of 7/31/18 | as of 7/31/18 |
| Putnam Absolute Return 100 | |||||||||
| Fund Class P* | $1,338 | $4,276 | $5,595 | $84 | $ — | $(7) | $(12) | — | $— |
| Putnam Fixed Income Absolute | |||||||||
| Return Fund Class P** | — | 6,842 | 1,610 | 30 | — | 4 | 1 | 531 | 5,237 |
| Putnam Absolute Return 500 | |||||||||
| Fund Class P† | 5,926 | 15,234 | 21,119 | 291 | 632 | 93 | (134) | — | — |
| Putnam Multi-Asset Absolute | |||||||||
| Return Fund Class P‡ | 20,282 | 94,269 | 27,758 | 967 | 219 | 585 | (2,854) | 7,115 | 84,524 |
| Putnam Dynamic Asset Allocation | |||||||||
| Equity Fund Class P | 199,978 | 692,894 | 247,578 | 9,407 | 27,231 | 22,078 | (9,079) | 48,156 | 658,293 |
| Putnam Dynamic Asset Allocation | |||||||||
| Growth Fund Class P | 43,541 | 152,476 | 53,570 | 1,963 | 6,988 | 3,111 | (2,648) | 8,051 | 142,910 |
| Putnam Government Money | |||||||||
| Market Fund Class G | 1,218 | 5,942 | 3,040 | — | — | — | — | 4,120 | 4,120 |
| Totals | $272,283 | $971,933 | $360,270 | $12,742 | $35,070 | $25,864 | $(14,726) | $895,084 |
Putnam RetirementReady 2055 Fund
| Change in | |||||||||
| unrealized | Shares | ||||||||
| Fair value | Purchase | Sale | Investment | Capital gain | Realized | appreciation | outstanding | Fair value | |
| Affiliates | as of 7/31/17 | cost | proceeds | income | distributions | gain (loss) | (depreciation) | as of 7/31/18 | as of 7/31/18 |
| Putnam Absolute Return 100 | |||||||||
| Fund Class P* | $118,144 | $94,474 | $211,792 | $3,922 | $— | $364 | $(1,190) | — | $— |
| Putnam Fixed Income Absolute | |||||||||
| Return Fund Class P** | — | 198,153 | 12,411 | 1,291 | — | 34 | 118 | 18,834 | 185,894 |
| Putnam Absolute Return 500 | |||||||||
| Fund Class P† | 374,105 | 224,948 | 589,673 | 10,189 | 20,465 | 3,498 | (12,878) | — | — |
| Putnam Multi-Asset Absolute | |||||||||
| Return Fund Class P‡ | 1,280,764 | 1,486,854 | 459,718 | 34,168 | 7,727 | 31,218 | (87,362) | 189,542 | 2,251,756 |
| Putnam Dynamic Asset Allocation | |||||||||
| Equity Fund Class P | 12,240,553 | 8,283,769 | 4,582,017 | 311,108 | 900,628 | 867,406 | (363,623) | 1,203,079 | 16,446,088 |
| Putnam Dynamic Asset Allocation | |||||||||
| Growth Fund Class P | 3,112,089 | 2,931,619 | 1,183,216 | 88,826 | 316,249 | 172,606 | (146,951) | 275,276 | 4,886,147 |
| Putnam Government Money | |||||||||
| Market Fund Class G | 77,143 | 129,741 | 99,233 | 1,481 | — | — | — | 107,651 | 107,651 |
| Totals | $17,202,798 | $13,349,558 | $7,138,060 | $450,985 | $1,245,069 | $1,075,126 | $(611,886) | $23,877,536 |
| 110 RetirementReady® Funds | RetirementReady® Funds 111 |
Putnam RetirementReady 2050 Fund
| Change in | |||||||||
| unrealized | Shares | ||||||||
| Fair value | Purchase | Sale | Investment | Capital gain | Realized | appreciation | outstanding | Fair value | |
| Affiliates | as of 7/31/17 | cost | proceeds | income | distributions | gain (loss) | (depreciation) | as of 7/31/18 | as of 7/31/18 |
| Putnam Absolute Return 100 | |||||||||
| Fund Class P* | $715,775 | $370,412 | $1,081,994 | $21,654 | $— | $4,231 | $(8,424) | — | $— |
| Putnam Fixed Income Absolute | |||||||||
| Return Fund Class P** | — | 1,013,559 | 109,649 | 6,317 | — | 424 | (356) | 91,588 | 903,978 |
| Putnam Absolute Return 500 | |||||||||
| Fund Class P† | 1,220,613 | 413,887 | 1,593,043 | 29,832 | 35,618 | 2,096 | (43,553) | — | — |
| Putnam Multi-Asset Absolute | |||||||||
| Return Fund Class P‡ | 4,179,126 | 3,280,314 | 1,512,317 | 100,746 | 22,784 | 80,034 | (187,322) | 491,569 | 5,839,835 |
| Putnam Dynamic Asset Allocation | |||||||||
| Equity Fund Class P | 31,277,229 | 12,029,858 | 11,931,194 | 702,790 | 2,034,511 | 2,296,224 | (1,093,640) | 2,383,210 | 32,578,477 |
| Putnam Dynamic Asset Allocation | |||||||||
| Growth Fund Class P | 18,457,298 | 10,207,731 | 6,572,798 | 461,476 | 1,642,995 | 1,012,913 | (844,598) | 1,254,115 | 22,260,546 |
| Putnam Government Money | |||||||||
| Market Fund Class G | 253,175 | 322,456 | 304,118 | 3,157 | — | — | — | 271,513 | 271,513 |
| Totals | $56,103,216 | $27,638,217 | $23,105,113 | $1,325,972 | $3,735,908 | $3,395,922 | $(2,177,893) | $61,854,349 |
Putnam RetirementReady 2045 Fund
| Change in | |||||||||
| unrealized | Shares | ||||||||
| Fair value | Purchase | Sale | Investment | Capital gain | Realized | appreciation | outstanding | Fair value | |
| Affiliates | as of 7/31/17 | cost | proceeds | income | distributions | gain (loss) | (depreciation) | as of 7/31/18 | as of 7/31/18 |
| Putnam Absolute Return 100 | |||||||||
| Fund Class P* | $1,258,156 | $805,330 | $2,056,144 | $39,595 | $— | $6,730 | $(14,072) | — | $— |
| Putnam Fixed Income Absolute | |||||||||
| Return Fund Class P** | — | 1,891,712 | 191,583 | 11,920 | — | 611 | (1,216) | 172,191 | 1,699,524 |
| Putnam Absolute Return 500 | |||||||||
| Fund Class P† | 1,267,824 | 757,147 | 1,985,189 | 35,753 | 42,922 | 2,770 | (42,552) | — | — |
| Putnam Multi-Asset Absolute | |||||||||
| Return Fund Class P‡ | 4,340,797 | 4,292,131 | 1,773,128 | 110,461 | 24,981 | 87,444 | (223,701) | 565,955 | 6,723,543 |
| Putnam Dynamic Asset Allocation | |||||||||
| Equity Fund Class P | 21,736,752 | 10,723,228 | 9,999,751 | 487,788 | 1,412,098 | 1,958,333 | (1,093,304) | 1,706,310 | 23,325,258 |
| Putnam Dynamic Asset Allocation | |||||||||
| Growth Fund Class P | 29,369,667 | 19,555,654 | 11,625,892 | 755,500 | 2,689,809 | 1,769,338 | (1,477,194) | 2,117,835 | 37,591,573 |
| Putnam Government Money | |||||||||
| Market Fund Class G | 260,309 | 386,302 | 338,761 | 2,808 | — | — | — | 307,850 | 307,850 |
| Totals | $58,233,505 | $38,411,504 | $27,970,448 | $1,443,825 | $4,169,810 | $3,825,226 | $(2,852,039) | $69,647,748 |
| 112 RetirementReady® Funds | RetirementReady® Funds 113 |
Putnam RetirementReady 2040 Fund
| Change in | |||||||||
| unrealized | Shares | ||||||||
| Fair value | Purchase | Sale | Investment | Capital gain | Realized | appreciation | outstanding | Fair value | |
| Affiliates | as of 7/31/17 | cost | proceeds | income | distributions | gain (loss) | (depreciation) | as of 7/31/18 | as of 7/31/18 |
| Putnam Absolute Return 100 | |||||||||
| Fund Class P* | $3,503,684 | $1,025,085 | $4,515,397 | $90,995 | $— | $31,194 | $(44,566) | — | $— |
| Putnam Fixed Income Absolute | |||||||||
| Return Fund Class P** | 279,738 | 4,676,570 | 535,633 | 57,500 | — | (1,289) | (12,062) | 446,537 | 4,407,324 |
| Putnam Absolute Return 500 | |||||||||
| Fund Class P† | 5,366,986 | 2,026,739 | 7,216,895 | 136,604 | 162,608 | 31,620 | (208,450) | — | — |
| Putnam Multi-Asset Absolute | |||||||||
| Return Fund Class P‡ | 12,057,563 | 12,275,122 | 4,233,607 | 304,790 | 68,928 | 273,284 | (635,176) | 1,661,379 | 19,737,186 |
| Putnam Dynamic Asset Allocation | |||||||||
| Balanced Fund Class P | 2,697,611 | 4,612,341 | 1,481,565 | 93,743 | 260,225 | 129,947 | (61,305) | 379,719 | 5,897,029 |
| Putnam Dynamic Asset Allocation | |||||||||
| Equity Fund Class P | 19,478,181 | 5,708,948 | 9,419,820 | 355,183 | 1,028,222 | 1,887,039 | (1,163,876) | 1,206,326 | 16,490,472 |
| Putnam Dynamic Asset Allocation | |||||||||
| Growth Fund Class P | 97,123,564 | 37,214,100 | 29,374,751 | 2,194,408 | 7,812,754 | 4,395,356 | (3,341,122) | 5,972,797 | 106,017,147 |
| Putnam Government Money | |||||||||
| Market Fund Class G | 2,054,506 | 1,871,023 | 1,265,336 | 26,215 | — | — | — | 2,660,193 | 2,660,193 |
| Totals | $142,561,833 | $69,409,928 | $58,043,004 | $3,259,438 | $9,332,737 | $6,747,151 | $(5,466,557) | $155,209,351 |
Putnam RetirementReady 2035 Fund
| Change in | |||||||||
| unrealized | Shares | ||||||||
| Fair value | Purchase | Sale | Investment | Capital gain | Realized | appreciation | outstanding | Fair value | |
| Affiliates | as of 7/31/17 | cost | proceeds | income | distributions | gain (loss) | (depreciation) | as of 7/31/18 | as of 7/31/18 |
| Putnam Absolute Return 100 | |||||||||
| Fund Class P* | $2,892,920 | $1,432,834 | $4,310,960 | $85,207 | $— | $12,584 | $(27,378) | — | $— |
| Putnam Fixed Income Absolute | |||||||||
| Return Fund Class P** | 1,752,987 | 5,739,339 | 966,490 | 165,382 | — | 13,391 | (55,299) | 656,933 | 6,483,928 |
| Putnam Absolute Return 500 | |||||||||
| Fund Class P† | 5,413,810 | 2,401,402 | 7,638,559 | 141,071 | 168,552 | (21,131) | (155,522) | — | — |
| Putnam Multi-Asset Absolute | |||||||||
| Return Fund Class P‡ | 11,606,344 | 13,569,660 | 3,861,427 | 311,025 | 70,338 | 66,661 | (482,404) | 1,759,161 | 20,898,834 |
| Putnam Dynamic Asset Allocation | |||||||||
| Balanced Fund Class P | 16,536,183 | 16,557,710 | 6,362,729 | 445,037 | 1,153,280 | 643,748 | (264,447) | 1,745,683 | 27,110,465 |
| Putnam Dynamic Asset Allocation | |||||||||
| Growth Fund Class P | 63,799,989 | 27,839,421 | 26,022,474 | 1,324,630 | 4,716,073 | 3,767,310 | (2,985,362) | 3,740,782 | 66,398,884 |
| Putnam Government Money | |||||||||
| Market Fund Class G | 2,847,562 | 2,071,823 | 1,299,784 | 35,411 | — | — | — | 3,619,601 | 3,619,601 |
| Totals | $104,849,795 | $69,612,189 | $50,462,423 | $2,507,763 | $6,108,243 | $4,482,563 | $(3,970,412) | $124,511,712 |
| 114 RetirementReady® Funds | RetirementReady® Funds 115 |
Putnam RetirementReady 2030 Fund
| Change in | |||||||||
| unrealized | Shares | ||||||||
| Fair value | Purchase | Sale | Investment | Capital gain | Realized | appreciation | outstanding | Fair value | |
| Affiliates | as of 7/31/17 | cost | proceeds | income | distributions | gain (loss) | (depreciation) | as of 7/31/18 | as of 7/31/18 |
| Putnam Absolute Return 100 | |||||||||
| Fund Class P* | $7,365,503 | $2,150,608 | $9,486,236 | $191,269 | $— | $59,263 | $(89,138) | — | $— |
| Putnam Fixed Income Absolute | |||||||||
| Return Fund Class P** | 9,672,245 | 13,169,240 | 3,834,014 | 633,273 | — | 93,661 | (250,399) | 1,909,902 | 18,850,733 |
| Putnam Absolute Return 500 | |||||||||
| Fund Class P† | 13,087,505 | 4,862,322 | 17,552,194 | 331,210 | 391,089 | 91,239 | (488,872) | — | — |
| Putnam Multi-Asset Absolute | |||||||||
| Return Fund Class P‡ | 26,485,760 | 22,929,291 | 8,123,370 | 600,861 | 135,884 | 432,286 | (1,148,049) | 3,415,481 | 40,575,918 |
| Putnam Dynamic Asset Allocation | |||||||||
| Balanced Fund Class P | 84,241,519 | 32,896,082 | 25,830,869 | 1,687,206 | 4,229,944 | 2,968,992 | (1,194,270) | 5,993,655 | 93,081,454 |
| Putnam Dynamic Asset Allocation | |||||||||
| Conservative Fund Class P | 1,954,297 | 518,022 | 528,530 | 41,713 | 13,410 | 23,892 | (859) | 181,274 | 1,966,822 |
| Putnam Dynamic Asset Allocation | |||||||||
| Growth Fund Class P | 46,027,401 | 10,930,747 | 22,750,250 | 743,885 | 2,648,455 | 3,987,038 | (3,300,100) | 1,965,906 | 34,894,836 |
| Putnam Government Money | |||||||||
| Market Fund Class G | 7,289,634 | 3,246,872 | 2,855,617 | 80,630 | — | — | — | 7,680,889 | 7,680,889 |
| Totals | $196,123,864 | $90,703,184 | $90,961,080 | $4,310,047 | $7,418,782 | $7,656,371 | $(6,471,687) | $197,050,652 |
Putnam RetirementReady 2025 Fund
| Change in | |||||||||
| unrealized | Shares | ||||||||
| Fair value | Purchase | Sale | Investment | Capital gain | Realized | appreciation | outstanding | Fair value | |
| Affiliates | as of 7/31/17 | cost | proceeds | income | distributions | gain (loss) | (depreciation) | as of 7/31/18 | as of 7/31/18 |
| Putnam Absolute Return 100 | |||||||||
| Fund Class P* | $5,316,249 | $2,371,745 | $7,661,534 | $154,533 | $— | $24,405 | $(50,865) | — | $— |
| Putnam Fixed Income Absolute | |||||||||
| Return Fund Class P** | 9,656,729 | 13,543,843 | 3,726,841 | 675,804 | — | (20,572) | (150,077) | 1,955,733 | 19,303,082 |
| Putnam Absolute Return 500 | |||||||||
| Fund Class P† | 12,535,255 | 7,899,387 | 20,010,716 | 376,387 | 448,727 | (45,472) | (378,454) | — | — |
| Putnam Multi-Asset Absolute | |||||||||
| Return Fund Class P‡ | 14,095,671 | 25,249,507 | 5,741,017 | 339,827 | 76,851 | 70,296 | (726,250) | 2,773,418 | 32,948,207 |
| Putnam Dynamic Asset Allocation | |||||||||
| Balanced Fund Class P | 51,266,531 | 23,117,753 | 20,893,494 | 983,530 | 2,335,676 | 2,140,378 | (1,071,886) | 3,513,154 | 54,559,282 |
| Putnam Dynamic Asset Allocation | |||||||||
| Conservative Fund Class P | 9,111,563 | 9,918,900 | 3,491,009 | 298,796 | 100,584 | 180,912 | (67,486) | 1,442,662 | 15,652,880 |
| Putnam Government Money | |||||||||
| Market Fund Class G | 5,269,843 | 3,330,003 | 2,003,246 | 66,155 | — | — | — | 6,596,600 | 6,596,600 |
| Totals | $107,251,841 | $85,431,138 | $63,527,857 | $2,895,032 | $2,961,838 | $2,349,947 | $(2,445,018) | $129,060,051 |
| 116 RetirementReady® Funds | RetirementReady® Funds 117 |
Putnam RetirementReady 2020 Fund
| Change in | |||||||||
| unrealized | Shares | ||||||||
| Fair value | Purchase | Sale | Investment | Capital gain | Realized | appreciation | outstanding | Fair value | |
| Affiliates | as of 7/31/17 | cost | proceeds | income | distributions | gain (loss) | (depreciation) | as of 7/31/18 | as of 7/31/18 |
| Putnam Absolute Return 100 | |||||||||
| Fund Class P* | $13,121,771 | $4,555,587 | $17,614,844 | $358,712 | $— | $114,255 | $(176,769) | — | $— |
| Putnam Fixed Income Absolute | |||||||||
| Return Fund Class P** | 27,934,935 | 28,766,143 | 10,974,287 | 1,749,379 | — | 408,382 | (854,005) | 4,587,758 | 45,281,168 |
| Putnam Absolute Return 500 | |||||||||
| Fund Class P† | 43,412,497 | 16,134,141 | 58,290,555 | 1,099,916 | 1,292,174 | 582,105 | (1,838,188) | — | — |
| Putnam Multi-Asset Absolute | |||||||||
| Return Fund Class P‡ | 14,869,057 | 54,932,705 | 10,218,549 | 273,881 | 61,938 | 670,522 | (1,724,493) | 4,926,704 | 58,529,242 |
| Putnam Dynamic Asset Allocation | |||||||||
| Balanced Fund Class P | 39,418,991 | 9,851,327 | 21,022,824 | 591,788 | 1,343,950 | 2,340,485 | (1,584,512) | 1,867,577 | 29,003,467 |
| Putnam Dynamic Asset Allocation | |||||||||
| Conservative Fund Class P | 49,217,553 | 21,424,613 | 16,148,422 | 1,156,824 | 383,092 | 1,157,626 | (577,873) | 5,075,898 | 55,073,497 |
| Putnam Government Money | |||||||||
| Market Fund Class G | 11,810,949 | 4,308,506 | 4,304,558 | 129,873 | — | — | — | 11,814,897 | 11,814,897 |
| Totals | $199,785,753 | $139,973,022 | $138,574,039 | $5,360,373 | $3,081,154 | $5,273,375 | $(6,755,840) | $199,702,271 |
Putnam Retirement Income Fund Lifestyle 1
| Change in | |||||||||
| unrealized | Shares | ||||||||
| Fair value | Purchase | Sale | Investment | Capital gain | Realized | appreciation | outstanding | Fair value | |
| Affiliates | as of 7/31/17 | cost | proceeds | income | distributions | gain (loss) | (depreciation) | as of 7/31/18 | as of 7/31/18 |
| Putnam Absolute Return 100 | |||||||||
| Fund Class P* | $8,195,573 | $2,616,125 | $10,780,961 | $213,081 | $— | $33,185 | $(63,922) | — | $— |
| Putnam Fixed Income Absolute | |||||||||
| Return Fund Class P** | 19,085,452 | 18,658,405 | 6,384,066 | 1,128,811 | — | (208,925) | (56,411) | 3,150,401 | 31,094,455 |
| Putnam Absolute Return 500 | |||||||||
| Fund Class P† | 27,528,717 | 9,699,924 | 36,495,936 | 666,960 | 796,038 | (138,549) | (594,156) | — | — |
| Putnam Multi-Asset Absolute | |||||||||
| Return Fund Class P‡ | — | 33,753,590 | 2,115,067 | — | — | (110,958) | (462,865) | 2,614,874 | 31,064,700 |
| Putnam Dynamic Asset Allocation | |||||||||
| Conservative Fund Class P | 31,215,979 | 13,038,569 | 8,975,196 | 712,639 | 225,587 | 81,755 | 299,279 | 3,286,672 | 35,660,386 |
| Putnam Government Money | |||||||||
| Market Fund Class G | 5,437,413 | 2,565,232 | 1,832,857 | 65,222 | — | — | — | 6,169,788 | 6,169,788 |
| Totals | $91,463,134 | $80,331,845 | $66,584,083 | $2,786,713 | $1,021,625 | $(343,492) | $(878,075) | $103,989,329 | |
* Effective 4/20/18, Putnam Absolute Return 100 Fund is no longer an underlying position within the Putnam RetirementReady Funds suite of funds.
** Effective 4/30/18, Putnam Absolute Return 300 Fund was renamed Putnam Fixed Income Absolute Return Fund.
† Effective 4/30/18, Putnam Absolute Return 500 Fund merged into Putnam Absolute Return 700 Fund.
‡ Effective 4/30/18, Putnam Absolute Return 700 Fund was renamed Putnam Multi-Asset Absolute Return Fund.
| 118 RetirementReady® Funds | RetirementReady® Funds 119 |
Note 6: Market, credit and other risks
In the normal course of business, the underlying Putnam Funds trade financial instruments and enter into financial transactions where risk of potential loss exists due to changes in the market (market risk) or failure of the contracting party to the transaction to perform (credit risk). The underlying Putnam Funds may be exposed to additional credit risk that an institution or other entity with which the fund has unsettled or open transactions will default. The underlying Putnam Funds may invest in foreign securities that involve certain risks, including those related to economic instability, unfavorable political developments, and currency fluctuations. The financial statements of the underlying Putnam Funds contain additional information about the expenses and investments of the underlying Putnam Funds and are available upon request.
| 120 RetirementReady® Funds |
Federal tax information (Unaudited)
Pursuant to §852 of the Internal Revenue Code, as amended, the following funds hereby designate the following monies as a capital gain dividend with respect to the taxable year ended July 31, 2018, or, if subsequently determined to be different, the net capital gain of such year.
| Amount | |
| Putnam RetirementReady 2060 Fund | $49,165 |
| Putnam RetirementReady 2055 Fund | 1,881,806 |
| Putnam RetirementReady 2050 Fund | 5,203,276 |
| Putnam RetirementReady 2045 Fund | 1,555,507 |
| Putnam RetirementReady 2040 Fund | 10,133,258 |
| Putnam RetirementReady 2030 Fund | 1,475,364 |
Each fund designated the following percentages of ordinary income distributions as qualifying for the dividends received deductions for corporations.
| Qualifying % | |
| Putnam RetirementReady 2060 Fund | 21.50% |
| Putnam RetirementReady 2055 Fund | 25.59 |
| Putnam RetirementReady 2050 Fund | 22.71 |
| Putnam RetirementReady 2045 Fund | 21.44 |
| Putnam RetirementReady 2040 Fund | 17.21 |
| Putnam RetirementReady 2035 Fund | 17.55 |
| Putnam RetirementReady 2030 Fund | 19.88 |
| Putnam RetirementReady 2025 Fund | 19.91 |
| Putnam RetirementReady 2020 Fund | 16.39 |
| Putnam Retirement Income Fund Lifestyle 1 | 13.25 |
For the reporting period, each fund hereby designates the following percentages, or the maximum amount allowable, of its taxable ordinary income distributions as qualified dividends taxed at the individual net capital gain rates.
| Qualifying % | |
| Putnam RetirementReady 2060 Fund | 34.22% |
| Putnam RetirementReady 2055 Fund | 40.74 |
| Putnam RetirementReady 2050 Fund | 36.21 |
| Putnam RetirementReady 2045 Fund | 33.69 |
| Putnam RetirementReady 2040 Fund | 27.52 |
| Putnam RetirementReady 2035 Fund | 27.43 |
| Putnam RetirementReady 2030 Fund | 29.75 |
| Putnam RetirementReady 2025 Fund | 29.56 |
| Putnam RetirementReady 2020 Fund | 25.22 |
| Putnam Retirement Income Fund Lifestyle 1 | 20.97 |
The Form 1099 that will be mailed to you in January 2019 will show the tax status of all distributions paid to your account in calendar 2018.
| RetirementReady® Funds 121 |

| 122 RetirementReady® Funds |

* Mr. Reynolds is an “interested person” (as defined in the Investment Company Act of 1940) of the fund and Putnam Investments. He is President and Chief Executive Officer of Putnam Investments, as well as the President of your fund and each of the other Putnam funds.
The address of each Trustee is One Post Office Square, Boston, MA 02109.
As of July 31, 2018, there were 101 Putnam funds. All Trustees serve as Trustees of all Putnam funds.
Each Trustee serves for an indefinite term, until his or her resignation, retirement at age 75, removal, or death.
| RetirementReady® Funds 123 |
Officers
In addition to Robert L. Reynolds, the other officers of the fund are shown below:
| Jonathan S. Horwitz (Born 1955) | Susan G. Malloy (Born 1957) |
| Executive Vice President, Principal Executive Officer, | Vice President and Assistant Treasurer |
| and Compliance Liaison | Since 2007 |
| Since 2004 | Head of Accounting, Middle Office, & Control Services, |
| Putnam Investments and Putnam Management | |
| Robert T. Burns (Born 1961) | |
| Vice President and Chief Legal Officer | Mark C. Trenchard (Born 1962) |
| Since 2011 | Vice President and BSA Compliance Officer |
| General Counsel, Putnam Investments, | Since 2002 |
| Putnam Management, and Putnam Retail Management | Director of Operational Compliance, Putnam |
| Investments and Putnam Retail Management | |
| James F. Clark (Born 1974) | |
| Vice President and Chief Compliance Officer | Nancy E. Florek (Born 1957) |
| Since 2016 | Vice President, Director of Proxy Voting and Corporate |
| Chief Compliance Officer, Putnam Investments | Governance, Assistant Clerk, and Assistant Treasurer |
| and Putnam Management | Since 2000 |
| Michael J. Higgins (Born 1976) | Denere P. Poulack (Born 1968) |
| Vice President, Treasurer, and Clerk | Assistant Vice President, Assistant Clerk, |
| Since 2010 | and Assistant Treasurer |
| Since 2004 | |
| Janet C. Smith (Born 1965) | |
| Vice President, Principal Financial Officer, Principal | |
| Accounting Officer, and Assistant Treasurer | |
| Since 2007 | |
| Head of Fund Administration Services, | |
| Putnam Investments and Putnam Management |
The principal occupations of the officers for the past five years have been with the employers as shown above, although in some cases they have held different positions with such employers. The address of each officer is One Post Office Square, Boston, MA 02109.
| 124 RetirementReady® Funds |
Fund information
Founded over 80 years ago, Putnam Investments was built around the concept that a balance between risk and reward is the hallmark of a well-rounded financial program. We manage over 100 funds across income, value, blend, growth, asset allocation, absolute return, and global sector categories.
| Investment Manager | Trustees | Michael J. Higgins |
| Putnam Investment | Kenneth R. Leibler, Chair | Vice President, Treasurer, |
| Management, LLC | Liaquat Ahamed | and Clerk |
| One Post Office Square | Ravi Akhoury | |
| Boston, MA 02109 | Barbara M. Baumann | Janet C. Smith |
| Katinka Domotorffy | Vice President, | |
| Investment Sub-Advisor | Catharine Bond Hill | Principal Financial Officer, |
| Putnam Investments Limited | Paul L. Joskow | Principal Accounting Officer, |
| 16 St James’s Street | Robert E. Patterson | and Assistant Treasurer |
| London, England SW1A 1ER | George Putnam, III | |
| Robert L. Reynolds | Susan G. Malloy | |
| Marketing Services | Manoj P. Singh | Vice President and |
| Putnam Retail Management | Assistant Treasurer | |
| One Post Office Square | Officers | |
| Boston, MA 02109 | Robert L. Reynolds | Mark C. Trenchard |
| President | Vice President and | |
| Custodian | BSA Compliance Officer | |
| State Street Bank | Jonathan S. Horwitz | |
| and Trust Company | Executive Vice President, | Nancy E. Florek |
| Principal Executive Officer, | Vice President, Director of | |
| Legal Counsel | and Compliance Liaison | Proxy Voting and Corporate |
| Ropes & Gray LLP | Governance, Assistant Clerk, | |
| Robert T. Burns | and Assistant Treasurer | |
| Independent Registered Public | Vice President and | |
| Accounting Firm | Chief Legal Officer | Denere P. Poulack |
| PricewaterhouseCoopers LLP | Assistant Vice President, Assistant | |
| James F. Clark | Clerk, and Assistant Treasurer | |
| Vice President and | ||
| Chief Compliance Officer |
This report is for the information of shareholders of Putnam RetirementReady® Funds. It may also be used as sales literature when preceded or accompanied by the current prospectus, the most recent copy of Putnam’s Quarterly Performance Summary, and Putnam’s Quarterly Ranking Summary. For more recent performance, please visit putnam.com. Investors should carefully consider the investment objectives, risks, charges, and expenses of a fund, which are described in its prospectus. For this and other information or to request a prospectus or summary prospectus, call 1-800-225-1581 toll free. Please read the prospectus carefully before investing. The fund’s Statement of Additional Information contains additional information about the fund’s Trustees and is available without charge upon request by calling 1-800-225-1581.

| Item 2. Code of Ethics: |
| (a) The fund's principal executive, financial and accounting officers are employees of Putnam Investment Management, LLC, the Fund's investment manager. As such they are subject to a comprehensive Code of Ethics adopted and administered by Putnam Investments which is designed to protect the interests of the firm and its clients. The Fund has adopted a Code of Ethics which incorporates the Code of Ethics of Putnam Investments with respect to all of its officers and Trustees who are employees of Putnam Investment Management, LLC. For this reason, the Fund has not adopted a separate code of ethics governing its principal executive, financial and accounting officers. |
| Item 3. Audit Committee Financial Expert: |
| The Funds' Audit, Compliance and Distributions Committee is comprised solely of Trustees who are “independent” (as such term has been defined by the Securities and Exchange Commission (“SEC”) in regulations implementing Section 407 of the Sarbanes-Oxley Act (the “Regulations”)). The Trustees believe that each of the members of the Audit, Compliance and Distributions Committee also possess a combination of knowledge and experience with respect to financial accounting matters, as well as other attributes, that qualify them for service on the Committee. In addition, the Trustees have determined that each of Mr. Patterson, Ms. Baumann and Mr. Singh qualifies as an “audit committee financial expert” (as such term has been defined by the Regulations) based on their review of his or her pertinent experience and education. The SEC has stated, and the funds' amended and restated agreement and Declaration of Trust provides, that the designation or identification of a person as an audit committee financial expert pursuant to this Item 3 of Form N-CSR does not impose on such person any duties, obligations or liability that are greater than the duties, obligations and liability imposed on such person as a member of the Audit, Compliance and Distribution Committee and the Board of Trustees in the absence of such designation or identification. |
| Item 4. Principal Accountant Fees and Services: |
| The following table presents fees billed in each of the last two fiscal years for services rendered to the fund by the fund's independent auditor: |
| Fiscal year ended | Audit Fees | Audit-Related Fees | Tax Fees | All Other Fees | |
| July 31, 2018 | $182,311 | $ — | $60,535 | $ — | |
| July 31, 2017 | $399,846 | $ — | $60,535 | $ — | |
| For the fiscal years ended July 31, 2018 and July 31, 2017, the fund's independent auditor billed aggregate non-audit fees in the amounts of $584,936 and $443,065 respectively, to the fund, Putnam Management and any entity controlling, controlled by or under common control with Putnam Management that provides ongoing services to the fund. |
| Audit Fees represent fees billed for the fund's last two fiscal years relating to the audit and review of the financial statements included in annual reports and registration statements, and other services that are normally provided in connection with statutory and regulatory filings or engagements. |
| Audit-Related Fees represent fees billed in the fund's last two fiscal years for services traditionally performed by the fund's auditor, including accounting consultation for proposed transactions or concerning financial accounting and reporting standards and other audit or attest services not required by statute or regulation. |
| Tax Fees represent fees billed in the fund's last two fiscal years for tax compliance, tax planning and tax advice services. Tax planning and tax advice services include assistance with tax audits, employee benefit plans and requests for rulings or technical advice from taxing authorities. |
| Pre-Approval Policies of the Audit, Compliance and Distributions Committee. The Audit, Compliance and Distributions Committee of the Putnam funds has determined that, as a matter of policy, all work performed for the funds by the funds' independent auditors will be pre-approved by the Committee itself and thus will generally not be subject to pre-approval procedures. |
| The Audit, Compliance and Distributions Committee also has adopted a policy to pre-approve the engagement by Putnam Management and certain of its affiliates of the funds' independent auditors, even in circumstances where pre-approval is not required by applicable law. Any such requests by Putnam Management or certain of its affiliates are typically submitted in writing to the Committee and explain, among other things, the nature of the proposed engagement, the estimated fees, and why this work should be performed by that particular audit firm as opposed to another one. In reviewing such requests, the Committee considers, among other things, whether the provision of such services by the audit firm are compatible with the independence of the audit firm. |
| The following table presents fees billed by the fund's independent auditor for services required to be approved pursuant to paragraph (c)(7)(ii) of Rule 2-01 of Regulation S-X. |
| Fiscal year ended | Audit-Related Fees | Tax Fees | All Other Fees | Total Non-Audit Fees | |
| July 31, 2018 | $ — | $524,401 | $ — | $ — | |
| July 31, 2017 | $ — | $382,530 | $ — | $ — | |
| Item 5. Audit Committee of Listed Registrants |
| Not applicable |
Item 6. Schedule of Investments: |
| The registrant's schedule of investments in unaffiliated issuers is included in the report to shareholders in Item 1 above. |
| Item 7. Disclosure of Proxy Voting Policies and Procedures For Closed-End Management Investment Companies: |
| Not applicable |
Item 8. Portfolio Managers of Closed-End Investment Companies |
| Not Applicable |
Item 9. Purchases of Equity Securities by Closed-End Management Investment Companies and Affiliated Purchasers: |
| Not applicable |
Item 10. Submission of Matters to a Vote of Security Holders: |
| Not applicable |
Item 11. Controls and Procedures: |
| (a) The registrant's principal executive officer and principal financial officer have concluded, based on their evaluation of the effectiveness of the design and operation of the registrant's disclosure controls and procedures as of a date within 90 days of the filing date of this report, that the design and operation of such procedures are generally effective to provide reasonable assurance that information required to be disclosed by the registrant in this report is recorded, processed, summarized and reported within the time periods specified in the Commission's rules and forms. |
| (b) Changes in internal control over financial reporting: Not applicable |
Item 12. Exhibits: |
| (a)(1) The Code of Ethics of The Putnam Funds, which incorporates the Code of Ethics of Putnam Investments, is filed herewith. |
| (a)(2) Separate certifications for the principal executive officer and principal financial officer of the registrant as required by Rule 30a-2(a) under the Investment Company Act of 1940, as amended, are filed herewith. |
| (b) The certifications required by Rule 30a-2(b) under the Investment Company Act of 1940, as amended, are filed herewith. |
| SIGNATURES |
| Pursuant to the requirements of the Securities Exchange Act of 1934 and the Investment Company Act of 1940, the registrant has duly caused this report to be signed on its behalf by the undersigned, thereunto duly authorized. |
| Putnam RetirementReady Funds |
| By (Signature and Title): |
| /s/ Janet C. Smith Janet C. Smith Principal Accounting Officer |
| Date: September 27, 2018 |
| Pursuant to the requirements of the Securities Exchange Act of 1934 and the Investment Company Act of 1940, this report has been signed below by the following persons on behalf of the registrant and in the capacities and on the dates indicated. |
| By (Signature and Title): |
| /s/ Jonathan S. Horwitz Jonathan S. Horwitz Principal Executive Officer |
| Date: September 27, 2018 |
| By (Signature and Title): |
| /s/ Janet C. Smith Janet C. Smith Principal Financial Officer |
| Date: September 27, 2018 |