Safe Harbor Statement under the Private Securities Litigation Reform Act of 1995:
Statements in this presentation regarding The Bancorp, Inc.’s business that are not historical facts are
“forward-looking statements” that involve risks and uncertainties. These statements may be identified
by the use of forward-looking terminology, including the words “may,” “believe,” “will,” “expect,”
“anticipate,” “estimate,” “continue,” or similar words. For further discussion of these risks and
uncertainties, see The Bancorp, Inc.’s filings with the SEC, including the “risk factors” section of
The Bancorp, Inc.’s Form 10-K. These risks and uncertainties could cause actual results to differ
materially from those projected in the forward-looking statements. The forward-looking statements
speak only as of the date of this presentation. The Bancorp, Inc. does not undertake to publicly revise
or update forward-looking statements in this presentation to reflect events or circumstances that arise
after the date of this presentation, except as may be required under applicable law.
FORWARD LOOKING STATEMENTS
2
BUSINESS MODEL: A DISTINCT BUSINESS STRATEGY(1)
5
Assets Deposits
Securities Portfolio
Primarily highly rated government
obligations
• Interest Income
Government Guaranteed
Lending (GGL)
Includes loans to franchisees; many of
which have a 75% guaranteed by U.S.
government
• Interest Income
(1) For the above presentation, revenue for asset-generating
departments includes all revenue from the assets they
fund with deposits they generate. It also includes half
the revenue on assets they generate but do not fund.
The other half of that revenue is allocated to deposit-
producing departments. The revenue shown was
generated in the first quarter of 2014 with the exception of
segments marked 2010, which represent full year 2010.
Commercial Mortgage-Backed
Securities (CMBS)
Commercial Loan Sales
• Non-Interest Income
• Interest Income
Leasing
Automobile Fleet Leasing
• Interest Income
• Non-Interest Income
Community Bank
Traditional Community Banking Products
• Interest Income
• Deposits
• Non-Interest Income
Prepaid Cards
Open Loop Prepaid Cards
• Deposits
• Non-Interest Income
Healthcare
Health Savings Accounts and
Flexible Spending Accounts
• Deposits
• Non-Interest Income
Payment Acceptance
Credit, Debit Card, and ACH Processing
• Deposits
• Non-Interest Income
Institutional Banking
Deposits and Loans for Clients
of Wealth Firms
• Interest Income
• Deposits
• Non-Interest Income
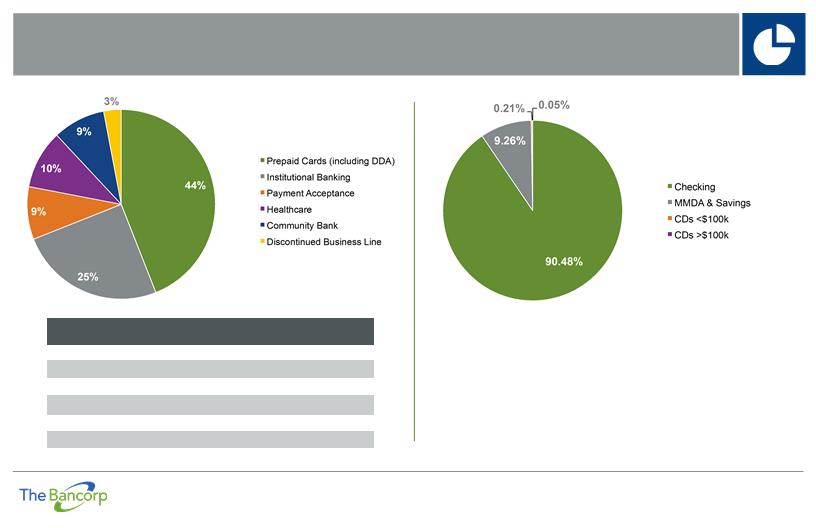
REVENUE
2010 Prepaid
Cards: 30%
2010 Community
Bank: 40%
12
AS WITH FUNDING, THE BANCORP EMPLOYS A MULTI-CHANNEL GROWTH STRATEGY FOR ASSET ORIGINATION.
CATEGORY | Q1 2014 BALANCE | Q1 2013 BALANCE | Q1 2014 AVG. YIELD |
| (in thousands) | |
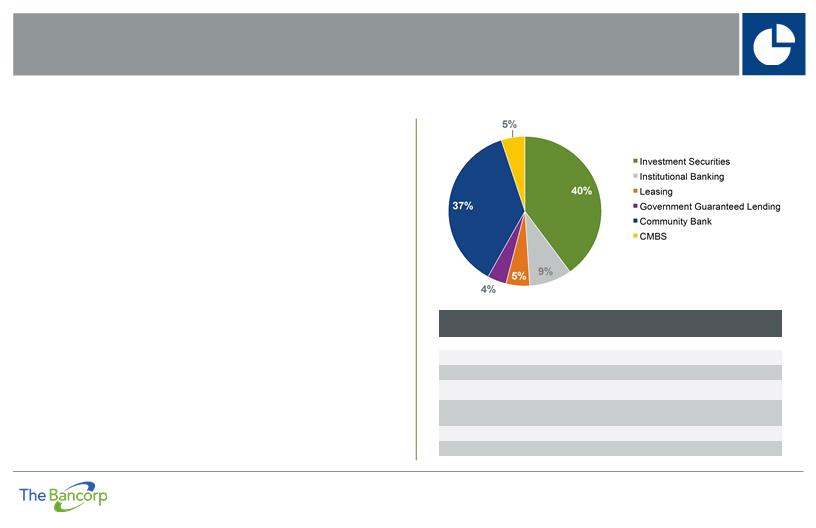
Investment Securities | $1,508,857 | $943,717 | 2.36% |
Institutional Banking | 332,563 | 253,121 | 2.65% |
Leasing | 181,007 | 157,508 | 6.78% |
Government Guaranteed
Lending | 167,628 | 120,902 | 4.57% |
Community Bank | 1,381,199 | 1,408,957 | 3.97% |
CMBS | 203,631 | 28,402 | 3.78% |
PRIMARY ASSET-GENERATING STRATEGIES: BUSINESS LINE OVERVIEW
• Investment Securities
– High credit quality tax exempt municipal obligations
– U.S. Government agency securities and other highly rated mortgage-backed
securities
– Corporate securities which, like other purchases, are validated and monitored
by independent credit advisory specialists
• Institutional Banking
– 15 affinity groups, managing & administering $2.7 trillion in assets
• SEI Investments, Legg Mason, AssetMark Trust Company, Franklin Templeton
– Generates securities-backed and other loans
• Leasing
– Well-collateralized automobile fleet leasing
• Average transaction: 8-15 automobiles, $350,000
• 30.7% of portfolio leased by local, state, and federal government agencies
• Government Guaranteed Lending
– Loans from $150,000 to $5.0 million including loans to franchisees such as
UPS Stores, Massage Envy, FASTSIGNS and Save a Lot, many of which
have a 75% guaranty by the U.S. Small Business Administration
– Approved Franchise and Medical Guidance lines of over $390 million
• Community Bank
– Offers traditional community banking products and services targeting the
highly fragmented Philadelphia/Wilmington banking market
• CMBS
– Loans which are generated for sale into CMBS markets that are
held until their quarterly sale
Adjusted Operating Earnings Reconciliation(1) Category (dollars in thousands) Q1 2014Q4
2013 Q3 2013 Q2 2013 Q1 2013 Q4 2012 Q3 2012 Q2 2012Q1 2012 Q4 2011 Q3 2011 Q2 2011 Q1 2011 Q4 2010 Q3 2010Q2 2010 Q1 2010Net income (loss) available to common shareholders $298 $7,324 $4,788 $5,592 $7,406$5,237$3,561 $3,854 $3,972 $3,288 $2,282 $660 $2,688 $2,041 $588 $407 ($4,056)Preferred stock dividend and accretion 6,242 Income tax expense 1684,0982,0343,2624,4311,6221,795 2,150 2,227 1,382 1,209 289 1,431 946 156 197 1,233 Gain on sales of investment securities(241)(1,104)(42)(476)(267)(554)(107) (136)(20)(603)-14 (2)(469)(750) Other than temporary impairment in securities 2076 126 75 35 Loss on other real estate owned62(8)403815251103533 421 1,451 64 439 52 22 Provision for loan and lease losses17,3006,5008,0009,5005,5007,3915,540 4,287 5,220 4,844 5,019 6,963 4,672 4,212 5,219 5,806 4,148 Core operating earnings $17,587$16,810$15,183$18,693$17,341$13,875$11,322 $10,838 $12,870 $9,378 $8,554 $7,748 $8,918 $7,213 $6,118 $5,941 $6,817
(1) As a supplement to GAAP, Bancorp has provided this non-GAAP performance result. The Bancorp believes that this non-GAAP financial measure is useful because it allows investors to assess its operating performance. Management utilizes adjusted operating earnings to measure the combined impact of changes in net interest income, non-interest income and certain other expenses. Adjusted operating earnings exclude the impact of the provision for loan losses, income taxes, securities gains and losses and certain non-recurring items. Other companies may calculate adjusted operating earnings differently. Although this non-GAAP financial measure is intended to enhance investors’ understanding of Bancorp’s business and performance, it should not be considered, and is not intended to be, a substitute for net income calculated pursuant to GAAP.