Exhibit 99.2
December 2019* *Guidance updated April 2020
Statements in this presentation regarding The Bancorp, Inc.’s business that are not historical facts are “forward - looking statements ”. These statements may be identified by the use of forward - looking terminology, including the words “may,” “believe,” “will,” “expect,” “anticipate,” “estimate,” “intend,” “plan," or similar words, and are based on current expectations about important economic, political, and technological factors, among others, and are subject to risks and uncertainties, which could cause the actual results, events or achievements to differ materially from those set forth in or implied by the forward - looking statements and related assumptions. These risks and uncertainties include those relating to the on - going COVID - 19 pandemic, the impact it will have on our business and the industry as a whole, and the resulting governmental and societal responses . For further discussion of these risks and uncertainties, see the “risk factors” sections contained in this presentation, in The Bancorp, Inc.’s Annual Report on Form 10 - K for the year ended December 31, 2019 and in its other public filings with the SEC. In addition, these forward - looking statements are based upon assumptions with respect to future strategies and decisions that are subject to change. Actual results may differ materially from the anticipated results discussed in these forward - looking statements. The forward - looking statements speak only as of the date of this presentation. The Bancorp, Inc. does not undertake to publicly revise or update forward - looking statements in this presentation to reflect events or circumstances that arise after the date of this presentation, except as may be required under applicable law. This presentation contains information regarding financial results that is calculated and presented on the basis of methodologies other than in accordance with accounting principles generally accepted in the United States (“GAAP”). This presentation may contain statistics and other data that in some cases has been obtained from or compiled from information made available by third - party service providers. The Bancorp, Inc. makes no representation or warranty, express or implied, with respect to the accuracy, reasonableness or completeness of such information. Past performance is not indicative nor a guarantee of future results. Copies of the documents filed by The Bancorp, Inc. with the SEC are available free of charge from the website of the SEC at www.sec.gov as well as on The Bancorp, Inc.’s website at www.thebancorp.com . This document is for information purposes only and shall not constitute an offer to sell or the solicitation of an offer to buy any securities. 2 DISCLOSURES FORWARD LOOKING STATEMENTS & OTHER DISCLOSURES
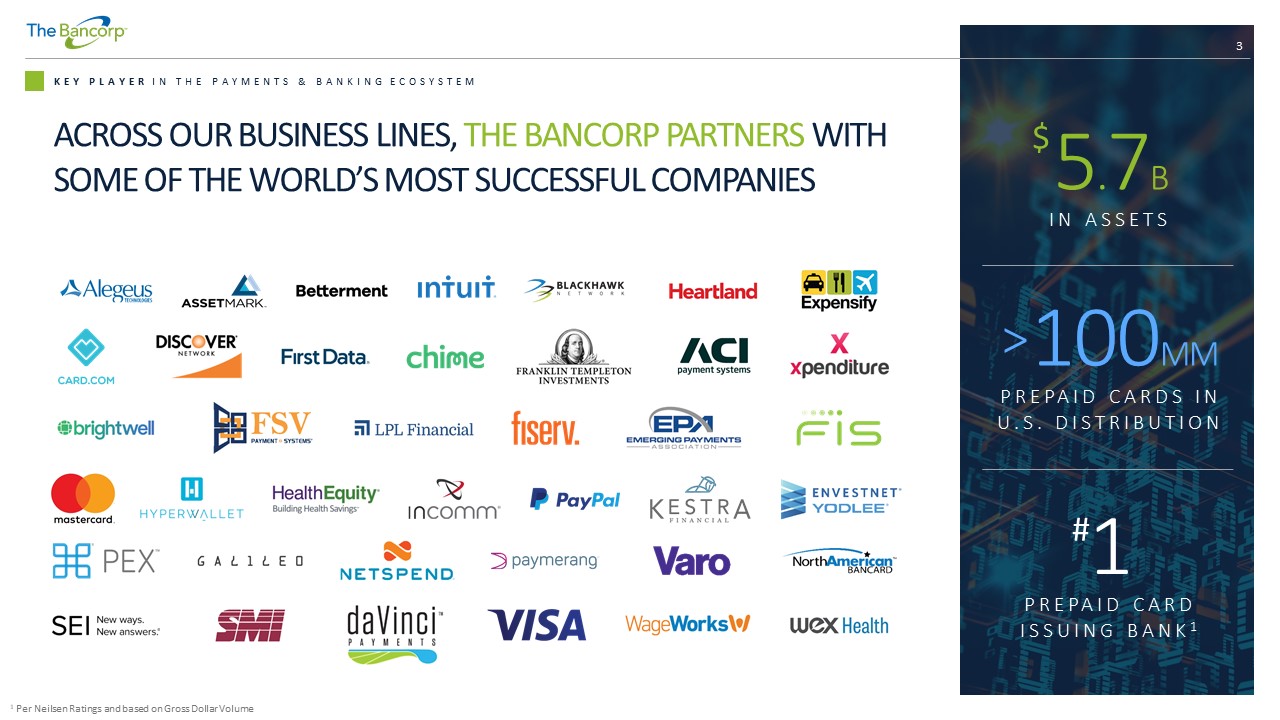
5 . 7 B $ IN ASSETS 100 MM PREPAID CARDS IN U.S. DISTRIBUTION 1 # PREPAID CARD ISSUING BANK 1 3 KEY PLAYER IN THE PAYMENTS & BANKING ECOSYSTEM 1 Per Neilsen Ratings and based on Gross Dollar Volume ACROSS OUR BUSINESS LINES, THE BANCORP PARTNERS WITH SOME OF THE WORLD’S MOST SUCCESSFUL COMPANIES >
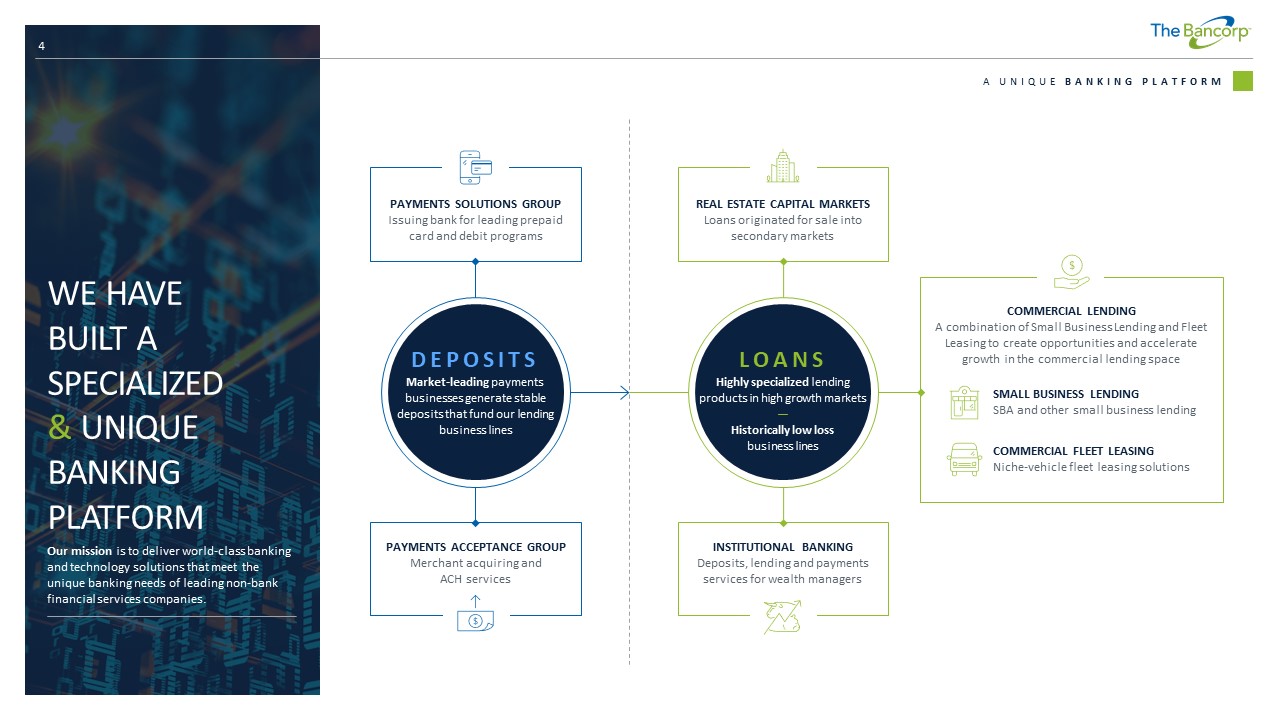
4 Our mission is to deliver world - class banking and technology solutions that meet the unique banking needs of leading non - bank financial services companies. A UNIQUE BANKING PLATFORM DEPOSITS Market - leading payments businesses generate stable deposits that fund our lending business lines LOANS Highly specialized lending products in high growth markets — Historically low loss business lines SMALL BUSINESS LENDING SBA and other small business lending COMMERCIAL FLEET LEASING Niche - vehicle fleet leasing solutions INSTITUTIONAL BANKING Deposits, lending and payments services for wealth managers PAYMENTS ACCEPTANCE GROUP Merchant acquiring and ACH services COMMERCIAL LENDING A combination of Small Business Lending and Fleet Leasing to create opportunities and accelerate growth in the commercial lending space REAL ESTATE CAPITAL MARKETS Loans originated for sale into secondary markets PAYMENTS SOLUTIONS GROUP Issuing bank for leading prepaid card and debit programs WE HAVE BUILT A SPECIALIZED & UNIQUE BANKING PLATFORM

$13.0 $9.7 $13.1 $8.7 $19.6 $8.3 $17.9 $10.5 $24.2 $15.1 $28.5 $5.1 $0 $5 $10 $15 $20 $25 $30 $35 Q1 Q2 Q3 Q4 Q1 Q2 Q3 Q4 Q1 Q2 Q3 Q41 $65M Gain from sale of Safe Harbor IRA PRE - TAX INCOME ($MILLIONS) $ 82.9 2017 $0.39 EPS $1.55 EPS $ 0.90 EPS 12 % …ROE 1 . 1 % …ROA x Clear strategic vision x Strong growth from core business x Investments in technology/innovation x Consistent execution of business plan 5 ESTABLISHED EARNINGS MOMENTUM KEYS TO EARNINGS GROWTH & SUSTAINABILITY 2019 FULL YEAR RESULTS WE HAVE NOW RECORDED 12 STRAIGHT QUARTERS OF POSITIVE PRE - TAX INCOME 2018 2019 1 Q4 2019 pre-tax income excluding $7.5 million civil money penalty was $12.6 million

STRATEGIC BUSINESS PLAN

7 STRATEGIC PLAN: 2020 GUIDANCE 1.25 $ 2020 EPS TARGET $0.39 $1.55 $0.90 $1.25 $0.00 $0.25 $0.50 $0.75 $1.00 $1.25 $1.50 $1.75 2017 2018 2019 (YTD) 2020 EARNINGS PER SHARE 2020 EPS TARGET 2019 2018 2017 WE BELIEVE THE PREVIOUSLY ANNOUNCED $1.25 IS ATTAINABLE IN THE CURRENT ECONOMIC ENVIRONMENT WITH RESPECT TO COVID - 19. A CCORDINGLY, THE $1.25 NOW BECOMES OUR GUIDANCE OUR BUSINESS PLAN OUTLINES THE PATH TO BECOMING THE LEADING INSTITUTION AMONG BANKS & PAYMENTS

8 STRATEGIC PLAN: FINANCIAL GOALS KEYS TO ACHIEVING FINANCIAL TARGETS x Establish a new Payments Ecosystem 2.0 x Investments in technology/innovation x Maintain an industry leading compliance & risk function x Expand salesforce and marketing function in key markets x Attract & retain the best talent PERFORMANCE METRICS 2019 LONG - TERM TARGETS ROE 11.6% 20% ROA 1.1% > 2.0% EPS $ 0.90 Leverage Ratio 9.7% 9% – 10% Total Assets $ 5.7B ~$8.0B EXECUTION OF OUR STRATEGIC PLAN WILL DELIVER MARKET - LEADING RETURNS & CREATE SIGNIFICANT VALUE FOR SHAREHOLDERS
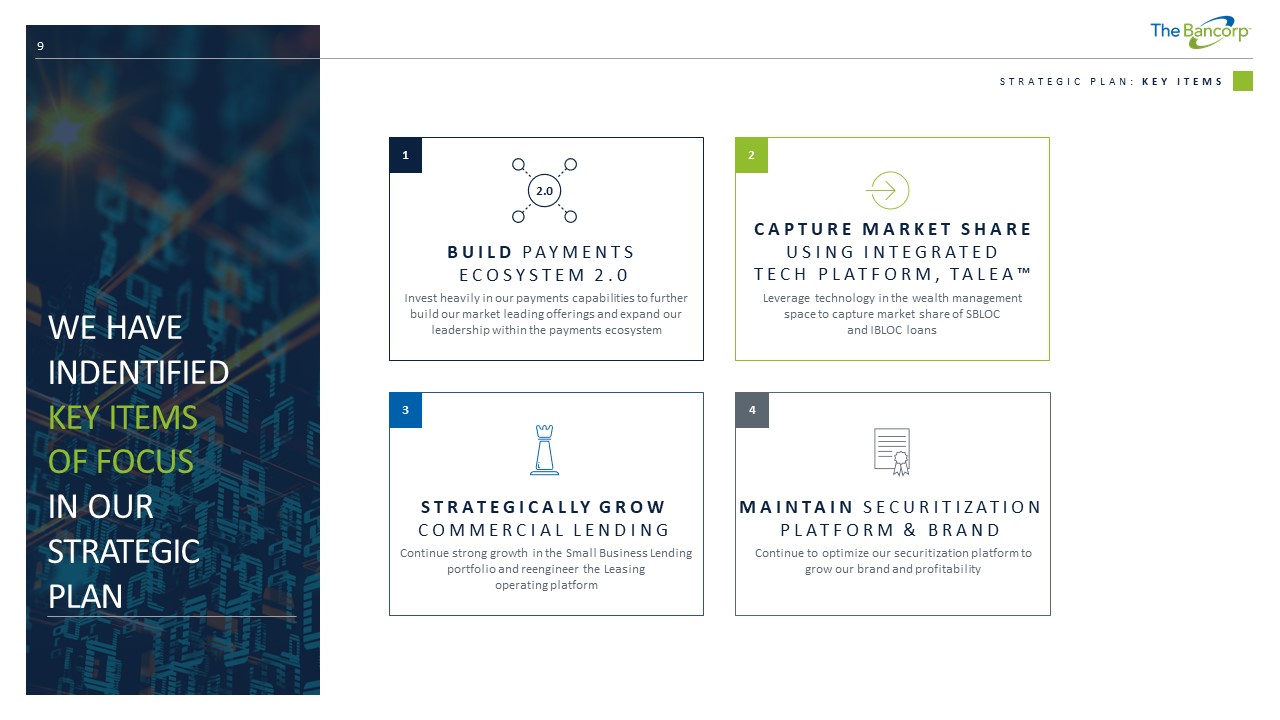
9 STRATEGIC PLAN: KEY ITEMS 1 BUILD PAYMENTS ECOSYSTEM 2.0 Invest heavily in our payments capabilities to further build our market leading offerings and expand our leadership within the payments ecosystem 2.0 CAPTURE MARKET SHARE USING INTEGRATED TECH PLATFORM, TALEA™ Leverage technology in the wealth management space to capture market share of SBLOC and IBLOC loans 2 3 STRATEGICALLY GROW COMMERCIAL LENDING Continue strong growth in the Small Business Lending portfolio and reengineer the Leasing operating platform 4 MAINTAIN SECURITIZATION PLATFORM & BRAND Continue to optimize our securitization platform to grow our brand and profitability WE HAVE INDENTIFIED KEY ITEMS OF FOCUS IN OUR STRATEGIC PLAN
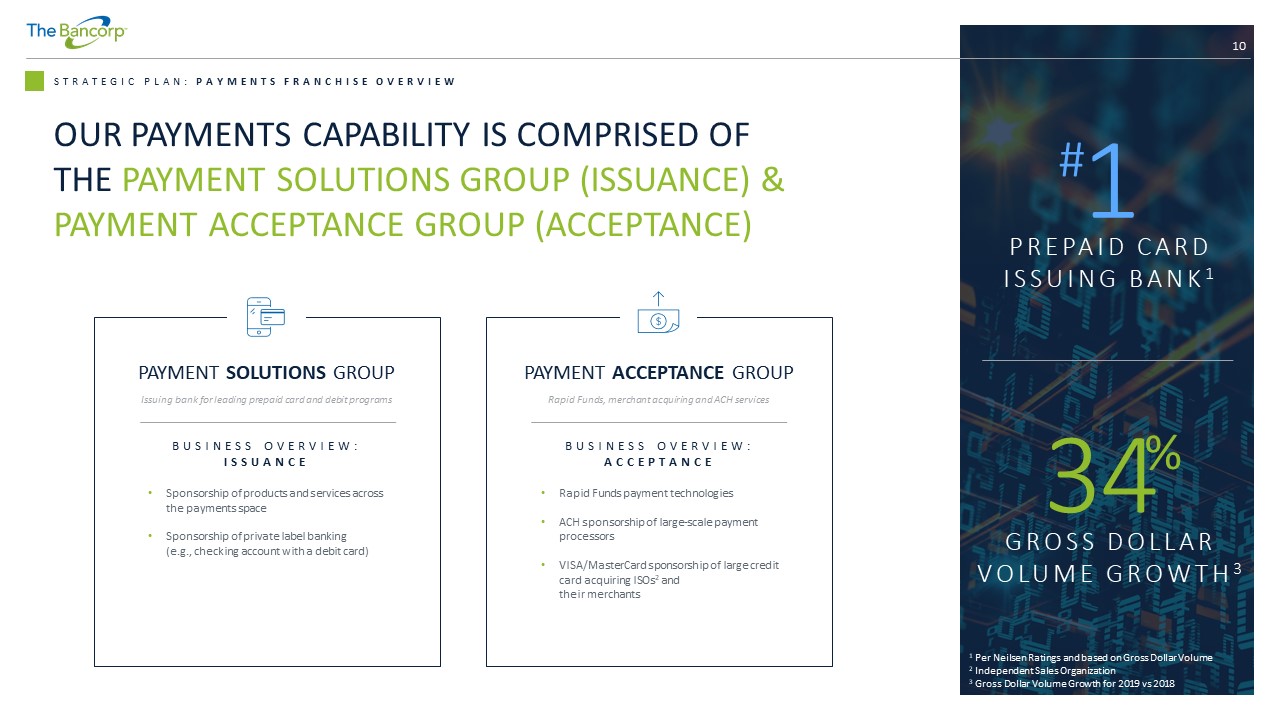
10 STRATEGIC PLAN: PAYMENTS FRANCHISE OVERVIEW PAYMENT SOLUTIONS GROUP Issuing bank for leading prepaid card and debit programs BUSINESS OVERVIEW: ISSUANCE • Sponsorship of products and services across the payments space • Sponsorship of private label banking (e.g., checking account with a debit card) PAYMENT ACCEPTANCE GROUP Rapid Funds, merchant acquiring and ACH services BUSINESS OVERVIEW: ACCEPTANCE • Rapid Funds payment technologies • ACH sponsorship of large - scale payment processors • VISA/MasterCard sponsorship of large credit card acquiring ISOs 2 and their merchants GROSS DOLLAR VOLUME GROWTH 3 1 Per Neilsen Ratings and based on Gross Dollar Volume 2 Independent Sales Organization 3 Gross Dollar Volume Growth for 2019 vs 2018 1 # 34 % OUR PAYMENTS CAPABILITY IS COMPRISED OF THE PAYMENT SOLUTIONS GROUP (ISSUANCE) & PAYMENT ACCEPTANCE GROUP (ACCEPTANCE) PREPAID CARD ISSUING BANK 1

11 STRATEGIC PLAN: PAYMENTS LANDSCAPE WE ARE POSITIONING OURSELVES TO CAPITALIZE ON DISRUPTIVE OPPORTUNITIES IN A TRANSFORMING MARKET COMMERCIAL ENTITIES CONSUMERS GIG ECONOMY Wages Earned P2P Gov’t Disbursements Tax Refunds Payments Acquired Bill Payments Achieved PAYMENTS IN PURCHASES Checks Cards Cash BILL PAYMENTS Checks ACH P2P CORPORATE DIBURSEMENTS Checks ACH Wires PAYMENTS OUT
12 STRATEGIC PLAN: PAYMENTS ECOSYSTEM 2.0 THE WORLD IS CHANGING , and we have responded to create an environment to benefit our partners EVOLUTION IN CUSTOMER DEMAND HAS CREATED AN INFLECTION POINT THAT IS DISRUPTING THE STATUS QUO — NEW WINNERS ARE EMERGING
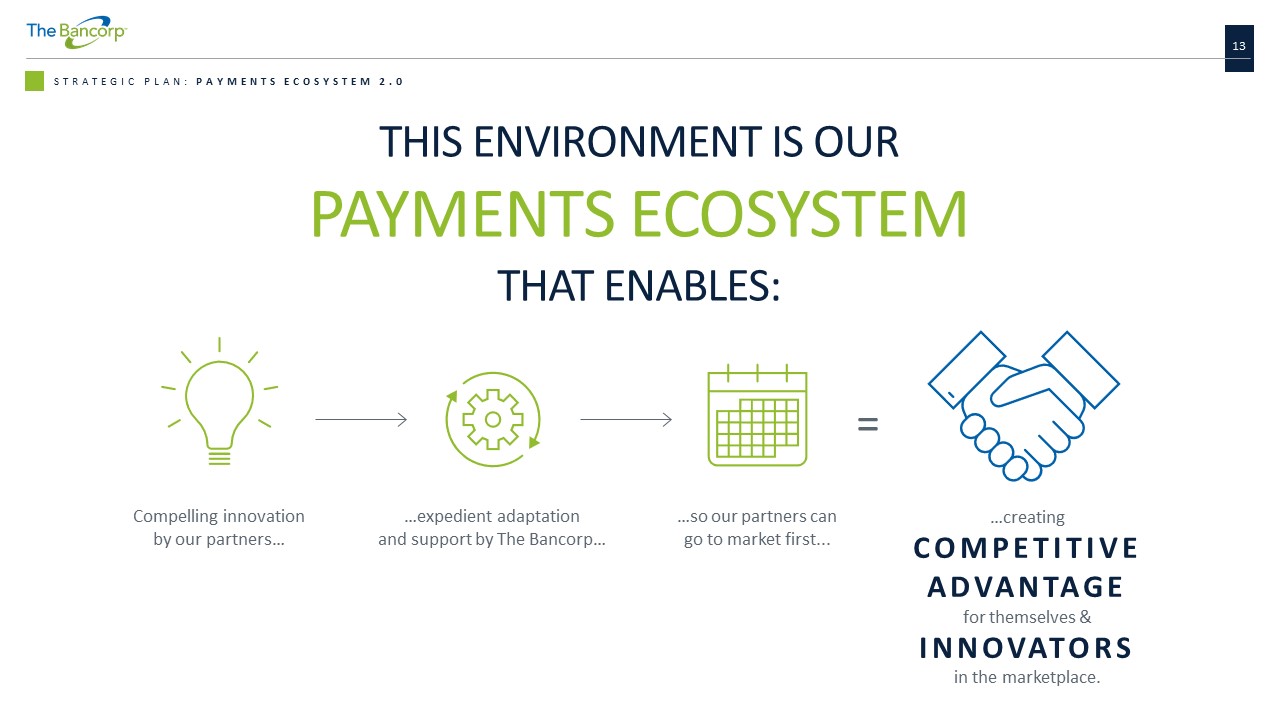
Compelling innovation by our partners… …expedient adaptation and support by The Bancorp… …so our partners can go to market first... = …creating COMPETITIVE ADVANTAGE for themselves & INNOVATORS in the marketplace. 13 STRATEGIC PLAN: PAYMENTS ECOSYSTEM 2.0 THIS ENVIRONMENT IS OUR PAYMENTS ECOSYSTEM THAT ENABLES:
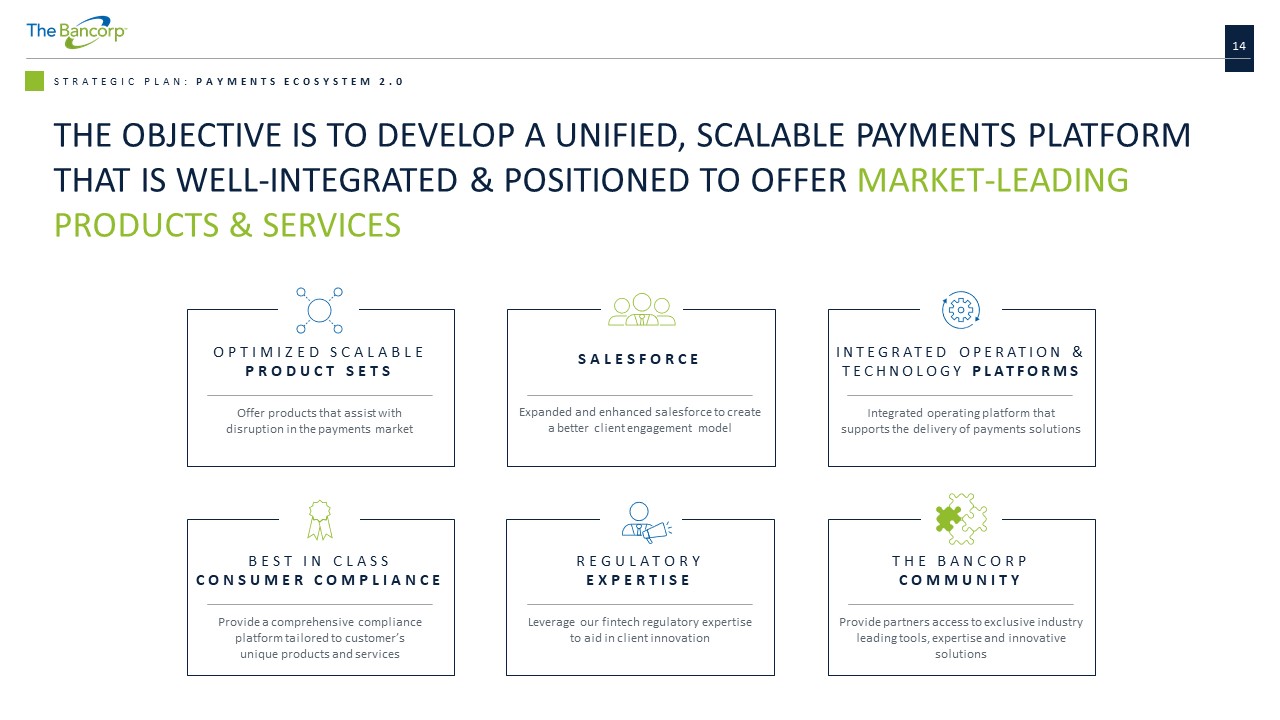
OPTIMIZED SCALABLE PRODUCT SETS Offer products that assist with disruption in the payments market SALESFORCE Expanded and enhanced salesforce to create a better client engagement model INTEGRATED OPERATION & TECHNOLOGY PLATFORMS Integrated operating platform that supports the delivery of payments solutions BEST IN CLASS CONSUMER COMPLIANCE Provide a comprehensive compliance platform tailored to customer’s unique products and services REGULATORY EXPERTISE Leverage our fintech regulatory expertise to aid in client innovation THE BANCORP COMMUNITY Provide partners access to exclusive industry leading tools, expertise and innovative solutions 14 STRATEGIC PLAN: PAYMENTS ECOSYSTEM 2.0 THE OBJECTIVE IS TO DEVELOP A UNIFIED, SCALABLE PAYMENTS PLATFORM THAT IS WELL - INTEGRATED & POSITIONED TO OFFER MARKET - LEADING PRODUCTS & SERVICES

15 STRATEGIC PLAN: PAYMENTS ECOSYSTEM 2.0 ($BILLIONS) $0 $2 $4 $6 $8 $10 $12 $14 $16 $18 $20 Q1 Q2 Q3 Q4 2017 2018 2019 1 Per Neilsen Ratings and measured by Gross Dollar Volume CHALLENGER BANKS GOVERNMENT HEALTHCARE CORPORATE SERVICES GIFT GROSS DOLLAR VOLUME GROWTH IS ACCELERATING WITHIN OUR PREPAID & DEBIT OFFERINGS PAYMENT SOLUTIONS GROUP Issuing bank for leading prepaid and debit accounts BUSINESS OVERVIEW : • Unique non - branch platform which leverages technology and strategic partners • #1 issuing bank for prepaid cards 1 • Leading position to provide tailored banking solutions to fin - tech firms, including challenger banks and other financial services companies GROSS DOLLAR VOLUME 2019 GROSS DOLLAR VOLUME GROWTH 34 % GROSS DOLLAR VOLUME GROWTH USE CASES
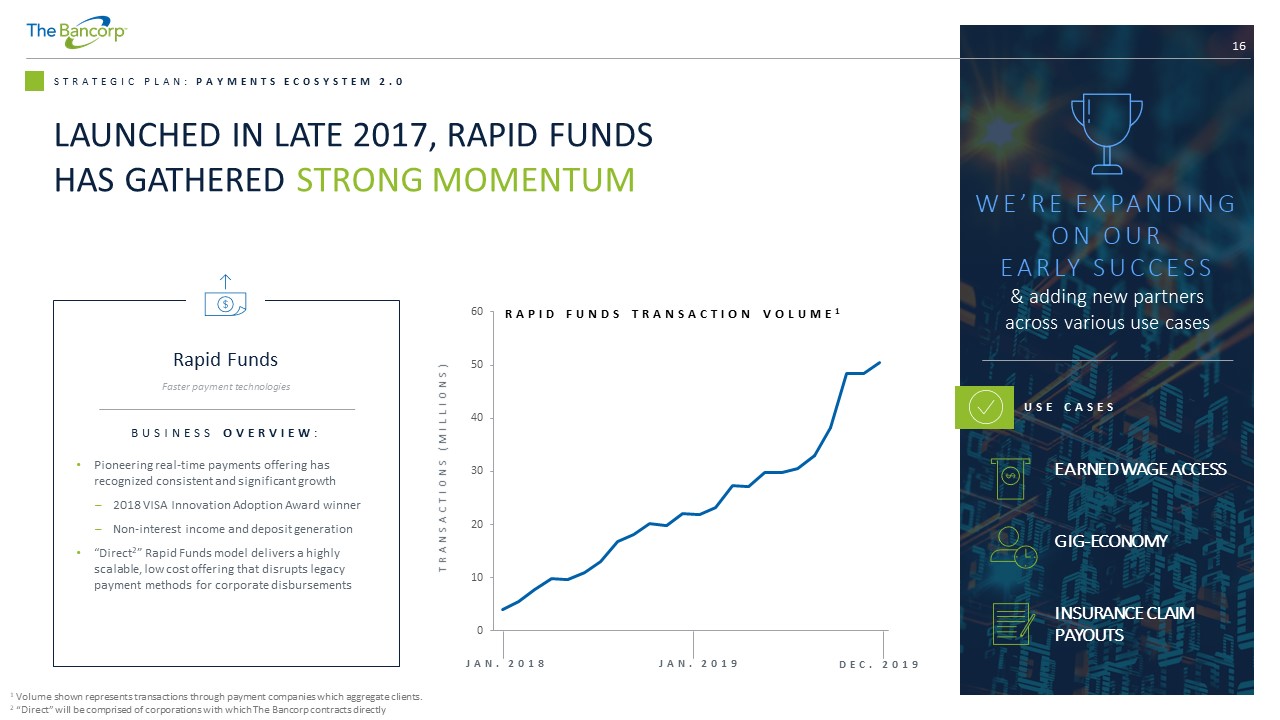
16 STRATEGIC PLAN: PAYMENTS ECOSYSTEM 2.0 WE’RE EXPANDING ON OUR EARLY SUCCESS & adding new partners across various use cases 1 Volume shown represents transactions through payment companies which aggregate clients. 2 “Direct” will be comprised of corporations with which The Bancorp contracts directly LAUNCHED IN LATE 2017, RAPID FUNDS HAS GATHERED STRONG MOMENTUM 0 10 20 30 40 50 60 JAN. 2018 JAN. 2019 DEC. 2019 TRANSACTIONS (MILLIONS) RAPID FUNDS TRANSACTION VOLUME 1 Rapid Funds Faster payment technologies BUSINESS OVERVIEW : • Pioneering real - time payments offering has recognized consistent and significant growth – 2018 VISA Innovation Adoption Award winner – Non - interest income and deposit generation • “Direct 2 ” Rapid Funds model delivers a highly scalable, low cost offering that disrupts legacy payment methods for corporate disbursements USE CASES EARNED WAGE ACCESS GIG - ECONOMY INSURANCE CLAIM PAYOUTS

BUSINESS OVERVIEW : • Automated loan platform, Talea , provides industry leading speed and delivery • Securities - backed lines of credit provide fast and flexible liquidity for investment portfolios • Insurance - backed lines of credit provide fast and flexible borrowing against the cash value of life insurance • Deposit accounts for wealth management clients 17 STRATEGIC PLAN: INSTITUTIONAL BANKING INSTITUTIONAL BANKING Deposits, lending and payments services for wealth managers HIGHLIGHTS : • Loan growth of 30% year over year for 2019 with significant additional market opportunity • Launched Talea loan automation platform and implemented with key partners • Market dynamics support business model – Advisors shifting from large broker/dealers to independent platforms – Sector shift to fee - based accounts – Emergence of new wealth management providers The Bancorp’s Business Model allows us to build banking solutions to “spec” without competing directly with our partner firms. We do not have any associated asset managers, proprietary advisory programs, or RIA programs. Our singular focus is to help our partner firms stay competitive in the marketplace and to grow and retain assets. ALWAYS A PARTNER, NEVER A COMPETITOR DELIVERING PRIVATE - LABEL LENDING & BANKING SERVICES TO WEALTH MANAGEMENT PROVIDERS NATIONWIDE 2019 PERFORMANCE 30 % LOAN GROWTH
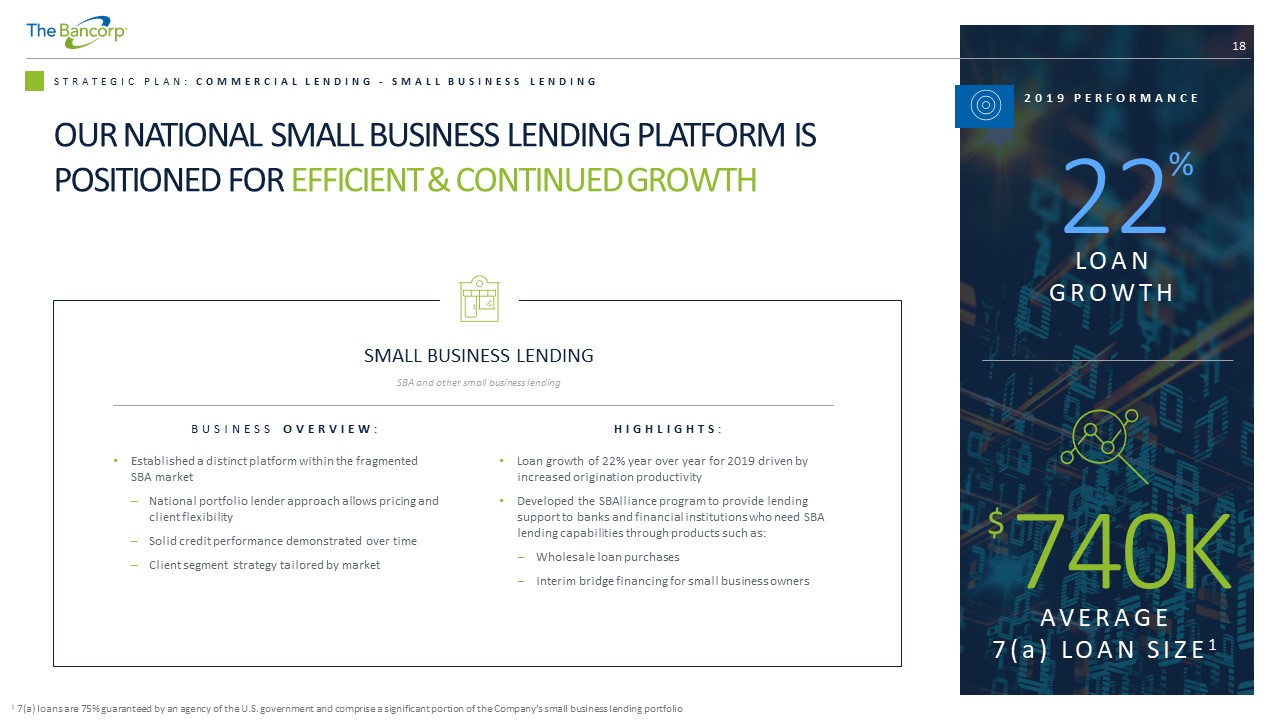
BUSINESS OVERVIEW : • Established a distinct platform within the fragmented SBA market – National portfolio lender approach allows pricing and client flexibility – Solid credit performance demonstrated over time – Client segment strategy tailored by market 18 STRATEGIC PLAN: COMMERCIAL LENDING - SMALL BUSINESS LENDING 740K AVERAGE 7(a) LOAN SIZE 1 $ SMALL BUSINESS LENDING SBA and other small business lending HIGHLIGHTS : • Loan growth of 22% year over year for 2019 driven by increased origination productivity • Developed the SBAlliance program to provide lending support to banks and financial institutions who need SBA lending capabilities through products such as: – Wholesale loan purchases – Interim bridge financing for small business owners 1 7(a) loans are 75% guaranteed by an agency of the U.S. government and comprise a significant portion of the Company’s small b us iness lending portfolio OUR NATIONAL SMALL BUSINESS LENDING PLATFORM IS POSITIONED FOR EFFICIENT & CONTINUED GROWTH 2019 PERFORMANCE 22 % LOAN GROWTH
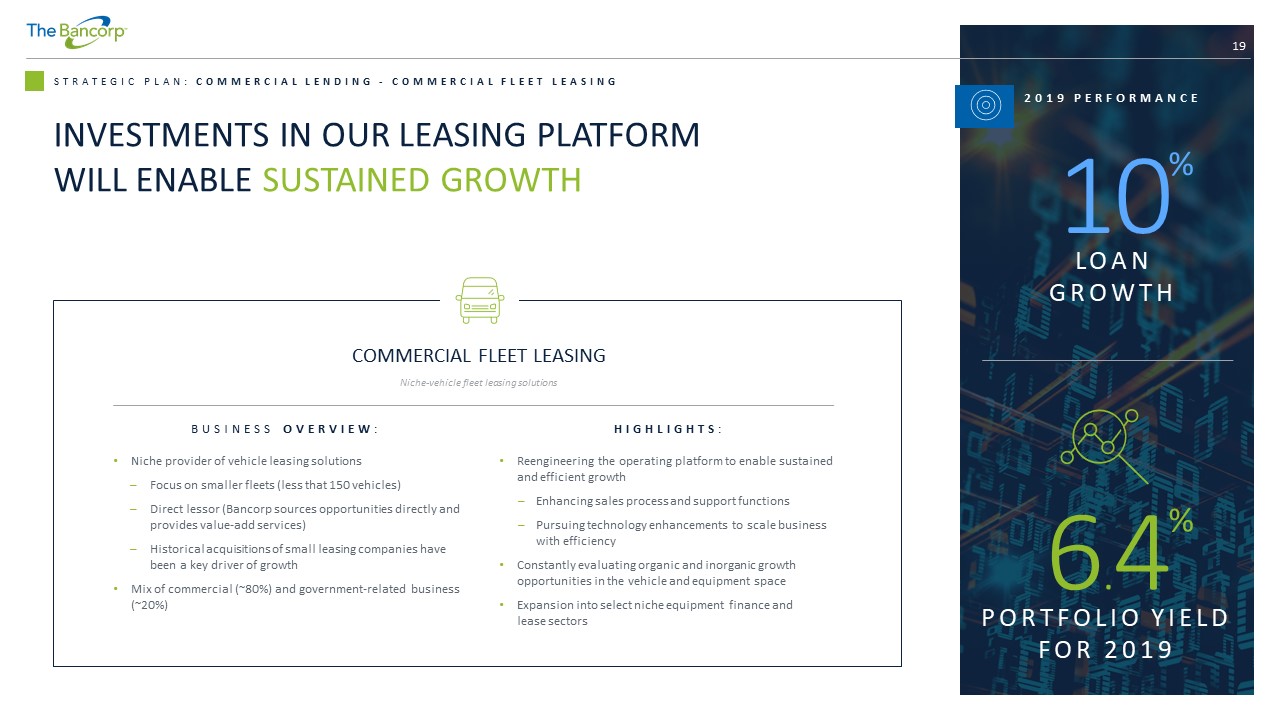
19 STRATEGIC PLAN: COMMERCIAL LENDING - COMMERCIAL FLEET LEASING BUSINESS OVERVIEW : • Niche provider of vehicle leasing solutions – Focus on smaller fleets (less that 150 vehicles) – Direct lessor (Bancorp sources opportunities directly and provides value - add services) – Historical acquisitions of small leasing companies have been a key driver of growth • Mix of commercial (~80%) and government - related business (~20%) COMMERCIAL FLEET LEASING Niche - vehicle fleet leasing solutions HIGHLIGHTS : • Reengineering the operating platform to enable sustained and efficient growth – Enhancing sales process and support functions – Pursuing technology enhancements to scale business with efficiency • Constantly evaluating organic and inorganic growth opportunities in the vehicle and equipment space • Expansion into select niche equipment finance and lease sectors INVESTMENTS IN OUR LEASING PLATFORM WILL ENABLE SUSTAINED GROWTH 2019 PERFORMANCE 10 % LOAN GROWTH 6 . 4 % PORTFOLIO YIELD FOR 2019
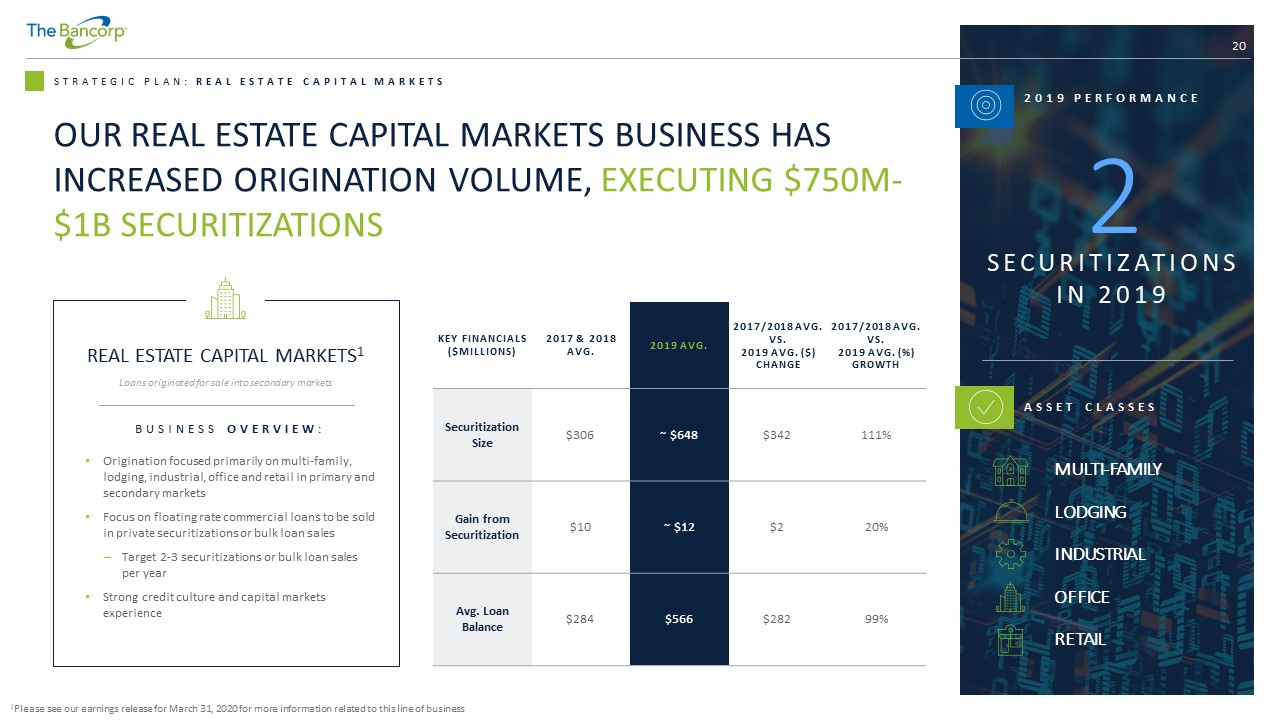
20 STRATEGIC PLAN: REAL ESTATE CAPITAL MARKETS REAL ESTATE CAPITAL MARKETS 1 Loans originated for sale into secondary markets BUSINESS OVERVIEW : • Origination focused primarily on multi - family, lodging, industrial, office and retail in primary and secondary markets • Focus on floating rate commercial loans to be sold in private securitizations or bulk loan sales – Target 2 - 3 securitizations or bulk loan sales per year • Strong credit culture and capital markets experience KEY FINANCIALS ($MILLIONS) 2017 & 2018 AVG. 2019 AVG . 2017/2018 AVG. VS. 2019 AVG. ($) CHANGE 2017/2018 AVG. VS. 2019 AVG. (%) GROWTH Securitization Size $306 ~ $648 $342 111% Gain from Securitization $10 ~ $12 $2 20% Avg . Loan Balance $284 $566 $282 99% 2019 PERFORMANCE 2 SECURITIZATIONS IN 2019 MULTI - FAMILY LODGING INDUSTRIAL OFFICE RETAIL ASSET CLASSES OUR REAL ESTATE CAPITAL MARKETS BUSINESS HAS INCREASED ORIGINATION VOLUME, EXECUTING $750M - $1B SECURITIZATIONS 1 Please see our earnings release for March 31, 2020 for more information related to this line of business
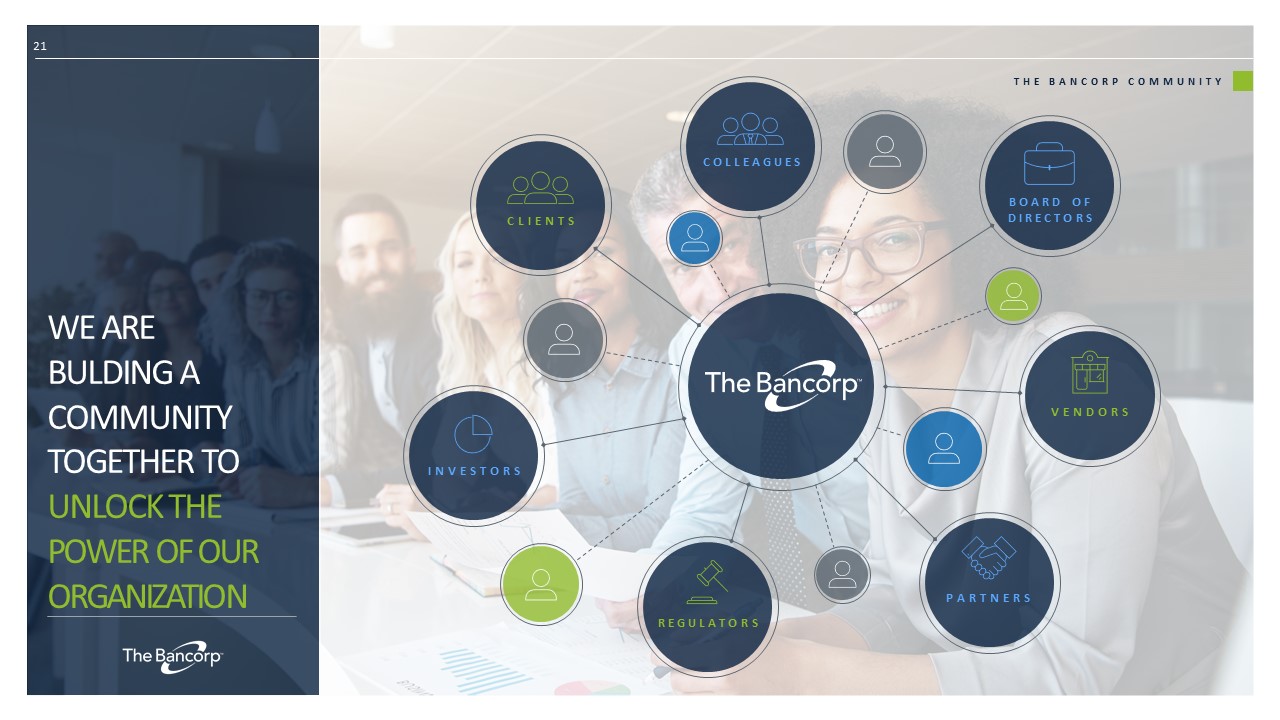
21 THE BANCORP COMMUNITY WE ARE BULDING A COMMUNITY TOGETHER TO UNLOCK THE POWER OF OUR ORGANIZATION COLLEAGUES CLIENTS INVESTORS REGULATORS PARTNERS VENDORS BOARD OF DIRECTORS

The risk factors discussed and identified in our Annual Report on Form 10 - K for the year ended December 31, 2019, and in other of our public filings with the SEC include but are not limited to the following: • changing economic and credit market conditions may have significant adverse effects on our assets and operating results, including increases in payment defaults and other credit risks, decreases in the fair value of some assets and increases in our provision for loan losses, and may result in a reduction in our capital base, reducing our ability to maintain deposits at current levels, and a reduction in our income and cash flows; • operating costs may increase; • adverse governmental or regulatory policies or actions may be promulgated; • management and other key personnel may be lost; • competition may increase; • the costs of our interest - bearing liabilities, principally deposits, may increase relative to the interest received on our interest bearing assets, principally loans, thereby decreasing our net interest income; • loan and investment yields may decrease resulting in a lower net interest margin; • possible geographic concentration could result in our loan portfolio being adversely affected by economic factors unique to the geographic area and not reflected in other regions of the country; • the market value of real estate that secures certain of our loans, principally loans we originate for sale into secondary markets, Small Business Administration loans under the 504 Fixed Asset Financing Program and our discontinued commercial loan portfolio, has been, and may continue to be, adversely affected by recent economic and market conditions, and may be affected by other conditions outside of our control such as lack of demand for real estate of the type securing our loans, natural disasters, changes in neighborhood values, competitive overbuilding, weather, casualty losses, occupancy rates and other similar factors; • we must satisfy our regulators with respect to Bank Secrecy Act, Anti - Money Laundering and other regulatory mandates to prevent additional penalties, including restrictions on adding customers; • the loans from our discontinued operations are now held for sale and were marked to fair value based on various internal and external inputs; however, the actual sales price could differ from those third - party fair values. The reinvestment rate for the proceeds of those sales in investment securities depends on future market interest rates; and • we may not be able to sustain our historical growth rate in our loan, prepaid card and other lines of business. 22 RISK FACTORS THE FOLLOWING RISK FACTORS , AMONG OTHERS, COULD CAUSE ACTUAL RESULTS TO DIFFER MATERIALLY FROM THE ANTICIPATED RESULTS OR OTHER EXPECTATIONS EXPRESSED IN THIS PRESENTATION