Exhibit 99.1

August 2020 THE BANCORP INVESTOR PRESENTATION
Statements in this presentation regarding The Bancorp, Inc.’s business that are not historical facts are “forward - looking statements”. These statements may be identified by the use of forward - looking terminology, including the words “may,” “believe,” “will,” “expect,” “anticipate,” “estimate,” “intend,” “plan," or similar words, and are based on current expectations about important economic, political, and technological factors, among others, and are subject to risks and uncertainties, which could cause the actual results, events or achievements to differ materially from those set forth in or implied by the forward - looking statements and related assumptions. These risks and uncertainties include those relating to the on - going COVID - 19 pandemic, the impact it will have on the company’s business and the industry as a whole, and the resulting governmental and societal responses. For further discussion of these risks and uncertainties, see the “risk factors” sections contained, in The Bancorp, Inc.’s Annual Report on Form 10 - K for the year ended December 31, 2019 and in its other public filings with the SEC. In addition, these forward - looking statements are based upon assumptions with respect to future strategies and decisions that are subject to change. Actual results may differ materially from the anticipated results discussed in these forward - looking statements. The forward - looking statements speak only as of the date of this presentation. The Bancorp, Inc. does not undertake to publicly revise or update forward - looking statements in this presentation to reflect events or circumstances that arise after the date of this presentation, except as may be required under applicable law. This presentation contains information regarding financial results that is calculated and presented on the basis of methodologies other than in accordance with accounting principles generally accepted in the United States (“GAAP”). This presentation may contain statistics and other data that in some cases has been obtained from or compiled from information made available by third - party service providers. The Bancorp, Inc. makes no representation or warranty, express or implied, with respect to the accuracy, reasonableness or completeness of such information. Past performance is not indicative nor a guarantee of future results. Copies of the documents filed by The Bancorp, Inc. with the SEC are available free of charge from the website of the SEC at www.sec.gov as well as on The Bancorp, Inc.’s website at www.thebancorp.com . This presentation is for information purposes only and shall not constitute an offer to sell or the solicitation of an offer to buy any securities. Neither the SEC nor any other regulatory body has approved or disapproved of the securities of The Bancorp, Inc. or passed upon the accuracy or adequacy of this presentation. Any representation to the contrary is a criminal offense. DISCLOSURES FORWARD LOOKING STATEMENTS & OTHER DISCLOSURES 2
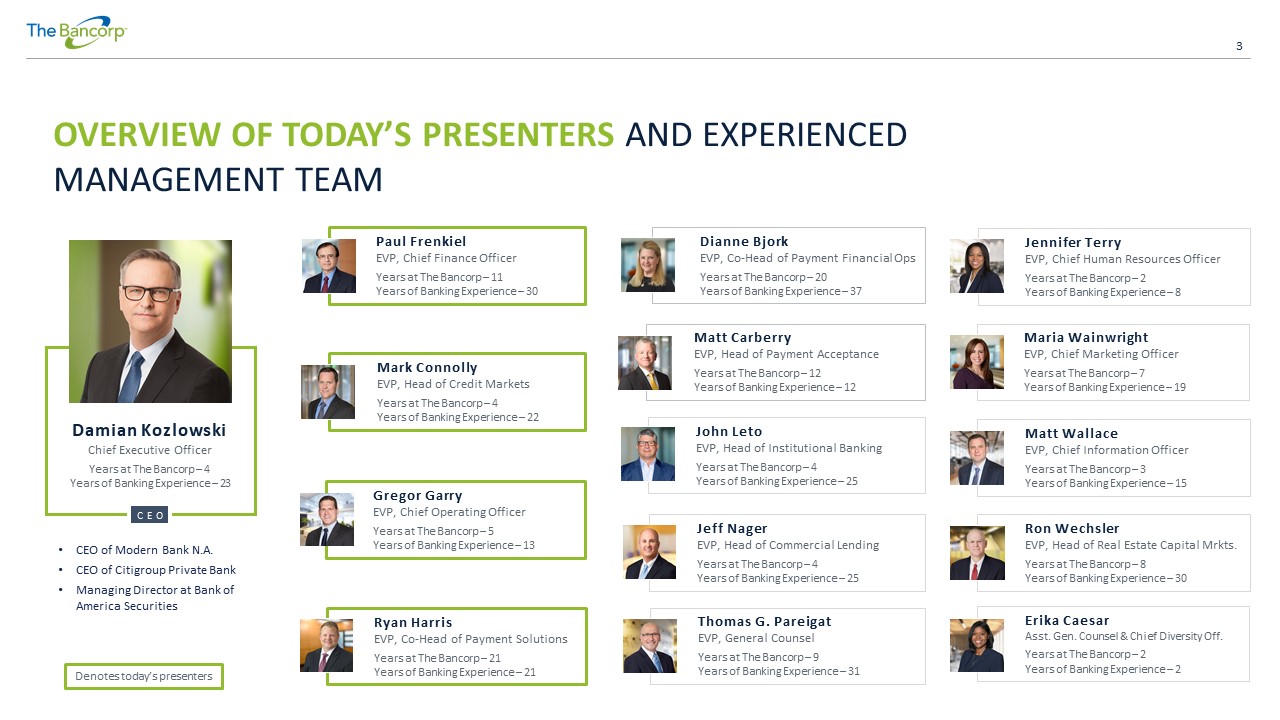
3 OVERVIEW OF TODAY’S PRESENTERS AND EXPERIENCED MANAGEMENT TEAM • CEO of Modern Bank N.A. • CEO of Citigroup Private Bank • Managing Director at Bank of America Securities Damian Kozlowski Chief Executive Officer Years at The Bancorp – 4 Years of Banking Experience – 23 CEO Dianne Bjork EVP, Co - Head of Payment Financial Ops Years at The Bancorp – 20 Years of Banking Experience – 37 Ryan Harris EVP, Co - Head of Payment Solutions Years at The Bancorp – 21 Years of Banking Experience – 21 Matt Wallace EVP, Chief Information Officer Years at The Bancorp – 3 Years of Banking Experience – 15 Ron Wechsler EVP, Head of Real Estate Capital Mrkts . Years at The Bancorp – 8 Years of Banking Experience – 30 John Leto EVP, Head of Institutional Banking Years at The Bancorp – 4 Years of Banking Experience – 25 Matt Carberry EVP, Head of Payment Acceptance Years at The Bancorp – 12 Years of Banking Experience – 12 Erika Caesar Asst. Gen. Counsel & Chief Diversity Off. Years at The Bancorp – 2 Years of Banking Experience – 2 Jeff Nager EVP, Head of Commercial Lending Years at The Bancorp – 4 Years of Banking Experience – 25 Maria Wainwright EVP, Chief Marketing Officer Years at The Bancorp – 7 Years of Banking Experience – 19 Jennifer Terry EVP, Chief Human Resources Officer Years at The Bancorp – 2 Years of Banking Experience – 8 Gregor Garry EVP, Chief Operating Officer Years at The Bancorp – 5 Years of Banking Experience – 13 Paul Frenkiel EVP, Chief Finance Officer Years at The Bancorp – 11 Years of Banking Experience – 30 Mark Connolly EVP, Head of Credit Markets Years at The Bancorp – 4 Years of Banking Experience – 22 Thomas G. Pareigat EVP, General Counsel Years at The Bancorp – 9 Years of Banking Experience – 31 Denotes today’s presenters 3
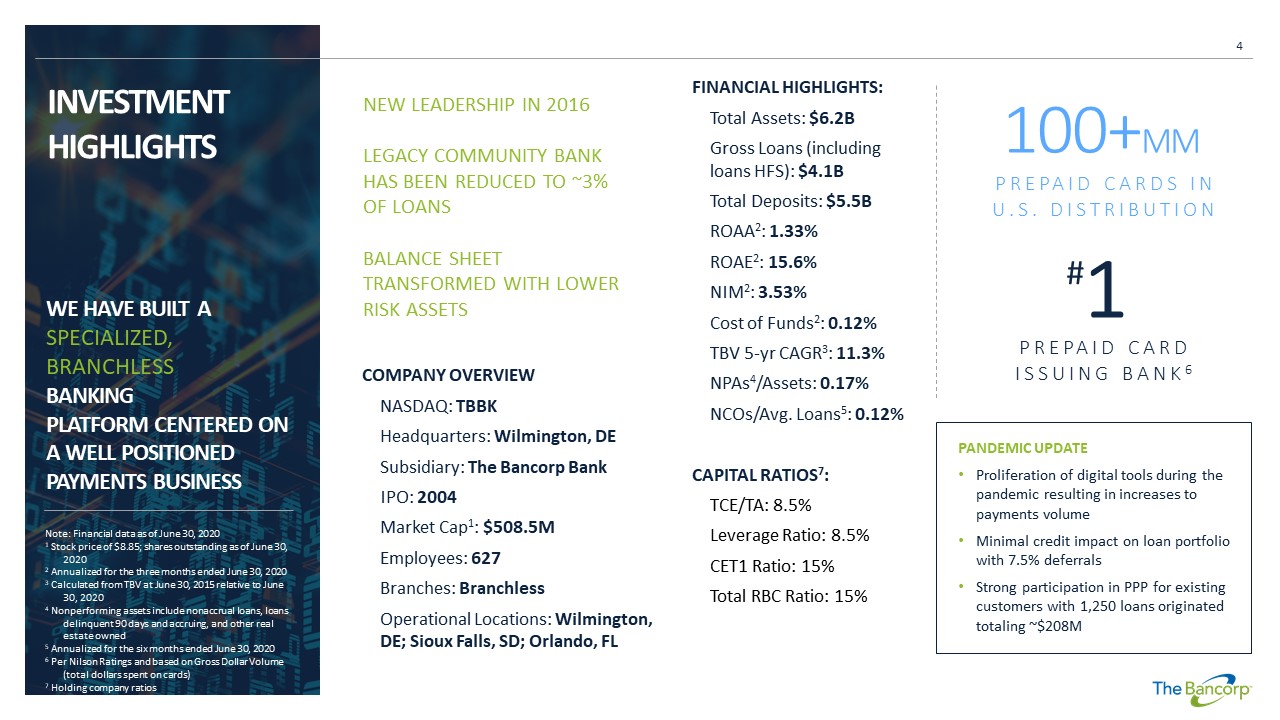
WE HAVE BUILT A SPECIALIZED, BRANCHLESS BANKING PLATFORM CENTERED ON A WELL POSITIONED PAYMENTS BUSINESS INVESTMENT HIGHLIGHTS Note: Financial data as of June 30, 2020 1 Stock price of $8.85; shares outstanding as of June 30, 2020 2 Annualized for the three months ended June 30, 2020 3 Calculated from TBV at June 30, 2015 relative to June 30, 2020 4 Nonperforming assets include nonaccrual loans, loans delinquent 90 days and accruing, and other real estate owned 5 Annualized for the six months ended June 30, 2020 6 Per Nilson Ratings and based on Gross Dollar Volume (total dollars spent on cards) 7 Holding company ratios FINANCIAL HIGHLIGHTS: Total Assets: $6.2B Gross Loans (including loans HFS): $4.1B Total Deposits: $5.5B ROAA 2 : 1.33% ROAE 2 : 15.6% NIM 2 : 3.53% Cost of Funds 2 : 0.12% TBV 5 - yr CAGR 3 : 11.3% NPAs 4 /Assets: 0.17% NCOs/Avg. Loans 5 : 0.12% CAPITAL RATIOS 7 : TCE/TA: 8.5% Leverage Ratio: 8.5% CET1 Ratio: 15% Total RBC Ratio: 15% COMPANY OVERVIEW NASDAQ: TBBK Headquarters: Wilmington, DE Subsidiary: The Bancorp Bank IPO: 2004 Market Cap 1 : $508.5M Employees: 627 Branches: Branchless Operational Locations: Wilmington, DE; Sioux Falls, SD; Orlando, FL 100+ MM PREPAID CARDS IN U.S. DISTRIBUTION 1 # PREPAID CARD ISSUING BANK 6 PANDEMIC UPDATE • Proliferation of digital tools during the pandemic resulting in increases to payments volume • Minimal credit impact on loan portfolio with 7.5% deferrals • Strong participation in PPP for existing customers with 1,250 loans originated totaling ~$208M 4 NEW LEADERSHIP IN 2016 LEGACY COMMUNITY BANK HAS BEEN REDUCED TO ~3% OF LOANS BALANCE SHEET TRANSFORMED WITH LOWER RISK ASSETS
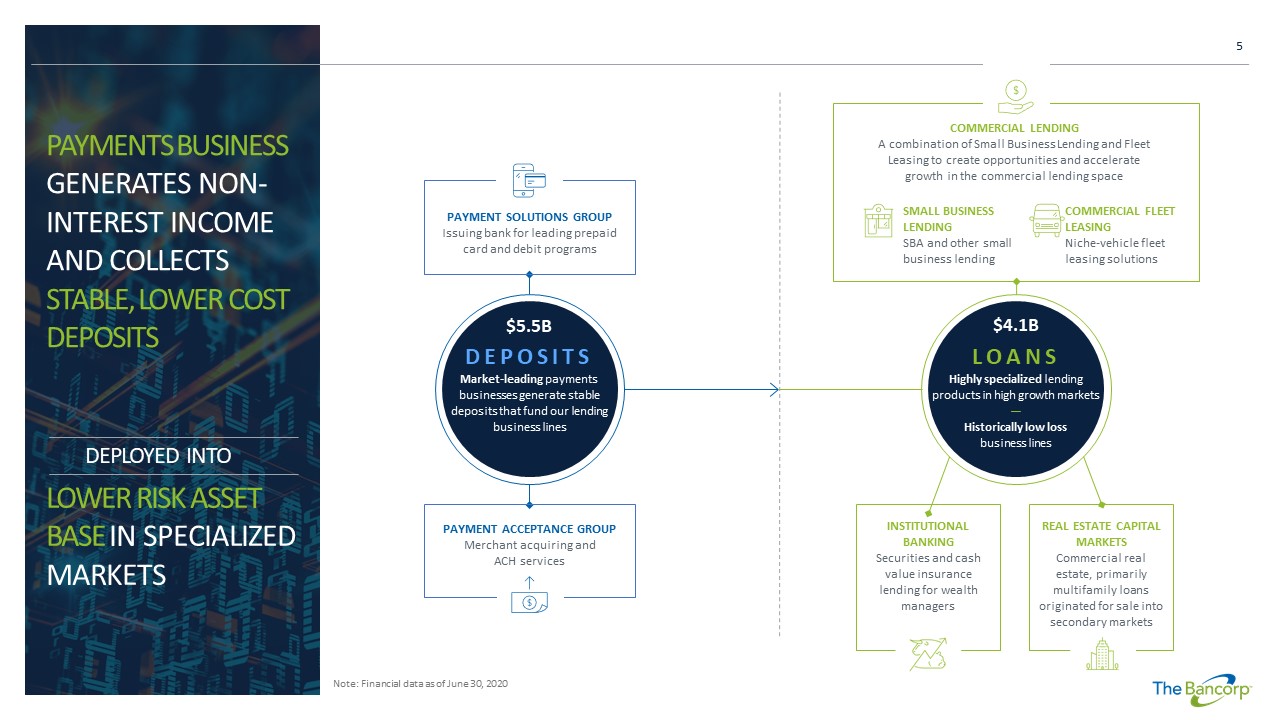
PAYMENTS BUSINESS GENERATES NON - INTEREST INCOME AND COLLECTS STABLE, LOWER COST DEPOSITS Note: Financial data as of June 30, 2020 PAYMENT ACCEPTANCE GROUP Merchant acquiring and ACH services PAYMENT SOLUTIONS GROUP Issuing bank for leading prepaid card and debit programs DEPOSITS Market - leading payments businesses generate stable deposits that fund our lending business lines $5.5B COMMERCIAL LENDING A combination of Small Business Lending and Fleet Leasing to create opportunities and accelerate growth in the commercial lending space SMALL BUSINESS LENDING SBA and other small business lending COMMERCIAL FLEET LEASING Niche - vehicle fleet leasing solutions LOANS Highly specialized lending products in high growth markets — Historically low loss business lines $4.1B INSTITUTIONAL BANKING Securities and cash value insurance lending for wealth managers REAL ESTATE CAPITAL MARKETS Commercial real estate, primarily multifamily loans originated for sale into secondary markets LOWER RISK ASSET BASE IN SPECIALIZED MARKETS DEPLOYED INTO 5
DEPOSITS PAYMENTS BUSINESS GENERATES NON - INTEREST INCOME AND STABLE, LOWER COST DEPOSITS 6
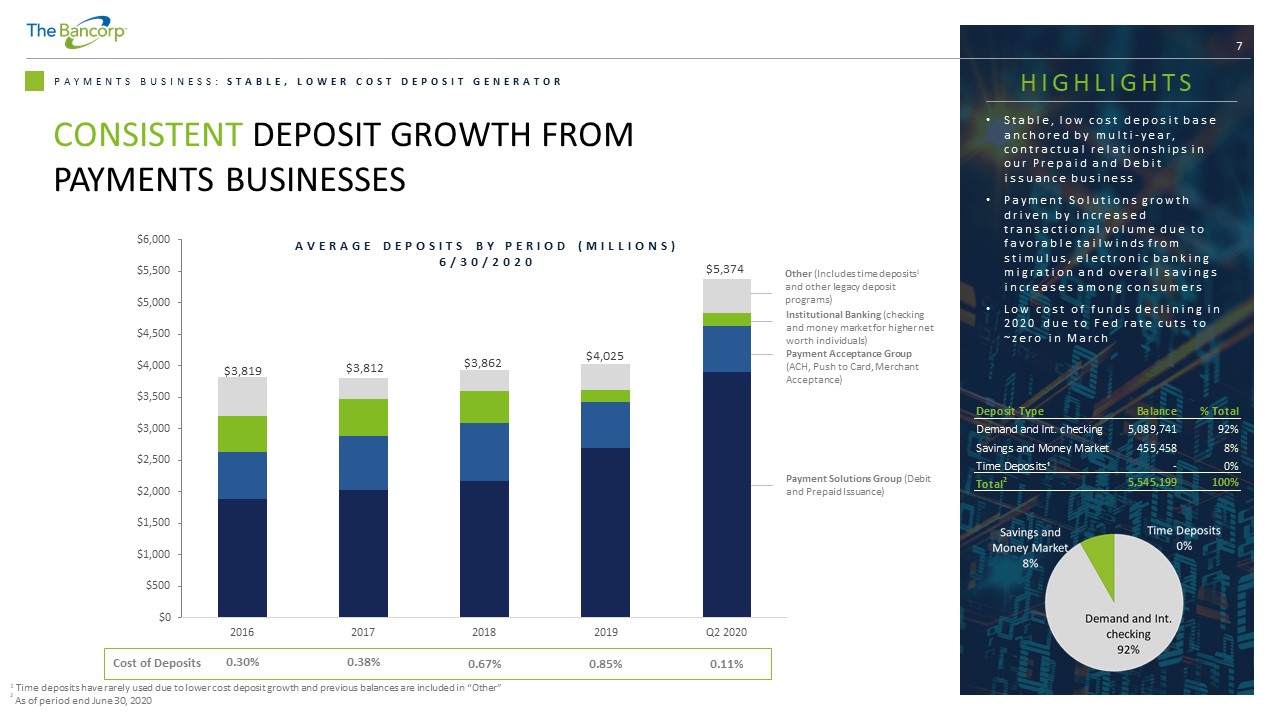
7 PAYMENTS BUSINESS: STABLE, LOWER COST DEPOSIT GENERATOR CONSISTENT DEPOSIT GROWTH FROM PAYMENTS BUSINESSES $0 $500 $1,000 $1,500 $2,000 $2,500 $3,000 $3,500 $4,000 $4,500 $5,000 $5,500 $6,000 2016 2017 2018 2019 Q2 2020 Payment Solutions Group (Debit and Prepaid Issuance) Payment Acceptance Group (ACH, Push to Card, Merchant Acceptance) Institutional Banking (checking and money market for higher net worth individuals) Other (Includes time deposits 1 and other legacy deposit programs) $3,819 $3,812 $3,862 $4,025 $5,374 Cost of Deposits AVERAGE DEPOSITS BY PERIOD (MILLIONS) 6/30/2020 HIGHLIGHTS • Stable, low cost deposit base anchored by multi - year, contractual relationships in our Prepaid and Debit issuance business • Payment Solutions growth driven by increased transactional volume due to favorable tailwinds from stimulus, electronic banking migration and overall savings increases among consumers • Low cost of funds declining in 2020 due to Fed rate cuts to ~zero in March 1 Time deposits have rarely used due to lower cost deposit growth and previous balances are included in “Other” ² As of period end June 30, 2020 0.30% 0.38% 0.67% 0.85% 0.11% Balance % Total Demand and Int. checking 5,089,741 92% Savings and Money Market 455,458 8% Time Deposits¹ - 0% Total 2 5,545,199 100% Deposit Type
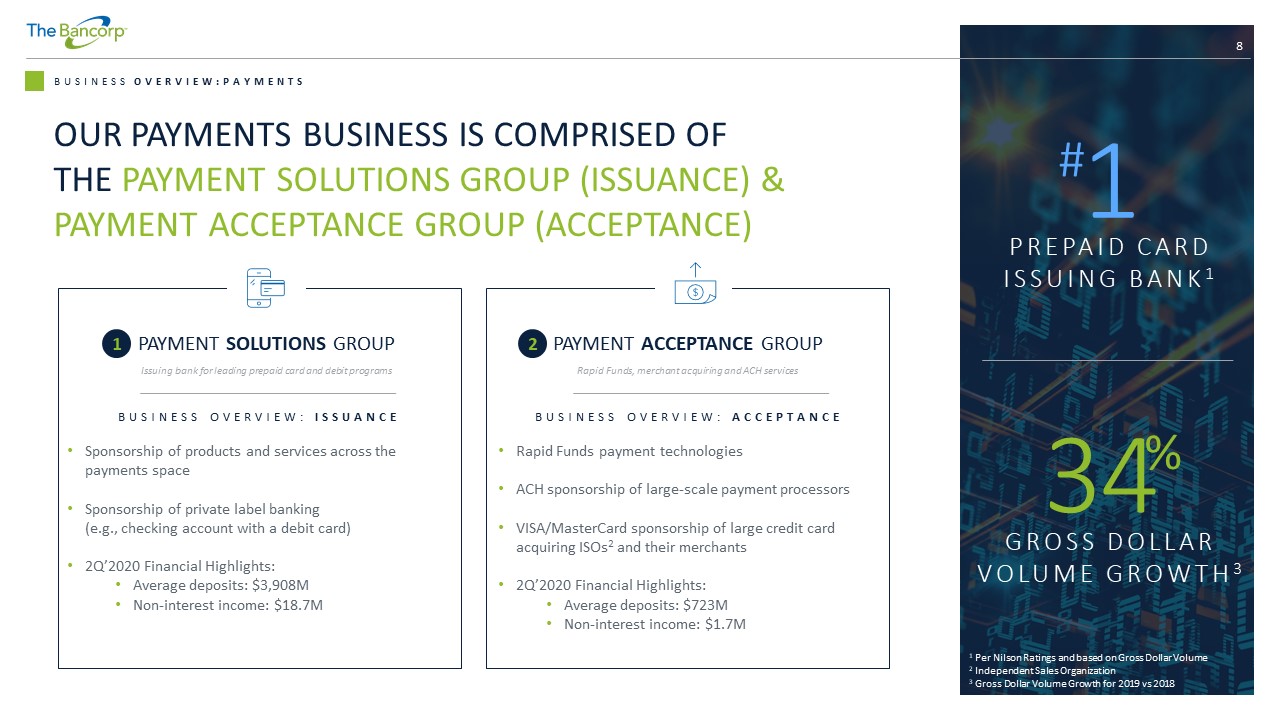
8 BUSINESS OVERVIEW:PAYMENTS PAYMENT SOLUTIONS GROUP Issuing bank for leading prepaid card and debit programs BUSINESS OVERVIEW: ISSUANCE • Sponsorship of products and services across the payments space • Sponsorship of private label banking (e.g., checking account with a debit card) • 2Q’2020 Financial Highlights: • Average deposits: $3,908M • Non - interest income: $18.7M PAYMENT ACCEPTANCE GROUP Rapid Funds, merchant acquiring and ACH services BUSINESS OVERVIEW: ACCEPTANCE • Rapid Funds payment technologies • ACH sponsorship of large - scale payment processors • VISA/MasterCard sponsorship of large credit card acquiring ISOs 2 and their merchants • 2Q’2020 Financial Highlights: • Average deposits: $723M • Non - interest income: $1.7M GROSS DOLLAR VOLUME GROWTH 3 1 Per Nilson Ratings and based on Gross Dollar Volume 2 Independent Sales Organization 3 Gross Dollar Volume Growth for 2019 vs 2018 1 # 34 % OUR PAYMENTS BUSINESS IS COMPRISED OF THE PAYMENT SOLUTIONS GROUP (ISSUANCE) & PAYMENT ACCEPTANCE GROUP (ACCEPTANCE) PREPAID CARD ISSUING BANK 1 1 2
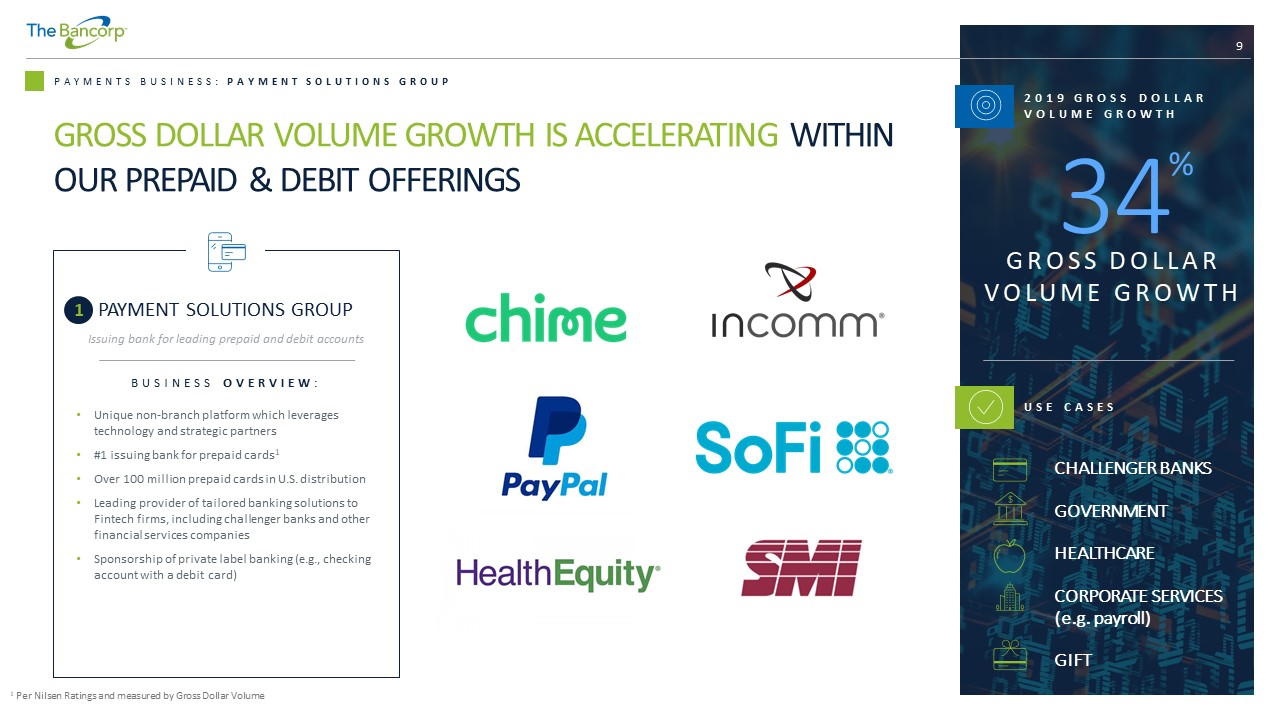
9 PAYMENTS BUSINESS: PAYMENT SOLUTIONS GROUP 1 Per Nilsen Ratings and measured by Gross Dollar Volume CHALLENGER BANKS GOVERNMENT HEALTHCARE CORPORATE SERVICES (e.g. payroll) GIFT GROSS DOLLAR VOLUME GROWTH IS ACCELERATING WITHIN OUR PREPAID & DEBIT OFFERINGS PAYMENT SOLUTIONS GROUP Issuing bank for leading prepaid and debit accounts BUSINESS OVERVIEW : • Unique non - branch platform which leverages technology and strategic partners • #1 issuing bank for prepaid cards 1 • Over 100 million prepaid cards in U.S. distribution • Leading provider of tailored banking solutions to Fintech firms, including challenger banks and other financial services companies • Sponsorship of private label banking (e.g., checking account with a debit card) 2019 GROSS DOLLAR VOLUME GROWTH 34 % GROSS DOLLAR VOLUME GROWTH USE CASES 1
10 PAYMENTS BUSINESS: PAYMENT ACCEPTANCE GROUP WE’RE EXPANDING ON OUR EARLY SUCCESS & adding new partners across various use cases 1 “Direct” is comprised of corporations with which The Bancorp contracts directly 2 Independent sales organization LAUNCHED IN LATE 2017, RAPID FUNDS HAS GATHERED STRONG MOMENTUM PAYMENT ACCEPTANCE GROUP Faster payment technologies BUSINESS OVERVIEW : • Pioneering real - time payments offering has recognized consistent and significant growth – 2018 VISA Innovation Adoption Award winner – Non - interest income and deposit generation • “Direct 2 ” Rapid Funds model delivers a highly scalable, low cost offering that disrupts legacy payment methods for corporate disbursements • ACH sponsorship of large - scale payment processors • VISA/MasterCard sponsorship of large credit card acquiring ISOs³ and their merchants USE CASES EARNED WAGE ACCESS GIG - ECONOMY INSURANCE CLAIM PAYOUTS 2

LOANS & LEASES HIGHLY SPECIALIZED LENDING WITH LOW LOSS HISTORIES 11
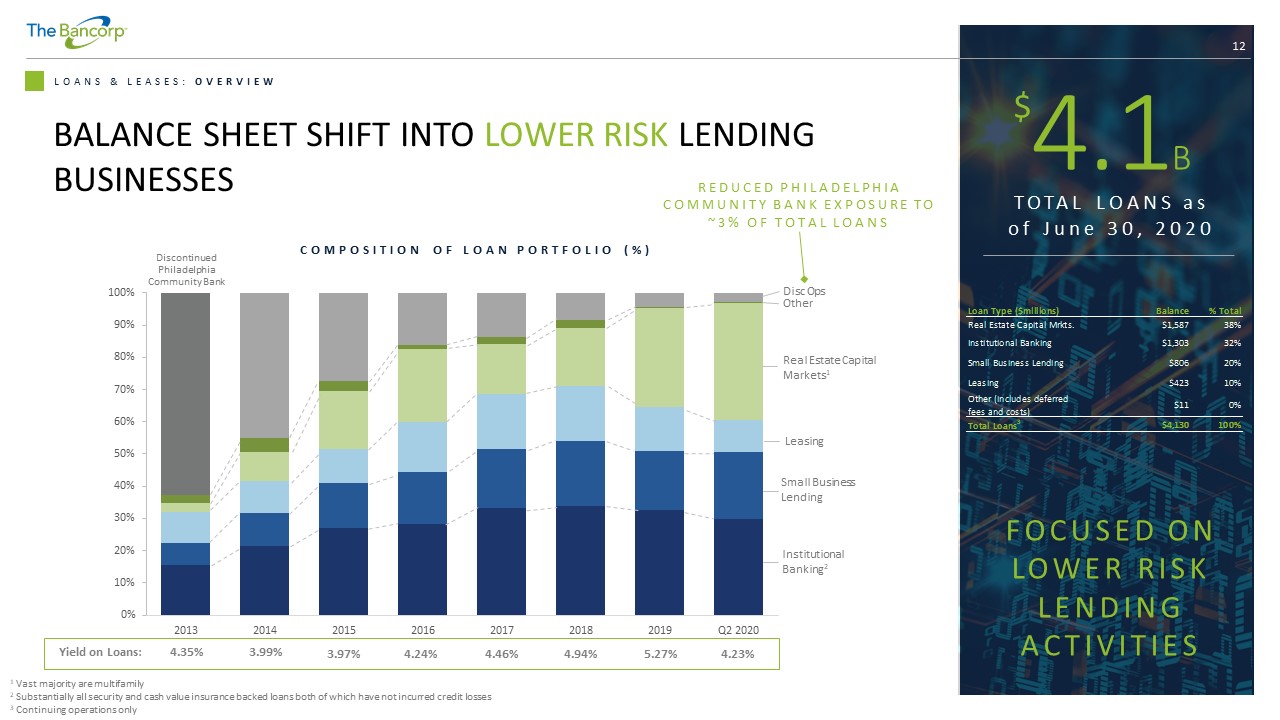
12 BALANCE SHEET SHIFT INTO LOWER RISK LENDING BUSINESSES 0% 10% 20% 30% 40% 50% 60% 70% 80% 90% 100% 2013 2014 2015 2016 2017 2018 2019 Q2 2020 Other Leasing Institutional Banking 2 Disc Ops Discontinued Philadelphia Community Bank 12 REDUCED PHILADELPHIA COMMUNITY BANK EXPOSURE TO ~3% OF TOTAL LOANS Small Business Lending Real Estate Capital Markets 1 4.1 B $ TOTAL LOANS as of June 30, 2020 LOANS & LEASES: OVERVIEW COMPOSITION OF LOAN PORTFOLIO (%) Yield on Loans: 4.35% 3.99% 3.97% 4.24% 4.46% 4.94% 5.27% 4.23% FOCUSED ON LOWER RISK LENDING ACTIVITIES 1 Vast majority are multifamily 2 Substantially all security and cash value insurance backed loans both of which have not incurred credit losses 3 Continuing operations only Loan Type ($millions) Balance % Total Real Estate Capital Mrkts. $1,587 38% Institutional Banking $1,303 32% Small Business Lending $806 20% Leasing $423 10% Other (includes deferred fees and costs) $11 0% Total Loans 3 $4,130 100%
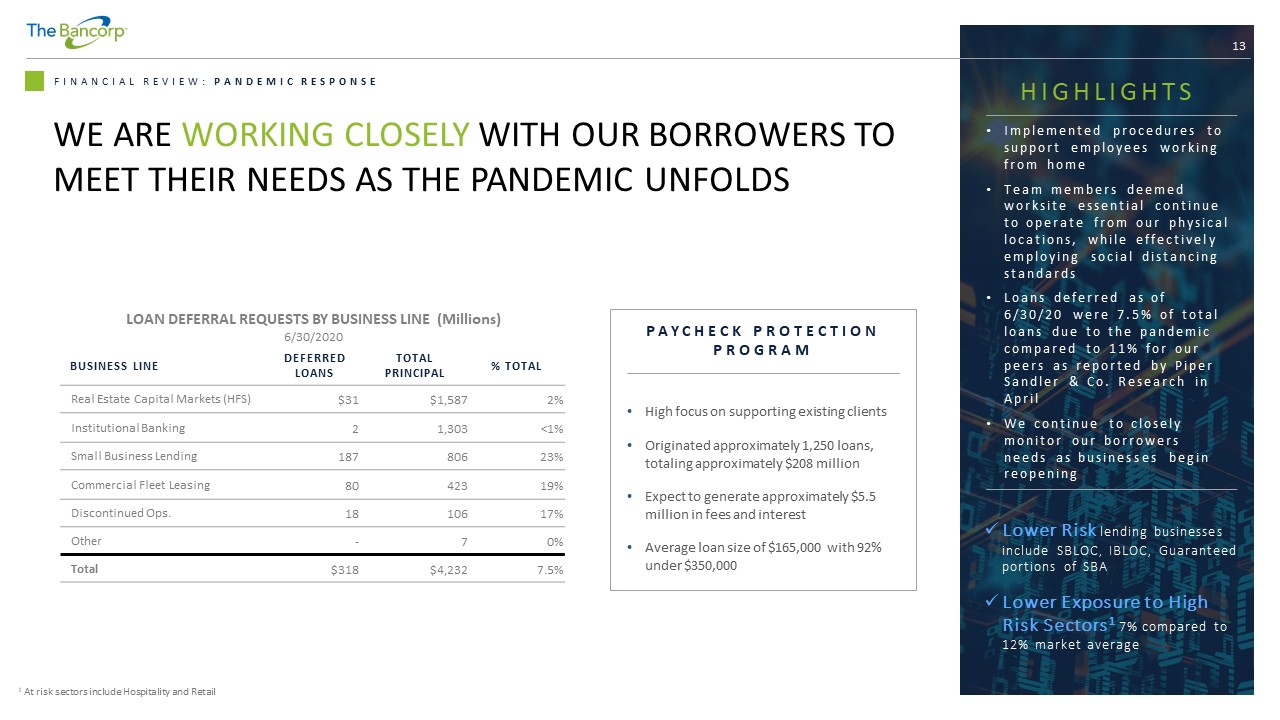
13 FINANCIAL REVIEW: PANDEMIC RESPONSE WE ARE WORKING CLOSELY WITH OUR BORROWERS TO MEET THEIR NEEDS AS THE PANDEMIC UNFOLDS HIGHLIGHTS • Implemented procedures to support employees working from home • Team members deemed worksite essential continue to operate from our physical locations, while effectively employing social distancing standards • Loans deferred as of 6/30/20 were 7.5% of total loans due to the pandemic compared to 11% for our peers as reported by Piper Sandler & Co. Research in April • We continue to closely monitor our borrowers needs as businesses begin reopening BUSINESS LINE DEFERRED LOANS TOTAL PRINCIPAL % TOTAL Real Estate Capital Markets (HFS) $31 $1,587 2% Institutional Banking 2 1,303 <1% Small Business Lending 187 806 23% Commercial Fleet Leasing 80 423 19% Discontinued Ops. 18 106 17% Other - 7 0% Total $318 $4,232 7.5% LOAN DEFERRAL REQUESTS BY BUSINESS LINE (Millions) 6/30/2020 PAYCHECK PROTECTION PROGRAM • High focus on supporting existing clients • Originated approximately 1,250 loans, totaling approximately $208 million • Expect to generate approximately $5.5 million in fees and interest • Average loan size of $165,000 with 92% under $350,000 x Lower Risk lending businesses include SBLOC, IBLOC, Guaranteed portions of SBA x Lower Exposure to High Risk Sectors 1 7% compared to 12% market average 1 At risk sectors include Hospitality and Retail
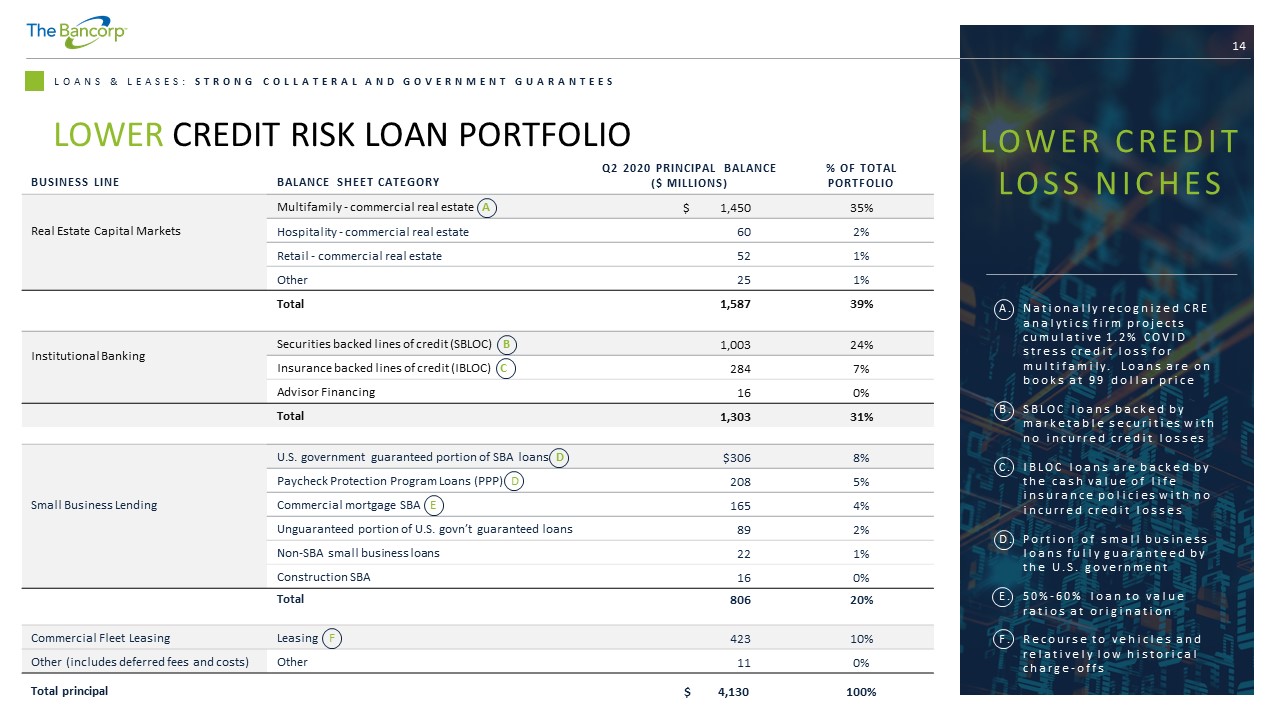
14 LOANS & LEASES: STRONG COLLATERAL AND GOVERNMENT GUARANTEES LOWER CREDIT RISK LOAN PORTFOLIO BUSINESS LINE BALANCE SHEET CATEGORY Q2 2020 PRINCIPAL BALANCE ($ MILLIONS) % OF TOTAL PORTFOLIO Real Estate Capital Markets Multifamily - commercial real estate A $ 1,450 35% Hospitality - commercial real estate 60 2% Retail - commercial real estate 52 1% Other 25 1% Total 1,587 39% Institutional Banking Securities backed lines of credit (SBLOC) B 1,003 24% Insurance backed lines of credit (IBLOC) C 284 7% Advisor Financing 16 0% Total 1,303 31% Small Business Lending U.S. government guaranteed portion of SBA loans D $306 8% Pay check Protection Program Loans (PPP) D 208 5% Commercial mortgage SBA E 165 4% Unguaranteed portion of U.S. govn’t guaranteed loans 89 2% Non - SBA small business loans 22 1% Construction SBA 16 0% Total 806 20% Commercial Fleet Leasing Leasing F 423 10% Other (includes deferred fees and costs) Other 11 0% Total principal $ 4,130 100% LOWER CREDIT LOSS NICHES A. Nationally recognized CRE analytics firm projects cumulative 1.2% COVID stress credit loss for multifamily. Loans are on books at 99 dollar price B. SBLOC loans backed by marketable securities with no incurred credit losses C. IBLOC loans are backed by the cash value of life insurance policies with no incurred credit losses D. Portion of small business loans fully guaranteed by the U.S. government E. 50% - 60% loan to value ratios at origination F. Recourse to vehicles and relatively low historical charge - offs
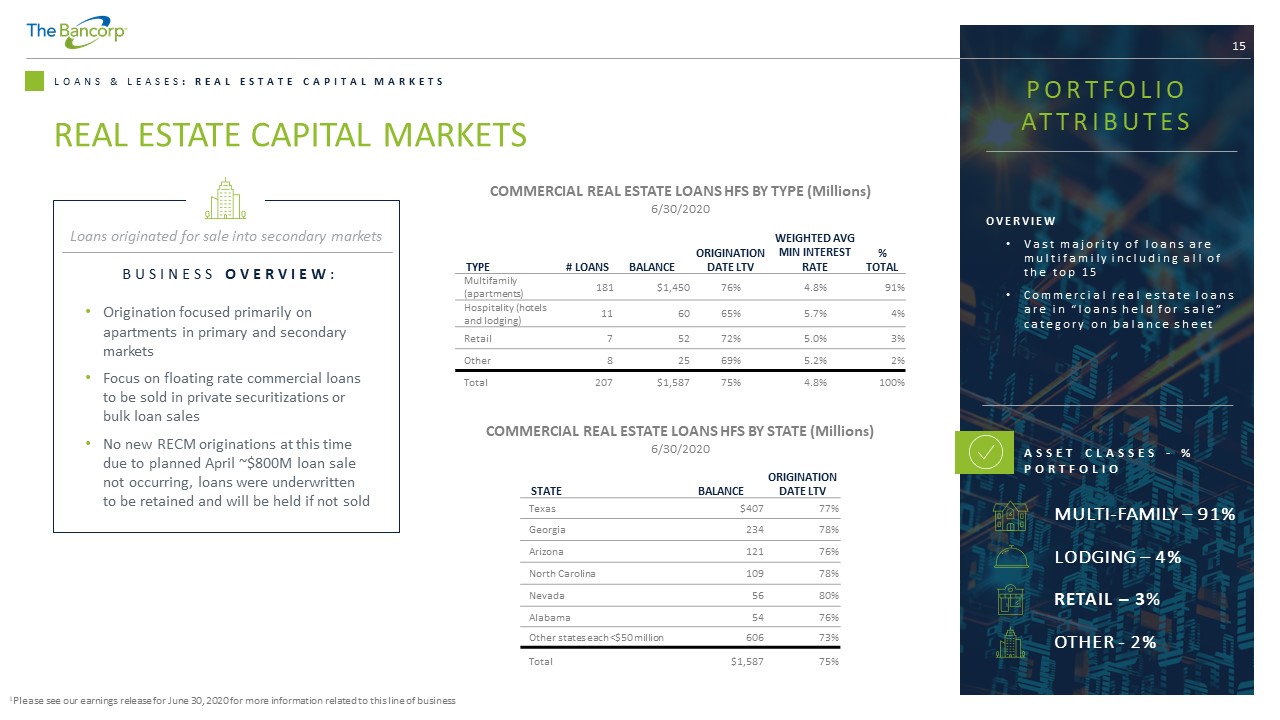
15 LOANS & LEASES : REAL ESTATE CAPITAL MARKETS BUSINESS OVERVIEW : • Origination focused primarily on apartments in primary and secondary markets • Focus on floating rate commercial loans to be sold in private securitizations or bulk loan sales • No new RECM originations at this time due to planned April ~$800M loan sale not occurring, loans were underwritten to be retained and will be held if not sold MULTI - FAMILY – 91% LODGING – 4% RETAIL – 3% OTHER - 2% ASSET CLASSES - % PORTFOLIO REAL ESTATE CAPITAL MARKETS TYPE # LOANS BALANCE ORIGINATION DATE LTV WEIGHTED AVG MIN INTEREST RATE % TOTAL Multifamily (apartments) 181 $1,450 76% 4.8% 91% Hospitality (hotels and lodging) 11 60 65% 5.7% 4% Retail 7 52 72% 5.0% 3% Other 8 25 69% 5.2% 2% Total 207 $1,587 75% 4.8% 100% COMMERCIAL REAL ESTATE LOANS HFS BY TYPE (Millions) 6/30/2020 STATE BALANCE ORIGINATION DATE LTV Texas $407 77% Georgia 234 78% Arizona 121 76% North Carolina 109 78% Nevada 56 80% Alabama 54 76% Other states each <$50 million 606 73% Total $1,587 75% COMMERCIAL REAL ESTATE LOANS HFS BY STATE (Millions) 6/30/2020 OVERVIEW • Vast majority of loans are multifamily including all of the top 15 • Commercial real estate loans are in “loans held for sale” category on balance sheet PORTFOLIO ATTRIBUTES Loans originated for sale into secondary markets 1 Please see our earnings release for June 30, 2020 for more information related to this line of business
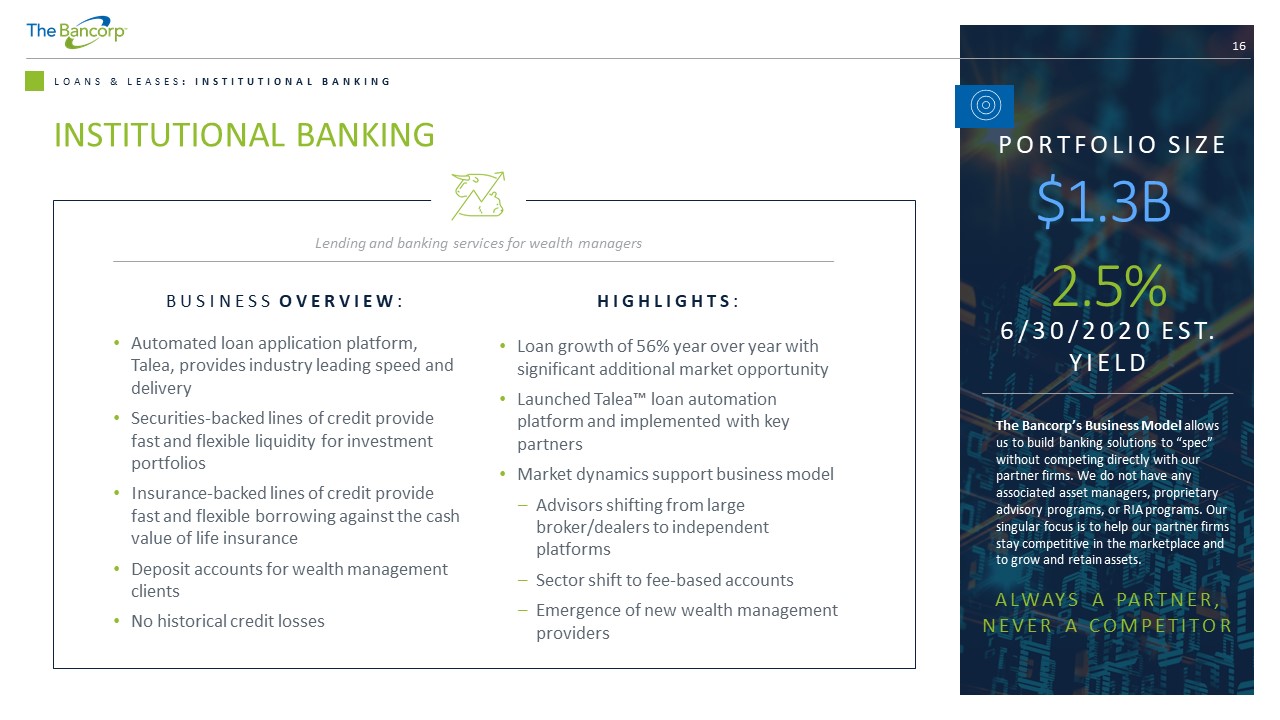
BUSINESS OVERVIEW : • Automated loan application platform, Talea, provides industry leading speed and delivery • Securities - backed lines of credit provide fast and flexible liquidity for investment portfolios • Insurance - backed lines of credit provide fast and flexible borrowing against the cash value of life insurance • Deposit accounts for wealth management clients • No historical credit losses 16 LOANS & LEASES : INSTITUTIONAL BANKING Lending and banking services for wealth managers HIGHLIGHTS : • Loan growth of 56% year over year with significant additional market opportunity • Launched Talea ™ loan automation platform and implemented with key partners • Market dynamics support business model – Advisors shifting from large broker/dealers to independent platforms – Sector shift to fee - based accounts – Emergence of new wealth management providers The Bancorp’s Business Model allows us to build banking solutions to “spec” without competing directly with our partner firms. We do not have any associated asset managers, proprietary advisory programs, or RIA programs. Our singular focus is to help our partner firms stay competitive in the marketplace and to grow and retain assets. ALWAYS A PARTNER, NEVER A COMPETITOR INSTITUTIONAL BANKING $1.3B PORTFOLIO SIZE 2.5% 6/30/2020 EST. YIELD
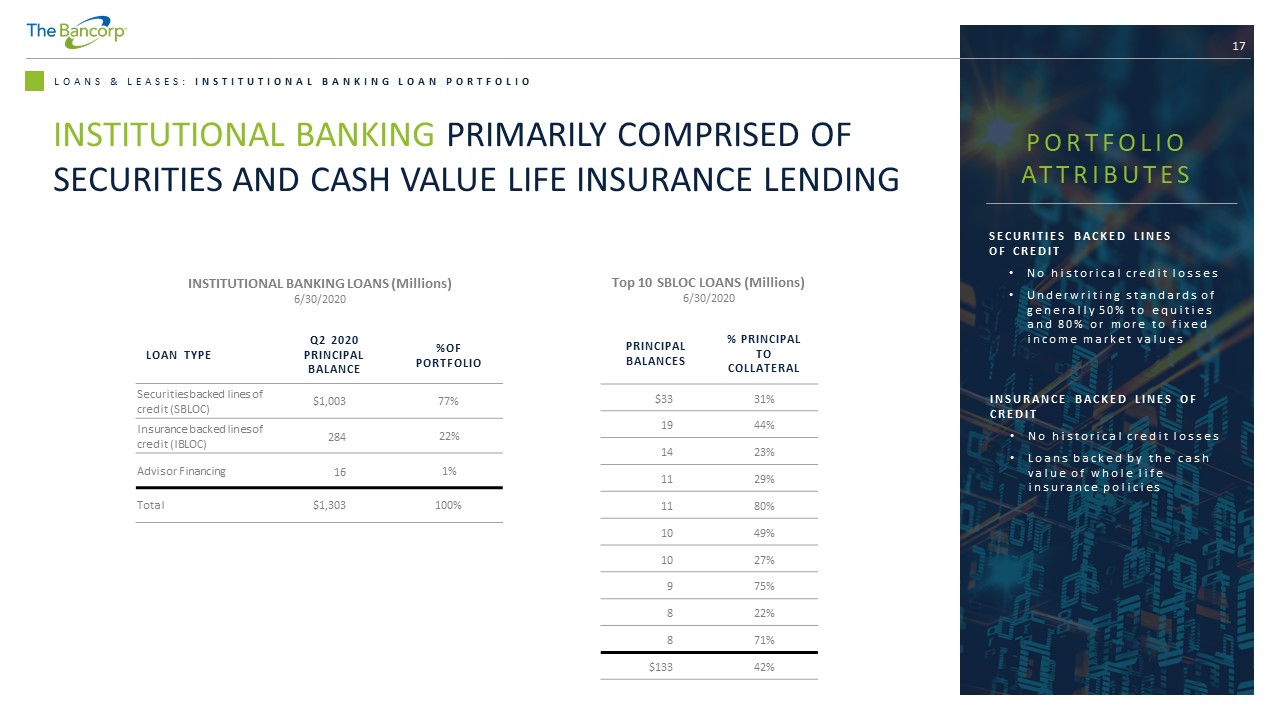
17 LOANS & LEASES: INSTITUTIONAL BANKING LOAN PORTFOLIO INSTITUTIONAL BANKING PRIMARILY COMPRISED OF SECURITIES AND CASH VALUE LIFE INSURANCE LENDING LOAN TYPE Q2 2020 PRINCIPAL BALANCE %OF PORTFOLIO Securities backed lines of credit (SBLOC) $1,003 77% Insurance backed lines of credit (IBLOC) 284 22% Advisor Financing 16 1% Total $1,303 100% PORTFOLIO ATTRIBUTES PRINCIPAL BALANCES % PRINCIPAL TO COLLATERAL $33 31% 19 44% 14 23% 11 29% 11 80% 10 49% 10 27% 9 75% 8 22% 8 71% $133 42% Top 10 SBLOC LOANS (Millions) 6/30/2020 INSTITUTIONAL BANKING LOANS (Millions) 6/30/2020 INSURANCE BACKED LINES OF CREDIT • No historical credit losses • Loans backed by the cash value of whole life insurance policies SECURITIES BACKED LINES OF CREDIT • No historical credit losses • Underwriting standards of generally 50% to equities and 80% or more to fixed income market values
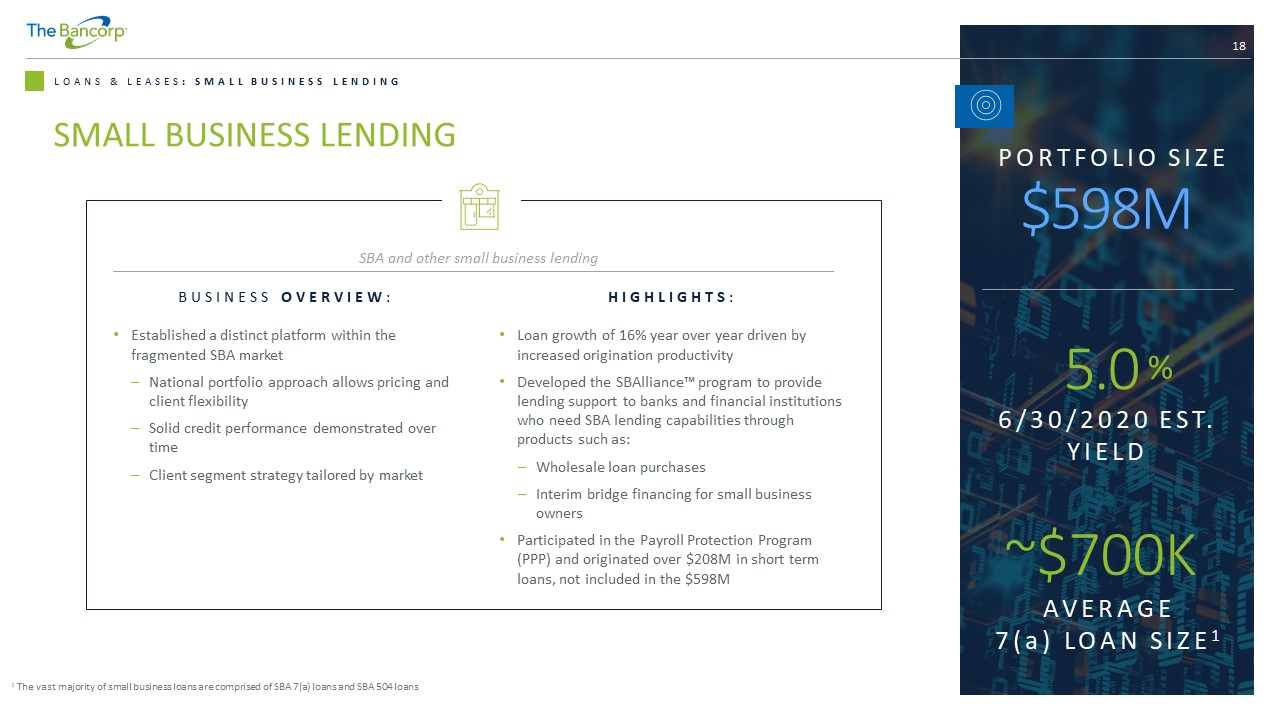
BUSINESS OVERVIEW : • Established a distinct platform within the fragmented SBA market – National portfolio approach allows pricing and client flexibility – Solid credit performance demonstrated over time – Client segment strategy tailored by market 18 LOANS & LEASES : SMALL BUSINESS LENDING ~$700K AVERAGE 7(a) LOAN SIZE 1 SBA and other small business lending HIGHLIGHTS : • Loan growth of 16% year over year driven by increased origination productivity • Developed the SBAlliance ™ program to provide lending support to banks and financial institutions who need SBA lending capabilities through products such as: – Wholesale loan purchases – Interim bridge financing for small business owners • Participated in the Payroll Protection Program (PPP) and originated over $208M in short term loans, not included in the $598M 1 The vast majority of small business loans are comprised of SBA 7(a) loans and SBA 504 loans SMALL BUSINESS LENDING $598M PORTFOLIO SIZE 5.0 % 6/30/2020 EST. YIELD
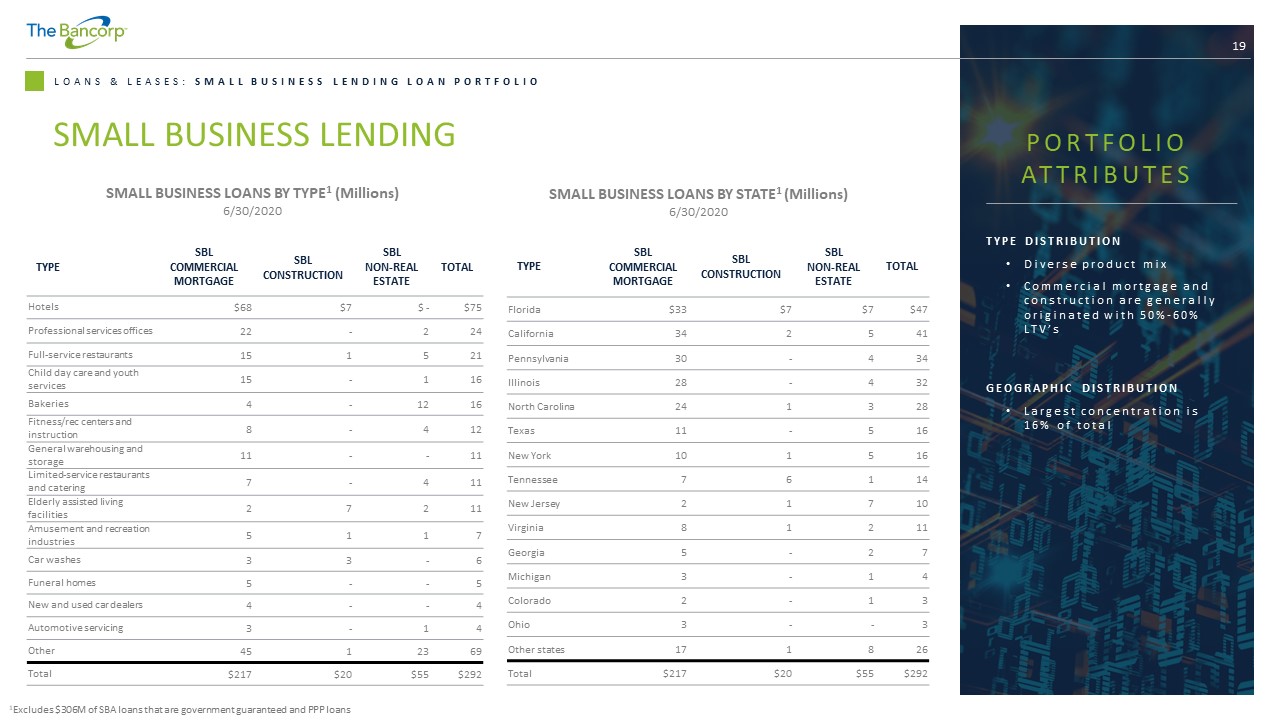
19 LOANS & LEASES: SMALL BUSINESS LENDING LOAN PORTFOLIO SMALL BUSINESS LENDING TYPE SBL COMMERCIAL MORTGAGE SBL CONSTRUCTION SBL NON - REAL ESTATE TOTAL Hotels $68 $7 $ - $75 Professional services offices 22 - 2 24 Full - service restaurants 15 1 5 21 Child day care and youth services 15 - 1 16 Bakeries 4 - 12 16 Fitness/rec centers and instruction 8 - 4 12 General warehousing and storage 11 - - 11 Limited - service restaurants and catering 7 - 4 11 Elderly assisted living facilities 2 7 2 11 Amusement and recreation industries 5 1 1 7 Car washes 3 3 - 6 Funeral homes 5 - - 5 New and used car dealers 4 - - 4 Automotive servicing 3 - 1 4 Other 45 1 23 69 Total $217 $20 $55 $292 TYPE SBL COMMERCIAL MORTGAGE SBL CONSTRUCTION SBL NON - REAL ESTATE TOTAL Florida $33 $7 $7 $47 California 34 2 5 41 Pennsylvania 30 - 4 34 Illinois 28 - 4 32 North Carolina 24 1 3 28 Texas 11 - 5 16 New York 10 1 5 16 Tennessee 7 6 1 14 New Jersey 2 1 7 10 Virginia 8 1 2 11 Georgia 5 - 2 7 Michigan 3 - 1 4 Colorado 2 - 1 3 Ohio 3 - - 3 Other states 17 1 8 26 Total $217 $20 $55 $292 SMALL BUSINESS LOANS BY TYPE 1 (Millions) 6/30/2020 GEOGRAPHIC DISTRIBUTION • Largest concentration is 16% of total 1 Excludes $306M of SBA loans that are government guaranteed and PPP loans SMALL BUSINESS LOANS BY STATE 1 (Millions) 6/30/2020 TYPE DISTRIBUTION • Diverse product mix • Commercial mortgage and construction are generally originated with 50% - 60% LTV’s PORTFOLIO ATTRIBUTES
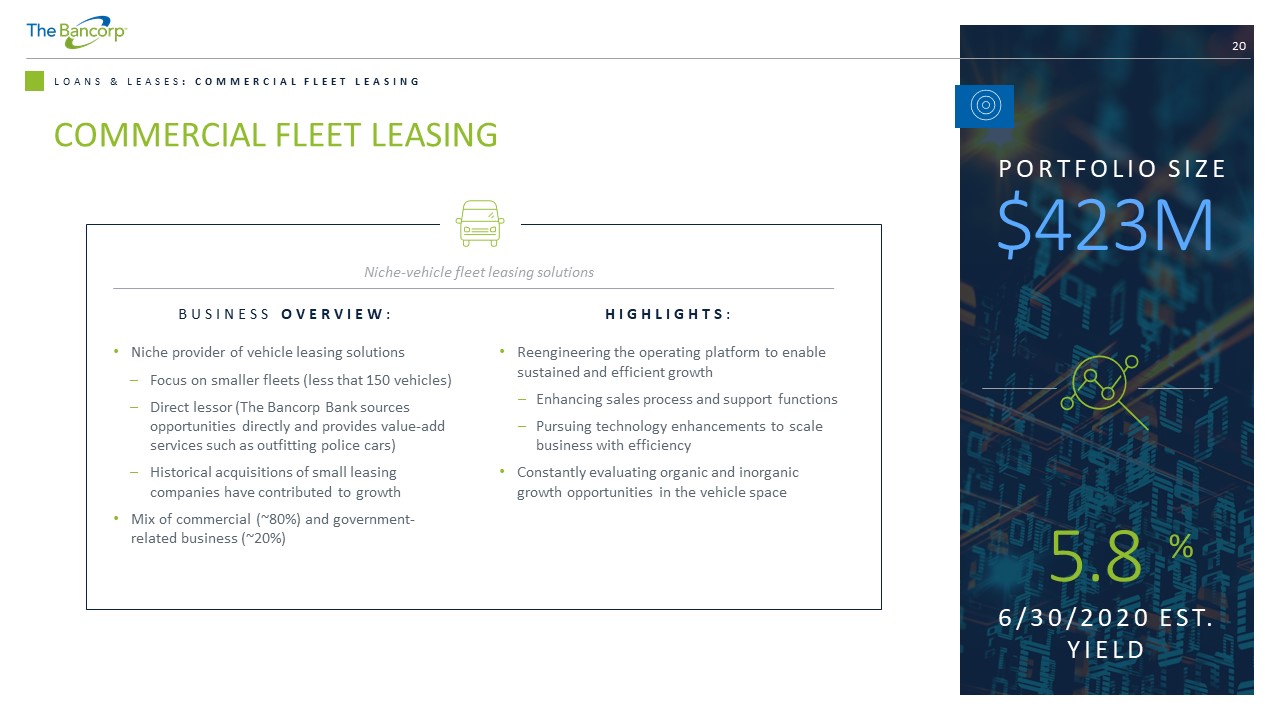
20 LOANS & LEASES : COMMERCIAL FLEET LEASING BUSINESS OVERVIEW : • Niche provider of vehicle leasing solutions – Focus on smaller fleets (less that 150 vehicles) – Direct lessor (The Bancorp Bank sources opportunities directly and provides value - add services such as outfitting police cars) – Historical acquisitions of small leasing companies have contributed to growth • Mix of commercial (~80%) and government - related business (~20%) Niche - vehicle fleet leasing solutions HIGHLIGHTS : • Reengineering the operating platform to enable sustained and efficient growth – Enhancing sales process and support functions – Pursuing technology enhancements to scale business with efficiency • Constantly evaluating organic and inorganic growth opportunities in the vehicle space COMMERCIAL FLEET LEASING 5.8 % 6/30/2020 EST. YIELD $423M PORTFOLIO SIZE
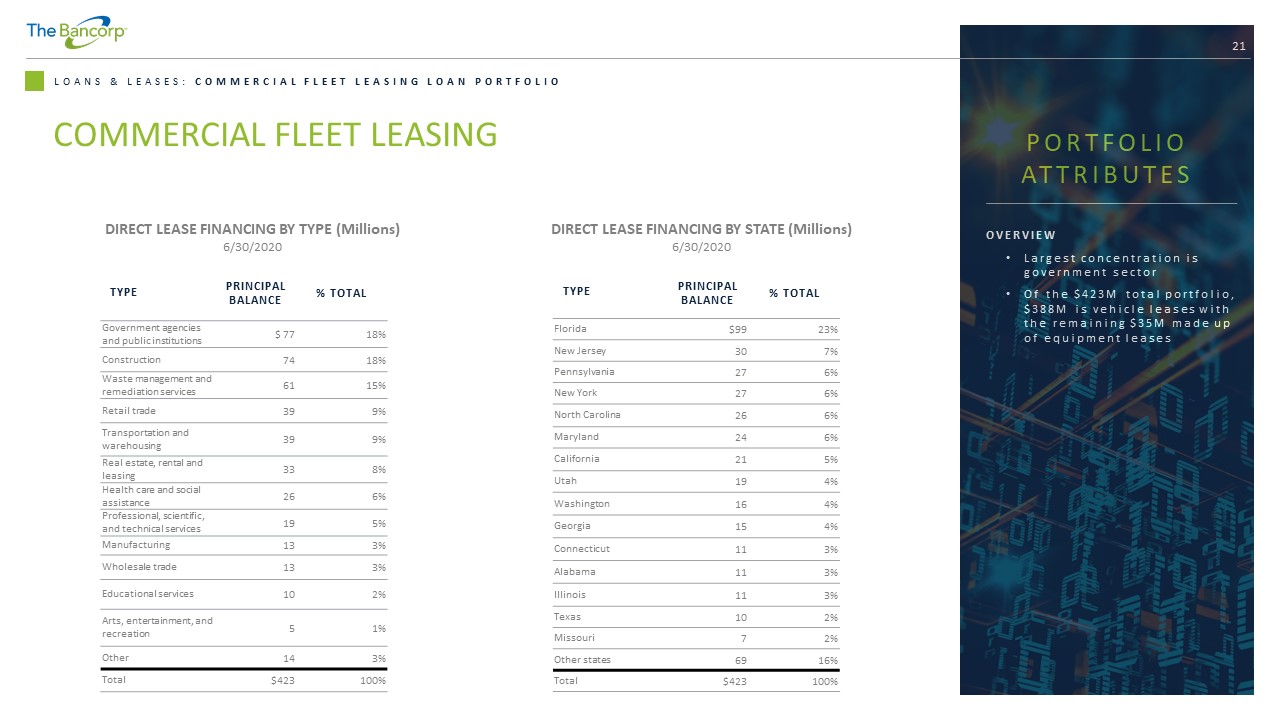
21 LOANS & LEASES: COMMERCIAL FLEET LEASING LOAN PORTFOLIO COMMERCIAL FLEET LEASING TYPE PRINCIPAL BALANCE % TOTAL Government agencies and public institutions $ 77 18% Construction 74 18% Waste management and remediation services 61 15% Retail trade 39 9% Transportation and warehousing 39 9% Real estate, rental and leasing 33 8% Health care and social assistance 26 6% Professional, scientific, and technical services 19 5% Manufacturing 13 3% Wholesale trade 13 3% Educational services 10 2% Arts, entertainment, and recreation 5 1% Other 14 3% Total $423 100% OVERVIEW • Largest concentration is government sector • Of the $423M total portfolio, $388M is vehicle leases with the remaining $35M made up of equipment leases TYPE PRINCIPAL BALANCE % TOTAL Florida $99 23% New Jersey 30 7% Pennsylvania 27 6% New York 27 6% North Carolina 26 6% Maryland 24 6% California 21 5% Utah 19 4% Washington 16 4% Georgia 15 4% Connecticut 11 3% Alabama 11 3% Illinois 11 3% Texas 10 2% Missouri 7 2% Other states 69 16% Total $423 100% DIRECT LEASE FINANCING BY TYPE (Millions) 6/30/2020 DIRECT LEASE FINANCING BY STATE (Millions) 6/30/2020 PORTFOLIO ATTRIBUTES

FINANCIAL REVIEW 22
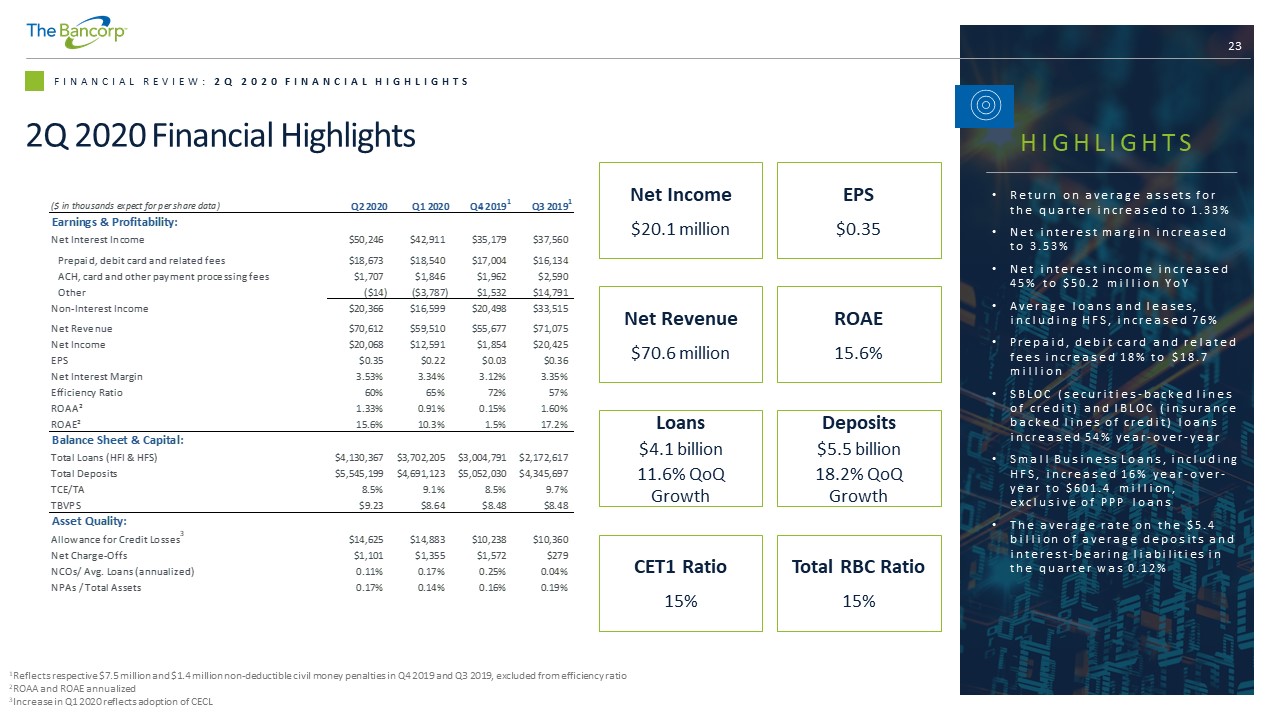
23 FINANCIAL REVIEW: 2Q 2020 FINANCIAL HIGHLIGHTS 2Q 2020 Financial Highlights 1 Reflects respective $7.5 million and $1.4 million non - deductible civil money penalties in Q4 2019 and Q3 2019, excluded from eff iciency ratio 2 ROAA and ROAE annualized 3 Increase in Q1 2020 reflects adoption of CECL Net Income $20.1 million EPS $0.35 Net Revenue $70.6 million Loans $4.1 billion 11.6% QoQ Growth CET1 Ratio 15% ROAE 15.6% Deposits $5.5 billion 18.2% QoQ Growth Total RBC Ratio 15% HIGHLIGHTS • Return on average assets for the quarter increased to 1.33% • Net interest margin increased to 3.53% • Net interest income increased 45% to $50.2 million YoY • Average loans and leases, including HFS, increased 76% • Prepaid, debit card and related fees increased 18% to $18.7 million • SBLOC (securities - backed lines of credit) and IBLOC (insurance backed lines of credit) loans increased 54% year - over - year • Small Business Loans, including HFS, increased 16% year - over - year to $601.4 million, exclusive of PPP loans • The average rate on the $5.4 billion of average deposits and interest - bearing liabilities in the quarter was 0.12% ($ in thousands expect for per share data) Q2 2020 Q1 2020 Q4 2019 1 Q3 2019 1 Earnings & Profitability: Net Interest Income $50,246 $42,911 $35,179 $37,560 Prepaid, debit card and related fees $18,673 $18,540 $17,004 $16,134 ACH, card and other payment processing fees $1,707 $1,846 $1,962 $2,590 Other ($14) ($3,787) $1,532 $14,791 Non-Interest Income $20,366 $16,599 $20,498 $33,515 Net Revenue $70,612 $59,510 $55,677 $71,075 Net Income $20,068 $12,591 $1,854 $20,425 EPS $0.35 $0.22 $0.03 $0.36 Net Interest Margin 3.53% 3.34% 3.12% 3.35% Efficiency Ratio 60% 65% 72% 57% ROAA² 1.33% 0.91% 0.15% 1.60% ROAE² 15.6% 10.3% 1.5% 17.2% Balance Sheet & Capital: Total Loans (HFI & HFS) $4,130,367 $3,702,205 $3,004,791 $2,172,617 Total Deposits $5,545,199 $4,691,123 $5,052,030 $4,345,697 TCE/TA 8.5% 9.1% 8.5% 9.7% TBVPS $9.23 $8.64 $8.48 $8.48 Asset Quality: Allowance for Credit Losses 3 $14,625 $14,883 $10,238 $10,360 Net Charge-Offs $1,101 $1,355 $1,572 $279 NCOs/ Avg. Loans (annualized) 0.11% 0.17% 0.25% 0.04% NPAs / Total Assets 0.17% 0.14% 0.16% 0.19%
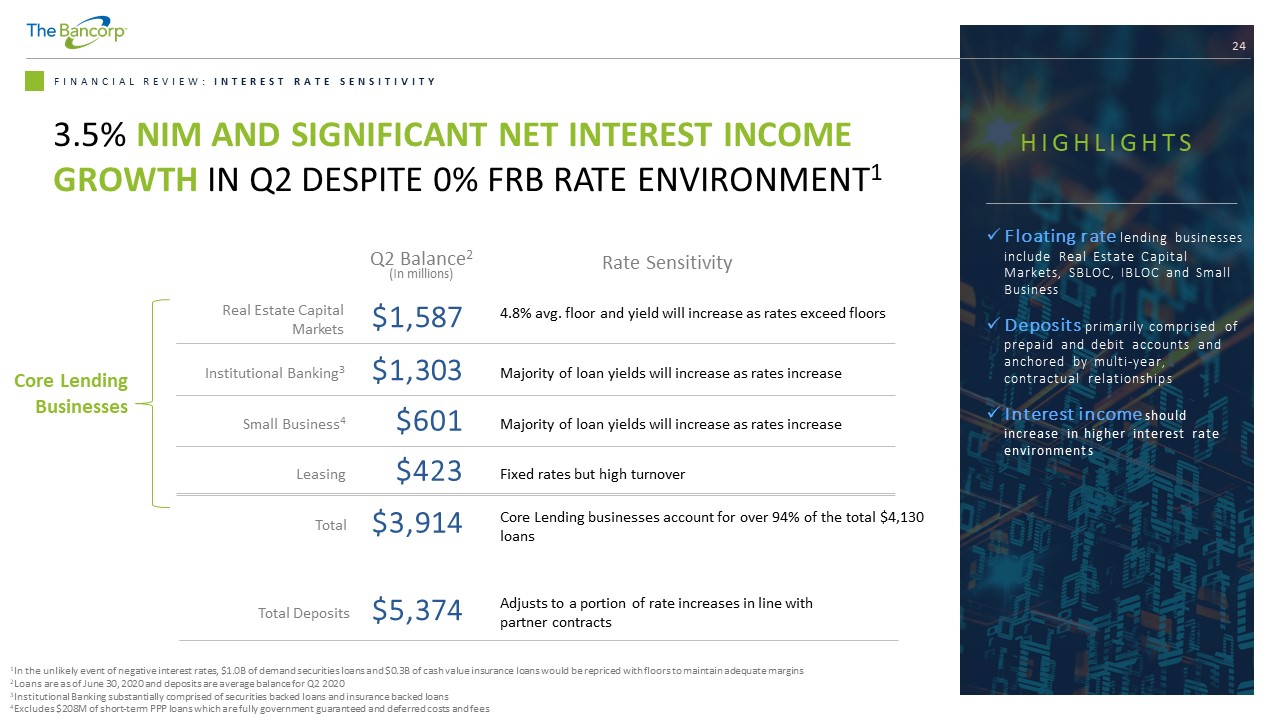
24 3.5% NIM AND SIGNIFICANT NET INTEREST INCOME GROWTH IN Q2 DESPITE 0% FRB RATE ENVIRONMENT 1 24 FINANCIAL REVIEW: INTEREST RATE SENSITIVITY Real Estate Capital Markets $1,587 HIGHLIGHTS x Floating rate lending businesses include Real Estate Capital Markets, SBLOC, IBLOC and Small Business x Deposits primarily comprised of prepaid and debit accounts and anchored by multi - year, contractual relationships x Interest income should increase in higher interest rate environments 1 In the unlikely event of negative interest rates, $1.0B of demand securities loans and $0.3B of cash value insurance loans wo uld be repriced with floors to maintain adequate margins 2 Loans are as of June 30, 2020 and deposits are average balance for Q2 2020 3 Institutional Banking substantially comprised of securities backed loans and insurance backed loans 4 Excludes $208M of short - term PPP loans which are fully government guaranteed and deferred costs and fees 4.8% avg. floor and yield will increase as rates exceed floors Institutional Banking 3 $1,303 Majority of loan yields will increase as rates increase Small Business 4 $601 Majority of loan yields will increase as rates increase Leasing $423 Q2 Balance 2 (In millions) Total Deposits $5,374 Adjusts to a portion of rate increases in line with partner contracts Fixed rates but high turnover Core Lending Businesses Total $3,914 Core Lending businesses account for over 94% of the total $4,130 loans Rate Sensitivity
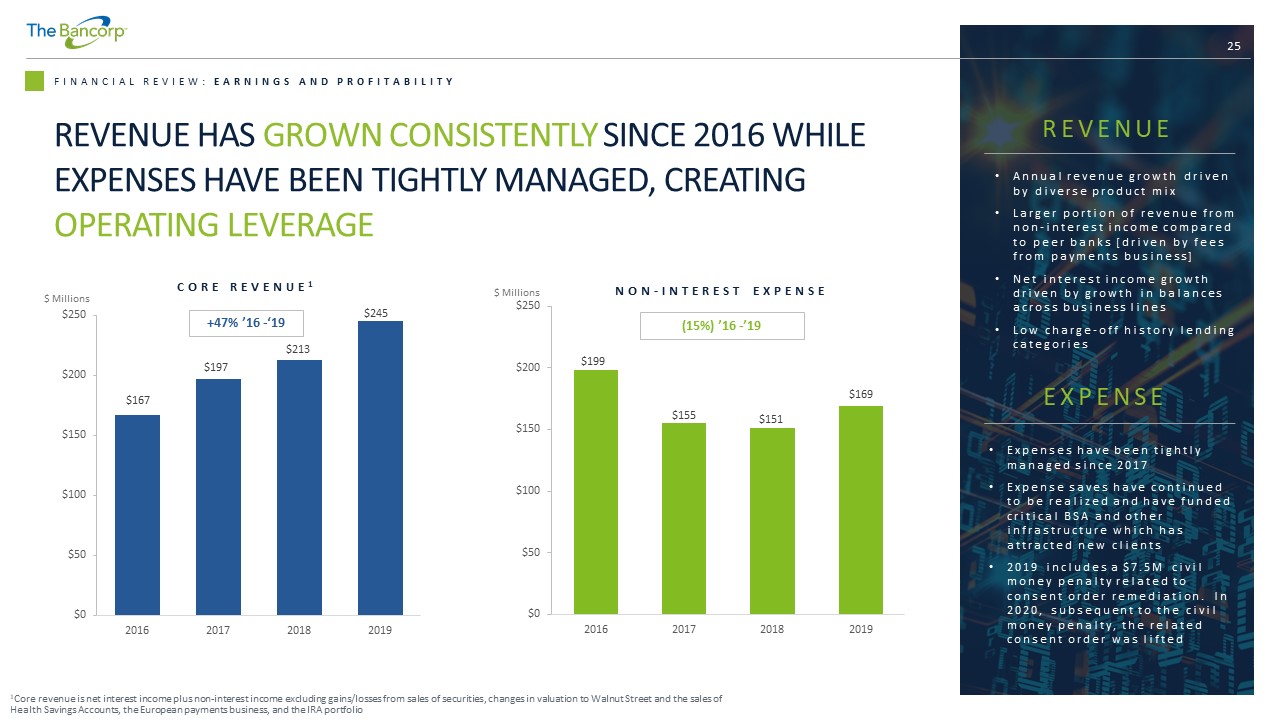
25 FINANCIAL REVIEW: EARNINGS AND PROFITABILITY 1 Core revenue is net interest income plus non - interest income excluding gains/losses from sales of securities, changes in valuati on to Walnut Street and the sales of Health Savings Accounts, the European payments business, and the IRA portfolio $0 $50 $100 $150 $200 $250 2016 2017 2018 2019 CORE REVENUE 1 $0 $50 $100 $150 $200 $250 2016 2017 2018 2019 +47% ’16 - ‘19 (15%) ’16 - ’19 $167 $197 $213 $199 $155 $151 $245 $169 REVENUE • Annual revenue growth driven by diverse product mix • Larger portion of revenue from non - interest income compared to peer banks [driven by fees from payments business] • Net interest income growth driven by growth in balances across business lines • Low charge - off history lending categories EXPENSE • Expenses have been tightly managed since 2017 • Expense saves have continued to be realized and have funded critical BSA and other infrastructure which has attracted new clients • 2019 includes a $7.5M civil money penalty related to consent order remediation. In 2020, subsequent to the civil money penalty, the related consent order was lifted NON - INTEREST EXPENSE REVENUE HAS GROWN CONSISTENTLY SINCE 2016 WHILE EXPENSES HAVE BEEN TIGHTLY MANAGED, CREATING OPERATING LEVERAGE $ Millions $ Millions
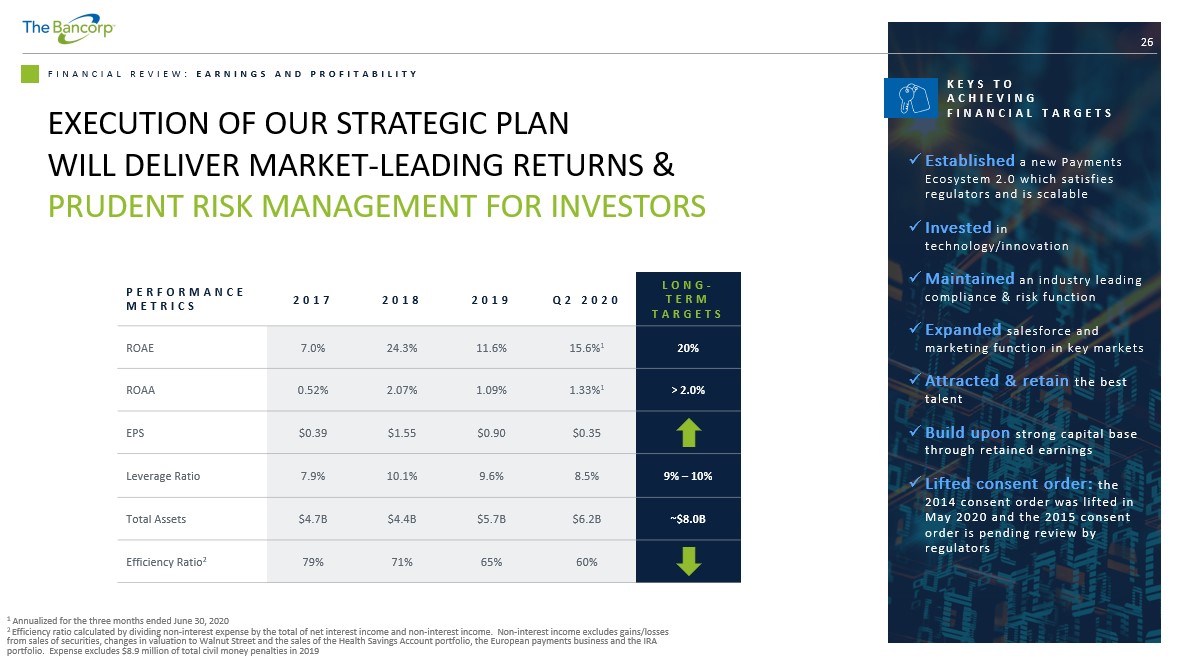
26 FINANCIAL REVIEW: EARNINGS AND PROFITABILITY KEYS TO ACHIEVING FINANCIAL TARGETS x Established a new Payments Ecosystem 2.0 which satisfies regulators and is scalable x Invested in technology/innovation x Maintained an industry leading compliance & risk function x Expanded salesforce and marketing function in key markets x Attracted & retain the best talent x Build upon strong capital base through retained earnings x Lifted consent order: the 2014 consent order was lifted in May 2020 and the 2015 consent order is pending review by regulators PERFORMANCE METRICS 2017 2018 2019 Q2 2020 LONG - TERM TARGETS ROAE 7.0% 24.3% 11.6% 15.6% 1 20% ROAA 0.52% 2.07% 1.09% 1.33% 1 > 2.0% EPS $0.39 $1.55 $0.90 $0.35 Leverage Ratio 7.9% 10.1% 9.6% 8.5% 9% – 10% Total Assets $4.7B $4.4B $5.7B $6.2B ~$8.0B Efficiency Ratio 2 79% 71% 65% 60% EXECUTION OF OUR STRATEGIC PLAN WILL DELIVER MARKET - LEADING RETURNS & PRUDENT RISK MANAGEMENT FOR INVESTORS 1 Annualized for the three months ended June 30, 2020 2 Efficiency ratio calculated by dividing non - interest expense by the total of net interest income and non - interest income. Non - i nterest income excludes gains/losses from sales of securities, changes in valuation to Walnut Street and the sales of the Health Savings Account portfolio, the European payments business and the IRA portfolio. Expense excludes $8.9 million of total civil money penalties in 2019
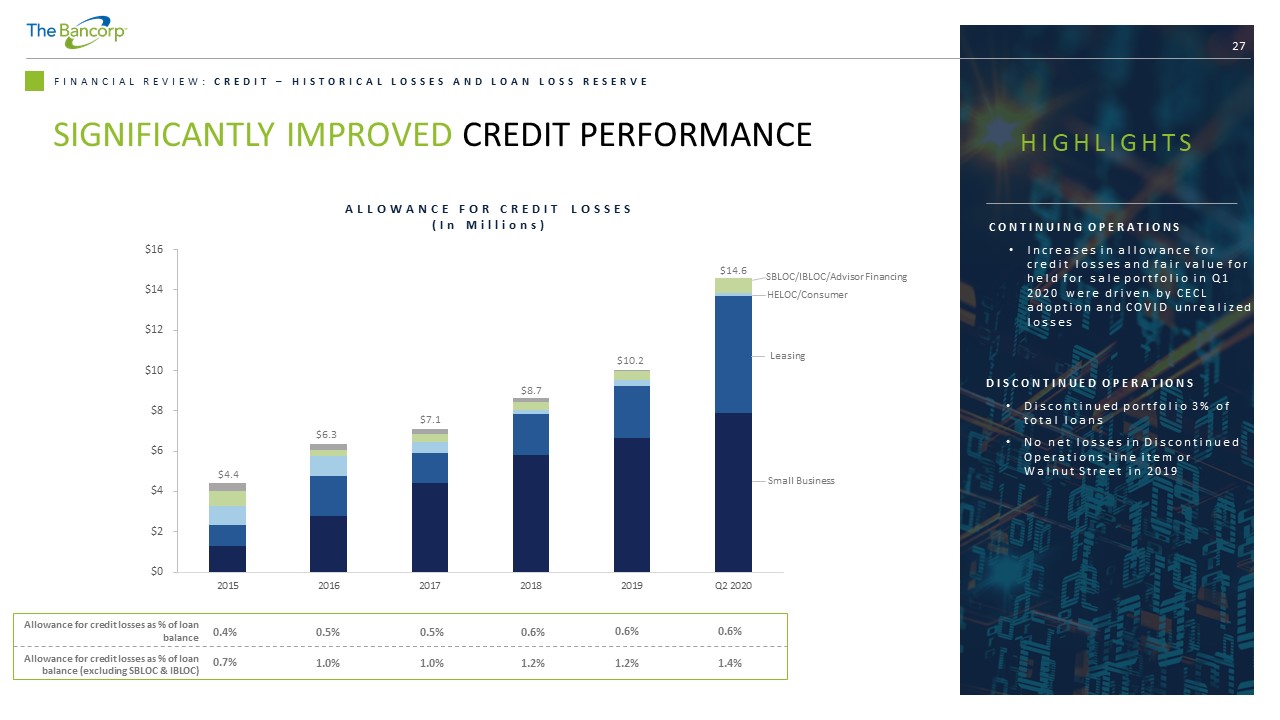
27 FINANCIAL REVIEW: CREDIT – HISTORICAL LOSSES AND LOAN LOSS RESERVE $0 $2 $4 $6 $8 $10 $12 $14 $16 2015 2016 2017 2018 2019 Q2 2020 0.4% 0.5% 0.6% Allowance for credit losses as % of loan balance Allowance for credit losses as % of loan balance (excluding SBLOC & IBLOC ) 0.7% 1.0% 1.2% 0.5% 1.0% 0.6% 1.2% HIGHLIGHTS DISCONTINUED OPERATIONS • Discontinued portfolio 3% of total loans • No net losses in Discontinued Operations line item or Walnut Street in 2019 CONTINUING OPERATIONS • Increases in allowance for credit losses and fair value for held for sale portfolio in Q1 2020 were driven by CECL adoption and COVID unrealized losses Leasing HELOC/Consumer SBLOC/IBLOC/Advisor Financing Small Business $4.4 $7.1 $6.3 $8.7 $10.2 $14.6 0.6% 1.4% SIGNIFICANTLY IMPROVED CREDIT PERFORMANCE ALLOWANCE FOR CREDIT LOSSES (In Millions)
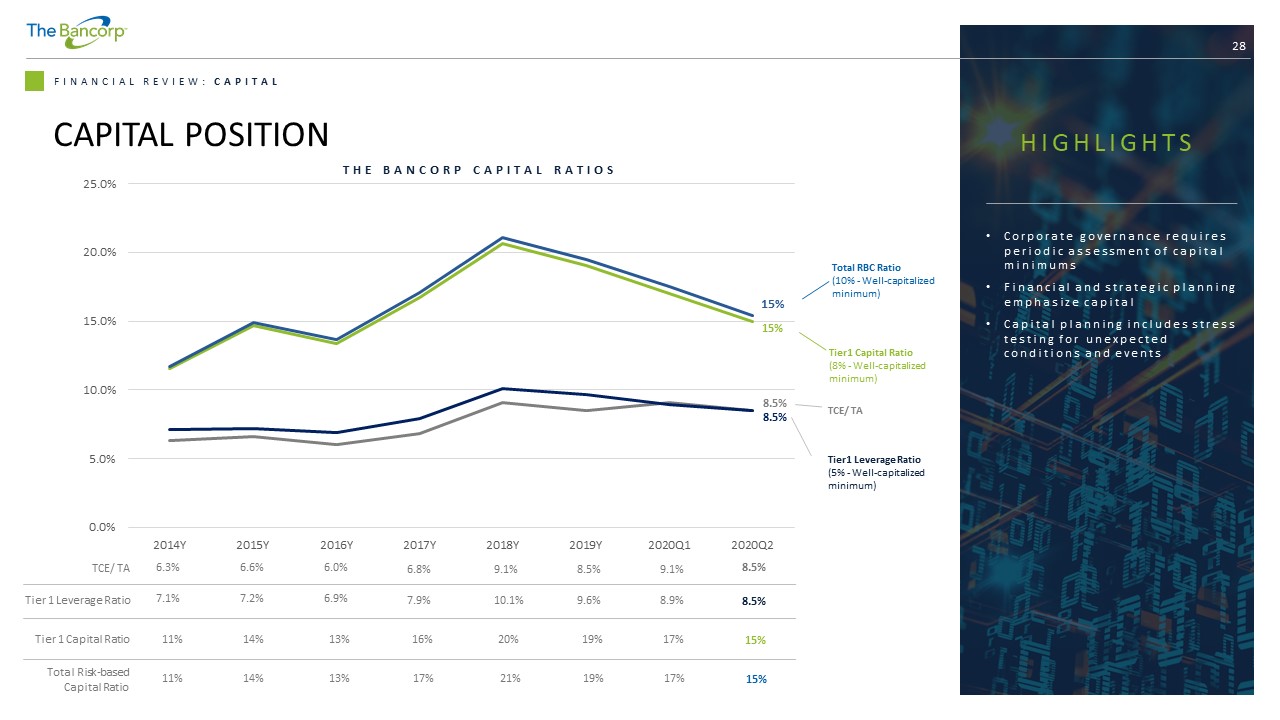
28 FINANCIAL REVIEW: CAPITAL CAPITAL POSITION TCE/ TA Tier 1 Leverage Ratio 7.1% 7.2% 11% 14% 11% 14% 13% 13% 16% 17% 6.9% 7.9% Tier 1 Capital Ratio 19% 19% 9.6% 20% 21% 10.1% Total Risk - based Capital Ratio 17% 17% 8.9% Tier1 Capital Ratio (8% - Well - capitalized minimum) HIGHLIGHTS • Corporate governance requires periodic assessment of capital minimums • Financial and strategic planning emphasize capital • Capital planning includes stress testing for unexpected conditions and events THE BANCORP CAPITAL RATIOS TCE/ TA 6.3% 6.6% 6.0% 6.8% 8.5% 9.1% 9.1% Total RBC Ratio (10% - Well - capitalized minimum) 15% 15% 8.5% 8.5% Tier1 Leverage Ratio (5% - Well - capitalized minimum) 8.5% 8.5% 15% 15% 0.0% 5.0% 10.0% 15.0% 20.0% 25.0% 2014Y 2015Y 2016Y 2017Y 2018Y 2019Y 2020Q1 2020Q2
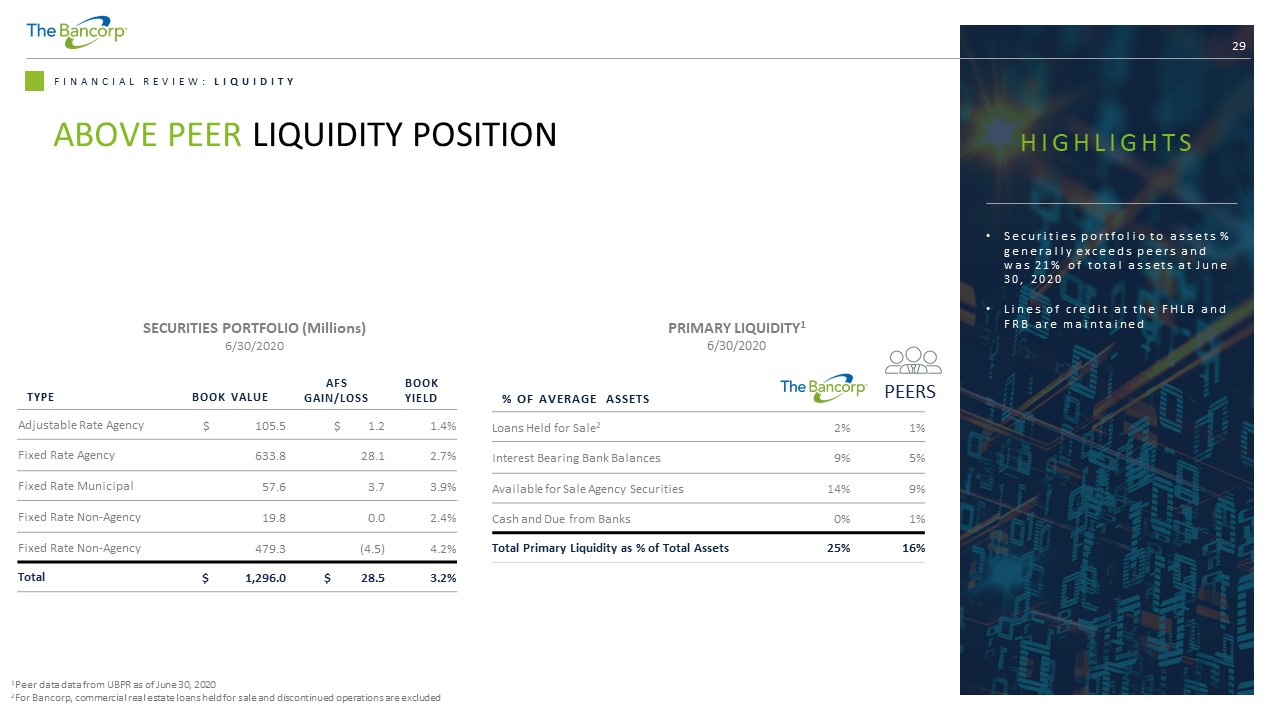
29 FINANCIAL REVIEW: LIQUIDITY ABOVE PEER LIQUIDITY POSITION TYPE BOOK VALUE AFS GAIN/LOSS BOOK YIELD Adjustable Rate Agency $ 105.5 $ 1.2 1.4% Fixed Rate Agency 633.8 28.1 2.7% Fixed Rate Municipal 57.6 3.7 3.9% Fixed Rate Non - Agency 19.8 0.0 2.4% Fixed Rate Non - Agency 479.3 (4.5) 4.2% Total $ 1,296.0 $ 28.5 3.2% SECURITIES PORTFOLIO (Millions) 6/30/2020 HIGHLIGHTS • Securities portfolio to assets % generally exceeds peers and was 21% of total assets at June 30, 2020 % OF AVERAGE ASSETS Loans Held for Sale 2 2% 1% Interest Bearing Bank Balances 9% 5% Available for Sale Agency Securities 14% 9% Cash and Due from Banks 0% 1% Total Primary Liquidity as % of Total Assets 25% 16% PRIMARY LIQUIDITY 1 6/30/2020 PEERS • Lines of credit at the FHLB and FRB are maintained 1 Peer data data from UBPR as of June 30, 2020 2 For Bancorp, commercial real estate loans held for sale and discontinued operations are excluded

APPENDIX 30
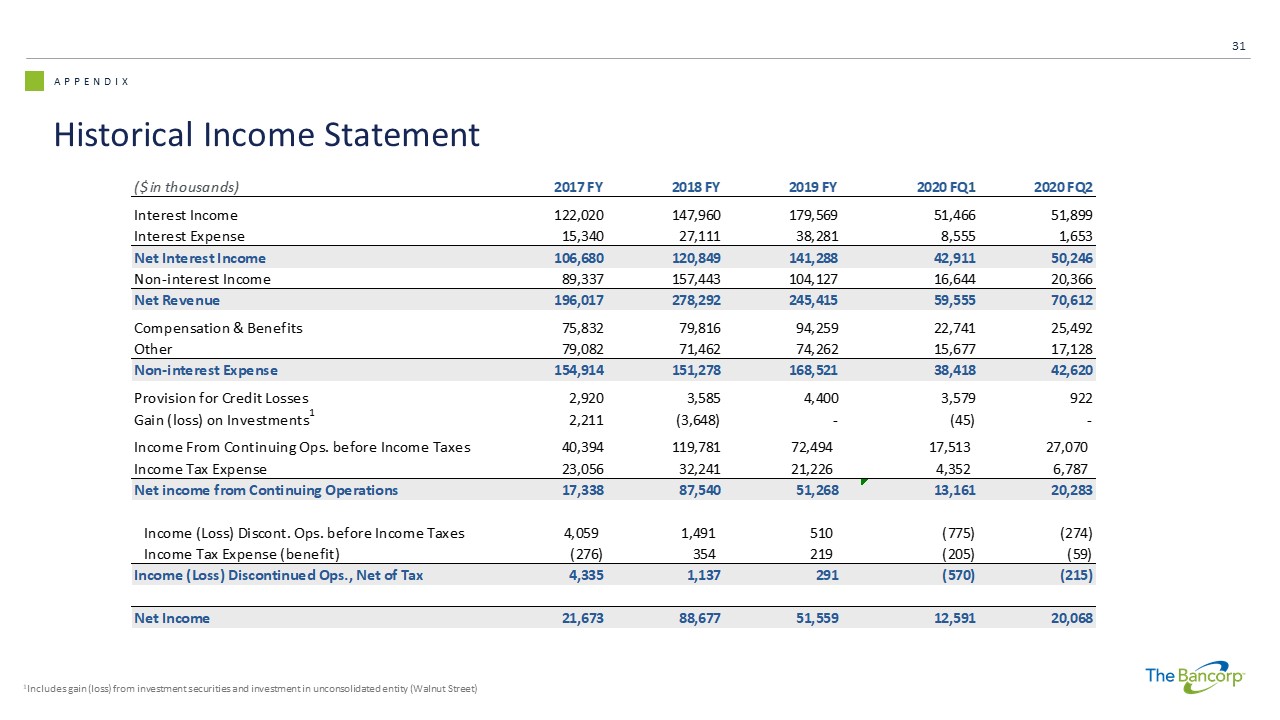
APPENDIX Historical Income Statement 31 1 Includes gain (loss) from investment securities and investment in unconsolidated entity (Walnut Street) ($ in thousands) 2017 FY 2018 FY 2019 FY 2020 FQ1 2020 FQ2 Interest Income 122,020 147,960 179,569 51,466 51,899 Interest Expense 15,340 27,111 38,281 8,555 1,653 Net Interest Income 106,680 120,849 141,288 42,911 50,246 Non-interest Income 89,337 157,443 104,127 16,644 20,366 Net Revenue 196,017 278,292 245,415 59,555 70,612 Compensation & Benefits 75,832 79,816 94,259 22,741 25,492 Other 79,082 71,462 74,262 15,677 17,128 Non-interest Expense 154,914 151,278 168,521 38,418 42,620 Provision for Credit Losses 2,920 3,585 4,400 3,579 922 Gain (loss) on Investments 1 2,211 (3,648) - (45) - Income From Continuing Ops. before Income Taxes 40,394 119,781 72,494 17,513 27,070 Income Tax Expense 23,056 32,241 21,226 4,352 6,787 Net income from Continuing Operations 17,338 87,540 51,268 13,161 20,283 Income (Loss) Discont. Ops. before Income Taxes 4,059 1,491 510 (775) (274) Income Tax Expense (benefit) (276) 354 219 (205) (59) Income (Loss) Discontinued Ops., Net of Tax 4,335 1,137 291 (570) (215) Net Income 21,673 88,677 51,559 12,591 20,068
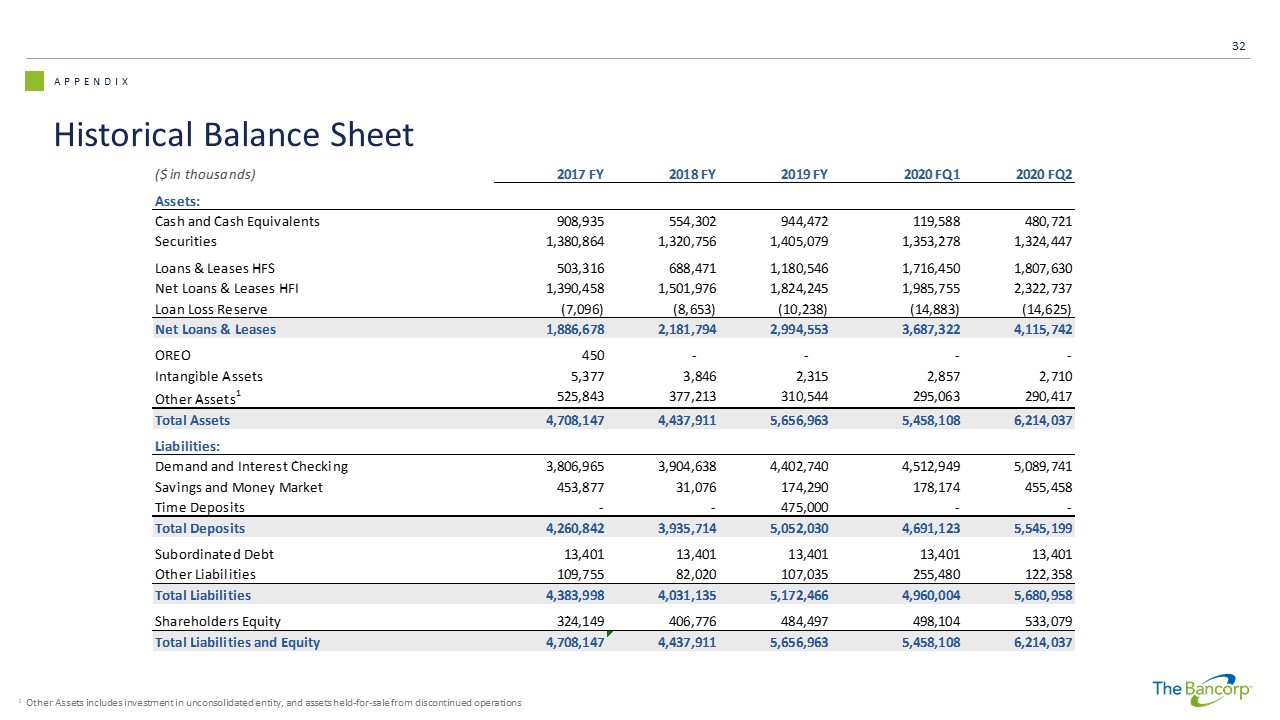
APPENDIX Historical Balance Sheet 32 1 Other Assets includes investment in unconsolidated entity, and assets held - for - sale from discontinued operations ($ in thousands) 2017 FY 2018 FY 2019 FY 2020 FQ1 2020 FQ2 Assets: Cash and Cash Equivalents 908,935 554,302 944,472 119,588 480,721 Securities 1,380,864 1,320,756 1,405,079 1,353,278 1,324,447 Loans & Leases HFS 503,316 688,471 1,180,546 1,716,450 1,807,630 Net Loans & Leases HFI 1,390,458 1,501,976 1,824,245 1,985,755 2,322,737 Loan Loss Reserve (7,096) (8,653) (10,238) (14,883) (14,625) Net Loans & Leases 1,886,678 2,181,794 2,994,553 3,687,322 4,115,742 OREO 450 - - - - Intangible Assets 5,377 3,846 2,315 2,857 2,710 Other Assets 1 525,843 377,213 310,544 295,063 290,417 Total Assets 4,708,147 4,437,911 5,656,963 5,458,108 6,214,037 Liabilities: Demand and Interest Checking 3,806,965 3,904,638 4,402,740 4,512,949 5,089,741 Savings and Money Market 453,877 31,076 174,290 178,174 455,458 Time Deposits - - 475,000 - - Total Deposits 4,260,842 3,935,714 5,052,030 4,691,123 5,545,199 Subordinated Debt 13,401 13,401 13,401 13,401 13,401 Other Liabilities 109,755 82,020 107,035 255,480 122,358 Total Liabilities 4,383,998 4,031,135 5,172,466 4,960,004 5,680,958 Shareholders Equity 324,149 406,776 484,497 498,104 533,079 Total Liabilities and Equity 4,708,147 4,437,911 5,656,963 5,458,108 6,214,037