Exhibit 99.2
THE BANCORP INVESTOR PRESENTATION JANUARY 2025
2 DISCLOSURES Statements in this presentation regarding The Bancorp, Inc.’s (“The Bancorp”) business , that are not historical facts, are “forward - looking statements.” These statements may be identified by the use of forward - looking terminology, including the words “intend,” “may,” “believe,” “will,” “expect,” “look,” “anticipate,” “plan,” “estimate,” “continue,” or similar words. Forward - looking statements include but are not limited to, statements regarding our annual fiscal 2024 results, profitability, and increased volumes, and relate to our current assumptions, projections, and expectations about our business and future events, including current expectations about important economic, political, and technological factors, among other factors, and are subject to risks and uncertainties, which could cause the actual results, events, or achievements to differ materially from those set forth in or implied by the forward - looking statements and related assumptions. Factors that could cause results to differ from those expressed in the forward - looking statements also include, but are not limited to, the risks and uncertainties referenced or described in The Bancorp’s filings with the Securities and Exchange Commission, including the “Risk Factors” and “Management’s Discussion and Analysis of Financial Condition and Results of Operations” sections of the Company’s Annual Report on Form 10 - K for the fiscal year ended December 31, 2023 and other documents that the Company files from time to time with the Securities and Exchange Commission. The Bancorp does not undertake any duty to publicly revise or update forward - looking statements in this presentation to reflect events or circumstances that arise after the date of this presentation, except as may be required under applicable law. This presentation contains information regarding financial results that is calculated and presented on the basis of methodologies other than in accordance with accounting principles generally accepted in the United States (“GAAP”), such as those identified in the Appendix. As a result, such information may not conform to SEC Regulations, including Regulation S - X, and may be adjusted and presented differently in filings with the SEC. Any non - GAAP financial measures used in this presentation are in addition to, and should not be considered superior to, or a substitute for, financial statements prepared in accordance with GAAP. Non - GAAP financial measures are subject to significant inherent limitations. The non - GAAP measures presented herein may not be comparable to similar non - GAAP measures presented by other companies. This presentation includes market, industry and economic data which was obtained from various publicly available sources and other sources believed by the Company to be true. Although the Company believes it to be reliable, the Company has not independently verified any of the data from third party sources referred to in this presentation or analyzed or verified the underlying reports relied upon or referred to by such sources, or ascertained the underlying economic and other assumptions relied upon by such sources. The Company believes that its market, industry, and economic data is accurate and that its estimates and assumptions are reasonable, but there can be no assurance as to the accuracy or completeness thereof. Past performance is not indicative nor a guarantee of future results. Copies of the documents filed by The Bancorp with the SEC are available free of charge from the website of the SEC at www.sec.gov as well as on The Bancorp’s website at www.thebancorp.com . FORWARD LOOKING STATEMENTS & OTHER DISCLOSURES
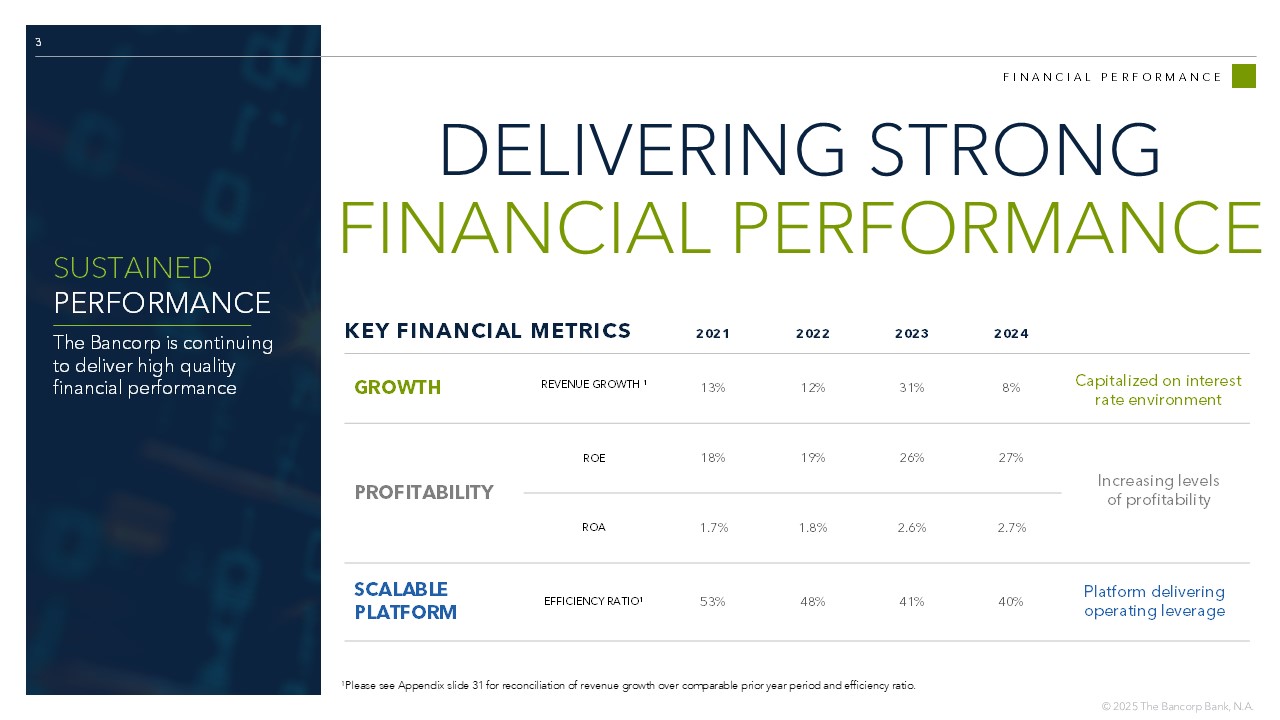
3 FINANCIAL PERFORMANCE DELIVERING STRONG FINANCIAL PERFORMANCE 2024 2023 2022 2021 8% 31% 12% 13% REVENUE GROWTH 1 GROWTH 27% 26% 19% 18% ROE PROFITABILITY 2.7% 2.6% 1.8% 1.7% ROA 40% 41% 48% 53% EFFICIENCY RATIO 1 SCALABLE PLATFORM KEY FINANCIAL METRICS 1 Please see Appendix slide 31 for reconciliation of revenue growth over comparable prior year period and efficiency ratio. Increasing levels of profitability Platform delivering operating leverage Capitalized on interest rate environment SUSTAINED PERFORMANCE The Bancorp is continuing to deliver high quality financial performance
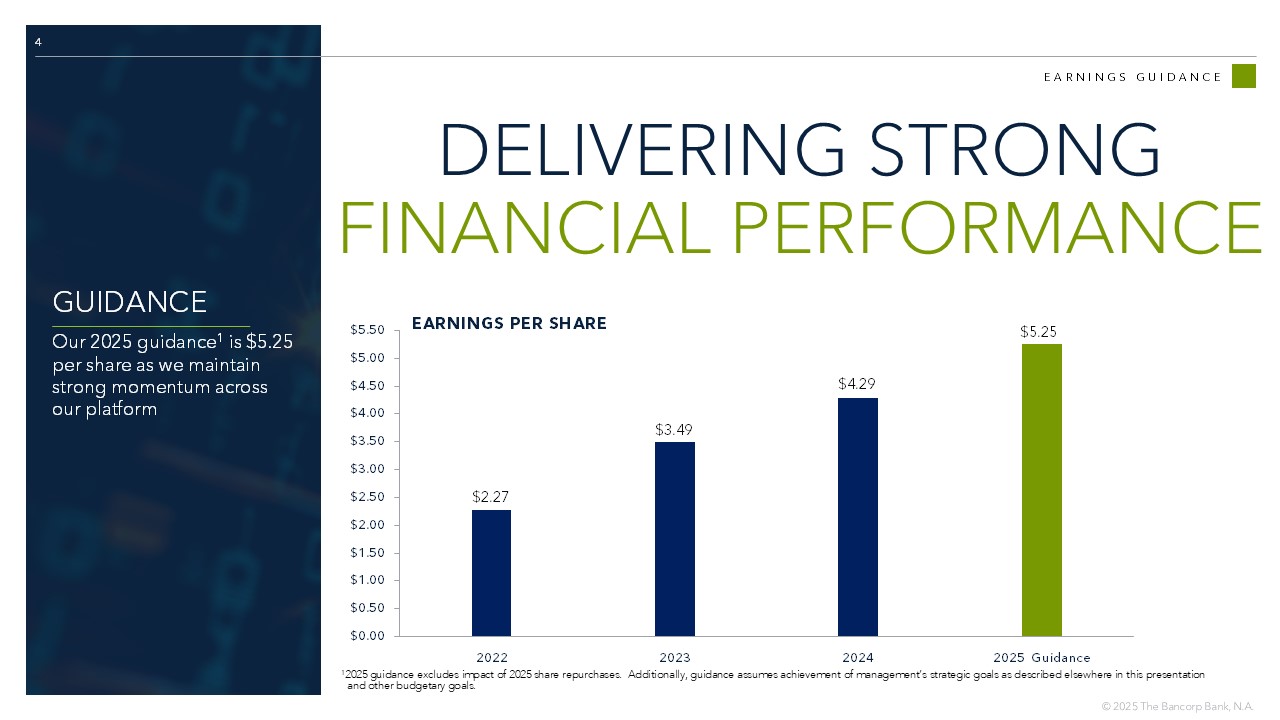
4 EARNINGS GUIDANCE DELIVERING STRONG FINANCIAL PERFORMANCE GUIDANCE Our 2025 guidance 1 is $5.25 per share as we maintain strong momentum across our platform 1 2025 guidance excludes impact of 2025 share repurchases. Additionally, guidance assumes achievement of management’s strategic goals as described elsewhere in this presentation and other budgetary goals. $0.00 $0.50 $1.00 $1.50 $2.00 $2.50 $3.00 $3.50 $4.00 $4.50 $5.00 $5.50 2022 2023 2024 2025 Guidance EARNINGS PER SHARE $5.25 $2.27 $3.49 $4.29
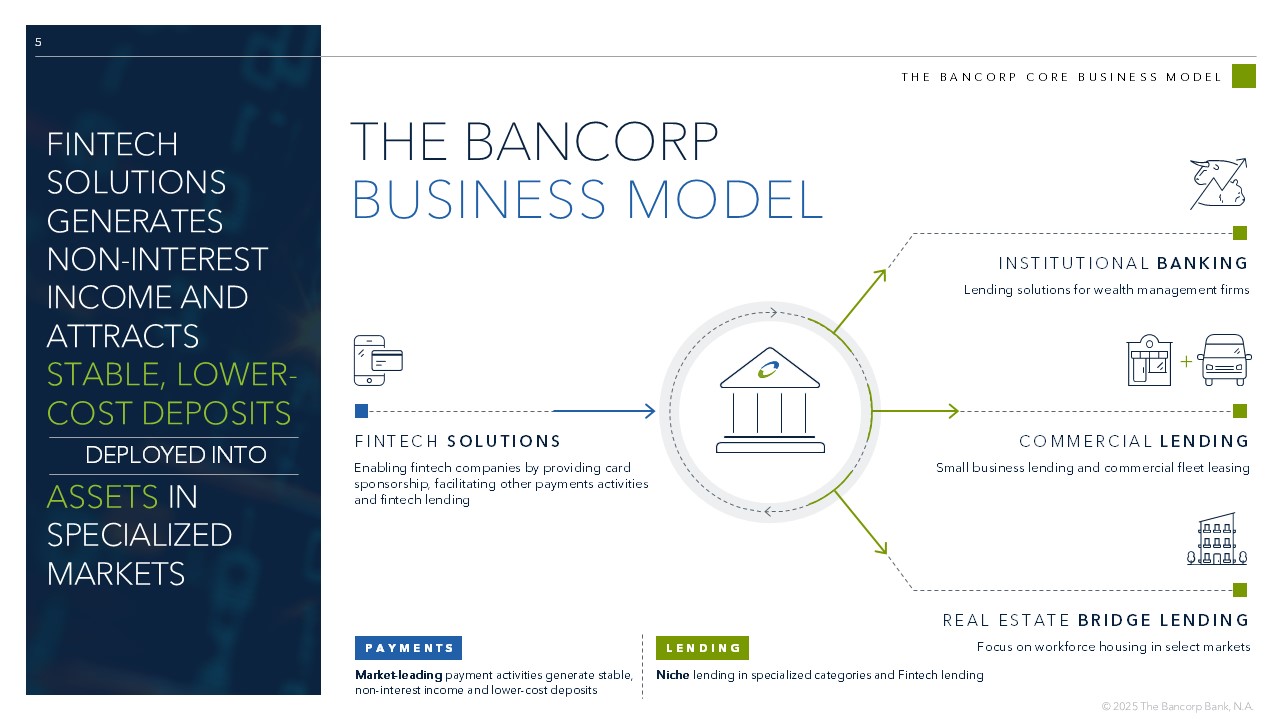
5 THE BANCORP CORE BUSINESS MODEL FINTECH SOLUTIONS GENERATES NON - INTEREST INCOME AND ATTRACTS STABLE, LOWER - COST DEPOSITS DEPLOYED INTO ASSETS IN SPECIALIZED MARKETS THE BANCORP BUSINESS MODEL FINTECH SOLUTIONS Enabling fintech companies by providing card sponsorship, facilitating other payments activities and fintech lending COMMERCIAL LENDING Small business lending and commercial fleet leasing + INSTITUTIONAL BANKING Lending solutions for wealth management firms REAL ESTATE BRIDGE LENDING Focus on workforce housing in select markets PAYMENTS Market - leading payment activities generate stable, non - interest income and lower - cost deposits LENDING Niche lending in specialized categories and Fintech lending
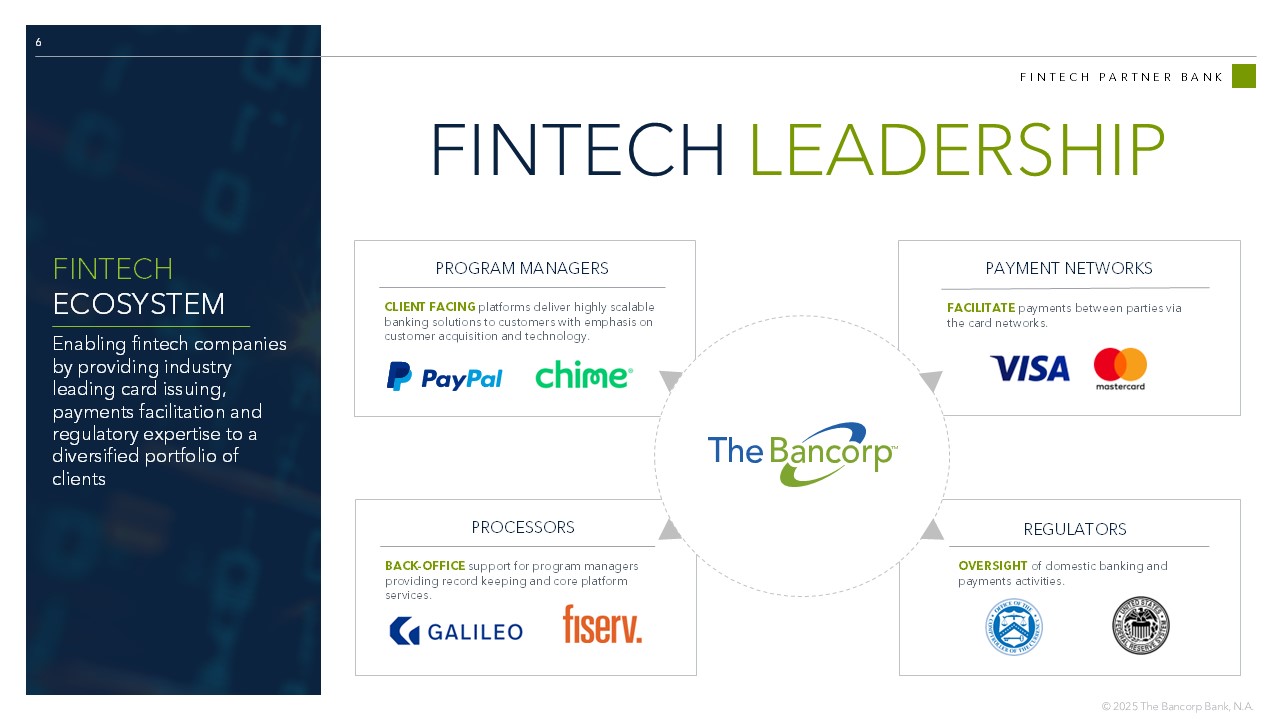
6 FINTECH PARTNER BANK FINTECH LEADERSHIP PAYMENT NETWORKS FACILITATE payments between parties via the card networks. PROGRAM MANAGERS CLIENT FACING platforms deliver highly scalable banking solutions to customers with emphasis on customer acquisition and technology. REGULATORS OVERSIGHT of domestic banking and payments activities. PROCESSORS BACK - OFFICE support for program managers providing record keeping and core platform services. FINTECH ECOSYSTEM Enabling fintech companies by providing industry leading card issuing, payments facilitation and regulatory expertise to a diversified portfolio of clients
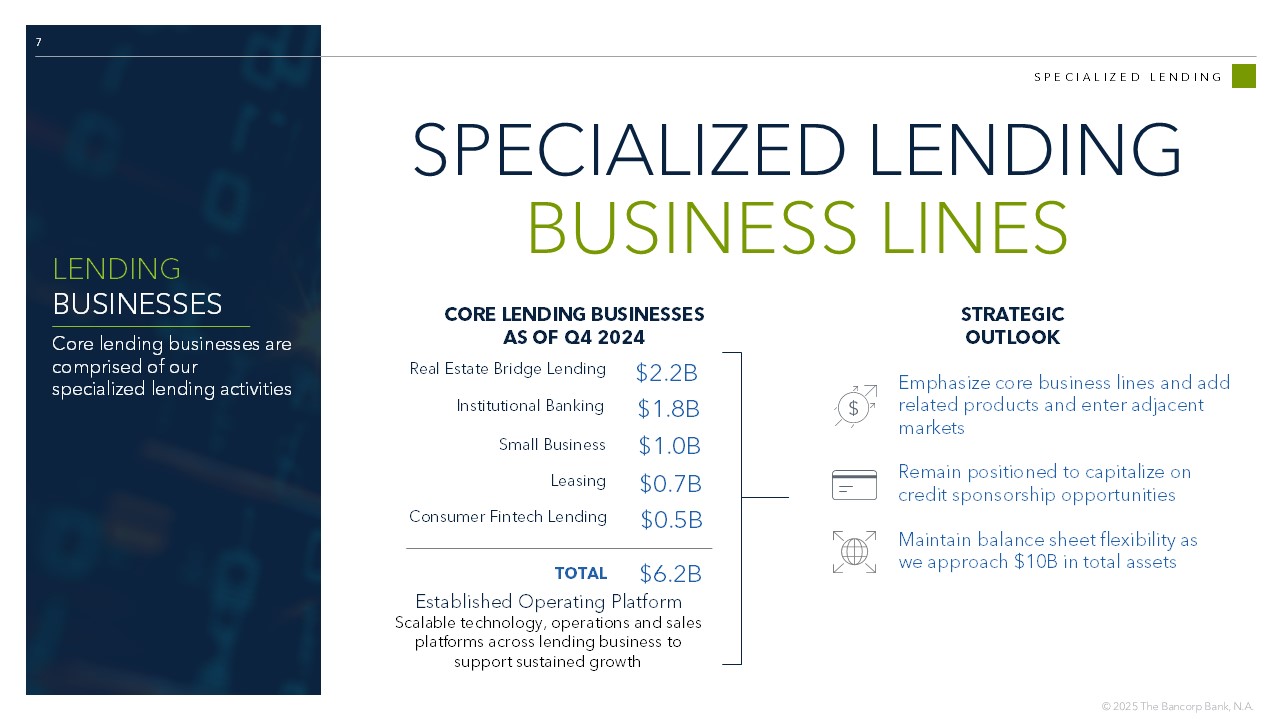
7 SPECIALIZED LENDING SPECIALIZED LENDING BUSINESS LINES LENDING BUSINESSES Core lending businesses are comprised of our specialized lending activities Institutional Banking $1.8B Emphasize core business lines and add related products and enter adjacent markets Remain positioned to capitalize on credit sponsorship opportunities Maintain balance sheet flexibility as we approach $10B in total assets Real Estate Bridge Lending $2.2B Small Business $1.0B Leasing $ 0.7B CORE LENDING BUSINESSES AS OF Q4 2024 TOTAL $ 6.2 B Established Operating Platform Scalable technology, operations and sales platforms across lending business to support sustained growth STRATEGIC OUTLOOK Consumer Fintech Lending $ 0.5B
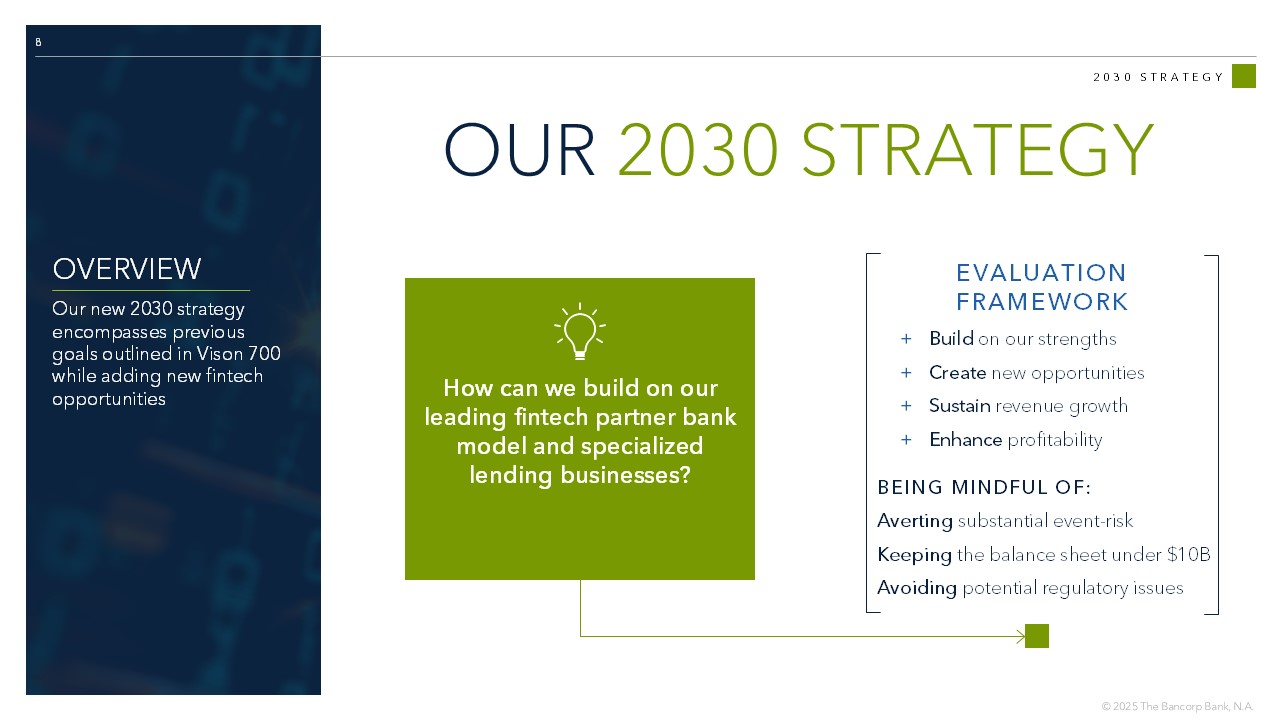
8 2030 STRATEGY OUR 2030 STRATEGY OVERVIEW Our new 2030 strategy encompasses previous goals outlined in Vison 700 while adding new fintech opportunities Build on our strengths Create new opportunities Sustain revenue growth Enhance profitability Averting substantial event - risk Keeping the balance sheet under $10B Avoiding potential regulatory issues + + + + EVALUATION FRAMEWORK BEING MINDFUL OF: How can we build on our leading fintech partner bank model and specialized lending businesses?
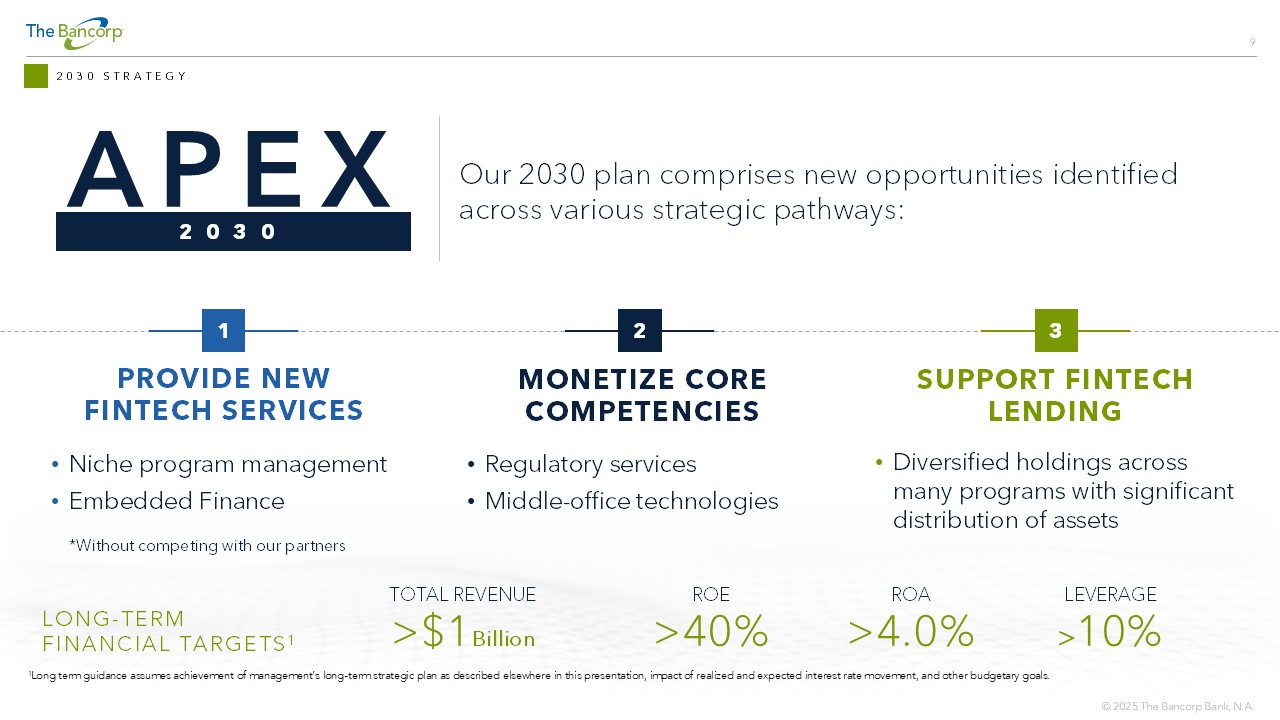
2030 STRATEGY *Without competing with our partners 1 PROVIDE NEW FINTECH SERVICES 3 SUPPORT FINTECH LENDING 2 MONETIZE CORE COMPETENCIES Our 2030 plan comprises new opportunities identified across various strategic pathways: 1 Long term guidance assumes achievement of management’s long - term strategic plan as described elsewhere in this presentation, imp act of realized and expected interest rate movement, and other budgetary goals. TOTAL REVENUE >$1 Billion ROE >40% ROA >4.0% LEVERAGE > 10% LONG - TERM FINANCIAL TARGETS 1 • Niche program management • Embedded Finance • Regulatory services • Middle - office technologies • Diversified holdings across many programs with significant distribution of assets APEX 2030
FINTECH SOLUTIONS: DEPOSIT & FEE GENERATION
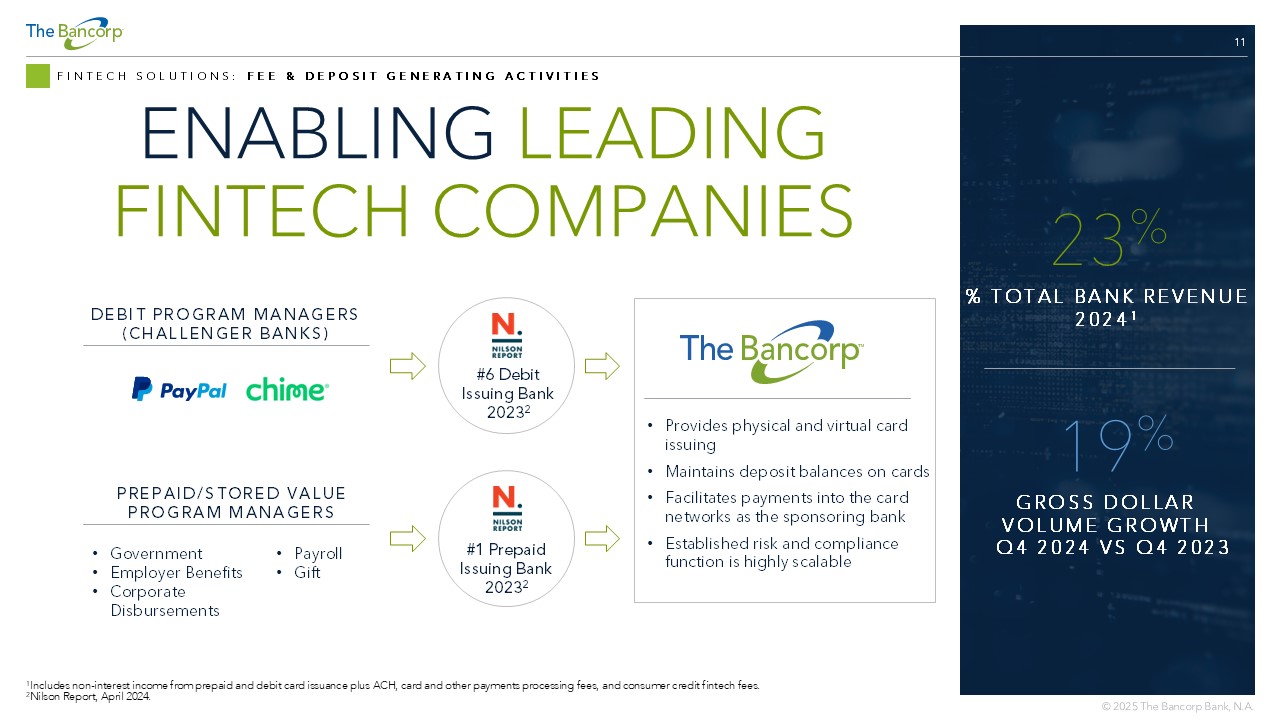
11 FINTECH SOLUTIONS: FEE & DEPOSIT GENERATING ACTIVITIES ENABLING LEADING FINTECH COMPANIES DEBIT PROGRAM MANAGERS (CHALLENGER BANKS) PREPAID/STORED VALUE PROGRAM MANAGERS • Provides physical and virtual card issuing • Maintains deposit balances on cards • Facilitates payments into the card networks as the sponsoring bank • Established risk and compliance function is highly scalable #6 Debit Issuing Bank 2023 2 #1 Prepaid Issuing Bank 2023 2 • Government • Employer Benefits • Corporate Disbursements • Payroll • Gift 1 Includes non - interest income from prepaid and debit card issuance plus ACH, card and other payments processing fees, and consume r credit fintech fees. 2 Nilson Report, April 2024. % TOTAL BANK REVENUE 2024 1 23 % GROSS DOLLAR VOLUME GROWTH Q4 2024 VS Q4 2023 19 %
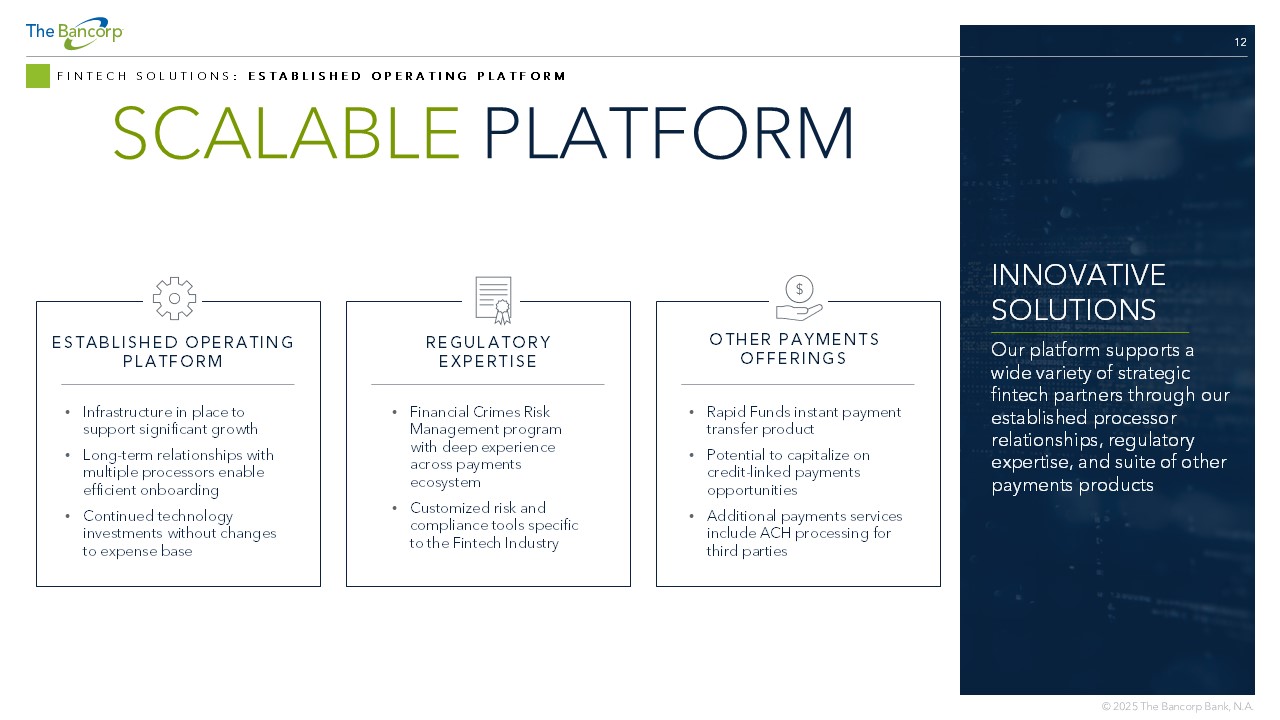
12 FINTECH SOLUTIONS : ESTABLISHED OPERATING PLATFORM SCALABLE PLATFORM ESTABLISHED OPERATING PLATFORM • Infrastructure in place to support significant growth • Long - term relationships with multiple processors enable efficient onboarding • Continued technology investments without changes to expense base REGULATORY EXPERTISE • Financial Crimes Risk Management program with deep experience across payments ecosystem • Customized risk and compliance tools specific to the Fintech Industry OTHER PAYMENTS OFFERINGS • Rapid Funds instant payment transfer product • Potential to capitalize on credit - linked payments opportunities • Additional payments services include ACH processing for third parties INNOVATIVE SOLUTIONS Our platform supports a wide variety of strategic fintech partners through our established processor relationships, regulatory expertise, and suite of other payments products
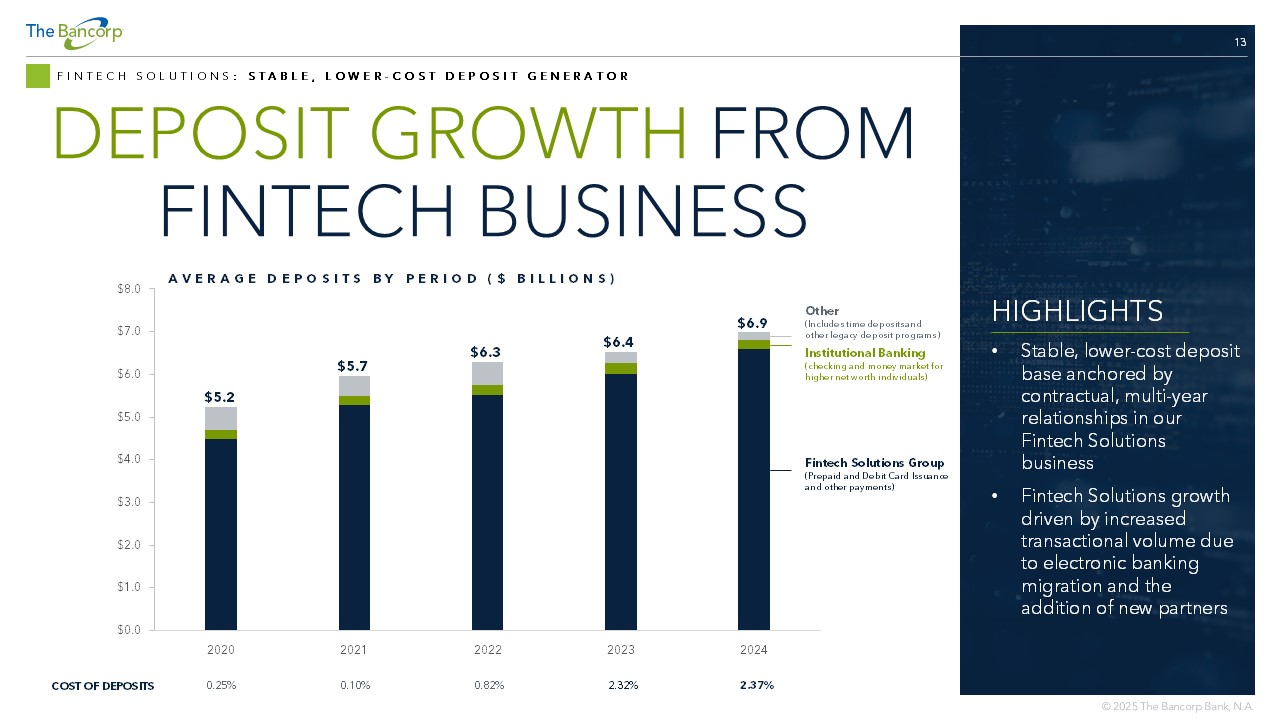
13 FINTECH SOLUTIONS : STABLE, LOWER - COST DEPOSIT GENERATOR DEPOSIT GROWTH FROM FINTECH BUSINESS HIGHLIGHTS • Stable, lower - cost deposit base anchored by contractual, multi - year relationships in our Fintech Solutions business • Fintech Solutions growth driven by increased transactional volume due to electronic banking migration and the addition of new partners $0.0 $1.0 $2.0 $3.0 $4.0 $5.0 $6.0 $7.0 $8.0 2020 2021 2022 2023 2024 AVERAGE DEPOSITS BY PERIOD ($ BILLIONS) Fintech Solutions Group (Prepaid and Debit Card Issuance and other payments) Institutional Banking (checking and money market for higher net worth individuals) Other (Includes time deposits and other legacy deposit programs) 2.37% 2.32% 0.82% 0.10% 0.25% COST OF DEPOSITS $5.2 $5.7 $6.3 $6.4 $6.9
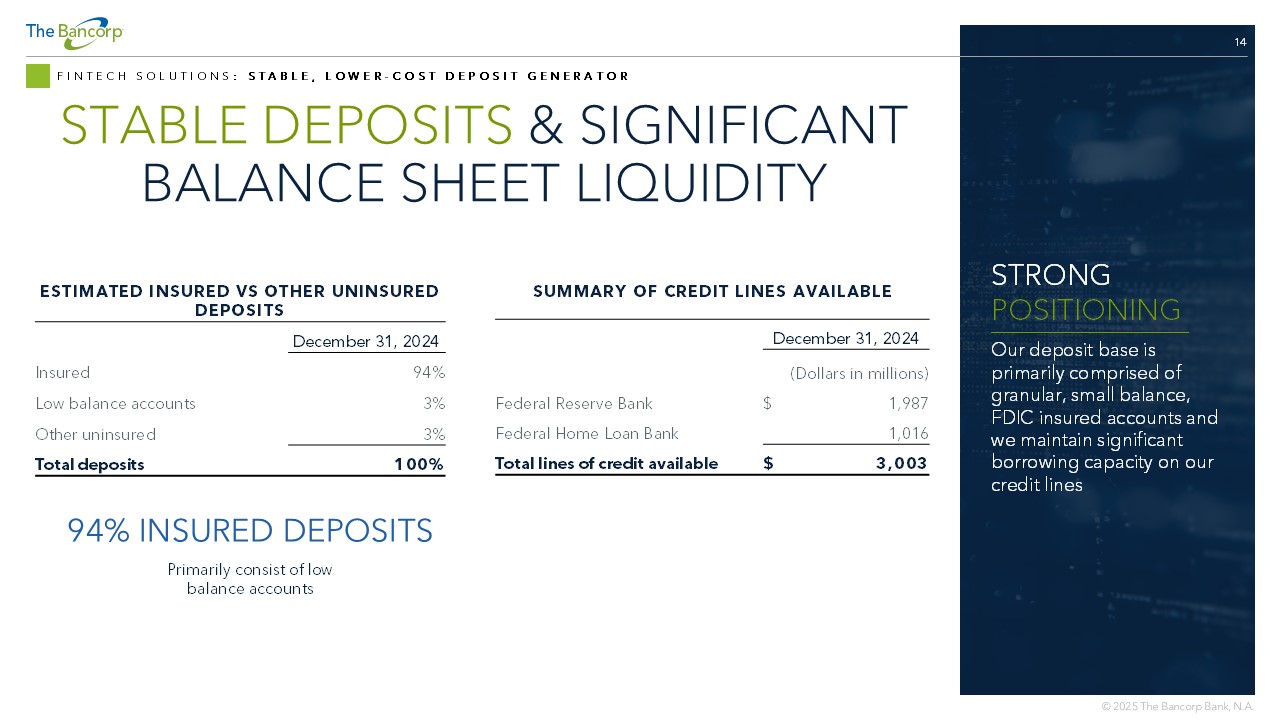
14 FINTECH SOLUTIONS : STABLE, LOWER - COST DEPOSIT GENERATOR STABLE DEPOSITS & SIGNIFICANT BALANCE SHEET LIQUIDITY STRONG POSITIONING Our deposit base is primarily comprised of granular, small balance, FDIC insured accounts and we maintain significant borrowing capacity on our credit lines ESTIMATED INSURED VS OTHER UNINSURED DEPOSITS December 31, 2024 94% Insured 3% Low balance accounts 3% Other uninsured 100% Total deposits SUMMARY OF CREDIT LINES AVAILABLE December 31, 2024 (Dollars in millions) 1,987 $ Federal Reserve Bank 1,016 Federal Home Loan Bank 3,003 $ Total lines of credit available 94% INSURED DEPOSITS Primarily consist of low balance accounts
LOANS, LEASES & SUPPORTING COLLATERAL
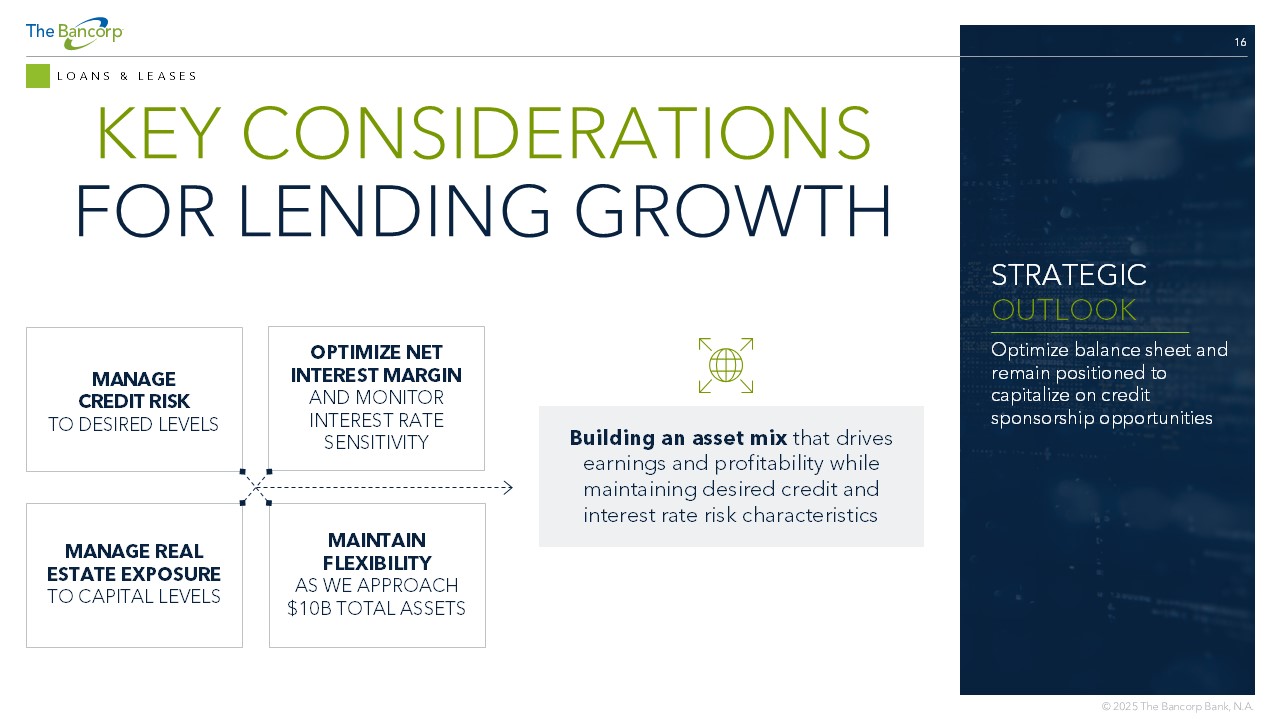
16 LOANS & LEASES STRATEGIC OUTLOOK Optimize balance sheet and r emain positioned to capitalize on credit sponsorship opportunities KEY CONSIDERATIONS FOR LENDING GROWTH MANAGE CREDIT RISK TO DESIRED LEVELS OPTIMIZE NET INTEREST MARGIN AND MONITOR INTEREST RATE SENSITIVITY MANAGE REAL ESTATE EXPOSURE TO CAPITAL LEVELS MAINTAIN FLEXIBILITY AS WE APPROACH $10B TOTAL ASSETS Building an asset mix that drives earnings and profitability while maintaining desired credit and interest rate risk characteristics
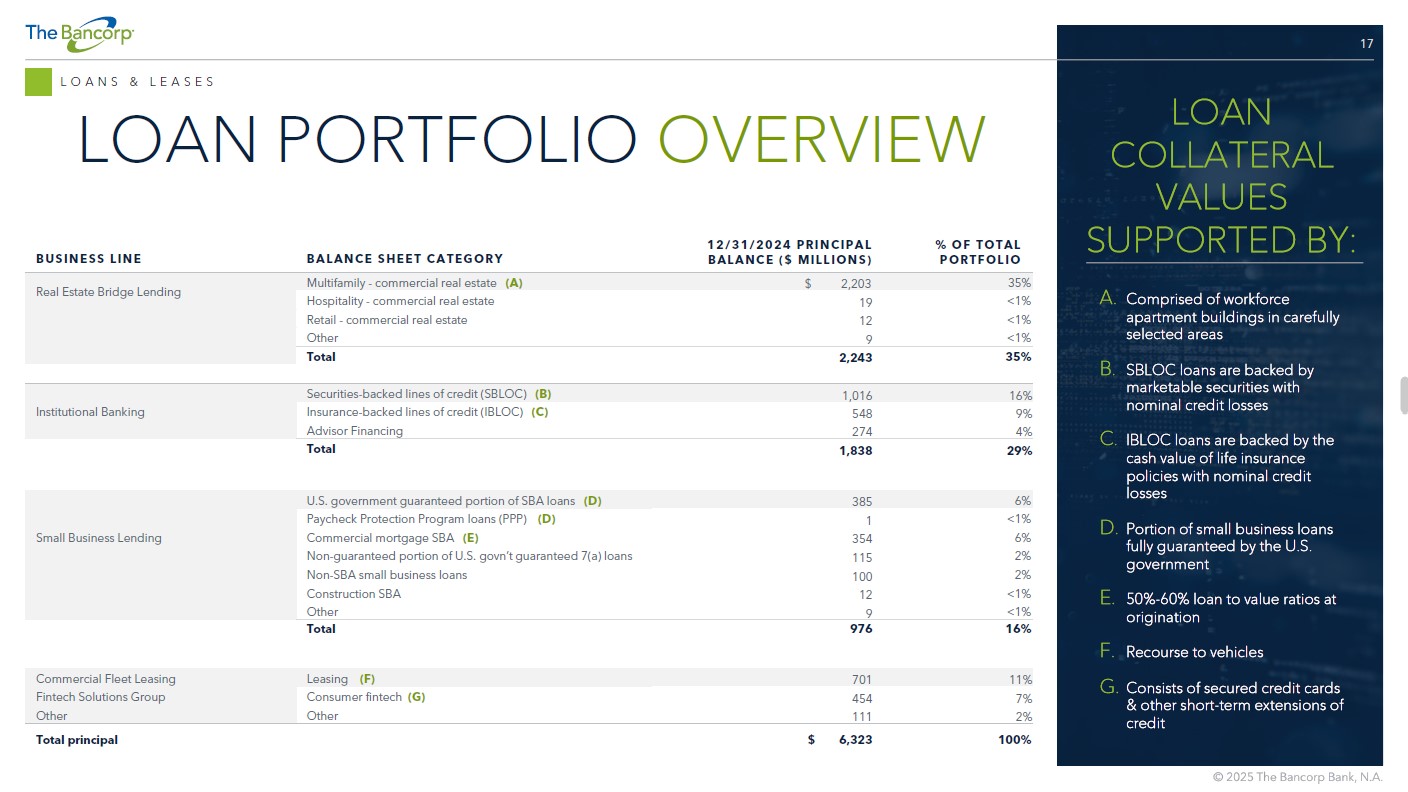
17 LOANS & LEASES LOAN PORTFOLIO OVERVIEW % OF TOTAL PORTFOLIO 12/31/2024 PRINCIPAL BALANCE ($ MILLIONS) BALANCE SHEET CATEGORY BUSINESS LINE 35% $ 2,203 Multifamily - commercial real estate (A) Real Estate Bridge Lending <1% 19 Hospitality - commercial real estate <1% 12 Retail - commercial real estate <1% 9 Other 35% 2,243 Total 16% 1,016 Securities - backed lines of credit (SBLOC) ( B) Institutional Banking 9% 548 Insurance - backed lines of credit (IBLOC) (C) 4% 274 Advisor Financing 29% 1,838 Total 6% 385 U.S. government guaranteed portion of SBA loans ( D) Small Business Lending <1% 1 Pay check Protection Program loans (PPP) ( D) 6% 354 Commercial mortgage SBA ( E) 2% 115 Non - guaranteed portion of U.S. govn’t guaranteed 7(a) loans 2% 100 Non - SBA small business loans <1% 12 Construction SBA <1% 9 Other 16% 976 Total 11% 701 Leasing ( F) Commercial Fleet Leasing 7% 454 Consumer fintech ( G) Fintech Solutions Group 2% 111 Other Other 100% $ 6,323 Total principal LOAN COLLATERAL VALUES SUPPORTED BY: A. Comprised of workforce apartment buildings in carefully selected areas B. SBLOC loans are backed by marketable securities with nominal credit losses C. IBLOC loans are backed by the cash value of life insurance policies with nominal credit losses D. Portion of small business loans fully guaranteed by the U.S. government E. 50% - 60% loan to value ratios at origination F. Recourse to vehicles G. Consists of secured credit cards & other short - term extensions of credit
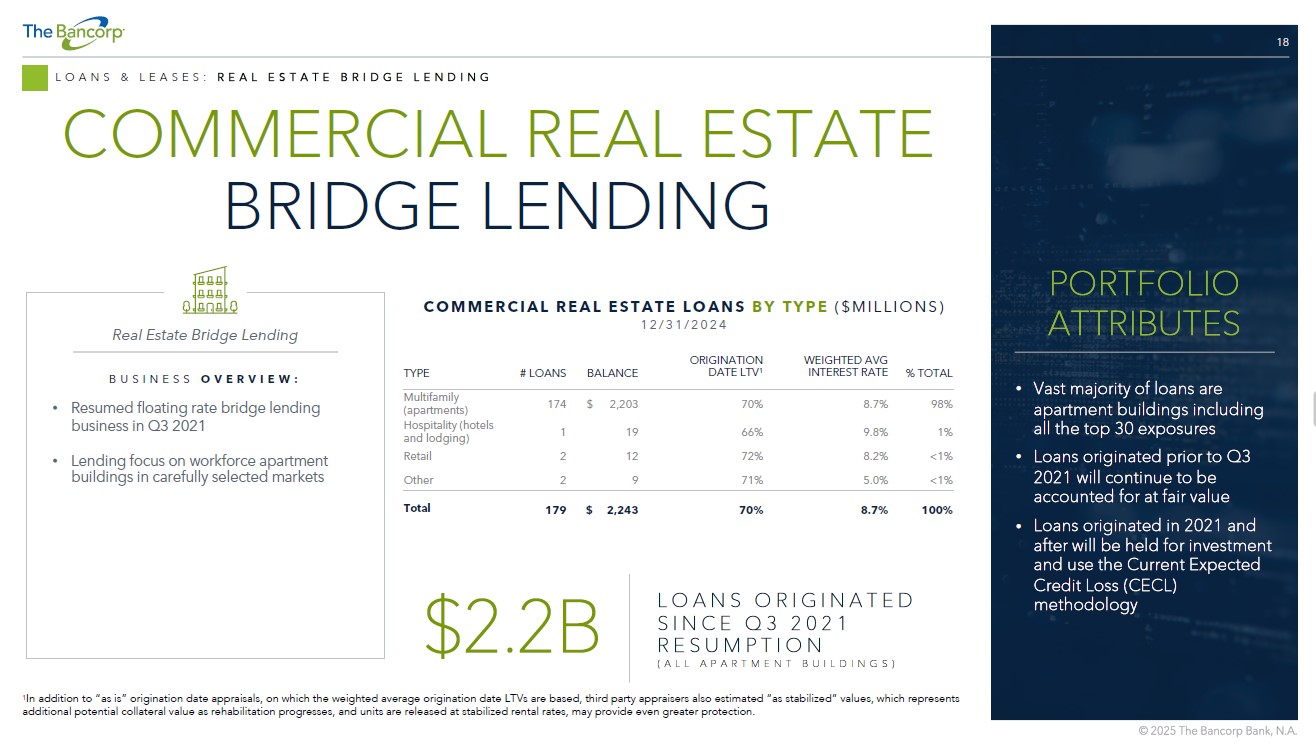
18 LOANS & LEASES: REAL ESTATE BRIDGE LENDING COMMERCIAL REAL ESTATE BRIDGE LENDING % TOTAL WEIGHTED AVG INTEREST RATE ORIGINATION DATE LTV 1 BALANCE # LOANS TYPE 98% 8.7% 70% $ 2,203 174 Multifamily (apartments) 1% 9.8% 66% 19 1 Hospitality (hotels and lodging) <1% 8.2% 72% 12 2 Retail <1% 5.0% 71% 9 2 Other 100% 8.7% 70% $ 2,243 179 Total COMMERCIAL REAL ESTATE LOANS BY TYPE ($MILLIONS) 12/31/2024 $2.2B PORTFOLIO LOANS ORIGINATED SINCE Q3 2021 RESUMPTION (ALL APARTMENT BUILDINGS) BUSINESS OVERVIEW: • Resumed floating rate bridge lending business in Q3 2021 • Lending focus on workforce apartment buildings in carefully selected markets Real Estate Bridge Lending • Vast majority of loans are apartment buildings including all the top 30 exposures • Loans originated prior to Q3 2021 will continue to be accounted for at fair value • Loans originated in 2021 and after will be held for investment and use the Current Expected Credit Loss (CECL) methodology PORTFOLIO ATTRIBUTES 1 In addition to “as is” origination date appraisals, on which the weighted average origination date LTVs are based, third part y a ppraisers also estimated “as stabilized” values, which represents additional potential collateral value as rehabilitation progresses, and units are released at stabilized rental rates, may pr ovi de even greater protection.
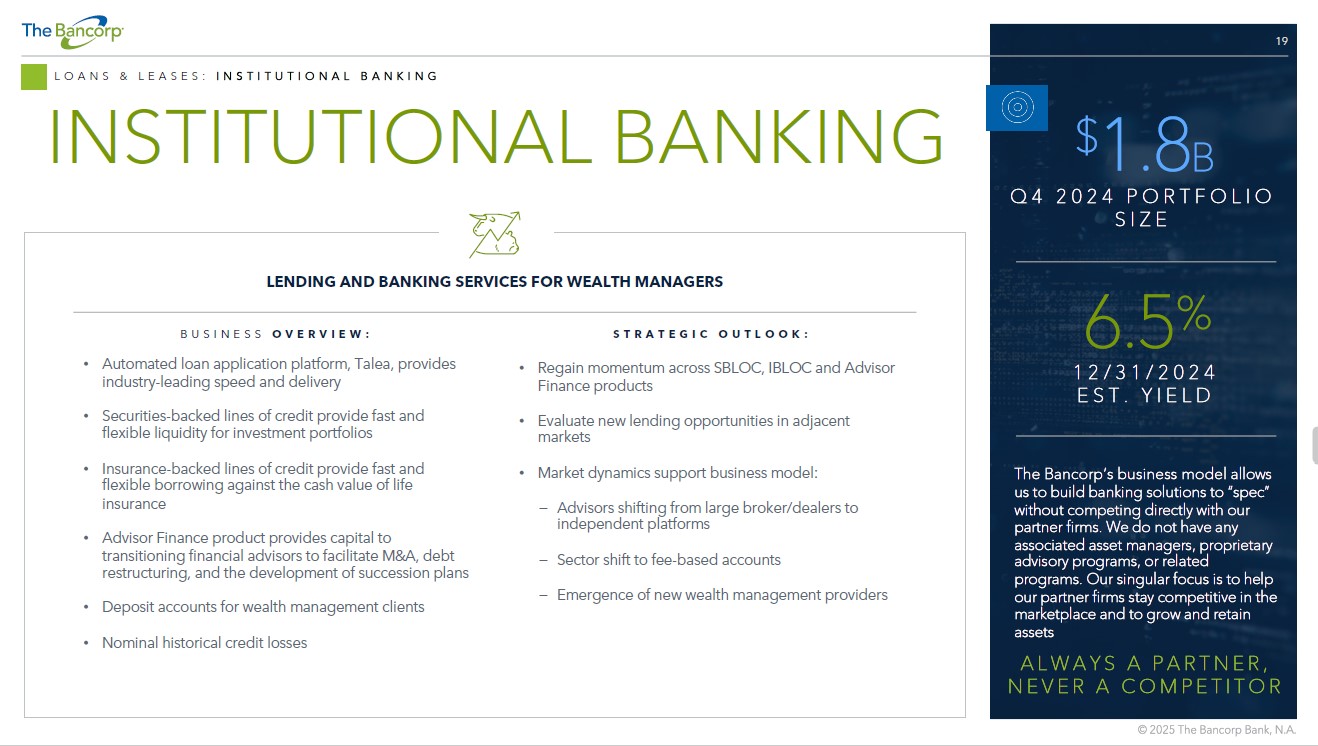
19 LOANS & LEASES: INSTITUTIONAL BANKING INSTITUTIONAL BANKING BUSINESS OVERVIEW: • Automated loan application platform, Talea, provides industry - leading speed and delivery • Securities - backed lines of credit provide fast and flexible liquidity for investment portfolios • Insurance - backed lines of credit provide fast and flexible borrowing against the cash value of life insurance • Advisor Finance product provides capital to transitioning financial advisors to facilitate M&A, debt restructuring, and the development of succession plans • Deposit accounts for wealth management clients • Nominal historical credit losses STRATEGIC OUTLOOK: • Regain momentum across SBLOC, IBLOC and Advisor Finance products • Evaluate new lending opportunities in adjacent markets • Market dynamics support business model: − Advisors shifting from large broker/dealers to independent platforms − Sector shift to fee - based accounts − Emergence of new wealth management providers LENDING AND BANKING SERVICES FOR WEALTH MANAGERS The Bancorp’s business model allows us to build banking solutions to “spec” without competing directly with our partner firms. We do not have any associated asset managers, proprietary advisory programs, or related programs. Our singular focus is to help our partner firms stay competitive in the marketplace and to grow and retain assets ALWAYS A PARTNER, NEVER A COMPETITOR $ 1.8 B Q4 2024 PORTFOLIO SIZE 6.5 % 12/31/2024 EST. YIELD
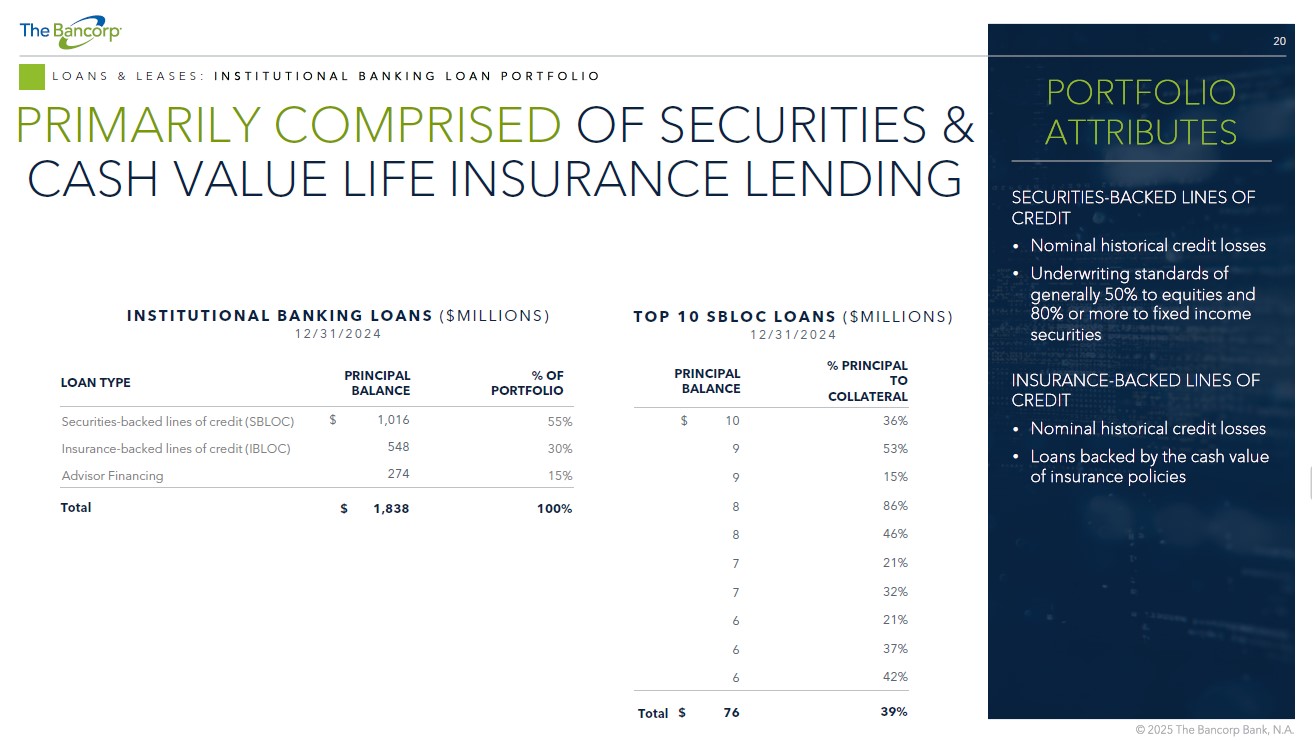
20 LOANS & LEASES: INSTITUTIONAL BANKING LOAN PORTFOLIO PRIMARILY COMPRISED OF SECURITIES & CASH VALUE LIFE INSURANCE LENDING % OF PORTFOLIO PRINCIPAL BALANCE LOAN TYPE 55% $ 1,016 Securities - backed lines of credit (SBLOC) 30% 548 Insurance - backed lines of credit (IBLOC) 15% 274 Advisor Financing 100% $ 1,838 Total INSTITUTIONAL BANKING LOANS ($MILLIONS) 12/31/2024 % PRINCIPAL TO COLLATERAL PRINCIPAL BALANCE 36% $ 10 53% 9 15% 9 86% 8 46% 8 21% 7 32% 7 21% 6 37% 6 42% 6 39% $ 76 Total TOP 10 SBLOC LOANS ($MILLIONS) 12/31/2024 SECURITIES - BACKED LINES OF CREDIT • Nominal historical credit losses • Underwriting standards of generally 50% to equities and 80% or more to fixed income securities INSURANCE - BACKED LINES OF CREDIT • Nominal historical credit losses • Loans backed by the cash value of insurance policies PORTFOLIO ATTRIBUTES
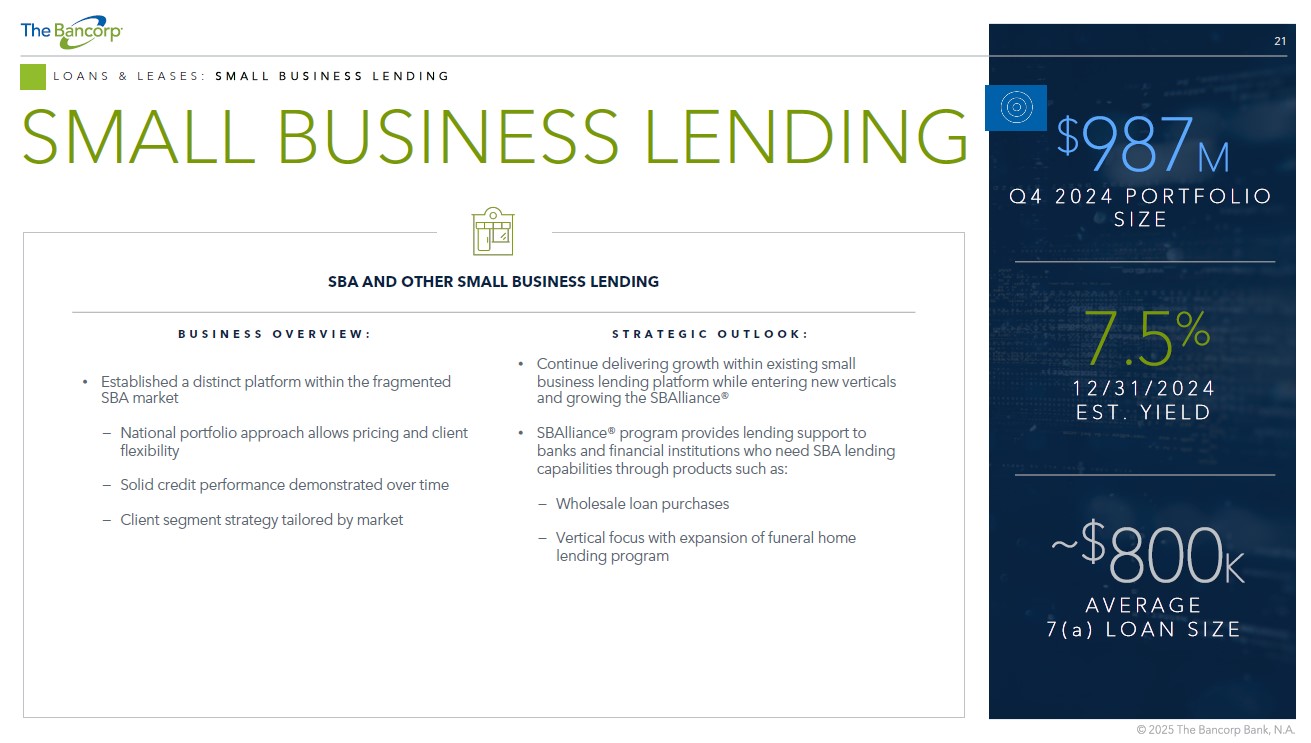
21 LOANS & LEASES: SMALL BUSINESS LENDING SMALL BUSINESS LENDING $ 987 M Q4 2024 PORTFOLIO SIZE 7.5 % 12/31/2024 EST. YIELD BUSINESS OVERVIEW: • Established a distinct platform within the fragmented SBA market − National portfolio approach allows pricing and client flexibility − Solid credit performance demonstrated over time − Client segment strategy tailored by market STRATEGIC OUTLOOK: • Continue delivering growth within existing small business lending platform while entering new verticals and growing the SBAlliance ® • SBAlliance ® program provides lending support to banks and financial institutions who need SBA lending capabilities through products such as: − Wholesale loan purchases − Vertical focus with expansion of funeral home lending program SBA AND OTHER SMALL BUSINESS LENDING ~$ 800 K AVERAGE 7(a) LOAN SIZE
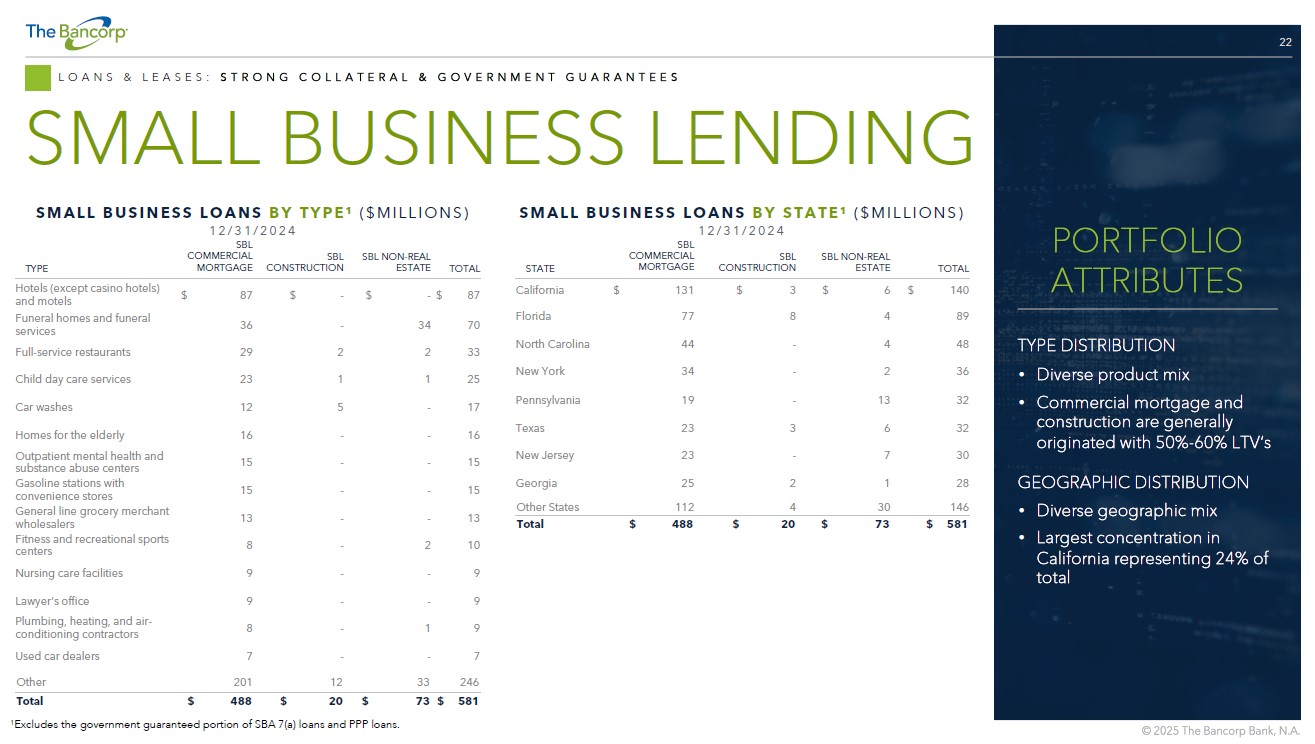
22 LOANS & LEASES: STRONG COLLATERAL & GOVERNMENT GUARANTEES SMALL BUSINESS LENDING SMALL BUSINESS LOANS BY TYPE 1 ($MILLIONS) 12/31/2024 SMALL BUSINESS LOANS BY STATE 1 ($MILLIONS) 12/31/2024 TOTAL SBL NON - REAL ESTATE SBL CONSTRUCTION SBL COMMERCIAL MORTGAGE STATE $ 140 $ 6 $ 3 $ 131 California 89 4 8 77 Florida 48 4 - 44 North Carolina 36 2 - 34 New York 32 13 - 19 Pennsylvania 32 6 3 23 Texas 30 7 - 23 New Jersey 28 1 2 25 Georgia 146 30 4 112 Other States $ 581 $ 73 $ 20 $ 488 Total TOTAL SBL NON - REAL ESTATE SBL CONSTRUCTION SBL COMMERCIAL MORTGAGE TYPE $ 87 $ - $ - $ 87 Hotels (except casino hotels) and motels 70 34 - 36 Funeral homes and funeral services 33 2 2 29 Full - service restaurants 25 1 1 23 Child day care services 17 - 5 12 Car washes 16 - - 16 Homes for the elderly 15 - - 15 Outpatient mental health and substance abuse centers 15 - - 15 Gasoline stations with convenience stores 13 - - 13 General line grocery merchant wholesalers 10 2 - 8 Fitness and recreational sports centers 9 - - 9 Nursing care facilities 9 - - 9 Lawyer's office 9 1 - 8 Plumbing, heating, and air - conditioning contractors 7 - - 7 Used car dealers 246 33 12 201 Other $ 581 $ 73 $ 20 $ 488 Total 1 Excludes the government guaranteed portion of SBA 7(a) loans and PPP loans. TYPE DISTRIBUTION • Diverse product mix • Commercial mortgage and construction are generally originated with 50% - 60% LTV’s GEOGRAPHIC DISTRIBUTION • Diverse geographic mix • Largest concentration in California representing 24% of total PORTFOLIO ATTRIBUTES
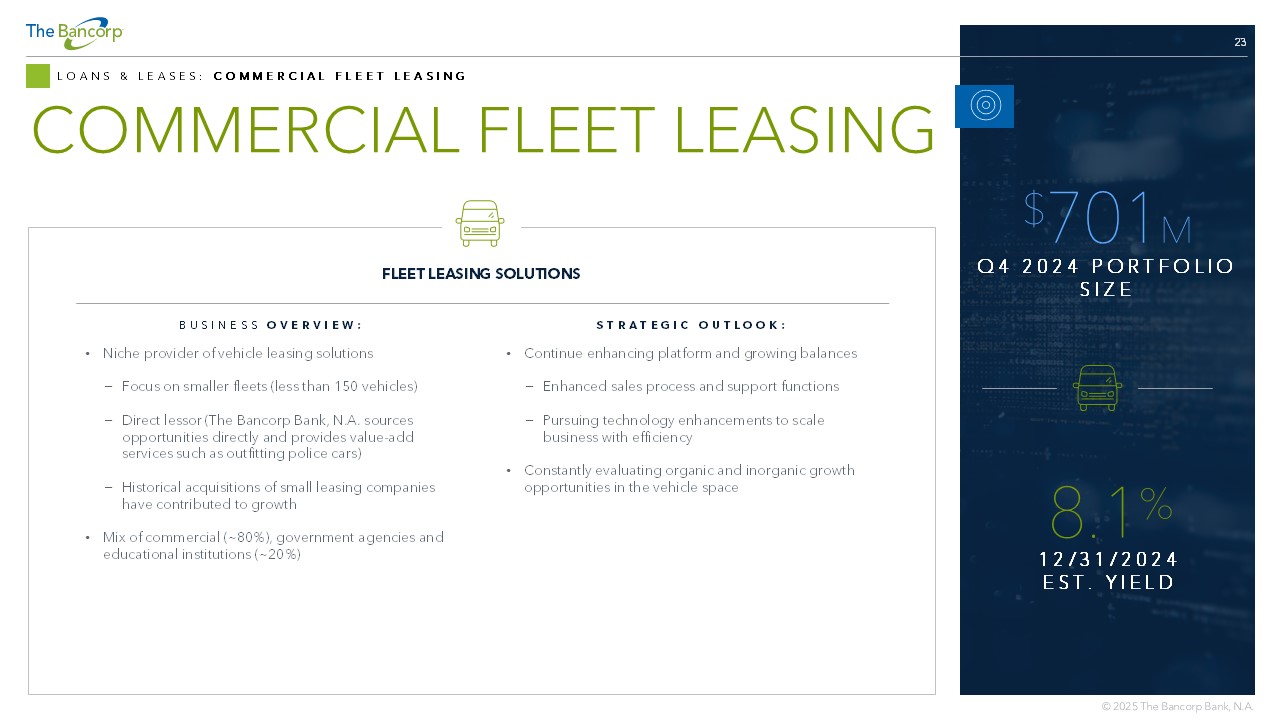
23 LOANS & LEASES: COMMERCIAL FLEET LEASING COMMERCIAL FLEET LEASING BUSINESS OVERVIEW: • Niche provider of vehicle leasing solutions − Focus on smaller fleets (less than 150 vehicles) − Direct lessor (The Bancorp Bank, N.A. sources opportunities directly and provides value - add services such as outfitting police cars) − Historical acquisitions of small leasing companies have contributed to growth • Mix of commercial (~80%), government agencies and educational institutions (~20%) STRATEGIC OUTLOOK: • Continue enhancing platform and growing balances − Enhanced sales process and support functions − Pursuing technology enhancements to scale business with efficiency • Constantly evaluating organic and inorganic growth opportunities in the vehicle space FLEET LEASING SOLUTIONS $ 701 M Q4 2024 PORTFOLIO SIZE 8.1 % 12/31/2024 EST. YIELD
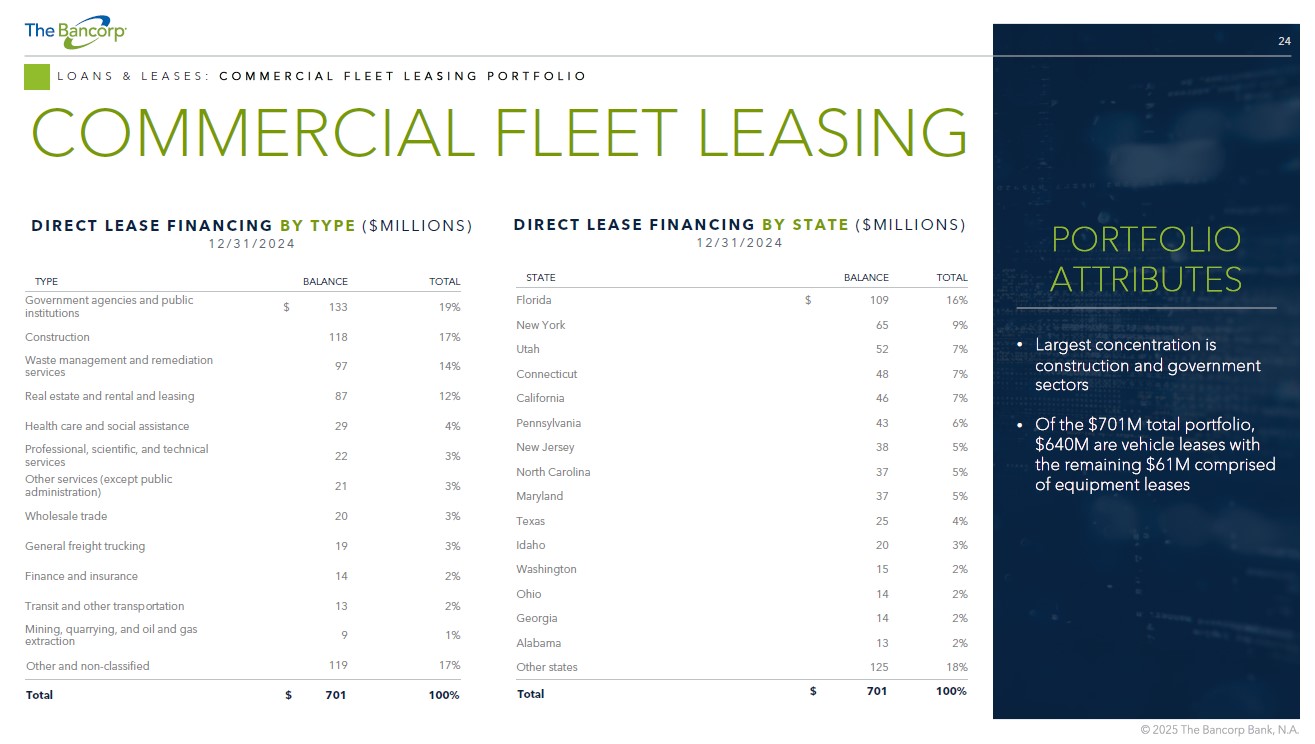
24 TOTAL BALANCE STATE 16% $ 109 Florida 9% 65 New York 7% 52 Utah 7% 48 Connecticut 7% 46 California 6% 43 Pennsylvania 5% 38 New Jersey 5% 37 North Carolina 5% 37 Maryland 4% 25 Texas 3% 20 Idaho 2% 15 Washington 2% 14 Ohio 2% 14 Georgia 2% 13 Alabama 18% 125 Other states 100% $ 701 Total LOANS & LEASES: COMMERCIAL FLEET LEASING PORTFOLIO COMMERCIAL FLEET LEASING • Largest concentration is construction and government sectors • Of the $701M total portfolio, $640M are vehicle leases with the remaining $61M comprised of equipment leases PORTFOLIO ATTRIBUTES TOTAL BALANCE TYPE 19% $ 133 Government agencies and public institutions 17% 118 Construction 14% 97 Waste management and remediation services 12% 87 Real estate and rental and leasing 4% 29 Health care and social assistance 3% 22 Professional, scientific, and technical services 3% 21 Other services (except public administration) 3% 20 Wholesale trade 3% 19 General freight trucking 2% 14 Finance and insurance 2% 13 Transit and other transportation 1% 9 Mining, quarrying, and oil and gas extraction 17% 119 Other and non - classified 100% $ 701 Total DIRECT LEASE FINANCING BY STATE ($MILLIONS) 12/31/2024 DIRECT LEASE FINANCING BY TYPE ($MILLIONS) 12/31/2024
FINANCIAL REVIEW
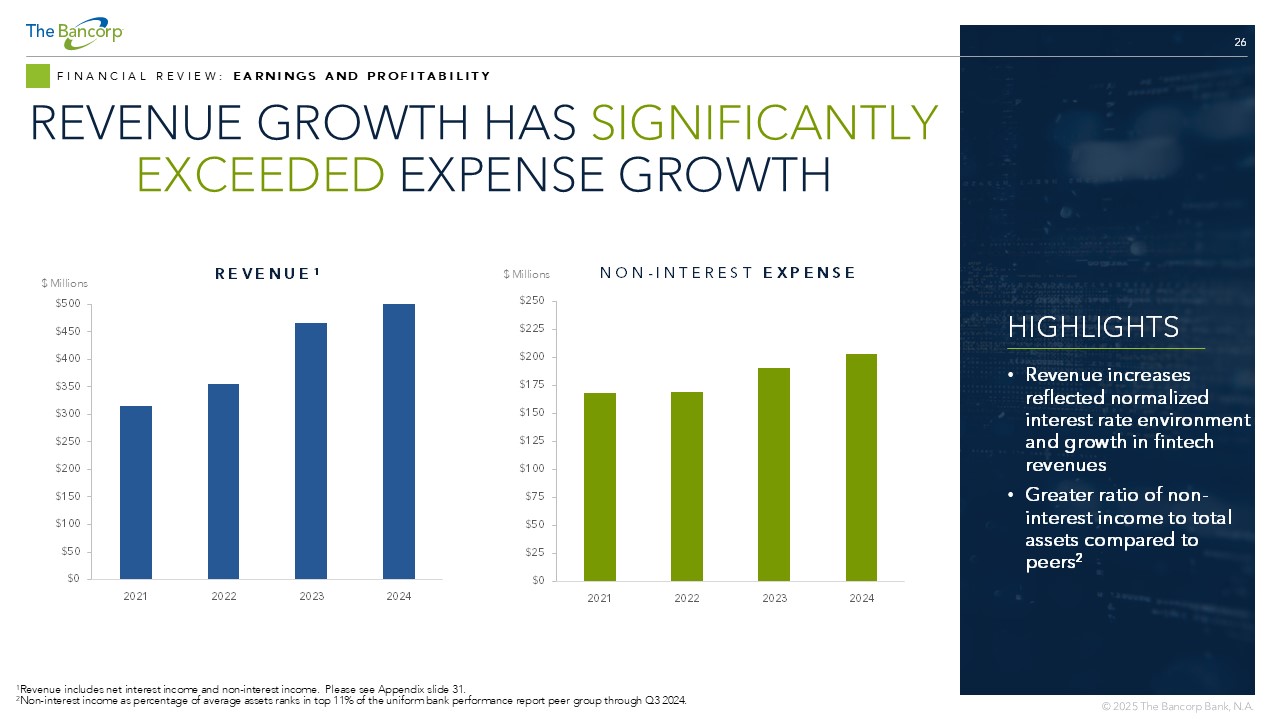
26 FINANCIAL REVIEW: EARNINGS AND PROFITABILITY REVENUE GROWTH HAS SIGNIFICANTLY EXCEEDED EXPENSE GROWTH 1 Revenue includes net interest income and non - interest income. Please see Appendix slide 31. 2 Non - interest income as percentage of average assets ranks in top 11% of the uniform bank performance report peer group through Q 3 2024. $0 $25 $50 $75 $100 $125 $150 $175 $200 $225 $250 2021 2022 2023 2024 NON - INTEREST EXPENSE $ Millions $0 $50 $100 $150 $200 $250 $300 $350 $400 $450 $500 2021 2022 2023 2024 REVENUE 1 $ Millions HIGHLIGHTS • Revenue increases reflected normalized interest rate environment and growth in fintech revenues • Greater ratio of non - interest income to total assets compared to peers 2

27 FINANCIAL REVIEW: LOAN LOSS RESERVE ALLOWANCE FOR CREDIT LOSSES PRIMARILY REFLECTS OUR CHARGE - OFF HISTORY 1 Please see Appendix slide 32 for GAAP to Non - GAAP reconciliation of adjusted allowance for credit losses to GAAP allowance for c redit losses as % of adjusted loan balance (excluding SBLOC & IBLOC). HIGHLIGHTS • Nominal charge - offs for REBL, SBLOC, & IBLOC • SBA 7(a) loans are ~75% U.S. government guaranteed • SBA 504 loans have 50% - 60% loan to value ratios at origination $0 $5 $10 $15 $20 $25 $30 $35 2020 2021 2022 2023 2024 ALLOWANCE FOR CREDIT LOSSES ($MILLIONS) Small Business HELOC/Consumer/Other SBLOC/IBLOC/Advisor Financing 0.5% 0.5% 0.4% 0.5% 0.6% Allowance for credit losses as % of loan balance 0.7% 0.7% 0.7% 0.9% 1.4% Adjusted allowance for credit losses as % of loan balance (excluding SBLOC & IBLOC) 1 Leasing Real Estate Bridge Lending
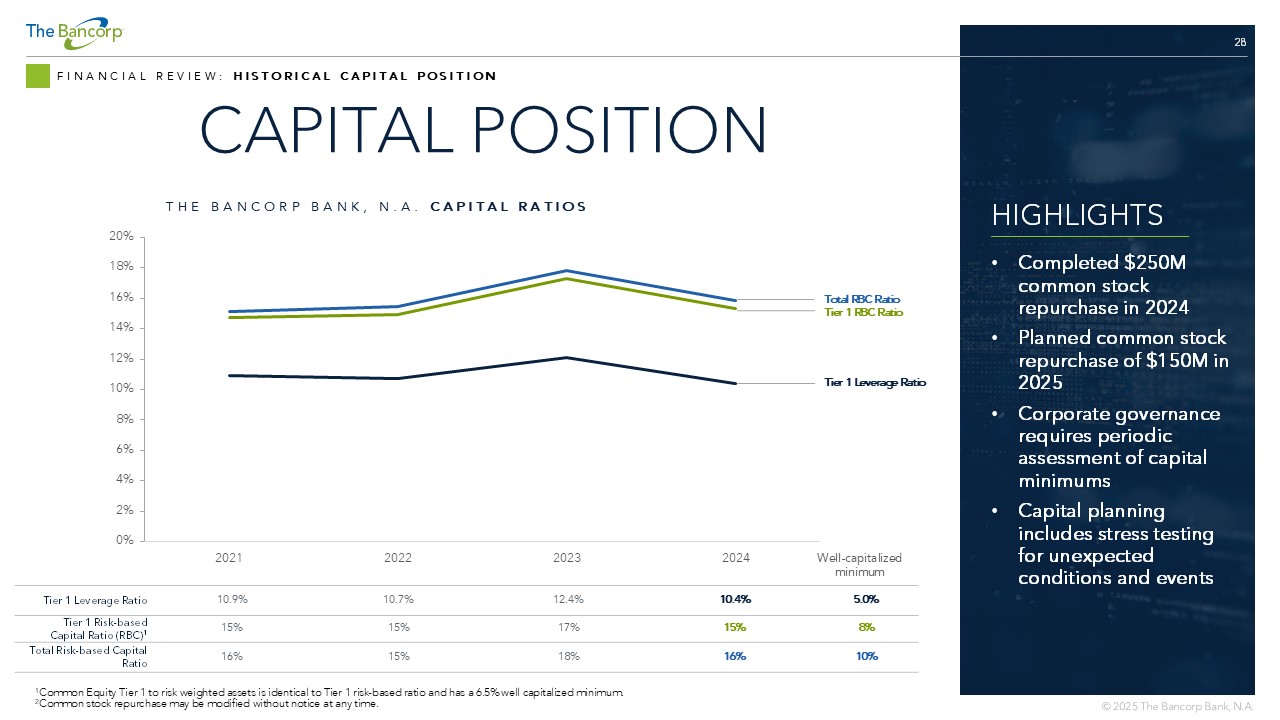
28 FINANCIAL REVIEW: HISTORICAL CAPITAL POSITION CAPITAL POSITION HIGHLIGHTS • Completed $250M common stock repurchase in 2024 • Planned common stock repurchase of $150M in 2025 • Corporate governance requires periodic assessment of capital minimums • Capital planning includes stress testing for unexpected conditions and events 0% 2% 4% 6% 8% 10% 12% 14% 16% 18% 20% 2021 2022 2023 2024 5.0% 10.4% 12.4% 10.7% 10.9% Tier 1 Leverage Ratio 8% 15% 17% 15% 15% Tier 1 Risk - based Capital Ratio (RBC) 1 10% 16% 18% 15% 16% Total Risk - based Capital Ratio Tier 1 RBC Ratio Total RBC Ratio Tier 1 Leverage Ratio THE BANCORP BANK, N.A. CAPITAL RATIOS Well - capitalized minimum 1 Common Equity Tier 1 to risk weighted assets is identical to Tier 1 risk - based ratio and has a 6.5% well capitalized minimum. 2 Common stock repurchase may be modified without notice at any time.
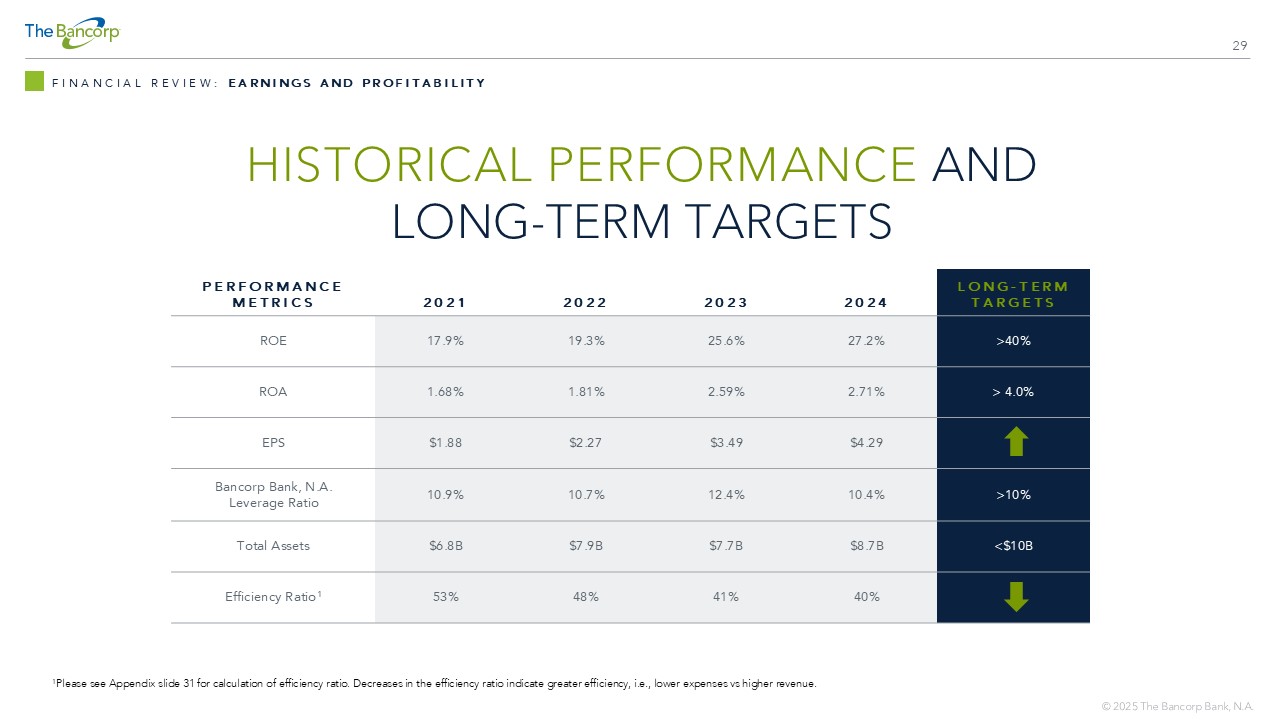
29 HISTORICAL PERFORMANCE AND LONG - TERM TARGETS FINANCIAL REVIEW: EARNINGS AND PROFITABILITY LONG - TERM TARGETS 2024 2023 2022 2021 PERFORMANCE METRICS >40% 27.2% 25.6% 19.3% 17.9% ROE > 4.0% 2.71% 2.59% 1.81% 1.68% ROA $4.29 $3.49 $2.27 $1.88 EPS >10% 10.4% 12.4% 10.7% 10.9% Bancorp Bank, N.A. Leverage Ratio <$10B $8.7B $7.7B $7.9B $6.8B Total Assets 40% 41% 48% 53% Efficiency Ratio 1 1 Please see Appendix slide 31 for calculation of efficiency ratio. Decreases in the efficiency ratio indicate greater efficien cy, i.e., lower expenses vs higher revenue.
APPENDIX
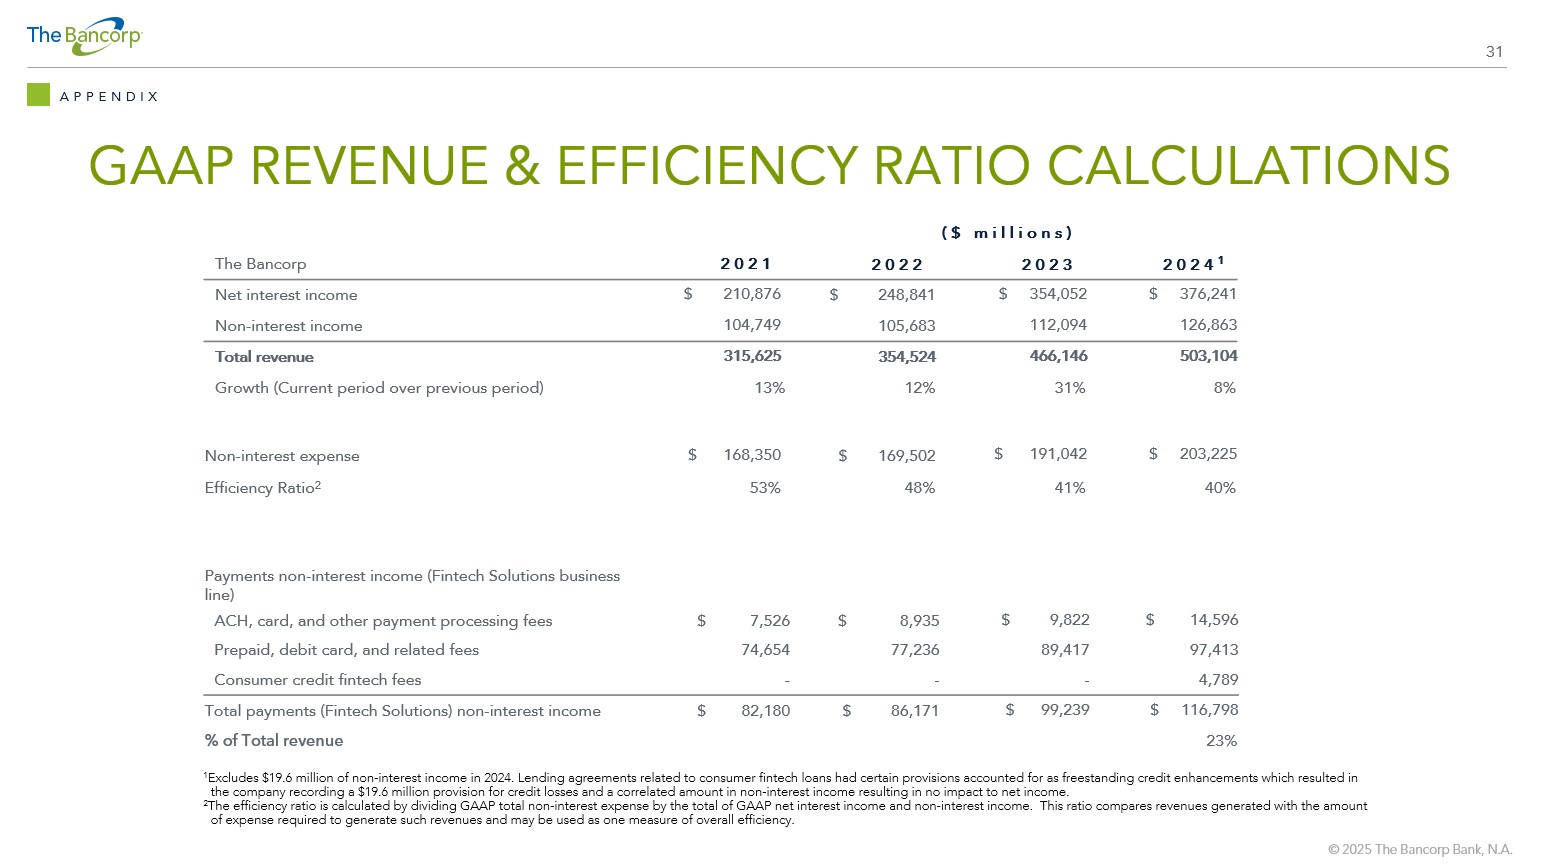
31 GAAP REVENUE & EFFICIENCY RATIO CALCULATIONS APPENDIX ($ millions) 2024 1 2023 2022 2021 The Bancorp $ 376,241 $ 354,052 $ 248,841 $ 210,876 Net interest income 126,863 112,094 105,683 104,749 Non - interest income 503,104 466,146 354,524 315,625 Total revenue 8% 31% 12% 13% Growth (Current period over previous period) $ 203,225 $ 191,042 $ 169,502 $ 168,350 Non - interest expense 40% 41% 48% 53% Efficiency Ratio 2 Payments non - interest income (Fintech Solutions business line) $ 14,596 $ 9,822 $ 8,935 $ 7,526 ACH, card, and other payment processing fees 97,413 89,417 77,236 74,654 Prepaid, debit card, and related fees 4,789 - - - Consumer credit fintech fees $ 116,798 $ 99,239 $ 86,171 $ 82,180 Total payments (Fintech Solutions) non - interest income 23% % of Total revenue 1 Excludes $19.6 million of non - interest income in 2024. Lending agreements related to consumer fintech loans had certain provisio ns accounted for as freestanding credit enhancements which resulted in the company recording a $19.6 million provision for credit losses and a correlated amount in non - interest income resulting in no impact to net income. 2 The efficiency ratio is calculated by dividing GAAP total non - interest expense by the total of GAAP net interest income and non - interest income. This ratio compares revenues generated with the amount of expense required to generate such revenues and may be used as one measure of overall efficiency.
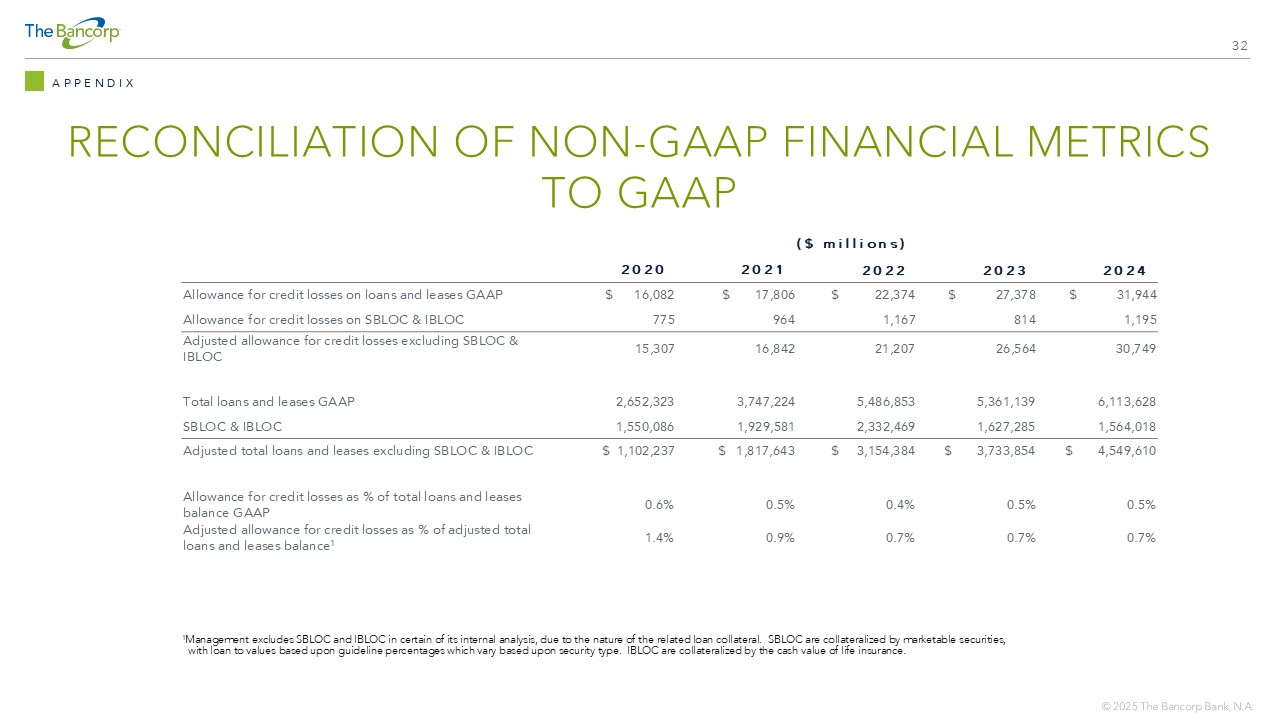
32 RECONCILIATION OF NON - GAAP FINANCIAL METRICS TO GAAP APPENDIX ($ millions) 2024 2023 2022 2021 2020 $ 31,944 $ 27,378 $ 22,374 $ 17,806 $ 16,082 Allowance for credit losses on loans and leases GAAP 1,195 814 1,167 964 775 Allowance for credit losses on SBLOC & IBLOC 30,749 26,564 21,207 16,842 15,307 Adjusted allowance for credit losses excluding SBLOC & IBLOC 6,113,628 5,361,139 5,486,853 3,747,224 2,652,323 Total loans and leases GAAP 1,564,018 1,627,285 2,332,469 1,929,581 1,550,086 SBLOC & IBLOC $ 4,549,610 $ 3,733,854 $ 3,154,384 $ 1,817,643 $ 1,102,237 Adjusted total loans and leases excluding SBLOC & IBLOC 0.5% 0.5% 0.4% 0.5% 0.6% Allowance for credit losses as % of total loans and leases balance GAAP 0.7% 0.7% 0.7% 0.9% 1.4% Adjusted allowance for credit losses as % of adjusted total loans and leases balance 1 1 Management excludes SBLOC and IBLOC in certain of its internal analysis, due to the nature of the related loan collateral. S BLO C are collateralized by marketable securities, with loan to values based upon guideline percentages which vary based upon security type. IBLOC are collateralized by the ca sh value of life insurance.