Exhibit(c).(4)
51job, Inc. Private and Confidential The information contained herein is of a confidential nature and is intended for the exclusive use of the persons or firm to whom it is furnished by us. Reproduction, publication, or dissemination of portions hereof may not be made without prior approval of Kroll, LLC. Prepared by: Duff & Phelps Opinions Practice March 1, 2022 Fairness Analysis Presented to the Special Committee of Independent Directors
2 Duff & Phelps Disclaimer • The following pages contain materials that are being provided by Kroll, LLC (“ Duff & Phelps ”), operating through its Duff & Phelps Opinions Practice, to the special committee of independent directors (the “ Special Committee ”) of the board of directors (the “ Board of Directors ”) (solely in its capacity as the Special Committee) of 51job, Inc. (the “ Company ”) in the context of a meeting of the Special Committee held to consider the Proposed Transaction (as defined herein). • The accompanying materials are, and any Opinion (as defined herein) will be, compiled and presented on a confidential basis, sol ely for the use and benefit of the Special Committee in connection with its evaluation of the Proposed Transaction and may not be, in whole o r i n part, distributed to any other party, publicly disclosed, or relied upon for any other purpose without the prior written consent of Du ff & Phelps or as otherwise provided in the engagement letter and the addendum thereto among Duff & Phelps, the Company, and the Special Commit tee . • Because these materials were prepared for use in the context of an oral presentation to the Special Committee, whose members are familiar with the business and affairs of the Company, neither Duff & Phelps nor any of its respective legal or financial advisors or acc ountants, take any responsibility for the accuracy or completeness of any of the accompanying materials if used by persons other than the Specia l C ommittee. • These materials are not intended to represent an Opinion and shall not be treated, construed, used or relied upon in any way as an Opinion. These materials are intended to serve as discussion materials for the Special Committee and as a summary of the basis upon wh ich Duff & Phelps may render an Opinion, and are incomplete without reference to, and should be viewed solely in conjunction with, the d isc ussion between Duff & Phelps and the Special Committee. • The accompanying material does not, and any Opinion provided by Duff & Phelps would not: (i) address the merits of the underl yin g business decision to enter into the Proposed Transaction versus any alternative strategy or transaction; (ii) constitute a recommendat ion as to how the Special Committee, the Board of Directors or any other person (including security holders of the Company) should vote or act wit h respect to any matters relating to the Proposed Transaction, or whether to proceed with the Proposed Transaction or any related transaction; or (iii) create any fiduciary duty on the part of Duff & Phelps to any party. • The information utilized in preparing this presentation was obtained from the Company and from public sources under the assum pti on that they are complete and accurate as of the date of provision. Duff & Phelps did not independently verify such information. Any estim ate s and forecasts contained herein have been prepared by or are based on discussions with the senior management of the Company and involve nume rou s and significant subjective determinations, which may or may not prove to be correct. No representation or warranty, expressed or imp lied, is made as to the accuracy or completeness of such information and nothing contained herein is, or shall be relied upon as, a representa tio n or warranty, whether as to the past or the future. • No selected company or selected transaction used in our analysis is directly comparable to the Company or the Proposed Transa cti on.
Table of Contents 3 1. Introduction and Transaction Overview 2. Valuation Analysis • Discounted Cash Flow Analysis • Selected Public Companies / M&A Transactions Analysis

1. Introduction and Transaction Overview
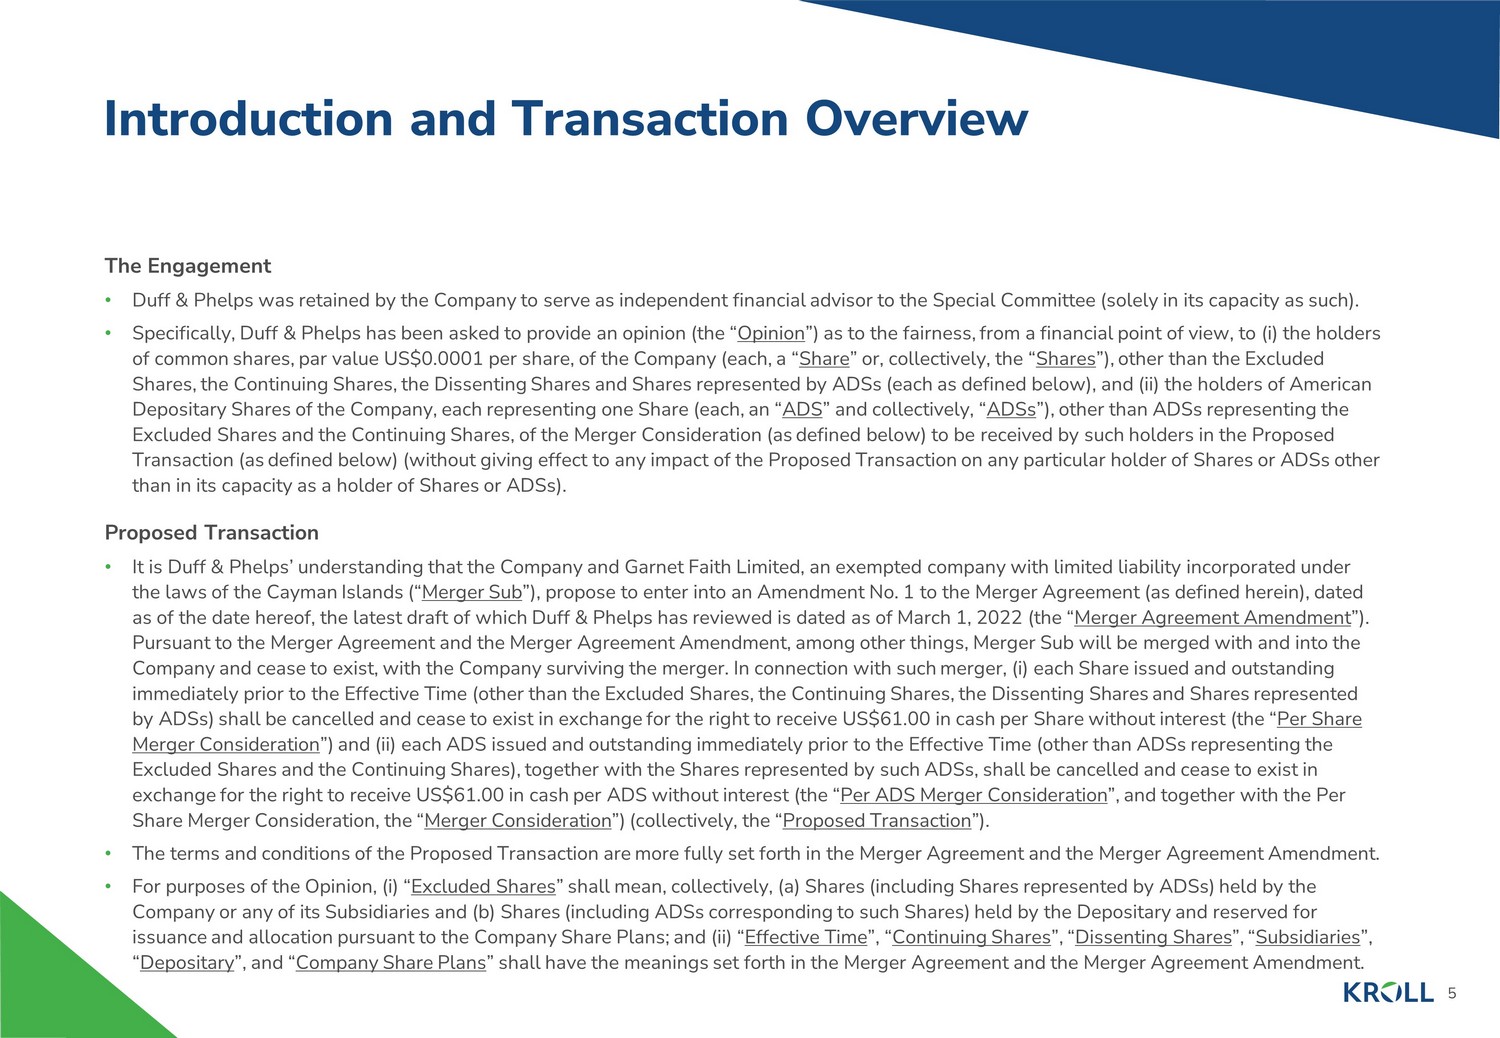
5 Introduction and Transaction Overview The Engagement • Duff & Phelps was retained by the Company to serve as independent financial advisor to the Special Committee (solely in its c apa city as such). • Specifically, Duff & Phelps has been asked to provide an opinion (the “ Opinion ”) as to the fairness, from a financial point of view, to (i) the holders of common shares, par value US$0.0001 per share, of the Company (each, a “ Share ” or, collectively, the “ Shares ”), other than the Excluded Shares, the Continuing Shares, the Dissenting Shares and Shares represented by ADSs (each as defined below), and (ii) the hol der s of American Depositary Shares of the Company, each representing one Share (each, an “ ADS ” and collectively, “ ADSs ”), other than ADSs representing the Excluded Shares and the Continuing Shares, of the Merger Consideration (as defined below) to be received by such holders in t he Proposed Transaction (as defined below) (without giving effect to any impact of the Proposed Transaction on any particular holder of S har es or ADSs other than in its capacity as a holder of Shares or ADSs). Proposed Transaction • It is Duff & Phelps’ understanding that the Company and Garnet Faith Limited, an exempted company with limited liability inco rpo rated under the laws of the Cayman Islands (“ Merger Sub ”), propose to enter into an Amendment No. 1 to the Merger Agreement (as defined herein), dated as of the date hereof, the latest draft of which Duff & Phelps has reviewed is dated as of March 1 , 2022 (the “ Merger Agreement Amendment ”). Pursuant to the Merger Agreement and the Merger Agreement Amendment, among other things, Merger Sub will be merged with and i nto the Company and cease to exist, with the Company surviving the merger. In connection with such merger, (i) each Share issued and out standing immediately prior to the Effective Time (other than the Excluded Shares, the Continuing Shares, the Dissenting Shares and Sha res represented by ADSs) shall be cancelled and cease to exist in exchange for the right to receive US$61.00 in cash per Share without intere st (the “ Per Share Merger Consideration ”) and (ii) each ADS issued and outstanding immediately prior to the Effective Time (other than ADSs representing the Excluded Shares and the Continuing Shares), together with the Shares represented by such ADSs, shall be cancelled and cease t o e xist in exchange for the right to receive US$61.00 in cash per ADS without interest (the “ Per ADS Merger Consideration ”, and together with the Per Share Merger Consideration, the “ Merger Consideration ”) (collectively, the “ Proposed Transaction ”). • The terms and conditions of the Proposed Transaction are more fully set forth in the Merger Agreement and the Merger Agreemen t A mendment. • For purposes of the Opinion, (i) “ Excluded Shares ” shall mean, collectively, (a) Shares (including Shares represented by ADSs) held by the Company or any of its Subsidiaries and (b) Shares (including ADSs corresponding to such Shares) held by the Depositary and re ser ved for issuance and allocation pursuant to the Company Share Plans; and (ii) “ Effective Time ”, “ Continuing Shares ”, “ Dissenting Shares ”, “ Subsidiaries ”, “ Depositary ”, and “ Company Share Plans ” shall have the meanings set forth in the Merger Agreement and the Merger Agreement Amendment.
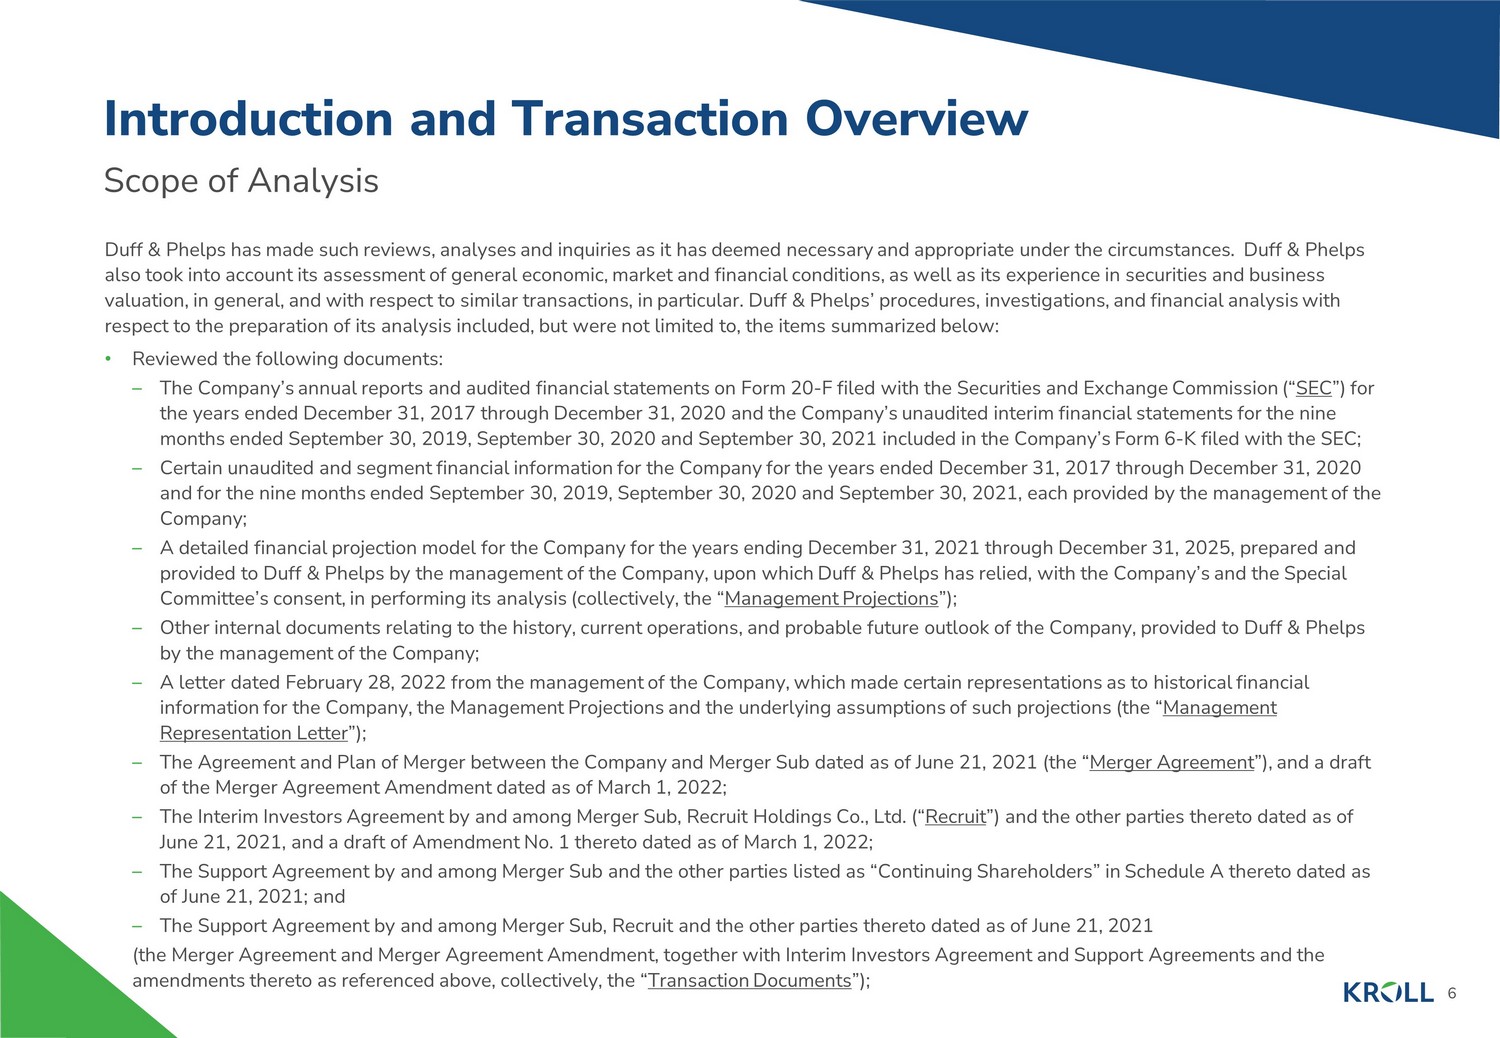
6 Scope of Analysis Introduction and Transaction Overview Duff & Phelps has made such reviews, analyses and inquiries as it has deemed necessary and appropriate under the circumstance s. Duff & Phelps also took into account its assessment of general economic, market and financial conditions, as well as its experience in secu rit ies and business valuation, in general, and with respect to similar transactions, in particular. Duff & Phelps’ procedures, investigations, an d f inancial analysis with respect to the preparation of its analysis included, but were not limited to, the items summarized below: • Reviewed the following documents: – The Company’s annual reports and audited financial statements on Form 20 - F filed with the Securities and Exchange Commission (“ SEC ”) for the years ended December 31, 2017 through December 31, 2020 and the Company’s unaudited interim financial statements for the nin e months ended September 30, 2019, September 30, 2020 and September 30, 2021 included in the Company’s Form 6 - K filed with the SEC ; – Certain unaudited and segment financial information for the Company for the years ended December 31, 2017 through December 31 , 2 020 and for the nine months ended September 30, 2019, September 30, 2020 and September 30, 2021, each provided by the management of the Company; – A detailed financial projection model for the Company for the years ending December 31, 2021 through December 31, 2025, prepa red and provided to Duff & Phelps by the management of the Company, upon which Duff & Phelps has relied, with the Company’s and the S pec ial Committee’s consent, in performing its analysis (collectively, the “ Management Projections ”); – Other internal documents relating to the history, current operations, and probable future outlook of the Company, provided to Du ff & Phelps by the management of the Company; – A letter dated February 28, 2022 from the management of the Company, which made certain representations as to historical fina nci al information for the Company, the Management Projections and the underlying assumptions of such projections (the “ Management Representation Letter ”); – The Agreement and Plan of Merger between the Company and Merger Sub dated as of June 21, 2021 (the “ Merger Agreement ”), and a draft of the Merger Agreement Amendment dated as of March 1, 2022; – The Interim Investors Agreement by and among Merger Sub, Recruit Holdings Co., Ltd. (“ Recruit ”) and the other parties thereto dated as of June 21, 2021, and a draft of Amendment No. 1 thereto dated as of March 1, 2022; – The Support Agreement by and among Merger Sub and the other parties listed as “Continuing Shareholders” in Schedule A thereto da ted as of June 21, 2021; and – The Support Agreement by and among Merger Sub, Recruit and the other parties thereto dated as of June 21 , 2021 (the Merger Agreement and Merger Agreement Amendment, together with Interim Investors Agreement and Support Agreements and th e amendments thereto as referenced above, collectively, the “ Transaction Documents ”);
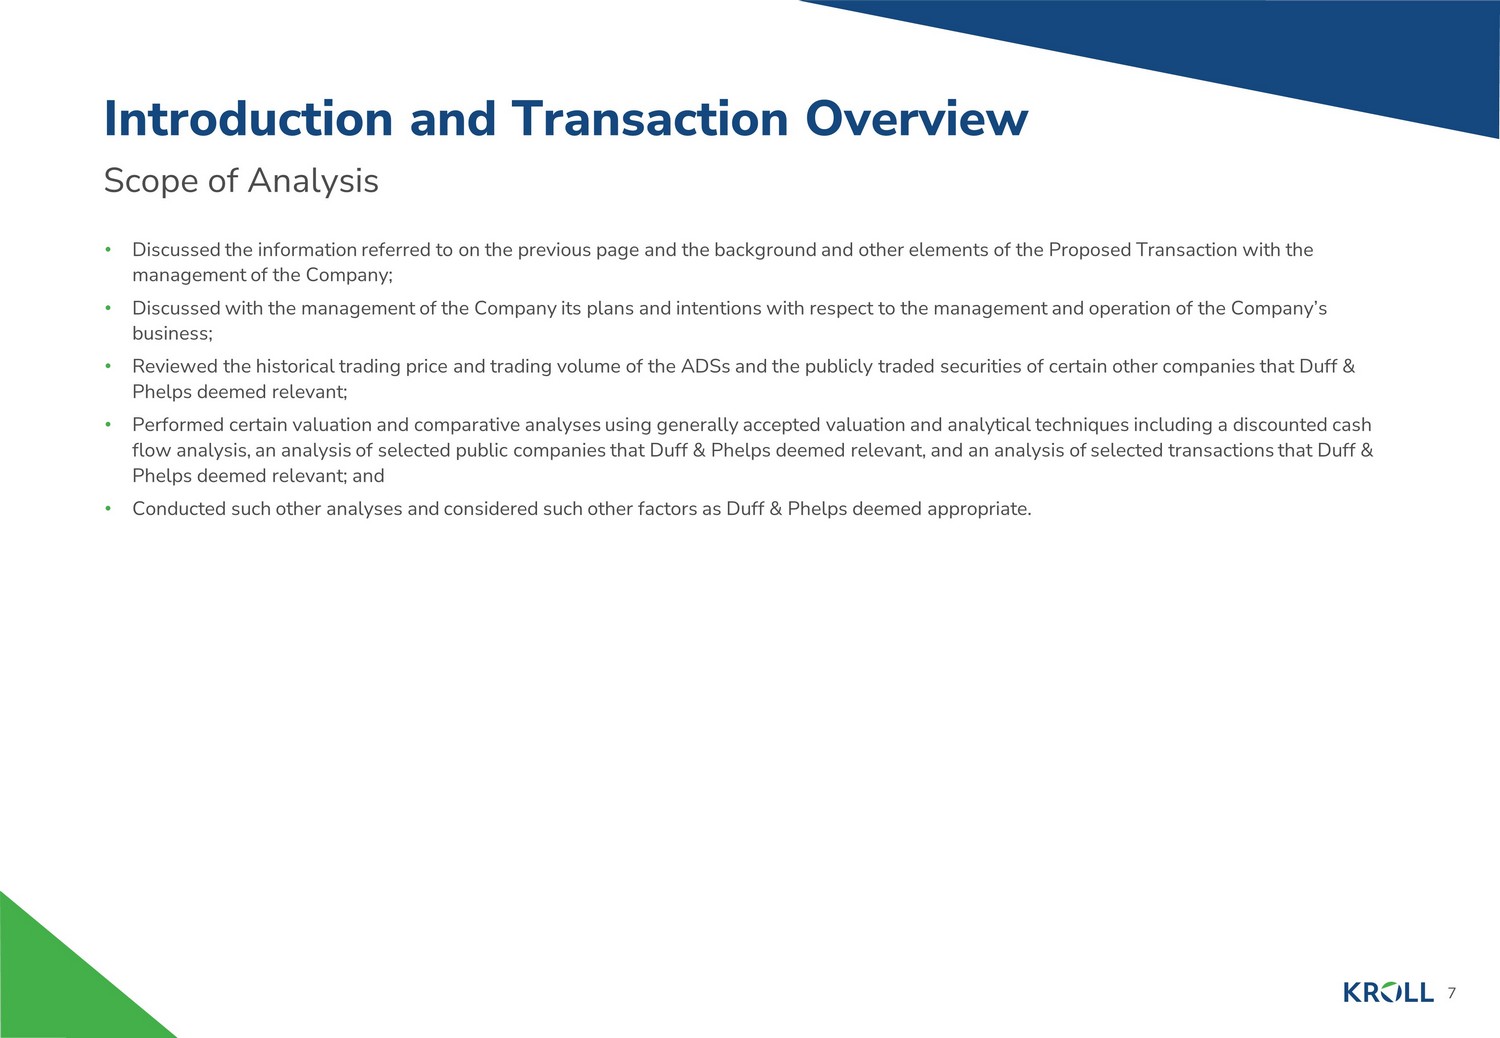
7 Scope of Analysis Introduction and Transaction Overview • Discussed the information referred to on the previous page and the background and other elements of the Proposed Transaction wit h the management of the Company; • Discussed with the management of the Company its plans and intentions with respect to the management and operation of the Com pan y’s business; • Reviewed the historical trading price and trading volume of the ADSs and the publicly traded securities of certain other comp ani es that Duff & Phelps deemed relevant; • Performed certain valuation and comparative analyses using generally accepted valuation and analytical techniques including a di scounted cash flow analysis, an analysis of selected public companies that Duff & Phelps deemed relevant, and an analysis of selected trans act ions that Duff & Phelps deemed relevant; and • Conducted such other analyses and considered such other factors as Duff & Phelps deemed appropriate.

8 Ownership Summary Introduction and Transaction Overview (1) Each ADS represents one Share. (2) Numbers of shares outstanding are provided by the management of the Company. Source: Company filings, Capital IQ, the management of the Company. 51job, Inc. - Ownership Current Shareholders ADSs (1) % of Ownership Buyer Consortium Yan, Rick (Co-Founder, CEO & President) 11,880,264 17.1% Buyer Consortium 11,880,264 17.1% Continuing Shareholders Chien, Kathleen (Co-Founder, Acting CFO & COO) 2,111,258 3.0% Other management members 256,269 0.4% Recruit Holdings Co., Ltd. 23,443,981 33.7% Continuing Shareholders 25,811,508 37.1% Top 15 Institutional Investors Oasis Management Company Ltd. 2,237,012 3.2% Allspring Global Investments, LLC 2,070,154 3.0% BlackRock, Inc. (NYSE:BLK) 1,684,342 2.4% Harding Loevner LP 1,551,123 2.2% Pentwater Capital Management LP 1,462,000 2.1% The Vanguard Group, Inc. 1,047,982 1.5% Indus Capital Partners, LLC 1,022,761 1.5% Corbin Capital Partners, L.P. 940,104 1.3% Citadel Advisors LLC 910,259 1.3% Goldman Sachs Group 769,815 1.1% Krane Funds Advisors, LLC 725,054 1.0% Hel Ved Capital Management Limited 673,899 1.0% Stonehill Capital Management LLC 632,444 0.9% Massachusetts Financial Services Company 624,743 0.9% State Street Global Advisors, Inc. 578,426 0.8% Top 15 Institutional Investors 16,930,118 24.3% Total Institutional Investors 27,555,682 39.6% Public Investors and Others 2,189,755 3.1% Total ADSs Outstanding (2) 67,437,209 96.8% Options In-the-Money at Offer Price 2,221,490 3.2% Fully Diluted ADSs Outstanding at Offer Price 69,658,699 100.00% Public Investors and Others 3.1% Institutional Investors 39.6% Continuing Shareholders 37.1% Buyer Consortium 17.1% Options 3.2%
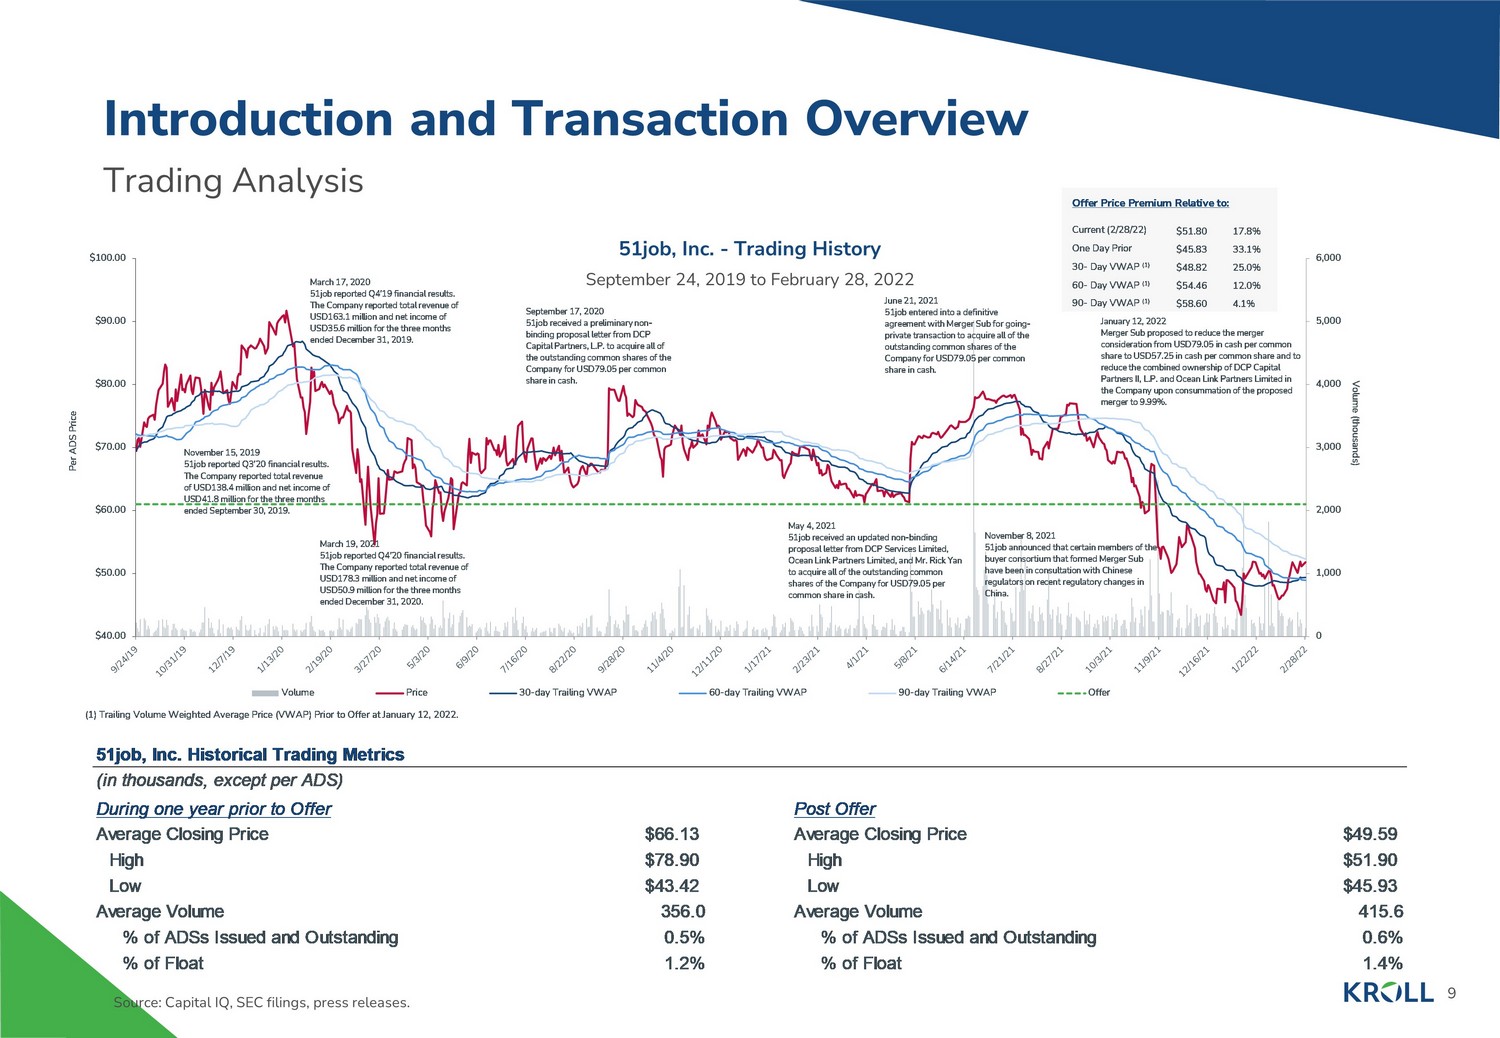
9 Trading Analysis Introduction and Transaction Overview Source: Capital IQ, SEC filings, press releases. 51job, Inc. - Trading History September 24, 2019 to February 28, 2022 51job, Inc. Historical Trading Metrics (in thousands, except per ADS) During one year prior to Offer Post Offer Average Closing Price $66.13 Average Closing Price $49.59 High $78.90 High $51.90 Low $43.42 Low $45.93 Average Volume 356.0 Average Volume 415.6 % of ADSs Issued and Outstanding 0.5% % of ADSs Issued and Outstanding 0.6% % of Float 1.2% % of Float 1.4% 0 1,000 2,000 3,000 4,000 5,000 6,000 $40.00 $50.00 $60.00 $70.00 $80.00 $90.00 $100.00 Volume (thousands) Per ADS Price Volume Price 30-day Trailing VWAP 60-day Trailing VWAP 90-day Trailing VWAP Offer (1) Trailing Volume Weighted Average Price (VWAP) Prior to Offer at January 12, 2022. Current (2/28/22) Offer Price Premium Relative to: 17.8% 30 - Day VWAP (1) 25.0% 12.0% 4.1% 60 - Day VWAP (1) 90 - Day VWAP (1) One Day Prior 33.1% $51.80 $48.82 $54.46 $58.60 $45.83 March 17, 2020 51job reported Q4'19 financial results. The Company reported total revenue of USD163.1 million and net income of USD35.6 million for the three months ended December 31, 2019 . March 19 , 2021 51job reported Q4'20 financial results. The Company reported total revenue of USD178.3 million and net income of USD50.9 million for the three months ended December 31, 2020 . November 15, 2019 51job reported Q3'20 financial results. The Company reported total revenue of USD138.4 million and net income of USD41.8 million for the three months ended September 30, 2019 . November 8 , 2021 51job announced that certain members of the buyer consortium that formed Merger Sub have been in consultation with Chinese regulators on recent regulatory changes in China. September 17 , 2020 51job received a preliminary non - binding proposal letter from DCP Capital Partners, L.P. to acquire all of the outstanding common shares of the Company for USD79.05 per common share in cash. May 4 , 2021 51job received an updated non - binding proposal letter from DCP Services Limited, Ocean Link Partners Limited, and Mr. Rick Yan to acquire all of the outstanding common shares of the Company for USD79.05 per common share in cash. January 12 , 2022 Merger Sub proposed to reduce the merger consideration from USD79.05 in cash per common share to USD57.25 in cash per common share and to reduce the combined ownership of DCP Capital Partners II, L.P. and Ocean Link Partners Limited in the Company upon consummation of the proposed merger to 9.99%. June 21 , 2021 51job entered into a definitive agreement with Merger Sub for going - private transaction to acquire all of the outstanding common shares of the Company for USD79.05 per common share in cash.
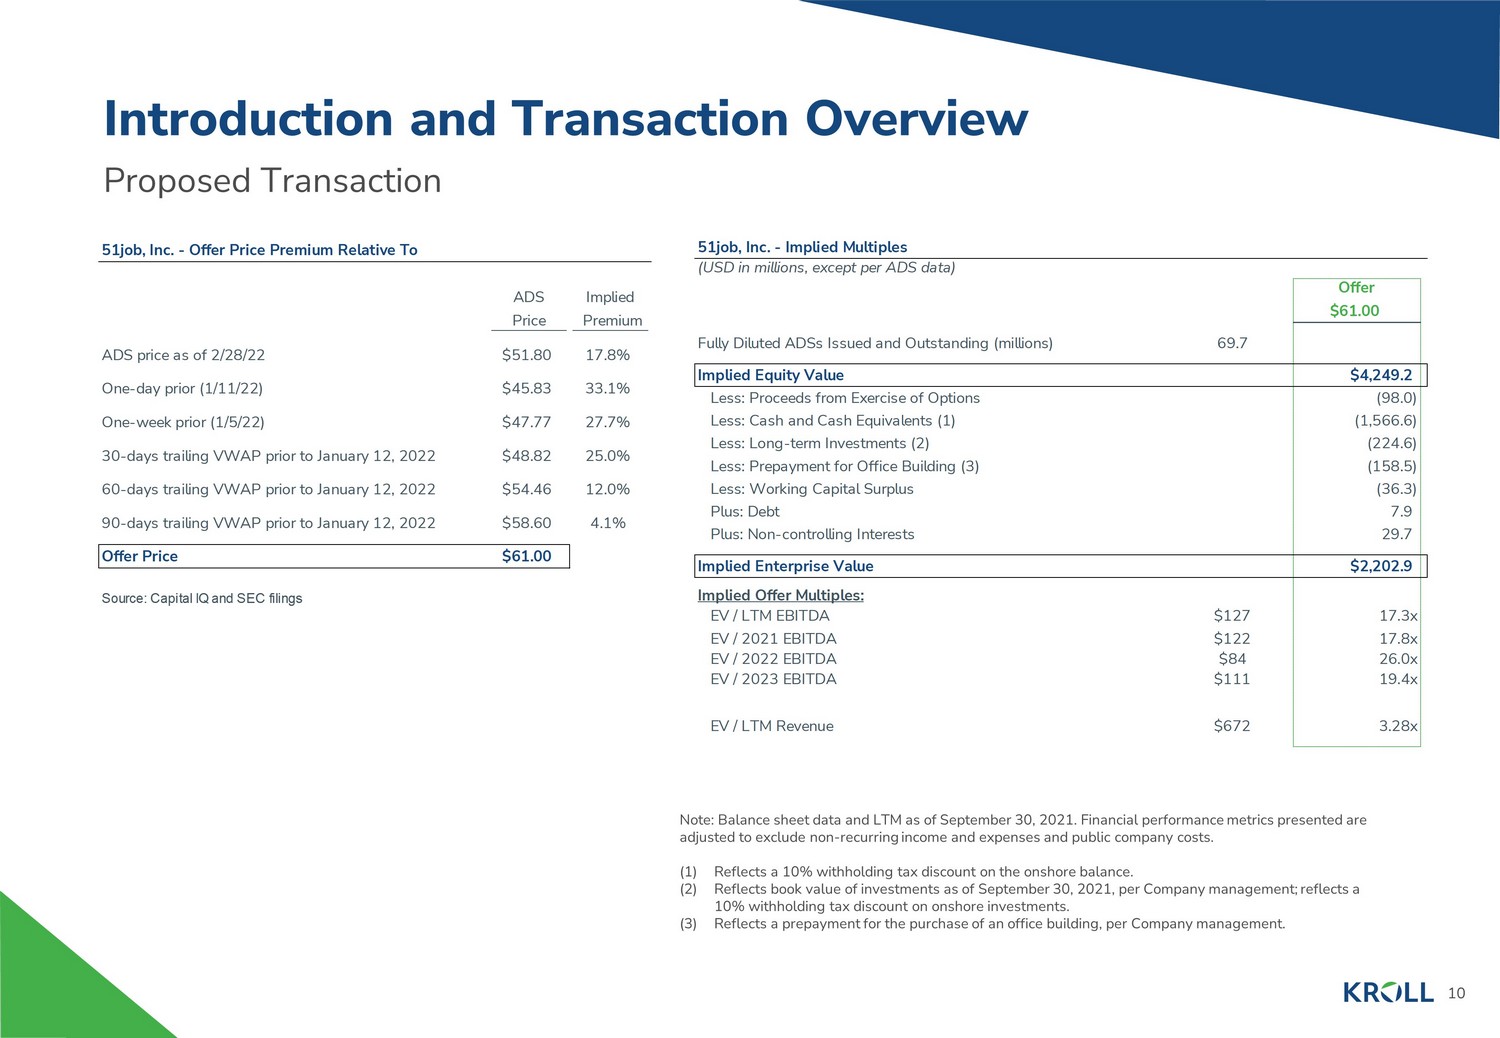
10 Proposed Transaction Introduction and Transaction Overview Note: Balance sheet data and LTM as of September 30, 2021. Financial performance metrics presented are adjusted to exclude non - recurring income and expenses and public company costs. (1) Reflects a 10% withholding tax discount on the onshore balance. (2) Reflects book value of investments as of September 30, 2021, per Company management; reflects a 10% withholding tax discount on onshore investments. (3) Reflects a prepayment for the purchase of an office building, per Company management. 51job, Inc. - Offer Price Premium Relative To ADS Implied Price Premium ADS price as of 2/28/22 $51.80 17.8% One-day prior (1/11/22) $45.83 33.1% One-week prior (1/5/22) $47.77 27.7% 30-days trailing VWAP prior to January 12, 2022 $48.82 25.0% 60-days trailing VWAP prior to January 12, 2022 $54.46 12.0% 90-days trailing VWAP prior to January 12, 2022 $58.60 4.1% Offer Price $61.00 Source: Capital IQ and SEC filings 51job, Inc. - Implied Multiples (USD in millions, except per ADS data) Offer $61.00 Fully Diluted ADSs Issued and Outstanding (millions) 69.7 1.00 Implied Equity Value $4,249.2 Less: Proceeds from Exercise of Options (618.24) (98.0) Less: Cash and Cash Equivalents (1) (9,883.30) (1,566.6) Less: Long-term Investments (2) (1,416.77) (224.6) Less: Prepayment for Office Building (3) (1,000.00) (158.5) Less: Working Capital Surplus (228.80) (36.3) Plus: Debt 50.00 7.9 Plus: Non-controlling Interests 187.32 29.7 Implied Enterprise Value $2,202.9 Implied Offer Multiples: EV / LTM EBITDA $127 17.3x EV / 2021 EBITDA $122 17.8x EV / 2022 EBITDA $84 26.0x EV / 2023 EBITDA $111 19.4x EV / LTM Revenue $672 3.28x
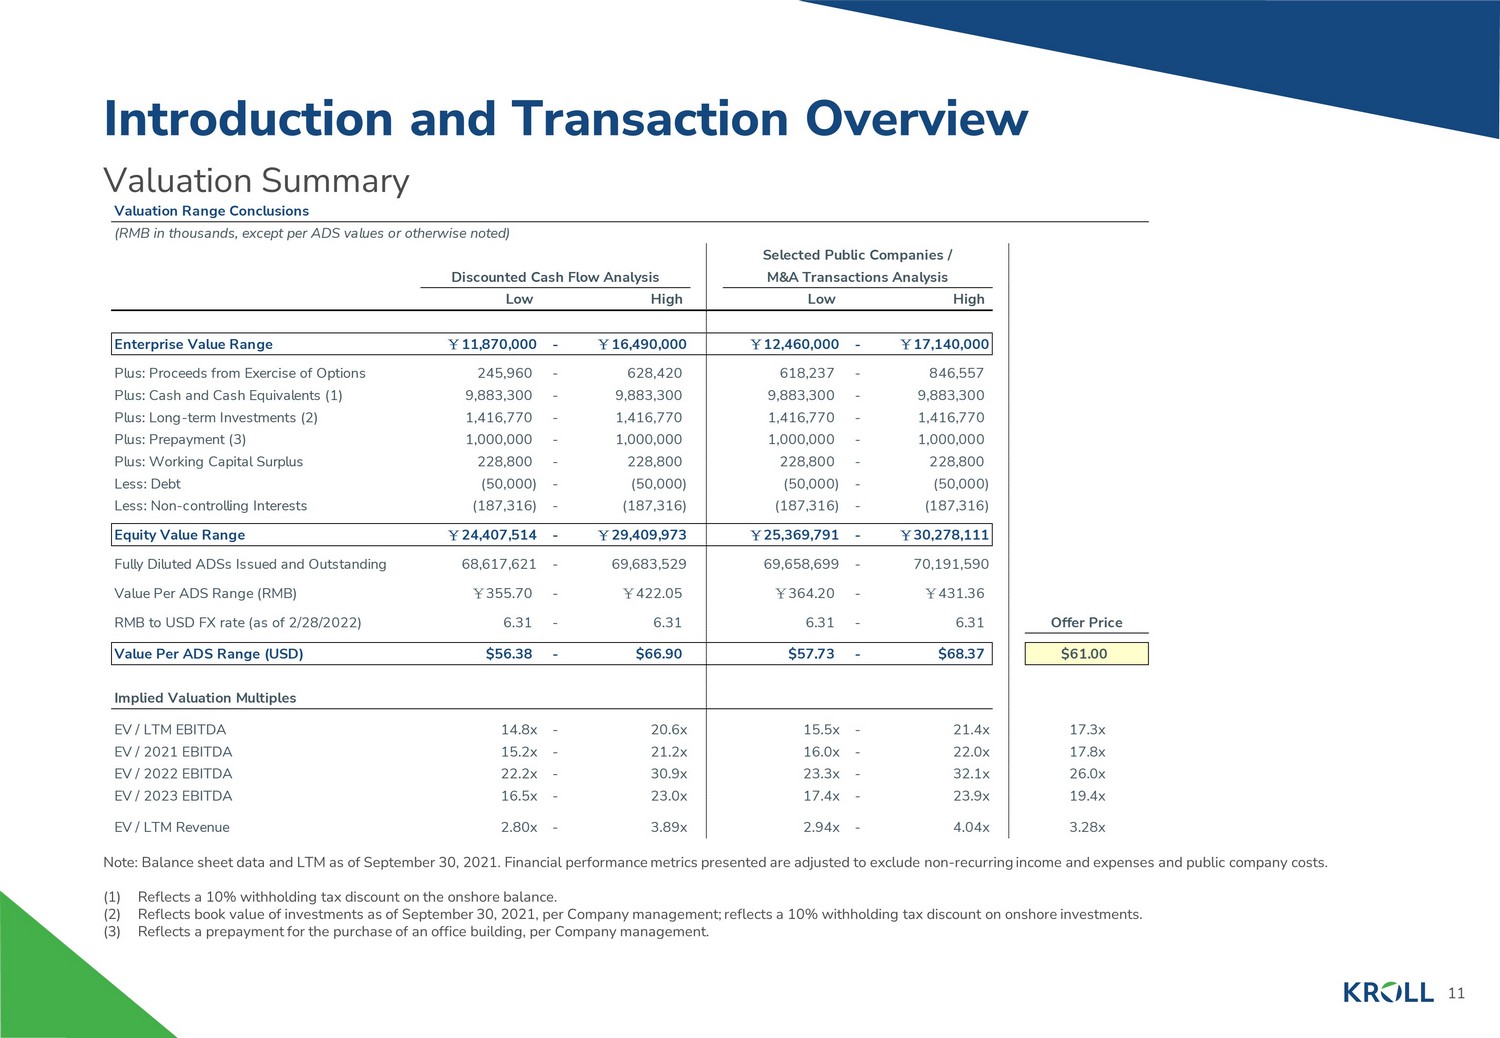
11 Valuation Summary Introduction and Transaction Overview Note: Balance sheet data and LTM as of September 30, 2021. Financial performance metrics presented are adjusted to exclude no n - r ecurring income and expenses and public company costs. (1) Reflects a 10% withholding tax discount on the onshore balance. (2) Reflects book value of investments as of September 30, 2021, per Company management; reflects a 10% withholding tax discount on onshore investments. (3) Reflects a prepayment for the purchase of an office building, per Company management. Valuation Range Conclusions (RMB in thousands, except per ADS values or otherwise noted) Discounted Cash Flow Analysis Selected Public Companies / M&A Transactions Analysis Low High Low High Enterprise Value Range ¥ 11,870,000 - ¥ 16,490,000 ¥ 12,460,000 - ¥ 17,140,000 Plus: Proceeds from Exercise of Options 245,960 - 628,420 618,237 - 846,557 Plus: Cash and Cash Equivalents (1) 9,883,300 - 9,883,300 9,883,300 - 9,883,300 Plus: Long-term Investments (2) 1,416,770 - 1,416,770 1,416,770 - 1,416,770 Plus: Prepayment (3) 1,000,000 - 1,000,000 1,000,000 - 1,000,000 Plus: Working Capital Surplus 228,800 - 228,800 228,800 - 228,800 Less: Debt (50,000) - (50,000) (50,000) - (50,000) Less: Non-controlling Interests (187,316) - (187,316) (187,316) - (187,316) Equity Value Range ¥ 24,407,514 - ¥ 29,409,973 ¥ 25,369,791 - ¥ 30,278,111 Fully Diluted ADSs Issued and Outstanding 68,617,621 - 69,683,529 69,658,699 - 70,191,590 Value Per ADS Range (RMB) ¥ 355.70 - ¥ 422.05 ¥ 364.20 - ¥ 431.36 RMB to USD FX rate (as of 2/28/2022) 6.31 - 6.31 6.31 - 6.31 Offer Price Value Per ADS Range (USD) $56.38 - $66.90 $57.73 - $68.37 $61.00 Implied Valuation Multiples EV / LTM EBITDA 14.8x - 20.6x 15.5x - 21.4x 17.3x EV / 2021 EBITDA 15.2x - 21.2x 16.0x - 22.0x 17.8x EV / 2022 EBITDA 22.2x - 30.9x 23.3x - 32.1x 26.0x EV / 2023 EBITDA 16.5x - 23.0x 17.4x - 23.9x 19.4x EV / LTM Revenue 2.80x - 3.89x 2.94x - 4.04x 3.28x
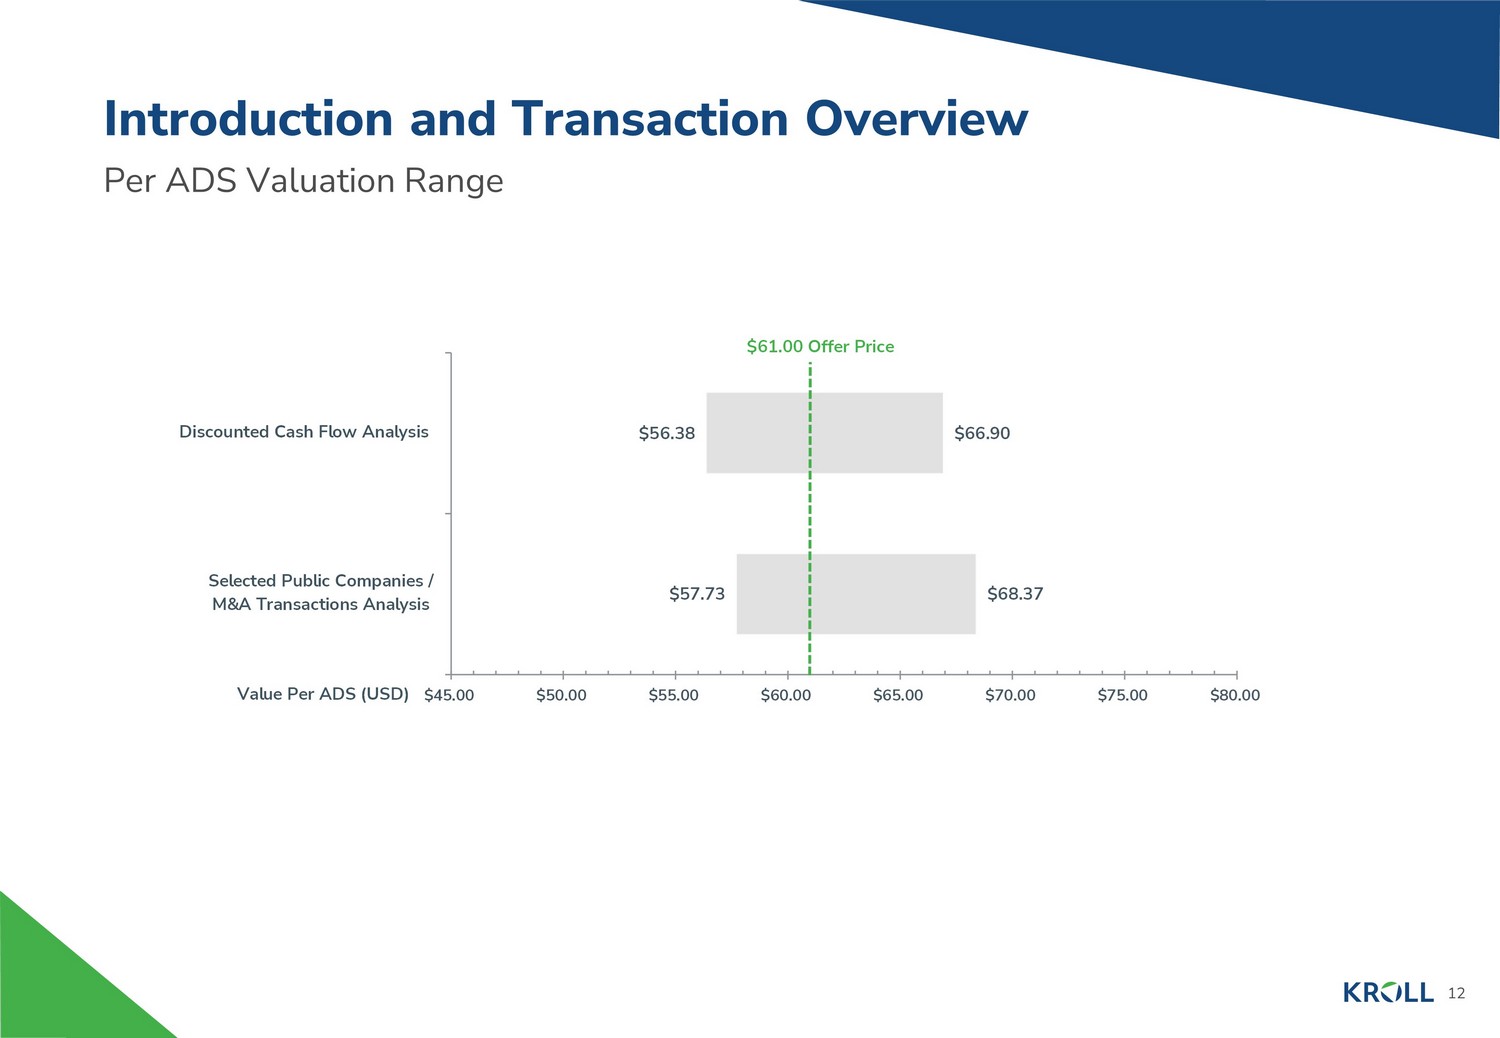
12 Per ADS Valuation Range Introduction and Transaction Overview $57.73 $56.38 $68.37 $66.90 $45.00 $50.00 $55.00 $60.00 $65.00 $70.00 $75.00 $80.00 Selected Public Companies / M&A Transactions Analysis Discounted Cash Flow Analysis Value Per ADS (USD) $61.00 Offer Price
2. Valuation Analysis

14 Historical and Projected Financial Performance Valuation Analysis (1) Net working capital as of September 30, 2021 excludes prepayment for the purchase of an office building. Note: Financial performance metrics presented are adjusted to exclude non - recurring income and expenses and public company costs . Source: Company filings, the management of the Company. Historical and Projected Financial Performance (RMB in thousands) YTD YTD LTM Management Projections 2017A 2018A 2019A 2020A 9/30/2020 9/30/2021 9/30/2021 2021P 2022P 2023P 2024P 2025P Online recruitment services ¥ 1,871,700 ¥ 2,431,898 ¥ 2,471,179 ¥ 2,147,334 ¥ 1,595,772 ¥ 1,778,506 ¥ 2,330,068 ¥ 2,379,391 ¥ 2,647,883 ¥ 2,968,310 ¥ 3,292,290 ¥ 3,647,083 Growth 21.0% 29.9% 1.6% (13.1%) (14.1%) 11.5% 5.5% 10.8% 11.3% 12.1% 10.9% 10.8% Other human resource related revenues ¥ 1,009,515 ¥ 1,350,048 ¥ 1,528,846 ¥ 1,541,617 ¥ 930,072 ¥ 1,296,739 ¥ 1,908,284 ¥ 2,007,145 ¥ 2,217,708 ¥ 2,465,460 ¥ 2,716,273 ¥ 2,975,449 Growth 22.3% 33.7% 13.2% 0.8% (7.6%) 39.4% 31.4% 30.2% 10.5% 11.2% 10.2% 9.5% Net Revenue ¥ 2,881,215 ¥ 3,781,946 ¥ 4,000,025 ¥ 3,688,951 ¥ 2,525,844 ¥ 3,075,245 ¥ 4,238,352 ¥ 4,386,536 ¥ 4,865,591 ¥ 5,433,769 ¥ 6,008,563 ¥ 6,622,531 Growth 21.4% 31.3% 5.8% (7.8%) (11.8%) 21.8% 15.8% 18.9% 10.9% 11.7% 10.6% 10.2% Adjusted EBITDA ¥ 1,028,753 ¥ 1,428,269 ¥ 1,504,959 ¥ 1,127,210 ¥ 735,646 ¥ 410,586 ¥ 802,150 ¥ 778,913 ¥ 534,248 ¥ 717,320 ¥ 934,638 ¥ 1,166,521 Margin % 35.7% 37.8% 37.6% 30.6% 29.1% 13.4% 18.9% 17.8% 11.0% 13.2% 15.6% 17.6% Growth NA 38.8% 5.4% (25.1%) (31.8%) (44.2%) (31.0%) (30.9%) (31.4%) 34.3% 30.3% 24.8% Adjusted EBIT ¥ 965,086 ¥ 1,332,700 ¥ 1,418,681 ¥ 1,041,708 ¥ 671,612 ¥ 346,104 ¥ 708,518 ¥ 692,998 ¥ 443,932 ¥ 621,541 ¥ 838,169 ¥ 1,052,106 Margin % 33.5% 35.2% 35.5% 28.2% 26.6% 11.3% 16.7% 15.8% 9.1% 11.4% 13.9% 15.9% Growth NA 38.1% 6.5% (26.6%) (33.8%) (48.5%) (33.9%) (33.5%) (35.9%) 40.0% 34.9% 25.5% Purchase of Fixed Assets ¥ 23,655 ¥ 87,053 ¥ 25,919 ¥ 47,327 ¥ 30,227 ¥ 32,855 ¥ 49,955 ¥ 50,000 ¥ 50,000 ¥ 75,000 ¥ 75,000 ¥ 100,000 % of Net Revenue 0.8% 2.3% 0.6% 1.3% 1.2% 1.1% 1.2% 1.1% 1.0% 1.4% 1.2% 1.5% % of EBITDA 2.3% 6.1% 1.7% 4.2% 4.1% 8.0% 6.2% 6.4% 9.4% 10.5% 8.0% 8.6% Purchase of Intangible Assets ¥ 1,987 ¥ 83,660 ¥ 8,538 ¥ 341 ¥ 240 ¥ 2,108 ¥ 2,209 ¥ 15,000 ¥ 20,000 ¥ 25,000 ¥ 30,000 ¥ 40,000 % of Net Revenue 0.1% 2.2% 0.2% 0.0% 0.0% 0.1% 0.1% 0.3% 0.4% 0.5% 0.5% 0.6% % of EBITDA 0.2% 5.9% 0.6% 0.0% 0.0% 0.5% 0.3% 1.9% 3.7% 3.5% 3.2% 3.4% Net Working Capital (1) - ¥ 1,279,318 - ¥ 1,637,567 - ¥ 1,852,580 - ¥ 1,978,059 - ¥ 1,735,963 - ¥ 1,884,907 - ¥ 1,884,907 - ¥ 2,187,654 - ¥ 2,278,902 - ¥ 2,475,930 - ¥ 2,668,338 - ¥ 2,929,872 % of Net Revenue (44.4%) (43.3%) (46.3%) (53.6%) (44.5%) (49.9%) (46.8%) (45.6%) (44.4%) (44.2%)
15 Discounted Cash Flow Analysis – Methodology and Key Assumptions Valuation Analysis Discounted Cash Flow Methodology • Duff & Phelps performed a discounted cash flow analysis of the projected unlevered free cash flows. • Unlevered free cash flow is defined as cash generated by the business that is available to either reinvest or to distribute t o s ecurity holders. • Projected free cash flows are discounted to the present using a discount rate which reflects their relative risk. • The discount rate is equivalent to the rate of return that security holders could expect to realize on alternative investment op portunities with similar risk profiles. Discounted Cash Flow Key Assumptions • Duff & Phelps utilized and relied upon the Management Projections for the fiscal years ending December 31, 2021 through 2025 (ex cluding public company expenses, as provided by the management of the Company), discussions with the management of the Company, and a re view of the Company’s historical performance and other factors to develop the DCF analysis. • Beyond the projection period, Duff & Phelps estimated the “terminal value” using a perpetuity formula. • Duff & Phelps discounted the resulting free cash flows and terminal value using a weighted average cost of capital range of 1 0.0 % to 12.0%, derived from the Capital Asset Pricing Model. • The following is a summary of the Management Projections utilized in the discounted cash flow analysis: – Net revenue increases at a compound annual growth rate (“ CAGR ”) of 10.8% from 2021 to 2025. – Adjusted EBITDA increases at a CAGR of 10.6% from 2021 to 2025. – Adjusted EBITDA margin averages 15.0% from 2021 to 2025. – Total purchase of fixed assets and purchases of intangible assets averages 1.7% of net revenue from 2021 to 2025. – Net working capital averages - 46.2% of net revenue from 2021 to 2025.
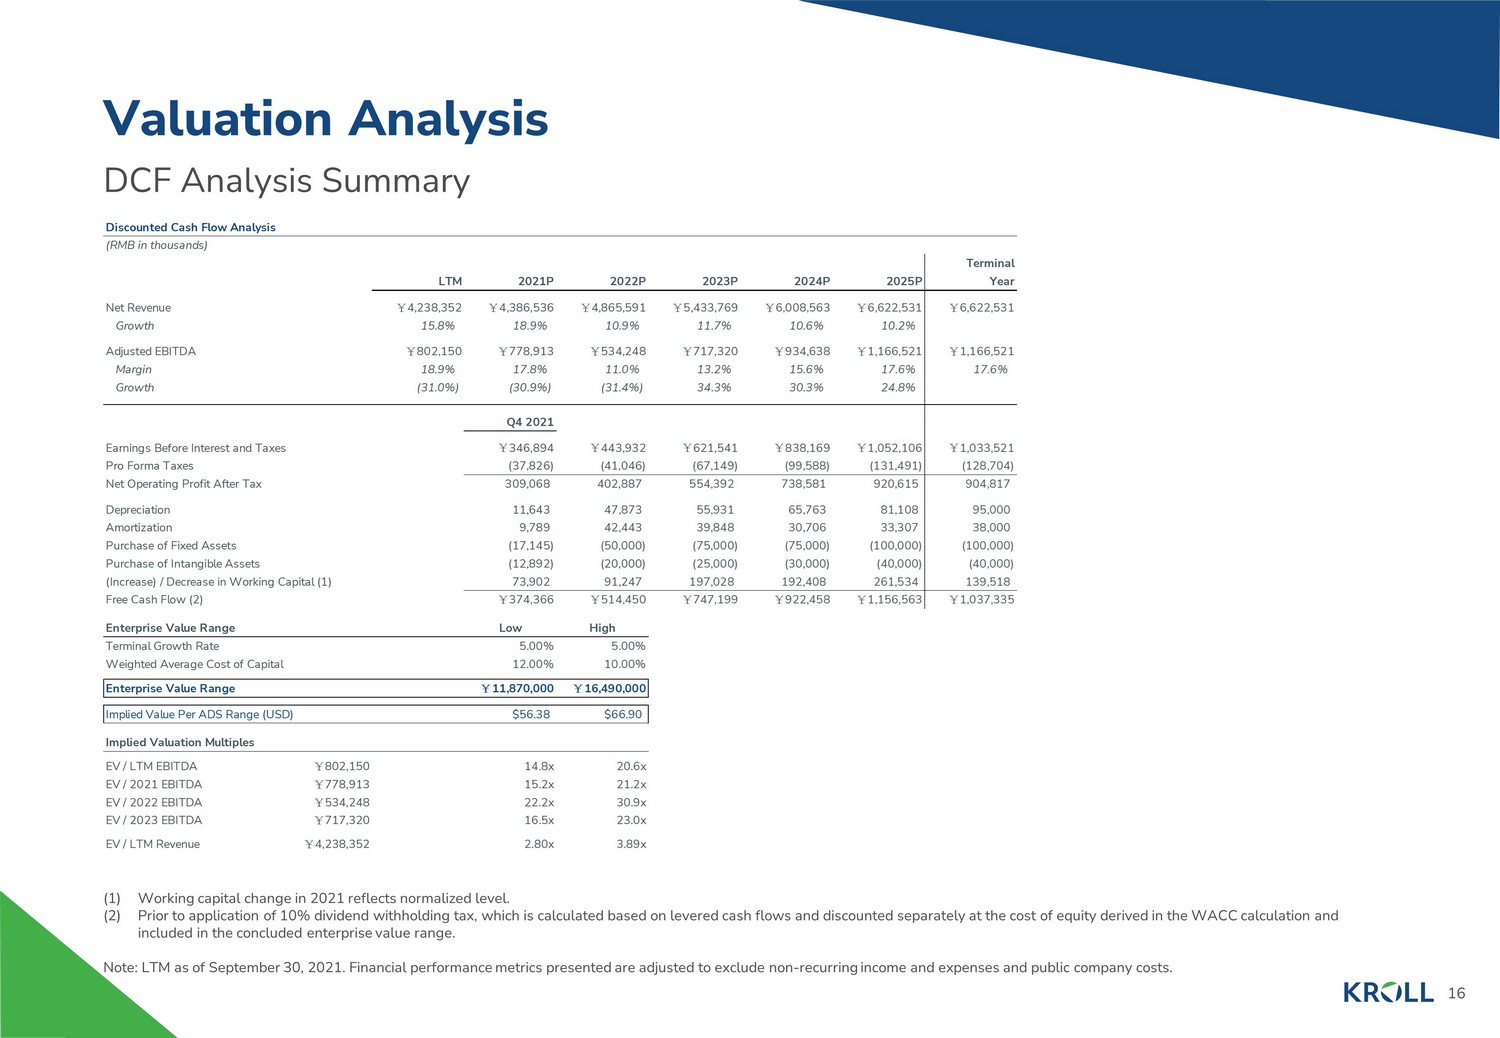
16 DCF Analysis Summary Valuation Analysis (1) Working capital change in 2021 reflects normalized level. (2) Prior to application of 10% dividend withholding tax, which is calculated based on levered cash flows and discounted separate ly at the cost of equity derived in the WACC calculation and included in the concluded enterprise value range. Note: LTM as of September 30, 2021. Financial performance metrics presented are adjusted to exclude non - recurring income and exp enses and public company costs. Discounted Cash Flow Analysis (RMB in thousands) Terminal LTM 2021P 2022P 2023P 2024P 2025P Year Net Revenue ¥ 4,238,352 ¥ 4,386,536 ¥ 4,865,591 ¥ 5,433,769 ¥ 6,008,563 ¥ 6,622,531 ¥ 6,622,531 Growth 15.8% 18.9% 10.9% 11.7% 10.6% 10.2% Adjusted EBITDA ¥ 802,150 ¥ 778,913 ¥ 534,248 ¥ 717,320 ¥ 934,638 ¥ 1,166,521 ¥ 1,166,521 Margin 18.9% 17.8% 11.0% 13.2% 15.6% 17.6% 17.6% Growth (31.0%) (30.9%) (31.4%) 34.3% 30.3% 24.8% Q4 2021 Earnings Before Interest and Taxes ¥ 346,894 ¥ 443,932 ¥ 621,541 ¥ 838,169 ¥ 1,052,106 ¥ 1,033,521 Pro Forma Taxes (37,826) (41,046) (67,149) (99,588) (131,491) (128,704) Net Operating Profit After Tax 309,068 402,887 554,392 738,581 920,615 904,817 Depreciation 11,643 47,873 55,931 65,763 81,108 95,000 Amortization 9,789 42,443 39,848 30,706 33,307 38,000 Purchase of Fixed Assets (17,145) (50,000) (75,000) (75,000) (100,000) (100,000) Purchase of Intangible Assets (12,892) (20,000) (25,000) (30,000) (40,000) (40,000) (Increase) / Decrease in Working Capital (1) 73,902 91,247 197,028 192,408 261,534 139,518 Free Cash Flow (2) ¥ 374,366 ¥ 514,450 ¥ 747,199 ¥ 922,458 ¥ 1,156,563 ¥ 1,037,335 Enterprise Value Range Low High Terminal Growth Rate 5.00% 5.00% Weighted Average Cost of Capital 12.00% 10.00% Enterprise Value Range ¥ 11,870,000 ¥ 16,490,000 Implied Value Per ADS Range (USD) $56.38 $66.90 Implied Valuation Multiples EV / LTM EBITDA ¥ 802,150 14.8x 20.6x EV / 2021 EBITDA ¥ 778,913 15.2x 21.2x EV / 2022 EBITDA ¥ 534,248 22.2x 30.9x EV / 2023 EBITDA ¥ 717,320 16.5x 23.0x EV / LTM Revenue ¥ 4,238,352 2.80x 3.89x

17 Selected Public Companies / M&A Transactions Analysis Methodology Valuation Analysis Selected Public Companies Analysis • Duff & Phelps selected seven publicly traded companies that were deemed relevant to its analysis. • Duff & Phelps analyzed the financial performance of each of the publicly traded companies. Duff & Phelps then analyzed the se lec ted public companies’ trading multiples, including enterprise value to revenue and EBITDA. Selected M&A Transactions Analysis • Duff & Phelps also reviewed certain merger and acquisition transactions involving target companies that were deemed relevant to its analysis and computed the implied valuation multiples for such transactions. Duff & Phelps analyzed a number of factors in comparing the Company to the selected public companies and the targets in the s ele cted M&A transactions, including historical and forecasted growth in revenue and profits, profit margins and other characteristics tha t w e deemed relevant. Duff & Phelps selected multiples that reflect the Company’s size, growth outlook, capital requirements, profit margins, reven ue mix, and other characteristics relative to the group. None of the companies utilized for comparative purposes in the following analysis are directly comparable to the Company, and no ne of the transactions utilized for comparative purposes in the following analysis are directly comparable to the Proposed Transaction. Du ff & Phelps does not have access to non - public information of any of the companies used for comparative purposes. Accordingly, a complete va luation analysis of the Company and the Proposed Transaction cannot rely solely upon a quantitative review of the selected companies and selected transactions, and involves complex considerations and judgments concerning differences in financial and operating characteris tic s of such companies and targets, as well as other factors that could affect their value relative to that of the Company. Therefore, the Se lected Public Companies / Selected M&A Transactions Analysis is subject to certain limitations.
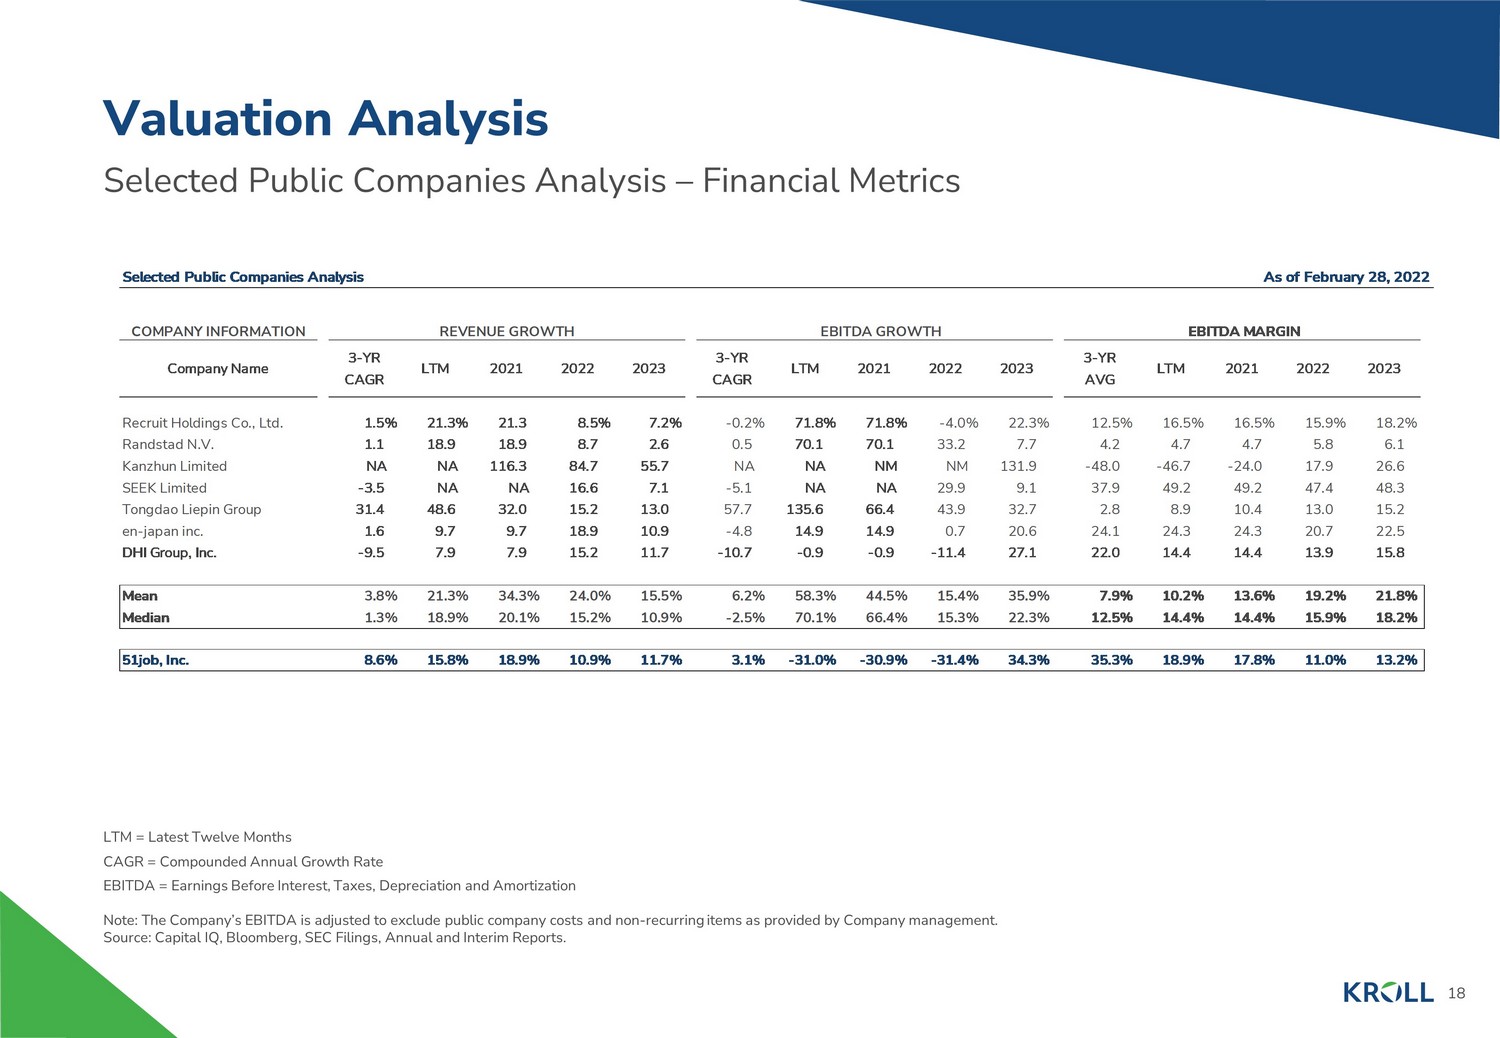
18 Selected Public Companies Analysis – Financial Metrics Valuation Analysis LTM = Latest Twelve Months CAGR = Compounded Annual Growth Rate EBITDA = Earnings Before Interest, Taxes, Depreciation and Amortization Note: The Company’s EBITDA is adjusted to exclude public company costs and non - recurring items as provided by Company management . Source: Capital IQ, Bloomberg, SEC Filings, Annual and Interim Reports. Selected Public Companies Analysis As of February 28, 2022 For Rank Charts (% of Revenue) COMPANY INFORMATION REVENUE GROWTH EBITDA GROWTH EBITDA MARGIN Company Name 3-YR CAGR LTM 2021 2022 2023 3-YR CAGR LTM 2021 2022 2023 3-YR AVG LTM 2021 2022 2023 Recruit Holdings Co., Ltd. 1.5% 21.3% 21.3 8.5% 7.2% -0.2% 71.8% 71.8% -4.0% 22.3% 12.5% 16.5% 16.5% 15.9% 18.2% Randstad N.V. 1.1 18.9 18.9 8.7 2.6 0.5 70.1 70.1 33.2 7.7 4.2 4.7 4.7 5.8 6.1 Kanzhun Limited NA NA 116.3 84.7 55.7 NA NA NM NM 131.9 -48.0 -46.7 -24.0 17.9 26.6 SEEK Limited -3.5 NA NA 16.6 7.1 -5.1 NA NA 29.9 9.1 37.9 49.2 49.2 47.4 48.3 Tongdao Liepin Group 31.4 48.6 32.0 15.2 13.0 57.7 135.6 66.4 43.9 32.7 2.8 8.9 10.4 13.0 15.2 en-japan inc. 1.6 9.7 9.7 18.9 10.9 -4.8 14.9 14.9 0.7 20.6 24.1 24.3 24.3 20.7 22.5 DHI Group, Inc. -9.5 7.9 7.9 15.2 11.7 -10.7 -0.9 -0.9 -11.4 27.1 22.0 14.4 14.4 13.9 15.8 Mean 3.8% 21.3% 34.3% 24.0% 15.5% 6.2% 58.3% 44.5% 15.4% 35.9% 7.9% 10.2% 13.6% 19.2% 21.8% Median 1.3% 18.9% 20.1% 15.2% 10.9% -2.5% 70.1% 66.4% 15.3% 22.3% 12.5% 14.4% 14.4% 15.9% 18.2% 51job, Inc. 8.6% 15.8% 18.9% 10.9% 11.7% 3.1% -31.0% -30.9% -31.4% 34.3% 35.3% 18.9% 17.8% 11.0% 13.2%

19 Selected Public Companies Analysis – Valuation Multiples Valuation Analysis LTM = Latest Twelve Months EBITDA = Earnings Before Interest, Taxes, Depreciation and Amortization Enterprise Value = [Market Capitalization + Management Equity + Debt + Finance Leases + Operating Leases (for IFRS/non - US GAAP c ompanies only) + Preferred Stock + Non - Controlling Interest] - [Cash & Equivalents + Long - Term Investments + Net Non - Operating Assets] Source: Capital IQ, Bloomberg, SEC Filings, Annual and Interim Reports. Selected Public Companies Analysis As of February 28, 2022 (US$ in millions, except per share data) COMPANY INFORMATION MARKET DATA ENTERPRISE VALUE AS MULTIPLE OF Company Name Common Stock Price (Primary) on 2/28/2022 % of 52- Week High Market Capitalization Enterprise Value LTM EBITDA 2021 EBITDA 2022 EBITDA 2023 EBITDA LTM Revenue Recruit Holdings Co., Ltd. $41.80 58.9% $68,312 $62,239 14.6x 14.6x 13.7x 11.3x 2.63x Randstad N.V. 68.16 89.9 12,478 13,073 8.7 8.7 7.5 7.0 0.47 Kanzhun Limited 32.30 71.8 12,918 12,736 NM NM NM 25.0 21.07 SEEK Limited 19.36 73.9 6,841 7,347 21.0 21.0 19.2 17.6 10.64 Tongdao Liepin Group 2.41 66.2 1,259 913 21.6 18.2 13.2 10.2 2.32 en-japan inc. 26.11 62.4 1,173 839 7.8 7.8 7.7 6.4 1.91 DHI Group, Inc. 5.66 85.5 263 275 15.9 15.9 14.4 11.3 2.30 Mean 72.7% $14,749 $13,918 14.9x 14.4x 12.6x 12.7x 5.91x Median 71.8% $6,841 $7,347 15.2x 15.2x 13.4x 11.3x 2.32x
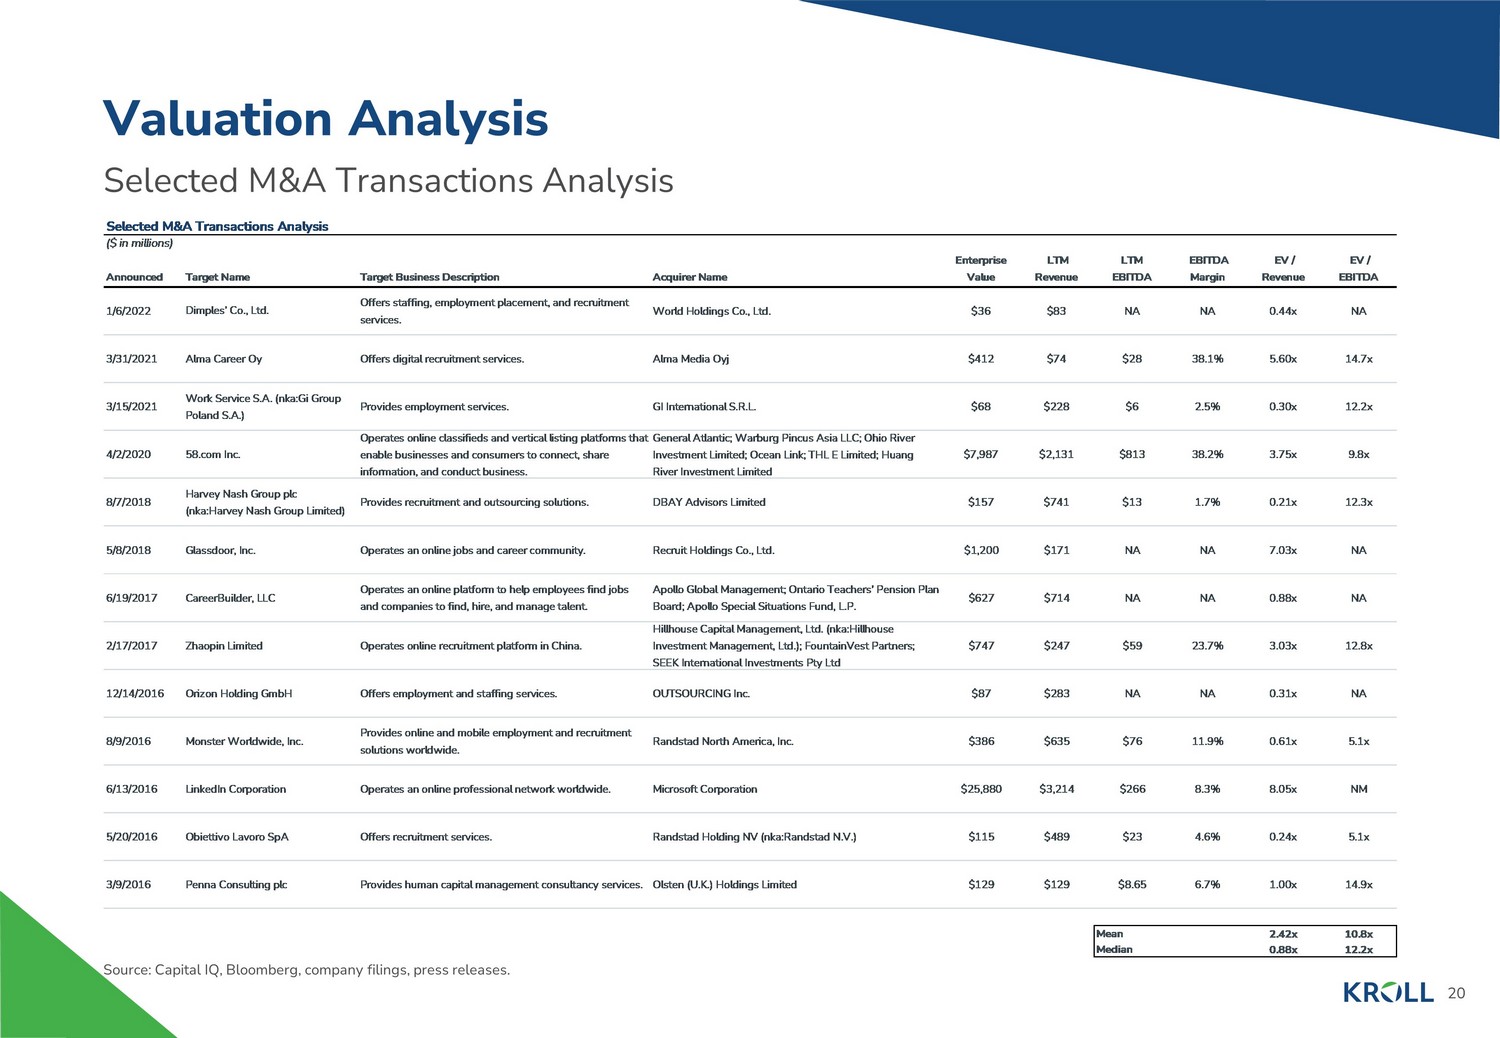
20 Selected M&A Transactions Analysis Valuation Analysis Source: Capital IQ, Bloomberg, company filings, press releases. Selected M&A Transactions Analysis ($ in millions) Announced Target Name Target Business Description Acquirer Name Enterprise Value LTM Revenue LTM EBITDA EBITDA Margin EV / Revenue EV / EBITDA 1/6/2022 Dimples’ Co., Ltd. Offers staffing, employment placement, and recruitment services. World Holdings Co., Ltd. $36 $83 NA NA 0.44x NA 3/31/2021 Alma Career Oy Offers digital recruitment services. Alma Media Oyj $412 $74 $28 38.1% 5.60x 14.7x 3/15/2021 Work Service S.A. (nka:Gi Group Poland S.A.) Provides employment services. GI International S.R.L. $68 $228 $6 2.5% 0.30x 12.2x 4/2/2020 58.com Inc. Operates online classifieds and vertical listing platforms that enable businesses and consumers to connect, share information, and conduct business. General Atlantic; Warburg Pincus Asia LLC; Ohio River Investment Limited; Ocean Link; THL E Limited; Huang River Investment Limited $7,987 $2,131 $813 38.2% 3.75x 9.8x 8/7/2018 Harvey Nash Group plc (nka:Harvey Nash Group Limited) Provides recruitment and outsourcing solutions. DBAY Advisors Limited $157 $741 $13 1.7% 0.21x 12.3x 5/8/2018 Glassdoor, Inc. Operates an online jobs and career community. Recruit Holdings Co., Ltd. $1,200 $171 NA NA 7.03x NA 6/19/2017 CareerBuilder, LLC Operates an online platform to help employees find jobs and companies to find, hire, and manage talent. Apollo Global Management; Ontario Teachers' Pension Plan Board; Apollo Special Situations Fund, L.P. $627 $714 NA NA 0.88x NA 2/17/2017 Zhaopin Limited Operates online recruitment platform in China. Hillhouse Capital Management, Ltd. (nka:Hillhouse Investment Management, Ltd.); FountainVest Partners; SEEK International Investments Pty Ltd $747 $247 $59 23.7% 3.03x 12.8x 12/14/2016 Orizon Holding GmbH Offers employment and staffing services. OUTSOURCING Inc. $87 $283 NA NA 0.31x NA 8/9/2016 Monster Worldwide, Inc. Provides online and mobile employment and recruitment solutions worldwide. Randstad North America, Inc. $386 $635 $76 11.9% 0.61x 5.1x 6/13/2016 LinkedIn Corporation Operates an online professional network worldwide. Microsoft Corporation $25,880 $3,214 $266 8.3% 8.05x NM 5/20/2016 Obiettivo Lavoro SpA Offers recruitment services. Randstad Holding NV (nka:Randstad N.V.) $115 $489 $23 4.6% 0.24x 5.1x 3/9/2016 Penna Consulting plc Provides human capital management consultancy services. Olsten (U.K.) Holdings Limited $129 $129 $8.65 6.7% 1.00x 14.9x Mean 2.42x 10.8x Median 0.88x 12.2x

21 Selected Public Companies / M&A Transactions Analysis Summary Valuation Analysis Note: LTM data for the Company as of September 30, 2021. Financial performance metrics presented are adjusted to exclude non - rec urring income and expenses and public company costs. Selected Public Companies / M&A Transactions Analysis Summary (RMB in thousands) Valuation Multiples Valuation Summary Metric Public Companies Median M&A Transactions Median Selected Multiple Range Company Performance Enterprise Value Range EV / 2021 EBITDA 7.8x - 21.0x 15.2x NA 16.0x - 22.0x ¥ 778,913 ¥ 12,462,602 - ¥ 17,136,078 Enterprise Value Range ¥ 12,460,000 - ¥ 17,140,000 Implied Value Per ADS Range (USD) $57.73 $68.37 Implied Multiples EV / LTM EBITDA 7.8x - 21.6x 15.2x 12.2x ¥ 802,150 15.5x - 21.4x EV / 2021 EBITDA 7.8x - 21.0x 15.2x NA ¥ 778,913 16.0x - 22.0x EV / 2022 EBITDA 7.5x - 19.2x 13.4x NA ¥ 534,248 23.3x - 32.1x EV / 2023 EBITDA 6.4x - 25.0x 11.3x NA ¥ 717,320 17.4x - 23.9x EV / LTM Revenue 0.47x - 21.07x 2.32x 0.88x ¥ 4,238,352 2.94x - 4.04x Public Companies Range

About Kroll Kroll provides proprietary data, technology and insights to help our clients stay ahead of complex demands related to risk, g ove rnance and growth. Our solutions deliver a powerful competitive advantage, enabling faster, smarter and more sustainable decisions. With 5,000 experts around the world, we create value and imp act for our clients and communities. To learn more, visit www.kroll.com . M&A advisory, capital raising and secondary market advisory services in the United States are provided by Kroll Securities, L LC (member FINRA/SIPC). M&A advisory, capital raising and secondary market advisory services in the United Kingdom are provided by Kroll Securities Ltd., which is authorized and regulated by the Finan cia l Conduct Authority (FCA). Valuation Advisory Services in India are provided by Duff & Phelps India Private Limited under a category 1 merchant banker license issued by the Securities and Exchange Board of India. © 2022 Kroll, LLC. All rights reserved.