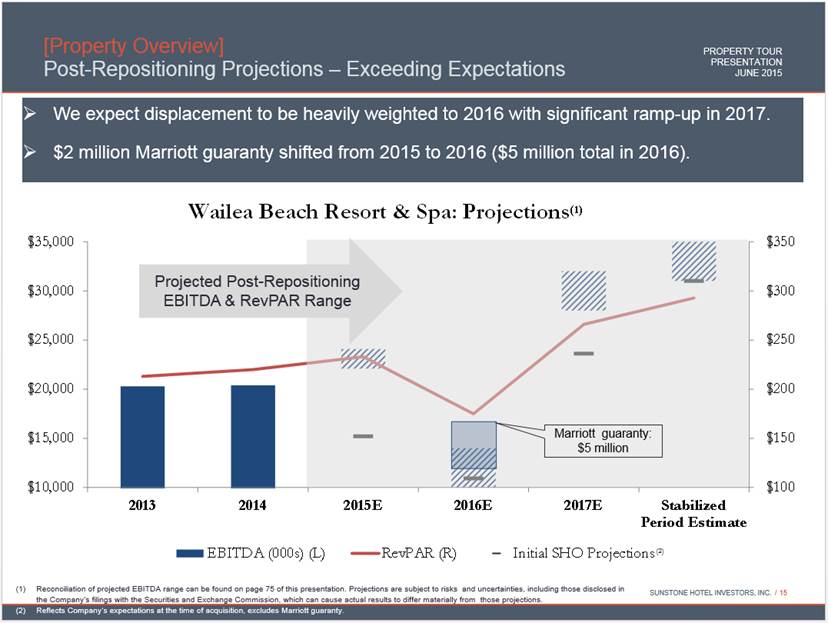
| Wailea Beach Resort & Spa [EBITDA Reconciliation] PROPERTY TOUR PRESENTATION JUNE 2015 SUNSTONE HOTEL INVESTORS, INC. 75 Plus: Equals: Hotel Less: Equals: Total Hotel EBITDA Hotel Net FFO Revenues Net Income Depreciation EBITDA Margin FF&E Reserve Operating Income Contribution Full Year 2013 (1) (2) 57,151 $ 11,757 $ 8,520 $ 20,277 $ 35.5% (2,300) $ 17,977 $ 20,277 $ Full Year 2014 (2) (3) 60,392 $ 11,535 $ 8,856 $ 20,391 $ 33.8% (2,400) $ 17,991 $ 20,391 $ 2014 EBITDA Multiple / Cap Rate (4) 16.0x 5.5% Full Year 2015 - Low 64,000 $ 13,448 $ 8,652 $ 22,100 $ 34.5% (2,600) $ 19,500 $ 22,100 $ Full Year 2015 - High 66,000 $ 15,448 $ 8,652 $ 24,100 $ 36.5% (2,600) $ 21,500 $ 24,100 $ Full Year 2016 - Low 49,000 $ (326) $ 10,326 $ 10,000 $ 20.4% (2,000) $ 8,000 $ 10,000 $ Full Year 2016 - High 53,000 $ 3,674 $ 10,326 $ 14,000 $ 26.4% (2,100) $ 11,900 $ 14,000 $ Full Year 2016 - Low with Marriott Guaranty (5) 54,000 $ 4,674 $ 10,326 $ 15,000 $ 27.8% (2,200) $ 12,800 $ 15,000 $ Full Year 2016 - High with Marriott Guaranty (5) 58,000 $ 8,674 $ 10,326 $ 19,000 $ 32.8% (2,300) $ 16,700 $ 19,000 $ Full Year 2017 - Low 72,500 $ 16,812 $ 11,188 $ 28,000 $ 38.6% (2,900) $ 25,100 $ 28,000 $ 2017 EBITDA Multiple / Cap Rate - Low (6) 14.1x 6.3% Full Year 2017 - High 76,500 $ 20,812 $ 11,188 $ 32,000 $ 41.8% (3,100) $ 28,900 $ 32,000 $ 2017 EBITDA Multiple / Cap Rate - High (6) 12.4x 7.3% Full Year Stabilized - Low 78,500 $ 19,480 $ 11,520 $ 31,000 $ 39.5% (3,100) $ 27,900 $ 31,000 $ Stabilized EBITDA Multiple / Cap Rate - Low (6) 12.8x 7.1% Full Year Stabilized - High 82,500 $ 23,480 $ 11,520 $ 35,000 $ 42.4% (3,300) $ 31,700 $ 35,000 $ Stabilized EBITDA Multiple / Cap Rate - High (6) 11.3x 8.0% (1) (2) (3) (4) (5) (6) Assumes projected 2016 Hotel EBITDA for the Wailea Beach Marriott Resort & Spa is at such a level as to trigger the Company's receipt of the entire $5.0 million performance guaranty from Marriott. Projections are subject to risks and uncertainties, including those disclosed in the Company’s filings with the Securities and Exchange Commission, which can cause actual results to differ materially from those projected. EBITDA Multiple calculated as projected Hotel EBITDA divided by projected All-in investment calculated as Net Purchase Price plus the midpoint of the projected capital investment. Cap Rate calculated as projected Hotel Net Operating Income divided by projected All-in Investment defined as Net Purchase Price plus the midpoint of the projected capital investment. Projections are subject to risks and uncertainties, including those disclosed in the Company’s filings with the Securities and Exchange Commission, which can cause actual results to differ materially from those projected. Wailea Beach Resort & Spa Property-Level EBITDA Reconciliation (Unaudited, $ in thousands) Full Year 2013 for the Wailea Beach Resort & Spa reflects prior ownership results from January 1, 2013 through December 31, 2013. Also includes the Company's pro forma adjustment for depreciation expense. EBITDA Multiple calculated as projected Hotel EBITDA divided by Net Purchase Price. Cap Rate calculated as Hotel Net Operating Income divided by Net Purchase Price. Full Year 2014 for the Wailea Beach Resort & Spa reflects prior ownership results from January 1, 2014 through July 16, 2014, plus the Company's results from July 17, 2014 through the remainder of the year. Also includes the Company's pro forma adjustment for depreciation expense. Data as provided in supplemental financial information reported on Form 8-K, furnished February 17, 2015. |