UNITED STATES
SECURITIES AND EXCHANGE COMMISSION
Washington, D.C. 20549
FORM N-CSR
CERTIFIED SHAREHOLDER REPORT OF REGISTERED
MANAGEMENT INVESTMENT COMPANIES
Investment Company Act file number 811-21606
Centaur Mutual Funds Trust
(Exact name of registrant as specified in charter)
470 Park Avenue South, 9th Floor
New York, NY 10016
(Address of principal executive offices) (Zip code)
Ultimus Fund Solutions, LLC
Attn: Zachary P. Richmond
225 Pictoria Drive, Suite 450
Cincinnati, OH 45246
(Name and address of agent for service)
Registrant’s telephone number, including area code: 1-513-587-3400
Date of fiscal year end: October 31
Date of reporting period: October 31, 2022
Form N-CSR is to be used by management investment companies to file reports with the Commission not later than 10 days after the transmission to stockholders of any report that is required to be transmitted to stockholders under Rule 30e-1 under the Investment Company Act of 1940 (17 CFR 270.30e-1). The Commission may use the information provided on Form N-CSR in its regulatory, disclosure review, inspection and policymaking roles.
A registrant is required to disclose the information specified by Form N-CSR, and the Commission will make this information public. A registrant is not required to respond to the collection of information contained in Form N-CSR unless the Form displays a currently valid Office of Management and Budget ("OMB") control number. Please direct comments concerning the accuracy of the information collection burden estimate and any suggestions for reducing the burden to Secretary, Securities and Exchange Commission, 450 Fifth Street, NW, Washington, DC 20549-0609. The OMB has reviewed this collection of information under the clearance requirements of 44 U.S.C. § 3507.
Item 1. Reports to Stockholders.
| |
| |
| |
| |
| |
| |
| |
| |
| |
| |
 |
| |
| |
| |
| |
| |
| |
| DCM/INNOVA HIGH EQUITY INCOME INNOVATION FUND |
| |
| |
| |
| |
| |
| |
| LEBENTHAL ULTRA SHORT TAX-FREE INCOME FUND |
| |
| |
| |
| |
| |
| |
| |
| |
| ANNUAL REPORT |
| |
| October 31, 2022 |
| |
| |
| |
| |
| |
| |
| |
| |
| |
| |
| |
| |
| |
| Centaur Mutual Funds Trust |
| Message from the Chief Executive Officer |
| October 31, 2022 (Unaudited) |
Dear Fellow Shareholder,
It’s better to be dependable than right.
I say this because looking back at my letter to you in last year’s Annual Report, we see that I was right about the shift from headlines dominated by COVID to ones dominated by Inflation and the Federal Reserve Board’s interest rate policy. While that proved to be the case for this past fiscal year, what should matter to us more is how well one can depend on our mutual funds to achieve their respective objectives for shareholders (of which I am one.)
In the case of our Lebenthal Ultra Short Tax-Free Income Fund (the “Lebenthal Fund”), the objective includes capital preservation. The past year included no shortage of threats to capital preservation in the bond markets, which saw declines across the board—even in the Fund’s Morningstar category of Short-Term Municipal—and yet the Lebenthal Fund preserved capital like a true fortress. The Lebenthal Fund’s NAV stability was second to none throughout the entire turbulent year. And the Lebenthal Fund produced attractive levels of tax-free income, true to its name. Personally, I will share with you that while I typically like to focus on the long-term power of equities for capital, this was a year I was reminded why I allocate a material part of my family’s capital to “boring”, low-growth cash. The Lebenthal Fund has served us all very, very well and when we needed most to depend on its stability—2022.
In the case of our DCM/INNOVA High Equity Income Innovation Fund (the “DCM/ INNOVA Fund”), it truly delivered its namesake high income from a smartly designed equity portfolio; dividend income (yield) which was five times that of its benchmark S&P 500® Total Return Index (the “S&P 500® Index”). Neither the DCM/INNOVA Fund nor the S&P 500® Index managed to escape the declines of 2022’s Bear Market. As investors, we have to always remind ourselves of the patience and fortitude required to realize the long-term effects of equities’ ability to provide above-average capital appreciation as an asset class. Not lost on us are the preceding three calendar years of returns for the S&P 500® Index, which are 28.71%, 18.40%, and 31.49% respectively. Suffice it to say, we often are taking one step backwards to go three steps forward in the equity markets.
Rather than attempt to predict what stories the markets focus on in 2023, just as I did last year (although I’m tempted to since I’m on a bit of a roll), I’ll share with you some things that are much more predictable; namely, the growth of our mutual fund lineup. Three years ago, we were offering just one mutual fund. It was called the Centaur Fund. We shaped that into a fund we thought folks would really enjoy if they were seeking attractive income from the dividends of equities. You know that Fund today as the DCM/ INNOVA High Equity Income Innovation Fund.
| Annual Report | October 31, 2022 | 1 |
| Centaur Mutual Funds Trust |
| Message from the Chief Executive Officer |
| October 31, 2022 (Unaudited) |
We also created a fund for one’s cash with my all-time favorite name for municipal bond management excellence—Lebenthal. The Lebenthal Ultra Short Tax-Free Income Fund is finally having its day in the sun. We’ve proven both during the COVID Shock of March 2020 and this year’s series of bazooka-sized Fed rate hikes just how well we can preserve capital and generate attractive, 100% tax-free income.
By the end of 2022, we are planning to announce our third mutual fund in this trust (the Centaur Mutual Funds Trust). The Copley Fund was created in 1974 and developed an admirable track record of conservative appreciation from the equities of utility companies and other low-volatility, dividend-paying equities. With the successful vote of Copley Fund shareholders, DCM Advisors, LLC becomes the Advisor to the Copley Fund and the third fund in the offering set for our shareholders. Many tax-savvy shareholders have shared their passion for the Copley Fund with me and I’m very excited by the prospects of what we can do for shareholders in 2023.
Just as shareholders have depended on our mutual funds delivering on their key objectives these past three years; just as seasoned investors have focused on the long-term strength of equity returns amidst volatile markets, you can depend on me to write more about the Copley Fund in our next report. For now, please enjoy the letters that follow from our portfolio managers and know that we thank you very much for your trust and confidence in our abilities to deliver quality, thoughtful, well-managed investment vehicles for your capital and mine.

Marc Rappaport
Chief Executive Officer
DCM Advisors
DCM/INNOVA High Equity Income Innovation Fund
Letter from the Portfolio Manager |
| October 31, 2022 (Unaudited) |
The DCM/INNOVA High Equity Income Innovation Fund’s (the “Fund’s”) fiscal year ended October 31, 2022, saw major selloffs in equity and bond markets driven by high inflation and a hawkish Federal Reserve (the “Fed”). Geopolitical considerations also affected markets adversely. While COVID faded into the background, the Russian invasion of Ukraine roiled commodity markets, and China’s strict approach to dealing with COVID exacerbated supply chain problems.
Equities’ steady fall over the course of the Fund’s fiscal year was punctuated by two sharp rallies. Despite the rallies, the S&P 500® Total Return Index (the “S&P 500 Index”) had total returns (including dividends) of -14.61%. Bonds tend to provide safety when equity markets sell off aggressively. Surprisingly, bonds experienced much worse returns than equities. The Bond market started the Fund’s fiscal year with the 10-year Government Bond yielding 1.55% and ended the Fund’s fiscal year at a yield of 4.05%. As an example of the pain of the Bond market, the iShares 20+ year Treasury Bond ETF was down greater than 33% over the course of the Fund’s fiscal year.
Inflation had started to perk up beyond the Fed’s 2% target in the second quarter of 2021. By December of 2021, inflation was running at a 7% annual headline rate, with the Fed’s preferred measure of inflation, the Personal Consumption Expenditures Price Index running at just over 5%. Initially, the Fed assumed that inflation would prove transitory, and was slow to act. When inflation appeared to be sticky even beyond the end of 2021, the Fed decided to raise rates starting in the middle of March 2022. It started with a 25 basis points raise in mid-March, followed by a 50 basis points increase in May of 2022. The following three raises, in June, July, and September, were 75 basis points each as headline inflation rose to as high as 9%.
Companies in the “old economy” sectors outperformed the broad market, while fast-growing, but money-losing companies underperformed. Only two of the 11 equity sectors, Energy and Consumer Staples, had positive total returns. The Russell 3000 Energy sector was up 57.4% as Russia’s war on Ukraine led to elevated energy prices. Defensive sectors such as Consumer Staples, which is defensive, was up 8.6%. Utilities were down 1.1% and the Health Care sector was down only 5.8%.
Higher interest rates adversely affected richly valued growth companies in sectors such as Technology, Consumer Discretionary and Communication Services. The Nasdaq Composite Index, which primarily includes growth companies, was down 28.5%. The other sector that was adversely affected by higher rates was Real Estate, with the Russell 3000 Real Estate Index down 21.2%.
| Annual Report | October 31, 2022 | 3 |
DCM/INNOVA High Equity Income Innovation Fund
Letter from the Portfolio Manager |
| October 31, 2022 (Unaudited) |
Increasing bond yields favor the value style of investing over the growth style. As a result, value style strongly outperformed the growth style with the Russell 1000 Value Index returning -7.0% compared with the -24.5% return of the Russell 1000 Growth Index. The DXY Dollar Index climbed 18.5% over the Fund’s fiscal year. This reflected the stronger economy in the U.S. compared with international economies, higher bond yields, and the fact that the Fed was raising rates more aggressively than other Central Banks. The strong dollar has been a headwind for equities, causing U.S. exports to become less competitive.
Equity markets rallied sharply from mid-June through mid-August, and then had another sharp leg down through mid-October. As a result, the Fund’s fiscal fourth quarter saw the S&P Index decline 5.9%. The S&P Index found some support at the 3,600 level and has been rallying from there. Over this period the Fund slightly lagged the S&P 500 Index with a return of -6.6%. Over the Fund’s fiscal year ended October 31, 2022, the Fund lagged the S&P 500 Index with returns of -23.57% compared with the Fund’s benchmark the S&P 500® Total Return Index returns of -14.61%.
Corporate earnings and revenues have held up better than what we expected from the increases in bond yields, the weaker GDP growth numbers in Q1 and Q2 of 2022, and increased volatility in equity and bond markets. At the beginning of the Fund’s fiscal year, in early November 2021 the Bloomberg forecast for earnings growth for the S&P 500 Index for 2022 was 7.4%. Towards the end of the Fund’s fiscal year ended October 31, 2022, the forecast for 2022 was up slightly at 8.4%. Revenue forecasts for calendar year 2022 were up from 8.1% in November 2021 to 11.3% in October 2022.
We have positioned the Fund to perform broadly in-line with the S&P Index over the long run but with a dividend yield that is three to four times as high as the S&P 500® Index dividend yield utilizing a proprietary process. During the fourth fiscal quarter, the Fund realized an annualized dividend yield of 4.76%, and a trailing 12-month yield of 10.16%. We believe the Fund is poised to provide S&P 500-like returns with a much higher dividend yield than this popular index going forward.

Vijay Chopra, PhD, CFA
Portfolio Manager
Lebenthal Ultra Short Tax-Free Income Fund
Letter from the Portfolio Manager |
| October 31, 2022 (Unaudited) |
In plain English, the past year has been a difficult one for the municipal market and fixed income markets overall. We have moved from the seemingly intractable low-rate environment to some of the highest rates seen in a decade, punctuated with outsized rate hikes from the Federal Reserve (the “Fed”). Municipal bonds overall returned a disappointing -11.98%, only to be eclipsed by treasuries -14.09% and U.S. Corporates -19.57%. Closer to home, the short end of the municipal market too fared poorly, returning a -2.19% return for the Bloomberg 1 Year Municipal Bond Index for the 1-year period ended October 31, 2022.
Trading and managing municipal bonds this year was a challenge, as there were periods of both volatility and “head-fakes” as investors tried to gauge the seriousness of the Fed’s response to inflation, and ultimately make a guess on what effect the series of large, constant rate-hikes would have on the economy going forward.
At the start of the fiscal year, we were coming out of the Pandemic, and we were evaluating the disparate potential of renewed shutdowns caused by Omicron and increasing inflation. These competing forces kept municipal rates largely unchanged and somewhat positive. But as the headline risk of Omicron faded going into calendar year 2022, the markets focused fully and entirely on the Fed’s fight against inflation.
The rest of this annual period has been marked by a recurring theme, and the volatility from that theme creating potential pitfalls for investors. In short, the Fed has tried to maintain an open and transparent dialogue - detailing exactly what they are looking to achieve, what they are focused on, and how they plan on getting there. The market’s response was to attempt to out-guess the Fed. And that attempt failed. This led to the repeat cycles of scrambling to buy bonds and pushing rates down – May and July 2022 – and capitulation – June, August and October – as inflation numbers remained high and the Fed committed to its series of large 75 basis points hikes in June, July, and September.
During this period, both Marc and I have been focused on two things: maintaining price stability and capturing the increasing yield provided by the Fed’s rate hikes. As fixed coupon bonds matured in the Lebenthal Ultra Short Tax-Free Income Fund (the “Fund”), we looked to increase the Variable Rate Demand Note allocation. This allocation increased from approximately 36% of holdings to 82%. That has provided the Fund a bulwark against price volatility caused by hikes and allowed the Fund to maintain its objective of capital preservation with de minimis NAV volatility. The remaining Fund assets were invested judiciously in very short maturity assets to capture incrementally increased yields without exposing the Fund to substantially increased duration. We sought to be consistent to this dual mandate especially during volatile periods, and not try to outsmart ourselves or fight the Fed.
| Annual Report | October 31, 2022 | 5 |
Lebenthal Ultra Short Tax-Free Income Fund
Letter from the Portfolio Manager |
| October 31, 2022 (Unaudited) |
We feel that the Fund has performed admirably over the course of the year. The Fund managed to provide stability with only a brief, 1–penny (one–tenth of one percent) move in its stable $10 NAV price. For the fiscal year ended October 31, 2022, the Fund has increased its 7-day tax-free yield from almost zero yield to over 2%. The Fund’s Class I Shares provided a positive return of 0.57% (to shareholders) whereas the Fund’s primary benchmark, the Bloomberg 1 Year Municipal Bond Index returned -2.19%.

Robert Morgan
Portfolio Manager
| Centaur Mutual Funds Trust |
| Important Disclosures |
| October 31, 2022 (Unaudited) |
Past performance is not predictive of future performance. Investment results and principal value will fluctuate so that shares, when redeemed, may be worth more or less than their original cost. Current performance may be higher or lower than the performance data quoted. Performance data current to the most recent month end are available by calling 1-888-484-5766.
An investor should consider the investment objectives, risks, charges and expenses of the Funds carefully before investing. The Funds’ prospectus contains this and other important information. To obtain a copy of the Funds’ prospectus please visit the Funds’ website at http://www.dcmmutualfunds.com or call 1-888-484-5766 and a copy will be sent to you free of charge. Please read the prospectus carefully before you invest. The Funds are distributed by Ultimus Fund Distributors, LLC.
The Letters from the Portfolio Managers seek to describe some of the investment advisor’s current opinions and views of the financial markets. Although the investment advisor believes it has a reasonable basis for any opinions or views expressed, actual results may differ, sometimes significantly so, from those expected or expressed. The securities held by the Funds that are discussed in the Letters from the Portfolio Managers were held during the period covered by this annual report. They do not comprise the entire investment portfolio of the Funds, may be sold at any time and may no longer be held by the Funds. For a complete list of securities held by the Funds as of October 31, 2022, please see the Schedules of Investments sections of this annual report. The opinions of DCM Advisors, LLC with respect to those securities may change at any time.
Statements in the Letters from the Portfolio Managers that reflect projections or expectations for future financial or economic performance of the Funds and the market in general and statements of the Funds’ plans and objectives for future operations are forward-looking statements. No assurance can be given that actual results or events will not differ materially from those projected, estimated, assumed, or anticipated in any such forward-looking statements. Important factors that could result in such differences, in addition to factors noted with such forward-looking statements, include, without limitation, general economic conditions, such as inflation, recession, and interest rates. Past performance is not a guarantee of future results.
| Annual Report | October 31, 2022 | 7 |
DCM/INNOVA High Equity Income Innovation Fund
Performance Update |
| October 31, 2022 (Unaudited) |
Growth of $10,000 Investment
For the period from October 31, 2012 to October 31, 2022:
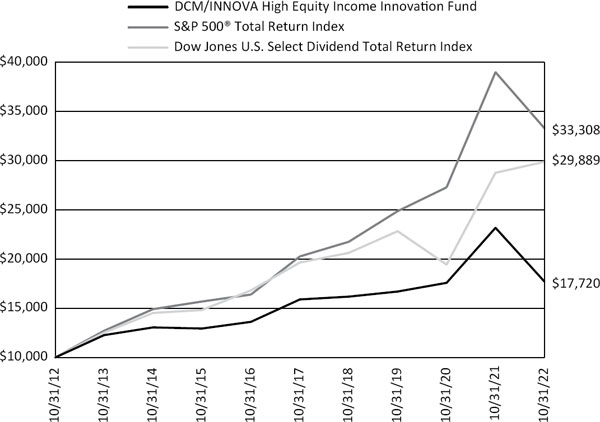
This graph assumes an initial $10,000 investment made on October 31, 2012 and held through October 31, 2022. All dividends and distributions are reinvested, if any. This graph depicts the performance of the DCM/INNOVA High Equity Income Innovation Fund (the “DCM/INNOVA Fund”) versus the S&P 500® Total Return Index and the Dow Jones U.S. Select Dividend Total Return Index. It is important to note that the DCM/INNOVA Fund is a professionally managed mutual fund while the indices are not available for investment and are unmanaged. The comparison is shown for illustrative purposes only.
DCM/INNOVA High Equity Income Innovation Fund
Performance Update |
| October 31, 2022 (Unaudited) |
Average Annual Total Returns for the years ended October 31, 2022*
| | One | Five | Ten | Since |
| | Year | Year | Year | Inception(a) |
| DCM/INNOVA High Equity Income Innovation Fund | -23.57% | 2.19% | 5.89% | 7.09% |
| S&P 500® Total Return Index(b) | -14.61% | 10.44% | 12.79% | 9.10% |
| Dow Jones U.S. Select Dividend Total Return Index(c) | 3.87% | 8.75% | 11.57% | 8.22% |
| | | | | |
| | | | | Expense |
| | | | | Ratios(d) |
| Gross | | | | 2.39% |
| With Applicable Waivers | | | | 1.54% |
The performance quoted represents past performance, which does not guarantee future results. The investment return and principal value of an investment will fluctuate so that an investor’s shares, when redeemed, may be worth more or less than their original cost. The returns shown do not reflect the deduction of taxes that a shareholder would pay on the DCM/INNOVA High Equity Income Innovation Fund (the “DCM/INNOVA Fund”) distributions or the redemption of shares. Current performance may be lower or higher than the performance quoted. Performance data current to the most recent month end may be obtained by calling (888) 484-5766.
| * | Return figures reflect any change in price per share and assume the reinvestment of all distributions. The DCM/INNOVA Fund’s returns reflect any fee reductions during the applicable period. If such fee reductions had not occurred, the quoted performances would have been lower. |
| (a) | The DCM/INNOVA Fund’s inception date – March 16, 2005 (Date of Initial Public Investment). |
| (b) | The S&P 500® Total Return Index is a widely recognized unmanaged index of equity securities and is representative of a broader domestic equity market and range of securities than is found in the DCM/ INNOVA Fund’s portfolio. |
| (c) | The Dow Jones U.S. Select Dividend Total Return Index consists of 100 of the highest dividend-yielding securities (excluding Real Estate Investment Trusts (REITs)) in the Dow Jones U.S. Index, a broad-based index representative of the total market for the United States equity securities. Individuals cannot invest directly in an index; however, an individual can invest in exchange-traded funds or other investment vehicles that attempt to track the performance of a benchmark index. |
| (d) | The expense ratios shown are from the DCM/INNOVA Fund’s prospectus dated February 28, 2022. Additional information pertaining to the expense ratios as of October 31, 2022 can be found in the financial highlights. |
An investor should consider the investment objectives, risks, charges and expenses of the Fund carefully before investing. The DCM/INNOVA Fund’s prospectus contains this and other important information. To obtain a copy of the Fund’s prospectus please visit our website at http://www.dcmmutualfunds.com or call (888) 484-5766 and a copy will be sent to you free of charge. Please read the prospectus carefully before you invest.
The DCM/INNOVA Fund is distributed by Ultimus Fund Distributors, LLC., Member FINRA/SIPC.
| Annual Report | October 31, 2022 | 9 |
Lebenthal Ultra Short Tax-Free Income Fund
Performance Update |
| October 31, 2022 (Unaudited) |
Growth of $250,000 Investment
For the period from December 30, 2019 (inception date) to October 31, 2022:
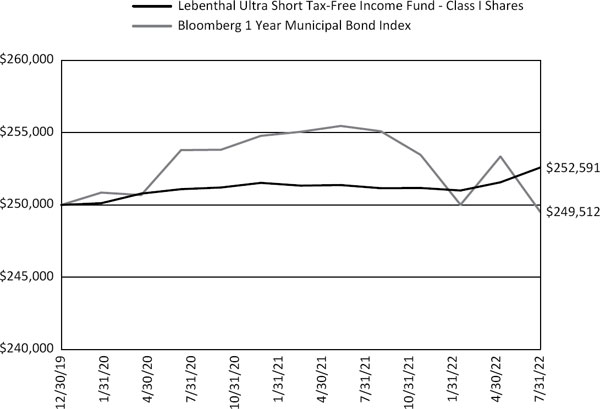
This graph assumes an initial $250,000 investment on December 30, 2019, the inception date of the Lebenthal Ultra Short Tax-Free Income Fund (the “Lebenthal Fund”) and held through October 31, 2022. All dividends and distributions are reinvested, if any. This graph depicts the performance of the Lebenthal Fund versus the Bloomberg 1 Year Municipal Bond Index. It is important to note that the Lebenthal Fund is a professionally managed mutual fund while the indices are not available for investment and are unmanaged. The comparison is shown for illustrative purposes only.
Lebenthal Ultra Short Tax-Free Income Fund
Performance Update |
| October 31, 2022 (Unaudited) |
Performance Returns for the periods ended October 31, 2022*
| | | Since |
| | One Year | Inception(a) |
| Lebenthal Ultra Short Tax-Free Income Fund - Class I Shares | 0.57% | 0.36% |
| Lebenthal Ultra Short Tax-Free Income Fund - Class A Shares (Without Load) | 0.30% | 0.12% |
| Lebenthal Ultra Short Tax-Free Income Fund - Class A Shares (With Load) | -0.20% | -0.05% |
| Bloomberg 1 Year Municipal Bond Index(b) | -2.19% | -0.07% |
| | | |
| | Expense Ratios(c) |
| | Class A Shares | Class I Shares |
| Gross | 3.35% | 3.10% |
| With Applicable Waivers | 0.74% | 0.49% |
The performance quoted represents past performance, which does not guarantee future results. The investment return and principal value of an investment will fluctuate so that an investor’s shares, when redeemed, may be worth more or less than their original cost. The returns shown do not reflect the deduction of taxes that a shareholder would pay on the Lebenthal Ultra Short Tax-Free Income Fund (the ” Lebenthal Fund”) distributions or the redemption of shares. Current performance may be lower or higher than the performance quoted. In the case of investments at or above $250,000, a contingent deferred sales charge (CDSC) of up to 0.25% may be charged on Class A shares redeemed within 12 months of purchase if you paid no sales charge on the original purchase and a finder’s fee was paid. Performance data current to the most recent month end may be obtained by calling (888) 484-5766.
| * | Return figures reflect any change in price per share and assume the reinvestment of all distributions. The Lebenthal Fund’s returns reflect any fee reductions during the applicable period. If such fee reductions had not occurred, the quoted performances would have been lower. |
| (a) | The Lebenthal Fund’s inception date – December 30, 2019 (Date of Initial Public Investment). |
| (b) | The Bloomberg 1 Year Municipal Bond Index is an unmanaged index of municipal bonds with a remaining maturity of one to two years. Individuals cannot invest directly in an index; however, an individual can invest in exchange-traded funds or other investment vehicles that attempt to track the performance of a benchmark index. |
| (c) | The expense ratios shown are from the Lebenthal Fund’s prospectus dated February 28, 2022. Additional information pertaining to the expense ratios as of October 31, 2022 can be found in the financial highlights. |
An investor should consider the investment objectives, risks, charges and expenses of the Fund carefully before investing. The Fund’s prospectus contains this and other important information. To obtain a copy of the Fund’s prospectus please visit our website at http://www.dcmmutualfunds.com or call (888) 484-5766 and a copy will be sent to you free of charge. Please read the prospectus carefully before you invest.
The Lebenthal Fund is distributed by Ultimus Fund Distributors, LLC., Member FINRA/SIPC.
| Annual Report | October 31, 2022 | 11 |
| DCM/INNOVA High Equity Income Innovation Fund |
| Schedule of Investments |
| October 31, 2022 |
| | | Shares | | | Fair Value | |
| COMMON STOCKS — 93.06% | | | | | | | | |
| | | | | | | | | |
| Communications — 6.89% | | | | | | | | |
| Activision Blizzard, Inc. | | | 170 | | | $ | 12,376 | |
| Alphabet, Inc., Class C(a) | | | 1,528 | | | | 144,640 | |
| Alphabet, Inc., Class A(a) | | | 1,876 | | | | 177,300 | |
| AT&T, Inc. | | | 3,433 | | | | 62,584 | |
| Charter Communications, Inc., Class A (a) | | | 23 | | | | 8,455 | |
| Comcast Corp., Class A | | | 1,017 | | | | 32,280 | |
| DISH Network Corp., Class A(a) | | | 48 | | | | 716 | |
| Electronic Arts, Inc. | | | 48 | | | | 6,046 | |
| Expedia Group, Inc.(a) | | | 9 | | | | 841 | |
| Fox Corp., Class B | | | 81 | | | | 2,203 | |
| Fox Corp., Class A | | | 66 | | | | 1,905 | |
| Interpublic Group of Cos., Inc. | | | 114 | | | | 3,396 | |
| Lumen Technologies, Inc. | | | 124 | | | | 913 | |
| Match Group, Inc.(a) | | | 44 | | | | 1,901 | |
| Meta Platforms, Inc., Class A(a) | | | 736 | | | | 68,566 | |
| Netflix, Inc. (a) | | | 100 | | | | 29,188 | |
| News Corp., Class A | | | 69 | | | | 1,164 | |
| News Corp., Class B | | | 79 | | | | 1,353 | |
| Omnicom Group, Inc. | | | 41 | | | | 2,983 | |
| Take-Two Interactive Software, Inc. (a) | | | 46 | | | | 5,450 | |
| T-Mobile US, Inc.(a) | | | 141 | | | | 21,370 | |
| VeriSign, Inc.(a) | | | 22 | | | | 4,410 | |
| Verizon Communications, Inc. | | | 958 | | | | 35,800 | |
| ViacomCBS, Inc., Class B | | | 162 | | | | 2,968 | |
| Walt Disney Co. (The)(a) | | | 395 | | | | 42,084 | |
| Warner Bros. Discovery, Inc.(a) | | | 483 | | | | 6,279 | |
| | | | | | | | 677,171 | |
| Consumer Discretionary — 9.39% | | | | | | | | |
| Advance Auto Parts, Inc. | | | 5 | | | | 950 | |
| Amazon.com, Inc.(a) | | | 2,616 | | | | 267,984 | |
| Aptiv PLC(a) | | | 56 | | | | 5,100 | |
| AutoZone, Inc.(a) | | | 4 | | | | 10,132 | |
| Bath & Body Works, Inc. | | | 1 | | | | 33 | |
| Best Buy Co., Inc. | | | 52 | | | | 3,557 | |
| Booking Holdings, Inc.(a) | | | 11 | | | | 20,564 | |
| BorgWarner, Inc. | | | 143 | | | | 5,367 | |
| Caesars Entertainment, Inc.(a) | | | 119 | | | | 5,204 | |
| CarMax, Inc.(a) | | | 23 | | | | 1,449 | |
| Carnival Corp.(a) | | | 75 | | | | 680 | |
| See Notes to Financial Statements |
| 12 | www.dcmmutualfunds.com |
| DCM/INNOVA High Equity Income Innovation Fund |
| Schedule of Investments |
| October 31, 2022 |
| | | Shares | | | Fair Value | |
| COMMON STOCKS — 93.06% (CONTINUED) | | | | | | | | |
| | | | | | | | | |
| Consumer Discretionary — 9.39% (Continued) | | | | | | | | |
| Chipotle Mexican Grill, Inc.(a) | | | 6 | | | $ | 8,990 | |
| Copart, Inc.(a) | | | 80 | | | | 9,201 | |
| D.R. Horton, Inc. | | | 127 | | | | 9,763 | |
| Darden Restaurants, Inc. | | | 27 | | | | 3,865 | |
| Domino’s Pizza, Inc. | | | 12 | | | | 3,987 | |
| eBay, Inc. | | | 116 | | | | 4,621 | |
| Etsy, Inc.(a) | | | 32 | | | | 3,005 | |
| Ford Motor Co. | | | 816 | | | | 10,910 | |
| Fortune Brands Home & Security, Inc. | | | 21 | | | | 1,267 | |
| General Motors Co. | | | 345 | | | | 13,541 | |
| Genuine Parts Co. | | | 6 | | | | 1,067 | |
| Hasbro, Inc. | | | 21 | | | | 1,370 | |
| Hilton Worldwide Holdings, Inc. | | | 285 | | | | 38,548 | |
| Home Depot, Inc. (The) | | | 358 | | | | 106,016 | |
| Las Vegas Sands Corp.(a) | | | 96 | | | | 3,649 | |
| Lennar Corp., Class A | | | 63 | | | | 5,084 | |
| Live Nation Entertainment, Inc. (a) | | | 12 | | | | 955 | |
| LKQ Corp. | | | 23 | | | | 1,280 | |
| Lowe’s Cos, Inc. | | | 154 | | | | 30,022 | |
| Marriott International, Inc., Class A | | | 50 | | | | 8,006 | |
| Masco Corp. | | | 2 | | | | 93 | |
| McDonald’s Corp. | | | 157 | | | | 42,807 | |
| MGM Resorts International | | | 112 | | | | 3,984 | |
| Newell Brands, Inc. | | | 2 | | | | 28 | |
| NIKE, Inc., Class B | | | 294 | | | | 27,248 | |
| Norwegian Cruise Lines Holdings Ltd.(a) | | | 22 | | | | 372 | |
| NVR, Inc.(a) | | | 1 | | | | 4,238 | |
| O’Reilly Automotive, Inc. (a) | | | 13 | | | | 10,883 | |
| Penn National Gaming, Inc. (a) | | | 52 | | | | 1,721 | |
| Pool Corp. | | | 13 | | | | 3,955 | |
| PulteGroup, Inc. | | | 76 | | | | 3,039 | |
| PVH Corp. | | | 5 | | | | 257 | |
| Ralph Lauren Corp. | | | 2 | | | | 185 | |
| Ross Stores, Inc. | | | 61 | | | | 5,837 | |
| Royal Caribbean Cruises Ltd.(a) | | | 45 | | | | 2,402 | |
| Starbucks Corp. | | | 252 | | | | 21,821 | |
| Tapestry, Inc. | | | 44 | | | | 1,394 | |
| Tesla, Inc.(a) | | | 729 | | | | 165,877 | |
| TJX Cos., Inc. (The) | | | 239 | | | | 17,232 | |
| See Notes to Financial Statements |
| Annual Report | October 31, 2022 | 13 |
| DCM/INNOVA High Equity Income Innovation Fund |
| Schedule of Investments |
| October 31, 2022 |
| | | Shares | | | Fair Value | |
| COMMON STOCKS — 93.06% (CONTINUED) | | | | | | | | |
| | | | | | | | | |
| Consumer Discretionary — 9.39% (Continued) | | | | | | | | |
| Tractor Supply Co. | | | 33 | | | $ | 7,252 | |
| Ulta Beauty, Inc.(a) | | | 12 | | | | 5,032 | |
| VF Corp. | | | 72 | | | | 2,034 | |
| Whirlpool Corp. | | | 3 | | | | 414 | |
| Wynn Resorts Ltd.(a) | | | 31 | | | | 1,981 | |
| Yum! Brands, Inc. | | | 57 | | | | 6,740 | |
| | | | | | | | 922,993 | |
| Consumer Staples — 6.43% | | | | | | | | |
| Altria Group, Inc. | | | 364 | | | | 16,842 | |
| Archer-Daniels-Midland Co. | | | 116 | | | | 11,250 | |
| Brown-Forman Corp., Class B | | | 40 | | | | 2,720 | |
| Campbell Soup Co. | | | 42 | | | | 2,222 | |
| Church & Dwight Co., Inc. | | | 53 | | | | 3,929 | |
| Clorox Co. (The) | | | 23 | | | | 3,359 | |
| Coca-Cola Co. (The) | | | 869 | | | | 52,010 | |
| Colgate-Palmolive Co. | | | 199 | | | | 14,694 | |
| Conagra Brands, Inc. | | | 169 | | | | 6,202 | |
| Constellation Brands, Inc., Class A | | | 23 | | | | 5,683 | |
| Costco Wholesale Corp. | | | 147 | | | | 73,720 | |
| Dollar General Corp. | | | 62 | | | | 15,813 | |
| Dollar Tree, Inc.(a) | | | 45 | | | | 7,133 | |
| Estee Lauder Cos., Inc. (The), Class A | | | 53 | | | | 10,626 | |
| General Mills, Inc. | | | 864 | | | | 70,486 | |
| Hershey Co. (The) | | | 38 | | | | 9,073 | |
| Hormel Foods Corp. | | | 85 | | | | 3,948 | |
| J.M. Smucker Co. (The) | | | 17 | | | | 2,561 | |
| Kellogg Co. | | | 54 | | | | 4,148 | |
| Keurig Dr Pepper, Inc. | | | 256 | | | | 9,943 | |
| Kimberly-Clark Corp. | | | 78 | | | | 9,708 | |
| Kraft Heinz Co. (The) | | | 104 | | | | 4,001 | |
| Kroger Co. (The) | | | 145 | | | | 6,857 | |
| Lamb Weston Holdings, Inc. | | | 18 | | | | 1,552 | |
| McCormick & Co., Inc. | | | 50 | | | | 3,932 | |
| Molson Coors Brewing Co., Class B | | | 17 | | | | 857 | |
| Mondelez International, Inc., Class A | | | 288 | | | | 17,706 | |
| Monster Beverage Corp.(a) | | | 110 | | | | 10,309 | |
| PepsiCo, Inc. | | | 318 | | | | 57,742 | |
| Philip Morris International, Inc. | | | 363 | | | | 33,342 | |
| Procter & Gamble Co. (The) | | | 530 | | | | 71,375 | |
| See Notes to Financial Statements |
| 14 | www.dcmmutualfunds.com |
| DCM/INNOVA High Equity Income Innovation Fund |
| Schedule of Investments |
| October 31, 2022 |
| | | Shares | | | Fair Value | |
| COMMON STOCKS — 93.06% (CONTINUED) | | | | | | | | |
| | | | | | | | | |
| Consumer Staples — 6.43% (Continued) | | | | | | | | |
| Sysco Corp. | | | 102 | | | $ | 8,829 | |
| Target Corp. | | | 122 | | | | 20,039 | |
| Tyson Foods, Inc., Class A | | | 82 | | | | 5,605 | |
| Walgreens Boots Alliance, Inc. | | | 202 | | | | 7,373 | |
| Wal-Mart Stores, Inc. | | | 325 | | | | 46,257 | |
| | | | | | | | 631,846 | |
| Energy — 5.12% | | | | | | | | |
| APA Corp. | | | 22 | | | | 1,000 | |
| Baker Hughes Co. | | | 288 | | | | 7,966 | |
| Chevron Corp. | | | 441 | | | | 79,778 | |
| ConocoPhillips | | | 295 | | | | 37,197 | |
| Coterra Energy, Inc. | | | 219 | | | | 6,817 | |
| Devon Energy Corp. | | | 131 | | | | 10,133 | |
| Diamondback Energy, Inc. | | | 48 | | | | 7,541 | |
| Enphase Energy, Inc.(a) | | | 34 | | | | 10,438 | |
| EOG Resources, Inc. | | | 376 | | | | 51,332 | |
| Exxon Mobil Corp. | | | 924 | | | | 102,389 | |
| Halliburton Co. | | | 238 | | | | 8,668 | |
| Hess Corp. | | | 79 | | | | 11,145 | |
| Kinder Morgan, Inc. | | | 329 | | | | 5,961 | |
| Marathon Oil Corp. | | | 62 | | | | 1,888 | |
| Marathon Petroleum Corp. | | | 154 | | | | 17,497 | |
| Occidental Petroleum Corp. | | | 170 | | | | 12,342 | |
| ONEOK, Inc. | | | 157 | | | | 9,313 | |
| Phillips 66 | | | 108 | | | | 11,263 | |
| Pioneer Natural Resources Co. | | | 66 | | | | 16,923 | |
| Schlumberger Ltd. | | | 366 | | | | 19,043 | |
| SolarEdge Technologies, Inc.(a) | | | 16 | | | | 3,680 | |
| Valero Energy Corp. | | | 549 | | | | 68,928 | |
| Williams Cos., Inc. (The) | | | 80 | | | | 2,618 | |
| | | | | | | | 503,860 | |
| Financials — 10.02% | | | | | | | | |
| Aflac, Inc. | | | 54 | | | | 3,516 | |
| Allstate Corp. (The) | | | 56 | | | | 7,070 | |
| American Express Co. | | | 125 | | | | 18,556 | |
| American International Group, Inc. | | | 187 | | | | 10,659 | |
| Ameriprise Financial, Inc. | | | 22 | | | | 6,801 | |
| Aon PLC, Class A | | | 39 | | | | 10,978 | |
| Arthur J. Gallagher & Co. | | | 61 | | | | 11,412 | |
| See Notes to Financial Statements |
| Annual Report | October 31, 2022 | 15 |
| DCM/INNOVA High Equity Income Innovation Fund |
| Schedule of Investments |
| October 31, 2022 |
| | | Shares | | | Fair Value | |
| COMMON STOCKS — 93.06% (CONTINUED) | | | | | | | | |
| | | | | | | | | |
| Financials — 10.02% (Continued) | | | | | | | | |
| Assurant, Inc. | | | 7 | | | $ | 951 | |
| Bank of America Corp. | | | 2,210 | | | | 79,647 | |
| Bank of New York Mellon Corp. (The) | | | 191 | | | | 8,043 | |
| Berkshire Hathaway, Inc., Class B(a) | | | 398 | | | | 117,445 | |
| BlackRock, Inc. | | | 27 | | | | 17,439 | |
| Brown & Brown, Inc. | | | 68 | | | | 3,998 | |
| Capital One Financial Corp. | | | 92 | | | | 9,754 | |
| Cboe Global Markets, Inc. | | | 19 | | | | 2,366 | |
| Charles Schwab Corp. (The) | | | 356 | | | | 28,362 | |
| Chubb Ltd. | | | 95 | | | | 20,415 | |
| Cincinnati Financial Corp. | | | 70 | | | | 7,232 | |
| Citigroup, Inc. | | | 417 | | | | 19,124 | |
| Citizens Financial Group, Inc. | | | 104 | | | | 4,254 | |
| CME Group, Inc. | | | 81 | | | | 14,037 | |
| Comerica, Inc. | | | 6 | | | | 423 | |
| Discover Financial Services | | | 59 | | | | 6,163 | |
| Everest Re Group Ltd. | | | 26 | | | | 8,389 | |
| F.N.B. Corp. | | | 6,400 | | | | 92,479 | |
| Fifth Third Bancorp | | | 119 | | | | 4,247 | |
| First Republic Bank | | | 36 | | | | 4,324 | |
| Franklin Resources, Inc. | | | 93 | | | | 2,181 | |
| Globe Life, Inc. | | | 5 | | | | 578 | |
| Goldman Sachs Group, Inc. (The) | | | 77 | | | | 26,527 | |
| Hartford Financial Services Group, Inc. (The) | | | 15 | | | | 1,086 | |
| Huntington Bancshares, Inc. | | | 287 | | | | 4,357 | |
| Intercontinental Exchange, Inc. | | | 131 | | | | 12,520 | |
| Invesco Ltd. | | | 88 | | | | 1,348 | |
| JPMorgan Chase & Co. | | | 837 | | | | 105,361 | |
| KeyCorp | | | 156 | | | | 2,788 | |
| Lincoln National Corp. | | | 46 | | | | 2,478 | |
| Loews Corp. | | | 5 | | | | 285 | |
| M&T Bank Corp. | | | 30 | | | | 5,051 | |
| Marsh & McLennan Cos., Inc. | | | 119 | | | | 19,217 | |
| MetLife, Inc. | | | 148 | | | | 10,835 | |
| Morgan Stanley | | | 312 | | | | 25,637 | |
| Nasdaq, Inc. | | | 69 | | | | 4,295 | |
| Northern Trust Corp. | | | 44 | | | | 3,711 | |
| PNC Financial Services Group, Inc. (The) | | | 85 | | | | 13,756 | |
| Principal Financial Group, Inc. | | | 41 | | | | 3,613 | |
| See Notes to Financial Statements |
| 16 | www.dcmmutualfunds.com |
| DCM/INNOVA High Equity Income Innovation Fund |
| Schedule of Investments |
| October 31, 2022 |
| | | Shares | | | Fair Value | |
| COMMON STOCKS — 93.06% (CONTINUED) | | | | | | | | |
| | | | | | | | | |
| Financials — 10.02% (Continued) | | | | | | | | |
| Progressive Corp. (The) | | | 149 | | | $ | 19,132 | |
| Prudential Financial, Inc. | | | 735 | | | | 77,315 | |
| Raymond James Financial, Inc. | | | 63 | | | | 7,443 | |
| Regions Financial Corp. | | | 101 | | | | 2,217 | |
| Signature Bank | | | 13 | | | | 2,061 | |
| State Street Corp. | | | 76 | | | | 5,624 | |
| SVB Financial Group(a) | | | 54 | | | | 12,472 | |
| Synchrony Financial | | | 142 | | | | 5,050 | |
| T. Rowe Price Group, Inc. | | | 74 | | | | 7,856 | |
| Travelers Cos., Inc. (The) | | | 58 | | | | 10,699 | |
| Truist Financial Corp. | | | 364 | | | | 16,304 | |
| U.S. Bancorp | | | 316 | | | | 13,414 | |
| W.R. Berkley Corp. | | | 31 | | | | 2,306 | |
| Wells Fargo & Co. | | | 753 | | | | 34,630 | |
| Willis Towers Watson PLC | | | 22 | | | | 4,801 | |
| Zions Bancorporation | | | 3 | | | | 156 | |
| | | | | | | | 985,188 | |
| Health Care — 13.68% | | | | | | | | |
| Abbott Laboratories | | | 686 | | | | 67,873 | |
| AbbVie, Inc. | | | 410 | | | | 60,024 | |
| ABIOMED, Inc.(a) | | | 9 | | | | 2,269 | |
| Agilent Technologies, Inc. | | | 48 | | | | 6,641 | |
| Align Technology, Inc.(a) | | | 21 | | | | 4,080 | |
| AmerisourceBergen Corp. | | | 64 | | | | 10,062 | |
| Amgen, Inc. | | | 121 | | | | 32,712 | |
| Anthem, Inc. | | | 52 | | | | 28,432 | |
| Baxter International, Inc. | | | 113 | | | | 6,142 | |
| Becton, Dickinson and Co. | | | 58 | | | | 13,686 | |
| Biogen, Inc.(a) | | | 22 | | | | 6,236 | |
| Bio-Rad Laboratories, Inc., Class A(a) | | | 8 | | | | 2,814 | |
| Bio-Techne Corp. | | | 12 | | | | 3,555 | |
| Boston Scientific Corp.(a) | | | 281 | | | | 12,114 | |
| Bristol-Myers Squibb Co. | | | 529 | | | | 40,982 | |
| Cardinal Health, Inc. | | | 76 | | | | 5,768 | |
| Catalent, Inc.(a) | | | 39 | | | | 2,563 | |
| Centene Corp.(a) | | | 237 | | | | 20,176 | |
| Charles River Laboratories International, Inc. (a) | | | 10 | | | | 2,123 | |
| Cigna Corp. | | | 92 | | | | 29,722 | |
| Cooper Cos., Inc. (The) | | | 15 | | | | 4,101 | |
| See Notes to Financial Statements |
| Annual Report | October 31, 2022 | 17 |
| DCM/INNOVA High Equity Income Innovation Fund |
| Schedule of Investments |
| October 31, 2022 |
| | | Shares | | | Fair Value | |
| COMMON STOCKS — 93.06% (CONTINUED) | | | | | | | | |
| | | | | | | | | |
| Health Care — 13.68% (Continued) | | | | | | | | |
| CVS Health Corp. | | | 328 | | | $ | 31,062 | |
| Danaher Corp. | | | 241 | | | | 60,652 | |
| DaVita, Inc.(a) | | | 4 | | | | 292 | |
| DENTSPLY SIRONA, Inc. | | | 51 | | | | 1,572 | |
| DexCom, Inc.(a) | | | 108 | | | | 13,044 | |
| Edwards LifeSciences Corp.(a) | | | 140 | | | | 10,140 | |
| Eli Lilly & Co. | | | 284 | | | | 102,834 | |
| Embecta Corp. | | | 160 | | | | 4,947 | |
| Gilead Sciences, Inc. | | | 279 | | | | 21,890 | |
| HCA Healthcare, Inc. | | | 56 | | | | 12,178 | |
| Henry Schein, Inc.(a) | | | 5 | | | | 342 | |
| Hologic, Inc.(a) | | | 45 | | | | 3,051 | |
| Humana, Inc. | | | 27 | | | | 15,068 | |
| IDEXX Laboratories, Inc.(a) | | | 6 | | | | 2,158 | |
| Illumina, Inc.(a) | | | 31 | | | | 7,093 | |
| Incyte Corp.(a) | | | 86 | | | | 6,393 | |
| Intuitive Surgical, Inc.(a) | | | 80 | | | | 19,718 | |
| IQVIA Holdings, Inc.(a) | | | 33 | | | | 6,919 | |
| Johnson & Johnson | | | 602 | | | | 104,730 | |
| Laboratory Corp. of America Holdings | | | 21 | | | | 4,659 | |
| McKesson Corp. | | | 30 | | | | 11,681 | |
| Medtronic PLC | | | 284 | | | | 24,805 | |
| Merck & Co., Inc. | | | 572 | | | | 57,886 | |
| Mettler-Toledo International, Inc. (a) | | | 5 | | | | 6,325 | |
| Moderna, Inc.(a) | | | 85 | | | | 12,778 | |
| Molina Healthcare, Inc.(a) | | | 25 | | | | 8,972 | |
| Organon & Co. | | | 24 | | | | 628 | |
| PerkinElmer, Inc. | | | 21 | | | | 2,805 | |
| Pfizer, Inc. | | | 1,932 | | | | 89,935 | |
| Quest Diagnostics, Inc. | | | 27 | | | | 3,879 | |
| Regeneron Pharmaceuticals, Inc. (a) | | | 23 | | | | 17,221 | |
| ResMed, Inc. | | | 35 | | | | 7,829 | |
| STERIS PLC | | | 23 | | | | 3,969 | |
| Stryker Corp. | | | 71 | | | | 16,276 | |
| Teleflex, Inc. | | | 6 | | | | 1,287 | |
| Thermo Fisher Scientific, Inc. | | | 131 | | | | 67,330 | |
| UnitedHealth Group, Inc. | | | 301 | | | | 167,100 | |
| Universal Health Services, Inc., Class B | | | 13 | | | | 1,506 | |
| Vertex Pharmaceuticals, Inc.(a) | | | 66 | | | | 20,592 | |
| See Notes to Financial Statements |
| 18 | www.dcmmutualfunds.com |
| DCM/INNOVA High Equity Income Innovation Fund |
| Schedule of Investments |
| October 31, 2022 |
| | | Shares | | | Fair Value | |
| COMMON STOCKS — 93.06% (CONTINUED) | | | | | | | | |
| | | | | | | | | |
| Health Care — 13.68% (Continued) | | | | | | | | |
| Viatris, Inc. | | | 365 | | | $ | 3,697 | |
| Waters Corp.(a) | | | 15 | | | | 4,488 | |
| West Pharmaceutical Services, Inc. | | | 20 | | | | 4,602 | |
| Zimmer Biomet Holdings, Inc. | | | 13 | | | | 1,474 | |
| Zoetis, Inc., Class A | | | 113 | | | | 17,038 | |
| | | | | | | | 1,344,920 | |
| Industrials — 7.50% | | | | | | | | |
| 3M Co. | | | 165 | | | | 20,755 | |
| A.O. Smith Corp. | | | 19 | | | | 1,041 | |
| Alaska Air Group, Inc.(a) | | | 74 | | | | 3,290 | |
| Allegion PLC | | | 26 | | | | 2,724 | |
| American Airlines Group, Inc.(a) | | | 129 | | | | 1,829 | |
| AMETEK, Inc. | | | 66 | | | | 8,558 | |
| Amphenol Corp., Class A | | | 722 | | | | 54,748 | |
| Boeing Co. (The)(a) | | | 115 | | | | 16,389 | |
| Carrier Global Corp. | | | 204 | | | | 8,111 | |
| Caterpillar, Inc. | | | 118 | | | | 25,542 | |
| CH Robinson Worldwide, Inc. | | | 51 | | | | 4,984 | |
| Cintas Corp. | | | 18 | | | | 7,696 | |
| CSX Corp. | | | 313 | | | | 9,096 | |
| Cummins, Inc. | | | 46 | | | | 11,248 | |
| Deere & Co. | | | 53 | | | | 20,978 | |
| Delta Air Lines, Inc.(a) | | | 140 | | | | 4,750 | |
| Dover Corp. | | | 29 | | | | 3,790 | |
| Eaton Corp. PLC | | | 72 | | | | 10,805 | |
| Emerson Electric Co. | | | 159 | | | | 13,769 | |
| Expeditors International of Washington, Inc. | | | 82 | | | | 8,024 | |
| Fastenal Co. | | | 209 | | | | 10,101 | |
| FedEx Corp. | | | 55 | | | | 8,815 | |
| Fortive Corp. | | | 17 | | | | 1,086 | |
| Generac Holdings, Inc.(a) | | | 17 | | | | 1,970 | |
| General Dynamics Corp. | | | 63 | | | | 15,737 | |
| General Electric, Co. | | | 196 | | | | 15,251 | |
| Honeywell International, Inc. | | | 141 | | | | 28,768 | |
| Howmet Aerospace Inc. | | | 1 | | | | 36 | |
| Huntington Ingalls Industries, Inc. | | | 16 | | | | 4,113 | |
| IDEX Corp. | | | 21 | | | | 4,669 | |
| Illinois Tool Works, Inc. | | | 63 | | | | 13,452 | |
| Ingersoll Rand, Inc. | | | 152 | | | | 7,676 | |
| See Notes to Financial Statements |
| Annual Report | October 31, 2022 | 19 |
| DCM/INNOVA High Equity Income Innovation Fund |
| Schedule of Investments |
| October 31, 2022 |
| | | Shares | | | Fair Value | |
| COMMON STOCKS — 93.06% (CONTINUED) | | | | | | | | |
| | | | | | | | | |
| Industrials — 7.50% (Continued) | | | | | | | | |
| Jacobs Solutions, Inc. 47 $5,416 | | | | | | | | |
| JB Hunt Transport Services, Inc. | | | 30 | | | | 5,132 | |
| Johnson Controls International PLC | | | 103 | | | | 5,958 | |
| Keysight Technologies, Inc.(a) | | | 50 | | | | 8,708 | |
| L3 Harris Technologies, Inc. | | | 69 | | | | 17,006 | |
| Lockheed Martin Corp. | | | 47 | | | | 22,874 | |
| Nordson Corp. | | | 9 | | | | 2,025 | |
| Norfolk Southern Corp. | | | 34 | | | | 7,754 | |
| Northrop Grumman Corp. | | | 28 | | | | 15,372 | |
| Old Dominion Freight Line, Inc. | | | 19 | | | | 5,217 | |
| Otis Worldwide Corp. | | | 109 | | | | 7,700 | |
| PACCAR, Inc. | | | 99 | | | | 9,586 | |
| Parker-Hannifin Corp. | | | 35 | | | | 10,172 | |
| Pentair PLC | | | 1 | | | | 43 | |
| Quanta Services, Inc. | | | 35 | | | | 4,971 | |
| Raytheon Technologies Corp. | | | 341 | | | | 32,334 | |
| Republic Services, Inc. | | | 54 | | | | 7,161 | |
| Robert Half International, Inc. | | | 33 | | | | 2,523 | |
| Rockwell Automation, Inc. | | | 30 | | | | 7,659 | |
| Rollins, Inc. | | | 94 | | | | 3,956 | |
| Roper Technologies, Inc. | | | 23 | | | | 9,534 | |
| Snap-on, Inc. | | | 3 | | | | 666 | |
| Southwest Airlines Co.(a) | | | 150 | | | | 5,453 | |
| Stanley Black & Decker, Inc. | | | 22 | | | | 1,727 | |
| TE Connectivity Ltd. | | | 68 | | | | 8,312 | |
| Teledyne Technologies, Inc.(a) | | | 13 | | | | 5,174 | |
| Textron, Inc. | | | 23 | | | | 1,574 | |
| Trane Technologies PLC | | | 38 | | | | 6,066 | |
| Transdigm Group, Inc. | | | 11 | | | | 6,333 | |
| Trimble, Inc.(a) | | | 66 | | | | 3,971 | |
| Union Pacific Corp. | | | 256 | | | | 50,468 | |
| United Airlines Holdings, Inc.(a) | | | 101 | | | | 4,351 | |
| United Parcel Service, Inc., Class B | | | 180 | | | | 30,199 | |
| United Rentals, Inc.(a) | | | 17 | | | | 5,367 | |
| W.W. Grainger, Inc. | | | 12 | | | | 7,012 | |
| Wabtec Corp. | | | 66 | | | | 6,156 | |
| Waste Management, Inc. | | | 98 | | | | 15,520 | |
| Watsco, Inc. | | | 130 | | | | 35,225 | |
| Xylem, Inc. | | | 31 | | | | 3,175 | |
| | | | | | | | 737,651 | |
| See Notes to Financial Statements |
| 20 | www.dcmmutualfunds.com |
| DCM/INNOVA High Equity Income Innovation Fund |
| Schedule of Investments |
| October 31, 2022 |
| | | Shares | | | Fair Value | |
| COMMON STOCKS — 93.06% (CONTINUED) | | | | | | | | |
| | | | | | | | | |
| Materials — 2.66% | | | | | | | | |
| Air Products & Chemicals, Inc. | | | 60 | | | $ | 15,024 | |
| Albemarle Corp. | | | 23 | | | | 6,437 | |
| Amcor PLC | | | 822 | | | | 9,519 | |
| Avery Dennison Corp. | | | 35 | | | | 5,934 | |
| Ball Corp. | | | 73 | | | | 3,605 | |
| Celanese Corp. | | | 39 | | | | 3,749 | |
| CF Industries Holdings, Inc. | | | 32 | | | | 3,400 | |
| Corteva, Inc. | | | 74 | | | | 4,835 | |
| Dow, Inc. | | | 188 | | | | 8,787 | |
| DuPont de Nemours, Inc. | | | 1 | | | | 57 | |
| Eastman Chemical Co. | | | 22 | | | | 1,690 | |
| Ecolab, Inc. | | | 35 | | | | 5,497 | |
| FMC Corp. | | | 29 | | | | 3,448 | |
| Freeport-McMoRan, Inc. | | | 315 | | | | 9,982 | |
| International Flavors & Fragrances, Inc. | | | 96 | | | | 9,371 | |
| International Paper Co. | | | 35 | | | | 1,176 | |
| Linde PLC | | | 186 | | | | 55,307 | |
| LyondellBasell Industries N.V., Class A | | | 738 | | | | 56,420 | |
| Martin Marietta Materials, Inc. | | | 15 | | | | 5,040 | |
| Mosaic Co. (The) | | | 57 | | | | 3,064 | |
| Newmont Corp. | | | 196 | | | | 8,295 | |
| Nippon Steel Trading Corp. | | | 100 | | | | 3,443 | |
| Nucor Corp. | | | 74 | | | | 9,723 | |
| Packaging Corp. of America | | | 27 | | | | 3,246 | |
| PPG Industries, Inc. | | | 56 | | | | 6,394 | |
| Sealed Air Corp. | | | 28 | | | | 1,333 | |
| Sherwin-Williams Co. (The) | | | 54 | | | | 12,152 | |
| Shougang Fushan Resources Group Ltd. | | | 2,000 | | | | 543 | |
| Vulcan Materials Co. | | | 16 | | | | 2,619 | |
| WestRock Co. | | | 59 | | | | 2,010 | |
| | | | | | | | 262,100 | |
| Real Estate — 1.91% | | | | | | | | |
| Alexandria Real Estate Equities, Inc. | | | 58 | | | | 8,427 | |
| American Tower Corp. | | | 104 | | | | 21,548 | |
| AvalonBay Communities, Inc. | | | 29 | | | | 5,078 | |
| Boston Properties, Inc. | | | 29 | | | | 2,108 | |
| Camden Property Trust | | | 22 | | | | 2,542 | |
| CBRE Group, Inc., Class A(a) | | | 115 | | | | 8,158 | |
| Crown Castle International Corp. | | | 91 | | | | 12,127 | |
| See Notes to Financial Statements |
| Annual Report | October 31, 2022 | 21 |
| DCM/INNOVA High Equity Income Innovation Fund |
| Schedule of Investments |
| October 31, 2022 |
| | | Shares | | | Fair Value | |
| COMMON STOCKS — 93.06% (CONTINUED) | | | | | | | | |
| | | | | | | | | |
| Real Estate — 1.91% (Continued) | | | | | | | | |
| Digital Realty Trust, Inc. | | | 74 | | | $ | 7,419 | |
| Equinix, Inc. | | | 18 | | | | 10,196 | |
| Equity Residential | | | 73 | | | | 4,600 | |
| Essex Property Trust, Inc. | | | 12 | | | | 2,667 | |
| Extra Space Storage, Inc. | | | 30 | | | | 5,323 | |
| Federal Realty Investment Trust | | | 6 | | | | 594 | |
| Healthpeak Properties, Inc. | | | 129 | | | | 3,061 | |
| Host Hotels & Resorts, Inc. | | | 13 | | | | 245 | |
| Iron Mountain, Inc. | | | 64 | | | | 3,204 | |
| Kimco Realty Corp. | | | 125 | | | | 2,673 | |
| Mid-America Apartment Communities, Inc. | | | 17 | | | | 2,677 | |
| Prologis, Inc. | | | 204 | | | | 22,593 | |
| Public Storage | | | 20 | | | | 6,195 | |
| Realty Income Corp. | | | 218 | | | | 13,575 | |
| Regency Centers Corp. | | | 16 | | | | 968 | |
| SBA Communications Corp., Class A | | | 23 | | | | 6,208 | |
| Simon Property Group, Inc. | | | 72 | | | | 7,847 | |
| UDR, Inc. | | | 81 | | | | 3,221 | |
| Ventas, Inc. | | | 72 | | | | 2,817 | |
| VICI Properties, Inc. | | | 358 | | | | 11,463 | |
| Vornado Realty Trust | | | 25 | | | | 590 | |
| Welltower, Inc. | | | 112 | | | | 6,836 | |
| Weyerhaeuser Co. | | | 91 | | | | 2,815 | |
| | | | | | | | 187,775 | |
| Technology — 25.54% | | | | | | | | |
| Accenture PLC, Class A | | | 150 | | | | 42,585 | |
| Adobe, Inc.(a) | | | 162 | | | | 51,597 | |
| Advanced Micro Devices, Inc.(a) | | | 379 | | | | 22,763 | |
| Akamai Technologies, Inc.(a) | | | 36 | | | | 3,180 | |
| Analog Devices, Inc. | | | 109 | | | | 15,546 | |
| ANSYS, Inc.(a) | | | 18 | | | | 3,981 | |
| Apple, Inc. | | | 4,401 | | | | 674,849 | |
| Applied Materials, Inc. | | | 208 | | | | 18,364 | |
| Arista Networks, Inc.(a) | | | 51 | | | | 6,164 | |
| Autodesk, Inc.(a) | | | 52 | | | | 11,144 | |
| Automatic Data Processing, Inc. | | | 88 | | | | 21,270 | |
| Broadcom, Inc. | | | 138 | | | | 64,877 | |
| Broadridge Financial Solutions, Inc. | | | 35 | | | | 5,252 | |
| Cadence Design Systems, Inc.(a) | | | 62 | | | | 9,386 | |
| See Notes to Financial Statements |
| 22 | www.dcmmutualfunds.com |
| DCM/INNOVA High Equity Income Innovation Fund |
| Schedule of Investments |
| October 31, 2022 |
| | | Shares | | | Fair Value | |
| COMMON STOCKS — 93.06% (CONTINUED) | | | | | | | | |
| | | | | | | | | |
| Technology — 25.54% (Continued) | | | | | | | | |
| CDW Corp. | | | 26 | | | $ | 4,493 | |
| Ceridian HCM Holding, Inc.(a) | | | 9 | | | | 596 | |
| Cisco Systems, Inc. | | | 1,433 | | | | 65,101 | |
| Cognizant Technology Solutions Corp., Class A | | | 107 | | | | 6,661 | |
| Corning, Inc. | | | 181 | | | | 5,823 | |
| DXC Technology Co.(a) | | | 1 | | | | 29 | |
| EPAM Systems, Inc.(a) | | | 14 | | | | 4,900 | |
| Equifax, Inc. | | | 19 | | | | 3,221 | |
| F5, Inc.(a) | | | 6 | | | | 857 | |
| FactSet Research Systems, Inc. | | | 10 | | | | 4,255 | |
| Fidelity National Information Services, Inc. | | | 165 | | | | 13,693 | |
| Fiserv, Inc.(a) | | | 175 | | | | 17,980 | |
| FleetCor Technologies, Inc.(a) | | | 19 | | | | 3,536 | |
| Fortinet, Inc. (a) | | | 502 | | | | 28,694 | |
| Garmin Ltd. | | | 345 | | | | 30,374 | |
| Gartner, Inc.(a) | | | 22 | | | | 6,642 | |
| Global Payments, Inc. | | | 93 | | | | 10,626 | |
| Hewlett Packard Enterprise Co. | | | 256 | | | | 3,653 | |
| HP, Inc. | | | 217 | | | | 5,994 | |
| Intel Corp. | | | 921 | | | | 26,184 | |
| International Business Machines Corp. | | | 408 | | | | 56,422 | |
| Intuit, Inc. | | | 58 | | | | 24,795 | |
| Jack Henry & Associates, Inc. | | | 18 | | | | 3,583 | |
| Juniper Networks, Inc. | | | 3 | | | | 92 | |
| KLA Corp. | | | 33 | | | | 10,443 | |
| Lam Research Corp. | | | 30 | | | | 12,143 | |
| Leidos Holdings, Inc. | | | 17 | | | | 1,727 | |
| MarketAxess Holdings, Inc. | | | 9 | | | | 2,196 | |
| MasterCard, Inc., Class A | | | 256 | | | | 84,015 | |
| Microchip Technology, Inc. | | | 99 | | | | 6,112 | |
| Micron Technology, Inc. | | | 229 | | | | 12,389 | |
| Microsoft Corp. | | | 2,210 | | | | 513,007 | |
| Monolithic Power Systems, Inc. | | | 13 | | | | 4,413 | |
| Moody’s Corp. | | | 36 | | | | 9,535 | |
| Motorola Solutions, Inc. | | | 37 | | | | 9,239 | |
| MSCI, Inc. | | | 18 | | | | 8,439 | |
| NetApp, Inc. | | | 43 | | | | 2,979 | |
| NortonLifeLock, Inc. | | | 3 | | | | 68 | |
| NVIDIA Corp. | | | 826 | | | | 111,485 | |
| See Notes to Financial Statements |
| Annual Report | October 31, 2022 | 23 |
| DCM/INNOVA High Equity Income Innovation Fund |
| Schedule of Investments |
| October 31, 2022 |
| | | Shares | | | Fair Value | |
| COMMON STOCKS — 93.06% (CONTINUED) | | | | | | | | |
| | | | | | | | | |
| Technology — 25.54% (Continued) | | | | | | | | |
| NXP Semiconductors NV | | | 64 | | | $ | 9,349 | |
| ON Semiconductor Corp.(a) | | | 34 | | | | 2,089 | |
| Oracle Corp. | | | 331 | | | | 25,841 | |
| Paychex, Inc. | | | 60 | | | | 7,099 | |
| Paycom Software, Inc. (a) | | | 12 | | | | 4,152 | |
| PayPal Holdings, Inc.(a) | | | 266 | | | | 22,232 | |
| PTC, Inc.(a) | | | 27 | | | | 3,181 | |
| Qorvo, Inc.(a) | | | 29 | | | | 2,496 | |
| Qualcomm, Inc. | | | 258 | | | | 30,356 | |
| S&P Global, Inc. | | | 185 | | | | 59,431 | |
| Salesforce.com, Inc.(a) | | | 380 | | | | 61,784 | |
| Seagate Technology PLC | | | 42 | | | | 2,086 | |
| ServiceNow, Inc.(a) | | | 88 | | | | 37,025 | |
| Skyworks Solutions, Inc. | | | 44 | | | | 3,784 | |
| Synopsys, Inc.(a) | | | 33 | | | | 9,654 | |
| Teradyne, Inc. | | | 56 | | | | 4,556 | |
| Texas Instruments, Inc. | | | 208 | | | | 33,411 | |
| Tyler Technologies, Inc.(a) | | | 14 | | | | 4,527 | |
| Verisk Analytics, Inc. | | | 5 | | | | 914 | |
| Visa, Inc., Class A | | | 549 | | | | 113,732 | |
| Western Digital Corp.(a) | | | 50 | | | | 1,719 | |
| Zebra Technologies Corp., Class A(a) | | | 15 | | | | 4,248 | |
| | | | | | | | 2,511,018 | |
| Utilities — 3.92% | | | | | | | | |
| AES Corp. | | | 113 | | | | 2,956 | |
| Alliant Energy Corp. | | | 53 | | | | 2,765 | |
| Ameren Corp. | | | 67 | | | | 5,462 | |
| American Electric Power Co., Inc. | | | 118 | | | | 10,375 | |
| American Water Works Co., Inc. | | | 39 | | | | 5,669 | |
| Atmos Energy Corp. | | | 40 | | | | 4,262 | |
| CenterPoint Energy, Inc. | | | 129 | | | | 3,691 | |
| CMS Energy Corp. | | | 71 | | | | 4,051 | |
| Consolidated Edison, Inc. | | | 80 | | | | 7,037 | |
| Constellation Energy Corp. | | | 48 | | | | 4,538 | |
| Dominion Energy, Inc. | | | 178 | | | | 12,455 | |
| DTE Energy Co. | | | 1,016 | | | | 113,903 | |
| Duke Energy Corp. | | | 184 | | | | 17,144 | |
| Edison International | | | 114 | | | | 6,845 | |
| Entergy Corp. | | | 669 | | | | 71,676 | |
| See Notes to Financial Statements |
| 24 | www.dcmmutualfunds.com |
| DCM/INNOVA High Equity Income Innovation Fund |
| Schedule of Investments |
| October 31, 2022 |
| | | Shares | | | Fair Value | |
| COMMON STOCKS — 93.06% (CONTINUED) | | | | | | | | |
| | | | | | | | | |
| Utilities — 3.92% (Continued) | | | | | | | | |
| Evergy, Inc. | | | 99 | | | $ | 6,052 | |
| Eversource Energy | | | 88 | | | | 6,713 | |
| Exelon Corp. | | | 116 | | | | 4,476 | |
| FirstEnergy Corp. | | | 142 | | | | 5,355 | |
| NextEra Energy, Inc. | | | 419 | | | | 32,472 | |
| Nisource, Inc. | | | 73 | | | | 1,875 | |
| NRG Energy, Inc. | | | 168 | | | | 7,459 | |
| Pinnacle West Capital Corp. | | | 62 | | | | 4,167 | |
| PPL Corp. | | | 50 | | | | 1,325 | |
| Public Service Enterprise Group, Inc. | | | 46 | | | | 2,579 | |
| Sempra Energy | | | 67 | | | | 10,113 | |
| Southern Co. (The) | | | 224 | | | | 14,668 | |
| WEC Energy Group, Inc. | | | 74 | | | | 6,758 | |
| Xcel Energy, Inc. | | | 125 | | | | 8,139 | |
| | | | | | | | 384,980 | |
| Total Common Stocks (Cost $9,690,025) | | | | | | | 9,149,502 | |
| | | | | | | | | |
| EXCHANGE-TRADED FUNDS — 5.13% | | | | | | | | |
| | | | | | | | | |
| iShares S&P 500 Growth ETF | | | 4,357 | | | | 263,207 | |
| SPDR S&P 500 ETF Trust | | | 625 | | | | 241,381 | |
| | | | | | | | | |
| Total Exchange-Traded Funds (Cost $540,317) | | | | | | | 504,588 | |
| | | | | | | | | |
| MONEY MARKET FUNDS — 0.32% | | | | | | | | |
| | | | | | | | | |
| First American Treasury Obligations Fund, Class X, 3.67%(b) | | | 31,801 | | | | 31,801 | |
| | | | | | | | | |
| Total Money Market Funds (Cost $31,801) | | | | | | | 31,801 | |
| | | | | | | | | |
| Total Investments — 98.51% (Cost $10,262,143) | | | | | | | 9,685,891 | |
| | | | | | | | | |
| Other Assets in Excess of Liabilities — 1.49% | | | | | | | 146,206 | |
| | | | | | | | | |
| NET ASSETS — 100.00% | | | | | | $ | 9,832,097 | |
| (a) | Non-income producing security. |
| (b) | Rate disclosed is the seven day effective yield as of October 31, 2022. |
ETF - Exchange-Traded Fund
SPDR - Standard & Poor’s Depositary Receipt
| See Notes to Financial Statements |
| Annual Report | October 31, 2022 | 25 |
| DCM/INNOVA High Equity Income Innovation Fund |
| Schedule of Investments |
| October 31, 2022 |
| Summary of Investments | | % of Net Assets | | | Fair Value | |
| Common Stocks | | | | | | | | |
| Communications | | | 6.89 | % | | $ | 677,171 | |
| Consumer Discretionary | | | 9.39 | % | | | 922,993 | |
| Consumer Staples | | | 6.43 | % | | | 631,846 | |
| Energy | | | 5.12 | % | | | 503,860 | |
| Financials | | | 10.02 | % | | | 985,188 | |
| Health Care | | | 13.68 | % | | | 1,344,920 | |
| Industrials | | | 7.50 | % | | | 737,651 | |
| Materials | | | 2.66 | % | | | 262,100 | |
| Real Estate | | | 1.91 | % | | | 187,775 | |
| Technology | | | 25.54 | % | | | 2,511,018 | |
| Utilities | | | 3.92 | % | | | 384,980 | |
| Exchange-Traded Funds | | | 5.13 | % | | | 504,588 | |
| Money Market Funds | | | 0.32 | % | | | 31,801 | |
| Other Assets in Excess of Liabilities | | | 1.49 | % | | | 146,206 | |
| Total | | | 100.00 | % | | $ | 9,832,097 | |
| See Notes to Financial Statements |
| 26 | www.dcmmutualfunds.com |
| Lebenthal Ultra Short Tax-Free Income Fund |
| Schedule of Investments |
| October 31, 2022 |
| | | Principal | | | | |
| | | Amount | | | Fair Value | |
| MUNICIPAL BONDS — 95.32% | | | | | | | | |
| Colorado — 0.06% | | | | | | | | |
| City & County of Denver, CO Airport System Revenue Bonds, Series 2012 B, 5.00%, 11/15/2022 | | $ | 5,000 | | | $ | 5,003 | |
| | | | | | | | | |
| Connecticut — 0.06% | | | | | | | | |
| University of Connecticut General Obligation Bonds, Series 2019 A, 5.00%, 11/1/2022 | | | 5,000 | | | | 5,000 | |
| | | | | | | | | |
| District of Columbia — 6.37% | | | | | | | | |
| District of Columbia Carnegie Endowment for International Peace Revenue Bonds, Series 2006, 2.23%, 11/1/2045(a) | | | 300,000 | | | | 300,000 | |
| District of Columbia Water & Sewer Authority Public Utilities Revenue Bonds, Series 2014 B-2, 2.26%, 10/1/2050(a) | | | 250,000 | | | | 250,000 | |
| | | | | | | | 550,000 | |
| Florida — 3.48% | | | | | | | | |
| JEA Water & Sewer System Revenue Bonds, Series 2008 B, 2.30%, 10/1/2041(a) | | | 300,000 | | | | 300,000 | |
| | | | | | | | | |
| Illinois — 8.11% | | | | | | | | |
| Chicago Midway International Airport Second Lien Revenue Bonds, Series 2004 D, 2.23%, 1/1/2035(a) | | | 300,000 | | | | 300,000 | |
| Illinois Educational Facilities Authority Revenue Bonds, Series 2003 B, 2.23%, 7/1/2033(a) | | | 400,000 | | | | 400,000 | |
| | | | | | | | 700,000 | |
| Maryland — 3.42% | | | | | | | | |
| Washington Suburban Sanitary District General Obligation Multi-Modal Bond Anticipation Notes, Series 2016 B-4, 2.25%, 6/1/2023(a) | | | 200,000 | | | | 200,000 | |
| Washington Suburban Sanitary District General Obligation Multi-Modal Bond Anticipation Notes, Series 2015 B-3, 2.25%, 6/1/2023(a) | | | 95,000 | | | | 95,000 | |
| | | | | | | | 295,000 | |
| See Notes to Financial Statements | |
| Annual Report | October 31, 2022 | 27 |
| Lebenthal Ultra Short Tax-Free Income Fund |
| Schedule of Investments |
| October 31, 2022 |
| | | Principal | | | | |
| | | Amount | | | Fair Value | |
| MUNICIPAL BONDS — 95.32% (CONTINUED) | | | | | | | | |
| Massachusetts — 11.01% | | | | | | | | |
| Massachusetts State Health & Educational Facilities Authority Revenue Bonds, Series 2001 J-2, 2.12%, 7/1/2031(a) | | $ | 300,000 | | | $ | 300,000 | |
| Massachusetts State Housing Finance Agency Housing Revenue Bonds, Series 2018 200, 2.24%, 12/1/2048(a) | | | 350,000 | | | | 350,000 | |
| Massachusetts Water Resources Authority Revenue Bonds, Series 2008 E, 2.25%, 8/1/2037(a) | | | 300,000 | | | | 300,000 | |
| | | | | | | | 950,000 | |
| Nevada — 0.93% | | | | | | | | |
| County of Washoe, NV General Obligation Bonds, Series 2021, 5.00%, 12/1/2022 | | | 80,000 | | | | 80,119 | |
| | | | | | | | | |
| New York — 27.70% | | | | | | | | |
| Battery Park City Authority Junior Revenue Bonds, Series 2019 D-1, 2.22%, 11/1/2038(a) | | | 300,000 | | | | 300,000 | |
| Metropolitan Transportation Authority NY Revenue Bonds, Series 2016 C-1, 5.00%, 11/15/2022 | | | 200,000 | | | | 200,118 | |
| New York City Industrial Development Agency Variable Rate Demand Liberty Revenue Bonds, Series 2007, 2.04%, 10/1/2042(a) | | | 500,000 | | | | 500,000 | |
| New York City Municipal Water Finance Authority Water & Sewer System Revenue Bonds, Series 2019 BB, 2.20%, 6/15/2051(a) | | | 400,000 | | | | 400,000 | |
| New York City Trust for Cultural Resources Revenue Bonds, Series 2009 A, 2.22%, 7/1/2032(a) | | | 250,000 | | | | 250,000 | |
| New York City Trust for Cultural Resources Revenue Bonds, Series 2006 A-2, 2.12%, 10/1/2036(a) | | | 200,000 | | | | 200,000 | |
| New York State Energy Research & Development Authority Facilities Revenue Bonds, Series 2005 A-3, 2.24%, 5/1/2039(a) | | | 300,000 | | | | 300,000 | |
| Village of Harrison, Westchester County, NY Public Improvement Bonds, Series 2013, 4.00%, 12/1/2030 | | | 240,000 | | | | 240,165 | |
| | | | | | | | 2,390,283 | |
| Ohio — 10.72% | | | | | | | | |
| Ohio State General Obligation Infrastructure Improvement Bonds, Series 2004 A, 2.24%, 2/1/2023(a) | | | 225,000 | | | | 225,000 | |
| Ohio State University (The) Revenue Bonds, Series 2014 B-2, 2.22%, 12/1/2039(a) | | | 300,000 | | | | 300,000 | |
| See Notes to Financial Statements | |
| 28 | www.dcmmutualfunds.com |
| Lebenthal Ultra Short Tax-Free Income Fund |
| Schedule of Investments |
| October 31, 2022 |
| | | Principal | | | | |
| | | Amount | | | Fair Value | |
| MUNICIPAL BONDS — 95.32% (CONTINUED) | | | | | | | | |
| Ohio — 10.72% (Continued) | | | | | | | | |
| Ohio Water Development Authority Water Pollution Control Loan Fund Revenue Bonds, Series 2016 A, 2.20%, 12/1/2036(a) | | $ | 400,000 | | | $ | 400,000 | |
| | | | | | | | 925,000 | |
| South Carolina — 4.63% | | | | | | | | |
| City of Columbia, SC Waterworks & Sewer System Revenue Bonds, Series 2009, 2.24%, 2/1/2038(a) | | | 400,000 | | | | 400,000 | |
| | | | | | | | | |
| Texas — 11.30% | | | | | | | | |
| Dallas Fort Worth International Airport Joint Revenue Improvement Bonds, Series 2013 B, 5.00%, 11/1/2027 | | | 400,000 | | | | 400,001 | |
| Dallas Fort Worth International Airport Joint Revenue Improvement Bonds, Series 2013 B, 5.00%, 11/1/2038 | | | 325,000 | | | | 325,000 | |
| State of Texas Veterans Bonds, Series 2016, 2.23%, 12/1/2046(a) | | | 250,000 | | | | 250,000 | |
| | | | | | | | 975,001 | |
| Virginia — 7.53% | | | | | | | | |
| Fairfax County, VA Economic Development Authority Revenue Bonds, Series 2003 A, 2.12%, 12/1/2033(a) | | | 300,000 | | | | 300,000 | |
| Fairfax County, VA Economic Development Authority Revenue Bonds, Series 2007, 2.30%, 6/1/2037(a) | | | 350,000 | | | | 350,000 | |
| | | | | | | | 650,000 | |
| | | | | | | | | |
| Total Municipal Bonds (Cost $8,225,825) | | | | | | | 8,225,406 | |
| See Notes to Financial Statements | |
| Annual Report | October 31, 2022 | 29 |
| Lebenthal Ultra Short Tax-Free Income Fund |
| Schedule of Investments |
| October 31, 2022 |
| | | Shares | | | Fair Value | |
| MONEY MARKET FUNDS — 3.86% | | | | | | | | |
| Federated Institutional Tax-Free Cash Trust, Premier Shares, 2.02%(b) | | | 333,328 | | | $ | 333,328 | |
| | | | | | | | | |
| Total Money Market Funds (Cost $333,328) | | | | | | | 333,328 | |
| | | | | | | | | |
| Total Investments — 99.18% (Cost $8,559,153) | | | | | | | 8,558,734 | |
| | | | | | | | | |
| Other Assets in Excess of Liabilities — 0.82% | | | | | | | 70,629 | |
| | | | | | | | | |
| NET ASSETS — 100.00% | | | | | | $ | 8,629,363 | |
| (a) | Certain variable rate securities are not based on a published reference rate spread but are determined by the issuer or agent and are based on current market conditions. These securities, therefore, do not indicate a reference rate and spread. |
| (b) | Rate disclosed is the seven day effective yield as of October 31, 2022. |
| See Notes to Financial Statements | |
| 30 | www.dcmmutualfunds.com |
| Lebenthal Ultra Short Tax-Free Income Fund |
| Schedule of Investments |
| October 31, 2022 |
| Summary of Investments | | % of Net Assets | | | Fair Value | |
| Municipal Bonds | | | | | | | | |
| Colorado | | | 0.06 | % | | $ | 5,003 | |
| Connecticut | | | 0.06 | % | | | 5,000 | |
| District of Columbia | | | 6.37 | % | | | 550,000 | |
| Florida | | | 3.48 | % | | | 300,000 | |
| Illinois | | | 8.11 | % | | | 700,000 | |
| Maryland | | | 3.42 | % | | | 295,000 | |
| Massachusetts | | | 11.01 | % | | | 950,000 | |
| Nevada | | | 0.93 | % | | | 80,119 | |
| New York | | | 27.70 | % | | | 2,390,283 | |
| Ohio | | | 10.72 | % | | | 925,000 | |
| South Carolina | | | 4.63 | % | | | 400,000 | |
| Texas | | | 11.30 | % | | | 975,001 | |
| Virginia | | | 7.53 | % | | | 650,000 | |
| Money Market Funds | | | 3.86 | % | | | 333,328 | |
| Other Assets in Excess of Liabilities | | | 0.82 | % | | | 70,629 | |
| Total | | | 100.00 | % | | $ | 8,629,363 | |
| See Notes to Financial Statements | |
| Annual Report | October 31, 2022 | 31 |
| Centaur Mutual Funds Trust |
| Statements of Assets and Liabilities |
| October 31, 2022 |
| | | DCM/INNOVA | | | Lebenthal | |
| | | High Equity | | | Ultra Short | |
| | | Income Innovation | | | Tax-Free Income | |
| | | Fund | | | Fund | |
| Assets | | | | | | | | |
| Investments in securities, at fair value (cost $10,262,143 and $8,559,153) | | $ | 9,685,891 | | | $ | 8,558,734 | |
| Foreign currencies, at value (cost $1,943 and $–) | | | 1,891 | | | | — | |
| Receivable from Advisor | | | 54,718 | | | | 33,289 | |
| Dividends and interest receivable | | | 7,040 | | | | 42,384 | |
| Tax reclaims receivable | | | 113,778 | | | | — | |
| Prepaid expenses | | | 11,454 | | | | 29,876 | |
| Total Assets | | | 9,874,772 | | | | 8,664,283 | |
| | | | | | | | | |
| Liabilities | | | | | | | | |
| Payable for fund shares redeemed | | | 3,626 | | | | — | |
| Payable for distributions to shareholders | | | — | | | | 176 | |
| Accrued 12b-1 fees – Class A Shares | | | — | | | | 3 | |
| Payable to Administrator | | | 7,321 | | | | 7,578 | |
| Other accrued expenses | | | 31,728 | | | | 27,163 | |
| Total Liabilities | | | 42,675 | | | | 34,920 | |
| Net Assets | | $ | 9,832,097 | | | $ | 8,629,363 | |
| | | | | | | | | |
| Net Assets consist of: | | | | | | | | |
| Paid-in capital | | | 17,675,840 | | | | 8,629,706 | |
| Accumulated deficit | | | (7,843,743 | ) | | | (343 | ) |
| Net Assets | | $ | 9,832,097 | | | $ | 8,629,363 | |
| See Notes to Financial Statements | |
| 32 | www.dcmmutualfunds.com |
| Centaur Mutual Funds Trust |
| Statements of Assets and Liabilities |
| October 31, 2022 |
| | | DCM/INNOVA | | | Lebenthal | |
| | | High Equity | | | Ultra Short | |
| | | Income Innovation | | | Tax-Free Income | |
| | | Fund | | | Fund | |
| Class I Shares: | | | | | | | | |
| Net Assets | | | | | | $ | 8,614,315 | |
| Shares outstanding (unlimited number of shares authorized, no par value) | | | | | | | 861,458 | |
| Net asset value, offering and redemption price per share | | | | | | $ | 10.00 | |
| | | | | | | | | |
| Class A Shares: | | | | | | | | |
| Net Assets: | | | | | | $ | 15,048 | |
| Shares outstanding (unlimited number of shares authorized, no par value) | | | | | | | 1,503 | |
| Net asset value, redemption price per share (a) | | | | | | $ | 10.01 | |
| Offering price per share (100%/(100%-0.50% (maximum sales charge)) of net asset value adjusted to the nearest cent) | | | | | | $ | 10.06 | |
| | | | | | | | | |
| Net Assets | | $ | 9,832,097 | | | | | |
| Shares outstanding (unlimited number of shares authorized, no par value) | | | 995,404 | | | | | |
| Net asset value, offering and redemption price per share | | $ | 9.88 | | | | | |
| (a) | In the case of investments at or above $250,000, a contingent deferred sales charge of up to 0.25% may be charged on shares redeemed within 12 months of purchase if no sales charge on the original purchase and a finder’s fee was paid. |
| See Notes to Financial Statements | |
| Annual Report | October 31, 2022 | 33 |
| Centaur Mutual Funds Trust |
| Statements of Operations |
| For the year ended October 31, 2022 |
| | | DCM/INNOVA | | | Lebenthal | |
| | | High Equity | | | Ultra Short | |
| | | Income Innovation | | | Tax-Free Income | |
| | | Fund | | | Fund | |
| Investment Income | | | | | | | | |
| Dividend income (net of foreign taxes withheld of $321,954 and $–) | | $ | 2,886,590 | | | $ | 1,741 | |
| Interest income | | | — | | | | 70,906 | |
| Total investment income | | | 2,886,590 | | | | 72,647 | |
| | | | | | | | | |
| Expenses | | | | | | | | |
| Advisor | | | 207,249 | | | | 40,340 | |
| Custodian | | | 65,814 | | | | 5,224 | |
| Administration | | | 45,629 | | | | 41,500 | |
| Legal | | | 35,615 | | | | 38,599 | |
| Fund accounting | | | 32,701 | | | | 36,469 | |
| Registration | | | 27,952 | | | | 36,703 | |
| Insurance | | | 17,268 | | | | 7,138 | |
| Audit and tax | | | 17,000 | | | | 16,400 | |
| Transfer agent | | | 15,000 | | | | 12,000 | |
| Report printing | | | 9,666 | | | | 8,585 | |
| Pricing | | | 8,534 | | | | 14,595 | |
| Trustee | | | 6,000 | | | | 6,000 | |
| 12b-1 fees – Class A Shares | | | — | | | | 487 | |
| Miscellaneous | | | 33,111 | | | | 21,059 | |
| Total expenses | | | 521,539 | | | | 285,099 | |
| Fees contractually waived and expenses reimbursed by Advisor | | | (107,460 | ) | | | (237,549 | ) |
| Fees voluntarily waived and expenses reimbursed by Advisor | | | — | | | | (26,308 | ) |
| Net operating expenses | | | 414,079 | | | | 21,242 | |
| Net investment income | | | 2,472,511 | | | | 51,405 | |
| | | | | | | | | |
| Net Realized and Change in Unrealized Loss on Investments | | | | | | | | |
| Net realized loss on: | | | | | | | | |
| Investment securities | | | (7,245,605 | ) | | | — | |
| Foreign currency transactions | | | (178,878 | ) | | | — | |
| Change in unrealized depreciation on: | | | | | | | | |
| Investment securities | | | (2,847,353 | ) | | | (3,033 | ) |
| Foreign currency translations | | | (11,837 | ) | | | — | |
| Net realized and unrealized gain (loss) on investment securities and foreign currency transactions | | | (10,283,673 | ) | | | (3,033 | ) |
| Net increase (decrease) in net assets resulting from operations | | $ | (7,811,162 | ) | | $ | 48,372 | |
| See Notes to Financial Statements | |
| 34 | www.dcmmutualfunds.com |
| DCM/INNOVA High Equity Income Innovation Fund |
| Statements of Changes in Net Assets |
| | | For the | | | For the | |
| | | Year Ended | | | Year Ended | |
| | | October 31, 2022 | | | October 31, 2021 | |
| Increase (Decrease) in Net Assets due to: | | | | | | | | |
| Operations | | | | | | | | |
| Net investment income | | $ | 2,472,511 | | | $ | 947,865 | |
| Net realized gain (loss) on investment securities and foreign currency transactions | | | (7,424,483 | ) | | | 1,431,403 | |
| Change in unrealized appreciation (depreciation) on investment securities and foreign currency translations | | | (2,859,190 | ) | | | 992,044 | |
| Net increase (decrease) in net assets resulting from operations | | | (7,811,162 | ) | | | 3,371,312 | |
| | | | | | | | | |
| Distributions to Shareholders From: | | | | | | | | |
| Earnings | | | (2,463,839 | ) | | | (880,056 | ) |
| Return of capital | | | (28,123 | ) | | | — | |
| Total distributions | | | (2,491,962 | ) | | | (880,056 | ) |
| | | | | | | | | |
| Capital Transactions | | | | | | | | |
| Proceeds from shares sold | | | 4,836,157 | | | | 27,351,195 | |
| Reinvestment of distributions | | | 2,462,225 | | | | 857,235 | |
| Amount paid for shares redeemed | | | (24,759,843 | ) | | | (1,317,102 | ) |
| Net increase (decrease) in net assets resulting from capital transactions | | | (17,461,461 | ) | | | 26,891,328 | |
| Total Increase (Decrease) in Net Assets | | | (27,764,585 | ) | | | 29,382,584 | |
| | | | | | | | | |
| Net Assets | | | | | | | | |
| Beginning of year | | | 37,596,682 | | | | 8,214,098 | |
| End of year | | $ | 9,832,097 | | | $ | 37,596,682 | |
| | | | | | | | | |
| Share Transactions | | | | | | | | |
| Shares sold | | | 403,865 | | | | 1,972,797 | |
| Shares issued in reinvestment of distributions | | | 200,910 | | | | 62,641 | |
| Shares redeemed | | | (2,266,782 | ) | | | (97,853 | ) |
| Net increase (decrease) in shares outstanding | | | (1,662,007 | ) | | | 1,937,585 | |
| See Notes to Financial Statements | |
| Annual Report | October 31, 2022 | 35 |
| Lebenthal Ultra Short Tax-Free Income Fund |
| Statements of Changes in Net Assets |
| | | For the | | | For the | |
| | | Year Ended | | | Year Ended | |
| | | October 31, 2022 | | | October 31, 2021 | |
| Increase (Decrease) in Net Assets due to: | | | | | | | | |
| Operations | | | | | | | | |
| Net investment income | | $ | 51,405 | | | $ | 7,528 | |
| Change in unrealized appreciation (depreciation) on investment securities | | | (3,033 | ) | | | (9,410 | ) |
| Net increase (decrease) in net assets resulting from operations | | | 48,372 | | | | (1,882 | ) |
| | | | | | | | | |
| Distributions to Shareholders From | | | | | | | | |
| Earnings | | | | | | | | |
| Class I Shares | | | (51,324 | ) | | | (7,558 | ) |
| Total distributions | | | (51,324 | ) | | | (7,558 | ) |
| | | | | | | | | |
| Capital Transactions — Class I Shares | | | | | | | | |
| Proceeds from shares sold | | | 280,051 | | | | 272,511 | |
| Reinvestment of distributions | | | 50,585 | | | | 7,477 | |
| Amount paid for shares redeemed | | | (1,353,600 | ) | | | (10 | ) |
| Total Class I Shares | | | (1,022,964 | ) | | | 279,978 | |
| | | | | | | | | |
| Capital Transactions — Class A Shares | | | | | | | | |
| Proceeds from shares sold | | | 400,000 | | | | 5,200 | |
| Amount paid for shares redeemed | | | (405,085 | ) | | | (30,165 | ) |
| Total Class A Shares | | | (5,085 | ) | | | (24,965 | ) |
| | | | | | | | | |
| Net increase (decrease) in net assets resulting from capital transactions | | | (1,028,049 | ) | | | 255,013 | |
| Total Increase (Decrease) in Net Assets | | | (1,031,001 | ) | | | 245,573 | |
| | | | | | | | | |
| Net Assets | | | | | | | | |
| Beginning of year | | | 9,660,364 | | | | 9,414,791 | |
| End of year | | $ | 8,629,363 | | | $ | 9,660,364 | |
| See Notes to Financial Statements | |
| 36 | www.dcmmutualfunds.com |
| Lebenthal Ultra Short Tax-Free Income Fund |
| Statements of Changes in Net Assets |
| | | For the | | | For the | |
| | | Year Ended | | | Year Ended | |
| | | October 31, 2022 | | | October 31, 2021 | |
| Share Transactions — Class I Shares | | | | | | | | |
| Shares sold | | | 27,996 | | | | 27,251 | |
| Shares issued in reinvestment of distributions | | | 5,059 | | | | 747 | |
| Shares redeemed | | | (135,360 | ) | | | (1 | ) |
| Total Class I Shares | | | (102,305 | ) | | | 27,997 | |
| | | | | | | | | |
| Share Transactions — Class A Shares | | | | | | | | |
| Shares sold | | | 40,120 | | | | 519 | |
| Shares redeemed | | | (40,621 | ) | | | (3,017 | ) |
| Total Class A Shares | | | (501 | ) | | | (2,498 | ) |
| | | | | | | | | |
| Net increase (decrease) in shares outstanding | | | (102,806 | ) | | | 25,499 | |
| See Notes to Financial Statements | |
| Annual Report | October 31, 2022 | 37 |
| DCM/INNOVA High Equity Income Innovation Fund |
| Financial Highlights |
For a share outstanding during each year.
| | | For the | | | For the | | | For the | | | For the | | | For the | |
| | | Year Ended | | | Year Ended | | | Year Ended | | | Year Ended | | | Year Ended | |
| | | October 31, | | | October 31, | | | October 31, | | | October 31, | | | October 31, | |
| | | 2022 | | | 2021 | | | 2020 | | | 2019 | | | 2018 | |
| Net asset value, Beginning of Year | | $ | 14.15 | | | $ | 11.41 | | | $ | 11.69 | | | $ | 13.01 | | | $ | 14.25 | |
| | | | | | | | | | | | | | | | | | | | | |
| Income from investment operations: | | | | | | | | | | | | | | | | | | | | |
| Net investment income (loss) | | | 1.21 | | | | 0.86 | | | | 0.82 | | | | 0.17 | | | | (0.11 | ) |
| Net realized and unrealized gain (loss) on investments | | | (4.40 | ) | | | 2.71 | | | | (0.23 | ) | | | 0.16 | | | | 0.35 | |
| Total from Investment Operations | | | (3.19 | ) | | | 3.57 | | | | 0.59 | | | | 0.33 | | | | 0.24 | |
| | | | | | | | | | | | | | | | | | | | | |
| Less Distributions: | | | | | | | | | | | | | | | | | | | | |
| Net investment income | | | (0.99 | ) | | | (0.83 | ) | | | (0.84 | ) | | | — | | | | — | |
| Net realized gains | | | (0.08 | ) | | | — | | | | — | | | | (1.65 | ) | | | (1.48 | ) |
| Return of capital | | | (0.01 | ) | | | — | | | | (0.03 | ) | | | — | | | | — | |
| Total distributions | | | (1.08 | ) | | | (0.83 | ) | | | (0.87 | ) | | | (1.65 | ) | | | (1.48 | ) |
| | | | | | | | | | | | | | | | | | | | | |
| Net Asset Value, End of Year | | $ | 9.88 | | | $ | 14.15 | | | $ | 11.41 | | | $ | 11.69 | | | $ | 13.01 | |
| | | | | | | | | | | | | | | | | | | | | |
| Total Return(a) | | | (23.57 | )% | | | 31.81 | % | | | 5.29 | % | | | 3.21 | % | | | 1.80 | % |
| | | | | | | | | | | | | | | | | | | | | |
| Net Assets, End of Year (in thousands) | | $ | 9,832 | | | $ | 37,597 | | | $ | 8,214 | | | $ | 10,062 | | | $ | 25,251 | |
| | | | | | | | | | | | | | | | | | | | | |
| Ratio of Gross Expenses to Average Net Assets | | | 1.89 | % | | | 2.35 | % | | | 3.36 | % | | | 3.15 | % | | | 2.56 | % |
| Ratio of Net Expenses to Average Net Assets | | | 1.50 | % | | | 1.50 | % | | | 1.50 | % | | | 1.70 | % | | | 1.95 | % |
| Ratio of Net Investment Income (Loss) to Average Net Assets | | | 8.96 | % | | | 6.06 | % | | | 6.81 | % | | | 1.13 | % | | | (0.84 | )% |
| | | | | | | | | | | | | | | | | | | | | |
| Portfolio Turnover Rate | | | 572 | % | | | 496 | % | | | 435 | % | | | 338 | % | | | 142 | % |
| (a) | Total return represents the rate that the investor would have earned or lost on an investment in the Fund, assuming reinvestment of distributions. |
| See Notes to Financial Statements | |
| 38 | www.dcmmutualfunds.com |
| Lebenthal Ultra Short Tax-Free Income Fund - Class I Shares |
| Financial Highlights |
For a share outstanding during each period.
| | | | | | | | | For the | |
| | | For the | | | For the | | | Period | |
| | | Year Ended | | | Year Ended | | | Ended | |
| | | October 31, | | | October 31, | | | October 31, | |
| | | 2022 | | | 2021 | | | 2020(a) | |
| Net Asset Value, Beginning of Period | | $ | 10.00 | | | $ | 10.01 | | | $ | 10.00 | |
| | | | | | | | | | | | | |
| Income from investment operations: | | | | | | | | | | | | |
| Net investment income | | | 0.06 | | | | 0.01 | | | | 0.04 | |
| Net realized and unrealized gain (loss) on investments | | | — | | | | (0.01 | ) | | | 0.01 | |
| Total from Investment Operations | | | 0.06 | | | | — | | | | 0.05 | |
| | | | | | | | | | | | | |
| Less Distributions: | | | | | | | | | | | | |
| Net investment income | | | (0.06 | ) | | | (0.01 | ) | | | (0.04 | ) |
| Total distributions | | | (0.06 | ) | | | (0.01 | ) | | | (0.04 | ) |
| | | | | | | | | | | | | |
| Net Asset Value, End of Period | | $ | 10.00 | | | $ | 10.00 | | | $ | 10.01 | |
| | | | | | | | | | | | | |
| Total Return(b) | | | 0.57 | % | | | (0.02 | )% | | | 0.48 | % (c) |
| | | | | | | | | | | | | |
| Net Assets, End of Period (in thousands) | | $ | 8,614 | | | $ | 9,640 | | | $ | 9,370 | |
| | | | | | | | | | | | | |
| Ratio of Gross Expenses to Average Net Assets | | | 2.96 | % | | | 3.10 | % | | | 2.87 | % (d) |
| Ratio of Net Expenses to Average Net Assets | | | 0.22 | % | | | 0.36 | % | | | 0.43 | % (d) |
| Ratio of Net Investment Income to Average Net Assets | | | 0.55 | % | | | 0.08 | % | | | 0.41 | % (d) |
| | | | | | | | | | | | | |
| Portfolio Turnover Rate | | | 59 | % | | | 9 | % | | | 88 | % (c) |
| (a) | For the period December 30, 2019 (commencement of operations) to October 31, 2020. |
| (b) | Total return represents the rate that the investor would have earned or lost on an investment in the Fund, assuming reinvestment of distributions. |
| See Notes to Financial Statements | |
| Annual Report | October 31, 2022 | 39 |
| Lebenthal Ultra Short Tax-Free Income Fund - Class A Shares |
| Financial Highlights |
For a share outstanding during each period.
| | | | | | | | | For the | |
| | | For the | | | For the | | | Period | |
| | | Year Ended | | | Year Ended | | | Ended | |
| | | October 31, | | | October 31, | | | October 31, | |
| | | 2022 | | | 2021 | | | 2020(a) | |
| Net Asset Value, Beginning of Period | | $ | 9.98 | | | $ | 10.01 | | | $ | 10.00 | |
| | | | | | | | | | | | | |
| Income from investment operations: | | | | | | | | | | | | |
| Net investment income (loss) | | | 0.06 | | | | (0.03 | ) | | | 0.02 | |
| Net realized and unrealized gain (loss) on investments | | | (0.03 | ) | | | — | (b) | | | 0.01 | |
| Total from Investment Operations | | | 0.03 | | | | (0.03 | ) | | | 0.03 | |
| | | | | | | | | | | | | |
| Less Distributions: | | | | | | | | | | | | |
| Net investment income | | | — | | | | — | | | | (0.02 | ) |
| Total distributions | | | — | | | | — | | | | (0.02 | ) |
| | | | | | | | | | | | | |
| Net Asset Value, End of Period | | $ | 10.01 | | | $ | 9.98 | | | $ | 10.01 | |
| | | | | | | | | | | | | |
| Total Return(c) | | | 0.30 | % | | | (0.30 | )% | | | 0.35 | % (d) |
| | | | | | | | | | | | | |
| Net Assets, End of Period (in thousands) | | $ | 15 | | | $ | 20 | | | $ | 45 | |
| | | | | | | | | | | | | |
| Ratio of Gross Expenses to Average Net Assets | | | 3.22 | % | | | 3.35 | % | | | 3.12 | % (e) |
| Ratio of Net Expenses to Average Net Assets | | | 0.47 | % | | | 0.61 | % | | | 0.68 | % (e) |
| Ratio of Net Investment Income (Loss) to Average Net Assets | | | 0.05 | % | | | (0.16 | )% | | | 0.12 | % (e) |
| | | | | | | | | | | | | |
| Portfolio Turnover Rate | | | 59 | % | | | 9 | % | | | 88 | % (d) |
| (a) | For the period December 30, 2019 (commencement of operations) to October 31, 2020. |
| (b) | Rounds to less than $0.005 per share. |
| (c) | Total return represents the rate that the investor would have earned or lost on an investment in the Fund, assuming reinvestment of distributions. Calculation does not reflect front-end sales charge or contingent deferred sales charge. |
| See Notes to Financial Statements | |
| 40 | www.dcmmutualfunds.com |
| Centaur Mutual Funds Trust |
| Notes to Financial Statements |
| October 31, 2022 |
The DCM/INNOVA High Equity Income Innovation Fund (formerly known as the DCM/ INNOVA High Dividend Income Innovation Fund) (the “DCM/INNOVA Fund”) and the Lebenthal Ultra Short Tax-Free Income Fund (the “Lebenthal Fund”) (each a “Fund” and, collectively the “Funds”), are each organized as diversified series of the Centaur Mutual Funds Trust (the “Trust”). The DCM/INNOVA Fund commenced operations on March 16, 2005 and was formally known as the Centaur Total Return Fund. The Lebenthal Fund commenced operations on December 30, 2019. The Trust is an open ended-management investment company and is organized as a Delaware statutory trust and is registered under the Investment Company Act of 1940 (the “1940 Act”), as amended.
The investment objective of the DCM/INNOVA Fund is to seek maximum total return through a combination of capital appreciation and current income. The investment objective of the Lebenthal Fund is to seek a high level of current income exempt from federal income tax consistent with relative stability of principal. The Lebenthal Fund invests primarily in municipal securities, the income from which is exempt from federal income tax.
The Lebenthal Fund currently offers two classes of shares; Class A Shares and Class I Shares. Each class of shares represents an interest in the Lebenthal Fund, has the same rights and is identical in all material respects, except that the classes bear different (or no) levels of sales loads and different expenses, certain class specific expenses will be borne solely by the class to which such expenses are attributable, and each class has exclusive voting rights with respect to matters relating to its own distribution arrangements. Class A Shares are subject to a front-end sales charge of 0.50% which is waived for purchases of $250,000 or greater. Unless you are otherwise eligible to purchase Class A shares without a sales charge, a CDSC of up to 0.25% will be charged on Class A shares redeemed within 12 months of purchase if you paid no sales charge on the original purchase and a finder’s fee was paid.
| 2. | SIGNIFICANT ACCOUNTING POLICIES |
The following is a summary of significant accounting policies consistently followed by the Funds. The policies are in conformity with accounting principles generally accepted in the United States of America (“GAAP”). The Funds are considered investment companies for financial reporting purposes under GAAP.
| Annual Report | October 31, 2022 | 41 |
| Centaur Mutual Funds Trust |
| Notes to Financial Statements |
| October 31, 2022 |
Estimates
The preparation of financial statements in conformity with GAAP requires management to make estimates and assumptions that affect the reported amounts of assets and liabilities and disclosure of contingent assets and liabilities at the date of the financial statements and the reported amounts of increases and decreases in the net assets from operations during the reported period. Actual results could differ from those estimates.
Investment Valuation
The Funds’ investments in securities are carried at fair value. Securities listed on an exchange or quoted on a national market system are valued at the last sales price as of 4:00 p.m. Eastern Time. Securities traded in the Nasdaq over-the-counter market are generally valued at the Nasdaq Official Closing Price. Other securities traded in the over-the-counter market and listed securities for which no sale was reported on that date are valued at the most recent bid price.
Fixed income securities will ordinarily be traded on the over-the-counter market. When market quotations are readily available, fixed income securities will be valued based on prices provided by independent third-party pricing service. The prices provided by the independent third-party pricing service are generally determined with consideration given to institutional bid and last sale prices and take into account securities prices, yields, maturities, call features, ratings, institutional trading in similar groups of securities, and developments related to specific securities. Such fixed income securities may also be priced based upon a matrix system of pricing similar bonds and other fixed income securities.
Securities and assets for which representative market quotations are not readily available or which cannot be accurately valued using the Funds normal pricing procedures are valued at fair value as determined under policies adopted by the Board of Trustees (the “Board”). Fair value pricing may be used, for example, in situations where (i) a portfolio security is so thinly traded that there have been no transactions for that security over an extended period of time; (ii) the exchange on which the portfolio security is principally traded closes early; or (iii) trading of the portfolio security is halted during the day and does not resume prior to the Funds’ net asset value calculation. A portfolio security’s “fair value” price may differ from the price next available for that portfolio security using the Trust’s normal pricing procedures.
| Centaur Mutual Funds Trust |
| Notes to Financial Statements |
| October 31, 2022 |
Fair Value Measurement
GAAP establishes a framework for measuring fair value and expands disclosure about fair value measurements. Various inputs are used in determining the value of the Funds’ investments. These inputs are summarized in the three broad levels listed below:
| Level 1 – | Unadjusted quoted prices in active markets for identical investments and/or registered investment companies where the value per share is determined and published and is the basis for current transactions for identical assets or liabilities at the valuation date |
| Level 2 – | Other significant observable inputs (including, but not limited to, quoted prices for an identical security in an inactive market, quoted prices for similar securities, interest rates, prepayment speeds, credit risk, etc.) |
| Level 3 – | Significant unobservable inputs (including the Funds’ own assumptions in determining the fair value of investments based on the best information available) |
The availability of observable inputs can vary from security to security and is affected by a wide variety of factors, including, for example, the type of security, whether the security is new and not yet established in the marketplace, the liquidity of markets, and other characteristics particular to the security. To the extent that valuation is based on models or inputs that are less observable or unobservable in the market, the determination of fair value requires more judgment. Accordingly, the degree of judgment exercised in determining fair value is greatest for instruments categorized in Level 3.
An investment asset’s or liability’s level within the fair value hierarchy is based on the lowest level input, individually or in the aggregate, that is significant to fair value measurement.
The valuation techniques used by the Funds to measure fair value during the fiscal year ended October 31, 2022 maximized the use of observable inputs and minimized the use of unobservable inputs.
| Annual Report | October 31, 2022 | 43 |
| Centaur Mutual Funds Trust |
| Notes to Financial Statements |
| October 31, 2022 |
The inputs or methodology used for valuing securities are not necessarily an indication of the risk associated with investing in those securities. The following is a summary of the inputs used in valuing the Funds’ assets and liabilities as of October 31, 2022.
| DCM/INNOVA Fund | | | | | | | | | | | | |
| Investments in Securities at Value | | Level 1 | | | Level 2 | | | Level 3 | | | Total | |
| Assets | | | | | | | | | | | | |
| Common Stocks | | $ | 9,149,502 | | | $ | — | | | $ | — | | | $ | 9,149,502 | |
| Exchange-Traded Funds | | | 504,588 | | | | — | | | | — | | | | 504,588 | |
| Money Market Funds | | | 31,801 | | | | — | | | | — | | | | 31,801 | |
| Total | | $ | 9,685,891 | | | $ | — | | | $ | — | | | $ | 9,685,891 | |
| | | | | | | | | | | | | | | | | |
| Lebenthal Fund | | | | | | | | | | | | |
| Investments in Securities at Value | | Level 1 | | | Level 2 | | | Level 3 | | | Total | |
| Assets | | | | | | | | | | | | |
| Municipal Bonds | | $ | — | | | $ | 8,225,406 | | | $ | — | | | $ | 8,225,406 | |
| Money Market Funds | | | 333,328 | | | | — | | | | — | | | | 333,328 | |
| Total | | $ | 333,328 | | | $ | 8,225,406 | | | $ | — | | | $ | 8,558,734 | |
The Funds did not hold any investments at the end of the reporting period for which significant unobservable inputs (Level 3) were used in determining fair value; therefore, no reconciliation of Level 3 securities is included for this reporting period.
Municipal Securities Risk
The Lebenthal Fund invests primarily in municipal securities. The risk of municipal securities generally depends on the financial and credit status of the issuer. Changes in a municipality’s financial health may make it difficult for the municipality to make interest and principal payments when due. Municipal obligations can be significantly affected by political and economic changes, including inflation, as well as uncertainties in the municipal market related to taxation, legislative changes, or the rights of municipal security holders. Municipal bonds have varying levels of sensitivity to changes in interest rates. Interest rate risk is generally lower for shorter-term municipal bonds and higher for long term municipal bonds.
LIBOR Risk
A Fund may be exposed to financial instruments that are tied to the London Interbank Offered Rate (“LIBOR”). LIBOR is used as a “benchmark” or “reference rate” for various commercial and financial contracts, including corporate and municipal bonds, bank loans, asset-backed and mortgage-related securities, interest rate swaps and other derivatives. Over the last several years, global regulators have indicated an intent to
| Centaur Mutual Funds Trust |
| Notes to Financial Statements |
| October 31, 2022 |
phase out the use of LIBOR. ICE Benchmark Administration, the administrator of LIBOR, ceased publication of most LIBOR settings on a representative basis at the end of 2021 and is expected to cease publication of a majority of U.S. dollar LIBOR settings on a representative basis after June 30, 2023. While some LIBOR linked instruments may contemplate a scenario where LIBOR is no longer available by providing for an alternative rate-setting methodology, not all LIBOR-linked instruments have such provisions and there may be significant uncertainty regarding the effectiveness of any such alternative reference rate methodologies. Public and private sector industry initiatives, regulators and market participants are currently engaged in trying to identify potential successor reference rates, such as the Secured Overnight Financing Rate for U.S. Dollar LIBOR and the Sterling Overnight Interbank Average Rate for Sterling LIBOR. However, there still remains uncertainty regarding successor reference rate methodologies and there is no assurance that the composition or characteristics of any alternative reference rate will be similar to or produce the same value or economic equivalence as LIBOR or that instruments using an alternative rate will have the same volume or liquidity as did LIBOR prior to its discontinuance or unavailability. The transition process away from LIBOR could lead to increased volatility and illiquidity in markets for instruments whose terms currently rely on LIBOR. It could also lead to a reduction in the value of some LIBOR-linked investments and reduce the effectiveness of new hedges placed against existing LIBOR-linked investments. The transition away from LIBOR may also result in operational issues for the Lebenthal Fund and the investment advisor, including the need of making regular fair valuation determinations. No assurances can be given as to the impact of the LIBOR transition (and the timing of any such impact) on a Fund and its investments. Furthermore, the risks associated with the expected discontinuation of LIBOR and transition may be exacerbated if the work necessary to effect an orderly transition to an alternative reference rate is not completed in a timely manner. All of the aforementioned may adversely affect the Lebenthal Fund’s performance and/or NAV.
Sector Focus Risk
While the DCM/INNOVA Fund does not focus its investments on a particular sector, the DCM/INNOVA Fund may, at times, be more heavily invested in certain sectors, which may cause the value of its shares to be especially sensitive to factors and economic risks that specifically affect those sectors and may cause the DCM/INNOVA Fund’s share price to fluctuate more widely than the shares of a mutual fund that invests in a broader range of industries.
| Annual Report | October 31, 2022 | 45 |
| Centaur Mutual Funds Trust |
| Notes to Financial Statements |
| October 31, 2022 |
Foreign Currency Translation
Portfolio securities and other assets and liabilities denominated in foreign currencies are translated into U.S. dollars based on the exchange rate of such currencies against U.S. dollars on the date of valuation. Purchases and sales of securities and income items denominated in foreign currencies are translated into U.S. dollars at the exchange rate in effect on the transaction date. The DCM/INNOVA Fund does not separately report the effect of changes in foreign exchange rates from changes in market prices on securities held. Such changes are included in net realized and unrealized gain or loss from investments.
Realized foreign exchange gains or losses arise from sales of foreign currencies, currency gains or losses realized between the trade and settlement dates on securities transactions and the difference between the recorded amounts of dividends, interest, and foreign withholding taxes, and the U.S. dollar equivalent of the amounts actually received or paid. Net unrealized foreign exchange gains and losses arise from changes in foreign exchange rates on foreign denominated assets and liabilities other than investments in securities held at the end of the reporting period.
Investment Transactions and Investment Income
Investment transactions are accounted for as of the date purchased or sold (trade date) for financial reporting purposes. Dividend income is recorded on the ex-dividend date. Certain dividends from foreign securities will be recorded as soon as the Funds are informed of the dividend if such information is obtained subsequent to the ex-dividend date. Interest income is recorded on the accrual basis and includes amortization of discounts and premiums. Gains and losses are determined on the identified cost basis, which is the same basis used for federal income tax purposes.
Expenses
Expenses that are directly related to one of the Funds are charged to that Fund. Expenses not directly billed to a particular Fund are allocated proportionally among all Funds in relation to net assets of each Fund or another reasonable allocation method. Expenses specifically attributable to any class are borne by that class. Income, realized gains and losses, unrealized appreciation and depreciation, and fund-wide expenses not allocated to a particular class shall be allocated to each class based on the net assets of that class in relation to the net assets of the entire Fund.
| Centaur Mutual Funds Trust |
| Notes to Financial Statements |
| October 31, 2022 |
Dividend Distributions
Dividends from net investment income are generally declared and paid monthly for the DCM/INNOVA Fund. Dividends from net investment income are generally declared daily and paid monthly for the Lebenthal Fund . Distributions from capital gains (if any) are generally declared and distributed annually. Dividends and distributions to shareholders are recorded on ex-date.
Federal Income Taxes
As of and during the fiscal year ended October 31, 2022, the Funds did not have a liability for any unrecognized tax benefits. The Funds file U.S. federal, state, and local tax returns as required. The Funds’ tax returns are subject to examination by the relevant tax authorities until expiration of the applicable statute of limitations which is generally three years after the filing of the tax return. Tax returns for open years have incorporated no uncertain tax positions that require a provision for income taxes.
The Funds’ policy is to continue to comply with the requirements of the Internal Revenue Code that are applicable to regulated investment companies and to distribute all their taxable income to their shareholders. The Funds also intend to distribute sufficient net investment income and net capital gains, if any, so that they will not be subject to excise tax on undistributed income and gains. Therefore, no federal income tax or excise tax provision is required.
| 3. | FEES AND OTHER TRANSACTIONS WITH AFFILIATES |
Advisor
DCM Advisors, LLC (the “Advisor”) is the investment advisor for the Funds. The Advisor serves in the capacity of investment advisor to each Fund pursuant to an investment advisory agreement with the Trust on behalf of the respective Fund. The Advisor receives monthly compensation based on each Fund’s average daily net assets at the annual rate of 0.75% for the DCM/INNOVA Fund and 0.42% for the Lebenthal Fund. For the fiscal year ended October 31, 2022, the Advisor earned fees of $207,249 and $40,340 from the DCM/INNOVA Fund and the Lebenthal Fund, respectively. At October 31, 2022, the Advisor owed $54,718 and $33,289 to the DCM/INNOVA Fund and Lebenthal Fund, respectively, pursuant to the expense limitation agreements described below.
The Advisor has entered into Expense Limitation Agreements with the DCM/INNOVA Fund and the Lebenthal Fund under which the Advisor has contractually agreed to reduce the amount of the investment advisory fees to be paid to the Advisor by the Funds and to assume other expenses of the Funds, if necessary, in an amount that limits the Funds’ annual operating expenses (exclusive of interest, taxes, brokerage commissions, other
| Annual Report | October 31, 2022 | 47 |
| Centaur Mutual Funds Trust |
| Notes to Financial Statements |
| October 31, 2022 |
expenditures which are capitalized in accordance with generally accepted accounting principles, other extraordinary expenses not incurred in the ordinary course of the Funds’ business, dividend expense on securities sold short, “acquired fund fees and expenses,” and amounts, if any, payable pursuant to a plan adopted in accordance with Rule 12b-1 under the 1940 Act) to not more than 1.50% of the average daily net assets of the DCM/INNOVA Fund through December 31, 2022 and not more than 0.49% of the average daily net assets of the Lebenthal Fund through December 31, 2022. For the fiscal year ended October 31, 2022, the Advisor waived fees and reimbursed expenses of $107,460 and $237,549 for the DCM/INNOVA Fund and Lebenthal Fund, respectively. The Expense Limitation Agreement may not be terminated prior to that date without the approval of the Board.
In addition to the expense limitations previously noted, effective June 25, 2020, the Advisor has agreed to a voluntarily waiver of ten basis points (0.10%) of the Lebenthal Fund’s average daily net assets. Effective July 7, 2021, the Advisor has agreed to voluntarily waive an additional ten basis points (0.10%) of the Lebenthal Fund’s average daily net assets. Effective November 2, 2021, the Advisor has agreed to voluntarily waive an additional 5 basis points (0.05%) of the Lebenthal Fund’s average daily net assets. Effective January 12, 2022, the Advisor has agreed to voluntarily waive an additional three basis points (0.03%) of the Lebenthal Fund’s average daily net assets. The Advisor is not entitled to the reimbursement of any fees voluntarily waived or expenses reimbursed. During the fiscal year ended October 31, 2022, the Advisor voluntarily waived fees of $26,308 for the Lebenthal Fund.
Administrator
Ultimus Fund Solutions, LLC (the “Administrator”) provides administration, fund accounting, compliance and transfer agency services to the Funds. The Funds pay the Administrator fees in accordance with the Master Services Agreement for such services. In addition, the Funds pay out-of-pocket expenses including but not limited to postage, supplies and costs of pricing its portfolio securities.
Distributor
Ultimus Fund Distributors, LLC (the “Distributor”) serves as the Trust’s Distributor. The Distributor acts as an agent for the Trust and the distributor of its shares. The Distributor is compensated by the Advisor for its services provided to the Trust. The Distributor operates as a wholly-owned subsidiary of the Administrator.
Certain officers of the Trust are employees of the Administrator and the Distributor.
| Centaur Mutual Funds Trust |
| Notes to Financial Statements |
| October 31, 2022 |
| 4. | DISTRIBUTION PLAN AND FEES |
The Trust, with respect to the Lebenthal Fund, has adopted a Distribution Plan (the “Plan”) for its Class A Shares in accordance with Rule 12b-1 under the 1940 Act. The Plan allows the Fund to pay for certain expenses related to the distribution of its shares (“12b-1 fees”), including, but not limited to, payments to securities dealers and other persons (including the Distributor and its affiliates) who are engaged in the sale of shares of the Lebenthal Fund and who may be advising investors regarding the purchase, sale or retention of the Lebenthal Fund shares; expenses of maintaining personnel who engage in or support distribution of shares or who render shareholder support services not otherwise provided by the Transfer Agent or the Trust; expenses of formulating and implementing marketing and promotional activities, including direct mail promotions and mass media advertising; expenses of preparing, printing and distributing sales literature and prospectuses and statements of additional information and reports for recipients other than existing shareholders; expenses of obtaining such information, analysis and reports with respect to marketing and promotional activities as the Trust may, from time to time, deem advisable; and any other expenses related to the distribution of the Lebenthal Fund shares. The annual limitation for payment of expenses pursuant to the Plan is 0.25% per annum of the Lebenthal Fund’s average daily net assets allocable to the Class A Shares. For the fiscal year ended October 31, 2022, the Class A Shares incurred 12b-1 fees of $487. As of October 31, 2022 the Lebenthal Fund owed the Distributor $3.
| 5. | PURCHASES AND SALES OF INVESTMENT SECURITIES |
For the fiscal year ended October 31, 2022, purchases and sales of investment securities other than short-term investments were as follows:
| | | DCM/INNOVA | | | Lebenthal | |
| | | Fund | | | Fund | |
| Purchases | | $ | 158,484,730 | | | $ | 6,659,026 | |
| Sales | | $ | 175,870,496 | | | $ | 3,630,000 | |
There were no purchases or sales of long-term U.S. government obligations during the fiscal year ended October 31, 2022.
| Annual Report | October 31, 2022 | 49 |
| Centaur Mutual Funds Trust |
| Notes to Financial Statements |
| October 31, 2022 |
Distributions are determined in accordance with Federal income tax regulations, which differ from GAAP, and, therefore, may differ significantly in amount or character from net investment income and realized gains for financial reporting purposes. Financial reporting records are adjusted for permanent book/tax differences to reflect tax character but are not adjusted for temporary differences.
Management has reviewed the Funds’ tax positions taken in tax years that remain subject to examination by all major tax jurisdictions, including federal (i.e., the previous three tax years ends and the interim tax period since then, as applicable), and has determined that the Funds do not have a liability for uncertain tax positions. The Funds recognize interest and penalties, if any, related to unrecognized tax benefits as income tax expense in the Statement of Operations. During the period, the Funds did not incur any interest or penalties.
As of October 31, 2022, the aggregate cost of investments, gross unrealized appreciation (depreciation) and net unrealized appreciation for Federal tax purposes was as follows:
| | | DCM/INNOVA | | | Lebenthal | |
| | | Fund | | | Fund | |
| Gross Unrealized Appreciation | | $ | 376,340 | | | $ | — | |
| Gross Unrealized Depreciation | | | (1,430,036 | ) | | | (419 | ) |
| Net Unrealized Depreciation | | $ | (1,053,696 | ) | | $ | (419 | ) |
| Cost of Investments for Income Tax Purposes | | $ | 10,739,587 | | | $ | 8,559,153 | |
Distributions paid during the fiscal years ended October 31, 2022 and October 31, 2021 were characterized for tax purposes as follows:
| | | DCM/INNOVA | | | Lebenthal | |
| | | Fund | | | Fund | |
| | | 2022 | | | 2021 | | | 2022 | | | 2021 | |
| Distributions paid from: | | | | | | | | | | | | | | | | |
| Ordinary Income | | $ | 2,263,603 | | | $ | 859,659 | | | $ | 1,578 | | | $ | 18 | |
| Tax Exempt Income | | | — | | | | — | | | | 49,570 | | | | 7,540 | |
| Long-Term Capital Gains | | | 200,236 | | | | 20,397 | | | | — | | | | — | |
| Return of Capital | | | 28,123 | | | | — | | | | — | | | | — | |
| Total distributions paid | | $ | 2,491,962 | | | | 880,056 | | | $ | 51,148 | | | $ | 7,558 | |
| Centaur Mutual Funds Trust |
| Notes to Financial Statements |
| October 31, 2022 |
As of October 31, 2022, the components of distributable earnings on a tax basis were as follows:
| | | DCM/INNOVA | | | Lebenthal | |
| | | Fund | | | Fund | |
| Undistributed Tax Exempt Income | | $ | — | | | $ | 257 | |
| Distributions Payable | | | — | | | | (176 | ) |
| Accumulated Capital Losses | | | (6,777,773 | ) | | | (5 | ) |
| Net Unrealized Depreciation | | | (1,065,970 | ) | | | (419 | ) |
| Total Distributable Earnings | | $ | (7,843,743 | ) | | $ | (343 | ) |
As of October 31, 2022, the DCM/INNOVA Fund and the Lebenthal Fund had short-term capital loss carryforwards available to offset future gains and not subject to expiration in the amount of $6,777,773 and $5, respectively.
The Funds have recorded reclassifications in their capital accounts. These reclassifications have no impact on the net asset value of the Funds and are designed generally to present accumulated earnings (deficit) on a tax basis which is considered to be more informative to the shareholder.
| 7. | COMMITMENTS AND CONTINGENCIES |
Under the Trust’s organizational documents, its Officers and Trustees are indemnified against certain liabilities arising out of the performance of their duties to the Funds. In addition, in the normal course of business, the Trust entered into contracts with its service providers, on behalf of the Funds, and others that provide for general indemnifications. The Funds’ maximum exposure under these arrangements is unknown, as this would involve future claims that may be made against the Funds. The Funds expect the risk of loss to be remote.
As of October 31, 2022, there were three Trustees, two of whom are not “interested persons” (as defined in the 1940 Act) of the Trust (the “Independent Trustees”). Each Independent Trustee receives a fee of $2,000 each year plus $500 per series of the Trust per meeting. The officers of the Trust will not receive compensation from the Trust for performing the duties of their offices. All Trustees and officers are reimbursed for any out-of-pocket expenses incurred in connection with attendance at meetings.
| Annual Report | October 31, 2022 | 51 |
| Centaur Mutual Funds Trust |
| Notes to Financial Statements |
| October 31, 2022 |
Management of the Funds has evaluated the need for disclosure and/or adjustments resulting from subsequent events through the date these financial statements were issued. Based upon this evaluation, management has determined that there are no other items requiring adjustment of the financial statements.
| Centaur Mutual Funds Trust |
| Report of Independent Registered Public Accounting Firm |
| October 31, 2022 |
To the Board of Trustees of Centaur Mutual Funds Trust
and the Shareholders of DCM/INNOVA High Equity Income Innovation Fund
and Lebenthal Ultra Short Tax-Free Income Fund
Opinion on the Financial Statements
We have audited the accompanying statements of assets and liabilities of DCM/ INNOVA High Equity Income Innovation Fund and Lebenthal Ultra Short Tax-Free Income Fund, each a series of shares of beneficial interest in Centaur Mutual Funds Trust (the “Funds”), including the schedules of investments, as of October 31, 2022, and the related statements of operations, the statements of changes in net assets and the financial highlights as noted in the table below, and the related notes (collectively referred to as the “financial statements”). In our opinion, the financial statements present fairly, in all material respects, the financial position of the Funds as of October 31, 2022, and the results of their operations, the changes in their net assets and their financial highlights as noted in the table below, in conformity with accounting principles generally accepted in the United States of America.
| | Statements of Operations, Changes in Net |
| Fund | Assets, and Financial Highlights Presented |
| DCM/INNOVA High Equity Income Innovation Fund | The statement of operations for the year ended October 31, 2022, the statements of changes in net assets for each of the years in the two-year period ended October 31, 2022 and the financial highlights for each of the years in the five-year period ended October 31, 2022 |
| | |
| Lebenthal Ultra Short Tax-Free Income Fund | The statement of operations for the year ended October 31, 2022, the statements of changes in net assets for each of the years in the two- year period ended October 31, 2022, and the financial highlights for each of the years in the two-year period ended October 31, 2022 and for the period from December 30, 2019 (commencement of operations) through October 31, 2020 |
| Annual Report | October 31, 2022 | 53 |
| Centaur Mutual Funds Trust |
| Report of Independent Registered Public Accounting Firm |
| October 31, 2022 |
Basis for Opinion
These financial statements are the responsibility of the Funds’ management. Our responsibility is to express an opinion on the Funds’ financial statements based on our audits. We are a public accounting firm registered with the Public Company Accounting Oversight Board (United States) (“PCAOB”) and are required to be independent with respect to the Funds in accordance with the U.S. federal securities law and the applicable rules and regulations of the Securities and Exchange Commission and the PCAOB.
We conducted our audits in accordance with the standards of the PCAOB. Those standards require that we plan and perform the audits to obtain reasonable assurance about whether the financial statements are free of material misstatement, whether due to error or fraud. The Funds are not required to have, nor were we engaged to perform, an audit of their internal control over financial reporting. As part of our audits we are required to obtain an understanding of internal control over financial reporting but not for the purpose of expressing an opinion on the effectiveness of the Funds’ internal control over financial reporting. Accordingly, we express no such opinion.
Our audits included performing procedures to assess the risk of material misstatement of the financial statements, whether due to error or fraud, and performing procedures that respond to those risks. Such procedures included examining, on a test basis, evidence regarding the amounts and disclosures in the financial statements. Our procedures included confirmation of securities owned as of October 31, 2022 by correspondence with the custodian. Our audits also included evaluating the accounting principles used and significant estimates made by management, as well as evaluating the overall presentation of the financial statements. We believe that our audits provide a reasonable basis for our opinion.

BBD, LLP
We have served as the auditor of one or more of the Funds in the Centaur Mutual Funds Trust since 2005.
Philadelphia, Pennsylvania
December 23, 2022
| Centaur Mutual Funds Trust |
| Summary of Fund Expenses |
| October 31, 2022 (Unaudited) |
As a shareholder of the Funds, you incur two types of costs: (1) transaction costs, including sales charges (loads) on purchase payments, reinvested dividends, or other distributions; redemption fees; and exchange fees; and (2) ongoing costs, including management fees; distribution fees [and/or service] (12b-1) fees; and other Fund expenses. This example is intended to help you understand your ongoing costs (in dollars) of investing in the Funds and to compare these costs with the ongoing costs of investing in other mutual funds. The example is based on an investment of $1,000 invested at the beginning of the period and held for the entire period as indicated below.
Actual Expenses – The first line of the table below provides information about the actual account values and actual expenses. You may use the information in this line, together with the amount you invested, to estimate the expenses that you paid over the period. Simply divide your account value by $1,000 (for example, an $8,600 account value divided by $1,000 = 8.6), then multiply the result by the number in the first line under the heading entitled “Expenses Paid During Period” to estimate the expenses you paid on your account during this period.
Hypothetical Example for Comparison Purposes – The second line of the table below provides information about hypothetical account values and hypothetical expenses based on the Funds’ actual expense ratio and an assumed annual rate of return of 5% before expenses, which is not the Funds’ actual return. The hypothetical account values and expenses may not be used to estimate the actual ending account balance or expenses you paid for the period. You may use this information to compare the ongoing costs of investing in the Funds and other funds by comparing this 5% hypothetical example with the 5% hypothetical examples that appear in the shareholder reports of other funds. Please note that the expenses shown in the table are meant to highlight your ongoing costs only and do not reflect any direct costs, such as wire fees or low balance fees. Therefore, the second line of the table is useful in comparing ongoing costs and will not help you determine the relative total costs of owning different funds. In addition, if these direct costs were included, your costs would be higher.
| Annual Report | October 31, 2022 | 55 |
| Centaur Mutual Funds Trust |
| Summary of Fund Expenses |
| October 31, 2022 (Unaudited) |
| | | Beginning | | Ending | | Expenses | | Annualized |
| | | Account Value, | | Account Value, | | Paid During | | Expense |
| | | May 1, 2022 | | October 31, 2022 | | Period(a) | | Ratio |
| DCM/INNOVA Fund | | | | | | | | |
| Actual | | $1,000.00 | | $ 869.40 | | $8.29 | | 1.76% |
| Hypothetical (5% return before expenses) | | $1,000.00 | | $1,016.34 | | $8.94 | | 1.76% |
| Lebenthal Fund - Class A Shares | | | | | | | | |
| Actual | | $1,000.00 | | $1,005.00 | | $2.33 | | 0.46% |
| Hypothetical (5% return before expenses) | | $1,000.00 | | $1,022.88 | | $2.35 | | 0.46% |
| Lebenthal Fund - Class I Shares | | | | | | | | |
| Actual | | $1,000.00 | | $1,006.30 | | $1.06 | | 0.21% |
| Hypothetical (5% return before expenses) | | $1,000.00 | | $1,024.15 | | $1.07 | | 0.21% |
| (a) | Expenses are equal to the Funds’ annualized expense ratios, multiplied by the average account value over the period, multiplied by the number of days in the most recent fiscal half year (184), divided by 365. |
| Centaur Mutual Funds Trust |
| Additional Information |
| October 31, 2022 (Unaudited) |
PROXY VOTING POLICIES AND VOTING RECORD
Both (i) a description of the Trust’s Proxy Voting and Disclosure Policy and the Advisor’s Proxy Voting and Disclosure Policy are included as Appendix B to the Funds’ Statement of Additional Information and (ii) information regarding how the Trust voted proxies relating to the Funds’ portfolio securities during the most recent 12-month period ended June 30th are available, without charge, upon request, by calling the Trust at (888) 484-5766, or on the on the Securities and Exchange Commission’s (“SEC”) website at https://www.sec.gov.
QUARTERLY PORTFOLIO HOLDINGS
The Trust files each Fund’s complete schedule of portfolio holdings with the SEC for the first and third quarters of each fiscal year as an exhibit to its reports on Form N-PORT, within sixty days after the end of the period. The Funds’ portfolio holdings are available on the SEC’s website at https://www.sec.gov and on the Funds’ website at http://www.dcmmutualfunds.com.
TAX INFORMATION
The Form 1099-DIV you receive in January 2023 will show the tax status of all distributions paid to your account in calendar year 2022. Shareholders are advised to consult their own tax advisor with respect to the tax consequences of their investment in the Funds. As required by the Internal Revenue Code and/or regulations, shareholders must be notified regarding the status of qualified dividend income for individuals and the dividends received deduction for corporations.
Qualified Dividend Income. The Funds designate the following percentage or up to the maximum amount of such dividends allowable pursuant to the Internal Revenue Code, as qualified dividend income eligible for the reduced tax rate.
| | | DCM/INNOVA | | Lebenthal |
| | | Fund | | Fund |
| Qualified Dividend Income | | 15% | | 0% |
| Annual Report | October 31, 2022 | 57 |
| Centaur Mutual Funds Trust |
| Additional Information |
| October 31, 2022 (Unaudited) |
Qualified Business Income. The Funds designate the following percentage of ordinary income dividends, or up to the maximum amount of such dividends allowable pursuant to the Internal Revenue Code, as qualified business income.
| | | DCM/INNOVA | | Lebenthal |
| | | Fund | | Fund |
| Qualified Business Income | | 0% | | 0% |
Dividends Received Deduction. Corporate shareholders are generally entitled to take the dividends received deduction on the portion of the Funds’ dividend distribution that qualifies under tax law. For the Funds’ calendar year 2022 ordinary income dividends, the following percentage qualifies for the corporate dividends received deductions.
| | | DCM/INNOVA | | Lebenthal |
| | | Fund | | Fund |
| Dividends Received Deduction | | 14% | | 0% |
The Funds designate the following amounts as long-term capital gains distributions. The amounts designated may not agree with long-term capital gains in the tax character of distribution table due to utilization of earnings and profits distributed to shareholders on redemption of shares.
| | | DCM/INNOVA | | | Lebenthal | |
| | | Fund | | | Fund | |
| Long-Term Capital Gains Distributions | | $ | 200,236 | | | $ | — | |
The Lebenthal Fund designated tax-exempt distributions in the amount of $49,570 for the fiscal year ended October 31, 2022.
| Centaur Mutual Funds Trust |
| Liquidity Risk Management Program |
| October 31, 2022 (Unaudited) |
The Funds have adopted and implemented a written liquidity risk management program (the “Program”) as required by Rule 22e-4 (the “Liquidity Rule”) under the 1940 Act. The Program is reasonably designed to assess and manage each Fund’s liquidity risk, taking into consideration, among other factors, each Fund’s investment strategy and the liquidity of its portfolio investments during normal and reasonably foreseeable stressed conditions; its short and long-term cash flow projections; and its cash holdings and access to other funding sources. The Fund’s Board of Trustees (the “Board”) approved the appointment of the Liquidity Administrator, who is the Chief Compliance Officer of the Fund’s Adviser, to be responsible for the Program’s administration and oversight and for reporting to the Board on at least an annual basis regarding the Program’s operation and effectiveness. The Liquidity Administrator maintains Program oversight and reports to the Board on at least an annual basis regarding the Program’s operational effectiveness through a written report (the “Report”). The Report outlined the operation of the Program and the adequacy and effectiveness of the Program’s implementation and was presented to the Board for consideration at its meeting held on September 22, 2022. During the review period, June 1, 2021 through May 31, 2022 (the “Review Period”), neither of the Funds experienced unusual stress or disruption to its operations related to purchase and redemption activity. Also, during the Review Period, the Funds held adequate levels of cash and highly liquid investments to meet shareholder redemption activities in accordance with applicable requirements. The Report concluded that (i) the Program is reasonably designed to prevent violation of the Liquidity Rule and (ii) the Program has been effectively implemented.
| Annual Report | October 31, 2022 | 59 |
| Centaur Mutual Funds Trust |
| Trustees and Officers |
| October 31, 2022 (Unaudited) |
Name
and Year of
Birth* | Position(s)
held with
Fund/Trust | Length of
Time
Served | Principal
Occupation(s)
During Past 5
Years | Number of
Portfolios in
Fund Complex
Overseen by
Trustee | Other Directorships
Held by Trustee
During the Past 5 Years |
| INDEPENDENT TRUSTEES |
James H.
Speed, Jr.,
(Born 1953) | Trustee and Chairman | Since 3/2009 (Chairman since 9/2012) | Retired, Private Investor (2016 to present); President and Chief Executive Officer (“CEO”) of NC Mutual Life Insurance Company (insurance company) (May 2003 to December 2015). | 3 | Independent Trustee of Hillman Capital Management Investment Trust for its one series, Brown Capital Management Funds for its four series, Starboard Investment Trust for its fourteen series, WST Investment Trust for its one series, and Chesapeake Investment Trust for its one series (all registered investment companies); Member of Board of Directors of M&F Bancorp; Member of Board of Directors of Investors Title Company |
Thomas G.
Douglass,
(Born 1956) | Trustee | Since 9/2013 | Principal, Douglass and Douglass, Attorneys | 3 | Independent Trustee of WST Investment Trust for its one series (a registered investment company) |
| INTERESTED TRUSTEE |
Marc
Rappaport,
(Born 1963) | Vice President | Since 9/2020 | CEO of DCM Advisors, LLC | 3 | None |
| Centaur Mutual Funds Trust |
| Trustees and Officers |
| October 31, 2022 (Unaudited) |
Name
and Year of
Birth* | Position(s)
held with
Fund/Trust | Length of
Time
Served | Principal
Occupation(s)
During Past 5
Years | Number of
Portfolios in
Fund Complex
Overseen by
Trustee | Other Directorships
Held by Trustee
During the Past 5 Years |
| OFFICERS |
David R. Carson,
(Born 1958) | President (Principal Executive Officer) | Since 11/2018 | Senior Vice President, Director of Client Strategies, Ultimus Fund Solutions, LLC (2013 to present) | N/A | N/A |
Zachary P. Richmond
(Born 1980) | Treasurer (Principal Financial Officer) | Since 5/2019 | Vice President, Director of Financial Administration, Ultimus Fund Solutions, LLC since February 2019; Associate Vice President, Associate Director of Financial Administration, Ultimus Fund Solutions, LLC (December 2015 to February 2019). | N/A | N/A |
Martin R. Dean
(Born 1963) | Chief Compliance Officer | Since 4/2022 | Senior Vice President, Director of Fund Compliance, Ultimus Fund Solutions LLC (since January 2016) | N/A | N/A |
Paul F. Leone
(Born 1963) | Secretary | Since 9/2020 | Vice President, Senior Legal Counsel; Ultimus Fund Solutions, LLC (since August 2020); Attorney, Leone Law Office P.C. (August 2019 to August 2020); Senior Counsel, Empower Retirement (May 2015 to July 2019). | N/A | N/A |
| Annual Report | October 31, 2022 | 61 |
Revised September 2020
| FACTS | WHAT DOES THE CENTAUR MUTUAL FUNDS TRUST DO WITH YOUR PERSONAL INFORMATION? |
| |
| Why? | Financial companies choose how they share your personal information. Federal law gives consumers the right to limit some but not all sharing. Federal law also requires us to tell you how we collect, share, and protect your personal information. Please read this notice carefully to understand what we do. |
| |
| What? | The types of personal information we collect and share depend on the product or service you have with us. This information can include: ● Social Security number and assets ● Account balances and transaction history ● Checking account information and wire transfer instructions When you are no longer our customer, we continue to share your information as described in this notice. |
| |
| How? | All financial companies need to share customers’ personal information to run their everyday business. In the section below, we list the reasons financial companies can share their customers’ personal information; the reasons the Centaur Mutual Funds Trust chooses to share; and whether you can limit this sharing. |
| |
| REASONS WE CAN SHARE YOUR PERSONAL INFORMATION | Does the Centaur
Mutual Funds Trust
share? | Can you limit
this sharing? |
| For our everyday business purposes —such as to process your transactions, maintain your account(s), respond to court orders and legal investigations, or report to credit bureaus | Yes | No |
| For our marketing purposes —to offer our products and services to you | No | We do not share. |
| For joint marketing with other financial companies | No | We do not share. |
| For our affiliates’ everyday business purposes — information about your transactions and experiences | No | We do not share. |
| For our affiliates’ everyday business purposes — information about your creditworthiness | No | We do not share. |
| For nonaffiliates to market to you | No | We do not share. |
| | | | |
| QUESTIONS? | Call 1-888-484-5766 |
| CENTAUR PRIVACY POLICY | Page 2 | |
| WHO WE ARE |
| Who is providing this notice? | The Centaur Mutual Funds Trust DCM/INNOVA High Equity Income Innovation Fund Lebenthal Ultra Short Tax-Free Income Fund |
| WHAT WE DO |
| How does the Centaur Mutual Funds Trust protect my personal information? | To protect your personal information from unauthorized access and use, we use security measures that comply with federal law. These measures include computer safeguards and secured files and buildings. We require any companies that help provide our services to you to protect the confidentiality of the personal information they receive. |
| How does the Centaur Mutual Funds Trust collect my personal information? | We collect your personal information, for example, when you ● open an account or give us your account information ● make deposits or withdrawals from our account ● pay us by check or make a wire transfer We also collect your personal information from other companies. |
| Why can’t I limit all sharing? | Federal law gives you the right to limit only ● sharing for affiliates’ everyday business purposes – information about your creditworthiness ● affiliates from using your information to market to you ● sharing for nonaffiliates to market to you State laws and individual companies may give you additional rights to limit sharing. |
| |
| DEFINITIONS |
| Affiliates | Companies related by common ownership or control. They can be financial and nonfinancial companies. ● DCM Advisors, LLC, an affiliate of Dinosaur Group Holdings, LLC, is the investment advisor to the Funds and is an affiliate of the Centaur Mutual Funds Trust. |
| Nonaffiliates | Companies not related by common ownership or control. They can be financial and nonfinancial companies. ● The Centaur Mutual Funds Trust does not share information with nonaffiliates so they can market to you. |
| Joint marketing | A formal agreement between nonaffiliated financial companies that together market financial products or services to you. ● The Centaur Mutual Funds Trust does not jointly market. |
| Annual Report | October 31, 2022 | 63 |
THIS PAGE INTENTIONALLY LEFT BLANK
Centaur-AR-22
The Centaur Mutual Funds Trust is distributed by Ultimus Fund Distributors, LLC.
Item 2. Code of Ethics.
| (a) | As of the end of the period covered by this report, Centaur Mutual Funds Trust (the “registrant”) |
has adopted a code of ethics (the “Section 406 Standards for Investment Companies – Ethical Standards for Principal Executive and Financial Officers”) that applies to the registrant’s Principal Executive Officer and Principal Financial Officer.
| (c) | Not applicable to registrant. |
| (d) | Not applicable to registrant. |
| (e) | Not applicable to registrant. |
(f) (1) A copy of the code of ethics that applies to the registrant’s Principal Executive Officer and Principal Financial Officer is filed pursuant to Item 12(a)(1) below.
Item 3. Audit Committee Financial Expert.
The registrant’s Board of Trustees has determined that the following member of the Board’s Audit Committee is an “audit committee financial expert,” and is “independent,” for purposes of this Item: James H. Speed, Jr.
Item 4. Principle Accountant Fees and Services.
| (a) | Audit fees billed to the registrant by the independent accountant for the last two fiscal years: |
| DCM/INNOVA High Equity Income Innovation Fund | | FY 2022 | | $12,500 | |
| | | FY 2021 | | $12,500 | |
| | | | | | |
| Lebenthal Ultra Short Tax-Free Income Fund | | FY 2022 | | $13,900 | |
| | | FY 2021 | | $13,500 | |
These amounts represent aggregate fees billed by the registrant’s independent accountant, BBD, LLP (“Accountant”), in connection with the annual audits of the registrant’s financial statements and for services normally provided by the Accountant in connection with the registrant’s statutory and regulatory filings for those fiscal years.
(b) Audit-Related Fees billed by the registrant’s independent accountant for the last two fiscal years:
| DCM/INNOVA High Equity Income Innovation Fund | | FY 2022 | | $0 | |
| | | FY 2021 | | $0 | |
| | | | | | |
| Lebenthal Ultra Short Tax-Free Income Fund | | FY 2022 | | $0 | |
| | | FY 2021 | | $0 | |
These amounts represent assurance and related services by the Accountant that were reasonably related to the performance of the audit of the registrant’s financial statements that were not reported under paragraph (a) of this Item.
(c) Tax Fees billed to the registrant’s independent accountant for the last two fiscal years:
| DCM/INNOVA High Equity Income Innovation Fund | | FY 2022 | | $3,000 | |
| | | FY 2021 | | $2,500 | |
| | | | | | |
| Lebenthal Ultra Short Tax-Free Income Fund | | FY 2022 | | $3,000 | |
These amounts represent professional services rendered by the Accountant for tax compliance, tax advice, and tax planning. These services were for the completion of the Fund’s federal and state income tax returns, excise tax returns, and assistance with distribution calculations.
(d) All Other Fees paid to the registrant’s independent accountant which were not disclosed in Items (a) through (c) above during the last two fiscal years:
| DCM/INNOVA High Equity Income Innovation Fund | | FY 2022 | | $0 | |
| | | FY 2021 | | $0 | |
| | | | | | |
| Lebenthal Ultra Short Tax-Free Income Fund | | FY 2022 | | $0 | |
| | | FY 2021 | | $0 | |
(e)(1) The registrant’s Board of Trustees pre-approved the engagement of the Accountant for the last two fiscal years at an audit committee meeting of the Board of Trustees called for such purpose; and will pre-approve the Accountant for each fiscal year thereafter at an audit committee meeting called for such purpose. The charter of the audit committee states that the audit committee should pre-approve any audit services and, when appropriate, evaluate and pre-approve any non-audit services provided by the Accountant to the registrant and to pre-approve, when appropriate, any non-audit services provided by the Accountant to the registrant’s investment adviser, or any entity controlling, controlled by, or under common control with the investment adviser that provides ongoing services to the registrant if the engagement relates directly to the operations and financial reporting of the registrant.
(e)(2) None of the services described in paragraph (b) through (d) of this Item were approved by the audit committee pursuant to paragraph (c)(7)(i)(C) of Rule 2-01 of Regulation S-X.
(f) Not applicable.
(g) Non-Audit Fees – Aggregate non-audit fees billed by the Accountant to the registrant for services rendered for the fiscal years ended October 31, 2020 and October 31, 2019 were $5,000 and $2,000, respectively. There were no fees billed by the Accountant for non-audit services rendered to the registrant’s investment adviser, or any other entity controlling, controlled by, or under common control with the registrant’s investment adviser.
(h) Not applicable.
(i) Not applicable.
(j) Not applicable.
Item 5. Audit Committee of Listed Companies.
NOT APPLICABLE – applies to listed companies only
Item 6. Schedule of Investments. Schedule filed with Item 1.
Item 7. Disclosure of Proxy Voting Policies and Procedures for Closed-End Management Investment Companies.
NOT APPLICABLE – applies to closed-end funds only
Item 8. Portfolio Managers of Closed-End Investment Companies.
NOT APPLICABLE – applies to closed-end funds only
Item 9. Purchases of Equity Securities by Closed-End Management Investment Company and Affiliated Purchasers.
NOT APPLICABLE – applies to closed-end funds only
Item 10. Submission of Matters to a Vote of Security Holders.
NOT APPLICABLE
Item 11. Controls and Procedures.
(a) The registrant’s Principal Executive Officer and Principal Financial Officer have concluded that the registrant's disclosure controls and procedures (as defined in Rule 30a-3(c) under the Act) are effective in design and operation and are sufficient to form the basis of the certifications required by Rule 30a-2 under the Act, based on their evaluation of these disclosure controls and procedures within 90 days of the filing of this report on Form N-CSR.
(b) There were no changes in the registrant’s internal control over financial reporting (as defined in Rule 30a-3(d) under the Act (17 CFR 270.30a-3(d)) that occurred during the period covered by this report that have materially affected or are reasonably likely to materially affect, the registrant’s internal control over financial reporting.
Item 12. Disclosure of Securities Lending Activities for Closed-End Investment Companies.
Not Applicable.
Item 13. Exhibits.
(a)(1) Exhibit EX-99.CODE ETH – Code of Ethics
(a)(2) Certifications pursuant to Rule 30a-2(a) are attached hereto.
(a)(3) Not applicable.
(b) Certifications pursuant to Rule 30a-2(b) are furnished herewith.
SIGNATURES
Pursuant to the requirements of the Securities Exchange Act of 1934 and the Investment Company Act of 1940, the registrant has duly caused this report to be signed on its behalf by the undersigned, thereunto duly authorized.
(Registrant) Centaur Mutual Funds Trust
By (Signature and Title)* /s/ David R. Carson
David R. Carson, Principal Executive Officer
Date 1/06/2023
Pursuant to the requirements of the Securities Exchange Act of 1934 and the Investment Company Act of 1940, this report has been signed below by the following persons on behalf of the registrant and in the capacities and on the dates indicated.
By (Signature and Title)* /s/ David R. Carson
David R. Carson, Principal Executive Officer
Date 1/06/2023
By (Signature and Title)* /s/ Zachary P. Richmond
Zachary P. Richmond, Treasurer
Date 1/06/2023