
1 Review of Second Quarter F’13 Results Matthew M. Mannelly, CEO Ronald M. Lombardi, CFO November 1, 2012 Exhibit 99.2
2 This presentation contains certain “forward-looking” statements within the meaning of the Private Securities Litigation Reform Act of 1995, such as statements about the Company’s growth strategies, investments in advertising and promotion, market position, product introductions and innovations, leverage, capital expenditures, growth and future financial performance. Words such as "continue," "will," "believe," “intend,” “expect,” “anticipate,” “plan,” “potential,” “estimate,” “may,” “should,” “could,” “would,” and similar expressions identify forward-looking statements. Such forward-looking statements represent the Company’s expectations and beliefs and involve a number of known and unknown risks, uncertainties and other factors that may cause actual results to differ materially from those expressed or implied by such forward-looking statements. These factors include, among others, the failure to successfully integrate the GSK brands or other future acquisitions, the failure to successfully commercialize new and enhanced products, the Company’s inability to rapidly deleverage, the effectiveness of the Company’s advertising and promotions investments, further decline in the household cleaning products market, the severity of the cold/cough season, the effectiveness of the Company’s marketing and distribution infrastructure, and other risks set forth in Part I, Item 1A. Risk Factors in the Company’s Annual Report on Form 10-K for the year ended March 31, 2012 and Part II, Item 1A. Risk Factors in the Company’s Quarterly Report on Form 10-Q for the quarter ended June 30, 2012. You are cautioned not to place undue reliance on these forward- looking statements, which speak only as of the date of this presentation. Except to the extent required by applicable securities laws, the Company undertakes no obligation to update any forward-looking statement contained herein, whether as a result of new information, future events, or otherwise. Safe Harbor Disclosure
3 Q2 FY2013: Performance Highlights Q2 FY2013: Financial Overview Prestige’s Strategy: Delivering Results; Poised for Continued Success 1 2 3 Agenda
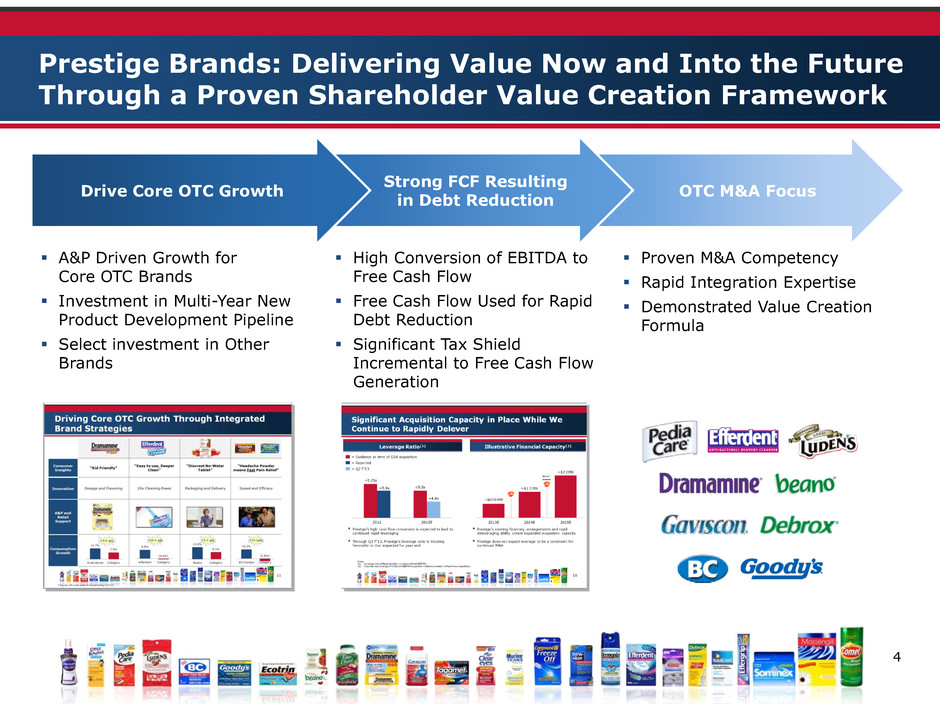
4 OTC M&A Focus Strong FCF Resulting in Debt Reduction Drive Core OTC Growth A&P Driven Growth for Core OTC Brands Investment in Multi-Year New Product Development Pipeline Select investment in Other Brands High Conversion of EBITDA to Free Cash Flow Free Cash Flow Used for Rapid Debt Reduction Significant Tax Shield Incremental to Free Cash Flow Generation Proven M&A Competency Rapid Integration Expertise Demonstrated Value Creation Formula Prestige Brands: Delivering Value Now and Into the Future Through a Proven Shareholder Value Creation Framework
5 Excellent financial performance for the quarter − Record Q2 consolidated net revenue of $161.8 million, up 53.4% − Financial profile, including acquired GSK brands, in line with expectations; GM expansion of ~600bps − Adjusted EPS(1) of $0.42, up 61.5% versus prior year corresponding quarter − Adjusted Cash flow from Operations of $31.9 million(5) − Leverage ratio(2) of ~4.6x, down from ~5.25x at the time of the GSK brands acquisition Brand building strategy delivered consistent organic growth for core OTC brands − Core OTC organic net revenue growth of 11.3%(3) − Core OTC consumption growth significantly exceeding category growth; Up 10.5% in L-12 weeks compared to category growth of 1.5%(4) − Nine consecutive quarters of organic net revenue increases for core OTC brands(3) Successful and timely integration of GSK brands − Actively executing against brand plans and new product opportunities − Continued seamless integration into Prestige supply chain Raising full year guidance − Full year FY’13 Adjusted EPS guidance of $1.37 - $1.42, up from prior guidance of $1.22 - $1.32 Notes: (1) This non-GAAP financial measure is reconciled to its most closely related GAAP financial measure in our earnings release in the “About Non-GAAP Financial Measures” section. Adjusted EPS is also reconciled to reported EPS on slide 16. (2) Leverage ratio reflects net debt / covenant defined EBITDA. (3) Excludes acquired GSK brands. (4) IRI multi-outlet retail dollar sales for the period ending 10/7/12; Includes acquired GSK brands. (5) Adjusted cash flow from operations is a non-GAAP financial measure and is reconciled to reported cash flow from operations on slide 17. Second Quarter Highlights: Delivering Against Stated Strategy
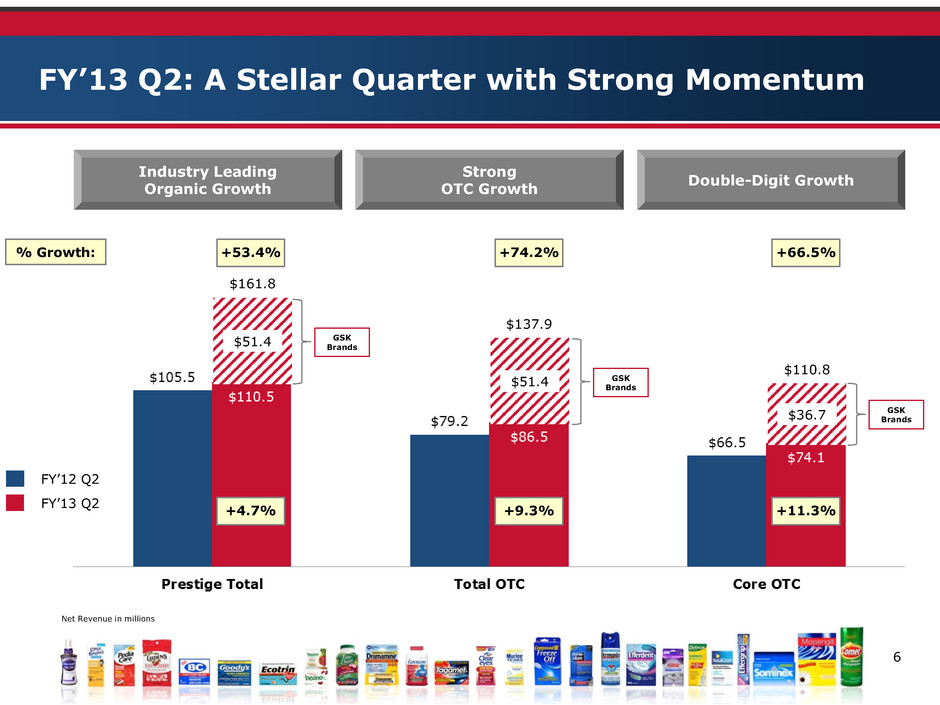
6 $51.4 $51.4 $36.7 $137.9 $161.8 $110.8 FY’13 Q2 FY’12 Q2 +53.4% +74.2% +11.3% Net Revenue in millions FY’13 Q2: A Stellar Quarter with Strong Momentum Industry Leading Organic Growth Strong OTC Growth Double-Digit Growth +4.7% +9.3% +66.5% % Growth: GSK Brands GSK Brands GSK Brands

7 Dollar values in millions Note: Excludes acquired GSK brands (1) Q4 FY’12, Q1 FY’13 and Q2 FY’13 prior year comparable quarter includes Blacksmith Brands and Dramamine. Nine Straight Quarters of Core OTC Organic Revenue Growth Excluding Acquisitions (1) (1) Double Digit Core OTC Organic Revenue Growth in 4 of Past 9 Quarters
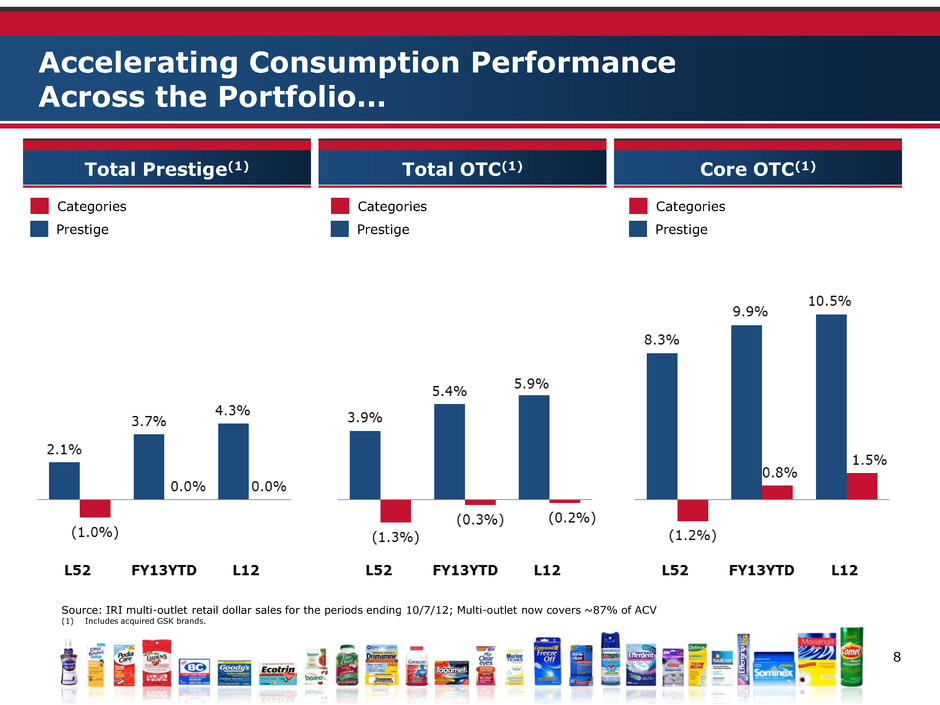
8 Accelerating Consumption Performance Across the Portfolio… Total Prestige(1) Total OTC(1) Core OTC(1) Prestige Categories Prestige Categories Prestige Categories Source: IRI multi-outlet retail dollar sales for the periods ending 10/7/12; Multi-outlet now covers ~87% of ACV (1) Includes acquired GSK brands.
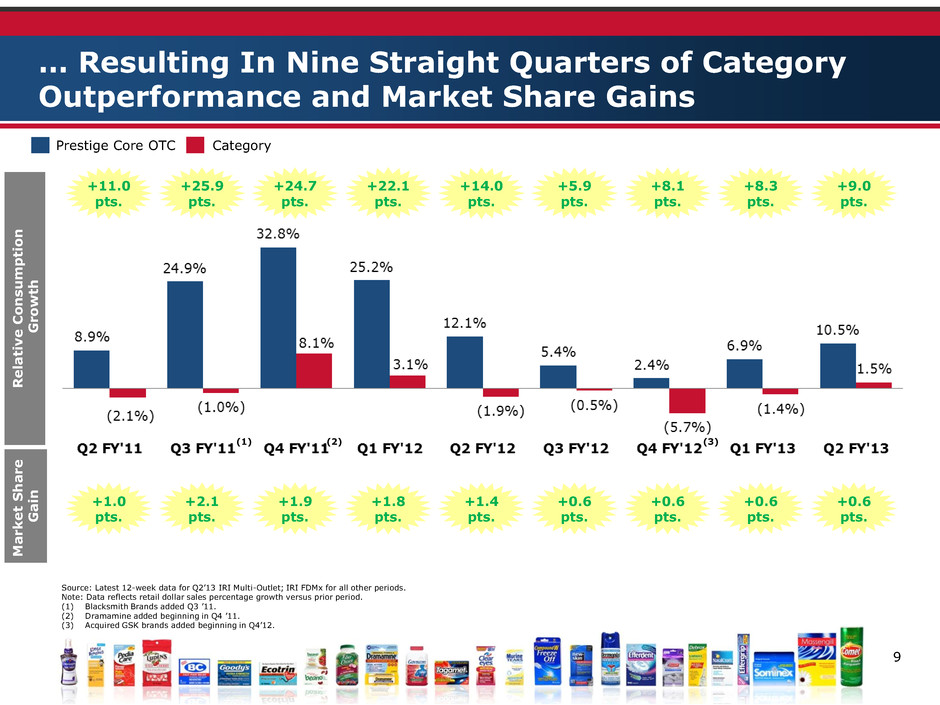
9 … Resulting In Nine Straight Quarters of Category Outperformance and Market Share Gains Category Source: Latest 12-week data for Q2’13 IRI Multi-Outlet; IRI FDMx for all other periods. Note: Data reflects retail dollar sales percentage growth versus prior period. (1) Blacksmith Brands added Q3 ’11. (2) Dramamine added beginning in Q4 ’11. (3) Acquired GSK brands added beginning in Q4’12. Prestige Core OTC +11.0 pts. +25.9 pts. +24.7 pts. +22.1 pts. +14.0 pts. +5.9 pts. +8.1 pts. +8.3 pts. (1) (3) Re la tiv e Con s umptio n G ro w th M a rk e t Share G a in +9.0 pts. +1.0 pts. +2.1 pts. +1.9 pts. +1.8 pts. +1.4 pts. +0.6 pts. +0.6 pts. +0.6 pts. +0.6 pts. (2)
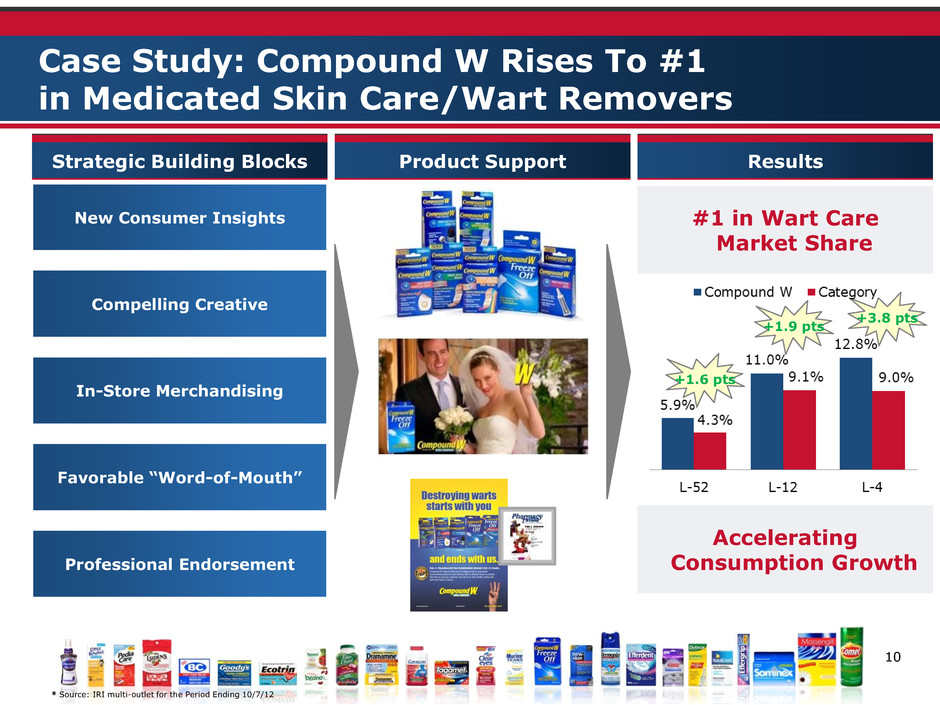
10 +3.8 pts Case Study: Compound W Rises To #1 in Medicated Skin Care/Wart Removers Strategic Building Blocks #1 in Wart Care Market Share New Consumer Insights In-Store Merchandising Professional Endorsement Compelling Creative Favorable “Word-of-Mouth” +1.9 pts * Source: IRI multi-outlet for the Period Ending 10/7/12 Product Support Results +1.6 pts Accelerating Consumption Growth

11 Driving Core OTC Growth Through Integrated Brand Strategies “Kid Friendly” “Easy to use, Deeper Clean” “Discreet No-Water Tablet” “Headache Powder means Fast Pain Relief” Dosage and Flavoring 10x Cleaning Power Packaging and Delivery Speed and Efficacy +4.8 pts +10.4 pts +5.7 pts +13.1pts Consumer Insights Innovation A&P and Retail Support Consumption Growth * Source: IRI multi-outlet for Period Ending 10/7/12
12 Q1 FY2013: Performance Highlights Q1 FY2013: Financial Overview Prestige’s Strategy: Delivering Results; Poised for Continued Success 1 2 3 Agenda 2
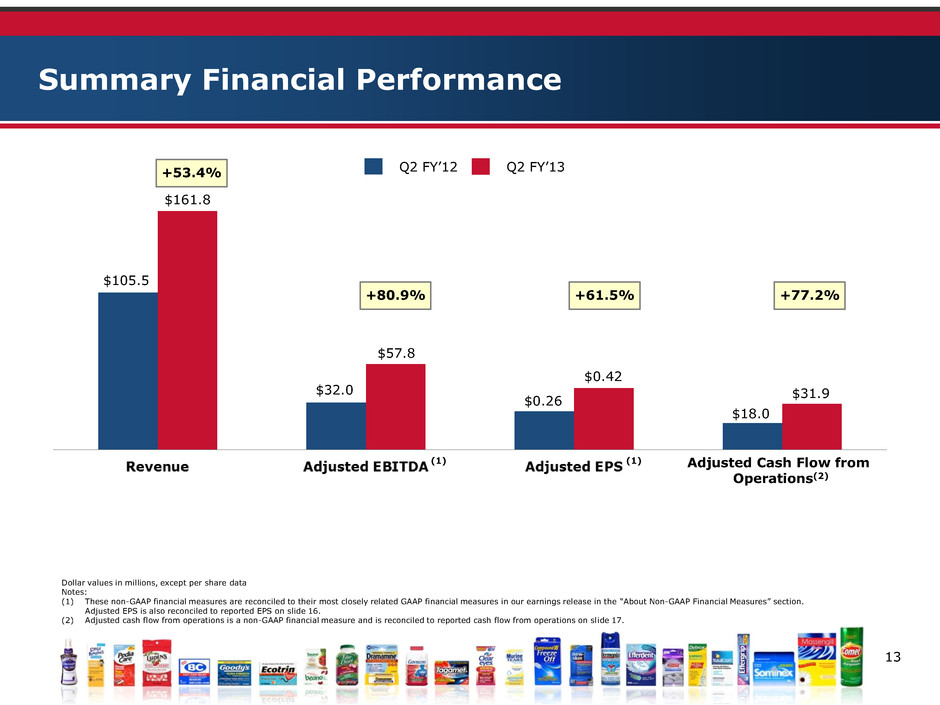
13 Summary Financial Performance Dollar values in millions, except per share data Notes: (1) These non-GAAP financial measures are reconciled to their most closely related GAAP financial measures in our earnings release in the “About Non-GAAP Financial Measures” section. Adjusted EPS is also reconciled to reported EPS on slide 16. (2) Adjusted cash flow from operations is a non-GAAP financial measure and is reconciled to reported cash flow from operations on slide 17. Q2 FY’13 Q2 FY’12 $161.8 $57.8 $0.42 $31.9 $18.0 $105.5 $32.0 $0.26 +53.4% +80.9% +61.5% +77.2% (1) (1) Adjusted Cash Flow from Operations(2)
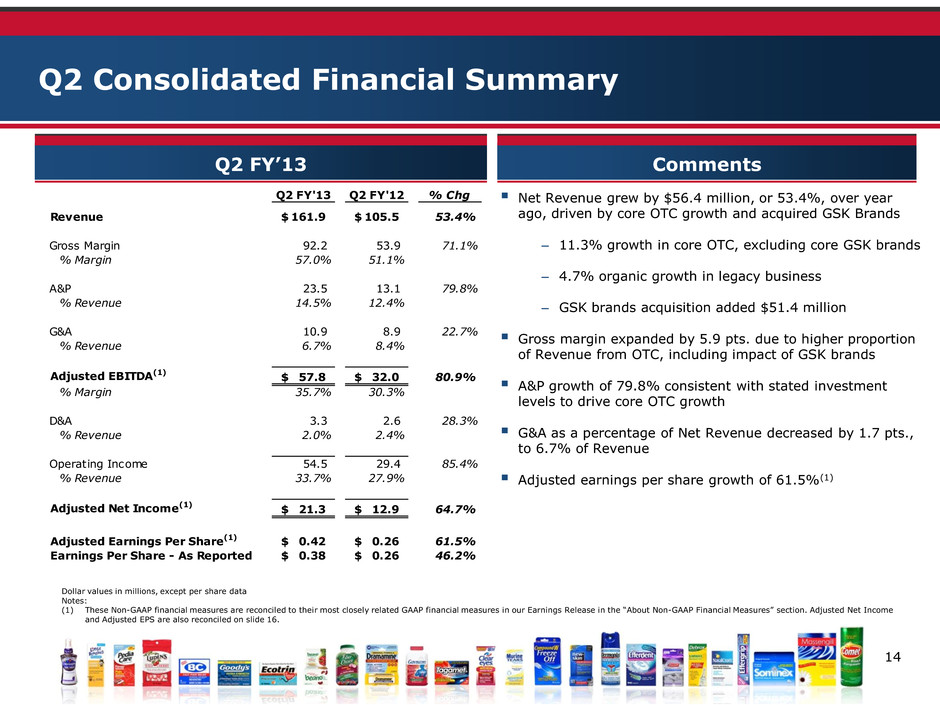
14 Net Revenue grew by $56.4 million, or 53.4%, over year ago, driven by core OTC growth and acquired GSK Brands – 11.3% growth in core OTC, excluding core GSK brands – 4.7% organic growth in legacy business – GSK brands acquisition added $51.4 million Gross margin expanded by 5.9 pts. due to higher proportion of Revenue from OTC, including impact of GSK brands A&P growth of 79.8% consistent with stated investment levels to drive core OTC growth G&A as a percentage of Net Revenue decreased by 1.7 pts., to 6.7% of Revenue Adjusted earnings per share growth of 61.5%(1) Q2 Consolidated Financial Summary Dollar values in millions, except per share data Notes: (1) These Non-GAAP financial measures are reconciled to their most closely related GAAP financial measures in our Earnings Release in the “About Non-GAAP Financial Measures” section. Adjusted Net Income and Adjusted EPS are also reconciled on slide 16. Q2 FY’13 Comments Q2 FY'13 Q2 FY'12 % Chg Revenue 161.9$ 105.5$ 53.4% Gross Margin 92.2 53.9 71.1% % Margin 57.0% 51.1% A&P 23.5 13.1 79.8% % Revenue 14.5% 12.4% G&A 10.9 8.9 22.7% % Revenue 6.7% 8.4% Adjusted EBITDA(1) 57.8$ 32.0$ 80.9% % Margin 35.7% 30.3% D&A 3.3 2.6 28.3% % Revenue 2.0% 2.4% Operating Income 54.5 29.4 85.4% % Revenue 33.7% 27.9% Adjusted Net Income(1) 21.3$ 12.9$ 64.7% Adjusted Earning Per Share(1) 0.42$ 0.26$ 61.5% Earnings Per Share - As Reported 0.38$ 0.26$ 46.2%
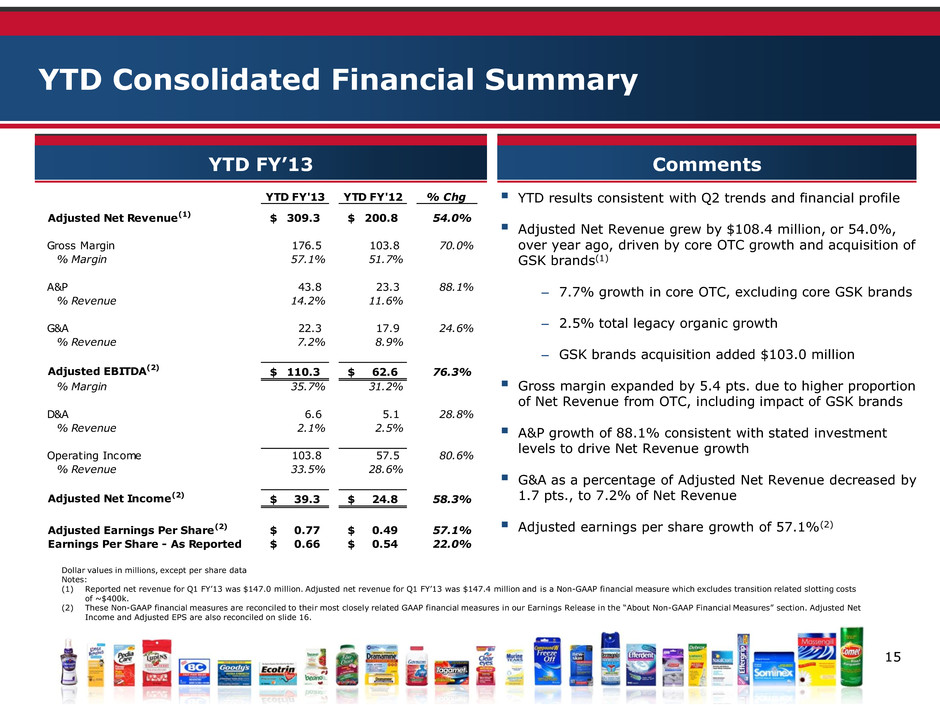
15 YTD results consistent with Q2 trends and financial profile Adjusted Net Revenue grew by $108.4 million, or 54.0%, over year ago, driven by core OTC growth and acquisition of GSK brands(1) – 7.7% growth in core OTC, excluding core GSK brands – 2.5% total legacy organic growth – GSK brands acquisition added $103.0 million Gross margin expanded by 5.4 pts. due to higher proportion of Net Revenue from OTC, including impact of GSK brands A&P growth of 88.1% consistent with stated investment levels to drive Net Revenue growth G&A as a percentage of Adjusted Net Revenue decreased by 1.7 pts., to 7.2% of Net Revenue Adjusted earnings per share growth of 57.1%(2) YTD Consolidated Financial Summary Dollar values in millions, except per share data Notes: (1) Reported net revenue for Q1 FY’13 was $147.0 million. Adjusted net revenue for Q1 FY’13 was $147.4 million and is a Non-GAAP financial measure which excludes transition related slotting costs of ~$400k. (2) These Non-GAAP financial measures are reconciled to their most closely related GAAP financial measures in our Earnings Release in the “About Non-GAAP Financial Measures” section. Adjusted Net Income and Adjusted EPS are also reconciled on slide 16. YTD FY’13 Comments YTD FY'13 YTD FY'12 % Chg Adjusted Net Revenue(1) 309.3$ 200.8$ 54.0% Gross Margin 176.5 103.8 70.0% % Margin 57.1% 51.7% A&P 43.8 23.3 88.1% % Revenue 14.2% 11.6% G&A 22.3 17.9 24.6% % Revenue 7.2% 8.9% Adjusted EBITDA(2) 110.3$ 62.6$ 76.3% % Margin 35.7% 31.2% D&A 6.6 5.1 28.8% % Revenue 2.1% 2.5% Operating Income 103.8 57.5 80.6% % Revenue 33.5% 28.6% Adjusted Net Inc me(2) 39.3$ 24.8$ 58.3% Adjusted Earnings P r Share(2) 0.77$ 0.49$ 57.1% Earnings Per Shar - As Reported 0.66$ 0.54$ 22.0%

16 Q2 FY’13 and YTD Net Income and EPS Reconciliation Dollar values in millions, except per share data Note: These Non-GAAP financial measures are being reconciled to their reported GAAP amounts. For Further information about Non-GAAP financial measures, refer to our Earnings Release in the “About Non-GAAP Financial Measures” section. Q2 FY’13 YTD FY’13 3 Months Ended 3 Months Ended YTD YTD Q2 FY'13 Q2 FY'12 YTD FY'13 YTD FY'12 Net Income EPS Net Income EPS Net Income EPS Net Income EPS As Reported 19.2$ 0.38$ 12.9$ 0.26$ 33.9$ 0.66$ 27.7$ 0.55$ Adjustments: Gain on Settlement - - - - - - (5.1) (0.09) Legal & Professional Fees - - - - 0.6 0.01 0.8 0.01 Transition Costs Associated with GSK 3.4 0.07 - - 8.1 0.16 - - Tax Impact of Adjustments (1.3) (0.03) - - (3.4) (0.07) 1.4 0.02 Total Adjustments 2.1 0.04 - - 5.3 0.10 (2.9) (0.06) Adjusted 21.3$ 0.42$ 12.9$ 0.26$ 39.2$ 0.77$ 24.8$ 0.49$
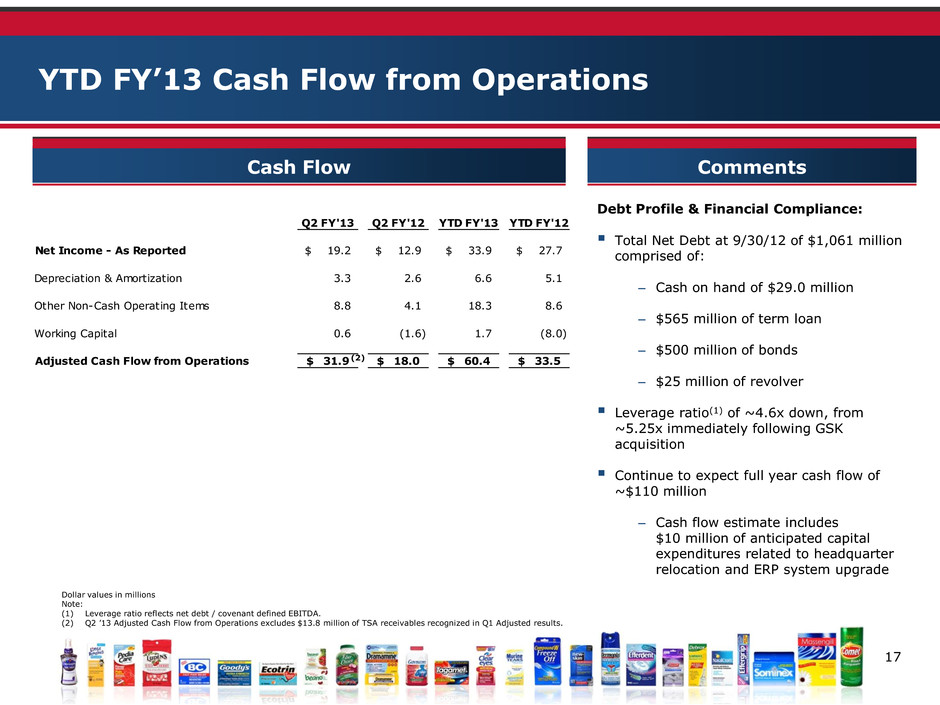
17 Q2 FY'13 Q2 FY'12 YTD FY'13 YTD FY'12 Net Income - As Reported 19.2$ 12.9$ 33.9$ 27.7$ Depreciation & Amortization 3.3 2.6 6.6 5.1 Other Non-Cash Operating Items 8.8 4.1 18.3 8.6 Working Capital 0.6 (1.6) 1.7 (8.0) Adjusted Cash Flow from Operations 31.9$ 18.0$ 60.4$ 33.5$ Debt Profile & Financial Compliance: Total Net Debt at 9/30/12 of $1,061 million comprised of: – Cash on hand of $29.0 million – $565 million of term loan – $500 million of bonds – $25 million of revolver Leverage ratio(1) of ~4.6x down, from ~5.25x immediately following GSK acquisition Continue to expect full year cash flow of ~$110 million – Cash flow estimate includes $10 million of anticipated capital expenditures related to headquarter relocation and ERP system upgrade YTD FY’13 Cash Flow from Operations Cash Flow Comments Dollar values in millions Note: (1) Leverage ratio reflects net debt / covenant defined EBITDA. (2) Q2 ’13 Adjusted Cash Flow from Operations excludes $13.8 million of TSA receivables recognized in Q1 Adjusted results. (2)
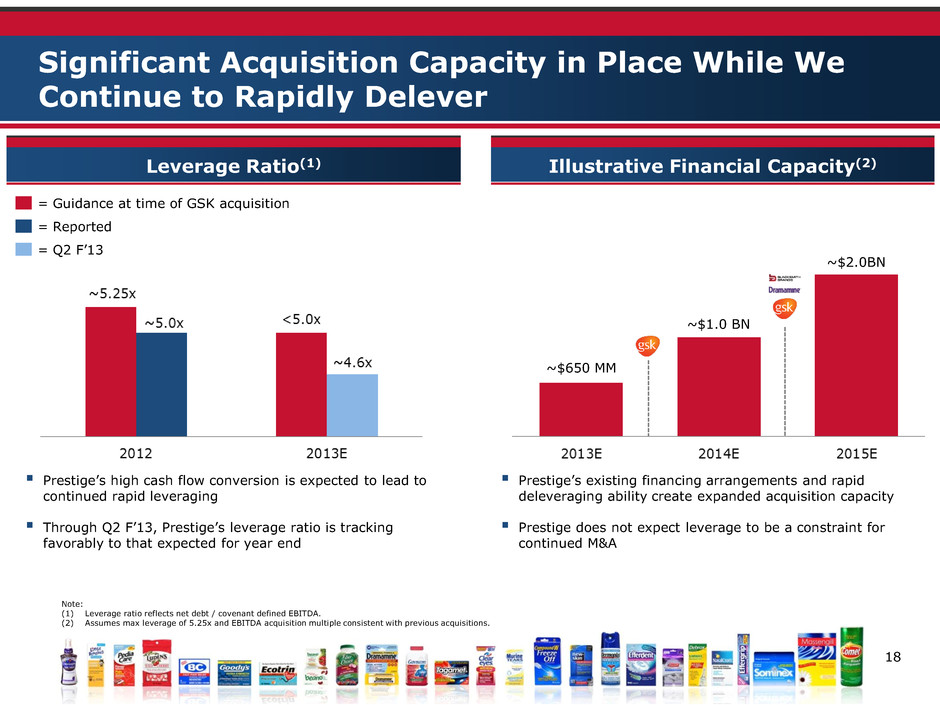
18 Significant Acquisition Capacity in Place While We Continue to Rapidly Delever Leverage Ratio(1) Illustrative Financial Capacity(2) ~$1.0 BN ~$2.0BN = Guidance at time of GSK acquisition = Reported Note: (1) Leverage ratio reflects net debt / covenant defined EBITDA. (2) Assumes max leverage of 5.25x and EBITDA acquisition multiple consistent with previous acquisitions. Prestige’s high cash flow conversion is expected to lead to continued rapid leveraging Through Q2 F’13, Prestige’s leverage ratio is tracking favorably to that expected for year end = Q2 F’13 Prestige’s existing financing arrangements and rapid deleveraging ability create expanded acquisition capacity Prestige does not expect leverage to be a constraint for continued M&A ~$650 MM
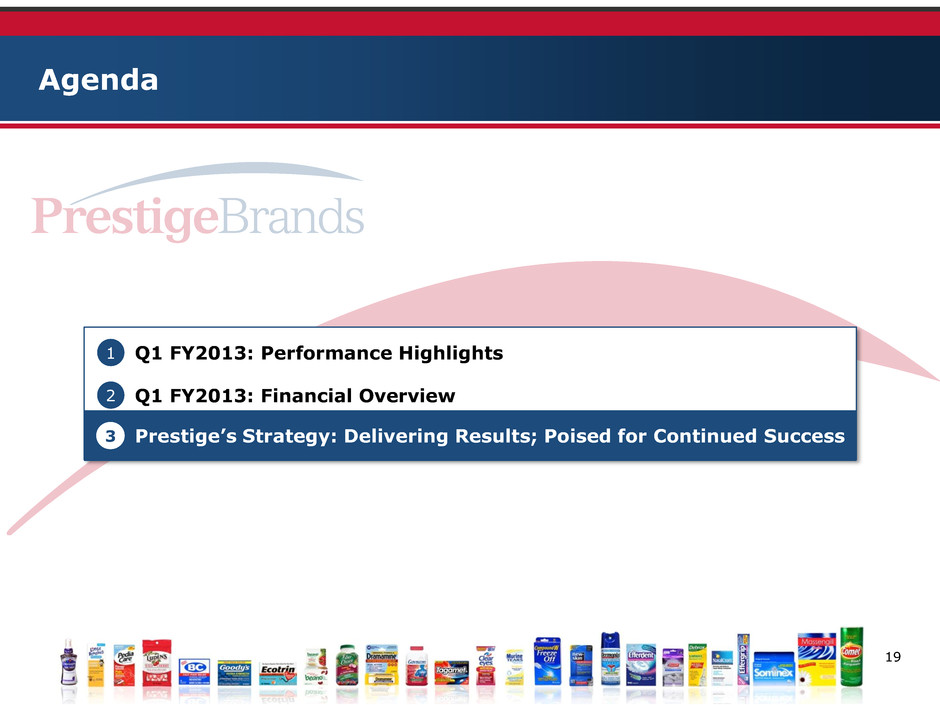
19 Q1 FY2013: Performance Highlights Q1 FY2013: Financial Overview Prestige’s Strategy: Delivering Results; Poised for Success 1 2 3 Agenda ’ lt ; r Continued Success
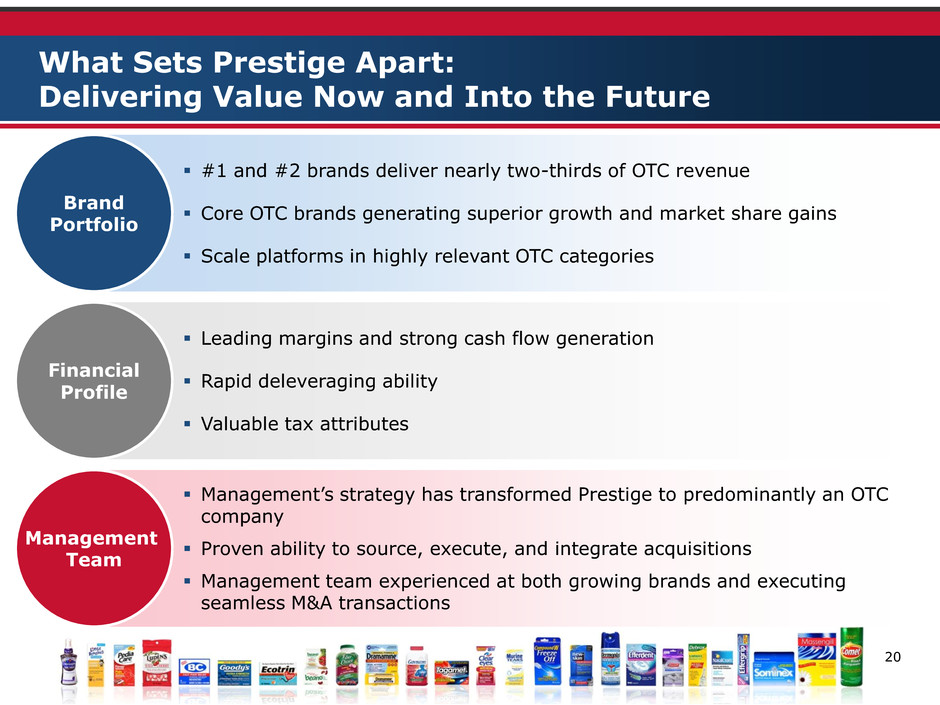
20 What Sets Prestige Apart: Delivering Value Now and Into the Future #1 and #2 brands deliver nearly two-thirds of OTC revenue Core OTC brands generating superior growth and market share gains Scale platforms in highly relevant OTC categories Leading margins and strong cash flow generation Rapid deleveraging ability Valuable tax attributes Management’s strategy has transformed Prestige to predominantly an OTC company Proven ability to source, execute, and integrate acquisitions Management team experienced at both growing brands and executing seamless M&A transactions Management Team Financial Profile Brand Portfolio
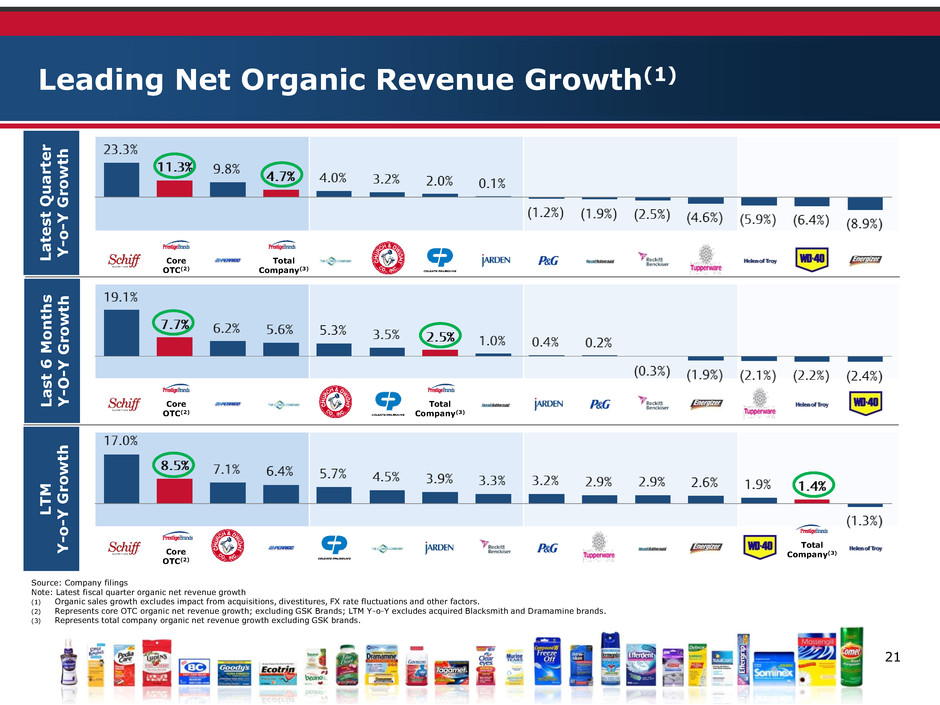
21 Leading Net Organic Revenue Growth(1) Source: Company filings Note: Latest fiscal quarter organic net revenue growth (1) Organic sales growth excludes impact from acquisitions, divestitures, FX rate fluctuations and other factors. (2) Represents core OTC organic net revenue growth; excluding GSK Brands; LTM Y-o-Y excludes acquired Blacksmith and Dramamine brands. (3) Represents total company organic net revenue growth excluding GSK brands. Core OTC(2) Core OTC(2) Core OTC(2) Total Company(3) Total Company(3) Total Company(3) L a te s t Q u a rt er Y -o -Y G rowt h L a s t 6 M o n th s Y -O -Y G rowt h L T M Y -o -Y G rowt h

22 EPS Guidance Revised Upwards Deliver FY’13 Adjusted EPS guidance of $1.37 - $1.42, up from prior guidance of $1.22 - $1.32 • Excludes estimated adjustments of $0.14 for full year(1) Clear goals for FY’13 to build on success and momentum − Successfully integrate and transition the acquired brands • Supply and demand • Integration continues beyond end of TSA − Continue to invest in, and drive, core OTC brands − Increase in A&P spending in the 2nd half of the year − Focus on development of long-term potential of acquired GSK brands through brand investment and new product development − Deliver strong free cash flow, de-lever, and provide flexibility for proven M&A strategy Q3 Highlights/Considerations − Revenue: Increased early season cough/cold incidences and earlier retailer purchases than prior year − A&P: Seasonal increase in marketing support associated with cough/cold season Continue the strategic course in the transformation process…”it’s a marathon, not a sprint” Outlook for Balance of FY’13 Moving Forward (1) Adjustments reflect GSK brands acquisition costs, costs related to the Transition Services Agreement, integration costs, and other legal and professional fees.

23 Core OTC organic net revenue growth of 11.3%(1) Core OTC consumption growth of 10.5% in L-12 weeks compared to category of 1.5%(2) Core OTC A&P of 16.8% of net revenue(1) Cash flow from operations of $31.9 million On track with ~$110 million target for full year Leverage ratio(3) of ~4.6x, down from ~5.25x immediately following the GSK acquisition GSK brands integration proceeding as expected Active pipeline of M&A opportunities Q2 FY2013: Delivering Against Stated Strategy Adjusted EPS of $0.42(4); +61.5% vs. Prior Year Corresponding Quarter Notes: (1) Excludes acquired GSK brands. (2) IRI multi-outlet retail dollar sales for the period ending 10/7/12; Includes acquired GSK brands. (3) Leverage ratio reflects net debt / covenant defined EBITDA. (4) This non-GAAP financial measure is reconciled to its most closely related GAAP financial measure in our earnings release in the “About Non-GAAP Financial Measures” section. Adjusted EPS is also reconciled to reported EPS on slide 16. OTC M&A Focus Strong FCF Resulting in Debt Reduction Drive Core OTC Growth
24 November 1, 2012


