P R E S T I G E B R A N D S F o u r t h Q u a r t e r & F ’ 1 4 R e s u l t s 1 Review of Fourth Quarter & F’14 Results Matt Mannelly, CEO & President Ron Lombardi, CFO May 15, 2014 Exhibit 99.2
P R E S T I G E B R A N D S F o u r t h Q u a r t e r & F ’ 1 4 R e s u l t s 2 This presentation contains certain “forward-looking” statements within the meaning of the Private Securities Litigation Reform Act of 1995, such as statements about the Company’s growth strategies, competitive position, product development and acquisitions, business trends, creation of shareholder value, ability to integrate the Insight and Hydralyte acquisitions, the timing of closing and the impact of the Insight acquisition, the growth and market position of the Company’s brands, and the Company’s future financial performance. Words such as “continue,” “will,” “expect,” “anticipate,” “likely,” “estimate,” “may,” “should,” “could,” “would,” and similar expressions identify forward-looking statements. Such forward-looking statements represent the Company’s expectations and beliefs and involve a number of known and unknown risks, uncertainties and other factors that may cause actual results to differ materially from those expressed or implied by such forward-looking statements. These factors include, among others, failure to satisfy the closing conditions for the Insight acquisition, the failure to successfully integrate the Insight or Hydralyte businesses or future acquisitions, the failure to successfully commercialize new and enhanced products, the severity of the cough/cold season, general economic and business conditions, competitive pressures, the effectiveness of the Company’s brand building investments, fluctuating foreign exchange rates, and other risks set forth in Part I, Item 1A. Risk Factors in the Company’s Annual Report on Form 10-K for the year ended March 31, 2013 and Part II, Item 1A in the Company’s Quarterly Report on Form 10-Q for the quarter ended December 31, 2013. You are cautioned not to place undue reliance on these forward- looking statements, which speak only as of the date this presentation. Except to the extent required by applicable law, the Company undertakes no obligation to update any forward-looking statement contained in this presentation, whether as a result of new information, future events, or otherwise. Safe Harbor Disclosure
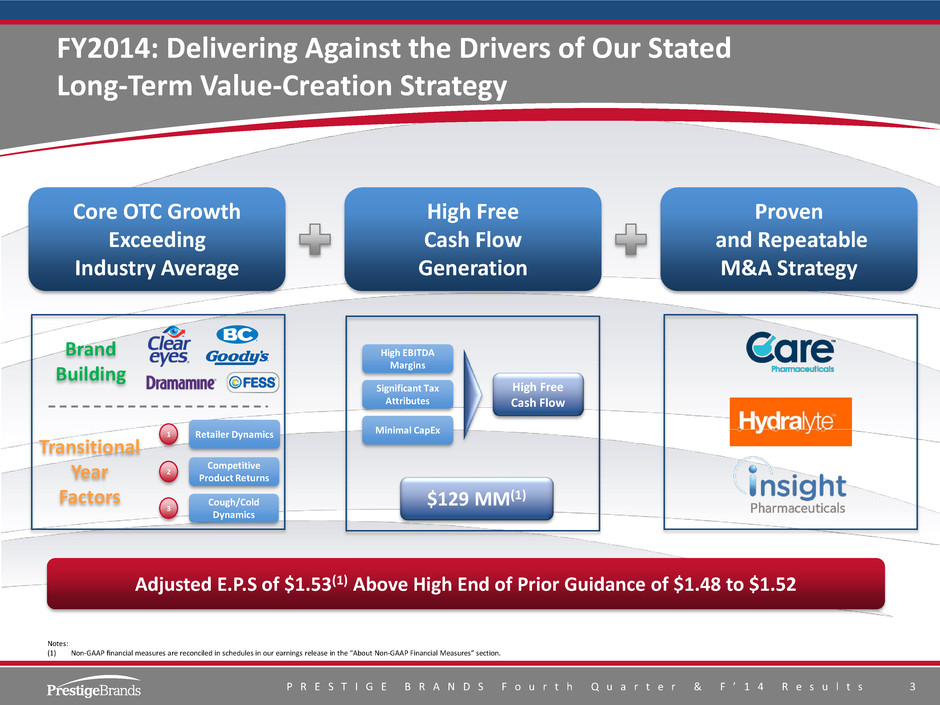
P R E S T I G E B R A N D S F o u r t h Q u a r t e r & F ’ 1 4 R e s u l t s 3 FY2014: Delivering Against the Drivers of Our Stated Long-Term Value-Creation Strategy Core OTC Growth Exceeding Industry Average High Free Cash Flow Generation Proven and Repeatable M&A Strategy Adjusted E.P.S of $1.53(1) Above High End of Prior Guidance of $1.48 to $1.52 Retailer Dynamics 1 Competitive Product Returns 2 Cough/Cold Dynamics 3 Notes: (1) Non-GAAP financial measures are reconciled in schedules in our earnings release in the “About Non-GAAP Financial Measures” section. Transitional Year Factors Brand Building $129 MM(1) High EBITDA Margins Significant Tax Attributes Minimal CapEx High Free Cash Flow
P R E S T I G E B R A N D S F o u r t h Q u a r t e r & F ’ 1 4 R e s u l t s 4 Agenda for Today’s Discussion I. Perspective on the OTC Environment II. Brand Building In Action III. Performance Highlights and Financial Overview IV. Outlook and Road Ahead: FY2015
P R E S T I G E B R A N D S F o u r t h Q u a r t e r & F ’ 1 4 R e s u l t s 5 I. Perspective on the OTC Environment
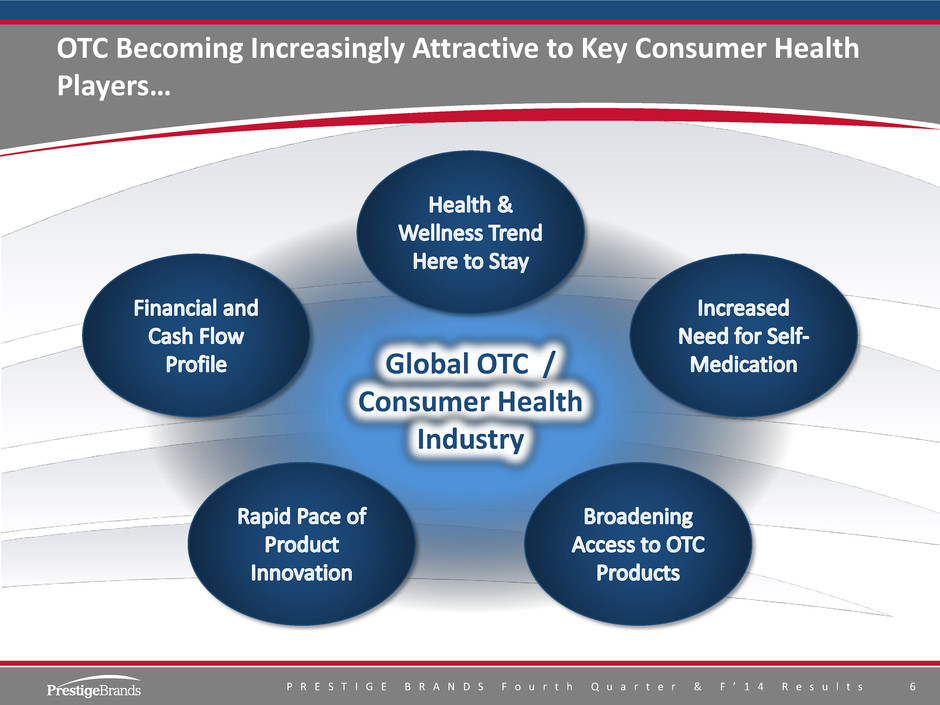
P R E S T I G E B R A N D S F o u r t h Q u a r t e r & F ’ 1 4 R e s u l t s 6 OTC Becoming Increasingly Attractive to Key Consumer Health Players… Global OTC / Consumer Health Industry
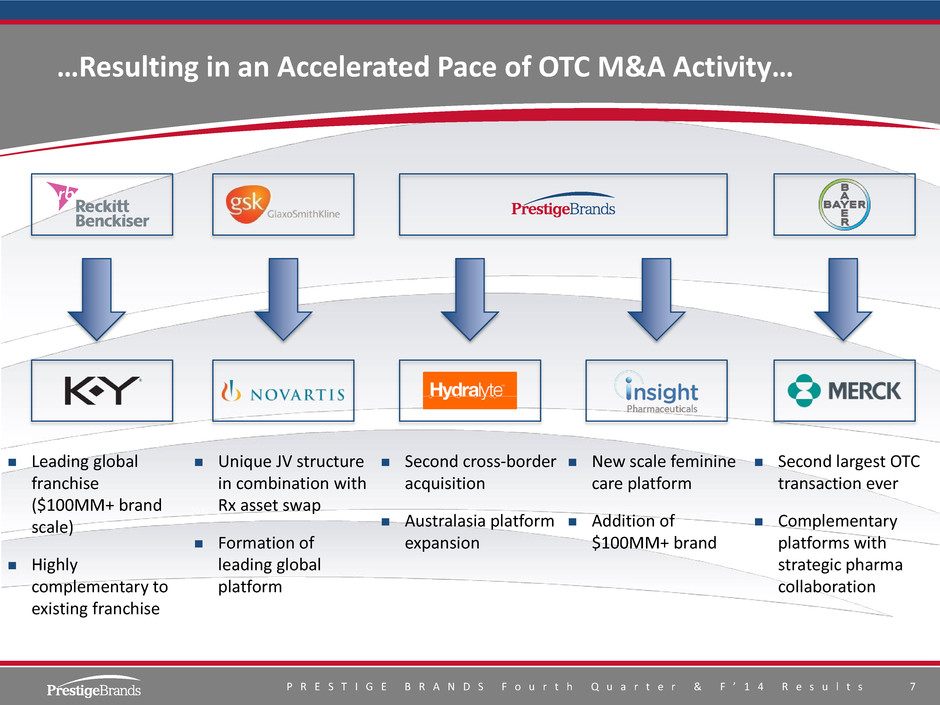
P R E S T I G E B R A N D S F o u r t h Q u a r t e r & F ’ 1 4 R e s u l t s 7 …Resulting in an Accelerated Pace of OTC M&A Activity… Leading global franchise ($100MM+ brand scale) Highly complementary to existing franchise Unique JV structure in combination with Rx asset swap Formation of leading global platform Second cross-border acquisition Australasia platform expansion New scale feminine care platform Addition of $100MM+ brand Second largest OTC transaction ever Complementary platforms with strategic pharma collaboration
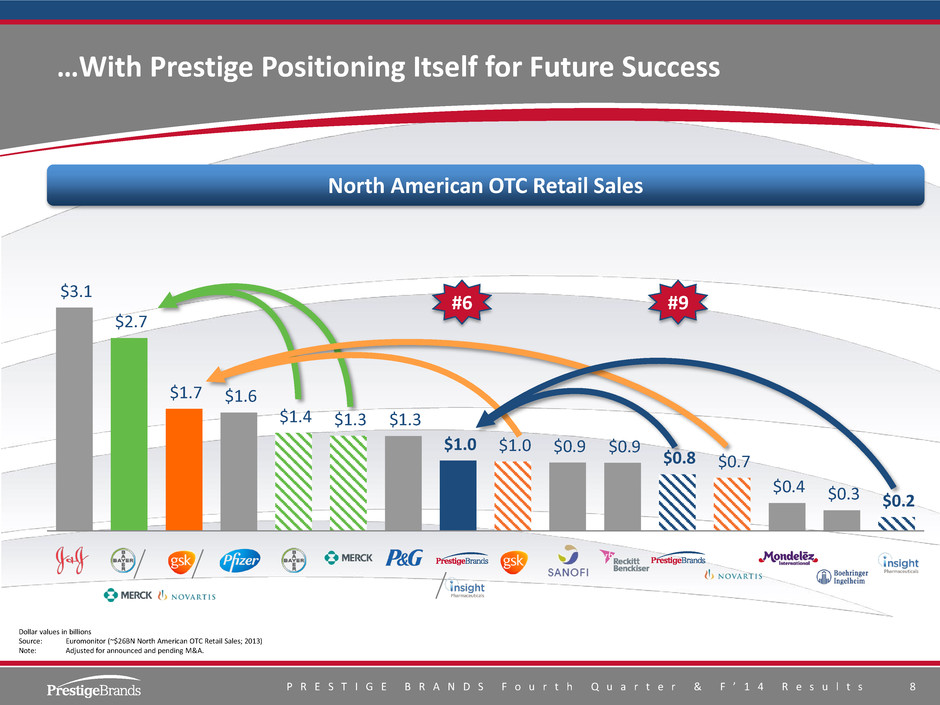
P R E S T I G E B R A N D S F o u r t h Q u a r t e r & F ’ 1 4 R e s u l t s 8 …With Prestige Positioning Itself for Future Success Dollar values in billions Source: Euromonitor (~$26BN North American OTC Retail Sales; 2013) Note: Adjusted for announced and pending M&A. $3.1 $2.7 $1.7 $1.6 $1.4 $1.3 $1.3 $1.0 $1.0 $0.9 $0.9 $0.8 $0.7 $0.4 $0.3 $0.2 North American OTC Retail Sales #6 #9
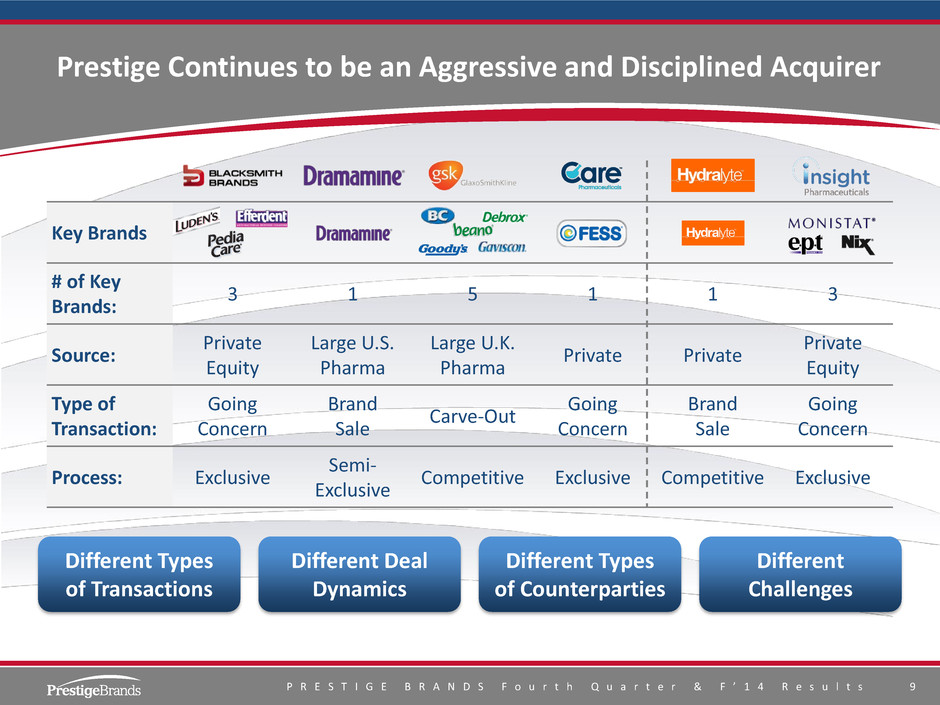
P R E S T I G E B R A N D S F o u r t h Q u a r t e r & F ’ 1 4 R e s u l t s 9 Prestige Continues to be an Aggressive and Disciplined Acquirer Key Brands # of Key Brands: 3 1 5 1 1 3 Source: Private Equity Large U.S. Pharma Large U.K. Pharma Private Private Private Equity Type of Transaction: Going Concern Brand Sale Carve-Out Going Concern Brand Sale Going Concern Process: Exclusive Semi- Exclusive Competitive Exclusive Competitive Exclusive Different Types of Transactions Different Deal Dynamics Different Types of Counterparties Different Challenges
P R E S T I G E B R A N D S F o u r t h Q u a r t e r & F ’ 1 4 R e s u l t s 1 0 Perspectives on the OTC Marketplace Going Forward OTC market continues to attract interest from pharma companies and large CPG companies alike Appeal of OTC assets resides, among others, in predictable growth and high gross margin, EBITDA margins and cash flow Scarcity of valuable brands and quality portfolios likely to result in increased value placed on OTC assets Consolidation likely to continue Ready and Able to Capitalize on New Market Opportunities Aggressive and Disciplined Well Established M&A Criteria Successful Value Creation Strategy Continued M&A Growth Ambitions
P R E S T I G E B R A N D S F o u r t h Q u a r t e r & F ’ 1 4 R e s u l t s 1 1 II. Brand Building In Action

P R E S T I G E B R A N D S F o u r t h Q u a r t e r & F ’ 1 4 R e s u l t s 1 2 FY2014: Continued Emphasis on Brand Building in a Transitional Year Brand Building Transitional Year Factors Retailer Dynamics 1 Competitive Product Returns 2 3 Cough/Cold Dynamics 3% 27% 32% 38% Retailer Dynamics Competitive Product Returns Other Cough/Cold & GI Category Dynamics
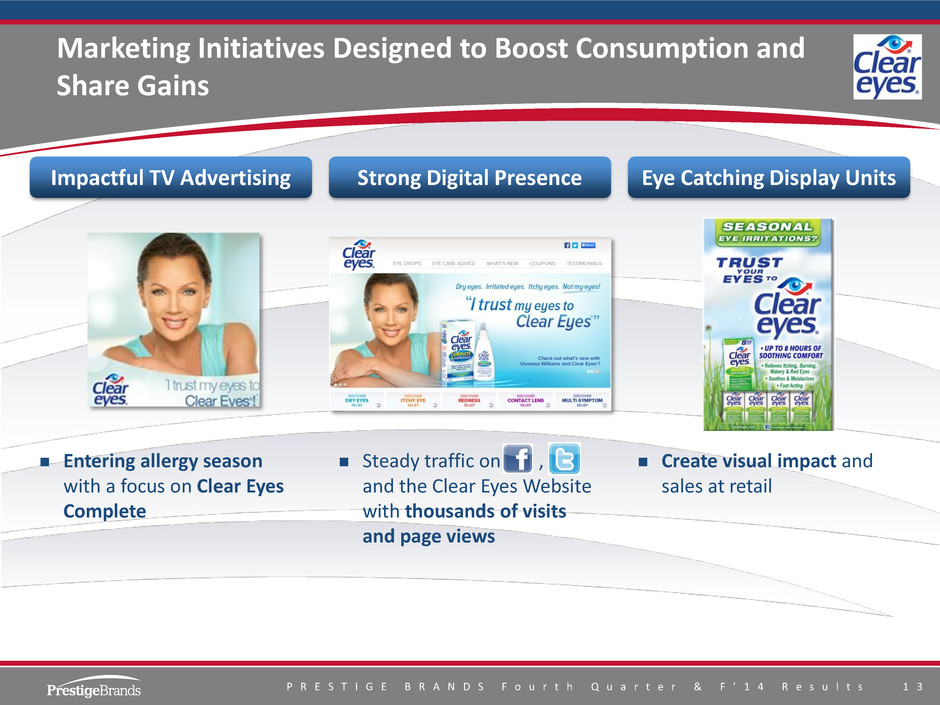
P R E S T I G E B R A N D S F o u r t h Q u a r t e r & F ’ 1 4 R e s u l t s 1 3 Marketing Initiatives Designed to Boost Consumption and Share Gains Impactful TV Advertising Strong Digital Presence Eye Catching Display Units Entering allergy season with a focus on Clear Eyes Complete Steady traffic on , and the Clear Eyes Website with thousands of visits and page views Create visual impact and sales at retail
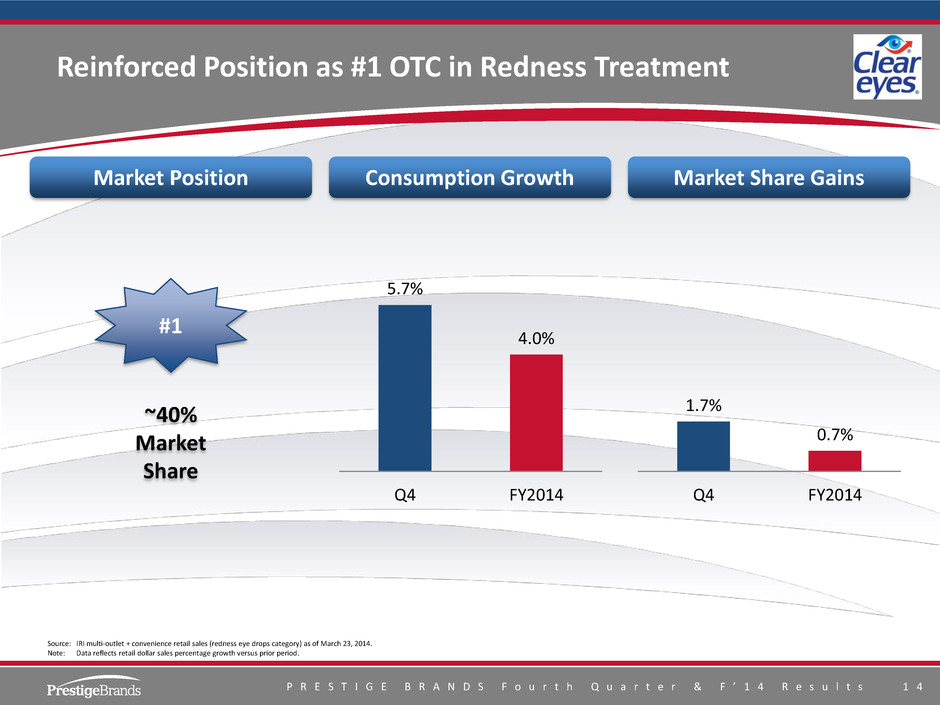
P R E S T I G E B R A N D S F o u r t h Q u a r t e r & F ’ 1 4 R e s u l t s 1 4 Reinforced Position as #1 OTC in Redness Treatment Market Position Consumption Growth Market Share Gains #1 ~40% Market Share 5.7% 4.0% Q4 FY2014 1.7% 0.7% Q4 FY2014 Source: IRI multi-outlet + convenience retail sales (redness eye drops category) as of March 23, 2014. Note: Data reflects retail dollar sales percentage growth versus prior period.
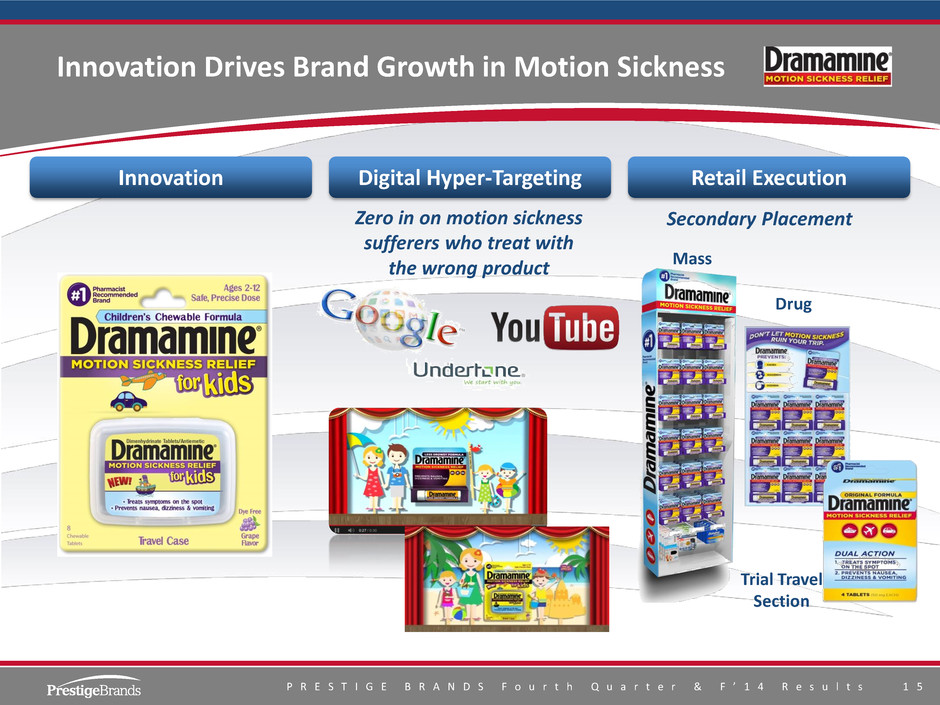
P R E S T I G E B R A N D S F o u r t h Q u a r t e r & F ’ 1 4 R e s u l t s 1 5 Innovation Drives Brand Growth in Motion Sickness Mass Trial Travel Section Drug Zero in on motion sickness sufferers who treat with the wrong product Secondary Placement Innovation Digital Hyper-Targeting Retail Execution
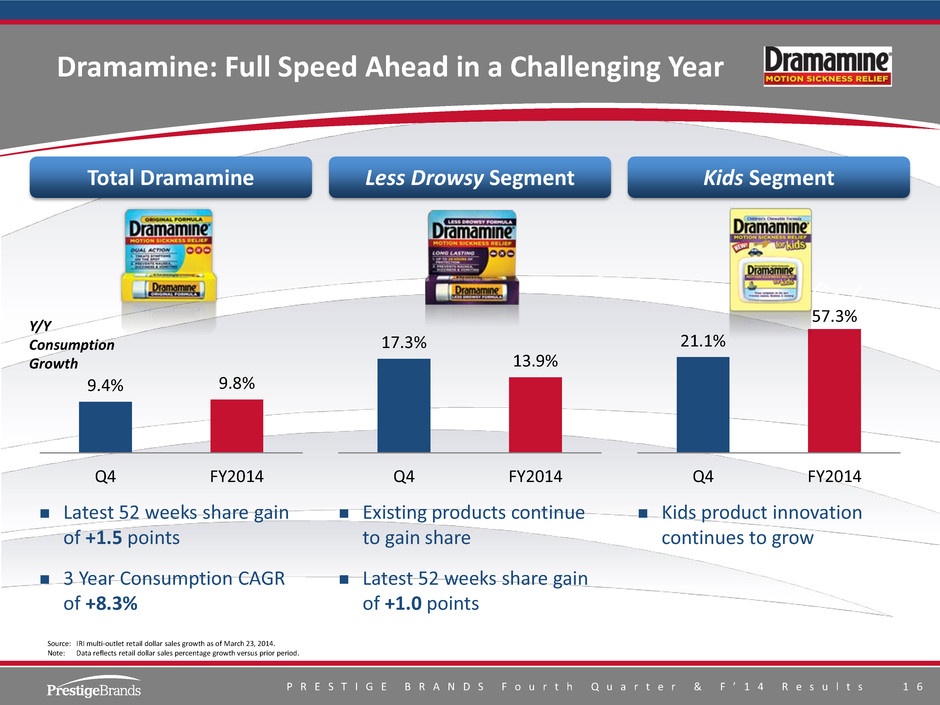
P R E S T I G E B R A N D S F o u r t h Q u a r t e r & F ’ 1 4 R e s u l t s 1 6 Dramamine: Full Speed Ahead in a Challenging Year Latest 52 weeks share gain of +1.5 points 3 Year Consumption CAGR of +8.3% Source: IRI multi-outlet retail dollar sales growth as of March 23, 2014. Note: Data reflects retail dollar sales percentage growth versus prior period. 9.4% 9.8% Q4 FY2014 17.3% 13.9% Q4 FY2014 21.1% 57.3% Q4 FY2014 Y/Y Consumption Growth Total Dramamine Less Drowsy Segment Kids Segment Kids product innovation continues to grow Existing products continue to gain share Latest 52 weeks share gain of +1.0 points
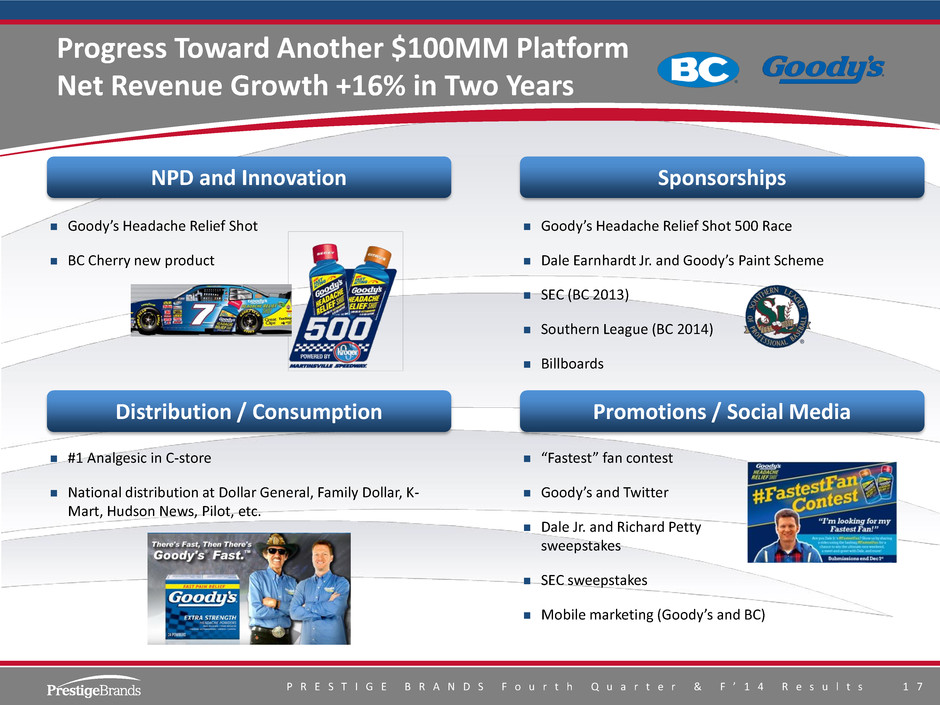
P R E S T I G E B R A N D S F o u r t h Q u a r t e r & F ’ 1 4 R e s u l t s 1 7 Progress Toward Another $100MM Platform Net Revenue Growth +16% in Two Years Distribution / Consumption Promotions / Social Media Goody’s Headache Relief Shot BC Cherry new product Goody’s Headache Relief Shot 500 Race Dale Earnhardt Jr. and Goody’s Paint Scheme SEC (BC 2013) Southern League (BC 2014) Billboards #1 Analgesic in C-store National distribution at Dollar General, Family Dollar, K- Mart, Hudson News, Pilot, etc. “Fastest” fan contest Goody’s and Twitter Dale Jr. and Richard Petty sweepstakes SEC sweepstakes Mobile marketing (Goody’s and BC) NPD and Innovation Sponsorships
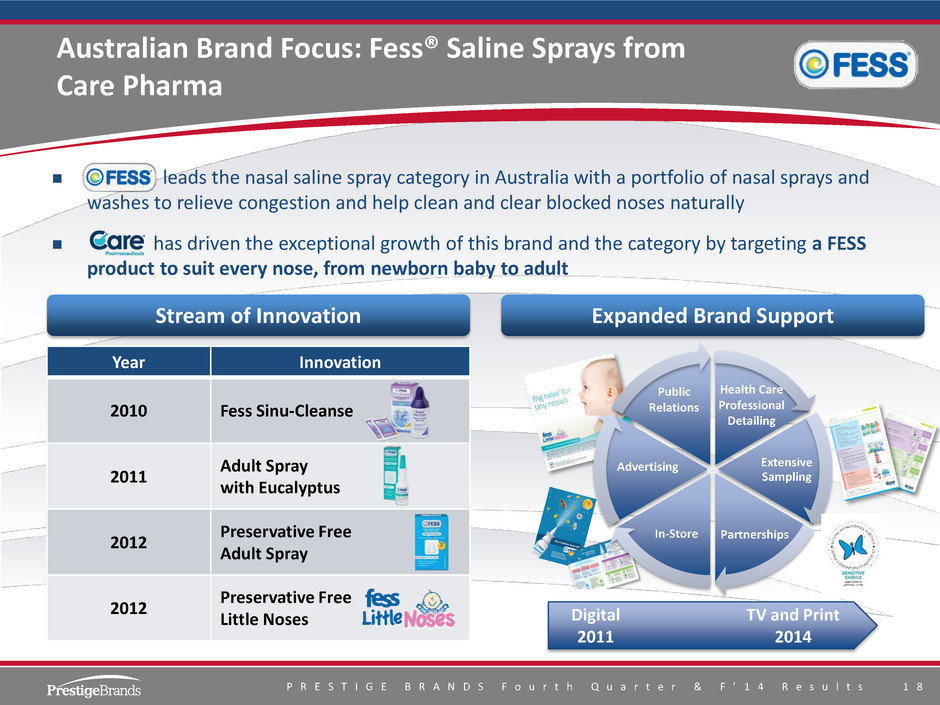
P R E S T I G E B R A N D S F o u r t h Q u a r t e r & F ’ 1 4 R e s u l t s 1 8 Australian Brand Focus: Fess® Saline Sprays from Care Pharma leads the nasal saline spray category in Australia with a portfolio of nasal sprays and washes to relieve congestion and help clean and clear blocked noses naturally has driven the exceptional growth of this brand and the category by targeting a FESS product to suit every nose, from newborn baby to adult Stream of Innovation Expanded Brand Support Extensive Sampling In-Store Health Care Professional Detailing Partnerships Advertising Public Relations Year Innovation 2010 Fess Sinu-Cleanse 2011 Adult Spray with Eucalyptus 2012 Preservative Free Adult Spray 2012 Preservative Free Little Noses Digital 2011 TV and Print 2014
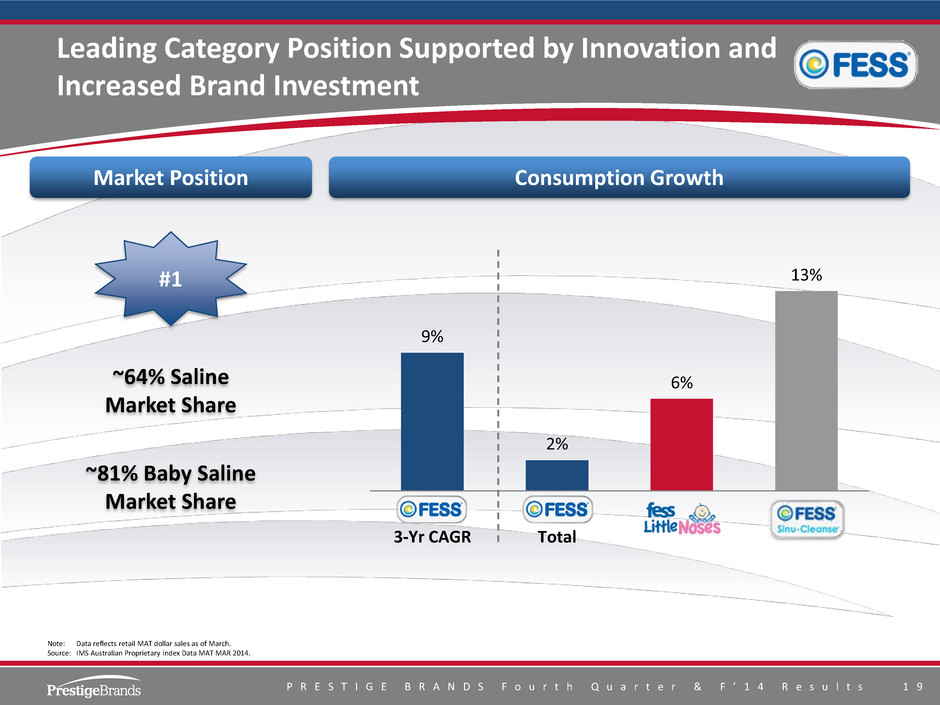
P R E S T I G E B R A N D S F o u r t h Q u a r t e r & F ’ 1 4 R e s u l t s 1 9 Leading Category Position Supported by Innovation and Increased Brand Investment Note: Data reflects retail MAT dollar sales as of March. Source: IMS Australian Proprietary Index Data MAT MAR 2014. 9% 2% 6% 13% 3-Yr CAGR Total Market Position Consumption Growth #1 ~64% Saline Market Share ~81% Baby Saline Market Share
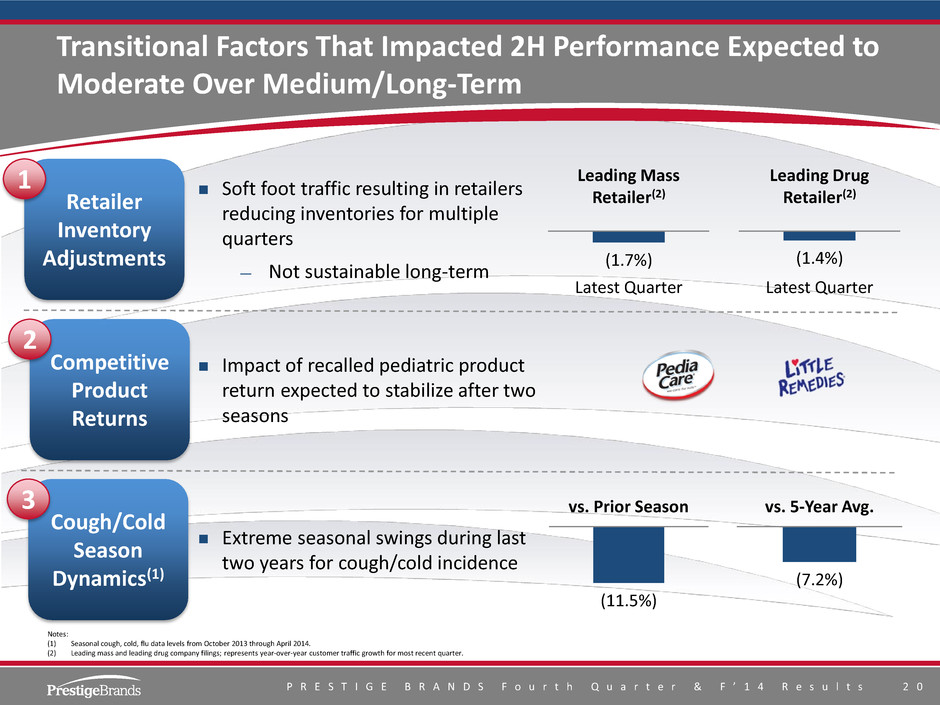
P R E S T I G E B R A N D S F o u r t h Q u a r t e r & F ’ 1 4 R e s u l t s 2 0 Transitional Factors That Impacted 2H Performance Expected to Moderate Over Medium/Long-Term 2012-2013 Season 2013-2014 Season YTD Cough/Cold Season: (15%) Competitive Product Returns 2 Impact of recalled pediatric product return expected to stabilize after two seasons Notes: (1) Seasonal cough, cold, flu data levels from October 2013 through April 2014. (2) Leading mass and leading drug company filings; represents year-over-year customer traffic growth for most recent quarter. Retailer Inventory Adjustments 1 Soft foot traffic resulting in retailers reducing inventories for multiple quarters — Not sustainable long-term (1.7%) Latest Quarter (1.4%) Latest Quarter Leading Mass Retailer(2) Leading Drug Retailer(2) Cough/Cold Season Dynamics(1) 3 Extreme seasonal swings during last two years for cough/cold incidence (11.5%) (7.2%) vs. Prior Season vs. 5-Year Avg.
P R E S T I G E B R A N D S F o u r t h Q u a r t e r & F ’ 1 4 R e s u l t s 2 1 III. Performance Highlights and Financial Overview
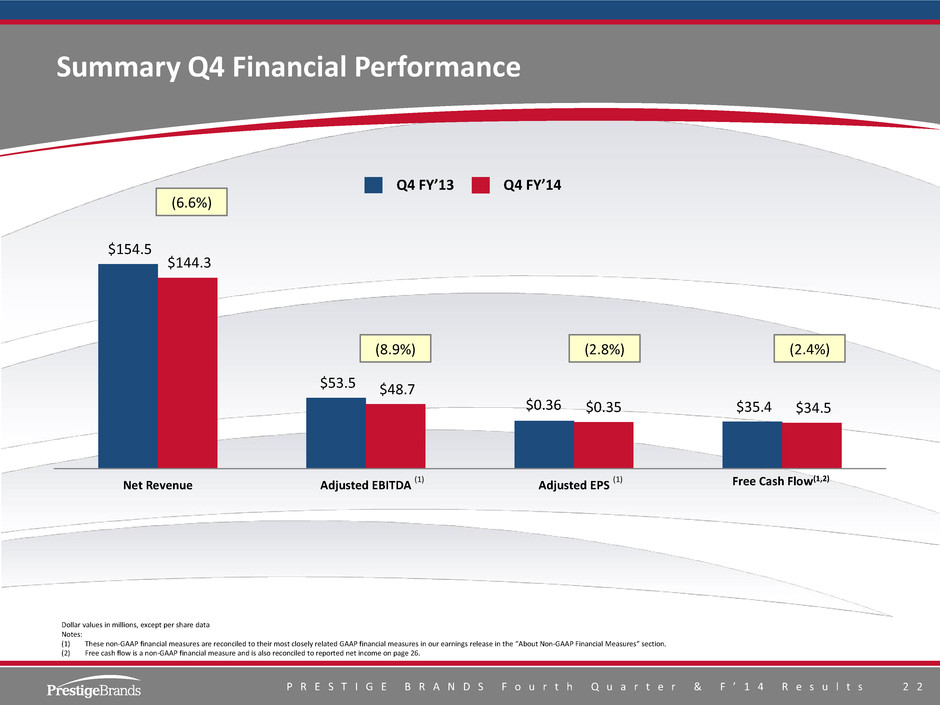
P R E S T I G E B R A N D S F o u r t h Q u a r t e r & F ’ 1 4 R e s u l t s 2 2 $154.5 $53.5 $35.4 $144.3 $48.7 $34.5 Net Revenue Adjusted EBITDA Adjusted EPS Summary Q4 Financial Performance Dollar values in millions, except per share data Notes: (1) These non-GAAP financial measures are reconciled to their most closely related GAAP financial measures in our earnings release in the “About Non-GAAP Financial Measures” section. (2) Free cash flow is a non-GAAP financial measure and is also reconciled to reported net income on page 26. Q4 FY’14 Q4 FY’13 (6.6%) (8.9%) (2.8%) (2.4%) (1) (1) Free Cash Flow(1,2) $0.36 $0.35
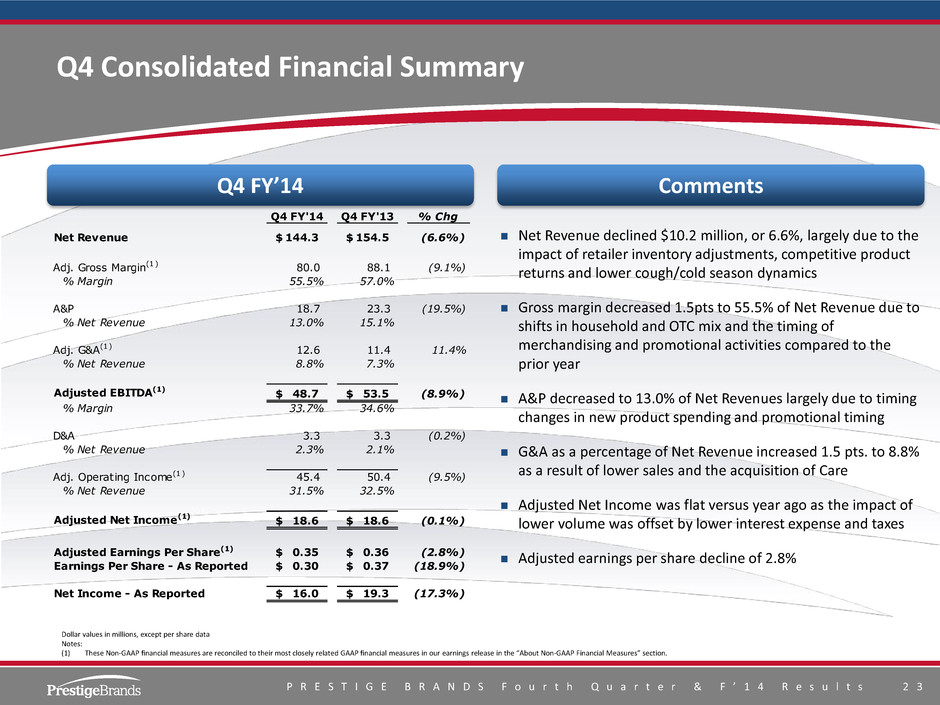
P R E S T I G E B R A N D S F o u r t h Q u a r t e r & F ’ 1 4 R e s u l t s 2 3 Q4 FY'14 Q4 FY'13 % Chg Net Revenue 144.3$ 154.5$ (6.6%) Adj. Gross Margin(1) 80.0 88.1 (9.1%) % Margin 55.5% 57.0% A&P 18.7 23.3 (19.5%) % Net Revenue 13.0% 15.1% Adj. G&A(1) 12.6 11.4 11.4% % Net Revenue 8.8% 7.3% Adjusted EBITDA(1) 48.7$ 53.5$ (8.9%) % Margin 33.7% 34.6% D&A 3.3 3.3 (0.2%) % Net Revenue 2.3% 2.1% Adj. Operating Income(1) 45.4 50.4 (9.5%) % Net Revenue 31.5% 32.5% Adjusted Net Income(1) 18.6$ 18.6$ (0.1%) Adjusted Earnings Per Share(1) 0.35$ 0.36$ (2.8%) Earnings Per Share - As Reported 0.30$ 0.37$ (18.9%) Net Income - As Reported 16.0$ 19.3$ (17.3%) Net Revenue declined $10.2 million, or 6.6%, largely due to the impact of retailer inventory adjustments, competitive product returns and lower cough/cold season dynamics Gross margin decreased 1.5pts to 55.5% of Net Revenue due to shifts in household and OTC mix and the timing of merchandising and promotional activities compared to the prior year A&P decreased to 13.0% of Net Revenues largely due to timing changes in new product spending and promotional timing G&A as a percentage of Net Revenue increased 1.5 pts. to 8.8% as a result of lower sales and the acquisition of Care Adjusted Net Income was flat versus year ago as the impact of lower volume was offset by lower interest expense and taxes Adjusted earnings per share decline of 2.8% Q4 Consolidated Financial Summary Dollar values in millions, except per share data Notes: (1) These Non-GAAP financial measures are reconciled to their most closely related GAAP financial measures in our earnings release in the “About Non-GAAP Financial Measures” section. Q4 FY’14 Comments
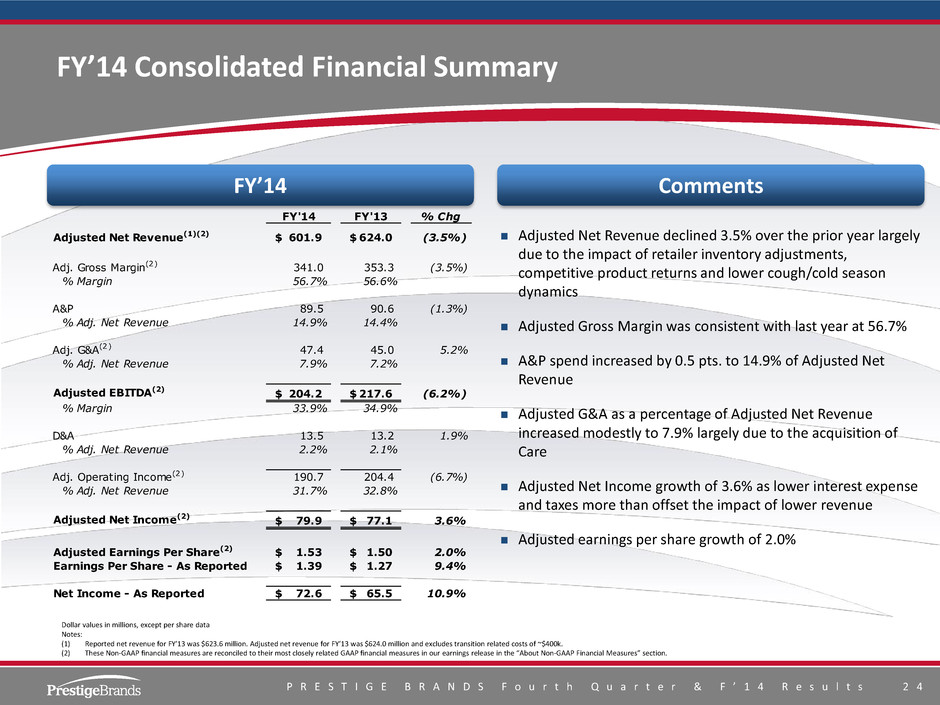
P R E S T I G E B R A N D S F o u r t h Q u a r t e r & F ’ 1 4 R e s u l t s 2 4 Adjusted Net Revenue declined 3.5% over the prior year largely due to the impact of retailer inventory adjustments, competitive product returns and lower cough/cold season dynamics Adjusted Gross Margin was consistent with last year at 56.7% A&P spend increased by 0.5 pts. to 14.9% of Adjusted Net Revenue Adjusted G&A as a percentage of Adjusted Net Revenue increased modestly to 7.9% largely due to the acquisition of Care Adjusted Net Income growth of 3.6% as lower interest expense and taxes more than offset the impact of lower revenue Adjusted earnings per share growth of 2.0% FY’14 Consolidated Financial Summary Dollar values in millions, except per share data Notes: (1) Reported net revenue for FY’13 was $623.6 million. Adjusted net revenue for FY’13 was $624.0 million and excludes transition related costs of ~$400k. (2) These Non-GAAP financial measures are reconciled to their most closely related GAAP financial measures in our earnings release in the “About Non-GAAP Financial Measures” section. FY’14 Comments FY'14 FY'13 % Chg Adjusted Net Revenue(1)(2) 601.9$ 624.0$ (3.5%) Adj. Gross Margin(2) 341.0 353.3 (3.5%) % Margin 56.7% 56.6% A&P 89.5 90.6 (1.3%) % Adj. Net Revenue 14.9% 14.4% Adj. G&A(2) 47.4 45.0 5.2% % Adj. Net Revenue 7.9% 7.2% Adjusted EBITDA(2) 204.2$ 217.6$ (6.2%) % Margin 33.9% 34.9% D&A 13.5 13.2 1.9% % Adj. Net Revenue 2.2% 2.1% Adj. Operating Income(2) 190.7 204.4 (6.7%) % Adj. Net Revenue 31.7% 32.8% Adjusted Net Income(2) 79.9$ 77.1$ 3.6% Adjusted Earnings Per Share(2) 1.53$ 1.50$ 2.0% Earnings Per Share - As Reported 1.39$ 1.27$ 9.4% Net Income - As Reported 72.6$ 65.5$ 10.9%
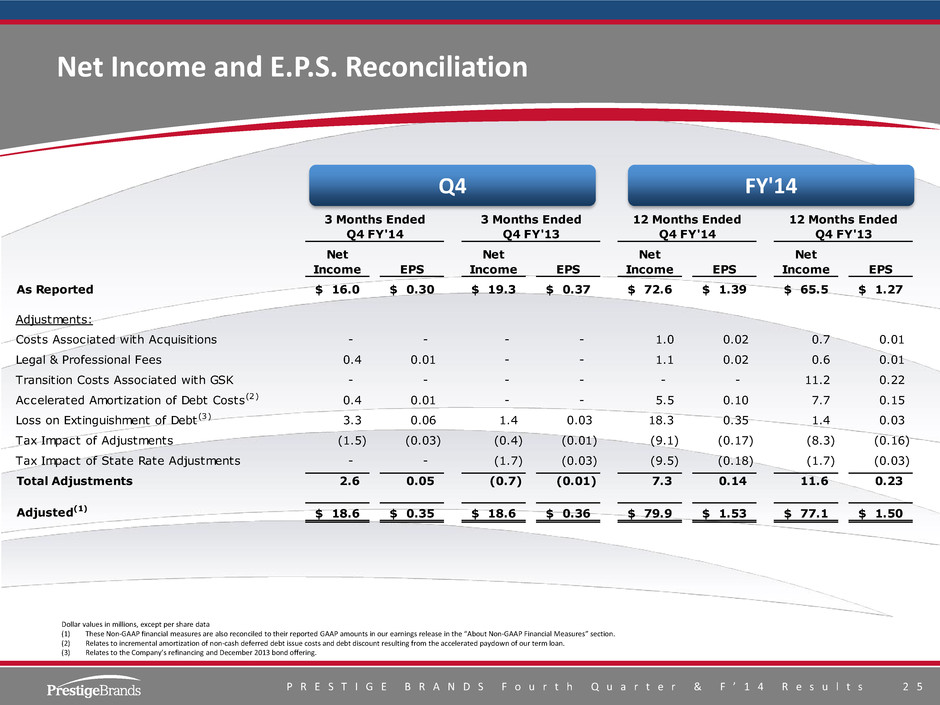
P R E S T I G E B R A N D S F o u r t h Q u a r t e r & F ’ 1 4 R e s u l t s 2 5 3 Months Ended 3 Months Ended 12 Months Ended 12 Months Ended Q4 FY'14 Q4 FY'13 Q4 FY'14 Q4 FY'13 Net Income EPS Net Income EPS Net Income EPS Net Income EPS As Reported 16.0$ 0.30$ 19.3$ 0.37$ 72.6$ 1.39$ 65.5$ 1.27$ Adjustments: Costs Associated with Acquisitions - - - - 1.0 0.02 0.7 0.01 Legal & Professional Fees 0.4 0.01 - - 1.1 0.02 0.6 0.01 Transition Costs Associated with GSK - - - - - - 11.2 0.22 - - Accelerated Amortization of Debt Costs(2) 0.4 0.01 - - 5.5 0.10 7.7 0.15 Loss on Extinguishment of Debt(3) 3.3 0.06 1.4 0.03 18.3 0.35 1.4 0.03 Tax Impact of Adjustments (1.5) (0.03) (0.4) (0.01) (9.1) (0.17) (8.3) (0.16) Tax Impact of State Rate Adjustments - - (1.7) (0.03) (9.5) (0.18) (1.7) (0.03) Total Adjustments 2.6 0.05 (0.7) (0.01) 7.3 0.14 11.6 0.23 Adjusted(1) 18.6$ 0.35$ 18.6$ 0.36$ 79.9$ 1.53$ 77.1$ 1.50$ Net Income and E.P.S. Reconciliation Dollar values in millions, except per share data (1) These Non-GAAP financial measures are also reconciled to their reported GAAP amounts in our earnings release in the “About Non-GAAP Financial Measures” section. (2) Relates to incremental amortization of non-cash deferred debt issue costs and debt discount resulting from the accelerated paydown of our term loan. (3) Relates to the Company’s refinancing and December 2013 bond offering. Q4 FY'14
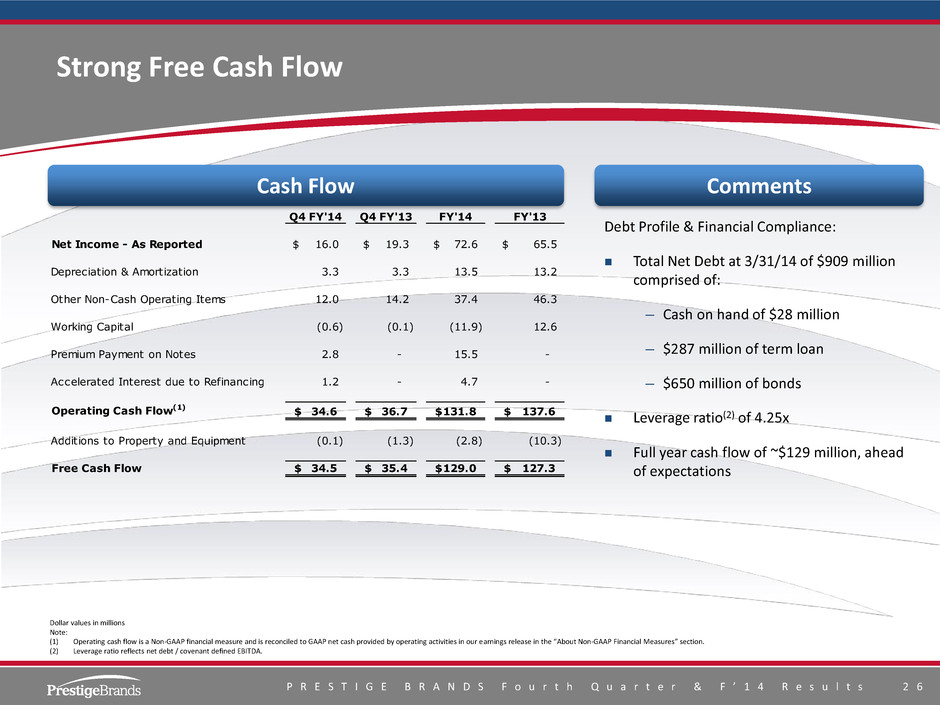
P R E S T I G E B R A N D S F o u r t h Q u a r t e r & F ’ 1 4 R e s u l t s 2 6 Q4 FY'14 Q4 FY'13 FY'14 FY'13 Net Income - As Reported 16.0$ 19.3$ 72.6$ 65.5$ Depreciation & Amortization 3.3 3.3 13.5 13.2 Other Non-Cash Operating Items 12.0 14.2 37.4 46.3 Working Capital (0.6) (0.1) (11.9) 12.6 Premium Payment on Notes 2.8 - 15.5 - Accelerated Interest due to Refinancing 1.2 - 4.7 - Operating Cash Flow(1) 34.6$ 36.7$ 131.8$ 137.6$ Additions to Property and Equipment (0.1) (1.3) (2.8) (10.3) Free Cash Flow 34.5$ 35.4$ 129.0$ 127.3$ Debt Profile & Financial Compliance: Total Net Debt at 3/31/14 of $909 million comprised of: – Cash on hand of $28 million – $287 million of term loan – $650 million of bonds Leverage ratio(2) of 4.25x Full year cash flow of ~$129 million, ahead of expectations Strong Free Cash Flow Dollar values in millions Note: (1) Operating cash flow is a Non-GAAP financial measure and is reconciled to GAAP net cash provided by operating activities in our earnings release in the “About Non-GAAP Financial Measures” section. (2) Leverage ratio reflects net debt / covenant defined EBITDA. Cash Flow Comments
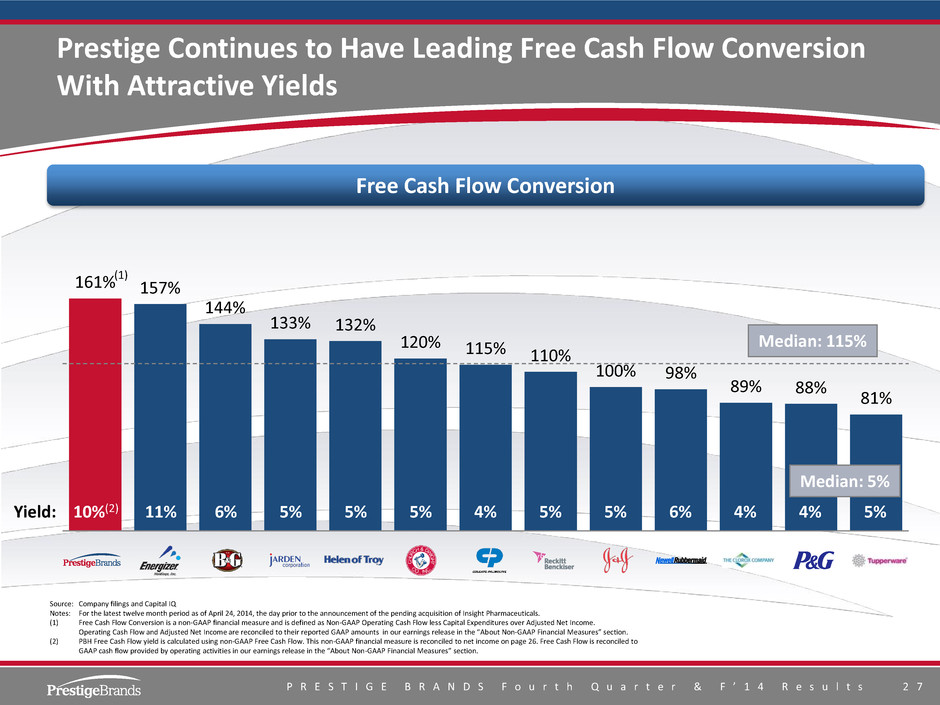
P R E S T I G E B R A N D S F o u r t h Q u a r t e r & F ’ 1 4 R e s u l t s 2 7 Prestige Continues to Have Leading Free Cash Flow Conversion With Attractive Yields 161% 157% 144% 133% 132% 120% 115% 110% 100% 98% 89% 88% 81% Median: 115% Source: Company filings and Capital IQ Notes: For the latest twelve month period as of April 24, 2014, the day prior to the announcement of the pending acquisition of Insight Pharmaceuticals. (1) Free Cash Flow Conversion is a non-GAAP financial measure and is defined as Non-GAAP Operating Cash Flow less Capital Expenditures over Adjusted Net Income. Operating Cash Flow and Adjusted Net Income are reconciled to their reported GAAP amounts in our earnings release in the “About Non-GAAP Financial Measures” section. (2) PBH Free Cash Flow yield is calculated using non-GAAP Free Cash Flow. This non-GAAP financial measure is reconciled to net income on page 26. Free Cash Flow is reconciled to GAAP cash flow provided by operating activities in our earnings release in the “About Non-GAAP Financial Measures” section. Free Cash Flow Conversion (1) 10%(2) 11% 6% 5% 5% 5% 4% 5% 5% 6% 4% 4% 5% Yield: Median: 5%
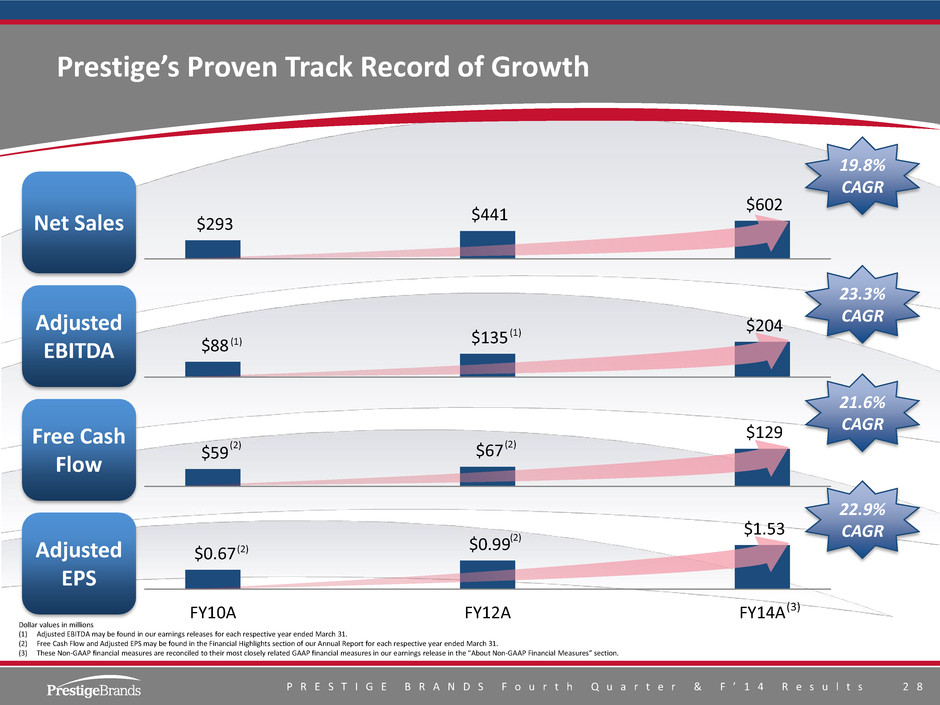
P R E S T I G E B R A N D S F o u r t h Q u a r t e r & F ’ 1 4 R e s u l t s 2 8 $0.67 $0.99 $1.53 FY10A FY12A FY14A Prestige’s Proven Track Record of Growth $88 $135 $204 $293 $441 $602 Dollar values in millions (1) Adjusted EBITDA may be found in our earnings releases for each respective year ended March 31. (2) Free Cash Flow and Adjusted EPS may be found in the Financial Highlights section of our Annual Report for each respective year ended March 31. (3) These Non-GAAP financial measures are reconciled to their most closely related GAAP financial measures in our earnings release in the “About Non-GAAP Financial Measures” section. $59 $67 $129 (1) (1) (2) (2) (2) (2) Net Sales Adjusted EBITDA Free Cash Flow Adjusted EPS 19.8% CAGR 23.3% CAGR 21.6% CAGR 22.9% CAGR (3)
P R E S T I G E B R A N D S F o u r t h Q u a r t e r & F ’ 1 4 R e s u l t s 2 9 IV. Outlook and Road Ahead: FY2015
P R E S T I G E B R A N D S F o u r t h Q u a r t e r & F ’ 1 4 R e s u l t s 3 0 Update on Recently Announced Acquisitions HydralyteTM acquisition closed April 30, 2014 Adds growing, market leading brand in Australia — #1 position in growing oral rehydration category — Strong strategic fit; doubles Prestige’s scale in Australia — Brand extension opportunities — Well aligned with Prestige’s international distribution channels, marketing approach, supply chain, and regulatory approach Expect Insight Pharmaceuticals to close in first half of FY2015 Adds attractive, new scale OTC platform in Feminine Care — Strong brand and consumer franchise; Monistat becomes Prestige’s largest brand — Increased brand support and new product pipeline are key to capturing long-term full value of the brand equity — Feminine care platform attractive from M&A standpoint
P R E S T I G E B R A N D S F o u r t h Q u a r t e r & F ’ 1 4 R e s u l t s 3 1 FY2015 Outlook: Continued Brand Building and M&A Integration Key to Strong Financial Growth Consumer sentiment: continued caution — Improving macro trends (unemployment and healthcare) — Brand loyalty remains important while delivering value to the consumer Challenging retail environment: retailers will continue to protect bottom line — More consumer engagement vs. consumer marketing — Continued investment in product innovation — Expanded channel development (Convenience, Dollar, Club) with key brands Ensure successful integration of acquisitions — Develop women’s health platform through product innovation and health care professional marketing — Maintain Hydralyte momentum while increasing brand/sales support and accelerating product innovation Continue to deliver strong and steady financial performance in FY2015(1) — Consistent high free cash flow of $150MM — 15% to 18% revenue growth Flat to down 3% for 1H based on strong comps and retail environment Approximately 30% for 2H based on organic growth and acquisitions – Adjusted E.P.S growth of 15% to 20% Note: (1) Assumes Insight close at September 30, 2014.
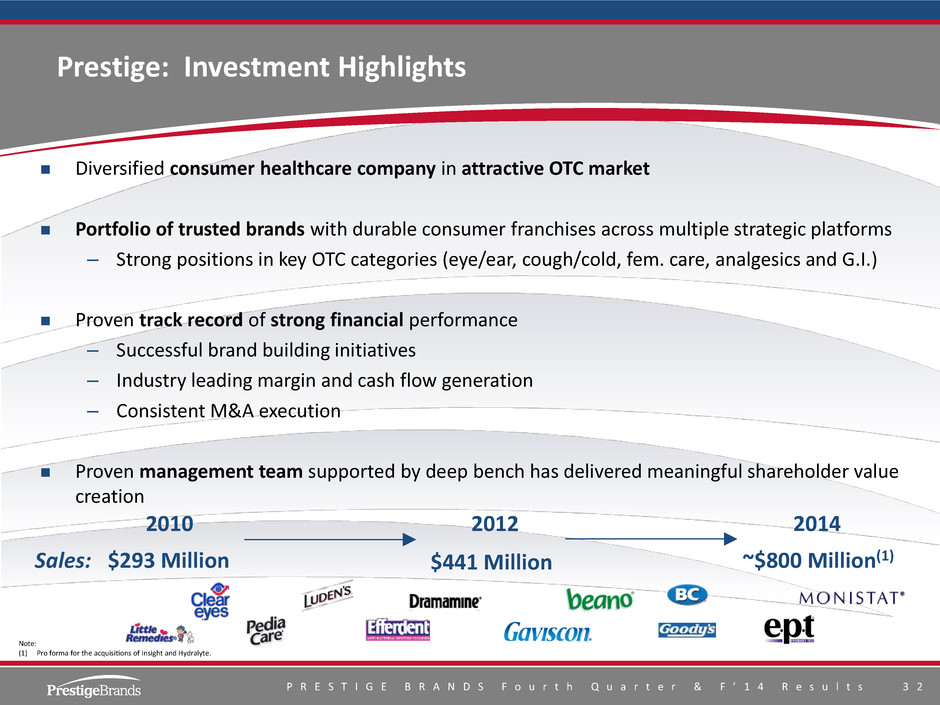
P R E S T I G E B R A N D S F o u r t h Q u a r t e r & F ’ 1 4 R e s u l t s 3 2 Prestige: Investment Highlights Diversified consumer healthcare company in attractive OTC market Portfolio of trusted brands with durable consumer franchises across multiple strategic platforms – Strong positions in key OTC categories (eye/ear, cough/cold, fem. care, analgesics and G.I.) Proven track record of strong financial performance – Successful brand building initiatives – Industry leading margin and cash flow generation – Consistent M&A execution Proven management team supported by deep bench has delivered meaningful shareholder value creation 2010 $293 Million 2012 $441 Million 2014 ~$800 Million(1) Sales: Note: (1) Pro forma for the acquisitions of Insight and Hydralyte.
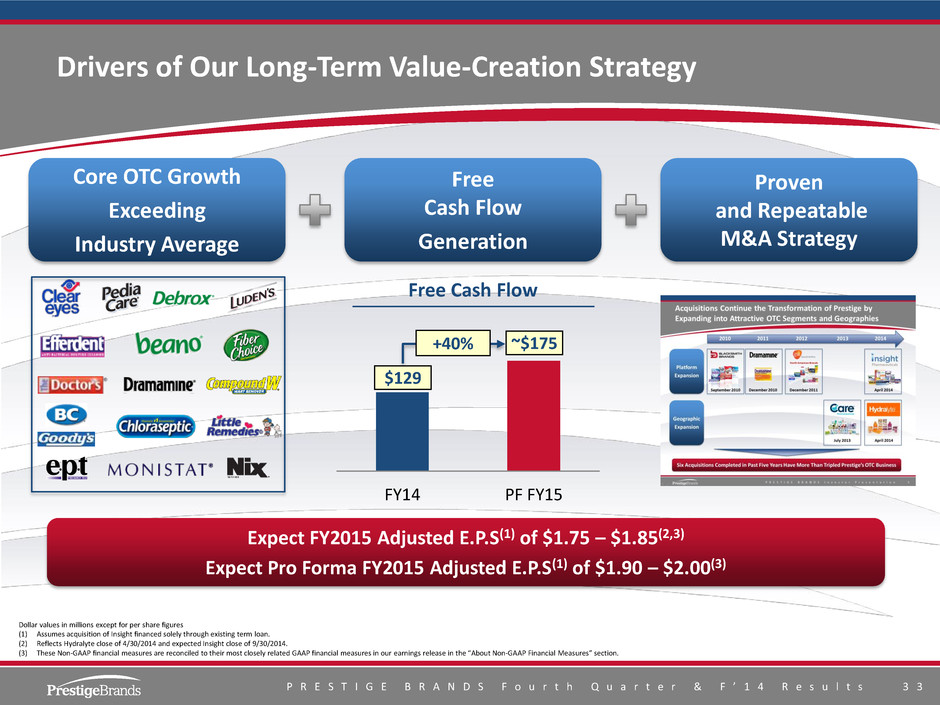
P R E S T I G E B R A N D S F o u r t h Q u a r t e r & F ’ 1 4 R e s u l t s 3 3 Drivers of Our Long-Term Value-Creation Strategy Expect FY2015 Adjusted E.P.S(1) of $1.75 – $1.85(2,3) Expect Pro Forma FY2015 Adjusted E.P.S(1) of $1.90 – $2.00(3) FY14 PF FY15 Free Cash Flow +40% $129 ~$175 Dollar values in millions except for per share figures (1) Assumes acquisition of Insight financed solely through existing term loan. (2) Reflects Hydralyte close of 4/30/2014 and expected Insight close of 9/30/2014. (3) These Non-GAAP financial measures are reconciled to their most closely related GAAP financial measures in our earnings release in the “About Non-GAAP Financial Measures” section. Core OTC Growth Exceeding Industry Average Free Cash Flow Generation Proven and Repeatable M&A Strategy
P R E S T I G E B R A N D S F o u r t h Q u a r t e r & F ’ 1 4 R e s u l t s 3 4


