
Exhibit 99.2
This presentation contains certain “forward-looking” statements within the meaning of the Private Securities Litigation Reform Act of 1995, such as statements regarding the Company’s expected financial performance, including revenue growth, organic growth, adjusted EPS, and adjusted free cash flow; the Company’s ability to de-lever; the availability of M&A opportunities; the market position and consumption trends for the Company’s brands; and the Company’s focus on brand-building. Words such as “trend,” “continue,” “will,” “expect,” “project,” “anticipate,” “likely,” “estimate,” “may,” “should,” “could,” “would,” and similar expressions identify forward-looking statements. Such forward-looking statements represent the Company’s expectations and beliefs and involve a number of known and unknown risks, uncertainties and other factors that may cause actual results to differ materially from those expressed or implied by such forward-looking statements. These factors include, among others, general economic and business conditions, regulatory matters, competitive pressures, supplier issues, disruptions to distribution, retailer inventory reductions, unexpected costs or liabilities, and other risks set forth in Part I, Item 1A. Risk Factors in the Company’s Annual Report on Form 10-K for the year ended March 31, 2018. You are cautioned not to place undue reliance on these forward-looking statements, which speak only as of the date this presentation. Except to the extent required by applicable law, the Company undertakes no obligation to update any forward-looking statement contained in this presentation, whether as a result of new information, future events, or otherwise. All adjusted GAAP numbers presented are footnoted and reconciled to their closest GAAP measurement in the attached reconciliation schedules or in our February 7, 2019 earnings release in the “About Non-GAAP Financial Measures” section.
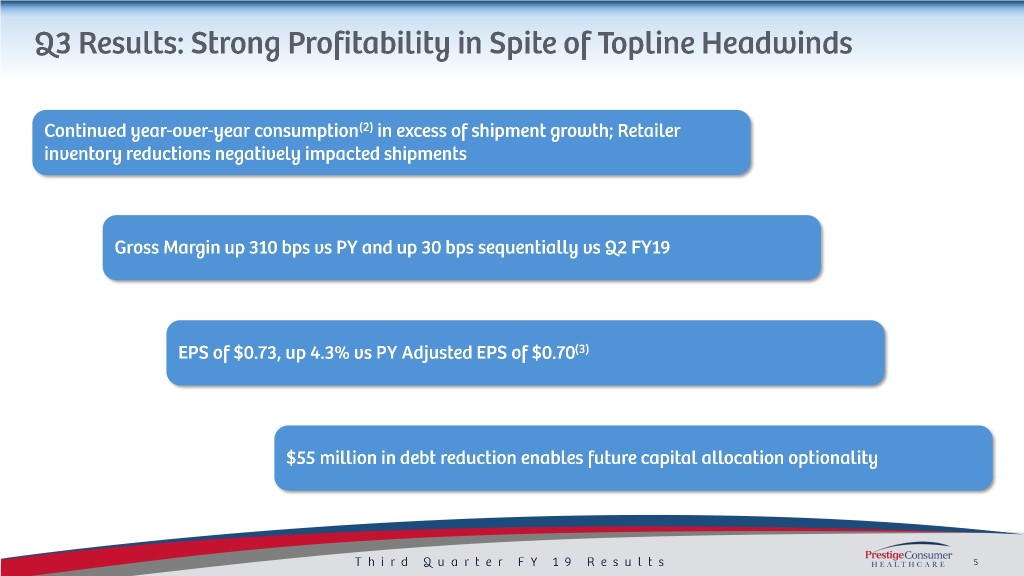
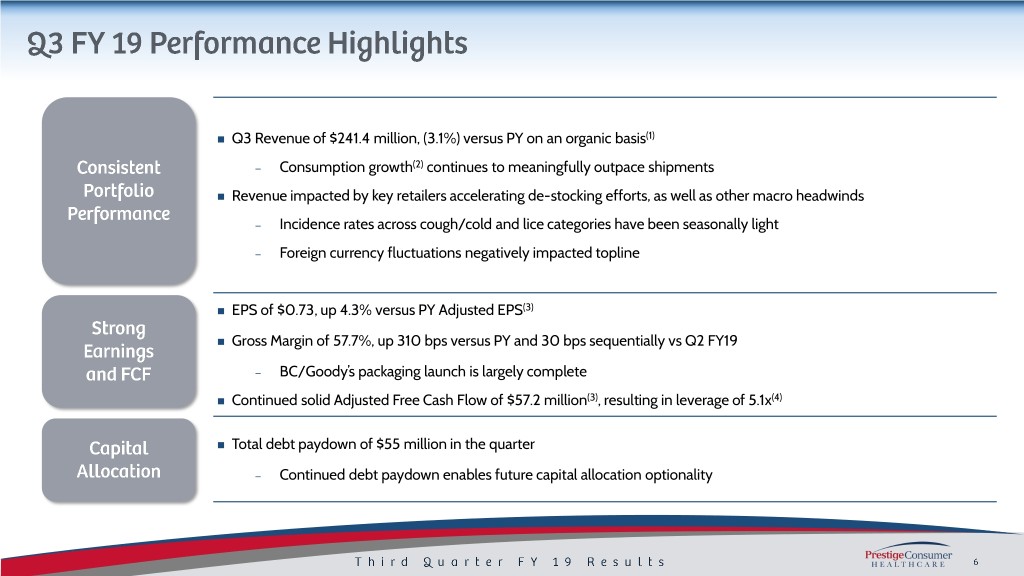
Q3 Revenue of $241.4 million, (3.1%) versus PY on an organic basis(1) – Consumption growth(2) continues to meaningfully outpace shipments Revenue impacted by key retailers accelerating de-stocking efforts, as well as other macro headwinds – Incidence rates across cough/cold and lice categories have been seasonally light – Foreign currency fluctuations negatively impacted topline EPS of $0.73, up 4.3% versus PY Adjusted EPS(3) Gross Margin of 57.7%, up 310 bps versus PY and 30 bps sequentially vs Q2 FY19 – BC/Goody’s packaging launch is largely complete Continued solid Adjusted Free Cash Flow of $57.2 million(3), resulting in leverage of 5.1x(4) Total debt paydown of $55 million in the quarter – Continued debt paydown enables future capital allocation optionality
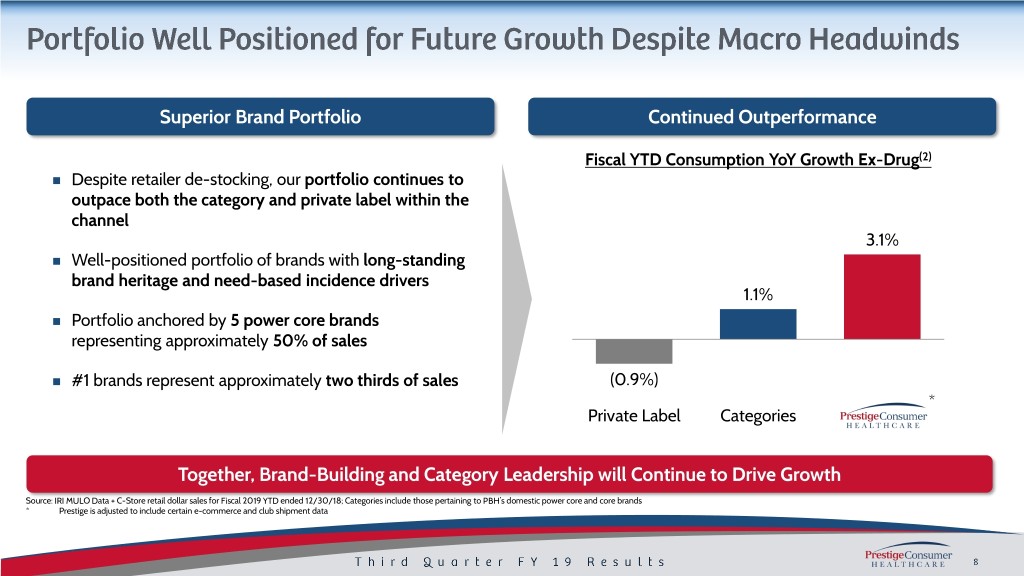
Superior Brand Portfolio Continued Outperformance Fiscal YTD Consumption YoY Growth Ex-Drug(2) Despite retailer de-stocking, our portfolio continues to outpace both the category and private label within the channel 3.1% Well-positioned portfolio of brands with long-standing brand heritage and need-based incidence drivers 1.1% Portfolio anchored by 5 power core brands representing approximately 50% of sales #1 brands represent approximately two thirds of sales (0.9%) * Private Label Categories Together, Brand-Building and Category Leadership will Continue to Drive Growth Source: IRI MULO Data + C-Store retail dollar sales for Fiscal 2019 YTD ended 12/30/18; Categories include those pertaining to PBH’s domestic power core and core brands * Prestige is adjusted to include certain e-commerce and club shipment data
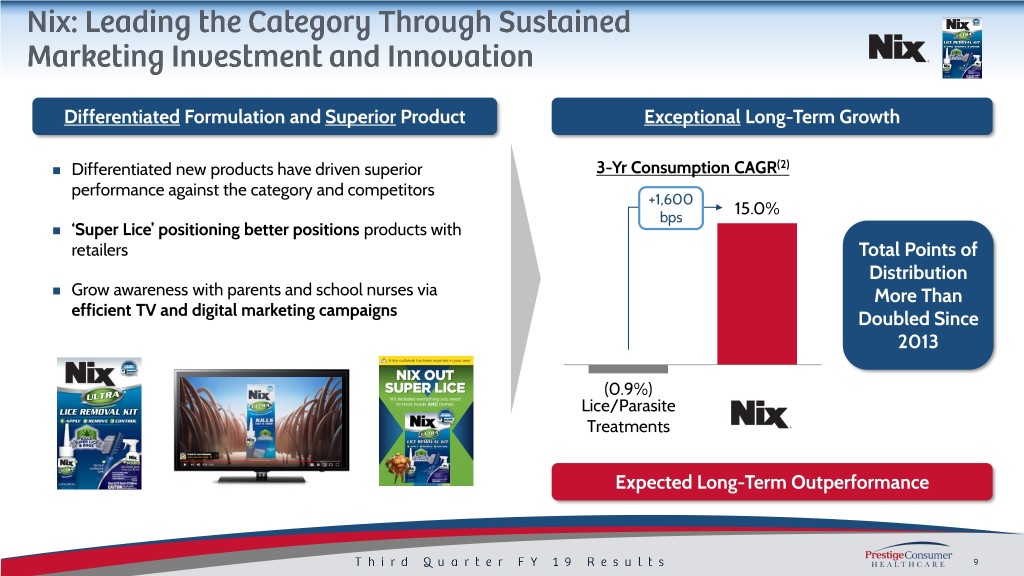
Differentiated Formulation and Superior Product Exceptional Long-Term Growth Differentiated new products have driven superior 3-Yr Consumption CAGR(2) performance against the category and competitors +1,600 15.0% bps ‘Super Lice’ positioning better positions products with retailers Total Points of Distribution Grow awareness with parents and school nurses via More Than efficient TV and digital marketing campaigns Doubled Since 2013 (0.9%) Lice/Parasite Treatments Expected Long-Term Outperformance
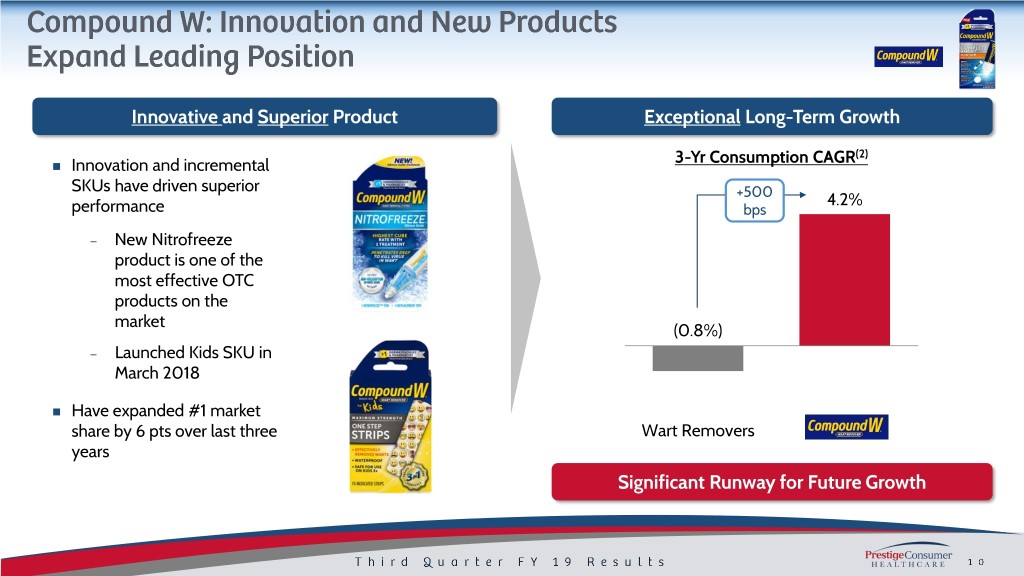
Innovative and Superior Product Exceptional Long-Term Growth (2) Innovation and incremental 3-Yr Consumption CAGR SKUs have driven superior +500 4.2% performance bps – New Nitrofreeze product is one of the most effective OTC products on the market (0.8%) – Launched Kids SKU in March 2018 Have expanded #1 market share by 6 pts over last three Wart Removers years Significant Runway for Future Growth

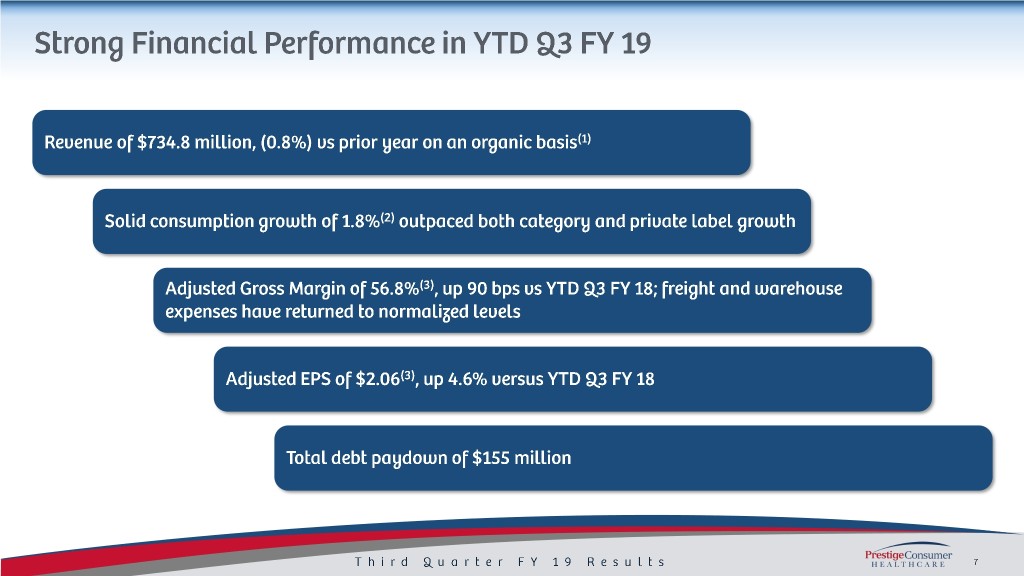
Solid profit performance in Q3 and YTD Q3 FY 19: − Q3 Revenue of $241.4 million, an organic(1) decrease of (3.1%) vs prior year − Q3 Adjusted EBITDA(3) of $85.2 million; up 100 bps as a percentage of revenue vs prior year − Q3 EPS of $0.73, an increase of 4.3% vs prior year Adjusted EPS(3) of $0.70, YTD 2019 Adjusted EPS(3) of $2.06, up 4.6% vs prior year Q3 FY 19 Q3 FY 18 YTD Q3 FY 19 YTD Q3 FY 18 (0.8%) (3.1%) $714.9 $720.5 (8.3%) 4.6% $241.4 $249.3 (8.3%) 4.3% $270.2 $247.7 $2.06 $1.97 $85.2 $93.0 $0.73 $0.70 (1) (3) (3) (1) (3) (3) Organic Revenue Adjusted EBITDA Adjusted EPS Organic Revenue Adjusted EBITDA Adjusted EPS Dollar values in millions, except per share data.
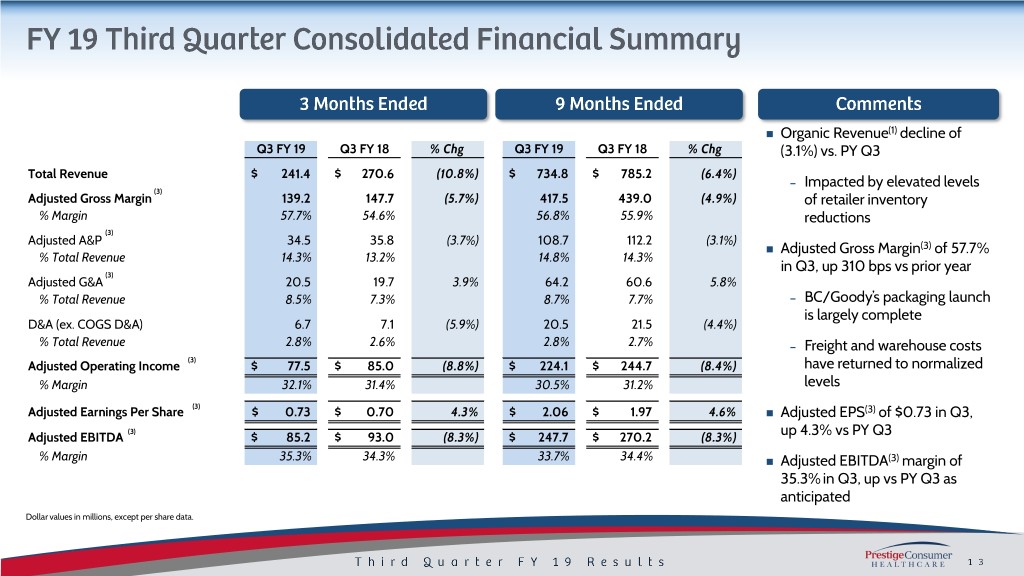
Organic Revenue(1) decline of Q3 FY 19 Q3 FY 18 % Chg Q3 FY 19 Q3 FY 18 % Chg (3.1%) vs. PY Q3 Total Revenue $ 241.4 $ 270.6 (10.8%) $ 734.8 $ 785.2 (6.4%) – Impacted by elevated levels (3) Adjusted Gross Margin 139.2 147.7 (5.7%) 417.5 439.0 (4.9%) of retailer inventory % Margin 57.7% 54.6% 56.8% 55.9% reductions (3) Adjusted A&P 34.5 35.8 (3.7%) 108.7 112.2 (3.1%) Adjusted Gross Margin(3) of 57.7% % Total Revenue 14.3% 13.2% 14.8% 14.3% in Q3, up 310 bps vs prior year (3) Adjusted G&A 20.5 19.7 3.9% 64.2 60.6 5.8% % Total Revenue 8.5% 7.3% 8.7% 7.7% – BC/Goody’s packaging launch is largely complete D&A (ex. COGS D&A) 6.7 7.1 (5.9%) 20.5 21.5 (4.4%) % Total Revenue 2.8% 2.6% 2.8% 2.7% – Freight and warehouse costs (3) Adjusted Operating Income $ 77.5 $ 85.0 (8.8%) $ 224.1 $ 244.7 (8.4%) have returned to normalized % Margin 32.1% 31.4% 30.5% 31.2% levels Adjusted Earnings Per Share (3) $ 0.73 $ 0.70 4.3% $ 2.06 $ 1.97 4.6% Adjusted EPS(3) of $0.73 in Q3, Adjusted EBITDA (3) $ 85.2 $ 93.0 (8.3%) $ 247.7 $ 270.2 (8.3%) up 4.3% vs PY Q3 % Margin 35.3% 34.3% 33.7% 34.4% Adjusted EBITDA(3) margin of 35.3% in Q3, up vs PY Q3 as anticipated Dollar values in millions, except per share data.
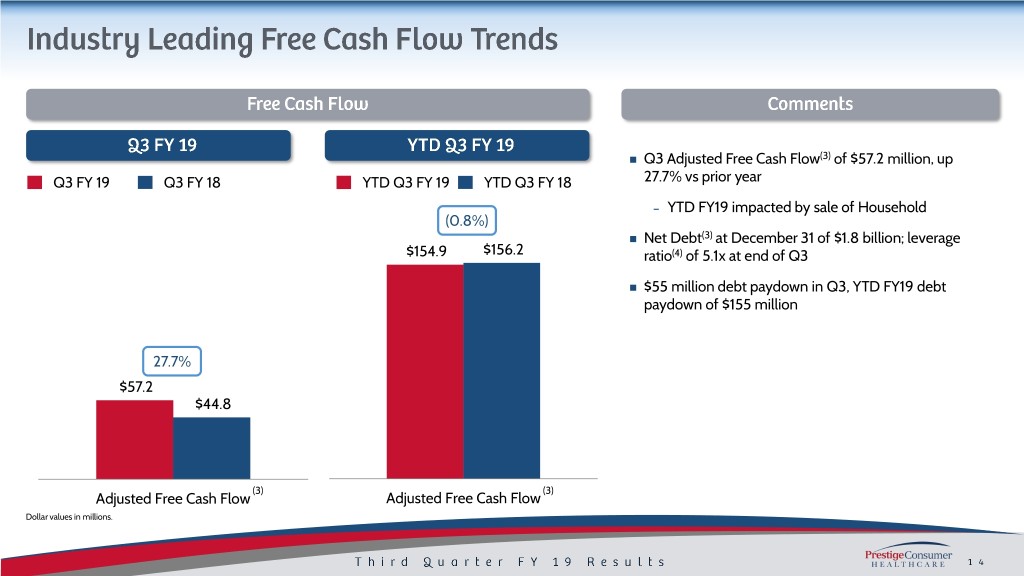
Q3 Adjusted Free Cash Flow(3) of $57.2 million, up Q3 FY 19 Q3 FY 18 YTD Q3 FY 19 YTD Q3 FY 18 27.7% vs prior year – YTD FY19 impacted by sale of Household (0.8%) Net Debt(3) at December 31 of $1.8 billion; leverage $154.9 $156.2 ratio(4) of 5.1x at end of Q3 $55 million debt paydown in Q3, YTD FY19 debt paydown of $155 million 27.7% $57.2 $44.8 (3) (3) Adjusted Free Cash Flow Adjusted Free Cash Flow Dollar values in millions.
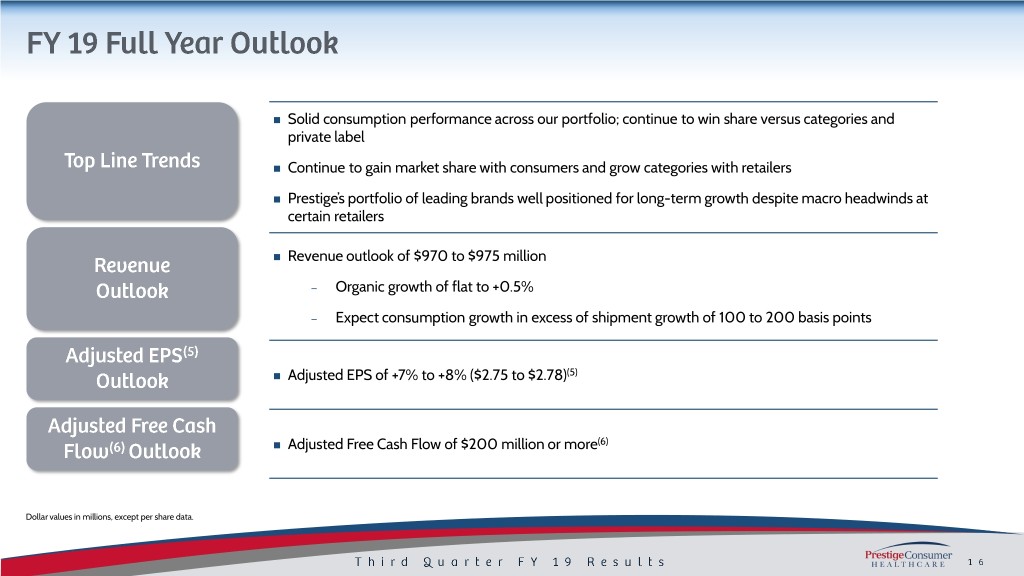
Solid consumption performance across our portfolio; continue to win share versus categories and private label Continue to gain market share with consumers and grow categories with retailers Prestige’s portfolio of leading brands well positioned for long-term growth despite macro headwinds at certain retailers Revenue outlook of $970 to $975 million – Organic growth of flat to +0.5% – Expect consumption growth in excess of shipment growth of 100 to 200 basis points Adjusted EPS of +7% to +8% ($2.75 to $2.78)(5) Adjusted Free Cash Flow of $200 million or more(6) Dollar values in millions, except per share data.
(1) Organic Revenue is a Non-GAAP financial measure and is reconciled to the most closely related GAAP financial measure in the attached Reconciliation Schedules and / or our earnings release in the “About Non-GAAP Financial Measures” section. (2) Total company consumption is based on domestic IRI multi-outlet + C-Store retail dollar sales for the nine month period ending 12-30-18 retail dollar sales for Amazon and Costco untracked channels, net revenues as a proxy for consumption for certain other untracked channels, international consumption which includes Canadian consumption for leading retailers, Australia consumption for leading brands, and other international net revenues as a proxy for consumption. (3) Adjusted Gross Margin, Adjusted A&P, Adjusted G&A, Adjusted EBITDA, Adjusted Operating Income, Adjusted Net Income, Adjusted EPS, Adjusted Free Cash Flow and Net Debt are Non-GAAP financial measures and are reconciled to their most closely related GAAP financial measures in the attached Reconciliation Schedules and / or in our earnings release in the “About Non- GAAP Financial Measures” section. (4) Leverage ratio reflects net debt / covenant defined EBITDA. (5) Adjusted EPS for FY 19 is a projected Non-GAAP financial measure, is reconciled to projected GAAP EPS in the attached Reconciliation Schedules and / or in our earnings release in the “About Non-GAAP Financial Measures” section and is calculated based on projected GAAP EPS plus adjustments relating to the sale of our Household cleaning business and related taxes. (6) Adjusted Free Cash Flow for FY 19 is a projected Non-GAAP financial measure, is reconciled to projected GAAP Net Cash Provided by Operating Activities in the attached Reconciliation Schedules and / or in our earnings release in the “About Non- GAAP Financial Measures” section and is calculated based on projected Net Cash Provided by Operating Activities less projected capital expenditures plus payments associated with divestitures less tax effect of payments associated with divestitures.
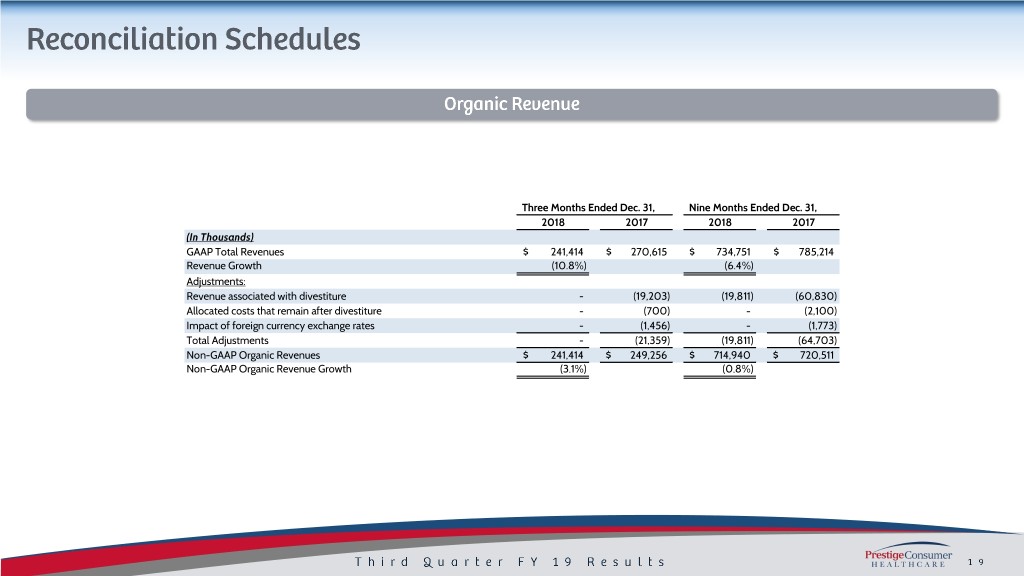
Three Months Ended Dec. 31, Nine Months Ended Dec. 31, 2018 2017 2018 2017 (In Thousands) GAAP Total Revenues $ 241,414 $ 270,615 $ 734,751 $ 785,214 Revenue Growth (10.8%) (6.4%) Adjustments: Revenue associated with divestiture - (19,203) (19,811) (60,830) Allocated costs that remain after divestiture - (700) - (2,100) Impact of foreign currency exchange rates - (1,456) - (1,773) Total Adjustments - (21,359) (19,811) (64,703) Non-GAAP Organic Revenues $ 241,414 $ 249,256 $ 714,940 $ 720,511 Non-GAAP Organic Revenue Growth (3.1%) (0.8%)
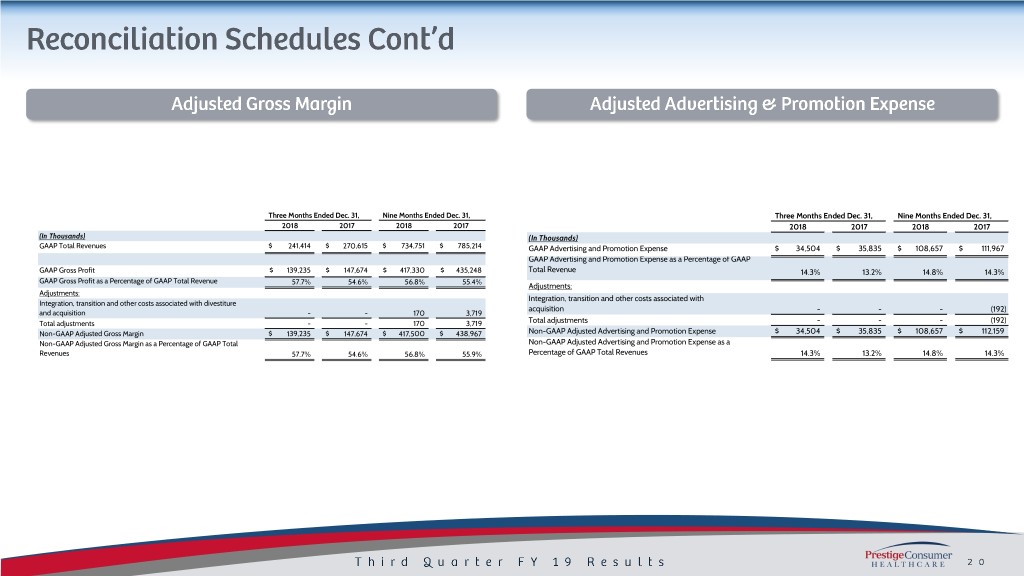
Three Months Ended Dec. 31, Nine Months Ended Dec. 31, Three Months Ended Dec. 31, Nine Months Ended Dec. 31, 2018 2017 2018 2017 2018 2017 2018 2017 (In Thousands) (In Thousands) GAAP Total Revenues $ 241,414 $ 270,615 $ 734,751 $ 785,214 GAAP Advertising and Promotion Expense $ 34,504 $ 35,835 $ 108,657 $ 111,967 GAAP Advertising and Promotion Expense as a Percentage of GAAP GAAP Gross Profit $ 139,235 $ 147,674 $ 417,330 $ 435,248 Total Revenue 14.3% 13.2% 14.8% 14.3% GAAP Gross Profit as a Percentage of GAAP Total Revenue 57.7% 54.6% 56.8% 55.4% Adjustments: Adjustments: Integration, transition and other costs associated with Integration, transition and other costs associated with divestiture acquisition - - - (192) and acquisition - - 170 3,719 Total adjustments - - 170 3,719 Total adjustments - - - (192) Non-GAAP Adjusted Gross Margin $ 139,235 $ 147,674 $ 417,500 $ 438,967 Non-GAAP Adjusted Advertising and Promotion Expense $ 34,504 $ 35,835 $ 108,657 $ 112,159 Non-GAAP Adjusted Gross Margin as a Percentage of GAAP Total Non-GAAP Adjusted Advertising and Promotion Expense as a Revenues 57.7% 54.6% 56.8% 55.9% Percentage of GAAP Total Revenues 14.3% 13.2% 14.8% 14.3%
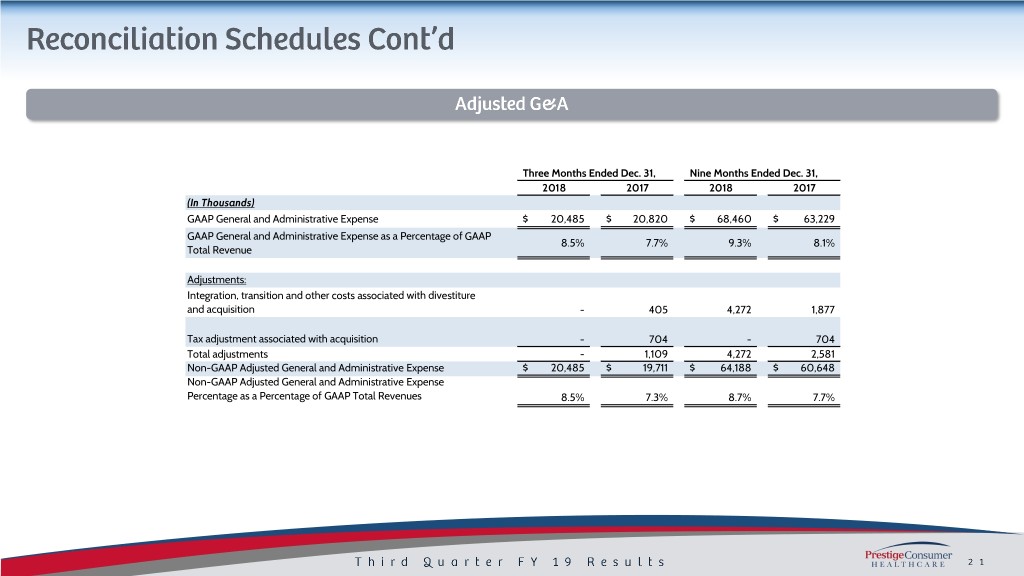
Three Months Ended Dec. 31, Nine Months Ended Dec. 31, 2018 2017 2018 2017 (In Thousands) GAAP General and Administrative Expense $ 20,485 $ 20,820 $ 68,460 $ 63,229 GAAP General and Administrative Expense as a Percentage of GAAP 8.5% 7.7% 9.3% 8.1% Total Revenue Adjustments: Integration, transition and other costs associated with divestiture and acquisition - 405 4,272 1,877 Tax adjustment associated with acquisition - 704 - 704 Total adjustments - 1,109 4,272 2,581 Non-GAAP Adjusted General and Administrative Expense $ 20,485 $ 19,711 $ 64,188 $ 60,648 Non-GAAP Adjusted General and Administrative Expense Percentage as a Percentage of GAAP Total Revenues 8.5% 7.3% 8.7% 7.7%
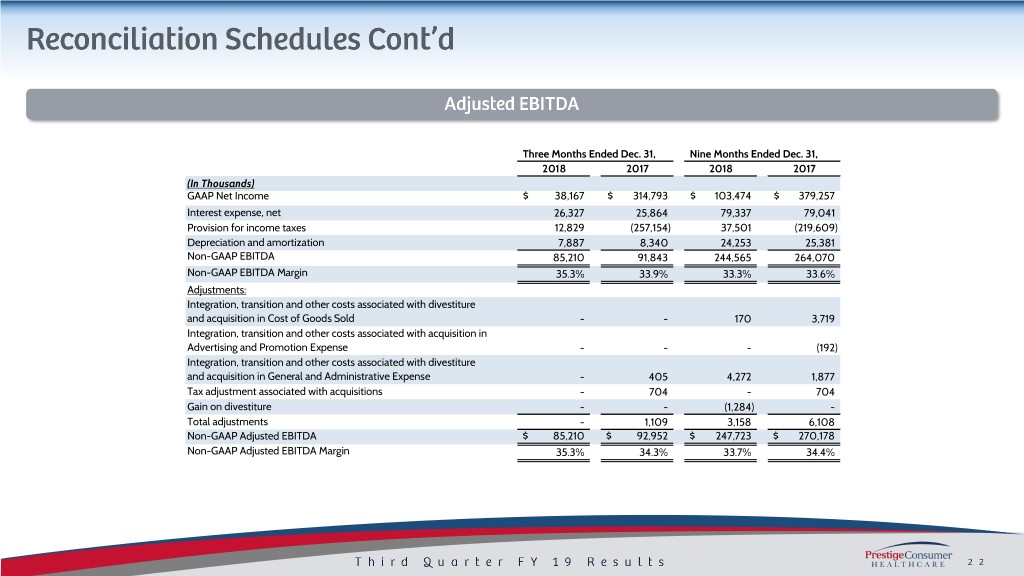
Three Months Ended Dec. 31, Nine Months Ended Dec. 31, 2018 2017 2018 2017 (In Thousands) GAAP Net Income $ 38,167 $ 314,793 $ 103,474 $ 379,257 Interest expense, net 26,327 25,864 79,337 79,041 Provision for income taxes 12,829 (257,154) 37,501 (219,609) Depreciation and amortization 7,887 8,340 24,253 25,381 Non-GAAP EBITDA 85,210 91,843 244,565 264,070 Non-GAAP EBITDA Margin 35.3% 33.9% 33.3% 33.6% Adjustments: Integration, transition and other costs associated with divestiture and acquisition in Cost of Goods Sold - - 170 3,719 Integration, transition and other costs associated with acquisition in Advertising and Promotion Expense - - - (192) Integration, transition and other costs associated with divestiture and acquisition in General and Administrative Expense - 405 4,272 1,877 Tax adjustment associated with acquisitions - 704 - 704 Gain on divestiture - - (1,284) - Total adjustments - 1,109 3,158 6,108 Non-GAAP Adjusted EBITDA $ 85,210 $ 92,952 $ 247,723 $ 270,178 Non-GAAP Adjusted EBITDA Margin 35.3% 34.3% 33.7% 34.4%
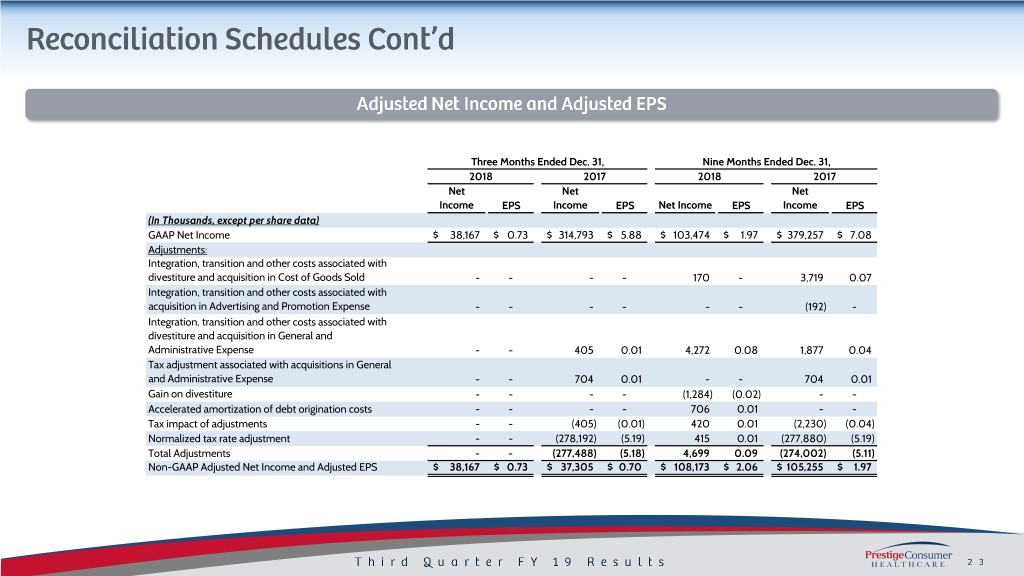
Three Months Ended Dec. 31, Nine Months Ended Dec. 31, 2018 2017 2018 2017 Net Net Net Income EPS Income EPS Net Income EPS Income EPS (In Thousands, except per share data) GAAP Net Income $ 38,167 $ 0.73 $ 314,793 $ 5.88 $ 103,474 $ 1.97 $ 379,257 $ 7.08 Adjustments: Integration, transition and other costs associated with divestiture and acquisition in Cost of Goods Sold - - - - 170 - 3,719 0.07 Integration, transition and other costs associated with acquisition in Advertising and Promotion Expense - - - - - - (192) - Integration, transition and other costs associated with divestiture and acquisition in General and Administrative Expense - - 405 0.01 4,272 0.08 1,877 0.04 Tax adjustment associated with acquisitions in General and Administrative Expense - - 704 0.01 - - 704 0.01 Gain on divestiture - - - - (1,284) (0.02) - - Accelerated amortization of debt origination costs - - - - 706 0.01 - - Tax impact of adjustments - - (405) (0.01) 420 0.01 (2,230) (0.04) Normalized tax rate adjustment - - (278,192) (5.19) 415 0.01 (277,880) (5.19) Total Adjustments - - (277,488) (5.18) 4,699 0.09 (274,002) (5.11) Non-GAAP Adjusted Net Income and Adjusted EPS $ 38,167 $ 0.73 $ 37,305 $ 0.70 $ 108,173 $ 2.06 $ 105,255 $ 1.97
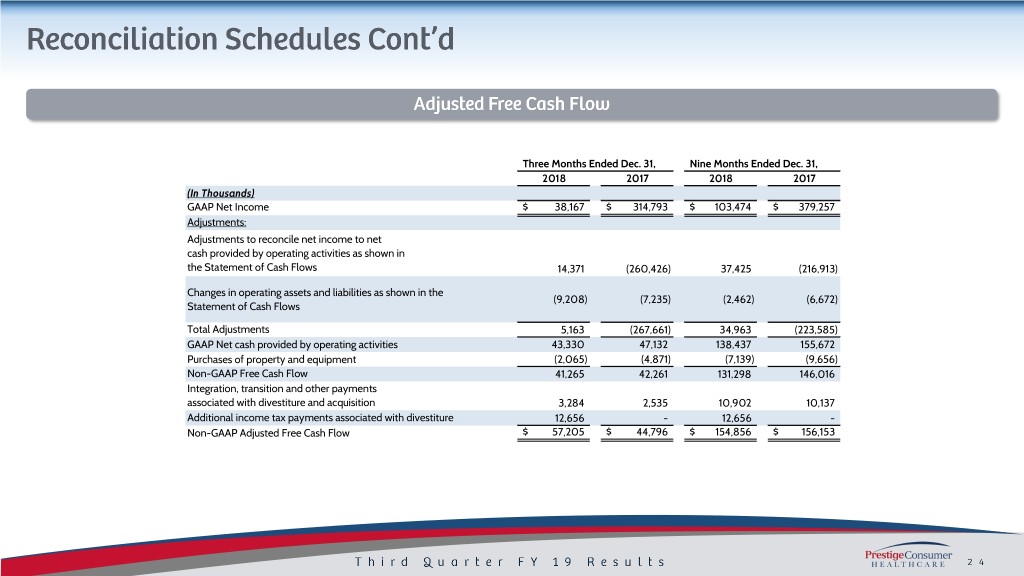
Three Months Ended Dec. 31, Nine Months Ended Dec. 31, 2018 2017 2018 2017 (In Thousands) GAAP Net Income $ 38,167 $ 314,793 $ 103,474 $ 379,257 Adjustments: Adjustments to reconcile net income to net cash provided by operating activities as shown in the Statement of Cash Flows 14,371 (260,426) 37,425 (216,913) Changes in operating assets and liabilities as shown in the (9,208) (7,235) (2,462) (6,672) Statement of Cash Flows Total Adjustments 5,163 (267,661) 34,963 (223,585) GAAP Net cash provided by operating activities 43,330 47,132 138,437 155,672 Purchases of property and equipment (2,065) (4,871) (7,139) (9,656) Non-GAAP Free Cash Flow 41,265 42,261 131,298 146,016 Integration, transition and other payments associated with divestiture and acquisition 3,284 2,535 10,902 10,137 Additional income tax payments associated with divestiture 12,656 - 12,656 - Non-GAAP Adjusted Free Cash Flow $ 57,205 $ 44,796 $ 154,856 $ 156,153

2019 Projected Free Cash Flow 2019 Projected EPS Low High (In millions) Projected FY'19 GAAP EPS $ 2.66 $ 2.69 Projected FY'19 GAAP Net Cash provided by operating activities $ 189 Adjustments: Additions to property and equipment for cash (13) Sale of Household Cleaning Business 0.07 0.07 Projected Non-GAAP Free Cash Flow 176 Tax adjustment 0.02 0.02 Total Adjustments 0.09 0.09 Payments associated with divestiture 24 Projected Non-GAAP Adjusted EPS $ 2.75 $ 2.78 Projected Non-GAAP Adjusted Free Cash Flow $ 200


