
Exhibit 99.2 Prestige Consume; HEALTHCARE Second �uorter FY 2020 Results October 31st, 2019 a>s= NO,f.!)ROWSY Driiiiiain --tlROWSY DiiiilamHlE-----a, =- iDhliii·amamffi'\fjji�e

This presentation contains certain “forward-looking” statements within the meaning of the Private Securities Litigation Reform Act of 1995, such as statements regarding the Company’s expected financial performance, including revenues, organic growth, adjusted EPS, and adjusted free cash flow; the market share, expected growth and consumption trends for the Company’s brands; the expected cost of transition to a new logistics provider; the impact of brand-building and product innovation and the related impact on the Company’s revenues; the Company’s disciplined capital allocation; the Company’s use of cash to pay down debt; the Company’s international performance and the impact of retailer destocking. Words such as “trend,” “continue,” “will,” “expect,” “project,” “anticipate,” “likely,” “estimate,” “may,” “should,” “could,” “would,” and similar expressions identify forward-looking statements. Such forward-looking statements represent the Company’s expectations and beliefs and involve a number of known and unknown risks, uncertainties and other factors that may cause actual results to differ materially from those expressed or implied by such forward-looking statements. These factors include, among others, general economic and business conditions, regulatory matters, competitive pressures, consumer trends, retail inventory management initiatives, supplier issues, the impact of the transition to a new third party logistics provider, unexpected costs or liabilities, and other risks set forth in Part I, Item 1A. Risk Factors in the Company’s Annual Report on Form 10-K for the year ended March 31, 2019. You are cautioned not to place undue reliance on these forward-looking statements, which speak only as of the date this presentation. Except to the extent required by applicable law, the Company undertakes no obligation to update any forward-looking statement contained in this presentation, whether as a result of new information, future events, or otherwise. All adjusted GAAP numbers presented are footnoted and reconciled to their closest GAAP measurement in the attached reconciliation schedule or in our October 31, 2019 earnings release in the “About Non-GAAP Financial Measures” section.

Agenda for Today's Discussion I. Performance Highlights II. Financial Oueruiew Ill. FY 20 Outloo� p� Second �u arter FY 20 Results HEALTHCARE 3

I. Performance Highlights fiMMii@@·j Fleet® Summers£ve· Dramamine· C·•fle �r � eyes®u l,:V· (fi:,1,J,ffl MONISTAT� GOf!ff.!'f!n� Oebrox� @FESS

◼ Q2 Revenue of $238.1 million, flat versus prior year on an organic basis (1) – Strong growth in international segment driven by Canada and Australia – Consumption growth(2) of 2% continues to meaningfully outpace revenue growth ◼ Adjusted EPS(3) of $0.68, up 4.6% versus Adjusted(3) prior year Q2 ◼ Adjusted Gross Margin(3) of 58.0% up ~60 bps since Q2 FY 19 ◼ Continued solid Adjusted Free Cash Flow(3) of $47.2 million, up 7.0% versus Adjusted(3) prior year Q2 ◼ Completed $50 million share buyback program with repurchase of $21 million of shares in Q2 ◼ Total debt paydown of $26 million in the quarter, resulting in leverage ratio of 5.0x(4) ◼ Continued focus on de-leveraging in second half

Strong Financial Performance in First Half FY 20 3 AdjustedEPS of $1.33( ), flat uersus prior year due to the Household Cleaning sole Adjusted Free Cash Flow(3) of $98.0 million Enabling Efficient Capitol Allocation p� Second Qu arter FY 20 Results H£ALTHCARE 6
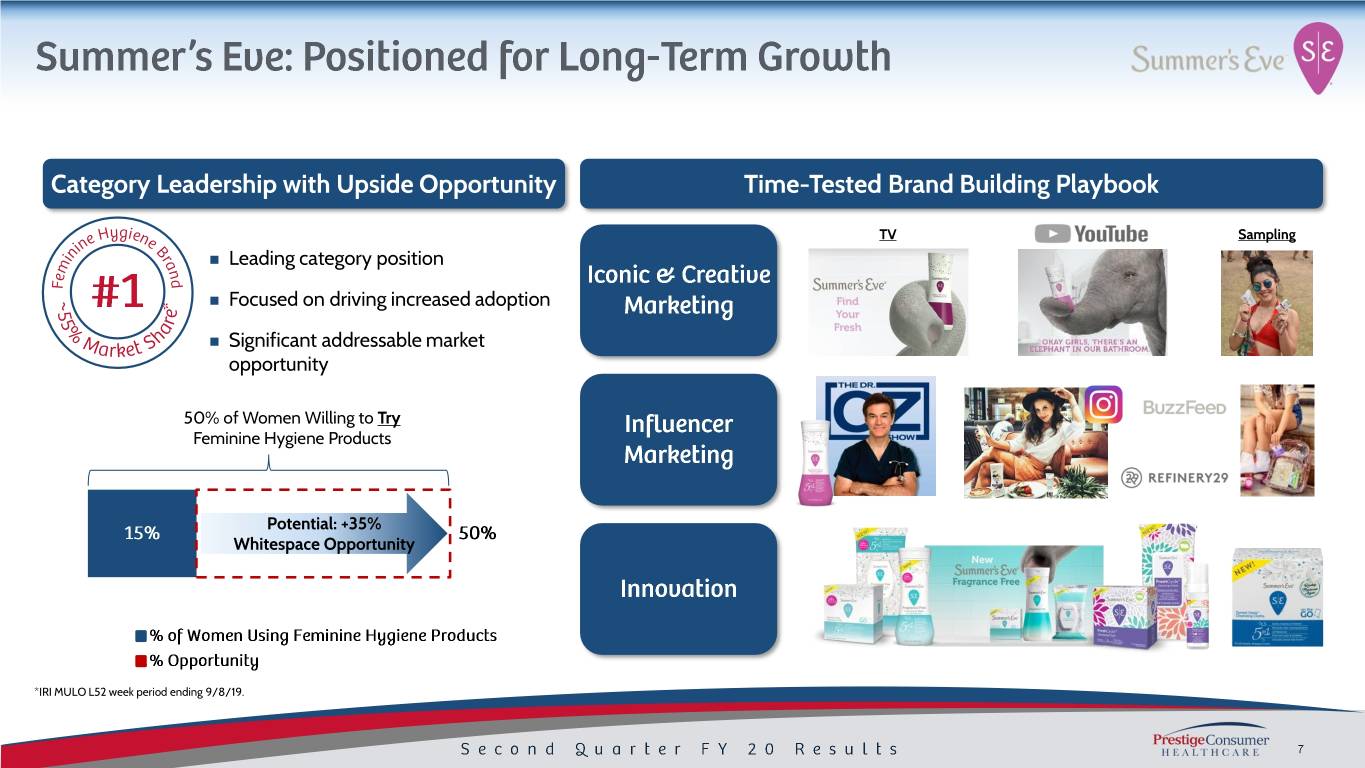
Category Leadership with Upside Opportunity Time-Tested Brand Building Playbook TV Sampling ◼ Leading category position ◼ Focused on driving increased adoption ◼ Significant addressable market opportunity 50% of Women Willing to Try Feminine Hygiene Products Potential: +35% Whitespace Opportunity *IRI MULO L52 week period ending 9/8/19.
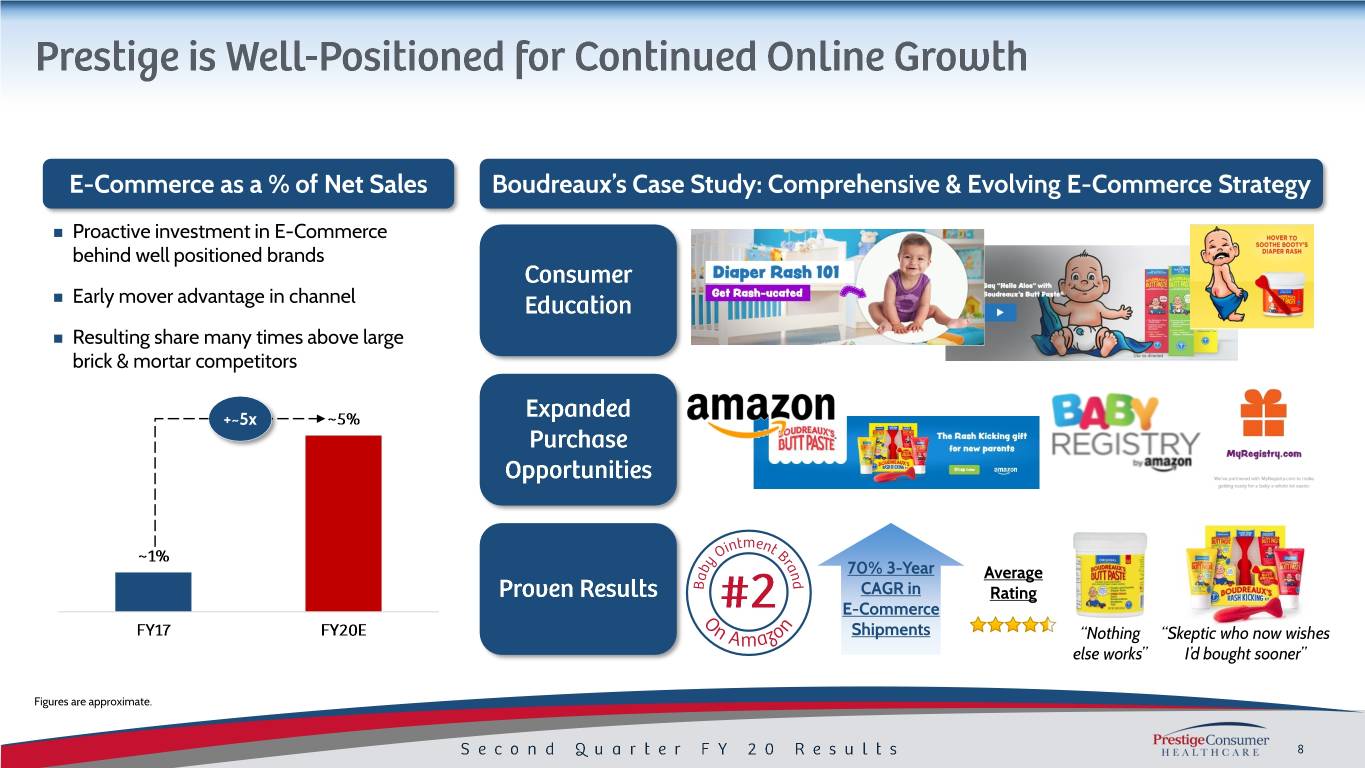
E-Commerce as a % of Net Sales Boudreaux’s Case Study: Comprehensive & Evolving E-Commerce Strategy ◼ Proactive investment in E-Commerce behind well positioned brands ◼ Early mover advantage in channel ◼ Resulting share many times above large brick & mortar competitors +~5x 70% 3-Year Average CAGR in Rating E-Commerce Shipments “Nothing “Skeptic who now wishes else works” I’d bought sooner” Figures are approximate.

II. Financial Oueruiew fiMMii@@·j Fleet® Summers£ve· Dramamine· C·•fle �r � eyes®u l,:V· (fi:,1,J,ffl MONISTAT� GOf!ff.!'f!n� Oebrox� @FESS
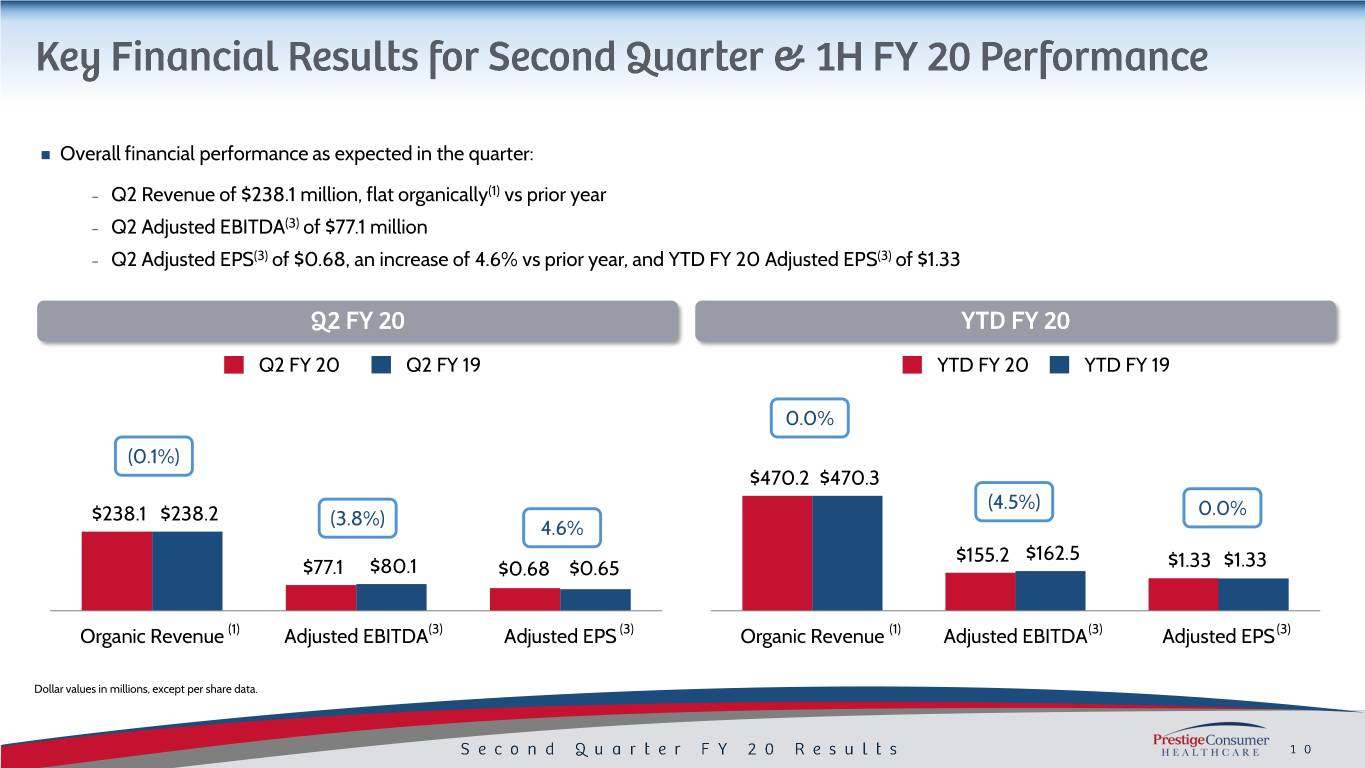
◼ Overall financial performance as expected in the quarter: − Q2 Revenue of $238.1 million, flat organically(1) vs prior year − Q2 Adjusted EBITDA(3) of $77.1 million − Q2 Adjusted EPS(3) of $0.68, an increase of 4.6% vs prior year, and YTD FY 20 Adjusted EPS(3) of $1.33 Q2 FY 20 Q2 FY 19 YTD FY 20 YTD FY 19 0.0% (0.1%) $470.2 $470.3 (4.5%) $238.1 $238.2 0.0% (3.8%) 4.6% $155.2 $162.5 $77.1 $80.1 $0.68 $0.65 $1.33 $1.33 Organic Revenue (1) Adjusted EBITDA(3) Adjusted EPS (3) Organic Revenue (1) Adjusted EBITDA(3) Adjusted EPS(3) Dollar values in millions, except per share data.

Q2 FY 20 Q2 FY 19 % Chg Q2 FY 20 Q2 FY 19 % Chg ◼ Organic revenue growth Total Revenue $ 238.1 $ 239.4 (0.5%) $ 470.2 $ 493.3 (4.7%) approximately flat vs prior year(1) (3) Adjusted Gross Margin 138.2 137.5 0.5% 272.2 278.3 (2.2%) – Continued destocking at % Margin 58.0% 57.4% 57.9% 56.4% retailers impacting A&P 38.7 37.1 4.4% 73.5 74.2 (0.9%) shipments despite strong % Total Revenue 16.2% 15.5% 15.6% 15.0% consumption Adjusted G&A(3) 22.5 21.2 6.3% 44.2 43.7 1.2% ◼ Adjusted Gross Margin(3) of % Total Revenue 9.5% 8.9% 9.4% 8.9% 58.0% in Q2, up ~60 bps vs prior D&A (ex. COGS D&A) 6.2 6.8 (7.9%) 12.3 13.8 (11.2%) year % Total Revenue 2.6% 2.8% 2.6% 2.8% (3) ◼ A&P was 16.2% of Revenue in Q2, Adjusted Operating Income $ 70.8 $ 72.4 (2.4%) $ 142.2 $ 146.6 (3.0%) as expected % Margin 29.7% 30.3% 30.2% 29.7% (3) ◼ (3) Adjusted Earnings Per Share $ 0.68 $ 0.65 4.6% $ 1.33 $ 1.33 — Adjusted EBITDA percent of Revenue of 33.0% YTD in-line Adjusted EBITDA(3) $ 77.1 $ 80.1 (3.8%) $ 155.2 $ 162.5 (4.5%) with expectations and prior year % Margin 32.4% 33.5% 33.0% 32.9% Dollar values in millions, except per share data.
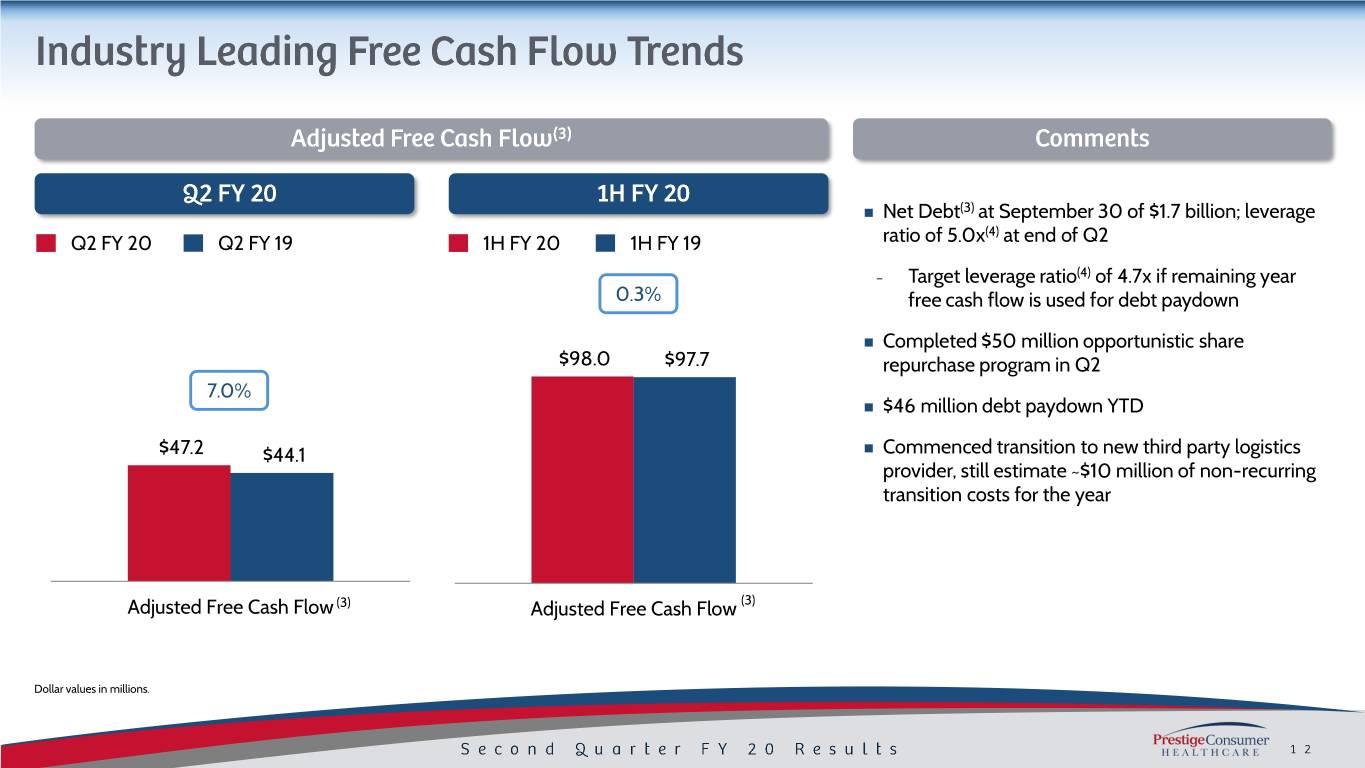
◼ Net Debt(3) at September 30 of $1.7 billion; leverage (4) Q2 FY 20 Q2 FY 19 1H FY 20 1H FY 19 ratio of 5.0x at end of Q2 – Target leverage ratio(4) of 4.7x if remaining year 0.3% free cash flow is used for debt paydown ◼ Completed $50 million opportunistic share $98.0 $97.7 repurchase program in Q2 7.0% ◼ $46 million debt paydown YTD $47.2 $44.1 ◼ Commenced transition to new third party logistics provider, still estimate ~$10 million of non-recurring transition costs for the year Adjusted Free Cash Flow (3) Adjusted Free Cash Flow (3) Dollar values in millions.

Ill. FY 20 Outloo� fiMMii@@·j Fleet® Summers£ve· Dramamine· C·•fle �r � eyes®u l,:V· (fi:,1,J,ffl MONISTAT� GOf!ff.!'f!n� Oebrox� @FESS

◼ Continue to gain market share with consumers and grow categories for retailers ◼ Prestige’s portfolio of need-based brands continues to be well positioned for long-term growth, despite continued inventory reduction at retail ◼ Expect continued strong international performance ◼ Reported Revenue of $947 to $957 million, Organic Revenue(1) expected to be approximately flat – Reported Revenue forecast reflects latest currency estimates – Expect consumption growth in excess of shipment growth – Expect continued retailer de-stocking, particularly in the drug channel ◼ Adjusted EPS approximately flat ($2.76 to $2.83)(5) ◼ Adjusted Free Cash Flow(6) of $200 million or more ◼ Continue to execute disciplined capital allocation strategy ◼ Target Leverage Ratio(4) of 4.7x by fiscal year end

p� rst Qu arter FY 20 Results H£ALTHCARE 1 5

(1) Organic Revenue is a Non-GAAP financial measure and is reconciled to the most closely related GAAP financial measure in the attached Reconciliation Schedules and / or our earnings release in the “About Non-GAAP Financial Measures” section. (2) Total company consumption is based on domestic IRI multi-outlet + C-Store retail sales for the period ending 9-7-19, direct point of sale consumption for certain untracked channels in North America for leading retailers, Australia consumption based on IMS data, and other international net revenues as a proxy for consumption. (3) Adjusted Gross Margin, Adjusted G&A, EBITDA, Adjusted EBITDA, Adjusted EBITDA Margin, Adjusted Operating Income, Adjusted Net Income, Adjusted EPS, Free Cash Flow, Adjusted Free Cash Flow and Net Debt are Non-GAAP financial measures and are reconciled to their most closely related GAAP financial measures in the attached Reconciliation Schedules and / or in our earnings release in the “About Non-GAAP Financial Measures” section. (4) Leverage ratio reflects net debt / covenant defined EBITDA. (5) Adjusted EPS for FY 20 is a projected Non-GAAP financial measure, is reconciled to projected GAAP EPS in the attached Reconciliation Schedules and / or in our earnings release in the “About Non-GAAP Financial Measures” section and is calculated based on projected GAAP EPS plus adjustments relating to the integration of our new logistics provider. (6) Adjusted Free Cash Flow for FY 20 is a projected Non-GAAP financial measure, is reconciled to projected GAAP Net Cash Provided by Operating Activities in the attached Reconciliation Schedules and / or in our earnings release in the “About Non- GAAP Financial Measures” section and is calculated based on projected Net Cash Provided by Operating Activities less projected capital expenditures plus payments associated with the integration of our new logistics provider.
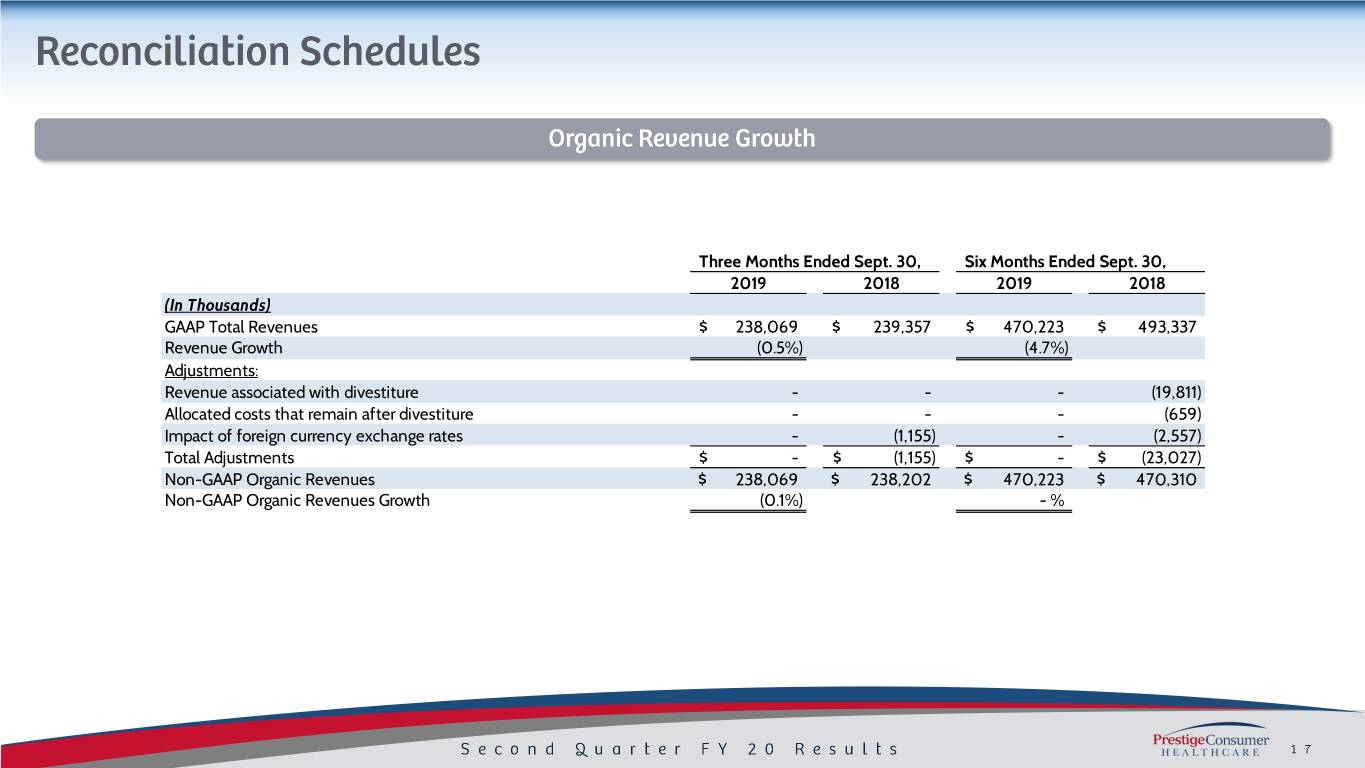
Three Months Ended Sept. 30, Six Months Ended Sept. 30, 2019 2018 2019 2018 (In Thousands) GAAP Total Revenues $ 238,069 $ 239,357 $ 470,223 $ 493,337 Revenue Growth (0.5%) (4.7%) Adjustments: Revenue associated with divestiture - - - (19,811) Allocated costs that remain after divestiture - - - (659) Impact of foreign currency exchange rates - (1,155) - (2,557) Total Adjustments $ - $ (1,155) $ - $ (23,027) Non-GAAP Organic Revenues $ 238,069 $ 238,202 $ 470,223 $ 470,310 Non-GAAP Organic Revenues Growth (0.1%) -%

Three Months Ended Sept. 30, Six Months Ended Sept. 30, Three Months Ended Sept. 30, Six Months Ended Sept. 30, 2019 2018 2019 2018 2019 2018 2019 2018 (In Thousands) (In Thousands) GAAP Total Revenues $ 238,069 $ 239,357 $ 470,223 $ 493,337 GAAP General and Administrative Expense $ 22,514 $ 24,034 $ 44,220 $ 47,975 GAAP General and Administrative Expense as a Percentage of GAAP Total Revenue 9.5% 10.0% 9.4% 9.7% GAAP Gross Profit $ 136,751 $ 137,472 $ 270,818 $ 278,095 GAAP Gross Profit as a Percentage of GAAP Total Revenue 57.4% 57.4% 57.6% 56.4% Adjustments: Adjustments: Transition and other costs associated with divestiture (a) - 2,850 - 4,272 Transition and other costs associated with new warehouse and Total adjustments - 2,850 - 4,272 divestiture (a) 1,407 - 1,407 170 Non-GAAP Adjusted General and Administrative Expense $ 22,514 $ 21,184 $ 44,220 $ 43,703 Total adjustments 1,407 - 1,407 170 Non-GAAP Adjusted General and Administrative Expense Non-GAAP Adjusted Gross Margin $ 138,158 $ 137,472 $ 272,225 $ 278,265 Percentage as a Percentage of GAAP Total Revenues 9.5% 8.9% 9.4% 8.9% Non-GAAP Adjusted Gross Margin as a Percentage of GAAP Total Revenues 58.0% 57.4% 57.9% 56.4% a) Items related to new warehouse represent costs to transition to the new warehouse and duplicate costs incurred during a) Items related to divestiture represent costs related to divesting of assets sold including (but not limited to), costs to exit the transition. Items related to divestiture represent costs related to divesting of assets sold. or convert contractual obligations, severance and consulting costs; and certain costs related to the consummation of the divestiture process such as insurance costs, legal and other related professional fees.

Three Months Ended Sept. 30, Six Months Ended Sept. 30, 2019 2018 2019 2018 (In Thousands) GAAP Net Income $ 33,252 $ 30,841 $ 67,177 $ 65,307 Interest expense, net 24,477 27,070 49,497 53,010 Provision for income taxes 10,760 12,678 22,885 24,672 Depreciation and amortization 7,222 7,994 14,283 16,366 Non-GAAP EBITDA 75,711 78,583 153,842 159,355 Non-GAAP EBITDA Margin 31.8% 32.8% 32.7% 32.3% Adjustments: Transition and other costs associated with new warehouse and divestiture in Cost of Goods Sold (a) 1,407 - 1,407 170 Transition and other costs associated with divestiture in General and Administrative Expense (b) - 2,850 - 4,272 Gain on divestiture - (1,284) - (1,284) Total adjustments 1,407 1,566 1,407 3,158 Non-GAAP Adjusted EBITDA $ 77,118 $ 80,149 $ 155,249 $ 162,513 Non-GAAP Adjusted EBITDA Margin 32.4% 33.5% 33.0% 32.9% a) Items related to new warehouse represent costs to transition to the new warehouse and duplicate costs incurred during the transition. Items related to divestiture represent costs related to divesting of assets sold. b) Items related to divestiture represent costs related to divesting of assets sold including (but not limited to), costs to exit or convert contractual obligations, severance and consulting costs; and certain costs related to the consummation of the divestiture process such as insurance costs, legal and other related professional fees.

Three Months Ended Sept. 30, Six Months Ended Sept. 30, 2019 2018 2019 2018 Net Income EPS Net Income EPS Net Income EPS Net Income EPS (In Thousands, except per share data) GAAP Net Income $ 33,252 $ 0.65 $ 30,841 $ 0.59 $ 67,177 $ 1.31 $ 65,307 $ 1.24 Adjustments: Transition and other costs associated with new warehouse and divestiture in Cost of Goods Sold (a) 1,407 0.03 - - 1,407 0.03 170 - Transition and other costs associated with divestiture in General and Administrative Expense (b) - - 2,850 0.05 - - 4,272 0.08 Gain on divestiture - - (1,284) (0.02) - - (1,284) (0.02) Accelerated amortization of debt origination costs - - 706 0.01 - - 706 0.01 Tax impact of adjustments (c) (344) (0.01) 824 0.02 (344) (0.01) 420 0.01 Normalized tax rate adjustment (d) - - 222 - - - 415 0.01 Total Adjustments 1,063 0.02 3,318 0.06 1,063 0.02 4,699 0.09 Non-GAAP Adjusted Net Income and Adjusted EPS $ 34,315 $ 0.68 $ 34,159 $ 0.65 $ 68,240 $ 1.33 $ 70,006 $ 1.33 Note: Amounts may not add due to rounding. a) Items related to new warehouse represent costs to transition to the new warehouse and duplicate costs incurred during the transition. Items related to divestiture represent costs related to divesting of assets sold. b) Items related to divestiture represent costs related to divesting of assets sold including (but not limited to), costs to exit or convert contractual obligations, severance and consulting costs; and certain costs related to the consummation of the divestiture process such as insurance costs, legal and other related professional fees. c) The income tax adjustments are determined using applicable rates in the taxing jurisdictions in which the above adjustments relate and includes both current and deferred income tax expense (benefit) based on the specific nature of the specific Non-GAAP performance measure. d) Income tax adjustment to adjust for discrete income tax items.

Three Months Ended Sept. 30, Six Months Ended Sept. 30, 2019 2018 2019 2018 (In Thousands) GAAP Net Income $ 33,252 $ 30,841 $ 67,177 $ 65,307 Adjustments: Adjustments to reconcile net income to net cash provided by operating activities as shown in the Statement of Cash Flows 14,039 5,349 28,896 23,054 Changes in operating assets and liabilities as shown in the 2,932 3,065 6,927 6,746 Statement of Cash Flows Total Adjustments 16,971 8,414 35,823 29,800 GAAP Net cash provided by operating activities 50,223 39,255 103,000 95,107 Purchase of property and equipment (3,866) (2,605) (5,822) (5,074) Non-GAAP Free Cash Flow 46,357 36,650 97,178 90,033 Transition and other payments associated with new warehouse and divestiture (a) 810 7,429 810 7,618 Non-GAAP Adjusted Free Cash Flow $ 47,167 $ 44,079 $ 97,988 $ 97,651 a) Payments related to new warehouse represent costs to transition to the new warehouse and duplicate costs incurred during the transition. Payments related to divestiture represent costs related to divesting of assets sold, including (but not limited to) costs to exit or convert contractual obligations, severance and consulting costs; and certain costs related to the consummation of the divestiture process such as legal and other related professional fees.
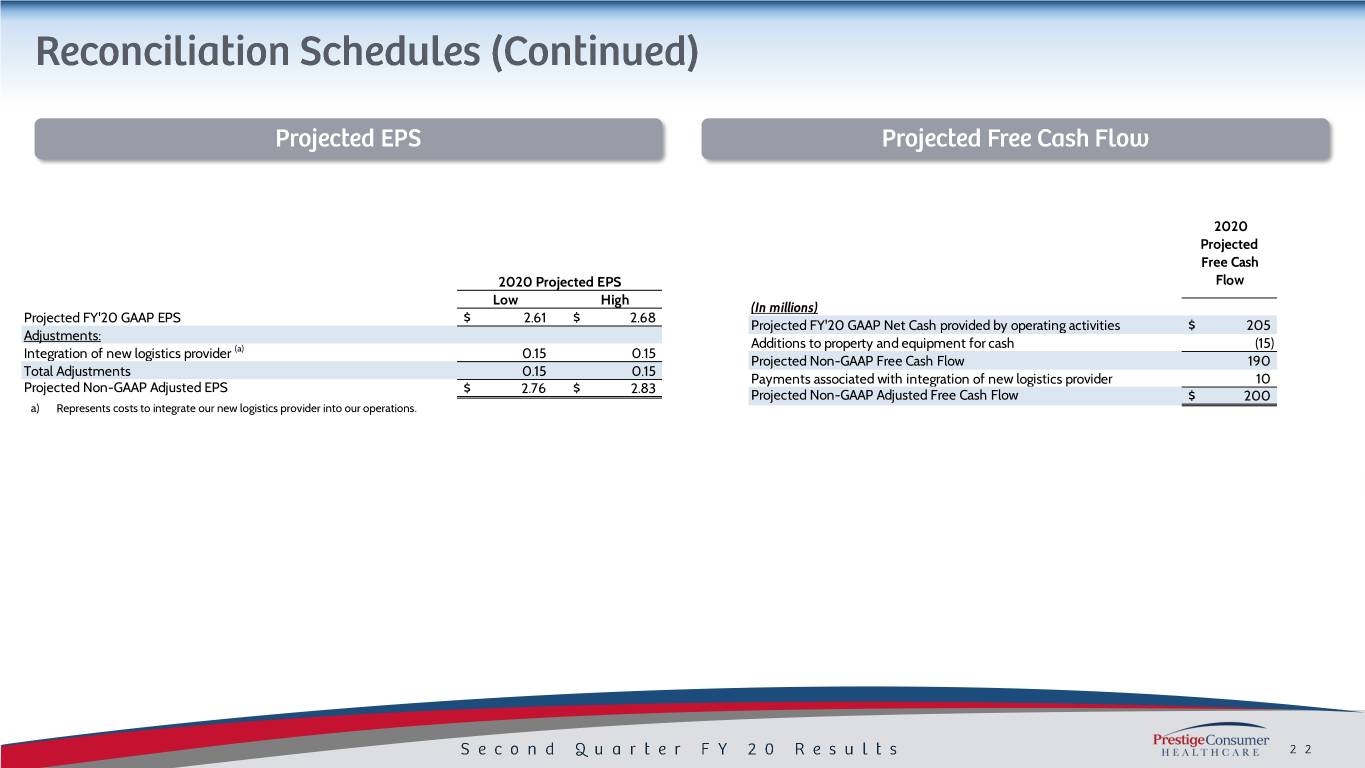
2020 Projected Free Cash 2020 Projected EPS Flow Low High (In millions) Projected FY'20 GAAP EPS $ 2.61 $ 2.68 Projected FY'20 GAAP Net Cash provided by operating activities $ 205 Adjustments: Additions to property and equipment for cash (15) Integration of new logistics provider (a) 0.15 0.15 Projected Non-GAAP Free Cash Flow 190 Total Adjustments 0.15 0.15 Payments associated with integration of new logistics provider 10 Projected Non-GAAP Adjusted EPS $ 2.76 $ 2.83 Projected Non-GAAP Adjusted Free Cash Flow $ 200 a) Represents costs to integrate our new logistics provider into our operations.


