
Third Quarter FY 2021 Results February 4th, 2021 Exhibit 99.2

T H I R D Q U A R T E R F Y 2 1 R E S U L T S This presentation contains certain “forward-looking” statements within the meaning of the Private Securities Litigation Reform Act of 1995, such as statements regarding the Company’s expected financial performance, including revenues, EPS, free cash flow, and organic revenue growth; the Company’s ability to perform well in the current changing disrupted environment and execute on its brand-building strategy; the Company’s ability to reduce debt and create value; the expected market share and consumption trends for the Company’s brands; and the Company’s disciplined capital allocation strategy. Words such as “trend,” “continue,” “will,” “expect,” “project,” “anticipate,” “focus,” “likely,” “estimate,” “may,” “should,” “could,” “would,” and similar expressions identify forward-looking statements. Such forward- looking statements represent the Company’s expectations and beliefs and involve a number of known and unknown risks, uncertainties and other factors that may cause actual results to differ materially from those expressed or implied by such forward-looking statements. These factors include, among others, the impact of the COVID-19 pandemic, including on economic and business conditions, government actions, consumer trends, retail management initiatives, and disruptions to the distribution and supply chain; competitive pressures; unexpected costs or liabilities; the financial condition of the Company’s suppliers and customers; and other risks set forth in Part I, Item 1A. Risk Factors in the Company’s Annual Report on Form 10-K for the year ended March 31, 2020. You are cautioned not to place undue reliance on these forward-looking statements, which speak only as of the date this presentation. Except to the extent required by applicable law, the Company undertakes no obligation to update any forward-looking statement contained in this presentation, whether as a result of new information, future events, or otherwise. All adjusted GAAP numbers presented are footnoted and reconciled to their closest GAAP measurement in the attached reconciliation schedule or in our February 4, 2021 earnings release in the “About Non-GAAP Financial Measures” section. Safe Harbor Disclosure 2

T H I R D Q U A R T E R F Y 2 1 R E S U L T S Agenda for Today’s Discussion I. Strategic Priorities II. Financial Overview III. FY 21 Outlook 3

T H I R D Q U A R T E R F Y 2 1 R E S U L T S I. Strategic Priorities

T H I R D Q U A R T E R F Y 2 1 R E S U L T S Strategy in Place for Value Creation Strategy and Execution is Delivering Results Long-Term Strategy ◼ Brand-building designed to grow categories and connect with consumers ◼ Strategy and tactics performing well in an evolving environment Business Continuity ◼ Continuity plans continue to protect service levels ◼ Strategically working to ensure supply in a dynamic environment Agile Marketing Financial Profile & Cash Flow ◼ Solid financial profile and cash flow generation ◼ Built cash in Q3 ahead of expected refinancing 5 ◼ Delivering long-term brand building and share growth ◼ Benefited from investments in winning channels wherever consumers shop

T H I R D Q U A R T E R F Y 2 1 R E S U L T S 6 Compound W: Proven Success Executing Against our Playbook Innovation eCommerce Investments Shelf-Space Wins ~$61M Retail Sales(2) Innovation and Superior Product Expand Leading Position Consumer Content * CAGR represents the period from 2015 to 2020

T H I R D Q U A R T E R F Y 2 1 R E S U L T S II. Financial Overview

T H I R D Q U A R T E R F Y 2 1 R E S U L T S Key Financial Results for Third Quarter and YTD FY 21 Performance FY 21 FY 20 Dollar values in millions, except per share data. $238.8 $ 81.4 $0.81 $241.6 $86.9 $0.81 Revenue Adjusted EBITDA Adjusted EPS (1.1%) (6.3%) 0.0% 8 Q 3 $705.6 $249.7 $2.45 $711.8 $242.2 $2.14 Revenue Adjusted EBITDA Adjusted EPS (0.9%) 3.1% 14.5% (3) Revenue of $238.8 million, down slightly vs. PY on an organic basis(1) EPS of $0.81 flat versus Adjusted(3) PY EBITDA(3) of $81.4 resulted in 34.1% margin, consistent with long-term expectations Y T D (3) 8 (3) (3)

T H I R D Q U A R T E R F Y 2 1 R E S U L T S Q3 FY 21 Q3 FY 20 % Chg YTD FY 21 YTD FY 20 % Chg Total Revenue 238.8$ 241.6$ (1.1%) 705.6$ 711.8$ (0.9%) Adj. Gross Margin (3) 138.9 140.1 (0.8%) 410.4 412.3 (0.5%) % Margin 58.2% 58.0% 58.2% 57.9% A&M 38.1 33.6 13.5% 104.2 107.0 (2.7%) % Total Revenue 15.9% 13.9% 14.8% 15.0% G&A 21.4 21.3 0.4% 61.7 65.5 (5.8%) % Total Revenue 9.0% 8.8% 8.7% 9.2% D&A 6.0 6.2 (4.1%) 18.1 18.5 (2.5%) Adj. Operating Income (3) 73.4$ 79.0$ (7.0%) 226.5$ 221.2$ 2.4% % Margin 30.8% 32.7% 32.1% 31.1% Adj. Earnings Per Share (3) 0.81$ 0.81$ 0.0% 2.45$ 2.14$ 14.5% Adj. EBITDA (3) 81.4$ 86.9$ (6.3%) 249.7$ 242.2$ 3.1% % Margin 34.1% 36.0% 35.4% 34.0% 3 Months Ended Q3 YTD Comments FY 21 Third Quarter and YTD Consolidated Financial Summary ◼ Organic Revenue(1) down slightly vs. PY – Broad & diverse portfolio helped offset consumption headwinds in COVID-19 disrupted categories – Triple-digit eCommerce consumption growth as consumers continue to shop online ◼ Gross Margin of 58.2% up slightly vs. Adjusted(3) PY ◼ A&M of 14.8% of Revenue ◼ G&A dollars slightly down vs. PY ◼ EPS up 14.5% vs. Adjusted(3) PY Dollar values in millions, except per share data Amounts may not add due to rounding 9 9 Months Ended
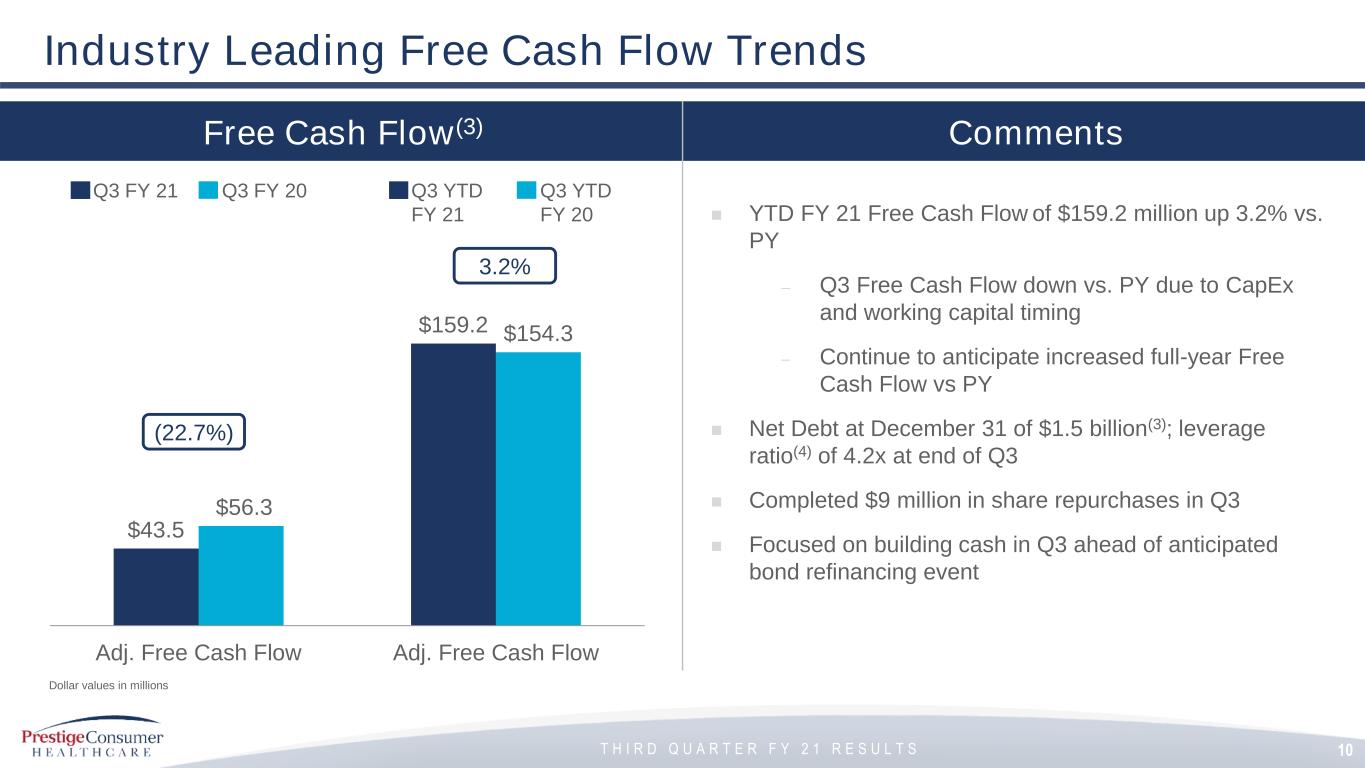
T H I R D Q U A R T E R F Y 2 1 R E S U L T S $43.5 $159.2 $56.3 $154.3 Adj. Free Cash Flow Adj. Free Cash Flow Free Cash Flow(3) Comments ◼ YTD FY 21 Free Cash Flow of $159.2 million up 3.2% vs. PY – Q3 Free Cash Flow down vs. PY due to CapEx and working capital timing – Continue to anticipate increased full-year Free Cash Flow vs PY ◼ Net Debt at December 31 of $1.5 billion(3); leverage ratio(4) of 4.2x at end of Q3 ◼ Completed $9 million in share repurchases in Q3 ◼ Focused on building cash in Q3 ahead of anticipated bond refinancing event Industry Leading Free Cash Flow Trends Q3 FY 21 Q3 FY 20 (22.7%) Dollar values in millions 10 Q3 YTD FY 21 Q3 YTD FY 20 3.2%

T H I R D Q U A R T E R F Y 2 1 R E S U L T S III. FY 21 Outlook
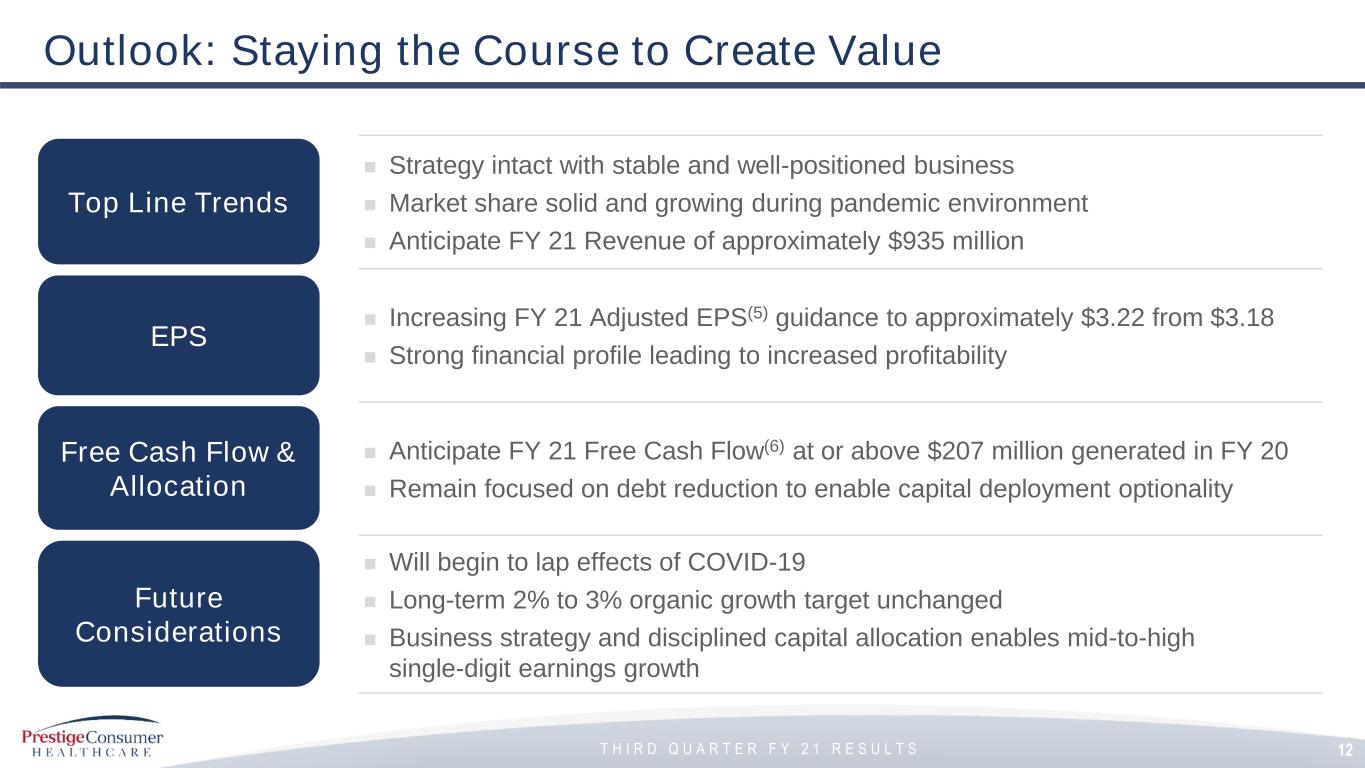
T H I R D Q U A R T E R F Y 2 1 R E S U L T S Outlook: Staying the Course to Create Value ◼ Strategy intact with stable and well-positioned business ◼ Market share solid and growing during pandemic environment ◼ Anticipate FY 21 Revenue of approximately $935 million ◼ Increasing FY 21 Adjusted EPS(5) guidance to approximately $3.22 from $3.18 ◼ Strong financial profile leading to increased profitability ◼ Anticipate FY 21 Free Cash Flow(6) at or above $207 million generated in FY 20 ◼ Remain focused on debt reduction to enable capital deployment optionality ◼ Will begin to lap effects of COVID-19 ◼ Long-term 2% to 3% organic growth target unchanged ◼ Business strategy and disciplined capital allocation enables mid-to-high single-digit earnings growth Top Line Trends Free Cash Flow & Allocation EPS 12 Future Considerations

T H I R D Q U A R T E R F Y 2 1 R E S U L T S Q&A

T H I R D Q U A R T E R F Y 2 1 R E S U L T S Appendix (1) Organic Revenue is a Non-GAAP financial measure and is reconciled to the most closely related GAAP financial measure in the attached Reconciliation Schedules and / or our earnings release dated February 4, 2021 in the “About Non-GAAP Financial Measures” section. (2) Total company consumption is based on domestic IRI multi-outlet + C-Store retail sales for the period ending December 31, 2020, retail sales from other 3rd parties for certain untracked channels in North America for leading retailers, Australia consumption based on IMS data, and other international net revenues as a proxy for consumption. (3) Adjusted EPS, Adjusted Gross Margin, Adjusted Operating Income, EBITDA, EBITDA Margin, Free Cash Flow and Net Debt are Non-GAAP financial measures and are reconciled to their most closely related GAAP financial measures in the attached Reconciliation Schedules and / or in our earnings release dated February 4, 2021 in the “About Non-GAAP Financial Measures” section. (4) Leverage ratio reflects net debt / covenant defined EBITDA. (5) Adjusted EPS for FY 21 is a projected Non-GAAP financial measure, is reconciled to projected GAAP EPS in the attached Reconciliation Schedules and / or in our earnings release in the “About Non-GAAP Financial Measures” section and is calculated based on projected GAAP EPS plus adjustments relating to discrete income tax items. (6) Adjusted Free Cash Flow for FY 21 is a projected Non-GAAP financial measure, is reconciled to projected GAAP Net Cash Provided by Operating Activities in the attached Reconciliation Schedules and / or in our earnings release in the “About Non-GAAP Financial Measures” section and is calculated based on projected Net Cash Provided by Operating Activities less projected capital expenditures. 14
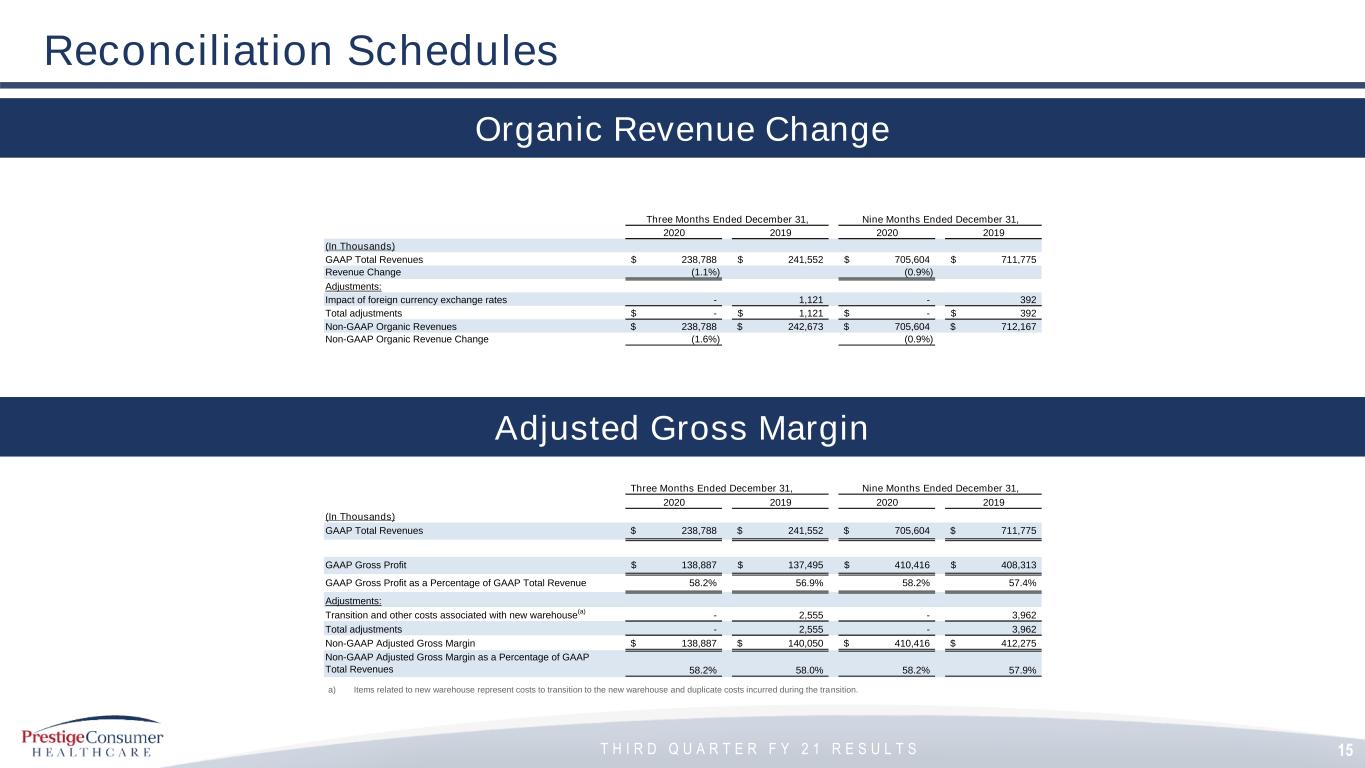
T H I R D Q U A R T E R F Y 2 1 R E S U L T S Adjusted Gross Margin 15 Reconciliation Schedules Organic Revenue Change a) Items related to new warehouse represent costs to transition to the new warehouse and duplicate costs incurred during the transition. Three Months Ended December 31, Nine Months Ended December 31, 2020 2019 2020 2019 (In Thousands) GAAP Total Revenues 238,788$ 241,552$ 705,604$ 711,775$ Revenue Change (1.1%) (0.9%) Adjustments: Impact of foreign currency exchange rates - 1,121 - 392 Total adjustments -$ 1,121$ -$ 392$ Non-GAAP Organic Revenues 238,788$ 242,673$ 705,604$ 712,167$ Non-GAAP Organic Revenue Change (1.6%) (0.9%) Three Months Ended December 31, Nine Months Ended December 31, 2020 2019 2020 2019 (In Thousands) GAAP Total Revenues 238,788$ 241,552$ 705,604$ 711,775$ GAAP Gross Profit 138,887$ 137,495$ 410,416$ 408,313$ GAAP Gross Profit as a Percentage of GAAP Total Revenue 58.2% 56.9% 58.2% 57.4% Adjustments: Transition and other costs associated with new warehouse (a) - 2,555 - 3,962 Total adjustments - 2,555 - 3,962 Non-GAAP Adjusted Gross Margin 138,887$ 140,050$ 410,416$ 412,275$ Non-GAAP Adjusted Gross Margin as a Percentage of GAAP Total Revenues 58.2% 58.0% 58.2% 57.9%
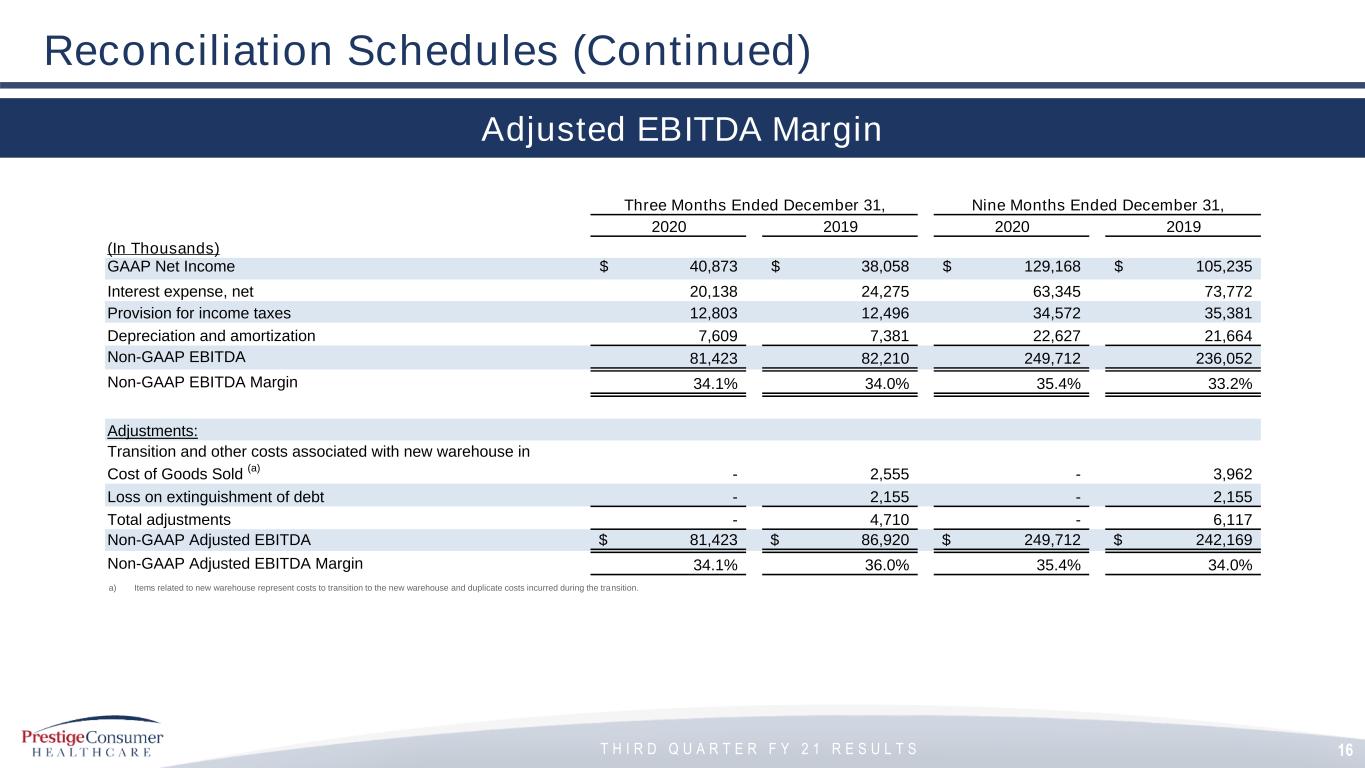
T H I R D Q U A R T E R F Y 2 1 R E S U L T S 16 Reconciliation Schedules (Continued) Adjusted EBITDA Margin a) Items related to new warehouse represent costs to transition to the new warehouse and duplicate costs incurred during the transition. Three Months Ended December 31, Nine Months Ended December 31, 2020 2019 2020 2019 (In Thousands) GAAP Net Income 40,873$ 38,058$ 129,168$ 105,235$ Interest expense, net 20,138 24,275 63,345 73,772 Provision for income taxes 12,803 12,496 34,572 35,381 Depreciation and amortization 7,609 7,381 22,627 21,664 Non-GAAP EBITDA 81,423 82,210 249,712 236,052 Non-GAAP EBITDA Margin 34.1% 34.0% 35.4% 33.2% Adjustments: Transition and other costs associated with new warehouse in Cost of Goods Sold (a) - 2,555 - 3,962 Loss on extinguishment of debt - 2,155 - 2,155 Total adjustments - 4,710 - 6,117 Non-GAAP Adjusted EBITDA 81,423$ 86,920$ 249,712$ 242,169$ Non-GAAP Adjusted EBITDA Margin 34.1% 36.0% 35.4% 34.0%
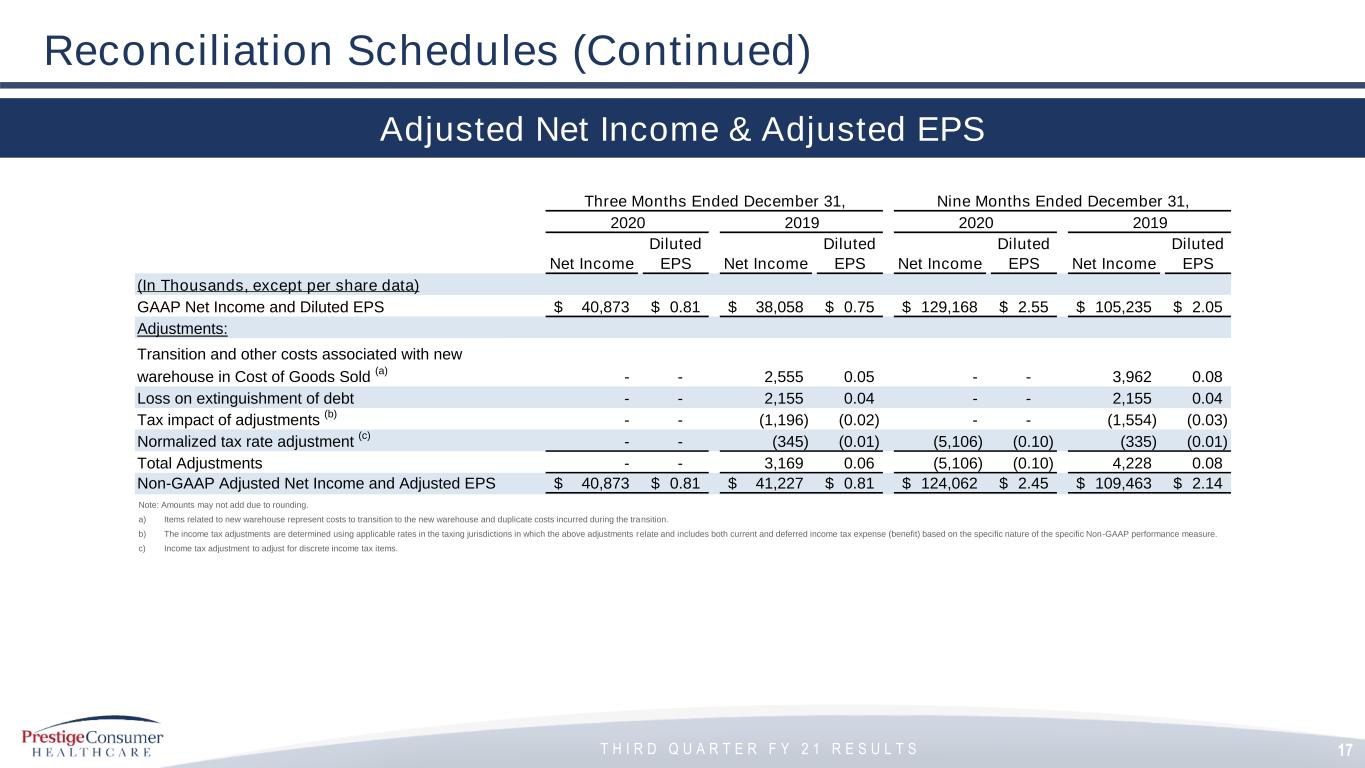
T H I R D Q U A R T E R F Y 2 1 R E S U L T S 17 Reconciliation Schedules (Continued) Adjusted Net Income & Adjusted EPS Note: Amounts may not add due to rounding. a) Items related to new warehouse represent costs to transition to the new warehouse and duplicate costs incurred during the transition. b) The income tax adjustments are determined using applicable rates in the taxing jurisdictions in which the above adjustments relate and includes both current and deferred income tax expense (benefit) based on the specific nature of the specific Non-GAAP performance measure. c) Income tax adjustment to adjust for discrete income tax items. Three Months Ended December 31, Nine Months Ended December 31, 2020 2019 2020 2019 Net Income Diluted EPS Net Income Diluted EPS Net Income Diluted EPS Net Income Diluted EPS (In Thousands, except per share data) GAAP Net Income and Diluted EPS 40,873$ 0.81$ 38,058$ 0.75$ 129,168$ 2.55$ 105,235$ 2.05$ Adjustments: Transition and other costs associated with new warehouse in Cost of Goods Sold (a) - - 2,555 0.05 - - 3,962 0.08 Loss on extinguishment of debt - - 2,155 0.04 - - 2,155 0.04 Tax impact of adjustments (b) - - (1,196) (0.02) - - (1,554) (0.03) Normalized tax rate adjustment (c) - - (345) (0.01) (5,106) (0.10) (335) (0.01) Total Adjustments - - 3,169 0.06 (5,106) (0.10) 4,228 0.08 Non-GAAP Adjusted Net Income and Adjusted EPS 40,873$ 0.81$ 41,227$ 0.81$ 124,062$ 2.45$ 109,463$ 2.14$

T H I R D Q U A R T E R F Y 2 1 R E S U L T S 18 Reconciliation Schedules (Continued) Adjusted Free Cash Flow a) Payments related to new warehouse represent costs to transition to the new warehouse and duplicate costs incurred during transition. Three Months Ended December 31, Nine Months Ended December 31, 2020 2019 2020 2019 (In Thousands) GAAP Net Income 40,873$ 38,058$ 129,168$ 105,235$ Adjustments: Adjustments to reconcile net income to net cash provided by operating activities as shown in the Statement of Cash Flows 16,844 17,089 46,619 45,985 Changes in operating assets and liabilities as shown in the Statement of Cash Flows (8,490) 2,851 733 9,778 Total adjustments 8,354 19,940 47,352 55,763 GAAP Net cash provided by operating activities 49,227 57,998 176,520 160,998 Purchase of property and equipment (5,728) (3,233) (17,347) (9,055) Non-GAAP Free Cash Flow 43,499 54,765 159,173 151,943 Transition and other payments associated with new warehouse (a) - 1,517 - 2,327 Non-GAAP Adjusted Free Cash Flow 43,499$ 56,282$ 159,173$ 154,270$

T H I R D Q U A R T E R F Y 2 1 R E S U L T S Projected Free Cash Flow 19 Reconciliation Schedules (Continued) Projected EPS a) Income tax adjustment to adjust for discrete income tax items. Projected FY'21 GAAP EPS 3.32$ Adjustments: Normalized tax rate adjustment for discrete income tax items (a) (0.10) Total Adjustments (0.10) Projected Non-GAAP Adjusted EPS 3.22$ (In millions) Projected FY'21 GAAP Net Cash provided by operating activities 232$ Additions to property and equipment for cash (25) Projected Non-GAAP Free Cash Flow 207$


