
Investor Presentation May 2018 0

Cautionary note regarding forward-looking statements Forward-Looking Statements This presentation of ZAGG Inc (“ZAGG,” the “Company,” “we” or “us”) contains (and oral communications made by us may contain) “forward-looking statements” within the meaning of the safe harbor provisions of the U.S. Private Securities Litigation Reform Act of 1995. Forward-looking statements can be identified by words such as "anticipate," "believe," "estimate," "expect," "intend," "plan," "predict," "project," "target," “future,” “seek,” “likely,” “strategy,” “may,” “should,” “will” and similar references to future periods. Examples of forward-looking statements include, among others, statements we make regarding our guidance for the Company and statements that estimate or project future results of operations or the performance of the Company. Forward-looking statements are neither historical facts nor assurances of future performance. Instead, they are based only on our current beliefs, expectations and assumptions regarding the future of our business, future plans and strategies, projections, anticipated events and trends, the economy and other future conditions. Because forward-looking statements relate to the future, they are subject to inherent uncertainties, risks and changes in circumstances that are difficult to predict and many of which are outside of our control. Our actual results and financial condition may differ materially from those indicated in the forward-looking statements. Therefore, you should not rely on any of these forward-looking statements. Important factors that could cause our actual results and financial condition to differ materially from those indicated in the forward-looking statements include, among others, the following: (a) the ability to design, produce, and distribute the creative product solutions required to retain existing customers and to attract new customers; (b) building and maintaining marketing and distribution functions sufficient to gain meaningful international market share for our products; (c) the ability to respond quickly with appropriate products after the adoption and introduction of new mobile devices by major manufacturers like Apple, Samsung, and Google; (d) changes or delays in announced launch schedules for (or recalls or withdrawals of) new mobile devices by major manufacturers like Apple, Samsung, and Google; (e) the ability to successfully integrate new operations or acquisitions, (f) the impact of inconsistent quality or reliability of new product offerings; (g) the impact of lower profit margins in certain new and existing product categories, including certain mophie products; (h) the impacts of changes in economic conditions, including on customer demand; (i) managing inventory in light of constantly shifting consumer demand; (j) the failure of information systems or technology solutions or the failure to secure information system data, failure to comply with privacy laws, security breaches, or the effect on the company from cyber- attacks, terrorist incidents, or the threat of terrorist incidents; (k) adoption of or changes in accounting policies, principles, or estimates; and (l) changes in tax laws and regulations. Any forward-looking statement made by us in this presentation speaks only as of the date of this presentation. New factors emerge from time to time and it is not possible for management to predict all such factors, nor can it assess the impact of any such factor on the business or the extent to which any factor, or combination of factors, may cause results to differ materially from those contained in any forward-looking statement. Readers should also review the risks and uncertainties listed in our most recent Annual Report on Form 10-K and other reports we file with the U.S. Securities and Exchange Commission, including (but not limited to) Item 1A - "Risk Factors" in the Form 10-K and Management's Discussion and Analysis of Financial Condition and Results of Operations and the risks described therein from time to time. We undertake no obligation to publicly update any forward-looking statement, whether written or oral, that may be made from time to time, whether as a result of new information, future developments or otherwise. The forward-looking statements contained in this presentation are intended to qualify for the safe harbor provisions of Section 27A of the Securities Act of 1933, as amended, and Section 21E of the Securities Exchange Act of 1934, as amended. This presentation also contains estimates and other statistical data made by independent parties and by ZAGG relating to market share, growth and other industry data. This data involves a number of assumptions and limitations, and you are cautioned not to give undue weight to such estimates. We have not independently verified the statistical and other industry data generated by independent parties and contained in this presentation and, accordingly, cannot guarantee their accuracy or completeness. In addition, projections, assumptions and estimates of our future performance and the future performance of the markets in which we compete are necessarily subject to a high degree of uncertainty and risk due to a variety of factors. These and other factors could cause results or outcomes to differ materially from those expressed in the estimates made by the independent parties and by ZAGG. Non-GAAP Financial Measures This presentation also includes certain non-GAAP financial measures, Adjusted EBITDA and Adjusted EBITDA Margin. Readers are cautioned that Adjusted EBITDA (earnings before interest, taxes, depreciation, amortization, stock- based compensation expense, other income (expense), mophie transaction expenses, mophie fair value inventory write-up related to acquisition, mophie restructuring charges, mophie employee retention bonus, loss on disputed mophie purchase price (2016 only), and impairment of intangible asset) and Adjusted EBITDA Margin (Adjusted EBITDA stated as a percentage of revenue) are not financial measures under US generally accepted accounting principles (“GAAP”). In addition, this financial information should not be construed as an alternative to any other measure of performance determined in accordance with GAAP, or as an indicator of operating performance, liquidity or cash flows generated by operating, investing and financing activities, as there may be significant factors or trends that it fails to address. As such, it should be read only in conjunction with our consolidated financial statements prepared in accordance with GAAP. We present Adjusted EBITDA and Adjusted EBITDA Margin because we believe that they are helpful to some investors as measures of performance. We caution readers that non- GAAP financial information, by its nature, departs from traditional accounting conventions. Accordingly, its use can make it difficult to compare current results with results from other reporting periods and with the financial results of other companies. We have provided a reconciliation of Adjusted EBITDA and Adjusted EBITDA Margin to the most directly comparable GAAP measures, which is available in the appendix. 1
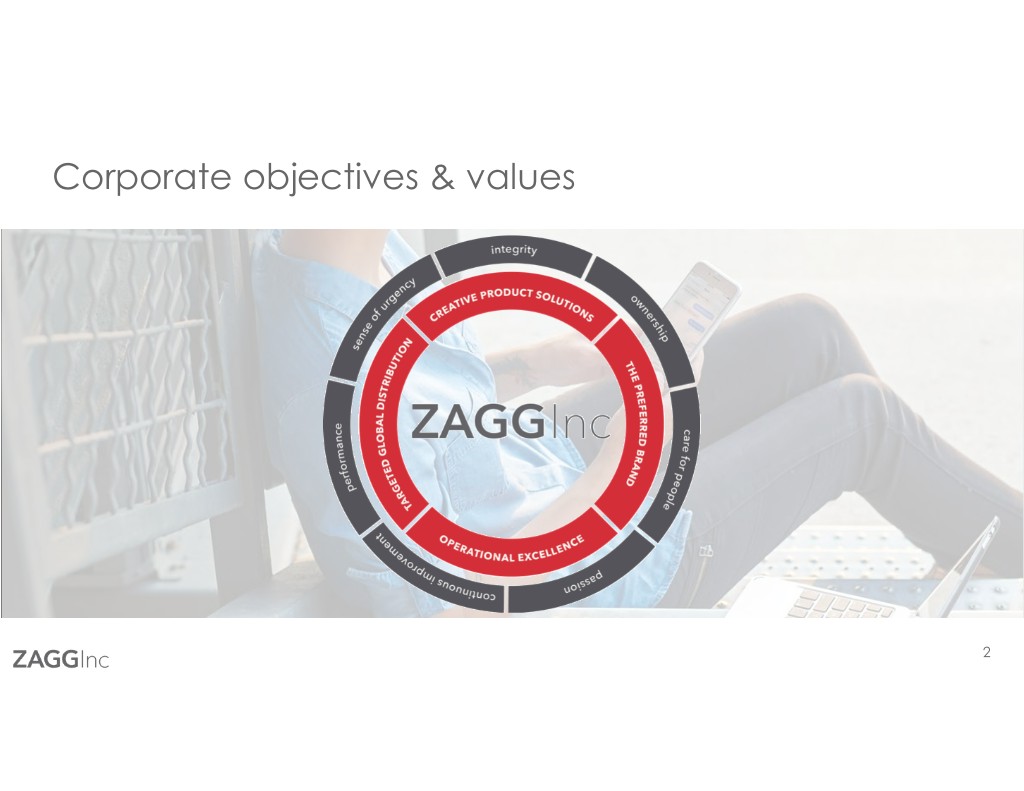
Corporate objectives & values 2

A history of continuous innovation 2007 2008 2009 2010 2011 2012 2013 2014 2015 2016 2017 $600 Samsung Apple First Apple Samsung First Samsung First Apple Apple launches releases GS8 releases iPhone is launches Galaxy iPad is first phablet – with curved iPhone 8, 8+ released Galaxy Note $500 Industry smartphone released with the iPhone 6 glass display and X with tablet series innovation released and 6+ launch and wireless wireless charging charging $400 InvisibleShield $300 introduces Apple optimized InvisibleShield ZAGG ZAGG ZAGG launches iFROGZ wireless curved glass charge pad launched releases acquires InvisibleShield earbuds released solution ZAGG launched first tablet iFrogz and On Demand and innovation ZAGG acquires mophie $200 keyboard enters audio InvisibleShield and launches wireless category Glass charging ecosystem $100 $- Screen Protection Power Cases Power Management Keyboards, Cases, and Other Audio 3

Product portfolio aligns with consumer needs Keyboards Cases/ Investment protection � Handset costs continue to rise Other � Protecting trade-in value of device 1% � Brittleness vs. scratch resistance screens Audio � 1.5 billion smartphones sold in 2017 5% Extended power � Larger screens and thinner devices are gaining popularity 5% � Apps and increased phone usage drain battery at an alarming rate Power Cases � “Our One Wish? Longer Battery Life” – Wall Street Journal 15% Mobile audio lifestyle 48% � People are consuming increasing amounts of content – wireless options allow for more flexibility � Mobile music listening has increased weekly headphone usage from 3 hours in 1980 to over 20 hours in 2016 Power Management 26% Connectivity & productivity � Mobile traffic outpacing desktop traffic � Increasing frequency of working remotely Screen � Tablets being used for more than just consumption – Protection content creation $519M net sales 2017 4
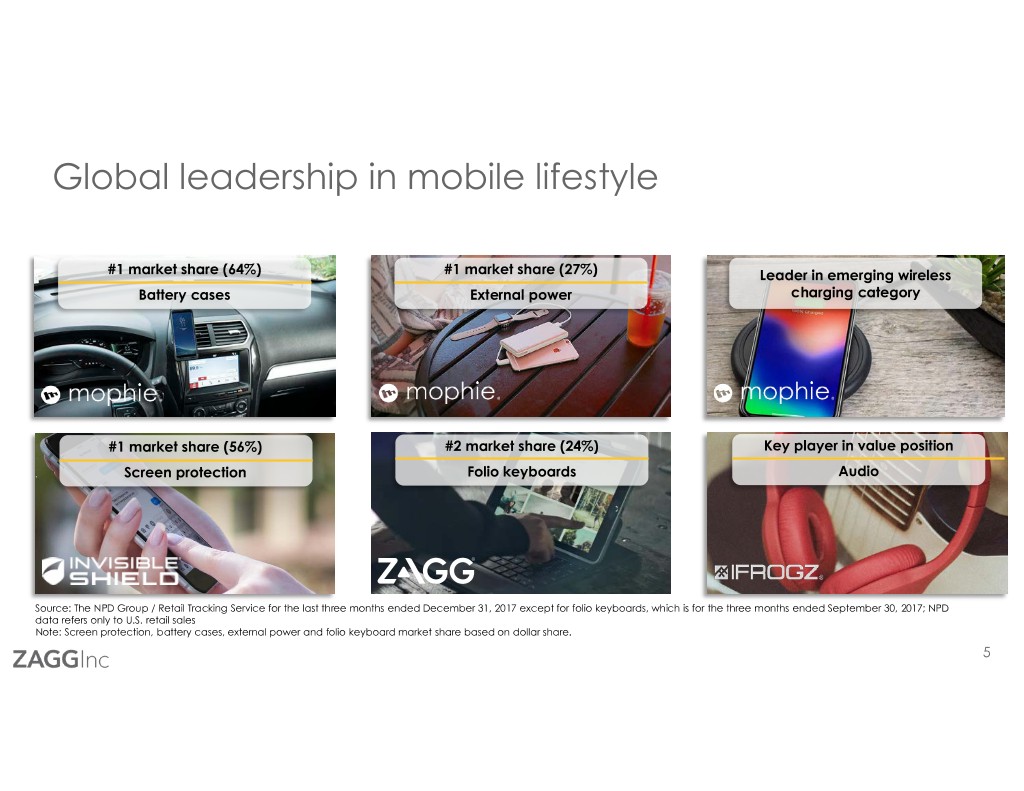
Global leadership in mobile lifestyle #1 market share (64%) #1 market share (27%) Leader in emerging wireless Battery cases External power charging category #1 market share (56%) #2 market share (24%) Key player in value position Screen protection Folio keyboards Audio Source: The NPD Group / Retail Tracking Service for the last three months ended December 31, 2017 except for folio keyboards, which is for the three months ended September 30, 2017; NPD data refers only to U.S. retail sales Note: Screen protection, battery cases, external power and folio keyboard market share based on dollar share. 5
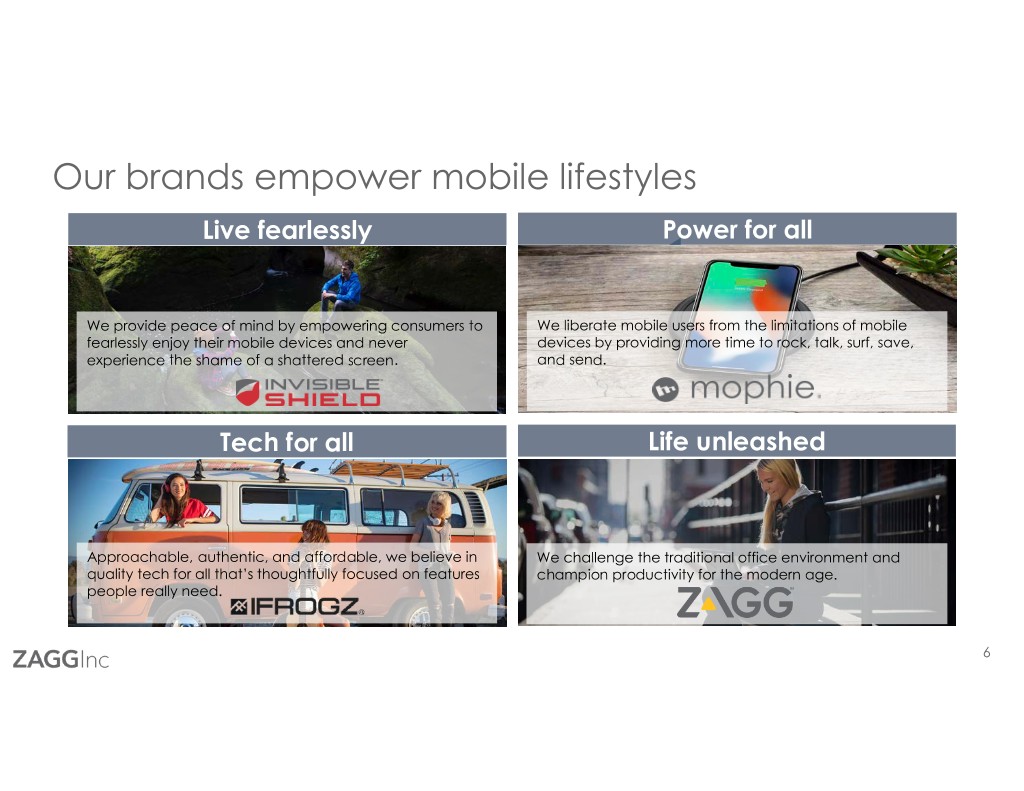
Our brands empower mobile lifestyles Live fearlessly Power for all We provide peace of mind by empowering consumers to We liberate mobile users from the limitations of mobile fearlessly enjoy their mobile devices and never devices by providing more time to rock, talk, surf, save, experience the shame of a shattered screen. and send. Tech for all Life unleashed Approachable, authentic, and affordable, we believe in We challenge the traditional office environment and quality tech for all that’s thoughtfully focused on features champion productivity for the modern age. people really need. 6
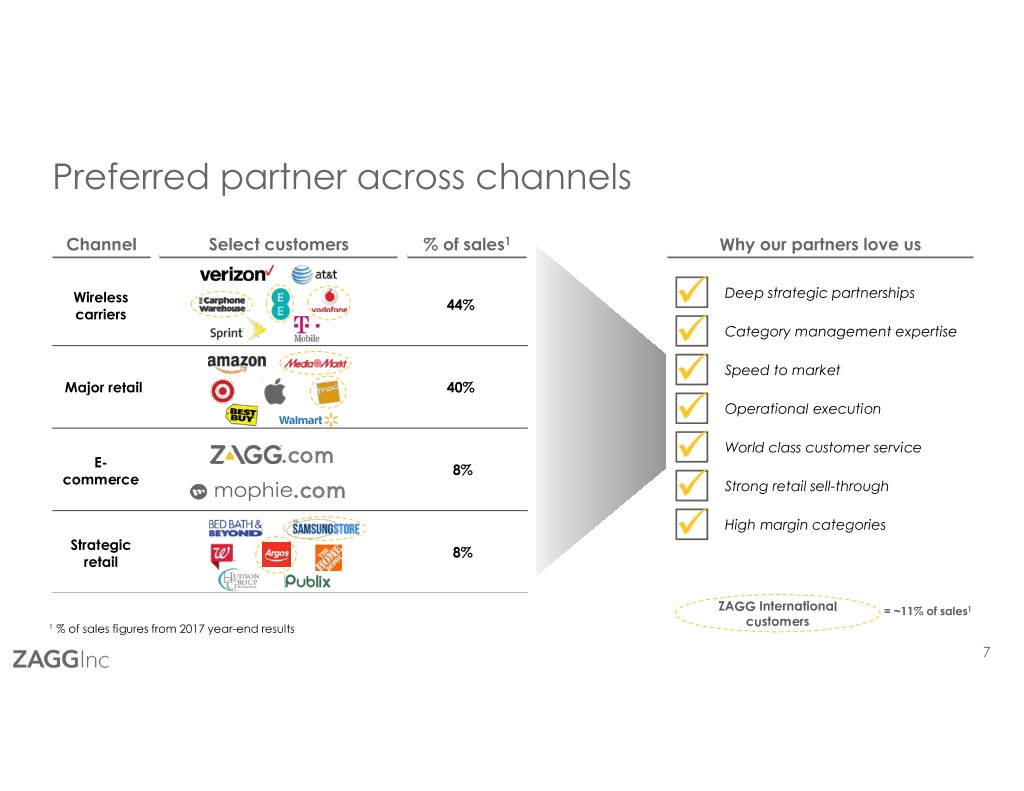
Preferred partner across channels Channel Select customers % of sales1 Why our partners love us Wireless Deep strategic partnerships 44% carriers � � Category management expertise Speed to market Major retail 40% � � Operational execution World class customer service E- .com 8% � commerce .com � Strong retail sell-through High margin categories Strategic � 8% retail ZAGG International = ~11% of sales1 customers 1 % of sales figures from 2017 year-end results 7

Continue global distribution expansion Significant Americas door growth with additional penetration opportunities 64,496 34.8% 45,634 42,202 22.8% 24.7% 32,161 17.4% 25,065 13.5% 2013 2014 2015 2016 2017 2013 2014 2015 2016 2017 Americas Door Count Americas % Total Door Penetration 8
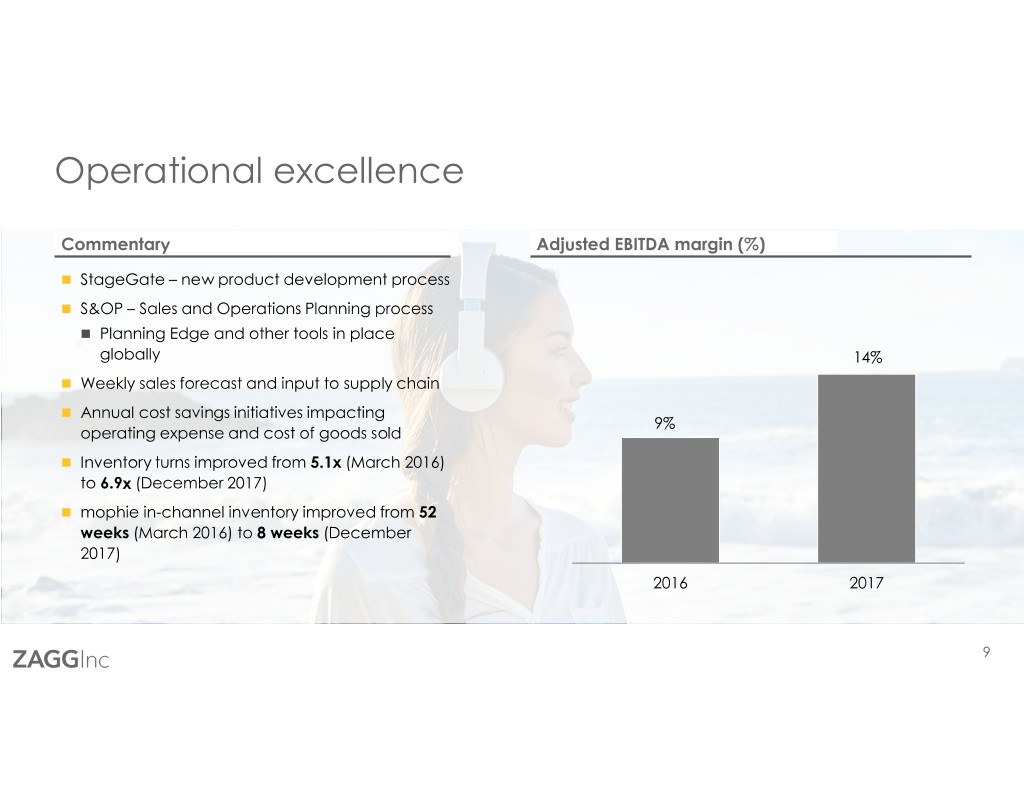
Operational excellence Commentary Adjusted EBITDA margin (%) � StageGate – new product development process � S&OP – Sales and Operations Planning process � Planning Edge and other tools in place globally 14% � Weekly sales forecast and input to supply chain � Annual cost savings initiatives impacting 9% operating expense and cost of goods sold � Inventory turns improved from 5.1x (March 2016) to 6.9x (December 2017) � mophie in-channel inventory improved from 52 weeks (March 2016) to 8 weeks (December 2017) 2016 2017 9
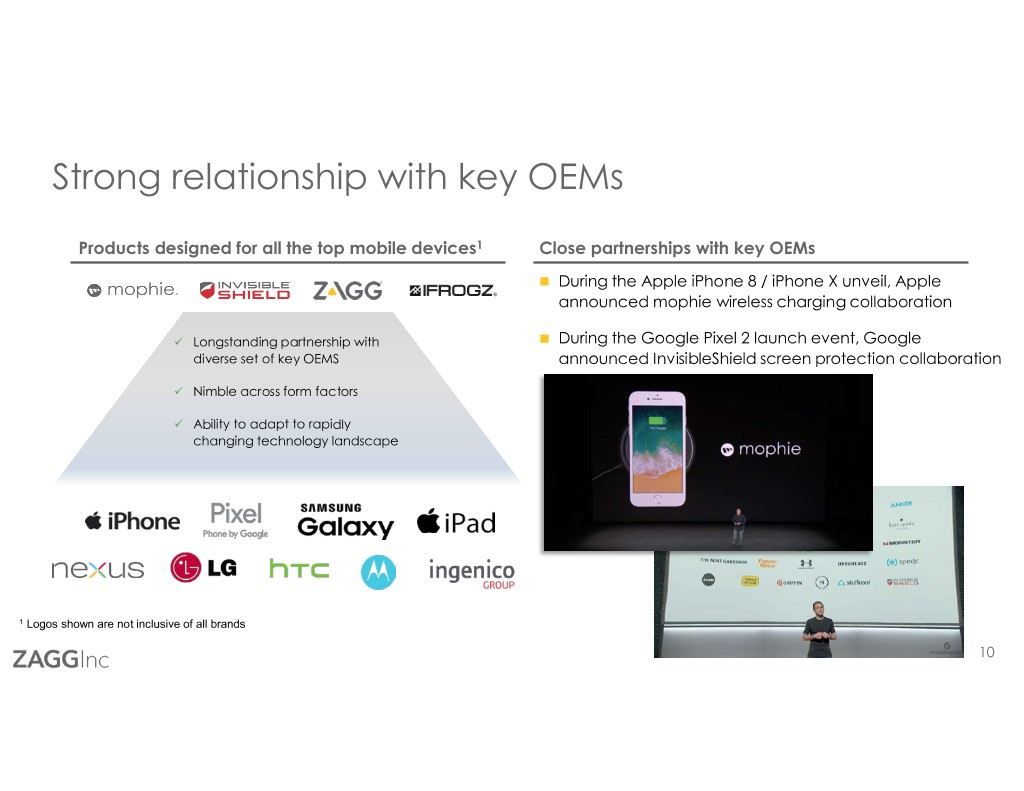
Strong relationship with key OEMs Products designed for all the top mobile devices1 Close partnerships with key OEMs � During the Apple iPhone 8 / iPhone X unveil, Apple announced mophie wireless charging collaboration � Longstanding partnership with � During the Google Pixel 2 launch event, Google diverse set of key OEMS announced InvisibleShield screen protection collaboration � Nimble across form factors � Ability to adapt to rapidly changing technology landscape 1 Logos shown are not inclusive of all brands 10
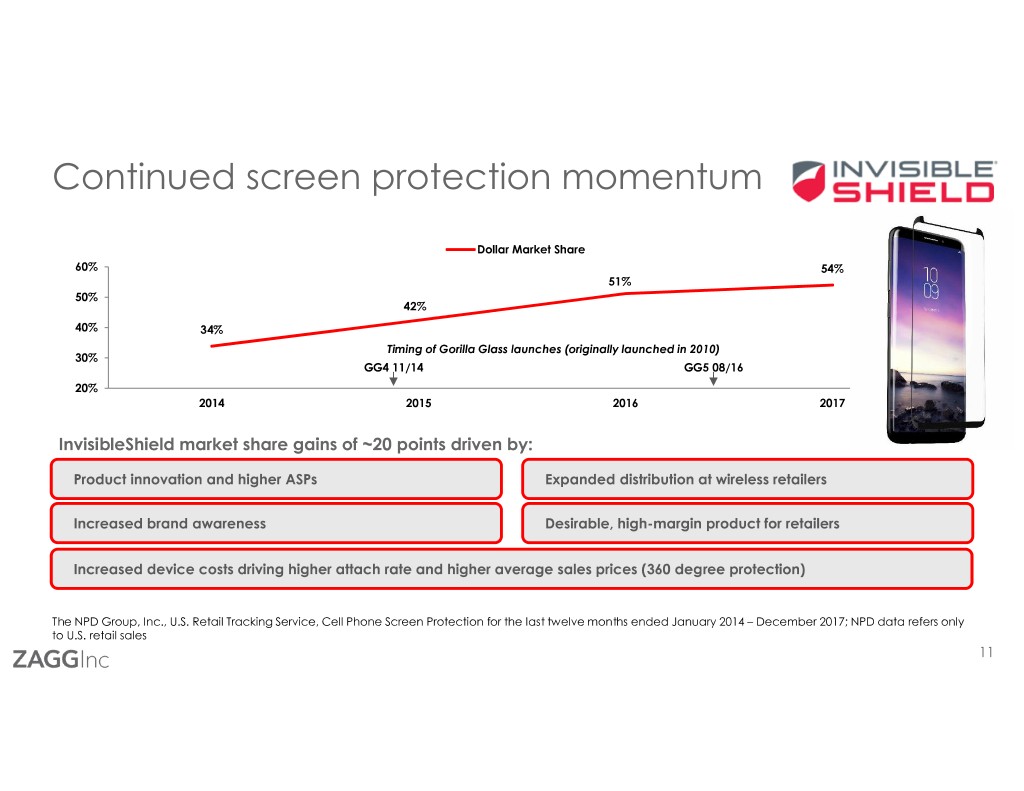
Continued screen protection momentum Dollar Market Share 60% 54% 51% 50% 42% 40% 34% Timing of Gorilla Glass launches (originally launched in 2010) 30% GG4 11/14 GG5 08/16 20% 2014 2015 2016 2017 InvisibleShield market share gains of ~20 points driven by: Product innovation and higher ASPs Expanded distribution at wireless retailers Increased brand awareness Desirable, high-margin product for retailers Increased device costs driving higher attach rate and higher average sales prices (360 degree protection) The NPD Group, Inc., U.S. Retail Tracking Service, Cell Phone Screen Protection for the last twelve months ended January 2014 – December 2017; NPD data refers only to U.S. retail sales 11
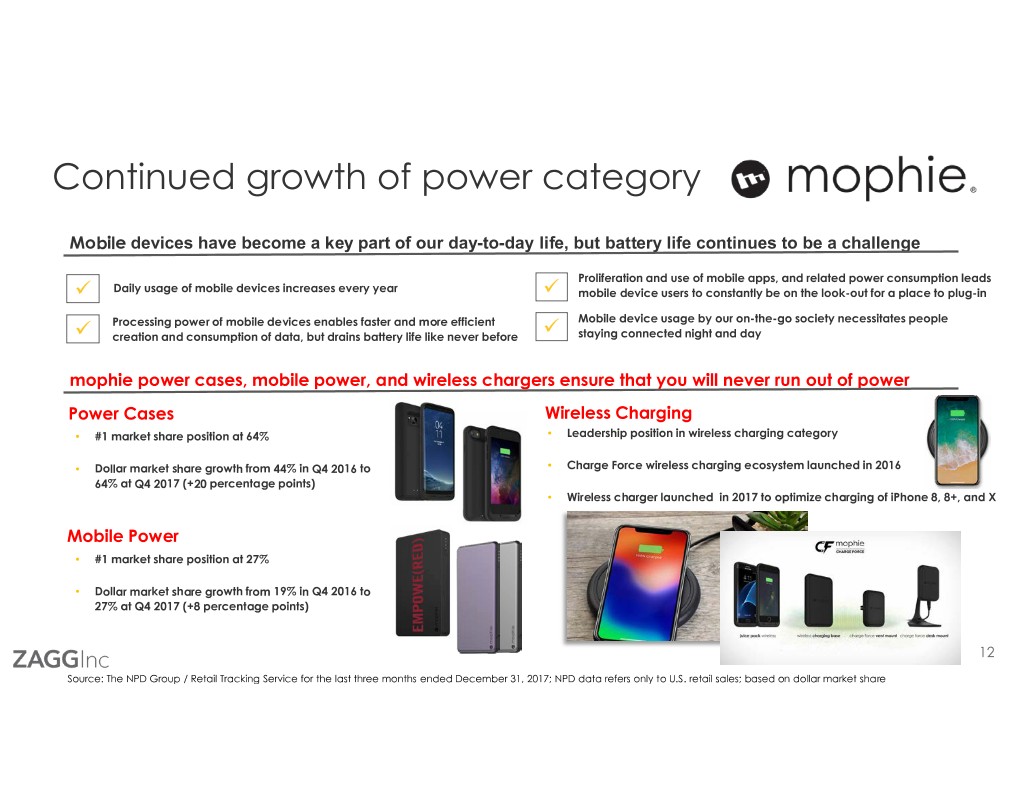
Continued growth of power category Mobile devices have become a key part of our day-to-day life, but battery life continues to be a challenge Proliferation and use of mobile apps, and related power consumption leads � Daily usage of mobile devices increases every year � mobile device users to constantly be on the look-out for a place to plug-in Processing power of mobile devices enables faster and more efficient Mobile device usage by our on-the-go society necessitates people � creation and consumption of data, but drains battery life like never before � staying connected night and day mophie power cases, mobile power, and wireless chargers ensure that you will never run out of power Power Cases Wireless Charging • #1 market share position at 64% • Leadership position in wireless charging category • Dollar market share growth from 44% in Q4 2016 to • Charge Force wireless charging ecosystem launched in 2016 64% at Q4 2017 (+20 percentage points) • Wireless charger launched in 2017 to optimize charging of iPhone 8, 8+, and X Mobile Power • #1 market share position at 27% • Dollar market share growth from 19% in Q4 2016 to 27% at Q4 2017 (+8 percentage points) 12 Source: The NPD Group / Retail Tracking Service for the last three months ended December 31, 2017; NPD data refers only to U.S. retail sales; based on dollar market share
Financial overview
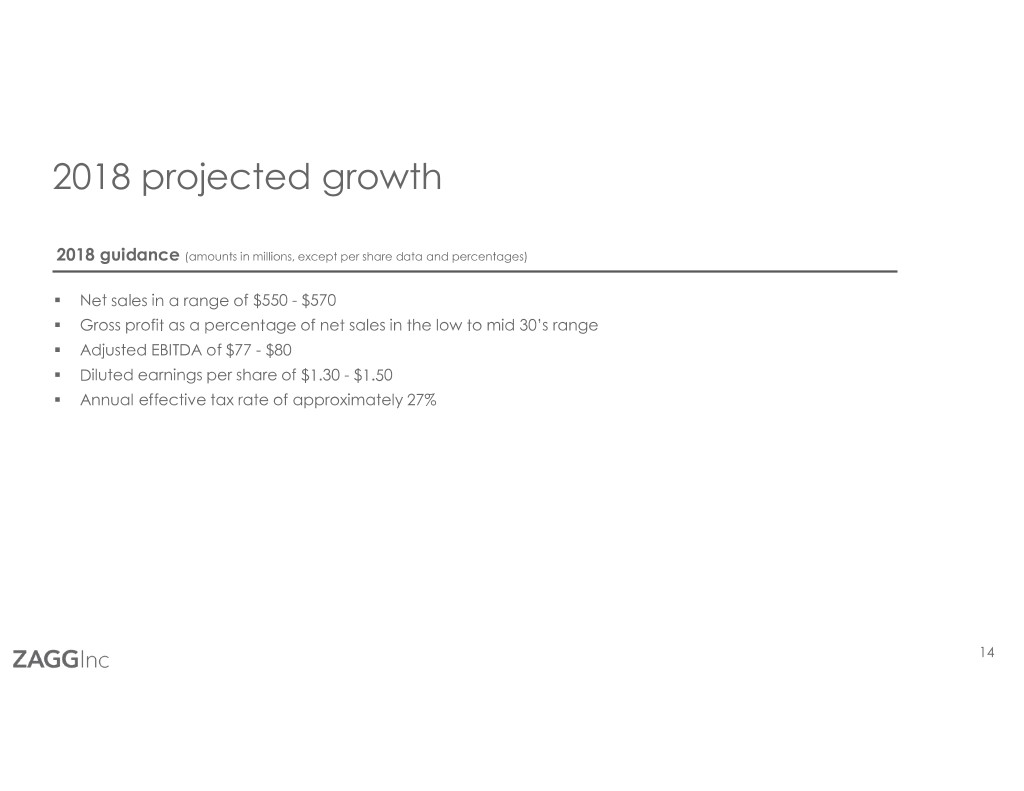
2018 projected growth 2018 guidance (amounts in millions, except per share data and percentages) � Net sales in a range of $550 - $570 � Gross profit as a percentage of net sales in the low to mid 30’s range � Adjusted EBITDA of $77 - $80 � Diluted earnings per share of $1.30 - $1.50 � Annual effective tax rate of approximately 27% 14

Compelling sales growth Net sales ($mm) $560 $519 +8% +29% $402 +49% $269 2 2015 2016¹ 2017 2018E 1 The Company acquired mophie on March 3, 2016 2 Midpoint of 2018 net sales guidance 15
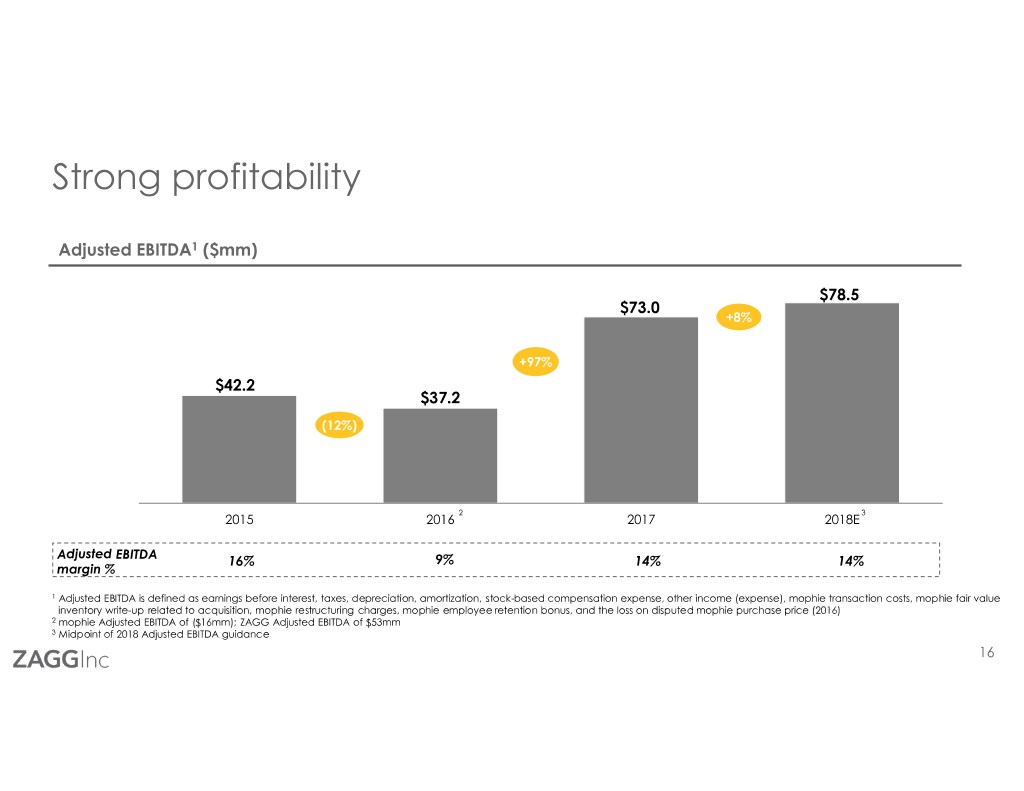
Strong profitability Adjusted EBITDA1 ($mm) $78.5 $73.0 +8% +97% $42.2 $37.2 (12%) 2 3 2015 2016 2017 2018E Adjusted EBITDA 16% 9% 14% 14% margin % 1 Adjusted EBITDA is defined as earnings before interest, taxes, depreciation, amortization, stock-based compensation expense, other income (expense), mophie transaction costs, mophie fair value inventory write-up related to acquisition, mophie restructuring charges, mophie employee retention bonus, and the loss on disputed mophie purchase price (2016) 2 mophie Adjusted EBITDA of ($16mm); ZAGG Adjusted EBITDA of $53mm 3 Midpoint of 2018 Adjusted EBITDA guidance 16
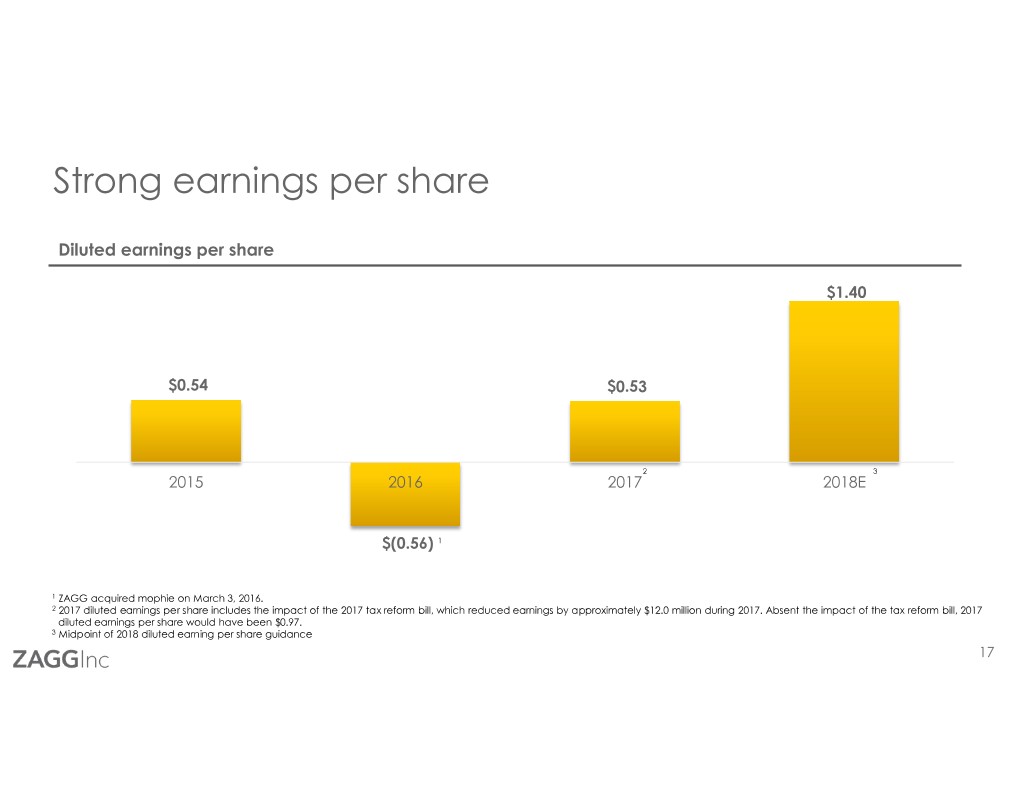
Strong earnings per share Diluted earnings per share $1.40 $0.54 $0.53 2 3 2015 2016 2017 2018E $(0.56) 1 1 ZAGG acquired mophie on March 3, 2016. 2 2017 diluted earnings per share includes the impact of the 2017 tax reform bill, which reduced earnings by approximately $12.0 million during 2017. Absent the impact of the tax reform bill, 2017 diluted earnings per share would have been $0.97. 3 Midpoint of 2018 diluted earning per share guidance 17
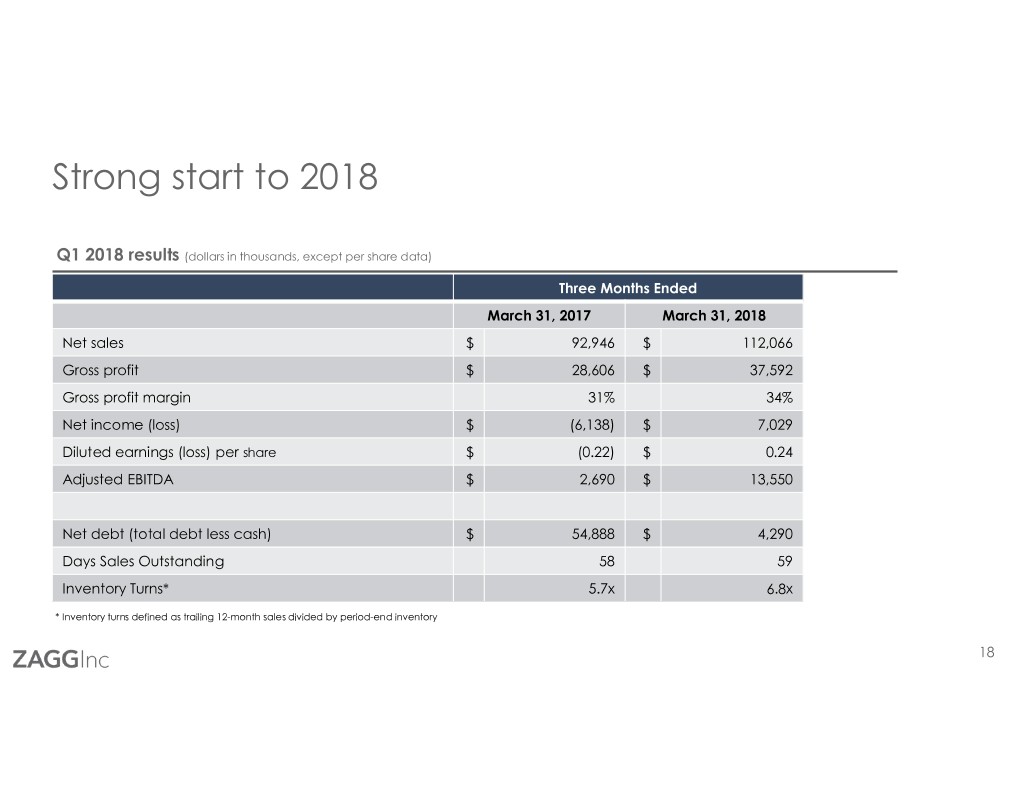
Strong start to 2018 Q1 2018 results (dollars in thousands, except per share data) Three Months Ended March 31, 2017 March 31, 2018 Net sales $ 92,946 $ 112,066 Gross profit $ 28,606 $ 37,592 Gross profit margin 31% 34% Net income (loss) $ (6,138) $ 7,029 Diluted earnings (loss) per share $ (0.22) $ 0.24 Adjusted EBITDA $ 2,690 $ 13,550 Net debt (total debt less cash) $ 54,888 $ 4,290 Days Sales Outstanding 58 59 Inventory Turns* 5.7x 6.8x * Inventory turns defined as trailing 12-month sales divided by period-end inventory 18
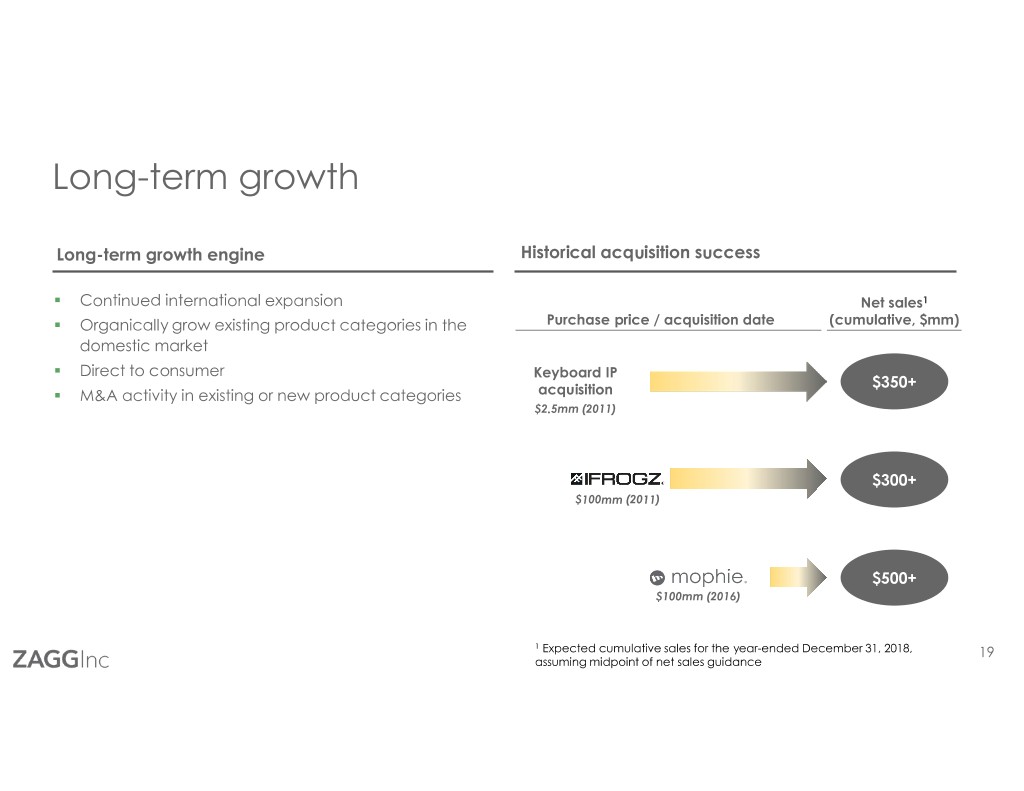
Long-term growth Long-term growth engine Historical acquisition success � Continued international expansion Net sales1 � Organically grow existing product categories in the Purchase price / acquisition date (cumulative, $mm) domestic market � Direct to consumer Keyboard IP $350+ � M&A activity in existing or new product categories acquisition $2.5mm (2011) $300+ $100mm (2011) $500+ $100mm (2016) 1 Expected cumulative sales for the year-ended December 31, 2018, 19 assuming midpoint of net sales guidance
Appendix 20

Non-GAAP reconciliation (annual periods) (amounts in thousands) Years Ended Actual Actual Actual Guidance1 December 31, 2015 December 31, 2016 December 31, 2017 December 31, 2018 Net income in accordance with GAAP $ 15,587 $ (15,587) $ 15,171 $ 40,200 Adjustments: a. Stock based compensation expense 3,893 3,830 3,602 3,667 b. Depreciation and amortization 12,923 22,270 21,888 18,358 c. Other (income) expense 166 2,199 1,383 1,375 d. Impairment of intangible asset - - 1,959 - e. mophie transaction costs 179 2,591 - - f. mophie fair value of inventory write-up - 2,586 - - g. mophie restructuring charges - 2,160 437 - h. mophie employee retention bonus - 841 346 - i. Loss on disputed mophie purchase price (2016) - 24,317 - - j. Recovery of reserves on note receivable (639) - - - k. Income tax expense (benefit) 10,111 (7,972) 28,605 14,900 Adjusted EBITDA $ 42,220 $ 37,235 $ 73,391 $ 78,500 Net sales in accordance with GAAP $ 269,311 $ 401,857 $ 519,495 $ 560,000 Adjusted EBITDA margin (Net sales/Adjusted EBITDA) 16% 9% 14% 14% 1 Midpoint of 2018 guidance 21
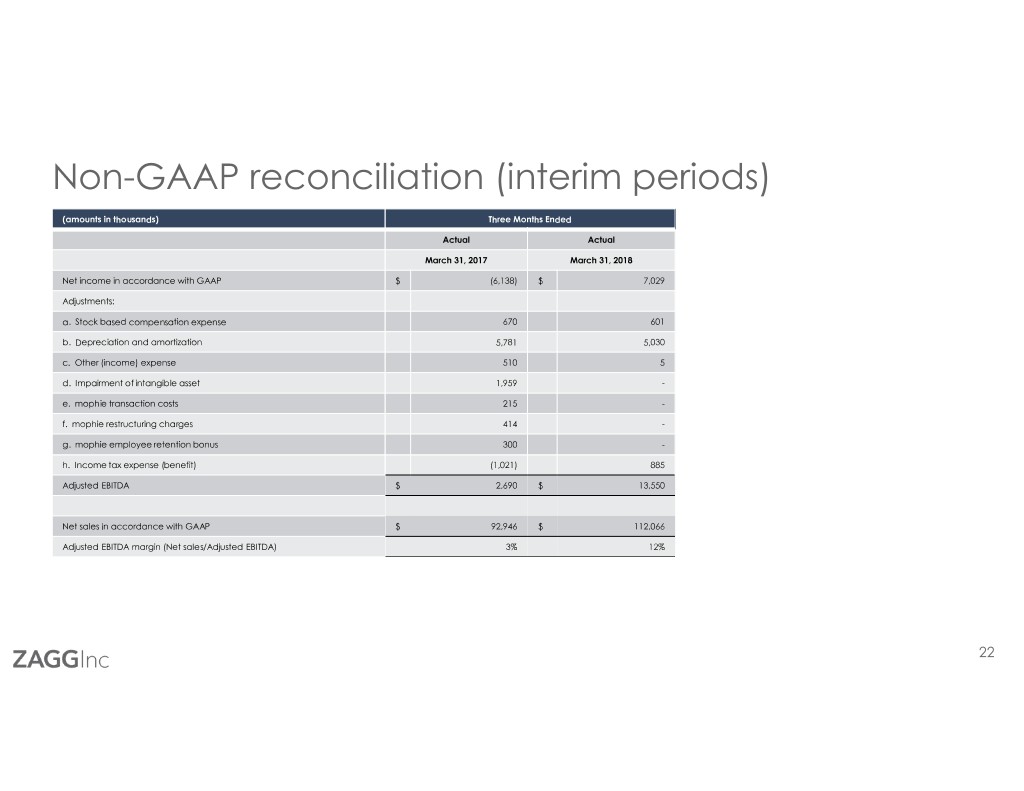
Non-GAAP reconciliation (interim periods) (amounts in thousands) Three Months Ended Actual Actual March 31, 2017 March 31, 2018 Net income in accordance with GAAP $ (6,138) $ 7,029 Adjustments: a. Stock based compensation expense 670 601 b. Depreciation and amortization 5,781 5,030 c. Other (income) expense 510 5 d. Impairment of intangible asset 1,959 - e. mophie transaction costs 215 - f. mophie restructuring charges 414 - g. mophie employee retention bonus 300 - h. Income tax expense (benefit) (1,021) 885 Adjusted EBITDA $ 2,690 $ 13,550 Net sales in accordance with GAAP $ 92,946 $ 112,066 Adjusted EBITDA margin (Net sales/Adjusted EBITDA) 3% 12% 22
The NPD Group, Inc. references References to the market shares information on slide #5 from The NPD Group Retail Tracking Services cited below: 1. The NPD Group Inc., U.S. Retail Tracking Service, Cell Phone Screen Protection, based on dollar sales, October 2017 – December 2017. 2. The NPD Group Inc., U.S. Retail Tracking Service, Cell Phone Device Protection, Charging Case, based on dollar sales, October 2017 – December 2017. 3. The NPD Group Inc., U.S. Retail Tracking Service, Mobile Power, Charge Type: Portable Power Packs, based on dollar sales, October 2017 – December 2017. 4. The NPD Group Inc., U.S. Retail Tracking Service, Tablet and e-readers – Cases, Keyboard Included, based on dollar sales, October 2017 – September 2017. References to the market shares information on slide #11 from The NPD Group Retail Tracking Services cited below: 1. The NPD Group Inc., U.S. Retail Tracking Service, Cell Phone Screen Protection, based on dollar sales, January 2014 – December 2017. References to the market shares information on slide #12 from The NPD Group Retail Tracking Services cited below: 1. The NPD Group Inc., U.S. Retail Tracking Service, Cell Phone Device Protection, Charging Case, based on dollar sales, October 2017 – December 2017. 2. The NPD Group Inc., U.S. Retail Tracking Service, Mobile Power, Charge Type: Portable Power Packs, based on dollar sales, October 2017 – December 2017. 23

Investor Presentation May 2018 24


