| 2.1 | Description of the Company and Subject Assets |
Ormat Technologies, Inc.
Ormat is a leading vertically-integrated company primarily engaged in the geothermal and recovered energy power business. The Company designs, develops, owns and operates geothermal and recovered energy-based power plants around the world. Additionally, the Company designs, manufactures and sells geothermal and recovered energy power units and other power-generating equipment, and provides related services. With more than four decades of experience in geothermal and recovered-energy generation, Ormat products and systems are covered by 82 U.S. patents.
Jersey Valley Facility
General
Jersey Valley is a binary geothermal plant and began start-up testing in December 2010. The Geothermal Power Plant (“Plant”) is located at the northern end of Dixie Valley, along the Pershing-Lander County line, in Nevada (the “Project Site”). Ormat's power solutions are utilized in the plant design; this includes two Ormat Energy Converters ("OEC"), a power generation unit that converts low, medium and high temperature heat into electrical energy. The electricity being produced is sold to NPC under a 20-year PPA.
The Jersey Valley lease area extends for several miles to the north and west, so there may be other geothermal systems yet to be discovered. If Ormat can resolve the injection limitations for the project, Management believes that the resource base within the leasehold at Jersey Valley is adequate to support the 12-MW power plant, though additional make-up drilling may be required during the life or the project.
Since December 2010, the Jersey Valley plant has been operating in start-up mode, using 77A-28 and 87-28RD as producers and the three northeast wells (14-27, 81-28, and 81A-28), as injectors. Ormat has Reported that, during early start-up operations, debris in the injection pipeline was inadvertently allowed to go down the three northeast injectors, resulting in lower-than-anticipated injection capacity at these wells. The injection limitations at these wells restricted the initial power output of the plant. Plant output has been as high as 11 net MW when injection well 18A-27 was in service.
Management has conducted acid frac stimulations of well 14-27, as of the Valuation Date, and believes that the generation targets of 10MW to 12MW are feasible. Ormat is also drilling a new well (14-34) about half a mile south of 18A-27, and it expects to use the new well for injection as well. Management anticipates that, once the acid frac jobs on the northeast injectors have been completed and the new 14-34 injector is available, the plant will be able to operate at its full capacity of 12 net MW.
While many scenarios and probabilities exist of the injection work to be done by Ormat at Jersey Valley, Management ultimately believes that it is probable that the work being undertaken will result in an increase in current capacity to levels in the 10 MW to 12 MW range. We considered the above mentioned analysis performed by Management and have incorporated the following conclusive assumptions made by Management into our analysis:
| | · | Probability of 10MW Case: 70%; |
| | · | Probability of 12MW Case: 30%. |
Power Purchase Agreement
Jersey Valley currently delivers power to NPC, a subsidiary of NV Energy Inc., collectively referred to here as the (“Parties”), under a 20 year PPA effective as of August 18, 2006. Per this contract, Ormat had initially agreed to build a 31.5 MW nominal nameplate geothermal plant to be located at the Project Site. The Parties amended the Agreement on May 21, 2007 (the "First Amendment") to reflect certain agreements between the Parties.
The Parties amended the Agreement again on Feb 11, 2011 (the "Second Amendment") to reflect certain agreements revised as follows:
| | · | Total nameplate capacity: 22.5 MW; |
| | · | Total gross output capacity: 19.0 MW ; |
| | · | Total capacity net of Station Usage: 12.0 MW. |
The purpose of the Amendment is to provide Ormat an option to revise the Parties’ rights and obligations under the current PPA for the remainder of the contract, adjusted for the achievable generation at Jersey Valley.
| 2.2 | Description of the Valuation Methodology |
To estimate the Fair Value of Jersey Valley under IAS 36, a DCF analysis was utilized. Under IFRS - IAS 36, an asset is considered to be impaired if the carrying value of the asset is greater than its estimated Fair Value. The impairment is recorded in the amount by which the carrying value exceeds the Fair Value of the asset.
Based on the injection work to be done by Ormat at Jersey Valley, Management ultimately believes that it is probable that the work being undertaken will result in an increase in current capacity to levels in the 10 MW to 12 MW range. Therefore, we have incorporated two cases based on the conclusive assumptions made by Management, with the following probabilities:
| | · | Probability of 10MW Case: 70%; |
| | · | Probability of 12MW Case: 30%. |
The Fair Value of the assets of Jersey Valley as of the Valuation Date was therefore estimated by:
| | · | Determining operational characteristics of the Plant under two generation capacities (10MW and 12MW) |
| | · | Forecasting revenues and variable operating costs as applicable, including energy prices for the electric output |
| | · | Forecasting fixed expenses and capital expenditures as applicable for each case |
| | · | Performing a DCF analysis for each generation case. The DCF for each generation case was then assigned a probability, based on the Company's estimates of its probability to materialize. The Fair Value was then calculated by summing the total weighted expected value of both cases. |
| 2.3 | Weighted Average Cost of Capital |
The weighted average cost of capital was calculated by weighting the required returns on fixed income and common equity capital in proportion to their estimated percentages in an expected capital structure. The valuation model assumes a weighted average cost of capital (WACC) of 8.0%.
Based on probabilities provided by the Company's Management, The Fair Value of Jersey Valley is estimated at $31.3 million (after taking into account assumed disposal costs) as exemplified below:
| Case | | Probability weighted Valuation | | | Case Weighting | | | Expected Value | |
| 10MW Case | | | 27,882 | | | | 70.0 | % | | | 19,518 | |
| 12MW Case | | | 39,258 | | | | 30.0 | % | | | 11,777 | |
| Total | | | | | | | 100.0 | % | | | 31,295 | |
Based on discussions with the management we assumed disposal costs estimated at 1% of the Fair Value, totaling $0.3-0.4 million (according to the selected case). These costs are already factored in the table above.
We estimate that the fair value of Jersey Valley is $31.3 million.
| | 2.4.4 | Sensitivity Analysis |
We have performed a sensitivity analysis for the value of Jersey Valley (Including disposal costs), with respect to the weighted average cost of capital as follows:
10MW case:
| % Change in WACC | | -1% | | | -0.5% | | | 8% | | | +0.50% | | | +1% | |
| Fair Value (less costs to sell) | | | 31.3 | | | | 29.5 | | | | 27.9 | | | | 26.4 | | | | 25.0 | |
12MW case:
| % Change in WACC | | -1% | | | -0.5% | | | 8% | | | +0.50% | | | +1% | |
| Fair Value (less costs to sell) | | | 44.2 | | | | 41.6 | | | | 39.3 | | | | 37.1 | | | | 35.1 | |
Combined (According to probabilities):
| % Change in WACC | | -1% | | | -0.5% | | | 8% | | | +0.50% | | | +1% | |
| Fair Value (less costs to sell) | | | 35.2 | | | | 33.1 | | | | 31.3 | | | | 29.6 | | | | 28.0 | |

Chapter C - Description of the Company and Subject Assets
| 3.1 | Ormat Technologies, Inc. |
Ormat is the leading vertically-integrated company primarily engaged in the geothermal and recovered energy power business. The Company designs, develops, owns and operates geothermal and recovered energy-based power plants around the world. Additionally, the Company designs, manufactures and sells geothermal and recovered energy power units and other power-generating equipment, and provides related services. With more than four decades of experience in geothermal and recovered-energy generation, Ormat products and systems are covered by 82 U.S. patents.
| 3.2 | Description of Subject Assets |
General
Jersey Valley is a binary geothermal plant and began start-up testing in December 2010. The Geothermal Power Plant (“Plant”) is located at the northern end of Dixie Valley, along the Pershing-Lander County line, in Nevada (the “Project Site”). Ormat's power solutions are utilized in the plant design; this includes two Ormat Energy Converters ("OEC"), a power generation unit that converts low, medium and high temperature heat into electrical energy. The electricity being produced is sold to NPC under a 20-year PPA.
The Jersey Valley lease area extends for several miles to the north and west, so there may be other geothermal systems yet to be discovered. If Ormat can resolve the injection limitations for the project, Management believes that the resource base within the leasehold at Jersey Valley is adequate to support the 12-MW power plant, though additional make-up drilling may be required during the life or the project.
Since December 2010, the Jersey Valley plant has been operating in start-up mode, using 77A-28 and 87-28RD as producers and the three northeast wells (14-27, 81-28, and 81A-28), as injectors. Ormat has Reported that, during early start-up operations, debris in the injection pipeline was inadvertently allowed to go down the three northeast injectors, resulting in lower-than-anticipated injection capacity at these wells. The injection limitations at these wells restricted the initial power output of the plant. Plant output has been as high as 11 net MW when injection well 18A-27 was in service.
Management has conducted acid frac stimulations of well 14-27, as of the Valuation Date, and believes that the generation targets of 10MW to 12MW are feasible. Ormat is also drilling a new well (14-34) about half a mile south of 18A-27, and it expects to use the new well for injection as well. Management anticipates that, once the acid frac jobs on the northeast injectors have been completed and the new 14-34 injector is available, the plant will be able to operate at its full capacity of 12 net MW.
While many scenarios and probabilities exist of the injection work to be done by Ormat at Jersey Valley, Management ultimately believes that it is probable that the work being undertaken will result in an increase in current capacity to levels in the 10 MW to 12 MW range. We considered the above mentioned analysis performed by Management and have incorporated the following conclusive assumptions made by Management into our analysis:
| | · | Probability of 10MW Case: 70%; |
| | · | Probability of 12MW Case: 30%. |
Power Purchase Agreement
Jersey Valley currently delivers power to NPC, a subsidiary of NV Energy Inc., collectively referred to here as the (“Parties”), under a 20 year PPA effective as of August 18, 2006. Per this contract, Ormat had initially agreed to build a 31.5 MW nominal nameplate geothermal plant to be located at the Project Site. The Parties amended the Agreement on May 21, 2007 (the "First Amendment") to reflect certain agreements between the Parties.
The Parties amended the Agreement again on Feb 11, 2011 (the "Second Amendment") to reflect certain agreements revised as follows:
| | · | Total nameplate capacity: 22.5 MW; |
| | · | Total gross output capacity: 19.0 MW ; |
| | · | Total capacity net of Station Usage: 12.0 MW. |
The purpose of the Amendment is to provide Ormat an option to revise the Parties’ rights and obligations under the current PPA for the remainder of the contract, adjusted for the achievable generation at Jersey Valley.
Chapter D – General Economic Outlook and Industry Analysis1
| 4.1 | General Economic Outlook |
In performing our analysis, we considered the general economic outlook as of the Valuation Date and its potential impact on the Subject Assets. An assessment of the general economy can often identify underlying causes for fluctuations in the financial and operating performance of a company. This overview of the general economic outlook is based on our examination of various economic analyses and the consensus forecasts of Blue Chip Economic Indicators and Blue Chip Financial Forecasts (collectively, the “consensus”).
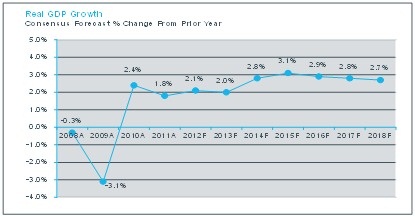
The United States’ economy is continuing to recover from one of its worst recessions in history. The 2008-2009 recession was declared officially over in June 2009, and was of greater duration than those of 1974-1975 and 1981-1982. Real GDP (i.e., output adjusted for the impact of inflation) contracted by 3.1% in 2009 on a year-over-year basis. This was the biggest decline since 1946 and was primarily attributed to sharp decreases in residential and non-residential fixed investments, real personal consumption expenditures (“PCE”) and, to a lesser extent, business inventories. In fact, 2009 saw the largest liquidation ever on record of business inventories.
In comparison to post World War II periods, the current recovery falls short of the rebound observed in post-World War II recessions. Real GDP growth in the year following the recessions of 1957-58, 1973-75, and 1981-82 was on average 5.6%. In contrast, real GDP grew by 2.4% during 2010, aided by a rebuilding of business inventories and a recovery in consumer spending. This sub-par growth trend did not improve in 2011, with the U.S economy only expanding by 1.8%. This lower than expected growth was attributable to a series of events, which included but was not limited to, harsh winter weather, continued cutbacks by state and local governments, political turmoil in several North African and Middle Eastern countries, a major earthquake and tsunami in Japan, and a resurfacing of the European sovereign debt crisis.
1 Sources– D&P Jersey Valley Impairment Analysis - Aug 2012, the IMF, and capital IQ.
Following this weak overall trend, the U.S. economy expanded by 2.0% in the first quarter of 2012. Real GDP growth was primarily driven by a rise in real PCE, which stemmed from a surge in auto and light truck unit sales driven by mild winter weather. In the second quarter of 2012, real GDP grew by only 1.3%, as the outlook for U.S. economic growth continued to deteriorate. Consumer spending slowed down, while manufacturing output growth was marked by a significant deceleration from the first quarter.
During the third quarter of 2012, the economy appears to have grown at a rate of 1.7% in real terms, according to consensus estimates. This was partially supported by a rebound in real PCE, but hindered by a further deceleration in industrial production. The biggest contributor to third-quarter growth appears to be a build-up in business inventories, but this is not expected to be a sustainable.
Looking ahead, the consensus estimates real GDP will grow 2.1% during 2012, followed by 2.0% in 2013, still below the U.S. long-term trend. Concerns related to the “fiscal cliff” are expected to dampen growth of real PCE in the early part of 2013. In fact, the Congressional Budget Office (“CBO”) projected that if the scheduled spending cuts and tax increases are not addressed, real GDP will contract by 0.5% in 2013. Slower growth in business inventories are also expected to hinder GDP, primarily the result of the drought in the U.S. and concerns about the impending fiscal cliff.
Other potential risks to U.S. economic growth include regulatory uncertainties resulting from the November 2012 U.S. presidential elections (and related impact on fiscal policy), effects of a deteriorating Euro sovereign debt crisis, and weakened economic growth in China.
In its most recent semi-annual update to long-range projections, the consensus estimated a five-year average real GDP growth rate of 2.9% for the period of 2014-2018, with a 2.5% average growth for the subsequent five-year-period. This is consistent with the most recent Livingston Survey, published by the Federal Reserve Bank of Philadelphia (the “Philadelphia Fed”), which projects a long-run (ten-year) average real GDP growth rate of 2.7%.2
The primary inflation index of the U.S., the consumer price index (“CPI”), expanded at an annualized rate of 3% in 2011, a substantially higher growth rate compared with the CPI growth rate in 2010, of 1.6%. During 2010 CPI was somewhat volatile, but ultimately registered an overall 1.6% increase, fueled by rising food, energy, and raw commodity prices. Price pressure from crude oil, which was exacerbated by the ongoing turmoil in North Africa and Middle East, persisted during the first half of 2011. This led to CPI’s annualized rise of 4.5% and 4.4% in the first and second quarters respectively. During the third quarter, the increase in CPI slowed down to an annualized 3.1%, but energy prices were still a large contributing factor. Further deceleration in CPI inflation was experienced during the fourth quarter at a surprisingly low annualized rate of 1.3%, largely due to the decline in gasoline and new vehicle prices. This contributed to an overall 2011 CPI inflation of 3.2%. A sudden rebound in oil prices during the first quarter of 2012 led to a 2.5% (annualized) rise in CPI. However, CPI inflation is set to decline in the second quarter due to a recent drop in prices of crude oil related products (driven by a slowing global economy), as well as energy services (attributable to plummeting natural gas prices and warm winter weather). The consensus estimates that CPI will rise by 2.2% and 2.1% in 2012 and 2013, respectively. In addition, the IMF estimates an average long-term inflation of 2%.
2 Source: “Livingston Survey – June 2012,” Federal Reserve Bank of Philadelphia, June 7, 2012.
In October 2009, the rate of unemployment peaked at 10.0%, the worst level since June 1983. In 2010 new jobs were created, led primarily by an increase in private sector payrolls, but restrained by layoffs of government employees, resulting in a 9.6% average unemployment rate. Conditions improved during the first half of 2011, driven primarily by private sector payroll expansion, lowering the average unemployment rate to 9.0%. A majority of first quarter job gains were eliminated during the second quarter of 2011 and the unemployment rate rose again to 9.1% in the third quarter of 2011. However, improvement in private sector employment in the fourth quarter resulted in a decline in the unemployment rate to 8.7%, leading to an overall 9.0% for 2011. Robust job creation continued in the first two months of 2012, primarily driven by a mild winter, leading to an average 8.3% unemployment rate in the first quarter of 2012, followed by 8.2% in the second quarter. Despite a general slowdown in job growth during the third quarter, the September 2012 unemployment rate declined to 7.8%, the lowest rate since January 2009. Nevertheless, this was largely a result of workers taking part-time jobs due a lack of full-time positions. Overall, the consensus expects an average unemployment rate of 8.2% in 2012 and 7.9% in 2013, projecting a below 6% rate only post-2017.
| | 4.1.5 | Interest Rate Environment and Global Economic Trends |
U.S. Interest rates remain historically low as a flight to quality led U.S. Treasury yields to drop sharply in May 2011, continuing to decline through 2012. Poor labor markets, signs of a global economic slowdown, rising capital and liquidity requirements for banks, and most notably an escalation of the Euro-zone sovereign debt crisis, all contributed to investors becoming more risk averse. Based on these trends, the Federal Open Market Committee (“FOMC”) announced in September 2012 that it will continue to keep interest rates exceptionally low through mid-2015.
In August 2010, due to market uncertainty, the Federal Reserve (“Fed”) introduced a variety of quantitative easing measures (also known as “QE2”) to support the U.S. economy, completed in June 2011. In September 2011, the Fed announced plans to purchase $400 billion of Treasury securities (known as “Operation Twist”), with the intent to drive down long-term interest rates and revive the economy. In June 2012, citing weakness in labor markets and strains in global financial markets, the Fed announced plans to continue Operation Twist through the end of 2012. In an effort to support economic recovery, the Fed announced in September 2012 that it will increase the pace of mortgage-backed security purchases to $40 billion per month. This program, known as “QE3”, does not have a defined term and will continue until labor markets improve.
Geopolitical and economic uncertainty is still very high across the globe. Concerns about the possibility of a global sovereign debt crisis first surfaced in February-March 2010, due to investors’ reactions to swelling budget deficits in several Euro-zone member states, especially in Greece. The European Union (“EU”) and the International Monetary Fund (“IMF”) first approved a bailout package for Greece in May 2010. Both Ireland (November 2010) and Portugal (April 2011) were forced to request similar EU-IMF bailouts. In July 2011, the EU approved a second Greek bailout agreement. However, markets reacted negatively and the crisis spread to Spain and Italy, which were considered by markets as “too big to fail”. Accordingly, the European Central Bank (“ECB”) was forced to reenact its government bonds purchase program and to provide additional liquidity to banks. In turn, this led to discussions about a new fiscal and banking union, which would enable the issuance of Euro-zone bonds. In September, Germany ratified plans to create a European Stability Mechanism (“ESM”) fund, which will serve as the Euro-zone’s permanent bailout mechanism. The ECB also announced a new QE program, whose intent is to acquire certain sovereign debt securities in secondary markets.
Despite starting with a healthy 2.5% annualized real GDP growth in the first quarter of 2011, the Euro-zone expanded by only 1.0% and 0.3% respectively in the second and third quarters, due to higher energy prices and the sovereign debt crisis. To worsen matters, the Euro-zone contracted by an annualized 1.4% in the last quarter of 2011. For overall 2011, the Euro-zone economy grew by 1.4%, in real terms. The first and second quarter saw further deterioration, with the economy contracting by 0.7%. Softness has extended from the periphery to core countries. Faced with this weak environment, the ECB decided in July to cut its benchmark interest rate by 25 basis points to a record low. A contraction in Euro-zone real GDP of 0.5% is now projected for 2012, followed by dismal growth of 0.2% in 2013. The actual growth trajectory for 2012 and 2013 will be dependent on politicians and the ECB’s ability to control the ongoing sovereign debt crisis.
The United Kingdom economy grew by an annualized 2.0% in the first quarter of 2011, but only by 0.3% in the second quarter, partially due to the April 2011 royal wedding and the effects from the Japanese earthquake. Third quarter saw an annualized 2.1% real GDP growth, primarily as an offset to the stagnation seen in the prior quarter. Downside risks in the economy led the Bank of England (“BOE”) to announce a QE2 program in October 2011. Real GDP contracted by an annualized 1.4% in the fourth quarter, mainly due to weakened Euro-zone growth and high inflation, leading the BOE to expand the QE2 in February 2012. Overall, real GDP grew by 0.9% in 2011. The U.K. slipped back into recession during 2012, as real GDP contracted by an annualized 1.2% and 1.5% in the first and second quarters, partly due to the Queen’s Diamond Jubilee. Consequently, in July the BOE expanded the QE2 again, in an attempt to shield the economy from the Euro-zone debt crisis. Third-quarter growth appears to have recovered, but again an offset to the prior quarter. The consensus projects a decline in real GDP of 0.5% in 2012, followed by growth of 1.1% in 2013.
In March 2011, Japan was hit by a devastating earthquake and subsequent tsunami, which created significant economic and fiscal challenges. Real GDP contracted by an annualized rate of 7.9% and 1.3% in the first and second quarters of 2011 respectively, as consumer spending, business investment, and exports collapsed following the disaster. The third quarter rebounded significantly, with a 6.9% annualized real GDP growth rate. Nonetheless, concerns regarding the rising yen and subsequent decline in Japanese exports pushed the Bank of Japan (“BOJ”) to a new round of QE measures and currency market intervention. Despite these measures, real GDP grew only by an annualized 0.3% in the fourth quarter, contributing to an overall 2011 decline of 0.8%. In the first quarter of 2012, the economy showed some improvement with a 5.3% annualized real growth, but decelerated to 0.7% in the second quarter. The consensus projects real GDP to grow by 2.3% and 1.3% in 2012 and 2013, respectively.
| 4.2 | U.S. Geothermal Market Update |
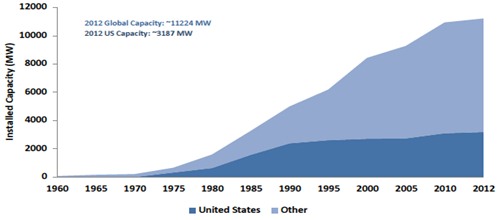
The development of geothermal energy resources for utility-scale electricity production in the United States has continued since the 1960’s, and in turn has positioned the US as a leader in the global geothermal industry. The US currently has approximately 3187 MW of installed geothermal capacity, more than any other country in the world, as depicted in the figure below.
US & Global Geothermal Installed Capacity (1960 – 2012)