Exhibit 99.1

North Brawley Power Plant
Asset Impairment Analysis
****
Prepared for
Ormat industries Ltd.
March 2012


Table of Contents
| | | | |
Chapter A - Introduction | | | 3 | |
| |
Chapter B - Executive Summary | | | 13 | |
| |
Chapter C - Description of the Company & Subject Assets | | | 18 | |
| |
Chapter D - General Economic Outlook and Industry Analysis | | | 20 | |
| |
Chapter E - Valuation | | | 30 | |
| |
Chapter F - Exhibits | | | 38 | |

2
Chapter A - Introduction
Giza Singer Even (Here and after “GSE”) has been mandated by Ormat Industries Ltd. (“Ormat” or the “Company”) to assist Ormat’s management with their asset impairment analysis in connection with the North Brawley power plant (“North Brawley” or the “Subject Assets”) to meet the requirements under IFRS accounting standards (“the Report”). In order to prepare the Report, GSE and Ormat has retained the advisory services of Duff & Phelps, a world-class global independent financial advisory firm with strong expertise and capabilities in the area of valuation services (“D&P”). This Report was prepared by GSE in cooperation with a D&P valuation team.
The Report includes a description of the methodology and main assumptions and analyses used by the Company, D&P and GSE for assessing the value of North Brawley. Having said that, the description does not purport to provide a full and detailed breakdown of all the procedures that we applied in formulating the Report.
| | 1.2 | Reliance on Information Received from the Company |
In formulating this Report, GSE and D&P assumed and relied on the accuracy, completeness, and up-to-datedness of the information received from the Company, including financial data and any forward-looking information. GSE is not responsible for independently verifying the information it has received, and accordingly, did not conduct an independent examination of this information, other than reasonability tests.
While preparing thus report, we also addressed, among other things, forecasts that were submitted to us by the Company. These projections are uncertain suppositions and expectations regarding the future, partly based on information existing in the Company as of the date of the valuation (“Valuation Date”), as well as various assumptions and expectations pertaining to the Company and to numerous extraneous factors, including the situation in the market segment in which the Company operates, potential competitors, and the general market situation. It should therefore be emphasized that there is no certainty that these forecasts and expectations will fully or partially materialize. The assessments and forecasts of the Company’s
3
Management, apart from being based on these assumptions, relate to the Company’s future intentions and goals as of the Valuation Date. These intentions and goals are materially influenced by the situation in the Company and in the market and need to be continuously adjusted to the various changes in the working assumptions, the Company’s situation and the general economic situation. Any such change stands to influence the chance that these estimations will materialize. If the estimations of the Company’s Management do not materialize, the actual results may vary materially from the results projected or inferred from these estimations, insofar as they were used in this opinion, noting that the Fair Value was appraised in this Report, as set out in the accounting standard chapter.
| | 1.3 | Forward-looking Information |
In this report, we also addressed forward-looking information that was submitted to us by the Company’s management. Forward-looking information is uncertain information concerning the future, which is based on information available to the Company on the Valuation Date and includes management’s estimations or intentions as of the Valuation Date. If management’s projections do not materialize, the actual results may vary materially from the results estimated or implied from this information, insofar as they were used in this Report.
| | 1.4 | Limitations in the Application of the Report |
An economic assessment is not an exact science, and is intended to reflect in a reasonable and fair manner the situation at a given time, based on known data, basic assumptions and forecasts. Changes in key variables and/or other information may alter the basis for the basic assumptions and alter the conclusions accordingly.
This Report does not constitute a due diligence study and does not purport to contain the information, investigations and tests or any other information contained in a due diligence study, including an examination of the Company’s contracts and engagements.
4
We emphasize that this Report does not constitute legal advice or a legal opinion. The interpretation of various documents that we reviewed was done exclusively for the purpose of forming and providing this Report.
The information appearing in the Report does not presume to include all the information required by a potential investor, and is not meant to determine the value for a specific investor. Different investors may have different objectives and methods of examination based on other assumptions, and accordingly, the price they would be willing to pay will vary.
| | 1.5 | Personal and Financial Relationship with the Company |
We hereby confirm that we have no personal interest in the Company, other than the fact that we receive a fee for providing this Report, and our professional fees are not contingent on the results of this Report.
It should be noted that in March 2011, GSE conducted an impairment analysis of the North Brawley Power Plant for the Company, in connection with the Company’s 2010 annual financial statements as follows:
| | | | | | | | | | | | | | |
Subject of the Opinion | | Date
of the Opinion | | Relevant
accounting
Standard | | Work
Method | | Valuation
Results
($ 000’s) | | | WACC | |
North Brawley | | March 2011 | | IFRS | | DCF | | | 139,009 | | | | 8 | % |
In connection with this Report, we should note that GSE will receive a letter of indemnity from the Company in the event that GSE is sued in a legal proceeding for the payment of any amount to the Company or to a third party for a cause of action that could stem, directly or indirectly, from this Report. In such case, the Company shall indemnify GSE for any expense that GSE shall incur or be required to pay for legal representation, legal advice, professional consulting, defense against legal proceedings, negotiations, etc. The Company shall also indemnify GSE for the amount that it shall be ordered to pay to a third party in a legal proceeding.
5
| | 1.6 | Reference to the Report |
We consent that this Report will be included in the 2011 annual report of Ormat Industries Ltd, and in a current report on form 8-k of Ormat Technologies, Inc.
This Report may not be used for any other purpose without receiving explicit prior and written permission from GSE. Anyone using the Report, in whole or in part, other than for the purposes for which it was submitted, and without the prior written approval of GSE, may be sued therefore.
| | 1.7 | Limitation of Liability |
This Report is intended for the use of the Company’s Management and for the purpose described above, and it may not be used for any other purpose, including transferring the Report to a third party or citing it, without our prior written consent. In no event, whether we have given our consent or not, will we not assume any responsibility toward any third party which was forwarded the Report.
In the course of our work, we received information, explanations, data and representations from the Company and/or from D&P and/or someone on the Company’s behalf (the “Information”). The responsibility for the information lies with whoever provided such information. The ambit of our work does not include an examination and/or verification of said Information. Consequently, our work shall not be considered and will not constitute a confirmation of the veracity, completeness or accuracy of the Information provided to us. In no event will we be liable for any loss, damage, cost or expenditure that might be caused in any manner or form from acts of fraud, misrepresentation, deception, submission of Information that is not true or complete or obstruction of information on the part of the Company and/or D&P and/or anyone on the Company’s behalf, or any other reliance on the Information.
In general, forecasts tend to relate to future events and are based on reasonable assumptions made on the date of the forecast. Such assumptions may change over the forecasted period, and consequently forecasts made at the time of the valuation may differ from actual financial results and/or from estimates made at a later date. Therefore, these forecasts may not be treated with the same level of confidence attributed to data appearing in audited financial statements. We offer no opinion regarding the correctness of the forecasts made by the Company, D&P and/or by anyone on their behalf with the financial results that will actually be obtained.
6
The Report does not constitute a due diligence study and should not be relied on as such. Moreover, financial assessments do not presume to be an exact science, and their conclusions are often contingent on the subjective judgment exercised by the valuator. Although we believe that the value that we have set is reasonable based on the information submitted to us, another value appraiser may reach a different result.
| | 1.8 | Sources of Information and Valuation Procedures |
Sources of Information
In the course of the Report, we relied upon financial and other information, including prospective financial information, obtained from the Company, D&P and from various public, financial, and industry sources. Our conclusion is dependent on such information being complete and accurate in all material respects. We will not accept responsibility for the accuracy and completeness of such provided information.
The principal sources of information used in performing our valuation include:
| | • | | Discussions with the Company’s management and with D&P, as follows: |
| | • | | Mr. Joseph Tenne, CFO, Ormat Industries Ltd. and Ormat Technologies, Inc. |
| | • | | Mr. Eyal Hen, Director of Finance, U.S. Operations, Ormat Technologies Inc. |
| | • | | Mr. Amit Gorka, V.P Corporate Controller, Ormat Industries Ltd. And Ormat Technologies, Inc. |
| | • | | Mr. Joseph Omoworare, Valuation Services Director, Duff & Phelps |
| | • | | Historical cost and financial statement information provided by Ormat Technologies, Inc. and Ormat Industries Ltd. |
7
| | • | | Ormat Technologies, Inc. Management’s financial projections for North Brawley under several capacity scenarios and for both pricing scenarios (Southern California Edison Company, and Third Party Off-taker) |
| | • | | Power Purchase Agreements (“PPAs”) related to North Brawley |
| | • | | Documentation provided by Management in regards to Amendments to the current PPA with Southern California Edison company (“SCE”) |
| | • | | North Brawley plant basis summary, provided by Management, as of the Valuation Date |
| | • | | ORNI 18 Term Sheet, provided by Management |
| | • | | Other publicly available information from sources, but not limited to, Capital IQ, and SNL, deemed relevant to preparation of this Report |
| | • | | Financial models, analyses and North Brawley Asset Impairment Analysis report received from D&P |
Valuation Procedures
For the purpose of preparing this Report, the Company’s management provided D&P and GSE with historical and forecasted performance characteristics for North Brawley, including generation output, additional capital expenditure requirements to improve output, energy revenues, along with plant and operating expenses. D&P and GSE have adopted management forecasts and assumptions. To check the reasonability of said forecasts and assumptions, GSE and D&P have conducted several interviews and conversations with the management and have reviewed various relevant materials provided by the Company. Procedures, investigations, and financial analyses with respect to the preparation of this Report included, but were not limited to, the items summarized below:
| | • | | Analysis of conditions in, and the economic outlook for, the geothermal / renewable energy sector |
| | • | | Analysis of general market data, including economic, governmental, and environmental forces |
| | • | | Analysis of the assumptions and estimates made by the Company’s management pertaining to the two pricing scenarios (Third Party Off-taker and SCE) |
8
| | • | | Discussions concerning the history, current state, and future operations of the Subject Asset; |
| | • | | Discussions with the Company’s management to obtain an explanation and clarification of data provided |
| | • | | Review of the documentation provided by the Company’s management in regards to amendments to the current PPA with Southern California Edison (SCE) |
| | • | | Review of the updated terms sheets pertaining to the PPA with the Third Party Off-taker |
| | • | | Analysis of financial and operating projections including revenues, operating margins (e.g., earnings before interest and taxes), working capital investments, production tax credits, and capital expenditures based on the Subject Asset’s historical operating results, industry results and expectations, and management representations as it relates to the Subject Assets for the several capacity generation cases |
| | • | | Estimation of an appropriate Weighted Average Cost of Capital (“WACC”) |
| | 1.9 | The Accounting Standard |
At the request of the Company, the valuation will be used for implementing International Accounting Standard No. 36 regarding asset impairment (hereinafter: the “Standard” or “IAS 36”) in its financial statements.
The purpose of the Standard is to prescribe the procedures that an enterprise must apply to ensure that its assets are carried at no more than their recoverable amount. An asset is carried at more than its recoverable amount when the carrying value of the asset exceeds the amount to be recovered through use or sale of the asset. In this case, the asset value has been impaired, and the Standard requires the corporation to recognize an impairment loss. The Standard also specifies when a corporation should reverse an impairment loss and requires certain disclosures for impaired assets, and for investments in investee companies that are not subsidiaries, which are carried in the financial statements in an amount that significantly exceeds their market value or net sale price.
9
The Standard prescribes the accounting treatment and statement required in the event of asset impairment. If an enterprise prepares consolidated financial statements (including proportionate consolidation), the Standard will be applied to the accounting treatment of the impairment of all the assets appearing in the enterprise’s consolidated balance sheet, including investments in investee companies that are not subsidiaries, goodwill stemming from the acquisition of subsidiaries and fair value adjustments. In effect, this Standard applies to investments in subsidiaries and jointly controlled companies, so that provisions for impairment loss, which are recognized in the consolidated financial statements with respect to assets of the subsidiary or the jointly-controlled company, including goodwill and fair value adjustments, will be stated in the separate financial statements of the parent company as a reduction of the investment account in the subsidiary or jointly-controlled company.
The Standard prescribes that the recoverable amount of an asset should be estimated whenever there are indications that an asset may be impaired.
The Standard requires recognizing the impairment loss of an asset (i.e. the value of the asset has declined) whenever the carrying amount of the asset exceeds its recoverable amount. An impairment loss will be recognized in the statement of profit and loss for those assets stated at cost and should be treated as a revaluation decrease, and only for those assets carried at a revalued amount in accordance with other accounting standards or in accordance with the provisions of any law.
The Standard prescribes that a recoverable amount shall be calculated as the Fair Value less costs to sell or Value in Use, whichever is higher:
| | 1. | The Value in Use of the asset is the estimate of the present value of future cash flows to be derived from use and disposal of the asset at the end of its useful life. |
| | 2. | Fair value less costs to sell is the amount obtainable from the sale of an asset or Cash-Generating Unit in an arm’s length transaction between knowledgeable, willing parties, less the costs of disposal. |
10
The Standard states that the best evidence of an asset’s Fair Value less costs to sell is a price in a binding sale agreement in an arm’s length transaction, adjusted for incremental costs that would be directly Attributable to the disposal of the asset.
If there is no binding sale agreement but an asset is traded in an active market, Fair Value less costs to sell is the asset’s market price less the costs of disposal. The appropriate market price is usually the current bid price. When current bid prices are unavailable, the price of the most recent transaction may provide a basis from which to estimate Fair Value less costs to sell, provided that there has not been a significant change in economic circumstances between the transaction date and the date as at which the estimate is made.
If there is no binding sale agreement or active market for an asset, Fair Value less costs to sell is based on the best information available to reflect the amount that an entity could obtain, at the balance sheet date, from the disposal of the asset in an arm’s length transaction between knowledgeable, willing parties, after deducting the costs of disposal. In determining this amount, an entity considers the outcome of recent transactions for similar assets within the same industry. Fair Value less costs to sell does not reflect a forced sale, unless management is compelled to sell immediately.
| 1.10 | Details on the Valuating Company |
Giza Singer Even is a leading Israeli financial advisory and investment banking firm. Throughout its 25 years of operations, the firm has been involved in the largest transactions and privatization processes in Israel and has serviced the largest corporations in the Israeli capital market.
Giza Singer Even is operating through three independent divisions:
| | • | | Investment Banking and Underwriting: the division provides services for various transactions as mergers and acquisitions, corporate finance, public offerings and debt rating. The division provides underwriting services through its subsidiary- GSE Capital Markets. |
11
| | • | | Financial advisory services: the division offers a wide range of services, including business plans, valuation and fair value measurements services, applied economics services and legal expert opinions |
| | • | | Analytical Research and Corporate Governance: our subsidiary, GSE Analytical Research and Corporate Governance provides debt analysis and consulting services to leading financial institutions as banks and institutional investors in Israel. The firm has substantially advanced its operations in this area following the increased regulatory requirements in connection with investments in corporate bonds |
This report has been prepared by a team headed by Hanoch Papoushado. Mr. Papoushado holds a LL.B and B.A in economics from the Tel-Aviv University and a M.B.A, from the Wharton Business School in the University of Pennsylvania.
|
| Sincerely yours, |
|
|
|
| Giza Singer Even |
|
| March 2012 |
12
Chapter B - Executive Summary
| 1. | Description of the Company and Subject Assets |
Ormat Technologies, Inc.
Ormat is the leading vertically-integrated company primarily engaged in the geothermal and recovered energy power business. The Company designs, develops, owns and operates geothermal and recovered energy-based power plants around the world. Additionally, the Company designs, manufactures and sells geothermal and recovered energy power units and other power-generating equipment, and provides related services. With more than four decades of experience in geothermal and recovered-energy generation, Ormat products and systems are covered by 82 U.S. patents.
| | • | | North Brawley Facility (The Plant) |
General
The North Brawley Geothermal Power Plant project (“The Plant”) is located in Brawley, California. The plant was placed in service on January 15, 2010 and consists of five (5) water cooled Ormat Energy Converter Units, water system and other auxiliary systems to produce up to 50 MW of electricity. The Plant is an addition to the expanding network of geothermal Type Power Plants in the area, which make use of the high temperature fluid beneath the surface to produce steam or brine and induce rotation in a turbine / generator configuration.
Since early 2009, Brawley has been hampered by four major factors:
| | • | | Inability to circulate the design flow due to injection field limitations, and lack of available production wells |
| | • | | High operating costs due to the cost of maintaining filtration on the injection wells and cleanouts of the injection wells |
| | • | | High well field operating costs due to early failures of the production pumps |
| | • | | Additional capital expenditure investment in pursuit of solutions to the injection and the production issues, including filtration and separation systems, drilling or modifying the injection wells, drilling production wells, adding injection pumps and constructing pipelines for the new wells |
13
As of the Valuation Date the Plant had a well field capacity of approximately 35MW of electricity. However, since June 2011, the well field has been operated in a “restricted operation mode”, where only the highest contribution wells are operated and the rest of the wells are kept idle until longer lasting pumps become available. The Company has also been working on additional well field studies in hopes to increase the well field and or develop better wells from the existing reservoir. Due to progress in the interpretation of the results from a 3-D seismic survey which was completed in 2011, management now have detailed information about the resource that will help better determine the targets for drilling of additional production wells. Based on the results from the 3-D seismic survey and the reservoir modeling the re-drilling of the damaged well was performed and drilling of an additional new production well is in progress.
Management’s assessment of the potential of the field remains unchanged and it believes that the generation targets of 45MW to 50MW that it has used in the past are still valid. Management also believes that there has been good progress in improving the service life of the production pumps which it currently sees as the biggest cost driver. The progress in interpretation of the nature of the reservoir through the use of a 3-D seismic survey improves the ability to define targets for hot low salinity production wells and matching injection wells to provide pressure support for the production wells.
Power Purchase Agreement - Renegotiation Status
North Brawley currently delivers power to Southern California Edison Company (“SCE”) under a 20 year Power Purchase Agreement (“PPA”) signed in 2007. In light of the current market conditions in the region, the Company submitted a proposal to a third party off-taker for a long term PPA for North Brawley, on September 8, 2011. The third party off-taker expressed interest in the proposal and after subsequent discussions and negotiations, revised term sheets were submitted between the Company and the Third Party Off-taker for North Brawley in November 2011, and December, 2011. A final decision has not yet been reached, although Management has confirmed that the prospects of the negotiations were very favorable. The Company is currently working with SCE on a bilateral amendment (Hereinafter “Amendment No. 6” or the “Amendment”) of the previous PPA, which will allow them to sign a new PPA with the Third Party Off-taker. The
14
purpose of the Amendment is to provide the Company an option to suspend the parties’ rights and obligations under the current PPA for a five 5 year period (hereinafter “Holiday Period”).
| 2. | Description of the Valuation Methodology |
To estimate the Fair Value of North Brawley under IAS 36, a DCF analysis was utilized. Under IFRS – IAS 36, an asset is considered to be impaired if the carrying value of the asset is greater than its estimated Fair Value. The impairment is recorded in the amount by which the carrying value exceeds the Fair Value of the asset.
In consideration of the current long term power purchase contract negotiations being currently undertaken by the Company, and as requested by the Company, the analysis has been conducted using the expected cash flow approach. To estimate a value for the long-lived assets we conducted a probability-weighted valuation analysis pertaining to the Third Party Off-taker and SCE pricing scenarios (further elaborated below) provided by the Company. Additionally, since the exact generation of the facility could not be calculated due to recent construction and addition of new wells, as mentioned in the Subject Asset description (see Chapter C), we used high probability and low probability generation assumptions under each of the two pricing scenarios (Third Party Off-taker and SCE), each with four power generation capacity cases; a 37MW case, a 40MW case, a 45MW case, and a 50MW case (collectively 8 cases).
The Fair Value of the assets of North Brawley as of the Valuation Date was therefore estimated by:
| | • | | Determining operational characteristics of the Plant’s four generation scenarios; a 37MW, a 40MW, a 45MW, and a 50MW scenario |
15
| | • | | Forecasting revenues and variable operating costs as applicable, including energy prices for the electric output under two pricing scenarios (Third Party Off-taker and SCE) |
| | • | | Forecasting fixed expenses and capital expenditures as applicable for each case |
| | • | | Performing a DCF analysis for each generation case under each pricing scenario. The DCF for each generation case was then assigned a probability, estimated by the Company’s management, and thereafter each pricing scenario was assigned a probability, based on the Company’s estimates of its probability to materialize. The Fair Value was then calculated by summing the total weighted expected value of all cases. |
| 3. | Weighted Average Cost of Capital |
The weighted average cost of capital was calculated by weighting the required returns on fixed income and common equity capital in proportion to their estimated percentages in an expected capital structure. The valuation model assumes a weighted average cost of capital (WACC) of 8%.
4.1Fair Value
Based on probabilities provided by the Company’s Management, the Fair Value of North Brawley is estimated at $157.8 million (pre disposal costs), as exemplified below:
| | | | | | | | | | | | | | | | | | | | | | | | | | | | |
Case | | Third Party
Off-taker
DCF | | | Weighting | | | SCE DCF | | | Weighting | | | Probability
weighted
Valuation | | | Case
Weighting | | | Expected
Value | |
37MW Case | | | 157,928 | | | | 80 | % | | | 83,676 | | | | 20 | % | | | 143,077 | | | | 50 | % | | | 71,539 | |
40MW Case | | | 169,852 | | | | 80 | % | | | 91,407 | | | | 20 | % | | | 154,163 | | | | 25 | % | | | 38,541 | |
45MW Case | | | 197,892 | | | | 80 | % | | | 121,338 | | | | 20 | % | | | 182,581 | | | | 12.5 | % | | | 22,823 | |
50MW Case | | | 213,683 | | | | 80 | % | | | 139,922 | | | | 20 | % | | | 198,931 | | | | 12.5 | % | | | 24,866 | |
| | | | | | | | | | | | | | | | | | | | | | | | | | | | |
Total | | | | | | | | | | | | | | | | | | | | | | | 100 | % | | | 157,769 | |
| | | | | | | | | | | | | | | | | | | | | | | | | | | | |
4.2Disposal Costs
Based on discussions with the management we assumed disposal costs estimated at 1% of the Fair Value, totaling $1.57 million
16
4.3Conclusion
We estimate that the Fair Value of North Brawley, less costs to sell, is $156.2 million
4.4Sensitivity Analysis
4.4.1Sensitivity to the WACC
We have performed a sensitivity analysis for the value of North Brawley, less costs to sell, with respect to the weighted average cost of capital as follows:
| | | | | | | | | | | | | | | | | | | | |
WACC | | | 7.00 | % | | | 7.50 | % | | | 8.00 | % | | | 8.50 | % | | | 9.00 | % |
Fair Value (less costs to sell) | | | 167.6 | | | | 161.7 | | | | 156.2 | | | | 151.0 | | | | 146.2 | |
4.4.2Sensitivity - probability weighting - Third Party Off-taker vs. SCE pricing scenarios
We have performed a sensitivity analysis for the value of North Brawley, less costs to sell, with respect to the probability weighting of the Third Party Off-taker vs. SCE pricing scenarios, as follows:
| | | | | | | | | | | | | | | | | | | | |
Probability SCE / Third Party Off taker | | | 40%/60 | % | | | 30%/70 | % | | | 20%/80 | % | | | 10%/90 | % | | | 0%/100 | % |
Fair Value (less costs to sell) | | | 141.2 | | | | 148.7 | | | | 156.2 | | | | 163.7 | | | | 171.2 | |
17
Chapter C - Description of the Company and Subject Assets
Ormat Technologies, Inc.
Ormat is the leading vertically-integrated company primarily engaged in the geothermal and recovered energy power business. The Company designs, develops, owns and operates geothermal and recovered energy-based power plants around the world. Additionally, the Company designs, manufactures and sells geothermal and recovered energy power units and other power-generating equipment, and provides related services. With more than four decades of experience in geothermal and recovered-energy generation, Ormat products and systems are covered by 82 U.S. patents.
Description of Subject Assets
General
The North Brawley Geothermal Power Plant project (“The Plant”) is located in Brawley, California. The plant was placed in service on January 15, 2010 and consists of five (5) water cooled Ormat Energy Converter Units, water system and other auxiliary systems to produce up to 50 MW of electricity. The Plant is an addition to the expanding network of geothermal Type Power Plants in the area, which make use of the high temperature fluid beneath the surface to produce steam or brine and induce rotation in a turbine / generator configuration.
Since early 2009, Brawley has been hampered by four major factors:
| • | | Inability to circulate the design flow due to injection field limitations, and lack of available production wells |
| • | | High operating costs due to the cost of maintaining filtration on the injection wells and cleanouts of the injection wells |
| • | | High well field operating costs due to early failures of the production pumps |
| • | | Additional capital expenditure investment in pursuit of solutions to the injection and the production issues, including filtration and separation systems, drilling or modifying the injection wells, drilling production wells, adding injection pumps and constructing pipelines for the new wells |
18
As of the Valuation Date the Plant had a well field capacity of approximately 35MW of electricity. However, since June 2011, the well field has been operated in a “restricted operation mode”, where only the highest contribution wells are operated and the rest of the wells are kept idle until longer lasting pumps become available. The Company has also been working on additional well field studies in hopes to increase the well field and or develop better wells from the existing reservoir. Due to progress in the interpretation of the results from a 3-D seismic survey which was completed in 2011, management now have detailed information about the resource that will help better determine the targets for drilling of additional production wells. Based on the results from the 3-D seismic survey and the reservoir modeling the re-drilling of the damaged well was performed and drilling of an additional new production well is in progress.
Management’s assessment of the potential of the field remains unchanged and it believes that the generation targets of 45MW to 50MW that it has used in the past are still valid. Management also believes that there has been good progress in improving the service life of the production pumps which it currently sees as the biggest cost driver. The progress in interpretation of the nature of the reservoir through the use of a 3-D seismic survey improves the ability to define targets for hot low salinity production wells and matching injection wells to provide pressure support for the production wells.
Power Purchase Agreement - Renegotiation Status
North Brawley currently delivers power to Southern California Edison Company (“SCE”) under a 20 year Power Purchase Agreement (“PPA”) signed in 2007. In light of the current market conditions in the region, the Company submitted a proposal to a third party off-taker for a long term PPA for North Brawley, on September 8, 2011. The third party off-taker expressed interest in the proposal and after subsequent discussions and negotiations, revised term sheets were submitted between the Company and the Third Party Off-taker for North Brawley in November 2011, and December, 2011. A final decision has not yet been reached, although Management has confirmed that the prospects of the negotiations were very favorable. The Company is currently working with SCE on a bilateral amendment (Hereinafter “Amendment No. 6” or the “Amendment”) of the previous PPA, which will allow them to sign a new PPA with the Third Party Off-taker. The purpose of the Amendment is to provide the Company an option to suspend the parties’ rights and obligations under the current PPA for a five 5 year period (hereinafter “Holiday Period”).
19
Chapter D – General Economic Outlook and Industry Analysis1
General Economic Outlook
Introduction
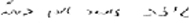
In performing our analysis, we considered the general economic outlook as of the Valuation Date and its potential impact on the Subject Assets. An assessment of the general economy can often identify underlying causes for fluctuations in the financial and operating performance of a company. This overview of the general economic outlook is based on our examination of various economic analyses and the consensus forecasts of Blue Chip Economic Indicators and Blue Chip Financial Forecasts (collectively, the “consensus”).
Economic Growth
The United States’ economy is continuing to recover from one of its worst recessions in history. The 2008-2009 recession was declared officially over in June 2009, and was of greater duration than those of 1974-1975 and 1981-1982. Moreover, based on revisions released July 20, 2011, it appears that this recession was deeper than previously assumed, while the subsequent recovery was less robust. Real GDP (i.e., output adjusted for the impact of inflation) contracted by 3.5% in 2009 on a year-over-year basis. This was the biggest decline since 1946 and was primarily attributed to sharp decreases in residential and non-residential fixed investments, real personal consumption expenditures (“PCE”) and, to a lesser extent, business inventories. In fact, 2009 saw the largest liquidation ever on record of business inventories.
Overall, real GDP grew by 1.5% during 2011, aided by a recovery in consumer spending. However, the current recovery falls short of the rebound observed in other post-World War II recessions. For the expansion period between 2009 and 2011, real GDP increased at an average annual rate of 2.3%. In contrast, real GDP growth in the year following the recessions of 1957-58, 1973-75, and 1981-82 was on average 5.6%.
Extra uncertainty was introduced by political turmoil in several North African and Middle Eastern countries, a major earthquake and Tsunami in Japan, and a
| 1 | Sources – D&P North Brawley Impairment Analysis – Feb 2011, the IMF, and capital IQ. |
20
resurfacing of the European sovereign debt crisis. Supply-chain disruptions in auto production related to the Japanese earthquake/Tsunami had a negative impact in real PCE and industrial production growth, which in turn led to a weak second quarter GDP annualized growth of 1.3%. State and local government cutbacks continued to be the leading contributor to the weakness in economic growth.
Third quarter growth improved to an annualized 2.5%, partly due to surprisingly strong growth in real PCE. However, business inventories subtracted 1.1% from the growth rate for the quarter; perhaps reflecting businesses’ somewhat pessimistic expectations for consumer spending during the holiday season. The consensus predicts slightly lower real GDP growth in the fourth quarter, which will be supported by consumer spending and a buildup in business inventories.
The consensus estimates real GDP will grow 1.8% during 2011, improving to 2.1% in 2012, but according to these analysts there is still nearly 28% probability of a recession occurring in 2012. Uncertainty continues to impact consumer confidence, hurt by the slow pace of income and job growth and unknown outcome of U.S. fiscal policy discussions. Businesses also face a high degree of uncertainty, hurt by a political stalemate (which led to the downgrade U.S.’s AAA credit rating back in August 2011) and potential effects of a deteriorating Euro sovereign debt crisis.
In its most recent semi-annual update to long-range projections, the consensus estimates a five-year average real GDP growth rate of 2.8% for the period of 2013-2017, with a 2.5% average growth for the subsequent five-year-period.
This is consistent with the most recent Livingston Survey published by the Federal Reserve Bank of Philadelphia (hereinafter the “Philadelphia Fed”).
21
Inflation and Unemployment
The primary inflation index of the U.S., the consumer price index (“CPI”), expanded at an annualized rate of 3% in 2011, a substantially higher growth rate compared with the CPI growth rate in 2010, of 1.6%. During 2010 CPI was somewhat volatile, but ultimately registered an overall 1.6% increase, fueled by rising food, energy, and raw commodity prices observed in the latter half of 2010. Due to the continued increase in energy and food prices, CPI rose by an annualized 5.2% in the first quarter of 2011. To add some perspective, the CPI energy index increased at a compound annual growth rate (“CAGR”) of 42.4% in the first three months of 2011. Price pressure from crude oil (due to the ongoing turmoil in North Africa and Middle East) continued in the second quarter of 2011, with energy prices being the biggest contributor to CPI’s 4.1% annualized rise. During the third quarter, the increase in CPI slowed down to an annualized 3.1%, but energy prices were still a big contributing factor. The consensus projects further deceleration in CPI inflation during the fourth quarter, with an estimated 1.9% annualized growth. Overall, it is estimated that CPI will rise by 1.2% and 0.9% in 2012 and 2013, respectively.
In 2011, the rate of unemployment reached 9.1% after peaking in 2010, to 9.6% (the worst level since April 1983). Conditions improved during the first quarter of 2011, driven primarily by private sector payrolls, with almost 660,000 new jobs being created during the quarter. This led the March 2011 unemployment rate down to 8.8%, the lowest level in two years. However, the labor market remains extremely weak. A great majority of first quarter job gains were eliminated during the second quarter of 2011 and the unemployment rate climbed up to 9.2% in June, the highest level since November 2010. Revisions to payroll data for the third quarter of 2011 show that job creation was better than expected, at approximately 691,000 new jobs, leading to a 9.1% unemployment rate for the quarter. In October, the unemployment rate declined slightly to 9.0%. It is estimated that the unemployment rate will average 9.04% in 2012 and will drop to below 7.0% by 2015.
22
Interest Rate Environment and Global Economic Trends
U.S. interest rates remain historically low. In fact, a flight to quality led U.S. Treasury yields to drop sharply in May 2011, continuing to decline through November. Poor labor markets, signs of a global economic slowdown, rising capital and liquidity requirements for banks, and most notably an escalation of the Euro-zone sovereign debt crisis, are all contributing to investors becoming more risk averse. Based on these trends, the Federal Open Market Committee (“FOMC”) announced in August that it will keep interest rates exceptionally low through mid-2013.
Due to increasing market uncertainty in the latter half of 2010, the Federal Reserve (“Fed”) was forced to revive some of its purchase programs to inject liquidity into the financial system. In August 2010, the Fed introduced a variety of quantitative easing measures (also known as “QE2”) to support the U.S. economy, a program that was completed at the end of June 2011, as scheduled. In September 2011, the Fed announced plans to purchase $400 billion of Treasury securities, as part of a new package of measures intended to drive down long-term interest rates and revive the economy (known as “Operation Twist”). Congress enacted the Budget Control Act of 2011 in early August, preventing a technical default on U.S. government debt. Citing political uncertainty, Standard & Poor’s reduced the United States’ historical credit rating of AAA to AA+. Significant deficit reduction decisions were slated to November 2011, such as the extension of the payroll tax reduction and unemployment benefits, but a political agreement remains uncertain.
Geopolitical and economic uncertainty is also very high across the globe. Increased concerns about the possibility of a global sovereign debt crisis first surfaced in February-March 2010 due to investors’ reactions to swelling budget deficits in several Euro-zone member states, especially in Greece. The European Union (“EU”) and the International Monetary Fund (“IMF”) first approved a bailout package for Greece in May 2010. Continued political indecision contributed to a series of downgrades by the three major credit rating agencies. Both Ireland (November 2010) and Portugal (April 2011) were forced to request similar EU-IMF bailouts. In a surprise decision, the European Central Bank (“ECB”) decreased its key benchmark rate by 25 basis points in November 2011, reversing its July 2011 hike. In July 2011, EU politicians approved a tentative restructuring of Greece’s debt, pursuant to a second bailout agreement. However, markets did not react positively and the crisis spread to Spain and Italy, which are considered by markets as “too big to fail”.
23
As a result, the ECB was forced to provide additional liquidity to banks and to reenact its government bonds purchase program. The discussions to further restructure Greek debt were reopened, adding more volatility to markets. In November, the Fed announced an extension of U.S. dollar liquidity swap arrangements with several central banks across the world, including the ECB, as a part of a coordinated central bank intervention. These events increased dramatically the volatility of sovereign bond yields of periphery Euro-zone nations.
U.S. Geothermal Market Update
Introduction
The Geothermal Energy Association (“GEA”) expects geothermal industry growth to continue for the foreseeable future. In the U.S., there are approximately 3,100 MW of geothermal power currently in production in nine states: Alaska, California, Hawaii, Idaho, Nevada, New Mexico, Oregon, Utah and Wyoming, with planned expansion in several other states. Geothermal companies continue to explore and develop geothermal resources at a growing number of sites throughout the United States. An increasing number of Geothermal projects are located in California and especially Nevada, where strong state policies and a geothermal friendly regulatory structure support strong industry growth. Overall, strong state renewable portfolio standards, federal tax incentives, and stimulus funding continue to drive growth in the geothermal industry. With 95% of geothermal projects receiving American Recovery and Reinvestment Act (“ARRA”) funding still being less than 50% complete, GEA anticipates that stimulus funding will continue to be a significant driver behind geothermal development through 2011.
Industry Growth Trends and Future Development
The total number of geothermal projects-underdevelopment, as well as geothermal prospects, reported in 2011 increased 12% over 2010. While developing projects in final stages of construction and completion is expected to be down from 2009 levels, GEA anticipates the number of advanced stage projects to rebound to new highs in 2011.
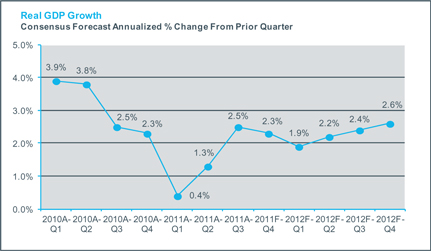
Within the United States, most geothermal reservoirs are located in the western states, Alaska, and Hawaii. Wells, in these areas, can be drilled into underground reservoirs for the generation of electricity, with a high probability of success and longevity. According to development companies within the industry, new projects were identified under development in 15 states: Nevada,
24
California, Utah, Idaho, Oregon, Alaska, Louisiana, Hawaii, New Mexico, Arizona, Colorado, Mississippi, Texas, Washington, and Wyoming in-spite of the economic downturn and risk-averse investors. As indicated in Figure 1 below, Nevada and California maintain to be leaders in geothermal power development. In the past few years, Nevada has overtaken California in the number and capacity (MW) of geothermal power projects under development primarily due to strong state policies supporting new geothermal growth, as well as, limited bureaucratic requirements.
Figure 1: Developing Projects by State and Phase, Source: GEA
Developers of geothermal facilities are progressively exploring for new areas where little or no previous development has taken place. Of the projects identified by the GEA, approximately 76% of them are developing conventional hydrothermal geothermal resources in unproduced areas. In addition to the development of conventional geothermal resources, the GEA 2011 Annual Report identifies five geothermal and hydrocarbon coproduction projects, four enhanced geothermal systems projects, and one geo-pressured resource development project.
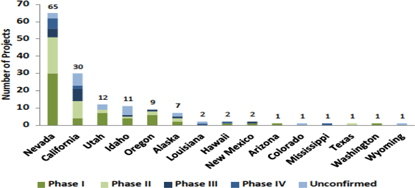
Due to state and governmental support, several large Utility providers have ventured into geothermal and related projects. However, in 2010 only one company, Nevada based Ormat Technologies, brought a new power plant online, a 15MW plant in Jersey Valley, Nevada. This increased total US installed capacity to 3102 MW. Although the amount of geothermal capacity brought online in 2010 did not reach levels attained in previous years, the geothermal industry is positioned to bring a significant amount of geothermal electricity to the grid in the near future. The Annual Report issued by the GEA, mentioned above, notates approximately 756-772 MW of new capacity that are in the drilling/construction phases, as shown in figure 2 below; and should be completed over the next few years.
25
Figure 2: Advanced Phase Project Development 2006 – 2011, Source: GEA
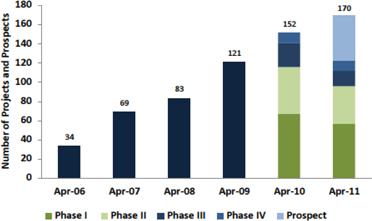
As of the second quarter of 2011, the GEA identified 170 projects in different stages of development in fifteen states which could produce as much as 7,875 MW of new electric power. This increase in the number of projects in development represents a 25% growth in the number of new projects under development in the United States between May 2009 and April 2010. Despite a slow-down in projects reaching the final construction phase, the long-term growth trend for new geothermal projects continues. Figure 3 highlights the growth in geothermal projects identified by GEA between 2006 and 2011.
Figure 3: Total Confirmed Projects 2006-2011, Source: GEA
26
Federal Incentives and Drivers of Development
Increased progress in the development of geothermal projects has been fueled by federal incentives and funding which help offset the risk and high capital cost of development. Subject to certain criteria, geothermal power projects are eligible for the full Production Tax Credit (“PTC”) if placed in service by December 31, 2013. Additionally, the American Recovery and Reinvestment Act of 2009 (“ARRA”) has made projects eligible for the PTC also eligible for a grant in lieu of the tax credit from the Treasury Department. Section 1603 of the ARRA allows developers of geothermal power plants the option of applying for the Investment Tax Credit (“ITC”) cash grant. The grant is equivalent to a 30% tax credit for the eligible portions of their capital investment.
Projects which are in construction by the end of calendar year 2011 and are placed in service by the end of calendar year 2013 may receive the cash grant. Geothermal developers have cited the cash grant as a particularly important factor in sustaining development through the economic recession. Since 2009 approximately $262.9M and $4.6M in cash grants have been provided to utility-scale geothermal projects and geothermal heat pump projects respectively. Projects receiving cash grants span 19 different states.
The ITC cash grant was included in the ARRA in response to the decreasing number of tax equity investors following the global credit crisis which began in 2008, as well as the fact that tax credits for many developers became less valuable in light of decreasing profits, and consequently shrinking tax burdens.
Many geothermal developers are building several projects in the US, and the cash grant provides them an effective incentive that quickly reduces their debt – an important factor in the present economic recession. In addition, four of the top five states with geothermal power under development have substantial renewable standards. Those states in order of geothermal development and their state renewable requirement are: 1) Nevada (25%), 2) California (33%), 3) Utah (20%), 4) Idaho (none), and 5) Oregon (25%).
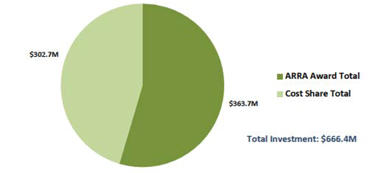
Department of Energy (“DOE”) federal stimulus legislation funding is also having an important influence on the US geothermal market. As part of the ARRA section 1705, the DOE has offered loan guarantees for eligible projects. In October 2009, the DOE also announced the results of its competitive solicitation under ARRA for geothermal technology projects. DOE announced awards that could result in up to $338 million in ARRA funding to geothermal research and development, and would require an additional $280 million in recipient cost-share. As of June 2010, ARRA awards administered through the DOE Geothermal
27
Technologies Program (“GTP”) totaled nearly $363.5 million. Total cost share contributes an additional $362.4M, bringing the combined ARRA/cost share geothermal technology investment to more than $725.88M. The vast majority of projects that have yet to be completed indicate that much of this total will be spent in the coming year, boosting job growth within the geothermal sector.
Total DOE GTP ARRA/Cost-Share Geothermal Investment, Source: GEA
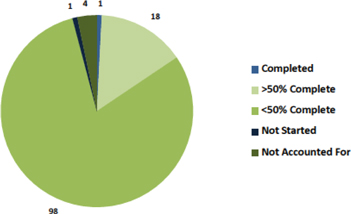
A review of GTP ARRA awards reveals that the impact of stimulus funding has not yet peaked for geothermal. At the end of 2010, of the 122 projects receiving ARRA funding through the DOE GTP: 1 has been completed, 18 are more than 50% complete, 98 are less than 50% complete, 1 has not been started, and 4 are unaccounted for on Recovery.gov.
Figure 5: ARRA Funded Geothermal Project Progress, Source: GEA
28
As indicated in Figure 5, about 98% of the projects receiving ARRA funding are either less than 50% complete. With the majority of ARRA funded projects still in early stages of development, GEA anticipates that much of this total will be spent in the coming years, boosting job growth within the geothermal sector.
Industry Outlook
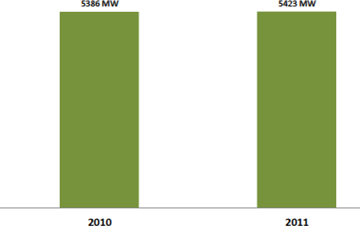
In 2010 approximately 4,407 – 6,365 MW of geothermal resources were under development by geothermal companies, while the industry reported approximately 5102 – 5745 MW of geothermal development in 2011. Figure 6 below, outlines the median values for geothermal capacity under development in 2010 and 2011 as 5386 MW and 5423 MW respectively, indicating that the median total geothermal MW under development remains steady. This does not include 18 geothermal prospects whose potential contribution is not estimated.
Figure 6: 2010 and 2011 Average Capacity (MW) Development Comparison, Source: GEA
29
Chapter E - Valuation
1.1 General
In our estimation of Fair Value we consider the income approach. The income approach is a valuation technique that provides an estimation of the Fair Value of an asset based on market participant expectations about the cash flows that an asset would generate over its remaining useful life. The Income Approach begins with an estimation of the annual cash flows a market participant would expect the subject asset (or business) to generate over a discrete projection period. The estimated cash flows for each of the years in the discrete projection period are then converted to their present value equivalent using a rate of return appropriate for the risk of achieving the projected cash flows. The present value of the estimated cash flows are then added to the present value equivalent of the residual value of the asset (if any) or the business at the end of the discrete projection period to arrive at an estimate of Fair Value.
In some situations, the expected cash flow approach is a more effective measurement tool than the traditional approach. In developing a measurement, the expected cash flow approach uses all expectations about possible cash flows, taking into consideration assumed probabilities of future events and/or future scenarios, instead of the single cash flow scenario.
1.2 Application of the Income Approach in this analysis
To estimate the Fair Value of North Brawley under IAS 36, a DCF analysis was utilized. Under IFRS – IAS 36, an asset is considered to be impaired if the carrying value of the asset is greater than its estimated Fair Value. The impairment is recorded in the amount by which the carrying value exceeds the Fair Value of the asset.
In consideration of the current long term power purchase contract negotiations being currently undertaken by the Company, and as requested by the Company, the analysis has been conducted using the expected cash flow approach. To estimate a value for the long-lived assets we conducted a probability-weighted valuation analysis pertaining to the Third Party Off-taker and SCE
30
pricing scenarios (further elaborated below) provided by the Company. Additionally, since the exact generation of the facility could not be calculated due to recent construction and addition of new wells, as mentioned in the Subject Asset description (see Chapter C), we used high probability and low probability generation assumptions under each of the two pricing scenarios (Third Party Off-taker and SCE), each with four power generation capacity cases; a 37MW case, a 40MW case, a 45MW case, and a 50MW case (collectively 8 cases).
The Fair Value of the assets of North Brawley as of the Valuation Date was therefore estimated by:
| | • | | Determining operational characteristics of the Plant’s four generation scenarios; a 37MW, a 40MW, a 45MW, and a 50MW scenario |
| | • | | Forecasting revenues and variable operating costs as applicable, including energy prices for the electric output under two pricing scenarios (Third Party Off-taker and SCE) |
| | • | | Forecasting fixed expenses and capital expenditures as applicable for each case |
| | • | | Performing a DCF analysis for each generation case under each pricing scenario. The DCF for each generation case was then assigned a probability, estimated by the Company’s management, and thereafter each pricing scenario was assigned a probability, based on the Company’s estimates of its probability to materialize. The Fair Value was then calculated by summing the total weighted expected value of all cases |
| 2. | North Brawley Valuation |
2.1 Valuation Scenarios
Based on the uncertainty of events related to the current negotiations on the proposed PPA, as of the Valuation Date, the North Brawley valuation analysis has been performed by probability weighting of two pricing scenarios – Third Party Off-taker and SCE scenarios. For the Third Party Off-taker Scenario, based on the Company’s estimates, an 80% probability is considered, while for the SCE Scenario, a 20% probability is considered. The two pricing scenarios provided by management are described below:
| | • | | Third Party Off-taker Scenario: This scenario constitutes the implementation of a long term PPA (currently being negotiated) with Third Party Off-taker as of 2012, whereby new contractual terms would be established for North Brawley. |
31
| | It is expected that final risk allotment and other salient business issues of the PPA will be similar to a PPA the Company recently signed in December 2011 for a separate solar project whose pricing is similar to the pricing proposed for North Brawley. Under this Scenario, the company expects to: |
| | • | | Subject to SCE approval, have the option to move the current PPA to a new project (the aggregation of ORMESA #1, ORMESA #2 and GEM facilities collectively referred to as the “ORMESA facility” or “ORMESA”) |
| | • | | Establish the Holiday Period in form of a letter agreement which begins on a date that is no later than one month from the date of the Company’s notice to SCE of their election to begin the Holiday Period (hereinafter the “Commencement of the Holiday Period”) and ends on the later of: |
| | (i) | Five years from the Commencement of the Holiday Period; or |
| | (ii) | Upon the completion of the term of the ORMESA Standard Offer PPA which is 11/30/2017 |
| | • | | Receive higher contracted prices with Third Party Off-taker |
| | • | | Not incur generation related PPA penalties previously forecasted with SCE |
| | • | | SCE Scenario:This scenario, is based on the existing PPA dated June, 2007 with SCE, it is reflective of the current obligations of the Company to SCE and as such, is curtailed around the prevailing market conditions of the time at which it was put into effect. Under this Scenario, Management is obligated to: |
| | • | | Minimum generation commitment |
| | • | | Contracted prices that are significantly lower than the proposed Third Party Off-taker case |
| | • | | Penalties in the event of non-compliance |
2.2 Key assumptions
2.2.1 Operating Characteristics
As of the Valuation Date the plant had a well field capacity of approximately 35MW of electricity. However, as detailed in the Subject Asset description (see Chapter C), management’s assessment of the potential of the field remains unchanged and it believes that the generation targets of 45MW to 50MW that it has used in the past are still valid. Based on management’s technical analysis and operational plan, management assigned probabilities for the different generation cases, as follows: (1) 50MW – 12.5% probability; (2) 45MW – 12.5% probability; (3) 40MW – 25% probability; and (4) 37MW – 50% probability.
32
2.2.2 Production and Revenues
The Company’s management provided production estimates and forecasts for each of the four generation cases considered in this analysis, which were considered to be reasonable and appropriate. Revenues were then derived by assuming the average realized price, provided by management, and in accordance with the PPA terms in each price scenario (Third Party Off-taker and SCE) as follows:
| | • | | SCE Pricing Scenario – reflects the current pricing including seasonality adjustment under the 20 year contract with SCE. Thereafter, in 2031, a replacement contract was assumed using equivalent MPR pricing of $101.7/MWh escalated thereafter by ~1% (in line with the recently released 2011 MPR pricing model). |
| | • | | New Off taker Pricing Scenario (Third Party Off-taker) – reflects the proposed 3rd party off taker pricing scenario with the proposed pricing escalated through the life of the generation facility. |
2.2.3 Operating Costs
The Company provided D&P and GSE with forecasted fixed and variable operating expenses, including costs such as plant operating expenses, utilities, insurance, royalties, and administrative expenses through year 2040 for the Subject Assets in all four generation scenarios. Management’s estimates and forecast of operating costs were based on its experience in the operations of the North-Brawley plant and similar geothermal facilities. Variable costs were determined based on estimates of actual material, equipment and services required to operate the Plant subject to assumed production in each generation scenario. Fixed operating costs, primarily labor, were based on the company experience in the operation of the Plant and similar facilities. To adjust these cost estimates to inflation, we have used a 2% long term inflation rate in all generation cases and in both pricing scenarios.
Property taxes, based on managements’ guidance, were calculated as 1% of the property value in each of the generation and pricing scenarios.
33
2.2.4 Capital Expenditures
The Company provided D&P and GSE with forecasted capital expenditures through year 2040 for the Subject Assets in all four generation scenarios. Management’s estimates and forecast of capital expenditures were based on its experience in the operations of the North-Brawley plant and similar geothermal facilities. Capital expenditures varied in the different generation scenarios to reflect further investments required to achieve increased generation capacity.
To adjust these cost estimates to inflation, we have used a 2% long term inflation rate in all generation cases and in both pricing scenarios.
2.2.5 Depreciation
Positive cash flow is generated by the tax shield that arises from tax depreciation charges that reduce the amount of taxes paid. To arrive at Fair Value from a market participant view, the Plant has been valued assuming an asset purchase, which means that, for U.S. tax purposes, the price paid becomes the new tax basis of the acquired asset (i.e. the tax basis is adjusted to the value or price paid of the acquired asset). We calculated the depreciation step-up using a 5-year MACRS half-year schedule applicable to geothermal facilities. Additionally, we have also included the allowed tax exemption in the amount of 3.55% of the concluded Fair Value in the analysis. The total plant and impairment loss depreciation benefit was limited to the Plant’s existing tax basis (approximately $300 million).
As the concluded Fair Value includes the value of the future tax benefits, we used an iterative process to arrive at the Fair Value of the Plant, and used the Fair Value as the assumed tax basis for all cases.
2.2.6 Tax
We utilized the corporate tax rate that a market participant that will operate the assets at their highest and best use would be expected to incur, and which is not necessarily the tax rate that is incurred by the Company or the Plant. The tax rate that we therefore used in our analysis is 40.75%.
2.2.7 Working Capital
In accordance with our assumptions in the past, we assumed 30 receivable days and 30 payable days to calculate the expected change in working capital.
34
2.3Weighted Average Cost Of Capital (WACC)
2.3.1 General
In accordance with the standard guidelines, the discount rate should reflect current market estimates of:
a. The time value of money;
b. Specific risks with respect to which the cash flows were adjusted
The discount rate reflects, among other things, the business-operating risk inherent in the company’s activities. Some of the risk is attributed to the nature of the market sector in which the company operates, and some of it stems from specific characteristics of the company.
The Weighted Average Cost of Capital used in this analysis is 8% based on the following calculation, and in-line with the weighted average cost of capital used in previous years.
2.3.1 Cost of Equity
The following table presents the sum of the key parameters that we used in calculating the Cost of Equity (Ke):
Estimation of the Cost of Equity
| | | | | | | | |
Risk Free Rate (nominal) | | | 3.03 | % | | | 1 | |
Market Risk Premium | | | 6.04 | % | | | 2 | |
Re-levered Beta | | | 1.33 | | | | 3 | |
Risk Premium | | | 1.98 | % | | | 4 | |
Cost of Equity | | | 12.7 | % | | | | |
Notes to the table:
| | (1) | The nominal rate of return on a US government bond2 for a 30-year period. |
| | (2) | Average difference between the annual real return on stock indexes and the risk free interest in the U.S3. |
| | (3) | To determine the Company’s beta, we examined a group of companies in the same field of business. We chose companies with similar features as the Company. Following is a list of peer companies used for calculating the beta4: |
Calculation of Levered Beta by Peer Companies:
| | | | | | | | | | | | |
Company | | Levered Beta | | | Unlevered Beta | | | D/V | |
Calpine Corp. | | | 1.30 | | | | 0.76 | | | | 0.54 | |
Ram Power Corp. | | | 1.15 | | | | 0.68 | | | | 0.53 | |
US Geothermal Inc. | | | 1.58 | | | | 0.81 | | | | 0.62 | |
Nevada Geothermal Power Inc. | | | 1.79 | | | | 1.79 | | | | 0.00 | |
Alterra power corp. | | | 1.21 | | | | 0.92 | | | | 0.31 | |
Ormat Technologies Inc. | | | 1.15 | | | | 0.67 | | | | 0.55 | |
Median | | | 1.26 | | | | 0.78 | | | | 0.54 | |
| 2 | Source: Federal Reserve – www.federalreserve.gov/Releases/H15/Current. |
| 3 | Source: Study published by Damodaran (as of December 2011) – http://pages.stern.nyu.edu/~adamodar |
35
(4) The specific risk premium, relevant to the size of the company in market of operation5.
2.3.3 WACC - Summary
Parameters for Calculating the WACC
| | | | | | |
Parameter | | Value | | | Comments |
Risk-free Rate | | | 3.03 | % | | |
Relevered Beta | | | 1.33 | | | 1 |
Market Risk Premium | | | 6.04 | % | | |
The Cost of Equity | | | 12.7 | % | | |
Cost of Debt | | | 6.75 | % | | 2 |
Tax rate | | | 40.75 | % | | |
D/V | | | 54 | % | | 3 |
WACC | | | 8.2 | % | | |
Notes to the table:
| | 1. | Re-levered beta based on the assumed D/E ratio and tax rate |
| | 2. | Based on the coupon rate set on the company’s bonds. |
| | 3. | The median Debt-to-Value ratio of comparable companies |
3.1Fair Value
Based on probabilities provided by the Company’s Management, the Fair Value of North Brawley is estimated at $157.8 million (pre disposal costs), as exemplified below:
| | | | | | | | | | | | | | | | | | | | | | | | | | | | |
Case | | Third Party
Off-taker
DCF | | | Weighting | | | SCE DCF | | | Weighting | | | Probability
weighted
Valuation | | | Case
Weighting | | | Expected
Value | |
37MW Case | | | 157,928 | | | | 80 | % | | | 83,676 | | | | 20 | % | | | 143,077 | | | | 50 | % | | | 71,539 | |
40MW Case | | | 169,852 | | | | 80 | % | | | 91,407 | | | | 20 | % | | | 154,163 | | | | 25 | % | | | 38,541 | |
45MW Case | | | 197,892 | | | | 80 | % | | | 121,338 | | | | 20 | % | | | 182,581 | | | | 12.5 | % | | | 22,823 | |
50MW Case | | | 213,683 | | | | 80 | % | | | 139,922 | | | | 20 | % | | | 198,931 | | | | 12.5 | % | | | 24,866 | |
| | | | | | | | | | | | | | | | | | | | | | | | | | | | |
Total | | | | | | | | | | | | | | | | | | | | | | | 100 | % | | | 157,769 | |
| | | | | | | | | | | | | | | | | | | | | | | | | | | | |
3.2Disposal Costs
Based on discussions with the Company’s Management we assumed disposal costs estimated at 1% of the Fair Value, totaling approximately 1.57 Million $.
| 5 | According to data published in Ibbotson (December, 2011). |
36
3.3Conclusion
Therefore we estimate that the Fair Value of North Brawley, less costs to sell, is 156.2 Million $.
3.4Sensitivity Analysis
3.4.1Sensitivity to the WACC
We have performed a sensitivity analysis for the value of North Brawley, less costs to sell, with respect to the weighted average cost of capital as follows:
| | | | | | | | | | | | | | | | | | | | |
WACC | | | 7.00 | % | | | 7.50 | % | | | 8.00 | % | | | 8.50 | % | | | 9.00 | % |
Fair Value (less costs to sell) | | | 167.6 | | | | 161.7 | | | | 156.2 | | | | 151.0 | | | | 146.2 | |
3.4.2Sensitivity - probability weighting - Third Party Off-taker vs. SCE pricing scenarios
We have performed a sensitivity analysis for the value of North Brawley, less costs to sell, with respect to the probability weighting of the Third Party Off-taker vs. SCE pricing scenarios, as follows:
| | | | | | | | | | | | | | | | | | | | |
Probability SCE / Third Party Off taker | | | 40%/60 | % | | | 30%/70 | % | | | 20%/80 | % | | | 10%/90 | % | | | 0%/100 | % |
Fair Value (less costs to sell) | | | 141.2 | | | | 148.7 | | | | 156.2 | | | | 163.7 | | | | 171.2 | |
37
Chapter F - Exhibits
| 1. | Discounted Cash Flow Analysis - Third Party Off-taker 37MW Scenario |
North Brawley
| | | | |
Depreciation Life | | | 5-Year MACRS | |
Remaining Life | | | 29 | |
Existing Discount Rate | | | 8.00 | % |
Tax Rate | | | 40.75 | % |
Net Capacity (MW) | | | Third Party Off-taker 37 | |
| | | | | | | | | | | | | | | | | | | | | | | | | | | | | | | | | | | | | | | | | | | | | | | | | | | | | | | | | | | | | | | | | | | | |
| | | | | | | | | 2011 | | | 2012 | | | 2013 | | | 2014 | | | 2015 | | | 2016 | | | 2017 | | | 2018 | | | 2019 | | | 2020 | | | 2021 | | | 2022 | | | 2023 | | | 2024 | | | 2025 | |
Total Revenue | | | | | | | | | | | — | | | | 23,594 | | | | 30,805 | | | | 30,958 | | | | 31,111 | | | | 31,265 | | | | 31,420 | | | | 31,575 | | | | 31,732 | | | | 31,889 | | | | 32,047 | | | | 32,205 | | | | 32,365 | | | | 32,525 | | | | 32,686 | |
| | | | | | | | | | | | | | | | | |
Total Operating Costs | | | | | | | | | | | — | | | | 17,379 | | | | 15,901 | | | | 15,958 | | | | 16,089 | | | | 16,272 | | | | 16,452 | | | | 16,673 | | | | 16,938 | | | | 17,207 | | | | 17,480 | | | | 17,758 | | | | 18,041 | | | | 18,328 | | | | 18,619 | |
| | | | | | | | | | | | | | | | | |
EBITDA | | | | | | | | | | | — | | | | 6,216 | | | | 14,904 | | | | 15,000 | | | | 15,022 | | | | 14,993 | | | | 14,968 | | | | 14,903 | | | | 14,794 | | | | 14,682 | | | | 14,566 | | | | 14,447 | | | | 14,324 | | | | 14,197 | | | | 14,067 | |
| | | | | | | | | | | | | | | | | |
Depreciation | | | | | | | | | | | — | | | | 39,080 | | | | 60,285 | | | | 38,857 | | | | 26,009 | | | | 26,142 | | | | 16,485 | | | | 6,773 | | | | 6,794 | | | | 6,817 | | | | 6,839 | | | | 6,863 | | | | 6,886 | | | | 6,910 | | | | 6,935 | |
| | | | | | | | | | | | | | | | | | | | | | | | | | | | | | | | | | | | | | | | | | | | | | | | | | | | | | | | | | | | | | | | | | | | |
| | | | | | | | | | | | | | | | | |
EBIT | | | | | | | | | | | — | | | | (33,464 | ) | | | (45,381 | ) | | | (23,857 | ) | | | (10,987 | ) | | | (11,148 | ) | | | (1,518 | ) | | | 8,130 | | | | 8,000 | | | | 7,865 | | | | 7,727 | | | | 7,584 | | | | 7,438 | | | | 7,287 | | | | 7,132 | |
| | | | | | | | | | | | | | | | | | | | | | | | | | | | | | | | | | | | | | | | | | | | | | | | | | | | | | | | | | | | | | | | | | | | |
| | | | | | | | | | | | | | | | | |
Income Tax | | | | | | | 40.7 | % | | | — | | | | (13,635 | ) | | | (18,491 | ) | | | (9,721 | ) | | | (4,477 | ) | | | (4,543 | ) | | | (618 | ) | | | 3,313 | | | | 3,260 | | | | 3,205 | | | | 3,148 | | | | 3,090 | | | | 3,031 | | | | 2,969 | | | | 2,906 | |
| | | | | | | | | | | | | | | | | | | | | | | | | | | | | | | | | | | | | | | | | | | | | | | | | | | | | | | | | | | | | | | | | | | | |
After-tax Operating Profit | | | | | | | | | | | — | | | | (19,829 | ) | | | (26,890 | ) | | | (14,136 | ) | | | (6,510 | ) | | | (6,606 | ) | | | (899 | ) | | | 4,817 | | | | 4,740 | | | | 4,660 | | | | 4,578 | | | | 4,494 | | | | 4,407 | | | | 4,318 | | | | 4,226 | |
| | | | | | | | | | | | | | | | | |
Plus: (Increase)/Decrease in Working Capital | | | | | | | | | | | — | | | | (518 | ) | | | (724 | ) | | | (8 | ) | | | (2 | ) | | | 2 | | | | 2 | | | | 5 | | | | 9 | | | | 9 | | | | 10 | | | | 10 | | | | 10 | | | | 11 | | | | 11 | |
Less: CAPEX | | | | | | | | | | | — | | | | (10,000 | ) | | | (1,025 | ) | | | (1,046 | ) | | | (1,066 | ) | | | (1,088 | ) | | | (1,109 | ) | | | (1,132 | ) | | | (1,154 | ) | | | (1,177 | ) | | | (1,201 | ) | | | (1,225 | ) | | | (1,249 | ) | | | (1,274 | ) | | | (1,300 | ) |
Plus: Depreciation Benefit | | | | | | | | | | | | | | | 39,680 | | | | 60,285 | | | | 38,857 | | | | 26,009 | | | | 26,142 | | | | 16,485 | | | | 6,773 | | | | 6,794 | | | | 6,817 | | | | 6,839 | | | | 6,863 | | | | 6,886 | | | | 6,910 | | | | 6,935 | |
| | | | | | | | | | | | | | | | | | | | | | | | | | | | | | | | | | | | | | | | | | | | | | | | | | | | | | | | | | | | | | | | | | | | |
Free Cash Flow from Operations | | | | | | | | | | | — | | | | 9,333 | | | | 31,646 | | | | 23,667 | | | | 18,430 | | | | 18,450 | | | | 14,479 | | | | 10,464 | | | | 10,389 | | | | 10,309 | | | | 10,226 | | | | 10,142 | | | | 10,054 | | | | 9,964 | | | | 9,872 | |
PV of Free Cash Flow from Operations | | | | | | | | | | | | | | | 8,981 | | | | 28,196 | | | | 19,525 | | | | 14,078 | | | | 13,050 | | | | 9,482 | | | | 6,345 | | | | 5,833 | | | | 5,359 | | | | 4,923 | | | | 4,520 | | | | 4,149 | | | | 3,808 | | | | 3,493 | |
| | | | | | | | | | | | | | | | | |
Sum of PV of Free Cash Flow from Operations | | | 157,928 | | | | | | | | | | | | | | | | | | | | | | | | | | | | | | | | | | | | | | | | | | | | | | | | | | | | | | | | | | | | | | | | | |
38
North Brawley
| | | | |
Depreciation Life | | | 5-Year MACRS | |
Remaining Life | | | 29 | |
Existing Discount Rate | | | 8.00 | % |
Tax Rate | | | 40.75 | % |
Net Capacity (MW) | | | Third Party Off-taker 37 | |
| | | | | | | | | | | | | | | | | | | | | | | | | | | | | | | | | | | | | | | | | | | | | | | | | | | | | | | | | | | | | | | | | | | | |
| | | | | | | | | 2026 | | | 2027 | | | 2028 | | | 2029 | | | 2030 | | | 2031 | | | 2032 | | | 2033 | | | 2034 | | | 2035 | | | 2036 | | | 2037 | | | 2038 | | | 2039 | | | 2040 | |
Total Revenue | | | | | | | | | | | 32,848 | | | | 33,010 | | | | 33,174 | | | | 33,338 | | | | 33,503 | | | | 33,669 | | | | 33,835 | | | | 34,003 | | | | 34,171 | | | | 34,340 | | | | 34,510 | | | | 34,681 | | | | 34,853 | | | | 35,025 | | | | 35,199 | |
| | | | | | | | | | | | | | | | | |
Total Operating Costs | | | | | | | | | | | 18,915 | | | | 19,215 | | | | 19,520 | | | | 19,829 | | | | 20,143 | | | | 20,461 | | | | 20,783 | | | | 21,110 | | | | 21,440 | | | | 21,775 | | | | 22,135 | | | | 22,504 | | | | 22,880 | | | | 23,261 | | | | 23,649 | |
| | | | | | | | | | | | | | | | | |
EBITDA | | | | | | | | | | | 13,933 | | | | 13,795 | | | | 13,653 | | | | 13,508 | | | | 13,360 | | | | 13,208 | | | | 13,052 | | | | 12,893 | | | | 12,731 | | | | 12,565 | | | | 12,375 | | | | 12,177 | | | | 11,973 | | | | 11,764 | | | | 11,550 | |
| | | | | | | | | | | | | | | | | |
Depreciation | | | | | | | | | | | 6,960 | | | | 6,986 | | | | 7,012 | | | | 7,038 | | | | 7,066 | | | | 7,093 | | | | 7,122 | | | | 7,150 | | | | 7,180 | | | | 2,497 | | | | 1,560 | | | | 1,592 | | | | 1,623 | | | | 1,656 | | | | 4,681 | |
| | | | | | | | | | | | | | | | | | | | | | | | | | | | | | | | | | | | | | | | | | | | | | | | | | | | | | | | | | | | | | | | | | | | |
| | | | | | | | | | | | | | | | | |
EBIT | | | | | | | | | | | 6,973 | | | | 6,809 | | | | 6,642 | | | | 6,470 | | | | 6,294 | | | | 6,114 | | | | 5,930 | | | | 5,743 | | | | 5,551 | | | | 10,068 | | | | 10,815 | | | | 10,585 | | | | 10,349 | | | | 10,108 | | | | 6,869 | |
| | | | | | | | | | | | | | | | | | | | | | | | | | | | | | | | | | | | | | | | | | | | | | | | | | | | | | | | | | | | | | | | | | | | |
| | | | | | | | | | | | | | | | | |
Income Tax | | | | | | | 40.7 | % | | | 2,841 | | | | 2,774 | | | | 2,706 | | | | 2,636 | | | | 2,565 | | | | 2,491 | | | | 2,416 | | | | 2,340 | | | | 2,262 | | | | 4,102 | | | | 4,407 | | | | 4,313 | | | | 4,217 | | | | 4,119 | | | | 2,799 | |
| | | | | | | | | | | | | | | | | | | | | | | | | | | | | | | | | | | | | | | | | | | | | | | | | | | | | | | | | | | | | | | | | | | | |
After-tax Operating Profit | | | | | | | | | | | 4,132 | | | | 4,035 | | | | 3,935 | | | | 3,834 | | | | 3,730 | | | | 3,623 | | | | 3,514 | | | | 3,403 | | | | 3,289 | | | | 5,965 | | | | 6,408 | | | | 6,272 | | | | 6,132 | | | | 5,989 | | | | 4,070 | |
| | | | | | | | | | | | | | | | | |
Plus: (Increase)/Decrease in Working Capital | | | | | | | | | | | 11 | | | | 11 | | | | 12 | | | | 12 | | | | 12 | | | | 13 | | | | 13 | | | | 13 | | | | 14 | | | | 14 | | | | 16 | | | | 17 | | | | 17 | | | | 17 | | | | 980 | |
Less: CAPEX | | | | | | | | | | | (1,326 | ) | | | (1,352 | ) | | | (1,380 | ) | | | (1,407 | ) | | | (1,435 | ) | | | (1,464 | ) | | | (1,493 | ) | | | (1,523 | ) | | | (1,554 | ) | | | (1,585 | ) | | | (1,616 | ) | | | (1,649 | ) | | | (1,682 | ) | | | (1,715 | ) | | | (1,750 | ) |
Plus: Depreciation Benefit | | | | | | | | | | | 6,960 | | | | 6,986 | | | | 7,012 | | | | 7,038 | | | | 7,066 | | | | 7,093 | | | | 7,122 | | | | 7,150 | | | | 7,180 | | | | 2,497 | | | | 1,560 | | | | 1,592 | | | | 1,623 | | | | 1,656 | | | | 4,681 | |
| | | | | | | | | | | | | | | | | | | | | | | | | | | | | | | | | | | | | | | | | | | | | | | | | | | | | | | | | | | | | | | | | | | | |
Free Cash Flow from Operations | | | | | | | | | | | 9,777 | | | | 9,679 | | | | 9,580 | | | | 9,477 | | | | 9,372 | | | | 9,265 | | | | 9,155 | | | | 9,043 | | | | 8,929 | | | | 6,892 | | | | 6,368 | | | | 6,232 | | | | 6,091 | | | | 5,948 | | | | 7,982 | |
PV of Free Cash Flow from Operations | | | | | | | | | | | 3,203 | | | | 2,936 | | | | 2,691 | | | | 2,465 | | | | 2,257 | | | | 2,066 | | | | 1,890 | | | | 1,729 | | | | 1,580 | | | | 1,130 | | | | 966 | | | | 876 | | | | 792 | | | | 716 | | | | 890 | |
| | | | | | | | | | | | | | | | | |
Sum of PV of Free Cash Flow from Operations | | | 157,928 | | | | | | | | | | | | | | | | | | | | | | | | | | | | | | | | | | | | | | | | | | | | | | | | | | | | | | | | | | | | | | | | | |
39
| 2. | Discounted Cash Flow Analysis - Third Party Off-taker 40MW Scenario |
North Brawley
| | | | |
Depreciation Life | | | 5-Year MACRS | |
Remaining Life | | | 29 | |
Existing Discount Rate | | | 8.00 | % |
Tax Rate | | | 40.75 | % |
Net Capacity (MW) | | | Third Party Off-taker 40 | |
| | | | | | | | | | | | | | | | | | | | | | | | | | | | | | | | | | | | | | | | | | | | | | | | | | | | | | | | | | | | | | | | | | | | |
| | | | | | | | | 2011 | | | 2012 | | | 2013 | | | 2014 | | | 2015 | | | 2016 | | | 2017 | | | 2018 | | | 2019 | | | 2020 | | | 2021 | | | 2022 | | | 2023 | | | 2024 | | | 2025 | |
Total Revenue | | | | | | | | | | | — | | | | 23,594 | | | | 33,303 | | | | 33,468 | | | | 33,634 | | | | 33,800 | | | | 33,967 | | | | 34,135 | | | | 34,304 | | | | 34,474 | | | | 34,645 | | | | 34,816 | | | | 34,989 | | | | 35,162 | | | | 35,336 | |
| | | | | | | | | | | | | | | | | |
Total Operating Costs | | | | | | | | | | | — | | | | 17,379 | | | | 16,416 | | | | 16,456 | | | | 16,577 | | | | 16,754 | | | | 16,928 | | | | 17,146 | | | | 17,412 | | | | 17,682 | | | | 17,956 | | | | 18,234 | | | | 18,516 | | | | 18,802 | | | | 19,092 | |
| | | | | | | | | | | | | | | | | |
EBITDA | | | | | | | | | | | — | | | | 6,216 | | | | 16,887 | | | | 17,012 | | | | 17,056 | | | | 17,046 | | | | 17,040 | | | | 16,990 | | | | 16,893 | | | | 16,792 | | | | 16,689 | | | | 16,582 | | | | 16,473 | | | | 16,360 | | | | 16,243 | |
| | | | | | | | | | | | | | | | | |
Depreciation | | | | | | | | | | | — | | | | 43,635 | | | | 66,400 | | | | 42,668 | | | | 28,437 | | | | 28,570 | | | | 17,877 | | | | 7,128 | | | | 7,149 | | | | 7,172 | | | | 7,194 | | | | 7,218 | | | | 7,241 | | | | 7,265 | | | | 7,290 | |
| | | | | | | | | | | | | | | | | | | | | | | | | | | | | | | | | | | | | | | | | | | | | | | | | | | | | | | | | | | | | | | | | | | | |
| | | | | | | | | | | | | | | | | |
EBIT | | | | | | | | | | | — | | | | (37,419 | ) | | | (49,513 | ) | | | (25,657 | ) | | | (11,381 | ) | | | (11,524 | ) | | | (838 | ) | | | 9,862 | | | | 9,743 | | | | 9,621 | | | | 9,495 | | | | 9,365 | | | | 9,231 | | | | 9,094 | | | | 8,953 | |
| | | | | | | | | | | | | | | | | |
Income Tax | | | | | | | 40.7 | % | | | — | | | | (15,247 | ) | | | (20,175 | ) | | | (10,454 | ) | | | (4,637 | ) | | | (4,696 | ) | | | (341 | ) | | | 4,018 | | | | 3,970 | | | | 3,920 | | | | 3,869 | | | | 3,816 | | | | 3,761 | | | | 3,706 | | | | 3,648 | |
| | | | | | | | | | | | | | | | | | | | | | | | | | | | | | | | | | | | | | | | | | | | | | | | | | | | | | | | | | | | | | | | | | | | |
After-tax Operating Profit | | | | | | | | | | | — | | | | (22,173 | ) | | | (29,339 | ) | | | (15,203 | ) | | | (6,744 | ) | | | (6,829 | ) | | | (496 | ) | | | 5,844 | | | | 5,773 | | | | 5,701 | | | | 5,626 | | | | 5,549 | | | | 5,470 | | | | 5,389 | | | | 5,305 | |
| | | | | | | | | | | | | | | | | |
Plus: (Increase)/Decrease in Working Capital | | | | | | | | | | | — | | | | (518 | ) | | | (889 | ) | | | (10 | ) | | | (4 | ) | | | 1 | | | | 1 | | | | 4 | | | | 8 | | | | 8 | | | | 9 | | | | 9 | | | | 9 | | | | 9 | | | | 10 | |
Less: CAPEX | | | | | | | | | | | — | | | | (18,000 | ) | | | (1,025 | ) | | | (1,046 | ) | | | (1,066 | ) | | | (1,088 | ) | | | (1,109 | ) | | | (1,132 | ) | | | (1,154 | ) | | | (1,177 | ) | | | (1,201 | ) | | | (1,225 | ) | | | (1,249 | ) | | | (1,274 | ) | | | (1,300 | ) |
Plus: Depreciation Benefit | | | | | | | | | | | — | | | | 43,635 | | | | 66,400 | | | | 42,668 | | | | 28,437 | | | | 28,570 | | | | 17,877 | | | | 7,128 | | | | 7,149 | | | | 7,172 | | | | 7,194 | | | | 7,218 | | | | 7,241 | | | | 7,265 | | | | 7,290 | |
| | | | | | | | | | | | | | | | | | | | | | | | | | | | | | | | | | | | | | | | | | | | | | | | | | | | | | | | | | | | | | | | | | | | |
Free Cash Flow from Operations | | | | | | | | | | | — | | | | 2,944 | | | | 35,147 | | | | 26,410 | | | | 20,624 | | | | 20,655 | | | | 16,272 | | | | 11,844 | | | | 11,777 | | | | 11,703 | | | | 11,628 | | | | 11,551 | | | | 11,471 | | | | 11,389 | | | | 11,305 | |
| | | | | | | | | | | | | | | | | |
PV of Free Cash Flow from Operations | | | | | | | | | | | | | | | 2,833 | | | | 31,315 | | | | 21,787 | | | | 15,754 | | | | 14,609 | | | | 10,656 | | | | 7,182 | | | | 6,612 | | | | 6,084 | | | | 5,597 | | | | 5,148 | | | | 4,734 | | | | 4,352 | | | | 4,000 | |
| | | | | | | | | | | | | | | | | |
Sum of PV of Free Cash Flow from Operations | | | 169,852 | | | | | | | | | | | | | | | | | | | | | | | | | | | | | | | | | | | | | | | | | | | | | | | | | | | | | | | | | | | | | | | | | |
40
North Brawley
| | | | |
Depreciation Life | | | 5-Year MACRS | |
Remaining Life | | | 29 | |
Existing Discount Rate | | | 8.00% | |
Tax Rate | | | 40.75% | |
Net Capacity (MW) | | | Third Party Off-taker 40 | |
| | | | | | | | | | | | | | | | | | | | | | | | | | | | | | | | | | | | | | | | | | | | | | | | | | | | | | | | | | | | | | | | | | | | |
| | | | | | | | | 2026 | | | 2027 | | | 2028 | | | 2029 | | | 2030 | | | 2031 | | | 2032 | | | 2033 | | | 2034 | | | 2035 | | | 2036 | | | 2037 | | | 2038 | | | 2039 | | | 2040 | |
Total Revenue | | | | | | | | | | | 35,511 | | | | 35,687 | | | | 35,863 | | | | 36,041 | | | | 36,219 | | | | 36,399 | | | | 36,579 | | | | 36,760 | | | | 36,942 | | | | 37,125 | | | | 37,308 | | | | 37,493 | | | | 37,679 | | | | 37,865 | | | | 38,053 | |
| | | | | | | | | | | | | | | | | |
Total Operating Costs | | | | | | | | | | | 19,387 | | | | 19,684 | | | | 19,986 | | | | 20,292 | | | | 20,601 | | | | 20,914 | | | | 21,230 | | | | 21,572 | | | | 21,923 | | | | 22,279 | | | | 22,640 | | | | 23,007 | | | | 23,379 | | | | 23,756 | | | | 24,139 | |
| | | | | | | | | | | | | | | | | |
EBITDA | | | | | | | | | | | 16,124 | | | | 16,002 | | | | 15,877 | | | | 15,749 | | | | 15,618 | | | | 15,485 | | | | 15,349 | | | | 15,188 | | | | 15,019 | | | | 14,846 | | | | 14,668 | | | | 14,486 | | | | 14,299 | | | | 14,109 | | | | 13,914 | |
| | | | | | | | | | | | | | | | | |
Depreciation | | | | | | | | | | | 7,315 | | | | 7,341 | | | | 7,367 | | | | 7,393 | | | | 7,421 | | | | 7,448 | | | | 2,349 | | | | 1,470 | | | | 1,500 | | | | 1,530 | | | | 1,560 | | | | 1,592 | | | | 1,623 | | | | 1,656 | | | | 4,681 | |
| | | | | | | | | | | | | | | | | | | | | | | | | | | | | | | | | | | | | | | | | | | | | | | | | | | | | | | | | | | | | | | | | | | | |
| | | | | | | | | | | | | | | | | |
EBIT | | | | | | | | | | | 8,809 | | | | 8,661 | | | | 8,510 | | | | 8,355 | | | | 8,198 | | | | 8,037 | | | | 13,000 | | | | 13,718 | | | | 13,519 | | | | 13,316 | | | | 13,107 | | | | 12,894 | | | | 12,676 | | | | 12,453 | | | | 9,232 | |
| | | | | | | | | | | | | | | | | |
Income Tax | | | | | | | 40.7 | % | | | 3,589 | | | | 3,529 | | | | 3,468 | | | | 3,405 | | | | 3,340 | | | | 3,275 | | | | 5,297 | | | | 5,589 | | | | 5,509 | | | | 5,426 | | | | 5,341 | | | | 5,254 | | | | 5,165 | | | | 5,074 | | | | 3,762 | |
| | | | | | | | | | | | | | | | | | | | | | | | | | | | | | | | | | | | | | | | | | | | | | | | | | | | | | | | | | | | | | | | | | | | |
After-tax Operating Profit | | | | | | | | | | | 5,220 | | | | 5,132 | | | | 5,043 | | | | 4,951 | | | | 4,857 | | | | 4,762 | | | | 7,703 | | | | 8,128 | | | | 8,011 | | | | 7,890 | | | | 7,767 | | | | 7,640 | | | | 7,511 | | | | 7,379 | | | | 5,471 | |
| | | | | | | | | | | | | | | | | |
Plus: (Increase)/Decrease in Working Capital | | | | | | | | | | | 10 | | | | 10 | | | | 10 | | | | 11 | | | | 11 | | | | 11 | | | | 11 | | | | 13 | | | | 14 | | | | 14 | | | | 15 | | | | 15 | | | | 16 | | | | 16 | | | | 1,176 | |
Less: CAPEX | | | | | | | | | | | (1,326 | ) | | | (1,352 | ) | | | (1,380 | ) | | | (1,407 | ) | | | (1,435 | ) | | | (1,464 | ) | | | (1,493 | ) | | | (1,523 | ) | | | (1,554 | ) | | | (1,585 | ) | | | (1,616 | ) | | | (1,649 | ) | | | (1,682 | ) | | | (1,715 | ) | | | (1,750 | ) |
Plus: Depreciation Benefit | | | | | | | | | | | 7,315 | | | | 7,341 | | | | 7,367 | | | | 7,393 | | | | 7,421 | | | | 7,448 | | | | 2,349 | | | | 1,470 | | | | 1,500 | | | | 1,530 | | | | 1,560 | | | | 1,592 | | | | 1,623 | | | | 1,656 | | | | 4,681 | |
| | | | | | | | | | | | | | | | | | | | | | | | | | | | | | | | | | | | | | | | | | | | | | | | | | | | | | | | | | | | | | | | | | | | |
Free Cash Flow from Operations | | | | | | | | | | | 11,219 | | | | 11,131 | | | | 11,040 | | | | 10,948 | | | | 10,854 | | | | 10,757 | | | | 8,570 | | | | 8,089 | | | | 7,971 | | | | 7,850 | | | | 7,726 | | | | 7,598 | | | | 7,468 | | | | 7,335 | | | | 9,578 | |
| | | | | | | | | | | | | | | | | |
PV of Free Cash Flow from Operations | | | | | | | | | | | 3,675 | | | | 3,376 | | | | 3,101 | | | | 2,847 | | | | 2,614 | | | | 2,399 | | | | 1,769 | | | | 1,546 | | | | 1,411 | | | | 1,286 | | | | 1,172 | | | | 1,068 | | | | 972 | | | | 884 | | | | 1,068 | |
| | | | | | | | | | | | | | | | | |
Sum of PV of Free Cash Flow from Operations | | | 169,852 | | | | | | | | | | | | | | | | | | | | | | | | | | | | | | | | | | | | | | | | | | | | | | | | | | | | | | | | | | | | | | | | | |
41
| 3. | Discounted Cash Flow Analysis - Third Party Off-taker 45MW Scenario |
North Brawley
| | | | |
Depreciation Life | | | 5-Year MACRS | |
Remaining Life | | | 29 | |
Existing Discount Rate | | | 8.00 | % |
Tax Rate | | | 40.75 | % |
Net Capacity (MW) | | | Third Party Off-taker 45 | |
| | | | | | | | | | | | | | | | | | | | | | | | | | | | | | | | | | | | | | | | | | | | | | | | | | | | | | | | | | | | | | | | | | | | |
| | | | | | | | | 2011 | | | 2012 | | | 2013 | | | 2014 | | | 2015 | | | 2016 | | | 2017 | | | 2018 | | | 2019 | | | 2020 | | | 2021 | | | 2022 | | | 2023 | | | 2024 | | | 2025 | |
Total Revenue | | | | | | | | | | | — | | | | 23,594 | | | | 36,944 | | | | 37,127 | | | | 37,311 | | | | 37,495 | | | | 37,681 | | | | 37,867 | | | | 38,055 | | | | 38,243 | | | | 38,432 | | | | 38,623 | | | | 38,814 | | | | 39,006 | | | | 39,199 | |
| | | | | | | | | | | | | | | | | | | | | | | | | | | | | | | | | | | | | | | | | | | | | | | | | | | | | | | | | | | | | | | | | | | | |
| | | | | | | | | | | | | | | | | |
Total Operating Costs | | | | | | | | | | | — | | | | 17,379 | | | | 17,199 | | | | 17,207 | | | | 17,306 | | | | 17,469 | | | | 17,628 | | | | 17,836 | | | | 18,098 | | | | 18,364 | | | | 18,632 | | | | 18,903 | | | | 19,177 | | | | 19,455 | | | | 19,737 | |
| | | | | | | | | | | | | | | | | |
EBITDA | | | | | | | | | | | — | | | | 6,216 | | | | 19,745 | | | | 19,920 | | | | 20,004 | | | | 20,026 | | | | 20,053 | | | | 20,032 | | | | 19,957 | | | | 19,880 | | | | 19,800 | | | | 19,719 | | | | 19,636 | | | | 19,552 | | | | 19,462 | |
| | | | | | | | | | | | | | | | | |
Depreciation | | | | | | | | | | | — | | | | 50,700 | | | | 77,065 | | | | 49,493 | | | | 32,958 | | | | 33,091 | | | | 20,670 | | | | 8,193 | | | | 8,214 | | | | 8,237 | | | | 8,259 | | | | 8,283 | | | | 8,306 | | | | 7,638 | | | | 1,255 | |
| | | | | | | | | | | | | | | | | | | | | | | | | | | | | | | | | | | | | | | | | | | | | | | | | | | | | | | | | | | | | | | | | | | | |
| | | | | | | | | | | | | | | | | |
EBIT | | | | | | | | | | | — | | | | (44,484 | ) | | | (57,320 | ) | | | (29,573 | ) | | | (12,954 | ) | | | (13,065 | ) | | | (617 | ) | | | 11,839 | | | | 11,742 | | | | 11,643 | | | | 11,541 | | | | 11,437 | | | | 11,330 | | | | 11,914 | | | | 18,207 | |
| | | | | | | | | | | | | | | | | |
Income Tax | | | | | | | 40.7 | % | | | — | | | | (18,126 | ) | | | (23,356 | ) | | | (12,050 | ) | | | (5,278 | ) | | | (5,324 | ) | | | (251 | ) | | | 4,824 | | | | 4,785 | | | | 4,744 | | | | 4,702 | | | | 4,660 | | | | 4,617 | | | | 4,854 | | | | 7,419 | |
| | | | | | | | | | | | | | | | | | | | | | | | | | | | | | | | | | | | | | | | | | | | | | | | | | | | | | | | | | | | | | | | | | | | |
After-tax Operating Profit | | | | | | | | | | | — | | | | (26,359 | ) | | | (33,965 | ) | | | (17,523 | ) | | | (7,676 | ) | | | (7,742 | ) | | | (366 | ) | | | 7,015 | | | | 6,958 | | | | 6,899 | | | | 6,839 | | | | 6,777 | | | | 6,714 | | | | 7,059 | | | | 10,789 | |
| | | | | | | | | | | | | | | | | |
Plus: (Increase)/Decrease in Working Capital | | | | | | | | | | | — | | | | (518 | ) | | | (1,127 | ) | | | (15 | ) | | | (7 | ) | | | (2 | ) | | | (2 | ) | | | 2 | | | | 6 | | | | 6 | | | | 7 | | | | 7 | | | | 7 | | | | 7 | | | | 7 | |
Less: CAPEX | | | | | | | | | | | — | | | | (18,000 | ) | | | (1,025 | ) | | | (1,046 | ) | | | (1,066 | ) | | | (1,088 | ) | | | (1,109 | ) | | | (1,132 | ) | | | (1,154 | ) | | | (1,177 | ) | | | (1,201 | ) | | | (1,225 | ) | | | (1,249 | ) | | | (1,274 | ) | | | (1,300 | ) |
Plus: Depreciation Benefit | | | | | | | | | | | | | | | 50,700 | | | | 77,065 | | | | 49,493 | | | | 32,958 | | | | 33,091 | | | | 20,670 | | | | 8,193 | | | | 8,214 | | | | 8,237 | | | | 8,259 | | | | 8,283 | | | | 8,306 | | | | 7,638 | | | | 1,255 | |
| | | | | | | | | | | | | | | | | | | | | | | | | | | | | | | | | | | | | | | | | | | | | | | | | | | | | | | | | | | | | | | | | | | | |
Free Cash Flow from Operations | | | | | | | | | | | — | | | | 5,823 | | | | 40,948 | | | | 30,910 | | | | 24,209 | | | | 24,260 | | | | 19,193 | | | | 14,078 | | | | 14,024 | | | | 13,965 | | | | 13,904 | | | | 13,841 | | | | 13,777 | | | | 13,430 | | | | 10,751 | |
| | | | | | | | | | | | | | | | | |
PV of Free Cash Flow from Operations | | | | | | | | | | | | | | | 5,603 | | | | 36,484 | | | | 25,500 | | | | 18,493 | | | | 17,159 | | | | 12,569 | | | | 8,536 | | | | 7,874 | | | | 7,260 | | | | 6,693 | | | | 6,169 | | | | 5,686 | | | | 5,132 | | | | 3,804 | |
| | | | | | | | | | | | | | | | | |
Sum of PV of Free Cash Flow from Operations | | | 197,892 | | | | | | | | | | | | | | | | | | | | | | | | | | | | | | | | | | | | | | | | | | | | | | | | | | | | | | | | | | | | | | | | | |
42
North Brawley
| | | | |
Depreciation Life | | | 5-Year MACRS | |
Remaining Life | | | 29 | |
Existing Discount Rate | | | 8.00 | % |
Tax Rate | | | 40.75 | % |
Net Capacity (MW) | | | Third Party Off-taker 45 | |
| | | | | | | | | | | | | | | | | | | | | | | | | | | | | | | | | | | | | | | | | | | | | | | | | | | | | | | | | | | | | | | | | | | | |
| | | | | | | | | 2026 | | | 2027 | | | 2028 | | | 2029 | | | 2030 | | | 2031 | | | 2032 | | | 2033 | | | 2034 | | | 2035 | | | 2036 | | | 2037 | | | 2038 | | | 2039 | | | 2040 | |
Total Revenue | | | | | | | | | | | 33,393 | | | | 33,588 | | | | 39,784 | | | | 39,981 | | | | 40,179 | | | | 40,378 | | | | 40,578 | | | | 40,779 | | | | 40,980 | | | | 41,183 | | | | 41,387 | | | | 41,592 | | | | 41,798 | | | | 42,005 | | | | 42,213 | |
| | | | | | | | | | | | | | | | | | | | | | | | | | | | | | | | | | | | | | | | | | | | | | | | | | | | | | | | | | | | | | | | | | | | |
| | | | | | | | | | | | | | | | | |
Total Operating Costs | | | | | | | | | | | 20,050 | | | | 20,368 | | | | 20,691 | | | | 21,019 | | | | 21,351 | | | | 21,689 | | | | 22,031 | | | | 22,378 | | | | 22,729 | | | | 23,085 | | | | 23,445 | | | | 23,810 | | | | 24,178 | | | | 24,551 | | | | 24,928 | |
| | | | | | | | | | | | | | | | | |
EBITDA | | | | | | | | | | | 19,343 | | | | 19,220 | | | | 19,093 | | | | 18,962 | | | | 18,827 | | | | 18,689 | | | | 18,547 | | | | 18,401 | | | | 18,252 | | | | 18,099 | | | | 17,942 | | | | 17,782 | | | | 17,620 | | | | 17,454 | | | | 17,285 | |
| | | | | | | | | | | | | | | | | |
Depreciation | | | | | | | | | | | 1,280 | | | | 1,306 | | | | 1,332 | | | | 1,358 | | | | 1,386 | | | | 1,413 | | | | 1,442 | | | | 1,470 | | | | 1,500 | | | | 1,530 | | | | 1,560 | | | | 1,592 | | | | 1,623 | | | | 1,656 | | | | 4,681 | |
| | | | | | | | | | | | | | | | | | | | | | | | | | | | | | | | | | | | | | | | | | | | | | | | | | | | | | | | | | | | | | | | | | | | |
| | | | | | | | | | | | | | | | | |
EBIT | | | | | | | | | | | 18,063 | | | | 17,914 | | | | 17,761 | | | | 17,604 | | | | 17,442 | | | | 17,276 | | | | 17,105 | | | | 16,931 | | | | 16,752 | | | | 16,569 | | | | 16,382 | | | | 16,191 | | | | 15,996 | | | | 15,798 | | | | 12,604 | |
| | | | | | | | | | | | | | | | | |
Income Tax | | | | | | | 40.7 | % | | | 7,360 | | | | 7,299 | | | | 7,237 | | | | 7,173 | | | | 7,107 | | | | 7,039 | | | | 6,970 | | | | 6,899 | | | | 6,826 | | | | 6,751 | | | | 6,675 | | | | 6,597 | | | | 6,518 | | | | 6,437 | | | | 5,135 | |
| | | | | | | | | | | | | | | | | | | | | | | | | | | | | | | | | | | | | | | | | | | | | | | | | | | | | | | | | | | | | | | | | | | | |
After-tax Operating Profit | | | | | | | | | | | 10,703 | | | | 10,615 | | | | 10,524 | | | | 10,431 | | | | 10,335 | | | | 10,237 | | | | 10,136 | | | | 10,032 | | | | 9,926 | | | | 9,818 | | | | 9,707 | | | | 9,594 | | | | 9,478 | | | | 9,361 | | | | 7,468 | |
| | | | | | | | | | | | | | | | | |
Plus: (Increase)/Decrease in Working Capital | | | | | | | | | | | 10 | | | | 10 | | | | 11 | | | | 11 | | | | 11 | | | | 12 | | | | 12 | | | | 12 | | | | 12 | | | | 13 | | | | 13 | | | | 13 | | | | 14 | | | | 14 | | | | 1,454 | |
Less: CAPEX | | | | | | | | | | | (1,326 | ) | | | (1,352 | ) | | | (1,380 | ) | | | (1,407 | ) | | | (1,435 | ) | | | (1,464 | ) | | | (1,493 | ) | | | (1,523 | ) | | | (1,554 | ) | | | (1,585 | ) | | | (1,616 | ) | | | (1,649 | ) | | | (1,682 | ) | | | (1,715 | ) | | | (1,750 | ) |
Plus: Depreciation Benefit | | | | | | | | | | | 1,280 | | | | 1,306 | | | | 1,332 | | | | 1,358 | | | | 1,386 | | | | 1,413 | | | | 1,442 | | | | 1,470 | | | | 1,500 | | | | 1,530 | | | | 1,560 | | | | 1,592 | | | | 1,623 | | | | 1,656 | | | | 4,681 | |
| | | | | | | | | | | | | | | | | | | | | | | | | | | | | | | | | | | | | | | | | | | | | | | | | | | | | | | | | | | | | | | | | | | | |
Free Cash Flow from Operations | | | | | | | | | | | 10,667 | | | | 10,578 | | | | 10,487 | | | | 10,393 | | | | 10,297 | | | | 10,197 | | | | 10,096 | | | | 9,992 | | | | 9,885 | | | | 9,776 | | | | 9,664 | | | | 9,550 | | | | 9,434 | | | | 9,315 | | | | 11,854 | |
| | | | | | | | | | | | | | | | | |
PV of Free Cash Flow from Operations | | | | | | | | | | | 3,495 | | | | 3,209 | | | | 2,946 | | | | 2,703 | | | | 2,479 | | | | 2,274 | | | | 2,084 | | | | 1,910 | | | | 1,750 | | | | 1,602 | | | | 1,466 | | | | 1,342 | | | | 1,227 | | | | 1,122 | | | | 1,322 | |
| | | | | | | | | | | | | | | | | |
Sum of PV of Free Cash Flow from Operations | | | 197,892 | | | | | | | | | | | | | | | | | | | | | | | | | | | | | | | | | | | | | | | | | | | | | | | | | | | | | | | | | | | | | | | | | |
43
| 4. | Discounted Cash Flow Analysis - Third Party Off-taker 50MW Scenario |
North Brawley
| | | | |
Depreciation Life | | | 5-Year MACRS | |
Remaining Life | | | 29 | |
Existing Discount Rate | | | 8.00 | % |
Tax Rate | | | 40.75 | % |
Net Capacity( MW) | | | Third Party Off-taker 50 | |
| | | | | | | | | | | | | | | | | | | | | | | | | | | | | | | | | | | | | | | | | | | | | | | | | | | | | | | | | | | | | | | | | | | | |
| | | | | | | | | 2011 | | | 2012 | | | 2013 | | | 2014 | | | 2015 | | | 2016 | | | 2017 | | | 2018 | | | 2019 | | | 2020 | | | 2021 | | | 2022 | | | 2023 | | | 2024 | | | 2025 | |
Total Revenue (3) | | | | | | | | | | | — | | | | 23,594 | | | | 40,469 | | | | 40,669 | | | | 40,870 | | | | 41,073 | | | | 41,276 | | | | 41,480 | | | | 41,686 | | | | 41,892 | | | | 42,099 | | | | 42,308 | | | | 42,517 | | | | 42,728 | | | | 42,939 | |
| | | | | | | | | | | | | | | | | | | | | | | | | | | | | | | | | | | | | | | | | | | | | | | | | | | | | | | | | | | | | | | | | | | | |
| | | | | | | | | | | | | | | | | |
Total Operating Costs | | | | | | | | | | | — | | | | 17,379 | | | | 17,775 | | | | 17,958 | | | | 18,032 | | | | 18,180 | | | | 18,328 | | | | 18,526 | | | | 18,783 | | | | 19,048 | | | | 19,314 | | | | 19,583 | | | | 19,886 | | | | 20,195 | | | | 20,508 | |
| | | | | | | | | | | | | | | | | |
EBITDA | | | | | | | | | | | — | | | | 6,216 | | | | 22,694 | | | | 22,711 | | | | 22,839 | | | | 22,893 | | | | 22,948 | | | | 22,954 | | | | 22,903 | | | | 22,844 | | | | 22,785 | | | | 22,725 | | | | 22,632 | | | | 22,533 | | | | 22,431 | |
| | | | | | | | | | | | | | | | | |
Depreciation (4) | | | | | | | | | | | — | | | | 52,633 | | | | 83,633 | | | | 57,442 | | | | 37,940 | | | | 36,616 | | | | 23,792 | | | | 9,818 | | | | 8,747 | | | | 8,769 | | | | 8,792 | | | | 1,465 | | | | 1,206 | | | | 1,230 | | | | 1,255 | |
| | | | | | | | | | | | | | | | | | | | | | | | | | | | | | | | | | | | | | | | | | | | | | | | | | | | | | | | | | | | | | | | | | | | |
| | | | | | | | | | | | | | | | | |
EBIT | | | | | | | | | | | — | | | | (46,417 | ) | | | (60,939 | ) | | | (34,730 | ) | | | (15,102 | ) | | | (13,723 | ) | | | (844 | ) | | | 13,136 | | | | 14,156 | | | | 14,075 | | | | 13,993 | | | | 21,260 | | | | 21,425 | | | | 21,303 | | | | 21,176 | |
| | | | | | | | | | | | | | | | | | | | | | | | | | | | | | | | | | | | | | | | | | | | | | | | | | | | | | | | | | | | | | | | | | | | |
| | | | | | | | | | | | | | | | | |
Income Tax(5) | | | | | | | 40.7 | % | |
| —
|
| | | (18,913 | ) | | | (24,830 | ) | | | (14,151 | ) | | | (6,153 | ) | | | (5,592 | ) | | | (344 | ) | | | 5,353 | | | | 5,768 | | | | 5,735 | | | | 5,702 | | | | 8,663 | | | | 8,730 | | | | 8,680 | | | | 8,628 | |
| | | | | | | | | | | | | | | | | | | | | | | | | | | | | | | | | | | | | | | | | | | | | | | | | | | | | | | | | | | | | | | | | | | | |
After-tax Operating Profit | | | | | | | | | | | — | | | | (27,504 | ) | | | (36,109 | ) | | | (20,579 | ) | | | (8,948 | ) | | | (8,132 | ) | | | (500 | ) | | | 7,784 | | | | 8,388 | | | | 8,340 | | | | 8,292 | | | | 12,597 | | | | 12,695 | | | | 12,623 | | | | 12,548 | |
| | | | | | | | | | | | | | | | | |
Plus: (Increase)/Decrease in Working Capital | | | | | | | | | | | — | | | | (518 | ) | | | (1,373 | ) | | | (1 | ) | | | (11 | ) | | | (4 | ) | | | (5 | ) | | | (1 | ) | | | 4 | | | | 5 | | | | 5 | | | | 5 | | | | 8 | | | | 8 | | | | 8 | |
Less: CAPEX | | | | | | | | | | | — | | | | (10,000 | ) | | | (20,000 | ) | | | (1,046 | ) | | | (1,066 | ) | | | (1,088 | ) | | | (1,109 | ) | | | (1,132 | ) | | | (1,154 | ) | | | (1,177 | ) | | | (1,201 | ) | | | (1,225 | ) | | | (1,249 | ) | | | (1,274 | ) | | | (1,300 | ) |
Plus: Depreciation Benefit | | | | | | | | | | | | | | | 52,633 | | | | 83,633 | | | | 57,442 | | | | 37,940 | | | | 36,616 | | | | 23,792 | | | | 9,818 | | | | 8,747 | | | | 8,769 | | | | 8,792 | | | | 1,465 | | | | 1,206 | | | | 1,230 | | | | 1,255 | |
| | | | | | | | | | | | | | | | | | | | | | | | | | | | | | | | | | | | | | | | | | | | | | | | | | | | | | | | | | | | | | | | | | | | |
Free Cash Flow from Operations | | | | | | | | | | | — | | | | 14,611 | | | | 26,151 | | | | 35,816 | | | | 27,915 | | | | 27,392 | | | | 22,178 | | | | 16,470 | | | | 15,985 | | | | 15,937 | | | | 15,888 | | | | 12,843 | | | | 12,660 | | | | 12,587 | | | | 12,511 | |
| | | | | | | | | | | | | | | | | |
Sum of PV of Free Cash Flow from Operations | | | 213,683 | | | | | | | | | | | | | | | | | | | | | | | | | | | | | | | | | | | | | | | | | | | | | | | | | | | | | | | | | | | | | | | | | |
44
North Brawley
| | | | |
Depreciation Life | | | 5-Year MACRS | |
Remaining Life | | | 29 | |
Existing Discount Rate | | | 8.00 | % |
Tax Rate | | | 40.75 | % |
Net Capacity (MW) | | | Third Party Off-taker 50 | |
| | | | | | | | | | | | | | | | | | | | | | | | | | | | | | | | | | | | | | | | | | | | | | | | | | | | | | | | | | | | | | | | | | | | |
| | | | | | | | | 2026 | | | 2027 | | | 2028 | | | 2029 | | | 2030 | | | 2031 | | | 2032 | | | 2033 | | | 2034 | | | 2035 | | | 2036 | | | 2037 | | | 2038 | | | 2039 | | | 2040 | |
Total Revenue (3) | | | | | | | | | | | 43,152 | | | | 43,365 | | | | 43,580 | | | | 43,796 | | | | 44,013 | | | | 44,230 | | | | 44,449 | | | | 44,669 | | | | 44,890 | | | | 45,113 | | | | 45,336 | | | | 45,560 | | | | 45,786 | | | | 46,013 | | | | 46,240 | |
| | | | | | | | | | | | | | | | | | | | | | | | | | | | | | | | | | | | | | | | | | | | | | | | | | | | | | | | | | | | | | | | | | | | |
| | | | | | | | | | | | | | | | | |
Total Operating Costs | | | | | | | | | | | 20,826 | | | | 21,148 | | | | 21,475 | | | | 21,806 | | | | 22,142 | | | | 22,482 | | | | 22,826 | | | | 23,174 | | | | 23,526 | | | | 23,882 | | | | 24,241 | | | | 24,604 | | | | 24,970 | | | | 25,339 | | | | 25,711 | |
| | | | | | | | | | | | | | | | | |
EBITDA | | | | | | | | | | | 22,326 | | | | 22,217 | | | | 22,105 | | | | 21,990 | | | | 21,871 | | | | 21,749 | | | | 21,624 | | | | 21,496 | | | | 21,365 | | | | 21,231 | | | | 21,095 | | | | 20,956 | | | | 20,816 | | | | 20,674 | | | | 20,530 | |
| | | | | | | | | | | | | | | | | |
Depreciation (4) | | | | | | | | | | | 1,280 | | | | 1,306 | | | | 1,332 | | | | 1,358 | | | | 1,386 | | | | 1,413 | | | | 1,442 | | | | 1,470 | | | | 1,500 | | | | 1,530 | | | | 1,560 | | | | 1,592 | | | | 1,623 | | | | 1,656 | | | | 4,681 | |
| | | | | | | | | | | | | | | | | | | | | | | | | | | | | | | | | | | | | | | | | | | | | | | | | | | | | | | | | | | | | | | | | | | | |
| | | | | | | | | | | | | | | | | |
EBIT | | | | | | | | | | | 21,046 | | | | 20,912 | | | | 20,773 | | | | 20,631 | | | | 20,485 | | | | 20,336 | | | | 20,182 | | | | 20,025 | | | | 19,865 | | | | 19,701 | | | | 19,534 | | | | 19,365 | | | | 19,192 | | | | 19,018 | | | | 15,848 | |
| | | | | | | | | | | | | | | | | |
Income Tax(5) | | | | | | | 40.7 | % | | | 8,575 | | | | 8,521 | | | | 8,464 | | | | 8,406 | | | | 8,347 | | | | 8,286 | | | | 8,223 | | | | 8,159 | | | | 8,094 | | | | 8,027 | | | | 7,959 | | | | 7,890 | | | | 7,823 | | | | 7,749 | | | | 6,458 | |
| | | | | | | | | | | | | | | | | | | | | | | | | | | | | | | | | | | | | | | | | | | | | | | | | | | | | | | | | | | | | | | | | | | | |
After-tax Operating Profit | | | | | | | | | | | 12,471 | | | | 12,391 | | | | 12,309 | | | | 12,225 | | | | 12,138 | | | | 12,050 | | | | 11,959 | | | | 11,866 | | | | 11,771 | | | | 11,674 | | | | 11,575 | | | | 11,474 | | | | 11,372 | | | | 11,269 | | | | 9,391 | |
| | | | | | | | | | | | | | | | | |
Plus: (Increase)/Decrease in Working Capital | | | | | | | | | | | 9 | | | | 9 | | | | 9 | | | | 10 | | | | 10 | | | | 10 | | | | 10 | | | | 11 | | | | 11 | | | | 11 | | | | 11 | | | | 12 | | | | 12 | | | | 12 | | | | 1,723 | |
Less: CAPEX | | | | | | | | | | | (1,326 | ) | | | (1,352 | ) | | | (1,380 | ) | | | (1,407 | ) | | | (1,435 | ) | | | (1,464 | ) | | | (1,493 | ) | | | (1,523 | ) | | | (1,554 | ) | | | (1,585 | ) | | | (1,616 | ) | | | (1,649 | ) | | | (1,682 | ) | | | (1,715 | ) | | | (1,750 | ) |
Plus: Depreciation Benefit | | | | | | | | | | | 1,280 | | | | 1,306 | | | | 1,332 | | | | 1,358 | | | | 1,386 | | | | 1,413 | | | | 1,442 | | | | 1,470 | | | | 1,500 | | | | 1,530 | | | | 1,560 | | | | 1,592 | | | | 1,623 | | | | 1,656 | | | | 4,681 | |
| | | | | | | | | | | | | | | | | | | | | | | | | | | | | | | | | | | | | | | | | | | | | | | | | | | | | | | | | | | | | | | | | | | | |
Free Cash Flow from Operations | | | | | | | | | | | 12,433 | | | | 12,353 | | | | 12,271 | | | | 12,186 | | | | 12,099 | | | | 12,009 | | | | 11,917 | | | | 11,824 | | | | 11,728 | | | | 11,630 | | | | 11,530 | | | | 11,429 | | | | 11,326 | | | | 11,221 | | | | 14,045 | |
| | | | | | | | | | | | | | | | | |
Sum of PV of Free Cash Flow from Operations | | | 213,683 | | | | | | | | | | | | | | | | | | | | | | | | | | | | | | | | | | | | | | | | | | | | | | | | | | | | | | | | | | | | | | | | | |
45
| 5. | Discounted Cash Flow Analysis - SCE 37MW Scenario |
North Brawley
| | | | |
Depreciation Life | | | 5-Year MACRS | |
Remaining Life | | | 29 | |
Existing Discount Rate | | | 8.00 | % |
Tax Rate | | | 40.75 | % |
Net Capacity (MW) | | | SCE 37 | |
| | | | | | | | | | | | | | | | | | | | | | | | | | | | | | | | | | | | | | | | | | | | | | | | | | | | | | | | | | | | | | | | | | | | |
| | | | | | | | | 2011 | | | 2012 | | | 2013 | | | 2014 | | | 2015 | | | 2016 | | | 2017 | | | 2018 | | | 2019 | | | 2020 | | | 2021 | | | 2022 | | | 2023 | | | 2024 | | | 2025 | |
Total Revenue | | | | | | | | | | | — | | | | 22,259 | | | | 25,725 | | | | 25,596 | | | | 25,468 | | | | 25,341 | | | | 25,214 | | | | 25,088 | | | | 24,963 | | | | 24,838 | | | | 24,714 | | | | 24,590 | | | | 24,467 | | | | 24,345 | | | | 24,223 | |
| | | | | | | | | | | | | | | | | |
Total Operating Costs | | | | | | | | | | | — | | | | 17,699 | | | | 14,945 | | | | 15,073 | | | | 15,243 | | | | 15,446 | | | | 15,651 | | | | 15,881 | | | | 16,141 | | | | 16,407 | | | | 16,680 | | | | 16,960 | | | | 17,247 | | | | 17,542 | | | | 17,844 | |
Operating Costs ($/kW-year) | | | | | | | | | | | #DIV/0! | | | | 558,93 | | | | 403,93 | | | | 409,42 | | | | 416,13 | | | | 423,78 | | | | 431.55 | | | | 440,12 | | | | 449,56 | | | | 459,27 | | | | 469,25 | | | | 479,52 | | | | 490,09 | | | | 500.98 | | | | 512,18 | |
| | | | | | | | | | | | | | | | | |
EBITDA | | | | | | | | | | | — | | | | 4,560 | | | | 10,779 | | | | 10,524 | | | | 10,225 | | | | 9,895 | | | | 9,564 | | | | 9,207 | | | | 8,822 | | | | 8,431 | | | | 8,034 | | | | 7,630 | | | | 7,220 | | | | 6,803 | | | | 6,379 | |
| | | | | | | | | | | | | | | | | |
Depreciation | | | | | | | | | | | — | | | | 22,018 | | | | 33,623 | | | | 21,795 | | | | 14,706 | | | | 14,839 | | | | 9,503 | | | | 4,110 | | | | 4,132 | | | | 4,154 | | | | 4,177 | | | | 4,200 | | | | 4,224 | | | | 4,248 | | | | 4,272 | |
| | | | | | | | | | | | | | | | | | | | | | | | | | | | | | | | | | | | | | | | | | | | | | | | | | | | | | | | | | | | | | | | | | | | |
| | | | | | | | | | | | | | | | | |
EBIT | | | | | | | | | | | — | | | | (17,457 | ) | | | (22,843 | ) | | | (11,271 | ) | | | (4,481 | ) | | | (4,944 | ) | | | 61 | | | | 5,097 | | | | 4,690 | | | | 4,277 | | | | 3,857 | | | | 3,430 | | | | 2,996 | | | | 2,555 | | | | 2,106 | |
| | | | | | | | | | | | | | | | | |
Income Tax | | | | | | | 40.7 | % | | | — | | | | (7,113 | ) | | | (9,308 | ) | | | (4,593 | ) | | | (1,826 | ) | | | (2,015 | ) | | | 25 | | | | 2,077 | | | | 1,911 | | | | 1,743 | | | | 1,572 | | | | 1,398 | | | | 1,221 | | | | 1,041 | | | | 858 | |
| | | | | | | | | | | | | | | | | | | | | | | | | | | | | | | | | | | | | | | | | | | | | | | | | | | | | | | | | | | | | | | | | | | | |
After-tax Operating Profit | | | | | | | | | | | — | | | | (10,344 | ) | | | (13,535 | ) | | | (6,679 | ) | | | (2,655 | ) | | | (2,930 | ) | | | 36 | | | | 3,020 | | | | 2,779 | | | | 2,534 | | | | 2,285 | | | | 2,033 | | | | 1,776 | | | | 1,514 | | | | 1,248 | |
| | | | | | | | | | | | | | | | | |
Plus: (Increase)/Decrease in Working Capital | | | | | | | | | | | — | | | | (380 | ) | | | (518 | ) | | | 21 | | | | 25 | | | | 27 | | | | 28 | | | | 30 | | | | 32 | | | | 33 | | | | 33 | | | | 34 | | | | 34 | | | | 35 | | | | 35 | |
Less: CAPEX | | | | | | | | | | | — | | | | (10,000 | ) | | | (1,025 | ) | | | (1,046 | ) | | | (1,066 | ) | | | (1,088 | ) | | | (1,109 | ) | | | (1,132 | ) | | | (1,154 | ) | | | (1,177 | ) | | | (1,201 | ) | | | (1,225 | ) | | | (1,249 | ) | | | (1,274 | ) | | | (1,300 | ) |
Plus: Depreciation Benefit | | | | | | | | | | | | | | | 22,018 | | | | 33,623 | | | | 21,795 | | | | 14,706 | | | | 14,839 | | | | 9,503 | | | | 4,110 | | | | 4,132 | | | | 4,154 | | | | 4,177 | | | | 4,200 | | | | 4,224 | | | | 4,248 | | | | 4,272 | |
| | | | | | | | | | | | | | | | | | | | | | | | | | | | | | | | | | | | | | | | | | | | | | | | | | | | | | | | | | | | | | | | | | | | |
Free Cash Flow from Operations | | | | | | | | | | | — | | | | 1,293 | | | | 18,544 | | | | 14,092 | | | | 11,009 | | | | 10,849 | | | | 8,457 | | | | 6,028 | | | | 5,789 | | | | 5,543 | | | | 5,294 | | | | 5,041 | | | | 4,784 | | | | 4,522 | | | | 4,256 | |
| | | | | | | | | | | | | | | | | |
PV of Free Cash Flow from Operations | | | | | | | | | | | | | | | 1,244 | | | | 16,522 | | | | 11,625 | | | | 8,410 | | | | 7,674 | | | | 5,538 | | | | 3,655 | | | | 3,250 | | | | 2,882 | | | | 2,549 | | | | 2,247 | | | | 1,974 | | | | 1,728 | | | | 1,506 | |
| | | | | | | | | | | | | | | | | |
Sum of PV of Free Cash Flow from Operations | | | 83,676 | | | | | | | | | | | | | | | | | | | | | | | | | | | | | | | | | | | | | | | | | | | | | | | | | | | | | | | | | | | | | | | | | |
46
North Brawley
| | | | |
Depreciation Life | | | 5-Year MACRS | |
Remaining Life | | | 29 | |
Existing Discount Rate | | | 8.00 | % |
Tax Rate | | | 40.75 | % |
Net Capacity (MW) | | | SCE 37 | |
| | | | | | | | | | | | | | | | | | | | | | | | | | | | | | | | | | | | | | | | | | | | | | | | | | | | | | | | | | | | | | | | | | | | |
| | | | | | | | | 2026 | | | 2027 | | | 2028 | | | 2029 | | | 2030 | | | 2031 | | | 2032 | | | 2033 | | | 2034 | | | 2035 | | | 2036 | | | 2037 | | | 2038 | | | 2039 | | | 2040 | |
Total Revenue | | | | | | | | | | | 24,102 | | | | 23,981 | | | | 23,862 | | | | 23,742 | | | | 23,624 | | | | 28,632 | | | | 28,773 | | | | 28,916 | | | | 29,059 | | | | 29,203 | | | | 29,347 | | | | 29,493 | | | | 29,639 | | | | 29,785 | | | | 29,933 | |
| | | | | | | | | | | | | | | | | |
Total Operating Costs | | | | | | | | | | | 18,155 | | | | 18,475 | | | | 18,803 | | | | 19,140 | | | | 19,487 | | | | 20,049 | | | | 20,399 | | | | 20,752 | | | | 21,112 | | | | 21,478 | | | | 21,851 | | | | 22,232 | | | | 22,619 | | | | 23,014 | | | | 23,416 | |
Operating Costs (S/kW-year) | | | | | | | | | | | 523.72 | | | | 535.61 | | | | 547.87 | | | | 560.50 | | | | 573.52 | | | | 593.02 | | | | 606.41 | | | | 620.01 | | | | 633.92 | | | | 648.16 | | | | 662.74 | | | | 677.67 | | | | 692.95 | | | | 708.58 | | | | 724.59 | |
| | | | | | | | | | | | | | | | | |
EBITDA | | | | | | | | | | | 5,947 | | | | 5,507 | | | | 5,059 | | | | 4,602 | | | | 4,137 | | | | 8,583 | | | | 8,374 | | | | 8,164 | | | | 7,947 | | | | 7,725 | | | | 7,496 | | | | 7,261 | | | | 7,019 | | | | 6,771 | | | | 6,516 | |
| | | | | | | | | | | | | | | | | |
Depreciation | | | | | | | | | | | 4,298 | | | | 4,323 | | | | 4,349 | | | | 4,376 | | | | 4,403 | | | | 4,431 | | | | 4,459 | | | | 4,488 | | | | 4,517 | | | | 4,547 | | | | 4,578 | | | | 4,609 | | | | 4,641 | | | | 4,673 | | | | 7,699 | |
| | | | | | | | | | | | | | | | | | | | | | | | | | | | | | | | | | | | | | | | | | | | | | | | | | | | | | | | | | | | | | | | | | | | |
| | | | | | | | | | | | | | | | | |
EBIT | | | | | | | | | | | 1,649 | | | | 1,184 | | | | 709 | | | | 226 | | | | (267 | ) | | | 4,152 | | | | 3,915 | | | | 3,676 | | | | 3,430 | | | | 3,177 | | | | 2,918 | | | | 2,652 | | | | 2,378 | | | | 2,098 | | | | (1,182 | ) |
| | | | | | | | | | | | | | | | | | | | | | | | | | | | | | | | | | | | | | | | | | | | | | | | | | | | | | | | | | | | | | | | | | | | |
| | | | | | | | | | | | | | | | | |
Income Tax | | | | | | | 40.7 | % | | | 672 | | | | 482 | | | | 289 | | | | 92 | | | | (109 | ) | | | 1,692 | | | | 1,595 | | | | 1,498 | | | | 1,398 | | | | 1,295 | | | | 1,189 | | | | 1,080 | | | | 969 | | | | 855 | | | | (482 | ) |
| | | | | | | | | | | | | | | | | | | | | | | | | | | | | | | | | | | | | | | | | | | | | | | | | | | | | | | | | | | | | | | | | | | | |
After-tax Operating Profit | | | | | | | | | | | 977 | | | | 701 | | | | 420 | | | | 134 | | | | (158 | ) | | | 2,460 | | | | 2,320 | | | | 2,178 | | | | 2,032 | | | | 1,883 | | | | 1,729 | | | | 1,571 | | | | 1,409 | | | | 1,243 | | | | (701 | ) |
| | | | | | | | | | | | | | | | | |
Plus: (Increase)/Decrease in Working Capital | | | | | | | | | | | 36 | | | | 37 | | | | 37 | | | | 38 | | | | 39 | | | | (371 | ) | | | 17 | | | | 18 | | | | 18 | | | | 19 | | | | 19 | | | | 20 | | | | 20 | | | | 21 | | | | 564 | |
Less: CAPEX | | | | | | | | | | | (1,326 | ) | | | (1,352 | ) | | | (1,380 | ) | | | (1,407 | ) | | | (1,435 | ) | | | (1,464 | ) | | | (1,493 | ) | | | (1,523 | ) | | | (1,554 | ) | | | (1,585 | ) | | | (1,616 | ) | | | (1,649 | ) | | | (1,682 | ) | | | (1,715 | ) | | | (1,750 | ) |
Plus: Depreciation Benefit | | | | | | | | | | | 4,298 | | | | 4,323 | | | | 4,349 | | | | 4,376 | | | | 4,403 | | | | 4,431 | | | | 4,459 | | | | 4,488 | | | | 4,517 | | | | 4,547 | | | | 4,578 | | | | 4,609 | | | | 4,641 | | | | 4,673 | | | | 7,699 | |
| | | | | | | | | | | | | | | | | | | | | | | | | | | | | | | | | | | | | | | | | | | | | | | | | | | | | | | | | | | | | | | | | | | | |
Free Cash Flow from Operations | | | | | | | | | | | 3,985 | | | | 3,709 | | | | 3,427 | | | | 3,141 | | | | 2,849 | | | | 5,057 | | | | 5,303 | | | | 5,160 | | | | 5,014 | | | | 4,864 | | | | 4,710 | | | | 4,551 | | | | 4,389 | | | | 4,222 | | | | 5,813 | |
| | | | | | | | | | | | | | | | | |
PV of Free Cash Flow from Operations | | | | | | | | | | | 1,305 | | | | 1,125 | | | | 963 | | | | 817 | | | | 686 | | | | 1,127 | | | | 1,095 | | | | 986 | | | | 888 | | | | 797 | | | | 715 | | | | 639 | | | | 571 | | | | 509 | | | | 648 | |
| | | | | | | | | | | | | | | | | |
Sum of PV of Free Cash Flow from Operations | | | 83,676 | | | | | | | | | | | | | | | | | | | | | | | | | | | | | | | | | | | | | | | | | | | | | | | | | | | | | | | | | | | | | | | | | |
47
| 6. | Discounted Cash Flow Analysis - SCE 40MW Scenario |
North Brawley
| | | | |
Depreciation Life | | | 5-Year MACRS | |
Remaining Life | | | 29 | |
Existing Discount Rate | | | 8.00 | % |
Tax Rate | | | 40.75 | % |
Net Capacity (MW) | | | SCE 40 | |
| | | | | | | | | | | | | | | | | | | | | | | | | | | | | | | | | | | | | | | | | | | | | | | | | | | | | | | | | | | | | | | | | | | | |
| | | | | | | | | 2011 | | | 2012 | | | 2013 | | | 2014 | | | 2015 | | | 2016 | | | 2017 | | | 2018 | | | 2019 | | | 2020 | | | 2021 | | | 2022 | | | 2023 | | | 2024 | | | 2025 | |
Total Revenue | | | | | | | | | | | — | | | | 22,259 | | | | 27,811 | | | | 27,672 | | | | 27,533 | | | | 27,396 | | | | 27,259 | | | | 27,122 | | | | 26,987 | | | | 26,852 | | | | 26,717 | | | | 26,584 | | | | 26,451 | | | | 26,319 | | | | 26,187 | |
| | | | | | | | | | | | | | | | | |
Total Operating Costs | | | | | | | | | | | — | | | | 17,699 | | | | 15,402 | | | | 15,518 | | | | 15,682 | | | | 15,881 | | | | 16,082 | | | | 16,313 | | | | 16,575 | | | | 16,843 | | | | 17,119 | | | | 17,401 | | | | 17,691 | | | | 17,988 | | | | 18,294 | |
| | | | | | | | | | | | | | | | | |
EBITDA | | | | | | | | | | | — | | | | 4,560 | | | | 12,409 | | | | 12,154 | | | | 11,851 | | | | 11,514 | | | | 11,176 | | | | 10,810 | | | | 10,412 | | | | 10,009 | | | | 9,599 | | | | 9,183 | | | | 8,760 | | | | 8,330 | | | | 7,894 | |
| | | | | | | | | | | | | | | | | |
Depreciation | | | | | | | | | | | — | | | | 24,795 | | | | 37,960 | | | | 24,468 | | | | 16,381 | | | | 16,514 | | | | 10,429 | | | | 4,288 | | | | 4,309 | | | | 4,332 | | | | 4,354 | | | | 4,378 | | | | 4,401 | | | | 4,425 | | | | 4,450 | |
| | | | | | | | | | | | | | | | | | | | | | | | | | | | | | | | | | | | | | | | | | | | | | | | | | | | | | | | | | | | | | | | | | | | |
| | | | | | | | | | | | | | | | | |
EBIT | | | | | | | | | | | — | | | | (20,235 | ) | | | (25,551 | ) | | | (12,314 | ) | | | (4,530 | ) | | | (5,000 | ) | | | 747 | | | | 6,522 | | | | 6,103 | | | | 5,677 | | | | 5,244 | | | | 4,805 | | | | 4,359 | | | | 3,905 | | | | 3,444 | |
| | | | | | | | | | | | | | | | | |
Income Tax | | | | | | | 40.7 | % | | | — | | | | (8,245 | ) | | | (10,411 | ) | | | (5,018 | ) | | | (1,846 | ) | | | (2,037 | ) | | | 304 | | | | 2,657 | | | | 2,487 | | | | 2,313 | | | | 2,137 | | | | 1,958 | | | | 1,776 | | | | 1,591 | | | | 1,403 | |
| | | | | | | | | | | | | | | | | | | | | | | | | | | | | | | | | | | | | | | | | | | | | | | | | | | | | | | | | | | | | | | | | | | | |
After-tax Operating Profit | | | | | | | | | | | — | | | | (11,990 | ) | | | (15,140 | ) | | | (7,297 | ) | | | (2,684 | ) | | | (2,963 | ) | | | 443 | | | | 3,865 | | | | 3,616 | | | | 3,364 | | | | 3,108 | | | | 2,847 | | | | 2,583 | | | | 2,314 | | | | 2,040 | |
| | | | | | | | | | | | | | | | | |
Plus: (Increase)/Decrease in Working Capital | | | | | | | | | | | — | | | | (380 | ) | | | (654 | ) | | | 21 | | | | 25 | | | | 28 | | | | 28 | | | | 31 | | | | 33 | | | | 34 | | | | 34 | | | | 35 | | | | 35 | | | | 36 | | | | 36 | |
Less: CAPEX | | | | | | | | | | | — | | | | (18,000 | ) | | | (1,025 | ) | | | (1,046 | ) | | | (1,066 | ) | | | (1,088 | ) | | | (1,109 | ) | | | (1,132 | ) | | | (1,154 | ) | | | (1,177 | ) | | | (1,201 | ) | | | (1,225 | ) | | | (1,249 | ) | | | (1,274 | ) | | | (1,300 | ) |
Plus: Depreciation Benefit | | | | | | | | | | | | | | | 24,795 | | | | 37,960 | | | | 24,468 | | | | 16,381 | | | | 16,514 | | | | 10,429 | | | | 4,288 | | | | 4,309 | | | | 4,332 | | | | 4,354 | | | | 4,378 | | | | 4,401 | | | | 4,425 | | | | 4,450 | |
| | | | | | | | | | | | | | | | | | | | | | | | | | | | | | | | | | | | | | | | | | | | | | | | | | | | | | | | | | | | | | | | | | | | |
Free Cash Flow from Operations | | | | | | | | | | | — | | | | (5,575 | ) | | | 21,141 | | | | 16,147 | | | | 12,656 | | | | 12,492 | | | | 9,790 | | | | 7,051 | | | | 6,804 | | | | 6,552 | | | | 6,295 | | | | 6,035 | | | | 5,770 | | | | 5,501 | | | | 5,227 | |
| | | | | | | | | | | | | | | | | |
PV of Free Cash Flow from Operations | | | | | | | | | | | | | | | (5,365 | ) | | | 18,836 | | | | 13,321 | | | | 9,667 | | | | 8,835 | | | | 6,412 | | | | 4,276 | | | | 3,820 | | | | 3,406 | | | | 3,030 | | | | 2,690 | | | | 2,381 | | | | 2,102 | | | | 1,849 | |
| | | | | | | | | | | | | | | | | |
Sum of PV of Free Cash Flow from Operations | | | 91,407 | | | | | | | | | | | | | | | | | | | | | | | | | | | | | | | | | | | | | | | | | | | | | | | | | | | | | | | | | | | | | | | | | |
48
North Brawley
| | | | |
Depreciation Life | | | 5-Year MACRS | |
Remaining Life | | | 29 | |
Existing Discount Rate | | | 8.00 | % |
Tax Rate | | | 40.75 | % |
Net Capacity (MW) | | | SCE 40 | |
| | | | | | | | | | | | | | | | | | | | | | | | | | | | | | | | | | | | | | | | | | | | | | | | | | | | | | | | | | | | | | | | | | | | |
| | | | | | | | | 2026 | | | 2027 | | | 2028 | | | 2029 | | | 2030 | | | 2031 | | | 2032 | | | 2033 | | | 2034 | | | 2035 | | | 2036 | | | 2037 | | | 2038 | | | 2039 | | | 2040 | |
Total Revenue | | | | | | | | | | | 26,056 | | | | 25,926 | | | | 25,796 | | | | 25,667 | | | | 25,539 | | | | 30,953 | | | | 31,106 | | | | 31,260 | | | | 31,415 | | | | 31,571 | | | | 31,727 | | | | 31,884 | | | | 32,042 | | | | 32,200 | | | | 32,360 | |
| | | | | | | | | | | | | | | | | |
Total Operating Costs | | | | | | | | | | | 18,607 | | | | 18,929 | | | | 19,260 | | | | 19,600 | | | | 19,949 | | | | 20,530 | | | | 20,882 | | | | 21,235 | | | | 21,594 | | | | 21,960 | | | | 22,333 | | | | 22,712 | | | | 23,097 | | | | 23,489 | | | | 23,887 | |
| | | | | | | | | | | | | | | | | |
EBITDA | | | | | | | | | | | 7,449 | | | | 6,997 | | | | 6,537 | | | | 6,068 | | | | 5,590 | | | | 10,423 | | | | 10,225 | | | | 10,025 | | | | 9,821 | | | | 9,610 | | | | 9,394 | | | | 9,172 | | | | 8,945 | | | | 8,712 | | | | 8,472 | |
| | | | | | | | | | | | | | | | | |
Depreciation | | | | | | | | | | | 4,475 | | | | 4,501 | | | | 4,527 | | | | 4,553 | | | | 4,581 | | | | 4,608 | | | | 4,637 | | | | 4,665 | | | | 4,695 | | | | 4,725 | | | | 4,755 | | | | 4,787 | | | | 4,818 | | | | 4,851 | | | | 7,876 | |
| | | | | | | | | | | | | | | | | | | | | | | | | | | | | | | | | | | | | | | | | | | | | | | | | | | | | | | | | | | | | | | | | | | | |
| | | | | | | | | | | | | | | | | |
EBIT | | | | | | | | | | | 2,974 | | | | 2,496 | | | | 2,010 | | | | 1,514 | | | | 1,009 | | | | 5,815 | | | | 5,588 | | | | 5,360 | | | | 5,126 | | | | 4,885 | | | | 4,639 | | | | 4,386 | | | | 4,126 | | | | 3,861 | | | | 596 | |
| | | | | | | | | | | | | | | | | |
Income Tax | | | | | | | 40.7 | % | | | 1,212 | | | | 1,017 | | | | 819 | | | | 617 | | | | 411 | | | | 2,369 | | | | 2,277 | | | | 2,184 | | | | 2,089 | | | | 1,991 | | | | 1,890 | | | | 1,787 | | | | 1,681 | | | | 1,573 | | | | 243 | |
| | | | | | | | | | | | | | | | | | | | | | | | | | | | | | | | | | | | | | | | | | | | | | | | | | | | | | | | | | | | | | | | | | | | |
After-tax Operating Profit | | | | | | | | | | | 1,762 | | | | 1,479 | | | | 1,191 | | | | 897 | | | | 598 | | | | 3,445 | | | | 3,311 | | | | 3,176 | | | | 3,037 | | | | 2,895 | | | | 2,749 | | | | 2,599 | | | | 2,445 | | | | 2,288 | | | | 353 | |
| | | | | | | | | | | | | | | | | |
Plus: (Increase)/Decrease in Working Capital | | | | | | | | | | | 37 | | | | 38 | | | | 38 | | | | 39 | | | | 40 | | | | (403 | ) | | | 17 | | | | 17 | | | | 17 | | | | 18 | | | | 18 | | | | 18 | | | | 19 | | | | 19 | | | | 726 | |
Less: CAPEX | | | | | | | | | | | (1,326 | ) | | | (1,352 | ) | | | (1,380 | ) | | | (1,407 | ) | | | (1,435 | ) | | | (1,464 | ) | | | (1,493 | ) | | | (1,523 | ) | | | (1,554 | ) | | | (1,585 | ) | | | (1,616 | ) | | | (1,649 | ) | | | (1,682 | ) | | | (1,715 | ) | | | (1,750 | ) |
Plus: Depreciation Benefit | | | | | | | | | | | 4,475 | | | | 4,501 | | | | 4,527 | | | | 4,553 | | | | 4,581 | | | | 4,608 | | | | 4,637 | | | | 4,665 | | | | 4,695 | | | | 4,725 | | | | 4,755 | | | | 4,787 | | | | 4,818 | | | | 4,851 | | | | 7,876 | |
| | | | | | | | | | | | | | | | | | | | | | | | | | | | | | | | | | | | | | | | | | | | | | | | | | | | | | | | | | | | | | | | | | | | |
Free Cash Flow from Operations | | | | | | | | | | | 4,948 | | | | 4,665 | | | | 4,376 | | | | 4,083 | | | | 3,783 | | | | 6,187 | | | | 6,471 | | | | 6,335 | | | | 6,196 | | | | 6,052 | | | | 5,906 | | | | 5,755 | | | | 5,601 | | | | 5,443 | | | | 7,206 | |
| | | | | | | | | | | | | | | | | |
PV of Free Cash Flow from Operations | | | | | | | | | | | 1,621 | | | | 1,415 | | | | 1,229 | | | | 1,062 | | | | 911 | | | | 1,380 | | | | 1,336 | | | | 1,211 | | | | 1,097 | | | | 992 | | | | 896 | | | | 809 | | | | 729 | | | | 656 | | | | 804 | |
| | | | | | | | | | | | | | | | | |
Sum of PV of Free Cash Flow from Operations | | | 91,407 | | | | | | | | | | | | | | | | | | | | | | | | | | | | | | | | | | | | | | | | | | | | | | | | | | | | | | | | | | | | | | | | | |
49
| 7. | Discounted Cash Flow Analysis - SCE 45MW Scenario |
North Brawley
| | | | |
Depreciation Life | | | 5-Year MACRS | |
Remaining Life | | | 29 | |
Existing Discount Rate | | | 8.00 | % |
Tax Rate | | | 40.75 | % |
Net Capacity (MW) | | | SCE 45 | |
| | | | | | | | | | | | | | | | | | | | | | | | | | | | | | | | | | | | | | | | | | | | | | | | | | | | | | | | | | | | | | | | | | | | |
| | | | | | | | | 2011 | | | 2012 | | | 2013 | | | 2014 | | | 2015 | | | 2016 | | | 2017 | | | 2018 | | | 2019 | | | 2020 | | | 2021 | | | 2022 | | | 2023 | | | 2024 | | | 2025 | |
Total Revenue (3) | | | | | | | | | | | — | | | | 22,259 | | | | 30,925 | | | | 30,771 | | | | 30,617 | | | | 30,464 | | | | 30,311 | | | | 30,160 | | | | 30,009 | | | | 29,859 | | | | 29,710 | | | | 29,561 | | | | 29,413 | | | | 28,266 | | | | 29,120 | |
| | | | | | | | | | | | | | | | | |
Total Operating Costs | | | | | | | | | | | — | | | | 17,699 | | | | 16,185 | | | | 16,272 | | | | 16,419 | | | | 16,610 | | | | 16,801 | | | | 17,028 | | | | 17,294 | | | | 17,567 | | | | 17,846 | | | | 18,132 | | | | 18,426 | | | | 18,727 | | | | 19,037 | |
| | | | | | | | | | | | | | | | | |
EBITDA | | | | | | | | | | | — | | | | 4,560 | | | | 14,740 | | | | 14,498 | | | | 14,198 | | | | 13,854 | | | | 13,510 | | | | 13,131 | | | | 12,715 | | | | 12,292 | | | | 11,864 | | | | 11,429 | | | | 10,987 | | | | 10,539 | | | | 10,083 | |
| | | | | | | | | | | | | | | | | |
Depreciation (4) | | | | | | | | | | | — | | | | 31,860 | | | | 48,625 | | | | 31,293 | | | | 20,902 | | | | 21,035 | | | | 13,222 | | | | 5,353 | | | | 5,374 | | | | 5,397 | | | | 5,419 | | | | 5,443 | | | | 5,466 | | | | 5,490 | | | | 5,515 | |
| | | | | | | | | | | | | | | | | | | | | | | | | | | | | | | | | | | | | | | | | | | | | | | | | | | | | | | | | | | | | | | | | | | | |
| | | | | | | | | | | | | | | | | |
EBIT | | | | | | | | | | | — | | | | (27,300 | ) | | | (33,885 | ) | | | (16,795 | ) | | | (6,704 | ) | | | (7,181 | ) | | | 288 | | | | 7,779 | | | | 7,340 | | | | 6,896 | | | | 6,444 | | | | 5,986 | | | | 5,521 | | | | 5,048 | | | | 4,568 | |
| | | | | | | | | | | | | | | | | | | | | | | | | | | | | | | | | | | | | | | | | | | | | | | | | | | | | | | | | | | | | | | | | | | | |
| | | | | | | | | | | | | | | | | |
Income Tax(5) | | | | | | | 40.7 | % | | | — | | | | (11,124 | ) | | | (13,807 | ) | | | (6,843 | ) | | | (2,732 | ) | | | (2,926 | ) | | | 117 | | | | 3,170 | | | | 2,991 | | | | 2,810 | | | | 2,626 | | | | 2,439 | | | | 2,250 | | | | 2,057 | | | | 1,861 | |
| | | | | | | | | | | | | | | | | | | | | | | | | | | | | | | | | | | | | | | | | | | | | | | | | | | | | | | | | | | | | | | | | | | | |
After-tax Operating Profit | | | | | | | | | | | — | | | | (16,176 | ) | | | (20,078 | ) | | | (9,951 | ) | | | (3,973 | ) | | | (4,255 | ) | | | 171 | | | | 4,609 | | | | 4,350 | | | | 4,086 | | | | 3,819 | | | | 3,547 | | | | 3,271 | | | | 2,991 | | | | 2,707 | |
| | | | | | | | | | | | | | | | | |
Plus: (Increase)/ Decrease in Working Capital | | | | | | | | | | | — | | | | (380 | ) | | | (848 | ) | | | 20 | | | | 25 | | | | 29 | | | | 29 | | | | 32 | | | | 35 | | | | 35 | | | | 36 | | | | 36 | | | | 37 | | | | 37 | | | | 38 | |
Less: CAPEX | | | | | | | | | | | — | | | | (18,000 | ) | | | (1,025 | ) | | | (1,046 | ) | | | (1,066 | ) | | | (1,088 | ) | | | (1,109 | ) | | | (1,132 | ) | | | (1,154 | ) | | | (1,177 | ) | | | (1,201 | ) | | | (1,225 | ) | | | (1,249 | ) | | | (1,274 | ) | | | (1,300 | ) |
Plus: Depreciation Benefit | | | | | | | | | | | — | | | | 31,860 | | | | 48,625 | | | | 31,293 | | | | 20,902 | | | | 21,035 | | | | 13,222 | | | | 5,353 | | | | 5,374 | | | | 5,397 | | | | 5,419 | | | | 5,443 | | | | 5,466 | | | | 5,490 | | | | 5,515 | |
| | | | | | | | | | | | | | | | | | | | | | | | | | | | | | | | | | | | | | | | | | | | | | | | | | | | | | | | | | | | | | | | | | | | |
Free Cash Flow from Operations | | | | | | | | | | | — | | | | (2,696 | ) | | | 26,673 | | | | 20,316 | | | | 15,888 | | | | 15,721 | | | | 12,312 | | | | 8,862 | | | | 8,604 | | | | 8,340 | | | | 8,073 | | | | 7,801 | | | | 7,525 | | | | 7,245 | | | | 6,960 | |
| | | | | | | | | | | | | | | | | |
PV of Free Cash Flow from Operations | | | | | | | | | | | | | | | (2,595 | ) | | | 23,765 | | | | 16,760 | | | | 12,136 | | | | 11,119 | | | | 8,063 | | | | 5,374 | | | | 4,831 | | | | 4,336 | | | | 3,886 | | | | 3,477 | | | | 3,106 | | | | 2,768 | | | | 2,463 | |
| | | | | | | | | | | | | | | | | |
Sum of PV of Free Cash Flow from Operations | | | 121,338 | | | | | | | | | | | | | | | | | | | | | | | | | | | | | | | | | | | | | | | | | | | | | | | | | | | | | | | | | | | | | | | | | |
50
North Brawley
| | | | |
Depreciation Life | | | 5-Year MACRS | |
Remaining Life | | | 29 | |
Existing Discount Rate | | | 8.00 | % |
Tax Rate | | | 40.75 | % |
Net Capacity (MW) | | | SCE 45 | |
| | | | | | | | | | | | | | | | | | | | | | | | | | | | | | | | | | | | | | | | | | | | | | | | | | | | | | | | | | | | | | | | | | | | |
| | | | | | | | | 2026 | | | 2027 | | | 2028 | | | 2029 | | | 2030 | | | 2031 | | | 2032 | | | 2033 | | | 2034 | | | 2035 | | | 2036 | | | 2037 | | | 2038 | | | 2039 | | | 2040 | |
Total Revenue (3) | | | | | | | | | | | 28,974 | | | | 28,829 | | | | 28,685 | | | | 28,542 | | | | 28,399 | | | | 34,368 | | | | 34,538 | | | | 34,709 | | | | 34,881 | | | | 35,054 | | | | 35,227 | | | | 35,402 | | | | 35,577 | | | | 35,753 | | | | 35,930 | |
| | | | | | | | | | | | | | | | | |
Total Operating Costs | | | | | | | | | | | 19,354 | | | | 19,073 | | | | 20,014 | | | | 20,358 | | | | 20,710 | | | | 21,317 | | | | 21,670 | | | | 22,024 | | | | 22,383 | | | | 22,748 | | | | 23,118 | | | | 23,494 | | | | 23,875 | | | | 24,261 | | | | 24,653 | |
| | | | | | | | | | | | | | | | | |
EBITDA | | | | | | | | | | | 9,621 | | | | 9,150 | | | | 8,671 | | | | 8,184 | | | | 7,689 | | | | 13,051 | | | | 12,868 | | | | 12,685 | | | | 12,498 | | | | 12,306 | | | | 12,109 | | | | 11,908 | | | | 11,702 | | | | 11,492 | | | | 11,277 | |
| | | | | | | | | | | | | | | | | |
Depreciation (4) | | | | | | | | | | | 5,540 | | | | 5,566 | | | | 5,592 | | | | 5,618 | | | | 5,646 | | | | 5,673 | | | | 5,702 | | | | 5,730 | | | | 5,760 | | | | 5,790 | | | | 5,820 | | | | 5,852 | | | | 5,883 | | | | 5,916 | | | | 8,941 | |
| | | | | | | | | | | | | | | | | | | | | | | | | | | | | | | | | | | | | | | | | | | | | | | | | | | | | | | | | | | | | | | | | | | | |
| | | | | | | | | | | | | | | | | |
EBIT | | | | | | | | | | | 4,080 | | | | 3,584 | | | | 3,079 | | | | 2,566 | | | | 2,043 | | | | 7,377 | | | | 7,166 | | | | 6,955 | | | | 6,738 | | | | 6,516 | | | | 6,289 | | | | 6,056 | | | | 5,818 | | | | 5,576 | | | | 2,336 | |
| | | | | | | | | | | | | | | | | | | | | | | | | | | | | | | | | | | | | | | | | | | | | | | | | | | | | | | | | | | | | | | | | | | | |
| | | | | | | | | | | | | | | | | |
Income Tax(5) | | | | | | | 40.7 | % | | | 1,663 | | | | 1,460 | | | | 1,255 | | | | 1 ,046 | | | | 833 | | | | 3,006 | | | | 2,920 | | | | 2,834 | | | | 2,745 | | | | 2,655 | | | | 2,562 | | | | 2,468 | | | | 2,371 | | | | 2,272 | | | | 952 | |
| | | | | | | | | | | | | | | | | | | | | | | | | | | | | | | | | | | | | | | | | | | | | | | | | | | | | | | | | | | | | | | | | | | | |
After-tax Operating Profit | | | | | | | | | | | 2,418 | | | | 2,124 | | | | 1,825 | | | | 1,520 | | | | 1,211 | | | | 4,371 | | | | 4,246 | | | | 4,121 | | | | 3,992 | | | | 3,861 | | | | 3,726 | | | | 3,588 | | | | 3,448 | | | | 3,304 | | | | 1,384 | |
| | | | | | | | | | | | | | | | | |
Plus: (Increase)/Decrease in Working Capital | | | | | | | | | | | 39 | | | | 39 | | | | 40 | | | | 41 | | | | 41 | | | | (447 | ) | | | 15 | | | | 15 | | | | 16 | | | | 16 | | | | 16 | | | | 17 | | | | 17 | | | | 18 | | | | 958 | |
Less: CAPEX | | | | | | | | | | | (1,326 | ) | | | (1,352 | ) | | | (1,380 | ) | | | (1,407 | ) | | | (1,435 | ) | | | (1,464 | ) | | | (1,493 | ) | | | (1,523 | ) | | | (1,554 | ) | | | (1,585 | ) | | | (1,616 | ) | | | (1,649 | ) | | | (1,682 | ) | | | (1,715 | ) | | | (1,750 | ) |
Plus: Depreciation Benefit | | | | | | | | | | | 5,540 | | | | 5,566 | | | | 5,592 | | | | 5,618 | | | | 5,646 | | | | 5,673 | | | | 5,702 | | | | 5,730 | | | | 5,760 | | | | 5,790 | | | | 5,820 | | | | 5,852 | | | | 5,883 | | | | 5,916 | | | | 8,941 | |
| | | | | | | | | | | | | | | | | | | | | | | | | | | | | | | | | | | | | | | | | | | | | | | | | | | | | | | | | | | | | | | | | | | | |
Free Cash Flow from Operations | | | | | | | | | | | 6,671 | | | | 6,376 | | | | 6,077 | | | | 5,772 | | | | 5,462 | | | | 8,134 | | | | 8,470 | | | | 8,343 | | | | 8,214 | | | | 8,082 | | | | 7,947 | | | | 7,808 | | | | 7,667 | | | | 7,522 | | | | 9,533 | |
| | | | | | | | | | | | | | | | | |
PV of Free Cash Flow from Operations | | | | | | | | | | | 2,185 | | | | 1,934 | | | | 1,707 | | | | 1,501 | | | | 1,315 | | | | 1,814 | | | | 1,749 | | | | 1,595 | | | | 1,454 | | | | 1,325 | | | | 1,206 | | | | 1,097 | | | | 997 | | | | 906 | | | | 1,063 | |
| | | | | | | | | | | | | | | | | |
Sum of PV of Free Cash Flow from Operations | | | 121,333 | | | | | | | | | | | | | | | | | | | | | | | | | | | | | | | | | | | | | | | | | | | | | | | | | | | | | | | | | | | | | | | | | |
51
| 8. | Discounted Cash Flow Analysis - SCE 50MW Scenario |
North Brawley
| | | | |
Depreciation Life | | | 5-Year MACRS | |
Remaining Life | | | 29 | |
Existing Discount Rate | | | 8.00 | % |
Tax Rate | | | 40.75 | % |
Net Capacity (MW) | | | SCE 50 | |
| | | | | | | | | | | | | | | | | | | | | | | | | | | | | | | | | | | | | | | | | | | | | | | | | | | | | | | | | | | | | | | | | | | | |
| | | | | | | | | 2011 | | | 2012 | | | 2013 | | | 2014 | | | 2015 | | | 2016 | | | 2017 | | | 2018 | | | 2019 | | | 2020 | | | 2021 | | | 2022 | | | 2023 | | | 2024 | | | 2025 | |
Total Revenue (3) | | | | | | | | | | | — | | | | 22,259 | | | | 33,960 | | | | 33,790 | | | | 33,621 | | | | 33,453 | | | | 33,285 | | | | 33,119 | | | | 32,953 | | | | 32,789 | | | | 32,625 | | | | 32,462 | | | | 32,299 | | | | 32,138 | | | | 31,977 | |
| | | | | | | | | | | | | | | | | |
Total Operating Costs | | | | | | | | | | | — | | | | 17,699 | | | | 16,768 | | | | 17,026 | | | | 17,146 | | | | 17,323 | | | | 17,505 | | | | 17,725 | | | | 17,990 | | | | 18,267 | | | | 18,550 | | | | 18,841 | | | | 19,139 | | | | 19,445 | | | | 19,758 | |
| | | | | | | | | | | | | | | | | |
EBITDA | | | | | | | | | | | — | | | | 4,560 | | | | 17,192 | | | | 16,764 | | | | 16,475 | | | | 16,130 | | | | 15,781 | | | | 15,394 | | | | 14,963 | | | | 14,522 | | | | 14,074 | | | | 13,620 | | | | 13,160 | | | | 12,693 | | | | 12,219 | |
| | | | | | | | | | | | | | | | | |
Depreciation (4) | | | | | | | | | | | — | | | | 34,970 | | | | 56,970 | | | | 40,379 | | | | 26,638 | | | | 25,314 | | | | 16,809 | | | | 7,156 | | | | 6,084 | | | | 6,107 | | | | 6,129 | | | | 6,153 | | | | 6,176 | | | | 6,200 | | | | 6,225 | |
| | | | | | | | | | | | | | | | | | | | | | | | | | | | | | | | | | | | | | | | | | | | | | | | | | | | | | | | | | | | | | | | | | | | |
| | | | | | | | | | | | | | | | | |
EBIT | | | | | | | | | | | — | | | | (30,410 | ) | | | (39,778 | ) | | | (23,615 | ) | | | (10,163 | ) | | | (9,184 | ) | | | (1,029 | ) | | | 8,239 | | | | 8,879 | | | | 8,415 | | | | 7,945 | | | | 7,468 | | | | 6,984 | | | | 6,492 | | | | 5,994 | |
| | | | | | | | | | | | | | | | | |
Income Tax(5) | | | | | | | 40.7 | % | | | — | | | | (12,391 | ) | | | (16,208 | ) | | | (9,622 | ) | | | (4,141 | ) | | | (3,742 | ) | | | (419 | ) | | | 3,357 | | | | 3,618 | | | | 3,429 | | | | 3,237 | | | | 3,043 | | | | 2,846 | | | | 2,645 | | | | 2,442 | |
| | | | | | | | | | | | | | | | | | | | | | | | | | | | | | | | | | | | | | | | | | | | | | | | | | | | | | | | | | | | | | | | | | | | |
After-tax Operating Profit | | | | | | | | | | | — | | | | (18,019 | ) | | | (23,570 | ) | | | (13,993 | ) | | | (6,022 | ) | | | (5,442 | ) | | | (610 | ) | | | 4,882 | | | | 5,261 | | | | 4,986 | | | | 4,708 | | | | 4,425 | | | | 4,138 | | | | 3,847 | | | | 3,552 | |
| | | | | | | | | | | | | | | | | |
Plus: (Increase)/Decrease in Working Capital | | | | | | | | | | | — | | | | (380 | ) | | | (1,053 | ) | | | 36 | | | | 24 | | | | 29 | | | | 29 | | | | 32 | | | | 36 | | | | 37 | | | | 37 | | | | 38 | | | | 38 | | | | 39 | | | | 40 | |
Less: CAPEX | | | | | | | | | | | — | | | | (10,000 | ) | | | (20,000 | ) | | | (1,046 | ) | | | (1,066 | ) | | | (1,088 | ) | | | (1,109 | ) | | | (1,132 | ) | | | (1,154 | ) | | | (1,177 | ) | | | (1,201 | ) | | | (1,225 | ) | | | (1,249 | ) | | | (1,274 | ) | | | (1,300 | ) |
Plus: Depreciation Benefit | | | | | | | | | | | | | | | 34,970 | | | | 56,970 | | | | 40,379 | | | | 26,638 | | | | 25,314 | | | | 16,809 | | | | 7,156 | | | | 6,084 | | | | 6,107 | | | | 6,129 | | | | 6,153 | | | | 6,176 | | | | 6,200 | | | | 6,225 | |
| | | | | | | | | | | | | | | | | | | | | | | | | | | | | | | | | | | | | | | | | | | | | | | | | | | | | | | | | | | | | | | | | | | | |
Free Cash Flow from Operations | | | | | | | | | | | — | | | | 6,571 | | | | 12,347 | | | | 25,376 | | | | 19,574 | | | | 18,813 | | | | 15,119 | | | | 10,938 | | | | 10,227 | | | | 9,952 | | | | 9,673 | | | | 9,390 | | | | 9,103 | | | | 8,812 | | | | 8,516 | |
| | | | | | | | | | | | | | | | | |
PV of Free Cash Flow from Operations | | | | | | | | | | | | | | | 6,323 | | | | 11,001 | | | | 20,935 | | | | 14,952 | | | | 13,306 | | | | 9,901 | | | | 6,632 | | | | 5,742 | | | | 5,174 | | | | 4,656 | | | | 4,185 | | | | 3,757 | | | | 3,367 | | | | 3,013 | |
| | | | | | | | | | | | | | | | | |
Sum of PV of Free Cash Flow from Operations | | | 139,922 | | | | | | | | | | | | | | | | | | | | | | | | | | | | | | | | | | | | | | | | | | | | | | | | | | | | | | | | | | | | | | | | | |
52
North Brawley
| | | | |
Depreciation Life | | | 5-Year MACRS | |
Remaining Life | | | 29 | |
Existing Discount Rate | | | 8.00 | % |
Tax Rate | | | 40.75 | % |
Net Capacity (MW) | | | SCE 50 | |
| | | | | | | | | | | | | | | | | | | | | | | | | | | | | | | | | | | | | | | | | | | | | | | | | | | | | | | | | | | | | | | | | | | | |
| | | | | | | | | 2026 | | | 2027 | | | 2028 | | | 2029 | | | 2030 | | | 2031 | | | 2032 | | | 2033 | | | 2034 | | | 2035 | | | 2036 | | | 2037 | | | 2038 | | | 2039 | | | 2040 | |
Total Revenue (3) | | | | | | | | | | | 31,817 | | | | 31,658 | | | | 31,500 | | | | 31,342 | | | | 31,186 | | | | 37,677 | | | | 37,864 | | | | 38,051 | | | | 38,240 | | | | 38,429 | | | | 38,619 | | | | 38,810 | | | | 39,003 | | | | 39,196 | | | | 39,390 | |
| | | | | | | | | | | | | | | | | |
Total Operating Costs | | | | | | | | | | | 20,080 | | | | 20,410 | | | | 20,749 | | | | 21,096 | | | | 21,453 | | | | 22,086 | | | | 22,441 | | | | 22,796 | | | | 23,156 | | | | 23,521 | | | | 23,890 | | | | 24,264 | | | | 24,643 | | | | 25,026 | | | | 25,412 | |
| | | | | | | | | | | | | | | | | |
EBITDA | | | | | | | | | | | 11,737 | | | | 11,248 | | | | 10,751 | | | | 10,246 | | | | 9,732 | | | | 15,591 | | | | 15,423 | | | | 15,255 | | | | 15,083 | | | | 14,908 | | | | 14,729 | | | | 14,546 | | | | 14,360 | | | | 14,170 | | | | 13,977 | |
| | | | | | | | | | | | | | | | | |
Depreciation (4) | | | | | | | | | | | 6,250 | | | | 6,276 | | | | 6,302 | | | | 6,328 | | | | 6,356 | | | | 6,383 | | | | 6,412 | | | | 6,440 | | | | 6,470 | | | | 6,500 | | | | 6,530 | | | | 6,562 | | | | 6,593 | | | | 6,626 | | | | 9,651 | |
| | | | | | | | | | | | | | | | | | | | | | | | | | | | | | | | | | | | | | | | | | | | | | | | | | | | | | | | | | | | | | | | | | | | |
| | | | | | | | | | | | | | | | | |
EBIT | | | | | | | | | | | 5,487 | | | | 4,972 | | | | 4,449 | | | | 3,917 | | | | 3,377 | | | | 9,208 | | | | 9,011 | | | | 8,814 | | | | 8,614 | | | | 8,408 | | | | 8,198 | | | | 7,984 | | | | 7,766 | | | | 7,544 | | | | 4,326 | |
| | | | | | | | | | | | | | | | | | | | | | | | | | | | | | | | | | | | | | | | | | | | | | | | | | | | | | | | | | | | | | | | | | | | |
Income Tax(5) | | | | | | | 40.7 | % | | | 2,236 | | | | 2,026 | | | | 1,813 | | | | 1,596 | | | | 1,376 | | | | 3,752 | | | | 3,672 | | | | 3,592 | | | | 3,510 | | | | 3,426 | | | | 3,340 | | | | 3,253 | | | | 3,164 | | | | 3,074 | | | | 1,763 | |
| | | | | | | | | | | | | | | | | | | | | | | | | | | | | | | | | | | | | | | | | | | | | | | | | | | | | | | | | | | | | | | | | | | | |
After-tax Operating Profit | | | | | | | | | | | 3,251 | | | | 2,946 | | | | 2,636 | | | | 2,321 | | | | 2,001 | | | | 5,456 | | | | 5,339 | | | | 5,223 | | | | 5,104 | | | | 4,982 | | | | 4,858 | | | | 4,731 | | | | 4,602 | | | | 4,470 | | | | 2,563 | |
| | | | | | | | | | | | | | | | | |
Plus: (Increase)/Decrease in Working Capital | | | | | | | | | | | 40 | | | | 41 | | | | 41 | | | | 42 | | | | 43 | | | | (488 | ) | | | 14 | | | | 14 | | | | 14 | | | | 15 | | | | 15 | | | | 15 | | | | 16 | | | | 16 | | | | 1,181 | |
Less: CAPEX | | | | | | | | | | | (1,326 | ) | | | (1,352 | ) | | | (1,380 | ) | | | (1,407 | ) | | | (1,435 | ) | | | (1,464 | ) | | | (1,493 | ) | | | (1,523 | ) | | | (1,554 | ) | | | (1,585 | ) | | | (1,616 | ) | | | (1,649 | ) | | | (1,682 | ) | | | (1,715 | ) | | | (1,750 | ) |
Plus: Depreciation Benefit | | | | | | | | | | | 6,250 | | | | 6,276 | | | | 6,302 | | | | 6,328 | | | | 6,356 | | | | 6,383 | | | | 6,412 | | | | 6,440 | | | | 6,470 | | | | 6,500 | | | | 6,530 | | | | 6,562 | | | | 6,593 | | | | 6,626 | | | | 9,651 | |
| | | | | | | | | | | | | | | | | | | | | | | | | | | | | | | | | | | | | | | | | | | | | | | | | | | | | | | | | | | | | | | | | | | | |
Free Cash Flow from Operations | | | | | | | | | | | 8,216 | | | | 7,910 | | | | 7,600 | | | | 7,285 | | | | 6,964 | | | | 9,887 | | | | 10,272 | | | | 10,154 | | | | 10,034 | | | | 9,912 | | | | 9,787 | | | | 9,659 | | | | 9,529 | | | | 9,397 | | | | 11,646 | |
| | | | | | | | | | | | | | | | | |
PV of Free Cash Flow from Operations | | | | | | | | | | | 2,692 | | | | 2,400 | | | | 2,135 | | | | 1,894 | | | | 1,677 | | | | 2,205 | | | | 2,121 | | | | 1,941 | | | | 1,776 | | | | 1,624 | | | | 1,485 | | | | 1,357 | | | | 1,240 | | | | 1,132 | | | | 1,299 | |
| | | | | | | | | | | | | | | | | |
Sum of PV of Free Cash Flow from Operations | | | 139,922 | | | | | | | | | | | | | | | | | | | | | | | | | | | | | | | | | | | | | | | | | | | | | | | | | | | | | | | | | | | | | | | | | |
53