SECURITIES AND EXCHANGE COMMISSION
WASHINGTON, DC 20549
FORM 10-K/A
x ANNUAL REPORT PURSUANT TO SECTION 13 OR 15(d) OF THE SECURITIES EXCHANGE ACT OF 1934
For the fiscal year ended December 31, 2006
o TRANSITION REPORT PURSUANT TO SECTION 13 OR 15(d) OF THE SECURITIES EXCHANGE ACT OF 1934
For the transition period from ______ to ______.
Commission file number: 000-117718
ORSUS XELENT TECHNOLOGIES, INC.
(Exact name of registrant as specified in its charter)
Delaware (State of incorporation) | 20-1198142 (I.R.S. Employer Identification No.) |
12th Floor, Tower B, Chaowai MEN Office Building
26 Chaowai Street, Chaoyang Disc.
Beijing, People’s Republic Of China 100020
(Address of principal executive offices, including zip code)
86-10-85653777
(Registrant’s telephone number, including area code)
Securities registered pursuant to Section 12(b) of the Act:
Common Stock, par value $0.001 per share
Securities registered pursuant to Section 12(g) of the Act:
None
Indicate by check mark if the registrant is a well-known seasoned issuer, as defined in Rule 405 of the Securities Act. Yes o No x
Indicate by check mark if the registrant is not required to file reports pursuant to Section 13 or Section 15(d) of the Securities Exchange Act of 1934. Yes o No x
Indicate by check mark whether the registrant: (1) has filed all reports required to be filed by Section 13 or 15(d) of the Securities Exchange Act of 1934 during the preceding 12 months (or for such shorter period that the registrant was required to file such reports), and (2) has been subject to such filing requirements for the past 90 days.
Yes x No o
Indicate by check mark if disclosure of delinquent filers pursuant to Item 405 of Regulation S-K is not contained herein, and will not be contained, to the best of registrant's knowledge, in definitive proxy or information statements incorporated by reference in Part III of this Form 10-K or any amendment to this Form 10-K. o
Indicate by check mark whether the registrant is a large accelerated filer, an accelerated filer, or a non-accelerated filer. See definition of “accelerated filer and large accelerated filer” in Rule 12b-2 of the Exchange Act.
Large accelerated filer o Accelerated filer o Non-accelerated filer x
Indicate by check mark whether the registrant is a shell company (as defined in Rule 12b-2 of the Exchange Act). Yes o No x
As of June 29, 2007, the aggregate market value of the registrant’s common stock held by non-affiliates of the registrant was $50,170,400 based on the closing price as reported on the American Stock Exchange.
Indicate the number of shares outstanding of each of the issuer’s classes of common stock, as of the latest practicable date.
Class | Outstanding at February 15, 2008 | |
Common Stock, $.001 par value per share | 29,756,000 shares |
This Annual Report amends and supplements the Form 10-K of Orsus Xelent Technologies, Inc. for the fiscal year ended December 31, 2006, filed with the Securities and Exchange Commission on April 2, 2007, as follows:
PART II
| Item 5. | Market For Registrant’s Common Equity, Related Stockholder Matters and Issuer Purchases of Equity Securities. |
The following graph compares the cumulative total return to shareholders on the Company’s common stock from April 30, 2005 (the first month quotations of the Company’s common stock were available) through December 31, 2007, relative to the cumulative total returns of the Russell Microcap Index+ and a customized peer group of three companies, which are: Wireless Telecom Group, Inc., Axesstel Inc. and Wireless Xcessories Group, Inc. (the “Peer Group”).
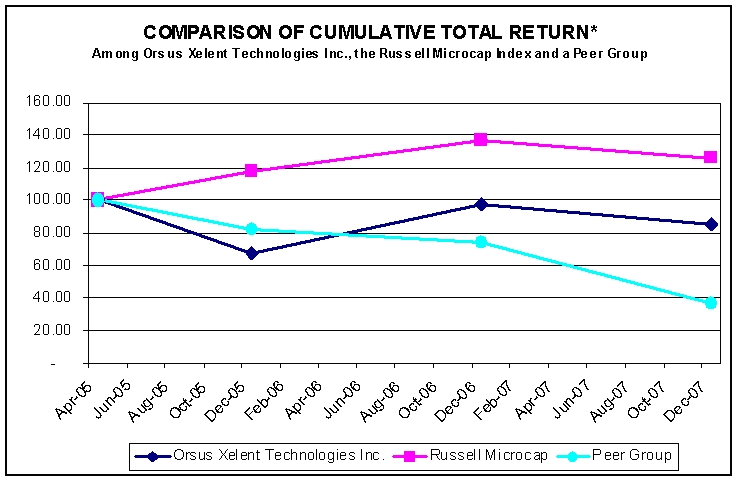
| * | $100 invested on April 30, 2005 in stock or index, including reinvestment of dividends. |
4/30/05 | 12/31/05 | 12/31/06 | 12/31/07 | ||||||||||
Orsus Xelent Technologies Inc. | 100.00 | 67.00 | 98.00 | 85.00 | |||||||||
Russell Microcap | 100.00 | 117.81 | 137.30 | 126.31 | |||||||||
Peer Group | 100.00 | 82.65 | 74.01 | 36.46 | |||||||||
The stock price performance included in this graph is not necessarily indicative of future stock price performance.
1
| Item 6. | Selected Financial Data. |
The following selected financial data has been extracted from our financial statements for the year ended December 31, 2006. This selected financial data should be read in conjunction with the consolidated financial statements and the notes to the consolidated financial statements starting on page F-1 and with “Management’s Discussion and Analysis of Financial Condition and Results of Operations.”
Consolidated Statements of Operations | Year Ended December 31, | |||||||||
2006 | 2005 | 2004 | ||||||||
(in thousands, except share and per share amounts) | ||||||||||
| Revenues | $ | 68,108 | $ | 28,705 | $ | 70,822 | ||||
| Operating Expenses | 60,102 | 25,711 | 62,164 | |||||||
| Other Income - Interest, net | 75 | 544 | 64 | |||||||
| Net Income | 6,718 | 3,492 | 8,699 | |||||||
| Weighted Average Common Shares Outstanding (Basic and diluted) | 29,756 | 29,756 | 29,756 | |||||||
| Net Income Per Common Share - Basic and Diluted | 0.23 | 0.12 | 0.29 | |||||||
Consolidated Balance Sheets | As of December 31, | |||||||||
2006 | 2005 | 2004 | ||||||||
(in thousands) | ||||||||||
| Current Assets | $ | 45,567 | $ | 30,230 | $ | 28,243 | ||||
| Total Assets | 45,887 | 31,011 | 29,021 | |||||||
| Current Liabilities | 23,604 | 16,072 | 17,923 | |||||||
| Total Liabilities | 23,604 | 16,072 | 17,923 | |||||||
| Total Stockholders’ Equity | 22,283 | 14,939 | 11,098 | |||||||
2
| Item 7. | Management’s Discussion and Analysis of Financial Condition and Results of Operations. |
The following table sets forth our statements of operations for the fiscal years ended December 31, 2006, 2005 and 2004, respectively:
Results of Operations | Year Ended December 31, | |||||||||
2006 | 2005 | 2004 | ||||||||
(in thousands, except share and per share amounts) | ||||||||||
| Revenues | $ | 68,108 | $ | 28,705 | $ | 70,822 | ||||
| Costs of Sales | 55,226 | 22,272 | 56,231 | |||||||
| Sales & Marketing Expenses | 1,045 | 1,554 | 3,314 | |||||||
| General & Admin Expenses | 1,560 | 1,064 | 1,435 | |||||||
| R&D Expenses | 255 | 413 | 586 | |||||||
| Depreciation & Amortization | 175 | 310 | 598 | |||||||
| Allowance for Obsolete Inventory | 1,387 | 98 | - | |||||||
| Allowance for Trading Deposit Receivable | - | - | - | |||||||
| Loss on Disposal of property, Plant and Equipment | 454 | - | - | |||||||
| Interest Expenses | 116 | 25 | 143 | |||||||
| Other Income, net | 75 | 544 | 64 | |||||||
| Income Before Taxes and Minority Interest | 7,965 | 3,513 | 8,579 | |||||||
| Minority Interest | - | - | 120 | |||||||
| Income Tax | 1,247 | 21 | - | |||||||
| Net Income | 6,718 | 3,492 | 8,699 | |||||||
| Weighted Average Common Shares Outstanding | 29,756 | 29,756 | 29,756 | |||||||
| Net Income Per Common Share -Basic and Diluted | 0.23 | 0.12 | 0.29 | |||||||
Results of operation
Years Ended December 31, 2006 and 2005
Revenues
Our revenues were $68,108,000 for the twelve months ended December 31, 2006, representing an increase of 137.27% as compared to 28,705,000 in the Fiscal Year 2005. After going through an environment of reformation in the cellular phone market in 2005, we adjusted our business model, our market position and our strategy and improved our technology and the quality of our products, in terms of both function and appearance. We believe that we are now in a much better position to deal with the rapidly changing and competitive market for cellular phone products in the PRC. Also, we are better prepared to take advantage of the rejuvenated cellular phone market that has resulted from the reduction in the monthly fee charged by telecommunication providers in the second quarter of 2006.
We continued cooperating with telecommunication operators and expanded the sales of our CDMA products, which accounted for 37% of our total revenues for the year ended December 31, 2006, representing an increase of 398%, compared to 2005. Meanwhile, the sales of GSM products have remained relatively stable. Our business strategy emerged in the second quarter and took effect in the third and fourth quarters.
3
Our mid-level and low-end products contain a number of attractive features, such as MP3, MPEG4, video recording and outer card storage. Our high-end products contain those same features as well as PDA, GPRS and office software function, special industry applications and other attractive features and functions. The appearance of all our products is in line with the latest trends, including being ultra slim and using metal casing, and they have been well received by our customers. We introduced a middle-grade dual mode cellular phone with both GSM & CDMA applications in the third quarter to meet demand in the market for this type of product.
In 2006, we withdrew from the overseas market and restructured our product strategy to focus on the development of mobile phones for customers in the PRC. As an emerging enterprise, we believed it was very important to increase our market share in the large domestic market of the PRC.
Products Segment
For the year ended December 31, 2006, products which contributed over 10% of our revenues are shown as follows:
Twelve months ended December 31, 2006 | |||||||
$’000 | % of revenue | ||||||
| D8120 | 10,805 | 15.86 | % | ||||
| C8000 | 10,442 | 15.33 | % | ||||
| D8110 | 10,124 | 14.86 | % | ||||
| Daxian X5 | 8,395 | 12.33 | % | ||||
| Others | 17,923 | 26.32 | % | ||||
In 2006, we continued our self-developed handsets business and jointly cooperated with our R&D partners, which took 53% of the total revenue, representing a decrease of 5%, as compared to 58% in 2005; we also developed trade sales activities in order to widen our revenue streams, which took 47% of the total revenue in 2006, representing an increase of 5%, as compared to 42% in 2005. The increase in the portion of trading mobile phones activities subsequently provides a risk-control on R&D investments and materials-ordering in facing the competition from the ‘black market’ (counterfeit) cellular phones in the PRC, because the business cycle of trade sales is shorter than R&D models, which made us forestall the ‘black market’ cellular phones in the market.
The total revenue for the twelve months ended December 31, 2006 amounted to $68,108,000, of which the sale of GSM products in this period accounted for $43,064,000, or 63.23%, of our total revenue. The GSM products mainly included, D8120 ($10,805,000), D8110 ($10,124,000), Daxian X5 ($8,395,000), and others ($13,740,000). The sales of CDMA was $25,044,000, representing 36.77% of our total revenue, which included C8000 ($10,442,000), C300 ($4,572,000), C200 ($3,373,000), C109 ($2,474,000), and others ($4,183,000). CDMA sales have sharply increased by $20,012,000, or 397.69%, as compared to $5,032,000 in fiscal year 2005.
4
Our GSM products are mainly purchased from China Electronic Apparatus Company and Beijing Dong Fang Long Yu Trading Company, which include D8120 (ultra thin, slide PDA with MP3, MEPG4, Camera, T-Flash Card, handwriting touch screen), D8110 (ultra thin, slide PDA with MP3, MEPG4, Camera, T-Flash Card), and X5 (ultra thin with MP3, MEPG4, Camera, T-Flash Card). Our CDMA products are mainly purchased from Tian Feng Ju Yuan Technology Company Limited, Beijing Tian Hong Bo Communication Apparatus Company Limited and Dalian Daxian Telecom Co., Ltd, which include C8000 (a high-end PDA with MP3, MEPG4, Camera, T-Flash Card, GSM & CDMA Simultaneous Standby Dual Mode handset), C300 (a high-end cell phone with colorful screen, MP3, Camera and IM System), C200 (a low-end shell phone with colorful screen, MP3, Camera), and C109 (a low-end bar phone with colorful screen).
Customers Segment
Twelve months ended December 31, 2006 | |||||||
$’000 | % of revenue | ||||||
| Beijing Xingwang Shidai Tech & Trading Co., Ltd. | 36,406 | 53.45 | % | ||||
| CEC Cellular Limited | 12,902 | 18.94 | % | ||||
| CECT-Chinacomm Communications Co., Ltd | 10,485 | 15.39 | % | ||||
| Others | 208 | 0.31 | % | ||||
Subtotal (Domestic) | 60,001 | 88.10 | % | ||||
| Singapore ST | 6,112 | 8.97 | % | ||||
| Singapore CEO | 1,995 | 2.93 | % | ||||
Subtotal (Overseas) | 8,107 | 11.90 | % | ||||
Our revenues were primarily derived from three major domestic customers. For the twelve months ended December 31, 2006, our revenues generated from Beijing Xingwang Shidai Tech & Trading Co., Ltd. (“XWSD”), CEC Cellular Limited (“CECM”) and CECT-Chinacomm Communications Co., Ltd (“CECT-Chinacom”) were $36,406,000, $12,902,000, and $10,485,000 respectively. XWSD has been one of the most important customers of Xelent for a long period of time. The sales to XWSD accounted for 53.45% of the total revenues in 2006. The other two major domestic customers accounted for 18.94% (CECM) and 15.39% (CECT-Chinacom) respectively. Both XWSD and CECM are distributors and dealers in mainland PRC, and their sales networks cover most of the major cities in the PRC. CECT-Chinacom is a new customer which began to cooperate with us from the fourth quarter of 2006. CECT-Chinacom is a telecommunication devices and services operator. In the overseas market, we distribute our products to two Singapore customers, ST Electronics (Info-Software Systems) Pte Ltd. and Chartered Electro-Optics Pte Ltd. The revenues generated from these two companies were $8,107,000, or 11.90% of the total revenue.
5
Other income, net
For the twelve months ended December 31, 2006, other net income was $75,000, or 0.11% of the total revenues. There was a significant decrease as compared with $544,000 of other net income in the same period of 2005. The decrease in other income, net in 2006 was primarily due to the once-off royalty fee rebate amounting to $309,000 in the second quarter of 2005.
Operating expenses
For the twelve months ended December 31, 2006, our operating expenses amounted to $60,102,000. The operating expenses mainly included sales and marketing, general and administrative and R & D expenses and depreciation shown and compared with the same period in 2005 as follows:
Twelve months ended December 31, 2006 | Twelve months ended December 31, 2005 | Comparison | |||||||||||||||||
$’000 | % of revenue | $’000 | % of revenue | $’000 | % | ||||||||||||||
| Cost of sales | 55,226 | 81.09 | % | 22,272 | 77.59 | % | 32,954 | 147.96 | % | ||||||||||
| Sales & Marketing | 1,045 | 1.53 | % | 1,554 | 5.41 | % | (509 | ) | -32.75 | % | |||||||||
| General & Admin | 1,560 | 2.29 | % | 1,064 | 3.71 | % | 496 | 46.62 | % | ||||||||||
| R&D | 255 | 0.37 | % | 413 | 1.44 | % | (158 | ) | -38.26 | % | |||||||||
| Depreciation | 175 | 0.26 | % | 310 | 1.08 | % | (135 | ) | -43.55 | % | |||||||||
| Allowance for Obsolete Inventory | 1,387 | 2.04 | % | 98 | 0.34 | % | 1,289 | 1315.31 | % | ||||||||||
| Loss on Disposal of Property, Plant and Equipment | 454 | 0.67 | % | - | - | 454 | 100.00 | % | |||||||||||
Total | 60,102 | 88.25 | % | 25,711 | 89.57 | % | 34,391 | 133.76 | % | ||||||||||
Cost of Sales
For the twelve months ended December 31, 2006, our cost of sales was $55,226,000, or 81.09% of revenue. The cost of sales to revenues was 77.59% for the corresponding period in 2005, resulting in an increase of 3.50%. The principal reason for this increase was the keen competition in the cellular phone industry in the PRC. The pressure on price cutting in our selling price was greater than the reduction in our purchase cost. Additionally $8,107,000 of the sales in the second quarter of 2006 was overseas trading, which have generally lower margins as compared to our domestic sales.
Sales and marketing expenses
Sales and marketing expenses mainly represent payments made to sales personnel, cost of provision for after-sales services, and marketing and transportation costs.
For the twelve months ended December 31, 2006, sales and marketing expenses were $1,045,000, or 1.53% of total revenue, as compared to $1,554,000, or 5.41% of total revenue for the corresponding period in 2005. This constituted a decrease of 32.75% as compared to the corresponding period in 2005. This decrease was due to the reduction in the number of personnel. In addition, the after-sales service expense was reduced as a result of the increase of the portion of trading of cellular phones, where no after-sales service is provided for the trading activities.
6
R&D expenses
Our R&D expenses were $255,000 or 0.37% of total revenue for the twelve months ended December 31, 2006, which represents a 38.26% decrease, as compared with $413,000 or 1.44% of total revenues in the same period of 2005. This decrease in R&D expenses was attributable to an increase in our trading activities and the change of the business model to purchase mature projects instead of R&D independently. The reduction of staff further decreased our R&D expenses.
General and administrative expenses
General and administrative expenses primarily consisted of compensation for personnel, depreciation, travel expenses, rental, materials expenses related to ordinary administration and fees for professional services.
For the twelve months ended December 31, 2006, general and administrative expenses were $1,560,000, which represented 2.29% of total revenue. Included in general and administrative expenses was an allowance for doubtful accounts amounting to $767,000, due primarily to the uncertainty of long outstanding accounts receivable and trade deposits. Except for the allowance factor, general and administrative expenses were $793,000 or 1.16% of the total revenue and represented a decrease of $122,000 or 13.22%, as compared to $915,000 in 2005. Since the second half of 2005, we adjusted our business strategy and eliminated some personnel, which made ordinary staff costs, including wages and insurance for personnel, decrease.
Allowance for repairs and returns
For the twelve months ended December 31, 2006, the allowance for repairs and returns was $146,203, representing a decrease of $294,244 or 66.81% as compared to $440,447 for the corresponding period in 2005.
Allowance for obsolete inventories
For the twelve months ended December 31, 2006, allowance for obsolete inventories was $1,387,000, which was due to the provision for certain aged materials of mobile models whose production had been terminated.
Gross profit and gross profit margin
For the twelve months ended December 31, 2006, our gross profit was $12,882,000. Our gross profit margin for the reporting period was 18.91%, which represented a 3.5% decrease, as compared to 22.41% for 2005.
The changes in our gross profit margin are attributable to:
| 1. | Competition from domestic cellular manufacturers and overseas cellular providers through strategic price-cutting. We believe that the keys to strengthening our competitiveness in the market are our products strategy of providing tailor-made products to operators and supplying specialized application mobile terminals to end-users of special government and business sectors; diversification of our product lines to minimize competition from similar products in the market; and maintaining sufficient revenues streams and earning abilities. |
7
| 2. | The gross profit of overseas trade being relatively low. We have continued to develop our overseas customers since the second quarter of 2006. At the beginning stage of the development of overseas customers, the price of our products was designed to be favorable and attractive to our customers, and the gross profit of overseas was approximately 15% |
| 3. | An increase in the sales of low-ended products. The demand for low-end products was stimulated by the reduction of monthly charges by telecommunications operators. |
Net income
For the twelve months ended December 31, 2006, our net income was $6,718,000, or net profit margin 9.86%, representing an increase of 3,226,000 or 92.38%, as compared to $3,492,000, or net profit margin of 12.17% in 2005. The improvement in our net profit was due primarily to the fact that we were successful in changing the new business strategy, and positioning in the domestic market played an important part in the increase in our net income. The improvement in net income was also a result of a 30% decline in labor costs resulting from our cost control efforts.
However, our net profit margin decreased by 2.30%, as compared to last year, which is mainly because:
| 1. | In 2006, the allowance for obsolete inventories and doubtful accounts amounted to $1,387,000 and $767,000, respectively, and the loss on the disposal of old models amounted to $454,000. |
| 2. | Income tax totaled $1,247,000 in 2006. |
Other than the two factors above, our net profit was $10,573,000 and net profit margin reached 15.52%, representing an increase of $6,833,000, as compared to net income of $3,740,000 for 2005 (other than the provision of $98,000 and $141,000 for obsolete inventories and for trade receivable doubtful accounts, respectively). Our profitability increased substantially in 2006.
8
Years Ended December 31, 2005 and 2004
Revenues
Our revenues for 2005 were $28,705,000 in 2005, representing a decrease of 59.47% as compared to the same period in 2004. The decrease was primarily due to fierce competition in the PRC cellular phone market. The cellular phone manufacturer’s enlarging production capability during the past years and the rapid growth of the industry, together with the accelerating speed of new products launched, all contributed to a shorter products lifecycle and over supply of obsolete inventory. Additionally, competition from the counterfeit and “black market” cellular phones in the PRC market affected the operations and market environment of the PRC cellular phones industry. In order to meet changing market demands, we developed series of new products with innovative functions and extended our product lines by using our newly developed platform SpreadTrum and MTK in the second half of the year.
Our revenues increased from $3,440,000 in the first half of the year to $25,265,000 in the second half of the year, representing 88.02% of the revenues for the year ended December 31, 2005. The significant growth in revenues was primarily due to the introduction of a series of new products with innovative functions, such as 70A, 62+, 8205, 60+, M72 and M36. During 2005, multimedia cellular phones were the mainstream product in the market. We captured the latest demand trend of the domestic consumption market to launch new models with leading features including MP3, MPEG4, FM radio and large memory capacity. Such new products also generated a higher profit margin for us.
Additionally, in the second half of 2005, we changed our strategy to develop cellular phones for platforms other than the GSM system. We adopted a strategy to strengthen cooperation with telecommunications operators and other cellular phone manufacturers to provide solution consultation in the production of CDMA cellular phone model C100. The solution consultation included knowledge of the software application, field testing, mechanical and molding design and marketing. Through co-operation with telecommunications operators and other cellular phone manufacturers, we participated in the production of CDMA cellular phones and also built relationships with the telecommunications operators, providing us with opportunities to develop a potential CDMA market and generate additional orders from the telecommunications operators in the future. During this quarter, sales of C100 phones were $5,032,000, representing 17.53% of our revenues.
In addition, during this quarter, we commenced cellular phone trading activities with domestic and overseas customers. In the domestic market, we still can earn profits by using our existing strategic partners’ sales networks, although the margin would be lower than the sales of self-produced cellular phones. In the overseas market, we sold over 10,000 units of M18+ to a customer in Hong Kong during the last quarter of 2005.
Product Segment
For the year ended December 31, 2005, products contributing over 5% of our revenues are shown as follows:
Twelve months ended December 31, 2005 | |||||||
$’000 | % of revenue | ||||||
C100 | 5,032 | 17.53 | % | ||||
N108 | 2,326 | 8.10 | % | ||||
8068 | 2,326 | 8.10 | % | ||||
OS70+ | 1,959 | 6.82 | % | ||||
K600 | 1,443 | 5.03 | % | ||||
9
The sales of OS70+, represented 6.82% of our revenues and resulted from the new products launched in 2005. In the second half of 2005, total sales of new products were over $4,410,000, representing 15.36% of total revenues.
The sales of C100 amounted to $5,032,000, representing 17.53% of revenues, which was the result of cooperation with telecommunications operators. The trading activities generated from the sales of GSM cellular phones N108 and 8068 and CDMA cellular phone K600 were $2,326,000, $ 2,326,000 and $1,443,000, respectively, representing 8.10%, 8.10% and 5.03% of revenues, respectively. Through the introduction of new innovative features models and the development of new business streams, our revenues achieved stable growth since this quarter.
Customers Segment
Twelve months ended December 31, 2005 | |||||||
$’000 | % of revenue | ||||||
| Beijing Xingwang Shidai Tech & Trading Co., Ltd. | 16,175 | 56.35 | % | ||||
| Hebei Mascot Communication Equipment Co., Ltd. | 5,871 | 20.45 | % | ||||
| CEC Cellular Limited | 5,777 | 20.13 | % | ||||
| Others | 882 | 3.07 | % | ||||
Our revenues were primarily derived from three major customers. For the year ended December 31, 2005, our revenues were mainly generated from orders from Beijing Xingwang Shidai Tech & Trading Co., Ltd. (“XWSD”), Hebei Mascot Communication Equipment Co., Ltd. (“MASCOT”) and CEC Cellular Limited (“CECM”) were $16,175,000, $5,871,000 and $5,777,000 respectively, which represents 56.35%, 20.45% and 20.13% of the revenue respectively. We established a strategic partnership with CECM and XWSD for a long period of time, both of which are provincial and national distributors and dealers, with sales networks covering most of the main cities of the PRC. MASCOT is a newly developed provincial distributor since the 3rd quarter of 2005, and its sales networks cover most of the main cities of the PRC, particularly in the northern region.
It is our primary policy to broaden our distribution channels so as to minimize the concentration risk of few distributors. We will explore other opportunities to further develop our distribution channels. To enhance healthy competition, MASCOT is mainly responsible for distributing our old products. Through the cooperation with different strategic partners in different areas, we believe we can further extend our distribution channels and stimulate our revenues in the short-run and also strengthen our brand awareness.
Other income, net
For the year ended December 31, 2005, other income, net was $544,000, and accounted for 1.62% of total revenue, as compared to $64,000, or 0.09% of total revenue for the corresponding period in 2004. Other income, net had a sharp period-to-period increase that is mainly due to a royalty fee rebate amounting to $309,000 in the 2nd quarter of 2005.
10
Operating expenses
For year ended December 31, 2005, operating expenses mainly included sales and marketing expenses, general and administrative expenses and R & D expenses shown as follows:
Twelve months ended December 31, 2005 | Twelve months ended December 31, 2004 | Comparison | |||||||||||||||||
$’000 | % of revenue | $’000 | % of revenue | $’000 | % | ||||||||||||||
| Cost of sales | 22,272 | 77.59 | % | 56,231 | 79.40 | % | (33,959 | ) | (60.39 | %) | |||||||||
| Sales & marketing exp. | 1,554 | 5.41 | % | 3,314 | 4.68 | % | (1,760 | ) | (53.11 | %) | |||||||||
| General & admin. Exp. | 1,064 | 3.71 | % | 1,435 | 2.03 | % | (371 | ) | (25.85 | %) | |||||||||
| R&D | 413 | 1.44 | % | 586 | 0.83 | % | (173 | ) | (29.52 | %) | |||||||||
| Allowance for Obsolete Inventory | 98 | 0.34 | % | - | - | 98 | 100.00 | % | |||||||||||
| Depreciation | 310 | 1.08 | % | 598 | 0.84 | % | (288 | ) | (48.16 | %) | |||||||||
Total | 25,711 | 89.57 | % | 62,164 | 87.77 | % | (36,453 | ) | (58.64 | %) | |||||||||
Cost of sales
For the year ended December 31, 2005, our cost of sales were $22,272,000, representing 77.59% of revenue, compared to $56,231,000 and 79.40% of revenue for the corresponding period in 2004. Compared to the corresponding period in 2004, the cost of sales had a period-to-period decrease of 60.39%, which corresponded with our sales revenues decrease of 59.47%. Although the fierce competition led to the cutting of sales prices for old products, the cost of sales percentage to revenues can be maintained through our effective control of raw materials used and negotiation of lower materials prices with suppliers, as well as the high profit margin of our new products launched in the second half of the year.
Sales and marketing expenses
Sales and marketing expenses mainly consisted of free-gifts and product models to customers and dealers respectively, the cost of provision for after-sales services, remunerations for sales personnel and development of our market.
For the year ended December 31, 2005, sales and marketing expenses were $1,554,000, accounting for 5.41% of the total revenues, as compared to $3,314,000, or 4.68% of total revenues for the corresponding period in 2004. Sales and marketing expenses had a period-to-period decrease of 53.11%. The percentage in total revenues increased from 4.68% to 5.41% as compared to the corresponding period in 2004 were due to the decrease of total revenue and the lack of change in expenses. A large portion of sales and marketing expenses were fixed expenses, such as remunerations for sales personnel. Compared to the period ended June 30, 2005, the percentage of total revenues decreased from 20.38% to 5.41% due to the sharp recovery of our revenues and our effective control of the cost of marketing, including remunerations for sales personnel, after-sales repair cost and free-gift and product model to customers and dealers.
11
R&D expenses
The R&D costs were $413,000 for the year ended December 31, 2005, which represented 1.44% of total revenue, compared with $586,000 and 0.83% of total revenue respectively in the same period in 2004. R&D expenses incurred in 2004 were due to ADI platform development expenses and research expenses for several models of mobile phones. R&D expenses incurred in the year were due to development costs on platforms for SPREADTRUM and MTK (MediaTek), two dominant cellphone chip suppliers in the PRC. Some innovative features functions, such as MP3, MPEG4 and U-disk could be developed with the utilization of these new platforms.
Our R&D investment will allow us to respond to market changes quickly. We introduced many models of cellular phones with innovative functions this quarter, such as OS70+, M62+ and OX8205. We expect the investment in R&D activities to continue next year. We believe that our R&D activities will strengthen our technologies, reduce the costs of existing products and also provide future revenue streams through the launch of new innovative products.
General and administrative expenses
General and administrative expenses consisted of compensation for personnel, travel expenses, materials expenses related to ordinary administration and fees for professional services.
For the year of December 31, 2005, general and administrative expenses were $1,064,000, accounting for 3.71% of the total revenues, as compared to $1,435,000, or 2.03% of the total revenues for the corresponding period in 2004. General and administrative expenses had a period-to-period decrease of 25.85%. This decrease was due to a reduction in personnel and personnel compensation, and the reduction of daily expenses by economizing travel expenses and administrative expenses.
Gross profit and gross margin
For the year December 31, 2005, our gross profit was $6,335,000, which represented a decrease of 56.58% as compared to the gross profit of $14,591,000 in the same period in 2004. Our gross margin for the last quarter of 2005 increased slightly from 20.06% in 2004 to 22.07% in 2005.
A slight increase in our gross margin under fierce market competition is attributable to new products successfully launched into the market and changes in our product mix. Although our gross margin decreased due to price reductions for sales promotions, it was offset by the high gross margin of new products such as CDMA cellular phone C100. Overall, the gross margin slightly increased. We tried to make use of raw materials effectively and reduce materials prices by negotiating with suppliers in order to control our cost of sales.
Net income
For the year ended of December 31, 2005, net income was $3,492,000, as compared to $8,699,000 for the same period in 2004. The reduction is due to a difficult market environment since the fourth quarter of 2004, created by such factors as competition from ‘black market’ (counterfeit) cell phones in the PRC market and customer demand for music phones rather than camera phones. Compared with the second quarter of 2005, our net income increased sharply from a net loss of $524,000 to net income of $4,016,000 in the second half of 2005.
12
| Item 8. | Financial Statements and Supplementary Data. |
Reference is made to pages F-1 through F-12 comprising a portion of this annual report on Form 10-K.
PART III
| Item 10. | Directors, Executive Officers and Corporate Governance. |
Compensation Committee Interlocks and Insider Participation in Compensation Decisions
During the last fiscal year, none of the Company’s executive officers served on the board of directors or compensation committee of any other entity whose executive officers served either the Company’s Board of Directors or Compensation Committee.
Audit Committee Report
As of December 31, 2006, our Board of Directors had not established an audit committee. The Audit Committee was established subsequent to the fiscal year end on December 31, 2006, and is composed of non-management Directors. It is currently composed of three independent Directors, Nathaniel K. Hsieh (Chair), Howard S. Barth and Zhixiang Zhang, and operates under the written Audit Committee charter adopted by the Board of Directors on February 7, 2007.
Under its charter, the Audit Committee provides assistance and guidance to the Board in fulfilling its oversight responsibilities to the Company’s stockholders with respect to the Company’s corporate accounting and reporting practices as well as the quality and integrity of the Company’s financial statements and reports. The Company’s principal executive officer and principal financial officer have the primary responsibility for the financial statements and the reporting process, including the systems of internal controls. The Company’s independent auditors are responsible for auditing the Company’s financial statements and expressing an opinion on the conformity of the audited financial statements with generally accepted accounting principles. The Audit Committee’s responsibility is to monitor and oversee these processes.
As the Audit Committee had not held a meeting prior to the filing of the annual report on Form 10-K and the members of the Audit Committee were not involved in the review and approval of this annual report on Form 10-K, the Board of Directors as a whole reviewed and discussed the audited financial statements of the Company for the fiscal year ended December 31, 2006 with management and Moores Rowland Mazars, the Company’s independent auditor. The Board of Directors as a whole discussed with Moores Rowland Mazars certain matters related to the conduct of the audit as required by Statement on Auditing Standards 61, as amended by Statement on Auditing Standards 90. In addition, the Audit Committee has received from Moores Rowland Mazars the written disclosures and the letter regarding the auditor’s independence required by Independence Standards Board Standard No. 1 and has discussed with Moores Rowland Mazars its independence.
13
In reliance on the reviews and discussions described above, the Board of Directors decided that the Company’s audited financial statements for the fiscal year ended December 31, 2006 be included in the Company’s Annual Report on Form 10-K for the year ended December 31, 2006.
The Board of Directors acting as a whole selected Moores Rowland Mazars as the Company’s independent auditors for the fiscal year ending December 31, 2007. Now that the Audit Committee has been established, the selection of auditors will be determined by the Audit Committee. This matter is not being submitted to the stockholders for approval as this is not required under applicable law.
Following the reorganization of Moores Rowland Mazars (the "Former Auditors") on June 1, 2007, eight of its partners have joined Mazars CPA Limited and the Former Auditors changed its name to Moores Rowland. As such, the Former Auditors resigned as the independent auditors of the Company, effective June 29, 2007. The Audit Committee of the Board of Directors of the Company (the "Audit Committee") approved the resignation of the Former Auditors on June 29, 2007.
As key members of the Former Auditors servicing the Company previously have joined Mazars CPA Limited, the Audit Committee appointed Mazars CPA Limited as the Company's new independent auditors (the "New Auditors"), effective from June 29, 2007.
BOARD OF DIRECTORS
Wang Xin
Liu Yu
Naizhong Che
Peng Wang
Zhixiang Zhang
Nathaniel K. Hsieh
Howard S. Barth
AUDIT COMMITTEE
Nathaniel K. Hsieh (Chair)
Howard S. Barth
Zhixiang Zhang
| Item 11. | Executive Compensation. |
Compensation Committee Report
As of December 31, 2006, our Board of Directors had not established a compensation committee. The Compensation Committee was established subsequent to the fiscal year end on December 31, 2006, and is composed of non-management Directors. It is currently composed of Naizhong Che (Chair), Zhixiang Zhang and Peng Wang, each of whom is independent under applicable SEC and American Stock Exchange Rules. Prior to this time, the entire Board of Directors acted as the Compensation Committee. The Compensation Committee operates under the written Compensation Committee charter adopted by the Board of Directors on February 7, 2007 and approves salary practices and performance objectives for executive officers, including the Chief Executive Officer. The Compensation Committee also evaluates the performance of the executive officer in light of those goals and objectives, and determines the compensation for the executive officers.
14
The Company’s policy in compensating executive officers is to establish methods and levels of compensation that will provide strong incentives to promote its growth and profitability and reward superior performance. Compensation of executive officers consists solely of salary.
The Compensation Committee assesses the information it receives in accordance with its business judgment. All decisions with respect to executive compensation are approved by the Compensation Committee and recommended to the full Board of Directors for ratification. The Compensation Committee also periodically reviews director compensation. All decisions with respect to director compensation are made by the Compensation Committee and presented to the full Board of Directors for a final determination.
As the Compensation Committee had not held a meeting prior to the filing of the annual report on Form 10-K and the members of the Compensation Committee were not involved in the review and approval of this annual report on Form 10-K, the Board of Directors as a whole the Compensation Discussion and Analysis (“CD&A”) for the year ended December 31, 2006 with management. In reliance on such reviews and discussions, the Board of Directors as a whole decided that the CD&A be included in this Proxy Statement and the Company’s Annual Report on Form 10-K for the year ended December 31, 2006.
BOARD OF DIRECTORS
Wang Xin
Liu Yu
Naizhong Che
Peng Wang
Zhixiang Zhang
Nathaniel K. Hsieh
Howard S. Barth
COMPENSATION COMMITTEE
Naizhong Che (Chair)
Zhixiang Zhang
Peng Wang
15
PART IV
| Item 15. | Exhibits and Financial Statement Schedules |
| (a) | Financial Statements. |
Our financial statements as set forth in the Index to Financial Statements attached hereto commencing on page F-1 are hereby incorporated by reference.
| (b) | Exhibits. |
The following exhibits, which are numbered in accordance with Item 601 of Regulation S-K, are filed herewith or, as noted, incorporated by reference herein:
Exhibit Number | Exhibit Description | |
3.1 | Certificate of Incorporation (1) | |
3.2 | Bylaws (1) | |
21.1 | Subsidiaries of the Company (2) | |
| 24.1 | Power of Attorney (2) | |
| 31.1 | Certification of Principal Executive Officer under Section 302 of the Sarbanes-Oxley Act of 2002 (3) | |
31.2 | Certification of Principal Financial Officer under Section 302 of the Sarbanes-Oxley Act of 2002 (3) | |
32.2 | Certification under Section 906 of the Sarbanes-Oxley Act of 2002 (3) |
| (1) | Incorporation by reference to the Company's Registration Statement on Form SB-2, as amended (Registration No. 333-125687). |
| (2) | Incorporated by reference to the Company's Annual Report on Form 10-K as filed with the SEC on April 2, 2007. |
| (3) | Filed herewith. |
16
Orsus Xelent Technologies, Inc.
Index to Consolidated Financial Statements
Year ended December 31, 2006
| Page | ||||
| Report of Independent Registered Public Accounting Firm | F-1 | |||
| Consolidated Statements of Operations | F-2 | |||
| Consolidated Balance Sheets | F-3 | |||
| Consolidated Statements of Changes in Stockholders’ Equity | F-4 | |||
| Consolidated Statements of Cash Flows | F-5 | |||
| Notes to Consolidated Financial Statements | F-6 - F-18 | |||
Report of Independent Registered Public Accounting Firm
To the Stockholders and Board of Directors
Orsus Xelent Technologies, Inc.
We have audited the accompanying consolidated balance sheets of Orsus Xelent Technologies, Inc. and its subsidiaries (the “Company”) as of December 31, 2006 and 2005, and the related consolidated statements of operations, changes in stockholders' equity and cash flows for the years ended December 31, 2006 and 2005 and 2004. These consolidated financial statements are the responsibility of the Company's management. Our responsibility is to express an opinion on these consolidated financial statements based on our audits.
We conducted our audits in accordance with the standards of the Public Company Accounting Oversight Board (United States). Those standards require that we plan and perform the audit to obtain reasonable assurance about whether the financial statements are free of material misstatement. An audit includes examining, on a test basis, evidence supporting the amounts and disclosures in the financial statements. An audit also includes assessing the accounting principles used and significant estimates made by management, as well as evaluating the overall financial statement presentation. We believe that our audits provide a reasonable basis for our opinion.
In our opinion, the consolidated financial statements referred to above present fairly, in all material respects, the financial position of the Company as of December 31, 2006 and 2005 and the results of its operations and its cash flows for the years ended December 31, 2006 and 2005 and 2004 in conformity with accounting principles generally accepted in the United States of America.
/S/ Mazars CPA Limited
Mazars CPA Limited
Certified Public Accountants
Hong Kong
Date: January 17, 2008
F-1
Orsus Xelent Technologies, Inc.
Consolidated Statements of Operations
Years ended December 31, 2006, 2005 and 2004
Note | 2006 | 2005 | 2004 | ||||||||||
US$’000 | US$’000 | US$’000 | |||||||||||
Operating revenues - Net sales | 68,108 | 28,705 | 70,822 | ||||||||||
Operating expenses: | |||||||||||||
Cost of sales | 55,226 | 22,272 | 56,231 | ||||||||||
Sales and marketing | 1,045 | 1,554 | 3,314 | ||||||||||
General and administrative | 1,560 | 1,064 | 1,435 | ||||||||||
Research and development | 255 | 413 | 586 | ||||||||||
Depreciation | 175 | 310 | 598 | ||||||||||
Allowance for obsolete inventories | 1,387 | 98 | - | ||||||||||
Loss on disposal of property, plant and equipment | 454 | - | - | ||||||||||
Total operating expenses | 60,102 | 25,711 | 62,164 | ||||||||||
Operating income | 8,006 | 2,994 | 8,658 | ||||||||||
| Interest expense | (116 | ) | (25 | ) | (143 | ) | |||||||
| Other income, net | 75 | 544 | 64 | ||||||||||
Income before income taxes and minority interest | 7,965 | 3,513 | 8,579 | ||||||||||
| Income taxes | 5 | (1,247 | ) | (21 | ) | - | |||||||
Income before minority interest | 6,718 | 3,492 | 8,579 | ||||||||||
| Minority interest | - | - | 120 | ||||||||||
Net income | 6,718 | 3,492 | 8,699 | ||||||||||
Other comprehensive income | |||||||||||||
| Foreign currency translation adjustment | 626 | 349 | - | ||||||||||
Comprehensive Income | 7,344 | 3,841 | 8,699 | ||||||||||
Earnings per share | |||||||||||||
Basic and diluted (US$) | 6 | 0.23 | 0.12 | 0.29 | |||||||||
Weighted average number of common shares outstanding | 29,756,000 | 29,756,000 | 29,756,000 | ||||||||||
The accompanying notes are an integral part of these consolidated financial statements.
F-2
Orsus Xelent Technologies, Inc.
Consolidated Balance Sheets
As of December 31, 2006 and 2005
Note | 2006 | 2005 | ||||||||
US$’000 | US$’000 | |||||||||
ASSETS | ||||||||||
Current assets | ||||||||||
| Cash and cash equivalents | 2,421 | 2,974 | ||||||||
| Accounts receivable, net of allowance for doubtful accounts of $230,000 (2005: $149,000) | 31,425 | 12,034 | ||||||||
| Inventories | 7 | 1,230 | 4,460 | |||||||
| Trade deposits paid | 8,989 | 10,580 | ||||||||
| Advance to third party | 288 | - | ||||||||
| Other current assets | 86 | 182 | ||||||||
| Pledged deposit | 8 | 1,128 | - | |||||||
| Total current assets | 45,567 | 30,230 | ||||||||
| Property, plant and equipment, net | 9 | 320 | 781 | |||||||
Total assets | 45,887 | 31,011 | ||||||||
LIABILITIES AND STOCKHOLDERS’ EQUITY | ||||||||||
Current liabilities | ||||||||||
| Short-term bank loan | 10 | 6,268 | - | |||||||
| Accounts payable - Trade | 10,964 | 7,939 | ||||||||
| Accrued expenses and other accrued liabilities | 4,444 | 2,238 | ||||||||
| Trade deposits received | 251 | 5,432 | ||||||||
| Due to directors | 13 | 330 | 320 | |||||||
| Provision for warranty | 53 | 122 | ||||||||
| Tax payables | 1,294 | 21 | ||||||||
| Total current liabilities | 23,604 | 16,072 | ||||||||
Commitments and contingencies | 14 | |||||||||
Stockholders’ equity | ||||||||||
| Preferred stock, US$0.001 par value: | ||||||||||
| Authorized: 100,000,000 shares, no shares issued | - | - | ||||||||
| Common stock and paid-in capital, US$0.001 par value: | ||||||||||
| Authorized: 100,000,000 shares | ||||||||||
| Authorized, issued and outstanding: 29,756,000 shares as of December 31, 2006 and as of December 31, 2005 | 30 | 30 | ||||||||
| Additional paid-in capital | 2,484 | 2,484 | ||||||||
| Dedicated reserves | 11 | 1,042 | 1,042 | |||||||
| Other comprehensive income | 975 | 349 | ||||||||
| Retained earnings | 17,752 | 11,034 | ||||||||
| Total stockholders’ equity | 22,283 | 14,939 | ||||||||
Total liabilities and stockholders’ equity | 45,887 | 31,011 | ||||||||
The accompanying notes are an integral part of these consolidated financial statements.
F-3
Orsus Xelent Technologies, Inc.
Consolidated Statements of Changes in Stockholders' Equity
Years ended December 31, 2006, 2005 and 2004
Common stock issued | ||||||||||||||||||||||
No. of shares | Amount | Additional paid-in capital | Dedicated reserves | Other comprehensive income | Retained earnings/ (Accumulated losses) | Total | ||||||||||||||||
US$’000 | US$’000 | US$’000 | US$’000 | US$’000 | US$’000 | |||||||||||||||||
| Balance as of January 1, 2004 | 15,000,000 | 15 | 2,549 | - | - | (115 | ) | 2,449 | ||||||||||||||
| Reverse merger and recapitalization | 14,756,000 | 15 | (65 | ) | - | - | - | (50 | ) | |||||||||||||
| Net income | - | - | - | - | - | 8,699 | 8,699 | |||||||||||||||
| Transfer to dedicated reserves | - | - | - | 1,042 | - | (1,042 | ) | - | ||||||||||||||
| Balance as of December 31, 2004 | 29,756,000 | 30 | 2,484 | 1,042 | - | 7,542 | 11,098 | |||||||||||||||
| Net income | - | - | - | - | - | 3,492 | 3,492 | |||||||||||||||
| Foreign currency translation adjustment | - | - | - | - | 349 | - | 349 | |||||||||||||||
| Balance as of December 31, 2005 | 29,756,000 | 30 | 2,484 | 1,042 | 349 | 11,034 | 14,939 | |||||||||||||||
| Net income | - | - | - | - | - | 6,718 | 6,718 | |||||||||||||||
| Foreign currency translation adjustment | - | - | - | - | 626 | - | 626 | |||||||||||||||
Balance as of December 31, 2006 | 29,756,000 | 30 | 2,484 | 1,042 | 975 | 17,752 | 22,283 | |||||||||||||||
The accompanying notes are an integral part of these consolidated financial statements.
F-4
Orsus Xelent Technologies, Inc.
Consolidated Statements of Cash Flows
Years ended December 31, 2006, 2005 and 2004
2006 | 2005 | 2004 | ||||||||
US$’000 | US$’000 | US$’000 | ||||||||
Cash flows from operating activities | ||||||||||
Net income | 6,718 | 3,492 | 8,699 | |||||||
| Adjustments to reconcile net income to net cash used in operating activities: | ||||||||||
Depreciation | 175 | 310 | 598 | |||||||
Loss on disposal of property, plant and equipment | 454 | - | 7 | |||||||
Allowance for doubtful accounts | 767 | 149 | - | |||||||
Allowance for obsolete inventories | 1,387 | 98 | 269 | |||||||
Interest expense | 116 | - | - | |||||||
Loss on liquidation of a subsidiary | - | - | 120 | |||||||
Minority interest | - | - | (120 | ) | ||||||
Exchange difference | 151 | 53 | - | |||||||
| Changes in assets and liabilities: | ||||||||||
Accounts receivable - trade | (19,072 | ) | (3,715 | ) | (8,250 | ) | ||||
Inventories, net | 1,989 | 1,376 | (5,687 | ) | ||||||
Trade deposits paid | 1,245 | (2,239 | ) | (8,125 | ) | |||||
Other current assets | 102 | 34 | (149 | ) | ||||||
Trade deposits received | (5,359 | ) | 2,879 | 2,487 | ||||||
Accounts payable - trade | 2,765 | (6,266 | ) | 13,651 | ||||||
Provision for warranty | (73 | ) | (65 | ) | 182 | |||||
Accrued expenses and other accrued liabilities | 2,133 | 1,317 | 959 | |||||||
Provision for taxation | 1,272 | 21 | - | |||||||
Net cash (used in) provided by operating activities | (5,230 | ) | (2,556 | ) | 4,641 | |||||
Cash flows from investing activities | ||||||||||
Purchase of property, plant and equipment | (156 | ) | (503 | ) | (1,397 | ) | ||||
| Proceeds from sales of property, plant and equipment | - | - | 43 | |||||||
Repayment from a related company | - | 3,407 | 4,524 | |||||||
Loan to a related company | - | - | (7,107 | ) | ||||||
Loan to third party | (288 | ) | - | - | ||||||
Decrease (Increase) in restricted cash | - | 2,395 | (2,333 | ) | ||||||
Pledged deposit paid | (1,128 | ) | - | - | ||||||
Repayment from stockholders | - | - | 1,352 | |||||||
Net cash (used in) provided by investing activities | (1,572 | ) | 5,299 | (4,918 | ) | |||||
Cash flows from financing activities | ||||||||||
| Interest expense | (116 | ) | - | - | ||||||
| Advance from stockholders | - | 1 | 311 | |||||||
| Borrowing from bank | 6,268 | - | - | |||||||
Net cash provided by financing activities | 6,152 | 1 | 311 | |||||||
Net (decrease) increase in cash and cash equivalents | (650 | ) | 2,744 | 34 | ||||||
Cash and cash equivalents, beginning of the year | 2,974 | 224 | 190 | |||||||
Exchange gain on cash and cash equivalents | 97 | 6 | - | |||||||
Cash and cash equivalents, end of the year | 2,421 | 2,974 | 224 | |||||||
Supplemental disclosure information: | ||||||||||
| Interest expenses | 116 | - | - | |||||||
The accompanying notes are an integral part of these consolidated financial statements.
F-5
Orsus Xelent Technologies, Inc.
Notes to Consolidated Financial Statements
Years ended December 31, 2006 and 2005 and 2004
1. BASIS OF FINANCIAL STATEMENT PRESENTATION AND REORGANIZATION
Orsus Xelent Technologies, Inc. (“ORXT”), formerly known as Universal Flirts Corp., was organized under the laws of the State of Delaware on May 25, 2004. Through its subsidiary, Universal Flirts, Inc., ORXT engaged in developing and operating an online dating service.
As described in Note 2 below, prior to the reorganization with United First International Limited (“UFI”), a company incorporated in the Hong Kong Special Administrative Region (“HK”) of the People’s Republic of China (the “PRC”), on March 31, 2005, ORXT was a development stage company, which, other than providing an online dating service, had no operations or revenues. After recapitalization, ORXT exited the development stage after March 31, 2005.
Upon the completion of the reorganization, ORXT assumed the business operations of UFI as primarily undertaken by its subsidiary, Beijing Orsus Xelent Technologies & Trading Co., Limited (“BOXT”) (English translation for identification purpose only), an enterprise incorporated in Beijing, the PRC that is engaged in the business of design, retail and wholesale distribution cellular phones.
| On July 14, 2005, Orsus Xelent Holdings (BVI) Limited (“OXHBVI”) was incorporated in the British Virgin Islands (“BVI”) with issued capital of US$2. OXHBVI is 100% owned by ORXT and the principal activity of OXHBVI is investment holding. On July 22, 2005, Orsus Xelent Trading (HK) Company Limited (“OXTHK”) was incorporated in HK with issued capital of HK$100 (equivalent to US$13), a company engaged in trading of cellular phone and accessories, and is 100% owned by OXHBVI. |
2. REORGANIZATION
| (a) | Reorganization |
On March 18, 2005, the board of directors approved a 4-for-1 forward split of its issued and outstanding common stock with a record date of March 28, 2005.
Pursuant to a Stock Transfer Agreement dated March 29, 2005, ORXT transferred all of the common stock of Universal Flirts, Inc. to Mr. Darrell Lerner in exchange for the cancellation of 28,200,000 shares of ORXT’s common stock. Subsequently, ORXT had 14,756,000 shares of its common stock outstanding.
| (b) | Recapitalization |
Effective on March 31, 2005, ORXT completed a stock exchange transaction with the stockholders of UFI. Pursuant to the Securities Exchange Agreement, ORXT issued 15,000,000 shares of its common stock to the stockholders of UFI, in exchange for 20,000,000 outstanding shares of UFI and cash payment of US$50,000 from UFI. After giving effect to the exchange, ORXT had 29,756,000 shares of its common stock outstanding. As a result of the exchange, UFI became a wholly-owned subsidiary of ORXT.
F-6
Orsus Xelent Technologies, Inc.
Notes to Consolidated Financial Statements
Years ended December 31, 2006 and 2005 and 2004
2. REORGANIZATION (CONTINUED)
| (b) | Recapitalization (Continued) |
For accounting purposes, the transaction has been treated as a recapitalization of UFI with ORXT being the legal survivor and UFI being the accounting survivor and the operating entity. That is, the historical financial statements prior to March 31, 2005 are those of UFI, even though they are labeled as those of ORXT. Retained earnings of the accounting survivor, UFI, is carried forward after the recapitalization. Operations prior to the recapitalization are those of the accounting survivor, UFI. Earnings per share for periods prior to the recapitalization are restated to reflect the equivalent number of shares. Upon completion of the transaction, the financial statements become those of the operating company, with adjustments to reflect the changes in equity structure and receipt of the assets/liabilities of the public shell, ORXT. Accordingly, the Company’s stockholders’ equity as of December 31, 2004 has been recapitalized and restated.
Following the recapitalization, ORXT held 100% of the issued and outstanding shares of UFI and UFI became a wholly-owned subsidiary of ORXT. In this report, ORXT, UFI, BOXT Sapphine, OXHBVI and OXTHK are collectively referred to as the “Company”.
| (c) | Merger under common control |
UFI was incorporated in Hong Kong on September 8, 2004 and was 20%, 40% and 40% owned by Mr. Wang Xin, Mr. Liu Yu and Mr. Wang Zhibin respectively. UFI has had no operations since its incorporation.
Pursuant to the agreement entered into between UFI and Mr. Wang Xin, Mr. Liu Yu and Mr. Wang Zhibin, who owned 20%, 40% and 40% interests respectively in BOXT on November 1, 2004, UFI consummated a merger with BOXT, and paid USD1,207,000, to all owners of Xelent, in exchange for all their beneficial interests in BOXT (“the Agreement”). BOXT was established in the PRC on May 6, 2003 as a PRC company with limited liability. The principal activities of BOXT were the development of cellular phones software and technology, including the design and trading of cellular phones.
On November 3, 2004, the Beijing Municipal Bureau of Commerce (the “Bureau”) approved the transfer of interests and the application for the change of BOXT status to a wholly-owned foreign investment enterprise (“WOFIE”) with limited liability. Upon granting WOFIE status, the operating period of BOXT was for an initial term of 10 years until November 9, 2014 and UFI became the sole registered owner of BOXT.
F-7
Orsus Xelent Technologies, Inc.
Notes to Consolidated Financial Statements
Years ended December 31, 2006 and 2005 and 2004
2. REORGANIZATION (CONTINUED)
| (c) | Merger under common control (Continued) |
Consistent with the provisions of Statement of Financial Accounting Standards (“SFAS”) No. 141 “Business Combinations”, transfers of net assets or exchanges of equity interests between entities under common control do not constitute business combinations. Because UFI and Xelent were beneficially owned by the same stockholders group, Mr. Wang Xin, Mr. Liu Yu and Mr. Wang Zhibin, immediately before and after the combination, the Agreement has been accounted for as a combination of entities under common control on a historical cost basis in a manner similar to a pooling of interests. In accordance with USGAAP, the accompanying financial statements of the Company have been prepared as if the Merger had occurred and UFI had been incorporated at the beginning of the earliest period presented, as of May 6, 2003.
3. SUMMARY OF SIGNIFICANT ACCOUNTING POLICIES
Accounting principles |
| The consolidated financial statements and accompanying notes are prepared in accordance with generally accepted accounting principles in the United States of America (“USGAAP”). |
Basis of consolidation |
The results of the subsidiaries acquired or disposed of during the year are consolidated from the effective dates of acquisition or to the effective dates of disposal, respectively.
All significant intercompany accounts and transactions have been eliminated upon consolidation.
Revenue recognition
Net sales represent the invoiced value of goods, net of value-added tax (“VAT”) and returns. The Company generally recognizes product revenue when persuasive evidence of an arrangement exists, delivery has occurred, the fee is fixed or determinable, and collectibility is probable. The Company has a policy of including handling costs incurred for finished goods, which are not significant, in sales and marketing expenses.
Research and development
| All cost of research and development activities are expensed as incurred. |
Warranties
The Company offers warranties for products it manufactures. Terms generally are for one year from the date of sale. Provision for warranty expense is established for costs that are expected to be incurred after the sales and delivery of products under warranty. The Company provided for anticipated warranty expense in the amount of US$81,000 and paid warranty claims of US$157,000 during the year ended December 31, 2006. The warranty provision is determined based on known product failures, historical experience of the level of repairs and replacements, and other currently available evidence.
F-8
Orsus Xelent Technologies, Inc.
Notes to Consolidated Financial Statements
Years ended December 31, 2006 and 2005 and 2004
3. SUMMARY OF SIGNIFICANT ACCOUNTING POLICIES (CONTINUED)
Income taxes
| Provision for income and other related taxes have been provided in accordance with the tax rates and laws in effect in various countries of operations. |
Income tax expense is computed based on pre-tax income included in the consolidated statements of operations. Deferred income taxes are provided, using the liability method, which requires recognition of deferred tax assets and liabilities for the expected future tax consequences of temporary differences between the carrying amounts and tax bases of assets and liabilities and their reported amounts. The tax consequences of those differences are classified as current or non-current based upon the classification of the related assets or liabilities in the consolidated financial statements.
Comprehensive income
SFAS No. 130, "Reporting Comprehensive Income", requires the presentation of comprehensive income, in addition to the existing statements of operations. Comprehensive income is defined as the change in equity during the year from transactions and other events, excluding the changes resulting from investments by owners and distributions to owners.
Trade receivables
Trade receivables are recorded at original invoice amount, less an estimated allowance for uncollectible accounts. Trade credit is generally extended on a short-term basis, thus trade receivables do not bear interest. Trade receivables are periodically evaluated for collectibility based on past credit history with customers and their current financial condition. Changes in the estimated collectibility of trade receivables are recorded in the results of operations for the year in which the estimate is revised. Trade receivables are presented net of an allowance for uncollectible amounts of US$230,000 and US$149,000 as of December 31, 2006 and of 2005 respectively.
Inventories
Inventories are stated at the lower of cost or market. Potential losses from obsolete and slow-moving inventories are provided for when identified. Cost, which comprises all costs of purchase and, where applicable, other costs that have been incurred in bringing the inventories to their present location and condition, is calculated using the weighted average method. Market represents the estimated selling price in the ordinary course of business less the estimated costs of completion and the estimated costs necessary to make the sale.
Property, plant and equipment
| Property, plant and equipment are stated at original cost less accumulated depreciation. |
The cost of an asset comprises its purchase price and any directly attributable costs of bringing the asset to its present working condition and location for its intended use. Expenditures incurred after the assets have been put into operation, such as repairs and maintenance, overhaul and minor renewals and betterments, are normally charged to operating expenses in the year in which they are incurred. In situations where it can be clearly demonstrated that the expenditure has resulted in an increase in the future economic benefits expected to be obtained from the use of the assets, the expenditure is capitalized.
F-9
Orsus Xelent Technologies, Inc.
Notes to Consolidated Financial Statements
Years ended December 31, 2006 and 2005 and 2004
3. SUMMARY OF SIGNIFICANT ACCOUNTING POLICIES (CONTINUED)
Property, plant and equipment (Continued)
When assets are sold or retired, their costs and accumulated depreciation are eliminated from the financial statements and any gain or loss resulting from their disposal is recognized in the year of disposition as an element of other income, net.
Depreciation is provided to write off the costs of property, plant and equipment over their useful lives from the date on which they become fully operational and after taking into account their estimated residual values, using the following methods:
| Moulds | Sum-of-the-units method | |
| Leasehold improvements | Straight-line method over the lease term | |
| Plant and machinery | Straight-line method at 20% p.a. | |
| Office equipment | Straight-line method at 20% p.a. | |
| Motor vehicles | Straight-line method at 20% p.a. |
Impairment of long-lived assets |
The long-lived assets held and used by the Company are reviewed for impairment whenever events or changes in circumstances indicate that the carrying amount of assets may not be recoverable. It is reasonably possible that these assets could become impaired as a result of technology or other industry changes. Determination of recoverability of assets to be held and used is by comparing the carrying amount of an asset to future net undiscounted cash flows to be generated by the assets. If such assets are considered to be impaired, the impairment to be recognized is measured by the amount by which the carrying amount of the assets exceeds the fair value of the assets. Assets to be disposed of are reported at the lower of the carrying amount or fair value less costs to sell.
Operating leases
Leases where substantially all the rewards and risks of ownership of assets remain with the leasing company are accounted for as operating leases. Rental payables under operating leases are recognized as expenses on the straight-line basis over the lease term.
Foreign currency translation
The Company considers Renminbi as its functional currency as a substantial portion of the Company’s usiness activities are based in Renminbi. However, the Company has chosen the United States dollar as its reporting currency.
Transactions in currencies other than the functional currency during the year are translated into the functional currency at the applicable rates of exchange prevailing at the time of the transactions. Monetary assets and liabilities denominated in currencies other than functional currency are translated into functional currency at the applicable rates of exchange in effect at the balance sheet date. Exchange gains and losses are recorded in the consolidated statements of operations.
For translation of financial statements into the reporting currency, assets and liabilities are translated at the exchange rate at the balance sheet date, equity accounts are translated at historical exchange rates, and revenues, expenses, gains and losses are translated at the weighted average rates of exchange prevailing during the year.
F-10
Orsus Xelent Technologies, Inc.
Notes to Consolidated Financial Statements
Years ended December 31, 2006 and 2005 and 2004
3. SUMMARY OF SIGNIFICANT ACCOUNTING POLICIES (CONTINUED)
Foreign currency translation (Continued)
Translation adjustments, when material, resulting from this process are recorded in accumulated other comprehensive income within stockholders’ equity.
Cash equivalents
The Company considers short-term, highly liquid investments with original maturities of three months or less to be cash equivalents.
Use of estimates
| The preparation of the consolidated financial statements in conformity with USGAAP requires the Company’s management to make estimates and assumptions that affect the reported amounts of assets and liabilities and disclosure of contingent assets and liabilities at the date of financial statements and the reported amounts of revenues and expenses during the reported year. Actual amounts could differ from those estimates. Estimates are used for, but not limited to, the accounting for certain items such as allowance for doubtful accounts, depreciation, inventory allowance, provision for warranty, taxes and contingencies. |
Segment information
Operating segments are defined as components of a company about which separated financial information is available that is evaluated regularly by the operating decision maker in deciding how to allocate resources and in assessing performance. The Company operates in a single business segment of trading of cellular phones.
The Company adopted SFAS No. 131, “Disclosure about Segments of an Enterprise and Related Information”. The Company’s results of operations and financial position were affected by the implementation of SFAS No. 131 as it operates in more than one geographical areas. Segment information is disclosed in note 4 to the consolidated financial statements.
Related parties
| Parties are considered to be related if one party has the ability, directly or indirectly, to control the other party or exercise significant influence over the other party in making financial and operating decisions. Parties are also considered to be related if they are subject to common control or common significant influence. |
Recently issued accounting standards
In June, 2006, the FASB issued Interpretation No. 48, “Accounting for Uncertainty in Income Taxes” (FIN 48). This interpretation clarified the accounting for uncertainty in income taxes recognized in the financial statements in accordance with SFAS Statement No. 109 “Accounting for Income Taxes” (SFAS 109). Specifically, FIN 48 clarifies the application of SFAS 109 by defining a criterion that an individual tax position must meet for any part of the benefit of that position to be recognized in an enterprise’s financial statements. Additionally, FIN 48 provides guidance on measurement, derecognition, classification, interest and penalties, accounting in interim periods of income taxes, as well as the required disclosure and transition. This interpretation is effective for fiscal years beginning after December 15, 2006. The Company is currently evaluating what effects the adoption of FIN 48 will have on the Company’s consolidated financial position and results of operations.
F-11
Orsus Xelent Technologies, Inc.
Notes to Consolidated Financial Statements
Years ended December 31, 2006 and 2005 and 2004
3. SUMMARY OF SIGNIFICANT ACCOUNTING POLICIES (CONTINUED)
Recently issued accounting standards (Continued)
There are no other new accounting pronouncements for which adoption is expected to have a material effect on the Company's financial statements.
4. CONCENTRATIONS
| The Company is engaged principally in the design and trading of cellular phones primarily to three dealers in the PRC. The Company buys certain major materials from five major suppliers. In addition, the Company subcontracts material purchasing and assembly works of cellular phones mainly to three subcontracting factories. Management believes that the sole agent arrangement gives the dealers more incentive to promote the Company’s products and reduce the Company’s exposure to the distribution market. On the other hand, the diversification of suppliers will reduce the risk of increasing production cost. |
(a) Customers accounted for over 10% of the Company's operating revenues are as follows:
2006 | 2005 | 2004 | ||||||||
% | % | % | ||||||||
Customer A | 53 | 56 | 21 | |||||||
Customer B | 19 | 20 | 77 | |||||||
Customer C | 15 | - | - | |||||||
Customer D | - | 20 | - | |||||||
No trade deposit was received from the above customers as of December 31, 2006. Trade receivables from the above customers were US$31,425,000 and US$11,508,000 as of December 31, 2006 and December 31, 2005, respectively.
(b) Suppliers accounted for over 10% of the Company's purchases are as follows:
2006 | 2005 | 2004 | ||||||||
% | % | % | ||||||||
Supplier A | 20 | 12 | - | |||||||
Supplier B | 15 | - | - | |||||||
Supplier C | 15 | - | - | |||||||
Supplier D | 11 | 15 | - | |||||||
Supplier E | 10 | 19 | - | |||||||
Supplier F | - | 10 | 44 | |||||||
Supplier G | - | 14 | - | |||||||
Supplier H | - | 7 | 10 | |||||||
F-12
Orsus Xelent Technologies, Inc.
Notes to Consolidated Financial Statements
Years ended December 31, 2006 and 2005 and 2004
4. CONCENTRATIONS (CONTINUED)
(b) Suppliers accounted for over 10% of the Company's purchases are as follows: (Continued)
Gross trade deposits paid to the above suppliers were US$6,753,000 and US$187,000 as of December 31, 2006 and December 31, 2005 respectively. Trade payables owed to the above suppliers were US$1,348,000 and US$529,000 as of December 31, 2006 and December 31, 2005 respectively.
(c) Geographical segments accounted for over 10% of the Company’s revenue are as follows:
2006 | 2005 | 2004 | ||||||||
Revenues | US$’000 | US$’000 | US$’000 | |||||||
| PRC | 60,001 | 27,841 | 70,822 | |||||||
| Singapore | 8,107 | - | - | |||||||
| Hong Kong | - | 864 | - | |||||||
68,108 | 28,705 | 70,822 | ||||||||
2006 | 2005 | ||||||
Carrying amount of long-lived assets | US$’000 | US$’000 | |||||
| PRC | 310 | 16 | |||||
| HK | 10 | 765 | |||||
| Total long -lived assets | 320 | 781 | |||||
| Reconciling items: | |||||||
| Others | 45,567 | 30,230 | |||||
45,887 | 31,011 | ||||||
5. INCOME TAXES
The Company is subject to income taxes on an entity basis on income arising in or derived from the tax jurisdictions in which it operates. Provision for income and other related taxes have been provided in accordance with the tax rates and laws in effect in the various countries of operations.
No provision for withholding or United States federal or state income taxes or tax benefits on the undistributed earnings and/or losses of the Company's subsidiaries has been provided as the earnings of these subsidiaries, in the opinion of the management, will be reinvested indefinitely. Determination of the amount of unrecognized deferred taxes on these earnings is not practical, however, unrecognized foreign tax credits would be available to reduce a portion of the tax liability.
F-13
Orsus Xelent Technologies, Inc.
Notes to Consolidated Financial Statements
Years ended December 31, 2006 and 2005 and 2004
5. INCOME TAXES (CONTINUED)
UFI was incorporated in Hong Kong and has no assessable profit for the years presented. OXTHK was also incorporated in Hong Kong and Hong Kong Profits Tax has been provided at the rate of 17.5% on OXTHK’s estimated assessable profits for the year.
Since BOXT has registered as a wholly-owned foreign investment enterprise (“WOFIE”), it is subject to tax laws applicable to WOFIE in the PRC and is fully exempt from the PRC enterprise income tax for two years since 2005 followed by a 50% reduction for the next three years.
(a) Income tax expenses comprised the following:
2006 | 2005 | 2004 | ||||||||
US$’000 | US$’000 | US$’000 | ||||||||
| Current tax | ||||||||||
| Hong Kong | 32 | 21 | - | |||||||
| PRC | 1,215 | - | - | |||||||
1,247 | 21 | - | ||||||||
| (b) | Reconciliation from the expected statutory tax rate in the PRC of 24% (2005: 24%, 2004: 33%) is as follows: |
2006 | 2005 | 2004 | ||||||||
% | % | % | ||||||||
| Statutory rate - PRC | 24.0 | 24.0 | 33.0 | |||||||
| Difference in tax rates in the countries that the Company operates | (0.1 | ) | (0.1 | ) | - | |||||
| Tax exemption | (14.7 | ) | (23.8 | ) | (33.0 | ) | ||||
| Non-deductible expenses | 6.3 | 0.6 | - | |||||||
| Effective tax rate | 15.5 | 0.7 | - | |||||||
6. EARNINGS PER SHARE
Basic earnings per share is computed based on the net income for the year and on the weighted average number of shares of common stock outstanding during each period as restated as a result of the reorganization and recapitalization. The 29,756,000 shares in connection with the recapitalization were included in the computation of earnings per share as if outstanding at the beginning of each period presented.
The Company had no potential common stock equivalents with a dilutive effect for any period presented, therefore basic and diluted earnings per share are the same.
F-14
Orsus Xelent Technologies, Inc.
Notes to Consolidated Financial Statements
Years ended December 31, 2006 and 2005 and 2004
7. INVENTORIES
Inventories consisted of the followings:
2006 | 2005 | ||||||
US$’000 | US$’000 | ||||||
| Raw materials | 1,115 | 4,257 | |||||
| Trading goods | 115 | 203 | |||||
1,230 | 4,460 | ||||||
8. PLEDGED DEPOSIT
| The Company pledged this deposit to a guaranty company to secure the loan borrowing of US$3,710,000. |
9. PROPERTY, PLANT AND EQUIPMENT, NET
Property, plant and equipment is summarized as follows:
2006 | 2005 | ||||||
US$’000 | US$’000 | ||||||
| Moulds | 107 | 1,239 | |||||
| Leasehold improvements | 115 | 112 | |||||
| Plant and machinery | 18 | 14 | |||||
| Office equipment | 266 | 255 | |||||
| Motor vehicles | 89 | 86 | |||||
595 | 1,706 | ||||||
| Accumulated depreciation | (275 | ) | (925 | ) | |||
320 | 781 | ||||||
10. SHORT-TERM BANK LOANS
| The bank loans were guaranteed by the director, Mr. Liu Yu and a deposit paid to a guaranty company, and were charged at interest rate of 6.7% - 7.956% per annum and repayable between January 19, 2007 to August 20, 2007. |
F-15
Orsus Xelent Technologies, Inc.
Notes to Consolidated Financial Statements
Years ended December 31, 2006 and 2005 and 2004
11. DISTRIBUTION OF INCOME
The Company's income is substantially contributed by BOXT, a company incorporated in the PRC. Income of BOXT is distributable to its stockholders after transfer to dedicated reserves as required under its articles of association and relevant PRC rules and regulations.
Prior to the re-organization to a WOFIE in November 2004, dedicated reserves of BOXT include a statutory surplus reserve and a statutory public welfare fund. In accordance with the relevant PRC Companies Law and rules and regulations, it is required to transfer amounts equal to at least 10% and 5% of its after-tax income to the statutory surplus reserve and statutory public welfare fund, respectively.
The statutory surplus reserve can only be utilized to offset prior years' losses or for capitalization as paid-in capital, whereas the statutory public welfare fund shall be utilized for collective staff welfare benefits such as building staff quarters or housing. No distribution of the remaining reserves shall be made other than on liquidation of BOXT.
Since BOXT has became a WOFIE, in accordance with its Articles of Association and the relevant PRC regulations, it is required to transfer to a general reserve fund an amount not less than 10% of the amount of after-tax income and a staff welfare and bonus fund an amount to be determined by the directors. No such transfer was made in years presented.
12. PENSION COSTS
As stipulated by PRC regulations, the Company maintains a defined contribution retirement plan for all of its employees who are residents of PRC. All retired employees of the Company are entitled to an annual pension equal to their basic annual salary upon retirement. The Company contributed to a state sponsored retirement plan approximately 20% of the basic salary of its employees and has no further obligations for the actual pension payments or post-retirement benefits beyond the annual contributions. The state sponsored retirement plan is responsible for the entire pension obligation payable to all employees. The pension expenses were US$27,000, US$15,000 and US$9,000 for the years ended December 31, 2006 and 2005 and 2004 respectively.
13. RELATED PARTY TRANSACTION
a. Name and relationship of related parties
Related party | Relationship with the Company | ||
| Mr. Wang Xin | Director and stockholder of the Company | ||
| Mr. Liu Yu | Director and stockholder of the Company | ||
| Mr. Wang Zhibin | Director and stockholder of the Company # |
F-16
Orsus Xelent Technologies, Inc.
Notes to Consolidated Financial Statements
Years ended December 31, 2006 and 2005 and 2004
13. RELATED PARTY TRANSACTION (CONTINUED)
b. Summary of related party balances
Note | 2006 | 2005 | ||||||||
US$’000 | US$’000 | |||||||||
Due to directors | ||||||||||
| Mr. Wang Xin, Mr. Liu Yu and Mr. Wang Zhibin | (i) | 330 | 320 | |||||||
2006 | 2005 | ||||||
US$’000 | US$’000 | ||||||
Bank loans guaranteed by a director | |||||||
| Mr. Liu Yu | 6,268 | - | |||||
c. Summary of related party transactions
2006 | 2005 | 2004 | ||||||||
Repayment from related companies | US$’000 | US$’000 | US$’000 | |||||||
| Beijing Huan Yitong Tech & Trading Co., Ltd. * | - | 3,319 | 3,788 | |||||||
Note:
(i) The amounts are unsecured, interest-free and repayable on demand.
# Ceased to be a director since February 7, 2007
* Ceased to be a related party since April 26, 2005
14. COMMITMENTS AND CONTINGENCIES
(a) Operating lease commitments
The Company leases certain staff quarters and office premises under non-cancelable operating leases. Rental expenses under operating leases were US$51,000, US$83,000 and US$126,000 for the year ended December 31, 2006 and 2005 and 2004 respectively.
F-17
Orsus Xelent Technologies, Inc.
Notes to Consolidated Financial Statements
Years ended December 31, 2006 and 2005 and 2004
14. COMMITMENTS AND CONTINGENCIES (CONTINUED)
(a) Operating lease commitments (Continued)
The following table summarizes the approximate future minimum rental payments under non-cancelable operating leases in effect as of December 31, 2006 and 2005:
2006 | 2005 | ||||||
US$’000 | US$’000 | ||||||
2005 | - | - | |||||
2006 | - | 27 | |||||
2007 | 27 | 27 | |||||
27 | 54 | ||||||
(b) Contingencies
Tax penalty
In accordance with PRC’s tax regulations, BOXT’s sales are subject to a 17% of value added tax (“VAT”) upon the issuance of VAT invoices to customers. BOXT follows the practice of reporting its revenue for VAT purposes when invoices are issued. As of December 31, 2006, there were sales amounted to approximately US$61,324,000 (2005: US$21,300,000) for which VAT invoices have not yet been issued.
Furthermore, BOXT reports its revenue for PRC enterprise income tax (“EIT”) purposes when VAT invoices are issued instead of when goods are delivered. All unbilled revenue will become taxable when invoice are issued.
The above practice is not in strict compliance with the relevant laws and regulations in respect of VAT and EIT. Despite the fact that BOXT has made full provision on VAT and EIT including surcharge in the financial statements, BOXT may be subject to a penalty for the deferred reporting of above tax obligations. The exact amount of penalty cannot be estimated with any reasonable degree of certainty. The board of directors considers it is more likely than not that the tax penalty will not be imposed.
Financial guarantee contract
On June 20, 2007, the Company entered into a guarantee contract to serve as guarantor of a bank loan amounting to approximately US$15,350,000 (equivalent to RMB120,000,000) to an independent third-party, CECT-Chinacom Communications Co., Ltd. (“CECT”), from Beijing Rural Bank to provide CECT with capital for equipment purchases. Under the guarantee contract, the Company shall perform all obligations of CECT under the loan contract if CECT fails to perform its obligations as set forth in the loan contract, including, but not limited to, ceasing production, going out of business, dissolving the business, having its business license withdrawn, and filing for bankruptcy. No contingent liabilities had been provided for in the financial statements in respect of the financial guarantee.
F-18
SIGNATURES
Pursuant to the requirements of Section 13 or 15(d) of the Securities Exchange Act of 1934, the Registrant has duly caused this report to be signed on its behalf by the undersigned, thereunto duly authorized.
ORSUS XELENT TECHNOLOGIES, INC. | ||
| | | |
| DATED: February 15, 2008 | By: | /s/ Wang Xin |
Wang Xin Chief Executive Officer | ||
S - 1
Index to Exhibits
| Exhibit Number | Exhibit Description | |
| 3.1 | Certificate of Incorporation (1) | |
| 3.2 | Bylaws (1) | |
| 21.1 | Subsidiaries of the Company (2) | |
| 24.1 | Power of Attorney (2) | |
| 31.1 | Certification of Principal Executive Officer under Section 302 of the Sarbanes-Oxley Act of 2002 (3) | |
| Certification of Principal Financial Officer under Section 302 of the Sarbanes-Oxley Act of 2002 (3) | ||
| 32.2 | Certification under Section 906 of the Sarbanes-Oxley Act of 2002 (3) |
| (1) | Incorporation by reference to the Company's Registration Statement on Form SB-2, as amended (Registration No. 333-125687). |
| (2) | Incorporated by reference to the Company's Annual Report on Form 10-K as filed with the SEC on April 2, 2007. |
| (3) | Filed herewith. |