Use these links to rapidly review the document
TABLE OF CONTENTS
Table of Contents
UNITED STATES SECURITIES AND EXCHANGE COMMISSION
Washington, D.C. 20549
Form 10-Q
| | |
| ý | | QUARTERLY REPORT PURSUANT TO SECTION 13 OR 15(d)
OF THE SECURITIES EXCHANGE ACT OF 1934 |
|
|
For the quarterly period ended September 30, 2012 |
OR |
o |
|
TRANSITION REPORT PURSUANT TO SECTION 13 OR 15(d)
OF THE SECURITIES EXCHANGE ACT OF 1934 |
Commission file number: 001-32329
Copano Energy, L.L.C.
(Exact Name of Registrant as Specified in Its Charter)
| | |
Delaware
(State or Other Jurisdiction of
Incorporation or Organization) | | 51-0411678
(I.R.S. Employer
Identification No.) |
1200 Smith Street, Suite 2300
Houston, Texas 77002
(Address of Principal Executive Offices) |
(713) 621-9547
(Registrant's Telephone Number, Including Area Code) |
Indicate by check mark whether the registrant (1) has filed all reports required to be filed by Section 13 or 15(d) of the Securities Exchange Act of 1934 during the preceding 12 months (or for such shorter period that the registrant was required to file such reports), and (2) has been subject to such filing requirements for the past 90 days. Yes ý No o
Indicate by check mark whether the registrant has submitted electronically and posted on its corporate Web site, if any, every Interactive Data File required to be submitted and posted pursuant to Rule 405 of Regulation S-T (§232.405 of this chapter) during the preceding 12 months (or for such shorter period that the registrant was required to submit and post such files). ý Yes o No
Indicate by check mark whether the registrant is a large accelerated filer, an accelerated filer, a non-accelerated filer or a smaller reporting company. See definitions of "large accelerated filer," "accelerated filer" and "smaller reporting company" in Rule 12b-2 of the Exchange Act.
| | | | | | |
| Large accelerated filerý | | Accelerated filero | | Non-accelerated filero | | Smaller reporting companyo |
Indicate by check mark whether the registrant is a shell company (as defined in Rule 12b-2 of the Exchange Act). Yes o No ý
There were 78,939,330 common units of Copano Energy, L.L.C. outstanding on November 6, 2012. Copano Energy, L.L.C.'s common units trade on the NASDAQ stock exchange under the symbol "CPNO."
TABLE OF CONTENTS
2
Table of Contents
Item 1. Financial Statements.
COPANO ENERGY, L.L.C. AND SUBSIDIARIES
UNAUDITED CONSOLIDATED BALANCE SHEETS
| | | | | | | |
| | September 30,
2012 | | December 31,
2011 | |
|---|
| | (In thousands, except unit information)
| |
|---|
ASSETS | | | | | | | |
Current assets: | | | | | | | |
Cash and cash equivalents | | $ | 53,484 | | $ | 56,962 | |
Accounts receivable, net(1) | | | 112,165 | | | 119,193 | |
Risk management assets | | | 16,420 | | | 4,322 | |
Prepayments and other current assets | | | 3,254 | | | 5,114 | |
| | | | | | |
Total current assets | | | 185,323 | | | 185,591 | |
| | | | | | |
Property, plant and equipment, net | | | 1,301,813 | | | 1,103,699 | |
Intangible assets, net | | | 161,652 | | | 192,425 | |
Investments in unconsolidated affiliates | | | 480,118 | | | 544,687 | |
Escrow cash | | | 1,848 | | | 1,848 | |
Risk management assets | | | 6,941 | | | 6,452 | |
Other assets, net | | | 28,163 | | | 29,895 | |
| | | | | | |
Total assets | | $ | 2,165,858 | | $ | 2,064,597 | |
| | | | | | |
LIABILITIES AND MEMBERS' CAPITAL | | | | | | | |
Current liabilities: | | | | | | | |
Accounts payable(1) | | $ | 137,232 | | $ | 155,921 | |
Accrued capital expenditures | | | 9,841 | | | 7,033 | |
Accrued interest | | | 25,022 | | | 8,686 | |
Accrued tax liability | | | 1,148 | | | 1,182 | |
Risk management liabilities | | | 1,512 | | | 3,565 | |
Other current liabilities | | | 22,974 | | | 15,007 | |
| | | | | | |
Total current liabilities | | | 197,729 | | | 191,394 | |
| | | | | | |
Long term debt (includes $3,194 and $0 bond premium as of September 30, 2012 and December 31, 2011, respectively) | | | 1,092,719 | | | 994,525 | |
Deferred tax liability | | | 2,440 | | | 2,199 | |
Other noncurrent liabilities | | | 9,893 | | | 4,581 | |
Commitments and contingencies (Note 9) | | | | | | | |
Members' capital: | | | | | | | |
Series A convertible preferred units, no par value, 12,582,468 units and 11,684,074 units issued and outstanding as of September 30, 2012 and December 31, 2011, respectively | | | 285,168 | | | 285,168 | |
Common units, no par value, 72,411,407 units and 66,341,458 units issued and outstanding as of September 30, 2012 and December 31, 2011, respectively | | | 1,353,900 | | | 1,164,853 | |
Paid in capital | | | 69,966 | | | 62,277 | |
Accumulated deficit | | | (848,066 | ) | | (624,121 | ) |
Accumulated other comprehensive income (loss) | | | 2,109 | | | (16,279 | ) |
| | | | | | |
| | | 863,077 | | | 871,898 | |
| | | | | | |
Total liabilities and members' capital | | $ | 2,165,858 | | $ | 2,064,597 | |
| | | | | | |
| | | | | | | |
- (1)
- Inclusive of related party transactions discussed in Note 8.
The accompanying notes are an integral part of these unaudited consolidated financial statements.
3
Table of Contents
COPANO ENERGY, L.L.C. AND SUBSIDIARIES
UNAUDITED CONSOLIDATED STATEMENTS OF OPERATIONS
| | | | | | | | | | | | | |
| | Three Months Ended
September 30, | | Nine Months Ended
September 30, | |
|---|
| | 2012 | | 2011 | | 2012 | | 2011 | |
|---|
| | (In thousands, except per unit information)
| |
|---|
Revenue: | | | | | | | | | | | | | |
Natural gas sales(1) | | $ | 97,614 | | $ | 120,815 | | $ | 253,819 | | $ | 348,538 | |
Natural gas liquids sales | | | 205,464 | | | 191,370 | | | 589,431 | | | 521,129 | |
Transportation, compression and processing fees(1)(2) | | | 49,314 | | | 30,337 | | | 132,394 | | | 82,706 | |
Condensate and other(1) | | | 14,001 | | | 11,169 | | | 45,280 | | | 37,299 | |
| | | | | | | | | | |
Total revenue | | | 366,393 | | | 353,691 | | | 1,020,924 | | | 989,672 | |
| | | | | | | | | | |
Costs and expenses: | | | | | | | | | | | | | |
Cost of natural gas and natural gas liquids(1)(2)(3) | | | 284,936 | | | 281,858 | | | 789,369 | | | 779,986 | |
Transportation(1)(2)(3) | | | 6,365 | | | 6,991 | | | 18,785 | | | 19,202 | |
Operations and maintenance | | | 19,242 | | | 16,091 | | | 56,171 | | | 46,953 | |
Depreciation and amortization | | | 19,259 | | | 16,911 | | | 57,409 | | | 51,143 | |
Impairment | | | — | | | 5,000 | | | 28,744 | | | 5,000 | |
General and administrative(1) | | | 13,697 | | | 10,031 | | | 38,939 | | | 34,530 | |
Taxes other than income | | | 1,983 | | | 1,502 | | | 5,459 | | | 4,029 | |
Equity in (earnings) loss from unconsolidated affiliates | | | (12,558 | ) | | 161,589 | | | 89,733 | | | 158,581 | |
Gain on sale of operating assets | | | (9,716 | ) | | — | | | (9,716 | ) | | — | |
| | | | | | | | | | |
Total costs and expenses | | | 323,208 | | | 499,973 | | | 1,074,893 | | | 1,099,424 | |
| | | | | | | | | | |
Operating income (loss) | | | 43,185 | | | (146,282 | ) | | (53,969 | ) | | (109,752 | ) |
Other income (expense): | | | | | | | | | | | | | |
Interest and other income | | | 11 | | | 16 | | | 570 | | | 31 | |
Loss on refinancing of unsecured debt | | | — | | | — | | | — | | | (18,233 | ) |
Interest and other financing costs | | | (13,797 | ) | | (11,080 | ) | | (42,823 | ) | | (34,450 | ) |
| | | | | | | | | | |
Income (loss) before income taxes | | | 29,399 | | | (157,346 | ) | | (96,222 | ) | | (162,404 | ) |
Provision for income taxes | | | (474 | ) | | (390 | ) | | (1,406 | ) | | (1,161 | ) |
| | | | | | | | | | |
Net income (loss) | | | 28,925 | | | (157,736 | ) | | (97,628 | ) | | (163,565 | ) |
Preferred unit distributions | | | (9,138 | ) | | (8,279 | ) | | (26,751 | ) | | (24,235 | ) |
| | | | | | | | | | |
Net income (loss) to common units | | $ | 19,787 | | $ | (166,015 | ) | $ | (124,379 | ) | $ | (187,800 | ) |
| | | | | | | | | | |
Basic net income (loss) per common unit: | | | | | | | | | | | | | |
Net income (loss) per common unit | | $ | 0.27 | | $ | (2.51 | ) | $ | (1.73 | ) | $ | (2.84 | ) |
| | | | | | | | | | |
Weighted average number of common units | | | 72,395 | | | 66,246 | | | 71,887 | | | 66,125 | |
| | | | | | | | | | |
Diluted net income (loss) per common unit: | | | | | | | | | | | | | |
Net income (loss) per common unit | | $ | 0.23 | | $ | (2.51 | ) | $ | (1.73 | ) | $ | (2.84 | ) |
| | | | | | | | | | |
Weighted average number of common units | | | 85,682 | | | 66,246 | | | 71,887 | | | 66,125 | |
| | | | | | | | | | |
Distributions declared per common unit | | $ | 0.575 | | $ | 0.575 | | $ | 1.725 | | $ | 1.725 | |
| | | | | | | | | | |
- (1)
- Inclusive of related party transactions discussed in Note 8.
- (2)
- Inclusive of the following affiliate transactions:
| | | | | | | | | | | | | | |
| | Transportation, compression and processing fees | | | $ 5,189 | | | $ 739 | | | $ 10,847 | | | $ 742 | |
| | Cost of natural gas and natural gas liquids | | | 47,971 | | | 7,757 | | | 105,729 | | | 7,476 | |
| | Transportation | | | 2,576 | | | 1,958 | | | 7,079 | | | 4,769 | |
- (3)
- Exclusive of operations and maintenance, depreciation and amortization and impairment shown separately below.
The accompanying notes are an integral part of these unaudited consolidated financial statements.
4
Table of Contents
COPANO ENERGY, L.L.C. AND SUBSIDIARIES
UNAUDITED CONSOLIDATED STATEMENTS OF COMPREHENSIVE INCOME (LOSS)
| | | | | | | | | | | | | |
| | Three Months Ended
September 30, | | Nine Months Ended
September 30, | |
|---|
| | 2012 | | 2011 | | 2012 | | 2011 | |
|---|
| | (In thousands)
| |
|---|
Net income (loss) | | $ | 28,925 | | $ | (157,736 | ) | $ | (97,628 | ) | $ | (163,565 | ) |
Other comprehensive income (loss): | | | | | | | | | | | | | |
Derivative settlements reclassified to earnings | | | 570 | | | 9,777 | | | 6,882 | | | 28,101 | |
Unrealized (loss) income — change in fair value of derivatives | | | (5,664 | ) | | 7,999 | | | 11,506 | | | (7,658 | ) |
| | | | | | | | | | |
Total other comprehensive (loss) income | | | (5,094 | ) | | 17,776 | | | 18,388 | | | 20,443 | |
| | | | | | | | | | |
Comprehensive income (loss) | | $ | 23,831 | | $ | (139,960 | ) | $ | (79,240 | ) | $ | (143,122 | ) |
| | | | | | | | | | |
The accompanying notes are an integral part of these unaudited consolidated financial statements.
5
Table of Contents
COPANO ENERGY, L.L.C. AND SUBSIDIARIES
UNAUDITED CONSOLIDATED STATEMENTS OF CASH FLOWS
| | | | | | | |
| | Nine Months Ended
September 30, | |
|---|
| | 2012 | | 2011 | |
|---|
| | (In thousands)
| |
|---|
Cash Flows From Operating Activities: | | | | | | | |
Net loss | | $ | (97,628 | ) | $ | (163,565 | ) |
Adjustments to reconcile net loss to net cash provided by operating activities: | | | | | | | |
Depreciation and amortization | | | 57,409 | | | 51,143 | |
Impairment | | | 28,744 | | | 5,000 | |
Amortization of debt issue costs | | | 2,987 | | | 2,855 | |
Equity in loss from unconsolidated affiliates | | | 89,733 | | | 158,581 | |
Distributions from unconsolidated affiliates | | | 31,229 | | | 17,961 | |
Gain on sale of operating assets | | | (9,716 | ) | | — | |
Loss on refinancing of unsecured debt | | | — | | | 18,233 | |
Non-cash gain on risk management activities, net | | | (4,327 | ) | | (4,723 | ) |
Equity-based compensation | | | 5,246 | | | 7,445 | |
Deferred tax provision | | | 240 | | | 253 | |
Other non-cash items | | | 5,196 | | | (86 | ) |
Changes in assets and liabilities, net of acquisitions: | | | | | | | |
Accounts receivable | | | 8,032 | | | (11,132 | ) |
Prepayments and other current assets | | | 1,861 | | | (2,952 | ) |
Risk management activities | | | 8,135 | | | 11,353 | |
Accounts payable | | | (24,371 | ) | | 17,459 | |
Other current liabilities | | | 21,010 | | | 14,964 | |
| | | | | | |
Net cash provided by operating activities | | | 123,780 | | | 122,789 | |
| | | | | | |
Cash Flows From Investing Activities: | | | | | | | |
Additions to property, plant and equipment | | | (247,179 | ) | | (175,323 | ) |
Additions to intangible assets | | | (6,869 | ) | | (5,316 | ) |
Acquisitions | | | — | | | (16,084 | ) |
Investments in unconsolidated affiliates | | | (60,677 | ) | | (105,111 | ) |
Distributions from unconsolidated affiliates | | | 3,279 | | | 2,368 | |
Escrow cash | | | — | | | 6 | |
Proceeds from sale of assets | | | 23,850 | | | 248 | |
Other | | | 2,604 | | | 98 | |
| | | | | | |
Net cash used in investing activities | | | (284,992 | ) | | (299,114 | ) |
| | | | | | |
Cash Flows From Financing Activities: | | | | | | | |
Proceeds from long-term debt | | | 420,375 | | | 725,000 | |
Repayment of long-term debt | | | (322,000 | ) | | (412,665 | ) |
Payments of premiums and expenses on redemption of unsecured debt | | | — | | | (14,572 | ) |
Deferred financing costs | | | (3,539 | ) | | (15,743 | ) |
Distributions to unitholders | | | (126,090 | ) | | (114,834 | ) |
Proceeds from public offering of common units, net of underwriting discounts and commissions of $7,590 | | | 188,083 | | | — | |
Equity offering costs | | | (379 | ) | | (4 | ) |
Proceeds from option exercises | | | 1,284 | | | 2,747 | |
| | | | | | |
Net cash provided by financing activities | | | 157,734 | | | 169,929 | |
| | | | | | |
Net decrease in cash and cash equivalents | | | (3,478 | ) | | (6,396 | ) |
Cash and cash equivalents, beginning of year | | | 56,962 | | | 59,930 | |
| | | | | | |
Cash and cash equivalents, end of period | | $ | 53,484 | | $ | 53,534 | |
| | | | | | |
The accompanying notes are an integral part of these unaudited consolidated financial statements.
6
Table of Contents
COPANO ENERGY, L.L.C. AND SUBSIDIARIES
UNAUDITED CONSOLIDATED STATEMENTS OF MEMBERS' CAPITAL
| | | | | | | | | | | | | | | | | | | | | | | | | |
| | Series A Preferred | | Common | |
| |
| |
| |
| |
|---|
| | Number
of Units | | Preferred
Units | | Number
of Units | | Common
Units | | Paid-in
Capital | | Accumulated
Deficit | | Accumulated
Other Comprehensive
(Loss) Income | | Total | |
|---|
| | (In thousands)
| |
|---|
Balance, December 31, 2011 | | | 11,684 | | $ | 285,168 | | | 66,341 | | $ | 1,164,853 | | $ | 62,277 | | $ | (624,121 | ) | $ | (16,279 | ) | $ | 871,898 | |
Issuance of preferred units (paid-in-kind) | | | 898 | | | 26,098 | | | — | | | — | | | — | | | — | | | — | | | 26,098 | |
Accrued in-kind units | | | — | | | 653 | | | — | | | — | | | — | | | — | | | — | | | 653 | |
In-kind distributions | | | — | | | (26,751 | ) | | — | | | — | | | — | | | — | | | — | | | (26,751 | ) |
Cash distributions to common unitholders | | | — | | | — | | | — | | | — | | | — | | | (126,317 | ) | | — | | | (126,317 | ) |
Issuance of common units | | | — | | | — | | | 5,750 | | | 188,083 | | | — | | | — | | | — | | | 188,083 | |
Equity offering costs | | | — | | | — | | | — | | | (320 | ) | | — | | | — | | | — | | | (320 | ) |
Equity-based compensation | | | — | | | — | | | 320 | | | 1,284 | | | 7,689 | | | — | | | — | | | 8,973 | |
Net loss | | | — | | | — | | | — | | | — | | | — | | | (97,628 | ) | | — | | | (97,628 | ) |
Derivative settlements reclassified to income | | | — | | | — | | | — | | | — | | | — | | | — | | | 6,882 | | | 6,882 | |
Unrealized income — change in fair value of derivatives | | | — | | | — | | | — | | | — | | | — | | | — | | | 11,506 | | | 11,506 | |
| | | | | | | | | | | | | | | | | | |
Balance, September 30, 2012 | | | 12,582 | | $ | 285,168 | | | 72,411 | | $ | 1,353,900 | | $ | 69,966 | | $ | (848,066 | ) | $ | 2,109 | | $ | 863,077 | |
| | | | | | | | | | | | | | | | | | |
| | | | | | | | | | | | | | | | | | | | | | | | | |
| | Series A Preferred | | Common | |
| |
| |
| |
| |
|---|
| | Number
of Units | | Preferred
Units | | Number
of Units | | Common
Units | | Paid-in
Capital | | Accumulated
Earnings
(Deficit) | | Accumulated
Other Comprehensive
(Loss) Income | | Total | |
|---|
| | (In thousands)
| |
|---|
Balance, December 31, 2010 | | | 10,585 | | $ | 285,172 | | | 65,915 | | $ | 1,161,652 | | $ | 51,743 | | $ | (313,454 | ) | $ | (30,356 | ) | $ | 1,154,757 | |
Issuance of preferred units (paid-in-kind) | | | 814 | | | 23,644 | | | — | | | — | | | — | | | — | | | — | | | 23,644 | |
Accrued in-kind units | | | — | | | 591 | | | — | | | — | | | — | | | — | | | — | | | 591 | |
In-kind distributions | | | — | | | (24,235 | ) | | — | | | — | | | — | | | — | | | — | | | (24,235 | ) |
Cash distributions to common unitholders | | | — | | | — | | | — | | | — | | | — | | | (115,657 | ) | | — | | | (115,657 | ) |
Equity offering costs | | | — | | | (4 | ) | | — | | | — | | | — | | | — | | | — | | | (4 | ) |
Equity-based compensation | | | — | | | — | | | 355 | | | 2,747 | | | 7,507 | | | — | | | — | | | 10,254 | |
Net loss | | | — | | | — | | | — | | | — | | | — | | | (163,565 | ) | | — | | | (163,565 | ) |
Derivative settlements reclassified to income | | | — | | | — | | | — | | | — | | | — | | | — | | | 28,101 | | | 28,101 | |
Unrealized loss — change in fair value of derivatives | | | — | | | — | | | — | | | — | | | — | | | — | | | (7,658 | ) | | (7,658 | ) |
| | | | | | | | | | | | | | | | | | |
Balance, September 30, 2011 | | | 11,399 | | $ | 285,168 | | | 66,270 | | $ | 1,164,399 | | $ | 59,250 | | $ | (592,676 | ) | $ | (9,913 | ) | $ | 906,228 | |
| | | | | | | | | | | | | | | | | | |
The accompanying notes are an integral part of these unaudited consolidated financial statements.
7
Table of Contents
COPANO ENERGY, L.L.C. AND SUBSIDIARIES
NOTES TO UNAUDITED CONSOLIDATED FINANCIAL STATEMENTS
Note 1 — Organization and Basis of Presentation
Copano Energy, L.L.C., a Delaware limited liability company, was formed in August 2001 to acquire entities owning businesses operating under the Copano name since 1992 and to serve as a holding company for our operating subsidiaries. We, through our subsidiaries and equity investments, provide midstream services to natural gas producers, including natural gas gathering, compression, dehydration, treating, marketing, transportation, processing and fractionation services. Our assets are located in Texas, Oklahoma and Wyoming.Unless otherwise indicated or the context requires otherwise, references to "Copano," "we," "our," "us" or like terms refer to Copano Energy, L.L.C. and its consolidated subsidiaries.
Our natural gas pipelines collect natural gas from wellheads or designated points near producing wells. We treat and process natural gas as needed to remove contaminants and to extract mixed natural gas liquids, or NGLs, and we deliver the resulting residue gas to third-party pipelines, local distribution companies, power generation facilities and industrial consumers. We sell extracted NGLs to petrochemical companies or other midstream companies as a mixture or as fractionated purity products and deliver them through our plant interconnects, trucking facilities or NGL pipelines. We process natural gas from our own gathering systems and from third-party pipelines, and in some cases we deliver natural gas and mixed NGLs to third parties who provide us with transportation, processing or fractionation services. We also provide natural gas transportation services in limited circumstances. We refer to our operations (i) conducted through our subsidiaries operating in Texas collectively as our "Texas" segment, (ii) conducted through our subsidiaries operating in Oklahoma collectively as our "Oklahoma" segment and (iii) conducted through our subsidiaries operating in Wyoming collectively as our "Rocky Mountains" segment. Through August 2012, the Texas segment included operations and results of our Lake Charles pant located in southwest Louisiana.
The accompanying unaudited consolidated financial statements and related notes include our assets, liabilities and results of operations for each of the periods presented. All intercompany accounts and transactions are eliminated in our unaudited consolidated financial statements.
The accompanying unaudited consolidated financial statements have been prepared without audit pursuant to the rules and regulations of the Securities and Exchange Commission ("SEC"). Accordingly, our financial statements reflect all normal and recurring adjustments that are, in the opinion of our management, necessary for a fair presentation of our results of operations for the interim periods. Certain information and notes normally included in financial statements prepared in accordance with generally accepted accounting principles have been condensed or omitted pursuant to such rules and regulations. As of September 30, 2012 and December 31, 2011, we changed our presentation for other current liabilities on our consolidated balance sheet to present separately accrued capital expenditures.
Our management believes that the disclosures in these unaudited consolidated financial statements are adequate to make the information presented not misleading. In the preparation of these financial statements, we evaluated subsequent events through the issuance date of the financial statements. These interim financial statements should be read in conjunction with the audited consolidated financial statements and notes thereto contained in our Annual Report on Form 10-K for the year ended December 31, 2011 ("2011 10-K").
8
Table of Contents
Note 2 — Recent Accounting Pronouncements
We adopted Accounting Standards Update ("ASU") 2011-05,"Comprehensive Income (Topic 220): Presentation of Comprehensive Income," which amended comprehensive income presentation guidance. We elected to present the components of other comprehensive income in two separate but consecutive statements. The adoption did not impact our consolidated financial results.
We adopted ASU 2011-04,"Amendments to Achieve Common Fair Value Measurement and Disclosure Requirements in U.S. GAAP and International Financial Reporting Standards," by changing certain fair value measurement principles and enhancing our disclosure of unobservable inputs discussed in Note 11. The adoption did not impact our consolidated financial results.
We have reviewed other recently issued, but not yet adopted, accounting standards and updates in order to determine their potential effects, if any, on our consolidated results of operations, financial position and cash flows and have determined that none are expected to have a material impact.
Note 3 — Intangible Assets
Our intangible assets consisted of the following as of the dates indicated:
| | | | | | | | | | | | | |
| | September 30, 2012 | |
|---|
| | Weighted
Average
Remaining
Amortization
Period | | Gross
Carrying
Amount | | Accumulated
Amortization | | Net | |
|---|
| | (In years)
| | (In thousands)
| |
|---|
Rights-of-way and easements | | | 19 | | $ | 151,329 | | $ | (32,605 | ) | $ | 118,724 | |
Contracts | | | 10 | | | 68,717 | | | (28,802 | ) | | 39,915 | |
Customer relationships | | | 10 | | | 4,864 | | | (1,851 | ) | | 3,013 | |
| | | | | | | | | | |
Total | | | 16 | | $ | 224,910 | | $ | (63,258 | ) | $ | 161,652 | |
| | | | | | | | | | |
| | | | | | | | | | | | | |
| | December 31, 2011 | |
|---|
| | Weighted
Average
Remaining
Amortization
Period | | Gross
Carrying
Amount | | Accumulated
Amortization | | Net | |
|---|
| | (In years)
| | (In thousands)
| |
|---|
Rights-of-way and easements | | | 19 | | $ | 145,598 | | $ | (28,822 | ) | $ | 116,776 | |
Contracts | | | 17 | | | 108,416 | | | (36,014 | ) | | 72,402 | |
Customer relationships | | | 11 | | | 4,864 | | | (1,617 | ) | | 3,247 | |
| | | | | | | | | | |
Total | | | 18 | | $ | 258,878 | | $ | (66,453 | ) | $ | 192,425 | |
| | | | | | | | | | |
During the three and nine months ended September 30, 2012 and 2011, we did not place in service any intangible assets with future renewals or extension costs. Amortization expense was $2,880,000 and $2,960,000 for the three months ended September 30, 2012 and 2011, respectively. Amortization expense was $8,898,000 and $8,814,000 for the nine months ended September 30, 2012 and 2011, respectively.
During the three months ended March 31, 2012 and September 30, 2011, we recorded non-cash impairment charges of $28,744,000 and $5,000,000, respectively, with respect to an underutilized contract for firm capacity that we resell to Rocky Mountains producers (see Accounting Standards Codification ("ASC")820 "Fair Value Measurement" andASC 815 "Derivatives and Hedging" in Note 11).
9
Table of Contents
Note 3 — Intangible Assets (Continued)
Estimated aggregate amortization expense remaining for 2012 and each of the five succeeding fiscal years is approximately:2012 —$3,290,000;2013 —$11,510,000;2014 —$11,347,000;2015 —$11,312,000;2016 —$11,290,000 and2017 —$11,050,000.
Note 4 — Investments in Unconsolidated Affiliates
Our investments in unconsolidated affiliates consisted of the following at September 30, 2012.
| | | | | | | |
| Equity Method Investment | | Structure | | Ownership
Percentage | | Segment |
|---|
Webb/Duval Gatherers ("Webb Duval") | | Texas general partnership | | | 62.50 | % | Texas |
Eagle Ford Gathering LLC ("Eagle Ford Gathering") | | Delaware limited liability company | | | 50.00 | % | Texas |
Liberty Pipeline Group, LLC ("Liberty Pipeline Group") | | Delaware limited liability company | | | 50.00 | % | Texas |
Double Eagle Pipeline LLC ("Double Eagle Pipeline") | | Delaware limited liability company | | | 50.00 | % | Texas |
Southern Dome, LLC ("Southern Dome") | | Delaware limited liability company | | | 69.50% | (1) | Oklahoma |
Bighorn Gas Gathering, L.L.C. ("Bighorn") | | Delaware limited liability company | | | 51.00 | % | Rocky Mountains |
Fort Union Gas Gathering, L.L.C. ("Fort Union") | | Delaware limited liability company | | | 37.04 | % | Rocky Mountains |
- (1)
- Represents Copano's right to distributions from Southern Dome
None of these entities' respective partnership or operating agreements restrict their ability to pay distributions to their respective partners or members after consideration of current and anticipated cash needs, including debt service obligations. However, Fort Union's credit agreement provides that it can distribute cash to its members only if its ratio of net operating cash flow to debt service is at least 1.25 to 1.00 and it is not otherwise in default under its credit agreement. If Fort Union fails to comply with this covenant or otherwise defaults under its credit agreement, it would be prohibited from distributing cash. As of September 30, 2012, Fort Union is in compliance with this financial covenant.
10
Table of Contents
Note 4 — Investments in Unconsolidated Affiliates (Continued)
Eagle Ford Gathering. Our investment in Eagle Ford Gathering totaled $148,596,000 and $120,910,000 as of September 30, 2012 and December 31, 2011, respectively. The summarized financial information for our investment in Eagle Ford Gathering, which is accounted for using the equity method, is as follows:
| | | | | | | |
| | As of and for the
Nine Months Ended
September 30, | |
|---|
| | 2012 | | 2011 | |
|---|
| | (In thousands)
| |
|---|
Operating revenue | | $ | 271,780 | | $ | 10,494 | |
Operating expenses | | | (220,068 | ) | | (5,609 | ) |
Depreciation and amortization | | | (9,275 | ) | | (1,064 | ) |
Other | | | (548 | ) | | — | |
| | | | | | |
Net income | | | 41,889 | | | 3,821 | |
Ownership % | | | 50 | % | | 50 | % |
| | | | | | |
| | | 20,945 | | | 1,911 | |
Copano's share of management fees charged | | | 199 | | | 74 | |
Amortization of difference between the carried investment and the underlying equity in net assets | | | (61 | ) | | (7 | ) |
| | | | | | |
Equity in earnings from Eagle Ford Gathering | | $ | 21,083 | | $ | 1,978 | |
| | | | | | |
Distributions | | $ | 16,617 | | $ | 775 | |
| | | | | | |
Contributions | | $ | 23,419 | | $ | 73,514 | |
| | | | | | |
Current assets | | $ | 53,751 | | $ | 21,464 | |
Noncurrent assets | | | 261,998 | | | 211,859 | |
Current liabilities | | | (25,210 | ) | | (23,886 | ) |
Noncurrent liabilities | | | (410 | ) | | (272 | ) |
| | | | | | |
Net assets | | $ | 290,129 | | $ | 209,165 | |
| | | | | | |
Bighorn and Fort Union. Our investments in Bighorn and Fort Union totaled $93,387,000 and $161,505,000, respectively, as of September 30, 2012, and $212,071,000 and $169,856,000, respectively, as of December 31, 2011.
We evaluate the carrying value of our investments in unconsolidated affiliates when circumstances indicate that our investment may not be fully recoverable. During the three months ended March 31, 2012, we recorded a $115 million non-cash impairment charge relating to our investment in Bighorn and a $5 million non-cash impairment charge relating to our investment in Fort Union. We determined that these charges were necessary primarily based on the low natural gas price environment in the region and our expectation for a lower level of drilling by producers in the Powder River Basin. We determined the fair value of our investments in Bighorn and Fort Union (seeASC 820 "Fair Value Measurement" andASC 815 "Derivatives and Hedging," in Note 11) using a probability-weighted discounted cash flow model with a discount rate reflective of our cost of capital and estimated contract rates, volumes, operating and maintenance costs and capital expenditures.
11
Table of Contents
Note 4 — Investments in Unconsolidated Affiliates (Continued)
The summarized financial information for our investments in Bighorn and Fort Union, which are accounted for using the equity method, is as follows:
| | | | | | | | | | | | | |
| | As of and for the Nine Months Ended September 30, | |
|---|
| | 2012 | | 2011 | |
|---|
| | Bighorn | | Fort Union | | Bighorn | | Fort Union | |
|---|
| | (In thousands)
| |
|---|
Operating revenue | | $ | 17,759 | | $ | 40,873 | | $ | 20,436 | | $ | 41,011 | |
Operating expenses | | | (7,215 | ) | | (5,329 | ) | | (7,089 | ) | | (5,175 | ) |
Depreciation and amortization | | | (4,065 | ) | | (5,993 | ) | | (3,874 | ) | | (5,994 | ) |
Interest income (expense) and other | | | 80 | | | (1,262 | ) | | 62 | | | (1,705 | ) |
| | | | | | | | | | |
Net income | | | 6,559 | | | 28,289 | | | 9,535 | | | 28,137 | |
Ownership % | | | 51 | % | | 37.04 | % | | 51 | % | | 37.04 | % |
| | | | | | | | | | |
| | | 3,345 | | | 10,478 | | | 4,863 | | | 10,422 | |
Priority allocation of earnings and other | | | 376 | | | — | | | 460 | | | — | |
Copano's share of management fees charged | | | 148 | | | 72 | | | 147 | | | 68 | |
Amortization of difference between the carried investment and the underlying equity in net assets and impairment | | | (117,738 | ) | | (8,421 | ) | | (128,445 | ) | | (49,817 | ) |
| | | | | | | | | | |
Equity in (loss) earnings from Bighorn and Fort Union | | $ | (113,869 | ) | $ | 2,129 | | $ | (122,975 | ) | $ | (39,327 | ) |
| | | | | | | | | | |
Distributions | | $ | 6,360 | | $ | 10,408 | | $ | 7,415 | | $ | 9,927 | |
| | | | | | | | | | |
Contributions | | $ | 1,693 | | $ | — | | $ | 530 | | $ | — | |
| | | | | | | | | | |
Current assets | | $ | 4,063 | | $ | 7,524 | | $ | 5,304 | | $ | 12,447 | |
Noncurrent assets | | | 85,350 | | | 190,057 | | | 86,587 | | | 198,227 | |
Current liabilities | | | (1,544 | ) | | (64,887 | ) | | (1,852 | ) | | (20,285 | ) |
Noncurrent liabilities | | | (332 | ) | | (141 | ) | | (289 | ) | | (63,046 | ) |
| | | | | | | | | | |
Net assets | | $ | 87,537 | | $ | 132,553 | | $ | 89,750 | | $ | 127,343 | |
| | | | | | | | | | |
12
Table of Contents
Note 4 — Investments in Unconsolidated Affiliates (Continued)
Other. Our investments in our other unconsolidated affiliates (Webb Duval, Double Eagle Pipeline, Liberty Pipeline Group and Southern Dome) totaled $76,630,000 and $41,850,000 as of September 30, 2012 and December 31, 2011, respectively. The summarized financial information for our investments in other unconsolidated affiliates is presented below in aggregate:
| | | | | | | |
| | As of and for the
Nine Months Ended
September 30, | |
|---|
| | 2012 | | 2011 | |
|---|
| | (In thousands)
| |
|---|
Operating revenue | | $ | 15,539 | | $ | 21,283 | |
Operating expenses | | | (10,822 | ) | | (17,887 | ) |
Depreciation and amortization | | | (3,041 | ) | | (1,394 | ) |
Other | | | (16 | ) | | — | |
| | | | | | |
Net income | | $ | 1,660 | | $ | 2,002 | |
| | | | | | |
Equity in earnings from unconsolidated affiliates | | $ | 924 | | $ | 1,743 | |
| | | | | | |
Distributions | | $ | 1,123 | | $ | 2,212 | |
| | | | | | |
Contributions(1) | | $ | 35,565 | | $ | 27,391 | |
| | | | | | |
Current assets | | $ | 9,001 | | $ | 5,306 | |
Noncurrent assets | | | 145,163 | | | 71,471 | |
Current liabilities | | | (9,201 | ) | | (6,876 | ) |
Noncurrent liabilities | | | (184 | ) | | (170 | ) |
| | | | | | |
Net assets | | $ | 144,779 | | $ | 69,731 | |
| | | | | | |
| | | | | | | |
- (1)
- Contributions for the nine months ended September 30, 2012 and 2011 were primarily made to Double Eagle Pipeline and Liberty Pipeline Group.
Note 5 — Long-Term Debt
| | | | | | | |
| | September 30,
2012 | | December 31,
2011 | |
|---|
| | (In thousands)
| |
|---|
Revolving credit facility | | $ | 330,000 | | $ | 385,000 | |
Senior Notes: | | | | | | | |
7.75% senior unsecured notes due 2018 | | | 249,525 | | | 249,525 | |
7.125% senior unsecured notes due 2021 | | | 510,000 | | | 360,000 | |
Unamortized bond premium-senior unsecured notes due 2021 | | | 3,194 | | | — | |
| | | | | | |
Total Senior Notes | | | 762,719 | | | 609,525 | |
| | | | | | |
Total long-term debt | | $ | 1,092,719 | | $ | 994,525 | |
| | | | | | |
Our $700 million senior secured revolving credit facility with Bank of America, N.A., as Administrative Agent, matures on June 10, 2016. The revolving credit facility contains covenants (some of which require us to make certain subjective representations and warranties), including financial covenants that require us and our subsidiary guarantors, on a consolidated basis, to maintain specified ratios. We are in compliance with the financial covenants under the revolving credit facility as of September 30, 2012.
13
Table of Contents
Note 5 — Long-Term Debt (Continued)
Future borrowings under our revolving credit facility are available for acquisitions, capital expenditures, working capital and general corporate purposes, and the facility may be drawn on and repaid without restrictions so long as we are in compliance with its terms, including maximum leverage ratios (applicable to our secured debt and total debt) and a minimum interest coverage ratio.
The weighted average interest rate on borrowings under the revolving credit facility for the nine months ended September 30, 2012 and 2011 was 5.63% and 6.48%, respectively, and the quarterly commitment fee was 0.5% and 0.375% on the unused portion of the revolving credit facility as of September 30, 2012 and 2011, respectively. Interest and other financing costs related to the revolving credit facility totaled $7,979,000 and $5,468,000 for the nine months ended September 30, 2012 and 2011, respectively. Costs incurred with the establishment and amendment and restatement of this credit facility are being amortized over its term, and as of September 30, 2012, the unamortized portion of debt issue costs totaled $8,579,000.
7.125% Senior Notes due 2021. On February 7, 2012, we completed a registered underwritten offering of an additional $150,000,000 in aggregate principal amount (the "new notes") of our existing 7.125% senior unsecured notes due 2021 (the "2021 Notes"). The new notes were issued under the same indenture as the 2021 Notes and are part of the same series of debt securities. The new notes priced at 102.25% of their principal amount, for net proceeds of approximately $150.1 million, excluding accrued interest on the new notes and after deducting related fees and expenses (including underwriting discounts and commissions). We used the net proceeds from the new notes to repay a portion of the outstanding indebtedness under our revolving credit facility.
Interest on the 2021 Notes is payable each April 1 and October 1. Interest and other financing costs related to the 2021 Notes totaled $26,844,000 and $12,937,000 for the nine months ended September 30, 2012 and 2011, respectively. Costs of issuing the 2021 Notes are being amortized over the term of the 2021 Notes and, as of September 30, 2012, the unamortized portion of debt issue costs totaled $9,890,000.
7.75% Senior Notes due 2018. Interest on the 7.75% senior unsecured notes due 2018 (the "2018 Notes" and, together with the 2021 Notes, the "Senior Notes") is payable each June 1 and December 1. Interest and other financing costs related to the 2018 Notes totaled $14,912,000 for each of the nine months ended September 30, 2012 and 2011. Costs of issuing the 2018 Notes are being amortized over the term of the 2018 Notes and, as of September 30, 2012, the unamortized portion of debt issue costs totaled $3,083,000.
8.125% Senior Notes due 2016. Pursuant to a tender offer and subsequent mandatory redemption completed in April 2011, we repurchased or redeemed all of our then outstanding 8.125% senior unsecured notes due 2016 (the "2016 Notes") using the net proceeds from our April 2011 issuance of the 2021 Notes. Interest and other financing costs related to the 2016 Notes totaled $7,664,000 for the nine months ended September 30, 2011.
General. The indentures governing our Senior Notes restrict our ability to pay cash distributions. Before we can pay a distribution to our unitholders, we must demonstrate that our ratio of EBITDA to fixed charges (as defined in the Senior Notes indentures) is at least 1.75 to 1.0.
We are in compliance with the financial covenants under the Senior Notes indentures as of September 30, 2012.
Condensed consolidating unaudited financial information for Copano and its 100%-owned subsidiaries is presented below.
14
Table of Contents
Note 5 — Long-Term Debt (Continued)
| | | | | | | | | | | | | | | | | | | | | | | | | | | | | | | | | | | | | |
| | September 30, 2012 | | December 31, 2011 | |
|---|
| | Parent | | Co-Issuer | | Guarantor
Subsidiaries | | Investment in
Non-Guarantor
Subsidiaries | | Eliminations | | Total | | Parent | | Co-Issuer | | Guarantor
Subsidiaries | | Investment in
Non-Guarantor
Subsidiaries | | Eliminations | | Total | |
|---|
| | (In thousands)
| |
|---|
ASSETS | | | | | | | | | | | | | | | | | | | | | | | | | | | | | | | | | | | | | |
Current assets: | | | | | | | | | | | | | | | | | | | | | | | | | | | | | | | | | | | | | |
Cash and cash equivalents | | $ | 22,655 | | $ | — | | $ | 30,829 | | $ | — | | $ | — | | $ | 53,484 | | $ | 9,064 | | $ | — | | $ | 47,898 | | $ | — | | $ | — | | $ | 56,962 | |
Accounts receivable, net | | | — | | | — | | | 112,165 | | | — | | | — | | | 112,165 | | | 2,374 | | | — | | | 116,819 | | | — | | | — | | | 119,193 | |
Intercompany receivable | | | 275,797 | | | (2 | ) | | (275,795 | ) | | — | | | — | | | — | | | 153,059 | | | (1 | ) | | (153,058 | ) | | — | | | — | | | — | |
Risk management assets | | | — | | | — | | | 16,420 | | | — | | | — | | | 16,420 | | | — | | | — | | | 4,322 | | | — | | | — | | | 4,322 | |
Prepayments and other current assets | | | 2,257 | | | — | | | 997 | | | — | | | — | | | 3,254 | | | 3,975 | | | — | | | 1,139 | | | — | | | — | | | 5,114 | |
| | | | | | | | | | | | | | | | | | | | | | | | | | |
Total current assets | | | 300,709 | | | (2 | ) | | (115,384 | ) | | — | | | — | | | 185,323 | | | 168,472 | | | (1 | ) | | 17,120 | | | — | | | — | | | 185,591 | |
| | | | | | | | | | | | | | | | | | | | | | | | | | |
Property, plant and equipment, net | | | — | | | — | | | 1,301,813 | | | — | | | — | | | 1,301,813 | | | 16 | | | — | | | 1,103,683 | | | — | | | — | | | 1,103,699 | |
Intangible assets, net | | | — | | | — | | | 161,652 | | | — | | | — | | | 161,652 | | | — | | | — | | | 192,425 | | | — | | | — | | | 192,425 | |
Investments in unconsolidated affiliates | | | — | | | — | | | 480,118 | | | 480,118 | | | (480,118 | ) | | 480,118 | | | — | | | — | | | 544,687 | | | 544,687 | | | (544,687 | ) | | 544,687 | |
Investments in consolidated subsidiaries | | | 1,672,043 | | | — | | | — | | | — | | | (1,672,043 | ) | | — | | | 1,698,260 | | | — | | | — | | | — | | | (1,698,260 | ) | | — | |
Escrow cash | | | — | | | — | | | 1,848 | | | — | | | — | | | 1,848 | | | — | | | — | | | 1,848 | | | — | | | — | | | 1,848 | |
Risk management assets | | | — | | | — | | | 6,941 | | | — | | | — | | | 6,941 | | | — | | | — | | | 6,452 | | | — | | | — | | | 6,452 | |
Other assets, net | | | 21,572 | | | — | | | 6,591 | | | — | | | — | | | 28,163 | | | 21,136 | | | — | | | 8,759 | | | — | | | — | | | 29,895 | |
| | | | | | | | | | | | | | | | | | | | | | | | | | |
Total assets | | $ | 1,994,324 | | $ | (2 | ) | $ | 1,843,579 | | $ | 480,118 | | $ | (2,152,161 | ) | $ | 2,165,858 | | $ | 1,887,884 | | $ | (1 | ) | $ | 1,874,974 | | $ | 544,687 | | $ | (2,242,947 | ) | $ | 2,064,597 | |
| | | | | | | | | | | | | | | | | | | | | | | | | | |
LIABILITIES AND MEMBERS'/PARTNERS' CAPITAL
|
|
Current liabilities: | | | | | | | | | | | | | | | | | | | | | | | | | | | | | | | | | | | | | |
Accounts payable | | $ | 85 | | $ | — | | $ | 137,147 | | $ | — | | $ | — | | $ | 137,232 | | $ | 31 | | $ | — | | $ | 155,890 | | $ | — | | $ | — | | $ | 155,921 | |
Accrued capital expenditures | | | — | | | | | | 9,841 | | | — | | | — | | | 9,841 | | | — | | | — | | | 7,033 | | | — | | | — | | | 7,033 | |
Accrued interest | | | 25,022 | | | — | | | — | | | — | | | — | | | 25,022 | | | 8,686 | | | — | | | — | | | — | | | — | | | 8,686 | |
Accrued tax liability | | | 1,148 | | | — | | | — | | | — | | | — | | | 1,148 | | | 1,182 | | | — | | | — | | | — | | | — | | | 1,182 | |
Risk management liabilities | | | — | | | — | | | 1,512 | | | — | | | — | | | 1,512 | | | — | | | — | | | 3,565 | | | — | | | — | | | 3,565 | |
Other current liabilities | | | 6,574 | | | — | | | 16,400 | | | — | | | — | | | 22,974 | | | 6,809 | | | — | | | 8,198 | | | — | | | — | | | 15,007 | |
| | | | | | | | | | | | | | | | | | | | | | | | | | |
Total current liabilities | | | 32,829 | | | — | | | 164,900 | | | — | | | — | | | 197,729 | | | 16,708 | | | — | | | 174,686 | | | — | | | — | | | 191,394 | |
| | | | | | | | | | | | | | | | | | | | | | | | | | |
Long-term debt | | | 1,092,719 | | | — | | | — | | | — | | | — | | | 1,092,719 | | | 994,525 | | | — | | | — | | | — | | | — | | | 994,525 | |
Deferred tax liability | | | 2,321 | | | — | | | 119 | | | — | | | — | | | 2,440 | | | 2,119 | | | — | | | 80 | | | — | | | — | | | 2,199 | |
Other noncurrent liabilities | | | 3,378 | | | — | | | 6,515 | | | — | | | — | | | 9,893 | | | 2,634 | | | — | | | 1,947 | | | — | | | — | | | 4,581 | |
Members'/Partners' capital: | | | | | | | | | | | | | | | | | | | | | | | | | | | | | | | | | | | | | |
Series A convertible preferred units | | | 285,168 | | | — | | | — | | | — | | | — | | | 285,168 | | | 285,168 | | | — | | | — | | | — | | | — | | | 285,168 | |
Common units | | | 1,353,900 | | | — | | | — | | | — | | | — | | | 1,353,900 | | | 1,164,853 | | | — | | | — | | | — | | | — | | | 1,164,853 | |
Paid in capital | | | 69,966 | | | 1 | | | 1,199,163 | | | 712,928 | | | (1,912,092 | ) | | 69,966 | | | 62,277 | | | 1 | | | 1,208,051 | | | 687,763 | | | (1,895,815 | ) | | 62,277 | |
Accumulated (deficit) earnings | | | (848,066 | ) | | (3 | ) | | 470,773 | | | (232,810 | ) | | (237,960 | ) | | (848,066 | ) | | (624,121 | ) | | (2 | ) | | 506,489 | | | (143,076 | ) | | (363,411 | ) | | (624,121 | ) |
Accumulated other comprehensive income (loss) | | | 2,109 | | | — | | | 2,109 | | | — | | | (2,109 | ) | | 2,109 | | | (16,279 | ) | | — | | | (16,279 | ) | | — | | | 16,279 | | | (16,279 | ) |
| | | | | | | | | | | | | | | | | | | | | | | | | | |
| | | 863,077 | | | (2 | ) | | 1,672,045 | | | 480,118 | | | (2,152,161 | ) | | 863,077 | | | 871,898 | | | (1 | ) | | 1,698,261 | | | 544,687 | | | (2,242,947 | ) | | 871,898 | |
| | | | | | | | | | | | | | | | | | | | | | | | | | |
Total liabilities and members'/partners' capital | | $ | 1,994,324 | | $ | (2 | ) | $ | 1,843,579 | | $ | 480,118 | | $ | (2,152,161 | ) | $ | 2,165,858 | | $ | 1,887,884 | | $ | (1 | ) | $ | 1,874,974 | | $ | 544,687 | | $ | (2,242,947 | ) | $ | 2,064,597 | |
| | | | | | | | | | | | | | | | | | | | | | | | | | |
15
Table of Contents
Note 5 — Long-Term Debt (Continued)
| | | | | | | | | | | | | | | | | | | | | | | | | | | | | | | | | | | | | |
| | Three Months Ended September 30, 2012 | | Three Months Ended September 30, 2011 | |
|---|
| | Parent | | Co-Issuer | | Guarantor
Subsidiaries | | Investment in
Non-Guarantor
Subsidiaries | | Eliminations | | Total | | Parent | | Co-Issuer | | Guarantor
Subsidiaries | | Investment in
Non-Guarantor
Subsidiaries | | Eliminations | | Total | |
|---|
| | (In thousands)
| |
|---|
Revenue: | | | | | | | | | | | | | | | | | | | | | | | | | | | | | | | | | | | | | |
Natural gas sales | | $ | — | | $ | — | | $ | 97,614 | | $ | — | | $ | — | | $ | 97,614 | | $ | — | | $ | — | | $ | 120,815 | | $ | — | | $ | — | | $ | 120,815 | |
Natural gas liquids sales | | | — | | | — | | | 205,464 | | | — | | | — | | | 205,464 | | | — | | | — | | | 191,370 | | | — | | | — | | | 191,370 | |
Transportation, compression and processing fees | | | — | | | — | | | 49,314 | | | — | | | — | | | 49,314 | | | — | | | — | | | 30,337 | | | — | | | — | | | 30,337 | |
Condensate and other | | | — | | | — | | | 14,001 | | | — | | | — | | | 14,001 | | | — | | | — | | | 11,169 | | | — | | | — | | | 11,169 | |
| | | | | | | | | | | | | | | | | | | | | | | | | | |
Total revenue | | | — | | | — | | | 366,393 | | | — | | | — | | | 366,393 | | | — | | | — | | | 353,691 | | | — | | | — | | | 353,691 | |
| | | | | | | | | | | | | | | | | | | | | | | | | | |
Costs and expenses: | | | | | | | | | | | | | | | | | | | | | | | | | | | | | | | | | | | | | |
Cost of natural gas and natural gas liquids | | | — | | | — | | | 284,936 | | | — | | | — | | | 284,936 | | | — | | | — | | | 281,858 | | | — | | | — | | | 281,858 | |
Transportation | | | — | | | — | | | 6,365 | | | — | | | — | | | 6,365 | | | — | | | — | | | 6,991 | | | — | | | — | | | 6,991 | |
Operations and maintenance | | | — | | | — | | | 19,242 | | | — | | | — | | | 19,242 | | | — | | | — | | | 16,091 | | | — | | | — | | | 16,091 | |
Depreciation and amortization | | | — | | | — | | | 19,259 | | | — | | | — | | | 19,259 | | | 10 | | | — | | | 16,901 | | | — | | | — | | | 16,911 | |
Impairment | | | — | | | — | | | — | | | — | | | — | | | — | | | — | | | — | | | 5,000 | | | — | | | — | | | 5,000 | |
General and administrative | | | 7,129 | | | — | | | 6,568 | | | — | | | — | | | 13,697 | | | 4,460 | | | — | | | 5,571 | | | — | | | — | | | 10,031 | |
Taxes other than income | | | — | | | — | | | 1,983 | | | — | | | — | | | 1,983 | | | — | | | — | | | 1,502 | | | — | | | — | | | 1,502 | |
Equity in (earnings) loss from unconsolidated affiliates | | | — | | | — | | | (12,558 | ) | | (12,558 | ) | | 12,558 | | | (12,558 | ) | | — | | | — | | | 161,589 | | | 161,589 | | | (161,589 | ) | | 161,589 | |
Gain on sale of operating assets | | | — | | | — | | | (9,716 | ) | | — | | | — | | | (9,716 | ) | | — | | | — | | | — | | | — | | | — | | | — | |
| | | | | | | | | | | | | | | | | | | | | | | | | | |
Total costs and expenses | | | 7,129 | | | — | | | 316,079 | | | (12,558 | ) | | 12,558 | | | 323,208 | | | 4,470 | | | — | | | 495,503 | | | 161,589 | | | (161,589 | ) | | 499,973 | |
| | | | | | | | | | | | | | | | | | | | | | | | | | |
Operating (loss) income | | | (7,129 | ) | | — | | | 50,314 | | | 12,558 | | | (12,558 | ) | | 43,185 | | | (4,470 | ) | | — | | | (141,812 | ) | | (161,589 | ) | | 161,589 | | | (146,282 | ) |
Other income (expense): | | | | | | | | | | | | | | | | | | | | | | | | | | | | | | | | | | | | | |
Interest and other income | | | — | | | — | | | 11 | | | — | | | — | | | 11 | | | — | | | — | | | 16 | | | — | | | — | | | 16 | |
Interest and other financing costs | | | (13,752 | ) | | — | | | (45 | ) | | — | | | — | | | (13,797 | ) | | (10,952 | ) | | — | | | (128 | ) | | — | | | — | | | (11,080 | ) |
| | | | | | | | | | | | | | | | | | | | | | | | | | |
(Loss) income before income taxes and equity in earnings (loss) from consolidated subsidiaries | | | (20,881 | ) | | — | | | 50,280 | | | 12,558 | | | (12,558 | ) | | 29,399 | | | (15,422 | ) | | — | | | (141,924 | ) | | (161,589 | ) | | 161,589 | | | (157,346 | ) |
Provision for income taxes | | | (459 | ) | | — | | | (15 | ) | | — | | | — | | | (474 | ) | | (365 | ) | | — | | | (25 | ) | | — | | | — | | | (390 | ) |
| | | | | | | | | | | | | | | | | | | | | | | | | | |
(Loss) income before equity in earnings (loss) from consolidated subsidiaries | | | (21,340 | ) | | — | | | 50,265 | | | 12,558 | | | (12,558 | ) | | 28,925 | | | (15,787 | ) | | — | | | (141,949 | ) | | (161,589 | ) | | 161,589 | | | (157,736 | ) |
Equity in earnings (loss) from consolidated subsidiaries | | | 50,265 | | | — | | | — | | | — | | | (50,265 | ) | | — | | | (141,949 | ) | | — | | | — | | | — | | | 141,949 | | | — | |
| | | | | | | | | | | | | | | | | | | | | | | | | | |
Net income (loss) | | | 28,925 | | | — | | | 50,265 | | | 12,558 | | | (62,823 | ) | | 28,925 | | | (157,736 | ) | | — | | | (141,949 | ) | | (161,589 | ) | | 303,538 | | | (157,736 | ) |
Preferred unit distributions | | | (9,138 | ) | | — | | | — | | | — | | | — | | | (9,138 | ) | | (8,279 | ) | | — | | | — | | | — | | | — | | | (8,279 | ) |
| | | | | | | | | | | | | | | | | | | | | | | | | | |
Net income (loss) to common units | | $ | 19,787 | | $ | — | | $ | 50,265 | | $ | 12,558 | | $ | (62,823 | ) | $ | 19,787 | | $ | (166,015 | ) | $ | — | | $ | (141,949 | ) | $ | (161,589 | ) | $ | 303,538 | | $ | (166,015 | ) |
| | | | | | | | | | | | | | | | | | | | | | | | | | |
Net income (loss) | | $ | 28,925 | | $ | — | | $ | 50,265 | | $ | 12,558 | | $ | (62,823 | ) | $ | 28,925 | | $ | (157,736 | ) | $ | — | | $ | (141,949 | ) | $ | (161,589 | ) | $ | 303,538 | | $ | (157,736 | ) |
Other comprehensive (loss) income: | | | | | | | | | | | | | | | | | | | | | | | | | | | | | | | | | | | | | |
Derivative settlements reclassified to earnings | | | 570 | | | — | | | 570 | | | — | | | (570 | ) | | 570 | | | 9,777 | | | — | | | 9,777 | | | — | | | (9,777 | ) | | 9,777 | |
Unrealized (loss) gain-change in fair value of derivatives | | | (5,664 | ) | | — | | | (5,664 | ) | | — | | | 5,664 | | | (5,664 | ) | | 7,999 | | | — | | | 7,999 | | | — | | | (7,999 | ) | | 7,999 | |
| | | | | | | | | | | | | | | | | | | | | | | | | | |
Total other comprehensive (loss) income | | | (5,094 | ) | | — | | | (5,094 | ) | | — | | | 5,094 | | | (5,094 | ) | | 17,776 | | | — | | | 17,776 | | | — | | | (17,776 | ) | | 17,776 | |
| | | | | | | | | | | | | | | | | | | | | | | | | | |
Comprehensive income (loss) | | $ | 23,831 | | $ | — | | $ | 45,171 | | $ | 12,558 | | $ | (57,729 | ) | $ | 23,831 | | $ | (139,960 | ) | $ | — | | $ | (124,173 | ) | $ | (161,589 | ) | $ | 285,762 | | $ | (139,960 | ) |
| | | | | | | | | | | | | | | | | | | | | | | | | | |
16
Table of Contents
Note 5 — Long-Term Debt (Continued)
| | | | | | | | | | | | | | | | | | | | | | | | | | | | | | | | | | | | | |
| | Nine Months Ended September 30, 2012 | | Nine Months Ended September 30, 2011 | |
|---|
| | Parent | | Co-Issuer | | Guarantor
Subsidiaries | | Investment in
Non-Guarantor
Subsidiaries | | Eliminations | | Total | | Parent | | Co-Issuer | | Guarantor
Subsidiaries | | Investment in
Non-Guarantor
Subsidiaries | | Eliminations | | Total | |
|---|
| | (In thousands)
| |
|---|
Revenue: | | | | | | | | | | | | | | | | | | | | | | | | | | | | | | | | | | | | | |
Natural gas sales | | $ | — | | $ | — | | $ | 253,819 | | $ | — | | $ | — | | $ | 253,819 | | $ | — | | $ | — | | $ | 348,538 | | $ | — | | $ | — | | $ | 348,538 | |
Natural gas liquids sales | | | — | | | — | | | 589,431 | | | — | | | — | | | 589,431 | | | — | | | — | | | 521,129 | | | — | | | — | | | 521,129 | |
Transportation, compression and processing fees | | | — | | | — | | | 132,394 | | | — | | | — | | | 132,394 | | | — | | | — | | | 82,706 | | | — | | | — | | | 82,706 | |
Condensate and other | | | — | | | — | | | 45,280 | | | — | | | — | | | 45,280 | | | — | | | — | | | 37,299 | | | — | | | — | | | 37,299 | |
| | | | | | | | | | | | | | | | | | | | | | | | | | |
Total revenue | | | — | | | — | | | 1,020,924 | | | — | | | — | | | 1,020,924 | | | — | | | — | | | 989,672 | | | — | | | — | | | 989,672 | |
| | | | | | | | | | | | | | | | | | | | | | | | | | |
Costs and expenses: | | | | | | | | | | | | | | | | | | | | | | | | | | | | | | | | | | | | | |
Cost of natural gas and natural gas liquids | | | — | | | — | | | 789,369 | | | — | | | — | | | 789,369 | | | — | | | — | | | 779,986 | | | — | | | — | | | 779,986 | |
Transportation | | | — | | | — | | | 18,785 | | | — | | | — | | | 18,785 | | | — | | | — | | | 19,202 | | | — | | | — | | | 19,202 | |
Operations and maintenance | | | — | | | — | | | 56,171 | | | — | | | — | | | 56,171 | | | — | | | — | | | 46,953 | | | — | | | — | | | 46,953 | |
Depreciation and amortization | | | 16 | | | — | | | 57,393 | | | — | | | — | | | 57,409 | | | 30 | | | — | | | 51,113 | | | — | | | — | | | 51,143 | |
Impairment | | | — | | | — | | | 28,744 | | | — | | | — | | | 28,744 | | | — | | | — | | | 5,000 | | | — | | | — | | | 5,000 | |
General and administrative | | | 19,855 | | | — | | | 19,084 | | | — | | | — | | | 38,939 | | | 17,876 | | | — | | | 16,654 | | | — | | | — | | | 34,530 | |
Taxes other than income | | | — | | | — | | | 5,459 | | | — | | | — | | | 5,459 | | | — | | | — | | | 4,029 | | | — | | | — | | | 4,029 | |
Equity in loss (earnings) from unconsolidated affiliates | | | — | | | — | | | 89,733 | | | 89,733 | | | (89,733 | ) | | 89,733 | | | — | | | — | | | 158,581 | | | 158,581 | | | (158,581 | ) | | 158,581 | |
Gain on sale of operating assets | | | — | | | — | | | (9,716 | ) | | — | | | — | | | (9,716 | ) | | — | | | — | | | — | | | — | | | — | | | — | |
| | | | | | | | | | | | | | | | | | | | | | | | | | |
Total costs and expenses | | | 19,871 | | | — | | | 1,055,022 | | | 89,733 | | | (89,733 | ) | | 1,074,893 | | | 17,906 | | | — | | | 1,081,518 | | | 158,581 | | | (158,581 | ) | | 1,099,424 | |
| | | | | | | | | | | | | | | | | | | | | | | | | | |
Operating (loss) income | | | (19,871 | ) | | — | | | (34,098 | ) | | (89,733 | ) | | 89,733 | | | (53,969 | ) | | (17,906 | ) | | — | | | (91,846 | ) | | (158,581 | ) | | 158,581 | | | (109,752 | ) |
Other income (expense): | | | | | | | | | | | | | | | | | | | | | | | | | | | | | | | | | | | | | |
Interest and other income | | | — | | | — | | | 570 | | | — | | | — | | | 570 | | | — | | | — | | | 31 | | | — | | | — | | | 31 | |
Loss of refinancing of unsecured debt | | | — | | | — | | | — | | | — | | | �� | | | — | | | (18,233 | ) | | | | | — | | | — | | | — | | | (18,233 | ) |
Interest and other financing costs | | | (42,576 | ) | | — | | | (247 | ) | | — | | | — | | | (42,823 | ) | | (33,579 | ) | | — | | | (871 | ) | | — | | | — | | | (34,450 | ) |
| | | | | | | | | | | | | | | | | | | | | | | | | | |
(Loss) income before income taxes and equity in (loss) earnings from consolidated subsidiaries | | | (62,447 | ) | | — | | | (33,775 | ) | | (89,733 | ) | | 89,733 | | | (96,222 | ) | | (69,718 | ) | | — | | | (92,686 | ) | | (158,581 | ) | | 158,581 | | | (162,404 | ) |
Provision for income taxes | | | (1,368 | ) | | — | | | (38 | ) | | — | | | — | | | (1,406 | ) | | (1,105 | ) | | — | | | (56 | ) | | — | | | — | | | (1,161 | ) |
| | | | | | | | | | | | | | | | | | | | | | | | | | |
(Loss) income before equity in (loss) earnings from consolidated subsidiaries | | | (63,815 | ) | | — | | | (33,813 | ) | | (89,733 | ) | | 89,733 | | | (97,628 | ) | | (70,823 | ) | | — | | | (92,742 | ) | | (158,581 | ) | | 158,581 | | | (163,565 | ) |
Equity in (loss) earnings from consolidated subsidiaries | | | (33,813 | ) | | — | | | — | | | — | | | 33,813 | | | — | | | (92,742 | ) | | — | | | — | | | — | | | 92,742 | | | — | |
| | | | | | | | | | | | | | | | | | | | | | | | | | |
Net (loss) income | | | (97,628 | ) | | — | | | (33,813 | ) | | (89,733 | ) | | 123,546 | | | (97,628 | ) | | (163,565 | ) | | — | | | (92,742 | ) | | (158,581 | ) | | 251,323 | | | (163,565 | ) |
Preferred unit distributions | | | (26,751 | ) | | — | | | — | | | — | | | — | | | (26,751 | ) | | (24,235 | ) | | — | | | — | | | — | | | — | | | (24,235 | ) |
| | | | | | | | | | | | | | | | | | | | | | | | | | |
Net (loss) income to common units | | $ | (124,379 | ) | $ | — | | $ | (33,813 | ) | $ | (89,733 | ) | $ | 123,546 | | $ | (124,379 | ) | $ | (187,800 | ) | $ | — | | $ | (92,742 | ) | $ | (158,581 | ) | $ | 251,323 | | $ | (187,800 | ) |
| | | | | | | | | | | | | | | | | | | | | | | | | | |
Net (loss) income | | $ | (97,628 | ) | $ | — | | $ | (33,813 | ) | $ | (89,733 | ) | $ | 123,546 | | $ | (97,628 | ) | $ | (163,565 | ) | $ | — | | $ | (92,742 | ) | $ | (158,581 | ) | $ | 251,323 | | $ | (163,565 | ) |
Other comprehensive income (loss): | | | | | | | | | | | | | | | | | | | | | | | | | | | | | | | | | | | | | |
Derivative settlements reclassified to earnings | | | 6,882 | | | — | | | 6,882 | | | — | | | (6,882 | ) | | 6,882 | | | 28,101 | | | — | | | 28,101 | | | — | | | (28,101 | ) | | 28,101 | |
Unrealized gain (loss)-change in fair value of derivatives | | | 11,506 | | | — | | | 11,506 | | | — | | | (11,506 | ) | | 11,506 | | | (7,658 | ) | | — | | | (7,658 | ) | | — | | | 7,658 | | | (7,658 | ) |
| | | | | | | | | | | | | | | | | | | | | | | | | | |
Total other comprehensive income (loss) | | | 18,388 | | | — | | | 18,388 | | | — | | | (18,388 | ) | | 18,388 | | | 20,443 | | | — | | | 20,443 | | | — | | | (20,443 | ) | | 20,443 | |
| | | | | | | | | | | | | | | | | | | | | | | | | | |
Comprehensive (loss) income | | $ | (79,240 | ) | $ | — | | $ | (15,425 | ) | $ | (89,733 | ) | $ | 105,158 | | $ | (79,240 | ) | $ | (143,122 | ) | $ | — | | $ | (72,299 | ) | $ | (158,581 | ) | $ | 230,880 | | $ | (143,122 | ) |
| | | | | | | | | | | | | | | | | | | | | | | | | | |
17
Table of Contents
Note 5 — Long-Term Debt (Continued)
| | | | | | | | | | | | | | | | | | | | | | | | | | | | | | | | | | | | | |
| | Nine Months Ended September 30, 2012 | | Nine Months Ended September 30, 2011 | |
|---|
| | Parent | | Co-Issuer | | Guarantor
Subsidiaries | | Investment in
Non-Guarantor
Subsidiaries | | Eliminations | | Total | | Parent | | Co-Issuer | | Guarantor
Subsidiaries | | Investment in
Non-Guarantor
Subsidiaries | | Eliminations | | Total | |
|---|
| | (In thousands)
| |
|---|
Cash Flows From Operating Activities: | | | | | | | | | | | | | | | | | | | | | | | | | | | | | | | | | | | | | |
Net cash (used in) provided by operating activities | | $ | (138,954 | ) | $ | — | | $ | 262,734 | | $ | 31,229 | | $ | (31,229 | ) | $ | 123,780 | | $ | (124,348 | ) | $ | — | | $ | 247,137 | | $ | 17,961 | | $ | (17,961 | ) | $ | 122,789 | |
| | | | | | | | | | | | | | | | | | | | | | | | | | |
Cash Flows From Investing Activities: | | | | | | | | | | | | | | | | | | | | | | | | | | | | | | | | | | | | | |
Additions to property, plant and equipment and intangibles | | | — | | | — | | | (254,048 | ) | | — | | | — | | | (254,048 | ) | | — | | | — | | | (180,639 | ) | | — | | | — | | | (180,639 | ) |
Acquisitions | | | — | | | — | | | — | | | — | | | — | | | — | | | — | | | — | | | (16,084 | ) | | — | | | — | | | (16,084 | ) |
Investments in unconsolidated affiliates | | | — | | | — | | | (60,677 | ) | | (60,677 | ) | | 60,677 | | | (60,677 | ) | | — | | | — | | | (105,111 | ) | | (105,111 | ) | | 105,111 | | | (105,111 | ) |
Distributions from unconsolidated affiliates | | | — | | | — | | | 3,279 | | | 3,279 | | | (3,279 | ) | | 3,279 | | | — | | | — | | | 2,368 | | | 2,368 | | | (2,368 | ) | | 2,368 | |
Investments in consolidated subsidiaries | | | (58,437 | ) | | — | | | — | | | — | | | 58,437 | | | — | | | (99,864 | ) | | — | | | — | | | — | | | 99,864 | | | — | |
Distributions from consolidated subsidiaries | | | 53,248 | | | — | | | — | | | — | | | (53,248 | ) | | — | | | 48,775 | | | — | | | — | | | — | | | (48,775 | ) | | — | |
Proceeds from sale of assets | | | — | | | — | | | 23,850 | | | — | | | — | | | 23,850 | | | — | | | — | | | 248 | | | — | | | — | | | 248 | |
Other | | | — | | | — | | | 2,604 | | | — | | | — | | | 2,604 | | | — | | | — | | | 104 | | | — | | | — | | | 104 | |
| | | | | | | | | | | | | | | | | | | | | | | | | | |
Net cash (used in) provided by investing activities | | | (5,189 | ) | | — | | | (284,992 | ) | | (57,398 | ) | | 62,587 | | | (284,992 | ) | | (51,089 | ) | | — | | | (299,114 | ) | | (102,743 | ) | | 153,832 | | | (299,114 | ) |
| | | | | | | | | | | | | | | | | | | | | | | | | | |
Cash Flows From Financing Activities: | | | | | | | | | | | | | | | | | | | | | | | | | | | | | | | | | | | | | |
Proceeds from long-term debt | | | 420,375 | | | — | | | — | | | — | | | — | | | 420,375 | | | 725,000 | | | — | | | — | | | — | | | — | | | 725,000 | |
Repayment of long-term debt | | | (322,000 | ) | | — | | | — | | | — | | | — | | | (322,000 | ) | | (412,665 | ) | | — | | | — | | | — | | | — | | | (412,665 | ) |
Deferred financing costs | | | (3,539 | ) | | — | | | — | | | — | | | — | | | (3,539 | ) | | (15,743 | ) | | — | | | — | | | — | | | — | | | (15,743 | ) |
Payments of premiums and expenses on redemption of unsecured debt | | | — | | | — | | | — | | | — | | | — | | | — | | | (14,572 | ) | | — | | | — | | | — | | | — | | | (14,572 | ) |
Distributions to unitholders | | | (126,090 | ) | | — | | | — | | | — | | | — | | | (126,090 | ) | | (114,834 | ) | | — | | | — | | | — | | | — | | | (114,834 | ) |
Proceeds from public offering of common units | | | 188,083 | | | — | | | — | | | — | | | — | | | 188,083 | | | — | | | — | | | — | | | — | | | — | | | — | |
Equity offering costs | | | (379 | ) | | — | | | — | | | — | | | — | | | (379 | ) | | (4 | ) | | — | | | — | | | — | | | — | | | (4 | ) |
Contributions from parent | | | — | | | — | | | 58,437 | | | — | | | (58,437 | ) | | — | | | — | | | — | | | 99,864 | | | — | | | (99,864 | ) | | — | |
Distributions to parent | | | — | | | — | | | (53,248 | ) | | — | | | 53,248 | | | — | | | — | | | — | | | (48,775 | ) | | — | | | 48,775 | | | — | |
Other | | | 1,284 | | | — | | | — | | | 60,677 | | | (60,677 | ) | | 1,284 | | | 2,747 | | | — | | | — | | | 105,111 | | | (105,111 | ) | | 2,747 | |
| | | | | | | | | | | | | | | | | | | | | | | | | | |
Net cash provided by (used in) financing activities | | | 157,734 | | | — | | | 5,189 | | | 60,677 | | | (65,866 | ) | | 157,734 | | | 169,929 | | | — | | | 51,089 | | | 105,111 | | | (156,200 | ) | | 169,929 | |
| | | | | | | | | | | | | | | | | | | | | | | | | | |
Net increase (decrease) in cash and cash equivalents | | | 13,591 | | | — | | | (17,069 | ) | | 34,508 | | | (34,508 | ) | | (3,478 | ) | | (5,508 | ) | | — | | | (888 | ) | | 20,329 | | | (20,329 | ) | | (6,396 | ) |
Cash and cash equivalents, beginning of year | | | 9,064 | | | — | | | 47,898 | | | 121,322 | | | (121,322 | ) | | 56,962 | | | 9,650 | | | — | | | 50,280 | | | 85,851 | | | (85,851 | ) | | 59,930 | |
| | | | | | | | | | | | | | | | | | | | | | | | | | |
Cash and cash equivalents, end of period | | $ | 22,655 | | $ | — | | $ | 30,829 | | $ | 155,830 | | $ | (155,830 | ) | $ | 53,484 | | $ | 4,142 | | $ | — | | $ | 49,392 | | $ | 106,180 | | $ | (106,180 | ) | $ | 53,534 | |
| | | | | | | | | | | | | | | | | | | | | | | | | | |
18
Table of Contents
Note 6 — Members' Capital and Distributions
The following table summarizes the quarterly distributions in kind (paid in the form of additional Series A convertible preferred units) during 2012.
| | | | | | | | | |
Quarter Ending | | Series A Convertible
Preferred Units Issued
As In-Kind Distributions | | Issue Date | | Amount | |
|---|
December 31, 2011 | | | 292,101 | | February 9, 2012 | | $ | 8,486,000 | |
March 31, 2012 | | | 299,404 | | May 10, 2012 | | $ | 8,698,000 | |
June 30, 2012 | | | 306,889 | | August 9, 2012 | | $ | 8,915,000 | |
September 30, 2012 | | | 314,561 | | November 2012(1) | | $ | 9,138,000 | |
- (1)
- Units will be issued on or about November 8, 2012.
For additional information about our Series A convertible preferred units, please read Note 6, "Members' Capital and Distributions," under Item 8 in our 2011 10-K.
In January 2012, we completed a registered underwritten offering of 5,750,000 common units at $34.03 per unit, for net proceeds of $187,763,000, after deducting underwriting discounts and offering expenses. We used the net proceeds to repay a portion of the outstanding indebtedness under our revolving credit facility.
In October 2012, we completed a registered underwritten offering of 6,526,078 common units at $32.13 per unit, for net proceeds of approximately $201,449,000, after deducting underwriting discounts and offering expenses. We used the net proceeds to repay a portion of the outstanding indebtedness under our revolving credit facility.
The following table sets forth information regarding distributions to our unitholders during 2012.
| | | | | | | | | | | | | |
Quarter Ending | | Distribution
Per Unit | | Date Declared | | Record Date | | Payment Date | | Amount | |
|---|
December 31, 2011 | | $ | 0.575 | | January 11, 2012 | | January 26, 2012 | | February 9, 2012 | | $ | 42,064,000 | |
March 31, 2012 | | $ | 0.575 | | April 11, 2012 | | April 30, 2012 | | May 10, 2012 | | $ | 42,113,000 | |
June 30, 2012 | | $ | 0.575 | | July 11, 2012 | | July 31, 2012 | | August 9, 2012 | | $ | 42,336,000 | |
September 30, 2012 | | $ | 0.575 | | October 10, 2012 | | October 31, 2012 | | November 8, 2012 | | $ | 46,087,000 | |
We use ASC 718,"Stock Compensation," to account for equity-based compensation expense related to awards issued under our long-term incentive plan ("LTIP"). As of September 30, 2012, the number of units available for grant under our LTIP totaled 1,734,560 of which up to 1,222,346 units were eligible to be issued as restricted common units, phantom units or unit awards.
Equity Awards. We recognized non-cash compensation expense of $7,444,000 and $6,795,000 related to the amortization of equity-based compensation under our LTIP during the nine months ended September 30, 2012 and 2011, respectively. Please read Note 6, "Members' Capital and Distributions," under Item 8 in our 2011 10-K for details on our equity-based compensation.
Unit Awards. During the three months ended March 31, 2012, we issued 74,606 unit awards (common units that are not subject to vesting or forfeiture) at a grant date issue price of $35.19 to settle our fourth quarter 2011 Employee Incentive Compensation Program and the 2011 Management Incentive Compensation Plan bonuses.
19
Table of Contents
Note 7 — Net Income (Loss) Per Unit
Net income (loss) per unit is calculated in accordance with ASC 260, "Earnings Per Share," which specifies the use of the two-class method of computing earnings per unit when participating or multiple classes of securities exist. Under this method, undistributed earnings for a period are allocated based on the contractual rights of each security to share in those earnings as if all of the earnings for the period had been distributed.
Basic net income (loss) per unit excludes dilution and is computed by dividing net income (loss) attributable to each respective class of units by the weighted average number of units outstanding for each respective class during the period. Dilutive net income (loss) per unit reflects potential dilution that could occur if convertible securities were converted into common units or contracts to issue common units were exercised except when the assumed conversion or exercise would have an anti-dilutive effect on net income (loss) per unit. Dilutive net income (loss) per unit is computed by dividing net income (loss) attributable to each respective class of units by the weighted average number of units outstanding for each respective class of units during the period increased by the number of additional units that would have been outstanding if the dilutive potential units had been issued.
Because we had a net loss to common units for the three months ended September 30, 2011 and the nine months ended September 30, 2012 and 2011, the weighted average units outstanding are the same for basic and diluted net loss per common unit.
| | | | | | | | | | | | | |
| | Three Months Ended
September 30, | | Nine Months Ended
September 30, | |
|---|
| | 2012 | | 2011 | | 2012 | | 2011 | |
|---|
| | (In thousands)
| |
|---|
Basic weighted average units | | | 72,395 | | | 66,246 | | | 71,887 | | | 66,125 | |
Potentially dilutive common equity: | | | | | | | | | | | | | |
Options | | | 142 | | | — | | | — | | | — | |
Unit appreciation rights | | | 75 | | | — | | | — | | | — | |
Restricted units | | | 15 | | | — | | | — | | | — | |
Phantom units | | | 473 | | | — | | | — | | | — | |
Series A preferred units | | | 12,582 | | | — | | | — | | | — | |
| | | | | | | | | | |
Dilutive weighted average units(1) | | | 85,682 | | | 66,246 | | | 71,887 | | | 66,125 | |
| | | | | | | | | | |
- (1)
- The following potentially dilutive common equity was excluded from the dilutive net income (loss) per unit calculation because to include these equity securities would have been anti-dilutive:
| | | | | | | | | | | | | | |
| |
| | Three Months Ended
September 30, | | Nine Months Ended
September 30, | |
|---|
| |
| | 2012 | | 2011 | | 2012 | | 2011 | |
|---|
| |
| | (In thousands)
| |
|---|
| | Options | | | 516 | | | 800 | | | 657 | | | 800 | |
| | Unit appreciation rights | | | 371 | | | 401 | | | 446 | | | 401 | |
| | Restricted units | | | 28 | | | 43 | | | 43 | | | 43 | |
| | Phantom units | | | 696 | | | 993 | | | 1,169 | | | 993 | |
| | Contingent incentive plan unit awards | | | — | | | 73 | | | — | | | 73 | |
| | Series A preferred units | | | — | | | 11,399 | | | 12,582 | | | 11,399 | |
20
Table of Contents
Note 8 — Related Party Transactions
Summary of Transactions With Affiliated Entities (in thousands).
| | | | | | | | | | | | | | | | | | | | | | |
| | Financial Statement Classification — Three Months Ended September 30, 2012 | |
|---|
| | Natural Gas
Sales | | Transportation,
Compression and
Processing Fees | | Condensate and
Other | | Cost of
Natural Gas and
Natural Gas Liquids | | Transportation | | General and
Administrative(2) | | Reimbursable
Costs(3) | |
|---|
Webb Duval | | $ | — | | $ | — | | $ | — | | $ | (146 | ) | $ | 190 | | $ | 59 | | $ | 433 | |
Eagle Ford Gathering | | | — | | | 5,189 | | | — | | | 48,117 | | | — | | | 136 | | | 1,091 | |
Liberty Pipeline Group | | | — | | | — | | | — | | | — | | | 454 | | | 57 | | | 58 | |
Double Eagle Pipeline | | | — | | | — | | | — | | | — | | | — | | | 175 | | | 6,442 | |
Southern Dome | | | — | | | — | | | — | | | — | | | — | | | 63 | | | 93 | |
Bighorn | | | — | | | — | | | 246 | | | — | | | — | | | 96 | | | 552 | |
Fort Union | | | — | | | — | | | 789 | | | — | | | 1,932 | | | 65 | | | 47 | |
| | | | | | | | | | | | | | | | |
Total related party transactions | | $ | — | | $ | 5,189 | | $ | 1,035 | | $ | 47,971 | | $ | 2,576 | | $ | 651 | | $ | 8,716 | |
| | | | | | | | | | | | | | | | |
|
|
Financial Statement Classification — Three Months Ended September 30, 2011 |
|
|---|
| | Natural Gas
Sales | | Transportation,
Compression and
Processing Fees | | Condensate and
Other | | Cost of
Natural Gas and
Natural Gas Liquids | | Transportation | | General and
Administrative(2) | | Reimbursable
Costs(3) | |
|---|
Affiliates of Mr. Lawing(1) | | $ | — | | $ | — | | $ | — | | $ | — | | $ | — | | $ | — | | $ | 57 | |
Webb Duval | | | — | | | — | | | — | | | 459 | | | 178 | | | 57 | | | 184 | |
Eagle Ford Gathering | | | 1,091 | | | 739 | | | — | | | 7,298 | | | — | | | 248 | | | 999 | |
Liberty Pipeline Group | | | — | | | — | | | — | | | — | | | 145 | | | 38 | | | 1,726 | |
Southern Dome | | | — | | | — | | | — | | | — | | | — | | | 63 | | | 98 | |
Bighorn | | | — | | | — | | | 299 | | | — | | | — | | | 96 | | | 579 | |
Fort Union | | | — | | | — | | | — | | | — | | | 1,635 | | | 62 | | | 57 | |
| | | | | | | | | | | | | | | | |
Total related party transactions | | $ | 1,091 | | $ | 739 | | $ | 299 | | $ | 7,757 | | $ | 1,958 | | $ | 564 | | $ | 3,700 | |
| | | | | | | | | | | | | | | | |
21
Table of Contents
Note 8 — Related Party Transactions (Continued)
| | | | | | | | | | | | | | | | | | | | | | | | | | | | |
| | Financial Statement Classification — Nine Months Ended September 30, 2012 | |
|---|
| | Natural Gas
Sales | | Transportation,
Compression and
Processing Fees | | Condensate and
Other | | Cost of
Natural Gas and
Natural Gas Liquids | | Transportation | | General and
Administrative(2) | | Reimbursable
Costs(3) | | Accounts
Payable | | Accounts
Receivable | |
|---|
Webb Duval | | $ | — | | $ | — | | $ | — | | $ | (187 | ) | $ | 742 | | $ | 173 | | $ | 767 | | $ | 283 | | $ | 70 | |
Eagle Ford Gathering | | | — | | | 10,847 | | | — | | | 105,916 | | | — | | | 475 | | | 1,407 | | | 18,356 | | | 137 | |
Liberty Pipeline Group | | | — | | | — | | | — | | | — | | | 1,115 | | | 171 | | | 239 | | | 131 | | | 36 | |
Double Eagle Pipeline | | | — | | | — | | | — | | | — | | | — | | | 525 | | | 12,296 | | | — | | | 185 | |
Southern Dome | | | — | | | — | | | — | | | — | | | — | | | 188 | | | 308 | | | — | | | 872 | |
Bighorn | | | — | | | — | | | 848 | | | — | | | — | | | 289 | | | 1,754 | | | — | | | 6 | |
Fort Union | | | — | | | — | | | 789 | | | — | | | 5,222 | | | 195 | | | 825 | | | — | | | — | |
Other | | | — | | | — | | | — | | | — | | | — | | | — | | | — | | | — | | | 6 | |
| | | | | | | | | | | | | | | | | | | | |
Total related party transactions | | $ | — | | $ | 10,847 | | $ | 1,637 | | $ | 105,729 | | $ | 7,079 | | $ | 2,016 | | $ | 17,596 | | $ | 18,770 | | $ | 1,312 | |
| | | | | | | | | | | | | | | | | | | | |
|
|
Financial Statement Classification — Nine Months Ended September 30, 2011 |
|
|---|
| | Natural Gas
Sales | | Transportation,
Compression and
Processing Fees | | Condensate and
Other | | Cost of
Natural Gas and
Natural Gas Liquids | | Transportation | | General and
Administrative(2) | | Reimbursable
Costs(3) | | Accounts
Payable | | Accounts
Receivable | |
|---|
Affiliates of Mr. Lawing(1) | | $ | (1 | ) | $ | 3 | | $ | — | | $ | 82 | | $ | — | | $ | — | | $ | 171 | | $ | — | | $ | — | |
Webb Duval | | | 39 | | | — | | | — | | | 90 | | | 348 | | | 169 | | | 521 | | | 454 | | | 81 | |
Eagle Ford Gathering | | | 1,091 | | | 739 | | | — | | | 7,298 | | | — | | | 878 | | | 14,594 | | | 3,677 | | | 375 | |
Liberty Pipeline Group | | | — | | | — | | | — | | | — | | | 145 | | | 38 | | | 17,231 | | | 45 | | | 94 | |
Southern Dome | | | — | | | — | | | — | | | — | | | — | | | 188 | | | 299 | | | — | | | 42 | |
Bighorn | | | — | | | — | | | 1,114 | | | — | | | — | | | 289 | | | 1,741 | | | — | | | 21 | |
Fort Union | | | — | | | — | | | — | | | 6 | | | 4,276 | | | 185 | | | 833 | | | — | | | 6 | |
Other | | | — | | | — | | | — | | | — | | | — | | | — | | | — | | | — | | | 2 | |
| | | | | | | | | | | | | | | | | | | | |
Total related party transactions | | $ | 1,129 | | $ | 742 | | $ | 1,114 | | $ | 7,476 | | $ | 4,769 | | $ | 1,747 | | $ | 35,390 | | $ | 4,176 | | $ | 621 | |
| | | | | | | | | | | | | | | | | | | | |
- (1)
- These entities were controlled by John R. Eckel, Jr., our former Chairman and Chief Executive Officer, until his death in November 2009, and since that time have been controlled by Douglas L. Lawing, our Executive Vice President, General Counsel and Secretary, in his role as executor of Mr. Eckel's estate. The contracts with the affiliates of Mr. Lawing underlying these transactions were assigned to non-affiliates or terminated in 2011.
- (2)
- Management fees and capital project fees received from our unconsolidated affiliates consists of the total compensation paid to us by our unconsolidated affiliates and is included as a reduction in general and administrative expenses on our consolidated statements of operations.
- (3)
- Reimbursable costs consist of expenses incurred by our affiliates for which Copano makes payment but is reimbursed by the affiliate. These amounts are settled through related party accounts receivable and payable and are not included on statements of operations.
22
Table of Contents
Note 8 — Related Party Transactions (Continued)
During the third quarter of 2012, we installed stabilization facilities and related liquids pipelines at our Houston Central complex for which Eagle Ford Gathering paid us $4,785,000 for stabilization services over the term of its processing arrangement with us. We have recorded this payment as deferred revenue and will amortize it to earnings as services are provided to Eagle Ford Gathering.
Certain of our operating subsidiaries incurred costs payable to affiliates of Valerus Compression Services, L.P. for compression equipment and related services totaling $251,000 and $15,000 for the three months ended September 30, 2012 and 2011, respectively and $1,438,000 and $70,000 for the nine months ended September 30, 2012 and 2011, respectively. TPG Copenhagen, L.P., an affiliate of TPG Capital, L.P., (together with its affiliates, "TPG") owns a controlling interest in Valerus Compression Services, L.P., and Michael G. MacDougall, a partner with TPG, is a member of our Board of Directors.
Our management believes that the terms and provisions of our related party agreements and transactions are no less favorable to us than those we could have obtained from unaffiliated third parties.
Note 9 — Commitments and Contingencies
For the three months ended September 30, 2012 and 2011, rental expense for leased office space, vehicles, compressors and related field equipment used in our operations totaled $1,587,000 and $1,122,000, respectively. For the nine months ended September 30, 2012 and 2011, rental expense for leased office space, vehicles, compressors and related field equipment used in our operations totaled $5,083,000 and $3,179,000, respectively.
We are party to firm transportation or fractionation and product sales agreements with Wyoming Interstate Gas Company, Fort Union, Formosa Hydrocarbons Company, Inc. and Targa Liquids Marketing and Trade LLC under which we are obligated to pay for natural gas or NGL services whether or not we use such services. Our commitments under these agreements expire between 2015 and 2023. Under these agreements, we are obligated to pay an aggregate amount of approximately $4,392,000 for the remainder of 2012, $26,813,000 in 2013, $25,990,000 in 2014, $24,573,000 in 2015, $22,224,000 in 2016 and $85,409,000 over the remainder of the contract terms.
We have fixed-quantity contractual commitments to Targa North Texas LP ("Targa") in settlement of a volume dedication dispute. As of September 30, 2012, we had fixed contractual commitments to provide Targa a total of 2.373 billion cubic feet of natural gas for each of 2012 and 2013. Under the terms of the agreement, we are obligated to pay annual fees ($1.15 per thousand cubic feet ("Mcf") and $1.25 per Mcf for 2012 and 2013, respectively) to the extent our natural gas deliveries to Targa fall below the committed quantity. In February 2012, we paid $1,567,000 to Targa in settlement of our 2011 obligation. As of September 30, 2012, we have accrued $826,000 of our 2012 obligation.
In the ordinary course of business, we are subject to various laws and regulations. As of the date of this filing, in the opinion of our management, compliance with existing laws and regulations is not expected to materially affect our financial position, results of operations or cash flows.
Please read Note 11, "Commitments and Contingencies," under Item 8 in our 2011 10-K.
We may, from time to time, be involved in other litigation and claims arising out of our operations in the normal course of business.
23
Table of Contents
Note 10 — Supplemental Disclosures to the Statements of Cash Flows
| | | | | | | |
| | Nine Months Ended
September 30, | |
|---|
| | 2012 | | 2011 | |
|---|
| | (In thousands)
| |
|---|
Cash payments for interest, net of $7,159,000 and $7,402,000 capitalized in 2012 and 2011, respectively | | $ | 28,289 | | $ | 23,583 | |
Cash payments for federal and state income taxes | | $ | 1,200 | | $ | 925 | |
In-kind distributions of Series A convertible preferred units | | $ | 26,751 | | $ | 24,235 | |
We incurred a change in liabilities of $14,177,000 and $18,658,000 for investing activities that had not been paid as of September 30, 2012 and 2011, respectively. Such amounts are not included in the change in accounts payable and accrued liabilities or with acquisitions, additions to property, plant and equipment and intangible assets on the consolidated statements of cash flows. As of September 30, 2012 and 2011, we accrued $40,370,000 and $26,657,000, respectively, for capital expenditures that had not been paid; therefore, these amounts are not included in investing activities for each respective period presented.
Note 11 — Financial Instruments
We are exposed to market risks, including changes in commodity prices and interest rates. We may use financial instruments such as puts, calls, swaps and other financial instruments to mitigate the effects of the identified risks. In general, we attempt to hedge risks to our future cash flow and profitability resulting from changes in applicable commodity prices or interest rates so that we can maintain cash flows sufficient to meet debt service, required capital expenditures, distribution objectives and similar requirements.
NGL and natural gas prices can be volatile and are impacted by changes in fundamental supply and demand, as well as market uncertainty and a variety of additional factors that are beyond our control. Our profitability is affected by prevailing commodity prices indirectly or directly as a function of the contract terms under which we are compensated for our services or pay third parties for their services. To the extent that compensation for our services is fee-based, commodity prices affect us indirectly because they influence exploration and production activity and therefore the volumes of natural gas, condensate and NGLs that flow through our assets. Our profitability is directly affected by commodity prices to the extent that we: (i) process natural gas at our plants or third-party plants under index-related pricing arrangements, (ii) purchase and sell or gather and transport volumes of natural gas at index-related prices and (iii) purchase and sell or transport and fractionate NGLs at index-related prices. We use commodity derivative instruments to manage the risks associated with direct exposure to changing commodity prices. Our risk management activities are governed by our risk management policy, which, subject to certain limitations, allows our management to purchase options and enter into swaps for crude oil, NGLs and natural gas in order to reduce our exposure to substantial adverse changes in the prices of those commodities. Our risk management policy prohibits the use of derivative instruments for speculative purposes.
Our Risk Management Committee, which consists of senior executives in the operations, finance and legal departments, monitors and ensures compliance with the risk management policy. The Audit Committee of our Board of Directors monitors the implementation of our risk management policy, and we have engaged an independent firm to monitor our compliance with the policy on a monthly basis. Our risk management policy provides that derivative transactions must be executed by our Chief Financial Officer or his designee and must be authorized in advance of execution by our Chief Executive Officer. Our risk management policy requires derivative transactions to take place either on the New York Mercantile Exchange (NYMEX) through a clearing member firm or with over-the-counter counterparties, with
24
Table of Contents
Note 11 — Financial Instruments (Continued)
investment grade ratings from both Moody's Investors Service and Standard & Poor's Ratings Services and with complete industry standard contractual documentation. Except for two option counterparties, all of our hedge counterparties are also lenders under our revolving credit facility, and any payment obligations in connection with our hedge transactions with a lender-counterparty are secured by a first priority lien on the collateral securing our revolving credit facility indebtedness that ranks equal in right of payment with liens granted in favor of our secured lenders. As long as this first priority lien is in effect, we will have no obligation to post cash, letters of credit or other additional collateral to secure these hedges at any time, even if our counterparty's exposure to our credit increases over the term of the hedge as a result of higher commodity prices or because there has been a change in our creditworthiness.
Financial instruments that we acquire pursuant to our risk management policy are recorded on our consolidated balance sheets at fair value. For derivatives designated as cash flow hedges under ASC 815, "Derivatives and Hedging," we recognize the effective portion of changes in fair value as other comprehensive income ("OCI") and reclassify them to revenue within the consolidated statements of operations as settlements of the underlying transactions impact earnings. For derivatives not designated as cash flow hedges, we recognize changes in fair value as a gain or loss in our consolidated statements of operations. These financial instruments serve the same risk management purpose whether designated as a cash flow hedge or not.
We assess, both at the inception of each hedge and on an ongoing basis, whether our derivative instruments are effective in hedging the variability of forecasted cash flows associated with the underlying hedged items. If the correlation between a derivative instrument and the underlying hedged item is lost or it becomes no longer probable that the original forecasted transaction will occur, we discontinue hedge accounting based on a determination that the instrument is ineffective as a hedge. Subsequent changes in the derivative instrument's fair value are immediately recognized as a gain or loss (increase or decrease in revenue) in our consolidated statements of operations.
As of September 30, 2012, we estimated that $873,000 of OCI will be reclassified as an increase to earnings in the next 12 months as a result of monthly settlements of instruments hedging NGLs and crude oil.
At September 30, 2012, the notional volumes of our commodity positions include:
| | | | | | | | | | | | | | |
Commodity | | Instrument | | Unit | | 2012 | | 2013 | | 2014 | |
|---|
Natural gas | | Calls | | MMBtu/d | | | — | | | 2,787 | | | — | |
NGLs | | Swaps | | Bbl/d | | | — | | | 1,000 | | | — | |
NGLs | | Puts | | Bbl/d | | | 4,625 | | | 2,650 | | | — | |
Crude oil | | Puts | | Bbl/d | | | 1,500 | | | 1,400 | | | 500 | |
At December 31, 2011, the notional volumes of our commodity positions were:
| | | | | | | | | | | |
Commodity | | Instrument | | Unit | | 2012 | | 2013 | |
|---|
NGLs | | Puts | | Bbl/d | | | 5,400 | | | 1,650 | |
Crude oil | | Puts | | Bbl/d | | | 1,500 | | | 750 | |
Our interest rate exposure results from variable rate borrowings under our revolving credit facility. We manage a portion of our interest rate exposure using interest rate swaps, which allow us to convert a portion of our variable rate debt into fixed rate debt. As of September 30, 2012, we hold a notional amount of $95.0 million in interest rate swaps, which have a weighted average fixed rate of 4.30% and expire in October 2012. As of September 30, 2012, our interest rate swaps were not designated as cash flow hedges.
25
Table of Contents
Note 11 — Financial Instruments (Continued)
As of September 30, 2012, we estimate that $28,000 of OCI related to previously designated interest rate swaps will be reclassified as a decrease to earnings as the underlying swaps expire during the remainder of 2012.
We recognize the fair value of our assets and liabilities that require periodic re-measurement as necessary based upon the requirements of ASC 820. This standard defines fair value, sets forth disclosure requirements with respect to fair value and specifies a hierarchy of valuation techniques based on whether the inputs to those valuation techniques are observable or unobservable. "Inputs" are the assumptions that a market participant would use in valuing the asset or liability. Observable inputs reflect market data, while unobservable inputs reflect our market assumptions. The three levels of the fair value hierarchy established by ASC 820 are as follows:
- •
- Level 1 — Unadjusted quoted prices in active markets that are accessible at the measurement date for identical, unrestricted assets or liabilities;
- •
- Level 2 — Quoted prices in markets that are not considered to be active or financial instruments for which all significant inputs are observable, either directly or indirectly; and
- •
- Level 3 — Prices or valuations that require inputs that are both significant to the fair value measurement and unobservable. These inputs may be used with internally developed methodologies that result in management's best estimate of fair value.
We use the income approach incorporating market-based inputs in determining fair value for our derivative contracts.
Our Level 2 instruments include interest rate swaps. Valuation of our Level 2 derivative contracts are based on observable market prices, which include 3-month LIBOR interest rate curves, incorporating discount rates.
Our Level 3 instruments include natural gas, NGL and WTI option contracts. Valuation of our Level 3 derivative contracts incorporates the use of option valuation models using significant unobservable inputs in addition to forward prices obtained from third-party pricing and data service providers. To the extent certain model inputs are observable, such as prices of WTI Crude, Mont Belvieu NGLs and Houston Ship Channel natural gas, we include observable market price and volatility data as inputs to our valuation model in addition to incorporating discount rates. Our unobservable inputs include implied volatilities for Mont Belvieu prices and WTI volatilities for illiquid periods of the forward price curves. Significant increases (decreases) in price curves would result in a significantly lower (higher) fair value measurement. On the other hand, significant increases (decreases) in volatility would result in a significantly higher (lower) fair value measurement. Our modeling methodology incorporates available market information to generate these inputs through techniques such as regression based interpolation and extrapolation.
We have an internal risk management group, which is responsible for our derivatives valuation, and reports to our Chief Financial Officer and Risk Management Committee. At each balance sheet date, they substantiate the reasonableness of our market-based inputs by (1) comparing the forward prices obtained from a third-party pricing service against other available market data (e.g. counterparty quotes) to confirm that the forward prices received are reasonable in relation to the market price, and (2) analyzing historical data to confirm reasonableness of volatilities. In addition, as of each balance sheet date, our risk management group performs an analysis of all instruments subject to ASC 820 and includes in Level 3 all of those for which fair value is based on significant unobservable inputs. This analysis consists of validating the observability of market-based inputs by analyzing available information, including transaction volumes on open market positions. The risk management group presents its analyses of all instruments to the Risk
26
Table of Contents
Note 11 — Financial Instruments (Continued)
Management Committee quarterly for approval of fair value hierarchy classification, as well as for discussion of changes in fair value from period to period. We chart movement in our market inputs to ensure that the shifts substantiate any changes in fair value.
The following tables set forth by level within the fair value hierarchy our financial assets and liabilities that were accounted for at fair value on a recurring basis as of September 30, 2012 and December 31, 2011. As required by ASC 820, assets and liabilities are classified in their entirety based on the lowest level of input that is significant to the fair value measurement. Management's assessment of the significance of a particular input to the fair value measurement requires judgment and may affect the valuation of fair value of assets and liabilities and their placement within the fair value hierarchy levels.
| | | | | | | | | | | | | |
| | Fair Value Measurements on Hedging Instruments(a)
September 30, 2012 | |
|---|
| | Level 1 | | Level 2 | | Level 3 | | Total | |
|---|
| | (In thousands)
| |
|---|
Assets: | | | | | | | | | | | | | |
Natural Gas: | | | | | | | | | | | | | |
Short-term — Designated(b) | | $ | — | | $ | — | | $ | 408 | | $ | 408 | |
Long-term — Designated(c) | | | — | | | — | | | 197 | | | 197 | |
Natural Gas Liquids: | | | | | | | | | | | | | |
Short-term — Designated(b) | | | — | | | — | | | 11,375 | | | 11,375 | |
Short-term — Not designated(b) | | | — | | | — | | | 1,162 | | | 1,162 | |
Long-term — Designated(c) | | | — | | | — | | | 2,862 | | | 2,862 | |
Crude Oil: | | | | | | | | | | | | | |
Short-term — Designated(b) | | | — | | | — | | | 2,819 | | | 2,819 | |
Short-term — Not designated(b) | | | — | | | — | | | 656 | | | 656 | |
Long-term — Designated(c) | | | — | | | — | | | 3,609 | | | 3,609 | |
Long-term — Not designated(c) | | | — | | | — | | | 273 | | | 273 | |
| | | | | | | | | | |
Total | | $ | — | | $ | — | | $ | 23,361 | | $ | 23,361 | |
| | | | | | | | | | |
Liabilities: | | | | | | | | | | | | | |
Natural Gas Liquids: | | | | | | | | | | | | | |
Short-term — Not designated(d) | | $ | — | | $ | — | | $ | 588 | | $ | 588 | |
Long-term — Designated(e) | | | — | | | — | | | 58 | | | 58 | |
Interest Rate: | | | | | | | | | | | | | |
Short-term — Not designated(d) | | | — | | | 924 | | | — | | | 924 | |
| | | | | | | | | | |
Total | | $ | — | | $ | 924 | | $ | 646 | | $ | 1,570 | |
| | | | | | | | | | |
Total designated assets | | $ | — | | $ | — | | $ | 21,212 | | $ | 21,212 | |
| | | | | | | | | | |
Total not designated (liabilities)/assets | | $ | — | | $ | (924 | ) | $ | 1,503 | | $ | 579 | |
| | | | | | | | | | |
- (a)
- Instruments measured on a recurring basis.
- (b)
- Included on the consolidated balance sheets as a current asset under the heading of "Risk management assets."
- (c)
- Included on the consolidated balance sheets as a noncurrent asset under the heading of "Risk management assets."
- (d)
- Included on the consolidated balance sheets as a current liability under the heading of "Risk management liabilities."
- (e)
- Included on the consolidated balance sheets as a noncurrent liability under the heading of "Other noncurrent liabilities."
27
Table of Contents
Note 11 — Financial Instruments (Continued)
| | | | | | | | | | | | | |
| | Fair Value Measurements on Hedging Instruments(a)
December 31, 2011 | |
|---|
| | Level 1 | | Level 2 | | Level 3 | | Total | |
|---|
| | (In thousands)
| |
|---|
Assets: | | | | | | | | | | | | | |
Natural Gas Liquids: | | | | | | | | | | | | | |
Short-term — Designated(b) | | $ | — | | $ | — | | $ | 1,641 | | $ | 1,641 | |
Short-term — Not designated(b) | | | — | | | — | | | 952 | | | 952 | |
Long-term — Designated(c) | | | — | | | — | | | 2,878 | | | 2,878 | |
Crude Oil: | | | | | | | | | | | | | |
Short-term — Designated(b) | | | — | | | — | | | 1,341 | | | 1,341 | |
Short-term — Not designated(b) | | | — | | | — | | | 388 | | | 388 | |
Long-term — Designated(c) | | | — | | | — | | | 3,574 | | | 3,574 | |
| | | | | | | | | | |
Total | | $ | — | | $ | — | | $ | 10,774 | | $ | 10,774 | |
| | | | | | | | | | |
Liabilities: | | | | | | | | | | | | | |
Interest Rate: | | | | | | | | | | | | | |
Short-term — Not designated(d) | | $ | — | | $ | 3,565 | | $ | — | | $ | 3,565 | |
| | | | | | | | | | |
Total | | $ | — | | $ | 3,565 | | $ | — | | $ | 3,565 | |
| | | | | | | | | | |
Total designated assets | | $ | — | | $ | — | | $ | 9,434 | | $ | 9,434 | |
| | | | | | | | | | |
Total not designated (liabilities)/assets | | $ | — | | $ | (3,565 | ) | $ | 1,340 | | $ | (2,225 | ) |
| | | | | | | | | | |
- (a)
- Instruments measured on a recurring basis.
- (b)
- Included on the consolidated balance sheets as a current asset under the heading of "Risk management assets."
- (c)
- Included on the consolidated balance sheets as a noncurrent asset under the heading of "Risk management assets."
- (d)
- Included on the consolidated balance sheets as a current liability under the heading of "Risk management liabilities."
As discussed in Notes 3 and 4, we recorded impairments with respect to our equity investments in Bighorn and Fort Union and a contract under which we provide services to Rocky Mountains producers during the three months ended March 31, 2012. The valuation of these investments required use of significant unobservable inputs. Our probability-weighted discounted cash flow analysis included the following input parameters that are not readily available: a discount rate reflective of our cost of capital and estimated contract rates, volumes, operating and maintenance costs, capital expenditures and a terminal value. The following table presents, by level within the fair value hierarchy, certain assets that have been measured at fair value on a non-recurring basis.
| | | | | | | |
| | Fair Value Measurements of Impairments(a)
March 31, 2012 | |
|---|
| | Level 3 | | Impairment
Expense | |
|---|
| | (In thousands)
| |
|---|
Long-lived assets(b) | | $ | 261,600 | | $ | 120,000 | |
Long-lived intangible assets(c) | | $ | — | | $ | 28,744 | |
- (a)
- Measured on a non-recurring basis.
- (b)
- Impairments of equity investments in Bighorn and Fort Union are included on the consolidated balance sheets as a noncurrent asset under "Investments in unconsolidated affiliates" and on the consolidated statements of operations under "Equity in loss (earnings) from unconsolidated affiliates."
- (c)
- Impairment of a contract is included on the consolidated balance sheets as a noncurrent asset under "Intangible assets, net" and on the consolidated statements of operations under "Impairment."
28
Table of Contents
Note 11 — Financial Instruments (Continued)
The following table provides a description of the unobservable inputs utilized in the valuation of our derivatives classified as Level 3 in the fair value hierarchy:
Quantitative Information about Level 3 Fair Value Measurements
| | | | | | | | | |
| | Fair Value as of
September 30,
2012 | | Valuation
Technique | | Unobservable Inputs | | Range |
|---|
| | (In thousands)
| |
| |
| |
|
|---|
Natural gas options | | $ | 605 | | European Option | | Volatility | | 27.73%-35.34% |
Natural gas liquids options: | | | | | | | | | |
Ethane | | $ | 1,956 | | Asian Option | | Volatility | | 47.21%-53.21% |
| | | | | | | Forward Price Curve | | $0.379-$0.384(1) |
Propane | | | 10,082 | | Asian Option | | Volatility | | 21.71%-27.71% |
| | | | | | | Forward Price Curve | | $0.98-$0.99(1) |
Iso-butane | | | 953 | | Asian Option | | Volatility | | 24.26%-30.26% |
| | | | | | | Forward Price Curve | | $1.62-$1.63(1) |
Normal butane | | | 1,817 | | Asian Option | | Volatility | | 23%-29% |
| | | | | | | Forward Price Curve | | $1.50-$1.52(1) |
| | | | | | | | | |
Total natural gas liquid options | | $ | 14,808 | | | | | | |
| | | | | | | | | |
Natural gas liquid ethane swaps | | $ | (55 | ) | Fixed Price Swap | | Forward Price Curve | | $0.379-$0.384(1) |
Crude oil options | | $ | 7,357 | | Asian Option | | Volatility | | 24.16%-31.48% |
- (1)
- Price shown is dollar per gallon.
The following tables provide a reconciliation of changes in the fair value of derivatives classified as Level 3 in the fair value hierarchy:
| | | | | | | | | | | | | |
| | Three Months Ended September 30, 2012 | |
|---|
| | Natural Gas | | Natural Gas
Liquids | | Crude Oil | | Total | |
|---|
| | (In thousands)
| |
|---|
Assets balance, beginning of period | | $ | — | | $ | 25,790 | | $ | 6,650 | | $ | 32,440 | |
Total gains or losses: | | | | | | | | | | | | | |
Non-cash amortization of option premium(a) | | | — | | | (4,313 | ) | | (1,611 | ) | | (5,924 | ) |
Other amounts included in earnings | | | — | | | 2,523 | | | (315 | ) | | 2,208 | |
Included in accumulated other comprehensive loss | | | 200 | | | (5,260 | ) | | (66 | ) | | (5,126 | ) |
Purchases | | | 405 | | | 830 | | | 2,712 | | | 3,947 | |
Issuances | | | — | | | (4,411 | ) | | — | | | (4,411 | ) |
Settlements | | | — | | | (406 | ) | | (13 | ) | | (419 | ) |
| | | | | | | | | | |
Asset balance, end of period | | $ | 605 | | $ | 14,753 | | $ | 7,357 | | $ | 22,715 | |
| | | | | | | | | | |
Change in unrealized loss included in earnings related to instruments still held as of the end of the period | | $ | — | | $ | 640 | | $ | 441 | | $ | 1,081 | |
| | | | | | | | | | |
- (a)
- Includes the impact of fair value changes of the extrinsic value of options and is included as a reduction of revenue in the statement of operations.
29
Table of Contents
Note 11 — Financial Instruments (Continued)
| | | | | | | | | | | | | |
| | Nine Months Ended September 30, 2012 | |
|---|
| | Natural Gas | | Natural Gas
Liquids | | Crude Oil | | Total | |
|---|
| | (In thousands)
| |
|---|
Assets balance, beginning of period | | $ | — | | $ | 5,471 | | $ | 5,303 | | $ | 10,774 | |
Total gains or losses: | | | | | | | | | | | | | |
Non-cash amortization of option premium(a) | | | — | | | (11,203 | ) | | (4,799 | ) | | (16,002 | ) |
Other amounts included in earnings | | | — | | | 10,386 | | | 222 | | | 10,608 | |
Included in accumulated other comprehensive loss | | | 200 | | | 15,583 | | | 2,483 | | | 18,266 | |
Purchases | | | 405 | | | 3,247 | | | 4,245 | | | 7,897 | |
Issuances | | | — | | | (4,411 | ) | | — | | | (4,411 | ) |
Settlements | | | — | | | (4,320 | ) | | (97 | ) | | (4,417 | ) |
| | | | | | | | | | |
Asset balance, end of period | | $ | 605 | | $ | 14,753 | | $ | 7,357 | | $ | 22,715 | |
| | | | | | | | | | |
Change in unrealized (income) loss included in earnings related to instruments still held as of the end of the period | | $ | — | | $ | (514 | ) | $ | 203 | | $ | (311 | ) |
| | | | | | | | | | |
- (a)
- Includes the impact of fair value changes of the extrinsic value of options and is included as a reduction of revenue in the statement of operations.
| | | | | | | | | | | | | |
| | Three Months Ended September 30, 2011 | |
|---|
| | Natural Gas | | Natural Gas
Liquids | | Crude Oil | | Total | |
|---|
| | (In thousands)
| |
|---|
Assets balance, beginning of period | | $ | 4 | | $ | 7,043 | | $ | 5,280 | | $ | 12,327 | |
Total gains or losses: | | | | | | | | | | | | | |
Non-cash amortization of option premium(a) | | | (1,486 | ) | | (3,953 | ) | | (2,004 | ) | | (7,443 | ) |
Other amounts included in earnings | | | — | | | (2,112 | ) | | 1,583 | | | (529 | ) |
Included in accumulated other comprehensive loss | | | 1,482 | | | 7,768 | | | 8,452 | | | 17,702 | |
Purchases | | | — | | | 1,561 | | | — | | | 1,561 | |
Settlements | | | — | | | 2,881 | | | — | | | 2,881 | |
| | | | | | | | | | |
Asset balance, end of year | | $ | — | | $ | 13,188 | | $ | 13,311 | | $ | 26,499 | |
| | | | | | | | | | |
Change in unrealized loss (income) included in earnings related to instruments still held as of the end of the period | | $ | — | | $ | (181 | ) | $ | (267 | ) | $ | (448 | ) |
| | | | | | | | | | |
- (a)
- Includes the impact of fair value changes of the extrinsic value of options and is included as a reduction of revenue in the statement of operations.
30
Table of Contents
Note 11 — Financial Instruments (Continued)
| | | | | | | | | | | | | |
| | Nine Months Ended September 30, 2011 | |
|---|
| | Natural Gas | | Natural Gas
Liquids | | Crude Oil | | Total | |
|---|
| | (In thousands)
| |
|---|
Assets balance, beginning of period | | $ | 87 | | $ | 8,350 | | $ | 6,475 | | $ | 14,912 | |
Total gains or losses: | | | | | | | | | | | | | |
Non-cash amortization of option premium(a) | | | (4,409 | ) | | (11,714 | ) | | (5,946 | ) | | (22,069 | ) |
Other amounts included in earnings | | | — | | | (7,211 | ) | | 2,373 | | | (4,838 | ) |
Included in accumulated other comprehensive loss | | | 4,322 | | | 7,245 | | | 8,609 | | | 20,176 | |
Purchases | | | — | | | 8,925 | | | 1,800 | | | 10,725 | |
Settlements | | | — | | | 7,593 | | | — | | | 7,593 | |
| | | | | | | | | | |
Asset balance, end of period | | $ | — | | $ | 13,188 | | $ | 13,311 | | $ | 26,499 | |
| | | | | | | | | | |
Change in unrealized (income) loss included in earnings related to instruments still held as of the end of the period | | $ | — | | $ | (495 | ) | $ | (208 | ) | $ | (703 | ) |
| | | | | | | | | | |
- (a)
- Includes the impact of fair value changes of the extrinsic value of options and is included as a reduction of revenue in the statement of operations.
Realized gains and losses for all Level 3 recurring items recorded in earnings are included in revenue on the consolidated statements of operations. Unrealized gains and losses for Level 3 recurring items that are not designated as cash flow hedges, or are ineffective as cash flow hedges, are also included in revenue on the consolidated statements of operations. The effective portion of unrealized gains and losses relating to cash flow hedges are included in accumulated other comprehensive loss on the consolidated balance sheets and consolidated statements of members' capital and statements of comprehensive income (loss).
Transfers in and/or out of Level 2 or Level 3 represent existing assets or liabilities where inputs to the valuation became less observable or assets and liabilities that were previously classified as a lower level for which the lowest significant input became observable during the period. There were no transfers in or out of Level 2 or Level 3 during the periods presented.
We have not entered into any derivative transactions containing credit risk related contingent features as of September 30, 2012.
31
Table of Contents
Note 11 — Financial Instruments (Continued)
The following table presents derivatives that are designated as cash flow hedges:
The Effect of Derivative Instruments on the Statements of Operations
| | | | | | | | | | | |
Derivatives Designated as
Cash Flow Hedges Under
ASC 815 | | Amount of Gain (Loss)
Recognized in OCI on
Derivatives
(Effective Portion) | | Amount of Gain (Loss)
Reclassified from
Accumulated OCI into
Income
(Effective Portion) | | Amount of Gain (Loss)
Recognized in Income on
Derivative
(Ineffective Portion and
Amount Excluded from
Effectiveness Testing) | | Statements of Operations Location |
|---|
| | (In thousands)
| |
|
|---|
Three Months Ended September 30, 2012 | | | | | | | | | | | |
Natural gas | | $ | 200 | | $ | — | | $ | — | | Natural gas sales |
Natural gas liquids | | | (4,694 | ) | | 567 | | | 5 | | Natural gas liquids sales |
Crude oil | | | (1,170 | ) | | (1,106 | ) | | (69 | ) | Condensate and other |
Interest rate swaps | | | — | | | (31 | ) | | — | | Interest and other financing costs |
| | | | | | | | | |
Total | | $ | (5,664 | ) | $ | (570 | ) | $ | (64 | ) | |
| | | | | | | | | |
Nine Months Ended September 30, 2012 | | | | | | | | | | | |
Natural gas | | $ | 200 | | $ | — | | $ | — | | Natural gas sales |
Natural gas liquids | | | 12,480 | | | (3,103 | ) | | 282 | | Natural gas liquids sales |
Crude oil | | | (1,174 | ) | | (3,658 | ) | | (140 | ) | Condensate and other |
Interest rate swaps | | | — | | | (121 | ) | | — | | Interest and other financing costs |
| | | | | | | | | |
Total | | $ | 11,506 | | $ | (6,882 | ) | $ | 142 | | |
| | | | | | | | | |
Three Months Ended September 30, 2011 | | | | | | | | | | | |
Natural gas | | $ | (5 | ) | $ | (1,486 | ) | $ | — | | Natural gas sales |
Natural gas liquids | | | 1,102 | | | (6,667 | ) | | 213 | | Natural gas liquids sales |
Crude oil | | | 6,901 | | | (1,550 | ) | | 518 | | Condensate and other |
Interest rate swaps | | | — | | | (74 | ) | | — | | Interest and other financing costs |
| | | | | | | | | |
Total | | $ | 7,998 | | $ | (9,777 | ) | $ | 731 | | |
| | | | | | | | | |
Nine Months Ended September 30, 2011 | | | | | | | | | | | |
Natural gas | | $ | (88 | ) | $ | (4,410 | ) | $ | — | | Natural gas sales |
Natural gas liquids | | | (11,496 | ) | | (18,755 | ) | | (104 | ) | Natural gas liquids sales |
Crude oil | | | 3,926 | | | (4,682 | ) | | 558 | | Condensate and other |
Interest rate swaps | | | — | | | (254 | ) | | — | | Interest and other financing costs |
| | | | | | | | | |
Total | | $ | (7,658 | ) | $ | (28,101 | ) | $ | 454 | | |
| | | | | | | | | |
32
Table of Contents
Note 11 — Financial Instruments (Continued)
The following table presents derivatives that are not designated as cash flow hedges:
The Effect of Derivative Instruments on the Statements of Operations
| | | | | |
Derivatives Not Designated as Hedging Instruments
Under ASC 820 | | Amount of Gain (Loss)
Recognized in Income on
Derivative | | Statements of Operations Location |
|---|
| | (In thousands)
| |
|
|---|
Three Months Ended September 30, 2012 | | | | | |
Natural gas liquids | | $ | (553 | ) | Natural gas liquids sales |
Crude oil | | | (761 | ) | Condensate and other |
Interest rate swaps | | | (13 | ) | Interest and other financing costs |
| | | | | |
Total | | $ | (1,327 | ) | |
| | | | | |
Nine Months Ended September 30, 2012 | | | | | |
Natural gas liquids | | $ | 1,235 | | Natural gas liquids sales |
Crude oil | | | (1,230 | ) | Condensate and other |
Interest rate swaps | | | (126 | ) | Interest and other financing costs |
| | | | | |
Total | | $ | (121 | ) | |
| | | | | |
Three Months Ended September 30, 2011 | | | | | |
Natural gas | | $ | (34 | ) | Natural gas sales |
Natural gas liquids | | | 556 | | Natural gas liquids sales |
Crude oil | | | 1,065 | | Condensate and other |
Interest rate swaps | | | (54 | ) | Interest and other financing costs |
| | | | | |
Total | | $ | 1,533 | | |
| | | | | |
Nine Months Ended September 30, 2011 | | | | | |
Natural gas | | $ | (162 | ) | Natural gas sales |
Natural gas liquids | | | 472 | | Natural gas liquids sales |
Crude oil | | | 1,814 | | Condensate and other |
Interest rate swaps | | | (617 | ) | Interest and other financing costs |
| | | | | |
Total | | $ | 1,507 | | |
| | | | | |
Note 12 — Fair Value of Financial Instruments
The fair value of our financial instrument liabilities are not recorded at fair value on our consolidated balance sheets and the estimated fair value does not affect our results of operations. Cash and cash equivalents approximate fair value is equal to the amount reflected in our consolidated balance sheets as of September 30, 2012. Our revolving credit facility is considered a Level 2 fair value measurement under the fair value hierarchy as we estimate the fair value based on recent debt transactions that we considered similar to our revolving credit facility. Our Senior Notes are considered a Level 2 fair value measurement under the fair value hierarchy as we estimate the fair value based on prices of recent trades or bid and ask
33
Table of Contents
Note 12 — Fair Value of Financial Instruments (Continued)
pricing as quoted by a large financial institution that is an active market participant in our Senior Notes. A summary of the fair value and carrying value of the financial instruments is shown in the table below.
| | | | | | | | | | | | | |
| | September 30, 2012 | | December 31, 2011 | |
|---|
| | Carrying
Value | | Estimated
Fair Value | | Carrying
Value | | Estimated
Fair Value | |
|---|
| | (In thousands)
| |
|---|
Cash and cash equivalents | | $ | 53,484 | | $ | 53,484 | | $ | 56,962 | | $ | 56,962 | |
Revolving credit facility | | $ | 330,000 | | $ | 332,672 | | $ | 385,000 | | $ | 385,000 | |
2018 Notes | | $ | 249,525 | | $ | 262,001 | | $ | 249,525 | | $ | 267,566 | |
2021 Notes | | $ | 510,000 | | $ | 534,225 | | $ | 360,000 | | $ | 366,300 | |
Note 13 — Segment Information
We manage our business and analyze and report our results of operations on a segment basis. Our operations are divided into the following three segments for both internal and external reporting and analysis:
- •
- Our Texas segment provides midstream natural gas services in south and north Texas, including gathering and transportation of natural gas, and related services such as compression, dehydration, treating, processing and marketing. Our Texas segment also provides NGL fractionation and transportation and, through August 2012, included our Lake Charles plant located in southwest Louisiana. In addition to our 100%-owned operations, this segment includes our equity investments in Webb Duval, Eagle Ford Gathering, Liberty Pipeline Group and Double Eagle Pipeline.
- •
- Our Oklahoma segment provides midstream natural gas services in central and east Oklahoma, including primarily low-pressure gathering of natural gas and related services such as compression, dehydration, treating, processing and nitrogen rejection. This segment includes our equity investment in Southern Dome.
- •
- Our Rocky Mountains segment provides midstream natural gas services in the Powder River Basin of Wyoming, including gathering and treating of natural gas. In addition to our 100%-owned producer services business, this segment includes our equity investments in Bighorn and Fort Union.
The amounts indicated below as "Corporate and other" relate to our risk management activities, intersegment eliminations and other activities we perform or assets we hold that have not been allocated to any of our reporting segments.
We evaluate segment performance based on segment gross margin before depreciation, amortization and impairment. Operating and maintenance expenses and general and administrative expenses incurred at Corporate and other are allocated to Texas, Oklahoma and Rocky Mountains based on expenses directly attributable to each segment or an allocation based on activity, as appropriate. We use the same accounting methods and allocations in the preparation of our segment information as used in our consolidated reporting.
34
Table of Contents
Note 13 — Segment Information (Continued)
Summarized financial information concerning our reportable segments is shown in the following tables:
| | | | | | | | | | | | | | | | | | | |
| | Texas | | Oklahoma | | Rocky
Mountains | | Total
Segments | | Corporate
and Other | | Consolidated | |
|---|
| | (In thousands)
| |
|---|
Three Months Ended September 30, 2012: | | | | | | | | | | | | | | | | | | | |
Total segment gross margin | | $ | 55,236 | | $ | 22,948 | | $ | 624 | | $ | 78,808 | | $ | (3,716 | ) | $ | 75,092 | |
Operations and maintenance expenses | | | 11,548 | | | 7,649 | | | 45 | | | 19,242 | | | — | | | 19,242 | |
Depreciation and amortization | | | 9,573 | | | 8,898 | | | 434 | | | 18,905 | | | 354 | | | 19,259 | |
General and administrative expenses | | | 3,753 | | | 2,535 | | | 261 | | | 6,549 | | | 7,148 | | | 13,697 | |
Taxes other than income | | | 1,131 | | | 842 | | | 10 | | | 1,983 | | | — | | | 1,983 | |
Equity in (earnings) loss from unconsolidated affiliates | | | (9,296 | ) | | (291 | ) | | (2,971 | ) | | (12,558 | ) | | — | | | (12,558 | ) |
Gain on sale of operating assets | | | (9,716 | ) | | — | | | — | | | (9,716 | ) | | — | | | (9,716 | ) |
| | | | | | | | | | | | | | |
Operating income (loss) | | $ | 48,243 | | $ | 3,315 | | $ | 2,845 | | $ | 54,403 | | $ | (11,218 | ) | $ | 43,185 | |
| | | | | | | | | | | | | | |
Natural gas sales | | $ | 64,827 | | $ | 32,787 | | $ | — | | $ | 97,614 | | $ | — | | $ | 97,614 | |
Natural gas liquids sales | | | 160,187 | | | 47,066 | | | — | | | 207,253 | | | (1,789 | ) | | 205,464 | |
Transportation, compression and processing fees | | | 41,028 | | | 4,322 | | | 3,964 | | | 49,314 | | | — | | | 49,314 | |
Condensate and other | | | 3,426 | | | 11,467 | | | 1,034 | | | 15,927 | | | (1,926 | ) | | 14,001 | |
| | | | | | | | | | | | | | |
Sales to external customers | | $ | 269,468 | | $ | 95,642 | | $ | 4,998 | | $ | 370,108 | | $ | (3,715 | ) | $ | 366,393 | |
| | | | | | | | | | | | | | |
Interest and other financing costs | | $ | — | | $ | — | | $ | — | | $ | — | | $ | 13,797 | | $ | 13,797 | |
| | | | | | | | | | | | | | |
Capital expenditures | | $ | 86,255 | | $ | 11,012 | | $ | — | | $ | 97,267 | | $ | 345 | | $ | 97,612 | |
| | | | | | | | | | | | | | |
Three Months Ended September 30, 2011: | | | | | | | | | | | | | | | | | | | |
Total segment gross margin | | $ | 44,540 | | $ | 27,876 | | $ | 432 | | $ | 72,848 | | $ | (8,006 | ) | $ | 64,842 | |
Operations and maintenance expenses | | | 9,082 | | | 6,930 | | | 79 | | | 16,091 | | | — | | | 16,091 | |
Depreciation and amortization | | | 7,182 | | | 8,623 | | | 764 | | | 16,569 | | | 342 | | | 16,911 | |
Impairment | | | — | | | — | | | 5,000 | | | 5,000 | | | — | | | 5,000 | |
General and administrative expenses | | | 3,010 | | | 2,199 | | | 339 | | | 5,548 | | | 4,483 | | | 10,031 | |
Taxes other than income | | | 711 | | | 774 | | | 17 | | | 1,502 | | | — | | | 1,502 | |
Equity in (earnings) loss from unconsolidated affiliates | | | (1,894 | ) | | (652 | ) | | 164,135 | | | 161,589 | | | — | | | 161,589 | |
| | | | | | | | | | | | | | |
Operating income (loss) | | $ | 26,449 | | $ | 10,002 | | $ | (169,902 | ) | $ | (133,451 | ) | $ | (12,831 | ) | $ | (146,282 | ) |
| | | | | | | | | | | | | | |
Natural gas sales | | $ | 74,681 | | $ | 47,528 | | $ | 127 | | $ | 122,336 | | $ | (1,521 | ) | $ | 120,815 | |
Natural gas liquids sales | | | 118,280 | | | 79,154 | | | — | | | 197,434 | | | (6,064 | ) | | 191,370 | |
Transportation, compression and processing fees | | | 23,407 | | | 2,727 | | | 4,203 | | | 30,337 | | | — | | | 30,337 | |
Condensate and other | | | 2,874 | | | 8,417 | | | 299 | | | 11,590 | | | (421 | ) | | 11,169 | |
| | | | | | | | | | | | | | |
Sales to external customers | | $ | 219,242 | | $ | 137,826 | | $ | 4,629 | | $ | 361,697 | | $ | (8,006 | ) | $ | 353,691 | |
| | | | | | | | | | | | | | |
Interest and other financing costs | | $ | — | | $ | — | | $ | — | | $ | — | | $ | 11,080 | | $ | 11,080 | |
| | | | | | | | | | | | | | |
Capital expenditures | | $ | 76,561 | | $ | 9,306 | | $ | (9 | ) | $ | 85,858 | | $ | 327 | | $ | 86,185 | |
| | | | | | | | | | | | | | |
35
Table of Contents
Note 13 — Segment Information (Continued)
| | | | | | | | | | | | | | | | | | | |
| | Texas | | Oklahoma | | Rocky
Mountains | | Total
Segments | | Corporate
and Other | | Consolidated | |
|---|
| | (In thousands)
| |
|---|
Nine Months Ended September 30, 2012: | | | | | | | | | | | | | | | | | | | |
Total segment gross margin | | $ | 149,678 | | $ | 67,318 | | $ | 1,169 | | $ | 218,165 | | $ | (5,395 | ) | $ | 212,770 | |
Operations and maintenance expenses | | | 33,441 | | | 22,592 | | | 138 | | | 56,171 | | | — | | | 56,171 | |
Depreciation and amortization | | | 28,306 | | | 26,226 | | | 1,633 | | | 56,165 | | | 1,244 | | | 57,409 | |
Impairment | | | — | | | — | | | 28,744 | | | 28,744 | | | — | | | 28,744 | |
General and administrative expenses | | | 10,427 | | | 7,049 | | | 1,467 | | | 18,943 | | | 19,996 | | | 38,939 | |
Taxes other than income | | | 3,192 | | | 2,243 | | | 17 | | | 5,452 | | | 7 | | | 5,459 | |
Equity in (earnings) loss from unconsolidated affiliates | | | (21,315 | ) | | (692 | ) | | 111,740 | | | 89,733 | | | — | | | 89,733 | |
Gain on sale of operating assets | | | (9,716 | ) | | — | | | — | | | (9,716 | ) | | — | | | (9,716 | ) |
| | | | | | | | | | | | | | |
Operating income (loss) | | $ | 105,343 | | $ | 9,900 | | $ | (142,570 | ) | $ | (27,327 | ) | $ | (26,642 | ) | $ | (53,969 | ) |
| | | | | | | | | | | | | | |
Natural gas sales | | $ | 167,483 | | $ | 86,257 | | $ | 79 | | $ | 253,819 | | $ | — | | $ | 253,819 | |
Natural gas liquids sales | | | 435,630 | | | 154,618 | | | — | | | 590,248 | | | (817 | ) | | 589,431 | |
Transportation, compression and processing fees | | | 106,598 | | | 13,669 | | | 12,127 | | | 132,394 | | | — | | | 132,394 | |
Condensate and other | | | 9,878 | | | 38,343 | | | 1,636 | | | 49,857 | | | (4,577 | ) | | 45,280 | |
| | | | | | | | | | | | | | |
Sales to external customers | | $ | 719,589 | | $ | 292,887 | | $ | 13,842 | | $ | 1,026,318 | | $ | (5,394 | ) | $ | 1,020,924 | |
| | | | | | | | | | | | | | |
Interest and other financing costs | | $ | — | | $ | — | | $ | — | | $ | — | | $ | 42,823 | | $ | 42,823 | |
| | | | | | | | | | | | | | |
Capital expenditures | | $ | 235,420 | | $ | 26,314 | | $ | — | | $ | 261,734 | | $ | 6,045 | | $ | 267,779 | |
| | | | | | | | | | | | | | |
Segment assets | | $ | 1,021,263 | | $ | 632,452 | | $ | 283,689 | | $ | 1,937,404 | | $ | 228,454 | | $ | 2,165,858 | |
| | | | | | | | | | | | | | |
Nine Months Ended September 30, 2011: | | | | | | | | | | | | | | | | | | | |
Total segment gross margin | | $ | 135,685 | | $ | 79,623 | | $ | 2,245 | | $ | 217,553 | | $ | (27,069 | ) | $ | 190,484 | |
Operations and maintenance expenses | | | 26,815 | | | 19,943 | | | 195 | | | 46,953 | | | — | | | 46,953 | |
Depreciation and amortization | | | 20,712 | | | 27,024 | | | 2,295 | | | 50,031 | | | 1,112 | | | 51,143 | |
Impairment | | | — | | | — | | | 5,000 | | | 5,000 | | | — | | | 5,000 | |
General and administrative expenses | | | 8,731 | | | 6,766 | | | 1,003 | | | 16,500 | | | 18,030 | | | 34,530 | |
Taxes other than income | | | 1,938 | | | 2,056 | | | 18 | | | 4,012 | | | 17 | | | 4,029 | |
Equity in loss (earnings) from unconsolidated affiliates | | | (1,698 | ) | | (2,023 | ) | | 162,302 | | | 158,581 | | | — | | | 158,581 | |
| | | | | | | | | | | | | | |
Operating income (loss) | | $ | 79,187 | | $ | 25,857 | | $ | (168,568 | ) | $ | (63,524 | ) | $ | (46,228 | ) | $ | (109,752 | ) |
| | | | | | | | | | | | | | |
Natural gas sales | | $ | 211,466 | | $ | 141,264 | | $ | 380 | | $ | 353,110 | | $ | (4,572 | ) | $ | 348,538 | |
Natural gas liquids sales | | | 315,879 | | | 224,174 | | | — | | | 540,053 | | | (18,924 | ) | | 521,129 | |
Transportation, compression and processing fees | | | 61,989 | | | 7,927 | | | 12,790 | | | 82,706 | | | — | | | 82,706 | |
Condensate and other | | | 12,366 | | | 27,392 | | | 1,114 | | | 40,872 | | | (3,573 | ) | | 37,299 | |
| | | | | | | | | | | | | | |
Sales to external customers | | $ | 601,700 | | $ | 400,757 | | $ | 14,284 | | $ | 1,016,741 | | $ | (27,069 | ) | $ | 989,672 | |
| | | | | | | | | | | | | | |
Interest and other financing costs | | $ | — | | $ | — | | $ | — | | $ | — | | $ | 34,450 | | $ | 34,450 | |
| | | | | | | | | | | | | | |
Capital expenditures | | $ | 179,177 | | $ | 34,407 | | $ | (9 | ) | $ | 213,575 | | $ | 1,112 | | $ | 214,687 | |
| | | | | | | | | | | | | | |
36
Table of Contents
Item 2. Management's Discussion and Analysis of Financial Condition and Results of Operations.
You should read the following discussion of our financial condition and results of operations in conjunction with the unaudited historical consolidated financial statements and notes thereto included in Item 1 of this report, as well as Item 7, "Management's Discussion and Analysis of Financial Condition and Results of Operations," and the audited financial statements included under Item 8 in our Annual Report on Form 10-K for the year ended December 31, 2011 (the "2011 10-K").
As generally used in the energy industry and in this report, the following terms have the following meanings:
| | |
| /d: | | Per day |
| Bbls: | | Barrels |
| Condensate: | | Hydrocarbons that are produced from natural gas reservoirs but remain liquid at normal temperature and pressure |
| Lean gas: | | Natural gas that is low in NGL content |
| MMBtu: | | One million British thermal units |
| Mcf: | | One thousand cubic feet |
| MMcf: | | One million cubic feet |
| NGLs: | | Natural gas liquids, which consist primarily of ethane, propane, isobutane, normal butane, natural gasoline and stabilized condensate |
| Residue gas: | | The pipeline quality natural gas remaining after natural gas is processed and NGLs removed |
| Rich gas: | | Natural gas that is high in NGL content |
| Throughput: | | The volume of natural gas or NGLs transported or passing through a pipeline, plant, terminal or other facility |
Forward-Looking Statements
This report contains "forward-looking statements" within the meaning of the federal securities laws. All statements in this report other than statements of historical fact, including those under "— Trends and Uncertainties," "— Our Results of Operations" and "— Liquidity and Capital Resources" are forward-looking statements. Forward-looking statements address activities, events or developments that we expect or anticipate will or may occur in the future, including references to future goals or intentions. These statements can be identified by the use of forward-looking terminology, including "may," "believe," "expect," "anticipate," "estimate," "continue," or similar words. These statements include assertions related to plans for growth of our business, future capital expenditures and competitive strengths and goals. We make these statements based on our past experience and our perception of historical trends, current conditions and expected future developments as well as other considerations we believe are appropriate under the circumstances. Whether actual results and developments in the future will conform to our expectations is subject to numerous risks and uncertainties, many of which are beyond our control. Therefore, actual outcomes and results could materially differ from what is expressed or implied in these statements. Any differences could be caused by a number of factors, including, but not limited to:
- •
- the volatility of prices and market demand for natural gas, crude oil, condensate and NGLs, and for products derived from these commodities;
- •
- our ability to continue to connect new sources of natural gas, crude oil and condensate, and the NGL content of new gas supplies;
- •
- the ability of key producers to continue to drill and successfully complete and connect new natural gas and condensate volumes and such producers' performance under their contracts with us;
37
Table of Contents
- •
- our ability to attract and retain key customers and contract with new customers, and such customers' performance under their contracts with us;
- •
- our ability to access or construct new pipeline capacity, gas processing and NGL fractionation and transportation capacity;
- •
- the availability of local, intrastate and interstate transportation systems, trucks and other facilities and services for condensate, natural gas and NGLs;
- •
- our ability (and the ability of our third-party service providers) to meet in-service dates, cost expectations and operating performance standards for construction projects;
- •
- our ability to successfully integrate any acquired asset or operations;
- •
- our ability to access our revolving credit facility and to obtain additional financing on acceptable terms;
- •
- the effectiveness of our hedging program;
- •
- general economic conditions;
- •
- force majeure events such as the loss of a market or facility downtime;
- •
- the effects of government regulations and policies; and
- •
- other financial, operational and legal risks and uncertainties detailed from time to time in our filings with the SEC.
This report and our 2011 10-K include cautionary statements identifying important factors that could cause our actual results to differ materially from our expectations expressed or implied in forward-looking statements. When considering forward-looking statements, you should keep in mind the risk factors and other cautionary statements set forth in this report and under Item 1A, "Risk Factors" in our 2011 10-K. All forward-looking statements in this report and all subsequent written or oral forward-looking statements attributable to us are expressly qualified in their entirety by these cautionary statements. Forward-looking statements speak only as of the date made, and we undertake no obligation to publicly update or revise any forward-looking statements, other than as required by law, whether as a result of new information, future events or otherwise.
Overview
Through our subsidiaries and equity investments, we own and operate natural gas gathering and intrastate transportation pipeline assets, natural gas processing and fractionation facilities and NGL pipelines. We operate in Texas, Oklahoma and Wyoming. We manage our business and analyze and report our results of operations on a segment basis. Our operations are divided into three operating segments: Texas, Oklahoma and Rocky Mountains.
Texas. Our Texas segment provides midstream natural gas services in south and north Texas, including gathering and transportation of natural gas, and related services such as compression, dehydration, treating, processing and marketing. Our Texas segment also provides NGL fractionation and transportation services, and through August 2012, included a processing plant located in southwest Louisiana. In addition to our 100%-owned operations, this segment includes:
- •
- our 50% interest in Eagle Ford Gathering LLC ("Eagle Ford Gathering"), which provides midstream natural gas services to Eagle Ford Shale producers;
- •
- our 50% interest in Liberty Pipeline Group, LLC ("Liberty Pipeline Group"), which transports mixed NGLs from our Houston Central complex to the Texas Gulf Coast;
38
Table of Contents
- •
- our 62.5% interest in Webb/Duval Gatherers ("Webb Duval"), which provides natural gas gathering in south Texas; and
- •
- our 50% interest in Double Eagle Pipeline LLC ("Double Eagle Pipeline"), which is constructing a condensate and crude oil gathering system that will serve Eagle Ford Shale producers.
Oklahoma. Our Oklahoma segment provides midstream natural gas services in central and east Oklahoma, including primarily low-pressure gathering of natural gas and related services such as compression, dehydration, treating, processing and nitrogen rejection. This segment includes our majority interest in Southern Dome, LLC ("Southern Dome"), which provides gathering and processing services within the Southern Dome prospect in the southern portion of Oklahoma County.
Rocky Mountains. Our Rocky Mountains segment provides midstream natural gas services in the Powder River Basin of Wyoming, including gathering and treating of natural gas. In addition to our 100%-owned producer services business, this segment includes:
- •
- our 51% interest in Bighorn Gas Gathering, L.L.C. ("Bighorn"), which provides gathering services to Powder River Basin producers; and
- •
- our 37.04% interest in Fort Union Gas Gathering, L.L.C. ("Fort Union"), which provides gathering and treating services to Powder River Basin producers.
Corporate and Other. Items reported as "Corporate and other" relate to our risk management activities, intersegment eliminations and other activities we perform or assets we hold that have not been allocated to any of our operating segments.
Recent Developments
Public Equity Offering. In October 2012, we completed a registered underwritten offering of 6,526,078 common units, including units issued upon the underwriters' exercise of their option to purchase additional units, at $32.13 per unit, for net proceeds of approximately $201 million, after deducting underwriting discounts and offering expenses. We used the net proceeds to repay a portion of the outstanding indebtedness under our revolving credit facility.
Sale of Operating Assets. In August 2012, we sold our Lake Charles natural gas processing plant, located in southwest Louisiana, and realized a gain on the sale of approximately $9.7 million. We acquired the Lake Charles plant as part of our Cantera Natural Gas acquisition in 2007, and had operated the plant only intermittently since its acquisition. The plant was our only Louisiana asset.
Declaration of Common Unit Distribution. On October 10, 2012, our Board of Directors declared a cash distribution of $0.575 per common unit for the third quarter of 2012. This distribution will be paid on November 8, 2012 to all common unitholders of record at the close of business on October 31, 2012, including holders of the additional 6,526,078 common units we issued in the public equity offering described above.
Trends and Uncertainties
This section, which describes recent changes in factors affecting our business, should be read in conjunction with "— How We Evaluate Our Operations" and "— How We Manage Our Operations" below and under Item 7 in our 2011 10-K. Many of the factors affecting our business are beyond our control and are difficult to predict.
Our gross margins and total distributable cash flow are affected by commodity prices and by the volumes of natural gas, NGLs and condensate that flow through our assets. Generally, commodity prices
39
Table of Contents
affect the cash flow and profitability of our Texas and Oklahoma segments directly because some of our contracts in those segments have commodity-sensitive pricing terms. In addition, commodity prices affect all of our segments indirectly because they influence exploration and production activity, which underlies the demand for our services and the long-term growth and sustainability of our business.
Commodity prices are influenced by various factors that affect supply and demand. These factors include regional drilling activity and completion technology, natural gas, NGL and crude oil storage levels, competing supplies (such as crude oil or liquefied natural gas imports or exports), and the availability, proximity and capacity of downstream infrastructure and markets for natural gas, condensate and NGLs. Many of the factors affecting demand are in turn dependent on overall economic activity. For example, demand for ethane, a primary feedstock for petrochemical and manufacturing industries, varies depending on overall economic activity. Factors that can cause volatility in crude oil prices, such as international political and economic events, can also affect NGL and condensate prices because the two have historically been correlated. Also, demand for natural gas used in power generation varies depending on the relative prices for natural gas and coal.
Producers typically increase drilling and well completions when prices are sufficient to make these activities economic, and they may reduce or suspend these activities when they have become uneconomic. The point at which producer activity becomes economic depends on a combination of factors in addition to commodity prices. In many cases, producers of rich gas can benefit from NGL prices under their contracts; for these producers, strong NGL prices may offset the potential disincentive of weak natural gas prices. Strong crude oil prices may also support increased production of casinghead natural gas associated with crude oil production.
Other factors that affect a producer's ability and incentives to drill include the producer's operating costs and financial resources (both access to capital and cost of capital), the availability of labor and necessary equipment and services, the expected composition of wellhead production and the availability, proximity and capacity of downstream infrastructure, services and market outlets. Also, some producers rely on commodity price hedging to support drilling activity when prices are less favorable, and some may drill only to the extent necessary to maintain their leasehold interests or capital commitments, either of which may require drilling within a specified period of time.
The impact of changes in drilling and well completion activity on our throughput volumes may be gradual because of the time required to complete and connect new wells (or at times when drilling is declining, because of continuing production from existing wells). Delays can range from a few days, in areas with minimal time required to complete and connect wells, to as long as 18 months, if extensive dewatering or completion of downstream facilities is required.
Some of our producer contracts entitle us to deficiency fees, which help to mitigate the impact of lower drilling and production activity. However, we may be subject to increased credit risk over periods when a producer is making payments to us that are not supported by physical volumes. In addition, our cash flow will be affected because deficiency fees are not paid monthly; rather, they become payable after the end of a longer commitment period, such as annually. Furthermore, deficiency fees may be less than the amount we would receive if the producer had delivered physical volumes. In the case of deficiency fees payable to one of our unconsolidated affiliates, the payment is reflected in our cash flow only after the unconsolidated affiliate has made a cash distribution to us, which may occur in a subsequent quarter or year.
Third-Quarter 2012 Commodity Prices Overall. Natural gas prices improved in the third quarter of 2012 after reaching 10-year-lows in the second quarter. Gas prices have continued to improve in October and November. Average NYMEX crude oil prices decreased from the second quarter of 2012 to $92.22 per Bbl in the third quarter and declined to $89.57 per Bbl for October. Weighted-average NGL prices at Mont Belvieu and Conway for the third quarter of 2012 were $36.78 and $31.44 per Bbl, respectively, down from second quarter prices of $38.71 and $30.23 per Bbl. Third-quarter average ethane prices at Conway increased to $6.07 per Bbl, compared to $4.66 per Bbl for the second quarter, while Mont Belvieu ethane
40
Table of Contents
prices declined, averaging $14.22 per Bbl compared to $16.96 per Bbl for the second quarter. The weighted-average spread between Mont Belvieu and Conway narrowed to $7.15 per Bbl over the third quarter, down from $11.34 per Bbl for the second quarter, due to a larger decline in Mont Belvieu prices. The spread narrowed to $4.03 per Bbl for October 2012.
Pricing Trends in Texas. The following graph and table summarize prices for natural gas and NGLs on the primary indices we use for Texas pricing and for crude oil on NYMEX.
Texas Prices for Crude Oil, Natural Gas and NGLs(1)
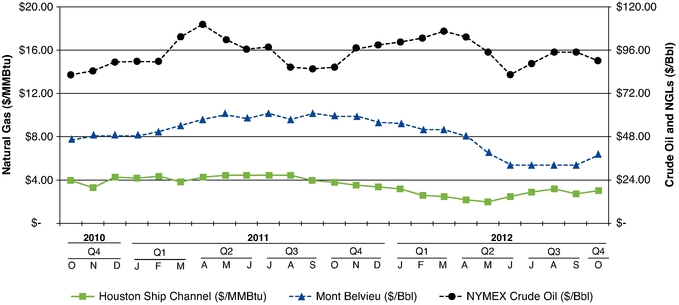
- (1)
- Average crude oil prices are based on NYMEX. Natural gas prices are first-of-the-month index prices. Average monthly NGL prices are calculated based on Mont Belvieu prices and our weighted-average product mix for the period indicated.
| | | | | | | | | | | | | | | | | | | | | | | | |
| | Quarterly Data for Texas | |
|---|
| | Q1 2011 | | Q2 2011 | | Q3 2011 | | Q4 2011 | |
| | Q1 2012 | | Q2 2012 | | Q3 2012 | |
|---|
Houston Ship Channel ($/MMBtu) | | $ | 4.06 | | $ | 4.29 | | $ | 4.23 | | $ | 3.49 | | | | $ | 2.65 | | $ | 2.17 | | $ | 2.84 | |
Mont Belvieu ($/Bbl) | | $ | 51.22 | | $ | 58.57 | | $ | 59.43 | | $ | 57.76 | | | | $ | 52.64 | | $ | 38.71 | | $ | 36.78 | |
NYMEX crude oil ($/Bbl) | | $ | 94.10 | | $ | 102.56 | | $ | 89.76 | | $ | 94.06 | | | | $ | 102.93 | | $ | 93.49 | | $ | 92.22 | |
100%-Owned | | | | | | | | | | | | | | | | | | | | | | | | |
Service throughput (MMBtu/d) | | | 654,996 | | | 665,040 | | | 765,744 | | | 844,469 | | | | | 944,033 | | | 924,465 | | | 897,601 | |
Plant inlet (MMBtu/d) | | | 560,903 | | | 588,533 | | | 686,398 | | | 803,282 | | | | | 833,163 | | | 834,846 | | | 824,196 | |
NGLs produced (Bbls/d) | | | 23,228 | | | 26,913 | | | 30,904 | | | 33,951 | | | | | 35,344 | | | 50,146 | | | 54,142 | |
Segment gross margin (in thousands) | | $ | 45,011 | | $ | 46,134 | | $ | 44,540 | | $ | 48,752 | | | | $ | 45,341 | | $ | 49,101 | | $ | 55,236 | |
Joint Ventures(1) | | | | | | | | | | | | | | | | | | | | | | | | |
Pipeline throughput (MMBtu/d) | | | 49,450 | | | 48,045 | | | 87,386 | | | 206,962 | | | | | 269,433 | | | 316,111 | | | 373,402 | |
NGLs produced (Bbls/d)(2) | | | — | | | — | | | — | | | 6,735 | | | | | 9,912 | | | 10,169 | | | 12,526 | |
Gross margin (in thousands) | | $ | 422 | | | 720 | | | 6,706 | | | 23,347 | | | | $ | 9,815 | | $ | 26,964 | | $ | 25,945 | |
- (1)
- Includes 100% of results and volumes from Eagle Ford Gathering, Webb Duval and Liberty Pipeline Group.
- (2)
- Net of NGLs produced at our Houston Central complex.
The first-of-the-month price for natural gas on the Houston Ship Channel index for October 2012 was $2.97 per MMBtu, and the spot price on October 31, 2012 was $3.39 per MMBtu. The weighted-average daily price for NGLs at Mont Belvieu for October 2012, based on our third-quarter 2012 product mix, was $40.78 per Bbl.
41
Table of Contents
Pricing Trends in Oklahoma. The following graph and table summarize prices for natural gas and NGLs on the primary indices we use for Oklahoma pricing and for crude oil on the NYMEX.
Oklahoma Prices for Crude Oil, Natural Gas and NGLs(1)
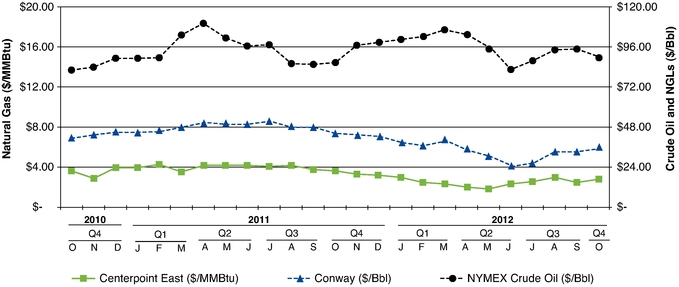
- (1)
- Average crude oil prices are based on NYMEX. Natural gas prices are first-of-the-month index prices. Average monthly NGL prices are calculated based on Conway prices and our weighted-average product mix for the period indicated.
| | | | | | | | | | | | | | | | | | | | | | | | |
| | Quarterly Data for Oklahoma | |
|---|
| | Q1 2011 | | Q2 2011 | | Q3 2011 | | Q4 2011 | |
| | Q1 2012 | | Q2 2012 | | Q3 2012 | |
|---|
CenterPoint East ($/MMBtu) | | $ | 3.93 | | $ | 4.14 | | $ | 4.05 | | $ | 3.38 | | | | $ | 2.60 | | $ | 2.11 | | $ | 2.72 | |
Conway ($/Bbl) | | $ | 46.36 | | $ | 50.17 | | $ | 49.21 | | $ | 43.49 | | | | $ | 39.18 | | $ | 30.23 | | $ | 31.44 | |
NYMEX crude oil ($/Bbl) | | $ | 94.10 | | $ | 102.56 | | $ | 89.76 | | $ | 94.06 | | | | $ | 102.93 | | $ | 93.49 | | $ | 92.22 | |
100%-Owned | | | | | | | | | | | | | | | | | | | | | | | | |
Service throughput (MMBtu/d) | | | 269,550 | | | 283,870 | | | 288,440 | | | 307,346 | | | | | 318,285 | | | 324,915 | | | 313,414 | |
Plant inlet (MMBtu/d) | | | 147,710 | | | 157,424 | | | 158,070 | | | 159,344 | | | | | 157,052 | | | 158,106 | | | 157,775 | |
NGLs produced (Bbls/d) | | | 16,037 | | | 17,331 | | | 17,453 | | | 17,471 | | | | | 16,961 | | | 17,028 | | | 16,207 | |
Segment gross margin (in thousands) | | $ | 23,082 | | $ | 28,665 | | $ | 27,876 | | $ | 25,457 | | | | $ | 24,199 | | $ | 20,171 | | $ | 22,948 | |
Joint Ventures(1) | | | | | | | | | | | | | | | | | | | | | | | | |
Plant inlet (MMBtu/d) | | | 11,182 | | | 11,730 | | | 11,970 | | | 10,287 | | | | | 10,017 | | | 7,352 | | | 10,354 | |
NGLs produced (Bbls/d) | | | 393 | | | 432 | | | 429 | | | 358 | | | | | 363 | | | 249 | | | 375 | |
Gross margin (in thousands) | | $ | 1,421 | | $ | 1,364 | | $ | 1,331 | | $ | 980 | | | | $ | 1,003 | | $ | 491 | | $ | 848 | |
- (1)
- Includes 100% of results and volumes from Southern Dome.
The first-of-the-month price for natural gas on the CenterPoint East index for October 2012 was $2.82 per MMBtu, and the spot price on October 31, 2012 was $3.38 per MMBtu. The weighted-average daily price for NGLs at Conway for October 2012, based on our third-quarter 2012 product mix, was $37.84 per Bbl.
Basis Trends. Basis risk continues to affect our hedges relating to Oklahoma NGL volumes, but we benefited from a narrowing of the Mont Belvieu-Conway basis spread in the third quarter of 2012. We use Mont Belvieu-priced hedge instruments for our Oklahoma NGL volumes because the forward market for Conway-based hedge instruments is limited.
42
Table of Contents
The monthly average basis differential between Mont Belvieu and Conway reached $10.75 per Bbl in July 2012 before narrowing in August and September, averaging $4.82 per Bbl for September. The basis differential for October 2012 averaged $4.03 per Bbl. The average basis differential between Houston Ship Channel and CenterPoint East natural gas index prices for the third quarter of 2012 was $0.12/MMBtu.
The following graph summarizes the basis differential between Mont Belvieu and Conway prices.
Mont Belvieu - Conway Basis(1)
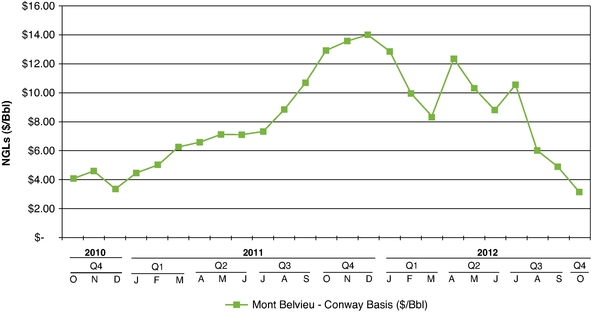
- (1)
- Average NGL prices are calculated based on our Oklahoma segment weighted-average product mix for the period indicated.
43
Table of Contents
Pricing Trends in the Rocky Mountains. The following graph and table summarize prices for natural gas on Colorado Interstate Gas, the primary index we use for the Rocky Mountains.
Rocky Mountains Natural Gas Prices(1)
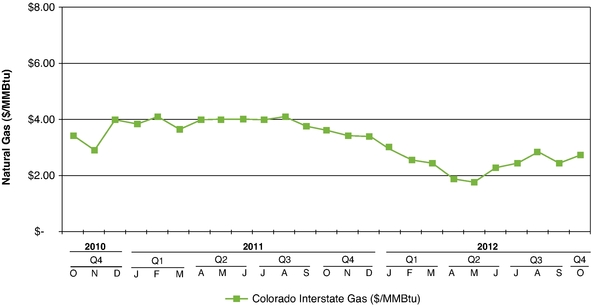
- (1)
- Natural gas prices are first-of-the-month index prices.
| | | | | | | | | | | | | | | | | | | | | | | | |
| | Quarterly Data for Rocky Mountains | |
|---|
| | Q1 2011 | | Q2 2011 | | Q3 2011 | | Q4 2011 | |
| | Q1 2012 | | Q2 2012 | | Q3 2012 | |
|---|
Colorado Interstate Gas ($/MMBtu) | | $ | 3.83 | | $ | 3.98 | | $ | 3.91 | | $ | 3.43 | | | | $ | 2.62 | | $ | 1.95 | | $ | 2.55 | |
100%-Owned | | | | | | | | | | | | | | | | | | | | | | | | |
Segment gross margin (in thousands) | | $ | 1,042 | | $ | 771 | | $ | 432 | | $ | 396 | | | | $ | 358 | | $ | 187 | | $ | 624 | |
Joint Ventures(1) | | | | | | | | | | | | | | | | | | | | | | | | |
Pipeline throughput (MMBtu/d) | | | 581,051 | | | 533,329 | | | 670,543 | | | 630,843 | | | | | 787,366 | | | 747,009 | | | 694,961 | |
Gross margin (in thousands) | | $ | 21,524 | | $ | 19,407 | | $ | 20,488 | | $ | 24,332 | | | | $ | 21,462 | | $ | 18,741 | | $ | 18,035 | |
- (1)
- Includes 100% of Bighorn and Fort Union volumes. Changes in pipeline throughput at Fort Union did not have a material impact on gross margin because Fort Union received payments for additional volumes under long-term contractual commitments in each of the periods indicated.
The first-of-the-month price for natural gas on the Colorado Interstate Gas index for October 2012 was $2.72 per MMBtu, and the spot price on October 31, 2012 was $3.48 per MMBtu.
Other Industry Trends. Volume growth from rich gas shale plays such as the Eagle Ford Shale continues to stress existing processing and liquids-handling infrastructure. NGL transportation and fractionation facilities remain subject to capacity constraints and older processing facilities are subject to reduced operating performance due to the very high NGL content of gas from these plays.
Transportation costs for crude oil, condensate and heavier NGL products in Texas remain higher due to limited pipeline infrastructure and available trucking capacity. In addition, we believe that limited fractionation capacity at Mont Belvieu and a lack of available NGL pipeline capacity in the Mid-Continent are contributing to the wide basis spread between Mont Belvieu and Conway. We anticipate that new pipeline infrastructure linking the Mid-Continent and Gulf Coast regions, which is scheduled to come online beginning in 2013, will help to moderate this basis spread.
44
Table of Contents
Generally, processing and NGL capacity constraints result in higher processing fees and NGL transportation and fractionation costs for parties that do not have contractually fixed costs. Midstream companies experiencing capacity constraints or related outages may curtail volumes, experience reduced operating performance or, where possible, reject ethane, each of which can have an immediate impact on cash flow and operating results for both the midstream company and its producers and other customers. While these effects could limit the benefits producers receive from rich gas production and therefore affect the level of producer activity, we anticipate that the impact of processing and fractionation capacity constraints may begin to improve as new facilities come online in 2014.
Third-quarter 2012 gathering volumes in Oklahoma were down slightly compared to second-quarter volumes, as producers suspended dry gas Woodford Shale drilling because of low natural gas prices, but were 9% higher compared to the third quarter of 2011, primarily due to Woodford Shale volume growth. In the Rocky Mountains, Fort Union and Bighorn volumes were down 7% and 9%, respectively, compared to the second quarter of 2012 due to limited drilling activity in the Powder River Basin. A 10% increase in Fort Union volumes compared to the third quarter of 2011 reflects volumes that producers brought to Fort Union during the third quarter of 2011 and flowed on Fort Union for the full quarter in 2012. Volumes on Bighorn declined 20% over the same period due to limited drilling activity.
Factors Affecting Operating Results and Financial Condition
Eagle Ford Shale volume growth in the third quarter of 2012 increased our total segment gross margin compared to the second quarter, and although Texas processing margins were less favorable, the impact was mitigated by a greater percentage of our gross margin coming from fee-based contracts. In Oklahoma, the impact of slightly lower volumes was offset by higher commodity prices. Our third-quarter results also reflect a full quarter of improved operating performance at our Houston Central complex, whereas we experienced shut-downs of third-party facilities, reduced operating performance and downtime for repairs and modifications early in the second quarter of 2012.
As compared to the third quarter of 2011, our third-quarter 2012 results also reflect declines in natural gas, condensate and NGL prices in Texas and Oklahoma, which partly offset the benefits of year-over-year
45
Table of Contents
volume growth due to strong drilling activity in the areas we serve. Cash received from our commodity hedge settlements increased compared to the second quarter of 2012 and the third quarter of 2011 due to lower NGL prices.
Our year-to-date results also reflect $148.7 million in non-cash impairments of our Rocky Mountains assets, which we recorded for the first quarter of 2012, due to low natural gas price environment in the region and our expectation of lower drilling activity in the Powder River Basin.
Our operating income for the third quarter of 2012 includes a $9.7 million gain received upon our sale of the Lake Charles plant.
Prices and Drilling Activity. We believe that the decline in NGL prices during the first half of 2012 was attributable to a series of events resulting in an overabundance of NGLs and compounded by infrastructure limitations. Propane prices were under pressure due to a mild winter, and ethane and other NGL prices have been lower due to a combination of NGL-industry-related outages and planned shutdowns, which effectively reduced fractionation and ethane-cracking capacity in the first half of 2012. Many fractionation and petrochemical facilities are back online, and recently announced expansions of propane export facilities in the Houston Ship Channel area may signal a trend that could reduce pressure on propane prices. However, we expect that the industry focus on rich gas drilling combined with significant production increases in unconventional shale plays and limited petrochemical cracking capacity will result in continued supply-based pressure on NGL prices over the near term.
As long as NGL prices remain above levels that are economic for producers, we anticipate continued drilling activity in oil and rich-gas areas. While the level at which prices are economic will vary depending upon the play and the producer, we believe that the Eagle Ford Shale, the north Barnett Shale Combo, the rich areas of the Woodford Shale, and the Hunton de-watering plays remain attractive to producers because they offer rich gas, low geologic risk, nearby infrastructure and market access relative to other plays, as well as high initial production rates. In addition, one of our producers in the lean Woodford Shale has indicated plans to resume drilling in December, and we have seen increases in drilling activity in the Mississippi Lime play in northern Oklahoma. We have completed gathering and compression facilities extending into the play from our existing assets in the area, and we expect to complete an interconnect with our Paden plant by the end of 2012. The Paden interconnect will enable us to provide processing and nitrogen rejection services for Mississippi Lime production.
Natural gas prices have improved from recent 10-year lows, we believe mainly due to increased power-generation demands relating to summer weather. Because natural gas prices have been low, gas has been an attractive alternative to coal for power generation. Natural gas prices have remained below the level at which producers have sufficient incentives to increase drilling in the Powder River Basin and many conventional drilling areas. Drilling and related activity in shale plays have consumed significant capital and other resources, shifting capital and resources away from conventional areas. We expect that many producers who rely on conventional drilling, produce mainly lean gas, or both, are not likely to resume significant drilling activity in the current natural gas price environment.
Volume Growth and Infrastructure. A consequence of the increasing volumes from shale plays is the continuing need for investment in new infrastructure. Our ability to benefit from oil and rich gas drilling activity depends on the successful completion of capital projects that we and some of our third-party service providers have undertaken, which includes having facilities perform as we expect. As we discussed in our second-quarter 2012 Form 10-Q, the Houston Central complex has been receiving gas with NGL content that exceeded our original expectations and is unprecedented compared to historical levels in the region.
46
Table of Contents
To address the higher NGL content of Eagle Ford Shale gas and enhance our ability to serve producers in the play, we are installing a 400 MMcf/d cryogenic processing facility at Houston Central, which is scheduled for completion in early 2013, and we plan to install an additional 400 MMcf/d cryogenic facility in 2014. These new facilities ultimately should enable us to relegate our lean oil facility to providing overflow and interruptible volume services. We expect that the high NGL content of Eagle Ford Shale gas may limit the operating performance at our Houston Central complex until the new facilities are complete. After the new facilities are in service, we may continue to face other operating risks. Please read Item 1A.,"Risk Factors," in this report and in our 2011 Form 10-K.
We anticipate that the basis differential affecting Texas and Oklahoma NGL prices in 2012 will continue to moderate as new fractionation facilities and NGL transportation infrastructure, including new third-party NGL pipelines linking the Mid-Continent to the Gulf Coast, come online beginning in late 2013.
We believe that investors and other market participants benefit from having access to the various financial and operating measures that our management uses in evaluating our performance because it allows them to independently evaluate our performance with the same information used by management. These measures include: (i) throughput volumes; (ii) segment gross margin and total segment gross margin; (iii) operations and maintenance expenses; (iv) general and administrative expenses; (v) EBITDA and adjusted EBITDA and (vi) total distributable cash flow.
Segment gross margin, total segment gross margin, EBITDA, adjusted EBITDA and total distributable cash flow are non-generally accepted accounting principles, or non-GAAP, financial measures. We use non-GAAP financial measures to evaluate our core profitability and to assess the financial performance of our assets. A reconciliation of each non-GAAP measure to its most directly comparable GAAP measure is provided below. Non-GAAP financial measures should not be considered as alternatives to GAAP measures such as net income (loss), operating income (loss), income (loss) from continuing operations, cash flows from operating activities or any other GAAP measure of liquidity or financial performance. Our non-GAAP financial measures may not be comparable to similarly titled measures of other companies, which may not calculate their measures in the same manner.
For additional discussion about these non-GAAP measures and our other financial and operating performance measures, please read "— How We Evaluate Our Operations" under Item 7 in our 2011 10-K.
Reconciliation of Non-GAAP Financial Measures. The following table presents a reconciliation of the non-GAAP financial measures of (i) total segment gross margin (which consists of the sum of individual segment gross margins and the results of our risk management activities, which are included in corporate and other) to the most directly comparable GAAP financial measure of operating income and (ii) EBITDA, adjusted EBITDA and total distributable cash flow to the most directly comparable GAAP financial measure of net income (loss), for each of the periods indicated.
47
Table of Contents
| | | | | | | | | | | | | | | |
| |
| | Three Months Ended
September 30, | | Nine Months Ended
September 30, | |
|---|
| |
| | 2012 | | 2011 | | 2012 | | 2011 | |
|---|
| |
| | (In thousands)
| |
|---|
Reconciliation of total segment gross margin to operating income (loss): | | | | | | | | | | | | | |
Operating income (loss) | | $ | 43,185 | | $ | (146,282 | ) | $ | (53,969 | ) | $ | (109,752 | ) |
Add: | | Operations and maintenance expenses | | | 19,242 | | | 16,091 | | | 56,171 | | | 46,953 | |
| | Depreciation and amortization | | | 19,259 | | | 16,911 | | | 57,409 | | | 51,143 | |
| | Impairment | | | — | | | 5,000 | | | 28,744 | | | 5,000 | |
| | General and administrative expenses | | | 13,697 | | | 10,031 | | | 38,939 | | | 34,530 | |
| | Taxes other than income | | | 1,983 | | | 1,502 | | | 5,459 | | | 4,029 | |
| | Equity in (earnings) loss from unconsolidated affiliates | | | (12,558 | ) | | 161,589 | | | 89,733 | | | 158,581 | |
| | Gain on sale of operating assets | | | (9,716 | ) | | — | | | (9,716 | ) | | — | |
| | | | | | | | | | | | |
Total segment gross margin | | $ | 75,092 | | $ | 64,842 | | $ | 212,770 | | $ | 190,484 | |
| | | | | | | | | | | | |
Reconciliation of EBITDA, adjusted EBITDA and total distributable cash flow to net income (loss): | | | | | | | | | | | | | |
Net income (loss) | | $ | 28,925 | | $ | (157,736 | ) | $ | (97,628 | ) | $ | (163,565 | ) |
Add: | | Depreciation and amortization | | | 19,259 | | | 16,911 | | | 57,409 | | | 51,143 | |
| | Interest and other financing costs | | | 13,797 | | | 11,080 | | | 42,823 | | | 34,450 | |
| | Provision for income taxes | | | 474 | | | 390 | | | 1,406 | | | 1,161 | |
| | | | | | | | | | | | |
EBITDA | | | 62,455 | | | (129,355 | ) | | 4,010 | | | (76,811 | ) |
Add: | | Amortization of commodity derivative options | | | 5,924 | | | 7,442 | | | 16,002 | | | 22,069 | |
| | Distributions from unconsolidated affiliates | | | 11,994 | | | 6,757 | | | 34,508 | | | 20,329 | |
| | Loss on refinancing of unsecured debt | | | — | | | — | | | — | | | 18,233 | |
| | Equity-based compensation | | | 3,223 | | | 2,093 | | | 7,575 | | | 9,184 | |
| | Equity in (earnings) loss from unconsolidated affiliates | | | (12,558 | ) | | 161,589 | | | 89,733 | | | 158,581 | |
| | Unrealized (gain) loss from commodity risk management activities | | | 2,583 | | | (2,332 | ) | | (1,818 | ) | | (2,695 | ) |
| | Impairment | | | — | | | 5,000 | | | 28,744 | | | 5,000 | |
| | Other non-cash operating items | | | (591 | ) | | 576 | | | 2,894 | | | (272 | ) |
| | | | | | | | | | | | |
Adjusted EBITDA | | | 73,030 | | | 51,770 | | | 181,648 | | | 153,618 | |
Less: | | Interest expense | | | (13,745 | ) | | (11,029 | ) | | (42,526 | ) | | (33,623 | ) |
| | Current income tax expense and other | | | (419 | ) | | (305 | ) | | (1,166 | ) | | (929 | ) |
| | Maintenance capital expenditures | | | (1,743 | ) | | (3,510 | ) | | (7,984 | ) | | (11,111 | ) |
| | | | | | | | | | | | |
Total distributable cash flow | | $ | 57,123 | | $ | 36,926 | | $ | 129,972 | | $ | 107,955 | |
| | | | | | | | | | | | |
Our management team uses a variety of tools to manage our business. These tools include: (i) our economic models, (ii) flow and transaction monitoring systems, (iii) producer activity evaluation and reporting, (iv) imbalance monitoring and control and (v) measurement and loss reports. For a further discussion, please read "— How We Manage Our Operations" under Item 7 in our 2011 10-K.
48
Table of Contents
| | | | | | | | | | | | | |
| | Three Months Ended
September 30, | | Nine Months Ended
September 30, | |
|---|
| | 2012 | | 2011 | | 2012 | | 2011 | |
|---|
| | ($ In thousands, except per unit information)
| |
|---|
Total segment gross margin(1) | | $ | 75,092 | | $ | 64,842 | | $ | 212,770 | | $ | 190,484 | |
Operations and maintenance expenses | | | 19,242 | | | 16,091 | | | 56,171 | | | 46,953 | |
Depreciation and amortization | | | 19,259 | | | 16,911 | | | 57,409 | | | 51,143 | |
Impairment | | | — | | | 5,000 | | | 28,744 | | | 5,000 | |
General and administrative expenses | | | 13,697 | | | 10,031 | | | 38,939 | | | 34,530 | |
Taxes other than income | | | 1,983 | | | 1,502 | | | 5,459 | | | 4,029 | |
Equity in (earnings) loss from unconsolidated affiliates(2)(3) | | | (12,558 | ) | | 161,589 | | | 89,733 | | | 158,581 | |
Gain on sale of operating assets | | | (9,716 | ) | | — | | | (9,716 | ) | | — | |
| | | | | | | | | | |
Operating income (loss) | | | 43,185 | | | (146,282 | ) | | (53,969 | ) | | (109,752 | ) |
Loss on refinancing of unsecured debt | | | — | | | — | | | — | | | (18,233 | ) |
Interest and other financing costs, net | | | (13,786 | ) | | (11,064 | ) | | (42,253 | ) | | (34,419 | ) |
Provision for income taxes | | | (474 | ) | | (390 | ) | | (1,406 | ) | | (1,161 | ) |
| | | | | | | | | | |
Net income (loss) | | | 28,925 | | | (157,736 | ) | | (97,628 | ) | | (163,565 | ) |
Preferred unit distributions | | | (9,138 | ) | | (8,279 | ) | | (26,751 | ) | | (24,235 | ) |
| | | | | | | | | | |
Net income (loss) to common units | | $ | 19,787 | | $ | (166,015 | ) | $ | (124,379 | ) | $ | (187,800 | ) |
| | | | | | | | | | |
Basic net income (loss) per common unit | | $ | 0.27 | | $ | (2.51 | ) | $ | (1.73 | ) | $ | (2.84 | ) |
| | | | | | | | | | |
Weighted average number of common units — basic | | | 72,395 | | | 66,246 | | | 71,887 | | | 66,125 | |
| | | | | | | | | | |
Diluted net income (loss) per common unit | | $ | 0.23 | | $ | (2.51 | ) | $ | (1.73 | ) | $ | (2.84 | ) |
| | | | | | | | | | |
Weighted average number of common units — diluted | | | 85,682 | | | 66,246 | | | 71,887 | | | 66,125 | |
| | | | | | | | | | |
Total segment gross margin: | | | | | | | | | | | | | |
Texas | | $ | 55,236 | | $ | 44,540 | | $ | 149,678 | | $ | 135,685 | |
Oklahoma | | | 22,948 | | | 27,876 | | | 67,318 | | | 79,623 | |
Rocky Mountains(4) | | | 624 | | | 432 | | | 1,169 | | | 2,245 | |
| | | | | | | | | | |
Segment gross margin | | | 78,808 | | | 72,848 | | | 218,165 | | | 217,553 | |
Corporate and other(5) | | | (3,716 | ) | | (8,006 | ) | | (5,395 | ) | | (27,069 | ) |
| | | | | | | | | | |
Total segment gross margin(1) | | $ | 75,092 | | $ | 64,842 | | $ | 212,770 | | $ | 190,484 | |
| | | | | | | | | | |
Segment gross margin per unit: | | | | | | | | | | | | | |
Texas: | | | | | | | | | | | | | |
Service throughput ($/MMBtu) | | $ | 0.67 | | $ | 0.63 | | $ | 0.59 | | $ | 0.71 | |
Oklahoma: | | | | | | | | | | | | | |
Service throughput ($/MMBtu) | | $ | 0.80 | | $ | 1.05 | | $ | 0.77 | | $ | 1.04 | |
Volumes: | | | | | | | | | | | | | |
Texas:(6) | | | | | | | | | | | | | |
Service throughput (MMBtu/d)(7) | | | 897,601 | | | 765,744 | | | 922,256 | | | 694,802 | |
Pipeline throughput (MMBtu/d) | | | 557,457 | | | 463,321 | | | 563,404 | | | 436,210 | |
Plant inlet volumes (MMBtu/d) | | | 824,196 | | | 686,398 | | | 830,755 | | | 612,405 | |
NGLs produced (Bbls/d) | | | 54,142 | | | 30,904 | | | 46,239 | | | 27,040 | |
Oklahoma:(8) | | | | | | | | | | | | | |
Service throughput (MMBtu/d)(7) | | | 313,414 | | | 288,440 | | | 318,851 | | | 280,689 | |
Plant inlet volumes (MMBtu/d) | | | 157,775 | | | 158,070 | | | 157,645 | | | 154,439 | |
NGLs produced (Bbls/d) | | | 16,207 | | | 17,453 | | | 16,729 | | | 16,945 | |
Capital Expenditures: | | | | | | | | | | | | | |
Maintenance capital expenditures | | $ | 1,743 | | $ | 3,510 | | $ | 7,984 | | $ | 11,111 | |
Expansion capital expenditures | | | 95,869 | | | 82,675 | | | 259,794 | | | 203,576 | |
| | | | | | | | | | |
Total capital expenditures | | $ | 97,612 | | $ | 86,185 | | $ | 267,778 | | $ | 214,687 | |
| | | | | | | | | | |
Operations and maintenance expenses: | | | | | | | | | | | | | |
Texas | | $ | 11,548 | | $ | 9,082 | | $ | 33,441 | | $ | 26,815 | |
Oklahoma | | | 7,649 | | | 6,930 | | | 22,592 | | | 19,943 | |
Rocky Mountains | | | 45 | | | 79 | | | 138 | | | 195 | |
| | | | | | | | | | |
Total operations and maintenance expenses | | $ | 19,242 | | $ | 16,091 | | $ | 56,171 | | $ | 46,953 | |
| | | | | | | | | | |
49
Table of Contents
- (1)
- Total segment gross margin is a non-GAAP financial measure. Please read "— How We Evaluate Our Operations" for a reconciliation of total segment gross margin to its most directly comparable GAAP measure of operating income.
- (2)
- During the three months ended March 31, 2012, we recorded a $120 million non-cash impairment charge relating to our investments in Bighorn and Fort Union.
- (3)
- The following table summarizes the results and volumes associated with our unconsolidated affiliates ($ in thousands):
| | | | | | | | | | | | | | | |
| |
| | Three Months Ended September 30, | |
|---|
| |
| | 2012 | | 2011 | |
|---|
| |
| | Volume | | Equity
(Earnings)/Loss | | Volume | | Equity
(Earnings)/Loss | |
|---|
Eagle Ford Gathering | | | | | | | $ | (9,174 | ) | | | | $ | (2,016 | ) |
Pipeline throughput(a) | | (MMBtu/d) | | | 319,919 | | | | | | 38,652 | | | | |
NGLs produced(b) | | (Bbls/d) | | | 12,526 | | | | | | — | | | | |
Liberty Pipeline Group(c) | | (Bbls/d) | | | 25,083 | | | 37 | | | 2,635 | | | 59 | |
Webb Duval(d) | | (MMBtu/d) | | | 53,483 | | | (65 | ) | | 48,628 | | | 73 | |
Southern Dome | | | | | | | | (291 | ) | | | | | (652 | ) |
Plant inlet | | (MMBtu/d) | | | 10,354 | | | | | | 11,970 | | | | |
NGLs produced | | (Bbls/d) | | | 375 | | | | | | 429 | | | | |
Bighorn and Fort Union(e) | | (MMBtu/d) | | | 694,961 | | | (2,970 | ) | | 670,543 | | | 164,136 | |
| | | | | | | | | | | | | | | |
| |
| | Nine Months Ended September 30, | |
|---|
| |
| | 2012 | | 2011 | |
|---|
| |
| | Volume | | Equity
(Earnings)/Loss | | Volume | | Equity
(Earnings)/Loss | |
|---|
Eagle Ford Gathering | | | | | | | $ | (21,082 | ) | | | | $ | (1,978 | ) |
Pipeline throughput(a) | | (MMBtu/d) | | | 260,212 | | | | | | 13,026 | | | | |
NGLs produced(b) | | (Bbls/d) | | | 10,875 | | | | | | — | | | | |
Liberty Pipeline Group(c) | | (Bbls/d) | | | 20,172 | | | 311 | | | 888 | | | 60 | |
Webb Duval(b) | | (MMBtu/d) | | | 59,517 | | | (255 | ) | | 48,705 | | | 257 | |
Southern Dome | | | | | | | | (692 | ) | | | | | (2,023 | ) |
Plant inlet | | (MMBtu/d) | | | 9,245 | | | | | | 11,630 | | | | |
NGLs produced | | (Bbls/d) | | | 329 | | | | | | 418 | | | | |
Bighorn and Fort Union(e) | | (MMBtu/d) | | | 742,937 | | | 111,740 | | | 595,302 | | | 162,302 | |
- (a)
- For the three and nine months ended September 30, 2011, the volume has been recast from 58,295 MMBtu/d, as previously stated, to reflect daily flow averaged over the 92 days and 273 days of the three- and nine-month periods, respectively, instead of the 63 days of physical flow.
- (b)
- Net of NGLs produced at our Houston Central complex.
- (c)
- For the three and nine months ended September 30, 2011, the volume has been recast from 4,252 MMBtu/d, as previously stated, to reflect daily flow averaged over the 92 days and 273 days of the three- and nine-month periods, respectively, instead of the 57 days of physical flow.
- (d)
- Net of intercompany volumes.
- (e)
- Changes in pipeline throughput at Fort Union did not have a material impact on gross margin because Fort Union received payments for additional volumes under long-term contractual commitments in each of the periods indicated.
- (4)
- Rocky Mountains segment gross margin includes results from producer services, including volumes purchased for resale, volumes gathered under firm capacity gathering agreements with Fort Union, volumes transported using our firm capacity agreements with Wyoming Interstate Gas Company and compressor rental services provided to Bighorn.
- (5)
- Corporate and other includes results attributable to our commodity risk management activities.
- (6)
- Plant inlet volumes and NGLs produced represent total volumes processed and produced by the Texas segment at all plants, including plants owned by the Texas segment and plants owned by third parties.
- (7)
- "Service throughput" means the volume of natural gas delivered to our 100%-owned processing plants by third-party pipelines plus our "pipeline throughput," which is the volume of natural gas transported or gathered through our pipelines.
- (8)
- Plant inlet volumes and NGLs produced represent total volumes processed and produced by the Oklahoma segment at all plants, including plants owned by the Oklahoma segment and plants owned by third parties.
50
Table of Contents
Three Months Ended September 30, 2012 Compared To Three Months Ended September 30, 2011
Texas Segment Gross Margin. Texas segment gross margin was $55.2 million for the three months ended September 30, 2012 compared to $44.5 million for the three months ended September 30, 2011, an increase of $10.7 million, or 24%. The impact of lower NGL prices, which declined 38%, was offset by higher volumes. Volumes gathered and volumes processed each increased 20%, and NGLs produced increased 75%, respectively, for the three months ended September 30, 2012 as compared to the three months ended September 30, 2011. Our gathering and processing volume growth was due primarily to the Eagle Ford Shale and north Barnett Shale Combo plays, and was offset by a decline in leaner gas volumes at the Houston Central complex, which were displaced to accommodate rich Eagle Ford Gathering volumes. Higher NGL production reflects overall volume growth at our Saint Jo plant and a substantial increase in the NGL content of gas processed at our Houston Central complex. Despite the 38% decline in NGL prices, Texas segment gross margin per unit of service throughput increased $0.04 per MMBtu to $0.67 per MMBtu for the three months ended September 30, 2012 compared to $0.63 per MMBtu for the three months ended September 30, 2011, mainly due to enhanced operating performance attributable to the cryogenic upgrade at our Houston Central complex and growth in fee-based volumes.
Oklahoma Segment Gross Margin. Oklahoma segment gross margin was $22.9 million for the three months ended September 30, 2012 compared to $27.9 million for the three months ended September 30, 2011, a decrease of $5.0 million, or 18%. Service throughput increased 9% period over period, while plant inlet volumes were down slightly. The increase in service throughput only partly offset the impact of lower commodity prices, as NGL prices declined 36% and average natural gas prices declined 33%. NGL production declined 7%, as the higher service throughput consisted mainly of lean gas from the Woodford Shale, and our Paden plant rejected ethane throughout the period. As a result of these price declines, coupled with an increase in lower-margin lean gas, our Oklahoma segment gross margin per unit of service throughput decreased $0.25 per MMBtu to $0.80 per MMBtu for the three months ended September 30, 2012 compared to $1.05 per MMBtu for the three months ended September 30, 2011.
Rocky Mountains Segment Gross Margin. Rocky Mountains segment gross margin was $0.6 million for the three months ended September 30, 2012 compared to $0.4 million for the three months ended September 30, 2011, an increase of $0.2 million, or 50%. This increase is primarily the result of a $0.8 million payment we received from Fort Union as a cashout of accumulated pipeline imbalances, and partly offset by our inability to resell all of the demand capacity under our firm gathering agreement with Fort Union because of production declines in the area and a scheduled increase of demand capacity resulting in higher fees payable under the agreement.
Corporate and Other. Corporate and other includes our commodity risk management activities and was a loss of $3.7 million for the three months ended September 30, 2012 compared to a loss of $8.0 million for the three months ended September 30, 2011. The loss for the three months ended September 30, 2012 included $5.9 million of non-cash amortization expense relating to the option component of our commodity derivative instruments and $2.6 million of unrealized losses on commodity derivative instruments offset by $4.8 million of net cash settlements received on expired commodity derivative instruments. The loss for the three months ended September 30, 2011 included $7.4 million of non-cash amortization expense relating to the option component of our commodity derivative instruments, $2.9 million of net cash settlements paid on expired commodity derivative instruments offset by $2.3 million of unrealized gain on commodity derivative instruments.
Operations and Maintenance Expenses. Operations and maintenance expenses totaled $19.2 million for the three months ended September 30, 2012 compared to $16.1 million for the three months ended September 30, 2011. The 19% increase consisted primarily of higher payroll, utility, mowing and equipment rental expenses in Texas relating to expanded operations at our Houston Central complex and volume increases at our Saint Jo plant in Texas. In addition, we operated the Lake Charles plant for July and August of 2012, but did not operate the plant during the three months ended September 30, 2011.
51
Table of Contents
Depreciation and Amortization. Depreciation and amortization totaled $19.3 million for the three months ended September 30, 2012 compared to $16.9 million for the three months ended September 30, 2011, an increase of 14%. This increase relates primarily to additional depreciation and amortization resulting from assets placed in service after September 30, 2011, including the fractionation expansion at our Houston Central complex in November 2011, our DK pipeline extension in December 2011 and our new 200 MMcf/d cryogenic facility at our Houston Central complex in March 2012.
Impairment. We had no impairment expense for the three months ended September 30, 2012 and impairment expense of $5.0 million for the same period in 2011, as a result of a write-down to an underutilized contract for firm capacity that we resell to Rocky Mountains producers. The 2011 impairment was due to a low natural gas price environment in the region and our expectation of lower drilling activity in the Powder River Basin.
General and Administrative Expenses. General and administrative expenses totaled $13.7 million for the three months ended September 30, 2012 compared to $10.0 million for the three months ended September 30, 2011. The 37% increase consists primarily of a $1.7 million increase in non-cash amortization of the fair value of equity awards issued under our Long-Term Incentive Plan, or LTIP, and a $2.0 million increase in compensation and benefits expense, both due primarily to increased headcount.
Equity in Earnings/Loss from Unconsolidated Affiliates. Equity in earnings from unconsolidated affiliates totaled $12.6 million for the three months ended September 30, 2012 compared to a loss of $161.6 million for the three months ended September 30, 2011, an increase of $174.2 million. Equity in earnings from unconsolidated affiliates for the three months ended September 30, 2012 consisted primarily of $9.2 million from Eagle Ford Gathering, $1.0 million from Bighorn and $2.0 million from Fort Union. Equity in earnings from unconsolidated affiliates for the three months ended September 30, 2011 consisted of non-cash impairment expense of $165.0 million on our investments in Bighorn and Fort Union due to a low natural gas price environment in the region and our expectation of lower drilling activity in the Powder River Basin, partially offset by equity earnings of $2.0 million from Eagle Ford Gathering, which began limited service during the three months ended September 30, 2011. The significant increase in the equity earnings from Eagle Ford Gathering is due to its commencement of significant operations during the fourth quarter of 2011.
Gain on Sale of Operating Assets. Gain on sale of operating assets was $9.7 million for the three months ended September 30, 2012 and included the gain on the sale of our Lake Charles plant in Louisiana.
Interest and Other Financing Costs. Interest and other financing costs totaled $13.8 million for the three months ended September 30, 2012 compared to $11.1 million for the three months ended September 30, 2011, an increase of $2.7 million, or 24%. The increase consisted primarily of $3.1 million in additional interest expense relating to higher indebtedness outstanding under our revolving credit facility and senior unsecured notes. Average borrowings under our credit arrangements for the three months ended September 30, 2012 and 2011 were $1.04 billion and $863.2 million, respectively, with weighted-average interest rates of 6.9% in both periods. Please read "— Liquidity and Capital Resources — Our Indebtedness."
Nine Months Ended September 30, 2012 Compared To Nine Months Ended September 30, 2011
Texas Segment Gross Margin. Texas segment gross margin was $149.7 million for the nine months ended September 30, 2012 compared to $135.7 million for the nine months ended September 30, 2011, an increase of $14.0 million, or 10%. Gathering, processing and NGL production volumes in Texas increased 29%, 36% and 71%, respectively, for the nine months ended September 30, 2012 compared to the nine months ended September 30, 2011. Our gathering and processing volume growth was due primarily to the Eagle Ford Shale and north Barnett Shale Combo plays, and was offset by a decline in leaner gas volumes
52
Table of Contents
at the Houston Central complex, which were displaced to accommodate rich volumes. Higher NGL production reflects overall volume growth at our Saint Jo plant and a substantial increase in the NGL content of gas processed at our Houston Central complex. Also, our Lake Charles plant contributed $4.7 million to Texas segment gross margin during the nine months ended September 30, 2012 but did not operate during the same period in 2011. The positive effects of the Lake Charles plant and volume increases were offset by lower NGL prices, which on average declined 27%, and reduced operating performance at our Houston Central complex during the first four months of the period. Texas segment gross margin per unit of service throughput decreased $0.12 per MMBtu to $0.59 per MMBtu for the nine months ended September 30, 2012 compared to $0.71 per MMBtu for the nine months ended September 30, 2011, mainly due to lower NGL prices and reduced operating performance at Houston Central.
Oklahoma Segment Gross Margin. Oklahoma segment gross margin was $67.3 million for the nine months ended September 30, 2012 compared to $79.6 million for the nine months ended September 30, 2011, a decrease of $12.3 million, or 15%. The decrease in segment gross margin was primarily due to period-over-period decreases in average NGL and natural gas prices of 31% and 39%, respectively. An increase in service throughput of 14% was due primarily to lean gas volume growth from the Woodford Shale. Oklahoma segment gross margin per unit of service throughput decreased $0.27 per MMBtu to $0.77 per MMBtu for the nine months ended September 30, 2012 compared to $1.04 per MMBtu for the nine months ended September 30, 2011.
Rocky Mountains Segment Gross Margin. Rocky Mountains segment gross margin was $1.2 million for the nine months ended September 30, 2012 compared to $2.2 million for the nine months ended September 30, 2011, a decrease of $1.0 million, or 45%. This decrease is primarily the result of our inability to resell all of the demand capacity under our firm gathering agreement with Fort Union because of production declines in the area and increased demand capacity under the agreement, offset in part by a $0.8 million payment we received from Fort Union as a cashout of accumulated pipeline imbalances.
Corporate and Other. Corporate and other includes our commodity risk management activities and was a loss of $5.4 million for the nine months ended September 30, 2012 compared to a loss of $27.1 million for the nine months ended September 30, 2011. The loss for the nine months ended September 30, 2012 included $16.0 million of non-cash amortization expense relating to the option component of our commodity derivative instruments, partially offset by $8.8 million of net cash settlements received on expired commodity derivative instruments and $1.8 million of unrealized gain on our commodity derivative instruments. The loss for the nine months ended September 30, 2011 included $22.1 million of non-cash amortization expense relating to the option component of our commodity derivative instruments and $7.7 million of net cash settlements paid on expired commodity derivative instruments partially offset by $2.7 million of unrealized mark-to-market gains on our commodity derivative instruments.
Operations and Maintenance Expenses. Operations and maintenance expenses totaled $56.2 million for the nine months ended September 30, 2012 compared to $47.0 million for the nine months ended September 30, 2011. The 20% increase consisted primarily of higher payroll, utilities, compression and equipment rental expenses in Texas relating to expanded operations at our Houston Central complex and volume increases at our Saint Jo plant. In addition, we operated our Lake Charles and Harrah plants for the full nine months ended September 30, 2012 but for the same period in 2011, we incurred minimal operating expenses at the Lake Charles plant (which did not operate during the period) and six months of operating expenses at the Harrah plant (which we acquired in April 2011).
Depreciation and Amortization. Depreciation and amortization totaled $57.4 million for the nine months ended September 30, 2012 compared to $51.1 million for the nine months ended September 30, 2011, an increase of 12%. This increase relates primarily to additional depreciation and amortization resulting from assets placed in service after September 30, 2011, including expenditures relating to the fractionation expansion at our Houston Central complex in November 2011, our DK pipeline extension in
53
Table of Contents
December 2011 and our new 200 MMcf/d cryogenic facility at our Houston Central complex in March 2012.
Impairment. Impairment expense totaled $28.7 million and $5.0 million for the nine months ended September 30, 2012 and September 30, 2011, respectively, as a result of write-downs to an underutilized contract for firm capacity that we resell to Rocky Mountains producers. Both impairments were due to a low natural gas price environment in the region and our expectation of lower drilling activity in the Powder River Basin.
�� General and Administrative Expenses. General and administrative expenses totaled $38.9 million for the nine months ended September 30, 2012 compared to $34.5 million for the nine months ended September 30, 2011. The 13% increase consists primarily of a $5.4 million increase in compensation and benefits expense due mainly to increased headcount, offset by a $0.7 million decrease in expense due to the collection of a receivable previously written off as uncollectible and a $0.3 million decrease in expenses for acquisition initiatives that were not consummated.
Equity in Loss from Unconsolidated Affiliates. Equity in loss from unconsolidated affiliates totaled $89.7 million for the nine months ended September 30, 2012 compared to a loss of $158.6 million for the nine months ended September 30, 2011. Equity in loss from unconsolidated affiliates for the nine months ended September 30, 2012 consisted of a $113.9 million loss from Bighorn (including a $115 million impairment during the first quarter of 2012), partially offset by $21.1 million in earnings from Eagle Ford Gathering. Equity in loss from unconsolidated affiliates for the nine months ended September 30, 2011 consisted primarily of a non-cash impairment of $165.0 million relating to our investments in Bighorn and Fort Union due to a low natural gas price environment in the region and our expectation of lower drilling activity in the Powder River Basin, partially offset by equity earnings from our investment in Eagle Ford Gathering. The significant increase in the equity earnings from Eagle Ford Gathering is due to its commencement of significant operations during the fourth quarter of 2011.
Gain on sale of operating assets. Gain on sale of operating assets was $9.7 million for the nine months ended September 30, 2012 and included the gain on the sale of our Lake Charles plant in Louisiana.
Interest and Other Financing Costs. Interest and other financing costs totaled $42.8 million for the nine months ended September 30, 2012 compared to $34.5 million for the nine months ended September 30, 2011, an increase of $8.3 million, or 24%. The increase consisted primarily of additional interest expense relating to higher indebtedness outstanding under our revolving credit facility and senior unsecured notes, slightly offset by lower interest rates. Average borrowings under our credit arrangements for the nine months ended September 30, 2012 and 2011 were $954.6 million and $754.4 million, respectively, with average interest rates of 7.1% and 7.6%, respectively. Please read "— Liquidity and Capital Resources — Our Indebtedness."
Cash Flows
The following table summarizes our cash flows as reported in the unaudited consolidated statements of cash flows found in Item 1 of this report.
| | | | | | | |
| | Nine Months Ended
September 30, | |
|---|
| | 2012 | | 2011 | |
|---|
| | (In thousands)
| |
|---|
Net cash provided by operating activities | | $ | 123,780 | | $ | 122,789 | |
Net cash used in investing activities | | $ | (284,992 | ) | $ | (299,114 | ) |
Net cash provided by financing activities | | $ | 157,734 | | $ | 169,929 | |
54
Table of Contents
Operating Cash Flows. Net cash provided by operating activities was $123.8 million for the nine months ended September 30, 2012 compared to $122.8 million for the nine months ended September 30, 2011. The increase in cash provided by operating activities of $1.0 million was attributable to the following changes:
- •
- a $13.3 million increase in distributions received from our unconsolidated affiliates in 2012 compared to the same period in 2011;
offset by:
- •
- a $4.4 million decrease in cash flow provided by operating activities for 2012 compared with the same period in 2011;
- •
- a $4.7 million increase in interest payments in 2012 compared to the same period in 2011 as a result of increased borrowings; and
- •
- a $3.2 million increase in cash flow used for risk management activities for 2012 as compared to 2011.
Investing Cash Flows. Net cash used in investing activities was $285.0 million and $299.1 million for the nine months ended September 30, 2012 and 2011, respectively. Investing activities for the nine months ended September 30, 2012 included (i) $254.0 million of capital expenditures, consisting of $205.0 million related to our Eagle Ford Shale growth strategy and well connections attaching volumes in new areas, $22.7 million related to activities around our Saint Jo plant and $26.3 million related to our activities in Oklahoma; and (ii) $60.7 million of investments in Eagle Ford Gathering, Double Eagle Pipeline, Liberty Pipeline Group and Bighorn, offset by (i) $26.4 million of proceeds from the sales of our Lake Charles plant and other assets and (ii) $3.3 million in distributions from Liberty Pipeline Group and Bighorn in excess of equity earnings. Investing activities for the nine months ended September 30, 2011 included (i) $196.4 million of capital expenditures related to our Eagle Ford Shale growth strategy, the acquisition of the Harrah plant in Oklahoma and well connections attaching volumes in new areas (please read "— Liquidity and Capital Resources — Capital Expenditures" for additional details) and (ii) $105.1 million of investments in Eagle Ford Gathering, Liberty Pipeline Group, Webb Duval and Bighorn, offset by $2.4 million of distributions from Bighorn and Southern Dome in excess of equity earnings.
Financing Cash Flows. Net cash provided by financing activities totaled $157.7 million during the nine months ended September 30, 2012 and included (i) net proceeds from our issuance of common units of $187.7 million in January 2012, (ii) proceeds from our issuance of senior unsecured notes due 2021 of $153.4 million in February 2012, (iii) proceeds from borrowings under our revolving credit facility of $267.0 million and (iv) proceeds from the exercise of common unit options of $1.3 million, offset by (i) repayment of our revolving credit facility of $322.0 million, (ii) distributions to our unitholders of $126.1 million and (iii) deferred financing costs of $3.6 million. Net cash provided by financing activities totaled $169.9 million during the nine months ended September 30, 2011 and included (i) net borrowings under our revolving credit facility of $285.0 million, (ii) issuance of our senior unsecured notes due 2021 of $360.0 million and (iii) proceeds from the exercise of common unit options of $2.7 million offset by (i) distributions to our unitholders of $114.8 million, (ii) tender and redemption of our senior unsecured notes due 2016 of $332.6 million, (iii) bond tender and consent premiums of $14.6 million and (iv) deferred financing costs of $15.8 million.
Liquidity and Capital Resources
Sources of Liquidity. Cash generated from operations (including distributions from our unconsolidated affiliates), borrowings under our revolving credit facility and funds from equity and debt offerings are our primary sources of liquidity. Our primary cash requirements consist of normal operating expenses, capital expenditures to sustain existing operations or generate additional revenues, interest payments on
55
Table of Contents
our revolving credit facility and senior unsecured notes, distributions to our unitholders and acquisitions of new assets or businesses. We expect to fund short-term cash requirements, such as operating expenses, capital expenditures to sustain existing operations and quarterly distributions to our unitholders, primarily through operating cash flows. We expect to fund long-term cash requirements such as for expansion projects, acquisitions and risk management assets through several sources, including operating cash flows, borrowings under our revolving credit facility and issuances of additional equity and debt securities, as appropriate and subject to market conditions.
For additional discussion, please read "— Our Long-Term Growth Strategy" under Item 7 in our 2011 10-K.
Capital Expenditures. Our business is capital-intensive, requiring significant investment to maintain and upgrade existing operations. Our capital requirements have consisted primarily of, and we anticipate will continue to be:
- •
- maintenance capital expenditures, which are capital expenditures made to replace partially or fully depreciated assets to maintain the existing operating capacity of our assets and to extend their useful lives, or other capital expenditures that are incurred in maintaining existing system volumes and related cash flows; and
- •
- expansion capital expenditures, which are capital expenditures made to expand or increase the efficiency of the existing operating capacity of our assets. Expansion capital expenditures include expenditures that facilitate an increase in volumes within our operations, whether through construction or acquisition. Expenditures that reduce our operating costs will be considered expansion capital expenditures only if the reduction in operating expenses exceeds cost reductions typically resulting from routine maintenance.
During the nine months ended September 30, 2012, our capital expenditures totaled $267.8 million, consisting of $8.0 million of maintenance capital and $259.8 million of expansion capital. We used funds from operations and borrowings under our revolving credit facility to fund our capital expenditures. Our expansion capital expenditures related mainly to (i) the initial 400 MMcf/d cryogenic expansion at our Houston Central complex, (ii) the southwest extension of our DK pipeline, (iii) the southeast extension of our Saint Jo gathering system, (iv) the conversion of our Goebel pipeline to condensate service and (v) other pipeline infrastructure in Texas and Oklahoma.
For the remainder of 2012, we expect to incur approximately $100 million in additional expansion capital expenditures to complete these projects and to enhance the capabilities and capacities of our current asset base. Based on our current scope of operations, we expect to incur approximately $4 million in maintenance capital expenditures for the remainder of 2012.
Investment in Unconsolidated Affiliates. During the nine months ended September 30, 2012, our capital contributions to our unconsolidated affiliates totaled $60.7 million and consisted primarily of contributions to Eagle Ford Gathering for construction of gathering pipelines and the related crossover project, and to Double Eagle Pipeline for construction of its condensate/crude gathering system. We anticipate that we will make approximately $21 million in additional contributions to our unconsolidated affiliates for these projects in the remainder of 2012, most of which will relate to Double Eagle Pipeline.
Eagle Ford Shale Growth Strategy. We have undertaken or completed a number of expansion capital projects in Texas to accomplish our Eagle Ford Shale growth strategy. The table below provides summary descriptions of projects related to this strategy that are ongoing or were completed in the first nine months
56
Table of Contents
of 2012; please refer to the description of our Texas segment under Item 1., "Business," in our 2011 10-K for summaries of projects completed before 2012.
| | | | | | | | | | | | | |
| Eagle Ford Shale Expansion Projects |
|---|
Project | | Miles | | Diameter | | Total
Resulting
Capacity(1) | | Estimated
Capital | | Expected
In-Service Date |
|---|
| |
| | (range)
| |
| | ($ in millions)
| |
|
|---|
100%-Owned | | | | | | | | | | | | | |
Houston Central cryogenic upgrade | | | — | | — | | | 700,000 | (2)(3) | $ | 21 | | Second Quarter 2012(2) |
Houston Central 400,000 Mcf/d processing expansion | | | — | | — | | | 1,100,000 | (3) | $ | 165 | | First Quarter 2013 |
Houston Central additional cryogenic capacity | | | — | | — | | | 1,000,000 | (4) | $ | 190 | | First Half 2014 |
Goebel conversion(5) | | | 46 | | 12"-14" | | | — | (6) | $ | 17 | | Fourth Quarter 2012 |
DK pipeline southwest extension | | | 65 | | 24" | | | — | (7) | $ | 120 | | Second Quarter 2013 |
Joint Ventures | | | | | | | | | | | | | |
Double Eagle Pipeline | | | 142 | | 12"-16" | | | 100,000 | | $ | 150 | (8) | Second Quarter 2013 |
- (1)
- Natural gas capacity and volumes are presented in Mcf/d. NGL and condensate capacity and volumes are presented in Bbls/d.
- (2)
- Consists of upgrading our existing processing facility with a more efficient cryogenic tower to allow for processing of very rich natural gas from the Eagle Ford Shale.
- (3)
- Reflects the facility's overall nameplate capacity, but operating performance may be reduced to the extent that the NGL content of inlet gas exceeds the original design specifications of one or more of the facility's components.
- (4)
- Consists of installing 400,000 Mcf/d of new, more efficient cryogenic processing capacity designed to process gas with higher NGL content. Excludes capacity of our 500,000 Mcf/d lean oil processing facility based on plans to relegate the lean oil facility to providing overflow and interruptible volume services upon completion of this project.
- (5)
- We are converting our Goebel pipeline from natural gas to condensate/crude service and will lease its capacity to Double Eagle Pipeline for gathering service.
- (6)
- The Double Eagle Pipeline system and the Goebel pipeline together will provide 100,000 Bbls/d of condensate gathering capacity from the Eagle Ford Shale to the Texas Gulf Coast.
- (7)
- The DK pipeline with the southwest extension will increase the total system capacity from 195,000 Mcf/d to 350,000 Mcf/d.
- (8)
- Joint venture project costs presented are gross amounts; our share of such costs is 50%.
Cash Distributions. The amount of cash on hand needed to pay the current distribution of $0.575 per unit, or $2.30 per unit annualized, to our common unitholders is as follows (in thousands):
| | | | | | | |
| | One Quarter | | Four Quarters | |
|---|
Common units(1) | | $ | 46,087 | | $ | 184,348 | |
| | | | | | |
- (1)
- Includes distributions on restricted common units and phantom units issued under our LTIP. Distributions made on restricted units and phantom units issued to date are subject to the same vesting provisions as the restricted common units and phantom units. As of October 31, 2012, we had 43,000 outstanding restricted common units and 1,169,084 outstanding phantom units.
Outlook. Our cash flow is affected by a number of factors, some of which we cannot control. These factors include prices and demand for our services, operational risks, volatility in commodity prices or interest rates, effectiveness of our hedging program, industry and economic conditions, conditions in the financial markets, and other factors.
Recent commodity prices and financial market conditions have supported significant opportunities for volume growth from shale resource plays. Our ability to benefit from growth projects to accommodate strong drilling activity is subject to operational risks and uncertainties such as the uncertainty inherent in some of the assumptions underlying design specifications for new, modified or expanded facilities. These
57
Table of Contents
risks also impact third-party service providers and their facilities. Delays or underperformance of our facilities or such third-party facilities may adversely affect our ability to generate cash from operations and comply with our obligations, including the covenants under our debt instruments. In other cases, actual production delivered may fall below volume estimates that we relied upon in deciding to pursue an acquisition or other growth project. Drilling activity around our assets in the Powder River Basin and in areas where producers employ conventional drilling techniques has been minimal. It remains unclear when producers in these areas will undertake sustained increases in drilling activity. Our cash flow and ability to comply with our debt covenants would likewise be adversely affected if we experienced declining volumes overall in combination with unfavorable commodity prices over a sustained period.
Our historical financing strategy for funding long-term capital expenditures has been to target a roughly equal mix of debt and equity financing and a consolidated leverage ratio of 4.0 to 1.0 or less. If we exceed our target leverage ratio, as we expect we will from time to time for significant capital projects, acquisitions or other investments, we anticipate reducing leverage through growth in our cash flow or issuance of additional equity.
Our net long-term debt has increased by $95 million through September 30, 2012, mainly due to our significant capital expansion program. We expect that additional operating cash flows from these projects will reduce our leverage and enhance our ability to meet our cash requirements, including distributions to unitholders. Also, in October 2012, we reduced the debt outstanding under our revolving credit facility using the net proceeds (approximately $201 million) from our recent public offering of common units.
We believe that our cash from operations, cash on hand and our revolving credit facility will provide sufficient liquidity to meet our short-term capital requirements and to fund our committed capital expenditures for the remainder of 2012 and 2013.
Acquisitions and organic expansion have been, and our management believes will continue to be, key elements of our business strategy. In addition, we continue to consider opportunities for strategic greenfield projects. We intend to finance growth projects primarily through the issuance of debt and equity. The timing, size or success of any acquisition or expansion effort and the associated potential capital commitments are unpredictable. To consummate larger acquisitions or capital projects, we will require access to additional capital on competitive terms. Our access to capital over the longer term will depend on our future operating performance, financial condition and credit rating and, more broadly, on the availability of equity and debt financing, which will be affected by prevailing conditions in our industry, the economy and the financial markets, and other financial and business factors, many of which are beyond our control.
We purchase commodity derivatives during favorable pricing environments so that the cash from their settlements will help to offset the effects of unfavorable pricing environments in the future.
As of September 30, 2012, our aggregate outstanding indebtedness totaled $1.1 billion, and we were in compliance with the financial covenants under our senior secured revolving credit facility and our incurrence covenants under the indentures governing our senior unsecured notes.
Credit Ratings. Moody's Investors Service has assigned a Corporate Family rating of Ba3 with a negative outlook, a B1 rating for our senior unsecured notes and a Speculative Grade Liquidity rating of SGL-3. Standard & Poor's Ratings Services has assigned a Corporate Credit Rating of B+ with a stable outlook and a rating for our senior unsecured notes of B.
Factors that could materially impact our credit ratings include our leverage, liquidity, and cash distribution coverage, and the impact of our project execution and operating performance on these measures. If our credit ratings were downgraded by Moody's or further downgraded by S&P, it could increase our borrowing costs.
58
Table of Contents
Revolving Credit Facility. As of September 30, 2012, we had $330 million of indebtedness and no letters of credit outstanding under our senior secured revolving credit facility with Bank of America, N.A., which matures June 10, 2016. We have not experienced any difficulties in obtaining funding from any of our lenders, but the lack of or delay in funding by one or more members of our banking group could negatively affect our liquidity position. Future borrowings under our revolving credit facility are available for acquisitions, capital expenditures, working capital and general corporate purposes, and the facility may be drawn on and repaid without restriction so long as we are in compliance with its terms, including the financial covenants described below.
- •
- The maximum consolidated leverage ratio (total debt to Consolidated EBITDA as defined in the amended credit agreement) permitted under the agreement is 5.25 to 1.0. Subject to conditions and limitations described in the amended credit agreement, up to 15% of our Consolidated EBITDA for purposes of calculating this ratio may consist of projected EBITDA attributable to material capital projects (generally, capital projects expected to exceed $20 million) then under construction, including our net share of projected EBITDA attributable to capital projects pursued by joint ventures in which we own interests ("Material Project EBITDA"). At September 30, 2012, our consolidated leverage ratio was 4.52 to 1.0.
- •
- The maximum senior secured leverage ratio (total senior secured debt to Consolidated EBITDA as defined in the amended credit agreement) permitted under the agreement is 4.0 to 1.0. Up to 15% of our Consolidated EBITDA for purposes of calculating this ratio may consist of Material Project EBITDA. At September 30, 2012, our senior secured leverage ratio was 1.37 to 1.0.
- •
- The minimum consolidated interest coverage ratio (Consolidated EBITDA to interest as defined in the amended credit agreement) as of the end of any fiscal quarter may not be less than 2.50 to 1.00. At September 30, 2012, our consolidated interest coverage ratio was 3.70 to 1.00.
Based on our trailing four-quarter Consolidated EBITDA, as defined under the amended credit agreement, at September 30, 2012, we could borrow an additional $175.1 million before reaching our maximum leverage ratio of 5.25 to 1.0. After our repayment of indebtedness using the net proceeds from our October 2012 equity offering, we could borrow an additional $376.1 million.
Please read "— How We Evaluate Our Operations" under Item 7 in our 2011 10-K for a discussion of Consolidated EBITDA's similarity to the non-GAAP financial measures used by our management.
Senior Notes. The indentures governing our senior unsecured notes restrict our ability to pay cash distributions. Before we can pay a distribution to our unitholders, we must demonstrate that our ratio of consolidated cash flow to fixed charges (each as defined in the senior notes indentures) is at least 1.75 to 1.0. At September 30, 2012, our ratio of consolidated cash flow to fixed charges was 3.41 to 1.0.
For additional information on our indebtedness, please read Note 5, "Long-Term Debt," included in Item 1 of this report.
Off-Balance Sheet Arrangements
We had no off-balance sheet arrangements as of September 30, 2012.
Recent Accounting Pronouncements
For information on new accounting pronouncements, please read Note 2, "New Accounting Pronouncements," included in Item 1 of this report.
Critical Accounting Policies
For a discussion of our critical accounting policies for revenue recognition, impairment of long-lived assets, risk management activity and equity method of accounting for unconsolidated affiliates, which
59
Table of Contents
remain unchanged, please read "— Critical Accounting Policies and Estimates" under Item 7 in our 2011 10-K.
Item 3. Quantitative and Qualitative Disclosures about Market Risk.
Market risk is the risk of loss arising from adverse changes in market rates and prices. We are exposed to market risks, including changes in commodity prices and interest rates. We may use financial instruments such as options, swaps and other derivatives to mitigate the effects of these risks. In general, we attempt to hedge risks related to the variability of our future cash flow and profitability resulting from changes in applicable commodity prices or interest rates so that we can maintain cash flows sufficient to meet debt service, required capital expenditures, distribution objectives and similar requirements. Our risk management policy prohibits the use of derivative instruments for speculative purposes.
Commodity Price Risk
NGL and natural gas prices can be volatile and are impacted by changes in fundamental supply and demand, as well as market uncertainty and a variety of additional factors that are beyond our control. Our profitability is directly affected by prevailing commodity prices primarily as a result of: (i) processing at our processing plants or third-party processing plants under index-related pricing arrangements, (ii) purchasing and selling or gathering and transporting volumes of natural gas at index-related prices and (iii) purchasing and selling or transporting and fractionating NGLs at index-related prices. To the extent that they influence the level of drilling activity, commodity prices also affect all of our segments indirectly.
Our contract mix reflects a variety of pricing terms typical for the midstream industry, with varying levels of commodity price sensitivity, including fee-based, percent-of-proceeds, percent-of-index and keep-whole terms. Please refer to "Business — Industry Overview — Midstream Contracts" under Item 1 in our 2011 10-K for detailed descriptions of these arrangements. In addition to compensating us for gathering, transportation, processing, or fractionation services, many of our contracts also allow us to charge fees for treating, compression, dehydration, nitrogen rejection or other services. Generally:
- •
- our margins from fee-based pricing are directly related to the volumes of natural gas, condensate or NGLs that flow through our systems and are not directly affected by commodity prices;
- •
- our margins from percent-of-proceeds (including percent-of-liquids) pricing and percent-of-index pricing for lean gas that does not require processing are generally directly related to the prices for natural gas, NGLs or both; in other words, our margins increase or decrease as prices increase or decrease; and
- •
- our margins from keep-whole pricing and percent-of-index pricing involving gas that we process are related not only to natural gas and NGL prices but also to the spread between natural gas and NGL prices. As NGL prices increase relative to natural gas prices, our margins increase, and if NGL prices decrease relative to natural gas prices, our margins decrease. Our keep-whole contracts sometimes include terms that help us avoid incurring losses that would result if NGL prices fell near or below natural gas prices, such as allowing us to charge fees and reduce the volume of NGLs we recover during unfavorable pricing environments. Also, to the extent our contract entitles us to keep extracted NGLs, we may share a portion of our processing margin with the counterparty when processing margins are favorable.
In addition, some of our fee-based and percent-of-proceeds contracts include "fixed recovery" provisions, which operate in conjunction with the contract's main pricing terms. Under fixed recovery terms, we determine the amount payable, or the volumes of residue gas and NGLs deliverable, to the counterparty based on contractual NGL recovery factors. Fixed recovery terms can affect our margins to the extent that
60
Table of Contents
our actual recoveries vary from the agreed NGL recovery factor. If we exceed fixed recoveries when processing margins are favorable, our margins will benefit to the extent of the difference. However, our margins will decrease to the extent we do not meet the NGL recovery factor in a favorable processing margin environment, and we could incur losses. If NGL prices are unfavorable relative to natural gas prices, we would be able to increase our margins by reducing our recoveries.
The table below illustrates the commodity sensitivity affecting our gross margin, as a percentage of our quarterly total segment gross margin and our share of the gross margin from each of our unconsolidated affiliates. The contract types presented indicate what portion of our gross margin was generated under each of the pricing terms listed, rather than under categories of contracts. As noted above, many of our contracts use a combination of pricing terms to help reduce our commodity price risk; therefore, a single contract will likely contribute to multiple categories in the table below.
| | | | | | | | | | | | | |
Contract Pricing(1) | | Q4 2011 | | Q1 2012(5) | | Q2 2012 | | Q3 2012 | |
|---|
Fee-based | | | 48 | % | | 64 | % | | 64 | % | | 64 | % |
Percentage-of-proceeds(2) | | | 26 | % | | 23 | % | | 15 | % | | 18 | % |
Keep-whole and other(3) | | | 41 | % | | 19 | % | | 17 | % | | 22 | % |
Net hedging(4) | | | (15 | )% | | (6 | )% | | 4 | % | | (4 | )% |
- (1)
- Gross margin attributable to percent-of-index arrangements for lean gas is immaterial and has not been set forth separately.
- (2)
- Gross margin attributable to percentage-of proceeds pricing increases as commodity prices increase and vice versa.
- (3)
- Gross margin attributable to keep-whole pricing terms increases if NGL prices increase relative to natural gas prices, and decreases if NGL prices decline relative to natural gas prices. "Other" includes percent-of-index arrangements involving rich gas and the effects of variations from agreed fixed recoveries.
- (4)
- Net impact of our commodity derivative instruments to total segment gross margin.
- (5)
- Higher fee-based and lower keep-whole percentages reflect a combination of factors, primarily: growth in fee-based Eagle Ford Shale volumes; conversion of a temporary, keep-whole processing arrangement into a fee-based arrangement; and effects of losses we incurred under contracts with fixed recovery terms because of Houston Central complex operating performance. Please read "Management's Discussion and Analysis — Trends and Uncertainties."
Sensitivity. In order to calculate the sensitivity of our total segment gross margin to commodity price changes, we adjusted our operating models for actual commodity prices, plant recovery rates and volumes. We have calculated that a $0.01 per gallon change in either direction of NGL prices would have resulted in a corresponding change of approximately $0.3 million to our total segment gross margin for the nine months ended September 30, 2012. We also calculated that a $0.10 per MMBtu increase or decrease in the price of natural gas would not change our total segment gross margin for the nine months ended September 30, 2012. These relationships are not necessarily linear. When actual prices fall below the strike prices of our hedges, our sensitivity to further changes in commodity prices is reduced. However, our hedge instruments do not reduce our sensitivity to commodity prices to the extent that commodity prices remain above strike prices. Strike prices exceeded commodity prices during the first half of 2012, partially reducing our commodity price sensitivity for the period.
Commodity Hedges. As of September 30, 2012, our commodity hedge portfolio totaled $23.4 million. For additional information, please read Note 11, "Financial Instruments," included in Item 1 of this report.
| | | | | | | |
| | Call | |
|---|
| | Strike
(Per MMBtu) | | Volumes
(MMBtu/d) | |
|---|
Houston Ship Channel Index Purchased Natural Gas Options | | | | | | | |
2013 | | $ | 3.4000 | | | 2,787 | |
61
Table of Contents
| | | | | | | | | | | | | |
| | Put | | Swap | |
|---|
| | Strike
(Per gallon) | | Volumes
(Bbls/d) | | Strike
(Per gallon) | | Volumes
(Bbls/d) | |
|---|
Mont Belvieu Purity Ethane | | | | | | | | | | | | | |
2012(2) | | $ | 0.3563 | | | 1,900 | | $ | — | | | — | |
2013 | | $ | — | | | — | | $ | 0.3660 | | | 1,000 | |
Mont Belvieu TET Propane | | | | | | | | | | | | | |
2012(1) | | $ | 1.3200 | | | 400 | | $ | — | | | — | |
2012(1) | | $ | 1.3200 | | | (400 | ) | $ | — | | | — | |
2012 | | $ | 1.0700 | | | 600 | | $ | — | | | — | |
2012(2) | | $ | 1.0700 | | | (600 | ) | $ | — | | | — | |
2012 | | $ | 1.1700 | | | 600 | | $ | — | | | — | |
2012(2) | | $ | 1.1700 | | | (600 | ) | $ | — | | | — | |
2012(2) | | $ | 0.9700 | | | 1,900 | | | — | | | — | |
2013 | | $ | 1.2400 | | | 600 | | $ | — | | | — | |
2013 | | $ | 1.2750 | | | 350 | | $ | — | | | — | |
2013 | | $ | 1.2200 | | | 300 | | $ | — | | | — | |
2013 | | $ | 1.2800 | | | 300 | | $ | — | | | — | |
2013 | | $ | 1.3300 | | | 250 | | $ | — | | | — | |
Mont Belvieu Non-TET Isobutane | | | | | | | | | | | | | |
2012 | | $ | 1.3900 | | | 165 | | $ | — | | | — | |
2012(1) | | $ | 1.3900 | | | 285 | | $ | — | | | — | |
2012(1) | | $ | 1.3900 | | | (150 | ) | $ | — | | | — | |
2013 | | $ | 1.6000 | | | 200 | | $ | — | | | — | |
2013 | | $ | 1.6800 | | | 100 | | $ | — | | | — | |
2013 | | $ | 1.9000 | | | 50 | | $ | — | | | — | |
Mont Belvieu Non-TET Normal Butane | | | | | | | | | | | | | |
2012 | | $ | 1.3500 | | | 250 | | $ | — | | | — | |
2012 | | $ | 1.3600 | | | 125 | | $ | — | | | — | |
2012(1) | | $ | 1.3600 | | | 225 | | $ | — | | | — | |
2012(1) | | $ | 1.3600 | | | (225 | ) | $ | — | | | — | |
2012(1) | | $ | 1.4600 | | | 150 | | $ | — | | | — | |
2013 | | $ | 1.5800 | | | 300 | | $ | — | | | — | |
2013 | | $ | 1.6500 | | | 100 | | $ | — | �� | | — | |
2013 | | $ | 1.8000 | | | 100 | | $ | — | | | — | |
WTI Crude Oil | | | | | | | | | | | | | |
2012(1) | | $ | 79.00 | | | 300 | | $ | — | | | — | |
2012 | | $ | 83.00 | | | 500 | | $ | — | | | — | |
2012(1) | | $ | 83.00 | | | 150 | | $ | — | | | — | |
2012 | | $ | 85.00 | | | 350 | | $ | — | | | — | |
2012 | | $ | 90.00 | | | 200 | | $ | — | | | — | |
2013 | | $ | 90.00 | | | 400 | | $ | — | | | — | |
2013 | | $ | 99.00 | | | 350 | | $ | — | | | — | |
2013 | | $ | 95.00 | | | 100 | | $ | — | | | — | |
2013(1) | | $ | 95.00 | | | 250 | | $ | — | | | — | |
2013 | | $ | 91.00 | | | 300 | | $ | — | | | — | |
2014 | | $ | 90.00 | | | 500 | | $ | — | | | — | |
- (1)
- Instrument not designated as a cash flow hedge under hedge accounting.
- (2)
- Instrument was executed in October 2012.
62
Table of Contents
Interest Rate Swaps. As of September 30, 2012, the fair value of our interest rate swaps liability totaled $0.9 million. For additional information on our interest rate swaps, please read Note 11, "Financial Instruments," included in Item 1 of the report.
Counterparty Risk
We are diligent in attempting to ensure that we provide credit only to credit-worthy customers. However, our purchases of natural gas and sales of the residue gas and NGLs expose us to significant credit risk, as our margin on any sale is generally a very small percentage of the total sale price. Therefore, a credit loss could be very large relative to our overall profitability. For the nine months ended September 30, 2012, Dow Hydrocarbon and Resources LLC, (17%), ONEOK Hydrocarbons, L.P. (13%), Formosa Hydrocarbons Company, Inc. (10%), Enterprise Products Operating, L.P. (8%) and ONEOK Energy Services, L.P. (7%) collectively accounted for approximately 55% of our revenue. As of September 30, 2012, all of these companies or their respective parent companies were rated investment grade by Moody's Investors Service and Standard & Poor's Ratings Services, except for Formosa Hydrocarbons Company. Formosa Hydrocarbons Company's parent, Formosa Plastics Corporation, U.S.A., is affiliated with the Taiwan-based Formosa Plastics Group, which is rated investment grade by Standard & Poor's Ratings Services. Companies accounting for another approximately 32% of our revenue have an investment grade parent, are themselves investment grade, have provided us with credit support in the form of a letter of credit issued by an investment grade financial institution or have provided prepayment for our services.
We also diligently review the creditworthiness of other counterparties to which we may have credit exposure, including hedge counterparties. Our risk management policy requires that we review and report the credit ratings of our hedging counterparties on a monthly basis. As of September 30, 2012, the value of our commodity net hedge positions by significant counterparty consisted of assets with JP Morgan (19%), Barclays Bank PLC (15%), Wells Fargo (12%), Goldman Sachs (11%), Credit Suisse (9%), Bank of America (9%), BBVA (6%) and Scotia Bank (5%). As of September 30, 2012, all of our counterparties were rated Baa3 and BBB+ or better by Moody's Investors Service and Standard & Poor's Ratings Services, respectively. Our hedge counterparties have not posted collateral to secure their obligations to us.
We have historically experienced minimal collection issues with our counterparties; however, nonpayment or nonperformance by one or more significant counterparties could adversely impact our liquidity.
Item 4. Controls and Procedures.
As required by Rule 13a-15(b) of the Exchange Act, we have evaluated, under the direction of our Chief Executive Officer and Chief Financial Officer, the effectiveness of the design and operation of our disclosure controls and procedures (as defined in Rules 13a-15(f) and 15d-15(f) under the Exchange Act) as of the end of the period covered by this report. Our disclosure controls and procedures are designed to provide reasonable assurance that the information required to be disclosed by us in reports that we file under the Exchange Act is accumulated and communicated to our management, including our Chief Executive Officer and Chief Financial Officer, as appropriate, to allow timely decisions regarding required disclosure and is recorded, processed, summarized and reported within the time periods specified in the rules and forms of the SEC. Based upon the evaluation, our Chief Executive Officer and Chief Financial Officer have concluded that our disclosure controls and procedures were effective at September 30, 2012 at the reasonable assurance level.
There has been no change in our internal controls over financial reporting (as defined in Rule 13a-15(f) under the Exchange Act) that occurred during the quarter ended September 30, 2012 that has materially affected or is reasonably likely to materially affect such internal controls over financial reporting.
63
Table of Contents
PART II — OTHER INFORMATION
Item 1. Legal Proceedings.
Please read Note 11, "Commitments and Contingencies," included in Part II, Item 8 in our 2011 10-K. There have been no material updates to the legal proceedings reported in our 2011 10-K.
Item 1A. Risk Factors.
In addition to the factors discussed below and elsewhere in this report, including the financial statements and related notes, you should consider carefully the risks and uncertainties described under Item 1A, "Risk Factors," in our 2011 10-K and under Part II, Item 1A of our 10-Q for the quarter ended March 31, 2012. These risks and uncertainties could materially adversely affect our business, financial condition and results of operations. If any of these risks or uncertainties were to occur, our business, financial condition or results of operation could be materially adversely affected.
We may not have sufficient cash after establishment of cash reserves to pay cash distributions at the current level.
We may not have sufficient cash each quarter to pay distributions at the current level. Under our limited liability company agreement, we set aside any cash reserve necessary for the conduct of our business before making a distribution to our unitholders. The amount of cash we have available for distribution is more a function of our cash flow than of our net income, which will be affected by non-cash items. As a result, we may make cash distributions during periods when we record losses and may not make cash distributions during periods when we record net income.
The amount of cash we can distribute principally depends upon the cash we generate from operations, which will fluctuate from quarter to quarter based on, among other things:
- •
- the amount of natural gas gathered and transported on our pipelines;
- •
- the volume and NGL content of natural gas we process, and the volume of NGLs we fractionate;
- •
- the fees we charge and the margins we realize for our services;
- •
- the fees we pay to third parties for their services;
- •
- the prices of natural gas, NGLs, condensate and crude oil;
- •
- the relationship between natural gas and NGL prices;
- •
- the relationship between Mont Belvieu and Conway NGL prices;
- •
- the operational performance and efficiency of our assets, including our plants and equipment;
- •
- the operational performance and efficiency of third-party processing, fractionation or other facilities that provide services to us
- •
- the level of our operating costs and the impact of inflation on those costs; and
- •
- the weather in our operating areas.
In addition, the actual amount of cash we will have available for distribution will depend on other factors, including:
- •
- the amount of capital we spend on projects, the profitability of such projects and the timing of the associated cash flow;
- •
- the cost of any acquisitions we make;
- •
- the effectiveness of our hedging program;
64
Table of Contents
- •
- the creditworthiness of our hedging, commercial and other contract counterparties;
- •
- the timing (quarterly or annual) of our producers' obligations to make volume deficiency payments to us;
- •
- performance by producers, customers and third-party service providers under their contracts with us;
- •
- our ability to borrow money and access capital markets on acceptable terms;
- •
- our debt service requirements;
- •
- fluctuations in our working capital needs;
- •
- restrictions on distributions imposed by our revolving credit facility and the indentures governing our senior unsecured notes;
- •
- restrictions on distributions by entities in which we own interests;
- •
- the amount of cash reserves established by our Board of Directors for the proper conduct of our business; and
- •
- prevailing economic conditions.
Some of the factors described above are beyond our control. If we decrease distributions, the market price for our units may be adversely affected.
Constructing new assets subjects us to risks of project delays, cost overruns and lower- or higher-than-anticipated volumes of natural gas, NGLs or condensate once a project is completed. Our operating cash flows from our capital projects may not be immediate or meet our expectations.
One of the ways we grow our business is by constructing additions or modifications to our existing facilities. We also construct new facilities, either near our existing operations or in new areas. We may be unable to complete construction projects on schedule, at the budgeted cost, or at all, which could have a material adverse effect on our business and results of operations. Construction projects require significant amounts of capital and involve numerous regulatory, environmental, political, legal, operational and geological uncertainties, many of which are beyond our control. These projects also involve numerous economic uncertainties, including the impact of inflation on project costs and the availability of required resources. For example, our ongoing projects include the installation of a 400 MMcf/d cryogenic processing facility at our Houston Central complex scheduled to be completed in 2014. We are unable to begin construction of this facility until we receive a permit from the Environmental Protection Agency, or EPA. Although we anticipate receiving the permit by mid-2013, the timing of the permit's issuance is out of our control. Our ability to fully benefit from our Eagle Ford Shale strategy is dependent on the timely completion of this facility.
Construction expenditures may occur over an extended period of time, yet we will not receive any material increases in cash flow until the project is completed and fully operational. Moreover, our cash flow from a project may be delayed or may not meet our expectations. Project specifications and expectations regarding cost, timing, asset performance, investment returns and other matters usually rely in part on the expertise of third parties such as producers whose gas we gather, engineers, technical experts and construction contractors. These estimates may prove to be inaccurate because of numerous operational, technological, geologic, economic and other uncertainties.
Estimates from producers regarding the timing, volume and composition of anticipated oil, gas or condensate production are subject to numerous uncertainties beyond our control and may prove to be inaccurate. When the composition of actual production differs significantly from estimates on which we rely to determine the capacity and operating specifications of new facilities, newly constructed, modified or
65
Table of Contents
expanded facilities may be unable to perform at the levels we expect. For the first four months of 2012, our operating results were negatively impacted by reduced operating performance of and intermittent downtime for repairs to a new cryogenic processing facility at our Houston Central complex, partly due to Eagle Ford Shale gas with higher-than-expected NGL content. Conversely, actual production delivered may fall below volume estimates on which we relied. In either case, we may be unable to achieve our expected cash flow and investment returns. Please read "Management's Discussion and Analysis — Trends and Uncertainties — Outlook."
We also construct assets in reliance on firm capacity commitments for third-party processing or fractionation downstream of our facilities. For example, we made processing commitments at our Houston Central complex and constructed the Liberty NGL pipeline through our joint venture with Energy Transfer in reliance on Formosa's capacity commitment to us, which requires Formosa to expand its facilities. If Formosa is unable to meet its commitment to us, or if other third-party facilities underperform or are not available when we expect them, our cash flows and results of operations would be adversely affected.
Item 6. Exhibits.
Exhibits not incorporated by reference to a prior filing are designated by an asterisk (*) or double asterisk (**) and are filed or furnished herewith; all exhibits not so designated are incorporated herein by reference to a prior filing as indicated.
| | | |
| Number | | Description |
|---|
| | 3.1 | | Certificate of Formation of Copano Energy Holdings, L.L.C. (now Copano Energy, L.L.C.) (incorporated by reference to Exhibit 3.1 to Registration Statement on Form S-1 filed July 30, 2004). |
|
3.2 |
|
Certificate of Amendment to Certificate of Formation of Copano Energy Holdings, L.L.C. (now Copano Energy, L.L.C.) (incorporated by reference to Exhibit 3.2 to Registration Statement on Form S-1 filed July 30, 2004). |
|
3.3 |
|
Fourth Amended and Restated Limited Liability Company Agreement of Copano Energy, L.L.C. (incorporated by reference to Exhibit 3.1 to Current Report on Form 8-K filed July 21, 2010). |
|
3.4 |
|
Amendment No. 1 to Fourth Amended and Restated Limited Liability Company Agreement of Copano Energy, L.L.C. (incorporated by reference to Exhibit 3.1 to Current Report on Form 8-K filed July 22, 2010). |
|
4.1 |
|
Indenture, dated as of February 7, 2006, among Copano Energy, L.L.C., Copano Energy Finance Corporation, the Guarantors party thereto and U.S. Bank National Association, as trustee (incorporated by reference to Exhibit 4.1 to Current Report on Form 8-K filed February 8, 2006). |
|
4.2 |
|
Indenture, dated May 16, 2008, among Copano Energy, L.L.C., Copano Energy Finance Corporation, the Subsidiary Guarantors named therein and U.S. Bank National Association, as trustee (incorporated by reference to Exhibit 4.1 to Current Report on Form 8-K filed May 19, 2008). |
|
4.3 |
|
Form of Global Note representing 7.75% Senior Notes due 2018 (included in 144A/Regulation S Appendix to Exhibit 4.1 above). |
|
4.4 |
|
Registration Rights Agreement, dated July 21, 2010, by and between Copano Energy, L.L.C. and TPG Copenhagen, L.P. (incorporated by reference to Exhibit 4.1 to Current Report on Form 8-K filed July 22, 2010). |
66
Table of Contents
| | | |
| Number | | Description |
|---|
| | 4.5 | | Fourth Supplemental Indenture, dated April 5, 2011, to the Indenture, dated February 7, 2006, by and among Copano Energy, L.L.C., Copano Energy Finance Corporation, the Guarantors name therein and U.S. Bank National Association, as trustee (incorporated by reference to Exhibit 4.1 to Current Report on Form 8-K filed April 5, 2011). |
|
4.6 |
|
Indenture, dated April 5, 2011, by and among Copano Energy, L.L.C., Copano Energy Finance Corporation, the Guarantors named therein and U.S. Bank National Association, as Trustee (incorporated by reference to Exhibit 4.2 to Current Report on Form 8-K filed April 5, 2011). |
|
4.7 |
|
First Supplemental Indenture, dated April 5, 2011, to the Indenture, dated April 5, 2011, by and among Copano Energy, L.L.C., Copano Energy Finance Corporation, the Guarantors named therein and U.S. Bank National Association, as Trustee (incorporated by reference to Exhibit 4.3 to Current Report on Form 8-K filed April 5, 2011). |
|
4.8 |
|
Form of Global Note representing 7.125% Senior Notes due 2021 (included in Exhibit A to Exhibit 4.5 above). |
|
10.1 |
|
Second Amended and Restated Long-Term Incentive Plan (incorporated by reference to Exhibit 99.1 to the Current Report on Form 8-K filed September 5, 2012). |
|
10.2* |
|
Employment Agreement between CPNO Services, L.P. and Bryan W. Neskora dated July 16, 2012. |
|
31.1* |
|
Sarbanes-Oxley Section 302 certification of Principal Executive Officer. |
|
31.2* |
|
Sarbanes-Oxley Section 302 certification of Principal Financial Officer. |
|
32.1** |
|
Sarbanes-Oxley Section 906 certification of Principal Executive Officer. |
|
32.2** |
|
Sarbanes-Oxley Section 906 certification of Principal Financial Officer. |
|
101.CAL** |
|
XBRL Calculation Linkbase Document. |
|
101.DEF** |
|
XBRL Definition Linkbase Document. |
|
101.INS** |
|
XBRL Instance Document. |
|
101.LAB** |
|
XBRL Labels Linkbase Document. |
|
101.PRE** |
|
XBRL Presentation Linkbase Document. |
|
101.SCH** |
|
XBRL Schema Document. |
- *
- Filed herewith.
- **
- Furnished herewith.
67
Table of Contents
SIGNATURES
Pursuant to the requirements of the Securities Exchange Act of 1934, the registrant has duly caused this report to be signed on its behalf by the undersigned, thereunto duly authorized, in the City of Houston, State of Texas, on November 8, 2012.
| | | | |
| | | Copano Energy, L.L.C. |
|
|
By: |
|
/s/ R. BRUCE NORTHCUTT
R. Bruce Northcutt
President and Chief Executive Officer
(Principal Executive Officer) |
|
|
By: |
|
/s/ CARL A. LUNA
Carl A. Luna
Senior Vice President and Chief Financial Officer
(Principal Financial Officer) |
68