Use these links to rapidly review the document
TABLE OF CONTENTS
COPANO ENERGY, L.L.C. INDEX TO FINANCIAL STATEMENTS
Table of Contents
UNITED STATES SECURITIES AND EXCHANGE COMMISSION
Washington, D.C. 20549
Form 10-K
| | |
| ý | | ANNUAL REPORT PURSUANT TO SECTION 13 OR 15(D) OF THE SECURITIES EXCHANGE ACT OF 1934 |
|
|
FOR THE FISCAL YEAR ENDED DECEMBER 31, 2012 |
OR |
o |
|
TRANSITION REPORT PURSUANT TO SECTION 13 OR 15(D) OF THE SECURITIES EXCHANGE ACT OF 1934 |
|
|
FOR THE TRANSITION PERIOD FROM TO
|
Commission file number: 001-32329
COPANO ENERGY, L.L.C.
(Exact name of registrant as specified in its charter)
| | |
Delaware
(State or other jurisdiction of
incorporation or organization) | | 51-0411678
(I.R.S. Employer
Identification No.) |
1200 Smith Street, Suite 2300
Houston, Texas 77002
(Address of principal executive offices) |
|
(713) 621-9547
(Registrant's telephone number, including area code) |
SECURITIES REGISTERED PURSUANT TO SECTION 12(b) OF THE ACT:
| | |
| Title of Each Class | | Name of Exchange on which Registered |
|---|
Common Units Representing Limited
Liability Company Interests | | The NASDAQ Global Select Market |
SECURITIES REGISTERED PURSUANT TO SECTION 12(g) OF THE ACT: None
Indicate by check mark if the registrant is a well-known seasoned issuer, as defined in Rule 405 of the Securities Act. Yes ý No o
Indicate by check mark if the registrant is not required to file reports pursuant to Section 13 or Section 15(d) of the Act. Yes o No ý
Indicate by check mark whether the registrant (1) has filed all reports required to be filed by Section 13 or 15(d) of the Securities Exchange Act of 1934 during the preceding 12 months (or for such shorter period that the registrant was required to file such reports), and (2) has been subject to such filing requirements for the past 90 days. Yes ý No o
Indicate by check mark whether the registrant has submitted electronically and posted on its corporate Web site, if any, every Interactive Data File required to be submitted and posted pursuant to Rule 405 of Regulation S-T (§ 232.405 of this chapter) during the preceding 12 months (or for such shorter period that the registrant was required to submit and post such files). Yes ý No o
Indicate by check mark if disclosure of delinquent filers pursuant to Item 405 of Regulation S-K (§229.405 of this chapter) is not contained herein, and will not be contained, to the best of registrant's knowledge, in definitive proxy or information statements incorporated by reference in Part III of this Form 10-K or any amendment to this Form 10-K. ý
Indicate by check mark whether the registrant is a large accelerated filer, an accelerated filer, a non-accelerated filer, or a smaller reporting company. See definitions of "large accelerated filer," "accelerated filer" and "smaller reporting company" in Rule 12b-2 of the Exchange Act.
| | | | | | |
| Large accelerated filer ý | | Accelerated filer o | | Non-accelerated filer o
(Do not check if a
smaller reporting company) | | Smaller reporting company o |
Indicate by check mark whether the registrant is a shell company (as defined in Rule 12b-2 of the Exchange Act). Yes o No ý
As of June 29, 2012, the aggregate market value of our voting and non-voting common equity held by non-affiliates of the registrant was approximately $2.0 billion based on $27.80 per common unit, the closing price of our common units as reported on The NASDAQ Global Select Market.
As of February 20, 2013, 78,994,980 of our common units were outstanding.
DOCUMENTS INCORPORATED BY REFERENCE:
| | |
Document | | Parts Into Which Incorporated |
|---|
Portions of our definitive proxy statement for the 2013 Annual Meeting of Unitholders or, in the event we do not file such proxy statement, such information shall be filed as an amendment to this Form 10-K no later than April 30, 2013. | | Part III |
Table of Contents
TABLE OF CONTENTS
Table of Contents
PART I
Unless the context requires otherwise, references to "Copano," "we," "our," "us" or like terms refer to Copano Energy, L.L.C., its subsidiaries and entities it manages or operates.
As used generally in the energy industry and in this report, the following terms have the meanings indicated below. Please read the subsection of Item 1 captioned "— Industry Overview" for a discussion of the midstream natural gas industry.
| | |
| /d: | | Per day |
| $/gal: | | U.S. dollars per gallon |
| Bbls: | | Barrels |
| Bcf: | | One billion cubic feet |
| Btu: | | One British thermal unit |
| GPM: | | Gallons per minute |
| Lean gas: | | Natural gas that is low in NGL content |
| MMBtu: | | One million British thermal units |
| Mcf: | | One thousand cubic feet |
| MMcf: | | One million cubic feet |
| NGLs: | | Natural gas liquids, which consist primarily of ethane, propane, isobutane, normal butane, natural gasoline and stabilized condensate |
| Residue gas: | | The pipeline quality natural gas remaining after natural gas is processed |
| Rich gas: | | Natural gas that is high in NGL content |
| Tcf: | | One trillion cubic feet |
| Throughput: | | The volume of natural gas or NGLs transported or passing through a pipeline, plant, terminal or other facility |
Item 1. Business
The following discussion of our business segments provides information regarding our principal processing plants, pipelines and other assets. For a discussion of our results of operations, please read Item 7., "Management's Discussion and Analysis of Financial Condition and Results of Operations."
General
We are an energy company engaged in the business of providing midstream services to natural gas producers, including gathering, transportation and processing of natural gas, fractionation and transportation of NGLs and other related services. Our assets are located in Texas, Oklahoma and Wyoming and include approximately 6,900 miles of active natural gas gathering and transmission pipelines and nine natural gas processing plants with over one Bcf/d of combined processing capacity. In addition to our natural gas pipelines, we operate 385 miles of NGL pipelines.
We were formed in August 2001 as a Delaware limited liability company to acquire entities operating under the Copano name since 1992, and to serve as a holding company for our operating subsidiaries. Since our inception in 1992, we have grown through strategic and bolt-on acquisitions and organic growth projects. Our common units are listed on the NASDAQ Global Select Market (NASDAQ") under the symbol "CPNO."
Recent Developments
Merger Agreement with Kinder Morgan. On January 29, 2013, we announced a definitive merger agreement with Kinder Morgan Energy Partners, L.P. ("Kinder Morgan"), under which Kinder Morgan
1
Table of Contents
will acquire all of Copano's outstanding equity in a unit-for-unit transaction with an exchange ratio of 0.4563 Kinder Morgan units per Copano unit. The transaction is valued at approximately $5 billion (including the assumption of debt) based on the closing price for Kinder Morgan's units on January 29, 2013. Our board of directors and Kinder Morgan's board of directors have approved the merger agreement, and we have agreed to submit the merger agreement to a vote of our unitholders and to recommend that unitholders approve the merger agreement. TPG Copenhagen, L.P. ("TPG"), an affiliate of TPG Capital, L.P. and our largest unitholder (owning over 14% of our outstanding equity), has agreed to vote all of its Series A convertible preferred units (and common units, if any) in favor of adoption of the merger agreement.
At the effective time of the merger, each of our common units outstanding or deemed outstanding as of immediately prior to the effective time will be converted into the right to receive 0.4563 Kinder Morgan common units (the "Merger Consideration"). All grants then outstanding under our Long-Term Incentive Plan, or LTIP, will vest, outstanding options and unit appreciation rights will be deemed net exercised, and all resulting common units will convert into the right to receive the Merger Consideration. The merger agreement includes customary representations, warranties and covenants, and specific agreements relating to the conduct of our business and Kinder Morgan's business between the date of the signing of the merger agreement and the closing of the merger, and the efforts of the parties to cause the merger transactions to be completed. In addition to certain other covenants, we have agreed not to encourage, solicit, initiate or facilitate any takeover proposal from a third party or enter into any agreement, arrangement or understanding requiring us to abandon, terminate or fail to consummate the merger and related transactions.
Completion of the merger is subject to satisfaction or waiver of certain closing conditions including, among others, customary regulatory approvals (including under the Hart-Scott Rodino Antitrust Improvements Act of 1976, as amended), approval by our unitholders and registration of the Merger Consideration under the securities laws. The merger agreement contains certain termination rights for both us and Kinder Morgan and further provides that, upon termination of the merger agreement, under certain circumstances, we may be required to pay Kinder Morgan a termination fee equal to $115 million, and under certain other circumstances, Kinder Morgan may be required to pay us a termination fee equal to $75 million.
Under the terms of the merger agreement, we have agreed to conduct our business in the ordinary course and in all material respects in substantially the same manner as conducted prior to the date of the merger agreement, subject to certain conditions and restrictions including, but not limited to, restrictions on our ability to (i) commit to new capital expenditures, (ii) acquire, invest in, or dispose of any material properties, assets, or equity interests as defined in the merger agreement, (iii) incur new debt, refinance, or guarantee debt or borrowed money, (iv) enter into, terminate, or amend certain material contracts and (v) issue, grant, sell, or redeem our common units or pay distributions in excess of $0.575 per common unit.
We expect the proposed transaction to close in the third quarter of 2013. Additional information regarding the proposed transaction and the terms and conditions of the merger agreement and voting agreement is set forth in our Current Report on Form 8-K filed on February 4, 2013.
DK Loop Expansion Project. Our Board has approved a project to loop approximately 65 miles of our DK pipeline from DeWitt County to our Houston Central complex, along the same path as our existing DK pipeline. The project is expected to begin service in the fourth quarter of 2013 and is projected to cost approximately $100 million. The addition of the loop line creates a fuel reduction by reallocation of compression and provides hydraulic pipeline capacity to serve the processing plant expansions at our Houston Central Complex. The project is supported by long-term, fee-based capacity commitments.
Declaration of Distribution. On January 10, 2013, our Board of Directors declared a cash distribution for the three months ended December 31, 2012 of $0.575 per common unit. The distribution, totaling $46.1 million, was paid on February 14, 2013 to all common unitholders of record at the close of business on January 31, 2013.
2
Table of Contents
Business Strategy
Our management team is committed to our mission of building a more diversified energy midstream company with scale, stability of cash flows, above-average returns on invested capital and providing secure and growing distributions to our unitholders. Key elements of our strategy include:
- •
- Executing on organic growth opportunities and bolt-on acquisitions. We pursue capital projects and complementary acquisitions that we believe will enhance our ability to increase cash flows from our existing assets by capitalizing on our existing infrastructure, personnel and customer relationships. For example, we have completed significant expansions of our Texas assets to capitalize on activity in the Eagle Ford Shale and the North Barnett Shale Combo plays, and we are installing 800 MMcf/d of cryogenic processing capacity at our Houston Central Complex in two phases and extending our DK pipeline further into the Eagle Ford Shale. We are also capitalizing on our existing assets to meet continued demand from Eagle Ford Shale producers through our Double Eagle Pipeline crude oil/condensate joint venture. In addition, we have extended one of our Oklahoma gathering systems into the Mississippi Lime play and have interconnected our Stroud system to serve production from the play. Where our pipelines and processing or fractionation facilities have excess capacity, we have opportunities to increase throughput volume and cash flow with minimal incremental costs. We seek to increase volumes and utilization of capacity by aggressively marketing our services to producers to connect new supplies of natural gas.
- •
- Reducing sensitivity to commodity prices. The volatility of natural gas and NGL prices is a key consideration as we enter into new contracts and review opportunities for growth. Our goal is to position ourselves to achieve stable cash flows in a variety of market conditions. Generally, we pursue contracts under which the compensation for our services is not directly dependent on commodity prices. For example, we have focused on replacing commodity-sensitive contracts with fee-based contracts in executing our strategy to increase volumes from the Eagle Ford Shale, the north Barnett Shale Combo play and the Woodford Shale, increasing our percentage of fee-based gross margin from 48% for the fourth quarter of 2011 to 63% for the fourth quarter of 2012. For a reconciliation of total segment gross margin to operating income, please read Item 7., "Management's Discussion and Analysis of Financial Condition and Results of Operations-How We Evaluate Our Operations." In addition, we pursue opportunities to increase the fee-based component of our contract portfolio through acquisitions or other growth projects. To the extent that our contracts are commodity sensitive, we use derivative instruments to hedge portions of our exposure to commodity price risk. We have established a product-specific, option-focused portfolio designed to allow us to meet our debt service, maintenance capital expenditure and similar requirements, along with our distribution objectives, despite fluctuations in commodity prices.
- •
- Expanding through greenfield opportunities and strategic acquisitions. We pursue greenfield projects that leverage our strengths through alignment with producers and downstream customers. We also pursue potential acquisitions in new regions that we believe will enhance the scale and diversity of our assets or otherwise offer cash flow and operational growth opportunities that are attractive to us.
- •
- Pursuing profitable growth. We believe that a disciplined approach in selecting new projects enables us to choose opportunities that deliver value for our company and our unitholders. In analyzing a particular acquisition, expansion, or greenfield project, we consider the operational, financial and strategic benefits of the transaction. Our analysis includes location of the assets or projects, strategic fit in relation to our existing business, expertise and management personnel required, capital required to integrate and maintain the assets involved, and the surrounding competitive environment. From a financial perspective, we analyze the rate of return the assets are expected to generate relative to our cost of capital under various volume and commodity price scenarios, comparative market parameters and the anticipated earnings and cash flow capabilities of the assets.
3
Table of Contents
- •
- Developing and exploiting flexibility in our operations. Flexibility is a fundamental consideration underlying our approach to developing, expanding or acquiring assets. We can modify the operation of our assets to maximize our cash flows. For example, we can operate several of our processing plants in ethane-rejection mode as commodity price environments or operating conditions warrant. In 2012, we continued our focus on developing our ability to offer Eagle Ford Shale producers access to multiple natural gas and NGL markets. Multiple residue markets are available at the tailgate of our Houston Central complex, and in 2011 and 2012, we secured alternatives for NGL handling through initiatives such as our Liberty pipeline project and our execution of third-party fractionation or purchase arrangements for NGLs or purity products, including agreements with petrochemical customers along the Texas Gulf Coast.
- •
- Maintaining a strong balance sheet and access to liquidity. We are committed to pursuing growth in a way that allows us to maintain the strength of our balance sheet and a liquidity position that allows us to execute our business strategy in various commodity price environments. For example, we financed a substantial portion of our initial Eagle Ford Shale capital expenditures though a private placement of preferred equity with TPG, which included a paid-in-kind distribution feature that allowed us the flexibility to maintain a strong balance sheet and liquidity position during construction and expansion of our assets and prior to generating cash flow from these projects. Other recent transactions through which we increased our liquidity included public equity offerings in January and October 2012 and a public debt offering in February 2012.
- •
- Maintaining an approach to business founded on a culture of integrity, safety, service and creativity. We believe that the dedication of our employees is a critical component of our success. We seek to maintain a company culture that fosters integrity, is committed to safety and environmental compliance, and encourages innovation and teamwork, which we believe will allow us to attract and retain high quality employees and deliver the superior service required to establish and maintain valued long-term commercial relationships.
As previously discussed, in January 2013 we announced a definitive merger agreement with Kinder Morgan. Under the merger agreement, we are subject to certain restrictions on the conduct of our business prior to completing the transaction, which may adversely affect our ability to execute certain of our business strategies without first obtaining consent from Kinder Morgan, including our ability in certain cases to enter into contracts, incur capital expenditures or grow our business.
Our Operations
Through our subsidiaries and equity investments, we own and operate natural gas gathering and intrastate transportation pipeline assets, natural gas processing and fractionation facilities and NGL pipelines. Our natural gas pipelines gather natural gas from wellheads or designated points near producing wells. We treat and process natural gas as needed to remove contaminants and extract mixed NGLs and deliver the resulting residue gas to third-party pipelines, local distribution companies, power generation facilities and industrial customers. We sell extracted NGLs as a mixture or as fractionated purity products and deliver them through our pipeline interconnects and truck loading facilities. We process natural gas from our own gathering systems and from third-party pipelines, and in some cases we deliver natural gas and mixed NGLs to other third parties who provide us with transportation, processing or fractionation services.
Our Operating Segments
We manage our business, analyze, and report our results of operations on a segment basis. Our operations are divided into three operating segments: Texas, Oklahoma, and Rocky Mountains.
4
Table of Contents
Operating Segments
| | | | | | | | | | | | | | | |
| |
| |
| |
| | Year Ended
December 31, 2012 | |
|---|
Segment | | Assets | | Pipeline Miles(1)/
Number of
Processing Plants | | Plant Inlet
Capacity(2) | | Average Pipeline
Throughput(2)(3) | | Average Plant
Inlet(2)(3) | |
|---|
Texas | | Natural Gas Pipelines(4) | | | 2,227 | | | — | | | 905,775 | | | — | |
| | Processing Plants | | | 2 | | | 800,000 | | | — | | | 768,505 | |
| | NGL Pipelines(5) | | | 390 | | | — | | | 60,476 | | | — | |
Oklahoma | | Natural Gas Pipelines | | |
4,038 | | |
— | | |
315,029 | | |
— | |
| | Processing Plants(6) | | | 7 | | | 224,000 | | | — | | | 148,397 | |
Rocky Mountains | | Natural Gas Pipelines(7) | | |
594 | | |
— | | |
726,026 | | |
— | |
- (1)
- Natural gas pipeline miles for Texas and Oklahoma exclude 522 miles and 2,942 miles, respectively, of inactive pipelines that are being held for potential future development.
- (2)
- Capacity and volumes presented include wholly owned assets and assets owned by unconsolidated affiliates in which we own interests. Average plant inlet for Texas includes volumes attributable to our 200,000 Mcf/d Lake Charles processing plant, which we owned and operated for 242 days in 2012 and which we sold in August 2012.
- (3)
- Plant inlet capacity is presented in Mcf/d. Natural gas volumes are presented in MMBtu/d. NGL volumes are presented in Bbls/d.
- (4)
- Includes a 153-mile gathering system owned by Webb/Duval Gatherers, an unconsolidated general partnership in which we own a 62.5% interest, and a 191-mile gathering system owned by Eagle Ford Gathering, an unconsolidated company in which we own a 50% interest.
- (5)
- Includes an 87-mile NGL pipeline owned by Liberty Pipeline Group LLC, an unconsolidated affiliate in which we own a 50% interest, and 127 miles of leased NGL pipelines.
- (6)
- Includes a processing plant owned by Southern Dome, LLC, an unconsolidated affiliate in which we own a majority interest.
- (7)
- Owned by Bighorn Gas Gathering, L.L.C. and Fort Union Gas Gathering, L.L.C., unconsolidated affiliates in which we own 51% and 37.04% interests, respectively.
For additional disclosure about our segments, please read Note 13, "Segment Information," to our consolidated financial statements included in Item 8 of this report.
Our Texas segment provides midstream natural gas services in south and north Texas, including gathering and transportation of natural gas, and related services such as compression, dehydration, treating, processing and marketing. Our Texas segment also provides NGL fractionation and transportation services, and through August 2012, included a processing plant located in southwest Louisiana. In addition to our 100%-owned operations, this segment includes:
- •
- our 50% interest in Eagle Ford Gathering LLC ("Eagle Ford Gathering"), which provides midstream natural gas services to Eagle Ford Shale producers;
- •
- our 50% interest in Liberty Pipeline Group, LLC ("Liberty Pipeline Group"), which transports mixed NGLs from our Houston Central complex to the Texas Gulf Coast;
- •
- our 62.5% interest in Webb/Duval Gatherers ("Webb Duval"), which provides natural gas gathering in south Texas; and
- •
- our 50% interest in Double Eagle Pipeline LLC ("Double Eagle Pipeline"), which is constructing a condensate and crude oil gathering system that will serve Eagle Ford Shale producers
5
Table of Contents
The following map represents our Texas segment:

6
Table of Contents
The tables below provide summary descriptions of our Texas pipeline systems and processing plants.
Texas Pipelines
| | | | | | | | | | |
| | Length | | Diameter | | Year Ended
December 31, 2012
Average Throughput(1)(2) | |
|---|
| | (miles)
| | (range)
| |
| |
|---|
Wholly Owned | | | | | | | | | | |
Natural Gas Pipelines: | | | | | | | | | | |
South Texas | | | 955 | | | 2"-20" | | | 307,475 | |
Houston Central | | | 325 | | | 2"-12" | | | 77,024 | |
Upper Gulf Coast | | | 230 | | | 2"-12" | | | 43,809 | |
Saint Jo(3) | | | 373 | | | 3"-12" | | | 123,770 | |
NGL Pipelines: | | | | | | | | | | |
Houston Central NGL Lines(4) | | | 298 | | | 4"-8" | | | 27,343 | |
Saint Jo NGL Lines | | | 5 | | | 6" | | | 11,104 | |
Joint Ventures | | | | | | | | | | |
Natural Gas Pipelines: | | | | | | | | | | |
Eagle Ford Gathering | | | 191 | | | 24"-30" | | | 296,965 | |
Webb Duval | | | 153 | | | 6"-12" | | | 56,732 | |
Condensate/NGL Pipelines: | | | | | | | | | | |
Liberty Pipeline | | | 87 | | | 12" | | | 22,029 | |
- (1)
- Natural gas volumes are presented in MMBtu/d. NGL volumes are presented in Bbls/d.
- (2)
- Throughput volumes presented in the table are net of intercompany transactions.
- (3)
- Excludes 522 miles of inactive pipelines held for potential future development.
- (4)
- Includes 127 miles of leased NGL pipelines.
Texas Processing
| | | | | | | | | | | | | | | | | | |
| |
| |
| |
| | Year Ended December 31, 2012 | |
|---|
| |
| |
| |
| |
| | Average Processing
Volumes(2) | |
|---|
| |
| | Plant Inlet
Capacity(1) | | Fractionation
Capacity(1) | | Average
Inlet
Volumes(1)(2) | |
|---|
Processing Plants | | Facilities | | NGLs(1) | | Residue(1) | |
|---|
Wholly Owned | | | | | | | | | | | | | | | | | | |
Houston Central(3) | | Cryogenic/lean oil | | | 700,000 | | | 44,000 | | | 566,476 | | | 34,520 | | | 427,327 | |
Saint Jo | | Cryogenic | | | 100,000 | | | — | | | 109,443 | | | 11,104 | | | 66,583 | |
Lake Charles(2) | | NA | | | NA | | | NA | | | 92,586 | | | 912 | | | 86,226 | |
Third Party(4) | | | | | — | | | 37,500 | | | 43,308 | | | 2,265 | | | 34,729 | |
Joint Ventures | | | | | | | | | | | | | | | | | | |
Eagle Ford Gathering: | | | | | | | | | | | | | | | | | | |
Third Party(5) | | | | | 330,000 | (6) | | | | | 162,411 | | | 12,528 | | | 121,876 | |
- (1)
- Plant inlet capacity is presented in Mcf/d. Natural gas volumes are presented in MMBtu/d. Fractionation capacity and NGL volumes are presented in Bbls/d. Residue volumes are presented in MMBtu/d.
- (2)
- Average inlet volumes and average processing volumes for the Lake Charles plant represent 242 days of activity in 2012. We sold the Lake Charles plant in August 2012.
- (3)
- We have committed 375,000 MMBtu/d (approximately 303,000 Mcf/d) of firm capacity at Houston Central to Eagle Ford Gathering.
7
Table of Contents
- (4)
- Reflects capacity under third-party arrangements discussed in the narrative description of our Texas segment under "— Liberty Pipeline".
- (5)
- Does not include Eagle Ford Gathering's 375,000 MMBtu/d (approximately 303,000 Mcf/d) of firm capacity at our Houston Central complex.
- (6)
- These third party processing agreements provide for fractionation capacity for the associated NGLs.
In addition to transporting natural gas to our plants, our Texas segment delivers natural gas to third-party service providers. Depending on our contractual arrangements, third-party processors collect transportation or processing fees, retain a portion of the NGLs or residue gas or retain a portion of the proceeds from the sale of the NGLs and residue gas in exchange for their services. Average daily volumes processed at third-party plants for our Texas segment were 43,308 MMBtu/d for the year ended December 31, 2012.
We have undertaken various expansion capital projects in Texas to accommodate volume growth from the Eagle Ford Shale and the north Barnett Shale Combo plays. The table below provides summary descriptions of our major Texas capital projects.
Texas Expansion Projects — Processing
| | | | | | | | | | | |
Project | | Increase in Capacity | | Total
Resulting
Processing/
Fractionation
Capacity(1) | | Estimated
Capital | | Placed In Service/
Expected In-Service Date |
|---|
| |
| |
| | (in millions)
| |
|
|---|
Houston Central fractionation expansion | | | 22,000 | | | 44,000 | | $ | 43 | | In service |
Houston Central cryogenic upgrade(2) | | | — | | | 700,000 | | $ | 21 | | In service |
Saint Jo system compression and amine treater | | | — | | | — | | $ | 23 | | In service |
Houston Central processing expansion | | | 400,000 | | | 1,100,000 | | $ | 165 | | First Quarter 2013 |
Houston Central additional cryogenic capacity(3) | | | — | | | 1,000,000 | | $ | 190 | | Second Quarter 2014 |
- (1)
- Processing capacity is presented in Mcf/d. Fractionation capacity is presented in Bbls/d.
- (2)
- Consisted of upgrading our existing processing facility with a more efficient cryogenic tower to allow for processing of very rich natural gas from the Eagle Ford Shale.
- (3)
- Consists of installing 400,000 Mcf/d of new, more efficient cryogenic processing capacity designed to process gas with higher NGL content. Excludes capacity of our 500,000 Mcf/d lean oil processing facility based on plans to relegate the lean oil facility to providing overflow and interruptible volume services upon completion of this project.
8
Table of Contents
Texas Expansion Projects — Pipelines
| | | | | | | | | | |
Project | | Miles | | Diameter | | Estimated
Capital | | Placed In Service/
Expected In-Service Date |
|---|
| |
| |
| | (in millions)
| |
|
|---|
Wholly Owned | | | | | | | | | | |
DK pipeline extension | | | 59 | | 24" | | $ | 141 | | In service |
Goebel conversion(1) | | | 46 | | 12"-14" | | $ | 18 | | First Quarter 2013 |
DK pipeline southwest extension | | | 65 | | 24" | | $ | 120 | | Second Quarter 2013 |
DK Loop | | | 65 | | 24" | | $ | 100 | | Fourth Quarter 2013 |
Joint Ventures | | | | | | | | | | |
Eagle Ford Gathering: | | | | | | | | | | |
Initial pipeline | | | 117 | | 24"-30" | | $ | 155 | (3) | In service |
Crossover pipeline(2) | | | 74 | | 20"-24" | | $ | 112 | (3) | In service |
Liberty NGL pipeline | | | 87 | | 12" | | $ | 60 | (3) | In service |
Double Eagle Pipeline | | | 142 | | 12"-16" | | $ | 76 | (3) | First Quarter 2013 |
- (1)
- We are converting our Goebel pipeline from natural gas to condensate service and will lease its capacity to Double Eagle Pipeline for condensate transportation service.
- (2)
- Includes lateral pipelines and equipment for interconnections between the crossover pipeline and Williams Partners, LP's and Formosa Hydrocarbons Company's processing plants.
- (3)
- Joint venture project costs presented are gross amounts; our share of such costs is 50%.
9
Table of Contents
The following map summarizes our Texas expansion projects:

10
Table of Contents
South Texas Systems
We deliver a substantial majority of the natural gas gathered on our wholly owned gathering systems in south Texas to our Houston Central complex, where we provide treating, processing and NGL fractionation and transportation services, as needed. Our gathering systems in this area have access to Houston Central directly, through our own DK pipeline and through the Laredo-to-Katy pipeline, a 30-inch natural gas transmission pipeline owned by a subsidiary of Kinder Morgan, which extends along the Texas Gulf Coast from south Texas to Houston. Our Houston Central complex straddles the Laredo-to-Katy pipeline, which has allowed us to move natural gas from our pipeline systems in south Texas and near the Texas Gulf Coast to our Houston Central complex and downstream markets.
We completed the interconnection of our DK pipeline and Houston Central complex in December 2011, which when coupled with Kinder Morgan's Laredo-to-Katy pipeline, significantly increased pipeline capacity for deliveries to our Houston Central complex. Most of the gas from our wholly owned gathering systems now reaches Houston Central via the DK pipeline, and as described below, deliveries to Houston Central via Kinder Morgan's Laredo-to-Katy line increasingly consist of natural gas that Kinder Morgan is transporting for Eagle Ford Gathering.
We also deliver gas from our south Texas gathering systems to other third-party pipelines and processing plants. Depending on our contractual arrangements, third-party service providers collect processing fees, retain a portion of the NGLs or residue gas or retain a portion of the proceeds from the sale of the NGLs and residue gas in exchange for their services.
Eagle Ford Gathering. We provide midstream natural gas services to Eagle Ford Shale producers through Eagle Ford Gathering, our 50/50 joint venture with Kinder Morgan. We have committed processing and fractionation capacity and Kinder Morgan has committed pipeline capacity to the joint venture. Eagle Ford Gathering's pipelines extend from the southern Eagle Ford Shale in McMullen, LaSalle, Dimmit and Webb Counties, Texas, to Kinder Morgan's Laredo-to-Katy pipeline near Freer, Texas, through which Eagle Ford Gathering has access to contracted processing capacity at our Houston Central complex. The joint venture was further extended with a crossover pipeline system connecting Kinder Morgan's Laredo-to-Katy pipeline near Kennedy Texas with its 30-inch Tejas pipeline near Refugio, Texas, providing Eagle Ford Gathering access to additional contracted capacity at Williams Field Services' processing plant (120,000 MMBtu/d) and Formosa's processing plant (210,000 MMBtu/d).
We serve as managing member of Eagle Ford Gathering, and as operator of its main gathering system in the Eagle Ford Shale. Kinder Morgan serves as operator of Eagle Ford Gathering's crossover pipeline system.
Webb/Duval Gatherers. Our south Texas systems include the Webb Duval gathering system, which is owned by Webb/Duval Gatherers, a general partnership that we operate and in which we own a 62.5% interest. Each partner has the right to use its pro rata share of pipeline capacity on this system, subject to applicable ratable take and common purchaser statutes.
Houston Central Complex. Our Houston Central complex has approximately 700,000 Mcf/d of processing capacity, consisting of 500,000 Mcf/d lean oil and 200,000 Mcf/d cryogenic processing facilities and includes a 1,100 GPM amine treating system, a 44,000 Bbls/d NGL fractionation facility, a truck rack to facilitate the transport of NGLs and 882,000 gallons of NGL storage capacity.
We are expanding the plant's cryogenic processing capacity by 400,000 Mcf/d and expect to place the additional capacity in service in the first quarter of 2013. We are obtaining permits for a second 400,000 Mcf/d expansion, which we expect to place in service by the second quarter of 2014. When both expansions are complete, we expect to relegate the lean oil facility to overflow or interruptible volume services.
Houston Central takes deliveries of natural gas from our recently completed DK pipeline, our Houston Central gathering systems and the Kinder Morgan Laredo-to-Katy pipeline. The plant has tailgate
11
Table of Contents
interconnects with Kinder Morgan, Houston Pipe Line, Tennessee Gas Pipeline Company and Texas Eastern Transmission for redelivery of residue natural gas. Tres Palacios Gas Storage LLC, an affiliate of Inergy, L.P., has commenced construction of an approximately 20-mile, 24-inch residue gas pipeline that will connect the Houston Central complex to Tres Palacios' header and storage facility. The pipeline is expected to be placed in service late in the second quarter of 2013. In addition, we operate NGL pipelines at the tailgate of the plant, and Enterprise Product Partners operates a crude oil and stabilized condensate pipeline that runs from the tailgate of the plant to refineries in the greater Houston area.
The plant and related facilities are located on a 208-acre tract of land that we own.
Our NGL Pipelines. We transport purity ethane and propane from the fractionator at our Houston Central complex through two six inch pipelines (portions of which are leased from an affiliate of Dow Hydrocarbon under long-term lease agreements) to Dow Hydrocarbons near Sweeny, Texas. In addition, we have the option to deliver NGLs into Enterprise Products Partners' Seminole Pipeline through our Brenham NGL pipeline, which we lease from Kinder Morgan under a long-term lease agreement. We also transport butylenes for a third party from Almeda in south Houston to the Shell Deer Park plant on the Houston Ship Channel through a wholly owned 6-inch pipeline.
Liberty Pipeline. The Liberty pipeline (owned through our 50/50 joint venture with Energy Transfer Partners) extends approximately 87 miles, from our Houston Central complex in Colorado County, Texas, first to an NGL product storage facility in Matagorda County, Texas, and then to Formosa's fractionation facility near Point Comfort, Texas. We have a minimum of 37,500 Bbls/d of firm capacity on the Liberty pipeline, which enables us to transport mixed NGLs for delivery to Formosa. We have a long-term fractionation and product purchase agreement with Formosa, which initially provides us access to 5,000 to 7,000 Bbls/d of fractionation and NGL product sales and will provide us with 37,500 Bbls/d of fractionation and product sales beginning in the second quarter of 2013.
Double Eagle Pipeline. We and Magellan formed Double Eagle Pipeline to provide crude oil and condensate services for Eagle Ford Shale producers. The 50/50 joint venture is constructing a condensate gathering and transportation system extending from Gardendale, Texas, in LaSalle County to Three Rivers, Texas, in Live Oak County, then extending north into northern Karnes County. We are converting the Goebel pipeline, one of our existing natural gas pipelines, which extends from near Three Rivers to near Corpus Christi, to condensate service and will lease that capacity to the joint venture. The initial capacity of the 182-mile pipeline system will be 100,000 Bbls/d. Double Eagle is also constructing a truck unloading and 400,000 Bbls storage facility along the pipeline near Three Rivers for deliveries of condensate destined for Corpus Christi. Magellan is making enhancements to its Corpus Christi terminal, including the construction of 500,000 Bbls of new condensate storage, which it will make available to the joint venture, and a new dock delivery pipeline for use by the joint venture's producer-customers. The project is supported by long-term customer commitments from Talisman Energy USA Inc. and Statoil Marketing and Trading (US) Inc. The pipeline from Three Rivers to Corpus Christi is expected to begin service by the end of the first quarter of 2013, while the remaining joint venture assets are expected to begin service in the third quarter of 2013. We will serve as operator of Double Eagle Pipeline.
Our Upper Gulf Coast systems gather natural gas from counties to the north of Houston, Texas and take deliveries from several third-party pipelines. We deliver or sell the natural gas gathered or transported on these systems to utilities and industrial customers. In 2012, we leased a 10,000 Mcf/d refrigeration processing plant to begin providing service to producers in the Woodbine Shale, an emerging rich resource play near our Upper Gulf Coast systems.
12
Table of Contents
Our pipelines in north Texas gather natural gas from the north Barnett Shale Combo play in Cooke, Denton, Montague and Wise Counties and deliver the gas to our Saint Jo processing plant in Montague County and to third-party processing plants and pipelines. Our systems in north Texas have interconnects with Targa Resources, Atlas Pipeline, SemGas, Pecan Pipeline Company, Atmos and Natural Gas Pipeline of America. We constructed our Saint Jo plant and placed it in service in September 2009, then expanded the plant's capacity from 50,000 Mcf/d to 100,000 Mcf/d in November 2010. The Saint Jo plant originally included a 1,100 GPM amine treating facility, which we expanded to 1,500 GPM in March 2012. The plant also has condensate stabilization facilities and ethane rejection capability. Our Saint Jo NGL pipeline transports NGLs from the plant to ONEOK Hydrocarbon's Arbuckle NGL pipeline.
Our Oklahoma segment provides midstream natural gas services in central and east Oklahoma, including primarily low-pressure gathering of natural gas and related services such as compression, dehydration, treating, processing and nitrogen rejection. This segment includes our majority interest in Southern Dome, LLC ("Southern Dome"), which provides gathering and processing services within the Southern Dome prospect in the southern portion of Oklahoma County.
13
Table of Contents
The following map represents our Oklahoma segment:

14
Table of Contents
The tables below provide summary descriptions of our Oklahoma pipeline systems and processing plants.
Oklahoma Pipelines
| | | | | | | | | |
| |
| |
| | Year Ended
December 31, 2012 | |
|---|
Natural Gas Pipelines | | Length
(miles) | | Diameter of Pipe
(range) | | Average
Throughput(1) | |
|---|
Stroud | | | 934 | | 2"-16" | | | 122,046 | |
Milfay | | | 367 | | 2"-16" | | | 9,806 | |
Glenpool | | | 1,019 | | 2"-10" | | | 5,874 | |
Twin Rivers | | | 571 | | 2"-12" | | | 20,504 | |
Central Oklahoma(2) | | | 244 | | 2"-10" | | | 5,560 | |
Osage | | | 602 | | 2"-8" | | | 17,477 | |
Mountain(3) | | | 222 | | 2"-20" | | | 117,467 | |
Harrah | | | 79 | | 2"-12" | | | 16,295 | |
- (1)
- Natural gas volumes are presented in MMBtu/d.
- (2)
- Excludes 2,942 miles of inactive pipelines held for potential future development.
- (3)
- The Mountain system consists of three separate systems: Blue Mountain, Cyclone Mountain and Pine Mountain.
| | | | | | | | | | | | | | | |
| |
| |
| | Year Ended December 31, 2012 | |
|---|
| |
| |
| |
| | Average
Processing
Volumes(1) | |
|---|
| |
| | Plant Inlet
Capacity(1) | | Average
Inlet
Volumes(1) | |
|---|
Processing Plants | | Facilities | | NGLs | | Residue | |
|---|
Wholly Owned | | | | | | | | | | | | | | | |
Paden | | Cryogenic and propane refrigeration Nitrogen rejection(3) | | | 100,000 | | | 88,768 | | | 11,508 | | | 56,980 | |
Milfay | | Propane refrigeration | | | 15,000 | | | 8,582 | | | 680 | | | 6,078 | |
Glenpool | | Cryogenic | | | 25,000 | | | 6,190 | | | 301 | | | 4,787 | |
Burbank | | Propane refrigeration | | | 10,000 | | | 7,901 | | | 430 | | | 5,410 | |
Harrah | | Cryogenic | | | 38,000 | | | 27,009 | | | 2,338 | | | 18,065 | |
Davenport | | Cryogenic | | | 18,000 | | | — | | | — | | | — | |
Joint Ventures | | | | | | | | | | | | | | | |
Southern Dome(2) | | Propane refrigeration | | | 18,000 | | | 9,947 | | | 348 | | | 8,276 | |
- (1)
- Plant inlet capacity is presented in Mcf/d. Natural gas volumes are presented in MMBtu/d, and NGL volumes are presented in Bbls/d.
- (2)
- We own a majority interest in Southern Dome, which owns the Southern Dome plant. The plant is designed for operating capacity of 30,000 Mcf/d. Throughput currently is limited to 18,000 Mcf/d due to inlet compression.
- (3)
- The nitrogen rejection unit removes entrained nitrogen from the natural gas stream associated with the cryogenic portion of the Paden plant, which has capacity of 60,000 Mcf/d.
In addition to gathering natural gas to our plants, our Oklahoma segment delivers natural gas to third-party plants. Depending on our contractual arrangements, third parties collect processing fees, retain a portion of the NGLs or residue gas or retain a portion of the proceeds from the sale of the NGLs and residue gas in exchange for their services. Average daily volumes processed at third-party plants for our Oklahoma segment were 20,303 MMBtu/d for the year ended December 31, 2012.
15
Table of Contents
The Stroud system is located in Lincoln, Oklahoma, Pottawatomie, Seminole and Okfuskee Counties, Oklahoma. Also, in December 2012, we completed construction of a pipeline interconnecting our Osage and Stroud systems to enable us to deliver Mississippi Lime gas gathered on Osage to our Paden processing plant.
The Paden plant has a 60,000 Mcf/d turbo-expander cryogenic facility placed in service in June 2001, and a 40,000 Mcf/d refrigeration unit that was added in May 2007. The Paden plant also has the ability to reduce (by approximately 22%) the ethane extracted from natural gas processed, or "ethane rejection" capability. This capability provides us an advantage when market prices or operating conditions make it more desirable to retain ethane within the gas stream. Field compression provides the necessary pressure at the plant inlet, eliminating the need for inlet compression. The plant also has inlet condensate facilities, including vapor recovery and condensate stabilization.
Wellhead production around the Paden plant includes natural gas high in nitrogen, which is inert and reduces the Btu value of residue gas. In 2008, we added a nitrogen rejection unit to the Paden plant, which allows us to process high-nitrogen natural gas while remaining in compliance with downstream pipeline gas quality specifications. The nitrogen rejection unit removes excess nitrogen from residue gas at the tailgate of the plant's cryogenic facility.
We deliver residue gas from the Paden plant to either Enogex (a subsidiary of OGE Energy Corp.) or ONEOK Gas Transmission. We deliver NGLs from the Paden plant to ONEOK Hydrocarbon and condensate is trucked by Enterprise Product Partners.
The Harrah plant has two turbo-expander cryogenic units with a combined capacity of 38,000 Mcf/d. In ethane-rejection mode, the plant has the ability to reduce ethane extracted from natural gas processed by approximately 40%. We deliver residue gas from the Harrah plant to Enogex. We sell NGLs from the Harrah plant to ONEOK Hydrocarbon, and we deliver the condensate to Murphy Energy via trucks.
Osage System. The Osage system is located in Osage, Pawnee, Payne, Washington and Tulsa Counties, Oklahoma. Wellhead production on the eastern portion of the Osage system tends to be lean and is not processed. This gas is delivered to Enogex and ONEOK Gas Transmission. Wellhead production on the western portion of the Osage system tends to be richer and includes gas from the Mississippi Lime play. We deliver rich gas from the Osage system to Keystone Gas, which delivers it to a third-party processor, and to our Burbank plant. As noted above, we recently completed an extension of the Osage system to interconnect with our Stroud system, which allows us to also provide processing and nitrogen rejection services at our Paden processing plant. The Burbank plant, located in Osage County, is a 10,000 Mcf/d refrigeration plant that we placed in service in the second quarter of 2010. We deliver the residue gas from the Burbank plant into KPC Pipeline and sell the NGLs to Murphy Energy via trucks.
Milfay System and Processing Plant. The Milfay system is located in Tulsa, Creek, Lincoln and Okfuskee Counties, Oklahoma. We deliver natural gas gathered on the Milfay system to our Milfay refrigeration plant, and have the ability to deliver to the Paden plant as well. We deliver the residue gas from the Milfay plant into ONEOK Gas Transmission and the NGLs to ONEOK Hydrocarbon.
Glenpool System and Processing Plant. The Glenpool system is located in Tulsa, Wagoner, Muskogee, McIntosh, Okfuskee, Okmulgee and Creek Counties, Oklahoma. Substantially all of the natural gas from the Glenpool system is delivered to our Glenpool cryogenic plant. We deliver the residue gas from the Glenpool plant into either ONEOK Gas Transmission or the American Electric Power Riverside power plant, and the NGLs to ONEOK Hydrocarbon.
Twin Rivers System. The Twin Rivers system is located in Okfuskee, Seminole, Hughes, Pontotoc and Coal Counties, Oklahoma and enables us to gather rich Woodford Shale production. We deliver substantially all of the Twin Rivers system's volumes to a third-party plant for processing.
16
Table of Contents
Central Oklahoma System. The Central Oklahoma system consists of five gathering systems located in Garvin, Stephens, McClain, Oklahoma and Carter Counties, Oklahoma. We deliver gas gathered on the Central Oklahoma system to two third-party plants for processing.
Mountain Systems. The Mountain systems are located in Atoka, Pittsburg and Latimer Counties, in the Arkoma Basin, and include the Blue Mountain, Cyclone Mountain and Pine Mountain systems. In 2012, we increased our amine treating and compression services to our Cyclone Mountain system to expand its ability to service producers in the Woodford Shale. Wellhead production on the Blue and Pine Mountain systems generally does not require processing or treating. We deliver natural gas from the Mountain systems to, among others, CenterPoint Transmission and Enogex.
Southern Dome. We own a majority interest in Southern Dome, which provides gathering and processing services within the Southern Dome prospect in the southern portion of Oklahoma County. We are the managing member of Southern Dome and serve as its operator. Southern Dome also operates a 3.4-mile gathering system owned by a single producer. Under a gas purchase and processing agreement between Southern Dome and this producer, substantially all of the natural gas from the gathering system is delivered to the Southern Dome processing plant, and the remainder is delivered to a third party for processing. Southern Dome receives a fee for operating the gathering system and retains a percentage of the producer's residue gas and NGLs at the tailgate of the Southern Dome plant. We deliver the residue gas to ONEOK Gas Transmission and sell the NGLs to Murphy Energy via trucks.
We are obligated to make 73% of the capital contributions requested by Southern Dome up to a maximum commitment amount of $18.25 million. We are entitled to receive 69.5% of member distributions until "payout," which refers to a point at which we have received distributions equal to our capital contributions plus an 11% return. After payout occurs, we will be entitled to 50.1% of member distributions. As of December 31, 2012, we have made $12.9 million in aggregate capital contributions to Southern Dome and have received an aggregate of $14.6 million in member distributions.
Our Rocky Mountains segment provides midstream natural gas services in the Powder River Basin of Wyoming, including gathering and treating of natural gas. This segment includes:
- •
- our 51% interest in Bighorn Gas Gathering, L.L.C. ("Bighorn"), which provides gathering services to Powder River Basin producers; and
- •
- our 37.04% interest in Fort Union Gas Gathering, L.L.C. ("Fort Union"), which provides gathering and treating services to Powder River Basin producers.
Our Rocky Mountains segment also includes firm gathering agreements with Fort Union and firm transportation agreements with Wyoming Interstate Gas Company ("WIC"). We acquired the business and assets in this segment through our purchase of Denver-based Cantera in October 2007.
Rocky Mountains Pipelines and Services(1)
| | | | | | | | | | |
| |
| |
| | Year Ended
December 31,
2012 | |
|---|
| | Length
(miles) | | Diameter of Pipe
(range) | | Average
Throughput(1) | |
|---|
Joint Ventures | | | | | | | | | | |
Natural Gas Pipelines(3) | | | 594 | | | 6"-24" | | | 726,026 | |
- (1)
- Natural gas volumes are presented in MMBtu/d.
- (2)
- Consists of pipelines owned by Bighorn and Fort Union. Fort Union also has 1,500 GPM of amine treating capacity.
17
Table of Contents
The following map represents the assets of Bighorn and Fort Union:

18
Table of Contents
Bighorn provides low and high pressure natural gas gathering service to coal-bed methane producers in the Powder River Basin. Due to the lean nature of coal-bed methane wellhead production, gas gathered on the Bighorn system does not require treating or processing and is delivered directly into the Fort Union gas gathering system at the southern terminus of the Bighorn system. We serve as managing member and field operator of Bighorn.
Fort Union takes delivery of gas from Bighorn, provides gathering services to other producers and provides amine treating at its Medicine Bow treating facility in order to meet the quality specifications of downstream pipelines. Pipeline interconnects downstream from the Fort Union system include WIC, Tallgrass Interstate Gas Transportation and Colorado Interstate Gas Company.
Fort Union has firm gathering agreements with each of its four owners, including us. Each owner has the right to use a fixed quantity of firm gathering capacity on the system (referred to asvariable capacity) that must be paid for only to the extent the owner's dedicated production exceeds that owner's demand capacity. Also, three of Fort Union's owners, including us, are obligated under their firm gathering agreements to pay for a fixed quantity of firm gathering capacity (referred to asdemand capacity) on the system, regardless of the owner's actual volumes delivered to Fort Union. Any capacity not used by the owners becomes available to third parties under interruptible gathering agreements.
The demand capacity arrangement is intended to ensure that Fort Union recovers its costs for capital projects plus a minimum rate of return on its capital invested. As a project's costs are recovered, the owners' respective demand capacity related to that project converts to variable capacity. Currently, 50% of Fort Union's total firm capacity is demand capacity, which expires in 2017. The variable capacity gathering agreements between Fort Union and its owners terminate only upon mutual agreement of the parties. We serve as the managing member of Fort Union. Western Gas Wyoming, L.L.C. ("Western"), a subsidiary of Anadarko Petroleum Corporation, acts as field operator, and a ONEOK Partners subsidiary acts as administrative manager and provides gas control, contract management and contract invoicing services.
We provide services to a number of producers in the Powder River Basin, including producers who deliver gas into the Bighorn or Fort Union gathering systems, using our firm capacity on Fort Union and WIC to provide producers access to downstream interstate markets.
Our gathering agreements with Fort Union currently provide us with total capacity of 402,269 Mcf/d, consisting of demand capacity of 150,000 Mcf/d and variable capacity of up to 252,269 Mcf/d. Under these agreements, Fort Union gathers gas from producers and from Bighorn and delivers it to WIC near Glenrock, Wyoming. Our transportation agreements with WIC provide us with 209,100 MMBtu/d of firm capacity on WIC's Medicine Bow lateral pipeline. WIC transports natural gas from the terminus of the Fort Union system, as well as other receipt points, to the Cheyenne Hub, which provides access to many interstate pipelines.
Our long-term WIC agreements extend through 2019, with a right to renew for additional five-year terms. Through the capacity release program established under WIC's Federal Emergency Regulatory Commission ("FERC") gas tariff, we have released all of our WIC capacity to several producers in the Powder River Basin. The producers, in turn, have agreed to pay WIC for the right to use our WIC capacity. Our WIC capacity release covers all of our long-term WIC capacity and continues through 2019. We are obligated to pay for our WIC capacity regardless of whether we use the capacity. Notwithstanding our capacity release, we remain obligated to pay WIC for such capacity in the event and to the extent that a replacement shipper to whom such capacity has been released fails to pay.
19
Table of Contents
Natural Gas Supply
We continually seek new supplies of natural gas, both to increase throughput volume and to offset natural declines in production from connected wells. We obtain new supplies in our operating areas by contracting for production from new wells, connecting new wells drilled on dedicated acreage or by obtaining supplies that were previously gathered by competitors. We contract for supplies of natural gas from producers under a variety of contractual arrangements. Please read "— Industry
Overview — Midstream Contracts" below and Item 7A., "Quantitative and Qualitative Disclosures about Market Risk."
We generally do not obtain reservoir engineering reports evaluating reserves dedicated to our pipeline systems due to the cost of such evaluations and the lack of publicly available producer reserve information. Accordingly, we do not have estimates of total reserves dedicated to our assets, the average production declines of producer wells or the anticipated lives of producing reserves; therefore volumes of natural gas transported on our pipeline systems in the future could be more or less than we anticipate. Please read Item 1A., "Risk Factors — Risks Related to Our Business."
Each of our operating segments is affected by the level of drilling in its operating area. During 2012, we saw considerable drilling activity in domestic shale plays, particularly the Eagle Ford Shale and north Barnett Shale Combo and increasing activity in the rich Woodford Shale and Mississippi Lime plays. Drilling activity in our conventional drilling areas has been minimal. As producers continue to focus on the unconventional shale plays, it remains unclear when they will undertake sustained increases in drilling activity throughout the conventional areas in which we operate. In the Powder River Basin, producers must "dewater" newly drilled coal-bed methane wells to draw the methane gas to the surface, which introduces a delay of twelve to eighteen months into the process of connecting newly drilled natural gas supplies. Volume growth due to any increase in drilling activity near our Rocky Mountains systems will be subject to delay because of dewatering. Dewatering is also required in the Hunton formation in Oklahoma, although the process used in that region generally requires less time to complete.
In Texas, we have increasingly focused on obtaining longer-term producer volume commitments and acreage dedications to secure natural gas supplies in support of our recent expansion projects. For example, our DK pipeline is supported by producer volume commitments.
During the year ended December 31, 2012, our Texas segment's top five suppliers by volume of natural gas collectively accounted for approximately 45% of the natural gas delivered to our Texas systems with EOG Resources and Geosouthern Energy Corporation each accounting for 13%, respectively. During the year ended December 31, 2012, Geosouthern Energy Corporation and Eagle Ford Gathering accounting for 16% and 15%, respectively, of our consolidated cost of goods sold. Our Texas segment's top five customers collectively accounted for 61% of our Texas segment's revenue in 2012, with Dow Hydrocarbons and Resources accounting for 17% and Formosa Hydrocarbons Company accounting for 10% of our consolidated revenue.
Our largest Oklahoma producer by volume has dedicated to us all of its production within a 1.1 million acre area under a long-term agreement. We also have dedications from other producers covering their production within approximately 500,000 acres in the aggregate.
During the year ended December 31, 2012, our Oklahoma segment's top five producers by volume collectively accounted for approximately 68% of the natural gas delivered to our Oklahoma systems during the period with New Dominion LLC accounting for 10% of our consolidated cost of goods sold. Our Oklahoma segment's top five customers collectively accounted for 88% of our Oklahoma segment's
20
Table of Contents
revenue in 2012, with Oneok Hydrocarbon, L.P. and its affiliates accounting for 12% of our consolidated revenue.
Under Fort Union's operating agreement, the owners of Fort Union established an area of mutual interest ("AMI") covering approximately 2.98 million acres in the Powder River Basin and committed all gas production from the AMI to the Fort Union system up to the total capacity of the Fort Union system based on each owner's total capacity rights.
During the year ended December 31, 2012, Fort Union's top three shippers based on gathering fees accounted for approximately 98% of Fort Union's revenue.
The owners of Bighorn established an approximately 3.8 million-acre AMI in the Powder River Basin, which provides that projects undertaken by the owners or their subsidiaries in the AMI must be conducted through Bighorn. Additionally, production from leases covering more than 800,000 acres of land within the Powder River Basin has been dedicated to the Bighorn Gathering system by other producers.
During the year ended December 31, 2012, Bighorn's top two producers based on gathering fees collectively accounted for approximately 81% of Bighorn's revenue.
Competition
The midstream industry is highly competitive. Competition is based primarily on the reputation, efficiency, flexibility, size, credit quality and reliability of the gatherer, the pricing arrangements offered by the gatherer, location of the gatherer's pipeline facilities and the gatherer's ability to offer a full range of services, including natural gas gathering, transportation, compression, dehydration, treating, processing, NGL transportation and fractionation and condensate gathering and transportation. We believe that offering an integrated package of services allows us to compete more effectively for new natural gas supplies in our operating regions.
We face strong competition in connecting new natural gas supplies, developing organic growth projects and in pursuing acquisition opportunities as part of our long-term growth strategy. Our competitors include major interstate and intrastate pipelines, other natural gas gatherers and natural gas producers that gather, process and market natural gas and NGLs. In addition, Double Eagle Pipeline will compete with other companies that provide crude and condensate gathering, transportation and storage and related services. Our competitors may have capital resources and control supplies of natural gas, crude oil or condensate greater than ours.
We provide comprehensive services to natural gas producers in our Texas segment, including gathering, transportation, compression, dehydration, treating and processing and NGL and condensate transportation, fractionation and marketing. We believe our ability to furnish this full slate of services gives us an advantage in competing effectively for new supplies of natural gas because we can provide the services that producers, marketers and others require to connect their natural gas quickly and efficiently. For natural gas that exceeds the maximum carbon dioxide and NGL specifications for interconnecting pipelines and downstream markets, we believe that our treating and other processing and fractionation services are offered on competitive terms.
Our major competitors for natural gas supplies and markets in our Texas segment include Enterprise Products Partners, DCP Midstream, Energy Transfer Partners and Targa Resources.
We provide comprehensive services to natural gas producers in our Oklahoma segment, including gathering, transportation, compression, dehydration, treating, processing and, at our Paden plant, nitrogen rejection. We believe our ability to furnish this full slate of services gives us an advantage in competing effectively for new supplies of natural gas because we can provide the services that producers, marketers and others require to connect their natural gas quickly and efficiently.
21
Table of Contents
Most of our Oklahoma systems offer low-pressure gathering service, which is attractive to producers. We have made significant investments in limited-emissions, multi-stage compressors for our Oklahoma segment, which has allowed for quicker permitting and installation, thereby allowing us to provide the low pressure required by producers more efficiently.
Our major competitors for natural gas supplies and markets in our Oklahoma segment include CenterPoint Field Services, DCP Midstream, Atlas Pipeline, ONEOK Field Services, Hiland Partners, Enogex, MarkWest, Enerfin, Mustang Gas Products and Superior Pipeline.
A significant portion of the gas on the Bighorn and Fort Union systems is dedicated under long-term gas gathering agreements.
Our major competitors for natural gas gathering supplies and markets in our Rocky Mountains segment include Thunder Creek Gas Gathering, Bitter Creek Pipeline Company, Bear Paw Energy and Western Gas Resources. In addition, our major competitor in providing take away capacity from the Rocky Mountains segment is the Bison Interstate Pipeline.
Industry Overview
The midstream oil and gas industry is the link between the exploration and production of natural gas and the delivery of its components to end-use markets and consists of gathering, compression, dehydration, treating, conditioning, processing, transportation and fractionation, see diagram of the industry below.

Gathering. The gathering process begins with the drilling of wells into gas or oil bearing rock formations. Once an oil or gas well has been completed, the well is connected to a gathering system. Gathering systems generally consist of a network of small-diameter pipelines that collect oil, gas or condensate from points near producing wells for delivery to larger pipelines or trucks for further transportation.
Compression. Gathering systems are operated at pressures that will maximize the total throughput from all connected wells. Because wells produce at progressively lower field pressures as they age, it becomes increasingly difficult to deliver the remaining production in the ground against the higher pressure that exists in the connected gathering system. Natural gas compression is a mechanical process in which a volume of gas at an existing pressure is compressed to a desired higher pressure, allowing gas that no longer naturally flows into a higher-pressure downstream pipeline to be brought to market. Field
22
Table of Contents
compression is typically used to allow a gathering system to operate at a lower pressure or provide sufficient discharge pressure to deliver gas into a higher-pressure downstream pipeline. If field compression is not installed, then the remaining natural gas in the ground will not be produced because it will be unable to overcome the higher gathering system pressure. In contrast, if field compression is installed, a declining well can continue delivering natural gas.
Natural gas dehydration. Natural gas is sometimes saturated with water, which must be removed because it can form ice and plug different parts of pipeline gathering and transportation systems and processing plants. Water in a natural gas stream can also cause corrosion when combined with carbon dioxide or hydrogen sulfide in natural gas, and condensed water in the pipeline can raise inlet pipeline pressure, causing a greater pressure drop downstream. Dehydration of natural gas helps to avoid these potential issues and to meet downstream pipeline and end-user gas quality standards.
Natural gas treating and blending. Natural gas composition varies depending on the field, the formation and the reservoir from which it is produced. Natural gas from certain formations can be high in carbon dioxide or hydrogen sulfide, which may cause significant damage to pipelines and is generally not acceptable to end-users. To alleviate the potential adverse effects of these contaminants, many pipelines regularly inject corrosion inhibitors into the gas stream. Additionally, to render natural gas with high carbon dioxide or hydrogen sulfide levels to downstream pipeline quality, pipelines may blend the gas with gas that contains low carbon dioxide or hydrogen sulfide levels, or arrange for treatment to remove carbon dioxide and hydrogen sulfide to levels that meet pipeline quality standards. Natural gas can also contain nitrogen, which lowers the heating value of natural gas and must be removed to meet pipeline specifications.
Amine treating. The amine treating process involves a continuous circulation of a liquid chemical called amine that physically contacts with natural gas. Amine has a chemical affinity for hydrogen sulfide and carbon dioxide, which allows it to absorb these impurities from the gas. After mixing, gas and amine are separated, and the impurities are removed from the amine by heating. The treating plants are sized by the amine circulation capacity in terms of gallons per minute.
Natural gas processing. Natural gas processing involves the separation of natural gas into downstream pipeline quality natural gas and a mixed NGL stream. The principal component of natural gas is methane, but most natural gas also contains varying amounts of heavier hydrocarbon components, or NGLs. Natural gas is described as lean or rich depending on its content of NGLs. Most natural gas produced by a well is not suitable for long-haul pipeline transportation or commercial use because it contains NGLs and impurities. Natural gas processing not only separates the dry natural gas from the NGLs that would interfere with downstream pipeline transportation or other uses of the natural gas, but also extracts hydrocarbon liquids that can have higher value as NGLs. Removal and separation of individual hydrocarbons by processing is possible because of differences in weight, boiling point, vapor pressure and other physical characteristics.
NGL fractionation. Fractionation is the process by which NGLs are separated into individual, more valuable components. NGL fractionation facilities separate mixed NGL streams into discrete NGL products: ethane, propane, isobutane, normal butane, natural gasoline and stabilized condensate. Ethane is primarily used in the petrochemical industry as feedstock for ethylene, one of the basic building blocks for a wide range of plastics and other chemical products. Propane is used both as a petrochemical feedstock in the production of ethylene and propylene and as a heating fuel, an engine fuel and an industrial fuel. Isobutane is used principally to enhance the octane content of motor gasoline. Normal butane is used as a petrochemical feedstock in the production of ethylene and butylene (a key ingredient in synthetic rubber), as a blend stock for motor gasoline and to derive isobutane through isomerization. Natural gasoline, a mixture of pentanes and heavier hydrocarbons, is used primarily as motor gasoline blend stock or petrochemical feedstock. Stabilized condensate is primarily used as a refinery feedstock for the production of motor gasoline and other products.
23
Table of Contents
NGLs are fractionated by heating mixed NGL streams and passing them through a series of distillation towers. Fractionation takes advantage of the differing boiling points of the various NGL products. As the temperature of the NGL stream is increased, the lightest (lowest boiling point) NGL product boils off the top of the tower where it is condensed and routed to a pipeline or storage. The mixture from the bottom of the first tower is then moved into the next tower where the process is repeated and a different NGL product is separated and stored. This process is repeated until the NGLs have been separated into their components. Because the fractionation process uses large quantities of heat, fuel costs are a major component of the total cost of fractionation.
Natural gas transportation. Natural gas transportation pipelines receive natural gas from other mainline transportation pipelines and gathering systems and deliver the natural gas to other pipelines, markets, industrial purchasers and utilities.
Oil and NGL transportation. Crude oil, condensate and NGLs are transported to market by means of pipelines, pressurized barges, railcar and tank trucks. The method of transportation used depends on, among other things, the existing resources of the transporter, the locations of the production points and the delivery points, cost-efficiency and the quantity being transported. Pipelines are generally the most cost-efficient means of transportation for large, consistent volumes of crude oil, condensate, or NGLs.
Condensate handling. Condensate is a liquid hydrocarbon recovered from raw natural gas (either associated or not associated with crude oil production). Once condensate has been removed from the natural gas stream, it may require stabilization to reduce the Reid Vapor Pressure so that it may be transported to a refinery or a petrochemical facility to be used as feedstock. Stabilized condensate is routinely transported via tank truck, railcar, marine vessel, or pipeline.
Natural gas is gathered and processed in the industry pursuant to a variety of arrangements generally categorized (by the nature of the commodity price risk) as fee-based, percent-of-proceeds, percent-of-index and keep-whole. Contracts may rely solely on a single type of arrangement, but more often they combine elements of two or more, which helps the parties manage the extent to which each shares in the potential risks and benefits of changing commodity prices. In addition, processing contracts sometimes include a "fixed recovery" concept, as described below. The terms of any individual contract will depend on a variety of factors, including gas quality and NGL content, pressures of natural gas production relative to downstream transporter pressure requirements, the competitive environment at the time the contract is executed and customer requirements.
Fee-Based. Under these arrangements, the pipeline or processor generally is paid a fee per unit volume for services such as gathering, transporting, processing or fractionation. Revenue from fee-based arrangements is directly related to the volume of oil, condensate, natural gas or NGLs that flows through the midstream company's systems and is not directly dependent on commodity prices. However, sustained low commodity prices could result in a decline in volumes and a corresponding decrease in fee revenue. These arrangements provide stable cash flows, but minimal if any upside in higher commodity price environments. Some fee-based arrangement involve firm volume commitments by the producer, under which the producer is obligated to pay fees (sometimes referred to as "deficiency fees") for the committed volumes even if the producer's physical deliveries are less. Typically deficiency fees become payable at the end of a quarter or year with respect to committed volumes for that period.
Percent-of-Proceeds. Under these arrangements generally, raw natural gas is gathered from producers at the wellhead, moved through the gathering system and then processed and sold at prices based on published index prices. Producers are paid based on an agreed percentage of the residue gas and NGLs multiplied by index prices or the actual sale prices. A similar type of arrangement, under which the processor shares only in specified percentages of the index-based value or actual sale proceeds for the
24
Table of Contents
NGLs, and the producer receives 100% of the index-based value or sale proceeds for the residue gas, is referred to as a "percent-of-liquids" arrangement. Margins from percent-of-proceeds and percent-of-liquids arrangements correlate directly with the prices of natural gas and NGLs, meaning that they provide upside to the processor in high commodity price environments but result in lower margins in low commodity price environments.
Percent-of-Index. Under percent-of-index arrangements, raw natural gas is purchased from producers at the wellhead at either a percentage discount to a specified index price or a weighted average sales price based on natural gas sales. The gas is then sold, or if the gas is processed, the resulting NGLs and residue gas are sold. For gas that is sold without processing, margins correlate directly with natural gas prices. If the gas is processed, the processor's margin increases as the prices of NGLs increase relative to the price of natural gas and decrease as the prices of NGLs decrease relative to the price of natural gas, resulting in commodity exposure similar to that of a keep-whole arrangement.
Keep-Whole. Under these arrangements, raw natural gas is processed to extract NGLs, and the processor pays the producer the full thermal-equivalent volume of the raw natural gas received from the producer, either in the form of residue gas or its equivalent value. The processor is generally entitled to retain the extracted NGLs and sell them for its own account. Keep-whole margins are a function of the difference between the value of the NGLs extracted and the cost of the residue gas needed to replace the thermal equivalent volume of natural gas used in processing. The profitability of these arrangements is subject not only to the commodity price risk of natural gas and NGLs, but also to the price of natural gas relative to NGL prices. These arrangements can provide significant upside in favorable commodity price environments but can result in losses if the cost of natural gas exceeds the value of its thermal equivalent of NGLs.
Many keep-whole arrangements have terms that reduce commodity price exposure in one or more ways, including (i) a fee-based, reduced-recovery arrangement that applies if the NGLs have a lower value than their thermal equivalent in natural gas, (ii) discounts to the applicable natural gas index price used to reimburse the producer an amount in cash for the thermal equivalent volume of raw natural gas acquired from the producer, or (iii) fees for ancillary services such as gathering, treating and compression.
Fixed Recoveries. Fee-based or percent-of-proceeds contracts sometimes include fixed recovery terms, which mean that the prices paid or products returned to the producer are calculated using an agreed NGL recovery factor, regardless of the volumes of NGLs actually recovered through processing. The processor negotiates the NGL recovery factor based generally on its expectations regarding operational factors such as plant capacity and efficiency and the average NGL content of natural gas delivered to the plant. If the processor's actual recoveries differ from the agreed recovery factor, the processor's margin will be affected to the extent of the difference. These arrangements can provide upside in high commodity price environments and also allow the processor to increase its margins by reducing recoveries in response to unfavorable NGL prices. Contracts providing for fixed recoveries allow the processor to benefit from increases in plant efficiency, which enhance the processor's ability to respond to changing commodity prices. However, the processor could incur losses during favorable NGL price environments if its actual NGL recoveries fall below agreed NGL recovery factor due to plant inefficiencies or for other operational reasons.
Risk Management
We are exposed to market risks such as changes in commodity prices and interest rates and use derivative instruments, contract terms and finance practices (mix of fix and floating-rate debt) to mitigate the effects of these risks. In general, we attempt to hedge against the effects of changes in commodity prices and interest rates on our cash flow and profitability so that we can continue to meet debt service, required capital expenditures, distribution objectives and similar requirements. Our risk management policy prohibits the use of derivative instruments for speculative purposes. For a discussion of our risk
25
Table of Contents
management activities, please read Item 7A., "Quantitative and Qualitative Disclosures about Market Risk."
Regulation
In the ordinary course of business, we are subject to various laws and regulations, as described below. We believe that compliance with existing laws and regulations will not materially affect our financial position. Although we cannot predict how new or amended laws or regulations that may be adopted would impact our business, such laws, regulations or amendments could increase our costs and could reduce demand for natural gas and NGLs or crude oil, thereby reducing demand for our services.
FERC Regulation of Natural Gas Pipelines. We do not own any interstate natural gas pipelines, so FERC does not directly regulate the rates and terms of service associated with our operations. However, FERC's regulations under the Natural Gas Policy Act of 1978 (the "NGPA") and the Energy Policy Act of 2005 do affect certain aspects of our business and the market for our products.
Under the Energy Policy Act of 2005, FERC possesses regulatory oversight over natural gas markets, including the purchase, sale and transportation activities of non-interstate pipelines and other natural gas market participants. The Commodity Futures Trading Commission (the "CFTC") has authority to prohibit market manipulation in the markets regulated by the CFTC pursuant to the Dodd-Frank Act. With regard to our physical purchases and sales of natural gas and NGLs, our gathering or transportation of these energy commodities and any related hedging activities that we undertake, we are required to observe these anti-market manipulation laws and related regulations enforced by FERC and/or the CFTC. These agencies hold substantial enforcement authority, including FERC's ability to assess civil penalties of up to $1 million per day per violation, order disgorgement of profits and recommend criminal penalties and CFTC's authority to subject violators to a civil penalty of up to the greater of $1 million or triple the monetary gain to the person for each violation. Should we violate the anti-market manipulation laws and regulations, we could also be subject to related third-party damage claims by, among others, sellers, royalty owners and taxing authorities.
FERC has adopted market-monitoring and annual reporting regulations intended to increase the transparency of wholesale energy markets, to protect the integrity of such markets, and to improve FERC's ability to assess market forces and detect market manipulation. Certain of our operations are subject to FERC reporting requirements, including reporting of contract terms by intrastate natural gas pipelines that provide services on behalf of an interstate natural gas pipeline pursuant to Section 311 of the NGPA and reporting of aggregated annual volume and other information by natural gas wholesalers and purchasers.
FERC Regulation of NGL Pipelines. We own or operate NGL pipelines in Texas. We believe that these pipelines do not provide interstate service and that they are thus not subject to FERC jurisdiction under the Interstate Commerce Act (the "ICA") and the Energy Policy Act of 1992. Under the ICA, tariffs must be just and reasonable and not unduly discriminatory or confer any undue preference. We cannot guarantee that the jurisdictional status of our NGL facilities will remain unchanged, however. Should they be found jurisdictional, the FERC's rate-making methodologies may limit our ability to set rates based on our actual costs, may delay the use of rates that reflect increased costs, and may subject us to potentially burdensome and expensive operational, reporting and other requirements.
Intrastate Natural Gas Pipeline Regulation. We own an intrastate natural gas transmission facility in Texas. To the extent it transports gas in interstate commerce, this facility is subject to regulation by the FERC under Section 311 of the NGPA. Section 311 requires, among other things, that rates for such interstate service (which may be established by the applicable state agency, in our case the Texas Railroad Commission, or the "TRRC") be "fair and equitable" and that the terms and conditions of interstate service be on file with the FERC.
26
Table of Contents
Natural Gas Gathering Regulation. Section 1(b) of the Natural Gas Act ("NGA") exempts natural gas gathering facilities from FERC's jurisdiction. We own or hold interests in a number of natural gas pipeline systems in Texas, Oklahoma and Wyoming that we believe meet the traditional tests FERC has used to establish a pipeline system's status as a non-jurisdictional gatherer. There is, however, no bright-line test for determining the jurisdictional status of pipeline facilities. Moreover, the distinction between FERC-regulated transmission services and federally unregulated gathering services is the subject of litigation from time to time, so the classification and regulation of some of our gathering facilities may be subject to change based on future determinations by FERC and the courts. Thus, we cannot guarantee that the jurisdictional status of our natural gas gathering facilities will remain unchanged. Should these gas gathering facilities be found jurisdictional, the FERC could require significant changes to the rates, terms and conditions of service on the affected pipelines and such facilities may be subject to potentially burdensome and expensive operational, reporting and other requirements.
In Texas, Oklahoma and Wyoming, the states in which our gathering operations take place, we are subject to state safety, environmental and service regulation. While our non-utility operations are not subject to direct state regulation of our gathering rates, we are required to offer gathering services on a non-discriminatory basis. In general, the non-discrimination requirement is monitored and enforced by each state based upon filed complaints.
We are also subject to state ratable take and common purchaser statutes in these states. Ratable take statutes generally require gatherers to take, without undue discrimination, natural gas production that may be tendered to the gatherer for handling. Similarly, common purchaser statutes generally require gatherers to purchase without discriminating in favor of one producer over another producer or one source of supply over another source of supply.
State Utility Regulation. Some of our operations in Texas (specifically, our intrastate transmission pipeline and several of our gathering systems) are subject to the Texas Gas Utility Regulatory Act, as implemented by the TRRC. Generally, the TRRC has authority to ensure that rates charged for natural gas sales or transportation services are just and reasonable. None of our operations in Oklahoma or Wyoming are regulated as public utilities by the Oklahoma Corporation Commission ("OCC") or the Wyoming Public Service Commission ("WPSC").
Sales of Natural Gas and NGLs. The prices at which we buy and sell natural gas currently are not subject to federal regulation, and except as noted above with respect to our gas utility operations, are not subject to state regulation. The prices at which we sell NGLs are not subject to federal or state regulation, but the ability to transport and sell such products on interstate pipelines is dependent on pipelines whose rates, terms and conditions of service are subject to the FERC jurisdiction under the ICA.
In December 2007, FERC issued a final rule on the annual natural gas transaction reporting requirements, as amended by subsequent orders on rehearing ("Order 704"). Under Order 704, any market participant, including a producer such as the Company, that engages in wholesale sales or purchases of gas that equal or exceed 2.2 million MMBtus of physical natural gas in the previous calendar year, must annually report such sales and purchases to FERC on Form No. 552 on May 1 of each year. Form No. 552 contains aggregate volumes of natural gas purchased or sold at wholesale in the prior calendar year to the extent such transactions utilize, contribute to, or may contribute to the formation of price indices. It is the responsibility of the reporting entity to determine which individual transactions should be reported based on the guidance of Order 704. Order 704 is intended to increase the transparency of the wholesale gas markets and to assist FERC in monitoring those markets and in detecting market manipulation.
Additional rules and legislation pertaining to these matters are considered or adopted from time to time. We cannot predict what effect, if any, such changes might have on our operations, but the industry could be required to incur additional capital expenditures and increased costs depending on future legislative and regulatory changes.
27
Table of Contents
Our operation of pipelines, plants and other facilities for gathering, compressing, treating, processing, transporting or fractionating of natural gas, NGLs, condensate and other products is subject to stringent and complex laws and regulations pertaining to occupational health and safety and the environment. As an owner or operator of these facilities, we must comply with these laws and regulations at the federal, regional, state and local levels. These laws and regulations can restrict or impact our business activities in many ways, such as:
- •
- Requiring us to acquire permits or other approvals to conduct regulated activities;
- •
- restricting the way we can handle or dispose of wastes;
- •
- limiting or prohibiting construction and operating activities in environmentally sensitive areas such as wetlands, coastal regions, or areas inhabited by endangered species;
- •
- imposing specific health and safety criteria addressing worker protection;
- •
- requiring remedial action to mitigate pollution conditions caused by our operations or attributable to former operators; and
- •
- causing us to incur capital cost to construct, maintain and upgrade equipment and facilities.
Failure to comply with these laws and regulations may result in the assessment of administrative, civil and criminal penalties, the imposition of remedial requirements and the issuance of orders enjoining future operations. We believe that our operations are in substantial compliance with applicable environmental laws and regulations and that compliance with existing environmental laws and regulations will not have a material adverse effect on our business, financial position or results of operations. However, the trend in environmental regulation is to place more restrictions and limitations on activities that may affect the environment. As a result, there can be no assurance as to the amount or timing of future expenditures for environmental compliance or remediation, and actual future expenditures may be different from the amounts we currently anticipate.
The following is a summary of the more significant current environmental and occupational health and safety laws and regulations, as amended from time to time, to which our business operations are subject:
Hazardous Substances and Wastes. Our operations are subject to the federal Resource Conservation and Recovery Act ("RCRA"), and comparable state laws, which impose detailed requirements for the handling, storage, treatment and disposal of hazardous waste and non-hazardous solid waste. Under the authority of the U.S. Environmental Protection Agency ("EPA"), most states administer some or all of the RCRA, sometimes in conjunction with their own, more stringent requirements. We are not currently required to comply with a substantial portion of the RCRA requirements relating to hazardous waste because our operations generate minimal quantities of hazardous waste. However, such generated wastes remain subject to non-hazardous solid waste requirements and it is possible that some wastes generated by us that are currently classified as non-hazardous solid waste requirements and it is possible that some wastes generated by us that are currently classified as non-hazardous solid waste may in the future be designated as hazardous wastes, resulting in those wastes becoming subject to more rigorous and costly transportation, storage, treatment and/or disposal requirements. In the course of our operations, we also generate some amount of ordinary industrial wastes, such as paint wastes, wastes solvents, and waste oils that may be regulated as hazardous waste.
The Comprehensive Environmental Response, Compensation and Liability Act of 1980 ("CERCLA"), also known as "Superfund," and comparable state laws impose liability, without regard to fault or the legality of the original conduct, on certain classes of persons responsible for the release of hazardous substances into the environment. Such classes of persons include the current and past owners or operators of sites where a hazardous substance was released and companies that disposed or arranged for disposal of
28
Table of Contents
hazardous substances at offsite locations such as landfills. Although petroleum and natural gas are excluded from CERCLA's definition of "hazardous substance," in the course of our ordinary operations we generate wastes that fall within the definition of a "hazardous substance." CERCLA authorizes the EPA and, in some cases, third parties, to take actions in response to threats to the public health or the environment and to seek to recover from the responsible classes of persons the costs they incur. Under CERCLA, we could be subject to strict joint and several liabilities for the costs of cleaning up and restoring sites where hazardous substances have been released, for damages to natural resources and for the costs of certain health studies.
We currently own or lease, and have in the past owned or leased, numerous properties that for many years have been used for the measurement, field compression and processing of natural gas, as well as the gathering of natural gas or crude oil. Although we used operating and disposal practices that were standard in the industry at the time, petroleum hydrocarbons or wastes have been disposed of or released on or under some properties owned or leased by us or on or under other locations where such substances have been taken for disposal. Some of these properties have been operated by third parties whose treatment and disposal or release of petroleum hydrocarbons or wastes was not under our control. These properties and the substances disposed or released on them may be subject to CERCLA, RCRA and analogous state laws. Under such laws, we could be required to remove previously disposed wastes (including waste disposed of by prior owners or operators), remediate contaminated property (including groundwater contamination), or perform remedial closure operations to prevent future contamination. As of December 31, 2012, we have not received notification that any of our properties has been determined to be a current Superfund site under CERCLA.
Air Emissions. Our operations are subject to the federal Clean Air Act ("CAA") and comparable state laws and regulations. These laws and regulations restrict emissions of air pollutants from various industrial sources, including our processing plants and compressor stations and also impose various monitoring and reporting requirements. Such laws and regulations may require that we obtain pre-approval for the construction or modification of certain projects or facilities expected to produce air emissions or result in the increase of existing air emissions, obtain and comply with air permits containing various emissions and operational limitations, and use specific emission control technologies to limit emissions. We may be required to incur capital expenditures in the future for installation of air pollution control equipment and encounter construction or operational delays while applying for, or awaiting the review, processing and issuance of new or amended permits. For example, natural gas processing and fractioning facilities may be required to incur certain expenditures in the future for air control equipment in connection with obtaining and maintaining operating permits and approvals for emissions of pollutants. For example, on August 16, 2012, the EPA published final rules under the CAA that subject oil and natural gas production, processing, transmission and storage operations to regulation under the New Source Performance Standards ("NSPS") and National Emission Standards for Hazardous Air Pollutants ("NESHAP") programs. With regards to gathering and processing activities, these final rules, among other things, revise existing requirements for volatile organic compound emissions from equipment leaks at onshore natural gas processing plants by lowering the leak definition for valves from 10,000 parts per million to 500 parts per million and requiring the monitoring of connectors, pumps pressure relief devices and open-ended lines. In addition, these rules establish requirements regarding emissions from: (i) wet seal and reciprocating compressors at gathering systems, boosting facilities, and onshore natural gas processing plants, effective October 15, 2012; (ii) specified pneumatic controllers at gathering systems, boosting facilities, and onshore natural gas processing plants, effective October 15, 2013; and (iii) specified storage vessels at gathering systems, boosting facilities, and onshore natural gas processing plants , effective October 15, 2013. We are currently reviewing this new rule and assessing its potential impacts on our operations. Compliance with these requirements could increase our operational costs for gathering and processing activities, which costs could be significant. While we may be required to incur certain capital expenditures in the future for air pollution control equipment in connection with obtaining and maintaining operating permits and approvals for air emissions, we currently do not believe that our operations will
29
Table of Contents
be materially adversely affected by such requirements, and the requirements are not expected to be any more burdensome to us than to any other similarly situated companies.
Climate Change. In response to its published findings in December 2009 that emissions of carbon dioxide, methane, and other greenhouse gases ("GHGs") present an endangerment to public health and the environment, the EPA adopted regulations under existing provisions of the federal Clean Air Act ("CAA") establishing Prevention of Significant Deterioration ("PSD") construction and Title V operating permit requirements for large sources of GHG's that are potential major sources of GHG emissions. We could become subject to these Title V and PSD permitting requirements and be required to install "best available control technology" to limit emissions of GHG's from any new or significantly modified facilities that we may seek to construct in the future if such facilities emitted volumes of GHGs in excess of threshold permitting levels. The EPA has also adopted rules requiring the reporting of GHG emissions from specified emission sources in the United States on an annual basis, including, among others, certain onshore and offshore production and onshore oil and natural gas processing, fractioning, transmission, storage and distribution facilities, which include certain of our operation. We are monitoring GHG emissions at certain of our operations and believe that our monitoring activities are in substantial compliance with applicable reporting requirements. As a result, we may incur potentially significant added costs to comply or added capital expenditures for air pollution control equipment, or we may experience delays or possible curtailment of construction or projects in connection with maintaining or in applying or obtaining preconstruction and operating permits and we may encounter limitations in design capacities or facility sizes.
While the federal Congress has from time to time considered legislation to reduce emissions of GHGs, there has not been significant activity in the form of adopted legislation to reduce GHG emissions at the federal level in recent years. In the absence of federal climate legislation in the U.S., a number of state and regional efforts have emerged that are aimed at tracking and/or reducing GHG emissions by means of cap and trade programs that typically require major sources of GHG emissions, such as electric power plants, to acquire and surrender emission allowances in return for emitting those GHGs. If Congress undertakes comprehensive tax reform in the coming year, it is possible that such reform may include a carbon tax, which could impose additional direct costs on operations and reduce demand for refined products. Although it is not possible at this time to predict how legislation or new regulations that may be adopted to address GHG emissions would impact our business, any such future laws and regulations could require us to incur increased operating costs, such as costs to purchase and operate emissions control systems, to acquire emission allowances or comply with new regulatory or reporting requirements including the imposition of a carbon tax. Any such legislation or regulatory programs could also increase the cost of consuming, and thereby reduce demand for oil and natural gas produced by our exploration and production customers that, in turn, could adversely affect demand for natural gas and NGLs we gather and process or fractionate.
Finally, some scientists have concluded that increasing concentrations of GHGs in the Earth's atmosphere may produce climate change that could have significant physical effects, such as increased frequency and severity of storms, droughts, and floods and other climatic events; if such effects were to occur, they could have an adverse effect on our midstream operations.
Water Discharges. Our operations are subject to the Federal Water Pollution Control Act, also known as the Clean Water Act, and analogous state laws and regulations. These laws and regulations impose detailed requirements and strict controls regarding the discharge of pollutants into state and federal waters. The discharge of such pollutants, including petroleum hydrocarbon discharges resulting from a spill or leak incident, is prohibited unless authorized by a permit or other agency approval. Spill prevention, control and countermeasure requirements under federal law require appropriate containment berms and similar structures to help prevent the contamination of navigable waters in the event of a hydrocarbon tank spill, rupture or leaks. In addition, the Clean Water Act and analogous state law may require individual permits or coverage under general permits for discharges of stormwater from certain types of facilities.
30
Table of Contents
The Clean Water Act and regulations implemented thereunder also prohibit discharges of dredged and fill material in wetlands and other waters of the United States unless authorized by a permit. Any unpermitted release of pollutants from our pipelines or facilities could result in administrative, civil and criminal penalties and significant remedial obligations.
Hydraulic Fracturing. Hydraulic fracturing is an important and common practice that is used to stimulate production of natural gas and/or oil from dense subsurface rock formations. The hydraulic fracturing process involves the injection of water, sand, and chemicals under pressure into the formation to fracture the surrounding rock and stimulate production. Hydraulic fracturing typically is regulated by state oil and natural gas commissions, but the EPA has asserted federal regulatory authority pursuant to the federal Safe Drinking Water Act over certain hydraulic fracturing activities involving the use of diesel fuel and published draft permitting guidance in May 2012 addressing the performance of such activities using diesel fuels. In November 2011, the EPA announced its intent to develop and issue regulations under the Toxic Substances Control Act to require companies to disclose information regarding the chemicals used in hydraulic fracturing and the agency currently plans to issue a Notice of Proposed Rulemaking that would seek public input on the design and scope of such disclosure regulations. In addition, legislation has been introduced before Congress from time to time to provide for federal regulation of hydraulic fracturing under the Safe Drinking Water Act and to require disclosure of the chemicals used in the hydraulic fracturing process but no such legislation has thus far been adopted. At the state level, several states have adopted or are considering legal requirements that could impose more stringent permitting, disclosure, or well construction requirements on hydraulic fracturing activities. In the event that new or more stringent federal, state, or local legal restrictions relating to the hydraulic fracturing process are adopted in areas where our oil and natural gas exploration and production customers' operate, those customers could incur potentially significant added costs to comply with such requirements and experience delays or curtailment in the pursuit of exploration, development, or production activities, which could reduce demand for our gathering, processing and fractionation services. In addition, several governmental reviews have been conducted or are underway that focus on environmental aspects of hydraulic fracturing activities. The White House Council on Environmental Quality is coordinating an administration-wide review of hydraulic fracturing practices. The EPA has commenced a study of the potential environmental effects of hydraulic fracturing on drinking water and groundwater, with a first progress report outlining work currently underway by the agency released on December 21, 2012 and a final report drawing conclusions about the potential impacts of hydraulic fracturing on drinking water resources expected to be available for public comment and peer review by 2014. Moreover, the EPA is planning to develop effluent limitations for the treatment and discharge of wastewater resulting from hydraulic fracturing activities by 2014. Other governmental agencies, including the U.S. Department of Energy and the U.S. Department of the Interior have evaluated or, are evaluating various other aspects of hydraulic fracturing. These studies, depending on their degree of pursuit and any meaningful results obtained, could spur initiatives to further regulate hydraulic fracturing under the federal Safe Drinking Water Act or other regulatory mechanisms, which events could delay or curtail production of natural gas by exploration and production operators, some of which may be our customers, and thus reduce demand for our midstream services.
31
Table of Contents
Endangered Species Act and Migrating Bird Treaty Act Considerations. The federal Endangered Species Act ("ESA") and analogous state laws regulate activities that could have an adverse effect on threatened or endangered species. While some of our facilities may be located in, or otherwise serve, areas that are designated as habitat for endangered or threatened species, we believe that we are in substantial compliance with the ESA. However, the designation of previously unidentified endangered or threatened species could cause us to incur additional costs or become subject to operating restrictions or bans in the affected areas. For example, in March 2010, the U.S. Department of the Interior ("DOI") considered listing the sage grouse, a ground-dwelling bird that inhabits portions of the Rocky Mountains region, including Wyoming, where we have natural gas gathering operations, as an endangered species under the ESA. An Endangered Species Act designation could result in broad conservation measures restricting or even prohibiting natural gas exploration and production and expansion of our natural gas gathering activities in affected areas. The DOI determined that the sage grouse qualified for protection under the ESA but deferred listing it as endangered because of higher-priority listing commitments. Rather, an executive order (Order No. 2011-5) was issued by Wyoming current Governor Matt Mead that provided core areas of protection for the sage grouse, some of which affect areas near Bighorn's and Fort Union's gathering system. More recently, on February 10, 2012, the DOI issued an Instruction Memorandum (No.WY-2012-019) providing guidance to Bureau of Land Management Wyoming Field Offices regarding management considerations of sage grouse habitats for proposed activities until certain resources management planning updates are completed. This Instruction Memorandum, which is considered by the DOI to be consistent with the terms of Wyoming's Order No. 2011-5, expires on September 30, 2013. In addition, as a result of a settlement approved by the U.S. District Court of the District of Columbia in September 2011, the U.S. Fish and Wildlife Service is required to make a determination on listing or more than 250 species as endangered or threatened under the ESA through the agency's 2017 fiscal year. In consideration of the Wyoming and DOI pronouncements and actions to be taken by the U.S. Fish and Wildlife Service, developers of oil and natural gas activities in affected areas must, among other things, adhere to applicable habitat conservation measures relating to timing, distance, disturbance and density for proposed projects. The implementation of current or future requirements relating to implementation of habitat conservation measures or due to the designation of the sage grouse or other previously unprotected species as threatened or endangered in areas where we conduct operations or plan to construct pipelines or facilities could cause us to incur increased costs arising from species protection measures or could result in limitations on our customer's exploration and production activities, which could have an adverse impact on demand for our midstream operations.
The Migratory Bird Treaty Act implements various treaties and conventions between the United States and certain other nations for the protection of migratory birds. In accordance with this law, the taking, killing or possessing of migratory birds covered under this act is unlawful without a permit. If there is the potential to adversely affect migratory birds as a result of our operations or construction activities, we may be required to obtain necessary permits to conduct those operations or construction activities, which may result in specified operating or construction restrictions on a temporary, seasonal or permanent basis in affected areas and thus have an adverse impact on our ability to provide timely gathering, processing or fractionating services to our exploration and production customers.
Occupational Health and Safety. We are subject to a number of federal and state laws and regulations, including the federal Occupational Safety and Health Act ("OSHA") and comparable state laws that regulates the protection of the health and safety of workers. In addition, the OSHA hazard communication standard requires that certain information be maintained about hazardous materials used or produced in our operations and that this information be provided to employees, state and local government authorities and citizens. We believe that we have conducted our operations in substantial compliance with OSHA requirements.
32
Table of Contents
Pipeline Safety. Our natural gas and NGL pipelines are subject to regulation by the U.S. Department of Transportation ("DOT"), under the Natural Gas Pipeline Safety Act of 1968 ("NGPSA"), with respect to natural gas and the Hazardous Liquids Pipeline Safety Act of 1979 ("HLPSA"), with respect to hazardous liquids (including NGLs) pursuant to which the DOT has established requirements relating to the design, installation, testing, construction, operation, replacement and management of pipeline facilities. These pipeline safety laws are subject to further amendment if deemed necessary after study, with the potential for more onerous obligations and stringent standards being imposed on pipeline owners and operators. For example, on January 3, 2012, President Obama signed the Pipeline Safety, Regulatory Certainty, and Job Creation Act of 2011 ("2011 Pipeline Safety Act"), which act requires increased safety measures for gas and hazardous liquids transportation pipelines. Among other things, the 2011 Pipeline Safety Act directs the Secretary of Transportation to promulgate rules or standards relating to expanded integrity management requirements, automatic or remote-controlled valve use, excess flow valve use, and leak detection system installation. The 2011 Pipeline Safety Act also directs owners and operators of interstate and intrastate gas transmission pipelines to verify their records confirming the maximum allowable pressure of pipelines in certain class locations and high consequence areas, requires promulgation of regulations for conducting tests to confirm the material strength of pipe operating above 30% of specified minimum yield strength in high consequence areas, and increases the maximum penalty for violation of pipeline safety regulations from $100,000 to $200,000 per violation per day of violation and also from $1 million to $2 million for a related series of violations. The safety enhancement requirements and other provisions of the 2011 Pipeline Safety Act could require us to install new or modified safety controls, pursue additional capital projects, or conduct maintenance programs on an accelerated basis, any or all of which tasks could result in our incurring increased operating costs that could be significant and have a material adverse effect on our results of operations or financial position.
Our pipelines are also subject to regulation by the DOT under the Pipeline Safety Improvement Act of 2002, which was amended by the Pipeline Inspection, Protection, Enforcement and Safety Act of 2006 ("PIPES"). The DOT, through the Pipeline and Hazardous Materials Safety Administration ("PHMSA"), has established a series of rules which require pipeline operators to develop and implement integrity management programs for natural gas and hazardous liquid pipelines located in areas where the consequences of potential pipeline accidents pose the greatest risk to people and their property. In addition, pursuant to authorization granted by PIPES, the DOT's regulatory coverage extends to certain rural onshore hazardous liquid gathering lines and low-stress pipelines located in specified "unusually sensitive areas," including non-populated areas requiring extra protection because of the presence of sole source drinking water resources, endangered species or other ecological resources. Safety requirements imposed by this extended coverage include pipeline corrosion and third-party damage concerns but do not include pipeline integrity management criteria. Moreover, future amendment of these DOT rules may result in the implementation of more stringent pipeline safety standards that could cause us to incur increased operating costs, which costs could be significant. For instance, in August 2011, PHMSA published an advance notice of proposed rulemaking in which the agency is seeking public comment on a number of changes to regulations governing the safety of gas transmission pipelines and gathering lines, including, for example, (i) revising the definitions of "high consequence areas" and "gathering lines"; (ii) strengthening integrity management requirements as they apply to existing regulated operators and to currently exempt operators should certain exemptions be removed; (iii) strengthening requirements on the types of gas transmission pipeline integrity assessment methods that may be selected for use by operators; (iv) imposing gas transmission integrity management requirements on onshore gas gathering lines; (v) requiring the submission of annual, incident and safety-related conditions reports by operators of all gathering lines; and (vi) enhancing the current requirements for internal corrosion control of gathering lines.
States are largely preempted by federal law from regulating pipeline safety for interstate lines but most are certified by the DOT to assume responsibility for enforcing federal intrastate pipeline regulations and
33
Table of Contents
inspection of intrastate pipeline. In practice, because states can adopt stricter standards for intrastate pipelines than those imposed by the federal government for interstate lines, states vary considerably in their authority and capacity to address pipeline safety. The TRRC and the OCC have adopted regulations similar to existing DOT regulations for intrastate natural gas and hazardous liquid gathering and transmission lines, while the Wyoming Public Service Commission has done the same for intrastate natural gas gathering and transmission lines but not hazardous liquid lines. We do not anticipate any significant difficulty in complying with applicable state laws and regulations. Our pipelines have operations and maintenance plans designed to keep the facilities in compliance with pipeline safety requirements.
Office Facilities
We lease our executive offices in Houston, Texas, and Tulsa, Oklahoma. We also lease property or facilities for some of our field offices.
Employees
As of December 31, 2012, we had 415 employees, 408 of which were full-time. None of our employees are covered by collective bargaining agreements. We consider our relations with our employees to be good.
Available Information
We file annual, quarterly and other reports and other information with the Securities and Exchange Commission ("SEC") under the Securities Exchange Act of 1934 (the "Exchange Act"). You may read and copy any materials that we file with the SEC at the SEC's Public Reference Room at 100 F Street, NE, Washington, DC 20549. You may obtain additional information about the Public Reference Room by calling the SEC at 1-800-SEC-0330. In addition, the SEC maintains an Internet site (http://www.sec.gov) that contains reports, proxy and information statements and other information regarding issuers that file electronically with the SEC, including us.
We also make available free of charge on or through our website (http://www.copano.com) or through our Investor Relations group (713-621-9547), our Annual Reports on Form 10-K, Quarterly Reports on Form 10-Q, Current Reports on Form 8-K and other information statements and, if applicable, amendments to those reports filed or furnished pursuant to Section 13(a) or 15(d) of the Exchange Act, as soon as reasonably practicable after we electronically file such material with, or furnish it to, the SEC. Information on our website is not incorporated by reference into this report.
Item 1A. Risk Factors
In addition to the factors discussed elsewhere in this report, including the financial statements and related notes, you should consider carefully the risks and uncertainties described below, which could materially adversely affect our business, financial condition and results of operations. If any of these risks or uncertainties were to occur, our business, financial condition or results of operations could be adversely affected.
Risks Related to Our Business
We may not have sufficient cash after establishment of cash reserves to pay cash distributions at the current level.
We may not have sufficient cash each quarter to pay distributions at the current level. Under our limited liability company agreement, we set aside any cash reserve necessary for the conduct of our business before making a distribution to our unitholders. The amount of cash we have available for distribution is more a function of our cash flow than of our net income, which will be affected by non-cash items. As a result, we may make cash distributions during periods when we record losses and may not make cash distributions during periods when we record net income.
34
Table of Contents
The amount of cash we can distribute principally depends upon the cash we generate from operations, which will fluctuate from quarter to quarter based on, among other things:
- •
- the amount of natural gas gathered and transported on our pipelines;
- •
- the volume and NGL content of natural gas we process, and the volume of NGLs we fractionate;
- •
- the fees we charge and the margins we realize for our services;
- •
- the fees we pay to third parties for their services;
- •
- the prices of natural gas, NGLs, condensate and crude oil;
- •
- the relationship between natural gas and NGL prices;
- •
- the relationship between Mont Belvieu and Conway NGL prices;
- •
- the operational performance and efficiency of our assets, including our plants and equipment;
- •
- the operational performance and efficiency of third-party processing, fractionation or other facilities that provide services to us
- •
- the level of our operating costs and the impact of inflation on those costs; and
- •
- the weather in our operating areas.
In addition, the actual amount of cash we will have available for distribution will depend on other factors, including:
- •
- the amount of capital we spend on projects, the profitability of such projects and the timing of the associated cash flow;
- •
- the cost of any acquisitions we make;
- •
- the effectiveness of our hedging program;
- •
- the creditworthiness of our hedging, commercial and other contract counterparties;
- •
- the timing (monthly, quarterly or annual) of our producers' obligations to make volume deficiency payments to us;
- •
- performance by producers, customers and third-party service providers under their contracts with us;
- •
- our ability to borrow money and access capital markets on acceptable terms;
- •
- our debt service requirements;
- •
- fluctuations in our working capital needs;
- •
- restrictions on distributions imposed by our revolving credit facility and the indentures governing our senior unsecured notes;
- •
- restrictions on distributions by entities in which we own interests;
- •
- the amount of cash reserves established by our Board of Directors for the proper conduct of our business; and
- •
- prevailing economic conditions.
Some of the factors described above are beyond our control. If we decrease distributions, the market price for our units may be adversely affected.
35
Table of Contents
Our cash flow and profitability depend upon prices and market demand for natural gas, oil and NGLs, which are beyond our control and can be volatile.
Our cash flow and profitability are affected by prevailing NGL and natural gas prices, and we are subject to significant risks due to fluctuations in commodity prices. In the past, the prices of natural gas and NGLs have been extremely volatile, and we expect this volatility to recur periodically.
We derive approximately 36% of our gross margin from contracts with terms that are commodity price sensitive. As a result, our cash flow and profitability depend to a significant extent on the prices at which we buy and sell natural gas and at which we sell NGLs and condensate. The markets and prices for natural gas, condensate and NGLs depend upon many factors beyond our control. These factors include supply and demand for oil, natural gas, liquefied natural gas ("LNG"), nuclear energy, coal and NGLs, which fluctuate with changes in market and economic conditions and other factors, including:
- •
- the impact of weather on the demand for oil and natural gas;
- •
- the levels of domestic oil and natural gas production and NGL extraction;
- •
- storage levels for oil, condensate, natural gas, LNG and NGLs;
- •
- the availability of imported oil, condensate, natural gas, LNG and NGLs;
- •
- international demand for LNG, oil, condensate, NGLs and NGL derivative products such as ethylene and propylene;
- •
- actions taken by foreign oil and gas producing nations;
- •
- the availability of takeaway and delivery infrastructure for natural gas, NGLs and condensate;
- •
- the availability of downstream NGL fractionation facilities;
- •
- our proximity to markets for natural gas, condensate and NGLs and the degree to which markets are accessible generally;
- •
- the availability and marketing of competitive fuels;
- •
- the impact of energy conservation efforts; and
- •
- the extent of governmental regulation and taxation.
Changes in commodity prices may also indirectly impact our profitability by influencing drilling activity and well operations, and thus the volume of natural gas we gather and process. This volatility may cause our gross margin and cash flows to vary widely from period to period. We use commodity derivative instruments to hedge our exposure to commodity prices, but these instruments also are subject to inherent risks. Please read "— Our hedging activities do not eliminate our exposure to commodity price and interest rate risks and may reduce our cash flow and subject our earnings to increased volatility."
Because of the natural decline in production from existing wells, our success depends on our ability to continually connect new supplies of natural gas and NGLs.
Our pipeline systems and processing or fractionation facilities are connected to or dependent on natural gas fields and wells from which the production will naturally decline over time, which means that our cash flows associated with these wells will also decline over time. To maintain or increase throughput volumes on our pipeline systems and inlet volumes at our processing plants, we must continually connect new supplies of natural gas and NGLs. The primary factors affecting our ability to do so include the level of successful drilling activity near our gathering systems and our ability to compete with other midstream service providers for new natural gas supplies.
36
Table of Contents
Fluctuations in energy prices can greatly affect drilling and production rates and investments by third parties in the development of new oil and gas reserves. Drilling activity generally decreases as oil or gas prices decrease, or in the case of rich gas drilling supported by NGL prices, as NGL prices decrease. We have no control over the level of drilling activity in the areas of our operations or the rate at which production from a well will decline. In addition, we have no control over producers or their drilling and production decisions, which are affected by, among other things, prevailing and projected energy prices, drilling costs, the availability of drilling rigs, equipment, materials and labor for drilling and completing wells, demand for hydrocarbons, the level of reserves, geological considerations, governmental regulations and the availability and cost of capital.
We face strong competition in acquiring new natural gas supplies. Competitors to our pipeline operations include producers, major interstate and intrastate pipelines, and other natural gas gatherers and midstream companies. Competition for natural gas supplies is primarily based on the location of pipeline facilities, access to related services such as pipeline capacity and processing and NGL handling, contract terms, reputation, efficiency, flexibility and reliability.
If we are unable to maintain or increase the throughput on our pipeline systems because of decreased drilling activity, production declines, or competitive pressures, or for any other reason, then our business, results of operations, financial condition and ability to make cash distributions to our unitholders will be adversely affected.
We generally do not obtain reservoir engineering reports evaluating reserves dedicated to our pipeline systems; therefore, volumes of natural gas transported on our pipeline systems in the future could be less than we anticipate, which may cause our revenues and operating income to be less than we expect.
We generally do not obtain reservoir engineering reports evaluating natural gas reserves connected to our pipeline systems due to producers' general unwillingness to provide reserve information, as well as the cost of such evaluations. Accordingly, we do not have estimates of total reserves dedicated to our systems or the anticipated life of such reserves. If the total reserves or estimated life of reserves connected to our pipeline systems is less than we anticipate and we are unable to secure additional sources of natural gas, condensate or NGLs, the volumes of natural gas, condensate or NGLs that we gather and process or fractionate would likely decline. A sustained decline in natural gas, condensate, or NGL volumes would cause our revenues to be less than we expect, which could have a material adverse effect on our business, financial condition and our ability to make cash distributions to you.
We rely on third-party pipelines and other facilities in providing service to our customers. If one or more of these pipelines or facilities were to become capacity-constrained or unavailable, our cash flows, results of operations and financial condition could be adversely affected.
Our ability to provide service to our customers depends in part on the availability, proximity and capacity of third-party pipeline, processing, fractionation and other facilities, and because we do not own or operate these facilities, their continuing operation or availability is not within our control. For example, we rely on Kinder Morgan's Laredo-to-Katy pipeline to transport natural gas from Eagle Ford Gathering and several of our Texas gathering systems to our Houston Central complex, and we rely on Dow Hydrocarbon and Formosa to take delivery of NGLs from Houston Central. We rely on ONEOK Hydrocarbon to take delivery of NGLs from our Saint Jo plant and from several of our Oklahoma processing plants. We also depend on other third-party processing plants, pipelines and other facilities to provide our customers with processing, delivery, fractionation or transportation options.
Like us, these third-party service providers are subject to risks inherent in the midstream business, including capacity constraints, natural disasters and operational, mechanical or other hazards, as well as service interruptions for scheduled maintenance. The curtailments arising from these and similar circumstances may last from a few days to several months. NGL fractionation and transportation facilities and
37
Table of Contents
trucking services on which we depend are subject to increasing capacity constraints. Also, some third-party pipelines have minimum gas quality specifications that at times may limit or eliminate our transportation options.
If any of these facilities becomes unavailable or limited in its ability to provide services on which we depend, our cash flow and results of operations could be adversely affected. We would likely incur higher fees or other costs in arranging for alternatives. Any significant curtailment in gathering system or pipeline capacity, or significant delay in the construction of necessary processing and transportation facilities, would interfere with our ability to serve our customers. A delay, prolonged interruption or reduction of service on Kinder Morgan's pipeline or at Dow Hydrocarbon, Formosa, ONEOK Hydrocarbon, or another pipeline or facility on which we depend could hinder our ability to contract for additional natural gas and condensate services.
Constructing new assets subjects us to risks of project delays, cost overruns, and lower- or higher-than-anticipated volumes of natural gas, NGLs or condensate once a project is completed. Our operating cash flows from our capital projects may not be immediate or meet our expectations.
One of the ways we grow our business is by constructing additions or modifications to our existing facilities. We also construct new facilities, either near our existing operations or in new areas. We may be unable to complete construction projects on schedule, at the budgeted cost, or at all, which could have a material adverse effect on our business and results of operations. Construction projects require significant amounts of capital and involve numerous regulatory, environmental, political, legal, operational and geological uncertainties, many of which are beyond our control. These projects also involve numerous economic uncertainties, including the impact of inflation on project costs and the availability of required resources. For example, our ongoing projects include the installation of a 400 MMcf/d cryogenic processing facility at our Houston Central complex scheduled to be completed in 2014. We are unable to begin construction of this facility until we receive a permit from the Environmental Protection Agency, or EPA. Although we anticipate receiving the permit by mid-2013, the timing of the permit's issuance is out of our control. Our ability to fully benefit from our Eagle Ford Shale strategy is dependent on the timely completion of this facility.
Construction expenditures may occur over an extended period of time, yet we will not receive any material increases in cash flow until the project is completed and fully operational. Moreover, our cash flow from a project may be delayed or may not meet our expectations. Project specifications and expectations regarding cost, timing, asset performance, investment returns and other matters usually rely in part on the expertise of third parties such as producers whose gas we gather, engineers, technical experts and construction contractors. These estimates may prove to be inaccurate because of numerous operational, technological, geologic, economic and other uncertainties.
Estimates from producers regarding the timing, volume and composition of anticipated oil, gas, condensate or NGL production are subject to numerous uncertainties beyond our control and may prove to be inaccurate. When the composition of actual production differs significantly from estimates on which we rely to determine the capacity and operating specifications of new facilities, newly constructed, modified or expanded facilities may be unable to perform at the levels we expect. For the first four months of 2012, our operating results were negatively impacted by reduced operating performance at our Houston Central complex that was partly due to Eagle Ford Shale gas with higher-than-expected NGL content. Conversely, actual production delivered may fall below volume estimates on which we rely. In either case, we may be unable to achieve our expected cash flow and investment returns. Please read Item 7., "Management's Discussion and Analysis of Financial Condition and Results of Operations — Trends and Uncertainties — Outlook."
We also construct assets in reliance on firm capacity commitments for third-party processing or fractionation downstream of our facilities. For example, we made processing commitments at our Houston
38
Table of Contents
Central complex and constructed the Liberty NGL pipeline through our joint venture with Energy Transfer in reliance on Formosa's capacity commitment to us, which requires Formosa to expand its facilities. If Formosa is unable to meet its commitment to us, or if other third-party facilities underperform or are not available when we expect them, our cash flows and results of operations would be adversely affected.
Competition could negatively affect us.
Our industry is highly competitive. Our competitors may expand or construct midstream systems that would create additional competition for the services we provide to our customers. Some of our competitors are large companies that have greater financial resources and access to supplies of oil, condensate, natural gas and NGLs than we do. We frequently have one or more competitors in the supply basins and markets that we are connected to. This includes new large pipeline systems that have recently been constructed near our assets, and growing competition in the markets that we serve. In addition, our customers may develop their own midstream systems in lieu of using ours. This competition could result in our inability to obtain new supplies, renew contracts and to maintain rates and transportation volumes, any of which could have a material adverse effect on our business, results of operations, financial condition and ability to make cash distributions to our unitholders.
Competition for hiring experienced personnel, particularly in the commercial, engineering, field operations, accounting and financial reporting, tax and land departments, has been strong. In addition, competition to acquire attractive midstream assets has been strong. We may often be outbid by competitors in our attempts to make acquisitions. Our inability to compete effectively in hiring or making acquisitions could have a material adverse impact on our ability to grow.
We are exposed to the credit risk of our customers and other counterparties. A general increase in nonpayment and nonperformance by counterparties could adversely affect our cash flows, results of operations and financial condition.
Risks of nonpayment and nonperformance by our counterparties are a major concern in our business. We are subject to risks of loss resulting from nonpayment or nonperformance by our customers and other counterparties, such as our lenders and hedging counterparties. Our shift toward a more fee-based contract portfolio means that we are increasingly reliant on the creditworthiness of customers who make fee-based volume commitments, many of which contain deficiency fees for failure to deliver volumes to us. Many of our customers finance their activities through cash flow from operations or debt or equity financing, all of which are subject to adverse changes in commodity prices and economic and market conditions. When commodity prices have been unfavorable for an extended period, some of our customers have experienced a combination of lower cash flow due to commodity prices, reduced borrowing bases under reserve-based credit facilities and reduced availability of debt or equity financing. These factors may result in a significant reduction in our customers' liquidity and ability to pay us or otherwise perform on their obligations to us. Furthermore, some of our customers may be highly leveraged and subject to their own credit, operating and regulatory risks, which increases the risk that they may default on their obligations to us.
Any increase in nonpayment and nonperformance by our counterparties, either as a result of financial and economic conditions or otherwise, could have an adverse impact on our operating results and could adversely affect our liquidity.
Our substantial indebtedness could limit our operating and financing flexibility and impair our ability to fulfill our obligations.
We have substantial indebtedness. As of February 20, 2013, we had total indebtedness of $1 billion, including our senior unsecured notes and our revolving credit facility, and available borrowing capacity under our revolving credit facility was approximately $271 million. We may incur significant additional
39
Table of Contents
indebtedness and other financial obligations in the future. Our substantial indebtedness and other financial obligations could have important consequences to you. For example, these obligations could:
- •
- require us to dedicate a substantial portion of our cash flow to payments on our indebtedness and other financial obligations, thereby reducing the availability of our cash flow to fund working capital, capital expenditures and other general company requirements;
- •
- make it more difficult for us to satisfy our debt service requirements or comply with financial or other covenants in our debt agreements;
- •
- impair our ability to obtain additional financing in the future for working capital, capital expenditures, acquisitions, general company purposes or other purposes;
- •
- result in higher interest expense if interest rates increase;
- •
- limit our flexibility in planning for, or reacting to, changes in our business and the industry in which we operate; and
- •
- place us at a disadvantage relative to any competitors that have proportionately less debt or lower borrowing costs.
If we are unable to meet our debt service and other financial obligations or comply with our debt covenants, we could be forced to restructure or refinance our indebtedness, in which case our lenders could require us to suspend cash distributions, or seek additional equity capital or sell assets. We may be unable to obtain such refinancing or equity capital or sell assets on satisfactory terms, if at all. Failure to meet our debt service and other financial obligations could result in defaults under our debt agreements, which, if not cured or waived, would lead to acceleration of our debt and other financial obligations. If we were unable to repay those obligations, our lenders could initiate a bankruptcy proceeding or liquidation proceeding or proceed against any collateral.
Restrictive covenants in the agreements governing our indebtedness may reduce our operating flexibility.
The indentures governing our outstanding senior unsecured notes contain various covenants that limit our ability to, among other things:
- •
- sell assets;
- •
- pay distributions on, redeem or repurchase our equity interests or redeem or repurchase our subordinated debt, if any;
- •
- make investments;
- •
- incur or guarantee additional indebtedness or issue preferred units;
- •
- create or incur certain liens;
- •
- enter into agreements that restrict distributions or other payments from our restricted subsidiaries to us;
- •
- consolidate, merge or transfer all or substantially all of our assets;
- •
- engage in transactions with affiliates;
- •
- create unrestricted subsidiaries;
- •
- enter into sale and leaseback transactions; and
- •
- enter into letters of credit.
40
Table of Contents
Our revolving credit facility contains similar covenants, as well as covenants that require us to maintain specified financial ratios and satisfy other financial conditions. The restrictive covenants in our indentures and our revolving credit facility could limit our ability to obtain future financings, make needed capital expenditures, withstand a future downturn in our business or in the economy in general, or conduct operations.
In addition, Fort Union, in which we own a 37.04% interest, has debt outstanding under an agreement that includes, among other customary covenants and events of default, a limitation on its ability to make cash distributions. Fort Union can distribute cash to its members only if its ratio of net operating cash flow to debt service is not less than 1.25 to 1.00 and it is not otherwise in default under its credit agreement. If Fort Union fails to comply with this covenant or otherwise defaults under its credit agreement, it would be prohibited from distributing cash to us, and its lenders could accelerate its repayment obligations, both of which would adversely affect our cash flow.
We may be unable to raise capital necessary to fully execute our business strategy on satisfactory terms, or at all.
Our business strategy contemplates pursuing capital projects and acquisitions. We regularly consider and enter into discussions regarding strategic projects or transactions that we believe will present opportunities to pursue our growth strategy. We will require substantial new capital to finance strategic acquisitions or to complete significant organic expansion or greenfield projects. If capital becomes too expensive, our ability to develop or acquire accretive assets will be limited.
The availability and cost of debt and equity capital are subject to general economic conditions and perceptions about the stability of financial markets and the solvency of counterparties. Adverse changes in these factors likely would result in higher interest rates and deterioration in the availability and cost of debt and equity financing. Any limitations on our access to capital will impair our ability to execute our growth strategy.
If capital on acceptable terms is not available to us, our inability to fully execute our growth strategy, otherwise take advantage of business opportunities or respond to competitive pressures could have a material adverse effect on our results of operations and financial condition. Illiquid capital markets could also limit investment and development by third parties, such as producers and end-users, which could indirectly affect our ability to fully execute our business strategy.
Our ability to obtain funding under our revolving credit facility could be impaired by conditions in the financial markets.
We rely on our revolving credit facility to finance a significant portion of our capital expenditures. Our ability to borrow under our revolving credit facility is subject to conditions in the financial markets, including the solvency of institutional lenders.
If we are unable to access funds under our revolving credit facility, we would need to meet our capital requirements using other sources which, depending on economic conditions, may not be available on acceptable terms. If the cash generated from our operations or the funds we are able to obtain under our revolving credit facility or other sources of liquidity are not sufficient to meet our capital requirements, then we may need to delay or abandon expansion projects or other business opportunities, which could have a material adverse effect on our results of operations and financial condition.
41
Table of Contents
Our business involves many hazards and operational risks, some of which may not be fully covered by insurance. If a significant accident or event occurs, that is not fully insured, our operations could be temporarily or permanently impaired, and our liabilities and expenses could be significant.
Our operations are subject to the many hazards inherent in the gathering, compression, treating, processing, transportation, and fractionation of natural gas and NGLs, including:
- •
- damage to pipelines, pipeline blockages and damage to related equipment and surrounding properties caused by hurricanes, tornadoes, floods, fires, extreme weather conditions and other natural disasters and acts of terrorism;
- •
- inadvertent damage from motor vehicles, construction or farm equipment;
- •
- leaks of natural gas, NGLs, condensate and other hydrocarbons;
- •
- environmental hazards, such as oil and NGL releases, pipeline or tank ruptures, and unauthorized discharges of toxic gases or other pollutants into the surface and subsurface environment;
- •
- operator error; and
- •
- fires and explosions.
These risks could result in substantial losses due to personal injury and/or loss of life, severe damage to and destruction of property and equipment and pollution or other environmental damage and may result in curtailment or suspension of our related operations. In addition, mechanical malfunctions, undetected leaks in pipelines, faulty measurement or other errors may result in significant costs or lost revenues. Our assets and operations are primarily concentrated in south and north Texas, central and eastern Oklahoma and in Wyoming, and a natural disaster or other hazard affecting any of these areas could have a material adverse effect on our operations, even if our own facilities are not directly affected.
There can be no assurance that insurance will cover all damages and losses resulting from these types of natural disasters. We are not fully insured against all risks incident to our business. In accordance with typical industry practice, we generally do not have any property insurance on any of our underground pipeline systems that would cover damage to the pipelines. We are not insured against all environmental accidents that might occur, other than those considered to be sudden and accidental. Our business interruption insurance provides limited coverage for lost revenues arising from physical damage to our processing plants and certain third-party facilities on which we depend, subject to deductibles and time and dollar limitations. If a significant accident or event occurs, that is not fully insured, our operations could be temporarily or permanently impaired, and our liabilities and expenses could be significant.
Due to our limited asset diversification, adverse developments in our gathering, transportation, processing and related businesses would have a significant impact on our results of operations.
Substantially all of our revenues are generated from our midstream services business, and as a result, our financial condition depends upon prices of, and continued demand for, natural gas, crude oil, NGLs and condensate. Furthermore, substantially all of our assets are located in Texas, Oklahoma and Wyoming. Due to our limited diversification in asset type and location, an adverse development in the midstream business or in one or more of these areas would have a significantly greater impact on our cash flows, results of operations and financial condition than if we maintained more diverse assets.
If we make acquisitions that do not perform as expected, our financial performance may be negatively impacted.
Our business strategy includes making acquisitions that we anticipate would increase the cash available for distribution to our unitholders. As a result, from time to time, we evaluate and pursue assets and businesses that we believe complement our existing operations or expand our operations into new regions where our growth strategy can be applied. We cannot assure you that we will be able to complete
42
Table of Contents
acquisitions in the future or achieve the desired results from any acquisitions we do complete. In addition, failure to successfully integrate our acquisitions could adversely affect our financial condition and results of operations.
Our acquisitions potentially involve numerous risks, including:
- •
- operating a significantly larger combined organization and adding operations;
- •
- difficulties in integrating the assets and operations of the acquired businesses, especially if the assets acquired are in a new type of midstream business or a new geographic area;
- •
- the risk that natural gas production expected to support the acquired assets may not be of the anticipated magnitude or may not be developed on the anticipated timetable, or at all;
- •
- the loss of significant producers or markets or key employees from the acquired businesses;
- •
- diversion of management's attention from other business concerns;
- •
- failure to realize expected profitability or growth;
- •
- failure to realize any expected synergies and cost savings;
- •
- exposure to increased competition;
- •
- coordinating geographically disparate organizations, systems and facilities;
- •
- coordinating or consolidating information technology, compliance under the Sarbanes-Oxley Act of 2002 and other administrative or compliance functions; and
- •
- a decrease in liquidity and increased leverage as a result of using significant amounts of available cash or debt to finance an acquisition.
Further, unexpected costs and challenges may arise whenever businesses with different operations or management are combined, and we may experience unanticipated delays in realizing the benefits of an acquisition. Because of these risks and challenges, even when we make acquisitions that we believe will increase our ability to distribute cash, those acquisitions may nevertheless reduce our cash from operations on a per unit basis. This could result in lower distributions to our common unitholders and make compliance with financial covenants under our debt agreements more difficult, and, if an acquisition's performance does not improve, could ultimately require us to record an impairment of our interest in the acquired company or assets. Although our capitalization and results of operations may change significantly following an acquisition, you may not have the opportunity to evaluate the economic, financial and other relevant information that we will consider in evaluating future acquisitions.
We own interests in limited liability companies and a general partnership in which third parties also own interests, which limits our ability to influence significant business decisions affecting these entities.
In addition to our wholly owned subsidiaries, we own interests in a number of entities in which third parties also own an interest. These interests include our:
- •
- 62.5% interest in Webb Duval;
- •
- majority interest in Southern Dome;
- •
- 51% interest in Bighorn;
- •
- 37.04% interest in Fort Union;
- •
- 50% interest in Eagle Ford Gathering;
- •
- 50% interest in Liberty Pipeline Group; and
43
Table of Contents
- •
- 50% interest in Double Eagle Pipeline.
We serve each of these entities as operator, managing member or both, but we do not control any of them. Our ability to make certain substantive business decisions with respect to each is subject to the majority or unanimous approval of the owners or, in the case of Bighorn, of a management committee to which we have the right to appoint 50% of the members. Examples of decisions that require approval include significant expenditures or contractual commitments, the construction or acquisition of assets, borrowing money or otherwise raising capital and transactions not in the ordinary course of business, among others. Differences in views among the owners of any of these entities could result in delayed decisions or in failures to agree on significant matters, potentially adversely affecting the business and results of operations or prospects of the entity involved and, in turn, the amounts and timing of cash from operations distributed to its members or partners, including us.
In addition, we do not control the day-to-day operations of Fort Union. Our lack of control over Fort Union's day-to-day operations and the associated costs of operations could result in our receiving lower cash distributions than we anticipate which could reduce our cash flow available for distribution to our unitholders.
We do not own all of the land on which our pipelines and other facilities are located, so our growth projects and operations could be disrupted by actions of the landowners.
We lease the sites on which some of our facilities are located, and we obtain rights-of-way to construct and operate our pipelines on land owned by third parties and governmental agencies for specified periods of time. We may be unable to obtain rights-of-way to connect new natural gas supplies to our existing gathering lines or capitalize on other expansion opportunities. Additionally, acquiring rights-of-way or lease renewals may be more expensive than we anticipate. If a significant existing lease or significant existing right-of-way contract lapses, is terminated or is determined to be invalid, we are subject to the possibility of more onerous terms or increased costs to retain necessary land use. Our inability to obtain or to renew right-of-way contracts or leases could have a material adverse effect on our business, results of operations and financial condition and our ability to make cash distributions.
Failure of the natural gas, NGLs, condensate or other products produced at our plants or shipped on our pipelines to meet the specifications of interconnecting pipelines or markets could result in curtailments by the pipelines or markets.
The markets and pipelines to which we deliver natural gas, NGLs, condensate or other products typically establish specifications for the products that they are willing to accept. These specifications include requirements such as hydrocarbon dewpoint, composition, temperature, and foreign content (such as water, sulfur, methane, carbon dioxide, nitrogen and hydrogen sulfide), and these specifications can vary by product, pipeline or markets. If the total mix of a product that we deliver to a pipeline or market fails to meet the applicable product quality specifications, the pipeline or market may refuse to accept all or a part of the products scheduled for delivery to it or may invoice us for the costs to handle the out-of-specification products. In those circumstances, we may be required to find alternative markets for that product or to shut-in the producers of the non-conforming natural gas that is causing the products to be out of specification, potentially reducing our throughput volumes or revenues. Changes in product quality specifications or changes in the quality of gas we receive from producers could reduce our throughput volumes or require us to incur additional handling costs or significant capital costs for new equipment such as nitrogen rejection or amine treating facilities. We may be unable to recover these costs through increased revenues.
44
Table of Contents
Our hedging activities do not eliminate our exposure to commodity price and interest rate risks and may reduce our cash flow and subject our earnings to increased volatility.
Our operations expose us to fluctuations in commodity prices, and our revolving credit facility exposes us to fluctuations in interest rates. We attempt to reduce our sensitivity to commodity prices and interest rates using contract terms, financing practices (mix of fixed and floating-rate debt) and derivative financial instruments. To the extent that we use derivative financial instruments, the degree of our exposure is related largely to the effectiveness and scope of our hedging activities. We have hedged only portions of our expected NGL and condensate volumes and currently have no interest-rate hedges. Accordingly, we continue to have direct risk with respect to both interest rates and our unhedged commodity volumes. In addition, our hedging strategies cannot offset volume risk.
Our ability to enter into new derivative instruments is subject to general economic and market conditions. The markets for instruments we use to hedge our commodity price and interest rate exposure generally reflect conditions in the underlying commodity and debt markets, and to the extent conditions in underlying markets are unfavorable, our ability to enter into new derivative instruments on acceptable terms will be limited. In addition, to the extent, we hedge our commodity price and interest rate risks using swap instruments, we will forego the benefits of favorable changes in commodity prices or interest rates.
Our hedging activity may be ineffective or adversely affect our cash flow and liquidity, our earnings or both because, among other factors:
- •
- hedging can be expensive, particularly during periods of volatile prices or when hedging into extended future periods;
- •
- our counterparty in the hedging transaction may default on its obligation to pay; and
- •
- available hedges may not correspond precisely with the risks against which we seek protection. For example:
- •
- the duration of a hedge may not match the duration of the risk against which we seek protection;
- •
- variations in the index we use to price a commodity hedge may not adequately correlate with variations in the index we use to sell the physical commodity (known as basis risk); or
- •
- we may not produce or process sufficient volumes to cover swap arrangements we enter into for a given period. If our actual volumes are lower than the volumes we estimated when entering into a swap for the period, we might be forced to satisfy all or a portion of our derivative obligation without the benefit of cash flow from our sale or purchase of the underlying physical commodity.
In 2012, basis risk materialized as a significant factor affecting our hedges for Oklahoma NGLs, because the hedges were priced at Mont Belvieu, while the physical commodity was priced at Conway. The basis spread between these indices reached historic highs, and while the prices we actually received for Oklahoma NGLs were below the strike prices for our hedges, we did not benefit because our hedges were based on Mont Belvieu prices, which remained above our hedge strike prices. Our financial statements may reflect gains or losses arising from exposure to commodity prices or interest rates for which we are unable to enter into fully economically effective hedges. In addition, the standards for cash flow hedge accounting are rigorous. Even when we engage in hedging transactions that are effective economically, these transactions may not be considered effective cash flow hedges for accounting purposes. Our earnings could be subject to increased volatility to the extent our derivatives do not continue to qualify as cash flow hedges, and, if we assume derivatives as part of an acquisition, to the extent we cannot obtain or choose not to seek cash flow hedge accounting for the derivatives we assume.
45
Table of Contents
The enactment of derivatives legislation could have an adverse effect on our ability to use derivative instruments to hedge risks associated with our business.
On July 21, 2010, new comprehensive financial reform legislation, known as the Dodd-Frank Wall Street Reform and Consumer Protection Act ("Dodd-Frank"), was enacted that establishes federal oversight and regulation of the over-the-counter derivatives market and entities, including businesses like ours, that participate in that market. Dodd-Frank requires the CFTC, the SEC and other regulators to promulgate rules and regulations implementing the new legislation. In its rulemaking under Dodd-Frank, the CFTC has issued final regulations to set position limits for certain futures and option contracts in the major energy markets and for swaps that are their economic equivalents. Certain bona fide hedging transactions would be exempt from these position limits. The position limits rule was vacated by the United States District Court for the District of Colombia in September 2012, although the CFTC has stated that it will appeal the District Court's decision. The CFTC also has finalized other regulations, including critical rulemakings on the definition of "swap," "security-based swap," "swap dealer" and "major swap participant." Dodd-Frank and CFTC Rules also will require us in connection with certain derivatives activities to comply with clearing and trade-execution requirements (or take steps to qualify for an exemption to such requirements). In addition new regulations may require us to comply with margin requirements although these regulations are not finalized and their application to us is uncertain at this time. Other regulations also remain to be finalized, and the CFTC recently has delayed the compliance dates for various regulations already finalized. As a result it is not possible at this time to predict with certainty the full effects of Dodd-Frank and CFTC rules on us and the timing of such effects. Dodd-Frank also may require the counterparties to our derivative instruments to spin off some of their derivatives activities to a separate entity, which may not be as creditworthy as the current counterparty.
Dodd-Frank and any new regulations could significantly increase the cost of derivatives contracts (including from swap recordkeeping and reporting requirements and through requirements to post collateral which could adversely affect our available liquidity), materially alter the terms of derivatives contracts, reduce the availability of derivatives to protect against risks we encounter, reduce our ability to monetize or restructure our existing derivatives contracts, and increase our exposure to less creditworthy counterparties. If we reduce our use of derivatives as a result of Dodd-Frank and regulations, our results of operations may become more volatile and our cash flows may be less predictable, which could adversely affect our ability to plan for and fund capital expenditures. Finally, Dodd-Frank was intended, in part, to reduce the volatility of oil and natural gas prices, which some legislators attributed to speculative trading in derivatives and commodity instruments related to oil and natural gas. Our revenues could therefore be adversely affected if a consequence of Dodd-Frank and regulations is to lower commodity prices. Any of these consequences could have a material adverse effect on our business, our financial condition, and our results of operations.
Our sales of natural gas and NGLs and related hedging activities expose us to potential regulatory risks.
The Federal Trade Commission, the FERC and the Commodity Futures Trading Commission hold statutory authority to monitor certain segments of the physical and futures energy commodities markets. These agencies have imposed broad regulations prohibiting fraud and manipulation of such markets. With regard to our physical sales of natural gas and NGLs, and any related hedging activities that we undertake, we are required to observe the market-related regulations enforced by these agencies, which hold substantial enforcement authority. Our sales may also be subject to certain reporting and other requirements. Should we violate the anti-market manipulation laws and regulations, we could also be subject to related third-party damage claims by, among others, sellers, royalty owners and taxing authorities. Failure to comply with such regulations, as interpreted and enforced, could have a material adverse effect on our business, results of operations, financial condition, and our ability to make cash distributions to our unitholders.
46
Table of Contents
Our acquisitions could expose us to potential significant liabilities.
We generally assume the liabilities of entities that we acquire and may assume certain liabilities relating to assets that we acquire, including unknown and contingent liabilities. We perform due diligence in connection with our acquisitions and attempt to verify the representations of the sellers, but there may be pending, threatened, contemplated or contingent claims related to environmental, title, regulatory, litigation or other matters of which we are unaware. We may have indemnification claims against sellers for certain of these liabilities, as well as for disclosed liabilities, but our indemnification rights generally will be limited in amount and duration. Our right to indemnification also will be limited, as a practical matter, to the creditworthiness of the indemnifying party. If our right to indemnification is inadequate to cover the obligations of an acquired entity or relating to acquired assets, or if our indemnifying seller is unable to meet its obligations to us, our liability for such obligations could materially adversely affect our cash flow, operations and financial condition.
Federal, state, or local regulatory measures could adversely affect our business.
Our pipeline transportation and gathering systems are subject to federal, state and local regulation. Most of our natural gas pipelines are gathering systems that are considered non-utilities in the states in which they are located. Several of our pipelines in Texas are subject to regulation as gas utilities by the TRRC. The states in which we operate have complaint-based regulation of natural gas gathering activities. Natural gas producers, shippers and other affected parties may file complaints with state regulators relating to natural gas gathering access and discrimination with regard to rates and terms of service, or, with respect to our gas utility pipelines in Texas, challenging the rates we charge for utility transportation service. Other state laws and regulations may not directly regulate our business, but may nonetheless affect the availability of natural gas for gathering, purchase, processing and sale, including state regulation of production rates and maximum daily production allowables from gas wells. A successful complaint, or new laws or regulatory rulings related to gathering, downstream quality specifications or natural gas utilities, could increase our costs or require us to alter our gathering or utility services charges and our business.
To the extent that our intrastate transmission pipeline in Texas transports natural gas in interstate commerce, the rates, terms and conditions of that transportation service are subject to regulation by the FERC pursuant to Section 311 of the NGPA. If our Section 311 rates are successfully challenged, if we are unable to include all of our costs in the cost of service approved in a future rate case, or if FERC changes its regulations or policies or establishes more onerous terms and conditions applicable to Section 311 service, our margins relating to this activity would be adversely affected.
We also have transportation contracts with interstate pipelines that are subject to FERC regulation. As a shipper on an interstate pipeline, we are subject to FERC requirements related to use of the interstate capacity. Any failure on our part to comply with the FERC's regulations or an interstate pipeline's tariff could result in the imposition of administrative, civil and criminal penalties.
Existing and other new laws and regulations or any administrative or judicial re-interpretations of existing laws, regulations or agreements could impose increased costs and administrative burdens on us, and our business, results of operations and financial condition could be adversely affected. In addition, laws and regulations affecting producers to whom we provide our services could have adverse effects on us to the extent they affect production in our operating areas. For instance, the U.S. Supreme Court is adjudicating a dispute between the States of Montana and Wyoming over water rights in two rivers that flow through both states. Montana is asserting that Wyoming uses too much water from the Tongue and Powder Rivers pursuant to the Yellowstone River Compact, an agreement that both states entered into in 1950. Montana argues that the Compact applies to groundwater, and that coal bed methane production in Wyoming, which involves the pumping of large quantities of groundwater, is depleting the two rivers in violation of the Compact. Montana has asked the Supreme Court to declare Montana's right to, and to order Wyoming to deliver, the waters of these two rivers to Montana in accord with the Compact. In a
47
Table of Contents
February 2010 ruling on Wyoming's motion to dismiss, the special master appointed by the Supreme Court concluded that the Compact protects Montana from at least some forms of groundwater pumping but left the question of the exact circumstances under which groundwater pumping violates the Compact to subsequent proceedings in the case. Any decision by the Supreme Court that effectively limits the amount of groundwater pumped in connection with coal bed methane production in Wyoming may have significant adverse effects on natural gas production in affected areas of Wyoming and, correspondingly, on gathering services that Bighorn and Fort Union provide.
If producer drilling activity declines or is delayed due to increased costs or operating restrictions relating to regulation of hydraulic fracturing, we could be adversely affected.
Hydraulic fracturing is an important and common practice that producers use to stimulate production of hydrocarbons, particularly natural gas, from tight formations. The process involves the injection of water, sand and chemicals under pressure into formations to fracture the surrounding rock and stimulate production. The process is typically regulated by state oil and gas commissions. However, the EPA has asserted federal regulatory authority under the Federal Safe Drinking Water Act over hydraulic fracturing involving the use of diesel and published draft permitting guidance in May 2012 addressing the performance of such activities using diesel fuels. In addition, legislation has been introduced before Congress from time to time to provide for federal regulation of hydraulic fracturing under the Safe Drinking Water Act and to require disclosure of the chemicals used in the hydraulic fracturing process. At the state level, some states, including Wyoming and Texas, have adopted and other states are considering adopting legal requirements that could impose more stringent permitting, disclosure, and well construction requirements on hydraulic fracturing activities. In the event that new or more stringent federal, state, or local legal restrictions relating to the hydraulic fracturing process are adopted in areas where our oil and natural gas exploration and production customers operate, those customers could incur potentially significant added costs to comply with such requirements and experience delays or curtailment in the pursuit of production or development activities, which could reduce demand for our midstream services. In addition, certain governmental reviews are either underway or being proposed that focus on environmental aspects of hydraulic fracturing practices. The White House Council on Environmental Quality is coordinating an administration-wide review of hydraulic fracturing practices, and the EPA has commenced a study of the potential environmental effects of hydraulic fracturing on drinking water and groundwater, with a first progress report outlining work currently underway by the agency released on December 21, 2012 and a final report drawing conclusions about the potential impacts of hydraulic fracturing on drinking water resources expected to be available for public comment and peer review by 2014. Other governmental agencies, including the U.S. Department of Energy and the DOI have evaluated or are evaluating various other aspects of hydraulic fracturing. These ongoing or proposed studies, depending on their degree of pursuit and any meaningful results obtained, could spur initiatives to further regulate hydraulic fracturing under the federal Safe Drinking Water Act or other regulatory mechanisms, which events could delay or curtail production of natural gas by exploration and production operators, some of which are our customers, and thus reduce demand for our midstream services.
A change in the characterization of some of our assets by federal, state or local regulatory agencies could adversely affect our business.
Section 1(b) of the NGA provides that the FERC's rate and service jurisdiction does not extend to facilities used for the production or gathering of natural gas. "Gathering" is not specifically defined by the NGA or its implementing regulations, and there is no bright-line test for determining the jurisdictional status of pipeline facilities. Although some guidance is provided by case law, the process of determining whether facilities constitute gathering facilities for purposes of regulation under the NGA is fact-specific and subject to regulatory change. Additionally, our construction, expansion, extension or alteration of pipeline facilities may involve regulatory, environmental, political and legal uncertainties, including the possibility that physical changes to our pipeline systems may be deemed to affect their jurisdictional status.
48
Table of Contents
The distinction between FERC-regulated interstate natural gas transmission services and federally unregulated gathering services has been the subject of litigation from time to time, as has been the line between intrastate and interstate transportation services. Thus, the classification and regulation of some of our natural gas gathering facilities and our intrastate transportation pipeline may be subject to change based on future determinations by the FERC and/or the courts. Should any of our natural gas gathering or intrastate facilities be deemed to be jurisdictional under the NGA, we could be required to comply with numerous federal requirements for interstate service, including laws and regulations governing the rates charged for interstate transportation services, the terms and conditions of service, certification and construction of new facilities, the extension or abandonment of services and facilities, the maintenance of accounts and records, the initiation and discontinuation of services, the monitoring and posting of real-time system information and many other requirements. Failure to comply with all applicable FERC-administered statutes, rules, regulations and orders could result in substantial penalties and fines. It is also possible that our gathering facilities could be deemed by a relevant state commission or court, or by a change in law or regulation, to constitute intrastate pipelines subject to general state law and regulation of rates and terms and conditions of service. A change in jurisdictional status through litigation or legislation could require significant changes to the rates and terms and conditions of service on the affected pipeline, and could increase the expense of providing service and adversely affect our business.
The distinction between FERC-regulated common carriage of NGLs, and the non-jurisdictional intrastate transportation of NGLs, has also been the subject of litigation. To the extent any of our NGL assets are found to be subject to FERC jurisdiction, the FERC's rate-making methodologies could limit our ability to set rates that we might otherwise be able to charge, could delay the use of rates that reflect increased costs and could subject us to potentially burdensome and expensive operational, reporting and other requirements. Any of the foregoing could adversely affect our business, revenues and cash flow.
Climate change legislation or regulations restricting emissions of "GHGs" could result in increased operating costs and reduced demand for our midstream services.
In response to its published findings that emissions of GHGs present an endangerment to public health and the environment because emissions of such gases are contributing to the warming of the earth's atmosphere and other climate changes, the EPA has adopted regulations under existing provisions of the CAA establishing PSD construction and Title V operating permit requirement for large sources of GHG's that are potential major sources of GHG emissions. The EPA has also adopted rules requiring reporting of GHG emissions from specified emission sources in the United States on an annual basis, including, among others, certain onshore and offshore production and onshore oil and natural gas processing, fractioning, transmission, storage and distribution facilities. In addition, Congress has from time to time considered legislation to reduce emissions of GHGs but, in the absence of federal climate legislation in the United States in recent years, a number of state and regional efforts have emerged that are aimed to tracking and/or reducing GHG emissions by means of cap and trade programs that typically require major sources of GHG emissions to acquire and surrender emission allowances in return for emitting those GHGs. If Congress undertakes comprehensive tax reform in the coming year, it is possible that such reform may include a carbon tax, which would impose additional direct costs on operations and reduce demand for refined products. Although it is not possible at this time to predict how legislation or new regulations that may be adopted to address GHG emissions would impact our business, any such future laws or regulations that requires reporting of GHGs or otherwise limits emissions of GHGs from our facilities and operations could require us to incur costs to reduce emissions of GHGs associated with our operations, could obligate us to comply with new regulatory requirements, including the imposition of a carbon tax, or could adversely affect demand for the natural gas and NGLs we gather and process or fractionate.
49
Table of Contents
We may incur significant costs and liabilities resulting from pipeline safety and integrity programs and related compliance efforts.
We are subject to DOT safety regulations with respect to our natural gas lines and our NGL lines, pursuant to which the DOT has established:
- •
- requirements relating to the design, installation, testing, construction, operation, replacement and management of pipeline facilities;
- •
- mandatory inspections for all United States crude oil (including NGL) and natural gas transportation pipelines and gathering lines meeting certain operational risk and location requirements; and
- •
- additional safety requirements applicable to certain rural onshore hazardous liquid gathering lines and low-stress pipelines located in specified unusually sensitive areas, which address primarily corrosion and third-party damage concerns.
Moreover, changes to pipeline safety laws and regulations that result in more stringent or costly safety standards could have a significant adverse effect on us and similarly situated midstream operators. For example, on January 3, 2012, President Obama signed the 2011 Pipeline Safety Act, which act, among other things, directs the Secretary of Transportation to conduct studies to determine the need for additional regulations relating to expanded integrity management requirements, automatic or remote-controlled valve use, excess flow valve use, leak detection system installation and testing to confirm the material strength of pipe operating above 30% of specified minimum yield strength in high consequence areas and to then adopt new rules or standards as determined to be appropriate. These safety enhancement requirements and other provisions of this act could require us to install new or modified safety controls, pursue additional capital projects, or conduct maintenance programs on an accelerated basis, any or all of which could result in our incurring increased operating costs that could be significant and have a material adverse effect on our financial position or results of operations.
We are subject to environmental laws and regulations that may expose us to significant costs and liabilities.
Our operation of gathering systems, plants and other facilities is subject to stringent and complex federal, regional, state and local environmental laws and regulations. These laws and regulations may restrict or impact our business activities in many ways, including requiring the acquisition of permits or other approvals to conduct regulated activities, restricting the manner in which we dispose of wastes, requiring remedial action to remove or mitigate contamination, and requiring capital expenditures to comply with pollution control requirements. Failure to comply with these laws and regulations may trigger a variety of administrative, civil and criminal enforcement measures, including the assessment of monetary penalties, the imposition of remedial requirements and the issuance of orders enjoining future operations. Certain environmental statutes impose strict joint and several liability for costs required to clean up and restore sites where substances and wastes have been disposed or otherwise released. Moreover, it is not uncommon for neighboring landowners and other third parties to file claims for personal injury and property damage allegedly caused by the release of substances or wastes into the environment.
There is inherent risk of environmental costs and liabilities in our business as a result of our handling of natural gas, NGLs and other hydrocarbons, because of air emissions and waste water discharges related to our operations, and due to historical industry operations, and waste disposal practices. For example, an accidental release from one of our pipelines or processing facilities could subject us to substantial liabilities arising from environmental cleanup, restoration costs and natural resource damages, claims made by neighboring landowners and other third parties for personal injury and property damage and fines or penalties for related violations of environmental laws or regulations. Moreover, it is possible that stricter laws, regulations or enforcement policies could significantly increase our compliance costs and the cost of any remediation that may become necessary. We may be unable to recover some or any of these costs from insurance.
50
Table of Contents
Risks Related to Our Proposed Merger with Kinder Morgan
We and Kinder Morgan may be unable to obtain the regulatory clearances required to complete the merger or, in order to do so, we and Kinder Morgan may be required to comply with material restrictions or satisfy material conditions.
Our proposed merger with Kinder Morgan is subject to review by the Antitrust Division of the Department of Justice and the Federal Trade Commission under the Hart Scott Rodino Antitrust Improvements Act of 1976, and potentially by state regulatory authorities. The closing of the merger is subject to the condition that there is no law, injunction, judgment, or ruling by a governmental authority in effect enjoining, restraining, preventing, or prohibiting the merger contemplated by the merger agreement. We can provide no assurance that all required regulatory clearances will be obtained. If a governmental authority asserts objections to the merger, Kinder Morgan may be required to divest some assets in order to obtain antitrust clearance. There can be no assurance as to the cost, scope or impact of the actions that may be required to obtain antitrust approval. In addition, the merger agreement provides that Kinder Morgan is not required to commit to dispositions of assets in order to obtain regulatory clearance unless they do not exceed specified thresholds. If Kinder Morgan must take such actions, it could be detrimental to the combined organization following the consummation of the merger. Furthermore, these actions could have the effect of delaying or preventing completion of the proposed merger or imposing additional costs on or limiting the revenues of the combined organization following the consummation of the merger.
Even if the parties receive early termination of the statutory waiting period under the HSR Act or the waiting period expires, governmental authorities could seek to block or challenge the merger as they deem necessary or desirable in the public interest at any time, including after completion of the transaction. In addition, in some circumstances, a third party could initiate a private action under antitrust laws challenging or seeking to enjoin the transaction, before or after it is completed. Kinder Morgan may not prevail and may incur significant cost in defending or settling any action under the antitrust laws.
We may have difficulty attracting, motivating and retaining executives and other employees in light of the merger.
Uncertainty about the effect of the merger on Copano employees may have an adverse effect on us and the combined organization. This uncertainty may impair our ability to attract, retain and motivate personnel until the merger is completed. Employee retention may be particularly challenging during the pendency of the merger, as employees may feel uncertain about their future roles with the combined organization. In addition, we may have to provide additional compensation in order to retain employees. If our employees depart because of issues relating to the uncertainty and difficulty of integration or a desire not to become employees of the combined organization, the combined organization's ability to realize the anticipated benefits of the merger could be reduced. Also, if we fail to complete the merger, it may be difficult and expensive to recruit and hire replacements for such employees.
Pending the completion of the transaction, our business and operations could be materially adversely affected.
Under the terms of our merger agreement with Kinder Morgan, we are subject to certain restrictions on the conduct of our business prior to completing the transaction, which may adversely affect our ability to execute certain of our business strategies, including our ability in certain cases to enter into contracts, incur capital expenditures or grow our business. The merger agreement also restricts our ability to solicit, initiate or encourage alternative acquisition proposals with any third party and may deter a potential acquirer from proposing an alternative transaction or may limit our ability to pursue any such proposal. Such limitations could negatively affect our business and operations prior to the completion of the proposed transaction. Furthermore, the process of planning to integrate two businesses and organizations for the post-merger period can divert management attention and resources and could ultimately have an adverse effect on us.
51
Table of Contents
In connection with the pending merger, it is possible that some customers, suppliers and other persons with whom we have business relationships may delay or defer certain business decisions or might decide to seek to terminate, change or renegotiate their relationship with us as a result of the transaction, which could negatively affect our revenues, earnings and cash flows, as well as the market price of our common units, regardless of whether the transaction is completed.
Under the terms of our merger agreement with Kinder Morgan, we are subject to certain restrictions on the conduct of our business prior to completing the transaction, which may adversely affect our ability to execute certain of our business strategies without first obtaining consent from Kinder Morgan, including our ability in certain cases to enter into contracts, incur capital expenditures or grow our business.
We will incur substantial transaction-related costs in connection with the merger.
We expect to incur a number of non-recurring transaction-related merger-related costs associated with completing the merger, combining the operations of the two companies, and achieving desired synergies. These fees and costs will be substantial. Non-recurring transaction costs include, but are not limited to, fees paid to legal, financial and accounting advisors, filing fees and printing costs. Additional unanticipated costs may be incurred in the integration of our and Kinder Morgan's businesses. There can be no assurance that the elimination of certain duplicative costs, as well as the realization of other efficiencies related to the integration of the two businesses, will offset the incremental transaction-related costs over time. Thus, any net benefit may not be achieved in the near term, the long term or at all.
Failure to successfully combine the businesses of Copano and Kinder Morgan in the expected time frame may adversely affect the future results of the combined organization, and, consequently, the value of the Kinder Morgan common units that Copano unitholders receive as the merger consideration.
The success of the proposed merger will depend, in part, on the ability of Kinder Morgan to realize the anticipated benefits and synergies from combining the businesses of Kinder Morgan and Copano. To realize these anticipated benefits, the businesses must be successfully combined. If the combined organization is not able to achieve these objectives, or is not able to achieve these objectives on a timely basis, the anticipated benefits of the merger may not be realized fully or at all. In addition, the actual integration may result in additional and unforeseen expenses, which could reduce the anticipated benefits of the merger.
Failure to complete the merger, or significant delays in completing the merger, could negatively affect the trading price of our common units and our future business and financial results.
Completion of the merger is not assured and is subject to risks, including the risks that approval of the merger by our unitholders or by governmental agencies is not obtained or that other closing conditions are not satisfied. If the merger is not completed, or if there are significant delays in completing the merger, it could negatively affect the trading price of our common units and our future business and financial results, and we will be subject to several risks, including the following:
- •
- liability for damages to Kinder Morgan under the terms and conditions of the merger agreement;
- •
- negative reactions from the financial markets, including declines in the price of our common units due to the fact that current prices may reflect a market assumption that the merger will be completed;
- •
- having to pay certain significant costs relating to the merger, including a termination fee of $115 million; and
- •
- the attention of our management will have been diverted to the merger rather than our own operations and pursuit of other opportunities that could have been beneficial to us.
52
Table of Contents
Purported class action complaints have been filed against Copano, Kinder Morgan, Copano's board of directors, Kinder Morgan GP and Merger Sub, challenging the merger, and an unfavorable judgment or ruling in these lawsuits could prevent or delay the consummation of the proposed merger and result in substantial costs.
Five purported class action lawsuits have been filed challenging the merger. Each lawsuit names as defendants Copano, Kinder Morgan, the individual members of Copano's board of directors, Kinder Morgan GP and Merger Sub. Among other remedies, the plaintiffs seek to enjoin the proposed merger. If these lawsuits are not dismissed or otherwise resolved, they could prevent and/or delay completion of the merger and result in substantial costs to us, including any costs associated with the indemnification of directors. Additional lawsuits may be filed in connection with the proposed merger. There can be no assurance that any of the defendants will prevail in the pending litigation or in any future litigation. The defense or settlement of any lawsuit or claim may adversely affect our or the combined organization's business, financial condition or results of operations.
The five lawsuits challenging the merger are:
- •
- Charles Bruen, et al. v. Copano Energy, L.L.C., et al., United States District Court, Southern District of Texas, Case No. 13-cv-00540 (filed on Feb. 28, 2013).
- •
- William Schultes, et al. v. R. Bruce Northcutt, et al., 151st Dist. Court of Harris County, Texas, Case No. 2013-06966 (filed on Feb. 5, 2013).
- •
- Irwin Berlin, et al. v. Copano Energy, L.L.C. et al.,, Court of Chancery of the State of Delaware, Case No. 8284 (filed Feb. 6, 2013).
- •
- Donald E. Welzenbach, et al. v. William L. Thacker, et al., Court of Chancery of the State of Delaware; Case No. 8317-VCN (filed on Feb. 13, 2013).
- •
- Charles E. Hudson, et al. v. Copano Energy, L.L.C., et al., Court of Chancery of the State of Delaware, Case No. 8337 (filed Feb. 19, 2013).
Risks Related to Our Structure
Our limited liability company agreement prohibits a unitholder who acquires 15% or more of our common units without the approval of our Board of Directors from engaging in a business combination with us for three years. This provision could discourage a change of control that our unitholders may favor, which could negatively affect the price of our common units.
Our limited liability company agreement effectively adopts Section 203 of the Delaware General Corporation Law. Section 203 as it applies to us prevents an interested unitholder, defined as a person who owns 15% or more of our outstanding units, from engaging in business combinations with us for three years following the time such person becomes an interested unitholder, except in limited circumstances. Section 203 broadly defines "business combination" to encompass a wide variety of transactions with or caused by an interested unitholder, including mergers, asset sales and other transactions in which the interested unitholder receives a benefit on other than a pro rata basis with other unitholders. This provision of our limited liability company agreement could have an anti-takeover effect with respect to transactions not approved in advance by our Board of Directors, including discouraging takeover attempts that might result in a premium over the market price for our common units.
We may issue additional common units without your approval, which would dilute your existing ownership interests.
Our limited liability company agreement does not limit the number of additional limited liability company interests, including common units and other equity securities that rank senior to common units, that we may issue at any time without the approval of our unitholders, and existing NASDAQ listing rules allow us to issue additional interests without unitholder approval so long as we do not exceed 20% of our
53
Table of Contents
common units then outstanding. The issuance of additional common units or other equity securities of equal or senior rank will have the following effects:
- •
- your proportionate ownership interest in us will decrease;
- •
- the amount of cash available for distribution on each unit may decrease;
- •
- the relative voting strength of each previously outstanding unit will be diminished; and
- •
- the market price of our common units may decline.
Our preferred units, which generally become convertible into common units beginning in July 2013, are entitled to in-kind payments of quarterly distributions for each quarter through the third quarter of 2013. We may elect to continue to pay preferred distributions in kind for each quarter through the third quarter of 2016. All preferred units that we issue in payment of quarterly preferred units in kind will be convertible into common units on a one-for-one basis.
Certain of our investors may sell units in the public market, which could reduce the market price of our outstanding common units.
We have agreed to file a registration statement on Form S-3 to cover sales by TPG of all common units issuable upon conversion of our outstanding preferred units and additional preferred units that we issue as in-kind quarterly distributions. If TPG or a successor to its registration rights, or any holder of a significant percentage of our common units, were to dispose of a substantial portion of these common units in the public market, whether in a single transaction or series of transactions, it could adversely affect the market price for our common units. In addition, these sales, or the possibility that these sales may occur, could make it more difficult for us to sell our common units in the future.
Our limited liability company agreement provides for a limited call right that may require you to sell your common units at an undesirable time or price.
If, at any time, any person owns more than 90% of our common units then outstanding, such person has the right, but not the obligation, which it may assign to any of its affiliates or to us, to acquire all, but not less than all, of the remaining common units then outstanding at a price not less than the then-current market price of our common units. As a result, you may be required to sell your common units at an undesirable time or price and may therefore not receive any return on your investment. You may also incur tax liability upon a sale of your units.
Increases in interest rates could adversely affect our unit price.
Interest rates on future credit facilities and debt offerings could be higher than current levels, causing our financing costs to increase accordingly. An increase in interest rates could also cause a corresponding decline in demand for equity investments, in general, and in particular for yield-based equity investments such as our common units. Lower demand for our common units for any reason, including competition from other more attractive investment opportunities, would likely cause the trading price of our common units to decline. If we then issue additional equity at a significantly lower price, material dilution to our existing unitholders could result.
54
Table of Contents
Tax Risks to Common Unitholders
Our tax treatment depends on our status as a partnership for federal income tax purposes, as well as our not being subject to a material amount of entity-level taxation by individual states. If the IRS were to treat us as a corporation for federal income tax purposes or we were to become subject to material additional amounts of entity-level taxation for state tax purposes, taxes paid, if any, would reduce the amount of cash available for distribution to unitholders.
The anticipated after-tax economic benefit of an investment in our common units depends largely on our being treated as a partnership for federal income tax purposes. We are a limited liability company under Delaware law; however, because we are publicly traded, we could be treated as a corporation for federal income tax purposes if we fail to satisfy a "qualifying income" requirement. Failure to meet the qualifying income requirement or a change in current law may cause us to be treated as a corporation for federal income tax purposes or otherwise subject us to taxation as an entity. We have not requested, and do not plan to request, a ruling from the IRS with respect to our treatment as a partnership for federal income tax purposes or any other tax matter.
If we were treated as a corporation for federal income tax purposes, we would pay federal income tax on our taxable income at the corporate tax rates, currently at a maximum rate of 35%, and would likely pay state income tax at varying rates. Distributions to you would generally be taxed again as corporate distributions, and no income, gain, loss, deduction or credit recognized by us would flow through you. Because a tax would be imposed on us as a corporation, our cash available for distribution to our unitholders would be substantially reduced. Therefore, treatment of us as a corporation would result in a material reduction in the anticipated cash flow and after-tax return to our unitholders and would likely result in a substantial reduction in the value of our common units.
At the state level, because of widespread state budget deficits and other reasons, several states are evaluating ways to subject partnerships and limited liability companies to entity-level taxation through the imposition of state income, franchise or other forms of taxation. For example, we are required to pay Texas franchise tax at a maximum effective rate of 0.7% of our federal gross income apportioned to Texas in the prior year. Imposition of such a tax on us by any other state will further reduce the cash available for distribution to our unitholders.
The tax treatment of publicly traded partnerships or an investment in our common units could be subject to potential legislative, judicial, or administrative changes and differing interpretations, possibly on a retroactive basis.
The present U.S. federal income tax treatment of publicly-traded partnerships, including us, or an investment in our common units may be modified by administrative, legislative or judicial changes or differing interpretations at any time. For example, from time to time, members of the U.S. Congress propose and consider substantive changes to the existing federal income tax laws that affect publicly traded partnerships. One such legislative proposal would eliminate the qualifying income exception to the treatment of all publicly traded partnerships as corporations upon which we rely for our treatment as a partnership for U.S. federal income tax purposes. We are unable to predict whether any of these changes or other proposals will ultimately be enacted. Any modification to the U.S. federal income tax laws may be applied retroactively and could make it more difficult or impossible to meet the exception for certain publicly-traded partnerships to be treated as partnerships for U.S. federal income tax purposes. It is possible that a change in law could affect us and may, if enacted, be applied retroactively. Any such changes could reduce the amount of cash available for distribution to our unitholders and negatively impact the value of an investment in our common units.
55
Table of Contents
If the IRS contests the federal income tax positions we take, the market for our common units may be adversely impacted, and the costs of any IRS contest will reduce cash available for distribution to our unitholders.
The IRS may adopt positions that differ from the positions we take. It may be necessary to resort to administrative or court proceedings to sustain some or all of the positions we take and a court may disagree with some or all of those positions. Any contest with the IRS may materially and adversely impact the market for our common units and the price at which they trade. In addition, our costs of any contest with the IRS will result in a reduction in cash available for distribution to our unitholders and thus will be borne indirectly by our unitholders.
You are required to pay taxes on the share of our income allocated to you even if you do not receive any cash distributions from us.
Because our unitholders will be treated as partners in us for federal income tax purposes to whom we allocate taxable income, you are required to pay federal income taxes and, in some cases, state and local income taxes on your share of our taxable income whether or not you receive cash distributions from us. You may not receive cash distributions from us equal to your share of our taxable income or even equal to the actual tax liability that result from your share of our taxable income.
Tax gain or loss on disposition of our common units could be more or less than expected.
If you sell your common units, you will recognize a gain or loss equal to the difference between the amount realized and your tax basis in those common units. Because distributions in excess of your allocable share of our net taxable income decrease your tax basis in your common units, the amount, if any, of such prior excess distributions with respect to the units you sell, will, in effect, become taxable income to you if you sell such units at a price greater than your tax basis in those common units, even if the price you receive is less than your original cost. Furthermore, a substantial portion of the amount realized, whether or not representing gain, may be taxed as ordinary income due to potential recapture items, including depreciation recapture. In addition, because the amount realized includes a unitholder's share of our nonrecourse liabilities, if you sell your units, you may incur a tax liability in excess of the amount of cash you receive from the sale.
Tax-exempt entities and non-U.S. persons face unique tax issues from owning common units that may result in adverse tax consequences to them.
Investment in common units by tax-exempt entities, including employee benefit plans and individual retirement accounts (IRAs), and non-U.S. persons raises issues unique to them. For example, virtually all of our income allocated to organizations exempt from federal income tax, including IRAs and other retirement plans, will be unrelated business taxable income and will be taxable to such a unitholder. Distributions to non-U.S. persons will be reduced by withholding taxes imposed at the highest effective applicable tax rate, and non-U.S. persons will be required to file U.S. federal income tax returns and pay tax on their share of our taxable income. If you are a tax-exempt entity or a non-U.S. person, you should consult your tax advisor before investing in our units.
We treat each purchaser of our common units as having the same tax benefits without regard to the actual common units purchased. The IRS may challenge this treatment, which could adversely affect the value of our common units.
Because we cannot match transferors and transferees of common units, we have adopted depreciation and amortization positions that may not conform to all aspects of existing Treasury Regulations. A successful IRS challenge to those positions could adversely affect the amount of tax benefits available to our unitholders. It also could affect the timing of these tax benefits or the amount of gain on the sale of common units and could have a negative impact on the value of our common units or result in audits of and adjustments to our unitholders' tax returns.
56
Table of Contents
We prorate our items of income, gain, loss and deduction between transferors and transferees of our units each month based upon the ownership of our units on the first day of each month, instead of on the basis of the date a particular unit is transferred. The IRS may challenge this treatment, which could change the allocation of items of income, gain, loss and deduction among our unitholders.
We generally prorate our items of income, gain, loss and deduction between transferors and transferees of our units each month based upon the ownership of our units on the first day of each month, instead of on the basis of the date a particular unit is transferred. Nonetheless, we allocate certain deductions for depreciation of capital additions based upon the date the underlying property is placed in service. The use of this proration method may not be permitted under existing Treasury Regulations. The U.S. Treasury Department has issued proposed Treasury Regulations that provide a safe harbor pursuant to which publicly traded partnerships may use a similar monthly simplifying convention. Nonetheless, the proposed regulations do not specifically authorize the use of the proration method we have adopted. If the IRS were to challenge this method or new Treasury Regulations were issued, we may be required to change the allocation of items of income, gain, loss and deduction among our unitholders.
A unitholder whose units are the subject of a securities loan (e.g., a loan to a "short seller" to cover a short sale of units) may be considered as having disposed of those units. If so, he would no longer be treated for tax purposes as a partner with respect to those units during the period of the loan and may recognize gain or loss from the disposition.
Because a unitholder whose units are the subject of a securities loan may be considered as having disposed of the loaned units, he may no longer be treated for tax purposes as a partner with respect to those units during the period of the loan and the unitholder may recognize gain or loss from such disposition. Moreover, during the period of the loan, any of our income, gain, loss or deduction with respect to those units may not be reportable by the unitholder, and any cash distributions received by the unitholder as to those units could be fully taxable as ordinary income. Unitholders desiring to assure their status as partners and avoid the risk of gain recognition from a securities loan should modify any applicable brokerage account agreements to prohibit their brokers from borrowing and lending their units.
The sale or exchange of 50% or more of our capital and profits interests during any twelve-month period will result in the technical termination of our partnership for federal income tax purposes.
We will be considered to have constructively terminated as a partnership for federal income tax purposes if there is a sale or exchange of 50% or more of the total interests in our capital and profits within a twelve-month period. For purposes of determining whether the 50% threshold has been met, multiple sales of the same interest will be counted only once. While we would continue our existence as a Delaware limited liability company, our technical termination would, among other things, result in the closing of our taxable year for all unitholders, which would result in us filing two tax returns (and unitholders receiving two Schedules K-1) for one fiscal year and could result in a deferral of depreciation deductions allowable in computing our taxable income. In the case of a unitholder reporting on a taxable year other than a fiscal year ending December 31, the closing of our taxable year may also result in more than twelve months of our taxable income or loss being includable in his taxable income for the year of termination. Our termination currently would not affect our classification as a partnership for federal income tax purposes, but instead, we would be treated as a new partnership for tax purposes. If treated as a new partnership, we must make new tax elections and could be subject to penalties if we are unable to determine that a termination occurred. The IRS has announced a relief procedure whereby if a publicly traded partnership that has technically terminated requests and the IRS grants special relief, among other things, the partnership may be permitted to provide only a single Schedule K-1 to unitholders for the tax year in which the termination occurs.
57
Table of Contents
As a result of investing in our common units, you may become subject to state and local taxes and return filing requirements in states where you do not live.
In addition to federal income taxes, you will likely be subject to other taxes, including state and local taxes, unincorporated business taxes and estate, inheritance or intangible taxes that are imposed by the various jurisdictions in which we conduct business or own property now or in the future, even if you do not live in any of those jurisdictions. You will likely be required to file state and local income tax returns and pay state and local income taxes in some or all of these various jurisdictions. Further, you may be subject to penalties for failure to comply with those requirements. We currently conduct business and own assets in several states, most of which currently impose a personal income tax. As we make acquisitions or expand our business, we may conduct business or own assets in other jurisdictions that impose a personal income tax. It is your responsibility to file all required U.S. federal, state and local tax returns.
Item 1B. Unresolved Staff Comments
None.
Item 2. Properties
A description of our properties is provided in Item 1 of this report. Substantially all of our pipelines are constructed under rights-of-way granted by the apparent record landowners. Lands over which pipeline rights-of-way have been obtained may be subject to prior liens that have not been subordinated to the right-of-way grants. We have obtained, where necessary, license or permit agreements from public authorities and railroad companies to cross over or under, or to lay facilities in or along, waterways, county roads, municipal streets, railroad properties and state highways, as applicable. In some cases, property on which our pipelines were built was purchased in fee.
Some of our leases, easements, rights-of-way, permits, licenses and franchise ordinances require the consent of the current landowner to transfer these rights, which in some instances is a governmental entity. We believe that we have obtained sufficient third-party consents, permits and authorizations for the transfer of the assets necessary for us to operate our business in all material respects. With respect to any consents, permits or authorizations that have not been obtained, we believe that the failure to obtain these consents, permits or authorizations will have no material adverse effect on the operation of our business.
We believe that we have satisfactory title to our assets. Title to property may be subject to encumbrances. We believe that none of these encumbrances will materially detract from the value of our properties or from our interest in these properties, nor will they materially interfere with their use in the operation of our business.
Item 3. Legal Proceedings
Although we may, from time to time, be involved in litigation and claims arising out of our operations in the normal course of business, we are not currently a party to any material legal proceedings, except for proceedings described below. In addition, we are not aware of any material legal or governmental proceedings against us, or contemplated to be brought against us, under the various environmental protection statutes to which we are subject, that would have a significant adverse effect on our financial position or results of operations.
As a result of our Cantera acquisition in October 2007, we acquired Cantera Gas Company LLC ("Cantera Gas Company," formerly CMS Field Services, Inc. ("CMSFS")). Cantera Gas Company is a party to a number of legal proceedings alleging (i) false reporting of natural gas prices by CMSFS and numerous other parties and (ii) other related claims. The claims made in these proceedings are based on events that occurred before Cantera Resources, Inc. acquired CMSFS in June 2003 (the "CMS Acquisition"). The amount of liability, if any, against Cantera Gas Company is not reasonably estimable. Pursuant
58
Table of Contents
to the CMS Acquisition purchase agreement, CMS Gas Transmission has assumed responsibility for the defense of these claims, and Cantera Gas Company is fully indemnified by CMS Gas Transmission and its parent, CMS Enterprises Company, against any losses that Cantera Gas Company may suffer as a result of these claims.
Shortly following the announcement of our merger agreement with Kinder Morgan, five purported class action lawsuits were filed challenging the merger. Each of the actions names Copano, the board of directors of Copano, Kinder Morgan GP, Kinder Morgan and Merger Sub as defendants. All five lawsuits are brought on behalf of a putative class seeking to enjoin the merger and alleging, among other things, that the members of the board of directors of Copano breached their fiduciary duties by agreeing to sell Copano for inadequate and unfair consideration and pursuant to an inadequate and unfair process, and that Copano, Kinder Morgan, Kinder Morgan GP and Merger Sub aided and abetted such alleged breaches.
The five lawsuits challenging the merger are:
- •
- Charles Bruen, et al. v. Copano Energy, L.L.C., et al., United States District Court, Southern District of Texas, Case No. 13-cv-00540 (filed on Feb. 28, 2013).
- •
- William Schultes, et al. v. R. Bruce Northcutt, et al., 151st Dist. Court of Harris County, Texas, Case No. 2013-06966 (filed on Feb. 5, 2013).
- •
- Irwin Berlin, et al. v. Copano Energy, L.L.C. et al.,, Court of Chancery of the State of Delaware, Case No. 8284 (filed Feb. 6, 2013).
- •
- Donald E. Welzenbach, et al. v. William L. Thacker, et al., Court of Chancery of the State of Delaware; Case No. 8317-VCN (filed on Feb. 13, 2013).
- •
- Charles E. Hudson, et al. v. Copano Energy, L.L.C., et al., Court of Chancery of the State of Delaware, Case No. 8337 (filed Feb. 19, 2013).
Item 4. Mine Safety Disclosures
Not Applicable.
PART II
Item 5. Market for Registrant's Common Equity, Related Unitholder Matters and Issuer Purchases of Equity Securities
Common Units
Our common units, which represent limited liability company interests in us, are listed on The NASDAQ Global Select Market ("NASDAQ"), under the symbol "CPNO." On February 20, 2013, the closing market price for our common units was $38.71 per unit, and there were approximately 76 common unitholders of record.
59
Table of Contents
The following table shows the high and low sales prices per common unit, as reported by NASDAQ, and the distribution per common unit for the periods indicated.
| | | | | | | | | | |
| | Price of Common
Units | |
| |
|---|
| | Cash
Distribution
Per Common
Unit | |
|---|
| | High | | Low | |
|---|
2012: | | | | | | | | | | |
Quarter Ended December 31 | | $ | 34.00 | | $ | 27.72 | | $ | 0.575 | |
Quarter Ended September 30 | | $ | 33.43 | | $ | 26.10 | | $ | 0.575 | |
Quarter Ended June 30 | | $ | 37.20 | | $ | 24.24 | | $ | 0.575 | |
Quarter Ended March 31 | | $ | 38.03 | | $ | 33.00 | | $ | 0.575 | |
2011: | | | | | | | | | | |
Quarter Ended December 31 | | $ | 34.28 | | $ | 26.08 | | $ | 0.575 | |
Quarter Ended September 30 | | $ | 35.39 | | $ | 27.07 | | $ | 0.575 | |
Quarter Ended June 30 | | $ | 37.40 | | $ | 31.17 | | $ | 0.575 | |
Quarter Ended March 31 | | $ | 36.40 | | $ | 30.23 | | $ | 0.575 | |
We intend to pay quarterly distributions to our common unitholders of record on the applicable record date within 45 days after the end of each quarter (in February, May, August and November of each year). Our limited liability company agreement provides that we may pay cash distributions only if and to the extent we have available cash from operating surplus, as defined in the agreement. Available cash consists generally of all cash on hand at the end of the fiscal quarter, less retained cash reserves established by our Board of Directors. Our credit agreement does not provide for the type of working capital borrowings that would be eligible for inclusion in available cash.
Our Board of Directors has broad discretion to establish cash reserves that it determines are necessary or appropriate for the proper conduct of our business. These can include cash reserves for future capital and maintenance expenditures, reserves to stabilize quarterly cash distributions, reserves to reduce debt or, as necessary, reserves to comply with the law or with the terms of any of our agreements or obligations.
Pursuant to our merger agreement with Kinder Morgan, we are obligated not to increase our quarterly distribution above $0.575 per unit for as long as the merger agreement remains in effect. In addition, our ability to distribute cash is subject to a number of risks and uncertainties, some of which are beyond our control. Please read Item 1A., "Risk Factors — Risks Related to Our Business." If we do not have sufficient cash to pay a distribution as well as satisfy our operational and financial obligations, then our Board of Directors can reduce or eliminate the distribution paid on our common units so that we may satisfy such obligations, including payments on our debt instruments. For a discussion of the restrictions on distributions imposed by our revolving credit facility and the indentures governing our senior unsecured notes, please read Item 7., "Management's Discussion and Analysis of Financial Condition and Results of Operations — Liquidity and Capital Resources."
Securities Authorized for Issuance under Equity Compensation Plans
Information concerning securities authorized for issuance under our equity compensation plan for directors and employees is incorporated herein by reference to our Proxy Statement for our 2013 Annual Meeting of Unitholders set forth under the caption "Securities Authorized for Issuance under Equity Compensation Plans," or in the event we do not prepare and file such proxy statement, such information will be in amendment to this Form 10-K filed no later than April 30, 2013.
60
Table of Contents
Series A Convertible Preferred Units
For a description of the terms of our preferred units, please read "Member's Capital and Distributions — Series A Convertible Preferred Units" in Note 6 to our consolidated financial statements included in Item 8 of this report.
Common Unitholder Return Performance Presentation
The performance graph below compares the cumulative total unitholder return on our common units with the cumulative total returns on the Standard & Poor's 500 Index (the "S&P 500 Index") and the Alerian MLP Total Return Index (the "Alerian Total Return Index"). The Alerian Total Return Index is a composite of the 50 most prominent energy master limited partnerships and limited liability companies, as determined by Standard & Poor's using a float-adjusted market capitalization methodology. The graph assumes an investment of $100 in our common units, and in each of the S&P 500 Index and the Alerian Total Return Index on January 1, 2007, and reinvestment of all dividends and distributions. The results shown in the graph are based on historical data and should not be considered indicative of future performance.
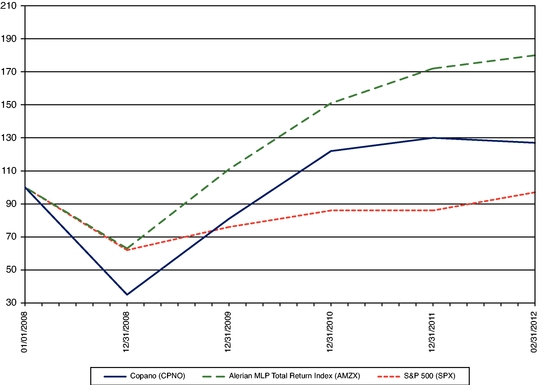
| | | | | | | | | | | | | | | | | | | |
| |
| | December 31, | |
|---|
| | January 1,
2008 | |
|---|
| | 2008 | | 2009 | | 2010 | | 2011 | | 2012 | |
|---|
Copano (CPNO) | | $ | 100 | | $ | 35 | | $ | 81 | | $ | 122 | | $ | 130 | | $ | 127 | |
Alerian MLP Total Return Index (AMZX) | | $ | 100 | | $ | 63 | | $ | 111 | | $ | 151 | | $ | 172 | | $ | 180 | |
S&P 500 Index (SPX) | | $ | 100 | | $ | 62 | | $ | 76 | | $ | 86 | | $ | 86 | | $ | 97 | |
Notwithstanding anything to the contrary set forth in any of our previous or future filings under the Securities Act or the Exchange Act that might incorporate this report or future filings with the SEC, in whole or in part, the preceding performance information shall not be deemed to be "soliciting material" or to be "filed" with the SEC or incorporated by reference into any filing except to the extent this performance presentation is specifically incorporated by reference therein.
61
Table of Contents
Issuer Purchases of Equity Securities
None.
Recent Sales of Unregistered Securities
Not applicable.
Item 6. Selected Financial Data
Selected Historical Consolidated Financial Information
The following table shows our selected historical consolidated financial information for the periods and as of the dates indicated. This information is derived from, should be read together with and is qualified in its entirety by reference to, our historical audited consolidated financial statements and the accompanying notes included in Item 8 of this report. The selected financial information should also be read together with Item 7., "Management's Discussion and Analysis of Financial Condition and Results of Operations."
| | | | | | | | | | | | | | | | |
| | Year Ended December 31, | |
|---|
| | 2012 | | 2011 | | 2010 | | 2009 | | 2008 | |
|---|
| | (In thousands, except per unit data)
| |
|---|
Summary of Operating Results: | | | | | | | | | | | | | | | | |
Revenue(1) | |
$ |
1,417,720 | |
$ |
1,345,223 | |
$ |
995,164 | |
$ |
820,046 | |
$ |
1,454,419 | |
(Loss) income from continuing operations | | $ | (138,970 | ) | $ | (156,312 | ) | $ | (8,681 | ) | $ | 20,866 | | $ | 55,922 | |
Preferred unit distributions | | $ | (36,117 | ) | $ | (32,721 | ) | $ | (15,188 | ) | $ | — | | $ | — | |
Net (loss) income to common units | | $ | (175,087 | ) | $ | (189,033 | ) | $ | (23,869 | ) | $ | 20,866 | | $ | 55,922 | |
Basic (loss) income per common unit from continuing operations | |
$ |
(2.39 |
) |
$ |
(2.86 |
) |
$ |
(0.37 |
) |
$ |
0.39 | |
$ |
1.15 | |
Diluted (loss) income per common unit from continuing operations | | $ | (2.39 | ) | $ | (2.86 | ) | $ | (0.37 | ) | $ | 0.36 | | $ | 0.97 | |
Other Financial Information: | | | | | | | | | | | | | | | | |
Cash distributions declared per common unit | | $ | 2.30 | | $ | 2.30 | | $ | 2.30 | | $ | 2.30 | | $ | 2.17 | |
| | | | | | | | | | | | | | | | |
| | December 31, | |
|---|
| | 2012 | | 2011 | | 2010 | | 2009 | | 2008 | |
|---|
| | (In thousands)
| |
|---|
Balance Sheet Information: | | | | | | | | | | | | | | | | |
Total assets | |
$ |
2,200,164 | |
$ |
2,064,597 | |
$ |
1,906,993 | |
$ |
1,867,412 | |
$ |
2,013,665 | |
Long-term debt | |
$ |
1,001,649 | |
$ |
994,525 | |
$ |
592,736 | |
$ |
852,818 | |
$ |
821,119 | |
Members' capital | |
$ |
980,276 | |
$ |
871,898 | |
$ |
1,154,757 | |
$ |
860,026 | |
$ |
1,037,958 | |
- (1)
- Our selected financial data as of and for the years ended December 31, 2009 and 2008 excludes the results attributable to our crude oil pipeline and related activities, as they are classified as discontinued operations.
62
Table of Contents
Item 7. Management's Discussion and Analysis of Financial Condition and Results of Operations
You should read the following discussion of our financial condition and results of operations in conjunction with the historical consolidated financial statements and notes thereto included in Item 8 of this report. In addition, you should review "— Forward-Looking Statements" below and "Risk Factors" included in Item 1A of this report for information regarding forward-looking statements made in this discussion and certain risks inherent in our business, as well as Item 7A., "Quantitative and Qualitative Disclosures about Market Risk."
Forward-Looking Statements
This report contains "forward-looking statements" within the meaning of the federal securities laws. All statements in this report other than statements of historical fact, including those under "— Trends and Uncertainties," "— Our Results of Operations" and "— Liquidity and Capital Resources" are forward-looking statements. Forward-looking statements address activities, events or developments that we expect or anticipate will or may occur in the future, including references to future goals or intentions. These statements can be identified by the use of forward-looking terminology, including "may," "believe," "expect," "anticipate," "estimate," "continue," or similar words. These statements include assertions related to plans for growth of our business, future capital expenditures and competitive strengths and goals. We make these statements based on our past experience and our perception of historical trends, current conditions and expected future developments as well as other considerations we believe are appropriate under the circumstances. Whether actual results and developments in the future will conform to our expectations is subject to numerous risks and uncertainties, many of which are beyond our control. Therefore, actual outcomes and results could materially differ from what is expressed or implied in these statements. Any differences could be caused by a number of factors, including, but not limited to:
- •
- the volatility of prices and market demand for natural gas, crude oil, condensate and NGLs, and for products derived from these commodities;
- •
- our ability to continue to connect new sources of natural gas, crude oil and condensate, and the NGL content of new gas supplies;
- •
- the ability of key producers to continue to drill and successfully complete and connect new natural gas and condensate volumes and such producers' performance under their contracts with us;
- •
- our ability to attract and retain key customers and contract with new customers, and such customers' performance under their contracts with us;
- •
- our ability to access or construct new pipeline capacity, gas processing and NGL fractionation and transportation capacity;
- •
- the availability of local, intrastate and interstate transportation systems, trucks and other facilities and services for condensate, natural gas and NGLs;
- •
- our ability (and the ability of our third-party service providers) to meet in-service dates, cost expectations and operating performance standards for construction projects;
- •
- our ability to successfully integrate any acquired asset or operations;
- •
- our ability to access our revolving credit facility and to obtain additional financing on acceptable terms;
- •
- the effectiveness of our hedging program;
- •
- general economic conditions;
- •
- force majeure events such as the loss of a market or facility downtime;
63
Table of Contents
- •
- the effects of government regulations and policies;
- •
- our ability to complete the proposed merger with Kinder Morgan; and
- •
- other financial, operational and legal risks and uncertainties detailed from time to time in our filings with the SEC.
This report includes cautionary statements identifying important factors that could cause our actual results to differ materially from our expectations expressed or implied in forward-looking statements. When considering forward-looking statements, you should keep in mind the risk factors and other cautionary statements set forth in this report. All forward-looking statements in this report and all subsequent written or oral forward-looking statements attributable to us are expressly qualified in their entirety by these cautionary statements. Forward-looking statements speak only as of the date made, and we undertake no obligation to publicly update or revise any forward-looking statements, other than as required by law, whether as a result of new information, future events or otherwise.
Overview
Through our subsidiaries and equity investments, we own and operate natural gas gathering and intrastate transportation pipeline assets, natural gas processing and fractionation facilities and NGL pipelines. We operate in Texas, Oklahoma and Wyoming. We manage our business and analyze and report our results of operations on a segment basis. Our operations are divided into three operating segments: Texas, Oklahoma and Rocky Mountains.
- •
- Our Texas segment provides midstream natural gas services in south and north Texas, including gathering and transportation of natural gas, and related services such as compression, dehydration, treating, processing and marketing. Our Texas segment also provides NGL fractionation and transportation and, through August 2012, included our Lake Charles processing plant located in southwest Louisiana. In addition to our 100%-owned operations, this segment includes our equity investments in Webb Duval, Eagle Ford Gathering, Liberty Pipeline Group and Double Eagle Pipeline.
- •
- Our Oklahoma segment provides midstream natural gas services in central and east Oklahoma, including primarily low-pressure gathering of natural gas and related services such as compression, dehydration, treating, processing and nitrogen rejection. This segment includes our equity investment in Southern Dome.
- •
- Our Rocky Mountains segment provides midstream natural gas services in the Powder River Basin of Wyoming, including gathering and treating of natural gas. In addition to our 100%-owned producer services business, this segment includes our equity investments in Bighorn and Fort Union.
Items reported as "Corporate and other" relate to our risk management activities, intersegment eliminations and other activities we perform or assets we hold that have not been allocated to any of our operating segments.
Proposed Merger with Kinder Morgan. On January 29, 2013, we announced a definitive merger agreement with Kinder Morgan, under which Kinder Morgan will acquire all of Copano's outstanding equity in a unit-for-unit transaction with an exchange ratio of 0.4563 Kinder Morgan units per Copano unit. The transaction is valued at approximately $5 billion (including the assumption of debt) based on the closing price for Kinder Morgan's units on January 29, 2013. Our board of directors and Kinder Morgan's board of directors have approved the merger agreement, and we have agreed to submit the merger agreement to a vote of our unitholders and to recommend that unitholders approve the merger agreement. TPG, our largest unitholder (owning over 14% of our outstanding equity), has agreed to vote all of its
64
Table of Contents
Series A convertible preferred units (and common units, if any) in favor of adoption of the merger agreement.
At the effective time of the merger, each of our common units outstanding or deemed outstanding as of immediately prior to the effective time will be converted into the right to receive 0.4563 Kinder Morgan common units (the "Merger Consideration"). All grants then outstanding under our LTIP will vest, outstanding options and unit appreciation rights will be deemed net exercised, and all resulting common units will convert into the right to receive the Merger Consideration. The merger agreement includes customary representations, warranties and covenants, and specific agreements relating to the conduct of our business and Kinder Morgan's business between the date of the signing of the merger agreement and the closing of the merger, and the efforts of the parties to cause the merger transactions to be completed. In addition to certain other covenants, we have agreed not to encourage, solicit, initiate or facilitate any takeover proposal from a third party or enter into any agreement, arrangement or understanding requiring us to abandon, terminate or fail to consummate the merger and related transactions.
Completion of the merger is subject to satisfaction or waiver of certain closing conditions including, among others, customary regulatory approvals (including under the Hart-Scott Rodino Antitrust Improvements Act of 1976, as amended), approval by our unitholders and registration of the Merger Consideration under the securities laws. The merger agreement contains certain termination rights for both us and Kinder Morgan and further provides that, upon termination of the merger agreement, under certain circumstances, we may be required to pay Kinder Morgan a termination fee equal to $115 million, and under certain other circumstances, Kinder Morgan may be required to pay us a termination fee equal to $75 million.
Under the terms of the merger agreement, we have agreed to conduct our business in the ordinary course and in all material respects in substantially the same manner as conducted prior to the date of the merger agreement, subject to certain conditions and restrictions including, but not limited to, restrictions on our ability to (i) commit to new capital expenditures, (ii) acquire, invest in, or dispose of any material properties, assets, or equity interests as defined in the merger agreement, (iii) incur new debt, refinance, or guarantee debt or borrowed money, (iv) enter into, terminate, or amend certain material contracts and (v) issue, grant, sell, or redeem our common units or pay distributions in excess of $0.575 per common unit.
Trends and Uncertainties
This section, which describes recent changes in factors affecting our business and many of the factors affecting our business are beyond our control and are difficult to predict.
Our gross margins and total distributable cash flow are affected by commodity prices and by the volumes of natural gas, NGLs and condensate that flow through our assets. Generally, commodity prices affect the cash flow and profitability of our Texas and Oklahoma segments directly because some of our contracts in those segments have commodity-sensitive pricing terms. In addition, commodity prices affect all of our segments indirectly because they influence exploration and production activity, which underlies the demand for our services and the long-term growth and sustainability of our business.
Commodity prices are influenced by various factors that affect supply and demand. These factors include regional drilling activity and completion technology, natural gas, NGL and crude oil storage levels, competing supplies (such as crude oil or liquefied natural gas imports or exports), and the availability, proximity and capacity of downstream infrastructure and markets for natural gas, condensate and NGLs. Many of the factors affecting demand are in turn dependent on overall economic activity. For example, demand for ethane, a primary feedstock for petrochemical and manufacturing industries, varies depending on overall economic activity. Factors that can cause volatility in crude oil prices, such as international political and economic events, can also affect NGL and condensate prices because the two have historically
65
Table of Contents
been correlated. Also, demand for natural gas used in power generation varies depending on the relative prices for natural gas and coal.
Producers typically increase drilling and well completions when prices are sufficient to make these activities economic, and they may reduce or suspend these activities when they have become uneconomic. The point at which producer activity becomes economic depends on a combination of factors in addition to commodity prices. In many cases, producers of rich gas can benefit from NGL prices under their contracts; for these producers, strong NGL prices may offset the potential disincentive of weak natural gas prices. Strong crude oil prices may also support increased production of casinghead natural gas associated with crude oil production.
Other factors that affect a producer's ability and incentives to drill include the producer's operating costs and financial resources (both access to capital and cost of capital), the availability of labor and necessary equipment and services, the expected composition of wellhead production and the availability, proximity and capacity of downstream infrastructure, services and market outlets. Also, some producers rely on commodity price hedging to support drilling activity when prices are less favorable, and some may drill only to the extent necessary to maintain their leasehold interests or capital commitments, either of which may require drilling within a specified period of time.
The impact of changes in drilling and well completion activity on our throughput volumes may be gradual because of the time required to complete and connect new wells (or at times when drilling is declining, because of continuing production from existing wells). Delays can range from a few days, in areas with minimal time required to complete and connect wells, to as long as 18 months, if extensive dewatering or completion of downstream facilities is required.
Some of our producer contracts entitle us to deficiency fees, which help to mitigate the impact of lower drilling and production activity. However, we may be subject to increased credit risk over periods when a producer is making payments to us that are not supported by physical volumes. In addition, our cash flow will be affected because in most cases deficiency fees are not paid monthly; rather, they become payable after the end of a longer commitment period, such as annually. Furthermore, deficiency fees may be less than the amount we would receive if the producer had delivered physical volumes. In the case of deficiency fees payable to one of our unconsolidated affiliates, the payment is reflected in our cash flow only after the unconsolidated affiliate has made a cash distribution to us, which may occur in a subsequent quarter or year.
Fourth-Quarter 2012 Commodity Prices Overall. Natural gas prices continued to improve in the fourth quarter of 2012 after reaching 10-year-lows in the second quarter, but declined in January and February of 2013. Average NYMEX crude oil prices decreased from the third quarter of 2012 to $88.18 per Bbl for the fourth quarter, and the spot price at February 20, 2013 was $92.84 per Bbl. Weighted-average NGL prices at Mont Belvieu for the fourth quarter of 2012 were $37.43, down slightly from $37.52 for the third quarter, while Conway prices for the fourth quarter averaged $36.12 per Bbl, up from $31.44 per Bbl for the third quarter. Fourth-quarter average ethane prices at Conway increased to $7.72 per Bbl, compared to $6.07 per Bbl for the third quarter, while Mont Belvieu ethane prices declined, averaging $11.92 per Bbl compared to $14.22 per Bbl for the third quarter. The weighted-average spread between Mont Belvieu and Conway narrowed to $3.12 per Bbl over the fourth quarter, down from $7.15 per Bbl for the third quarter, due mainly to the decline in Mont Belvieu ethane prices coupled with overall improvement in Conway prices. The spread was $1.53 per Bbl on February 20, 2013.
66
Table of Contents
The following graph and table summarize prices for natural gas and NGLs on the primary indices we use for Texas pricing and for crude oil on the NYMEX.
Texas Prices for Crude Oil, Natural Gas and NGLs(1)
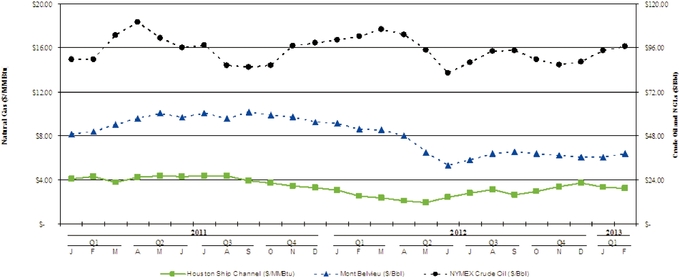
- (1)
- Average crude oil prices are based on NYMEX. Natural gas prices are first-of-the-month index prices. Average monthly NGL prices are calculated based on Mont Belvieu prices and our weighted-average product mix for the period indicated.
| | | | | | | | | | | | | | | | | | | | | | | | |
| |
| |
|---|
| | Annual Data for Texas | |
| | Quarterly Data for Texas | |
|---|
| | 2010 | | 2011 | | 2012 | |
| | Q1 2012 | | Q2 2012 | | Q3 2012 | | Q4 2012 | |
|---|
Houston Ship Channel ($/MMBtu) | | $ | 4.38 | | $ | 4.02 | | $ | 2.75 | | | | $ | 2.65 | | $ | 2.17 | | $ | 2.84 | | $ | 3.35 | |
Mont Belvieu ($/Bbl) | | $ | 44.68 | | $ | 56.96 | | $ | 40.28 | | | | $ | 52.64 | | $ | 38.71 | | $ | 37.52 | | $ | 37.43 | |
NYMEX crude oil ($/Bbl) | | $ | 79.53 | | $ | 95.12 | | $ | 94.20 | | | | $ | 102.93 | | $ | 93.49 | | $ | 92.22 | | $ | 88.18 | |
100% owned | | | | | | | | | | | | | | | | | | | | | | | | |
Service throughput (MMBtu/d) | | | 595,641 | | | 726,944 | | | 895,212 | | | | | 944,033 | | | 924,465 | | | 897,601 | | | 814,684 | |
Plant inlet (MMBtu/d) | | | 504,810 | | | 639,194 | | | 811,813 | | | | | 833,163 | | | 834,846 | | | 824,196 | | | 755,395 | |
NGLs produced (Bbls/d) | | | 18,718 | | | 28,736 | | | 48,802 | | | | | 35,344 | | | 50,146 | | | 54,142 | | | 56,434 | |
Segment gross margin (in thousands) | | $ | 128,682 | | $ | 184,437 | | $ | 204,324 | | | | $ | 45,341 | | $ | 49,101 | | $ | 55,236 | | $ | 54,646 | |
Joint Venture(1) | | | | | | | | | | | | | | | | | | | | | | | | |
Pipeline throughput (Mmbtu/d) | | | 54,879 | | | 162,734 | | | 353,697 | | | | | 269,433 | | | 316,111 | | | 373,402 | | | 454,862 | |
NGLs produced (Bbls/d)(2) | | | — | | | 1,698 | | | 12,528 | | | | | 9,912 | | | 10,169 | | | 12,526 | | | 17,450 | |
Gross margin (in thousands) | | $ | 1,698 | | $ | 31,195 | | $ | 93,725 | | | | $ | 9,815 | | $ | 26,964 | | $ | 25,945 | | $ | 31,001 | |
- (1)
- Includes 100% of the results and volumes from Eagle Ford Gathering, Webb Duval and Liberty Pipeline Group.
- (2)
- Net of NGLs produced at our Houston Central complex.
The first-of-the-month price for natural gas on the Houston Ship Channel index for February 2013 was $3.23 per MMBtu, and the spot price on February 20, 2013 was $3.22 per MMBtu. The weighted-average spot price for NGLs at Mont Belvieu on February 20, 2013, based on our fourth-quarter 2012 product mix, was $39.31 per Bbl.
67
Table of Contents
Pricing Trends in Oklahoma. The following graph and table summarize prices for natural gas and NGLs on the primary indices we use for Oklahoma pricing and for crude oil on the NYMEX.
Oklahoma Prices for Crude Oil, Natural Gas and NGLs(1)

- (1)
- Average crude oil prices are based on NYMEX. Natural gas prices are first-of-the-month index prices. Average monthly NGL prices are calculated based on Conway prices and our weighted-average product mix the period indicated.
| | | | | | | | | | | | | | | | | | | | | | | | |
| |
| |
|---|
| | Annual Data for Oklahoma | |
| | Quarterly Data for Oklahoma | |
|---|
| | 2010 | | 2011 | | 2012 | |
| | Q1 2012 | | Q2 2012 | | Q3 2012 | | Q4 2012 | |
|---|
CenterPoint East ($/MMBtu) | | $ | 4.19 | | $ | 3.87 | | $ | 2.67 | | | | $ | 2.60 | | $ | 2.11 | | $ | 2.72 | | $ | 3.24 | |
Conway ($/Bbl) | | $ | 40.21 | | $ | 47.32 | | $ | 34.27 | | | | $ | 39.18 | | $ | 30.23 | | $ | 31.44 | | $ | 36.12 | |
NYMEX crude oil ($/Bbl) | | $ | 79.53 | | $ | 95.12 | | $ | 94.20 | | | | $ | 102.93 | | $ | 93.49 | | $ | 92.22 | | $ | 88.18 | |
100% owned | | | | | | | | | | | | | | | | | | | | | | | | |
Service throughput (MMBtu/d) | | | 261,636 | | | 287,408 | | | 315,029 | | | | | 318,285 | | | 324,915 | | | 313,414 | | | 303,645 | |
Plant inlet (MMBtu/d) | | | 156,181 | | | 155,675 | | | 158,754 | | | | | 157,052 | | | 158,106 | | | 157,775 | | | 162,057 | |
NGLs produced (Bbls/d) | | | 16,251 | | | 17,498 | | | 16,644 | | | | | 16,691 | | | 17,028 | | | 16,207 | | | 16,390 | |
Segment gross margin (in thousands) | | $ | 93,617 | | $ | 105,080 | | $ | 88,468 | | | | $ | 24,199 | | $ | 20,171 | | $ | 22,948 | | $ | 21,150 | |
Joint Venture(1) | | | | | | | | | | | | | | | | | | | | | | | | |
Plant inlet (MMBtu/d) | | | 12,522 | | | 11,292 | | | 9,961 | | | | | 10,017 | | | 7,352 | | | 10,354 | | | 12,095 | |
NGLs produced (Bbls/d) | | | 449 | | | 403 | | | 351 | | | | | 363 | | | 249 | | | 375 | | | 417 | |
Gross margin (in thousands) | | $ | 5,654 | | $ | 5,096 | | $ | 3,418 | | | | $ | 1,003 | | $ | 491 | | $ | 848 | | $ | 1,076 | |
- (1)
- Includes 100% of the results and volumes from Southern Dome.
The first-of-the-month price for natural gas on the CenterPoint East index for February 2013 was $3.16 per MMBtu, and the spot price on February 20, 2013 was $3.21 per MMBtu. The weighted-average spot price for NGLs at Conway on February 20, 2013, based on our fourth-quarter 2012 product mix, was $37.77 per Bbl.
Basis Trends. Basis risk continues to affect our hedges relating to Oklahoma NGL volumes, but we benefited from a narrowing of the Mont Belvieu-Conway basis spread in the fourth quarter of 2012. We use Mont Belvieu-priced hedge instruments for our Oklahoma NGL volumes because the forward market for Conway-based hedge instruments is limited.
68
Table of Contents
The weighted-average Mont Belvieu-Conway basis differential at February 20, 2013, based on our fourth-quarter 2012 product mix, was $1.53 per Bbl. The average basis differential between Houston Ship Channel and CenterPoint East natural gas index prices for the fourth quarter of 2012 was $(0.11) per MMBtu.
The following graph summarizes the basis differential between Mont Belvieu and Conway prices.
Mont Belvieu — Conway Basis(1)

- (1)
- Average NGL prices are calculated based on our Oklahoma segment weighted-average product mix for the period indicated.
Pricing Trends in the Rocky Mountains. The following graph and table summarize prices for natural gas on Colorado Interstate Gas, the primary index we use for the Rocky Mountains.
Rocky Mountains Natural Gas Prices(1)

69
Table of Contents
- (1)
- Natural gas prices are first-of-the-month index prices.
| | | | | | | | | | | | | | | | | | | | | | | | |
| |
| |
|---|
| | Annual Data for Rocky Mountains | |
| | Quarterly Data for Rocky Mountains | |
|---|
| | 2010 | | 2011 | | 2012 | |
| | Q1 2012 | | Q2 2012 | | Q3 2012 | | Q4 2012 | |
|---|
Colorado Interstate Gas ($/MMBtu) | | $ | 3.92 | | $ | 3.79 | | $ | 2.58 | | | | $ | 2.62 | | $ | 1.95 | | $ | 2.55 | | $ | 3.20 | |
100% owned | | | | | | | | | | | | | | | | | | | | | | | | |
Segment gross margin (in thousands) | | $ | 4,440 | | $ | 2,641 | | $ | 932 | | | | $ | 358 | | $ | 187 | | $ | 624 | | $ | (237 | ) |
Joint Venture(1) | | | | | | | | | | | | | | | | | | | | | | | | |
Pipeline throughput (MMBtu/d) | | | 907,809 | | | 604,261 | | | 726,026 | | | | | 787,366 | | | 747,009 | | | 694,961 | | | 675,662 | |
Gross margin (in thousands) | | $ | 89,888 | | $ | 85,751 | | $ | 83,670 | | | | $ | 21,462 | | $ | 18,741 | | $ | 18,035 | | $ | 25,432 | |
- (1)
- Includes 100% of Bighorn and Fort Union volumes. Changes in pipeline throughput at Fort Union did not have a material impact on gross margin because Fort Union received payments for additional volumes under long-term contractual commitments in each of the periods indicated.
The first-of-the-month price for natural gas on the Colorado Interstate Gas index for February 2013 was $3.17 per MMBtu, and the spot price on February 20, 2013 was $3.34 per MMBtu.
Other Industry Trends. Volume growth from rich gas shale plays such as the Eagle Ford Shale continues to stress existing processing and liquids-handling infrastructure. NGL transportation and fractionation facilities remain subject to capacity constraints and older processing facilities are subject to reduced operating performance due to the very high NGL content of gas from these plays.
Transportation costs for crude oil, condensate and heavier NGL products in Texas remain higher due to limited pipeline infrastructure and available trucking capacity. In addition, we believe that limited fractionation capacity at Mont Belvieu and a lack of available NGL pipeline capacity in the Mid-Continent contributed to a wide basis spread between Mont Belvieu and Conway for much of 2012. We anticipate that new pipeline infrastructure linking the Mid-Continent and Gulf Coast regions, which is scheduled to come online in 2013 and 2014, will help to reduce volatility in this basis spread. Initially, this new pipeline infrastructure may result in downward pressure on Mont Belvieu prices due to insufficient petrochemical cracking capacity along the Gulf Coast. New capacity is expected to begin coming on line in 2016 or 2017.
Generally, processing and NGL capacity constraints result in higher processing fees and NGL transportation and fractionation costs for parties that do not have contractually fixed costs. Midstream companies experiencing capacity constraints or related outages may curtail volumes, experience reduced operating performance or, where possible, reject ethane, each of which can have an immediate impact on cash flow and operating results for both the midstream company and its producers and other customers. While these effects could limit the benefits producers receive from rich gas production and therefore affect the level of producer activity, we anticipate that the impact of processing and fractionation capacity constraints may begin to improve as new facilities come online in 2014.
70
Table of Contents
Texas volumes decreased compared to both prior periods primarily because we sold our Lake Charles processing plant in August 2012. Excluding the impact of the sale of the Lake Charles plant, Texas volumes decreased 1% compared to the third quarter of 2012 and increased 5% compared to the fourth quarter of 2011. The increase in fourth-quarter volumes (excluding Lake Charles volumes) compared to the same period in 2011 reflects (i) the combined impact of a 179% increase in Eagle Ford Gathering volumes and a 39% increase in our wholly owned Eagle Ford Shale volumes, and (ii) the offsetting impact of displacing leaner third-party volumes that Kinder Morgan historically delivered to Houston Central complex to accommodate Eagle Ford Gathering volumes.
Fourth-quarter 2012 gathering volumes in Oklahoma were down slightly compared to third-quarter 2012 and fourth-quarter 2011 volumes, as producers that had been active in lean Woodford Shale areas for much of 2011 and early 2012 suspended drilling due to low natural gas prices. Oklahoma gathering volumes for the full year 2012 were up 10% compared to 2011, a reflection of the significant volumes attributable to the lean Woodford Shale activity earlier in 2012. In the Rocky Mountains, fourth quarter 2012 Fort Union and Bighorn volumes were flat and down 10%, respectively, compared to the third quarter of 2012 due to drilling activity in the Powder River Basin. A 17% increase in Fort Union volumes compared to the fourth quarter of 2011 reflects that producers flowed volumes on Fort Union rather than a competing pipeline. Volumes on Bighorn declined 28% over the same period due to a lack of drilling activity.
Factors Affecting Operating Results and Financial Condition
North Barnett Shale Combo and Eagle Ford Shale volume growth in the fourth quarter of 2012 increased our total segment gross margin compared to the third quarter, and although Texas processing margins were less favorable, the impact was mitigated because a greater percentage of our gross margin was generated from fee-based contracts. Oklahoma benefitted from higher commodity prices, but the impact was offset by lower volumes compared to the third quarter of 2012.
71
Table of Contents
As compared to the fourth quarter of 2011, our fourth-quarter 2012 results also reflect declines in natural gas, condensate and NGL prices in Texas and Oklahoma, which partly offset the benefits of year-over-year volume growth in Texas. Cash received from our commodity hedge settlements increased compared to the third quarter of 2012 and the fourth quarter of 2011 due to lower NGL prices and more beneficial strike prices.
Our 2012 operating results also reflects a total of $215.0 million in non-cash impairments of our Rocky Mountains assets, which we recorded for the first and fourth quarters of 2012, due to a low natural gas price environment in the region, a decline in the forecasted future volume and our expectation of lower drilling activity in the Powder River Basin. Our operating income for 2012 includes a $9.9 million gain realized from our sale of the Lake Charles plant in the third quarter.
Prices and Drilling Activity. We believe that the decline in NGL prices during the first half of 2012 was attributable to a series of events resulting in an overabundance of NGLs compounded by infrastructure limitations. Propane prices were under pressure due to mild winters in 2011 and 2012, and ethane and other NGL prices were lower due to a combination of NGL-industry-related outages and planned shutdowns, which effectively reduced fractionation and ethane-cracking capacity in the first half of 2012. Many fractionation and petrochemical facilities were back online in the second half of 2012, and recently announced expansions of propane export facilities in 2013 in the Houston Ship Channel area may signal a trend that could reduce pressure on propane prices. However, we expect that the industry focus on rich gas drilling combined with significant production increases in unconventional shale plays and limited petrochemical cracking capacity will result in continued supply-based pressure on NGL prices over the near term.
As long as NGL prices remain above levels that are economic for producers, we anticipate continued drilling activity in oil and rich-gas areas. While the level at which prices are economic will vary depending upon the play and the producer, we believe that the Eagle Ford Shale, the north Barnett Shale Combo, the rich areas of the Woodford Shale, and the Hunton de-watering plays remain attractive to producers because they offer rich gas, low geologic risk, nearby infrastructure and market access relative to other plays, as well as high initial production rates. In addition, one of our producers in the lean Woodford Shale resumed drilling in January 2013, and we have seen steady drilling activity in the rich areas of the Mississippi Lime play in northern Oklahoma as producers continue to test the eastern part of the play. We have completed gathering and compression facilities extending into the play from our existing assets in the area, and in late 2012, we completed an interconnect with our Paden plant that will enable us to provide processing and nitrogen rejection services for Mississippi Lime production.
Natural gas prices have improved from recent 10-year lows, we believe mainly due to increased use of natural gas for power generation. Because natural gas prices have been low, gas has been an attractive alternative to coal for power generation. Natural gas prices have remained below the level at which producers have sufficient incentives to increase drilling in the Powder River Basin and many conventional drilling areas. Drilling and related activity in shale plays have consumed significant capital and other resources, shifting capital and resources away from conventional areas. We expect that many producers who rely on conventional drilling, produce mainly lean gas, or both, are not likely to resume significant drilling activity in the current natural gas price environment.
Volume Growth and Infrastructure. A consequence of the increasing volumes from shale plays is the continuing need for investment in new gathering and processing infrastructure. Our ability to benefit from oil and rich gas drilling activity depends on the successful completion of capital projects that we and some of our third-party service providers have undertaken, which includes having facilities perform as we expect. In 2012, the Houston Central complex began receiving gas with NGL content that exceeded our original expectations and is unprecedented compared to historical levels in the region.
72
Table of Contents
To address the higher NGL content of Eagle Ford Shale gas and enhance our ability to serve producers in the play, we are installing a 400 MMcf/d cryogenic processing facility at Houston Central, which is scheduled for completion in early 2013, and subject to receiving an EPA permit, we plan to begin installation of an additional 400 MMcf/d cryogenic facility in 2013 and expect to place the facility in service in the second quarter of 2014. These new facilities ultimately should enable us to relegate our lean oil facility to providing overflow and interruptible volume services. We expect that the high NGL content of Eagle Ford Shale gas may limit the operating performance at our Houston Central complex until the new facilities are complete. After the new facilities are in service, we may continue to face other operating risks. Please read Item 1A., "Risk Factors," in this report.
We anticipate that the basis differential that affected Texas and Oklahoma NGL prices in 2012 will continue to moderate as new fractionation facilities and NGL transportation infrastructure, including new third-party NGL pipelines linking the Mid-Continent to the Gulf Coast, come online in 2013 and 2014. However, we expect that the industry focus on rich gas drilling, increase in shale play production and limited petrochemical cracking capacity will result in continued supply-based pressure on NGL prices over the near term.
We believe that investors and other market participants benefit from having access to the various financial and operating measures that our management uses in evaluating our performance because it allows them to independently evaluate our performance with the same information used by management. These measures include: (i) throughput volumes; (ii) segment gross margin and total segment gross margin; (iii) operations and maintenance expenses; (iv) general and administrative expenses; (v) EBITDA and adjusted EBITDA and (vi) total distributable cash flow.
Segment gross margin, total segment gross margin, EBITDA, adjusted EBITDA and total distributable cash flow are non-generally accepted accounting principles, or non-GAAP, financial measures. We use non-GAAP financial measures to evaluate our core profitability and to assess the financial performance of our assets. A reconciliation of each non-GAAP measure to its most directly comparable GAAP measure is provided below. Non-GAAP financial measures should not be considered as alternatives to GAAP measures such as net income (loss), operating income (loss), income (loss) from continuing operations, cash flows from operating activities or any other GAAP measure of liquidity or financial performance. Our non-GAAP financial measures may not be comparable to similarly titled measures of other companies, which may not calculate their measures in the same manner.
Throughput Volumes. Throughput volumes associated with our business are an important part of our operational analysis. We continually evaluate the volumes delivered to our processing plants and flowing through our pipelines to ensure that we have adequate throughput to meet our financial objectives. Our performance at our processing plants is also significantly influenced by quality of natural gas delivered to the plant, the NGL content of the natural gas and the plant's recovery capability. In addition, we monitor fuel consumption and losses because they have a significant impact on the gross margin realized from our processing operations through contractual agreements where we provide a fixed recovery to our producers. Where contractual agreements allow, fuel costs and losses are passed on to our producers.
It is also important that we continually add new volumes to our gathering systems to offset or exceed the normal decline of existing volumes. In monitoring our pipeline volumes, managers of our Texas and Oklahoma segments evaluate what we refer to asservice throughput, which consists of two components:
- •
- the volume of natural gas transported or gathered through our wholly owned pipelines, which we callpipeline throughput; and
73
Table of Contents
- •
- the volume of natural gas delivered to our wholly owned processing plants by third-party pipelines or the volume of natural gas delivered to third-party plants under our transportation or processing contracts, excluding any volumes already included in our pipeline throughput.
In our Texas segment, we also compare pipeline throughput and service throughput to evaluate the volumes generated from our pipelines, as opposed to third-party pipelines. In Oklahoma, because no gas is delivered to our wholly owned plants other than by our pipelines, pipeline throughput and service throughput are equivalent.
Segment Gross Margin and Total Segment Gross Margin. We define segment gross margin as an operating segment's revenue minus cost of sales. Cost of sales includes the cost of natural gas and NGLs we purchase and costs for transportation or processing of our volumes. We view segment gross margin as an important performance measure of the core profitability of our operations. Segment gross margin allows our senior management to compare volume and price performance of our segments and to more easily identify operational or other issues within a segment. With respect to our Texas and Oklahoma segments, our management analyzes segment gross margin per unit of service throughput.
We usetotal segment gross margin to measure the overall financial impact of our contract portfolio. Total segment gross margin is the sum of our operating segments' gross margins and the results of our risk management activities, which are included in corporate and other. Our total segment gross margin is determined primarily by five interrelated variables: (i) the volume and quality of natural gas gathered or transported through our pipelines, (ii) the volume and NGL content of natural gas processed, fractionated or treated at our processing plants or on our behalf at third-party processing plants, (iii) natural gas, crude oil and NGL prices and the relative price differential between NGLs and natural gas, (iv) our contract portfolio and (v) the results of our risk management activities. The results of our risk management activities consist of (i) net cash settlements paid or received on expired commodity derivative instruments, (ii) amortization expense relating to the option component of our commodity derivative instruments and (iii) unrealized mark-to-market gain or loss on our commodity derivative instruments that have not been designated as cash flow hedges.
Because our profitability is a function of the difference between the revenues we receive from our operations, including revenues from the products we sell, and the costs associated with conducting our operations, including the costs of products we purchase, increases or decreases in our revenues alone are not necessarily indicative of increases or decreases in our profitability. To a large extent, our contract portfolio and the pricing environment for oil, natural gas and NGLs will dictate increases or decreases in our profitability. Our profitability is also dependent upon the market demand for oil, natural gas and NGLs, which fluctuate with changes in market and economic conditions and other factors.
Both segment gross margin and total segment gross margin are reviewed monthly for consistency and trend analysis.
Joint Venture Distributions. The cash distributions we receive in respect of our joint venture interests are also important to our operational analysis. In addition, we serve each of our joint ventures as managing member, operator, or both. In our role as managing member or operator, we generally use the other financial and operating measures described in this section and below in "— How We Manage Our Operations" to evaluate and monitor the performance of our joint ventures.
Operations and Maintenance Expenses. The most significant portion of our operations and maintenance expenses consists of direct labor, insurance, repair and maintenance, utilities and contract services. These expenses remain relatively stable across broad volume ranges and fluctuate slightly depending on the activities performed during a specific period. We monitor operations and maintenance expenses to assess the impact of such costs on the profitability of a particular asset or group of assets and to evaluate the efficiency of our operations.
74
Table of Contents
General and Administrative Expenses. Our general and administrative expenses include the cost of employee and officer compensation and related benefits, office lease and expenses, professional fees, information technology expenses, as well as other expenses not directly associated with our field operations. To help ensure the appropriateness of our general and administrative expenses, we compare such expenses against the annual financial plan approved by our Board of Directors.
EBITDA and Adjusted EBITDA. We define EBITDA as net income (loss) plus interest and other financing costs, provision for income taxes and depreciation and amortization expense. Commencing with the second quarter of 2011, we revised our calculation of adjusted EBITDA to more closely resemble that of many of our peers in terms of measuring our ability to generate cash. Our adjusted EBITDA (as revised) equals:
- •
- net income (loss);
- •
- plus interest and other financing costs, provision for income taxes, depreciation and amortization expense, impairment expense, non-cash amortization expense associated with our commodity derivative instruments, distributions from unconsolidated affiliates, loss on refinancing of unsecured debt and equity-based compensation expense;
- •
- minus equity in earnings (loss) from unconsolidated affiliates and unrealized gains (losses) from commodity risk management activities; and
- •
- plus or minus other miscellaneous non-cash amounts affecting net income (loss) for the period.
In calculating adjusted EBITDA as revised, we no longer add to EBITDA our share of the depreciation, amortization and impairment expense and interest and other financing costs embedded in our equity in earnings (loss) from unconsolidated affiliates; instead, we now add to EBITDA (i) other non-cash amounts affecting net income (loss) for the period, (ii) non-cash amortization expense associated with our commodity derivative instruments, (iii) loss on refinancing of unsecured debt and (iv) distributions from unconsolidated affiliates.
We believe that our revised calculation of adjusted EBITDA is a more effective tool for our management in evaluating our operating performance for several reasons. Although our historical method of calculating adjusted EBITDA was useful in assessing the performance of our assets (including our unconsolidated affiliates) without regard to financing methods, capital structure or historical cost basis, the prior calculation was not as useful in evaluating the core performance of our assets and their ability to generate cash because adjustments for a number of non-cash expenses and other non-cash and non-operating items were not reflected in the calculation, and the impact of cash distributions from our unconsolidated affiliates was likewise not reflected. We believe that the revised calculation of adjusted EBITDA is more consistent with the method and presentation used by many of our peers and will allow management and analysts to better evaluate our performance relative to our peer companies.
External users of our financial statements such as investors, commercial banks and research analysts use EBITDA or adjusted EBITDA, and our management uses adjusted EBITDA, as a supplemental financial measure to assess:
- •
- the financial performance of our assets without regard to financing methods, capital structure or historical cost basis;
- •
- the ability of our assets to generate cash sufficient to pay interest costs and support our indebtedness;
- •
- our operating performance and return on capital as compared to those of other companies in the midstream energy sector, without regard to financing or capital structure; and
- •
- the viability of acquisitions and capital expenditure projects and the overall rates of return on alternative investment opportunities.
75
Table of Contents
We believe that the revised calculation more effectively represents what lenders and debt holders, as well as industry analysts and many of our unitholders, have indicated is useful in assessing our core performance and outlook and comparing us to other companies in our industry. For example, we believe that adjusted EBITDA as revised may provide investors and analysts with a more useful tool for evaluating our leverage because it more closely resembles Consolidated EBITDA (as defined under our revolving credit facility), which is used by our lenders to calculate our financial covenants. Consolidated EBITDA differs from adjusted EBITDA in that it includes further adjustments to (i) reflect the pro forma effects of material acquisitions and dispositions and (ii) in the case of leverage ratio calculations, includes projected EBITDA from significant capital projects under construction. Please read — Liquidity and Capital Resources — Our Indebtedness — Revolving Credit Facility.
Total Distributable Cash Flow. Commencing with the second quarter of 2011, we present total distributable cash flow as net income (loss) plus all adjustments included in the adjusted EBITDA calculation described above and minus: (i) cash interest expense, (ii) current tax expense and (iii) maintenance capital expenditures. Although we have revised our presentation of total distributable cash flow, the components of the calculation have not changed except that total distributable cash flow now eliminates the impact of any loss on refinancing of unsecured debt because such losses do not reduce operating cash flow.
Total distributable cash flow is a significant performance metric used by senior management to compare basic cash flows we generate (prior to the establishment of any retained cash reserves by our Board of Directors) to the cash distributions we expect to pay our unitholders. Using total distributable cash flow, management can quickly compute the coverage ratio of estimated cash flows to planned cash distributions.
Total distributable cash flow is also an important non-GAAP financial measure for our unitholders because it serves as an indicator of our success in providing a cash return on investment — specifically, whether or not we are generating cash flow at a level that can sustain or support an increase in our quarterly distribution rates. Total distributable cash flow is also used by industry analysts with respect to publicly-traded partnerships and limited liability companies because the market value of such entities' equity securities is significantly influenced by the amount of cash they can distribute to unitholders. Because of the significance of total distributable cash flow to our unitholders, our Compensation Committee and Board of Directors have designated total distributable cash flow per common unit as the financial objective under our Management Incentive Compensation Plan since the plan's inception in 2005.
Reconciliation of Non-GAAP Financial Measures. The following table presents a reconciliation of the non-GAAP financial measures of (i) total segment gross margin to the GAAP financial measure of operating income and (ii) EBITDA, adjusted EBITDA and total distributable cash flow to the GAAP financial measure of net income (loss), for each of the periods indicated. The reconciliation of the
76
Table of Contents
non-GAAP financial measures for 2010 and 2009 have been recast to conform with the revised calculation to allow for direct comparisons to 2011 activity.
| | | | | | | | | | |
| | Year Ended December 31, | |
|---|
| | 2012 | | 2011 | | 2010 | |
|---|
| | (In thousands)
| |
|---|
Reconciliation of total segment gross margin to operating (loss) income: | | | | | | | | | | |
Operating (loss) income | | $ | (82,614 | ) | $ | (89,450 | ) | $ | 45,777 | |
Add: Operations and maintenance expenses | | | 77,943 | | | 65,326 | | | 53,487 | |
Depreciation and amortization | | | 77,104 | | | 69,156 | | | 62,572 | |
Impairment | | | 29,486 | | | 8,409 | | | — | |
General and administrative expenses | | | 50,648 | | | 48,680 | | | 40,347 | |
Taxes other than income | | | 7,392 | | | 5,130 | | | 4,726 | |
Equity in loss from unconsolidated affiliates | | | 137,088 | | | 145,324 | | | 20,480 | |
Gain on sale of operating assets | | | (9,941 | ) | | — | | | — | |
| | | | | | | | |
Total segment gross margin | | $ | 287,106 | | $ | 252,575 | | $ | 227,389 | |
| | | | | | | | |
Reconciliation of EBITDA, adjusted EBITDA and total distributable cash flow to net loss: | | | | | | | | | | |
Net loss | | $ | (138,970 | ) | $ | (156,312 | ) | $ | (8,681 | ) |
Add: Depreciation and amortization | | | 77,104 | | | 69,156 | | | 62,572 | |
Interest and other financing costs | | | 55,264 | | | 47,187 | | | 53,605 | |
Provision for income taxes | | | 1,678 | | | 1,502 | | | 931 | |
| | | | | | | | |
EBITDA | | | (4,924 | ) | | (38,467 | ) | | 108,427 | |
Add: Amortization of commodity derivative options | | | 21,757 | | | 29,517 | | | 32,378 | |
Distributions from unconsolidated affiliates | | | 47,475 | | | 35,471 | | | 25,955 | |
Loss on refinancing of unsecured debt | | | — | | | 18,233 | | | — | |
Equity-based compensation | | | 10,574 | | | 13,265 | | | 10,388 | |
Equity in loss from unconsolidated affiliates | | | 137,088 | | | 145,324 | | | 20,480 | |
Unrealized (gain) loss from commodity risk management activities | | | (333 | ) | | (550 | ) | | 582 | |
Impairment | | | 29,486 | | | 8,409 | | | — | |
Other non-cash operating items | | | 1,461 | | | 118 | | | 1,319 | |
| | | | | | | | |
Adjusted EBITDA | | | 242,584 | | | 211,320 | | | 199,529 | |
Less: Cash interest and other financing costs | | | (54,178 | ) | | (46,395 | ) | | (51,417 | ) |
Provision for income taxes and other | | | (1,383 | ) | | (1,207 | ) | | (991 | ) |
Maintenance capital expenditures | | | (10,853 | ) | | (13,490 | ) | | (9,563 | ) |
| | | | | | | | |
Total distributable cash flow(1) | | $ | 176,170 | | $ | 150,228 | | $ | 137,558 | |
| | | | | | | | |
- (1)
- Prior to any retained cash reserves established by our Board of Directors.
How We Manage Our Operations
Our management team uses a variety of tools to manage our business. These tools include: (i) our economic models, (ii) flow and transaction monitoring systems, (iii) producer activity evaluation and reporting, (iv) imbalance monitoring and control and (v) measurement and loss reports.
Economic Models. We use our economic models to determine (i) whether we should reduce the ethane extracted from natural gas processed by some of our processing plants and third-party plants and (ii) whether we should reduce the rate of recovery of other products at our processing plants.
Our recent Eagle Ford Shale expansion projects and our increasingly fee-based contract portfolio have changed how we manage operations at our Houston Central complex. In the past, our commodity price
77
Table of Contents
risk was largely related to "keep-whole" pricing, which meant that our margins depended on the spread between natural gas and NGL prices. To mitigate the risk of negative processing margins, which occur when NGL prices fall to near or below natural gas prices, we could "condition," rather than process, natural gas by extracting only the volume of NGLs necessary to meet downstream pipeline specifications. We calculated what we referred to as a "standardized processing margin" to monitor the impact of natural gas and NGL prices on our Houston Central complex operations and to help determine when we would benefit from conditioning.
Because of recent changes in our assets and our business, natural gas conditioning at the Houston Central complex has become significantly less important from a commodity-risk management standpoint and less effective from an operational standpoint. The pricing terms of producer contracts supporting our Saint Jo processing operations in north Texas and our Eagle Ford Shale expansion projects in south Texas are predominantly fee-based, which has substantially reduced the potential impact that negative processing margins could have on our Texas operations. In addition, as Eagle Ford Shale volumes have increased, the NGL content of natural gas delivered to the Houston Central complex has increased. If we were to condition this very rich natural gas, we would be unable to meet downstream pipeline specifications.
Please read Item 1., "Business — Industry Overview — Midstream Contracts" and Item 7A., "Quantitative and Qualitative Disclosures about Market Risk" for more information about commodity price sensitivity under our contracts.
Flow and Transaction Monitoring Systems. We use automated systems that track commercial activity on and monitor the flow of natural gas on our pipelines in each of our segments. We track each of our natural gas transactions, which allows us to continuously track volumes, pricing, imbalances and estimated revenues from our pipeline assets. Additionally, we use automated Supervisory Control and Data Acquisition ("SCADA") systems, which assist management in monitoring and operating our Texas segment. These SCADA systems allow us to monitor our assets at remote locations and respond to changes in pipeline operating conditions. For our Oklahoma segment, we electronically monitor pipeline volumes and operating conditions at certain key points along our pipeline systems and use a SCADA system on some of our gathering systems. Bighorn, which our Rocky Mountains segment operates, also uses a SCADA system.
Producer Activity Evaluation and Reporting. We monitor producer drilling and completion activity in our areas of operation to identify anticipated changes in production and potential new well connection opportunities. The continued connection of natural gas production to our pipeline systems is critical to our business and directly impacts our financial performance. Using a third-party electronic reporting system, we receive daily reports of new drilling permits and completion reports filed with the state regulatory agency that governs these activities in Texas and Oklahoma. Additionally, our field personnel report the locations of new wells in their respective areas and anticipated changes in production volumes to supply representatives and operating personnel. These processes enhance our awareness of new well activity in our operating areas and allow us to be responsive to producers in connecting new volumes of natural gas to our pipelines. In all our operating segments, we meet with producers to better understand their drilling and production plans, and to obtain drilling schedules, if available, to assist us in anticipating future activity on our pipelines.
Imbalance Monitoring and Control. We continually monitor volumes received and volumes delivered on behalf of third parties to ensure we remain within acceptable imbalance limits during the calendar month. We seek to reduce imbalances because of the inherent commodity price risk that results when receipts and deliveries of natural gas are not balanced concurrently. We have implemented "cash-out" provisions in many of our transportation and gathering agreements to reduce this commodity price risk. Cash-out provisions require that any imbalance that exists between a third party and us at the end of a calendar month is settled in cash based upon a pre-determined pricing formula. These provisions ensure that imbalances under such contracts are not carried forward from month-to-month and revalued at higher or lower prices.
78
Table of Contents
Measurement and Loss Reports. We use measurement, fuel and loss reports to monitor the efficiency and integrity of our systems.
| | | | | | | | | | |
| | Year Ended December 31, | |
|---|
| | 2012 | | 2011 | | 2010 | |
|---|
| | ($ In thousands)
| |
|---|
Total segment gross margin(1)(2) | | $ | 287,106 | | | 252,575 | | | 227,389 | |
Operations and maintenance expenses | | | 77,943 | | | 65,326 | | | 53,487 | |
Depreciation and amortization | | | 77,104 | | | 69,156 | | | 62,572 | |
Impairment | | | 29,486 | | | 8,409 | | | — | |
General and administrative expenses | | | 50,648 | | | 48,680 | | | 40,347 | |
Taxes other than income | | | 7,392 | | | 5,130 | | | 4,726 | |
Equity in loss from unconsolidated affiliates(2)(3) | | | 137,088 | | | 145,324 | | | 20,480 | |
Gain on sale of operating assets | | | (9,941 | ) | | — | | | — | |
| | | | | | | | |
Operating (loss) income(2)(3) | | | (82,614 | ) | | (89,450 | ) | | 45,777 | |
Loss on refinancing of unsecured debt | | | — | | | (18,233 | ) | | — | |
Interest and other financing costs, net | | | (54,678 | ) | | (47,127 | ) | | (53,527 | ) |
Provision for income taxes | | | (1,678 | ) | | (1,502 | ) | | (931 | ) |
| | | | | | | | |
Net loss | | | (138,970 | ) | | (156,312 | ) | | (8,681 | ) |
Preferred unit distributions | | | (36,117 | ) | | (32,721 | ) | | (15,188 | ) |
| | | | | | | | |
Net loss to common units | | $ | (175,087 | ) | $ | (189,033 | ) | $ | (23,869 | ) |
| | | | | | | | |
Basic and diluted net loss per common unit | | $ | (2.39 | ) | $ | (2.86 | ) | $ | (0.37 | ) |
| | | | | | | | |
Weighted average number of common units — basic and diluted | | | 73,225 | | | 66,169 | | | 63,854 | |
| | | | | | | | |
Total segment gross margin: | | | | | | | | | | |
Texas | | $ | 204,324 | | $ | 184,437 | | $ | 128,682 | |
Oklahoma | | | 88,468 | | $ | 105,080 | | $ | 93,617 | |
Rocky Mountains(4) | | | 932 | | $ | 2,641 | | $ | 4,440 | |
| | | | | | | | |
Segment gross margin | | | 293,724 | | | 292,158 | | | 226,739 | |
Corporate and other(5) | | | (6,618 | ) | $ | (39,583 | ) | $ | 650 | |
| | | | | | | | |
Total segment gross margin(1) | | $ | 287,106 | | $ | 252,575 | | $ | 227,389 | |
| | | | | | | | |
Segment gross margin per unit: | | | | | | | | | | |
Texas: | | | | | | | | | | |
Service throughput ($/MMBtu) | | $ | 0.62 | | $ | 0.70 | | $ | 0.59 | |
Oklahoma: | | | | | | | | | | |
Service throughput ($/MMBtu) | | $ | 0.77 | | $ | 1.00 | | $ | 0.98 | |
Volumes: | | | | | | | | | | |
Texas:(6) | | | | | | | | | | |
Service throughput (MMBtu/d)(7)(8) | | | 895,212 | | | 726,944 | | | 595,641 | |
Pipeline throughput (MMBtu/d) | | | 552,078 | | | 456,686 | | | 328,967 | |
Plant inlet volumes (MMBtu/d)(8) | | | 811,813 | | | 639,194 | | | 504,810 | |
NGLs produced (Bbls/d)(8) | | | 48,802 | | | 28,736 | | | 18,718 | |
Oklahoma:(9) | | | | | | | | | | |
Service throughput (MMBtu/d)(7)(8) | | | 315,029 | | | 287,408 | | | 261,636 | |
Plant inlet volumes (MMBtu/d)(8) | | | 158,754 | | | 155,675 | | | 156,181 | |
NGLs produced (Bbls/d) | | | 16,644 | | | 17,498 | | | 16,251 | |
Capital Expenditures: | | | | | | | | | | |
Maintenance capital expenditures | | $ | 10,853 | | $ | 13,490 | | $ | 9,563 | |
Expansion capital expenditures | | | 348,487 | | | 259,803 | | | 120,941 | |
| | | | | | | | |
Total capital expenditures | | $ | 359,340 | | $ | 273,293 | | $ | 130,504 | |
| | | | | | | | |
Operations and maintenance expenses: | | | | | | | | | | |
Texas | | $ | 47,352 | | $ | 38,099 | | $ | 29,236 | |
Oklahoma | | | 30,334 | | | 26,982 | | | 23,955 | |
Rocky Mountains | | | 257 | | | 245 | | | 296 | |
| | | | | | | | |
Total operations and maintenance expenses | | $ | 77,943 | | $ | 65,326 | | $ | 53,487 | |
| | | | | | | | |
79
Table of Contents
- (1)
- Total segment gross margin is a non-GAAP financial measure. Please read "— How We Evaluate Our Operations" for a reconciliation of total segment gross margin to its most directly comparable GAAP measure of operating income.
- (2)
- During the three months ended March 31, 2012 and December 31, 2012, we recorded a $120.0 million and $66.3 million non-cash impairment charge, respectively, relating to our investments in Bighorn and Fort Union.
- (3)
- The following table summarizes the results and volumes associated with our unconsolidated affiliates ($ in thousands):
| | | | | | | | | | | | | | | | | | | | | |
| |
| | Year Ended December 31, | |
|---|
| |
| | 2012 | | 2011 | | 2010 | |
|---|
| |
| | Volume | | Equity
(Earnings)/Loss | | Volume | | Equity
(Earnings)/Loss | | Volume | | Equity
(Earnings)/Loss | |
|---|
Eagle Ford Gathering | | | | | | | $ | (34,919 | ) | | | | $ | (11,218 | ) | | | | $ | — | |
Pipeline throughput(a) | | (MMBtu/d) | | | 296,965 | | | | | | 46,456 | | | | | | — | | | | |
NGLs produced(b) | | (Bbls/d) | | | 12,528 | | | | | | 1,698 | | | | | | — | | | | |
Liberty Pipeline Group(c) | | (Bbls/d) | | | 22,029 | | | 442 | | | 1,876 | | | 270 | | | — | | | — | |
Webb Duval(d) | | (MMBtu/d) | | | 56,732 | | | (240 | ) | | 51,907 | | | 146 | | | 54,879 | | | 3,364 | |
Southern Dome | | | | | | | | (1,104 | ) | | | | | (2,415 | ) | | | | | (2,667 | ) |
Plant inlet | | (MMBtu/d) | | | 9,961 | | | | | | 11,292 | | | | | | 12,522 | | | | |
NGLs produced | | (Bbls/d) | | | 351 | | | | | | 403 | | | | | | 449 | | | | |
Bighorn and Fort Union(e) | | (MMBtu/d) | | | 726,026 | | | 172,926 | | | 604,261 | | | 158,592 | | | 907,809 | | | 36,762 | |
- (a)
- For 2011, the volume has been recast from 110,827 MMBtu/d, as previously stated, to reflect daily flow averaged over the 365 days of the year instead of the 153 days of physical flow.
- (b)
- Net of NGLs produced at our Houston Central complex.
- (c)
- For 2011, the volume has been recast from 4,597 Bbls/d, as previously stated, to reflect daily flow averaged over the 365 days of the year instead of the 149 days of physical flow.
- (d)
- Net of intercompany volumes.
- (e)
- Changes in pipeline throughput at Fort Union did not have a material impact on gross margin because Fort Union received payments for additional volumes under long-term contractual commitments in each of the periods indicated.
- (4)
- Rocky Mountains segment gross margin includes results from producer services, including volumes purchased for resale, volumes gathered under firm capacity gathering agreements with Fort Union, volumes transported using our firm capacity agreements with Wyoming Interstate Gas Company and compressor rental services provided to Bighorn.
- (5)
- Corporate and other includes results attributable to our commodity risk management activities.
- (6)
- Plant inlet volumes and NGLs produced represent total volumes processed and produced by the Texas segment at all plants, including plants owned by the Texas segment and plants owned by third parties.
- (7)
- "Service throughput" means the volume of natural gas delivered to our 100%-owned processing plants by third-party pipelines plus our "pipeline throughput," which is the volume of natural gas transported or gathered through our pipelines.
- (8)
- Volumes for the year ended December 31, 2011 have been recast from the following results to reflect daily flow averaged over the 365 day period instead of the actual days of physical flow.
| | | | |
| | Year Ended
December 31,
2011 | |
|---|
Texas | | | | |
Service throughput (MMBtu/d) | | | 795,497 | |
Plant inlet volumes (MMBtu/d) | | | 758,588 | |
NGLs produced (Bbls/d) | | | 29,147 | |
Oklahoma | | | | |
Service throughput (MMBtu/d) | | | 291,532 | |
Plant inlet volumes (MMBtu/d) | | | 160,406 | |
- (9)
- Plant inlet volumes and NGLs produced represent total volumes processed and produced by the Oklahoma segment at all plants, including plants owned by the Oklahoma segment and plants owned by third parties.
80
Table of Contents
Year Ended December 31, 2012 Compared To Year Ended December 31, 2011
Texas Segment Gross Margin. Texas segment gross margin was $204.3 million for 2012 compared to $184.4 million for 2011, an increase of $19.9 million, or 11%. The impact of lower NGL prices, which declined 29%, was offset by higher volumes. Volumes gathered and volumes processed increased 21% and 12%, respectively, and NGLs produced increased 70%, for 2012 as compared to 2011. Our gathering and processing volume growth was due primarily to increased volumes from the north Barnett Shale Combo and Eagle Ford Shale plays and our Lake Charles plant, which we operated for January through August 2012 but only operated for 28 days in 2011. Eagle Ford Shale volume increases were offset by a decline in leaner gas volumes at the Houston Central complex, which were displaced to accommodate rich Eagle Ford Gathering volumes. Higher NGL production reflects overall volume growth at our Saint Jo plant and a substantial increase in the NGL content of gas processed at our Houston Central complex. Despite the 29% decline in NGL prices, Texas segment gross margin per unit of service throughput decreased only $0.08 per MMBtu to $0.62 per MMBtu for 2012 compared to $0.70 per MMBtu for 2011, mainly due to growth in fee-based volumes and, beginning in May 2012, enhanced operating performance at our Houston Central complex.
Oklahoma Segment Gross Margin. Oklahoma segment gross margin was $88.5 million for 2012 compared to $105.1 million for 2011, a decrease of $16.6 million, or 16%. Service throughput increased 10% period over period, and plant inlet volumes increased 2%. The increase in service throughput only partly offset the impact of lower commodity prices, as NGL prices declined 28% and average natural gas prices declined 31%. NGL production declined 5%, as the higher service throughput consisted mainly of lean gas from the Woodford Shale, and our Paden and Harrah plants rejected ethane for most of the second half of 2012. As a result of these price declines, coupled with an increase in lower-margin lean gas, our Oklahoma segment gross margin per unit of service throughput decreased $0.23 per MMBtu to $0.77 per MMBtu for 2012 compared to $1.00 per MMBtu for 2011.
Rocky Mountains Segment Gross Margin. Rocky Mountains segment gross margin was $0.9 million for 2012 compared to $2.6 million for 2011, a decrease of $1.7 million, or 65%. This decrease is primarily the result of our inability to resell all of the demand capacity under our firm gathering agreement with Fort Union because of production declines in the area and a scheduled increase of demand capacity resulting in higher fees payable under the agreement and partly offset by a $0.8 million payment we received from Fort Union as a cashout of accumulated pipeline imbalances.
Corporate and Other. Corporate and other includes our commodity risk management activities and was a loss of $6.6 million for 2012 compared to a loss of $39.6 million for 2011. The loss for 2012 included $21.7 million of non-cash amortization expense relating to the option component of our commodity derivative instruments partially offset by $0.3 million of unrealized gains on commodity derivative instruments and $14.8 million of net cash settlements received on expired commodity derivative instruments. The loss for 2011 included $29.5 million of non-cash amortization expense relating to the option component of our commodity derivative instruments, $10.6 million of net cash settlements paid on expired commodity derivative instruments offset by $0.5 million of unrealized gain on commodity derivative instruments.
Operations and Maintenance Expenses. Operations and maintenance expenses totaled $77.9 million for 2012 compared to $65.3 million for 2011. The 19% increase consisted primarily of higher payroll, compression, utilities and equipment rental expenses in Texas relating to expanded operations at our Houston Central complex and volume increases at our Saint Jo plant in Texas. In addition, we operated the Lake Charles plant for January through August 2012, but only operated the plant for 28 days in 2011.
Depreciation and Amortization. Depreciation and amortization totaled $77.1 million for 2012 compared to $69.2 million for 2011, an increase of 11%. This increase relates primarily to additional depreciation and amortization resulting from assets placed in service in late 2011 and 2012, including the
81
Table of Contents
fractionation expansion at our Houston Central complex in November 2011, our DK pipeline extension in December 2011 and our new 200 MMcf/d cryogenic facility at our Houston Central complex in March 2012.
Impairment. During 2012, we recorded non-cash impairment charges of $29.5 million compared to $8.4 million for 2011, primarily as a result of a write-down of an underutilized contract for firm capacity that we resell to Rocky Mountains producers and the impairment of underutilized non-core assets in Oklahoma. The 2011 impairment was due to a low natural gas price environment and our expectation of lower drilling activity in the Powder River Basin and the impairment of underutilized non-core assets in south Texas.
General and Administrative Expenses. General and administrative expenses totaled $50.6 million for 2012 compared to $48.7 million for 2011. The 4% increase consists primarily of a $4.1 million increase in compensation and benefits expense and a $0.8 million increase in deferred equity compensation under our LTIP, both primarily due to increased headcount. These increases were partially offset by a decrease of (i) $1.6 million in bad debt expense as our Texas segment recovered $0.7 million that was written off in 2011 and (ii) $0.6 million in accounting fees and costs of preparing and processing tax K-1s to unitholders.
Equity in Loss from Unconsolidated Affiliates. Equity in loss from unconsolidated affiliates totaled $137.1 million for 2012 compared to a loss of $145.3 million for 2011, a change of $8.2 million. The change is primarily related to increased equity earnings from Eagle Ford Gathering of $23.7 million, which commenced significant operations during the fourth quarter of 2011, offset by increased equity losses from Bighorn and Fort Union of $14.3 million. Equity losses from our investments in Bighorn and Fort Union included non-cash impairment charges for 2012 and 2011 of $186.3 million and $165.0 million, respectively. The impairment charges for 2012 and 2011 were due to the low natural gas price environment in the region, a decline in forecasted future volumes for Bighorn and Fort Union, and our expectation of lower drilling activity in the Powder River Basin. Please read Note 4, "Investments in Unconsolidated Affiliates," in Item 8 of this report.
Gain on Sale of Operating Assets. Gain on sale of operating assets was $9.9 million for 2012 and included the gain on the sale of our Lake Charles plant in Louisiana.
Interest and Other Financing Costs. Interest and other financing costs totaled $55.3 million for 2012 compared to $47.2 million for 2011, an increase of $8.1 million, or 17%. The increase consisted primarily of $3.1 million in additional interest expense relating to higher indebtedness outstanding under our revolving credit facility and senior unsecured notes. Average borrowings under our credit arrangements for 2012 and 2011 were $1.04 billion and $807.6 million, respectively, with weighted-average interest rates of 6.9% in both periods. Please read "— Liquidity and Capital Resources — Our Indebtedness."
Year Ended December 31, 2011 Compared To Year Ended December 31, 2010
Texas Segment Gross Margin. Texas segment gross margin was $184.4 million for 2011 compared to $128.7 million for 2010, an increase of $55.7 million, or 43%. Texas segment gross margin per unit of service throughput increased $0.11 per MMBtu to $0.70 per MMBtu for 2011 compared to $0.59 per MMBtu for 2010, reflecting 27% higher NGL prices and 8% lower natural gas prices compared to 2010, the impact of our fractionation facilities for a full year (operations started in May 2010) which reduced our third-party fractionation costs and enabled us to begin earning fees for providing fractionation services, and an increase in revenue associated with fee-based contracts in the Eagle Ford Shale and the north Barnett Shale Combo plays, including $5.1 million in deficiency fees for volumes committed to us but not delivered. The Texas segment's service throughput, gathering and NGL production increased 22%, 39% and 53%, respectively, and processed volumes increased 50% during 2011. The increase in service throughput is due to volumes from the Eagle Ford Shale and north Barnett Shale Combo plays. The increase in NGL production is due to additional volumes at our Houston Central complex and Saint Jo
82
Table of Contents
plant and reflects a 122% increase in volumes behind our Saint Jo plant in the north Barnett Shale Combo play. We restarted our Lake Charles plant in November 2011 and the average inlet volumes and average processing volumes for the Lake Charles plant include 28 days of activity in 2011. Please read Item 1., "Business — Industry Overview — Midstream Contracts."
Oklahoma Segment Gross Margin. Oklahoma segment gross margin was $105.1 million for 2011 compared to $93.6 million for 2010, an increase of $11.5 million, or 12%. The increase in segment gross margin resulted primarily from a period-over-period increase in NGL prices of 18%, offset by an 8% decrease in natural gas prices. NGL production also increased 8% period-over-period. Oklahoma segment gross margin per unit of service throughput increased $0.02 per MMBtu to $1.00 per MMBtu for 2011 compared to $0.98 per MMBtu for 2010. Service throughput increased 10% between the periods due to volume increases on the Mountain systems. For 2011, plant inlet volumes decreased slightly compared to 2010 primarily as a result of normal production declines from our other gathering systems partially offset by increased volumes resulting from our acquisition of the Harrah plant and associated gathering facilities. Please read Item 1., "Business — Industry Overview — Midstream Contracts.
Rocky Mountains Segment Gross Margin. Rocky Mountains segment gross margin was $2.6 million for 2011 compared to $4.4 million for 2010, a decrease of $1.8 million, or 41%. This decrease is primarily the result of our inability to resell all of the demand capacity under our firm gathering agreement with Fort Union because of production declines in the area and a scheduled increase of demand capacity resulting in higher fees payable under the agreement.
Corporate and Other. Corporate and other includes our commodity risk management activities and was a $39.6 million loss for 2011 compared to a $0.6 million gain for 2010, a decrease of $40.2 million. The loss for 2011 includes $10.6 million of net cash settlements paid on expired commodity derivative instruments and $29.5 million of non-cash amortization expense relating to the option component of our commodity derivative instruments offset by $0.5 million of unrealized gains on our commodity derivative instruments. The gain for 2010 includes $33.6 million of net cash settlements received on expired commodity derivative instruments offset by $0.6 million of unrealized losses on our commodity derivative instruments and $32.4 million of non-cash amortization expense relating to the option component of our commodity derivative instruments.
Operations and Maintenance Expenses. Operations and maintenance expenses totaled $65.3 million for 2011 compared to $53.5 million for 2010. The 22% increase is attributable primarily to increased payroll, utilities, chemicals and repair and maintenance expenses in our Texas segment of $8.8 million, including expenses for expanded operations related to new Eagle Ford Shale assets and repairs at the Saint Jo plant, and increased payroll, operating costs for new compressors, fuel, utilities and supplies expenses in our Oklahoma segment of $3.0 million, including expenses for the operations of the Burbank and Harrah plants acquired in April 2010 and 2011, respectively.
Depreciation and Amortization. Depreciation and amortization totaled $69.2 million for 2011 compared with $62.6 million for 2010, an increase of 11%. This increase relates primarily to additional depreciation and amortization resulting from capital expenditures in 2011, including expenditures relating to acquisition of the Harrah plant, the expansion of the fractionation facility to double the capacity at our Houston Central complex, continued expansion of the gathering system surrounding our Saint Jo plant and the extension of the initial segment of the DK pipeline to the Houston Central complex in Texas.
Impairment. Impairment totaled $8.4 million for 2011 primarily due to a $3.4 million non-cash impairment in south Texas and a $5.0 million non-cash impairment primarily as a result of a write-down of an underutilized contract for firm capacity that we resell to Rocky Mountains producers. We did not recognize impairment in 2010.
83
Table of Contents
General and Administrative Expenses. General and administrative expenses totaled $48.7 million for 2011 compared to $40.3 million for 2010. The 21% increase consists primarily of a $5.1 million increase in personnel, compensation and benefits costs, a $1.7 million increase in deferred equity compensation, a $0.7 million increase in tax services, a $0.7 million increase in bad debt expense and a $0.5 million increase in acquisition costs offset by a $0.3 million increase in management fees received from our unconsolidated affiliates.
Equity in Loss from Unconsolidated Affiliates. Equity in loss from unconsolidated affiliates totaled $145.3 million for 2011 compared to $20.5 million for 2010, an increase of $124.8 million. The increase consists primarily of a non-cash impairment charge of $165.0 million on our investments in Bighorn and Fort Union, primarily based on a downward shift in the Colorado Interstate Gas forward price curve and our expectations of a continued weak outlook for Rocky Mountains natural gas prices and drilling activity in Wyoming's Powder River Basin, partially offset by equity earnings of $11.2 million from Eagle Ford Gathering, which began service during the third quarter of 2011. Equity in loss from unconsolidated affiliates for 2010 consisted of $28.5 million of equity loss from Bighorn primarily related to a $25.0 million non-cash impairment charge and $0.3 million of equity loss from our other investments offset by $8.3 million of equity earnings from Fort Union.
Interest and Other Financing Costs. Interest and other financing costs totaled $47.2 million for 2011 compared to $53.6 million for 2010, a decrease of $6.4 million. Interest expense related to our revolving credit facility totaled $10.4 million (including settlements paid under our interest rate swaps of $3.9 million) and $8.5 million (including settlements paid under our interest rate swaps of $5.1 million) for 2011 and 2010, respectively. Interest expense related to our senior notes totaled $45.7 million and $46.3 million for 2011 and 2010, respectively. Interest and other financing costs for 2011 includes unrealized mark-to-market gains of $3.0 million on undesignated interest rate swaps compared to unrealized mark-to-market gains of $1.6 million for 2010. Amortization of debt issue costs totaled $3.8 million for 2011 and 2010. Interest expense was offset by capitalized interest of $9.7 million and $3.4 million for 2011 and 2010, respectively. Average borrowings under our credit arrangements for 2011 and 2010 were $807.6 million and $689.6 million with average interest rates of 7.2% and 10.0%, respectively. Please read "— Liquidity and Capital Resources."
Cash Flows
The following table summarizes our cash flows as reported in the historical consolidated statements of cash flows found in Item 8 of this report.
| | | | | | | | | | |
| | Year Ended December 31, | |
|---|
| | 2012 | | 2011 | | 2010 | |
|---|
| | (In thousands)
| |
|---|
Net cash provided by operating activities | | $ | 148,825 | | $ | 151,232 | | $ | 123,598 | |
Net cash used in investing activities | | | (373,894 | ) | | (376,314 | ) | | (156,730 | ) |
Net cash provided by financing activities | | | 223,025 | | | 222,114 | | | 48,370 | |
Our cash flows are affected by a number of factors, some of which we cannot control. These factors include industry and economic conditions, as well as conditions in the financial markets, prices and demand for our services, volatility in commodity prices or interest rates, effectiveness of our hedging program, operational risks and other factors.
Operating Cash Flows. Net cash provided by operating activities was $148.8 million for 2012 compared to $151.2 million for 2011. The decrease in cash provided by operating activities of $2.4 million was attributable to the following changes:
- •
- a $7.1 million increase in interest payments in 2012 compared to 2011; and
84
Table of Contents
- •
- a $7.7 million reduction of cash flow related to our risk management activities in 2012 as compared to 2011;
offset by:
- •
- a $11.4 million increase in distributions received from our unconsolidated affiliates in 2012 compared to 2011; and
- •
- a $1.0 million increase in cash flow provided by operating activities for 2012 compared to 2011.
Net cash provided by operating activities was $151.2 million for 2011 compared to $123.6 million for 2010. The increase in cash provided by operating activities of $27.6 million was attributable to the following changes:
- •
- a $9.2 million increase in cash distributions received from Eagle Ford Gathering, Bighorn, Fort Union and Southern Dome in 2011 compared to 2010;
- •
- a $10.3 million increase in working capital for 2011 compared to 2010;
- •
- a $5.0 million decrease in cash used in risk management activities, primarily because we purchased commodity derivative instruments at a total cost of $11.1 million during 2011, whereas in 2010, we purchased $19.8 million of commodity derivative instruments; and
- •
- a $3.1 million decrease in interest payments for 2011 compared to 2010 as a result of increased capitalized interest.
Investing Cash Flows. Net cash used in investing activities was $373.9 million and $376.3 million for 2012. Investing activities for 2012 included (i) $332.6 million of capital expenditures, consisting of $276.8 million related to our Eagle Ford Shale growth strategy and well connections attaching volumes in new areas, $24.9 million related to activities around our Saint Jo plant and $30.9 million related to our activities in Oklahoma; and (ii) $72.3 million of investments in Eagle Ford Gathering, Double Eagle Pipeline, Liberty Pipeline Group and Bighorn, offset by (i) $26.6 million of proceeds from the sales of our Lake Charles plant and other assets and (ii) $4.4 million in distributions from Liberty Pipeline Group and Bighorn in excess of equity earnings.
Net cash used in investing activities was $376.3 million for 2011. Investing activities for 2011 included (i) $258.1 million of capital expenditures related to our Eagle Ford Shale growth strategy, the acquisition of the Harrah plant in Oklahoma and well connections attaching volumes in new areas and (ii) $122.0 million of investments in Eagle Ford Gathering, Liberty Pipeline Group, Webb Duval, Double Eagle Pipeline and Bighorn offset by $3.8 million of distributions from Bighorn and Southern Dome in excess of equity earnings.
Net cash used in investing activities was $156.7 million for 2010. Investing activities for 2010 included (i) $127.7 million of capital expenditures related to the expansion of our Saint Jo plant and construction of upstream gathering lines, right-of-way acquisition, construction of the DK pipeline and start-up of our fractionator at the Houston Central complex in Texas, and completion of the Burbank plant and installation of treating and compression facilities in Oklahoma, as well as constructing well interconnects to attach volumes in new areas and (ii) $33.0 million of investments in Eagle Ford Gathering offset by (i) $3.5 million of distributions from Bighorn and Southern Dome in excess of equity earnings and (ii) other investing activities of $0.5 million.
Financing Cash Flows. Net cash provided by financing activities totaled $223.0 million in 2012 and included (i) net proceeds from our issuance of common units of $389.4 million in January 2012 and October 2012, (ii) proceeds from our issuance of senior unsecured notes due 2021 of $153.4 million in February 2012, (iii) proceeds from borrowings under our revolving credit facility of $377.0 million and (iv) proceeds from the exercise of common unit options of $1.3 million, offset by (i) repayment of our
85
Table of Contents
revolving credit facility of $523.0 million, (ii) distributions to our unitholders of $171.6 million and (iii) deferred financing costs of $3.5 million.
Net cash provided by financing activities totaled $222.1 million during 2011 and included (i) net borrowings under our revolving credit facility of $375 million, (ii) issuance of our senior unsecured notes due 2021 of $360 million in April 2011 and (iii) proceeds from the exercise of unit options of $3.2 million offset by (i) distributions to our unitholders of $153.1 million, (ii) tender and redemption of our senior unsecured notes due 2016 of $332.6 million in April 2011, (iii) bond tender and consent premiums of $14.6 million and (iv) deferred financing costs of $15.8 million.
Net cash provided by financing activities totaled $48.4 million during 2010 and included (i) proceeds from our private placement of Series A convertible preferred units net of underwriting discounts and commissions and fees of $285.2 million in July 2010, (ii) net proceeds from our public offering of common units (including units issued upon the underwriters' exercise of their option to purchase additional units) of $164.3 million in March 2010 and (iii) proceeds from the exercise of unit options of $5.4 million offset by (i) net repayments under our revolving credit facility of $260 million, (ii) distributions to our unitholders of $145.5 million and (iii) deferred financing costs of $1.0 million.
Liquidity and Capital Resources
Sources of Liquidity. Cash generated from operations (including distributions from our unconsolidated affiliates), borrowings under our revolving credit facility and funds from equity and debt offerings are our primary sources of liquidity. Our primary cash requirements consist of normal operating expenses, capital expenditures to sustain existing operations or generate additional revenues, interest payments on our revolving credit facility and senior unsecured notes, distributions to our unitholders and acquisitions of new assets or businesses. We expect to fund short-term cash requirements, such as operating expenses, capital expenditures to sustain existing operations and quarterly distributions to our unitholders, primarily through operating cash flows. Subject to limitations under our merger agreement with Kinder Morgan discussed below, we expect to fund long-term cash requirements, such as for expansion projects, acquisitions and risk management assets, through several sources, including operating cash flows, borrowings under our revolving credit facility and issuances of additional equity and debt securities, as appropriate and subject to market conditions.
Pursuant to our merger agreement with Kinder Morgan, we are subject to conditions, restrictions and thresholds relating to, among other things, our ability to refinance or incur new debt, issue equity and dispose of any material properties, assets, or equity interests other than as prescribed in the merger agreement. Based on our current available liquidity, we expect our existing liquidity sources and operating cash flow to be sufficient to fund our short-term capital requirements and estimated 2013 capital expenditures. However a substantial delay in completing, or failure to complete, our proposed merger with Kinder Morgan may require us to adjust our plans, which could include reductions in our capital expenditures, increasing our indebtedness or reducing our operating and general and administrative expenses, all of which could impact our financial and operating performance.
Capital Expenditures. Our business is capital-intensive, requiring significant investment to maintain and upgrade existing operations. Our capital requirements have consisted primarily of, and we anticipate will continue to be:
- •
- maintenance capital expenditures, which are capital expenditures made to replace partially or fully depreciated assets to maintain the existing operating capacity of our assets and to extend their useful lives, or other capital expenditures that are incurred in maintaining existing system volumes and related cash flows; and
- •
- expansion capital expenditures, which are capital expenditures made to expand or increase the efficiency of the existing operating capacity of our assets. Expansion capital expenditures include
86
Table of Contents
expenditures that facilitate an increase in volumes within our operations, whether through construction or acquisition. Expenditures that reduce our operating costs will be considered expansion capital expenditures only if the reduction in operating expenses exceeds cost reductions typically resulting from routine maintenance.
During 2012, our capital expenditures totaled $359.4 million, consisting of $10.9 million of maintenance capital expenditures and $348.5 million of expansion capital expenditures. We used funds from operations and borrowings under our revolving credit facility to fund our capital expenditures. Our expansion capital expenditures related mainly to (i) the initial 400 MMcf/d cryogenic expansion at our Houston Central complex, (ii) the southwest extension of our DK pipeline, (iii) the southeast extension of our Saint Jo gathering system, (iv) the Double Eagle pipeline projects, including conversion of our Goebel pipeline to condensate and crude oil service and (v) other pipeline infrastructure in Texas and Oklahoma.
In 2013, we expect to incur up to $450 million in additional expansion capital expenditures to complete these projects and to enhance the capabilities and capacities of our current asset base. Based on our current scope of operations, we expect to incur approximately $20 million in maintenance capital expenditures in 2013. Under our merger agreement with Kinder Morgan, our ability to make non-emergency capital expenditures is restricted, except as prescribed in the merger agreement.
Investment in Unconsolidated Affiliates. During 2012, our capital contributions to our unconsolidated affiliates totaled $72.3 million and consisted primarily of contributions to Eagle Ford Gathering for construction of gathering pipelines and the related crossover project, and to Double Eagle Pipeline for construction of its condensate/crude gathering system. We anticipate that we will make approximately $71 million in contributions to our unconsolidated affiliates in 2013, most of which will relate to Double Eagle Pipeline.
Cash Distributions. The amount of cash on hand needed to pay the current distribution of $0.575 per unit, or $2.30 per unit annualized, to our common unitholders is as follows (in thousands):
| | | | | | | |
| | One Quarter | | Four Quarters | |
|---|
Common units(1) | | $ | 46,108 | | $ | 184,431 | |
| | | | | | |
- (1)
- Includes distributions on restricted common units and phantom units issued under our LTIP. Distributions made on restricted units and phantom units issued to date are subject to the same vesting provisions as the restricted common units and phantom units. As of January 31, 2013, we had 43,000 outstanding restricted common units and 1,170,116 outstanding phantom units.
Contractual Cash Obligations. A summary of our contractual cash obligations as of December 31, 2012 is as follows:
| | | | | | | | | | | | | | | | |
| | Payment Due by Period | |
|---|
Type of Obligation | | Total
Obligation | | Less than 1 Year | | 1-3 Years | | 3-5 Years | | More than 5
years | |
|---|
| | (In thousands)
| |
|---|
Long-term debt | | $ | 999,000 | | $ | — | | $ | — | | $ | 239,000 | | $ | 760,000 | |
Interest | | | 448,586 | | | 62,955 | | | 125,758 | | | 114,562 | | | 145,311 | |
Gathering, transportation and fractionation firm commitments(1) | | | 349,383 | | | 38,499 | | | 87,569 | | | 80,804 | | | 142,511 | |
Operating leases | | | 15,572 | | | 2,937 | | | 4,742 | | | 2,769 | | | 5,124 | |
Capital expenditures and investments in unconsolidated affiliates(2) | | | 510,000 | | | 510,000 | | | — | | | — | | | — | |
| | | | | | | | | | | | |
Total contractual cash obligations | | $ | 2,322,541 | | $ | 614,391 | | $ | 218,069 | | $ | 437,135 | | $ | 1,052,946 | |
| | | | | | | | | | | | |
87
Table of Contents
- (1)
- These amounts reflect commitments to third parties for payments whether or not we use the associated services.
- (2)
- Includes commitments as of December 31, 2012 discussed above in — "Capital Expenditures" and — "Investments in Unconsolidated Affiliates."
Outlook. Our cash flow is affected by a number of factors, some of which we cannot control. These factors include prices and demand for our services, operational risks, volatility in commodity prices or interest rates, effectiveness of our hedging program, industry and economic conditions, conditions in the financial markets, and other factors.
Recent commodity prices and financial market conditions have supported significant opportunities for volume growth from shale resource plays. Our ability to benefit from growth projects to accommodate strong drilling activity is subject to operational risks and uncertainties such as the uncertainty inherent in some of the assumptions underlying design specifications for new, modified or expanded facilities. These risks also impact third-party service providers and their facilities. Delays or underperformance of our facilities or such third-party facilities may adversely affect our ability to generate cash from operations and comply with our obligations, including the covenants under our debt instruments. In other cases, actual production delivered may fall below volume estimates that we relied upon in deciding to pursue an acquisition or other growth project, and any volume deficiency payments relating to committed volumes may not be sufficient to offset the effect of a shortfall. Drilling activity around our assets in the Powder River Basin and in areas where producers employ conventional drilling techniques has been minimal. It remains unclear when producers in these areas will undertake sustained increases in drilling activity. Our cash flow and ability to comply with our debt covenants would likewise be adversely affected if we experienced declining volumes overall in combination with unfavorable commodity prices over a sustained period.
Our historical financing strategy for funding long-term capital expenditures has been to target a roughly equal mix of debt and equity financing and a consolidated leverage ratio of 4.0 to 1.0 or less. If we exceed our target leverage ratio, as we expect we will from time to time for significant capital projects, acquisitions or other investments, we anticipate reducing leverage through growth in our cash flow or issuance of additional equity. Both our ability to incur additional debt and issue additional equity are subject to limitations under our merger agreement with Kinder Morgan.
We believe that our cash from operations, cash on hand and our revolving credit facility will provide sufficient liquidity to meet our short-term capital requirements and to fund our committed capital expenditures for 2013.
Acquisitions and organic expansion have been, and our management believes will continue to be, key elements of our business strategy. In addition, we continue to consider opportunities for strategic greenfield projects. The timing, size or success of any acquisition or expansion effort and the associated potential capital commitments are unpredictable. To consummate larger acquisitions or capital projects, we will require access to additional capital on competitive terms. Our access to capital over the longer term will depend on our ability to consummate the merger with Kinder Morgan, our future operating performance, financial condition and credit rating and, more broadly, on the availability of equity and debt financing, which will be affected by prevailing conditions in our industry, the economy and the financial markets, and other financial and business factors, many of which are beyond our control.
We purchase commodity derivatives during favorable pricing environments so that the cash from their settlements will help to offset the effects of unfavorable pricing environments in the future.
88
Table of Contents
As of December 31, 2012, our aggregate outstanding indebtedness totaled $1.0 billion, and we were in compliance with the financial covenants under our senior secured revolving credit facility and our incurrence covenants under the indentures governing our senior unsecured notes.
Credit Ratings. At December 31, 2012, Moody's Investors Service has assigned a Corporate Family rating of Ba3 with a negative outlook, a B1 rating for our senior unsecured notes and a Speculative Grade Liquidity rating of SGL-3 and Standard & Poor's Ratings Services has assigned a Corporate Credit Rating of B+ with a stable outlook and a rating for our senior unsecured notes of B. Following the announcement of our merger agreement with Kinder Morgan, Moody's Investors Service placed our rating under review for a possible upgrade and Standard & Poor's Ratings Services placed our rating on Creditwatch with positive implications.
Factors that could materially impact our credit ratings include our leverage, liquidity, and cash distribution coverage, and the impact of our project execution and operating performance on these measures. If our credit ratings were downgraded by Moody's or further downgraded by S&P, it could increase our borrowing costs.
Revolving Credit Facility. As of December 31, 2012, we had $239 million in outstanding borrowings under our $700 million senior secured revolving credit facility with Bank of America, N.A., as Administrative Agent.
We have not experienced any difficulties in obtaining funding from any of our lenders, but the lack of or delay in funding by one or more members of our banking group could negatively affect our liquidity position. Future borrowings under our revolving credit facility are available for acquisitions, capital expenditures, working capital and general corporate purposes, and the facility may be drawn on and repaid without restriction so long as we are in compliance with its terms, including the financial covenants described below. Our revolving credit facility provides for up to $100 million in standby letters of credit. As of December 31, 2012 and 2011, we had no letters of credit outstanding. We have not experienced any difficulties in obtaining funding from any of our lenders, but the lack of or delay in funding by one or more members of our banking group could negatively affect our liquidity position.
Our revolving credit facility obligations are secured by first priority liens on substantially all of our assets and the assets of our 100% owned subsidiaries (except for our equity interests in joint venture entities other than Webb Duval and Southern Dome), all of which are guarantors under the revolving credit facility. Our less than 100% owned subsidiaries have not pledged their assets as security or guaranteed our obligations under the revolving credit facility.
89
Table of Contents
Annual interest under the revolving credit facility is determined, at our election, by reference to (i) the British Bankers Association LIBOR rate, or LIBOR, plus an applicable margin ranging from 2.00% to 3.25% per annum, or (ii) the higher of the federal funds rate plus 0.5%, the prime rate and LIBOR plus 1.0% plus, in each case, an applicable margin ranging from 1.0% to 2.25%. The effective average interest rate on borrowings under the revolving credit facility for 2012, 2011 and 2010 was 5.3%, 5.6% and 8.9%, respectively, and the quarterly commitment fee on the unused portion of the revolving credit facility at the end of each of those periods was 0.5%, 0.375% and 0.25%, respectively.
The revolving credit facility contains various covenants (including certain subjective representations and warranties) that, subject to exceptions, limit our and subsidiary guarantors' ability to grant liens; make loans and investments; make distributions other than from available cash (as defined in our limited liability company agreement); merge or consolidate with or into a third party; or engage in certain asset dispositions, including a sale of all or substantially all of our assets. Additionally, the revolving credit facility limits our and our subsidiary guarantors' ability to incur additional indebtedness, subject to exceptions, including (i) purchase money indebtedness and indebtedness related to capital or synthetic leases, (ii) unsecured indebtedness qualifying as subordinated debt and (iii) certain privately placed or public term unsecured indebtedness.
The revolving credit facility also contains financial covenants, which, among other things, require us and our subsidiary guarantors, on a consolidated basis, to maintain:
- •
- The maximum consolidated leverage ratio (total debt to Consolidated EBITDA as defined in the amended credit agreement) permitted under the agreement is 5.25 to 1.0. Subject to conditions and limitations described in the amended credit agreement, up to 15% of our Consolidated EBITDA for purposes of calculating this ratio may consist of projected EBITDA attributable to material capital projects (generally, capital projects expected to exceed $20 million) then under construction, including our net share of projected EBITDA attributable to capital projects pursued by joint ventures in which we own interests ("Material Project EBITDA"). At December 31, 2012, our consolidated leverage ratio was 4.00 to 1.0.
- •
- The maximum senior secured leverage ratio (total senior secured debt to Consolidated EBITDA as defined in the amended credit agreement) permitted under the agreement is 4.0 to 1.0. Up to 15% of our Consolidated EBITDA for purposes of calculating this ratio may consist of Material Project EBITDA. At December 31, 2012, our senior secured leverage ratio was 0.96 to 1.0.
- •
- The minimum consolidated interest coverage ratio (Consolidated EBITDA to interest as defined in the amended credit agreement) as of the end of any fiscal quarter may not be less than 2.50 to 1.00. At December 31, 2012, our consolidated interest coverage ratio was 3.62 to 1.00.
Based on our trailing four-quarter Consolidated EBITDA, as defined under the amended credit agreement, at December 31, 2012, we could borrow an additional $311 million before reaching our maximum leverage ratio of 5.25 to 1.0.
Our revolving credit facility also contains customary events of default, including the following:
- •
- failure to pay any principal when due, or within specified grace periods, any interest, fees or other amounts;
- •
- failure to perform or otherwise comply with the covenants in the credit agreement or other loan documents, subject to grace periods in some cases;
- •
- default on the payment of any other indebtedness in excess of $35 million, or in the performance of any obligation or condition with respect to such indebtedness, beyond the applicable grace period if the effect of the default is to permit or cause the acceleration of the indebtedness;
- •
- bankruptcy or insolvency events involving us or our subsidiaries;
90
Table of Contents
- •
- the entry of, and failure to pay, one or more adverse judgments in excess of $35 million upon which enforcement proceedings are brought or are not stayed pending appeal; and
- •
- a change of control (as defined in the revolving credit facility).
If we failed to comply with the financial or other covenants under our revolving credit facility or experienced a material adverse effect on our operations, business, properties, liabilities or financial or other condition, we would be unable to borrow under our revolving credit facility, and could be in default after specified notice and cure periods. If an event of default exists under the revolving credit facility, our lenders could terminate their commitments to lend to us and accelerate the maturity of our outstanding obligations under the revolving credit facility.
Senior Notes. As of December 31, 2012, our aggregate outstanding indebtedness under our senior notes due 2018 and 2021 totaled $762.6 million, including an unamortized bond premium of $3.1 million. Interest on the senior notes is payable semi-annually.
On April 5, 2011, we closed a public offering of $360 million in aggregate principal amount of 7.125% senior unsecured notes due 2021. We used the net proceeds to fund a tender offer for all of our outstanding 8.125% senior secured notes due 2016 and a subsequent redemption of all of these senior notes not purchased in the tender offer, and to provide working capital and for general corporate purposes.
On February 7, 2012, we completed a registered underwritten offering of an additional $150 million aggregate principal amount of 7.125% senior notes due 2021 at 102.25% of their principal amount for net proceeds of approximately $150.1 million. These notes are an additional issue of our existing senior notes due 2021 and are issued under the same indenture and are part of the same series. We used net proceeds from the offering to repay a portion of the outstanding indebtedness under our revolving credit facility.
The senior notes are jointly and severally guaranteed by all of our 100% owned subsidiaries (other than Copano Energy Finance Corporation, the co-issuer of the Senior Notes). The subsidiary guarantees rank equally in right of payment with all of our guarantor subsidiaries' existing and future senior indebtedness, including their guarantees of our other senior indebtedness. The subsidiary guarantees are effectively subordinated to all of our guarantor subsidiaries' existing and future secured indebtedness (including under our revolving credit facility) to the extent of the value of the assets securing that indebtedness, and all liabilities, including trade payables, of any non-guarantor subsidiaries (other than indebtedness and other liabilities owed to our guarantor subsidiaries).
The senior notes are redeemable, in whole or in part and at our option, at stated redemption prices plus accrued and unpaid interest to the redemption date. If we undergo a change in control, we must give the holders of Senior Notes an opportunity to sell us their notes at 101% of the face amount, plus accrued and unpaid interest to date.
The indentures governing our senior notes include customary covenants that limit our and our subsidiary guarantors' abilities to, among other things:
- •
- sell assets;
- •
- redeem or repurchase equity or subordinated debt;
- •
- make investments;
- •
- incur or guarantee additional indebtedness or issue preferred units;
- •
- create or incur liens;
- •
- enter into agreements that restrict distributions or other payments from our restricted subsidiaries to us;
91
Table of Contents
- •
- consolidate, merge or transfer all or substantially all of our assets;
- •
- engage in transactions with affiliates;
- •
- create unrestricted subsidiaries; and
- •
- enter into sale and leaseback transactions.
In addition, the indentures governing our senior notes restrict our ability to pay cash distributions. Before we can pay a distribution to our unitholders, we must demonstrate that our ratio of consolidated cash flow to fixed charges (each as defined in the senior notes indentures) is at least 1.75 to 1.0. At December 31, 2012, our ratio of consolidated cash flow to fixed charges was 3.40 to 1.0.
These covenants are subject to customary exceptions and qualifications. Additionally, if the senior notes achieve an investment grade rating from each of Moody's Investors Service and Standard & Poor's Ratings Services, many of these covenants will terminate.
Impact of Inflation
Although the impact of inflation on us has not been material in recent years, it remains a factor in the midstream natural gas industry and in the United States economy in general. We may experience increasing costs for chemicals, utilities, materials and supplies, labor and equipment during times of increased activity in the energy sector or increasing commodity prices. To the extent permitted by competition, regulation and our existing agreements, we may pass along increased costs to our customers in the form of higher fees.
Off-Balance Sheet Arrangements
We had no off-balance sheet arrangements as of December 31, 2012 and 2011.
Recent Accounting Pronouncements
In February 2013, the Financial Accounting Standards Board issued Accounting Standards Update 2013-02-Comprehensive Income (Topic 220), "Reporting of Amounts Reclassified Out of Accumulated Other Comprehensive Income." This update requires that we report reclassifications out of accumulated other comprehensive income and their effect on net income by component or financial statement line. This can be reported either on the face of the statement where net income is presented or in the notes and is required beginning with our quarterly filing for the three months ended March 31, 2013. We do not expect this to impact our consolidated financial results, as the only required change is the format of our presentation.
We have reviewed other recently issued, but not yet adopted, accounting standards and updates in order to determine their potential effects, if any, on our consolidated results of operations, financial position and cash flows and have determined that none are expected to have a material impact.
Critical Accounting Policies and Estimates
The selection and application of accounting policies is an important process that has developed as our business activities have evolved and as the accounting rules have developed. Accounting rules generally do not involve a selection among alternatives, but involve an implementation and interpretation of existing rules, and the use of judgment applied to the specific set of circumstances existing in our business. We make every effort to properly comply with all applicable rules on or before their adoption, and we believe the proper implementation and consistent application of the accounting rules are critical. For further details on our accounting policies, please read Notes 2 and 3 to our consolidated financial statements included in Item 8 of this report.
92
Table of Contents
We own a 62.5% equity investment in Webb Duval, a majority interest in Southern Dome, a 51% equity investment in Bighorn, a 37.04% equity investment in Fort Union, a 50% equity investment in Eagle Ford Gathering, a 50% equity investment in Liberty Pipeline Group and a 50% equity investment in Double Eagle Pipeline. Although we are the managing partner or member in each of these equity investments and own a majority interest in some of these equity investments, we account for these investments using the equity method of accounting because the remaining general partners or members have substantive participating rights with respect to the management of each of these equity investments. Equity in earnings (loss) from our unconsolidated affiliates is included in income from operations as the operations of each of our unconsolidated affiliates are integral to our operations.
In accordance with Accounting Standard Codification ("ASC") 360, "Accounting for the Impairment or Disposal of Long-Lived Assets," we evaluate whether long-lived assets, including related intangibles, have been impaired when events or changes in circumstances indicate, in management's judgment, that the carrying value of such assets may not be recoverable. For such long-lived assets, an impairment exists when its carrying value exceeds the sum of management's estimate of the undiscounted future cash flows expected to result from the use and eventual disposition of the asset. If the carrying value of the long-lived asset is not recoverable based on these estimated future undiscounted cash flows, the impairment loss is measured as the excess of the asset's carrying value over its fair value, such that the asset's carrying value is adjusted to its estimated fair value. For assets identified to be disposed of in the future, the carrying value of these assets is compared to the estimated fair value less the cost to sell to determine if impairment is required. Until the assets are disposed of, an estimate of the fair value is recalculated when related events or circumstances change.
Additionally, we periodically reevaluate our equity-method investments to determine whether current events or circumstances warrant adjustments to our carrying value in accordance with the ASC 323"Investments — Equity Method and Joint Ventures." When indicators of impairment are present, we perform an impairment test to determine if adjustment to our carrying value is necessary. The impairment test for our investments in unconsolidated affiliates requires that we consider whether the fair value of our equity investment as a whole, not the underlying net assets, has declined, and if so, whether that decline is other than temporary.
Our estimates of future cash flows for purposes of an impairment analysis with respect to assets or investments are based on various assumptions, including future commodity prices and estimated future natural gas production in the region (which is dependent in part on commodity prices). Projections of gas volumes and future commodity prices are inherently subjective and contingent upon a number of variable factors, including but not limited to:
- •
- changes in general economic conditions in which our assets are located;
- •
- the availability and prices of natural gas supply;
- •
- improvements in exploration and production technology;
- •
- the finding and development cost for producers to exploit reserves in a particular area;
- •
- our ability to negotiate favorable agreements with producers and customers;
- •
- availability of downstream natural gas and NGL markets;
- •
- our dependence on certain significant customers, producers, gatherers and transporters of natural gas; and
- •
- competition from other midstream service providers, including major energy companies.
93
Table of Contents
Any significant variance in any of the above assumptions or factors could materially affect our estimated cash flows, which could require us to record an impairment of an asset or an investment. An estimate of the sensitivity of these assumptions to our estimated future undiscounted or discounted cash flows used in our impairment review is not practicable given the extensive array of our assets and investments and the number of assumptions involved in these estimates.
During 2011, we recorded a $3.4 million non-cash impairment charge relating to assets in south Texas leaving a remaining book value of these assets of less than $0.1 million.
During 2011 and 2012, we recorded non-cash impairment charges of $5 million and $28.7 million related to a contract under which we provide services to Rocky Mountains producers. In both cases, the impairment was primarily as a result of a continued weak Rocky Mountains pricing environment for natural gas, lack of drilling activity in Wyoming's Powder River Basin and a downward shift in the Colorado Interstate Gas forward price curve. As a result of these impairments, we have no remaining carrying value related to this asset.
In 2011 and early 2012, we recorded non-cash impairment charges of $165 million and $120 million, respectively, relating to our investments in Bighorn and Fort Union primarily as a result of a continued weak Rocky Mountains pricing environment for natural gas, lack of drilling activity in Wyoming's Powder River Basin and a downward shift in the Colorado Interstate Gas forward price curve.
During the three months ended December 31, 2012, we recorded a non-cash impairment charge of $66.3 million relating to our investments in Bighorn and Fort Union primarily as a result of a decline in our forecasted future volumes on the respective systems after by a major producer in the region informed us that some of its current and future production was going to be abandoned.
For each of the impairment charges discussed above, we developed the fair value of our investments in Bighorn and Fort Union using a probability weighted discounted cash flow model that applied a discount rate reflective of market participants' cost of capital and estimated contract rates, volumes, operating and maintenance costs and capital expenditures. Based on forecasted pricing in the region, we believe it is probable that producers on dedicated acreage may increase drilling and production in the future when prices are sufficient to support substantial drilling and completion activity, and that we will recover our revalued investments in Bighorn and Fort Union. If the assumptions underlying our expectations prove incorrect and volumes do not recover either due to decreased drilling activity or a weaker-than-forecasted pricing environment, we ultimately would be required to record an additional impairment of our interests in Bighorn, Fort Union, or both. As of December 31, 2012, the remaining carrying value of our investments in Bighorn and Fort Union is $189.5 million.
For additional information, please read Notes 2, 4 and 9 to our consolidated financial statements included in Item 8 of this report.
Using the revenue recognition criteria of evidence of an arrangement, delivery of a product and the determination of price, our natural gas and NGL revenue is recognized in the period when the physical product is delivered to the customer and in an amount based on the pricing terms of an executed contract. Our transportation, compression, processing, fractionation and other revenue is recognized in the period when the service is provided and includes our fee-based service revenue including processing under firm capacity arrangements. In addition, collectability is evaluated on a customer-by-customer basis. New and existing customers are subject to a credit review process, which evaluates the customers' financial position and their ability to pay.
Our sale and purchase arrangements are primarily accounted for on a gross basis in the statements of operations as natural gas sales and costs of natural gas, respectively. These transactions are contractual arrangements that establish the terms of the purchase of natural gas at a specified location and the sale of
94
Table of Contents
natural gas at a different location on the same or on another specified date. All transactions require physical delivery of the natural gas, and transfer of the risk and reward of ownership are evidenced by title transfer, assumption of environmental risk, transportation scheduling, credit risk and counterparty nonperformance risk.
On occasion, we enter into buy/sell arrangements that are accounted for on a net basis in the statements of operations as either a net natural gas sale or a net cost of natural gas, as appropriate. These purchase and sale transactions are generally detailed either jointly, in a single contract or separately, in individual contracts that are entered into concurrently or in contemplation of one another with a single or multiple counterparties.
Our contract mix reflects a variety of pricing terms typical for the midstream industry, with varying levels of commodity price sensitivity, including fee-based, percent-of-proceeds, percent-of-index and keep-whole terms. Please read Item 7A., "Quantitative and Qualitative Disclosures about Market Risk — Our Contracts."
ASC 815"Derivatives and Hedging," as amended, establishes accounting and reporting standards for derivative instruments, including certain derivative instruments embedded in other contracts, and for hedging activities. In accordance with ASC 815, we recognize all derivatives as either risk management assets or liabilities in our consolidated balance sheets and measure those instruments at fair value. If the financial instruments meet the hedging criteria, changes in fair value will be recognized in earnings for fair value hedges and in other comprehensive income for the effective portion of cash flow hedges. Ineffectiveness in cash flow hedges is recognized in earnings in the period in which the ineffectiveness occurs. Gains and losses on cash flow hedges are reclassified to operating revenue as the forecasted transactions impact earnings. We included changes in our risk management activities in cash flow from operating activities on the consolidated statements of cash flows.
We use financial instruments such as puts, calls, swaps and other derivatives to mitigate the risks to our cash flow and profitability resulting from changes in commodity prices and interest rates. We recognize these transactions as assets and liabilities on our consolidated balance sheets based on the instrument's fair value. We estimate the fair value of our financial derivatives using valuation models based on whether the inputs to those valuation techniques are observable or unobservable. For further details on our risk management activities, please read Note 9, "Financial Instruments," to our consolidated financial statements included in Item 8 of this report.
Item 7A. Quantitative and Qualitative Disclosures about Market Risk.
Market risk is the risk of loss arising from adverse changes in market rates and prices. We are exposed to market risks, including changes in commodity prices and interest rates. We may use financial instruments such as options, swaps and other derivatives to mitigate the effects of these risks. In general, we attempt to hedge risks related to the variability of our future cash flow and profitability resulting from changes in applicable commodity prices or interest rates so that we can maintain cash flows sufficient to meet debt service, required capital expenditures, distribution objectives and similar requirements. Our risk management policy prohibits the use of derivative instruments for speculative purposes.
NGL and natural gas prices can be volatile and are impacted by changes in fundamental supply and demand, as well as market uncertainty and a variety of additional factors that are beyond our control. Our profitability is directly affected by prevailing commodity prices primarily as a result of: (i) processing at our processing plants or third-party processing plants under index-related pricing arrangements, (ii) purchasing and selling or gathering and transporting volumes of natural gas at index-related prices and (iii) purchasing
95
Table of Contents
and selling or transporting and fractionating NGLs at index-related prices. To the extent that they influence the level of drilling activity, commodity prices also affect all of our segments indirectly.
Our contract mix reflects a variety of pricing terms typical for the midstream industry, with varying levels of commodity price sensitivity, including fee-based, percent-of-proceeds, percent-of-index and keep-whole terms. Please refer to Item 1., "Business — Industry Overview — Midstream Contracts" for detailed descriptions of these arrangements. In addition to compensating us for gathering, transportation, processing, or fractionation services, many of our contracts also allow us to charge fees for treating, compression, dehydration, nitrogen rejection or other services. Generally:
- •
- our margins from fee-based pricing are directly related to the volumes of natural gas, condensate or NGLs that flow through our systems and are not directly affected by commodity prices;
- •
- our margins from percent-of-proceeds (including percent-of-liquids) pricing and percent-of-index pricing for lean gas that does not require processing are generally directly related to the prices for natural gas, NGLs or both; in other words, our margins increase or decrease as prices increase or decrease; and
- •
- our margins from keep-whole pricing and percent-of-index pricing involving gas that we process are related not only to natural gas and NGL prices but also to the spread between natural gas and NGL prices. As NGL prices increase relative to natural gas prices, our margins increase, and if NGL prices decrease relative to natural gas prices, our margins decrease. Our keep-whole contracts sometimes include terms that help us avoid incurring losses that would result if NGL prices fell near or below natural gas prices, such as allowing us to charge fees and reduce the volume of NGLs we recover during unfavorable pricing environments. Also, to the extent our contract entitles us to keep extracted NGLs, we may share a portion of our processing margin with the counterparty when processing margins are favorable.
In addition, some of our fee-based and percent-of-proceeds contracts include "fixed recovery" provisions, which operate in conjunction with the contract's main pricing terms. Under fixed recovery terms, we determine the amount payable, or the volumes of residue gas and NGLs deliverable, to the counterparty based on contractual NGL recovery factors. Fixed recovery terms can affect our margins to the extent that our actual recoveries vary from the agreed NGL recovery factor. If we exceed fixed recoveries when processing margins are favorable, our margins will benefit to the extent of the difference. However, our margins will decrease to the extent we do not meet the NGL recovery factor in a favorable processing margin environment, and we could incur losses. If NGL prices are unfavorable relative to natural gas prices, we would be able to increase our margins by reducing our recoveries.
The table below illustrates the commodity sensitivity affecting our gross margin, as a percentage of our quarterly total segment gross margin and our share of the gross margin from each of our unconsolidated affiliates. The contract types presented indicate what portion of our gross margin was generated under each of the pricing terms listed, rather than under categories of contracts. As noted above, many of our contracts use a combination of pricing terms to help reduce our commodity price risk; therefore, a single contract will likely contribute to multiple categories in the table below.
96
Table of Contents
| | | | | | | | | | | | | | | | | | | | | | | | |
Contract Pricing(1) | | Q1 2011 | | Q2 2011 | | Q3 2011 | | Q4 2011 | | Q1 2012(5) | | Q2 2012 | | Q3 2012 | | Q4 2012 |
|---|
Fee-based | | | 43% | | | 45% | | | 48% | | | 48% | | | 64% | | | 64% | | | 64% | | | 63% |
Percentage-of-proceeds(2) | | | 32% | | | 36% | | | 33% | | | 26% | | | 23% | | | 15% | | | 18% | | | 17% |
Keep-whole and other(3) | | | 38% | | | 33% | | | 29% | | | 40% | | | 19% | | | 17% | | | 22% | | | 21% |
Net hedging(4) | | | (13)% | | | (14)% | | | (10)% | | | (14)% | | | (6)% | | | 4% | | | (4)% | | | (1)% |
- (1)
- Gross margin attributable to percent-of-index arrangements for lean gas is immaterial and has not been set forth separately.
- (2)
- Gross margin attributable to percentage-of proceeds pricing increases as commodity prices increase.
- (3)
- Gross margin attributable to keep-whole pricing terms increases if NGL prices increase relative to natural gas prices, and decreases if NGL prices decline relative to natural gas prices. "Other" consists of percent-of-index arrangements involving rich gas and the effects of variations from agreed fixed recoveries.
- (4)
- Net impact of our commodity derivative instruments to total segment gross margin.
- (5)
- Higher fee-based and lower keep-whole percentages reflect a combination of factors, primarily: growth in fee-based Eagle Ford Shale volumes; conversion of a temporary, keep-whole processing arrangement into a fee-based arrangement; and effects of losses we incurred under contracts with fixed recovery terms because of Houston Central complex operating performance during this period.
Texas. Our Texas pipeline systems purchase natural gas and transport for resale and also transport and provide other services on a fee-for-service basis. Many of the contracts we executed in 2011 and 2012 were fee-based and have provided for volume commitments by producers, under which the producer is obligated to deliver an agreed volume of natural gas and to pay a "deficiency fee" to the extent the producer delivers less than the agreed volume. The fees we charge to transport natural gas for the accounts of others are primarily fixed, but our Texas contracts also include a percentage-of-index component in a number of cases.
Oklahoma. A majority of the processing contracts in our Oklahoma segment are percentage-of-proceeds arrangements. Our Oklahoma segment also has fixed-fee contracts and percentage-of-index contracts.
Rocky Mountains. Substantially all of our Rocky Mountains contractual arrangements as well as the contractual arrangements of Fort Union and Bighorn are fee-based arrangements pursuant to which the gathering fee income represents an agreed rate per unit of throughput. We have experienced the effects of indirect commodity price risk in our Rocky Mountains operations, as sustained low natural gas prices have discouraged drilling activity, which has caused volume declines for our producer services and on the Bighorn and Fort Union gathering systems.
Other Commodity Price Risks. Although we seek to maintain a position that is substantially balanced between purchases and sales for future delivery obligations, we experience imbalances between our natural gas or NGL purchases and sales from time to time. For example, a producer could fail to deliver or deliver in excess of contracted gas volumes, or a customer could take more or less than its contracted volumes. We also experience imbalances relating to operational factors such as accumulation of condensate in our pipelines, which reduces the thermal equivalent value of the gas being gathered or transported, although we periodically recover and sell the condensate to offset these imbalances. To the extent our purchases and sales of gas or NGLs are not balanced, we face increased exposure to commodity prices with respect to the imbalance.
We purchase and sell natural gas and NGLs under a variety of pricing arrangements. We generally purchase gas, mixed NGLs or both from producers at index-based prices, in some cases less an agreed discount or fee, or at prices based on our actual resale prices. We sell gas by reference to first of the month index prices, daily index prices or a weighted average of index prices over a given period. We resell mixed NGLs or purity products at index-based prices, in some cases less a discount or fee to the purchaser. Our goal is to minimize commodity price risk by aligning the combination of pricing methods and indices under which we purchase gas and NGLs with the combination under which we sell gas and NGLs, although it is not always possible to do so.
97
Table of Contents
Basis risk is the risk that the value of a hedge may not move in tandem with the value of the actual price exposure that is being hedged. Any disparity in terms, such as product, time or location, between the hedge and the underlying exposure creates the potential for basis risk. Our long position in natural gas in Oklahoma can serve as a hedge against our short position in natural gas in Texas. To the extent we rely on natural gas from our Oklahoma segment, which is priced primarily on the CenterPoint East index, to offset a short position in natural gas in our Texas segment, which is priced on the Houston Ship Channel index, we are subject to basis risk. In addition, we are subject to basis risk to the extent we hedge Oklahoma NGL volumes because, due to the limited liquidity in the forward market for Conway-based hedge instruments, we use Mont Belvieu-priced hedge instruments for our Oklahoma NGL volumes. The CenterPoint East and Houston Ship Channel indices and the Mont Belvieu and Conway indices historically have been highly correlated; however, CenterPoint East and Houston Ship Channel displayed greater variability in 2009 before returning to a correlation more consistent with their historical pattern. Mont Belvieu and Conway have continued to show variability; this basis continued to widen in the first half of 2012 but tightened considerably in the second half of 2012.
Sensitivity. In order to calculate the sensitivity of our total segment gross margin to commodity price changes, we adjusted our operating models for actual commodity prices, plant recovery rates and volumes. We have calculated that a $0.01 per gallon change in either direction of NGL prices would have resulted in a corresponding change of approximately $0.2 million and $1.1 million to our total segment gross margin for the years ended December 31, 2012 and 2011, respectively. We also calculated that a $0.10 per MMBtu increase or decrease in the price of natural gas would have resulted in a corresponding change of approximately $0.1 million to our total segment gross margin for each of the years ended December 31, 2012 and 2011. These relationships are not necessarily linear. When actual prices fall below the strike prices of our hedges, our sensitivity to further changes in commodity prices is reduced. However, our hedge instruments do not reduce our sensitivity to commodity prices to the extent that commodity prices remain above strike prices. Our strike prices exceeded commodity prices during most of 2012, partially reducing our commodity price sensitivity for the period.
We seek to mitigate the price risk of natural gas and NGLs, and our interest rate risk discussed below under " Interest Rate Swaps", through the use of derivative instruments. These activities are governed by our risk management policy. Our Risk Management Committee is responsible for our compliance with our risk management policy and consists of our Chief Executive Officer, Chief Financial Officer, Chief Operating Officer, General Counsel and the President of any operating segment. The Audit Committee of our Board of Directors monitors the implementation of our risk management policy, and we have engaged an independent firm to monitor compliance with our risk management policy on a monthly basis.
Our risk management policy provides that derivative transactions must be executed by our Chief Financial Officer or his designee and must be authorized in advance of execution by our Chief Executive Officer.
As of December 31, 2012, we were in compliance with our risk management policy.
Permitted Derivative Instruments. Our risk management policy allows our management to:
- •
- purchase put options or "put spreads" (purchase of a put and a sale of a put at a lower strike price) on WTI crude oil to hedge NGLs produced or condensate collected by us or an entity or asset to be acquired by us if a binding purchase and sale agreement has been executed (a "Pending Acquisition");
98
Table of Contents
- •
- purchase put or call options, enter into collars (purchase of a put together with the sale of a call) or "call or put spreads" (i) purchase of a call and a sale of a call at a higher strike price or (ii) purchase of a put and a sale of a put at a lower strike price), fixed-for-floating swaps or floating-for-floating swaps (basis swaps) on natural gas at Henry Hub, Houston Ship Channel or other highly liquid points relevant to our operations or a Pending Acquisition;
- •
- purchase put options, enter into collars or "put spreads" (purchase of a put and a sale of a put at a lower strike price) and/or sell fixed for floating swaps or floating-for-floating swaps (basis swaps) on NGLs to which we or a Pending Acquisition has direct price exposure, priced at Mont Belvieu or Conway; and
- •
- purchase put options and collars and/or sell fixed for floating swaps on the "fractionation spread" or the "processing margin spread" for NGLs (as a mixed Bbl or as a separate product) for which we or a Pending Acquisition has direct price exposure.
Limitations. Our policy also limits the maturity and notional amounts of our derivatives transactions as follows:
- •
- Maturities with respect to the purchase of any crude oil, natural gas, NGLs, fractionation spread or processing margin spread hedge instruments must be limited to five years from the date of the transaction;
- •
- Except as provided below under "Exception to Volume Limitations," we may not (i) purchase crude oil or NGLs put options, (ii) purchase natural gas put or call options, (iii) purchase fractionation spread or processing margin spread put options or (iv) enter into any crude oil, natural gas or NGLs spread options permitted by the policy if, as a result of the proposed transaction, net notional hedged volumes with respect to the underlying hedged commodity would exceed 80% of the projected requirements or output, as applicable, for the hedged period. We are required to divest outstanding hedge positions only to the extent net notional hedged volumes with respect to an underlying hedged commodity exceed 100% of the projected requirements or output, as applicable, for the hedged period;
- •
- The aggregate volumetric exposure associated with swaps (other than basis swaps), collars and written calls relating to any product must not exceed 35% of the projected requirements or output with respect to such product; and
- •
- We may not enter into a basis swap if, as a result of the proposed transaction, net notional hedged volumes with respect to the underlying hedged basis would exceed 80% of the projected requirements or output, as applicable, for the hedged period. We are required to divest outstanding basis swaps only to the extent net notional hedged volumes with respect to an underlying hedged basis exceed 100% of the projected requirements or output, as applicable, for the hedged period.
Our policy of limiting swaps (other than basis swaps) relating to a percentage of the related projected requirements or output is intended to avoid risk associated with potential fluctuations in output volumes that may result from operational circumstances.
Exception to Volume Limitations. The volume limitations under our risk management policy provide that the notional amounts of put options with strike prices that are greater than 33% out-of-the-money (market price exceeds strike price by greater than 33%) may be excluded from the notional volume limitations for so long as such put options remain out-of-the-money. In the event that the strike price of such a put option returns to being in-the-money, the instrument's notional amount would again be included in the volume limitations. If the reversal of a prior exclusion results in an over-hedged notional position, we will be required to become compliant with the notional volume limitations within 30 days of the reversal.
99
Table of Contents
Approved Markets. Our risk management policy requires derivative transactions to take place either on the New York Mercantile Exchange ("NYMEX") through a clearing member firm or with over-the-counter counterparties with investment grade ratings from both Moody's Investors Service and Standard & Poor's Ratings Services with complete industry standard contractual documentation. Except for two option counterparties, all of our hedge counterparties are also lenders under our revolving credit facility, and the payment obligations in connection with our hedge transactions are secured by a first priority lien on the collateral securing our revolving credit facility indebtedness that ranks equal in right of payment with liens granted in favor of our secured lenders. As long as this first priority lien is in effect, we will have no obligation to post cash, letters of credit, or other additional collateral to secure these hedges at any time even, if our counterparty's exposure to our credit increases over the term of the hedge as a result of higher commodity prices or because there has been a change in our creditworthiness. We have not executed any derivative transactions on the NYMEX as of December 31, 2012.
We generally seek, whenever possible, to enter into hedge transactions that meet the requirements for effective hedges as outlined in ASC 815,"Derivatives and Hedging."
Texas Segment. With the exception of condensate and a portion of our natural gasoline production, NGLs are hedged using the Mont Belvieu index, the same index used to price the underlying commodities. We generally do not hedge against potential declines in the price of natural gas for the Texas segment because our natural gas position is neutral to short due to our contractual arrangements.
Oklahoma Segment. Historically, we have used options priced on the CenterPoint East index to hedge natural gas in Oklahoma. Currently, the principal indices used to price the underlying commodity for our Oklahoma segment are the ONEOK Gas Transportation index and the CenterPoint East index. While this creates the potential for additional basis risk, statistical analysis reveals that the CenterPoint East index and the ONEOK Gas Transportation index historically have been highly correlated. With the exception of condensate, NGLs are contractually priced using the Conway index, but because there is an extremely limited forward market for Conway-based hedge instruments, we use the Mont Belvieu index for NGL hedges. This creates the potential for basis risk. Although these indices have been highly correlated historically, they have displayed greater variability beginning in 2009 and continuing throughout the first half of 2012. The basis differential tightened considerably in the second half of 2012, narrowing to an average differential of $3.12 per Bbl for the fourth quarter of 2012. At February 20, 2013, this basis differential was $1.53 per Bbl.
Rocky Mountains Segment. Because the profitability of our Rocky Mountains segment is only indirectly affected by the level of commodity prices, this segment has no outstanding transactions to hedge commodity price risk.
Commodity Hedges. As of December 31, 2012 and 2011, our commodity hedge portfolio totaled $18.1 million and $10.8 million in assets, respectively. For additional information, please read Note 9, "Financial Instruments," to our consolidated financial statements included in Item 8 of this report.
| | | | | | | |
| | Call | |
|---|
| | Strike
(Per MMBtu) | | Volumes
(MMBtu/d) | |
|---|
Houston Ship Channel Index Purchased Natural Gas Options | | | | | | | |
2013 | | $ | 3.4000 | | | 2,787 | |
100
Table of Contents
| | | | | | | | | | | | | |
| | Put | | Swap | |
|---|
| | Strike
(Per gallon) | | Volumes
(Bbls/d) | | Strike
(Per gallon) | | Volumes
(Bbls/d) | |
|---|
Mont Belvieu Purity Ethane | | | | | | | | | | | | | |
2013 | | $ | — | | | — | | $ | 0.3660 | | | 1,000 | |
Mont Belvieu TET Propane | | | | | | | | | | | | | |
2013 | | $ | 1.2400 | | | 600 | | $ | — | | | — | |
2013 | | $ | 1.2750 | | | 350 | | $ | — | | | — | |
2013 | | $ | 1.2200 | | | 300 | | $ | — | | | — | |
2013 | | $ | 1.2800 | | | 300 | | $ | — | | | — | |
2013 | | $ | 1.3300 | | | 250 | | $ | — | | | — | |
Mont Belvieu Non-TET Isobutane | | | | | | | | | | | | | |
2013 | | $ | 1.6000 | | | 200 | | $ | — | | | — | |
2013 | | $ | 1.6800 | | | 100 | | $ | — | | | — | |
2013 | | $ | 1.9000 | | | 50 | | $ | — | | | — | |
2014(3) | | $ | 1.6000 | | | 300 | | $ | — | | | — | |
Mont Belvieu Non-TET Normal Butane | | | | | | | | | | | | | |
2013 | | $ | 1.5800 | | | 300 | | $ | — | | | — | |
2013 | | $ | 1.6500 | | | 100 | | $ | — | | | — | |
2013 | | $ | 1.8000 | | | 100 | | $ | — | | | — | |
2014(3) | | $ | 1.5300 | | | 350 | | $ | — | | | — | |
WTI Crude Oil | | | | | | | | | | | | | |
2013 | | $ | 90.00 | | | 400 | | $ | — | | | — | |
2013 | | $ | 99.00 | | | 350 | | $ | — | | | — | |
2013 | | $ | 95.00 | | | 100 | | $ | — | | | — | |
2013(1) | | $ | 95.00 | | | 250 | | $ | — | | | — | |
2013 | | $ | 91.00 | | | 300 | | $ | — | | | — | |
2014 | | $ | 90.00 | | | 500 | | $ | — | | | — | |
2014(2) | | $ | 87.50 | | | 750 | | $ | — | | | — | |
2014(3) | | $ | 89.00 | | | 300 | | $ | — | | | — | |
- (1)
- Instrument not designated as a cash flow hedge under hedge accounting.
- (2)
- Instrument executed in January 2013.
- (3)
- Instrument executed in February 2013.
We are diligent in attempting to ensure that we provide credit only to credit-worthy customers. However, our purchases of natural gas and sales of the residue gas and NGLs expose us to significant credit risk, as our margin on any sale is generally a very small percentage of the total sale price. Therefore, a credit loss could be very large relative to our overall profitability. For the year ended December 31, 2012, Dow Hydrocarbon and Resources LLC, (17%), ONEOK Hydrocarbons, L.P. (12%), Formosa Hydrocarbons Company, Inc. (10%), Enterprise Products Operating, L.P. (8%) and ONEOK Energy Services, L.P. (8%) collectively accounted for approximately 55% of our revenue. As of December 31, 2012, all of these companies or their respective parent companies were rated investment grade by Moody's Investors Service and Standard & Poor's Ratings Services, except for Formosa Hydrocarbons Company. Formosa Hydrocarbons Company's parent, Formosa Plastics Corporation, U.S.A., is affiliated with the Taiwan-based Formosa Plastics Group, which is rated investment grade by Standard & Poor's Ratings Services. Companies
101
Table of Contents
accounting for another approximately 32% of our revenue have an investment grade parent, are themselves investment grade, have provided us with credit support in the form of a letter of credit issued by an investment grade financial institution or have provided prepayment for our services.
We also diligently review the creditworthiness of other counterparties to which we may have credit exposure, including hedge counterparties. Our risk management policy requires that we review and report the credit ratings of our hedging counterparties on a monthly basis. As of December 31, 2012, the value of our commodity net hedge positions by significant counterparty consisted of assets with JP Morgan (19.9%), Wells Fargo (15.8%), Goldman Sachs (11.4%), Barclays Bank PLC (11.1%), Morgan Stanley (10.4%) and Bank of America (10.3%). As of December 31, 2012, all of our counterparties were rated Baa1 and A- or better by Moody's Investors Service and Standard & Poor's Ratings Services, respectively. Our hedge counterparties have not posted collateral to secure their obligations to us.
We have historically experienced minimal collection issues with our counterparties; however, nonpayment or nonperformance by one or more significant counterparties could adversely impact our liquidity. Please read Item 1A., "Risk Factors."
Item 8. Financial Statements and Supplementary Data
The Report of Independent Registered Public Accounting Firm, Consolidated Financial Statements and supplementary financial data required for this Item beginning on page F-1 of this report and are incorporated herein by reference.
Item 9. Changes in and Disagreements with Accountants on Accounting and Financial Disclosure
None.
Item 9A. Controls and Procedures
As required by Rule 13a-15(b) of the Exchange Act, we have evaluated, under the direction of our Chief Executive Officer and Chief Financial Officer, the effectiveness of the design and operation of our disclosure controls and procedures (as defined in Rules 13a-15(e) and 15d-15(e) under the Exchange Act) as of the end of the period covered by this report. Our disclosure controls and procedures are designed to provide reasonable assurance that the information required to be disclosed by us in reports that we file under the Exchange Act is accumulated and communicated to our management, including our Chief Executive Officer and Chief Financial Officer, as appropriate, to allow timely decisions regarding required disclosure and is recorded, processed, summarized and reported within the time periods specified in the rules and forms of the SEC. Based upon their evaluation, our Chief Executive Officer and Chief Financial Officer have concluded that our disclosure controls and procedures were effective at December 31, 2012 at the reasonable assurance level.
Our management, including the Chief Executive Officer and the Chief Financial Officer, is responsible for establishing and maintaining adequate internal control over financial reporting, as such term is defined in Rules 13a-15(f) of the Exchange Act. Our management, with the participation of our Chief Executive Officer and Chief Financial Officer, has evaluated the effectiveness of internal control over financial reporting (as defined in Exchange Act Rules 13a-15(f)) as of the end of the period covered by this report. We based our evaluation on the framework established by the Committee of Sponsoring Organizations of the Treadway Commission in the publication entitled, "Internal Control — Integrated Framework" (the "COSO Framework").
102
Table of Contents
Based on our evaluation and the COSO Framework, we believe that, as of December 31, 2012, our internal control over financial reporting is effective to provide reasonable assurance regarding the reliability of financial reporting and the preparation of financial statements for external purposes in accordance with generally accepted accounting principles. Deloitte & Touche LLP, our independent registered public accounting firm, has issued a report on our internal control over financial reporting, which is included in "Report of Independent Registered Public Accounting Firm" below.
There has been no change in our internal controls over financial reporting (as defined in Rules 13a-15(f) and 15d-15(f) under the Exchange Act) that occurred during the three months ended December 31, 2012 that has materially affected or is reasonably likely to materially affect such internal controls over financial reporting.
103
Table of Contents
MANAGEMENT'S ANNUAL REPORT ON INTERNAL CONTROL
OVER FINANCIAL REPORTING
AS OF DECEMBER 31, 2012
The management of Copano Energy, L.L.C. and its consolidated subsidiaries, including the Chief Executive Officer and the Chief Financial Officer, is responsible for establishing and maintaining adequate internal control over financial reporting, as defined in Rules 13a-15(f) and 15d-15(f) of the Exchange Act. The Company's management, with the participation of the Company's Chief Executive Officer and Chief Financial Officer, has evaluated the effectiveness of internal control over financial reporting (as defined in Exchange Act Rules 13a-15(f) and 15d-15(f), as of the end of the period covered by this report. The Company based its evaluation on the framework established by the Committee of Sponsoring Organizations of the Treadway Commission in the publication entitled, "Internal Control — Integrated Framework" (the "COSO Framework"). Our assessment of internal controls over financial reporting included design effectiveness and operating effectiveness of internal control over financial reporting, as well as the safeguarding of our assets.
Our internal control system was designed to provide reasonable assurance to our management and Board of Directors regarding the preparation and fair presentation of published financial statements in accordance with generally accepted accounting principles. All internal control systems, no matter how well designed, have inherent limitations. Therefore, even those systems determined to be effective can provide only reasonable assurance with respect to financial statement preparation and presentation. A system of internal control may become inadequate over time because of changes in conditions or deterioration in the degree of compliance with the policies or procedures. Therefore, even those systems determined to be effective can provide only reasonable assurance with respect to financial statement preparation and presentation.
Based on our assessment, we believe that, as of December 31, 2012, our internal control over financial reporting is effective to provide reasonable assurance regarding the reliability of financial reporting and the preparation of financial statements for external purposes in accordance with generally accepted accounting principles based on the criteria of the COSO Framework.
Deloitte and Touche LLP, the independent registered public accounting firm that audited the consolidated financial statements of the Company included in this annual report on Form 10-K, has issued an attestation report on the effectiveness of the Company's internal control over financial reporting as of December 31, 2012. The report, which expresses an unqualified opinion on the effectiveness of the Company's internal control over financial reporting as of December 31, 2012, is included in this Item under the heading "Report of Independent Registered Public Accounting Firm."
Pursuant to the requirements of Rules 13a-15(f) and 15d-15(f) of the Exchange Act, as amended, this Annual Report on Internal Control Over Financial Reporting has been signed below by the following persons on behalf of the registrant and in the capacities indicated below on March 1, 2013.
| | |
/s/ R. BRUCE NORTHCUTT
R. Bruce Northcutt
President and Chief Executive Officer | | /s/ CARL A. LUNA
Carl A. Luna
Senior Vice President and Chief Financial Officer |
104
Table of Contents
REPORT OF INDEPENDENT REGISTERED PUBLIC ACCOUNTING FIRM
To the Board of Directors and Unitholders of Copano Energy, L.L.C. and Subsidiaries:
Houston, Texas
We have audited the internal control over financial reporting of Copano Energy, L.L.C. and subsidiaries (the "Company") as of December 31, 2012, based on criteria established inInternal Control — Integrated Framework issued by the Committee of Sponsoring Organizations of the Treadway Commission. The Company's management is responsible for maintaining effective internal control over financial reporting and for its assessment of the effectiveness of internal control over financial reporting, included in the accompanying Management's Annual Report on Internal Control Over Financial Reporting. Our responsibility is to express an opinion on the Company's internal control over financial reporting based on our audit.
We conducted our audit in accordance with the standards of the Public Company Accounting Oversight Board (United States). Those standards require that we plan and perform the audit to obtain reasonable assurance about whether effective internal control over financial reporting was maintained in all material respects. Our audit included obtaining an understanding of internal control over financial reporting, assessing the risk that a material weakness exists, testing and evaluating the design and operating effectiveness of internal control based on the assessed risk, and performing such other procedures as we considered necessary in the circumstances. We believe that our audit provides a reasonable basis for our opinion.
A company's internal control over financial reporting is a process designed by, or under the supervision of, the company's principal executive and principal financial officers, or persons performing similar functions, and effected by the company's board of directors, management, and other personnel to provide reasonable assurance regarding the reliability of financial reporting and the preparation of financial statements for external purposes in accordance with generally accepted accounting principles. A company's internal control over financial reporting includes those policies and procedures that (1) pertain to the maintenance of records that, in reasonable detail, accurately and fairly reflect the transactions and dispositions of the assets of the company; (2) provide reasonable assurance that transactions are recorded as necessary to permit preparation of financial statements in accordance with generally accepted accounting principles, and that receipts and expenditures of the company are being made only in accordance with authorizations of management and directors of the company; and (3) provide reasonable assurance regarding prevention or timely detection of unauthorized acquisition, use, or disposition of the company's assets that could have a material effect on the financial statements.
Because of the inherent limitations of internal control over financial reporting, including the possibility of collusion or improper management override of controls, material misstatements due to error or fraud may not be prevented or detected on a timely basis. Also, projections of any evaluation of the effectiveness of the internal control over financial reporting to future periods are subject to the risk that the controls may become inadequate because of changes in conditions, or that the degree of compliance with the policies or procedures may deteriorate.
In our opinion, the Company maintained, in all material respects, effective internal control over financial reporting as of December 31, 2012, based on the criteria established inInternal Control — Integrated Framework issued by the Committee of Sponsoring Organizations of the Treadway Commission.
We have also audited, in accordance with the standards of the Public Company Accounting Oversight Board (United States), the consolidated financial statements as of and for the year ended December 31, 2012 of the Company and our report dated March 1, 2013 expressed an unqualified opinion on those financial statements.
| | |
/s/Deloitte & Touche LLP
Houston, Texas
March 1, 2013
| | |
105
Table of Contents
PART III
Item 9B. Other Information
None.
Item 10. Directors, Executive Officers and Corporate Governance
The information required by Item 10 is incorporated herein by reference to the applicable information in our Proxy Statement for our 2013 Annual Meeting of Unitholders set forth under the caption "Proposal One — Election of Directors," "The Board of Directors and its Committees" and "Executive Officers," or, in the event we do not prepare and file such proxy statement, such information shall be filed as an amendment to this Form 10-K no later than April 30, 2013.
Item 11. Executive Compensation
The information required by Item 11 is incorporated herein by reference to the applicable information in our Proxy Statement for our 2013 Annual Meeting of Unitholders set forth under the captions "The Board of Directors and its Committees — Director Compensation," "The Board of Directors and its Committees — Compensation Committee Interlocks and Insider Participation," "Compensation Disclosure and Analysis," "Executive Compensation," "Report of the Compensation Committee" and "Section 16(a) Beneficial Ownership Reporting Compliance," or, in the event we do not prepare and file such proxy statement, such information shall be filed as an amendment to this Form 10-K no later than April 30, 2013.
Item 12. Security Ownership of Certain Beneficial Owners and Management and Related Unitholder Matters
The information required by Item 12, including information concerning securities authorized for issuance under our equity compensation plan for directors and employees, is incorporated herein by reference to our Proxy Statement for our 2013 Annual Meeting of Unitholders set forth under the captions "Securities Authorized for Issuance under Equity Compensation Plans," "Security Ownership of Certain Beneficial Owners and Management" and "Executive Compensation."
Item 13. Certain Relationships and Related Transactions, and Director Independence
The information required by Item 13 is incorporated herein by reference to the applicable information in our Proxy Statement for our 2013 Annual Meeting of Unitholders set forth under the caption "Certain Relationships and Related Transactions, and Director Independence," or, in the event we do not prepare and file such proxy statement, such information shall be filed as an amendment to this Form 10-K no later than April 30, 2013.
Item 14. Principal Accounting Fees and Services
The information required by Item 14 is incorporated herein by reference to the applicable information in our Proxy Statement for our 2013 Annual Meeting of Unitholders set forth under the caption "Proposal Two — Ratification of Independent Registered Public Accounting Firm," or, in the event we do not prepare and file such proxy statement, such information shall be filed as an amendment to this Form 10-K no later than April 30, 2013.
106
Table of Contents
PART IV
Item 15. Exhibits and Financial Statement Schedules
(a)(1) and (2) Financial Statements
The consolidated financial statements of Copano Energy, L.L.C. are listed on the Index to Financial Statements to this report beginning on page F-1 and are incorporated by reference into Item 8. "Financial Statements and Supplementary Data."
(a)(3) Exhibits
The exhibits filed as a part of this report or incorporated by reference are listed in the exhibit index and incorporated by reference herein.
107
Table of Contents
SIGNATURES
Pursuant to the requirements of Section 13 or 15(d) of the Exchange Act, the Registrant has duly caused this Annual Report to be signed on its behalf by the undersigned, thereunto duly authorized, in the City of Houston, State of Texas, on the 1st day of March 2013.
| | | | |
| | | Copano Energy, L.L.C. |
|
|
By: |
|
/s/ R. BRUCE NORTHCUTT
R. Bruce Northcutt
President and Chief Executive Officer
(Principal Executive Officer) |
|
|
By: |
|
/s/ CARL A. LUNA
Carl A. Luna
Senior Vice President and Chief Financial Officer (Principal Financial Officer) |
Pursuant to the requirements of the Exchange Act, this Annual Report has been signed below on the dates indicated by the following persons on behalf of the Registrant and in the capacities indicated.
| | | | |
Signature | | Title | | Date |
|---|
|
|
|
|
|
/s/ R. BRUCE NORTHCUTT
R. Bruce Northcutt | | President and Chief Executive Officer
and Director (Principal Executive
Officer) | | March 1, 2013 |
/s/ CARL A. LUNA
Carl A. Luna |
|
Senior Vice President and Chief
Financial Officer (Principal Financial
Officer) |
|
March 1, 2013 |
/s/ LARI PARADEE
Lari Paradee |
|
Senior Vice President, Controller and Principal Accounting Officer (Principal Accounting Officer) |
|
March 1, 2013 |
/s/ WILLIAM L. THACKER
William L. Thacker |
|
Chairman of the Board of Directors |
|
March 1, 2013 |
/s/ JAMES G. CRUMP
James G. Crump |
|
Director |
|
March 1, 2013 |
108
Table of Contents
| | | | |
Signature | | Title | | Date |
|---|
|
|
|
|
|
/s/ ERNIE L. DANNER
Ernie L. Danner | | Director | | March 1, 2013 |
/s/ SCOTT A. GRIFFITHS
Scott A. Griffiths |
|
Director |
|
March 1, 2013 |
/s/ MICHAEL L. JOHNSON
Michael L. Johnson |
|
Director |
|
March 1, 2013 |
/s/ MICHAEL G. MACDOUGALL
Michael G. MacDougall |
|
Director |
|
March 1, 2013 |
/s/ T. WILLIAM PORTER
T. William Porter |
|
Director |
|
March 1, 2013 |
109
Table of Contents
COPANO ENERGY, L.L.C.
INDEX TO FINANCIAL STATEMENTS
| | |
| | Page |
|---|
Copano Energy, L.L.C. and Subsidiaries Consolidated Financial Statements: | | |
Report of Independent Registered Public Accounting Firm | | F-2 |
Consolidated Balance Sheets as of December 31, 2012 and 2011 | | F-3 |
Consolidated Statements of Operations for the years ended December 31, 2012, 2011 and 2010 | | F-4 |
Consolidated Statements of Consolidated Statements of Comprehensive Loss for the years ended December 31, 2012, 2011 and 2010 | | F-5 |
Consolidated Statements of Cash Flows for the years ended December 31, 2012, 2011 and 2010 | | F-6 |
Consolidated Statements of Members' Capital for the years ended December 31, 2012, 2011 and 2010 | | F-7 |
Notes to Consolidated Financial Statements | | F-8 |
Eagle Ford Gathering LLC Consolidated Financial Statements: | | |
Independent Auditors' Report | | F-61 |
Consolidated Balance Sheets as of December 31, 2012 and 2011 | | F-62 |
Consolidated Consolidated Statements of Operations for the years ended December 31, 2012 and 2011 and for the period from May 12, 2010 (date of inception) through December 31, 2010 | | F-63 |
Consolidated Statements of Cash Flows for the years ended December 31, 2012 and 2011 and for the period from May 12, 2010 (date of inception) through December 31, 2010 | | F-64 |
Consolidated Statements of Members' Equity for the years ended December 31, 2012 and 2011 and for the period from May 12, 2010 (date of inception) through December 31, 2010 | | F-65 |
Notes to Consolidated Financial Statements | | F-66 |
Bighorn Gas Gathering, L.L.C. Financial Statements: | | |
Independent Auditors' Report | | F-72 |
Balance Sheets as of December 31, 2012 and 2011 | | F-73 |
Statements of Operations for the years ended December 31, 2012, 2011 and 2010 | | F-74 |
Statements of Cash Flows for the years ended December 31, 2012, 2011 and 2010 | | F-75 |
Statements of Members' Equity for the years ended December 31, 2012, 2011 and 2010 | | F-76 |
Notes to Financial Statements | | F-77 |
F-1
Table of Contents
REPORT OF INDEPENDENT REGISTERED PUBLIC ACCOUNTING FIRM
To the Board of Directors and Unitholders of Copano Energy, L.L.C. and Subsidiaries:
Houston, Texas
We have audited the accompanying consolidated balance sheets of Copano Energy, L.L.C. and subsidiaries (the "Company") as of December 31, 2012 and 2011, and the related consolidated statements of operations, members' capital and comprehensive loss, and cash flows for each of the three years in the period ended December 31, 2012. These financial statements are the responsibility of the Company's management. Our responsibility is to express an opinion on these financial statements based on our audits.
We conducted our audits in accordance with the standards of the Public Company Accounting Oversight Board (United States). Those standards require that we plan and perform the audit to obtain reasonable assurance about whether the financial statements are free of material misstatement. An audit includes examining, on a test basis, evidence supporting the amounts and disclosures in the financial statements. An audit also includes assessing the accounting principles used and significant estimates made by management, as well as evaluating the overall financial statement presentation. We believe that our audits provide a reasonable basis for our opinion.
In our opinion, such consolidated financial statements present fairly, in all material respects, the financial position of Copano Energy, L.L.C. and subsidiaries at December 31, 2012 and 2011, and the results of their operations and their cash flows for each of the three years in the period ended December 31, 2012, in conformity with accounting principles generally accepted in the United States of America.
We have also audited, in accordance with the standards of the Public Company Accounting Oversight Board (United States), the Company's internal control over financial reporting as of December 31, 2012, based on the criteria established inInternal Control — Integrated Framework issued by the Committee of Sponsoring Organizations of the Treadway Commission and our report dated March 1, 2013 expressed an unqualified opinion on the Company's internal control over financial reporting.
| | |
/s/ Deloitte & Touche LLP
Houston, Texas
March 1, 2013 | | |
F-2
Table of Contents
COPANO ENERGY, L.L.C. AND SUBSIDIARIES
CONSOLIDATED BALANCE SHEETS
| | | | | | | |
| | December 31, | |
|---|
| | 2012 | | 2011 | |
|---|
| | (In thousands, except unit
information)
| |
|---|
ASSETS | | | | | | | |
Current assets: | | | | | | | |
Cash and cash equivalents | | $ | 54,918 | | $ | 56,962 | |
Accounts receivable, net(1) | | | 126,909 | | | 119,193 | |
Risk management assets | | | 16,183 | | | 4,322 | |
Prepayments and other current assets | | | 5,555 | | | 5,114 | |
| | | | | | |
Total current assets | | | 203,565 | | | 185,591 | |
| | | | | | |
Property, plant and equipment, net | | | 1,372,509 | | | 1,103,699 | |
Intangible assets, net | | | 162,071 | | | 192,425 | |
Investments in unconsolidated affiliates | | | 431,447 | | | 544,687 | |
Escrow cash | | | 1,848 | | | 1,848 | |
Risk management assets | | | 1,881 | | | 6,452 | |
Other assets, net | | | 26,843 | | | 29,895 | |
| | | | | | |
Total assets | | $ | 2,200,164 | | $ | 2,064,597 | |
| | | | | | |
LIABILITIES AND MEMBERS' CAPITAL | | | | | | | |
Current liabilities: | | | | | | | |
Accounts payable(1) | | $ | 162,147 | | $ | 155,921 | |
Accrued capital expenditures | | | 11,306 | | | 7,033 | |
Accrued interest | | | 11,089 | | | 8,686 | |
Accrued tax liability | | | 1,551 | | | 1,182 | |
Risk management liabilities | | | — | | | 3,565 | |
Other current liabilities | | | 20,034 | | | 15,007 | |
| | | | | | |
Total current liabilities | | | 206,127 | | | 191,394 | |
| | | | | | |
Long term debt (includes $3,124 and $0 bond premium as of December 31, 2012 and 2011, respectively) | | | 1,001,649 | | | 994,525 | |
Deferred tax liability | | | 2,494 | | | 2,199 | |
Risk management and other noncurrent liabilities | | | 9,618 | | | 4,581 | |
Commitments and contingencies (Note 11) | | | | | | | |
Members' capital: | | | | | | | |
Series A convertible preferred units, no par value, 12,897,029 units and 11,684,074 units issued and outstanding as of December 31, 2012 and 2011, respectively | | | 285,168 | | | 285,168 | |
Common units, no par value, 78,966,408 units and 66,341,458 units issued and outstanding as of December 31, 2012 and 2011, respectively | | | 1,555,468 | | | 1,164,853 | |
Paid in capital | | | 72,916 | | | 62,277 | |
Accumulated deficit | | | (935,482 | ) | | (624,121 | ) |
Accumulated other comprehensive income (loss) | | | 2,206 | | | (16,279 | ) |
| | | | | | |
| | | 980,276 | | | 871,898 | |
| | | | | | |
Total liabilities and members' capital | | $ | 2,200,164 | | $ | 2,064,597 | |
| | | | | | |
- (1)
- Inclusive of related party transactions discussed in Note 7.
The accompanying notes are an integral part of these consolidated financial statements.
F-3
Table of Contents
COPANO ENERGY, L.L.C. AND SUBSIDIARIES
CONSOLIDATED STATEMENTS OF OPERATIONS
| | | | | | | | | | |
| | Year Ended December 31, | |
|---|
| | 2012 | | 2011 | | 2010 | |
|---|
| | (In thousands,
except per unit information)
| |
|---|
Revenue: | | | | | | | | | | |
Natural gas sales(1) | | $ | 360,340 | | $ | 452,726 | | $ | 381,453 | |
Natural gas liquids sales | | | 814,916 | | | 723,063 | | | 490,980 | |
Transportation, compression and processing fees(1)(2) | | | 192,270 | | | 121,631 | | | 68,398 | |
Condensate and other(1) | | | 50,194 | | | 47,803 | | | 54,333 | |
| | | | | | | | |
Total revenue | | | 1,417,720 | | | 1,345,223 | | | 995,164 | |
| | | | | | | | |
Costs and expenses: | | | | | | | | | | |
Cost of natural gas and natural gas liquids(1)(2)(3) | | | 1,105,415 | | | 1,068,423 | | | 745,074 | |
Transportation(1)(2)(3) | | | 25,199 | | | 24,225 | | | 22,701 | |
Operations and maintenance | | | 77,943 | | | 65,326 | | | 53,487 | |
Depreciation and amortization | | | 77,104 | | | 69,156 | | | 62,572 | |
Impairment | | | 29,486 | | | 8,409 | | | — | |
General and administrative | | | 50,648 | | | 48,680 | | | 40,347 | |
Taxes other than income | | | 7,392 | | | 5,130 | | | 4,726 | |
Equity in loss from unconsolidated affiliates | | | 137,088 | | | 145,324 | | | 20,480 | |
Gain on sale of operating assets | | | (9,941 | ) | | — | | | — | |
| | | | | | | | |
Total costs and expenses | | | 1,500,334 | | | 1,434,673 | | | 949,387 | |
| | | | | | | | |
Operating (loss) income | | | (82,614 | ) | | (89,450 | ) | | 45,777 | |
Other income (expense): | | | | | | | | | | |
Interest and other income | | | 586 | | | 60 | | | 78 | |
Loss on refinancing of unsecured debt | | | — | | | (18,233 | ) | | — | |
Interest and other financing costs | | | (55,264 | ) | | (47,187 | ) | | (53,605 | ) |
| | | | | | | | |
Loss before income taxes | | | (137,292 | ) | | (154,810 | ) | | (7,750 | ) |
Provision for income taxes | | | (1,678 | ) | | (1,502 | ) | | (931 | ) |
| | | | | | | | |
Net loss | | | (138,970 | ) | | (156,312 | ) | | (8,681 | ) |
Preferred unit distributions | | | (36,117 | ) | | (32,721 | ) | | (15,188 | ) |
| | | | | | | | |
Net loss to common units | | $ | (175,087 | ) | $ | (189,033 | ) | $ | (23,869 | ) |
| | | | | | | | |
Basic and diluted net loss per common unit | | $ | (2.39 | ) | $ | (2.86 | ) | $ | (0.37 | ) |
| | | | | | | | |
Weighted average number of common units — basic and diluted | | | 73,225 | | | 66,169 | | | 63,854 | |
| | | | | | | | |
Distributions declared per common unit | | $ | 2.30 | | $ | 2.30 | | $ | 2.30 | |
| | | | | | | | |
- (1)
- Inclusive of related party transactions discussed in Note 7.
- (2)
- Inclusive of the following affiliate transactions discussed in Note 7:
| | | | | | | | | | | |
| | Transportation, compression and processing fees | | | $ 17,874 | | | $ 2,091 | | | $ 11 | |
| | Cost of natural gas and natural gas liquids | | | $171,138 | | | $19,290 | | | $ 518 | |
| | Transportation | | | $ 9,514 | | | $ 6,846 | | | $5,478 | |
- (3)
- Exclusive of operations and maintenance and depreciation, amortization and impairment shown separately below.
The accompanying notes are an integral part of these consolidated financial statements.
F-4
Table of Contents
COPANO ENERGY, L.L.C. AND SUBSIDIARIES
CONSOLIDATED STATEMENTS OF COMPREHENSIVE LOSS
| | | | | | | | | | |
| | Year Ended December 31, | |
|---|
| | 2012 | | 2011 | | 2010 | |
|---|
| | (In thousands)
| |
|---|
Net loss | | $ | (138,970 | ) | $ | (156,312 | ) | $ | (8,681 | ) |
Other comprehensive income (loss): | | | | | | | | | | |
Derivative settlements reclassified to earnings | | | 7,539 | | | 36,605 | | | (2,671 | ) |
Unrealized income (loss) — change in fair value of derivatives | | | 10,946 | | | (22,528 | ) | | (11,502 | ) |
| | | | | | | | |
Total other comprehensive income (loss) | | | 18,485 | | | 14,077 | | | (14,173 | ) |
| | | | | | | | |
Comprehensive loss | | $ | (120,485 | ) | $ | (142,235 | ) | $ | (22,854 | ) |
| | | | | | | | |
The accompanying notes are an integral part of these consolidated financial statements.
F-5
Table of Contents
COPANO ENERGY, L.L.C. AND SUBSIDIARIES
CONSOLIDATED STATEMENTS OF CASH FLOWS
| | | | | | | | | | |
| | Year Ended December 31, | |
|---|
| | 2012 | | 2011 | | 2010 | |
|---|
| | (In thousands)
| |
|---|
Cash Flows From Operating Activities: | | | | | | | | | | |
Net loss | | $ | (138,970 | ) | $ | (156,312 | ) | $ | (8,681 | ) |
Adjustments to reconcile net loss to net cash provided by operating activities: | | | | | | | | | | |
Depreciation and amortization | | | 77,104 | | | 69,156 | | | 62,572 | |
Impairment | | | 29,486 | | | 8,409 | | | — | |
Amortization of debt issue costs | | | 3,999 | | | 3,764 | | | 3,755 | |
Equity in loss from unconsolidated affiliates | | | 137,088 | | | 145,324 | | | 20,480 | |
Distributions from unconsolidated affiliates | | | 43,031 | | | 31,623 | | | 22,416 | |
Gain on sale of operating assets | | | (9,941 | ) | | — | | | — | |
Loss on refinancing of unsecured debt | | | — | | | 18,233 | | | — | |
Non-cash gain on risk management activities, net | | | (2,996 | ) | | (3,523 | ) | | (984 | ) |
Equity-based compensation | | | 8,195 | | | 11,558 | | | 9,311 | |
Deferred tax provision | | | 295 | | | 317 | | | 21 | |
Other non-cash items, net | | | 4,870 | | | 162 | | | (504 | ) |
Changes in assets and liabilities: | | | | | | | | | | |
Accounts receivable | | | (6,725 | ) | | (19,475 | ) | | (4,780 | ) |
Prepayments and other current assets | | | (441 | ) | | 245 | | | (242 | ) |
Risk management activities | | | 10,627 | | | 18,343 | | | 13,345 | |
Accounts payable | | | (6,999 | ) | | 29,812 | | | 6,626 | |
Other current liabilities | | | 202 | | | (6,404 | ) | | 263 | |
| | | | | | | | |
Net cash provided by operating activities | | | 148,825 | | | 151,232 | | | 123,598 | |
| | | | | | | | |
Cash Flows From Investing Activities: | | | | | | | | | | |
Additions to property, plant and equipment | | | (322,251 | ) | | (218,929 | ) | | (117,875 | ) |
Additions to intangible assets | | | (10,389 | ) | | (20,698 | ) | | (9,828 | ) |
Acquisitions | | | — | | | (16,084 | ) | | — | |
Investments in unconsolidated affiliates | | | (72,313 | ) | | (121,967 | ) | | (33,002 | ) |
Distributions from unconsolidated affiliates | | | 4,443 | | | 3,848 | | | 3,539 | |
Escrow cash | | | — | | | 8 | | | 2 | |
Proceeds from sale of assets | | | 24,124 | | | 260 | | | 447 | |
Other, net | | | 2,492 | | | (2,752 | ) | | (13 | ) |
| | | | | | | | |
Net cash used in investing activities | | | (373,894 | ) | | (376,314 | ) | | (156,730 | ) |
| | | | | | | | |
Cash Flows From Financing Activities: | | | | | | | | | | |
Proceeds from long-term debt | | | 530,375 | | | 825,000 | | | 100,000 | |
Repayment of long-term debt | | | (523,000 | ) | | (422,665 | ) | | (360,000 | ) |
Payments of premiums and expenses on redemption of unsecured debt | | | — | | | (14,572 | ) | | — | |
Deferred financing costs | | | (3,540 | ) | | (15,783 | ) | | (995 | ) |
Distributions to unitholders | | | (171,586 | ) | | (153,062 | ) | | (145,531 | ) |
Proceeds from issuance of Series A convertible preferred units, net of underwriting discounts and commissions of $8,935 | | | — | | | — | | | 291,065 | |
Proceeds from public offering of common units, net of underwriting discounts and commissions of $15,421 and $7,223 for the years ended December 31, 2012 and 2010, respectively | | | 405,355 | | | — | | | 164,786 | |
Equity offering costs | | | (15,910 | ) | | (5 | ) | | (6,395 | ) |
Proceeds from option exercises | | | 1,331 | | | 3,201 | | | 5,440 | |
| | | | | | | | |
Net cash provided by financing activities | | | 223,025 | | | 222,114 | | | 48,370 | |
| | | | | | | | |
Net (decrease) increase in cash and cash equivalents | | | (2,044 | ) | | (2,968 | ) | | 15,238 | |
Cash and cash equivalents, beginning of year | | | 56,962 | | | 59,930 | | | 44,692 | |
| | | | | | | | |
Cash and cash equivalents, end of year | | $ | 54,918 | | $ | 56,962 | | $ | 59,930 | |
| | | | | | | | |
The accompanying notes are an integral part of these consolidated financial statements.
F-6
Table of Contents
COPANO ENERGY, L.L.C. AND SUBSIDIARIES
CONSOLIDATED STATEMENTS OF MEMBERS' CAPITAL
| | | | | | | | | | | | | | | | | | | | | | | | | | | | | | | |
| | Series A Preferred | | Common | | Class D | |
| |
| |
| |
| |
|---|
| |
| |
| | Accumulated
Other
Comprehensive
(Loss) Income | |
| |
|---|
| | Number
of Units | | Preferred
Units | | Number
of Units | | Common
Units | | Number
of Units | | Class D
Units | | Paid-in
Capital | | Accumulated
Deficit | | Total | |
|---|
| | (In thousands)
| |
|---|
Balance, December 31, 2009 | | | — | | $ | — | | | 54,670 | | $ | 879,504 | | | 3,246 | | $ | 112,454 | | $ | 42,518 | | $ | (158,267 | ) | $ | (16,183 | ) | $ | 860,026 | |
Conversion of Class D Units into common units | | | — | | | — | | | 3,246 | | | 112,454 | | | (3,246 | ) | | (112,454 | ) | | — | | | — | | | — | | | — | |
Issuance of preferred units (paid-in-kind) | | | 258 | | | 7,500 | | | — | | | — | | | — | | | — | | | — | | | — | | | — | | | 7,500 | |
Accrued in-kind units | | | — | | | 7,688 | | | — | | | — | | | — | | | — | | | — | | | — | | | — | | | 7,688 | |
In-kind distributions | | | — | | | (15,188 | ) | | — | | | — | | | — | | | — | | | — | | | — | | | — | | | (15,188 | ) |
Cash distributions to common unitholders | | | — | | | — | | | — | | | — | | | — | | | — | | | — | | | (146,506 | ) | | — | | | (146,506 | ) |
Issuance of units | | | 10,327 | | | 300,000 | | | 7,446 | | | 172,008 | | | — | | | — | | | — | | | — | | | — | | | 472,008 | |
Equity offering costs | | | — | | | (14,828 | ) | | — | | | (7,754 | ) | | — | | | — | | | — | | | — | | | — | | | (22,582 | ) |
Equity-based compensation | | | — | | | — | | | 553 | | | 5,440 | | | — | | | — | | | 9,225 | | | — | | | — | | | 14,665 | |
Net income | | | — | | | — | | | — | | | — | | | — | | | — | | | — | | | (8,681 | ) | | — | | | (8,681 | ) |
Derivative settlements reclassified to income | | | — | | | — | | | — | | | — | | | — | | | — | | | — | | | — | | | (2,671 | ) | | (2,671 | ) |
Unrealized loss-change in fair value of derivatives | | | — | | | — | | | — | | | — | | | — | | | — | | | — | | | — | | | (11,502 | ) | | (11,502 | ) |
| | | | | | | | | | | | | | | | | | | | | | |
Balance, December 31, 2010 | | | 10,585 | | | 285,172 | | | 65,915 | | | 1,161,652 | | | — | | | — | | | 51,743 | | | (313,454 | ) | | (30,356 | ) | | 1,154,757 | |
Issuance of preferred units (paid-in-kind) | | | 1,099 | | | 31,922 | | | — | | | — | | | — | | | — | | | — | | | — | | | — | | | 31,922 | |
Accrued in-kind units | | | — | | | 799 | | | — | | | — | | | — | | | — | | | — | | | — | | | — | | | 799 | |
In-kind distributions | | | — | | | (32,721 | ) | | — | | | — | | | — | | | — | | | — | | | — | | | — | | | (32,721 | ) |
Cash distributions to common unitholders | | | — | | | — | | | — | | | — | | | — | | | — | | | — | | | (154,355 | ) | | — | | | (154,355 | ) |
Equity offering costs | | | — | | | (4 | ) | | — | | | — | | | — | | | — | | | — | | | — | | | — | | | (4 | ) |
Equity-based compensation | | | — | | | — | | | 426 | | | 3,201 | | | — | | | — | | | 10,534 | | | — | | | — | | | 13,735 | |
Net income | | | — | | | — | | | — | | | — | | | — | | | — | | | — | | | (156,312 | ) | | — | | | (156,312 | ) |
Derivative settlements reclassified to income | | | — | | | — | | | — | | | — | | | — | | | — | | | — | | | — | | | 36,605 | | | 36,605 | |
Unrealized loss-change in fair value of derivatives | | | — | | | — | | | — | | | — | | | — | | | — | | | — | | | — | | | (22,528 | ) | | (22,528 | ) |
| | | | | | | | | | | | | | | | | | | | | | |
Balance, December 31, 2011 | | | 11,684 | | | 285,168 | | | 66,341 | | | 1,164,853 | | | — | | | — | | | 62,277 | | | (624,121 | ) | | (16,279 | ) | | 871,898 | |
Issuance of preferred units (paid-in-kind) | | | 1,213 | | | 35,236 | | | — | | | — | | | — | | | — | | | — | | | — | | | — | | | 35,236 | |
Accrued in-kind units | | | — | | | 881 | | | — | | | — | | | — | | | — | | | — | | | — | | | — | | | 881 | |
In-kind distributions | | | — | | | (36,117 | ) | | — | | | — | | | — | | | — | | | — | | | — | | | — | | | (36,117 | ) |
Cash distributions to common unitholders | | | — | | | — | | | — | | | — | | | — | | | — | | | — | | | (172,391 | ) | | — | | | (172,391 | ) |
Issuance of common units | | | — | | | — | | | 12,276 | | | 405,355 | | | — | | | — | | | — | | | — | | | — | | | 405,355 | |
Equity offering costs | | | — | | | — | | | — | | | (16,071 | ) | | — | | | — | | | — | | | — | | | — | | | (16,071 | ) |
Equity-based compensation | | | — | | | — | | | 349 | | | 1,331 | | | — | | | — | | | 10,639 | | | — | | | — | | | 11,970 | |
Net loss | | | — | | | — | | | — | | | — | | | — | | | — | | | — | | | (138,970 | ) | | — | | | (138,970 | ) |
Derivative settlements reclassified to income | | | — | | | — | | | — | | | — | | | — | | | — | | | — | | | — | | | 7,539 | | | 7,539 | |
Unrealized gain-change in fair value of derivatives | | | — | | | — | | | — | | | — | | | — | | | — | | | — | | | — | | | 10,946 | | | 10,946 | |
| | | | | | | | | | | | | | | | | | | | | | |
Balance, December 31, 2012 | | | 12,897 | | $ | 285,168 | | | 78,966 | | $ | 1,555,468 | | | — | | $ | — | | $ | 72,916 | | $ | (935,482 | ) | $ | 2,206 | | $ | 980,276 | |
| | | | | | | | | | | | | | | | | | | | | | |
The accompanying notes are an integral part of these consolidated financial statements.
F-7
Table of Contents
COPANO ENERGY, L.L.C. AND SUBSIDIARIES
NOTES TO CONSOLIDATED FINANCIAL STATEMENTS
Note 1 — Organization
Copano Energy, L.L.C., a Delaware limited liability company, was formed in August 2001 to acquire entities owning businesses operating under the Copano name since 1992 and to serve as a holding company for our operating subsidiaries. We, through our subsidiaries and equity investments, provide midstream services to natural gas producers, including natural gas gathering, compression, dehydration, treating, marketing, transportation, processing and fractionation services. Our assets are located in Texas, Oklahoma and Wyoming.Unless otherwise indicated or the context requires otherwise, references to "Copano," "we," "our," "us" or like terms refer to Copano Energy, L.L.C. and its consolidated subsidiaries.
Our natural gas pipelines collect natural gas from wellheads or designated points near producing wells. We treat and process natural gas as needed to remove contaminants and to extract mixed natural gas liquids, or NGLs, and we deliver the resulting residue gas to third-party pipelines, local distribution companies, power generation facilities and industrial consumers. We sell extracted NGLs to petrochemical companies or other midstream companies as a mixture or as fractionated purity products and deliver them through our plant interconnects, trucking facilities and NGL pipelines. We process natural gas from our own gathering systems and from third-party pipelines, and in some cases we deliver natural gas and mixed NGLs to third parties who provide us with transportation, processing or fractionation services. We also provide natural gas transportation services in limited circumstances. We refer to our operations (i) conducted through our subsidiaries operating in Texas collectively as our "Texas" segment, (ii) conducted through our subsidiaries operating in Oklahoma collectively as our "Oklahoma" segment and (iii) conducted through our subsidiaries operating in Wyoming collectively as our "Rocky Mountains" segment. Through August 2012, the Texas segment included operations and results of our Lake Charles plant located in southwest Louisiana.
Note 2 — Summary of Significant Accounting Policies
The accompanying consolidated financial statements and related notes include our assets, liabilities and results of operations for each of the periods presented. All intercompany accounts and transactions are eliminated in our consolidated financial statements. As of December 31, 2011, we changed our presentation for other current liabilities on our consolidated balance sheet to present separately accrued capital expenditures.
Our management believes that the disclosures in these audited consolidated financial statements are adequate to make the information presented not misleading. In the preparation of these financial statements, we evaluated subsequent events through the issuance date of the financial statements.
Although we are the managing partner or member in each of our equity investments and own a majority interest in some of our equity investments, we account for our investments in unconsolidated affiliates using the equity method of accounting. Equity in earnings (loss) from our unconsolidated affiliates is included in income from operations as the operations of each of our unconsolidated affiliates are integral to our operations. We serve each of our equity method investments as operator, managing member or both, but we do not control any of them. Our ability to make certain substantive business decisions with respect to each is subject to the majority or unanimous approval of the owners or management committee. See Note 4.
F-8
Table of Contents
Note 2 — Summary of Significant Accounting Policies (Continued)
In preparing the financial statements in conformity with accounting policies generally accepted in the United States of America ("GAAP"), management must make estimates and assumptions that affect the reported amounts of assets, liabilities, revenues and expenses and disclosure of contingent assets and liabilities that exist at the date of the financial statements. Although our management believes the estimates are appropriate, actual results can differ materially from those estimates.
Cash and cash equivalents include all highly liquid cash investments with original maturities of three months or less when purchased.
Financial instruments that potentially subject us to concentrations of credit risk consist principally of cash and cash equivalents, accounts receivable and risk management assets and liabilities.
We place our cash and cash equivalents with large financial institutions. We derive our revenue from customers primarily in the natural gas, utility and petrochemical industries. These industry concentrations have the potential to impact our overall exposure to credit risk, either positively or negatively, in that our customers could be affected by similar changes in economic, industry or other conditions. However, we believe that the credit risk posed by this industry concentration is offset by the creditworthiness of our customer base. Our portfolio of accounts receivable consists primarily of mid-size to large domestic corporate entities. Counterparties that individually accounted for 5% or more of our 2012 revenue collectively accounted for approximately 62% of our 2012 revenue. As of December 31, 2012, all of these companies or their respective parent companies were rated investment grade by Moody's Investors Service and Standard & Poor's Ratings Services, except for Formosa Hydrocarbons Company. Formosa Hydrocarbons Company's parent, Formosa Plastics Corporation, U.S.A., is affiliated with the Taiwan-based Formosa Plastics Group, which is rated investment grade by Standard & Poor's Ratings Services. Companies accounting for another approximately 25% of our revenue have an investment grade parent, are themselves investment grade, have provided us with credit support in the form of a letter of credit issued by an investment grade financial institution or have provided prepayment for our services.
We also diligently review the creditworthiness of other counterparties to which we may have credit exposure, including hedge counterparties. Our risk management policy requires that we review the credit ratings of our hedging counterparties on a monthly basis. As of December 31, 2012, our five largest hedging counterparties accounted for approximately 69% of the value of our net commodity hedging positions and all counterparties were rated Baa1 and A- or better by Moody's Investors Service and Standard & Poor's Ratings Services, respectively.
We extend credit to customers and other parties in the normal course of business. Estimated losses on accounts receivable are provided through an allowance for doubtful accounts. In evaluating the level of established reserves, we make judgments regarding economic conditions, each party's ability to make required payments and other factors. As the financial condition of any party changes, other circumstances develop or additional information becomes available, adjustments to the allowance for doubtful accounts may be required. We have established various procedures to manage our credit exposure, including initial credit approvals, credit limits and rights of offset. We also manage our credit risk using prepayments and
F-9
Table of Contents
Note 2 — Summary of Significant Accounting Policies (Continued)
guarantees to ensure that our management's established credit criteria are met. The activity in the allowance for doubtful accounts is as follows (in thousands):
| | | | | | | | | | | | | |
| | Balance at
Beginning
of Period | | Charged to
Expense | | Write-Offs,
Net of
Recoveries | | Balance at
End of
Period | |
|---|
Year ended December 31, 2012 | | $ | 927 | | $ | 115 | | $ | (915 | ) | $ | 127 | |
Year ended December 31, 2011 | | | 172 | | | 808 | | | (53 | ) | | 927 | |
Year ended December 31, 2010 | | | 211 | | | 65 | | | (104 | ) | | 172 | |
Property, Plant and Equipment
Our property, plant and equipment consist of intrastate gas transmission systems, gas gathering systems, gas processing, fractionation and treating facilities and other related facilities, and are carried at cost less accumulated depreciation.
| | | | | | | |
| | December 31, | |
|---|
| | 2012 | | 2011 | |
|---|
| | (In thousands)
| |
|---|
Property, plant and equipment, at cost | | | | | | | |
Pipelines and equipment | | $ | 1,000,831 | | $ | 953,401 | |
Gas processing plants and equipment | | | 385,892 | | | 345,547 | |
Construction in progress | | | 294,691 | | | 70,395 | |
Office furniture and equipment | | | 15,980 | | | 12,723 | |
| | | | | | |
| | | 1,697,394 | | | 1,382,066 | |
Less accumulated depreciation, amortization and impairment | | | (324,885 | ) | | (278,367 | ) |
| | | | | | |
Property, plant and equipment, net | | $ | 1,372,509 | | $ | 1,103,699 | |
| | | | | | |
We charge repairs and maintenance against income when incurred and capitalize renewals and betterments, which extend the useful life or expand the capacity of the assets. We calculate depreciation on the straight-line method based on the estimated useful lives of our assets as follows:
| | |
| | Useful Lives |
|---|
Pipelines and equipment | | 3-30 years |
Gas processing plants and equipment | | 5-30 years |
Other property and equipment | | 3-10 years |
Depreciation expense for the years ended December 31, 2012, 2011 and 2010 was $65,108,000, $60,779,000 and $51,382,000, respectively.
We capitalize interest on major projects during extended construction time periods. Such interest is allocated to property, plant and equipment and amortized over the estimated useful lives of the related assets. We capitalized $11,977,000, $9,675,000 and $3,355,000 of interest related to major projects during the years ended December 31, 2012, 2011 and 2010, respectively.
F-10
Table of Contents
Note 2 — Summary of Significant Accounting Policies (Continued)
Our intangible assets consist of rights-of-way, easements, contracts and acquired customer relationships. Intangible assets consisted of the following:
| | | | | | | | | | | | | |
| | December 31, 2012 | |
|---|
| | Weighted
Average
Remaining
Amortization
Period | | Gross
Carrying
Amount | | Accumulated
Amortization | | Net | |
|---|
| | (in years)
| | (In thousands)
| |
|---|
Rights-of-way and easements | | | 19 | | $ | 154,849 | | $ | (34,490 | ) | $ | 120,359 | |
Contracts | | | 9 | | | 68,717 | | | (29,940 | ) | | 38,777 | |
Customer relationships | | | 10 | | | 4,864 | | | (1,929 | ) | | 2,935 | |
| | | | | | | | | | | |
Total | | | 16 | | $ | 228,430 | | $ | (66,359 | ) | $ | 162,071 | |
| | | | | | | | | | | |
| | | | | | | | | | | | | |
| | December 31, 2011 | |
|---|
| | Weighted
Average
Remaining
Amortization
Period | | Gross
Carrying
Amount | | Accumulated
Amortization | | Net | |
|---|
| | (in years)
| | (In thousands)
| |
|---|
Rights-of-way and easements | | | 19 | | $ | 145,598 | | $ | (28,822 | ) | $ | 116,776 | |
Contracts | | | 17 | | | 108,416 | | | (36,014 | ) | | 72,402 | |
Customer relationships | | | 11 | | | 4,864 | | | (1,617 | ) | | 3,247 | |
| | | | | | | | | | | |
Total | | | 18 | | $ | 258,878 | | $ | (66,453 | ) | $ | 192,425 | |
| | | | | | | | | | | |
We amortize existing intangible assets and any costs incurred to renew or extend the terms of existing intangible assets over the contract term or estimated useful life, as applicable. Initial costs of acquiring new intangible assets are amortized over the estimated useful life of the related tangible assets. Any related renewals or extension costs of intangible assets are expensed over the contract term using the straight-line method.
During 2012, we acquired approximately $646,000 of rights-of-way with a weighted average renewal period of 5 years. These rights-of-way are being amortized over their estimated life of 20 years, which is based on our historical experience of having the ability to renew the agreements as well as our intended use of the asset. However, in order to utilize these rights-of-way over the 20 year-period, we will pay a renewal amount of approximately $891,000 at the end of each 5 year renewal period.
During the three months ended March 31, 2012 and September 30, 2011, we recorded non-cash impairment charges of $28,744,000 and $5,000,000, respectively, with respect to an underutilized contract for firm capacity that we resell to Rocky Mountains producers (see"Other Fair Value Measurements" in Note 9).
Estimated aggregate amortization expense is approximately:2013 —$11,690,000;2014 —$11,528,000;2015 —$11,493,000;2016 —$11,471,000 and2017 —$11,228,000.
In accordance with Accounting Standards Codification ("ASC") 360, "Accounting for the Impairment or Disposal of Long-Lived Assets," we evaluate whether long-lived assets, including related intangibles, have
F-11
Table of Contents
Note 2 — Summary of Significant Accounting Policies (Continued)
been impaired when events or changes in circumstances indicate, in management's judgment, that the carrying value of such assets may not be recoverable. For such long-lived assets, an impairment exists when its carrying value exceeds the sum of management's estimate of the undiscounted future cash flows expected to result from the use and eventual disposition of the asset. If the carrying value of the long-lived asset is not recoverable based on these estimated future undiscounted cash flows, the impairment loss is measured as the excess of the asset's carrying value over its fair value, such that the asset's carrying value is adjusted to its estimated fair value. For assets identified to be disposed of in the future, the carrying value of these assets is compared to the estimated fair value less the cost to sell to determine if impairment is required. Until the assets are disposed of, an estimate of the fair value is recalculated when related events or circumstances change.
When determining whether impairment of one of our long-lived assets has occurred, we must estimate the undiscounted cash flows attributable to the asset or asset group. Our estimate of cash flows is based on assumptions regarding the asset, including future commodity prices and estimated future natural gas production in the related region (which is dependent in part on commodity prices). Projections of gas volumes and future commodity prices are inherently subjective and contingent upon a number of variable factors, including but not limited to:
- •
- changes in general economic conditions in which our assets are located;
- •
- the availability and prices of natural gas supply;
- •
- improvements in exploration and production technology;
- •
- the finding and development cost for producers to exploit reserves in a particular area;
- •
- our ability to negotiate favorable agreements with producers and customers;
- •
- our dependence on certain significant customers, producers, gatherers and transporters of natural gas;
- •
- availability of downstream natural gas and NGL markets; and
- •
- competition from other midstream service providers, including major energy companies.
Any significant variance in any of the above assumptions or factors could materially affect our cash flows, which could require us to record an impairment of an asset. See Notes 4 and 9.
Goodwill acquired in a business combination is not subject to amortization. As required by ASC 350,"Intangibles — Goodwill and Other," we test such goodwill for impairment at the reporting unit level on an annual basis and between annual tests if an event occurs or circumstances change that would more likely than not reduce the fair value of a reporting unit below its carrying amount. For the years ended December 31, 2012, 2011 and 2010, we did not record a goodwill impairment. Goodwill of $518,000 related to our acquisition of Cimmarron Gathering, LP in 2007 is included in other assets as of December 31, 2012 and 2011.
Other assets primarily consist of costs associated with debt issuance costs net of related accumulated amortization. Amortization of other assets is calculated using a method that approximates the effective interest method over the maturity of the associated debt or the term of the associated contract.
F-12
Table of Contents
Note 2 — Summary of Significant Accounting Policies (Continued)
In the course of transporting natural gas and NGLs for others, we may receive for redelivery different quantities of natural gas or NGLs than the quantities we ultimately redeliver. These differences are recorded as transportation and exchange imbalance receivables or payables that are recovered or repaid through the receipt or delivery of natural gas or NGLs in future periods, if not subject to cash-out provisions. Imbalance receivables are included in accounts receivable, and imbalance payables are included in accounts payable on the consolidated balance sheets at current market prices in effect for the reporting period of the outstanding imbalances. As of December 31, 2012 and 2011, we had imbalance receivables totaling $585,000 and $566,000, respectively, and imbalance payables totaling $505,000 and $370,000, respectively. Changes in market value and the settlement of any such imbalance at a price greater than or less than the recorded imbalance results in an upward or downward adjustment, as appropriate, to the cost of natural gas sold.
Asset retirement obligations ("AROs") are legal obligations associated with the retirement of tangible long-lived assets that result generally from the acquisition, construction, development or normal operation of the asset. When an ARO is incurred, we recognize a liability for the fair value of the ARO and increase the carrying amount of the related long-lived asset. Over time, the liability is accreted to its present value and recognized as accretion expense each period, and the capitalized amount is depreciated over the remaining useful life of the related long-lived asset. Upon settlement of the liability, we either settle the obligation for its recorded amount or incur a gain or loss on settlement. We have recorded AROs related to (i) rights-of-way and easements over property we do not own and (ii) regulatory requirements where a legal or contractual obligation exists upon abandonment of the related facility.
The following table presents information regarding our AROs (in thousands):
| | | | |
ARO liability balance, December 31, 2010 | | $ | 842 | |
AROs incurred in 2011 | | | 161 | |
Accretion for conditional obligations | | | 65 | |
| | | | |
ARO liability balance, December 31, 2011 | | | 1,068 | |
ARO incurred in 2012 | | | 2 | |
Accretion for conditional obligations | | | 66 | |
ARO settled/released in 2012 | | | (209 | ) |
| | | | |
ARO liability balance, December 31, 2012 | | $ | 927 | |
| | | | |
At December 31, 2012 and 2011, there were no assets legally restricted for purposes of settling AROs.
F-13
Table of Contents
Note 2 — Summary of Significant Accounting Policies (Continued)
Using the revenue recognition criteria of evidence of an arrangement, delivery of a product and the determination of price, our natural gas and NGL revenue is recognized in the period when the physical product is delivered to the customer and in an amount based on the pricing terms of an executed contract. Our transportation, compression, processing, fractionation and other revenue is recognized in the period when the service is provided and includes our fee-based service revenue including processing under firm capacity arrangements. In addition, collectability is evaluated on a customer-by-customer basis. New and existing customers are subject to a credit review process, which evaluates the customers' financial position and their ability to pay.
Our sale and purchase arrangements are primarily accounted for on a gross basis in the statements of operations as natural gas sales and costs of natural gas, respectively. These transactions are contractual arrangements that establish the terms of the purchase of natural gas at a specified location and the sale of natural gas at a different location on the same or on another specified date. All transactions require physical delivery of the natural gas, and transfer of the risk and reward of ownership are evidenced by title transfer, assumption of environmental risk, transportation scheduling, credit risk and counterparty nonperformance risk.
On occasion, we enter into buy/sell arrangements that are accounted for on a net basis in the statements of operations as either a net natural gas sale or a net cost of natural gas, as appropriate. These purchase and sale transactions are generally detailed either jointly, in a single contract or separately, in individual contracts that are entered into concurrently or in contemplation of one another with a single or multiple counterparties.
Our contract mix reflects a variety of pricing terms typical for the midstream industry, with varying levels of commodity price sensitivity, including fee-based, percent-of-proceeds, percent-of-index and keep-whole terms. In addition to compensating us for gathering, transportation, processing, or fractionation services, many of our contracts also allow us to charge fees for treating, compression, dehydration, nitrogen rejection or other services. Generally:
- •
- our margins from fee-based pricing are directly related to the volumes of natural gas or NGLs that flow through our systems and are not directly affected by commodity prices;
- •
- our margins from percent-of-proceeds (including percent-of-liquids) pricing and percent-of-index pricing for lean gas that does not require processing are generally directly related to the prices for natural gas, NGLs or both; in other words, our margins increase or decrease as prices increase or decrease; and
- •
- our margins from keep-whole pricing and percent-of-index pricing involving gas that we process are related not only to natural gas and NGL prices but also to the spread between natural gas and NGL prices. As NGL prices increase relative to natural gas prices, our margins increase, and if NGL prices decrease relative to natural gas prices, our margins decrease. Our keep-whole contracts include terms that help us avoid incurring losses that would result if NGL prices fell near or below natural gas prices, such as allowing us to charge fees and reduce the volume of NGLs we recover during unfavorable pricing environments. Also, to the extent our contract entitles us to keep extracted NGLs, we may share a portion of our processing margin with the counterparty when processing margins are favorable.
In addition, some of our fee-based and percent-of-proceeds contracts include "fixed recovery" provisions, which operate in conjunction with the contract's main pricing terms. Under fixed recovery terms, we determine the amount payable, or the volumes of residue gas and NGLs deliverable, to the counterparty
F-14
Table of Contents
Note 2 — Summary of Significant Accounting Policies (Continued)
based on contractual NGL recovery factors. Fixed recovery terms can affect our margins to the extent that our actual recoveries vary from the agreed NGL recovery factor. If we exceed fixed recoveries when processing margins are favorable, our margins will benefit to the extent of the difference. However, our margins will decrease to the extent we do not meet the NGL recovery factor in a favorable processing margin environment, and we could incur losses. If NGL prices are unfavorable relative to natural gas prices, we would be able to increase our margins by reducing our recoveries.
We engage in risk management activities that take the form of derivative instruments to manage the risks associated with natural gas and NGL prices and the fluctuation in interest rates. Through our risk management activities, we must estimate the fair value of our financial derivatives using valuation models based on whether the inputs to those valuation techniques are observable or unobservable.
ASC 815,"Derivatives and Hedging," as amended, establishes accounting and reporting standards for derivative instruments, including certain derivative instruments embedded in other contracts, and for hedging activities. In accordance with ASC 815, we recognize all derivatives as either risk management assets or liabilities in our consolidated balance sheets and measure those instruments at fair value. Changes in the fair value of financial instruments over time are recognized into earnings unless specific hedging criteria are met. If the financial instruments meet the hedging criteria, changes in fair value will be recognized in earnings for fair value hedges and in other comprehensive income for the effective portion of cash flow hedges. Ineffectiveness in cash flow hedges is recognized in earnings in the period in which the ineffectiveness occurs. Gains and losses on cash flow hedges are reclassified to operating revenue as the forecasted transactions impact earnings. We included changes in our risk management activities in cash flow from operating activities on the consolidated statements of cash flows.
ASC 815 does not apply to non-derivative contracts or derivative contracts that are subject to a normal purchases and normal sales exclusion. Contracts for normal purchases and normal sales provide for the purchase or sale of something other than a financial instrument or derivative instrument and for delivery in quantities expected to be used or sold by the reporting entity over a reasonable period in the normal course of business. Our forward natural gas purchase and sales contracts are either not considered a derivative or are subject to the normal purchases and normal sales scope exception. These contracts generally have terms ranging between one and five years, although a small number continue for the life of the dedicated production.
We use financial instruments such as puts, calls, swaps and other derivatives to mitigate the risks to our cash flow and profitability resulting from changes in commodity prices and interest rates. We recognize these transactions as assets and liabilities on our consolidated balance sheets based on the instrument's fair value. Our financial instruments have been designated and accounted for as cash flow hedges except as discussed in Note 9.
We recognize the fair value of our assets and liabilities that require periodic re-measurement as necessary based upon the requirements of ASC 820,"Fair Value Measurement," as discussed in Note 9.
Interest and other financing costs includes interest and fees incurred and amortization of debt issuance costs related to our senior secured revolving credit facility and senior unsecured notes discussed in Note 5, net cash settlements of interest rate swaps, net unrealized mark-to-market gain or loss on interest rate swaps, capitalized interest and non-cash ineffectiveness of interest rate swaps.
F-15
Table of Contents
Note 2 — Summary of Significant Accounting Policies (Continued)
Three of our 100% owned subsidiaries, Copano General Partners, Inc. ("CGP") and Copano Energy Finance Corporation ("CEFC"), both Delaware corporations, and CPNO Services, L.P. ("CPNO Services"), a Texas limited partnership, are the only entities within our consolidated group subject to federal income taxes. CGP's operations primarily include its indirect ownership of the managing general partner interest in certain of our Texas operating entities. CEFC was formed in July 2005 and is a co-issuer of our senior unsecured notes discussed in Note 5. CPNO Services allocates administrative and operating costs, including payroll and benefits expenses, to us and certain of our operating subsidiaries. As of December 31, 2012, CGP and CPNO Services have estimated a combined net operating loss ("NOL") carry forward of approximately $6,916,000, for which a valuation allowance has been recorded. Our NOL carry forwards have a 20 year life and expire between 2025 and 2032. We recognized no significant income tax expense for the years ended December 31, 2012, 2011 and 2010. Except for income allocated with respect to CGP, CEFC and CPNO Services, our income is taxable directly to our unitholders.
We do not provide for federal income taxes in the accompanying consolidated financial statements, as we are not subject to entity-level federal income tax. However, we are subject to the Texas margin tax, which is imposed at a maximum effective rate of 0.7% on our annual "margin," as defined in the Texas margin tax statute enacted in 2007. Our annual margin generally is calculated as our revenues for federal income tax purposes less the "cost of the products sold" as defined in the statute. The provision for the Texas margin tax totaled $1,654,000, $1,453,000 and $895,000 for the years ended December 31, 2012, 2011 and 2010, respectively. Under the provisions of ASC 740,"Accounting for Income Taxes," we are required to record the effects on deferred taxes for a change in tax rates or tax law in the period that includes the enactment date. Under ASC 740, taxes based on income, like the Texas margin tax, are accounted for using the liability method under which deferred income taxes are recognized for the future tax effects of temporary differences between the financial statement carrying amounts and the tax basis of existing assets and liabilities using the enacted statutory tax rates in effect at the end of the period. A valuation allowance for deferred tax assets is recorded when it is more likely than not that the benefit from the deferred tax asset will not be realized. The deferred tax provisions presented on the accompanying consolidated balance sheets relate to the effect of temporary book/tax timing differences associated with depreciation.
Net income (loss) per unit is calculated in accordance with ASC 260, "Earnings Per Share," which specifies the use of the two-class method of computing earnings per unit when participating or multiple classes of securities exist. Under this method, undistributed earnings for a period are allocated based on the contractual rights of each security to share in those earnings as if all of the earnings for the period had been distributed.
Basic net income (loss) per unit excludes dilution and is computed by dividing net income (loss) attributable to each respective class of units by the weighted average number of units outstanding for each respective class during the period. Dilutive net income (loss) per unit reflects potential dilution that could occur if convertible securities were converted into common units or contracts to issue common units were exercised except when the assumed conversion or exercise would have an anti-dilutive effect on net income (loss) per unit. Dilutive net income (loss) per unit is computed by dividing net income (loss) attributable to each respective class of units by the weighted average number of units outstanding for each respective class of units during the period increased by the number of additional units that would have been outstanding if the dilutive potential units had been issued.
Because we had a net loss to common units for the years ended December 31, 2012, 2011 and 2010, the weighted average units outstanding are the same for basic and diluted net loss per common unit. The
F-16
Table of Contents
Note 2 — Summary of Significant Accounting Policies (Continued)
following potentially dilutive common equity was excluded from the dilutive net loss per unit calculation because to include these equity securities would have been anti-dilutive.
| | | | | | | | | | |
| | Year Ended December 31, | |
|---|
| | 2012 | | 2011 | | 2010 | |
|---|
| | (In thousands)
| |
|---|
Options | | | 637 | | | 766 | | | 962 | |
Unit appreciation rights | | | 477 | | | 407 | | | 360 | |
Restricted units | | | 43 | | | 44 | | | 60 | |
Phantom units | | | 1,172 | | | 997 | | | 882 | |
Contingent incentive plan unit awards | | | — | | | 100 | | | 64 | |
Series A preferred units | | | 12,897 | | | 11,684 | | | 10,585 | |
We account for equity-based compensation expense in accordance with ASC 718, "Stock Compensation." We estimate grant date fair value using either an option-pricing model that is consistent with the terms of the award or a market observed price, if such a price exists. This cost is recognized over the period during which an employee is required to provide services in exchange for the award (which is usually the vesting period). We treat equity awards granted as a single award and recognize equity-based compensation expense on a straight-line basis (net of estimated forfeitures) over the employee service or vesting period. Equity-based compensation expense is recorded in operations and maintenance expenses and general and administrative expenses in our consolidated statements of operations. See Note 6.
We sponsor a 401(k) tax deferred savings plan, whereby we match a portion of employees' contributions in cash. Participation in the plan is voluntary and all employees who are 21 years of age are eligible to participate. For the year ended December 31, 2010, we suspended our contribution match program as a result of the economic downturn and business environment. In 2011, we reinstated our discretionary contribution match and matched employee contributions dollar-for-dollar on the first 3% of an employee's pretax earnings. For 2012, we matched employee contributions dollar-for-dollar on the first 3% and $0.50 per dollar for the next 2% of an employee's pretax earnings. We charged to expense plan contributions of $1,094,000 and $444,000 in 2012 and 2011, respectively.
Note 3 — New Accounting Pronouncements
In February 2013, the Financial Accounting Standards Board ("FASB") issued Accounting Standards Update 2013-02-Comprehensive Income (ASC 220), "Reporting of Amounts Reclassified Out of Accumulated Other Comprehensive Income." This update requires that we report reclassifications out of accumulated other comprehensive income and their effect on net income by component or financial statement line. This can be reported either on the face of the statement where net income is presented or in the notes and is required beginning with our quarterly filing for the three months ended March 31, 2013. We do not expect this to impact our consolidated financial results, as the only required change is the format of our presentation.
We have reviewed other recently issued, but not yet adopted, accounting standards and updates in order to determine their potential effects, if any, on our consolidated results of operations, financial position and cash flows and have determined that none are expected to have a material impact.
F-17
Table of Contents
Note 4 — Investments in Unconsolidated Affiliates
Our investments in unconsolidated affiliates consisted of the following at December 31, 2012.
| | | | | | | |
| Equity Method Investment | | Structure | | Ownership Percentage | | Segment |
|---|
Webb/Duval Gatherers ("Webb Duval") | | Texas general partnership | | | 62.50 | % | Texas |
Eagle Ford Gathering LLC
("Eagle Ford Gathering") | | Delaware limited liability company | | | 50.00 | % | Texas |
Liberty Pipeline Group, LLC
("Liberty Pipeline Group") | | Delaware limited liability company | | | 50.00 | % | Texas |
Double Eagle Pipeline LLC
("Double Eagle Pipeline") | | Delaware limited liability company | | | 50.00 | % | Texas |
Southern Dome, LLC ("Southern Dome") | | Delaware limited liability company | | | 69.50% | (1) | Oklahoma |
Bighorn Gas Gathering, L.L.C. ("Bighorn") | | Delaware limited liability company | | | 51.00 | % | Rocky Mountains |
Fort Union Gas Gathering, L.L.C.
("Fort Union") | | Delaware limited liability company | | | 37.04 | % | Rocky Mountains |
- (1)
- Represents Copano's right to distributions from Southern Dome
None of these entities' respective partnership or operating agreements restrict their ability to pay distributions to their respective partners or members after consideration of current and anticipated cash needs, including debt service obligations. However, Fort Union's credit agreement provides that it can distribute cash to its members only if its ratio of net operating cash flow to debt service is at least 1.25 to 1.00 and it is not otherwise in default under its credit agreement. If Fort Union fails to comply with this covenant or otherwise defaults under its credit agreement, it would be prohibited from distributing cash. As of December 31, 2012, Fort Union is in compliance will this financial covenant.
Impairment. The impairment test for our investments in unconsolidated affiliates requires that we consider whether the fair value of our equity investment as a whole, not the underlying net assets, has declined, and if so, whether that decline is other than temporary. We periodically reevaluate our equity — method investments to determine whether current events or circumstances warrant adjustments to our carrying value in accordance with the ASC 323, "Investments — Equity Method and Joint Ventures."
- •
- During the three months ended December 31, 2012, we recorded non-cash impairment charges of $48,254,000 and $18,000,000 related to our investments in Bighorn and Fort Union, respectively, primarily as a result of a decline in our forecasted future volumes on the respective systems after a major producer in the region informed us that some of its current and future production was going to be abandoned. We updated our probability-weighted discounted cash flow model for the new volume assumption which resulted in an additional impairment of our investments in Fort Union and Bighorn. We determined the fair value of our investments in Bighorn and Fort Union using a probability-weighted discounted cash flow model (see"Other Fair Value Measurements" in Note 9).
- •
- During the three months ended March 31, 2012, we recorded non-cash impairment charges of $115,000,000 and $5,000,000 relating to our investments in Bighorn and Fort Union, respectively, primarily based on the low natural gas price environment in the region and our expectation for a lower level of drilling by producers in the Powder River Basin. We determined the fair value of our investments in Bighorn and Fort Union using a probability-weighted discounted cash flow model (see"Other Fair Value Measurements" in Note 9).
- •
- During the three months ended September 30, 2011, we recorded non-cash impairment charges of $120,000,000 and $45,000,000 relating to our investments in Bighorn and Fort Union. We determined that these charges were necessary primarily based on a downward shift in the Colorado Interstate Gas forward price curve and our expectations of a continued weak outlook for Rocky
F-18
Table of Contents
Note 4 — Investments in Unconsolidated Affiliates (Continued)
Mountains natural gas prices and, as producers focus more on rich-gas and shale plays, a continued lack of drilling activity in Wyoming's Powder River Basin. We determined the fair value of our investments in Bighorn and Fort Union using a probability-weighted discounted cash flow model (see"Other Fair Value Measurements" in Note 9).
- •
- During the three months ended June 30, 2010, we recorded a $25,000,000 non-cash impairment charge relating to our investment in Bighorn primarily as a result of a continued weak Rocky Mountains pricing environment for natural gas, lack of drilling activity in Wyoming's Powder River Basin and a downward shift in the Colorado Interstate Gas forward price curve.
- •
- During the three months ended December 31, 2010, we recorded a $697,000 non-cash impairment of our investment in Webb Duval due to declines in volumes transported on the Webb Duval system at the time.
Eagle Ford Gathering. Our investment in Eagle Ford Gathering, totaled $155,224,000 and $120,910,000 as of December 31, 2012 and 2011, respectively. The summarized financial information for our investment in Eagle Ford Gathering, which is accounted for using the equity method, is as follows (in thousands):
| | | | | | | | | | |
| |
| |
| | Period from
May 12,
2010 to
December 31,
2010 | |
|---|
| | Year Ended December 31, | |
|---|
| | 2012 | | 2011 | |
|---|
Operating revenue | | $ | 415,923 | | $ | 69,976 | | $ | — | |
Operating expenses | | | (333,131 | ) | | (43,684 | ) | | (98 | ) |
Depreciation and amortization | | | (12,496 | ) | | (3,802 | ) | | — | |
Other | | | (828 | ) | | (275 | ) | | — | |
| | | | | | | | |
Net income (loss) | | | 69,468 | | | 22,215 | | | (98 | ) |
Ownership % | | | 50 | % | | 50 | % | | 50 | % |
| | | | | | | | |
| | | 34,734 | | | 11,108 | | | (49 | ) |
Copano's share of management fee charged | | | 266 | | | 137 | | | 41 | |
Amortization of the difference between the carried investment and the underlying equity in net assets | | | (82 | ) | | (27 | ) | | — | |
| | | | | | | | |
Equity in earnings (loss) from Eagle Ford Gathering | | $ | 34,918 | | $ | 11,218 | | $ | (8 | ) |
| | | | | | | | |
Distributions | | $ | 24,958 | | $ | 9,457 | | $ | — | |
| | | | | | | | |
Contributions | | $ | 24,619 | | $ | 88,789 | | $ | 29,982 | |
| | | | | | | | |
Current assets | | $ | 65,702 | | $ | 19,700 | | $ | 8,302 | |
Noncurrent assets | | | 265,360 | | | 238,877 | | | 57,956 | |
Current liabilities | | | (27,193 | ) | | (23,627 | ) | | (6,392 | ) |
Noncurrent liabilities | | | (442 | ) | | (313 | ) | | — | |
| | | | | | | | |
Net assets | | $ | 303,427 | | $ | 234,637 | | $ | 59,866 | |
| | | | | | | | |
Bighorn. Our investment in Bighorn totaled $43,902,000 and $212,071,000 as of December 31, 2012 and 2011, respectively. We are entitled to a priority distribution of net cash flows from the capital we
F-19
Table of Contents
Note 4 — Investments in Unconsolidated Affiliates (Continued)
contributed to non-consent capital projects up to 140% of the contributed capital. Remaining income of Bighorn is allocated to us based on our ownership interest.
The summarized financial information for our investment in Bighorn, which is accounted for using the equity method, is as follows (in thousands):
| | | | | | | | | | |
| | Year Ended December 31, | |
|---|
| | 2012 | | 2011 | | 2010 | |
|---|
Operating revenue | | $ | 23,057 | | $ | 26,962 | | $ | 31,435 | |
Operating expenses | | | (9,788 | ) | | (9,724 | ) | | (11,552 | ) |
Depreciation and amortization | | | (5,411 | ) | | (5,176 | ) | | (5,320 | ) |
Interest income and other | | | 88 | | | 78 | | | 95 | |
| | | | | | | | |
Net income | | | 7,946 | | | 12,140 | | | 14,658 | |
Ownership % | | | 51 | % | | 51 | % | | 51 | % |
| | | | | | | | |
| | | 4,052 | | | 6,191 | | | 7,476 | |
Priority allocation of earnings and other | | | 527 | | | 596 | | | 485 | |
Copano's share of management fee charged | | | 197 | | | 197 | | | 283 | |
Amortization of the difference between the carried investment and the underlying equity in net assets and impairment | | | (166,532 | ) | | (130,107 | ) | | (36,715 | ) |
| | | | | | | | |
Equity in loss from Bighorn | | $ | (161,756 | ) | $ | (123,123 | ) | $ | (28,471 | ) |
| | | | | | | | |
Distributions | | $ | 8,198 | | $ | 10,091 | | $ | 11,190 | |
| | | | | | | | |
Contributions | | $ | 1,982 | | $ | 1,444 | | $ | 848 | |
| | | | | | | | |
Current assets | | $ | 3,332 | | $ | 3,562 | | $ | 5,449 | |
Noncurrent assets | | | 84,269 | | | 87,847 | | | 88,754 | |
Current liabilities | | | (1,178 | ) | | (1,943 | ) | | (1,031 | ) |
Noncurrent liabilities | | | (339 | ) | | (309 | ) | | (269 | ) |
| | | | | | | | |
Net assets | | $ | 86,084 | | $ | 89,157 | | $ | 92,903 | |
| | | | | | | | |
Fort Union. Our investment in Fort Union totaled $145,588,000 and $169,856,000 as of December 31, 2012 and 2011, respectively.
F-20
Table of Contents
Note 4 — Investments in Unconsolidated Affiliates (Continued)
The summarized financial information for our investment in Fort Union, which is accounted for using the equity method, is as follows (in thousands):
| | | | | | | | | | |
| | Year Ended December 31, | |
|---|
| | 2012 | | 2011 | | 2010 | |
|---|
Operating revenue | | $ | 60,721 | | $ | 58,789 | | $ | 58,611 | |
Operating expenses | | | (7,140 | ) | | (7,100 | ) | | (7,474 | ) |
Depreciation and amortization | | | (8,115 | ) | | (7,991 | ) | | (7,739 | ) |
Interest expense and other | | | (1,517 | ) | | (2,040 | ) | | (3,915 | ) |
| | | | | | | | |
Net income | | | 43,949 | | | 41,658 | | | 39,483 | |
Ownership % | | | 37.04 | % | | 37.04 | % | | 37.04 | % |
| | | | | | | | |
| | | 16,279 | | | 15,430 | | | 14,625 | |
Copano's share of management fee charged | | | 96 | | | 91 | | | 89 | |
Amortization of the difference between the carried investment and the underlying equity in net assets and impairment | | | (27,545 | ) | | (50,990 | ) | | (6,423 | ) |
| | | | | | | | |
Equity in (loss) earnings from Fort Union | | $ | (11,170 | ) | $ | (35,469 | ) | $ | 8,291 | |
| | | | | | | | |
Distributions | | $ | 13,001 | | $ | 13,075 | | $ | 11,668 | |
| | | | | | | | |
Contributions | | $ | — | | $ | — | | $ | 774 | |
| | | | | | | | |
Current assets | | $ | 14,114 | | $ | 14,757 | | $ | 15,729 | |
Noncurrent assets | | | 187,988 | | | 196,184 | | | 204,424 | |
Current liabilities | | | (60,744 | ) | | (19,359 | ) | | (19,944 | ) |
Noncurrent liabilities | | | (145 | ) | | (59,218 | ) | | (74,203 | ) |
| | | | | | | | |
Net assets | | $ | 141,213 | | $ | 132,364 | | $ | 126,006 | |
| | | | | | | | |
Other. Our investments in our other unconsolidated affiliates (Webb Duval, Double Eagle Pipeline, Liberty Pipeline Group and Southern Dome) totaled $86,733,000 and $41,894,000 as of December 31, 2012
F-21
Table of Contents
Note 4 — Investments in Unconsolidated Affiliates (Continued)
and 2011, respectively. The summarized financial information for our investments in other unconsolidated affiliates is presented below in aggregate (in thousands):
| | | | | | | | | | |
| | Year Ended December 31, | |
|---|
| | 2012 | | 2011 | | 2010 | |
|---|
Operating revenue | | $ | 22,594 | | $ | 27,061 | | $ | 30,262 | |
Operating expenses | | | (15,823 | ) | | (22,554 | ) | | (25,690 | ) |
Depreciation, amortization and impairment | | | (4,064 | ) | | (2,367 | ) | | (4,654 | ) |
Other (expense) income, net | | | (24 | ) | | (1 | ) | | 7 | |
| | | | | | | | |
Net income (loss) | | $ | 2,683 | | $ | 2,139 | | $ | (75 | ) |
| | | | | | | | |
Equity in earnings (loss) from other unconsolidated affiliates | | $ | 920 | | $ | 2,050 | | $ | (292 | ) |
| | | | | | | | |
Distributions | | $ | 1,317 | | $ | 2,848 | | $ | 3,097 | |
| | | | | | | | |
Contributions(1) | | $ | 45,712 | | $ | 31,734 | | $ | 750 | |
| | | | | | | | |
Current assets | | $ | 4,716 | | $ | 3,654 | | $ | 3,864 | |
Noncurrent assets | | | 170,968 | | | 75,002 | | | 17,405 | |
Current liabilities | | | (15,984 | ) | | (4,163 | ) | | (4,951 | ) |
Noncurrent liabilities | | | (188 | ) | | (173 | ) | | (63 | ) |
| | | | | | | | |
Net assets | | $ | 159,512 | | $ | 74,320 | | $ | 16,255 | |
| | | | | | | | |
- (1)
- Contributions for the year ended December 31, 2012 and 2011 were primarily made to Double Eagle Pipeline and Liberty Pipeline Group.
Note 5 — Long-Term Debt
| | | | | | | |
| | December 31, | |
|---|
| | 2012 | | 2011 | |
|---|
| | (In thousands)
| |
|---|
Long-term debt: | | | | | | | |
Revolving credit facility | | $ | 239,000 | | $ | 385,000 | |
Senior Notes: | | | | | | | |
7.75% senior unsecured notes due 2018 | | | 249,525 | | | 249,525 | |
7.125% senior unsecured notes due 2021 | | | 510,000 | | | 360,000 | |
Unamortized bond premium-senior unsecured notes due 2021 | | | 3,124 | | | — | |
| | | | | | |
Total Senior Notes | | | 762,649 | | | 609,525 | |
| | | | | | |
Total long-term debt | | $ | 1,001,649 | | $ | 994,525 | |
| | | | | | |
On June 10, 2011, we entered into a second amended and restated credit agreement (the "Amended Credit Agreement") with Bank of America, N.A., as Administrative Agent, which increased our $550 million senior secured revolving credit facility to $700 million. The changes in the Amended Credit Agreement include:
- •
- The maturity date is extended from October 18, 2012 to June 10, 2016.
F-22
Table of Contents
Note 5 — Long-Term Debt (Continued)
- •
- Interest is determined, at our election, by reference to (a) the British Bankers Association LIBOR rate, or LIBOR, plus an applicable rate between 2.0% and 3.25% per annum or (b) the highest of (1) the federal funds rate plus 0.50%, (2) the prime rate and (3) LIBOR plus 1.0%, plus, in each case, an applicable rate between 1.0% and 2.25% per annum. The applicable rates vary depending on our consolidated leverage ratio (as defined in the Amended Credit Agreement).
- •
- The quarterly commitment fee on the unused amount of the revolving credit facility is determined by reference to an applicable rate between 0.375% and 0.5% per annum. The applicable rate varies depending on our consolidated leverage ratio (as defined in the Amended Credit Agreement).
- •
- A sublimit of up to $100 million is available for letters of credit and a sublimit of up to $75 million is available for swing line loans.
As of December 31, 2012, we had no letters of credit outstanding.
Our obligations under the revolving credit facility are secured by first priority liens on substantially all of our assets and the assets of our 100% owned subsidiaries (except for our equity interests in joint venture entities other than Webb Duval and Southern Dome), all of which are party to the revolving credit facility as guarantors. Our less than 100% owned subsidiaries have not pledged their assets as security or guaranteed our obligations under the revolving credit facility.
Interest is payable quarterly for prime rate loans and at the applicable maturity date for LIBOR loans, except that if the interest period for a LIBOR loan is six months, interest will be paid at the end of each three-month period. The weighted average interest rate on borrowings under the revolving credit facility for the years ended December 31, 2012, 2011 and 2010 was 5.3%, 5.6% and 8.9%, respectively, and the quarterly commitment fee on the unused portion of the revolving credit facility at the end of each of those periods, respectively, was 0.5%, 0.375% and 0.25%. Interest and other financing costs related to the revolving credit facility totaled $10,933,000, $8,887,000 and $5,725,000 for the years ended December 31, 2012, 2011 and 2010, respectively.
We incurred $7,939,000 in financing fees related to the Amended Credit Agreement. Because the borrowing capacity of the Amended Credit Agreement is greater than the borrowing capacity of the previous arrangement, our costs incurred in connection with the establishment of the Amended Credit Agreement are being amortized over its term in accordance with ASC 470-50-40-21, "Debt — Modifications and Extinguishments-Line-of-Credit Arrangement." As of December 31, 2012 and 2011, the unamortized portion of debt issue costs totaled $7,995,000 and $10,187,000, respectively.
The revolving credit facility contains various covenants (including certain subjective representations and warranties) that, subject to exceptions, limit our and subsidiary guarantors' ability to grant liens; make loans and investments; make distributions other than from available cash (as defined in our limited liability company agreement); merge or consolidate with or into a third party; or engage in certain asset dispositions, including a sale of all or substantially all of our assets. Additionally, the revolving credit facility limits us and our subsidiary guarantors' ability to incur additional indebtedness, subject to exceptions, including (i) purchase money indebtedness and indebtedness related to capital or synthetic leases, (ii) unsecured indebtedness qualifying as subordinated debt and (iii) certain privately placed or public term unsecured indebtedness.
The revolving credit facility contains covenants (some of which require that we make certain subjective representations and warranties), including financial covenants that require us and our subsidiary guarantors, on a consolidated basis, to maintain specified ratios as follows:
- •
- a maximum consolidated leverage ratio (total debt to Consolidated EBITDA as defined in the Amended Credit Agreement) permitted under the agreement is 5.25 to 1.0. Subject to conditions
F-23
Table of Contents
Note 5 — Long-Term Debt (Continued)
and limitations described in the Amended Credit Agreement, up to 15% of our Consolidated EBITDA for purposes of calculating this ratio may consist of projected EBITDA attributable to material capital projects (generally, capital projects expected to exceed $20 million) then under construction, including our net share of projected EBITDA attributable to capital projects pursued by joint ventures in which we own interest ("Material Project EBITDA");
- •
- a maximum senior secured leverage ratio (total senior secured debt to Consolidated EBITDA as defined in the Amended Credit Agreement) permitted under the agreement is 4.0 to 1.0. Up to 15% of our Consolidated EBITDA for purposes of calculating this ratio may consist of Material Project EBITDA; and
- •
- a minimum consolidated interest coverage ratio (Consolidated EBITDA to interest as defined in the Amended Credit Agreement) as of the end of any fiscal quarter may not be less than 2.50 to 1.00.
EBITDA for the purposes of the revolving credit facility is our EBITDA with certain negotiated adjustments.
At December 31, 2012, our ratio of total debt to EBITDA was 4.00x, our ratio of total senior secured debt to EBITDA was 0.96x and our ratio of EBITDA to interest expense was 3.62x. Based on our ratio of debt to EBITDA at December 31, 2012, we have approximately $311 million of available capacity under the revolving credit facility before we reach the maximum total debt to EBITDA ratio of 5.25 to 1.0.
Our revolving credit facility also contains customary events of default, including the following:
- •
- failure to pay any principal when due, or, within specified grace periods, any interest, fees or other amounts;
- •
- failure to perform or otherwise comply with the covenants in the credit agreement or other loan documents, subject to certain grace periods in some cases;
- •
- default on the payment of any other indebtedness in excess of $35 million, or in the performance of any obligation or condition with respect to such indebtedness, beyond the applicable grace period if the effect of the default is to permit or cause the acceleration of the indebtedness;
- •
- bankruptcy or insolvency events involving us or our subsidiaries;
- •
- the entry of, and failure to pay, one or more adverse judgments in excess of $35 million upon which enforcement proceedings are brought or are not stayed pending appeal; and
- •
- a change of control (as defined in the revolving credit facility).
If we failed to comply with the financial or other covenants under our revolving credit facility or experienced a material adverse effect on our operations, business, properties, liabilities or financial or other condition, we would be unable to borrow under our revolving credit facility, and could be in default after specified notice and cure periods. If an event of default exists under the revolving credit facility, our lenders could terminate their commitments to lend to us and accelerate the maturity of our outstanding obligations under the revolving credit facility.
Future borrowings under our revolving credit facility are available for acquisitions, capital expenditures, working capital and general corporate purposes, and the facility may be drawn on and repaid without restrictions so long as we are in compliance with its terms, including financial covenants described above.
We are in compliance with the financial covenants under the revolving credit facility as of December 31, 2012.
F-24
Table of Contents
Note 5 — Long-Term Debt (Continued)
Senior Notes Offering and Tender Offer. On April 5, 2011, we closed a public offering of $360,000,000 in aggregate principal amount of 7.125% senior unsecured notes due 2021 (the "2021 Notes"). We used the net proceeds to fund a tender offer for all of our outstanding 8.125% senior unsecured notes due 2016 (the "2016 Notes") and a subsequent redemption of our 2016 Notes not tendered under the tender offer, and to provide additional working capital and for general corporate purposes. We recognized a loss on the tender and redemption of the 2016 Notes totaling $18,233,000, including $4,185,000 in remaining unamortized debt issue costs related to the 2016 Notes. Interest and other financing costs relating to the 2016 Notes totaled $7,664,000 and $27,802,000 for the years ended December 31, 2011 and 2010, respectively.
On February 7, 2012, we completed a registered underwritten offering of an additional $150,000,000 aggregate principal amount of 7.125% senior notes due 2021 (the "new notes") at 102.25% of their principal amount for net proceeds of approximately $150.1 million, excluding accrued interest on the new notes and after deducting fees and expenses payable by us (including underwriting discounts and commissions). The new notes are an additional issue of our outstanding 2021 Notes issued on April 5, 2011. The new notes were issued under the same indenture as the 2021 Notes and are part of the same series of debt securities. We used the net proceeds from the offering of the new notes to repay a portion of the outstanding indebtedness under our revolving credit facility.
Interest and other financing costs related to the 2021 Notes totaled $36,149,000 and $19,548,000 for the years ended December 31, 2012 and 2011. Interest on the 2021 Notes is payable each April 1 and October 1. Costs of issuing the 2021 Notes are being amortized over the term of the 2021 Notes and, as of December 31, 2012, the unamortized portion of debt issue costs totaled $9,600,000.
7.75% Senior Notes Due 2018. In May 2008, we issued $300 million in aggregate principal amount of 7.75% senior unsecured notes due 2018 (the "2018 Notes" and, together with the 2021 Notes, the "Senior Notes") in a private placement.
Interest and other financing costs related to the 2018 Notes totaled $19,882,000 for each of the years ended December 31, 2012, 2011 and 2010, respectively. Interest on the 2018 Notes is payable each June 1 and December 1. Costs of issuing the 2018 Notes are being amortized over the term of the 2018 Notes and, as of December 31, 2012, the unamortized portion of debt issue costs totaled $2,947,000.
General. The Senior Notes are jointly and severally guaranteed by all of our 100% owned subsidiaries (other than CEFC, the co-issuer of the Senior Notes). The subsidiary guarantees rank equally in right of payment with all of our guarantor subsidiaries existing and future senior indebtedness, including their guarantees of our other senior indebtedness. The subsidiary guarantees are effectively subordinated to all of our guarantor subsidiaries' existing and future secured indebtedness (including under our revolving credit facility) to the extent of the value of the assets securing that indebtedness, and all liabilities, including trade payables, of any non-guarantor subsidiaries (other than indebtedness and other liabilities owed to our guarantor subsidiaries).
The Senior Notes are redeemable, in whole or in part and at our option, at stated redemption prices plus accrued and unpaid interest to the redemption date. If we undergo a change in control, we must give the holders of Senior Notes an opportunity to sell us their notes at 101% of the face amount, plus accrued and unpaid interest to date.
The indenture governing the Senior Notes includes customary covenants that limit our and our subsidiary guarantors' ability to, among other things:
F-25
Table of Contents
Note 5 — Long-Term Debt (Continued)
- •
- redeem or repurchase equity or subordinated debt;
- •
- make investments;
- •
- incur or guarantee additional indebtedness or issue preferred units;
- •
- create or incur liens;
- •
- enter into agreements that restrict distributions or other payments from our restricted subsidiaries to us;
- •
- consolidate, merge or transfer all or substantially all of our assets;
- •
- engage in transactions with affiliates;
- •
- create unrestricted subsidiaries; and
- •
- enter into sale and leaseback transactions.
In addition, the indentures governing our Senior Notes restrict our ability to pay cash distributions. Before we can pay a distribution to our unitholders, we must demonstrate that our ratio of EBITDA to fixed charges (as defined in the Senior Notes indentures) is at least 1.75x. At December 31, 2012, our ratio of EBITDA to fixed charges was 3.40x, which is in compliance with this incurrence covenant under the indentures governing our Senior Notes.
These covenants are subject to customary exceptions and qualifications. Additionally, if the Senior Notes achieve an investment grade rating from each of Moody's Investors Service and Standard & Poor's Ratings Services, many of these covenants will terminate.
We are in compliance with the financial covenants under the Senior Notes as of December 31, 2012.
F-26
Table of Contents
Note 5 — Long-Term Debt (Continued)
Condensed consolidating financial information for Copano and its 100% owned subsidiaries is presented below.
| | | | | | | | | | | | | | | | | | | | | | | | | | | | | | | | | | | | | |
| | December 31, 2012 | | December 31, 2011 | |
|---|
| | Parent | | Co-Issuer | | Guarantor
Subsidiaries | | Investment in
Non-Guarantor
Subsidiaries | | Eliminations | | Total | | Parent | | Co-Issuer | | Guarantor
Subsidiaries | | Investment in
Non-Guarantor
Subsidiaries | | Eliminations | | Total | |
|---|
| | (In thousands)
| |
|---|
ASSETS | | | | | | | | | | | | | | | | | | | | | | | | | | | | | | | | | | | | | |
Current assets: | | | | | | | | | | | | | | | | | | | | | | | | | | | | | | | | | | | | | |
Cash and cash equivalents | | $ | 24,750 | | $ | — | | $ | 30,168 | | $ | — | | $ | — | | $ | 54,918 | | $ | 9,064 | | $ | — | | $ | 47,898 | | $ | — | | $ | — | | $ | 56,962 | |
Accounts receivable, net | | | 188 | | | — | | | 126,721 | | | — | | | — | | | 126,909 | | | 2,374 | | | — | | | 116,819 | | | — | | | — | | | 119,193 | |
Intercompany receivable | | | 336,736 | | | (2 | ) | | (336,734 | ) | | — | | | — | | | — | | | 153,059 | | | (1 | ) | | (153,058 | ) | | — | | | — | | | — | |
Risk management assets | | | — | | | — | | | 16,183 | | | — | | | — | | | 16,183 | | | — | | | — | | | 4,322 | | | — | | | — | | | 4,322 | |
Prepayments and other current assets | | | 4,186 | | | — | | | 1,369 | | | — | | | — | | | 5,555 | | | 3,975 | | | — | | | 1,139 | | | — | | | — | | | 5,114 | |
| | | | | | | | | | | | | | | | | | | | | | | | | | |
Total current assets | | | 365,860 | | | (2 | ) | | (162,293 | ) | | — | | | — | | | 203,565 | | | 168,472 | | | (1 | ) | | 17,120 | | | — | | | — | | | 185,591 | |
| | | | | | | | | | | | | | | | | | | | | | | | | | |
Property, plant and equipment, net | | | — | | | — | | | 1,372,509 | | | — | | | — | | | 1,372,509 | | | 16 | | | — | | | 1,103,683 | | | — | | | — | | | 1,103,699 | |
Intangible assets, net | | | — | | | — | | | 162,071 | | | — | | | — | | | 162,071 | | | — | | | — | | | 192,425 | | | — | | | — | | | 192,425 | |
Investments in unconsolidated affiliates | | | — | | | — | | | 431,447 | | | 431,447 | | | (431,447 | ) | | 431,447 | | | — | | | — | | | 544,687 | | | 544,687 | | | (544,687 | ) | | 544,687 | |
Investments in consolidated subsidiaries | | | 1,623,322 | | | — | | | — | | | — | | | (1,623,322 | ) | | — | | | 1,698,260 | | | — | | | — | | | — | | | (1,698,260 | ) | | — | |
Escrow cash | | | — | | | — | | | 1,848 | | | — | | | — | | | 1,848 | | | — | | | — | | | 1,848 | | | — | | | — | | | 1,848 | |
Risk management assets | | | — | | | — | | | 1,881 | | | — | | | — | | | 1,881 | | | — | | | — | | | 6,452 | | | — | | | — | | | 6,452 | |
Other assets, net | | | 20,542 | | | — | | | 6,301 | | | — | | | — | | | 26,843 | | | 21,136 | | | — | | | 8,759 | | | — | | | — | | | 29,895 | |
| | | | | | | | | | | | | | | | | | | | | | | | | | |
Total assets | | $ | 2,009,724 | | $ | (2 | ) | $ | 1,813,764 | | $ | 431,447 | | $ | (2,054,769 | ) | $ | 2,200,164 | | $ | 1,887,884 | | $ | (1 | ) | $ | 1,874,974 | | $ | 544,687 | | $ | (2,242,947 | ) | $ | 2,064,597 | |
| | | | | | | | | | | | | | | | | | | | | | | | | | |
LIABILITIES AND MEMBERS'/PARTNERS' CAPITAL
|
|
Current liabilities: | | | | | | | | | | | | | | | | | | | | | | | | | | | | | | | | | | | | | |
Accounts payable | | $ | 888 | | $ | — | | $ | 161,259 | | $ | — | | $ | — | | $ | 162,147 | | $ | 31 | | $ | — | | $ | 155,890 | | $ | — | | $ | — | | $ | 155,921 | |
Accrued capital expenditures | | | — | | | — | | | 11,306 | | | — | | | — | | | 11,306 | | | — | | | — | | | 7,033 | | | — | | | — | | | 7,033 | |
Accrued interest | | | 11,089 | | | — | | | — | | | — | | | — | | | 11,089 | | | 8,686 | | | — | | | — | | | — | | | — | | | 8,686 | |
Accrued tax liability | | | 1,551 | | | — | | | — | | | — | | | — | | | 1,551 | | | 1,182 | | | — | | | — | | | — | | | — | | | 1,182 | |
Risk management liabilities | | | — | | | — | | | — | | | — | | | — | | | — | | | — | | | — | | | 3,565 | | | — | | | — | | | 3,565 | |
Other current liabilities | | | 8,598 | | | — | | | 11,436 | | | — | | | — | | | 20,034 | | | 6,809 | | | — | | | 8,198 | | | — | | | — | | | 15,007 | |
| | | | | | | | | | | | | | | | | | | | | | | | | | |
Total current liabilities | | | 22,126 | | | — | | | 184,001 | | | — | | | — | | | 206,127 | | | 16,708 | | | — | | | 174,686 | | | — | | | — | | | 191,394 | |
| | | | | | | | | | | | | | | | | | | | | | | | | | |
Long-term debt | | | 1,001,649 | | | — | | | — | | | — | | | — | | | 1,001,649 | | | 994,525 | | | — | | | — | | | — | | | — | | | 994,525 | |
Deferred tax liability | | | 2,390 | | | — | | | 104 | | | — | | | — | | | 2,494 | | | 2,119 | | | — | | | 80 | | | — | | | — | | | 2,199 | |
Risk management and other noncurrent liabilities | | | 3,283 | | | — | | | 6,335 | | | — | | | — | | | 9,618 | | | 2,634 | | | — | | | 1,947 | | | — | | | — | | | 4,581 | |
Members'/Partners' capital: | | | | | | | | | | | | | | | | | | | | | | | | | | | | | | | | | | | | | |
Series A convertible preferred units | | | 285,168 | | | — | | | — | | | — | | | — | | | 285,168 | | | 285,168 | | | — | | | — | | | — | | | — | | | 285,168 | |
Common units | | | 1,555,468 | | | — | | | — | | | — | | | — | | | 1,555,468 | | | 1,164,853 | | | — | | | — | | | — | | | — | | | 1,164,853 | |
Paid-in capital | | | 72,916 | | | 1 | | | 1,171,240 | | | 711,611 | | | (1,882,852 | ) | | 72,916 | | | 62,277 | | | 1 | | | 1,208,051 | | | 687,763 | | | (1,895,815 | ) | | 62,277 | |
Accumulated (deficit) earnings | | | (935,482 | ) | | (3 | ) | | 449,878 | | | (280,164 | ) | | (169,711 | ) | | (935,482 | ) | | (624,121 | ) | | (2 | ) | | 506,489 | | | (143,076 | ) | | (363,411 | ) | | (624,121 | ) |
Accumulated other comprehensive (loss) income | | | 2,206 | | | — | | | 2,206 | | | — | | | (2,206 | ) | | 2,206 | | | (16,279 | ) | | — | | | (16,279 | ) | | — | | | 16,279 | | | (16,279 | ) |
| | | | | | | | | | | | | | | | | | | | | | | | | | |
| | | 980,276 | | | (2 | ) | | 1,623,324 | | | 431,447 | | | (2,054,769 | ) | | 980,276 | | | 871,898 | | | (1 | ) | | 1,698,261 | | | 544,687 | | | (2,242,947 | ) | | 871,898 | |
| | | | | | | | | | | | | | | | | | | | | | | | | | |
Total liabilities and members'/partners' capital | | $ | 2,009,724 | | $ | (2 | ) | $ | 1,813,764 | | $ | 431,447 | | $ | (2,054,769 | ) | $ | 2,200,164 | | $ | 1,887,884 | | $ | (1 | ) | $ | 1,874,974 | | $ | 544,687 | | $ | (2,242,947 | ) | $ | 2,064,597 | |
| | | | | | | | | | | | | | | | | | | | | | | | | | |
F-27
Table of Contents
Note 5 — Long-Term Debt (Continued)
| | | | | | | | | | | | | | | | | | | | | | | | | | | | | | | | | | | | | |
| | Year Ended December 31, 2012 | | Year Ended December 31, 2011 | |
|---|
| | Parent | | Co-Issuer | | Guarantor
Subsidiaries | | Investment in
Non-Guarantor
Subsidiaries | | Eliminations | | Total | | Parent | | Co-Issuer | | Guarantor
Subsidiaries | | Investment in
Non-Guarantor
Subsidiaries | | Eliminations | | Total | |
|---|
| | (In thousands)
| |
|---|
Revenue: | | | | | | | | | | | | | | | | | | | | | | | | | | | | | | | | | | | | | |
Natural gas sales | | $ | — | | $ | — | | $ | 360,340 | | $ | — | | $ | — | | $ | 360,340 | | $ | — | | $ | — | | $ | 452,726 | | $ | — | | $ | — | | $ | 452,726 | |
Natural gas liquids sales | | | — | | | — | | | 814,916 | | | — | | | — | | | 814,916 | | | — | | | — | | | 723,063 | | | — | | | — | | | 723,063 | |
Transportation, compression and processing fees | | | — | | | — | | | 192,270 | | | — | | | — | | | 192,270 | | | — | | | — | | | 121,631 | | | — | | | — | | | 121,631 | |
Condensate and other | | | — | | | — | | | 50,194 | | | — | | | — | | | 50,194 | | | — | | | — | | | 47,803 | | | — | | | — | | | 47,803 | |
| | | | | | | | | | | | | | | | | | | | | | | | | | |
Total revenue | | | — | | | — | | | 1,417,720 | | | — | | | — | | | 1,417,720 | | | — | | | — | | | 1,345,223 | | | — | | | — | | | 1,345,223 | |
| | | | | | | | | | | | | | | | | | | | | | | | | | |
Costs and expenses: | | | | | | | | | | | | | | | | | | | | | | | | | | | | | | | | | | | | | |
Cost of natural gas and natural gas liquids(1) | | | — | | | — | | | 1,105,415 | | | — | | | — | | | 1,105,415 | | | — | | | — | | | 1,068,423 | | | — | | | — | | | 1,068,423 | |
Transportation(1) | | | — | | | — | | | 25,199 | | | — | | | — | | | 25,199 | | | — | | | — | | | 24,225 | | | — | | | — | | | 24,225 | |
Operations and maintenance | | | — | | | — | | | 77,943 | | | — | | | — | | | 77,943 | | | — | | | — | | | 65,326 | | | — | | | — | | | 65,326 | |
Depreciation and amortization | | | 16 | | | — | | | 77,088 | | | — | | | — | | | 77,104 | | | 40 | | | — | | | 69,116 | | | — | | | — | | | 69,156 | |
Impairment | | | — | | | — | | | 29,486 | | | — | | | — | | | 29,486 | | | — | | | — | | | 8,409 | | | — | | | — | | | 8,409 | |
General and administrative | | | 27,601 | | | — | | | 23,047 | | | — | | | — | | | 50,648 | | | 24,780 | | | — | | | 23,900 | | | — | | | — | | | 48,680 | |
Taxes other than income | | | — | | | — | | | 7,392 | | | — | | | — | | | 7,392 | | | — | | | — | | | 5,130 | | | — | | | — | | | 5,130 | |
Equity in loss (earnings) from unconsolidated affiliates | | | — | | | — | | | 137,088 | | | 137,088 | | | (137,088 | ) | | 137,088 | | | — | | | — | | | 145,324 | | | 145,324 | | | (145,324 | ) | | 145,324 | |
Gain on sale of operating assets | | | — | | | — | | | (9,941 | ) | | — | | | — | | | (9,941 | ) | | — | | | — | | | — | | | — | | | — | | | — | |
| | | | | | | | | | | | | | | | | | | | | | | | | | |
Total costs and expenses | | | 27,617 | | | — | | | 1,472,717 | | | 137,088 | | | (137,088 | ) | | 1,500,334 | | | 24,820 | | | — | | | 1,409,853 | | | 145,324 | | | (145,324 | ) | | 1,434,673 | |
| | | | | | | | | | | | | | | | | | | | | | | | | | |
Operating (loss) income | | | (27,617 | ) | | — | | | (54,997 | ) | | (137,088 | ) | | 137,088 | | | (82,614 | ) | | (24,820 | ) | | — | | | (64,630 | ) | | (145,324 | ) | | 145,324 | | | (89,450 | ) |
Other income (expense): | | | | | | | | | | | | | | | | | | | | | | | | | | | | | | | | | | | | | |
Interest and other income | | | — | | | — | | | 586 | | | — | | | — | | | 586 | | | — | | | — | | | 60 | | | — | | | — | | | 60 | |
Loss of refinancing of unsecured debt | | | — | | | — | | | — | | | — | | | — | | | — | | | (18,233 | ) | | — | | | — | | | — | | | — | | | (18,233 | ) |
Interest and other financing costs | | | (54,988 | ) | | — | | | (276 | ) | | — | | | — | | | (55,264 | ) | | (46,306 | ) | | — | | | (881 | ) | | — | | | — | | | (47,187 | ) |
| | | | | | | | | | | | | | | | | | | | | | | | | | |
(Loss) income before income taxes and equity in (loss) earnings from consolidated subsidiaries | | | (82,605 | ) | | — | | | (54,687 | ) | | (137,088 | ) | | 137,088 | | | (137,292 | ) | | (89,359 | ) | | — | | | (65,451 | ) | | (145,324 | ) | | 145,324 | | | (154,810 | ) |
Provision for income taxes | | | (1,654 | ) | | — | | | (24 | ) | | — | | | — | | | (1,678 | ) | | (1,453 | ) | | — | | | (49 | ) | | — | | | — | | | (1,502 | ) |
| | | | | | | | | | | | | | | | | | | | | | | | | | |
Loss (income) before equity (loss) earnings from consolidated subsidiaries | | | (84,259 | ) | | — | | | (54,711 | ) | | (137,088 | ) | | 137,088 | | | (138,970 | ) | | (90,812 | ) | | — | | | (65,500 | ) | | (145,324 | ) | | 145,324 | | | (156,312 | ) |
Equity in (loss) earnings from consolidated subsidiaries | | | (54,711 | ) | | — | | | — | | | — | | | 54,711 | | | — | | | (65,500 | ) | | — | | | — | | | — | | | 65,500 | | | — | |
| | | | | | | | | | | | | | | | | | | | | | | | | | |
Net (loss) income | | | (138,970 | ) | | — | | | (54,711 | ) | | (137,088 | ) | | 191,799 | | | (138,970 | ) | | (156,312 | ) | | — | | | (65,500 | ) | | (145,324 | ) | | 210,824 | | | (156,312 | ) |
Preferred unit distributions | | | (36,117 | ) | | — | | | — | | | — | | | — | | | (36,117 | ) | | (32,721 | ) | | — | | | — | | | — | | | — | | | (32,721 | ) |
| | | | | | | | | | | | | | | | | | | | | | | | | | |
Net (loss) income to common units | | $ | (175,087 | ) | $ | — | | $ | (54,711 | ) | $ | (137,088 | ) | $ | 191,799 | | $ | (175,087 | ) | $ | (189,033 | ) | $ | — | | $ | (65,500 | ) | $ | (145,324 | ) | $ | 210,824 | | $ | (189,033 | ) |
| | | | | | | | | | | | | | | | | | | | | | | | | | |
Net (loss) income | | $ | (138,970 | ) | $ | — | | $ | (54,711 | ) | $ | (137,088 | ) | $ | 191,799 | | $ | (138,970 | ) | $ | (156,312 | ) | $ | — | | $ | (65,500 | ) | $ | (145,324 | ) | $ | 210,824 | | $ | (156,312 | ) |
Derivative settlements reclassified to income | | | 7,539 | | | — | | | 7,539 | | | — | | | (7,539 | ) | | 7,539 | | | 36,605 | | | — | | | 36,605 | | | — | | | (36,605 | ) | | 36,605 | |
Unrealized gain/(loss)-change in fair value of derivatives | | | 10,946 | | | — | | | 10,946 | | | — | | | (10,946 | ) | | 10,946 | | | (22,528 | ) | | — | | | (22,528 | ) | | — | | | 22,528 | | | (22,528 | ) |
| | | | | | | | | | | | | | | | | | | | | | | | | | |
Total other comprehensive income (loss) | | | 18,485 | | | — | | | 18,485 | | | — | | | (18,485 | ) | | 18,485 | | | 14,077 | | | — | | | 14,077 | | | — | | | (14,077 | ) | | 14,077 | |
| | | | | | | | | | | | | | | | | | | | | | | | | | |
Comprehensive (loss) income | | $ | (120,485 | ) | $ | — | | $ | (36,226 | ) | $ | (137,088 | ) | $ | 173,314 | | $ | (120,485 | ) | $ | (142,235 | ) | $ | — | | $ | (51,423 | ) | $ | (145,324 | ) | $ | 196,747 | | $ | (142,235 | ) |
| | | | | | | | | | | | | | | | | | | | | | | | | | |
- (1)
- Exclusive of operations and maintenance and depreciation and amortization and Impairment shown separately below.
F-28
Table of Contents
Note 5 — Long-Term Debt (Continued)
| | | | | | | | | | | | | | | | | | | |
| | Year Ended December 31, 2010 | |
|---|
| | Parent | | Co-Issuer | | Guarantor
Subsidiaries | | Investment in
Non-Guarantor
Subsidiaries | | Eliminations | | Total | |
|---|
| | (In thousands)
| |
|---|
Revenue: | | | | | | | | | | | | | | | | | | | |
Natural gas sales | | $ | — | | $ | — | | $ | 381,453 | | $ | — | | $ | — | | $ | 381,453 | |
Natural gas liquids sales | | | — | | | — | | | 490,980 | | | — | | | — | | | 490,980 | |
Transportation, compression and processing fees | | | — | | | — | | | 68,398 | | | — | | | — | | | 68,398 | |
Condensate and other | | | — | | | — | | | 54,333 | | | — | | | — | | | 54,333 | |
| | | | | | | | | | | | | | |
Total revenue | | | — | | | — | | | 995,164 | | | — | | | — | | | 995,164 | |
| | | | | | | | | | | | | | |
Costs and expenses: | | | | | | | | | | | | | | | | | | | |
Cost of natural gas and natural gas liquids(1) | | | — | | | — | | | 745,074 | | | — | | | — | | | 745,074 | |
Transportation(1) | | | — | | | — | | | 22,701 | | | — | | | — | | | 22,701 | |
Operations and maintenance | | | — | | | — | | | 53,487 | | | — | | | — | | | 53,487 | |
Depreciation and amortization | | | 40 | | | — | | | 62,532 | | | — | | | — | | | 62,572 | |
General and administrative | | | 19,536 | | | — | | | 20,811 | | | — | | | — | | | 40,347 | |
Taxes other than income | | | — | | | — | | | 4,726 | | | — | | | — | | | 4,726 | |
Equity in loss (earnings) from unconsolidated affiliates | | | — | | | — | | | 20,480 | | | 20,480 | | | (20,480 | ) | | 20,480 | |
| | | | | | | | | | | | | | |
Total costs and expenses | | | 19,576 | | | — | | | 929,811 | | | 20,480 | | | (20,480 | ) | | 949,387 | |
| | | | | | | | | | | | | | |
Operating (loss) income | | | (19,576 | ) | | — | | | 65,353 | | | (20,480 | ) | | 20,480 | | | 45,777 | |
Other income (expense): | | | | | | | | | | | | | | | | | | | |
Interest and other income | | | — | | | — | | | 78 | | | — | | | — | | | 78 | |
Interest and other financing costs | | | (50,054 | ) | | — | | | (3,551 | ) | | — | | | — | | | (53,605 | ) |
| | | | | | | | | | | | | | |
(Loss) income before income taxes, discontinued operations and equity in earnings (loss) from consolidated subsidiaries | | | (69,630 | ) | | — | | | 61,880 | | | (20,480 | ) | | 20,480 | | | (7,750 | ) |
Provision for income taxes | | | (896 | ) | | — | | | (35 | ) | | — | | | — | | | (931 | ) |
| | | | | | | | | | | | | | |
(Loss) income before equity earnings from consolidated subsidiaries | | | (70,526 | ) | | — | | | 61,845 | | | (20,480 | ) | | 20,480 | | | (8,681 | ) |
Equity in earnings (loss) from consolidated subsidiaries | | | 61,845 | | | — | | | — | | | — | | | (61,845 | ) | | — | |
| | | | | | | | | | | | | | |
Net income (loss) | | | (8,681 | ) | | — | | | 61,845 | | | (20,480 | ) | | (41,365 | ) | | (8,681 | ) |
Preferred unit distributions | | | (15,188 | ) | | — | | | — | | | — | | | — | | | (15,188 | ) |
| | | | | | | | | | | | | | |
Net (loss) income to common units | | $ | (23,869 | ) | $ | — | | $ | 61,845 | | $ | (20,480 | ) | $ | (41,365 | ) | $ | (23,869 | ) |
| | | | | | | | | | | | | | |
Net (loss) income | | $ | (8,681 | ) | $ | — | | $ | 61,845 | | $ | (20,480 | ) | $ | (41,365 | ) | $ | (8,681 | ) |
Other comprehensive (loss) income: | | | | | | | | | | | | | | | | | | | |
Derivative settlements reclassified to income | | | (2,671 | ) | | — | | | (2,671 | ) | | — | | | 2,671 | | | (2,671 | ) |
Unrealized gain-change in fair value of derivatives | | | (11,502 | ) | | — | | | (11,502 | ) | | — | | | 11,502 | | | (11,502 | ) |
| | | | | | | | | | | | | | |
Total other comprehensive (loss) income | | | (14,173 | ) | | — | | | (14,173 | ) | | — | | | 14,173 | | | (14,173 | ) |
| | | | | | | | | | | | | | |
Comprehensive (loss) income | | $ | (22,854 | ) | $ | — | | $ | 47,672 | | $ | (20,480 | ) | $ | (27,192 | ) | $ | (22,854 | ) |
| | | | | | | | | | | | | | |
- (1)
- Exclusive of operations and maintenance and depreciation and amortization shown separately below.
F-29
Table of Contents
Note 5 — Long-Term Debt (Continued)
| | | | | | | | | | | | | | | | | | | | | | | | | | | | | | | | | | | | | |
| | Year Ended December 31, 2012 | | Year Ended December 31, 2011 | |
|---|
| | Parent | | Co-Issuer | | Guarantor
Subsidiaries | | Investment in
Non-Guarantor
Subsidiaries | | Eliminations | | Total | | Parent | | Co-Issuer | | Guarantor
Subsidiaries | | Investment in
Non-Guarantor
Subsidiaries | | Eliminations | | Total | |
|---|
| | (In thousands)
| |
|---|
Cash Flows From Operating Activities: | | | | | | | | | | | | | | | | | | | | | | | | | | | | | | | | | | | | | |
Net cash (used in) provided by operating activities | | $ | (230,075 | ) | $ | — | | $ | 378,900 | | $ | 43,031 | | $ | (43,031 | ) | $ | 148,825 | | $ | (178,178 | ) | $ | — | | $ | 329,410 | | $ | 31,623 | | $ | (31,623 | ) | $ | 151,232 | |
| | | | | | | | | | | | | | | | | | | | | | | | | | |
Cash Flows From Investing Activities: | | | | | | | | | | | | | | | | | | | | | | | | | | | | | | | | | | | | | |
Additions to property, plant and equipment and intangibles | | | — | | | — | | | (332,640 | ) | | — | | | — | | | (332,640 | ) | | — | | | — | | | (239,627 | ) | | — | | | — | | | (239,627 | ) |
Acquisitions | | | — | | | — | | | — | | | — | | | — | | | — | | | — | | | — | | | (16,084 | ) | | — | | | — | | | (16,084 | ) |
Investments in unconsolidated affiliates | | | — | | | — | | | (72,313 | ) | | (72,313 | ) | | 72,313 | | | (72,313 | ) | | — | | | — | | | (121,967 | ) | | (121,967 | ) | | 121,967 | | | (121,967 | ) |
Distributions from unconsolidated affiliates | | | — | | | — | | | 4,443 | | | 4,443 | | | (4,443 | ) | | 4,443 | | | — | | | — | | | 3,848 | | | 3,848 | | | (3,848 | ) | | 3,848 | |
Investments in consolidated affiliates | | | (69,127 | ) | | — | | | — | | | — | | | 69,127 | | | — | | | (114,979 | ) | | — | | | — | | | — | | | 114,979 | | | — | |
Distributions from consolidated affiliates | | | 91,863 | | | — | | | — | | | — | | | (91,863 | ) | | — | | | 70,457 | | | — | | | — | | | — | | | (70,457 | ) | | — | |
Proceeds from sale of assets | | | — | | | — | | | 24,124 | | | — | | | — | | | 24,124 | | | — | | | — | | | 260 | | | — | | | — | | | 260 | |
Other | | | — | | | — | | | 2,492 | | | — | | | — | | | 2,492 | | | — | | | — | | | (2,744 | ) | | — | | | — | | | (2,744 | ) |
| | | | | | | | | | | | | | | | | | | | | | | | | | |
Net cash provided by (used in) investing activities | | | 22,736 | | | — | | | (373,894 | ) | | (67,870 | ) | | 45,134 | | | (373,894 | ) | | (44,522 | ) | | — | | | (376,314 | ) | | (118,119 | ) | | 162,641 | | | (376,314 | ) |
| | | | | | | | | | | | | | | | | | | | | | | | | | |
Cash Flows From Financing Activities: | | | | | | | | | | | | | | | | | | | | | | | | | | | | | | | | | | | | | |
Proceeds from long-term debt | | | 530,375 | | | — | | | — | | | — | | | — | | | 530,375 | | | 825,000 | | | — | | | — | | | — | | | — | | | 825,000 | |
Repayments of long-term debt | | | (523,000 | ) | | — | | | — | | | — | | | — | | | (523,000 | ) | | (422,665 | ) | | — | | | — | | | — | | | — | | | (422,665 | ) |
Deferred financing costs | | | (3,540 | ) | | — | | | — | | | — | | | — | | | (3,540 | ) | | (15,783 | ) | | — | | | — | | | — | | | — | | | (15,783 | ) |
Payments of premiums and expenses on redemption of unsecured debt | | | — | | | — | | | — | | | — | | | — | | | — | | | (14,572 | ) | | — | | | — | | | — | | | — | | | (14,572 | ) |
Distributions to unitholders | | | (171,586 | ) | | — | | | — | | | — | | | — | | | (171,586 | ) | | (153,062 | ) | | — | | | — | | | — | | | — | | | (153,062 | ) |
Proceeds from public offering of common units | | | 405,355 | | | — | | | — | | | — | | | — | | | 405,355 | | | — | | | — | | | — | | | — | | | — | | | — | |
Equity offering costs | | | (15,910 | ) | | — | | | — | | | — | | | — | | | (15,910 | ) | | (5 | ) | | — | | | — | | | — | | | — | | | (5 | ) |
Contributions from parent | | | — | | | — | | | 69,127 | | | — | | | (69,127 | ) | | — | | | — | | | — | | | 114,979 | | | — | | | (114,979 | ) | | — | |
Distributions to parent | | | — | | | — | | | (91,863 | ) | | — | | | 91,863 | | | — | | | — | | | — | | | (70,457 | ) | | — | | | 70,457 | | | — | |
Other | | | 1,331 | | | — | | | — | | | 72,313 | | | (72,313 | ) | | 1,331 | | | 3,201 | | | — | | | — | | | 121,967 | | | (121,967 | ) | | 3,201 | |
| | | | | | | | | | | | | | | | | | | | | | | | | | |
Net cash provided by (used in) financing activities | | | 223,025 | | | — | | | (22,736 | ) | | 72,313 | | | (49,577 | ) | | 223,025 | | | 222,114 | | | — | | | 44,522 | | | 121,967 | | | (166,489 | ) | | 222,114 | |
| | | | | | | | | | | | | | | | | | | | | | | | | | |
Net increase (decrease) in cash and cash equivalents | | | 15,686 | | | — | | | (17,730 | ) | | 47,474 | | | (47,474 | ) | | (2,044 | ) | | (586 | ) | | — | | | (2,382 | ) | | 35,471 | | | (35,471 | ) | | (2,968 | ) |
Cash and cash equivalents, beginning of year | | | 9,064 | | | — | | | 47,898 | | | 121,322 | | | (121,322 | ) | | 56,962 | | | 9,650 | | | — | | | 50,280 | | | 85,851 | | | (85,851 | ) | | 59,930 | |
| | | | | | | | | | | | | | | | | | | | | | | | | | |
Cash and cash equivalents, end of year | | $ | 24,750 | | $ | — | | $ | 30,168 | | $ | 168,796 | | $ | (168,796 | ) | $ | 54,918 | | $ | 9,064 | | $ | — | | $ | 47,898 | | $ | 121,322 | | $ | (121,322 | ) | $ | 56,962 | |
| | | | | | | | | | | | | | | | | | | | | | | | | | |
F-30
Table of Contents
Note 5 — Long-Term Debt (Continued)
| | | | | | | | | | | | | | | | | | | |
| | Year Ended December 31, 2010 | |
|---|
| | Parent | | Co-Issuer | | Guarantor
Subsidiaries | | Investment in
Non-Guarantor
Subsidiaries | | Eliminations | | Total | |
|---|
| | (In thousands)
| |
|---|
Cash Flows From Operating Activities: | | | | | | | | | | | | | | | | | | | |
Net cash (used in) provided by operating activities | | $ | (75,621 | ) | $ | — | | $ | 199,219 | | $ | 22,416 | | $ | (22,416 | ) | $ | 123,598 | |
| | | | | | | | | | | | | | |
Cash Flows From Investing Activities: | | | | | | | | | | | | | | | | | | | |
Additions to property, plant and equipment and intangibles | | | — | | | — | | | (127,703 | ) | | — | | | — | | | (127,703 | ) |
Acquisitions | | | — | | | — | | | — | | | — | | | — | | | — | |
Investments in unconsolidated affiliates | | | — | | | — | | | (33,002 | ) | | (33,002 | ) | | 33,002 | | | (33,002 | ) |
Distributions from unconsolidated affiliates | | | — | | | — | | | 3,539 | | | 3,539 | | | (3,539 | ) | | 3,539 | |
Investments in consolidated affiliates | | | (82,415 | ) | | — | | | — | | | — | | | 82,415 | | | — | |
Distributions from consolidated affiliates | | | 115,455 | | | — | | | — | | | — | | | (115,455 | ) | | — | |
Proceeds from sale of assets | | | — | | | — | | | 447 | | | — | | | — | | | 447 | |
Other | | | — | | | — | | | (11 | ) | | — | | | — | | | (11 | ) |
| | | | | | | | | | | | | | |
Net cash provided by (used in) investing activities | | | 33,040 | | | — | | | (156,730 | ) | | (29,463 | ) | | (3,577 | ) | | (156,730 | ) |
| | | | | | | | | | | | | | |
Cash Flows From Financing Activities: | | | | | | | | | | | | | | | | | | | |
Proceeds from long-term debt | | | 100,000 | | | — | | | — | | | — | | | — | | | 100,000 | |
Repayments of long-term debt | | | (360,000 | ) | | — | | | — | | | — | | | — | | | (360,000 | ) |
Deferred financing costs | | | (995 | ) | | — | | | — | | | — | | | — | | | (995 | ) |
Distributions to unitholders | | | (145,531 | ) | | — | | | — | | | — | | | — | | | (145,531 | ) |
Proceeds from public offering of common units | | | 164,786 | | | — | | | — | | | — | | | — | | | 164,786 | |
Equity offering of common units-offering costs | | | (6,395 | ) | | — | | | — | | | — | | | — | | | (6,395 | ) |
Equity offering of Series A convertible preferred units-offering costs | | | 291,065 | | | — | | | — | | | — | | | — | | | 291,065 | |
Contributions from parent | | | — | | | — | | | 82,415 | | | — | | | (82,415 | ) | | — | |
Distributions to parent | | | — | | | — | | | (115,455 | ) | | — | | | 115,455 | | | — | |
Other | | | 5,440 | | | — | | | — | | | 33,002 | | | (33,002 | ) | | 5,440 | |
| | | | | | | | | | | | | | |
Net cash provided by (used in) financing activities | | | 48,370 | | | — | | | (33,040 | ) | | 33,002 | | | 38 | | | 48,370 | |
| | | | | | | | | | | | | | |
Net increase (decrease) in cash and cash equivalents | | | 5,789 | | | — | | | 9,449 | | | 25,955 | | | (25,955 | ) | | 15,238 | |
Cash and cash equivalents, beginning of year | | | 3,861 | | | — | | | 40,831 | | | 59,896 | | | (59,896 | ) | | 44,692 | |
| | | | | | | | | | | | | | |
Cash and cash equivalents, end of year | | $ | 9,650 | | $ | — | | $ | 50,280 | | $ | 85,851 | | $ | (85,851 | ) | $ | 59,930 | |
| | | | | | | | | | | | | | |
F-31
Table of Contents
Note 5 — Long-Term Debt (Continued)
Scheduled maturities of long-term debt as of December 31, 2012 were as follows (in thousands):
| | | | |
Year | | Principal
Amount | |
|---|
2012 | | $ | — | |
2013 | | | — | |
2014 | | | — | |
2015 | | | — | |
2016 | | | 239,000 | |
Thereafter | | | 759,525 | |
| | | | |
| | $ | 998,525 | |
| | | | |
Note 6 — Members' Capital and Distributions
On July 21, 2010, we issued 10,327,022 Series A convertible preferred units ("Series A preferred units") in a private placement to TPG Copenhagen, L.P. ("TPG"), an affiliate of TPG Capital, L.P., for gross proceeds of $300 million. The preferred units were priced at $29.05 per unit, a 10% premium to the 30-day volume-weighted average closing price of our common units on July 19, 2010, two trading days before the date we issued the preferred units. We used $180.0 million of the net proceeds to repay the then-outstanding balance under our revolving credit facility. We used the remaining net proceeds to fund our expansion strategy in the Eagle Ford Shale play and other growth initiatives in Texas and Oklahoma.
The Series A preferred units are classified as permanent equity, as they do not meet the criteria of a liability within the scope of ASC 480-10,"Distinguishing Liabilities from Equity," nor do they meet the criteria of the mezzanine level under ASC 815,"Accounting for Derivative Instruments and Hedging Activities." Additionally, none of the identified embedded derivatives relating to the terms of the Series A preferred units requires bifurcation, as each embedded derivative was determined to be clearly and closely related to the host contract of the Series A preferred units under ASC 815-15,"Embedded Derivatives." As discussed below, the distribution payment under the terms of the Series A preferred units is not discretionary during the first three years and, therefore, the commitment date was determined to be the date of original issuance under ASC 470-20-30,"Debt With Conversions and Other Options." Further, the change of control provision under the agreement does not preclude the establishment of a commitment date, as it is outside the control of Copano and the Series A preferred unitholder.
Distributions. The Series A preferred units are senior to our common units with respect to rights to distributions. For the first three years after the date on which they were issued, the Series A preferred units are entitled to quarterly distributions in kind (paid in the form of additional Series A preferred units). In-kind distributions equal $0.72625 per preferred unit per quarter (or 10% per year of the purchase price of a Series A preferred unit) divided by the $29.05 issue price. Beginning with the distribution for the quarter ending September 30, 2013 and through the distribution for the quarter ending June 30, 2016, we are entitled to elect whether to pay preferred distributions in cash, in kind or in a combination of both. For quarters ending after June 30, 2016, we will be obligated to pay preferred distributions in cash unless our available cash (after reserves established by our Board of Directors) is not sufficient to fund the distribution or we and the preferred unitholder agree that a distribution will be paid in kind. Cash distributions on the Series A preferred units will equal the greater of $0.72625 per preferred unit per quarter or the quarterly per-unit distribution paid to our common unitholders for the applicable quarter.
F-32
Table of Contents
Note 6 — Members' Capital and Distributions (Continued)
In-kind distributions for the years ended December 31, 2012, 2011 and 2010 totaled $36,117,000, $32,721,000 and $15,118,000, respectively.
The following table summarizes the quarterly distributions in kind (paid in the form of additional Series A convertible preferred units):
| | | | | | | | | |
Quarter Ending | | Series A
Preferred Units Issued
As In-Kind Distributions | | Issue Date | | Amount | |
|---|
September 30, 2010 | | | 258,175 | | November 11, 2010 | | $ | 7,500,000 | |
December 31, 2010 | | | 264,629 | | February 11, 2011 | | | 7,688,000 | |
March 31, 2011 | | | 271,245 | | May 12, 2011 | | | 7,880,000 | |
June 30, 2011 | | | 278,026 | | August 11, 2011 | | | 8,076,000 | |
September 30, 2011 | | | 284,977 | | November 10, 2011 | | | 8,279,000 | |
December 31, 2011 | | | 292,101 | | February 9, 2012 | | | 8,486,000 | |
March 31, 2012 | | | 299,404 | | May 10, 2012 | | | 8,698,000 | |
June 30, 2012 | | | 306,889 | | August 9, 2012 | | | 8,915,000 | |
September 30, 2012 | | | 314,561 | | November 8, 2012 | | | 9,138,000 | |
December 31, 2012 | | | 322,425 | | February 1, 2013 | | | 9,366,000 | |
Voting Rights. At a special meeting held on November 17, 2010, our common unitholders approved full voting rights for all Series A preferred units on an as converted basis. Except in connection with a change of control as described below, each Series A preferred unit entitles the holder to one vote.
Conversion. At the special meeting referred to above, our common unitholders also approved full convertibility of all Series A preferred units into common units on a one-for-one basis. Beginning on July 21, 2013, the Series A preferred units will generally become convertible into common units by us or by the preferred unitholder, subject to the conditions described below. After July 21, 2013, the preferred unitholder may elect to convert all or any portion of its Series A preferred units into common units at any time, but only to the extent that conversion will not cause our estimated ratio of total distributable cash flow to per-unit distributions (for all of our outstanding common and Series A preferred units) to fall below 100% over any of the forecasted succeeding four quarters. In addition, we will have the right to force conversion of all or any portion of the Series A preferred units if the daily volume-weighted average trading price and the average daily trading volume of our common units exceed $37.77 and 500,000 units, respectively, for 20 trading days out of the trailing 30-day period prior to our notice of conversion. On the date of conversion, the rights of the converting Series A preferred units will cease; the converting Series A preferred units will no longer be outstanding and will represent only the right to receive common units at the rate of one common unit for each preferred unit.
Rights upon a Change of Control. The preferred unitholder has conversion rights with respect to certain change of control events. Before consummating a transaction in which any person, other than the preferred unitholder, becomes the beneficial owner, directly or indirectly, of more than 50% of our voting securities, we will make an irrevocable offer (a "change of control offer") to the preferred unitholder to convert all, but not less than all, of such holder's Series A preferred units into common units, subject to certain conditions and limitations. Series A preferred units converting in the context of a change of control offer would not convert into common units on a one-for-one basis. Instead, the number of common units we would issue upon conversion of Series A preferred units would equal the quotient of (a) 110% of the aggregate preferred unit issue price for such preferred unitholder's converting Series A preferred units and all accrued and unpaid distributions on such Series A preferred units as of the date of the change of control offer, divided by (b) $29.05. The preferred unitholder is under no obligation to accept a change of
F-33
Table of Contents
Note 6 — Members' Capital and Distributions (Continued)
control offer. If the preferred unitholder elects not to accept, we will be obligated to ensure that the preferred unitholder receives securities in the change of control transaction with terms substantially equivalent to the terms of the preferred units.
Dissolution and Liquidation. The Series A preferred units are senior to our common units with respect to rights on dissolution and liquidation. Common units issued upon conversion of Series A preferred units will rank equally with the rest of our common units with respect to rights on dissolution and liquidation.
TPG Voting Agreement and Election to Convert Series A Preferred Units. Simultaneously with the execution of our merger agreement with Kinder Morgan (discussed in Note 15), we, Kinder Morgan and TPG entered into a voting agreement pursuant to which TPG agreed, among other things, to vote all of its Series A preferred units (and common units, if any) in favor of adoption of the merger agreement. TPG also agreed not to sell, transfer, pledge or otherwise dispose of any of its Series A preferred units or common units. On February 8, 2013, in accordance with the terms of our limited liability company agreement and following its receipt of our change of control offer, TPG notified us of its election, subject to the conditions set forth in the voting agreement, to have all of its Series A preferred units converted into common units immediately prior to the effective time of the merger. Under our limited liability company agreement and the voting agreement, the Series A preferred units will be convertible, effective immediately prior to the merger, into a number of Copano common units equal to 110% of the number of Series A preferred units then outstanding. In accordance with our limited liability company agreement, the Series A preferred units outstanding on the record date for the special meeting of unitholders relating to the merger will have that number of votes equal to the number of common units into which such Series A preferred units will convert immediately prior to the merger.
In March 2010, we issued 7,446,250 common units in an underwritten public offering (including units issued upon the underwriters' exercise of their option to purchase additional units). We used the net proceeds from the offering to repay a portion of our then-outstanding balance under our revolving credit facility.
In January 2012, we completed a registered underwritten offering of 5,750,000 common units at $34.03 per unit, for net proceeds of approximately $187,762,000, after deducting underwriting discounts and offering expenses. We used the net proceeds to repay a portion of the outstanding indebtedness under our revolving credit facility.
In October 2012, we completed a registered underwritten offering of 6,526,078 common units at $32.13 per unit, for net proceeds of approximately $201,522,000, after deducting underwriting discounts and offering expenses. We used the net proceeds to repay a portion of the outstanding indebtedness under our revolving credit facility.
F-34
Table of Contents
Note 6 — Members' Capital and Distributions (Continued)
Distributions. The following table sets forth information regarding distributions to our unitholders for the quarterly periods indicated:
| | | | | | | | | | | | | |
Quarter Ending | | Distribution
Per Unit | | Date Declared | | Record Date | | Payment Date | | Amount | |
|---|
December 31, 2009 | | $ | 0.575 | | January 13, 2010 | | February 1, 2010 | | February 11, 2010 | | $ | 31,911,000 | |
March 31, 2010 | | $ | 0.575 | | April 14, 2010 | | April 30, 2010 | | May 13, 2010 | | $ | 38,134,000 | |
June 30, 2010 | | $ | 0.575 | | July 14, 2010 | | August 2, 2010 | | August 12, 2010 | | $ | 38,295,000 | |
September 30, 2010 | | $ | 0.575 | | October 13, 2010 | | November 1, 2010 | | November 11, 2010 | | $ | 38,349,000 | |
December 31, 2010 | | $ | 0.575 | | January 12, 2011 | | February 1, 2011 | | February 11, 2011 | | $ | 38,456,000 | |
March 31, 2011 | | $ | 0.575 | | April 13, 2011 | | April 29, 2011 | | May 12, 2011 | | $ | 38,538,000 | |
June 30, 2011 | | $ | 0.575 | | July 13, 2011 | | August 1, 2011 | | August 11, 2011 | | $ | 38,687,000 | |
September 30, 2011 | | $ | 0.575 | | October 12, 2011 | | October 31, 2011 | | November 10, 2011 | | $ | 38,705,000 | |
December 31, 2011 | | $ | 0.575 | | January 11, 2012 | | January 26, 2012 | | February 9, 2012 | | $ | 42,064,000 | |
March, 31 2012 | | $ | 0.575 | | April 11, 2012 | | April 30, 2012 | | May 10, 2012 | | $ | 42,113,000 | |
June 30, 2012 | | $ | 0.575 | | July 11, 2012 | | July 31, 2012 | | August 9, 2012 | | $ | 42,336,000 | |
September 30, 2012 | | $ | 0.575 | | October 10, 2012 | | October 31, 2012 | | November 8, 2012 | | $ | 46,087,000 | |
December 31, 2012 | | $ | 0.575 | | January 10, 2013 | | January 31, 2013 | | February 14, 2013 | | $ | 46,108,000 | |
Class D units totaling 3,245,817 as of December 31, 2009 converted into our common units on a one-for-one basis in February 2010.
As discussed in Note 2, we use ASC 718,"Stock Compensation," to account for equity-based compensation expense related to awards issued under our long-term incentive plan ("LTIP"). As of December 31, 2012, the number of units available for grant under our LTIP totaled 1,692,276, of which up to 1,195,729 units were eligible to be issued as restricted common units, phantom units or unit awards.
Restricted Common Units. An award of restricted common units is valued based on the closing price of our common units on the date of grant. The aggregate intrinsic value of our restricted common units, net of anticipated forfeitures, is amortized into expense over the respective vesting periods of the awards. We recognized non-cash compensation expense of $600,000, $678,000 and $1,240,000 related to the amortization of restricted common units outstanding during the years ended December 31, 2012, 2011 and 2010, respectively.
A summary of restricted common unit activity is provided below:
| | | | | | | | | | | | | | | | | | | |
| | 2012 | | 2011 | | 2010 | |
|---|
| | Number of
Restricted
Units | | Weighted
Average
Grant-
Date Fair
Value | | Number of
Restricted
Units | | Weighted
Average
Grant-
Date Fair
Value | | Number of
Restricted
Units | | Weighted
Average
Grant-
Date Fair
Value | |
|---|
Outstanding at beginning of year | | | 43,800 | | $ | 29.40 | | | 59,952 | | $ | 24.09 | | | 105,501 | | $ | 21.45 | |
Granted | | | 21,000 | | | 29.91 | | | 21,000 | | | 32.30 | | | 24,000 | | | 29.29 | |
Vested | | | (21,800 | ) | | 27.58 | | | (37,132 | ) | | 22.47 | | | (69,329 | ) | | 21.88 | |
Forfeited | | | — | | | — | | | (20 | ) | | 23.26 | | | (220 | ) | | 23.26 | |
| | | | | | | | | | | | | | |
Outstanding at end of year | | | 43,000 | | $ | 30.57 | | | 43,800 | | $ | 29.40 | | | 59,952 | | $ | 24.09 | |
| | | | | | | | | | | | | | |
F-35
Table of Contents
Note 6 — Members' Capital and Distributions (Continued)
As of December 31, 2012, unrecognized compensation costs related to outstanding restricted common units totaled $1,224,000. The expense is expected to be recognized over an approximate weighted average period of 2.2 years. The total fair value of restricted common units that vested during the years ended December 31, 2012, 2011 and 2010 was $657,000, $1,218,000 and $1,962,000, respectively.
Phantom Units. An award of phantom units is valued based on the closing price of our common units on the date of grant. The aggregate intrinsic value of our phantom units, net of anticipated forfeitures, is amortized into expense over the respective vesting periods of the awards. We recognized non-cash compensation expense of $9,357,000, $8,148,000 and $5,303,000 related to the amortization of phantom units outstanding during the years ended December 31, 2012, 2011 and 2010, respectively.
We have two types of phantom units — (1) service-based awards and (2) performance-based awards. All outstanding service-based phantom units vest over periods of 3 to 6 years and include tandem distribution equivalent rights, which are subject to the same vesting and forfeiture terms as the related phantom unit. Upon vesting, the grantee is entitled to an amount equal to the cash distributions made with respect to a common unit during the period from the time of grant until vesting. All unvested service-based phantom units will be automatically forfeited upon termination of the grantee's employment, except as otherwise provided in the applicable award agreement. For service-based phantom unit awards, compensation cost is measured based on the fair value of the award on the date of grant and is recognized over the service (vesting) period of the award in accordance with ASC 718-10-35.
All outstanding performance-based phantom units cliff vest after three years provided that a specified performance goal, which is declaration of a specified annualized distribution per common unit, is met at any time during the three-year vesting period. The performance-based phantom units may vest at a threshold (50%), target (100%) or maximum (200%) level depending on the level of achievement of the performance goal. The performance-based phantom unit awards include tandem distribution equivalent rights, which are subject to the same vesting and forfeiture terms as the related phantom unit. All unvested performance-based phantom units will be automatically forfeited upon termination of the grantee's employment, except as otherwise provided in the applicable award agreement. Upon vesting, a grantee is entitled to an amount equal to the cash distributions made with respect to a common unit during the period from the time of grant until vesting. Since these awards contain performance conditions that affect the level of vesting, compensation cost is recognized and adjusted quarterly over the vesting period to record compensation expense equal to the probable estimated ultimate outcome of the performance award (ASC 718-10-30-15).
Upon vesting, both performance-based and service-based phantom units may be settled net of taxes with cash or common units, as determined by the Compensation Committee of our Board of Directors in its discretion. To date, all vested phantom units have been settled net of taxes with common units. Additionally, we have the ability to deliver common units and are not required to settle the award in cash if a contingent event occurs. Both types of phantom units are accounted for as equity awards since each plan permits us to settle them in equity in accordance with ASC 718-10-25-15.
F-36
Table of Contents
Note 6 — Members' Capital and Distributions (Continued)
A summary of the phantom unit activity is provided below:
| | | | | | | | | | | | | | | | | | | |
| | 2012 | | 2011 | | 2010 | |
|---|
| | Number of
Phantom
Units | | Weighted
Average
Grant-
Date Fair
Value | | Number of
Phantom
Units | | Weighted
Average
Grant-
Date Fair
Value | | Number of
Phantom
Units | | Weighted
Average
Grant-
Date Fair
Value | |
|---|
Outstanding at beginning of year | | | 996,502 | | $ | 28.74 | | | 881,638 | | $ | 27.25 | | | 698,136 | | $ | 28.46 | |
Granted | | | 463,104 | | | 28.66 | | | 272,564 | | | 31.42 | | | 314,290 | | | 24.60 | |
Vested | | | (242,573 | ) | | 28.60 | | | (147,825 | ) | | 25.06 | | | (91,252 | ) | | 25.41 | |
Forfeited | | | (44,930 | ) | | 27.82 | | | (9,875 | ) | | 24.35 | | | (39,536 | ) | | 31.73 | |
| | | | | | | | | | | | | | |
Outstanding at end of year | | | 1,172,103 | | $ | 28.78 | | | 996,502 | | $ | 28.74 | | | 881,638 | | $ | 27.25 | |
| | | | | | | | | | | | | | |
As of December 31, 2012, unrecognized compensation expense related to outstanding phantom units totaled $19,508,000. The expense is expected to be recognized over an approximate weighted average period of 2.2 years. The total fair value of phantom units that vested during the years ended December 31, 2012, 2011 and 2010 was $6,980,000, $4,785,000 and $2,313,000, respectively.
Unit Options. The fair value of a unit option award, net of anticipated forfeitures, is amortized into expense over the vesting period. We recognized non-cash compensation expense of $229,000, $363,000 and $772,000 related to unit options, net of anticipated forfeitures, for the years ended December 31, 2012, 2011 and 2010, respectively.
F-37
Table of Contents
Note 6 — Members' Capital and Distributions (Continued)
A summary of unit option activity under our LTIP is provided below:
| | | | | | | | | | | | | | | | | | | |
| | 2012 | | 2011 | | 2010 | |
|---|
| | Number of
Units
Underlying
Options | | Weighted
Average
Exercise
Price | | Number of
Units
Underlying
Options | | Weighted
Average
Exercise
Price | | Number of
Units
Underlying
Options | | Weighted
Average
Exercise
Price | |
|---|
Outstanding at beginning of year | | | 765,952 | | $ | 26.89 | | | 962,359 | | $ | 25.64 | | | 1,302,476 | | $ | 23.86 | |
Exercised | | | (61,140 | ) | | 20.82 | | | (172,407 | ) | | 18.91 | | | (312,695 | ) | | 17.40 | |
Cancelled | | | (53,600 | ) | | 35.88 | | | (9,600 | ) | | 37.72 | | | (14,960 | ) | | 37.75 | |
Forfeited | | | (14,500 | ) | | 34.31 | | | (14,400 | ) | | 31.68 | | | (12,462 | ) | | 31.78 | |
| | | | | | | | | | | | | | |
Outstanding at end of year | | | 636,712 | | $ | 26.55 | | | 765,952 | | $ | 26.89 | | | 962,359 | | $ | 25.64 | |
| | | | | | | | | | | | | | |
Aggregate intrinsic value at end of year | | $ | 4,689,000 | | | | | $ | 6,609,000 | | | | | $ | 9,016,000 | | | | |
Weighted average remaining contractual term | | | 3.8 years | | | | | | 4.9 years | | | | | | 5.7 years | | | | |
Exercisable Options: | | | | | | | | | | | | | | | | | | | |
Outstanding at end of year | | | 597,912 | | $ | 26.48 | | | 638,692 | | $ | 25.86 | | | 689,745 | | $ | 23.45 | |
Aggregate intrinsic value at end of year | | $ | 4,464,000 | | | | | $ | 6,110,000 | | | | | $ | 7,797,000 | | | | |
Weighted average remaining contractual term | | | 3.7 years | | | | | | 4.6 years | | | | | | 5.3 years | | | | |
Options expected to vest: | | | | | | | | | | | | | | | | | | | |
At end of year | | | 38,800 | | $ | 26.55 | | | 689,357 | | $ | 26.89 | | | 866,123 | | $ | 25.64 | |
Aggregate intrinsic value at end of year | | $ | 225,000 | | | | | $ | 5,948,000 | | | | | $ | 8,114,000 | | | | |
Weighted average remaining contractual term | | | 3.8 years | | | | | | 4.9 years | | | | | | 5.7 years | | | | |
Exercise prices for unit options outstanding as of December 31, 2012 ranged from $10.00 to $44.14.
The fair value of each unit option granted is estimated on the date of grant using the Black-Scholes option-pricing model with the following assumptions. The risk-free rate of periods within the expected life of the option is based on the U.S. Treasury yield curve in effect at the time of grant. The expected volatility and distribution yield rates are based on the average of our historical common unit prices and distribution rates and those of similar companies. The expected term of unit options is based on the simplified method and represents the period of time that the unit options are expected to be outstanding. We did not grant any unit options during the years ended December 31, 2012, 2011 and 2010.
As of December 31, 2012, all compensation costs related to outstanding unit options have been recognized.
Unit Appreciation Rights. The fair value of a unit appreciation right ("UAR") award, net of anticipated forfeitures, is amortized into expense over the vesting period. We recognized non-cash compensation expense of $256,000, $246,000 and $301,000 related to UARs, net of anticipated forfeitures, for the years ended December 31, 2012, 2011 and 2010, respectively.
F-38
Table of Contents
Note 6 — Members' Capital and Distributions (Continued)
A summary of UAR activity is provided below:
| | | | | | | | | | | | | | | | | | | |
| | 2012 | | 2011 | | 2010 | |
|---|
| | Number of
Units
Underlying
UARs | | Weighted
Average
Exercise
Price | | Number of
Units
Underlying
UARs | | Weighted
Average
Exercise
Price | | Number of
Units
Underlying
UARs | | Weighted
Average
Exercise
Price | |
|---|
Outstanding at beginning of year | | | 407,125 | | $ | 23.12 | | | 360,450 | | $ | 17.94 | | | 302,900 | | $ | 15.40 | |
Granted | | | 163,300 | | | 31.76 | | | 140,200 | | | 33.78 | | | 91,100 | | | 25.67 | |
Exercised | | | (57,902 | ) | | 16.60 | | | (71,685 | ) | | 16.45 | | | (28,870 | ) | | 15.56 | |
Cancelled | | | (160 | ) | | 15.09 | | | — | | | — | | | (40 | ) | | 15.09 | |
Forfeited | | | (35,080 | ) | | 28.92 | | | (21,840 | ) | | 28.01 | | | (4,640 | ) | | 18.53 | |
| | | | | | | | | | | | | | |
Outstanding at end of year | | | 477,283 | | $ | 26.44 | | | 407,125 | | $ | 23.12 | | | 360,450 | | $ | 17.94 | |
| | | | | | | | | | | | | | |
Aggregate intrinsic value at end of year | | $ | 2,908,000 | | | | | $ | 4,571,000 | | | | | $ | 5,697,000 | | | | |
Weighted average remaining contractual term | | | 6.7 years | | | | | | 5.9 years | | | | | | 5.2 years | | | | |
Exercisable UARs: | | | | | | | | | | | | | | | | | | | |
Outstanding at end of year | | | 78,303 | | $ | 23.32 | | | 36,845 | | $ | 17.76 | | | 32,150 | | $ | 18.55 | |
Aggregate intrinsic value at end of year | | $ | 699,000 | | | | | $ | 606,000 | | | | | $ | 596,000 | | | | |
Weighted average remaining contractual term | | | 5.2 years | | | | | | 2.7 years | | | | | | 3.5 years | | | | |
UARs expected to vest: | | | | | | | | | | | | | | | | | | | |
At end of year | | | 359,082 | | $ | 26.44 | | | 366,413 | | $ | 23.12 | | | 324,405 | | $ | 17.94 | |
Aggregate intrinsic value at end of year | | $ | 1,988,000 | | | | | $ | 4,114,000 | | | | | $ | 5,127,300 | | | | |
Weighted average remaining contractual term | | | 6.7 years | | | | | | 5.9 years | | | | | | 5.2 years | | | | |
Exercise prices for UARs outstanding as of December 31, 2012 ranged from $15.09 to $37.75.
The fair value of each UAR granted is estimated on the date of grant using the Black-Scholes option-pricing model with the following assumptions. The risk-free rate of periods within the expected life of the UAR is based on the U.S. Treasury yield curve in effect at the time of grant. The expected volatility and distribution yield rates are based on the average of our historical common unit prices and distribution rates
F-39
Table of Contents
Note 6 — Members' Capital and Distributions (Continued)
and those of similar companies. The expected term of UARs is based on the simplified method and represents the period of time that UARs granted are expected to be outstanding.
| | | | | | | | | | |
| | Year Ended December 31, | |
|---|
| | 2012 | | 2011 | | 2010 | |
|---|
Weighted average exercise price | | $ | 31.76 | | $ | 16.45 | | $ | 17.94 | |
Expected volatility | | | 30.6-30.9 | % | | 30.4-30.7 | % | | 30.6-31.0 | % |
Distribution yield | | | 7.1-7.2 | % | | 7.1-7.2 | % | | 7.1-7.2 | % |
Risk-free interest rate | | | 1.0-1.7 | % | | 1.4-3.0 | % | | 1.9-3.5 | % |
Expected term (in years) | | | 6.5 | | | 6.5 | | | 6.5 | |
Weighted average grant-date fair value of appreciation rights granted | |
$ |
3.67 | |
$ |
4.28 | |
$ |
3.42 | |
Total intrinsic value of appreciation rights exercised | | $ | 1,032,000 | | $ | 1,195,000 | | $ | 340,000 | |
As of December 31, 2012, unrecognized compensation costs related to outstanding UARs totaled $1,004,000. The expense is expected to be recognized over a weighted average period of approximately 3.8 years.
Unit Awards. For the years ended December 31, 2011 and 2010, we granted 87,839 and 97,788 unit awards, respectively, under our LTIP with a weighted average fair value of $33.59 and $24.89, respectively, to settle bonuses, including obligations under our Management Incentive Compensation Plan and Employee Incentive Compensation Program.
F-40
Table of Contents
Note 7 — Related Party Transactions
Summary of Transactions With Affiliated Entities (in thousands).
| | | | | | | | | | | | | | | | | | | | | | | | | | | | |
| | Financial Statement Classification — Year Ended December 31, 2012 | |
|---|
| | Natural Gas
Sales | | Transportation,
Compression and
Processing Fees | | Condensate and
Other | | Cost of
Natural Gas and
Natural Gas Liquids | | Transportation | | General and
Administrative(2) | | Reimbursable
Costs(3) | | Accounts
Payable | | Accounts
Receivable | |
|---|
Webb Duval | | $ | — | | $ | — | | $ | — | | $ | (219 | ) | $ | 900 | | $ | 231 | | $ | 969 | | $ | 3 | | $ | 82 | |
Eagle Ford Gathering | | | — | | | 17,874 | | | 144 | | | 171,357 | | | — | | | 713 | | | 2,420 | | | 18,761 | | | 383 | |
Liberty Pipeline Group | | | — | | | — | | | — | | | — | | | 1,460 | | | 228 | | | 355 | | | 111 | | | 48 | |
Double Eagle Pipeline | | | — | | | — | | | — | | | — | | | — | | | 700 | | | 17,590 | | | — | | | 4,461 | |
Southern Dome | | | — | | | — | | | — | | | — | | | — | | | 250 | | | 427 | | | — | | | 254 | |
Bighorn | | | — | | | — | | | 1,090 | | | — | | | — | | | 386 | | | 2,369 | | | — | | | 68 | |
Fort Union | | | — | | | — | | | 789 | | | — | | | 7,154 | | | 260 | | | 1,515 | | | — | | | 40 | |
Other | | | — | | | — | | | — | | | — | | | — | | | — | | | — | | | — | | | 5 | |
| | | | | | | | | | | | | | | | | | | | |
Total related party transactions | | $ | — | | $ | 17,874 | | $ | 2,023 | | $ | 171,138 | | $ | 9,514 | | $ | 2,768 | | $ | 25,645 | | $ | 18,875 | | $ | 5,341 | |
| | | | | | | | | | | | | | | | | | | | |
|
|
Financial Statement Classification — Year Ended December 31, 2011 |
|
|---|
| | Natural Gas
Sales | | Transportation,
Compression and
Processing Fees | | Condensate and
Other | | Cost of
Natural Gas and
Natural Gas Liquids | | Transportation | | General and
Administrative(2) | | Reimbursable
Costs(3) | | Accounts
Payable | | Accounts
Receivable | |
|---|
Affiliates of Mr. Lawing(1) | | $ | (1 | ) | $ | 3 | | $ | — | | $ | 82 | | $ | — | | $ | — | | $ | 171 | | $ | — | | $ | — | |
Webb Duval | | | 39 | | | — | | | — | | | 393 | | | 638 | | | 226 | | | 1,568 | | | 196 | | | 65 | |
Eagle Ford Gathering | | | 1,091 | | | 2,088 | | | — | | | 18,809 | | | — | | | 1,115 | | | 15,529 | | | 4,644 | | | 806 | |
Liberty Pipeline Group | | | — | | | — | | | — | | | — | | | 329 | | | 95 | | | 17,200 | | | 99 | | | 31 | |
Southern Dome | | | — | | | — | | | — | | | — | | | — | | | 250 | | | 388 | | | — | | | 36 | |
Bighorn | | | — | | | — | | | 1,419 | | | — | | | — | | | 386 | | | 2,383 | | | 2 | | | 158 | |
Fort Union | | | — | | | — | | | — | | | 6 | | | 5,879 | | | 246 | | | 1,481 | | | — | | | 16 | |
Other | | | — | | | — | | | — | | | — | | | — | | | — | | | — | | | — | | | 5 | |
| | | | | | | | | | | | | | | | | | | | |
Total related party transactions | | $ | 1,129 | | $ | 2,091 | | $ | 1,419 | | $ | 19,290 | | $ | 6,846 | | $ | 2,318 | | $ | 38,720 | | $ | 4,941 | | $ | 1,117 | |
| | | | | | | | | | | | | | | | | | | | |
F-41
Table of Contents
Note 7 — Related Party Transactions (Continued)
| | | | | | | | | | | | | | | | | | | | | | |
| | Financial Statement Classification — Year Ended December 31, 2010 | |
|---|
| | Natural Gas
Sales | | Transportation,
Compression and
Processing Fees | | Condensate and
Other | | Cost of
Natural Gas and
Natural Gas Liquids | | Transportation | | General and
Administrative(2) | | Reimbursable
Costs(3) | |
|---|
Affiliates of Mr. Lawing(1) | | $ | 24 | | $ | 11 | | $ | — | | $ | 510 | | $ | — | | $ | — | | $ | 264 | |
Webb Duval | | | 129 | | | — | | | — | | | (47 | ) | | 238 | | | 224 | | | 967 | |
Eagle Ford Gathering | | | — | | | — | | | — | | | — | | | — | | | 681 | | | 5,760 | |
Southern Dome | | | — | | | — | | | — | | | — | | | — | | | 250 | | | 354 | |
Bighorn | | | — | | | — | | | 1,666 | | | 3 | | | 16 | | | 556 | | | 2,473 | |
Fort Union | | | — | | | — | | | — | | | 52 | | | 5,224 | | | 239 | | | 892 | |
Other | | | 190 | | | — | | | — | | | — | | | — | | | — | | | — | |
| | | | | | | | | | | | | | | | |
Total related party transactions | | $ | 343 | | $ | 11 | | $ | 1,666 | | $ | 518 | | $ | 5,478 | | $ | 1,950 | | $ | 10,710 | |
| | | | | | | | | | | | | | | | |
- (1)
- These entities were controlled by John R. Eckel, Jr., our former Chairman and Chief Executive Officer, until his death in November 2009, and since that time have been controlled by Douglas L. Lawing, our Executive Vice President, General Counsel and Secretary, in his role as executor of Mr. Eckel's estate. The contracts with the affiliates of Mr. Lawing underlying these transactions were assigned to non-affiliates or terminated in 2011.
- (2)
- Management fees and capital project fees received from our unconsolidated affiliates consists of the total compensation paid to us by our unconsolidated affiliates and is included as a reduction in general and administrative expenses on our consolidated statements of operations.
- (3)
- Reimbursable costs consist of expenses incurred by our affiliates for which Copano makes payment but is reimbursed by the affiliate. These amounts are settled through related party accounts receivable and payable and are not included on statements of operations.
F-42
Table of Contents
Note 7 — Related Party Transactions (Continued)
During the third quarter of 2012, we installed stabilization facilities and related liquids pipelines at our Houston Central complex for which Eagle Ford Gathering paid us $4,785,000 for stabilization services over the term of its processing arrangement with us. We have recorded this payment as deferred revenue and will amortize it to earnings as services are provided to Eagle Ford Gathering.
Certain of our operating subsidiaries incurred costs payable to affiliates of Valerus Compression Services, L.P. for compression equipment and related services totaling $1,475,000, $76,000 and $61,000 for the years ended December 31, 2012, 2011 and 2010, respectively. TPG Copenhagen, L.P., an affiliate of TPG Capital, L.P., (together with its affiliates, "TPG") owns a controlling interest in Valerus Compression Services, L.P., and Michael G. MacDougall, a partner with TPG, is a member of our Board of Directors.
Our management believes that the terms and provisions of our related party agreements and transactions are no less favorable to us than those we could have obtained from unaffiliated third parties.
Note 8 — Customer Information
The following tables summarize our significant customer information for the periods indicated.
Percentage of Revenue
| | | | | | | | | | | | |
| |
| | Year Ended December 31, | |
|---|
Customer | | Segment | | 2012 | | 2011 | | 2010 | |
|---|
Dow Hydrocarbons and Resources LLC | | Texas | | | 17 | % | | 15 | % | | (a) | |
ONEOK Hydrocarbon, L.P. | | Texas and Oklahoma | | | 12 | % | | 18 | % | | 20 | % |
Formosa Hydrocarbons Company Inc. | | Texas | | | 10 | % | | (a) | | | (a) | |
ONEOK Energy Services, L.P. | | Oklahoma | | | (a) | | | 11 | % | | 16 | % |
DCP Midstream | | Texas and Oklahoma | | | (a) | | | (a) | | | 12 | % |
Percentage of Cost of Goods Sold
| | | | | | | | | | | | |
| |
| | Year Ended December 31, | |
|---|
Producer | | Segment | | 2012 | | 2011 | | 2010 | |
|---|
Geosouthern Energy Corporation | | Texas | | | 16 | % | | (a) | | | (a) | |
Eagle Ford Gathering (See Note 7) | | Texas | | | 15 | % | | (a) | | | (a) | |
New Dominion LLC | | Oklahoma | | | 10 | % | | 14 | % | | 17 | % |
Equal Energy Ltd. | | Oklahoma | | | (a) | | | (a) | | | 12 | % |
Percentage of Accounts Receivable
| | | | | | | | | | | | |
| |
| | Year Ended December 31, | |
|---|
Customer or Counterparty | | Segment | | 2012 | | 2011 | | 2010 | |
|---|
ONEOK Energy Services, L.P. | | Oklahoma | | | 10 | % | | (a) | | | 15 | % |
ONEOK Hydrocarbon, L.P. | | Oklahoma and Texas | | | 12 | % | | 15 | % | | 19 | % |
EOG Resources, Inc. | | Texas | | | (a) | | | 12 | % | | (a) | |
F-43
Table of Contents
Note 8 — Customer Information (Continued)
- (a)
- Percentages are not provided for periods for which the customer or producer is less than 10% of our consolidated revenue, cost of goods sold or accounts receivable.
Note 9 — Financial Instruments
We are exposed to market risks, including changes in commodity prices and interest rates. We may use financial instruments such as puts, calls, swaps and other financial instruments to mitigate the effects of the identified risks. In general, we attempt to hedge risks to our future cash flow and profitability resulting from changes in applicable commodity prices or interest rates so that we can maintain cash flows sufficient to meet debt service, required capital expenditures, distribution objectives and similar requirements.
NGL and natural gas prices can be volatile and are impacted by changes in fundamental supply and demand, as well as market uncertainty and a variety of additional factors that are beyond our control. Our profitability is affected by prevailing commodity prices indirectly or directly as a function of the contract terms under which we are compensated for our services or pay third parties for their services. To the extent that compensation for our services is fee-based, commodity prices affect us indirectly because they influence exploration and production activity and therefore affect the volumes of natural gas, condensate and NGLs that flow through our assets. Our profitability is directly affected by commodity prices to the extent that we: (i) process natural gas at our plants or third-party plants under index-related pricing arrangements, (ii) purchase and sell or gather and transport volumes of natural gas at index-related prices and (iii) purchase and sell or transport and fractionate NGLs at index-related prices. We use commodity derivative instruments to manage the risks associated with direct exposure to changing commodity prices. Our risk management activities are governed by our risk management policy, which, subject to certain limitations, allows our management to purchase options and enter into swaps for crude oil, NGLs and natural gas in order to reduce our exposure to substantial adverse changes in the prices of those commodities. Our risk management policy prohibits the use of derivative instruments for speculative purposes.
Our Risk Management Committee, which consists of senior executives in the operations, finance and legal departments, monitors and ensures compliance with the risk management policy. The Audit Committee of our Board of Directors monitors the implementation of our risk management policy, and we have engaged an independent firm to monitor our compliance with the policy on a monthly basis. Our risk management policy provides that derivative transactions must be executed by our Chief Financial Officer or his designee and must be authorized in advance of execution by our Chief Executive Officer. Our risk management policy requires derivative transactions to take place either on the New York Mercantile Exchange (NYMEX) through a clearing member firm or with over-the-counter counterparties, with investment grade ratings from both Moody's Investors Service and Standard & Poor's Ratings Services and with complete industry standard contractual documentation. Except for two option counterparties, all of our hedge counterparties are also lenders under our revolving credit facility, and any payment obligations in connection with our hedge transactions with a lender-counterparty are secured by a first priority lien on the collateral securing our revolving credit facility indebtedness that ranks equal in right of payment with liens granted in favor of our secured lenders. As long as this first priority lien is in effect, we will have no obligation to post cash, letters of credit or other additional collateral to secure these hedges at any time, even if our counterparty's exposure to our credit increases over the term of the hedge as a result of higher commodity prices or because there has been a change in our creditworthiness.
Financial instruments that we acquire pursuant to our risk management policy are recorded on our consolidated balance sheets at fair value. For derivatives designated as cash flow hedges under ASC 815,
F-44
Table of Contents
Note 9 — Financial Instruments (Continued)
"Derivatives and Hedging," we recognize the effective portion of changes in fair value as other comprehensive income ("OCI") and reclassify them to revenue within the consolidated statements of operations as settlements of the underlying transactions impact earnings. For derivatives not designated as cash flow hedges, we recognize changes in fair value as a gain or loss in our consolidated statements of operations. These financial instruments serve the same risk management purpose whether designated as a cash flow hedge or not.
We assess, both at the inception of each hedge and on an ongoing basis, whether our derivative instruments are effective in hedging the variability of forecasted cash flows associated with the underlying hedged items. If the correlation between a derivative instrument and the underlying hedged item is lost or it becomes no longer probable that the original forecasted transaction will occur, we discontinue hedge accounting based on a determination that the instrument is ineffective as a hedge. Subsequent changes in the derivative instrument's fair value are immediately recognized as a gain or loss (increase or decrease in revenue) in our consolidated statements of operations.
As of December 31, 2012, we estimated that $2,207,000 of OCI will be reclassified as an increase to earnings in the next 12 months as a result of monthly settlements of instruments hedging natural gas, NGLs and crude oil.
At December 31, 2012, the notional volumes of our commodity positions were:
| | | | | | | | | | | |
Commodity | | Instrument | | Unit | | 2013 | | 2014 | |
|---|
Natural gas | | Calls | | MMBtu/d | | | 2,787 | | | — | |
NGLs | | Puts | | Bbls/d | | | 2,650 | | | — | |
NGLs | | Swaps | | Bbls/d | | | 1,000 | | | — | |
Crude oil | | Puts | | Bbls/d | | | 1,400 | | | 500 | |
At December 31, 2011, the notional volumes of our commodity positions were:
| | | | | | | | | | | |
Commodity | | Instrument | | Unit | | 2012 | | 2013 | |
|---|
NGLs | | Puts | | Bbls/d | | | 5,400 | | | 1,650 | |
Crude oil | | Puts | | Bbls/d | | | 1,500 | | | 750 | |
Our interest rate exposure results from variable rate borrowings under our revolving credit facility. Through October 2012, we managed a portion of our interest rate exposure using interest rate swaps, which allowed us to convert a portion of our variable rate debt into fixed rate debt. As of December 31, 2012, all of our interest rate swaps had expired.
We recognize the fair value of our assets and liabilities that require periodic re-measurement as necessary based upon the requirements of ASC 820. This standard defines fair value, sets forth disclosure requirements with respect to fair value and specifies a hierarchy of valuation techniques based on whether the inputs to those valuation techniques are observable or unobservable. "Inputs" are the assumptions that a market participant would use in valuing the asset or liability. Observable inputs reflect market data, while unobservable inputs reflect our market assumptions. The three levels of the fair value hierarchy established by ASC 820 are as follows:
- •
- Level 1 — Unadjusted quoted prices in active markets that are accessible at the measurement date for identical, unrestricted assets or liabilities;
F-45
Table of Contents
Note 9 — Financial Instruments (Continued)
- •
- Level 2 — Quoted prices in markets that are not considered to be active or financial instruments for which all significant inputs are observable, either directly or indirectly; and
- •
- Level 3 — Prices or valuations that require inputs that are both significant to the fair value measurement and unobservable. These inputs may be used with internally developed methodologies that result in management's best estimate of fair value.
We use the income approach incorporating market-based inputs in determining fair value for our derivative contracts.
Through October 2012, our Level 2 instruments included interest rate swaps. Valuation of our Level 2 derivative contracts were based on observable market prices, which included 3-month LIBOR interest rate curves, incorporating discount rates.
Our Level 3 instruments include natural gas, NGL and WTI option contracts. Valuation of our Level 3 derivative contracts incorporates the use of option valuation models using significant unobservable inputs in addition to forward prices obtained from third-party pricing and data service providers. To the extent certain model inputs are observable, such as prices of WTI Crude, Mont Belvieu NGLs and Houston Ship Channel natural gas, we include observable market price and volatility data as inputs to our valuation model in addition to incorporating discount rates. Our unobservable inputs include implied volatilities for Mont Belvieu prices and WTI volatilities for illiquid periods of the forward price curves. Significant increases (decreases) in price curves would result in a significantly lower (higher) fair value measurement. On the other hand, significant increases (decreases) in volatility would result in a significantly higher (lower) fair value measurement. Our modeling methodology incorporates available market information to generate these inputs through techniques such as regression based interpolation and extrapolation.
We have an internal risk management group, which is responsible for our derivatives valuation, and reports to our Chief Financial Officer and Risk Management Committee. At each balance sheet date, they substantiate the reasonableness of our market-based inputs by (1) comparing the forward prices obtained from a third-party pricing service against other available market data (e.g. counterparty quotes) to confirm that the forward prices received are reasonable in relation to the market price, and (2) analyzing historical data to confirm reasonableness of volatilities. In addition, as of each balance sheet date, our risk management group performs an analysis of all instruments subject to ASC 820 and includes in Level 3 all of those for which fair value is based on significant unobservable inputs. This analysis consists of validating the observability of market-based inputs by analyzing available information, including transaction volumes on open market positions. The risk management group presents its analyses of all instruments to the Risk Management Committee quarterly for approval of fair value hierarchy classification, as well as for discussion of changes in fair value from period to period. We chart movement in our market inputs to ensure that the shifts substantiate any changes in fair value.
The following tables set forth by level within the fair value hierarchy our financial assets and liabilities that were accounted for at fair value on a recurring basis as of December 31, 2012 and 2011. As required by ASC 820, assets and liabilities are classified in their entirety based on the lowest level of input that is significant to the fair value measurement. Management's assessment of the significance of a particular
F-46
Table of Contents
Note 9 — Financial Instruments (Continued)
input to the fair value measurement requires judgment and may affect the valuation of fair value of assets and liabilities and their placement within the fair value hierarchy levels.
| | | | | | | | | | | | | |
| | Fair Value Measurements on Hedging Instruments(a)
December 31, 2012 | |
|---|
| | Level 1 | | Level 2 | | Level 3 | | Total | |
|---|
| | (In thousands)
| |
|---|
Assets: | | | | | | | | | | | | | |
Natural Gas: | | | | | | | | | | | | | |
Short-term — Designated(b) | | $ | — | | $ | — | | $ | 348 | | $ | 348 | |
Natural Gas Liquids: | | | | | | | | | | | | | |
Short-term — Designated(b) | | | — | | | — | | | 12,210 | | | 12,210 | |
Crude Oil: | | | | | | | | | | | | | |
Short-term — Designated(b) | | | — | | | — | | | 2,927 | | | 2,927 | |
Short-term — Not designated(b) | | | — | | | — | | | 698 | | | 698 | |
Long-term — Designated(c) | | | — | | | — | | | 1,881 | | | 1,881 | |
| | | | | | | | | | |
Total | | $ | — | | $ | — | | $ | 18,064 | | $ | 18,064 | |
| | | | | | | | | | |
Total designated assets | | $ | — | | $ | — | | $ | 17,366 | | $ | 17,366 | |
| | | | | | | | | | |
Total not designated assets | | $ | — | | $ | — | | $ | 698 | | $ | 698 | |
| | | | | | | | | | |
- (a)
- Instruments re-measured on a recurring basis.
- (b)
- Included on the consolidated balance sheets as a current asset under the heading of "Risk management assets."
- (c)
- Included on the consolidated balance sheets as a noncurrent asset under the heading of "Risk management assets."
F-47
Table of Contents
Note 9 — Financial Instruments (Continued)
| | | | | | | | | | | | | |
| | Fair Value Measurements on Hedging Instruments(a)
December 31, 2011 | |
|---|
| | Level 1 | | Level 2 | | Level 3 | | Total | |
|---|
| | (In thousands)
| |
|---|
Assets: | | | | | | | | | | | | | |
Natural Gas Liquids: | | | | | | | | | | | | | |
Short-term — Designated(b) | | $ | — | | $ | — | | $ | 1,641 | | $ | 1,641 | |
Short-term — Not designated(b) | | | — | | | — | | | 952 | | | 952 | |
Long-term — Designated(c) | | | — | | | — | | | 2,878 | | | 2,878 | |
Crude Oil: | | | | | | | | | | | | | |
Short-term — Designated(b) | | | — | | | — | | | 1,341 | | | 1,341 | |
Short-term — Not designated(b) | | | — | | | — | | | 388 | | | 388 | |
Long-term — Designated(c) | | | — | | | — | | | 3,574 | | | 3,574 | |
| | | | | | | | | | |
Total | | $ | — | | $ | — | | $ | 10,774 | | $ | 10,774 | |
| | | | | | | | | | |
Liabilities: | | | | | | | | | | | | | |
Interest Rate: | | | | | | | | | | | | | |
Short-term — Not designated(d) | | $ | — | | $ | 3,565 | | $ | — | | $ | 3,565 | |
| | | | | | | | | | |
Total | | $ | — | | $ | 3,565 | | $ | — | | $ | 3,565 | |
| | | | | | | | | | |
Total designated assets | | $ | — | | $ | — | | $ | 9,434 | | $ | 9,434 | |
| | | | | | | | | | |
Total not designated (liabilities)/assets | | $ | — | | $ | (3,565 | ) | $ | 1,340 | | $ | (2,225 | ) |
| | | | | | | | | | |
- (a)
- Instruments re-measured on a recurring basis.
- (b)
- Included on the consolidated balance sheets as a current asset under the heading of "Risk management assets."
- (c)
- Included on the consolidated balance sheets as a noncurrent asset under the heading of "Risk management assets."
- (d)
- Included on the consolidated balance sheets as a current liability under the heading of "Risk management liabilities."
F-48
Table of Contents
Note 9 — Financial Instruments (Continued)
The following table provides a description of the unobservable inputs utilized in the valuation of our derivatives classified as Level 3 in the fair value hierarchy:
Quantitative Information about Level 3 Fair Value Measurements
| | | | | | | | | |
| | Fair Value as of
December 31, 2012 | | Valuation
Technique | | Unobservable
Inputs | | Range |
|---|
| | (In thousands)
| |
| |
| |
|
|---|
Natural gas options | | $ | 348 | | European Option | | Volatility | | 29.89%-34.49% |
Natural gas liquids options: | | | | | | | | | |
Propane | | $ | 9,165 | | Asian Option | | Volatility | | 25.55%-26.62% |
| | | | | | | Forward Price Curve | | $0.93-$0.98(1) |
Iso-butane | | | 511 | | Asian Option | | Volatility | | 25.19%-26.26% |
| | | | | | | Forward Price Curve | | $1.70-$1.86(1) |
Normal butane | | | 930 | | Asian Option | | Volatility | | 25.17%-26.24% |
| | | | | | | Forward Price Curve | | $1.60-$1.63(1) |
| | | | | | | | | |
Total natural gas liquid options | | $ | 10,606 | | | | | | |
| | | | | | | | | |
Natural gas liquid ethane swaps | | $ | 1,604 | | Fixed Price Swap | | Forward Price Curve | | $0.26-$0.27(1) |
Crude oil options | | $ | 5,506 | | Asian Option | | Volatility | | 23.94%-27.97% |
- (1)
- Price shown is dollar per gallon.
The following tables provide a reconciliation of changes in the fair value of derivatives classified as Level 3 in the fair value hierarchy:
| | | | | | | | | | | | | |
| | Year Ended December 31, 2012 | |
|---|
| | Natural Gas | | Natural Gas
Liquids | | Crude Oil | | Total | |
|---|
| | (In thousands)
| |
|---|
Asset balance, beginning of year | | $ | — | | $ | 5,471 | | $ | 5,303 | | $ | 10,774 | |
Total gains or losses: | | | | | | | | | | | | | |
Non-cash amortization of option premium(a) | | | — | | | (15,347 | ) | | (6,410 | ) | | (21,757 | ) |
Other amounts included in earnings | | | — | | | 14,818 | | | 321 | | | 15,139 | |
Included in accumulated other comprehensive loss | | | (56 | ) | | 16,216 | | | 2,177 | | | 18,337 | |
Purchases | | | 404 | | | 3,908 | | | 4,245 | | | 8,557 | |
Issuances | | | — | | | (7,390 | ) | | — | | | (7,390 | ) |
Settlements | | | — | | | (5,466 | ) | | (130 | ) | | (5,596 | ) |
| | | | | | | | | | |
Asset balance, end of year | | $ | 348 | | $ | 12,210 | | $ | 5,506 | | $ | 18,064 | |
| | | | | | | | | | |
Change in unrealized (income) losses included in earnings related to instruments still held as of the end of the year | | $ | — | | $ | (293 | ) | $ | 214 | | $ | (79 | ) |
| | | | | | | | | | |
F-49
Table of Contents
Note 9 — Financial Instruments (Continued)
- (a)
- Includes the impact of fair value changes of the extrinsic value of options and is included as a reduction of revenue in the statement of operations.
| | | | | | | | | | | | | |
| | Year Ended December 31, 2011 | |
|---|
| | Natural Gas | | Natural Gas
Liquids | | Crude Oil | | Total | |
|---|
| | (In thousands)
| |
|---|
Assets balance, beginning of year | | $ | 87 | | $ | 8,349 | | $ | 6,476 | | $ | 14,912 | |
Total gains or losses: | | | | | | | | | | | | | |
Non-cash amortization of option premium(a) | | | (5,895 | ) | | (15,671 | ) | | (7,949 | ) | | (29,515 | ) |
Other amounts included in earnings | | | — | | | (11,155 | ) | | 1,209 | | | (9,946 | ) |
Included in accumulated other comprehensive loss | | | 5,808 | | | 4,184 | | | 3,767 | | | 13,759 | |
Purchases | | | — | | | 9,351 | | | 1,800 | | | 11,151 | |
Settlements | | | — | | | 10,413 | | | — | | | 10,413 | |
| | | | | | | | | | |
Assets balance, end of year | | $ | — | | $ | 5,471 | | $ | 5,303 | | $ | 10,774 | |
| | | | | | | | | | |
Change in unrealized losses (income) included in earnings related to instruments still held as of the end of the year | | $ | — | | $ | 1,200 | | $ | 933 | | $ | 2,133 | |
| | | | | | | | | | |
- (a)
- Includes the impact of fair value changes of the extrinsic value of options and is included as a reduction of revenue in the statement of operations.
Realized gains and losses for all Level 3 recurring items recorded in earnings are included in revenue on the consolidated statements of operations. Unrealized gains and losses for Level 3 recurring items that are not designated as cash flow hedges, or are ineffective as cash flow hedges, are also included in revenue on the consolidated statements of operations. The effective portion of unrealized gains and losses relating to cash flow hedges are included in accumulated other comprehensive loss on the consolidated balance sheets and consolidated statements of members' capital and statements of comprehensive loss.
Transfers in and/or out of Level 2 or Level 3 represent existing assets or liabilities where inputs to the valuation became less observable or assets and liabilities that were previously classified as a lower level for which the lowest significant input became observable during the period. There were no transfers in or out of Level 2 or Level 3 during the periods presented.
We have not entered into any derivative transactions containing credit risk related contingent features as of December 31, 2012 and 2011.
F-50
Table of Contents
Note 9 — Financial Instruments (Continued)
The following table presents derivatives that are designated as cash flow hedges:
The Effect of Derivative Instruments on the Statements of Operations
| | | | | | | | | | | |
Derivatives Designated as
Cash Flow Hedges Under
ASC 815 | | Amount of Gain (Loss)
Recognized in OCI on
Derivatives
(Effective Portion) | | Amount of Gain (Loss)
Reclassified from
Accumulated OCI into Income
(Effective Portion) | | Amount of Gain (Loss)
Recognized in Income on
Derivative
(Ineffective Portion and
Amount Excluded from
Effectiveness Testing) | | Statements of Operations Location |
|---|
| | (In thousands)
| |
|
|---|
Year Ended December 31, 2012 | | | | | | | | |
Natural gas | | $ | (56 | ) | $ | — | | $ | — | | Natural gas sales |
Natural gas liquids | | | 13,647 | | | (2,568 | ) | | 299 | | Natural gas liquids sales |
Crude oil | | | (2,645 | ) | | (4,822 | ) | | (183 | ) | Condensate and other |
Interest rate swaps | | | — | | | (149 | ) | | — | | Interest and other financing costs |
| | | | | | | | | |
Total | | $ | 10,946 | | $ | (7,539 | ) | $ | 116 | | |
| | | | | | | | | |
Year Ended December 31, 2011 | | | | | | | | |
Natural gas | | $ | (86 | ) | $ | (5,895 | ) | $ | — | | Natural gas sales |
Natural gas liquids | | | (20,131 | ) | | (24,314 | ) | | (290 | ) | Natural gas liquids sales |
Crude oil | | | (2,311 | ) | | (6,078 | ) | | 399 | | Condensate and other |
Interest rate swaps | | | — | | | (318 | ) | | — | | Interest and other financing costs |
| | | | | | | | | |
Total | | $ | (22,528 | ) | $ | (36,605 | ) | $ | 109 | | |
| | | | | | | | | |
Year Ended December 31, 2010 | | | | | | | | |
Natural gas | | $ | (2,665 | ) | $ | (5,906 | ) | $ | — | | Natural gas sales |
Natural gas liquids | | | (4,095 | ) | | (967 | ) | | (131 | ) | Natural gas liquids sales |
Crude oil | | | (4,742 | ) | | 10,022 | | | (402 | ) | Condensate and other |
Interest rate swaps | | | — | | | (478 | ) | | — | | Interest and other financing costs |
| | | | | | | | | |
Total | | $ | (11,502 | ) | $ | 2,671 | | $ | (533 | ) | |
| | | | | | | | | |
F-51
Table of Contents
Note 9 — Financial Instruments (Continued)
The following table presents derivatives that are not designated as cash flow hedges:
The Effect of Derivative Instruments on the Statements of Operations
| | | | | |
Derivatives Not Designated as Hedging Instruments
Under ASC 815 | | Amount of Gain (Loss)
Recognized in Income on
Derivative | | Statements of Operations Location |
|---|
| | (In thousands)
| |
|
|---|
Year Ended December 31, 2012 | | | | | |
Natural gas | | $ | — | | Natural gas sales |
Natural gas liquids | | | (5,254 | ) | Natural gas liquids sales |
Crude oil | | | (1,623 | ) | Condensate and other |
Interest rate swaps | | | (127 | ) | Interest and other financing costs |
| | | | | |
Total | | $ | (7,004 | ) | |
| | | | | |
Year Ended December 31, 2011 | | | | | |
Natural gas | | $ | (120 | ) | Natural gas sales |
Natural gas liquids | | | (453 | ) | Natural gas liquids sales |
Crude oil | | | 811 | | Condensate and other |
Interest rate swaps | | | (563 | ) | Interest and other financing costs |
| | | | | |
Total | | $ | (325 | ) | |
| | | | | |
Year Ended December 31, 2010 | | | | | |
Natural gas | | $ | (98 | ) | Natural gas sales |
Natural gas liquids | | | 356 | | Natural gas liquids sales |
Crude oil | | | (305 | ) | Condensate and other |
Interest rate swaps | | | (3,073 | ) | Interest and other financing costs |
| | | | | |
Total | | $ | (3,120 | ) | |
| | | | | |
As discussed in Notes 2 and 4, during 2012 and 2011, we recorded impairments with respect to our equity investments in Bighorn and Fort Union and a contract under which we provide services to Rocky Mountains producers. The valuation of these investments required the use of significant unobservable inputs (Level 3). Our probability-weighted discounted cash flow analysis included the following input parameters that are not readily available: (1) a discount rate reflective of market participants' cost of capital and (2) estimated contract rates, volumes, operating and maintenance costs, capital expenditures and a terminal value.
The following table presents, by level within the fair value hierarchy, certain of these investment that have been measured at fair value on a non-recurring basis as of December 31, 2012.
F-52
Table of Contents
Note 9 — Financial Instruments (Continued)
| | | | | | | |
| | Fair Value Measurements of Impairments(a) | |
|---|
| | Level 3 | | Impairment
Charge | |
|---|
| | (In thousands)
| |
|---|
Long-lived assets(b) | | $ | 189,490 | | $ | 66,254 | |
- (a)
- Measured on a non-recurring basis.
- (b)
- Impairments of equity investments in Bighorn and Fort Union are included on the consolidated balance sheets as a noncurrent asset under "Investments in unconsolidated affiliates" and on the consolidated statements of operations under "Equity in loss from unconsolidated affiliates."
As reflected above, during the three months ended December 31, 2012, we recorded non-cash impairment charges totaling $66,254,000 related to our equity investments in Bighorn and Fort Union. Additionally, during the three months ended March 31, 2012, we recorded non-cash impairment charges totaling $120,000,000 related to our equity investments in Bighorn and Fort Union and $28,744,000 related to a contract under which we provide services to Rocky Mountains producers.
During 2011, we recorded non-cash impairment charges of $165,000,000 with respect to our equity investments in Bighorn and Fort Union, $5,000,000 related to a contract under which we provide services to Rocky Mountains producers and $3,409,000 related to assets located in south Texas.
Note 10 — Fair Value of Financial Instruments
The fair value of our financial instrument liabilities are not recorded at fair value on our consolidated balance sheets and the estimated fair value does not affect our results of operations. Cash and cash equivalents approximate fair value is equal to the amount reflected in our consolidated balance sheets as of December 31, 2012. Our revolving credit facility is considered a Level 2 fair value measurement under the fair value hierarchy as we estimate the fair value based on recent debt transactions that we considered similar to our revolving credit facility. Our Senior Notes are considered a Level 2 fair value measurement under the fair value hierarchy as we estimate the fair value based on prices of recent trades or bid and ask pricing as quoted by a large financial institution that is an active market participant in our Senior Notes. A summary of the fair value and carrying value of the financial instruments is shown in the table below.
| | | | | | | | | | | | | |
| | December 31, | |
|---|
| | 2012 | | 2011 | |
|---|
| | Carrying
Value | | Estimated
Fair Value | | Carrying
Value | | Estimated
Fair Value | |
|---|
| | (In thousands)
| |
|---|
Cash and cash equivalents | | $ | 54,918 | | $ | 54,918 | | $ | 56,962 | | $ | 56,962 | |
Revolving credit facility | | | 239,000 | | | 240,792 | | | 385,000 | | | 385,000 | |
2018 Notes | | | 249,525 | | | 263,249 | | | 249,525 | | | 267,566 | |
2021 Notes | | | 510,000 | | | 552,075 | | | 360,000 | | | 366,300 | |
Note 11 — Commitments and Contingencies
For the years ended December 31, 2012, 2011 and 2010, rental expense for leased office space, vehicles and compressors and related field equipment used in our operations totaled $6,291,000, 4,865,000 and $3,859,000, respectively. As of December 31, 2012, commitments under our lease obligations for the next five years are payable as follows:2013 — $2,937,000;2014 — $2,747,000;2015 — $1,995,000;2016 — $1,335,000 and2017 — $1,434,000.
F-53
Table of Contents
Note 11 — Commitments and Contingencies (Continued)
We are party to firm transportation or fractionation and product sales agreements with Wyoming Interstate Gas Company, Fort Union, Formosa Hydrocarbons Company, Inc., Targa Liquids Marketing and Trade LLC and ONEOK Hydrocarbon, L.P under which we are obligated to pay for natural gas or NGL services whether or not we use such services. Our commitments under these agreements expire between 2015 and 2023. Under these agreements, we are obligated to pay an aggregate amount of approximately $38,499,000 in 2013, $44,493,000 in 2014, $43,076,000 in 2015, $40,778,000 in 2016, $40,026,000 in 2017 and $142,511,000 over the remainder of the contract terms.
We have fixed-quantity contractual commitments to Targa North Texas LP ("Targa") in settlement of a dispute regarding what portion, if any, of natural gas we were purchasing from producers that had been contractually dedicated by us for resale to Targa. As of December 31, 2012, our remaining commitment to Targa is a fixed contractual commitment to deliver 2.373 billion cubic feet of natural gas in 2013. Under the terms of the agreement, we are obligated to pay $1.25 per Mcf to the extent our natural gas deliveries to Targa fall below the committed quantity. In February 2012, we paid $1,567,000 to Targa in settlement of our 2011 obligation. As of December 31, 2012, we had accrued $1,271,000 of our 2012 obligation which was paid to Targa in February 2013.
In the ordinary course of business, we are subject to various laws and regulations. As of the date of this filing, in the opinion of our management, compliance with existing laws and regulations is not expected to materially affect our financial position, results of operations or cash flows.
As a result of our acquisition of Cantera Natural Gas LLC in October 2007, we acquired Cantera Gas Company LLC ("Cantera Gas Company," formerly CMS Field Services, Inc. ("CMSFS")). Cantera Gas Company is a party to a number of legal proceedings alleging (i) false reporting of natural gas prices by CMSFS and numerous other parties and (ii) other related claims. The claims made in these proceedings are based on events that occurred before Cantera Resources, Inc. acquired CMSFS in June 2003 (the "CMS Acquisition"). The amount of liability, if any, against Cantera Gas Company is not reasonably estimable. Pursuant to the CMS Acquisition purchase agreement, CMS Gas Transmission has assumed responsibility for the defense of these claims, and Cantera Gas Company is fully indemnified by CMS Gas Transmission and its parent, CMS Enterprises Company, against any losses that Cantera Gas Company may suffer as a result of these claims.
Shortly following the announcement of our merger agreement with Kinder Morgan (discussed in Note 15), five purported class action lawsuits were filed challenging the merger. Each of the actions names Copano, the board of directors of Copano, Kinder Morgan GP, Kinder Morgan and Merger Sub as defendants. All five lawsuits are brought on behalf of a putative class seeking to enjoin the merger and alleging, among other things, that the members of the board of directors of Copano breached their fiduciary duties by agreeing to sell Copano for inadequate and unfair consideration and pursuant to an inadequate and unfair process, and that Copano, Kinder Morgan, Kinder Morgan GP and Merger Sub aided and abetted such alleged breaches.
The five lawsuits challenging the merger are:
- •
- Charles Bruen, et al. v. Copano Energy, L.L.C., et al.,United States District Court, Southern District of Texas, Case No. 13-cv-00540 (filed on Feb. 28, 2013).
- •
- William Schultes, et al. v. R. Bruce Northcutt, et al., 151st Dist. Court of Harris County, Texas, Case No. 2013-06966 (filed on Feb. 5, 2013).
F-54
Table of Contents
Note 11 — Commitments and Contingencies (Continued)
- •
- Irwin Berlin, et al. v. Copano Energy, L.L.C. et al.,, Court of Chancery of the State of Delaware, Case No. 8284 (filed Feb. 6, 2013).
- •
- Donald E. Welzenbach, et al. v. William L. Thacker, et al., Court of Chancery of the State of Delaware; Case No. 8317-VCN (filed on Feb. 13, 2013).
- •
- Charles E. Hudson, et al. v. Copano Energy, L.L.C., et al., Court of Chancery of the State of Delaware, Case No. 8337 (filed Feb. 19, 2013).
We may, from time to time, be involved in other litigation and claims arising out of our operations in the normal course of business.
Note 12 — Supplemental Disclosures to the Statements of Cash Flows
| | | | | | | | | | |
| | Year Ended December 31, | |
|---|
| | 2012 | | 2011 | | 2010 | |
|---|
| | (In thousands)
| |
|---|
Cash payments for interest, net of $11,977,000, $9,675,000 and $3,355,000 capitalized in 2012, 2011 and 2010, respectively | | $ | 53,969 | | $ | 46,847 | | $ | 49,962 | |
Cash payments for federal and state income taxes | | $ | 1,200 | | $ | 925 | | $ | 655 | |
In-kind distributions on Series A preferred unit | | $ | 36,117 | | $ | 32,721 | | $ | 15,188 | |
We incurred a change in liabilities for investing activities that had not been paid as of December 31, 2012, 2011 and 2010 of $26,742,000, $18,194,000 and $2,750,000, respectively. Such amounts are not included in the change in accounts payable and accrued liabilities or with acquisitions, additions to property, plant and equipment and intangible assets on the consolidated statements of cash flows. As of December 31, 2012, 2011 and 2010, we accrued $52,935,000, $26,193,000 and $7,999,000, respectively, for capital expenditures that had not been paid, therefore, these amounts are not included in investing activities for each respective period presented.
Note 13 — Segment Information
We manage our business and analyze and report our results of operations on a segment basis. Our operations are divided into the following three segments for both internal and external reporting and analysis:
- •
- Our Texas segment provides midstream natural gas services in south and north Texas, including gathering and transportation of natural gas, and related services such as compression, dehydration, treating, processing and marketing. Our Texas segment also provides NGL fractionation and transportation and, through August 2012, included our Lake Charles plant located in southwest Louisiana. In addition to our 100%-owned operations, this segment includes our equity investments in Webb Duval, Eagle Ford Gathering, Liberty Pipeline Group and Double Eagle Pipeline.
- •
- Our Oklahoma segment provides midstream natural gas services in central and east Oklahoma, including primarily low-pressure gathering of natural gas and related services such as compression, dehydration, treating, processing and nitrogen rejection. This segment includes our equity investment in Southern Dome.
- •
- Our Rocky Mountains segment provides midstream natural gas services in the Powder River Basin of Wyoming, including gathering and treating of natural gas. In addition to our 100%-owned producer services business, this segment includes our equity investments in Bighorn and Fort Union.
F-55
Table of Contents
Note 13 — Segment Information (Continued)
The amounts indicated below as "Corporate and other" relate to our risk management activities, intersegment eliminations and other activities we perform or assets we hold that have not been allocated to any of our reporting segments.
We evaluate segment performance based on segment gross margin before depreciation, amortization and impairment. Operating and maintenance expenses and general and administrative expenses incurred at Corporate and other are allocated to Texas, Oklahoma and Rocky Mountains based on expenses directly attributable to each segment or an allocation based on activity, as appropriate. We use the same accounting methods and allocations in the preparation of our segment information as used in our consolidated reporting.
F-56
Table of Contents
Note 13 — Segment Information (Continued)
Summarized financial information concerning our reportable segments is shown in the following tables:
| | | | | | | | | | | | | | | | | | | |
| | Texas | | Oklahoma | | Rocky
Mountains | | Total
Segments | | Corporate
and Other | | Consolidated | |
|---|
Year Ended December 31, 2012: | | | | | | | | | | | | | | | | |
Total segment gross margin | | $ | 204,324 | | $ | 88,468 | | $ | 932 | | $ | 293,724 | | $ | (6,618 | ) | $ | 287,106 | |
Operations and maintenance expenses | | | 47,352 | | | 30,334 | | | 257 | | | 77,943 | | | — | | | 77,943 | |
Depreciation and amortization | | | 38,289 | | | 35,145 | | | 2,068 | | | 75,502 | | | 1,602 | | | 77,104 | |
Impairment | | | — | | | 742 | | | 28,744 | | | 29,486 | | | — | | | 29,486 | |
General and administrative expenses | | | 12,585 | | | 9,126 | | | 1,619 | | | 23,330 | | | 27,318 | | | 50,648 | |
Taxes other than income | | | 4,523 | | | 2,841 | | | 18 | | | 7,382 | | | 10 | | | 7,392 | |
Equity in (earnings) loss from unconsolidated affiliates | | | (34,734 | ) | | (1,104 | ) | | 172,926 | | | 137,088 | | | — | | | 137,088 | |
Gain on sale of operating assets | | | (9,941 | ) | | — | | | — | | | (9,941 | ) | | — | | | (9,941 | ) |
| | | | | | | | | | | | | | |
Operating income (loss) | | $ | 146,250 | | $ | 11,384 | | $ | (204,700 | ) | $ | (47,066 | ) | $ | (35,548 | ) | $ | (82,614 | ) |
| | | | | | | | | | | | | | |
Natural gas sales | | $ | 234,752 | | $ | 125,509 | | $ | 79 | | $ | 360,340 | | $ | — | | $ | 360,340 | |
Natural gas liquids sales | | | 606,664 | | | 208,781 | | | — | | | 815,445 | | | (529 | ) | | 814,916 | |
Transportation, compression and processing fees | | | 148,470 | | | 27,778 | | | 16,022 | | | 192,270 | | | — | | | 192,270 | |
Condensate and other | | | 13,888 | | | 40,517 | | | 1,878 | | | 56,283 | | | (6,089 | ) | | 50,194 | |
| | | | | | | | | | | | | | |
Sales to external customers | | $ | 1,003,774 | | $ | 402,585 | | $ | 17,979 | | $ | 1,424,338 | | $ | (6,618 | ) | $ | 1,417,720 | |
| | | | | | | | | | | | | | |
Interest and other financing costs | | $ | — | | $ | — | | $ | — | | $ | — | | $ | 55,264 | | $ | 55,264 | |
Capital expenditures | | $ | 321,767 | | $ | 30,859 | | $ | — | | $ | 352,626 | | $ | 6,714 | | $ | 359,340 | |
Segment assets | | $ | 1,058,248 | | $ | 632,475 | | $ | 220,557 | | $ | 1,911,280 | | $ | 288,884 | | $ | 2,200,164 | |
Year Ended December 31, 2011:
|
|
|
|
|
|
|
|
|
|
|
|
|
|
|
|
|
Total segment gross margin | | $ | 184,437 | | $ | 105,080 | | $ | 2,641 | | $ | 292,158 | | $ | (39,583 | ) | $ | 252,575 | |
Operations and maintenance expenses | | | 38,099 | | | 26,982 | | | 245 | | | 65,326 | | | — | | | 65,326 | |
Depreciation and amortization | | | 28,934 | | | 35,726 | | | 3,061 | | | 67,721 | | | 1,435 | | | 69,156 | |
Impairment | | | 3,409 | | | — | | | 5,000 | | | 8,409 | | | — | | | 8,409 | |
General and administrative expenses | | | 13,208 | | | 9,094 | | | 1,415 | | | 23,717 | | | 24,963 | | | 48,680 | |
Taxes other than income | | | 2,436 | | | 2,659 | | | 18 | | | 5,113 | | | 17 | | | 5,130 | |
Equity in (earnings) loss from unconsolidated affiliates | | | (10,853 | ) | | (2,415 | ) | | 158,592 | | | 145,324 | | | — | | | 145,324 | |
| | | | | | | | | | | | | | |
Operating income (loss) | | $ | 109,204 | | $ | 33,034 | | $ | (165,690 | ) | $ | (23,452 | ) | $ | (65,998 | ) | $ | (89,450 | ) |
| | | | | | | | | | | | | | |
Natural gas sales | | $ | 278,235 | | $ | 180,032 | | $ | 475 | | $ | 458,742 | | $ | (6,016 | ) | $ | 452,726 | |
Natural gas liquids sales | | | 456,536 | | | 293,354 | | | — | | | 749,890 | | | (26,827 | ) | | 723,063 | |
Transportation, compression and processing fees | | | 92,846 | | | 11,832 | | | 16,953 | | | 121,631 | | | — | | | 121,631 | |
Condensate and other | | | 15,908 | | | 37,216 | | | 1,419 | | | 54,543 | | | (6,740 | ) | | 47,803 | |
| | | | | | | | | | | | | | |
Sales to external customers | | $ | 843,525 | | $ | 522,434 | | $ | 18,847 | | $ | 1,384,806 | | $ | (39,583 | ) | $ | 1,345,223 | |
| | | | | | | | | | | | | | |
Interest and other financing costs | | $ | — | | $ | — | | $ | — | | $ | — | | $ | 47,187 | | $ | 47,187 | |
Capital expenditures | | $ | 230,947 | | $ | 40,299 | | $ | (12 | ) | $ | 271,234 | | $ | 2,059 | | $ | 273,293 | |
Segment assets | | $ | 855,172 | | $ | 658,486 | | $ | 459,457 | | $ | 1,973,115 | | $ | 91,482 | | $ | 2,064,597 | |
F-57
Table of Contents
Note 13 — Segment Information (Continued)
| | | | | | | | | | | | | | | | | | | |
| | Texas | | Oklahoma | | Rocky
Mountains | | Total
Segments | | Corporate
and Other | | Consolidated | |
|---|
Year Ended December 31, 2010:
|
|
|
|
|
|
|
|
|
|
|
|
|
|
|
|
|
Total segment gross margin | | $ | 128,682 | | $ | 93,617 | | $ | 4,440 | | $ | 226,739 | | $ | 650 | | $ | 227,389 | |
Operations and maintenance expenses | | | 29,236 | | | 23,955 | | | 296 | | | 53,487 | | | — | | | 53,487 | |
Depreciation and amortization | | | 24,696 | | | 33,154 | | | 3,061 | | | 60,911 | | | 1,661 | | | 62,572 | |
General and administrative expenses | | | 9,966 | | | 8,655 | | | 1,775 | | | 20,396 | | | 19,951 | | | 40,347 | |
Taxes other than income | | | 2,191 | | | 2,503 | | | 27 | | | 4,721 | | | 5 | | | 4,726 | |
Equity in loss (earnings) from unconsolidated affiliates | | | 3,139 | | | (2,840 | ) | | 20,181 | | | 20,480 | | | — | | | 20,480 | |
| | | | | | | | | | | | | | |
Operating income (loss) | | $ | 59,454 | | $ | 28,190 | | $ | (20,900 | ) | $ | 66,744 | | $ | (20,967 | ) | $ | 45,777 | |
| | | | | | | | | | | | | | |
Natural gas sales | | $ | 188,588 | | $ | 197,632 | | $ | 1,234 | | $ | 387,454 | | $ | (6,001 | ) | $ | 381,453 | |
Natural gas liquids sales | | | 256,501 | | | 236,781 | | | — | | | 493,282 | | | (2,302 | ) | | 490,980 | |
Transportation, compression and processing fees | | | 43,233 | | | 7,336 | | | 17,829 | | | 68,398 | | | — | | | 68,398 | |
Condensate and other | | | 11,253 | | | 32,462 | | | 1,666 | | | 45,381 | | | 8,952 | | | 54,333 | |
| | | | | | | | | | | | | | |
Sales to external customers | | $ | 499,575 | | $ | 474,211 | | $ | 20,729 | | $ | 994,515 | | $ | 649 | | $ | 995,164 | |
| | | | | | | | | | | | | | |
Interest and other financing costs | | $ | — | | $ | — | | $ | — | | $ | — | | $ | 53,605 | | $ | 53,605 | |
Capital expenditures | | $ | 106,792 | | $ | 23,320 | | $ | (14 | ) | $ | 130,098 | | $ | 406 | | $ | 130,504 | |
Segment assets | | $ | 594,528 | | $ | 658,729 | | $ | 651,096 | | $ | 1,904,353 | | $ | 2,640 | | $ | 1,906,993 | |
F-58
Table of Contents
Note 14 — Quarterly Financial Data (Unaudited)
| | | | | | | | | | | | | | | | |
| | Year 2012 | |
|---|
| | Quarter Ended | |
| |
|---|
| | March 31 | | June 30 | | September 30 | | December 31 | | Year | |
|---|
| | (In thousands, except per unit information)
| |
|---|
Revenue | | $ | 337,228 | | $ | 317,303 | | $ | 366,393 | | $ | 396,796 | | $ | 1,417,720 | |
Operating (loss) income(a) | | | (132,684 | ) | | 35,530 | | | 43,185 | | | (28,645 | ) | | (82,614 | ) |
Net (loss) income(a) | | | (147,671 | ) | | 21,118 | | | 28,925 | | | (41,342 | ) | | (138,970 | ) |
Preferred unit distributions | | | (8,698 | ) | | (8,915 | ) | | (9,138 | ) | | (9,366 | ) | | (36,117 | ) |
Net (loss) income to common units(a) | | | (156,369 | ) | | 12,203 | �� | | 19,787 | | | (50,708 | ) | | (175,087 | ) |
Basic net (loss) income per common unit | | | (2.20 | ) | | 0.17 | | | 0.27 | | | (0.66 | ) | | (2.39 | ) |
Diluted net (loss) income per common unit | | | (2.20 | ) | | 0.14 | | | 0.23 | | | (0.66 | ) | | (2.39 | ) |
| | | | | | | | | | | | | | | | |
| | Year 2011 | |
|---|
| | Quarter Ended | |
| |
|---|
| | March 31 | | June 30 | | September 30 | | December 31 | | Year | |
|---|
| | (In thousands, except per unit information)
| |
|---|
Revenue | | $ | 289,925 | | $ | 346,056 | | $ | 353,691 | | $ | 355,551 | | $ | 1,345,223 | |
Operating income (loss)(a) | | | 16,352 | | | 20,178 | | | (146,282 | ) | | 20,302 | | | (89,450 | ) |
Net income (loss)(a) | | | 3,532 | | | (9,361 | ) | | (157,736 | ) | | 7,253 | | | (156,312 | ) |
Preferred unit distributions | | | (7,880 | ) | | (8,076 | ) | | (8,279 | ) | | (8,486 | ) | | (32,721 | ) |
Net loss to common units(a) | | | (4,348 | ) | | (17,437 | ) | | (166,015 | ) | | (1,233 | ) | | (189,033 | ) |
Basic net loss per common unit | | | (0.07 | ) | | (0.26 | ) | | (2.51 | ) | | (0.02 | ) | | (2.86 | ) |
Diluted net loss per common unit | | | (0.07 | ) | | (0.26 | ) | | (2.51 | ) | | (0.02 | ) | | (2.86 | ) |
- (a)
- Includes impairment charges of $148,744,000, $66,996,000, $170,000,000 and $3,409,000 for each of the three months ended March 31, 2012, December 31, 2012, September 30, 2011 and December 31, 2011, respectively, primarily related to our Rocky Mountains assets.
Note 15 — Subsequent Events (Unaudited)
Merger Agreement with Kinder Morgan. On January 29, 2013, we announced a definitive merger agreement with Kinder Morgan Energy Partners, L.P. ("Kinder Morgan"), under which Kinder Morgan will acquire all of Copano's outstanding equity in a unit-for-unit transaction with an exchange ratio of 0.4563 Kinder Morgan units per Copano unit. The transaction is valued at approximately $5 billion (including the assumption of debt) based on the closing price for Kinder Morgan's units on January 29, 2013. Our board of directors and Kinder Morgan's board of directors have approved the merger agreement, and we have agreed to submit the merger agreement to a vote of our unitholders and to recommend that unitholders approve the merger agreement. TPG, our largest unitholder (owning over 14% of our outstanding equity), has agreed to vote all of its Series A convertible preferred units (and common units, if any) in favor of adoption of the merger agreement.
At the effective time of the merger, each of our common units outstanding or deemed outstanding as of immediately prior to the effective time will be converted into the right to receive 0.4563 Kinder Morgan common units (the "Merger Consideration"). All grants then outstanding under our LTIP will vest, outstanding options and unit appreciation rights will be deemed net exercised, and all resulting common units will convert into the right to receive the Merger Consideration. The merger agreement includes customary representations, warranties and covenants, and specific agreements relating to the conduct of our business and Kinder Morgan's business between the date of the signing of the merger agreement and
F-59
Table of Contents
Note 15 — Subsequent Events (Unaudited) (Continued)
the closing of the merger, and the efforts of the parties to cause the merger transactions to be completed. In addition to certain other covenants, we have agreed not to encourage, solicit, initiate or facilitate any takeover proposal from a third party or enter into any agreement, arrangement or understanding requiring us to abandon, terminate or fail to consummate the merger and related transactions.
Completion of the merger is subject to satisfaction or waiver of certain closing conditions including, among others, customary regulatory approvals (including under the Hart-Scott Rodino Antitrust Improvements Act of 1976, as amended), approval by our unitholders and registration of the Merger Consideration under the securities laws. The merger agreement contains certain termination rights for both us and Kinder Morgan and further provides that, upon termination of the merger agreement, under certain circumstances, we may be required to pay Kinder Morgan a termination fee equal to $115 million, and under certain other circumstances, Kinder Morgan may be required to pay us a termination fee equal to $75 million.
Under the terms of the merger agreement, we have agreed to conduct our business in the ordinary course and in all material respects in substantially the same manner as conducted prior to the date of the merger agreement, subject to certain conditions and restrictions including, but not limited to, restrictions on our ability to (i) commit to new capital expenditures, (ii) acquire, invest in, or dispose of any material properties, assets, or equity interests as defined in the merger agreement, (iii) incur new debt, refinance, or guarantee debt or borrowed money, (iv) enter into, terminate, or amend certain material contracts and (v) issue, grant, sell, or redeem our common units or pay distributions in excess of $0.575 per common unit.
We expect the proposed transaction to close in the third quarter of 2013. Additional information regarding the proposed transaction and the terms and conditions of the merger agreement and voting agreement is set forth in our Current Report on Form 8-K filed on February 4, 2013.
F-60
Table of Contents
INDEPENDENT AUDITORS' REPORT
To the Members of Eagle Ford Gathering, L.L.C.:
We have audited the accompanying consolidated financial statements of Eagle Ford Gathering, L.L.C. and subsidiary (collectively the "Company"), which comprise the consolidated balance sheets as of December 31, 2012 and 2011, and the related consolidated statements of operations, members' equity and cash flows for the years ended December 31, 2012 and 2011, and for the period from May 12, 2010 (date of inception) to December 31, 2010, and the related notes to the consolidated financial statements.
Management's Responsibility for the Consolidated Financial Statements
Management is responsible for the preparation and fair presentation of these consolidated financial statements in accordance with accounting principles generally accepted in the United States of America; this includes the design, implementation, and maintenance of internal control relevant to the preparation and fair presentation of consolidated financial statements that are free from material misstatement, whether due to fraud or error.
Auditors' Responsibility
Our responsibility is to express an opinion on these consolidated financial statements based on our audits. We conducted our audits in accordance with auditing standards generally accepted in the United States of America. Those standards require that we plan and perform the audit to obtain reasonable assurance about whether the consolidated financial statements are free from material misstatement.
An audit involves performing procedures to obtain audit evidence about the amounts and disclosures in the consolidated financial statements. The procedures selected depend on the auditor's judgment, including the assessment of the risks of material misstatement of the consolidated financial statements, whether due to fraud or error. In making those risk assessments, the auditor considers internal control relevant to the Company's preparation and fair presentation of the consolidated financial statements in order to design audit procedures that are appropriate in the circumstances, but not for the purpose of expressing an opinion on the effectiveness of the Company's internal control. Accordingly, we express no such opinion. An audit also includes evaluating the appropriateness of accounting policies used and the reasonableness of significant accounting estimates made by management, as well as evaluating the overall presentation of the consolidated financial statements.
We believe that the audit evidence we have obtained is sufficient and appropriate to provide a basis for our audit opinion.
Opinion
In our opinion, the consolidated financial statements referred to above present fairly, in all material respects, the financial position of Eagle Ford Gathering, L.L.C. and its subsidiary as of December 31, 2012 and 2011, and the results of their operations and their cash flows for the years ended December 31, 2012 and 2011, and for the period from May 12, 2010 (date of inception) to December 31, 2010 in accordance with accounting principles generally accepted in the United States of America.
/s/ Deloitte & Touche LLP
Houston, Texas
March 1, 2013
F-61
Table of Contents
EAGLE FORD GATHERING LLC
Consolidated Balance Sheets
| | | | | | | |
| | December 31, | |
|---|
| | 2012 | | 2011 | |
|---|
ASSETS | | | | | | | |
Current assets: | | | | | | | |
Cash and cash equivalents | | $ | 2,992,297 | | $ | 2,001,088 | |
Accounts receivable, net | | | | | | | |
Trade | | | 43,447,485 | | | 12,962,059 | |
Related party | | | 18,761,624 | | | 4,647,165 | |
Prepaid expenses | | | 500,739 | | | 89,688 | |
| | | | | | |
Total current assets | | | 65,702,145 | | | 19,700,000 | |
| | | | | | |
Property and equipment, net | | | 230,325,965 | | | 206,328,120 | |
Intangible assets, net | | | 30,075,486 | | | 31,816,732 | |
Other assets, net | | | 4,958,571 | | | 731,707 | |
| | | | | | |
Total assets | | $ | 331,062,167 | | $ | 258,576,559 | |
| | | | | | |
LIABILITIES AND MEMBERS' EQUITY | | | | | | | |
Current liabilities: | | | | | | | |
Accounts payable | | $ | 22,308,589 | | $ | 11,102,884 | |
Payable to related party | | | 2,796,455 | | | 8,893,976 | |
Accrued liabilities | | | 2,088,397 | | | 3,630,221 | |
| | | | | | |
Total current liabilities | | | 27,193,441 | | | 23,627,081 | |
| | | | | | |
Deferred tax liability | | | 140,329 | | | 35,372 | |
Asset retirement obligations | | | 301,222 | | | 277,696 | |
Commitments and contingencies (Note 5) | | | | | | | |
Members' equity | | | 303,427,175 | | | 234,636,410 | |
| | | | | | |
Total liabilities and members' equity | | $ | 331,062,167 | | $ | 258,576,559 | |
| | | | | | |
The accompanying notes are an integral part of these consolidated financial statements.
F-62
Table of Contents
EAGLE FORD GATHERING LLC
Consolidated Statements of Operations
| | | | | | | | | | |
| | Year Ended December 31, | | Period From
May 12, 2010 (Date
of Inception) to
December 31, 2010 | |
|---|
| | 2012 | | 2011 | |
|---|
Revenue: | | | | | | | | | | |
Natural gas liquids sales | | $ | 128,335,876 | | $ | 34,139,996 | | $ | — | |
Natural gas liquids sales — related party | | | 178,592,798 | | | 25,348,632 | | | — | |
Gathering and processing fees | | | 103,908,101 | | | 8,668,694 | | | — | |
Gathering and processing fees — related party | | | 20,019 | | | 10,928 | | | — | |
Condensate and other | | | 4,923,166 | | | 1,808,220 | | | — | |
Condensate and other — related party | | | 143,692 | | | — | | | — | |
| | | | | | | | |
Total revenue | | | 415,923,652 | | | 69,976,470 | | | — | |
| | | | | | | | |
Costs and expenses: | | | | | | | | | | |
Cost of natural gas and natural gas liquids | | | 285,460,030 | | | 28,870,947 | | | — | |
Cost of natural gas and natural gas liquids — related party | | | 25,245,194 | | | 10,075,892 | | | — | |
Transportation — related party | | | 15,186,892 | | | 2,629,621 | | | — | |
Depreciation and amortization | | | 12,496,135 | | | 3,801,902 | | | — | |
Operating and maintenance | | | 3,497,820 | | | 1,471,158 | | | 5,497 | |
General and administrative | | | 808,870 | | | 412,829 | | | 92,607 | |
Taxes other than income | | | 2,932,350 | | | 223,344 | | | — | |
| | | | | | | | |
Total costs and expenses | | | 345,627,291 | | | 47,485,693 | | | 98,104 | |
| | | | | | | | |
Operating income (loss) | | | 70,296,361 | | | 22,490,777 | | | (98,104 | ) |
Provision for income taxes | | | 827,646 | | | 275,151 | | | — | |
| | | | | | | | |
Net income (loss) | | $ | 69,468,715 | | $ | 22,215,626 | | $ | (98,104 | ) |
| | | | | | | | |
- (1)
- Exclusive of operations and maintenance and depreciation and amortization shown separately below.
The accompanying notes are an integral part of these consolidated financial statements.
F-63
Table of Contents
EAGLE FORD GATHERING LLC
Consolidated Statements of Cash Flows
| | | | | | | | | | |
| | Year Ended December 31, | |
| |
|---|
| | Period From May 12,
2010 (Date of Inception)
to December 31, 2010 | |
|---|
| | 2012 | | 2011 | |
|---|
Cash flow from operating activities: | | | | | | | | | | |
Net income (loss) | | $ | 69,468,715 | | $ | 22,215,626 | | $ | (98,104 | ) |
Adjustments to reconcile net income (loss) to net cash provided by (used in) operating activities: | | | | | | | | | | |
Depreciation and amortization | | | 12,496,135 | | | 3,801,902 | | | — | |
Deferred tax provision | | | 104,956 | | | 35,372 | | | — | |
Other noncash items | | | 23,527 | | | 7,426 | | | — | |
Changes in assets and liabilities: | | | | | | | | | | |
Accounts receivable | | | (30,485,426 | ) | | (12,962,059 | ) | | — | |
Receivable from related party | | | (14,114,459 | ) | | (4,646,645 | ) | | — | |
Prepaid expenses | | | (411,051 | ) | | (34,423 | ) | | (55,265 | ) |
Accounts payable | | | 12,465,015 | | | 9,185,477 | | | 465 | |
Payable to related party | | | 379,235 | | | 2,078,015 | | | 11,628 | |
Accrued liabilities | | | 559,348 | | | 319,775 | | | 446 | |
| | | | | | | | |
Net cash provided by (used in) operating activities | | | 50,485,995 | | | 20,000,466 | | | (140,830 | ) |
| | | | | | | | |
Cash flow from investing activities: | | | | | | | | | | |
Additions to property, plant and equipment | | | (44,886,070 | ) | | (145,713,720 | ) | | (51,576,888 | ) |
Additions to intangible assets | | | 296,098 | | | (32,355,121 | ) | | — | |
Other, net | | | (4,226,864 | ) | | (731,707 | ) | | — | |
| | | | | | | | |
Net cash used in investing activities | | | (48,816,836 | ) | | (178,800,548 | ) | | (51,576,888 | ) |
| | | | | | | | |
Cash flow from financing activities: | | | | | | | | | | |
Equity contributions from members | | | 49,238,000 | | | 171,468,000 | | | 59,963,888 | |
Distributions to members | | | (49,915,950 | ) | | (18,913,000 | ) | | — | |
| | | | | | | | |
Net cash (used in) provided by financing activities | | | (677,950 | ) | | 152,555,000 | | | 59,963,888 | |
| | | | | | | | |
Net increase (decrease) in cash and cash equivalents | | | 991,209 | | | (6,245,082 | ) | | 8,246,170 | |
Cash and cash equivalents, beginning of period | | | 2,001,088 | | | 8,246,170 | | | — | |
| | | | | | | | |
Cash and cash equivalents, end of year | | $ | 2,992,297 | | $ | 2,001,088 | | $ | 8,246,170 | |
| | | | | | | | |
Supplemental disclosure to the Statement of Cash Flows — | | | | | | | | | | |
Accrued capital expenditures | | $ | (9,837,238 | ) | $ | 5,651,453 | | $ | 6,379,303 | |
| | | | | | | | |
The accompanying notes are an integral part of these consolidated financial statements.
F-64
Table of Contents
EAGLE FORD GATHERING LLC
Consolidated Statements of Members' Equity
| | | | | | | | | | |
| | Copano Eagle
Ford LLC | | Kinder Morgan
Eagle Ford,
L.L.C. | | Total | |
|---|
Balance at May 12, 2010 (Date of inception) | | $ | — | | $ | — | | $ | — | |
Contributions | | | 29,981,944 | | | 29,981,944 | | | 59,963,888 | |
Net Loss | | | (49,052 | ) | | (49,052 | ) | | (98,104 | ) |
| | | | | | | | |
Balance at December 31, 2010 | | | 29,932,892 | | | 29,932,892 | | | 59,865,784 | |
Contributions | | | 85,734,000 | | | 85,734,000 | | | 171,468,000 | |
Distributions | | | (9,456,500 | ) | | (9,456,500 | ) | | (18,913,000 | ) |
Net income | | | 11,107,813 | | | 11,107,813 | | | 22,215,626 | |
| | | | | | | | |
Balance at December 31, 2011 | | | 117,318,205 | | | 117,318,205 | | | 234,636,410 | |
Contributions | | | 24,619,000 | | | 24,619,000 | | | 49,238,000 | |
Distributions | | | (24,957,975 | ) | | (24,957,975 | ) | | (49,915,950 | ) |
Net income | | | 34,734,357 | | | 34,734,358 | | | 69,468,715 | |
| | | | | | | | |
Balance at December 31, 2012 | | $ | 151,713,587 | | $ | 151,713,588 | | $ | 303,427,175 | |
| | | | | | | | |
The accompanying notes are an integral part of these consolidated financial statements.
F-65
Table of Contents
EAGLE FORD GATHERING LLC
Notes to Consolidated Financial Statements
Note 1 — Organization and Business
Eagle Ford Gathering LLC ("Eagle Ford" and together with its subsidiary, Eagle Ford Crossover LLC, the "Company") is a Delaware limited liability company. The Company was formed on May 12, 2010 as a 50/50 joint venture between Kinder Morgan Eagle Ford LLC ("Kinder Morgan") and Copano Eagle Ford LLC ("Copano") to develop and construct natural gas gathering facilities and to provide gathering, transportation and processing services to natural gas producers in the Eagle Ford Shale play in south Texas. The Company began operations in August 2011 upon completion of its gathering system. Eagle Ford is funded through capital contributions from the members.
Pursuant to the operating agreement among the members, net income, contributions and distributions are allocated among the member interests in proportion to their respective equity interest. Members' liabilities are limited to the amount of capital contributed.
Note 2 — Summary of Significant Accounting Policies
The accompanying consolidated financial statements and related notes include the Company's assets, liabilities and results of operations for each of the periods presented. All intercompany accounts and transactions are eliminated in the consolidated financial statements.
The preparation of financial statements in conformity with accounting principles generally accepted in the United States of America requires the Company's management to make estimates and assumptions that affect the reported amounts of assets and liabilities and disclosures of contingent assets and liabilities, if any, at the date of the financial statements, and the reported amounts of revenues and expenses during the reporting period. Actual results could differ from those estimates.
Cash and cash equivalents include all highly liquid cash investments with original maturities of three months or less when purchased.
Property and equipment consist of natural gas gathering systems and related equipment, and is recorded at cost. Depreciation is provided on a straight-line basis over the estimated useful life for each asset. Depreciation expense for the years ended December 31, 2012 and 2011 and for the period from
F-66
Table of Contents
Note 2 — Summary of Significant Accounting Policies (Continued)
May 12, 2010 (date of inception) to December 31, 2010 was $11,050,987, $3,263,513 and $0, respectively. Property and equipment included the following:
| | | | | | | | | |
| |
| | December 31, | |
|---|
| | Useful
Lives | |
|---|
| | 2012 | | 2011 | |
|---|
Property and equipment, at cost | | | | | | | | | |
Pipelines and equipment | | 10-30 years | | $ | 240,008,072 | | $ | 208,623,570 | |
Construction in progress | | N/A | | | 4,650,759 | | | 968,063 | |
| | | | | | | | |
| | | | | 244,658,831 | | | 209,591,633 | |
Less accumulated depreciation and amortization | | | | | (14,332,866 | ) | | (3,263,513 | ) |
| | | | | | | | |
Property and equipment, net | | | | $ | 230,325,965 | | $ | 206,328,120 | |
| | | | | | | | |
The Company amortizes existing intangible assets and any costs incurred to renew or extend the terms of existing intangible assets over the contract term or estimated useful life, as applicable. Initial costs of acquiring new intangible assets are amortized over the estimated useful life of the related tangible assets. Any related renewals or extension costs of intangible assets are expensed over the contract term using the straight-line method. During 2012 and 2011, the Company did not acquire any rights-of-way with future renewals or extensions. Amortization expense was $1,445,148, $538,390 and $0 for the years ended December 31, 2012 and 2011 and for the period from May 12, 2010 (date of inception) to December 31, 2010, respectively. Estimated aggregate amortization expense is approximately: $1,451,518 for2013, $1,451,518 for2014, $1,451,518 for2015, $1,451,518 for2016, $1,451,518 for2017. Intangible assets consisted of the following:
| | | | | | | | | |
| |
| | December 31, | |
|---|
| | Useful
Lives | |
|---|
| | 2012 | | 2011 | |
|---|
Rights-of-way and easements | | 20-30 years | | $ | 32,040,657 | | $ | 32,355,122 | |
Less accumulated amortization | | | | | (1,965,171 | ) | | (538,390 | ) |
| | | | | | | | |
Intangible assets, net | | | | $ | 30,075,486 | | $ | 31,816,732 | |
| | | | | | | | |
Other assets consist of facility fees paid to a third party which are amortized over the contract term.
Asset retirement obligations ("AROs") are legal obligations associated with the retirement of tangible long-lived assets that result generally from the acquisition, construction, development or normal operation of the asset. When an ARO is incurred, the Company recognizes a liability for the fair value of the ARO and an increase in the carrying amount of the related long-lived asset. Over time, the liability is accreted to its present value and recognized as accretion expense each period, and the capitalized amount is depreciated over the remaining useful life of the related long-lived asset. Upon settlement of the liability, the Company either settles the obligation for its recorded amount or incurs a gain or loss on settlement. The Company has recorded AROs related to (i) rights-of-way and easements over property it does not own and (ii) regulatory requirements where a legal or contractual obligation exists upon abandonment of the related facility.
F-67
Table of Contents
Note 2 — Summary of Significant Accounting Policies (Continued)
The following table presents information regarding the Company's AROs:
| | | | |
ARO liability balance, December 31, 2010 | | $ | — | |
AROs incurred in 2011 | | | 270,270 | |
Accretion for conditional obligations | | | 7,426 | |
| | | | |
ARO liability balance, December 31, 2011 | | | 277,696 | |
Accretion for conditional obligations | | | 23,526 | |
| | | | |
ARO liability balance, December 31, 2012 | | $ | 301,222 | |
| | | | |
At December 31, 2012 and 2011, there were no assets legally restricted for purposes of settling AROs.
Substantially all of the Company's accounts receivable at December 31, 2012 and 2011 result from the gathering and processing of gas for other companies in the oil and gas industry. This concentration of customers may impact the Company's overall credit risk, either positively or negatively, in that these entities may be similarly affected by industry-wide changes in economic or other conditions. Such receivables are generally not collateralized. However, the Company performs credit evaluations on all its customers to minimize exposure to credit risk. During 2012 and 2011, the Company had no credit losses.
During the years ended December 31, 2012 and 2011 and for the period from May 12, 2010 (date of inception) to December 31, 2010, the Company's revenue was derived from a limited number of counterparties, of which an affiliate of an investment grade company and an affiliate of Copano accounted for 67%, 49% and 36%, respectively, of the Company's revenue.
The Company's financial instruments consist of cash, accounts receivable, prepaid expenses, accounts payable and accrued liabilities. The carrying amounts of financial instruments approximate fair value due to their short maturities.
Using the revenue recognition criteria of evidence of an arrangement, delivery of a product and the determination of price, the Company's natural gas and NGL revenue is recognized in the period when the physical product is delivered to the customer and in an amount based on the pricing terms of an executed contract. The Company's gathering, transportation and processing service revenue is recognized in the period when the service is provided and includes the Company's fee-based service revenue including processing under firm capacity arrangements. In addition, collectability is evaluated on a customer-by-customer basis. New and existing customers are subject to a credit review process, which evaluates the customers' financial position and their ability to pay.
The Company's sale and purchase arrangements are primarily accounted for on a gross basis in the statements of operations as natural gas sales and costs of natural gas, respectively. These transactions are contractual arrangements that establish the terms of the purchase of natural gas at a specified location and the sale of natural gas at a different location on the same or on another specified date. All transactions require physical delivery of the natural gas, and transfer of the risk and reward of ownership are evidenced by title transfer, assumption of environmental risk, transportation scheduling, credit risk and counterparty nonperformance risk.
F-68
Table of Contents
Note 2 — Summary of Significant Accounting Policies (Continued)
On occasion, the Company enters into buy/sell arrangements that are accounted for on a net basis in the statements of operations as either a net natural gas sale or a net cost of natural gas, as appropriate. These purchase and sale transactions are generally detailed either jointly, in a single contract or separately, in individual contracts that are entered into concurrently or in contemplation of one another with a single or multiple counterparties.
Due to the Company's limited liability status, the tax consequences of the Company pass through to the individual members. Accordingly, no provision has been made for federal or state income taxes. However, the Company is subject to the Texas margin tax, which is imposed at a maximum rate of 0.7% on its annual "margin," as defined in the Texas margin tax statute enacted in 2007. The annual margin generally is calculated as revenues for federal income tax purposes less the "cost of the products sold" as defined in the statue. The provision for the Texas margin tax totaled $827,646 and $275,151 for the years ended December 31, 2012 and 2011, respectively. Under the provisions of Accounting Standards Codification ("ASC") 740, "Accounting for Income Taxes," the Company is required to record the effects on deferred taxes for a change in tax rates or tax law in the period that includes the enactment date. Under ASC 740, taxes based on income, like the Texas margin tax, are accounted for using the liability method under which deferred income taxes are recognized for the future tax effects of temporary differences between the financial statement carrying amounts and the tax basis of existing assets and liabilities using the enacted statutory tax rates in effect at the end of the period. A valuation allowance for deferred tax assets is recorded when it is more likely than not that the benefit from the deferred tax asset will not be realized. The deferred tax provisions presented on the accompanying consolidated balance sheets relates to the effect of the temporary book/tax timing differences associated with depreciation.
The Company's management believes that the disclosures are adequate to make the information presented not misleading. In the preparation of these financial statements, the Company's management evaluated subsequent events through March 1, 2013, the issuance date of the financial statements.
Note 3 — New Accounting Pronouncements
The Company's management has reviewed recently issued, but not yet adopted, accounting standards and updates in order to determine their effects, if any, on the Company's consolidated results of operations, financial position and cash flows. Most of the recent updates represented technical corrections to the accounting literature or applied to other industries and are not expected to have a material impact on the Company's consolidated cash flows, results of operations or financial position.
Note 4 — Related Party Transactions
The Company pays Copano management fees for services as managing member of the Company and operation and administration of a portion of the Company's natural gas gathering assets. For the years ended December 31, 2012 and 2011 and for the period from May 12, 2010 (date of inception) to December 31, 2010, the Company paid management fees totaling $532,417, $274,772 and $81,264, respectively, reflected in general and administrative expenses. In addition, for the Company's capital projects managed by Copano, the Company pays Copano a capital project fee of 1% of direct project costs incurred. For the years ended December 31, 2012 and 2011 and for the period from May 12, 2010 (date of inception) to December 31, 2010, the Company paid Copano fees of $180,754, $840,055 and $599,639, respectively, reflected in property and equipment. For the years ended December 31, 2012 and 2011 and
F-69
Table of Contents
Note 4 — Related Party Transactions (Continued)
for the period from May 12, 2010 (date of inception) to December 31, 2010, the Company paid reimbursable costs totaling $2,316,557, $15,529,264 and $5,765,071, respectively, to Copano for project costs paid by Copano. As of December 31, 2012 and 2011, the Company owed Copano and its affiliate $383,351 and $806,313, respectively.
The Company pays an affiliate of Kinder Morgan management fees for operation and administration of the Company's natural gas gathering assets owned by Eagle Ford Crossover LLC. For the years ended December 31, 2012 and 2011 and for the period from May 12, 2010 (date of inception) to December 31, 2010, the Company paid management fees of $195,000, $47,177 and $0, respectively, to this Kinder Morgan affiliate that is reflected in general and administrative expenses. In addition, for the capital projects managed by Kinder Morgan, the Company pays Kinder Morgan a capital project fee of 1% of direct project costs incurred. For the years ended December 31, 2012 and 2011 and for the period from May 12, 2010 (date of inception) to December 31, 2010, the Company paid an affiliate of Kinder Morgan a fee of $195,411, $825,309 and $0, respectively, reflected in property and equipment. For the years ended December 31, 2012 and 2011 and for the period from May 12, 2010 (date of inception) to December 31, 2010, the Company paid reimbursable costs totaling $26,742,399, $91,654,210 and $0, respectively, to an affiliate of Kinder Morgan for project costs paid by it. As of December 31, 2012 and 2011, the Company owed Kinder Morgan's affiliate $327,057 and $8,087,663, respectively.
The Company and an affiliate of Copano are party to an agreement under which an affiliate of Copano provides natural gas processing and related services to the Company. For the years ended December 31, 2012 and 2011 and for the period from May 12, 2010 (date of inception) to December 31, 2010, the Company sold $178,592,798, $25,348,632 and $0, respectively, of natural gas liquids to an affiliate of Copano. In addition, the Company paid $24,227,165, $2,559,307 and $0, to an affiliate of Copano for services provided during the years ended December 31, 2012 and 2011 and for the period from May 12, 2010 (date of inception) to December 31, 2010, respectively, and $882,761, $7,159,501 and $0 for gas purchases. As of December 31, 2012 and 2011, Copano's affiliate owed the Company $18,760,690 and $4,644,036 for services rendered under this agreement.
Beginning in 2011, the Company and an affiliate of Kinder Morgan are party to an agreement under which the Kinder Morgan affiliate provides natural gas transportation and related services to the Company. For the year ended December 31, 2012, the Company paid the Kinder Morgan affiliate $135,268 for gas purchases and $15,186,893 for transportation services and received $20,019 from the Kinder Morgan affiliate for gathering services. For the year ended December 31, 2011, the Company paid the Kinder Morgan affiliate $357,084 for gas purchases and $2,629,621 for transportation services and received $10,928 from the Kinder Morgan affiliate for gathering services. As of December 31, 2012 and 2011, Kinder Morgan's affiliate owed the Company $2,086,046 and $3,128 for services rendered under this agreement.
During 2012, the Company paid Copano $4,785,000 for stabilization services to be provided over the term of the processing arrangement with Copano. The Company has recorded this payment as prepaid stabilization fees and is amortizing this amount to expense as services are provided to the Company. For the year ended December 31, 2012, the Company recognized amortization expense of $96,993 related to the stabilization services. As of December 31, 2012, $4,688,007 of prepaid stabilization fees remain to be amortized over the processing arrangement with Copano.
During 2011, the Company purchased approximately 16,000 feet of 24-inch pipe from an affiliate of Copano for $633,022.
F-70
Table of Contents
Note 4 — Related Party Transactions (Continued)
Management believes that the terms of these transactions are fair to the Company; however, it cannot be certain that such transactions have terms as favorable to the Company as could have been achieved with an unaffiliated entity.
Note 5 — Commitments and Contingencies
The Company leases certain equipment periodically for use on its gathering system under month-to-month operating leases. Rental expense was $303,561, $757,768 and $0 for the years ended December 31, 2012 and 2011 and for the period from May 12, 2010 (date of inception) to December 31, 2010, respectively. As of December 31, 2012, the Company has no future commitments payable from operating leases.
The Company is a party to processing and product sales agreements under which its counterparties have committed firm processing capacity to the Company. Under these agreements, the Company is obligated to pay approximately $9,240,750 for2013, $11,004,750 for2014, $12,647,250 for2015, $12,681,900 for 2016, $12,647,250 for 2017 and $55,555,850 thereafter to the extent the Company's natural gas deliveries fall below the committed quantity. These commitments expire on December 31, 2021 and 2024.
In the ordinary course of business, the Company is subject to various laws and regulations. In the opinion of the Company's management, compliance with existing laws and regulations will not materially affect the Company's financial position, results of operations or cash flows.
Although the Company may, from time to time, be involved in litigation and claims arising out of its operations in the normal course of business, the Company is not currently a party to any material legal proceedings. In addition, management of the Company is not aware of any material legal or governmental proceedings against the Company, or contemplated to be brought against the Company, under the various environmental protection statutes to which the Company is subject, that would have a material effect on the Company's financial position, results of operations or cash flows.
Note 6 — Subsequent Events
On January 29, 2013, the parent entities of Kinder Morgan and Copano, Kinder Morgan Energy Partners, L.P. ("Kinder") and Copano Energy, L.L.C. ("Copano Energy"), announced a definitive merger agreement, under which Kinder will acquire all of Copano Energy's outstanding equity in a unit-for-unit transaction with an exchange ratio of 0.4563 Kinder units per Copano Energy unit. The transaction is valued at approximately $5 billion (including the assumption of debt) based on the closing price for Kinder's common units on January 29, 2013. The merger agreement includes customary representations, warranties and covenants, and specific agreements relating to the conduct of Copano Energy's and Kinder's respective businesses between the date of the signing of the merger agreement and the closing of the merger, and the efforts of the parties to cause the merger transactions to be completed. Completion of the merger is subject to satisfaction or waiver of certain closing conditions including, among others, customary regulatory approvals, approval by Copano Energy's unitholders and registration of Kinder's common units to be issued as merger consideration under the securities laws.
F-71
Table of Contents
INDEPENDENT AUDITORS' REPORT
To the Members of Bighorn Gas Gathering L.L.C.:
We have audited the accompanying financial statements of Bighorn Gas Gathering, L.L.C. (the "Company"), which comprise the balance sheets as of December 31, 2012 and 2011, and the related statements of operations, members' equity and cash flows for the years ended December 31, 2012, 2011, and 2010, and the related notes to the financial statements.
Management's Responsibility for the Financial Statements
Management is responsible for the preparation and fair presentation of these financial statements in accordance with accounting principles generally accepted in the United States of America; this includes the design, implementation, and maintenance of internal control relevant to the preparation and fair presentation of financial statements that are free from material misstatement, whether due to fraud or error.
Auditors' Responsibility
Our responsibility is to express an opinion on these financial statements based on our audits. We conducted our audits in accordance with auditing standards generally accepted in the United States of America. Those standards require that we plan and perform the audit to obtain reasonable assurance about whether the financial statements are free from material misstatement.
An audit involves performing procedures to obtain audit evidence about the amounts and disclosures in the financial statements. The procedures selected depend on the auditor's judgment, including the assessment of the risks of material misstatement of the financial statements, whether due to fraud or error. In making those risk assessments, the auditor considers internal control relevant to the Company's preparation and fair presentation of the financial statements in order to design audit procedures that are appropriate in the circumstances, but not for the purpose of expressing an opinion on the effectiveness of the Company's internal control. Accordingly, we express no such opinion. An audit also includes evaluating the appropriateness of accounting policies used and the reasonableness of significant accounting estimates made by management, as well as evaluating the overall presentation of the financial statements.
We believe that the audit evidence we have obtained is sufficient and appropriate to provide a basis for our audit opinion.
Opinion
In our opinion, the financial statements referred to above present fairly, in all material respects, the financial position of Bighorn Gas Gathering, L.L.C. as of December 31, 2012 and 2011, and the results of its operations and its cash flows for the years ended December 31, 2012, 2011, and 2010 in accordance with accounting principles generally accepted in the United States of America.
| | |
/s/ Deloitte & Touche LLP
Houston, Texas
March 1, 2013
| | |
F-72
Table of Contents
BIGHORN GAS GATHERING, L.L.C.
Balance Sheets
| | | | | | | |
| | December 31, | |
|---|
| | 2012 | | 2011 | |
|---|
ASSETS | | | | | | | |
Current assets: | | | | | | | |
Cash and cash equivalents | | $ | 1,205,435 | | $ | 1,013,791 | |
Accounts receivable, net: | | | | | | | |
Trade | | | 2,042,670 | | | 2,472,641 | |
Related parties | | | 75,030 | | | 67,632 | |
Prepaid expenses | | | 8,400 | | | 8,400 | |
| | | | | | |
Total current assets | | | 3,331,535 | | | 3,562,464 | |
Property and equipment, net | | | 82,141,952 | | | 85,617,176 | |
Other assets, net | | | 2,127,502 | | | 2,228,920 | |
| | | | | | |
Total assets | | $ | 87,600,989 | | $ | 91,408,560 | |
| | | | | | |
LIABILITIES AND MEMBERS' EQUITY | | | | | | | |
Current liabilities: | | | | | | | |
Accounts payable: | | | | | | | |
Trade | | $ | 669,264 | | $ | 1,010,482 | |
Related parties | | | 125,338 | | | 158,948 | |
Accrued liabilities | | | 383,698 | | | 773,672 | |
| | | | | | |
Total current liabilities | | | 1,178,300 | | | 1,943,102 | |
| | | | | | |
Asset retirement obligations | | | 339,429 | | | 308,688 | |
Commitments and contingencies (Notes 4 and 6) | | | | | | | |
Members' equity | | | 86,083,260 | | | 89,156,770 | |
| | | | | | |
Total liabilities and members' equity | | $ | 87,600,989 | | $ | 91,408,560 | |
| | | | | | |
The accompanying notes are an integral part of these financial statements.
F-73
Table of Contents
BIGHORN GAS GATHERING, L.L.C.
Statements of Operations
| | | | | | | | | | |
| | Year Ended December 31, | |
|---|
| | 2012 | | 2011 | | 2010 | |
|---|
Gathering fee revenue | | $ | 23,057,410 | | $ | 26,961,804 | | $ | 31,434,453 | |
Expenses: | | | | | | | | | | |
Operating and maintenance | | | 9,365,162 | | | 9,875,759 | | | 10,921,001 | |
General and administrative | | | 422,752 | | | 497,851 | | | 630,954 | |
Recovery of doubtful accounts | | | — | | | (649,000 | ) | | — | |
Depreciation and amortization | | | 5,411,278 | | | 5,175,809 | | | 5,320,153 | |
| | | | | | | | |
Total expenses | | | 15,199,192 | | | 14,900,419 | | | 16,872,108 | |
| | | | | | | | |
Operating income | | | 7,858,218 | | | 12,061,385 | | | 14,562,345 | |
Other income: | | | | | | | | | | |
Interest income | | | — | | | — | | | — | |
Other income | | | 88,026 | | | 78,426 | | | 95,357 | |
| | | | | | | | |
Total other income | | | 88,026 | | | 78,426 | | | 95,357 | |
| | | | | | | | |
Net income | | $ | 7,946,244 | | $ | 12,139,811 | | $ | 14,657,702 | |
| | | | | | | | |
The accompanying notes are an integral part of these financial statements.
F-74
Table of Contents
BIGHORN GAS GATHERING, L.L.C.
Statements of Cash Flows
| | | | | | | | | | |
| | Year Ended December 31, | |
|---|
| | 2012 | | 2011 | | 2010 | |
|---|
Cash flows from operating activities: | | | | | | | | | | |
Net income | | $ | 7,946,244 | | $ | 12,139,811 | | $ | 14,657,702 | |
Adjustments to reconcile net income to net cash provided by operating activities: | | | | | | | | | | |
Depreciation and amortization | | | 5,411,278 | | | 5,175,809 | | | 5,320,153 | |
Accretion expense | | | 30,741 | | | 26,897 | | | 30,880 | |
Provision for doubtful accounts | | | 525,674 | | | — | | | (40,575 | ) |
Gain on disposal of assets | | | (593,415 | ) | | (9,856 | ) | | (7,500 | ) |
Changes in assets and liabilities: | | | | | | | | | | |
Accounts receivable | | | (103,101 | ) | | 29,765 | | | 279,785 | |
Prepaid expenses and other | | | — | | | 11,864 | | | (16,421 | ) |
Accounts payable | | | (374,828 | ) | | 272,898 | | | (474,325 | ) |
Accrued liabilities | | | 122,837 | | | 73,961 | | | 68,536 | |
| | | | | | | | |
Net cash provided by operating activities | | | 12,965,430 | | | 17,721,149 | | | 19,818,235 | |
| | | | | | | | |
Cash flows from investing activities: | | | | | | | | | | |
Additions to property and equipment | | | (2,222,480 | ) | | (3,551,931 | ) | | (1,039,454 | ) |
Additions to intangible assets | | | (179,426 | ) | | (137,760 | ) | | (525,793 | ) |
Proceeds from sale of assets | | | 647,874 | | | 9,856 | | | 7,500 | |
| | | | | | | | |
Net cash used in investing activities | | | (1,754,032 | ) | | (3,679,835 | ) | | (1,557,747 | ) |
| | | | | | | | |
Cash flows from financing activities: | | | | | | | | | | |
Priority distributions to members | | | (1,670,342 | ) | | (1,217,119 | ) | | (989,885 | ) |
Distributions to members | | | (12,800,000 | ) | | (17,400,000 | ) | | (20,000,000 | ) |
Equity contributions from members | | | 3,450,588 | | | 2,730,896 | | | 1,339,382 | |
| | | | | | | | |
Net cash used in financing activities | | | (11,019,754 | ) | | (15,886,223 | ) | | (19,650,503 | ) |
| | | | | | | | |
Net increase (decrease) in cash and cash equivalents | | | 191,644 | | | (1,844,909 | ) | | (1,390,015 | ) |
Cash and cash equivalents, beginning of year | | | 1,013,791 | | | 2,858,700 | | | 4,248,715 | |
| | | | | | | | |
Cash and cash equivalents, end of year | | $ | 1,205,435 | | $ | 1,013,791 | | $ | 2,858,700 | |
| | | | | | | | |
Supplemental disclosure to the Statements of Cash Flows — | | | | | | | | | | |
Accrued capital expenditures | | $ | 65,000 | | $ | 577,811 | | $ | 12,542 | |
| | | | | | | | |
The accompanying notes are an integral part of these financial statements.
F-75
Table of Contents
BIGHORN GAS GATHERING, L.L.C.
Statements of Members' Equity
| | | | | | | | | | | | | |
| | Common Member Interests | |
|---|
| | Copano
Pipelines/Rocky
Mountains, L.L.C. | | Crestone
Energy
Ventures,
L.L.C. | | Crestone
Gathering
Services,
L.L.C. | | Total | |
|---|
Balance at December 31, 2009 | | $ | 49,926,951 | | $ | 38,179,435 | | $ | 9,789,597 | | $ | 97,895,983 | |
Contributions | | | 847,730 | | | 393,322 | | | 98,330 | | | 1,339,382 | |
Allocation of 2010 contributions | | | (164,645 | ) | | 129,035 | | | 35,610 | | | — | |
Distributions | | | (11,189,885 | ) | | (7,800,000 | ) | | (2,000,000 | ) | | (20,989,885 | ) |
Net income | | | 7,960,472 | | | 5,330,449 | | | 1,366,781 | | | 14,657,702 | |
| | | | | | | | | | |
Balance at December 31, 2010 | | | 47,380,623 | | | 36,232,241 | | | 9,290,318 | | | 92,903,182 | |
Contributions | | | 1,443,666 | | | 1,029,784 | | | 257,446 | | | 2,730,896 | |
Allocation of 2011 contributions | | | (50,909 | ) | | 35,265 | | | 15,644 | | | — | |
Distributions | | | (10,091,119 | ) | | (6,786,000 | ) | | (1,740,000 | ) | | (18,617,119 | ) |
Net income | | | 6,787,692 | | | 4,259,850 | | | 1,092,269 | | | 12,139,811 | |
| | | | | | | | | | |
Balance at December 31, 2011 | | | 45,469,953 | | | 34,771,140 | | | 8,915,677 | | | 89,156,770 | |
Contributions | | | 1,981,814 | | | 1,175,020 | | | 293,754 | | | 3,450,588 | |
Allocation of 2012 contributions | | | (222,014 | ) | | 170,710 | | | 51,304 | | | — | |
Distributions | | | (8,198,342 | ) | | (4,992,000 | ) | | (1,280,000 | ) | | (14,470,342 | ) |
Net income | | | 4,871,052 | | | 2,447,602 | | | 627,590 | | | 7,946,244 | |
| | | | | | | | | | |
Balance at December 31, 2012 | | $ | 43,902,463 | | $ | 33,572,472 | | $ | 8,608,325 | | $ | 86,083,260 | |
| | | | | | | | | | |
The accompanying notes are an integral part of these financial statements.
F-76
Table of Contents
BIGHORN GAS GATHERING, L.L.C.
Notes to Financial Statements
Note 1 — Organization and Basis of Presentation
Bighorn Gas Gathering, L.L.C. (the "Company") is a Delaware limited liability company. The Company was formed in 1999 to construct and operate natural gas gathering lines and related facilities in Wyoming's Powder River Basin. As of December 31, 2012 and 2011, the members' common equity interests were owned by the following:
| | | | |
Copano Pipelines/Rocky Mountains, LLC ("Copano") | | | 51 | % |
Crestone Energy Ventures, L.L.C. ("Crestone Energy") | | | 39 | |
Crestone Gathering Services, L.L.C. ("Crestone Gathering") | | | 10 | |
| | | | |
| | | 100 | % |
| | | | |
Contributions from the Company's common members may be required from time to time and are generally required from each member in proportion to their respective ownership percentage. In addition, members may propose capital additions to the Company's gathering and transportation system. In the event that all members do not consent, consenting members may make capital contributions to the Company, which would be used to fund the prospective capital addition. Such contributions are immediately reallocated to the equity accounts of each member in proportion to their respective ownership interests. Consenting members are entitled to a priority distribution of up to 140% of the amount of capital contributed by such consenting members, as discussed below. Members' liabilities are limited to the amount of capital contributed.
For the year ended December 31, 2012, common members contributed $3,450,588, including $453,089 from Copano related to non-consent capital projects. The $453,089 of additional capital was reallocated to the remaining common members resulting in a $222,014 decrease in Copano's member interest and a corresponding increase in the remaining members' interests.
For the year ended December 31, 2011, common members contributed $2,730,896, including $103,896 from Copano related to non-consent capital projects. The $103,896 of additional capital was reallocated to the remaining common members resulting in a $50,909 decrease in Copano's member interest and a corresponding increase in the remaining members' interests.
For the year ended December 31, 2010, common members contributed $1,339,382, including $335,998 from Copano related to non-consent capital projects, of which $335,998 was allocated to the remaining common members resulting in a $164,639 decrease in Copano's member interest and a corresponding increase in the remaining members' interests.
Priority distributions related to net recovery from non-consent capital projects are made in priority to common distributions. Once 140% of the capital contributed by consenting members has been distributed to the consenting members, net revenue from non-consent projects is distributable as common distributions. Common member distributions are made using net cash flows from the Company's operations, as defined in the member agreement, in proportion to the common members' respective ownership interests. For the year ended December 31, 2012, distributions to common members totaled $14,470,342, including priority distributions to Copano of $1,670,342. For the year ended December 31, 2011, distributions to common members totaled $18,617,119, including priority distributions to Copano of $1,217,119. For the year ended December 31, 2010, distributions to common members totaled $20,989,885, including priority distributions to Copano of $989,885. As noted above, net revenue from non-consent capital projects is attributable entirely to consenting members up to 140% of the contributed capital. Allocation of the Company's net income to each member's capital account is computed by combining (a) the proportion of
F-77
Table of Contents
Note 1 — Organization and Basis of Presentation (Continued)
the member's respective ownership percentage multiplied by the Company's net income and (b) the reallocation of the excess distribution related to non-consent projects.
Note 2 — Summary of Significant Accounting Policies
The preparation of financial statements in conformity with accounting principles generally accepted in the United States of America requires the Company's management to make estimates and assumptions that affect the reported amounts of assets and liabilities and disclosures of contingent assets and liabilities, if any, at the date of the financial statements, and the reported amounts of revenues and expenses during the reporting period. Actual results could differ from those estimates.
The Company's revenue is derived from fees collected for gathering natural gas. Revenue is recognized once the Company can conclude it has evidence of an arrangement, the fees are fixed or determinable, collectability is probable and delivery has occurred. The Company typically enters into long-term contracts that provide for per unit gathering fees. Gathering fees are determined on a monthly basis based upon actual volumes and are recognized when the gas enters the Bighorn system. The Company assesses collectability at the inception of an arrangement based upon credit ratings and prior collections history.
Cash and cash equivalents include all highly liquid cash investments with original maturities of three months or less when purchased.
Imbalances result when the Company's customers either over or under-deliver natural gas to the Company's system. In general, over or under-delivery into the Company's system is offset by the Company's equivalent over or under-delivery at the delivery points into the Fort Union gathering system which are then cashed out. Accordingly, at December 31, 2012 and 2011, the Company had no material gas imbalances.
Property and equipment are recorded at cost. Repairs and maintenance are charged to expense as incurred. Expenditures that extend the useful lives of assets are capitalized. The historical costs and related accumulated depreciation of assets retired or otherwise disposed of are written off and any resulting loss on the retirement is reflected in the current period depreciation expense. The gain or loss on sale of an asset is reflected in general and administrative expense in the period in which the asset was sold. Depreciation is provided on a straight-line basis over the estimated useful life for each asset.
F-78
Table of Contents
Note 2 — Summary of Significant Accounting Policies (Continued)
Property and equipment consists of the following:
| | | | | | | | | |
| |
| | December 31, | |
|---|
| | Useful
Lives | |
|---|
| | 2012 | | 2011 | |
|---|
Vehicles | | 3 years | | $ | 1,046,540 | | $ | 1,058,614 | |
Computer and communication equipment | | 5 years | | | 626,076 | | | 626,076 | |
Construction in progress | | N/A | | | 10,544 | | | 2,744,477 | |
Gathering lines and related equipment | | 4-30 years | | | 126,738,361 | | | 123,061,684 | |
| | | | | | | | |
| | | | | 128,421,521 | | | 127,490,851 | |
Less accumulated depreciation | | | | | (46,279,569 | ) | | (41,873,675 | ) |
| | | | | | | | |
Property and equipment, net | | | | $ | 82,141,952 | | $ | 85,617,176 | |
| | | | | | | | |
The Company's policy is to capitalize major overhauls of compression equipment, the costs of which are included in gathering lines and related equipment and depreciated over a four-year period until the next expected overhaul. If the Company determines an asset will cease to be used prior to the end of its previously estimated useful life, that asset will be abandoned and depreciation estimates will be revised. For the years ended December 31, 2012, 2011 and 2010, the Company recorded abandonment charges in the amounts of $0, $0 and $0, respectively. Depreciation expense for the years ended December 31, 2012, 2011 and 2010 was $5,130,434, $4,908,181 and $5,089,767, respectively.
The Company's other assets consist of rights-of-way agreements. The Company amortizes existing intangible assets and any costs incurred to renew or extend the terms of existing intangible assets over the contract term or estimated useful life, as applicable. Initial costs of acquiring new intangible assets are amortized over the estimated useful life of the related tangible assets. Any related renewals or extension costs of intangible assets are expensed over the contract term using the straight-line method. Amortization expense was $280,844, $267,628 and $230,386 for the years ended December 31, 2012, 2011 and 2010, respectively. Estimated aggregate amortization expense is approximately: $219,128 for2013, $193,306 for2014, $168,980 for2015, $125,195 for2016 and $119,791 for2017. Intangible assets consisted of the following:
| | | | | | | |
| | December 31, | |
|---|
| | 2012 | | 2011 | |
|---|
Rights-of-way, at cost | | $ | 3,578,763 | | $ | 3,495,411 | |
Less accumulated amortization for rights-of-way | | | (1,451,261 | ) | | (1,266,491 | ) |
| | | | | | |
Rights-of-way, net | | $ | 2,127,502 | | $ | 2,228,920 | |
| | | | | | |
For the years ended December 31, 2012 and 2011, the weighted average amortization period for rights-of-way agreements was 9 and 10 years, respectively.
In accordance with Accounting Standards Codification 360, "Accounting for the Impairment or Disposal of Long-Lived Assets," the Company evaluates whether long-lived assets, including related intangibles, have been impaired when events or changes in circumstances indicate, in management's judgment, that the carrying value of such assets may not be recoverable. For such long-lived assets, impairment exists when the carrying value exceeds the sum of management's estimate of the undiscounted future cash flows
F-79
Table of Contents
Note 2 — Summary of Significant Accounting Policies (Continued)
expected to result from the use and eventual disposition of the asset. If the carrying value of the long-lived asset is not recoverable based on these estimated future undiscounted cash flows, the impairment loss is measured as the excess of the asset's carrying value over its fair value, such that the asset's carrying value is adjusted to its estimated fair value. For assets identified to be disposed of in the future, the carrying value of these assets is compared to the estimated fair value less the cost to sell to determine if impairment is required. Until the assets are disposed of, an estimate of the fair value is recalculated when related events or circumstances change.
When determining whether impairment of one of the Company's long-lived assets has occurred, the Company must estimate the undiscounted cash flows attributable to the asset or asset group. The Company's estimate of cash flows is based on assumptions regarding the asset, including future commodity prices and estimated future natural gas production in the related region (which is dependent in part on commodity prices). Projections of gas volumes and future commodity prices are inherently subjective and contingent upon a number of variable factors, including but not limited to:
- •
- changes in general economic conditions in which the Company's assets are located;
- •
- the availability and prices of natural gas supply;
- •
- improvements in exploration and production technology;
- •
- the finding and development cost for producers to exploit reserves in a particular area;
- •
- the Company's ability to negotiate favorable agreements with producers and customers;
- •
- the Company's dependence on certain significant customers, producers, gatherers and transporters of natural gas; and
- •
- competition from other midstream service providers, including major energy companies.
Any significant variance in any of the above assumptions or factors could materially affect the Company's cash flows, which could require the Company to record an impairment of an asset. No such impairment losses were recorded for the years ended December 31, 2012, 2011 or 2010.
Asset retirement obligations ("AROs") are legal obligations associated with the retirement of tangible long-lived assets that result generally from the acquisition, construction, development or normal operation of the asset. When an ARO is incurred, the Company recognizes a liability for the fair value of the ARO and an increase in the carrying amount of the related long-lived asset. Over time, the liability is accreted to its present value and recognized as accretion expense each period, and the capitalized amount is depreciated over the remaining useful life of the related long-lived asset. Upon settlement of the liability, the Company either settles the obligation for its recorded amount or incurs a gain or loss on settlement. The Company has recorded AROs related to (i) rights-of-way and easements over property it does not own and (ii) regulatory requirements where a legal or contractual obligation exists upon abandonment of the related facility.
F-80
Table of Contents
Note 2 — Summary of Significant Accounting Policies (Continued)
The following table presents information regarding the Company's AROs:
| | | | |
ARO liability balance, December 31, 2010 | | $ | 268,968 | |
AROs incurred in 2011 | | | 12,823 | |
Accretion for conditional obligations | | | 26,897 | |
| | | | |
ARO liability balance, December 31, 2011 | | | 308,688 | |
Accretion for conditional obligations | | | 30,741 | |
| | | | |
ARO liability balance, December 31, 2012 | | $ | 339,429 | |
| | | | |
At December 31, 2012 and 2011, there were no assets legally restricted for purposes of settling AROs.
The Company's financial instruments consist of cash, accounts receivable, prepaid expenses, accounts payable and accrued liabilities. The carrying amounts of financial instruments approximate fair value due to their short maturities.
Substantially all of the Company's accounts receivable at December 31, 2012 and 2011 results from gas gathering fees earned from other companies in the oil and gas industry. This concentration of customers may impact the Company's overall credit risk, either positively or negatively, in that these entities may be similarly affected by industry-wide changes in economic or other conditions. Such receivables are generally not collateralized. However, the Company performs credit evaluations on all its customers to minimize exposure to credit risk. During the years ended December 31, 2012, 2011 and 2010, the Company recorded an allowance for doubtful accounts of $525,674, $0 and $0, respectively.
As of December 31, 2012, trade accounts receivable includes receivables from two customers representing 63% and 20% of total accounts receivable, and as of December 31, 2011, trade accounts receivable includes receivables from two customers representing 60% and 10% of total accounts receivable.
For the year ended December 31, 2012, revenue includes gathering fees received from one customer representing 72% of total revenue. Subsequent to December 31, 2012, this customer notified the Company of its intent to abandon its current and future production in Wyoming's Powder River Basin by 2014. For the year ended December 31, 2011, revenue includes gathering fees received from one customer representing 69% of total revenue and for the year ended December 31, 2010, revenue includes gathering fees received from two customers representing 73% and 12% of total revenue.
Due to the Company's limited liability status, the tax consequences of the Company pass through to the individual members. Accordingly, no provision has been made for federal or state income taxes.
The Company's management believes that the disclosures are adequate to make the information presented not misleading. In the preparation of these financial statements, the Company's management evaluated subsequent events through March 1, 2013, the issuance date of the financial statements.
F-81
Table of Contents
Note 3 — New Accounting Pronouncements
The Company's management has reviewed recently issued, but not yet adopted, accounting standards and updates in order to determine their effects, if any, on the Company's consolidated results of operations, financial position and cash flows. Most of the recent updates represented technical corrections to the accounting literature or applied to other industries and are not expected to have a material impact on the Company's consolidated cash flows, results of operations or financial position.
Note 4 — Lease Commitments
The Company leases certain equipment, including equipment from related parties (see Note 5), for use on its gathering system under month-to-month and long term operating leases. For the years ended December 31, 2012, 2011 and 2010, rent expense totaled $2,063,154, $2,633,230 and $3,530,611, respectively. As of December 31, 2012, the Company has no commitments under its lease agreements.
Note 5 — Related-Party Transactions
During the years ended December 31, 2012, 2011 and 2010, gathering services provided to Crestone Energy accounted for approximately 1%, 1% and 1%, respectively, of the Company's total revenue.
As of December 31, 2012 and 2011, accounts receivable include $58,683 and $65,731, respectively, for gathering services provided to Crestone Energy.
Beginning May 1, 2009, the Company began leasing compressors for use on its gathering system from Copano Field Facilities/Rocky Mountains, LLC, an indirect wholly-owned subsidiary of Copano. During the years ended December 31, 2012, 2011 and 2010, the Company reflected in operating and maintenance expenses $1,089,800, $1,419,207 and $1,766,156, respectively, related to these leases. As of December 31, 2012 and 2011, there were no amounts due to Copano Field Facilities/Rocky Mountains, LLC.
Beginning in September 2011, the Company entered into lease agreements with an affiliate of Crestone Energy for compressors. Included in operating and maintenance expenses for the years ended December 31, 2012 and 2011 is $100,800 and $33,600, respectively, related to these leases. At December 31, 2012, there are no amounts due under these lease agreements.
The Company pays Copano management fees related to the operation and administration of the Company's gathering system. For the years ended December 31, 2012, 2011 and 2010, the Company reflected in operating and maintenance expenses and general and administrative expenses management fees totaling $385,680, $385,680 and $555,660, respectively, and reimbursable costs totaling $2,369,220, $2,382,458 and $2,473,070, respectively.
As of December 31, 2012 and 2011, the Company had accounts payable to Copano of $67,864 and $158,948, respectively, and accounts receivable from Copano of $0 and $1,901, respectively, related to management fees and reimbursements of expenses.
Management believes that the terms of these transactions are fair to the Company; however, it cannot be certain that such transactions have terms as favorable to the Company as could have been achieved with an unaffiliated entity.
Note 6 — Commitments and Contingencies
In the ordinary course of business, the Company is subject to various laws and regulations. In the opinion of the Company's management, compliance with existing laws and regulations will not materially affect the Company's financial position, results of operations or cash flows.
F-82
Table of Contents
Note 6 — Commitments and Contingencies (Continued)
Although the Company may, from time to time, be involved in litigation and claims arising out of its operations in the normal course of business, the Company is not currently a party to any material legal proceedings. In addition, management of the Company is not aware of any material legal or governmental proceedings against the Company, or contemplated to be brought against the Company, under the various environmental protection statutes to which the Company is subject, that would have a material effect on the Company's financial position, results of operations or cash flows.
F-83
Table of Contents
Exhibit Index
| | | |
| Number | | Description |
|---|
| | 2.1 | | Agreement and Plan of Merger, dated as of January 29, 2013, among Kinder Morgan Energy Partners, L.P., Kinder Morgan G.P., Inc., Javelina Merger Sub LLC and Copano Energy, L.L.C. (incorporated by reference to Exhibit 2.1 to Current Report on Form 8-K filed February 4, 2013). |
| | | | |
| | 3.1 | | Certificate of Formation of Copano Energy Holdings, L.L.C. (now Copano Energy, L.L.C.) (incorporated by reference to Exhibit 3.1 to Registration Statement on Form S-1 filed July 30, 2004). |
| | | | |
| | 3.2 | | Certificate of Amendment to Certificate of Formation of Copano Energy Holdings, L.L.C. (now Copano Energy, L.L.C.) (incorporated by reference to Exhibit 3.2 to Registration Statement on Form S-1 filed July 30, 2004). |
| | | | |
| | 3.3 | | Fourth Amended and Restated Limited Liability Company Agreement of Copano Energy, L.L.C. (incorporated by reference to Exhibit 3.1 to Current Report on Form 8-K filed July 21, 2010). |
| | | | |
| | 3.4 | | Amendment No. 1 to Fourth Amended and Restated Limited Liability Company Agreement of Copano Energy, L.L.C. (incorporated by reference to Exhibit 3.1 to Current Report on Form 8-K filed July 22, 2010). |
| | | | |
| | 4.1 | | Indenture, dated May 16, 2008, among Copano Energy, L.L.C., Copano Energy Finance Corporation, the Subsidiary Guarantors named therein and U.S. Bank National Association, as trustee (incorporated by reference to Exhibit 4.1 to Current Report on Form 8-K filed May 19, 2008). |
| | | | |
| | 4.2 | | Form of Global Note representing 7.75% Senior Notes due 2018 (included in 144A/Regulation S Appendix to Exhibit 4.3 above). |
| | | | |
| | 4.3 | | Series A Convertible Preferred Unit Purchase Agreement, dated July 21, 2010, by and between Copano Energy, L.L.C. and TPG Copenhagen, L.P. (incorporated by reference to Exhibit 10.1 to Current Report on Form 8-K filed July 22, 2010). |
| | | | |
| | 4.4 | | Registration Rights Agreement, dated July 21, 2010, by and between Copano Energy, L.L.C. and TPG Copenhagen, L.P. (incorporated by reference to Exhibit 4.1 to Current Report on Form 8-K filed July 22, 2010). |
| | | | |
| | 4.5 | | Director Designation Agreement, dated July 21, 2010, by and between Copano Energy, L.L.C. and TPG Copenhagen, L.P. (incorporated by reference to Exhibit 10.2 to Current Report on Form 8-K filed July 22, 2010). |
| | | | |
| | 4.6 | | Voting Agreement, dated as of January 29, 2013, among TPG Copenhagen, L.P., Copano Energy, L.L.C. and Kinder Morgan Energy Partners, L.P. (incorporated by reference to Exhibit 10.1 to Current Report on Form 8-K filed February 4, 2013). |
| | | | |
| | 4.7 | | Indenture, dated April 5, 2011, by and among Copano Energy, L.L.C., Copano Energy Finance Corporation, the Guarantors named therein and U.S. Bank National Association, as Trustee (incorporated by reference to Exhibit 4.2 to Current Report on Form 8-K filed April 5, 2011). |
| | | | |
| | 4.8 | | First Supplemental Indenture, dated April 5, 2011, to the Indenture, dated April 5, 2011, by and among Copano Energy, L.L.C., Copano Energy Finance Corporation, The Guarantors named therein and U.S. Bank National Association, as Trustee (incorporated by reference to Exhibit 4.3 to Current Report on Form 8-K filed April 5, 2011). |
| | | | |
| | 4.8 | | Form of Global Note representing 7.125% Senior Notes due 2021 (included as Exhibit A to Exhibit 4.7 above). |
| |
| | |
Table of Contents
| | | |
| Number | | Description |
|---|
| | 10.1 | | Second Amended and Restated Long-Term Incentive Plan (incorporated by reference to Exhibit 99.1 to the Current Report on Form 8-K filed September 5, 2012). |
| | | | |
| | 10.2 | | Employment Agreement between Copano/Operations, Inc., R. Bruce Northcutt and the Copano Controlling Entities, dated April 9, 2003 (incorporated by reference to Exhibit 10.8 to Amendment No. 2 to Registration Statement on Form S-1/A filed October 12, 2004). |
| | | | |
| | 10.3 | | First Amendment to Employment Agreement between Copano/Operations, Inc., R. Bruce Northcutt and the Copano Controlling Entities, dated July 30, 2004 (incorporated by reference to Exhibit 10.9 to Amendment No. 2 to Registration Statement on Form S-1/A filed October 12, 2004). |
| | | | |
| | 10.4 | | Assignment and Assumption Agreement between Copano/Operations, Inc. and CPNO Services, L.P., effective January 1, 2005 with respect to Employment Agreement between Copano/Operations, Inc., R Bruce Northcutt and the Copano Controlling Entities, as amended (incorporated by reference to Exhibit 10.10 to Annual Report on Form 10-K filed March 31, 2005). |
| | | | |
| | 10.5 | | Second Amendment to Employment Agreement between CPNO Services, L.P., R. Bruce Northcutt and the Copano Controlling Entities, effective March 1, 2005 (incorporated by reference to Exhibit 10.10 to Annual Report on Form 10-K filed March 31, 2005). |
| | | | |
| | 10.6 | | Third Amendment to Employment Agreement between CPNO Services, L.P., R. Bruce Northcutt and the Copano Controlling Entities, effective November 18, 2008 (incorporated by reference to Exhibit 99.2 to Annual Report on Form 10-K filed November 25, 2008). |
| | | | |
| | 10.7 | | Retirement, Release and Consulting Services Agreement between Copano Energy, L.L.C. and John A. Raber, effective as of August 2, 2010 (incorporated by reference to Exhibit 99.1 to Form 8-K filed July 30, 2010). |
| | | | |
| | 10.8 | | Employment Agreement between ScissorTail Energy, L.L.C. and Sharon Robinson, dated as of August 1, 2005 (incorporated by reference to Exhibit 10.34 to Quarterly Report on Form 10-Q filed August 15, 2005). |
| | | | |
| | 10.9 | | First Amendment to Employment Agreement between ScissorTail Energy, L.L.C. and Sharon Robinson, dated as of December 31, 2008 incorporated by reference to Exhibit 10.15 to Annual Report on Form 10-K filed February 27, 2009). |
| | | | |
| | 10.10 | | Employment Agreement between CPNO Services, L.P. and James E. Wade, dated April 5, 2010 (incorporated by reference to Exhibit 10.1 to Quarterly Report on Form 10-Q filed May 6, 2011). |
| | | | |
| | 10.11 | | Employment Agreement between CPNO Services, L.P. and Bryan W. Neskora, dated July 16, 2012 (incorporated by reference to Exhibit 10.2 to Quarterly Report on Form 10-Q filed November 8, 2012). |
| | | | |
| | 10.12 | | 2004 Form of Restricted Unit Grant (Directors) (incorporated by reference to Exhibit 10.1 to Current Report on Form 8-K filed December 15, 2004). |
| | | | |
| | 10.13 | | 2004 Form of Unit Option Grant (incorporated by reference to Exhibit 10.17 to Quarterly Report on Form 10-Q filed December 21, 2004). |
| | | | |
| | 10.14 | | 2005 Form of Restricted Unit Grant (Employees) (incorporated by reference to Exhibit 4.4 to Registration Statement on Form S-8 filed February 11, 2005). |
| | | | |
| | 10.15 | | 2005 Form of Unit Option Grant (incorporated by reference to Exhibit 4.5 to Registration Statement on Form S-8 filed February 11, 2005). |
| |
| | |
Table of Contents
| | | |
| Number | | Description |
|---|
| | 10.16 | | Form of Unit Option Grant (ScissorTail Energy, LLC Officers) (incorporated by reference to Exhibit 10.37 to Quarterly Report on Form 10-Q filed August 15, 2005). |
| | | | |
| | 10.17 | | Form of Restricted Unit Grant (ScissorTail Energy, LLC Officers) (incorporated by reference to Exhibit 10.38 to Quarterly Report on Form 10-Q filed August 15, 2005). |
| | | | |
| | 10.18 | | 2006 Form of Restricted Unit Grant (Directors) (incorporated by reference to Exhibit 10.3 to Current Report on Form 8-K filed May 30, 2006). |
| | | | |
| | 10.19 | | 2006 Form of Unit Option Grant (Employees) (incorporated by reference to Exhibit 10.2 to Current Report on Form 8-K filed May 30, 2006). |
| | | | |
| | 10.20 | | 2006 Form of Restricted Unit Grant (Employees) (incorporated by reference to Exhibit 10.4 to Current Report on Form 8-K filed May 30, 2006). |
| | | | |
| | 10.21 | | November 2006 Form of Restricted Unit Grant (Directors) (incorporated by reference to Exhibit 10.1 to Current Report on Form 8-K filed November 20, 2006). |
| | | | |
| | 10.22 | | 2007 Form of Phantom Unit Grant (incorporated by reference to Exhibit 10.1 to Current Report on Form 8-K filed June 18, 2007). |
| | | | |
| | 10.23 | | 2008 Form of Phantom Unit Grant (Employees) (incorporated by reference to Exhibit 10.1 to Current Report on Form 8-K filed June 6, 2008). |
| | | | |
| | 10.24 | | 2008 Form of Performance Based Phantom Unit Grant (Employees) (incorporated by reference to Exhibit 10.2 to Current Report on Form 8-K filed June 6, 2008). |
| | | | |
| | 10.25 | | 2008 Form of Long-Term Retention Award Grant (Employees) (incorporated by reference to Exhibit 10.3 to Current Report on Form 8-K filed June 6, 2008). |
| | | | |
| | 10.26 | | 2008 Form of Phantom Unit Grant (Employee Bonus Awards) (incorporated by reference to Exhibit 99.2 to Current Report on Form 8-K filed November 12, 2008). |
| | | | |
| | 10.27 | | 2008 Form of Restricted Unit Grant (Directors) (incorporated by reference to Exhibit 99.4 to Current Report on Form 8-K filed November 25 2008). |
| | | | |
| | 10.28 | | Form of Unit Appreciation Right Award Agreement (incorporated by reference to Exhibit 99.1 to Current Report on Form 8-K filed May 18, 2009). |
| | | | |
| | 10.29 | | Form of Unit Appreciation Right Award Agreement (incorporated by reference to Exhibit 99.1 to Current Report on Form 8-K filed August 18, 2009). |
| | | | |
| | 10.30 | | Form of Performance-Based Phantom Unit Award Agreement (incorporated by reference to Exhibit 99.1 to Current Report on Form 8-K filed June 10, 2010). |
| | | | |
| | 10.31 | | Form of Restricted Unit Award Agreement (Director Pursuant to Contract) (incorporated by reference to Exhibit 99.2 to Current Report on Form 8-K filed November 23, 2010). |
| | | | |
| | 10.32 | | Form of Phantom Unit Award Agreement (incorporated by reference to Exhibit 99.1 to the Current Report on Form 8-K filed May 21, 2012). |
| | | | |
| | 10.33 | | Amended and Restated Copano Energy, L.L.C. Management Incentive Compensation Plan (incorporated by reference to Exhibit 99.1 to Current Report on Form 8-K filed February 23, 2010). |
| | | | |
| | 10.34 | | 2012 Administrative Guidelines for Copano Energy, L.L.C. Management Incentive Compensation Plan (incorporated by reference to Exhibit 99.1 to Current Report on Form 8-K filed February 21, 2012). |
| | | | |
| | 10.35 | | Copano Energy, L.L.C. Deferred Compensation Plan, dated December 16, 2008 (incorporated by reference to Exhibit 99.1 to Current Report on Form 8-K filed December 19, 2008). |
| |
| | |
Table of Contents
| | | |
| Number | | Description |
|---|
| | 10.36 | | Form of Deferred Compensation Plan Participation Agreement (incorporated by reference to Exhibit 99.2 to Current Report on Form 8-K filed December 19, 2008). |
| | | | |
| | 10.37 | | Form of Indemnification Agreement (incorporated by reference to Exhibit 10.1 to Current Report on Form 8-K filed November 2, 2005). |
| | | | |
| | 10.38 | | Copano Energy, L.L.C. Amended and Restated Change in Control Severance Plan, effective August 25, 2010 (incorporated by reference to Exhibit 99.1 to Current Report on Form 8-K filed August 31, 2010). |
| | | | |
| | 10.39 | | Second Amended & Restated Credit Agreement, dated June 10, 2011, among Copano Energy, L.L.C., as the Borrower, Bank of America, N.A., as Administrative Agent, Swing Line Lender and L/C Issuer, JP Morgan Chase Bank, N.A. and Wells Fargo Bank, National Association, as Co-Syndication Agents, BNP Paribas and Royal Bank of Canada as Co-Documentation Agents, and other Lenders Party hereto (incorporated by reference to Exhibit 10.1 to Current Report on Form 8-K filed June 15, 2011). |
| | | | |
| | 10.40 | | First Amendment to Second Amended and Restated Credit Agreement, dated as of January 4, 2012, among Copano Energy, L.L.C., as the Borrower, Bank of America, N.A., Administrative Agent Swing Line Lender and L/C Issuer, and the lender party thereto (incorporated by reference to Exhibit 10.1 to the Current Report on Form 8-K filed January 10, 2012). |
| | | | |
| | 21.1 | | List of Subsidiaries (incorporated by reference to Exhibit 21.1 to Annual Report on Form 10-K filed February 29, 2012). |
| | | | |
| | 23.1 | * | Consent of Deloitte & Touche LLP. |
| | | | |
| | 31.1 | * | Sarbanes-Oxley Section 302 certification of Principal Executive Officer. |
| | | | |
| | 31.2 | * | Sarbanes-Oxley Section 302 certification of Principal Financial Officer. |
| | | | |
| | 32.1 | ** | Sarbanes-Oxley Section 906 certification of Principal Executive Officer. |
| | | | |
| | 32.2 | ** | Sarbanes-Oxley Section 906 certification of Principal Financial Officer. |
| | | | |
| | 101.CAL | * | XBRL Calculation Linkbase Document. |
| | | | |
| | 101.DEF | * | XBRL Definition Linkbase Document. |
| | | | |
| | 101.INS | * | XBRL Instance Document. |
| | | | |
| | 101.LAB | * | XBRL Labels Linkbase Document. |
| | | | |
| | 101.PRE | * | XBRL Presentation Linkbase Document. |
| | | | |
| | 101.SCH | * | XBRL Schema Document. |
- *
- Filed herewith.
- **
- Furnished herewith.