UNITED STATES
SECURITIES AND EXCHANGE COMMISSION
Washington, D.C. 20549
FORM 10-K
| x | ANNUAL REPORT PURSUANT TO SECTION 13 OR 15(d) OF THE SECURITIES EXCHANGE ACT OF 1934 |
For the fiscal year ended December 31, 2010
or
| ¨ | TRANSITION REPORT PURSUANT TO SECTION 13 OR 15(d) OF THE SECURITIES EXCHANGE ACT OF 1934 |
For the transition period from to
Commission File No. 000-53200
CB RICHARD ELLIS REALTY TRUST
(Exact name of registrant as specified in its charter)
| | |
| Maryland | | 56-2466617 |
(State or other jurisdiction incorporation or organization) | | (I.R.S. Employer Identification No.) |
47 Hulfish Street, Suite 210, Princeton, New Jersey 08542
(Address of principal executive offices—zip code)
(609) 683-4900
(Registrant’s telephone number, including area code)
SECURITIES REGISTERED PURSUANT TO SECTION 12(b) OF THE ACT:
| | |
Title of Each Class | | Name of Each Exchange on Which Registered |
| None | | Not Applicable |
SECURITIES REGISTERED PURSUANT TO SECTION 12(g) OF THE ACT:
Common Shares of Beneficial Interest, Par Value $0.01 Per Share
Indicate by check mark if the registrant is a well-known seasoned issuer, as defined in Rule 405 of the Securities Act. Yes ¨ No x .
Indicate by check mark if the registrant is not required to file reports pursuant to Section 13 or Section 15(d) of the Act. Yes ¨ No x .
Indicate by check mark whether the registrant (1) has filed all reports required to be filed by Section 13 or 15(d) of the Securities Exchange Act of 1934 during the preceding 12 months (or for such shorter period that the registrant was required to file such reports), and (2) has been subject to such filing requirements for the past 90 days. Yes x No ¨
Indicate by check mark if disclosure of delinquent filers pursuant to Item 405 of Regulation S-K (229.405) is not contained herein, and will not be contained, to the best of the registrant’s knowledge, in definitive proxy or information statements incorporated by reference in Part III of this Form 10-K or any amendment to this Form 10-K. ¨
Indicate by check mark whether the registrant has submitted electronically and posted on its corporate Website, if any, every Interactive Data File required to be submitted and posted pursuant to Rule 405 of Regulation S-T (§ 232.405 of this chapter) during the preceding 12 months (or for such shorter period that the registrant was required to submit and post such files). Yes ¨ No ¨
Indicate by check mark whether the registrant is a large accelerated filer, an accelerated filer, a non-accelerated filer, or a smaller reporting company. See the definitions of “large accelerated filer,” “accelerated filer” and “smaller reporting company” in Rule 12b-2 of the Exchange Act.
| | | | | | |
Large accelerated filer ¨ | | Accelerated Filer ¨ | | Non-accelerated filer x | | Smaller reporting company ¨ |
| | (do not check if a smaller reporting company) |
Indicate by check mark whether the registrant is a shell company (as defined in Rule 12b-2 of the Exchange Act). Yes ¨ No x
Since there was no established market for the voting and non-voting common shares as of June 30, 2010, there was no market value for the common shares held by non-affiliates of the registrant as of such date.
The number of shares outstanding of the registrant’s common shares, $0.01 par value, was 172,025,430 as of March 17, 2011.
DOCUMENTS INCORPORATED BY REFERENCE
Portions of the registrant’s Proxy Statement for its 2011 Annual Shareholders’ Meeting expected to be filed on or prior to April 30, 2011 are incorporated by reference into Part III of this Annual Report on Form 10-K.
CB RICHARD ELLIS REALTY TRUST
FORM 10-K
TABLE OF CONTENTS
PART I
Overview
CB Richard Ellis Realty Trust is a Maryland real estate investment trust that invests in real estate, focusing on office, industrial (primarily warehouse/distribution), retail and potentially multi-family residential properties. As of December 31, 2010, we owned, on a consolidated basis, 73 office, industrial (primarily warehouse/distribution) and retail properties located in 15 states (Arizona, California, Florida, Georgia, Illinois, Massachusetts, Minnesota, New Jersey, North Carolina, Ohio, South Carolina, Texas, Utah and Virginia) and in the United Kingdom encompassing approximately 12,800,000 rentable square feet in the aggregate. In addition, we have ownership interests in five unconsolidated entities that, as of December 31, 2010, owned interests in 38 properties. Excluding those properties owned through our investment in CB Richard Ellis Strategic Partners Asia II, L.P. (“CBRE Strategic Partners Asia”), we owned, on an unconsolidated basis, 30 industrial, office and retail properties located in eight states (Arizona, Florida, Indiana, Missouri, North Carolina, Ohio, Tennessee and Texas) and in the United Kingdom and Europe encompassing approximately 9,901,000 rentable square feet in the aggregate.
We commenced operations in July 2004, following an initial private placement of our common shares of beneficial interest. We raised aggregate net proceeds (after commissions and expenses) of approximately $55,500,000 from July 2004 to October 2004 in private placements of our common shares. On October 24, 2006, we commenced an initial public offering of up to $2,000,000,000 in our common shares. In connection with that offering, as of January 30, 2009, we had accepted subscriptions from 13,270 investors, issued 60,808,967 common shares including 1,487,943 common shares issued pursuant to our dividend reinvestment plan, and received $607,345,702 in gross proceeds. Our initial public offering was terminated effective as of the close of business on January 29, 2009. We withdrew from registration a total of 140,243,665 common shares that were registered but not sold in connection with the initial public offering.
The registration statement relating to our follow-on public offering was declared effective by the Securities and Exchange Commission (the “SEC”) on January 30, 2009. CNL Securities Corp. is the dealer manager of our offering (the “Dealer Manager”). The registration statement covers up to $3,000,000,000 in common shares of beneficial interest, 90% of which will be offered at a price of $10.00 per share, and 10% of which will be offered pursuant to our dividend reinvestment plan at a purchase price equal to the higher of $9.50 per share or 95% of the fair market value of a common share on the reinvestment date, as determined by the Investment Advisor, or another firm we choose for that purpose. We reserve the right to reallocate the shares between the primary offering and our dividend reinvestment plan. From January 30, 2009 (effective date) through December 31, 2010, we had accepted subscriptions from 26,244 investors and we had received gross offering proceeds of approximately $1,010,076,294 from the sale of 101,245,478 common shares including 4,756,981 common shares issued pursuant to our dividend reinvestment plan.
From October 24, 2006 through December 31, 2010, we had accepted subscriptions from 39,514 investors, issued 162,054,446 common shares, including 6,244,924 common shares issued pursuant to our dividend reinvestment plan, and received $1,617,421,996 in gross proceeds. As of December 31, 2010, 164,511,252 common shares were issued and outstanding.
We are an externally managed REIT, and have retained CBRE Advisors LLC as our investment advisor (the “Investment Advisor”). The Investment Advisor is responsible for managing our affairs on a day-to-day basis and for identifying and making acquisitions on our behalf. The Investment Advisor receives advisory services relating to real estate acquisitions, property management and communications with existing investors and, in addition, receives marketing and other operational services from CNL Fund Management Company, an affiliate of CNL Securities Corp pursuant to a sub-advisory agreement. We hold all of our real estate investments directly or indirectly through our operating partnership, CBRE Operating Partnership, L.P. (“CBRE OP”).
We benefit from the investment expertise and experience of the Investment Advisor, which is an affiliate of our sponsor CB Richard Ellis Investors, L.L.C. (“CBRE Investors”). CBRE Investors is a real estate investment management company and a registered investment advisor with the SEC. CBRE Investors is a wholly-owned subsidiary of CB Richard Ellis Group, Inc. (NYSE: CBG), or CB Richard Ellis. We have elected to be taxed as a real estate investment trust, or REIT, for U.S. federal income tax purposes. As a REIT, we generally will not be subject to U.S. federal income tax on that portion of our income that we distribute to our shareholders if, in general, at least 90% of our net taxable income (excluding net capital gain) is distributed to our shareholders.
Unless the context otherwise requires or indicates, references to “CBRE REIT,” “we,” “our” and “us” refer to the activities of and the assets and liabilities of the business and operations of CB Richard Ellis Realty Trust and its subsidiaries.
1
Investment Objectives and Acquisition Policies
When we invest in real estate properties, focusing on office, industrial (primarily warehouse/distribution), retail and potentially multi-family residential properties and other investment assets, we compete with a variety of institutional investors, including other REITs, insurance companies, mutual funds, pension funds, investment banking firms, banks and other financial institutions that invest in the same types of assets. Many of these investors have greater financial resources and access to lower costs of capital than we do. The existence of these competitive entities, as well as the possibility of additional entities forming in the future, may increase the competition for the acquisition of the types of properties we are seeking to acquire, resulting in higher prices and lower yields on assets. The consideration we agree to pay for real property shall ordinarily be based on the fair market value of the property as determined by a majority of our trustees.
We invest in real estate properties, focusing on office, retail, industrial (primarily warehouse/distribution), and multi-family residential properties, as well as certain other real estate-related assets. Our investment objectives are:
| | ¡ | | to maximize cash dividends paid to you; |
| | ¡ | | to preserve and protect your capital contributions; |
| | ¡ | | to realize growth in the value of our assets upon our ultimate sale of such assets; and |
| | ¡ | | to provide you with the potential for future liquidity by (i) listing our shares on a national securities exchange, the Nasdaq Global Select Market or the Nasdaq Global Market or (ii) if a listing has not occurred on or before December 31, 2011 our Board of Trustees must consider (but is not required to commence) an orderly liquidation of our assets. |
In 2010, our Board of Trustees established a Special Committee of the Board (the “Special Committee”) consisting of all of the Board’s independent trustees, Messrs. Black (Chairman) Reid and Orphanides, to explore and review our strategic alternatives and liquidity events in accordance with our investment objectives. There can be no assurance that the exploration of strategic alternatives will result in any particular outcome. We do not anticipate any further public comment on this matter unless and until the Special Committee deems it necessary.
We cannot assure you that we will attain these objectives or that our capital will not decrease. We may not change our investment objectives, except upon approval of shareholders holding a majority of our outstanding shares; however, our Board of Trustees may change any of our investment policies without prior notice to you or a vote of our shareholders.
We employ an enhanced income investment strategy designed to maximize risk-adjusted returns. To do so, we purchase, actively and passively manage and sell properties located in the business districts and suburban markets of major metropolitan areas. Our primary focus is on office, industrial (primarily warehouse/distribution), retail and potentially multi-family residential properties. The number and aggregate purchase price of properties we acquire in each asset class will depend upon real estate and market conditions and other circumstances existing at the time we acquire assets.
Our office portfolio may include properties such as multi-tenant, single-tenant and sale leasebacks, office parks and portfolios, newly constructed, corporate/user activity, medical office, technology/telecommunication, redevelopments and stabilized operations. Our retail portfolio may encompass regional malls, power centers, community centers, grocery-anchored strips, freestanding stores, urban properties, single assets and multiple property portfolios. Our industrial portfolio will consist primarily of warehouse/distribution properties, but may also include office/showroom, research and development facilities, manufacturing, single-tenant and sale leasebacks and corporate/user activity properties. Our multi-family residential portfolio may include garden complexes, townhouse developments, mid/high-rise towers, newly constructed and redevelopment properties, single assets and multi-property portfolios.
Our investment strategy is centered on CBRE Investors’ research-driven approach. We focus on the property types and markets identified as most compelling by CBRE Investors’ research. As a result, we believe that our opportunities will evolve over time as market conditions change.
We hold all of our real estate investments directly or indirectly through our operating partnership, CBRE OP. We are the sole general partner of CBRE OP. Our ownership of properties in CBRE OP is referred to as an Umbrella Partnership REIT, or “UPREIT.” We believe the UPREIT structure is a competitive advantage for us when seeking to acquire assets, because it allows potential sellers of properties to defer gain recognition for U.S. federal income tax purposes by contributing properties to CBRE OP in return for an interest therein. Although we are not limited as to the form our investments may take, our investments in real estate generally take the form of holding fee title or a long-term leasehold estate in the properties we acquire. We acquire such interests either directly in CBRE OP or indirectly by acquiring membership interests in, or acquisitions of property through, limited liability companies or through investments in joint ventures, partnerships, co-tenancies or other co-ownership arrangements with developers of properties, affiliates of the Investment Advisor or other persons. In addition, we may purchase properties and lease them back to the sellers of such properties.
2
We may, from time to time, invest in or make mortgage or other real estate-related loans, which may include first or second mortgages, mezzanine loans or other real estate-related investments that do not conflict with the maintenance of our REIT qualification. Although we do not have a formal policy, our criteria for investing in mortgage loans will be substantially the same as those involved in our investment in properties and will be subject to the investment limitations contained in our declaration of trust.
We are not limited as to the geographic area where we may conduct our operations. We intend to invest primarily in properties located in geographically-diverse major metropolitan areas in the United States. In addition, we currently intend to invest up to 30% of our total assets in properties outside of the United States. Our international investments may be in markets in which CBRE Investors has existing operations or previous investment experience, or may be in partnership with other entities that have significant local-market expertise. We expect that our international investments will focus on properties typically located in significant business districts and suburban markets.
We may purchase existing assets with an operating history, newly constructed properties or assets under construction. We will not invest more than 20% of our total assets in any single investment. Except for this limitation on our ability to invest in excess of 20% of our total assets in any single investment, after the initial startup activities, we are not specifically limited in the number or size of investments we may acquire or on the percentage of net proceeds of our offerings that we may invest in a single investment. It is our intent over time to build a diversified portfolio of assets. However, the number and mix of assets we acquire will depend upon real estate and market conditions and other circumstances existing at the time we acquire assets and the amount of proceeds we raise in our current public offering. In making investment decisions for us, the Investment Advisor considers relevant risks and financial factors, including the creditworthiness of major tenants, the expected levels of rental and occupancy rates, current and projected cash flow of the property, the location, condition and use of the property, suitability for any development contemplated or in progress, income-producing capacity, the prospects for long-range appreciation, liquidity and income tax considerations. In addition to these factors, the Investment Advisor, when evaluating prospective mortgage loan investments, will consider the ratio of the amount of the investment to the value of the property by which it is selected and the quality, experience and creditworthiness of the borrower. The Investment Advisor also utilizes the resources and professionals of CBRE Investors and consults with its investment committee when evaluating potential investments. In this regard, the Investment Advisor has substantial discretion with respect to the selection of specific investments.
Our obligation to close the purchase of any property is generally conditioned upon the delivery and verification of certain documents from the seller or developer, including, where appropriate:
| | ¡ | | plans and specifications; |
| | ¡ | | evidence of marketable title subject to such liens and encumbrances as are acceptable to the Investment Advisor; |
| | ¡ | | title and liability insurance policies; and |
| | ¡ | | audited financial statements covering recent operations of properties having operating histories, unless such statements would not be required to be filed with the SEC, so long as we are a public company. |
We will not close the purchase of any property unless and until we obtain an environmental assessment for each property purchased and are generally satisfied with the environmental status of the property. A Phase I environmental site assessment basically consists of a visual survey of the building and the property in an attempt to identify areas of potential environmental concern, visually observing neighboring properties to assess surface conditions or activities that may have an adverse environmental impact on the property, and contacting local governmental agency personnel and performing a regulatory agency file search in an attempt to determine any known environmental concerns in the immediate vicinity of the property. A Phase I environmental site assessment does not generally include any sampling or testing of soil, groundwater or building materials from the property. We may pursue additional assessments or reviews if the Phase I site assessment indicates that further environmental investigation is warranted.
In connection with our assessment and selection of investment partners, property managers, development managers and other service providers, we will consider their experience and reputation in the areas of environmental sustainability, including experience in the development and operation of buildings certified under the LEED (Leadership in Energy and Environmental Design) Green Building Rating System promulgated by the US Green Building Counsel. The Investment Advisor will evaluate the sustainability of a prospective investment property by assessing its Energy Star score, its preliminary LEED score, and sustainability measures that have been or can be implemented, such as recycling, water conservation and green cleaning methods. We will consider operational, maintenance and capital improvement practices for existing properties designed to increase energy efficiency, reduce waste and otherwise lessen environmental impacts while remaining conscious of economic performance. We will engage in dialog with our property managers and tenants to determine and implement sustainability initiatives appropriate for particular properties. We will also consider utilizing and recommending to our tenants the environmental sustainability consulting services of CB Richard Ellis or unaffiliated parties.
3
We may also enter into arrangements with the seller or developer of a property whereby the seller or developer agrees that if during a stated period the property does not generate a specified cash flow, the seller or developer will pay in cash to us a sum necessary to reach the specified cash flow level, subject in some cases to negotiated dollar limitations.
In determining whether to purchase a particular property, we may, in accordance with customary practices, obtain an option on such property. The amount paid for an option, if any, is normally surrendered if the property is not purchased and is normally credited against the purchase price if the property is purchased.
Development and Construction of Properties
We have invested in, and may in the future invest in properties on which improvements are to be constructed or completed. We are not restricted in our ability to invest in such properties. To help ensure performance by the builders of properties that are under construction, completion of properties under construction may be guaranteed at the price contracted either by an adequate completion bond or performance bond. We may rely, however, upon the substantial net worth of the contractor or developer or a personal guarantee accompanied by financial statements showing a substantial net worth provided by an affiliate of the person entering into the construction or development contract as an alternative to a completion bond or performance bond. Development of real estate properties is subject to risks relating to a builder’s ability to control construction costs or to build in conformity with plans, specifications and timetables.
We may make periodic progress payments or other cash advances to developers and builders of our properties prior to completion of construction only upon receipt of an architect’s certification as to the percentage of the project then-completed and as to the dollar amount of the construction then-completed. We intend to use such additional controls on disbursements to builders and developers as we deem necessary or prudent.
We may directly employ one or more project managers to plan, supervise and implement the development of any unimproved properties that we may acquire. In such event, such persons would be compensated directly by us. There currently is no affiliate of the Investment Advisor that performs development activities on our behalf and neither we nor the Investment Advisor currently intend to form an entity for such purpose.
Joint Venture Investments
We have entered into, and may in the future enter into, joint ventures, partnerships, co-tenancies and other co-ownership arrangements or participations with real estate developers, owners and other affiliated third-parties, including other programs sponsored by CBRE Investors, for the purpose of developing, owning and operating real properties. In determining whether to invest in a particular joint venture, the Investment Advisor will evaluate the real property that such joint venture owns or is being formed to own under the same criteria employed for the selection of our real estate property investments.
In the event that the co-venturer were to elect to sell property held in any such joint venture, however, we may not have sufficient funds to exercise our right of first refusal to buy the other co-venturer’s interest in the property held by the joint venture. In the event that any joint venture with an affiliated entity holds interests in more than one property, the interest in each such property may be specially allocated based upon the respective proportion of funds invested by each co-venturer in each such property. Our entering into joint ventures with other affiliates, including other programs sponsored by CBRE Investors, will result in certain conflicts of interest.
Borrowing Policies
While we strive for diversification, the number of different assets we can acquire will be affected by the amount of funds available to us.
Our ability to increase our diversification through borrowing could be adversely impacted by banks and other lending institutions reducing the amount of funds available for loans secured by real estate. When interest rates on mortgage loans are high or financing is otherwise unavailable on a timely basis, we may purchase certain properties for cash with the intention of obtaining a mortgage loan for a portion of the purchase price at a later time.
Although we have adopted a policy to limit our aggregate borrowing to no more than 65% of the cost of our assets before non-cash reserves and depreciation, subject to the 300% of net assets borrowing restriction described below, this policy may be altered at any time or suspended by our Board of Trustees if necessary to pursue attractive investment opportunities. Our organizational documents contain a limitation on the amount of indebtedness that we may incur, so that until our shares are listed on a national securities exchange, our aggregate borrowing may not exceed 300% of our net assets unless any excess borrowing is approved by a majority of our independent trustees and is disclosed to shareholders in our next quarterly report. Our Board of Trustees must review our aggregate borrowing from time to time, but at least quarterly.
4
By operating on a leveraged basis, we will have more funds available for investment in assets. This will allow us to make more investments than would otherwise be possible, resulting in a more diversified portfolio. Although our liability for the repayment of indebtedness is expected to be limited to the value of the asset securing the liability and the rents or profits derived therefrom, our use of leveraging may increase the risk of default on the mortgage payments and a resulting foreclosure of a particular property. To the extent that we do not obtain mortgage loans on our properties, our ability to acquire additional assets will be restricted. The Investment Advisor will use its best efforts to obtain financing on our behalf on the most favorable terms available. Lenders may have recourse to assets not securing the repayment of the indebtedness.
We may refinance properties during the term of a loan only in limited circumstances, such as when a decline in interest rates makes it beneficial to prepay an existing mortgage, when an existing mortgage matures or if an attractive investment becomes available and the proceeds from the refinancing can be used to purchase such investment. The benefits of the refinancing may include an increased cash flow resulting from reduced debt service requirements, an increase in dividend distributions from proceeds of the refinancing, if any, and/or an increase in property ownership if some refinancing proceeds are reinvested in real estate.
We may not borrow money from any of our trustees or from the Investment Advisor and its affiliates unless approved by a majority of our trustees, including a majority of any independent trustees not otherwise interested in the transaction, as fair, competitive and commercially reasonable and no less favorable to us than comparable loans between unaffiliated parties.
Disposition Policies
We intend to hold each asset we acquire for an extended period. However, circumstances might arise which could result in the early sale of some assets. We may sell a property before the end of the expected holding period if, among other reasons:
| | ¡ | | in our judgment, the sale of the asset is in the best interests of our shareholders; |
| | ¡ | | we can reinvest the proceeds in a higher-yielding investment; |
| | ¡ | | we can increase cash flow through the disposition of the asset; or |
| | ¡ | | in the judgment of the Investment Advisor, the value of an asset might decline substantially. |
The determination of whether a particular asset should be sold or otherwise disposed of will be made after consideration of relevant factors, including prevailing economic conditions, with a view to achieving maximum long-term capital appreciation. We cannot assure you that this objective will be realized.
If our shares are not listed for trading on a national securities exchange, the Nasdaq Global Select Market or the Nasdaq Global Market by December 31, 2011, our declaration of trust requires our Board of Trustees to consider (but is not required to commence) an orderly liquidation of our assets, which liquidation would require the approval of shareholders. In making the decision to apply for listing of our shares, our trustees will try to determine whether listing our shares or liquidating our assets will result in greater long-term value for our shareholders. We cannot determine at this time the circumstances, if any, under which our trustees will determine to list our shares. Even if no shares are listed, we are under no obligation to actually sell our portfolio within this time period since the precise timing will depend on real estate and financial markets, economic conditions of the areas in which the properties are located and U.S. federal income tax effects on shareholders which may be applicable in the future. Furthermore, we cannot assure you that we will be able to liquidate our assets. In addition, we may consider other business strategies such as reorganizations or mergers with other entities if our Board of Trustees determines such strategies would be in the best interests of our shareholders. Any change in the investment objectives set forth in our declaration of trust would require the vote of shareholders holding a majority of our outstanding shares.
Investment Limitations
Our declaration of trust places numerous limitations on us with respect to the manner in which we may invest our funds, most of which are required by various provisions of the North American Securities Administrators Association Guidelines, or NASAA Guidelines. Our declaration of trust provides that until our shares are listed on a national securities exchange or included on the Nasdaq Global Select Market or the Nasdaq Global Market, we may not:
| | ¡ | | invest in equity securities unless a majority of our trustees, including a majority of any independent trustees not otherwise interested in the transaction, approve such investment as being fair, competitive and commercially reasonable; |
| | ¡ | | make investments in unimproved property or indebtedness secured by a deed of trust or mortgage loans on unimproved property in excess of 10% of our total assets; |
5
| | ¡ | | invest in commodities or commodity futures contracts, except for futures contracts when used solely for the purpose of hedging in connection with our ordinary business of investing in real estate assets and mortgages; |
| | ¡ | | make or invest in mortgage loans unless an appraisal is obtained concerning the underlying property, except for those mortgage loans insured or guaranteed by a government or government agency. In cases where a majority of our independent trustees determine, and in all cases in which the transaction is with any of our trustees or the Investment Advisor or its affiliates, such appraisal shall be obtained from an independent appraiser. We will maintain such appraisal in our records for at least five years and it will be available for your inspection and duplication. We will also obtain a mortgagee’s or owner’s title insurance policy as to the priority of the mortgage; |
| | ¡ | | invest in real estate contracts of sale, otherwise known as land sale contracts, unless the contract is in recordable form and is appropriately recorded in the chain of title; |
| | ¡ | | make or invest in mortgage loans, including construction loans, on any one property if the aggregate amount of all mortgage loans on such property would exceed an amount equal to 85% of the appraised value of such property as determined by appraisal unless substantial justification exists for exceeding such limit because of the presence of other underwriting criteria; |
| | ¡ | | make or invest in mortgage loans that are subordinate to any mortgage or equity interest of any of our trustees, the Investment Advisor or its affiliates; |
| | ¡ | | issue “redeemable securities,” as defined in Section 2(a)(32) of the Investment Company Act of 1940, as amended, or the Investment Company Act; |
| | ¡ | | issue debt securities unless the historical debt service coverage (in the most recently completed fiscal year) as adjusted for known changes is sufficient to properly service that higher level of debt; |
| | ¡ | | grant warrants or options to purchase shares to the Investment Advisor or its affiliates or to officers or trustees affiliated with the Investment Advisor except on the same terms as such warrants or options are sold to the general public and in an amount not to exceed 10% of the outstanding shares on the date of grant of the warrants and options; |
| | ¡ | | issue equity securities on a deferred payment basis or other similar arrangement; or |
| | ¡ | | lend money to our trustees or to the Investment Advisor or its affiliates. |
The Investment Advisor continually reviews our investment activity to ensure that we do not come within the application of the Investment Company Act. Among other things, the Investment Advisor monitors the proportion of our portfolio that is placed in various investments so that we do not come within the definition of an “investment company” under the Investment Company Act. If at any time the character of our investments could cause us to be deemed an “investment company” for purposes of the Investment Company Act, we will take the necessary actions to attempt to ensure that we are not deemed to be an “investment company.”
Change in Investment Objectives and Limitations
Until our shares are listed on a national securities exchange, our declaration of trust requires that the independent trustees review our investment policies at least annually to determine that the policies we are following are in the best interests of our shareholders. Each determination, and the basis therefore, is required to be set forth in our minutes. The methods of implementing our investment policies also may vary as new investment techniques are developed. The methods of implementing our investment objectives and policies, except as otherwise provided in the organizational documents, may be altered by a majority of our trustees, including a majority of the independent trustees, without the approval of the shareholders. Our investment objectives themselves, however, may only be amended by a vote of the shareholders holding a majority of our outstanding shares.
Restrictions on Roll-up Transactions
Until our shares are listed on a national securities exchange, our declaration of trust requires that we follow the policy set forth below with respect to any “Roll-up Transaction.” In connection with any proposed transaction considered a “Roll-up Transaction” involving us and the issuance of securities of an entity, or a Roll-up Entity, that would be created or would survive after the successful completion of the Roll-up Transaction, an appraisal of all properties must be obtained from a competent independent appraiser. The properties must be appraised on a consistent basis, and the appraisal shall be based on the evaluation of all relevant information and shall indicate the value of the properties as of the date immediately prior to the announcement of the proposed Roll-up Transaction. The appraisal shall assume an orderly liquidation of properties over a 12-month period. The terms of the engagement of the independent appraiser must clearly state that the engagement is for our benefit and our shareholders’ benefit. A summary of the appraisal, indicating all material assumptions underlying the appraisal, shall be included in a report to our shareholders in connection with any proposed Roll-up Transaction. If the appraisal will be included in a document used to offer the securities of a Roll-up Entity, the appraisal shall be filed with the SEC and the states as an exhibit to the registration statement for the offering.
6
A “Roll-up Transaction” is a transaction involving the acquisition, merger, conversion or consolidation, directly or indirectly, of us and the issuance of securities of a Roll-up Entity. This term does not include:
| | ¡ | | a transaction involving our securities that have been listed on a national securities exchange for at least 12 months; or |
| | ¡ | | a transaction involving our conversion into corporate or association form if, as a consequence of the transaction, there will be no significant adverse change in any of the following: our shareholder voting rights; the term of our existence; compensation to the Investment Advisor or its affiliates; or our investment objectives. |
In connection with a proposed Roll-up Transaction, the person sponsoring the Roll-up Transaction must offer to our shareholders who vote “no” on the proposal a choice of:
| | ¡ | | accepting the securities of the Roll-up Entity offered in the proposed Roll-up Transaction; or |
| | ¡ | | remaining as shareholders and preserving their interests on the same terms and conditions as existed previously; or |
| | ¡ | | receiving cash in an amount equal to the shareholders’pro rata share of the appraised value of our net assets. |
We are prohibited from participating in any proposed Roll-up Transaction:
| | ¡ | | that would result in our shareholders having voting rights in a Roll-up Entity that are less than those provided in our bylaws and described elsewhere in this document including rights with respect to the election and removal of trustees, annual reports, annual and special meetings, amendment of our declaration of trust and our dissolution; |
| | ¡ | | that includes provisions that would operate to materially impede or frustrate the accumulation of shares by any purchaser of the securities of the Roll-up Entity, except to the minimum extent necessary to preserve the tax status of the Roll-up Entity, or which would limit the ability of an investor to exercise voting rights of its securities of the Roll-up Entity on the basis of the number of shares held by that investor; |
| | ¡ | | in which investors’ right to access of records of the Roll-up Entity will be less than those provided in the section of our prospectus entitled “Description of Shares”; or |
| | ¡ | | in which any of the costs of the Roll-up Transaction would be borne by us if the Roll-up Transaction is not approved by our shareholders. |
Policies With Respect to Certain Other Activities
If our Board of Trustees determines that additional funding is required, we may raise such funds through additional equity offerings or the retention of cash flow (subject to the REIT provisions of the Internal Revenue Code of 1986, as amended (the “Internal Revenue Code”) concerning distribution requirements and taxability of undistributed net taxable income) or a combination of these methods.
In the event that our Board of Trustees determines to raise additional equity capital, it has the authority, without shareholder approval, to issue additional common or preferred shares in any manner and on such terms and for such consideration it deems appropriate, at any time.
We have authority to repurchase or otherwise reacquire our shares and may engage in such activities in the future. We may invest in the securities of other issuers for the purpose of exercising control. We currently have no intention to underwrite securities of other issuers.
Our Board of Trustees may change any of these policies without prior notice to you or a vote of our shareholders.
The Advisory Agreement
We entered into an advisory agreement with the Investment Advisor in July 2004, which was amended and restated in October 2006, January 2009 and December 2010. Pursuant to this agreement, which was unanimously approved by our Board of Trustees, including our independent trustees, we appointed the Investment Advisor to manage, operate, direct and supervise our operations. The Investment Advisor performs its duties as a fiduciary of us and our shareholders. Many of the services to be performed by the Investment Advisor in managing our day-to-day activities are summarized below.
7
This summary is provided to illustrate the material functions that the Investment Advisor performs for us as the Investment Advisor, and it is not intended to include all of the services that may be provided to us by the Investment Advisor or by third parties. The Investment Advisor may subcontract with third parties for the performance of certain duties on our behalf. The Investment Advisor will only subcontract with third parties that are believed to have the requisite experience to perform their duties. The Investment Advisor will supervise the activities of any such third parties consistent with its fiduciary duty to us. Under the terms of the advisory agreement, the Investment Advisor undertakes to use its best efforts to present to us investment opportunities consistent with our investment policies and objectives as adopted by our Board of Trustees. In its performance of this undertaking, the Investment Advisor shall, subject to the authority of the board:
| | ¡ | | find, present and recommend to us real estate investment opportunities consistent with our investment policies and objectives; |
| | ¡ | | structure the terms and conditions of transactions pursuant to which acquisitions of properties will be made; |
| | ¡ | | acquire assets on our behalf in compliance with our investment objectives and policies; |
| | ¡ | | arrange for financing and refinancing of properties; and |
| | ¡ | | enter into leases and service contracts for the properties acquired. |
The initial term of the advisory agreement was for one year and the term may be renewed at the end of each year of the agreement for an additional one-year period. The current term of the advisory agreement expires on April 30, 2011. Prior to any renewal, our trustees will evaluate the performance of the Investment Advisor and the criteria used in such evaluation will be reflected in the minutes of such meeting. Additionally, the advisory agreement may be terminated:
| | ¡ | | immediately by us (i) in the event the Investment Advisor commits fraud, criminal conduct, willful misconduct or willful or negligent breach of fiduciary duty by the Investment Advisor, (ii) upon the bankruptcy or insolvency of the Investment Advisor, CBRE Investors or CB Richard Ellis or (iii) upon material breach of the Advisory Agreement by the Investment Advisor, which remains uncured after 30 days’ written notice or (iv) if there is a dissolution of any of the Investment Advisor, CBRE Investors or CB Richard Ellis; |
| | ¡ | | without cause or penalty by a majority of our independent trustees or by the Investment Advisor upon 60 days’ written notice; or |
| | ¡ | | immediately by the Investment Advisor upon our bankruptcy or any material breach of the advisory agreement by us, which remains uncured after 10 days’ written notice. |
Affiliates of the Investment Advisor may engage in other business ventures and, as a result, their resources may not be dedicated exclusively to our business. However, pursuant to the advisory agreement, the Investment Advisor must devote sufficient resources to the administration of our company to discharge our obligations. The Investment Advisor does not currently intend to advise REITs other than us. The Investment Advisor may assign the advisory agreement to an affiliate upon approval of a majority of the trustees, including the independent trustees. Until our shares are listed on a national securities exchange, the Nasdaq Global Select Market or the Nasdaq Global Market, the trustees shall determine that any successor advisor possesses sufficient qualifications to (i) perform the advisory function for us and (ii) justify the compensation provided for in its contract with us. We may assign or transfer the advisory agreement to a successor entity of ours.
The Investment Advisor may not complete an acquisition or disposition of property or financing of such acquisition on our behalf without the prior approval of a majority of our Board of Trustees. The Investment Advisor also utilizes the resources and professionals of CBRE Investors and consults with its investment committee when evaluating potential investments. However, the actual terms and conditions of transactions involving investments in properties shall be determined in the sole discretion of the Investment Advisor, subject at all times to such board approval.
We reimburse the Investment Advisor for all of the costs it incurs in connection with the services it provides to us, including, but not limited to:
| | ¡ | | cumulative organization and offering expenses estimated to be 0.8%, but in no event shall such organizational and offering expenses exceed 15.0% of our aggregate gross offering proceeds from the sale of shares in the primary offering, which include actual legal, accounting, printing and other expenses attributable to conducting our offering or other offerings, any organizational documents, qualification of the shares for sale in the states and filing fees incurred by the Investment Advisor, as well as reimbursements for marketing, direct expenses of its employees while engaged in registering and marketing the shares and other marketing and organization costs; |
8
| | ¡ | | the annual cost of goods and materials used by us, including brokerage fees paid in connection with the purchase and sale of securities; |
| | ¡ | | administrative services including personnel costs; |
| | ¡ | | acquisition expenses, which are defined to include expenses related to the selection and acquisition of properties; |
| | ¡ | | financing expenses; and |
| | ¡ | | operating expenses, subject to certain limitations set forth in the advisory agreement, which includes all expenses paid or incurred by the Investment Advisor or its affiliates as determined by generally accepted accounting principles, such as real estate operating costs, net of reimbursements, management and leasing fees, general and administrative expenses, and legal and accounting expenses. |
The Investment Advisor and its affiliates are paid fees in connection with services provided to us. In the event the advisory agreement is terminated, the Investment Advisor will be paid all accrued and unpaid fees and expense reimbursements. In addition, an affiliate of the Investment Advisor has received one class B limited partnership interest in CBRE OP (representing 100% of the class B interest outstanding) in exchange for the services provided to us relating to our formation and future services. The class B limited partnership interest is subject to redemption by CBRE OP in the event of termination of the advisory agreement.
A majority of the independent trustees, and a majority of trustees not otherwise interested in the transaction, must approve all transactions with the Investment Advisor or any of its affiliates. Until our shares are listed on a national securities exchange, the Nasdaq Global Select Market or the Nasdaq Global Market, our independent trustees must determine from time to time, but at least annually, that our fees and expenses are reasonable in light of our performance, our net assets and net income and the fees and expenses of other comparable unaffiliated REITs. During this period, our independent trustees are also responsible for reviewing the performance of the Investment Advisor and determining that the compensation to be paid to the Investment Advisor is reasonable in relation to the nature and quality of services to be performed and that the provisions of the advisory agreement are being carried out. Specifically, our independent trustees consider factors such as:
| | ¡ | | the amount of the fee paid to the Investment Advisor in relation to the size, composition and performance of our investments; |
| | ¡ | | the success of the Investment Advisor in generating appropriate investment opportunities; |
| | ¡ | | rates charged to other REITs and other investors by advisors performing similar services; |
| | ¡ | | additional revenues realized by the Investment Advisor and any of its Affiliates through their relationship with us, whether we pay them or they are paid by others with whom we do business; |
| | ¡ | | the quality and extent of service and advice furnished by the Investment Advisor and the performance of our investment portfolio; |
| | ¡ | | the performance of our investments, including income generation, conservation or appreciation of capital, frequency of problem investments and competence in dealing with distress situations; and |
| | ¡ | | the quality of our portfolio relative to the investments generated by the Investment Advisor for its other clients. |
Until our shares are listed on a national securities exchange, the Nasdaq Global Select Market or the Nasdaq Global Market, neither our trustees, the Investment Advisor nor their affiliates may vote or consent to the voting of shares they now own or hereafter acquire on matters submitted to the shareholders regarding either (1) the removal of the Investment Advisor, any trustee or any affiliate, or (2) any transaction between us and the Investment Advisor, any trustee or any affiliate.
The Sub-Advisory Agreement
The Investment Advisor has entered into a sub-advisory agreement with CNL Fund Management Company, or the Sub-Advisor. The Sub-Advisor, which is a wholly-owned subsidiary of CNL Financial Group, Inc., is an affiliate of the Dealer Manager, which is a wholly-owned subsidiary of CNL Capital Markets Corp. Pursuant to this agreement, the Sub-Advisor acts only as an advisor to the Investment Advisor, upon request, and may provide advisory services relating to real estate acquisitions, property management and communications with existing investors and, in addition, provides marketing and other operational services. The term of this agreement will continue so long as the Investment Advisor remains our advisor pursuant to the advisory agreement and it may automatically be extended concurrently with the advisory agreement. The sub-advisory agreement may be terminated by (i) the Investment Advisor for “cause” on 60 days’ written notice or if the managing dealer agreement is terminated pursuant to its terms, or (ii) the Sub-Advisor for
9
a material breach of the agreement which remains uncured after 15 days’ written notice or the bankruptcy of the Investment Advisor. For advisory services relating to real estate acquisitions, property management and communications with existing investors, the Investment Advisor compensates the Sub-Advisor through certain investment management and acquisition fees, which are in an amount equal to approximately 14% to 19%, respectively, of such fees the Investment Advisor receives from us. The Sub-Advisor may also provide certain marketing and operational services to the Investment Advisor, for which it is entitled to receive fees, and the Sub-Advisor is also entitled to reimbursement by the Investment Advisor for certain expenses it incurs. In the event the sub-advisory agreement is terminated, the Sub-Advisor will be paid all accrued and unpaid fees and expense reimbursements. The Investment Advisor retains ultimate responsibility for the performance of all of the matters entrusted to it under the advisory agreement.
Industry Segments
We view our operations as having three reportable segments, two Domestic segments, consisting of Domestic Office Properties and Domestic Industrial Properties and an International Office/Retail Properties segment, which participate in the acquisition, development, ownership and operation of high quality real estate assets in their respective regions. Information regarding our reportable segments can be reviewed under Note 11, “Segment Disclosure,” in the accompanying consolidated financial statements.
Geographic Areas of Properties
We currently operate in two geographic areas, the United States and the United Kingdom. Information regarding the geographic diversification of our consolidated properties as of December 31, 2010 can be reviewed under Note 10, “Concentrations—Geographic Concentrations,” in the accompanying consolidated financial statements. As of December 31, 2010, we also have ownership interests in (i) CBRE Strategic Partners Asia, which, owned interests in properties in China and Japan, (ii) the UK JV, which owned interests in properties in the United Kingdom and (iii) the European JV, which owned interests in properties in Germany. Information relative to CBRE Strategic Partners Asia, the UK JV and the European JV can be reviewed under Note 5, “Investments in Unconsolidated Entities” in the accompanying consolidated financial statements.
Competition
As we purchase properties to build our portfolio, we are in competition with other potential buyers for the same properties, which may result in an increase in the amount we must pay to acquire a property or may require us to locate another property that meets our investment criteria. Leasing of real estate is also highly competitive in the current market, and we will experience competition for tenants from owners and managers of competing projects. As a result, we may have to provide rent concessions, incur charges for tenant improvements or offer other inducements to enable us to timely lease vacant space, all of which may have an adverse impact on our results of operations. At the time we elect to dispose of our properties, we will also be in competition with sellers of similar properties to locate suitable purchasers.
10
Organizational Structure
The following chart illustrates our general structure and ownership and the management relationship between the Investment Advisor and us.
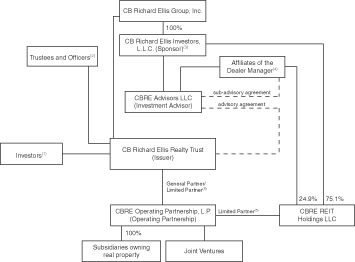
| (1) | Includes investors in our current public offering, our initial public offering and our private offerings, excluding shares held by CBRE Investors, our trustees and officers. As of December 31, 2010, 164,511,252 common shares were issued and outstanding. |
| (2) | Our trustees and officers own an aggregate 105,642 of our common shares. |
| (3) | CBRE Investors owns 243,229 of our common shares. CBRE Investors also owns all of the cash distribution interest and CBRE Investors (including certain of its current and former executive officers and our executive officers) own an aggregate 77% distribution interest in the net proceeds upon a sale of the Investment Advisor. |
| (4) | Fund Investors, LLC and CNL Fund Management Company, affiliates of the Dealer Manager, own (i) an aggregate 23% distribution interest in the net proceeds upon a sale of the Investment Advisor and (ii) an aggregate 24.9% voting and distribution interest (excluding distributions that CBRE Investors is entitled to with respect to 29,937 class A units) in CBRE REIT Holdings LLC. CNL Fund Management Company serves as the Sub-Advisor to the Investment Advisor. |
| (5) | CBRE Investors owns a 75.1% voting interest and CBRE Investors (including certain of its current and former executive officers) and our executive officers own an aggregate 75.1% distribution interest (excluding distributions that CBRE Investors is entitled to with respect to 29,937 class A units) in CBRE REIT Holdings LLC. |
| (6) | As of December 31, 2010, we owned a 99.85% general/limited partnership interest in CBRE OP and CBRE REIT Holdings LLC owned a 0.15% (or 246,361 class A units) limited partnership interest in CBRE OP. CBRE REIT Holdings LLC also owns one class B limited partnership interest in CBRE OP (representing 100% of the class B interest outstanding). CBRE REIT Holdings LLC is controlled by CBRE Investors. |
Employees
As of December 31, 2010, we had no full-time employees and do not anticipate any material changes in the number of our full-time employees. Our executive officers are employees of the Investment Advisor or one or more of its affiliates.
Facilities
Our principal offices are located at 47 Hulfish Street, Suite 210, Princeton, New Jersey 08542. We also have offices located at 515 South Flower Street, Suite 3100, Los Angeles, California 90071. Our telephone number is (609) 683-4900.
Available Information
Our website ishttp://www.cbrerealtytrust.com. The information found on, or otherwise accessible through, our website is not incorporated information and does not form a part of this Annual Report on Form 10-K or any other report or document we file with or furnish to the SEC. We make available, free of charge, on or through the “SEC Filings” section of our website, annual reports on
11
Form 10-K, quarterly reports on Form 10-Q, current reports on Form 8-K and amendments to those reports filed or furnished pursuant to Section 13(a) or 15(d) of the Securities Exchange Act of 1934, as amended, as soon as reasonably practicable after we electronically file such material with, or furnish it to, the SEC. We have also posted on our website the Audit Committee Charter, Compensation Committee Charter, Conflicts Committee Charter and Code of Business Conduct and Ethics, which govern our trustees, officers and employees. Within the time period required by the SEC, we will post on our website any amendment to our Code of Business Conduct and Ethics and any waiver applicable to our senior financial officers, and our executive officers or trustees. The information contained on our website is not incorporated into this report on Form 10-K. You can also read and copy any materials we file with the Securities and Exchange Commission at its Public Reference Room at 100 F Street, NE, Washington, DC 20549 (1-800-SEC-0330). The Securities and Exchange Commission maintains an Internet site(http://www.sec.gov) that contains reports, proxy and information statements, and other information regarding issuers that file electronically with the Securities and Exchange Commission.
Recent Developments
From January 1, 2011 through March 17, 2011, we received gross proceeds from our public offering of approximately $80,515,423 from the sale of 8,105,529 common shares.
On January 20, 2011 and February 14, 2011, we paid down the Amended Wells Fargo Credit Facility loan payable by $20,000,000 and $15,000,000, respectively. On March 30, 2011, an additional $30,000,000 was drawn down on the Amended Wells Fargo Credit Facility.
On January 31, 2011, we were notified that the investment commitment period of CBRE Strategic Partners Asia was extended for one year from January 31, 2011 to January 31, 2012.
On February 8, 2011, we entered into five secured term loans totaling $37,000,000 with ING USA Annuity and Life Insurance Company secured by the following properties: 4701 Gold Spike Road, $10,650,000, Summit Distribution Center, $6,700,000, Tolleson Commerce Park II, $4,600,000, 3660 Deerpark Blvd., $7,650,000 and 1985 International Way, $7,400,000. The loans bear interest at a fixed rate of 4.45% and mature on February 8, 2018.
On February 22, 2011, we entered into a lease for the Kings Mountain III property, a 541,910 square foot warehouse/distribution building located in Charlotte, North Carolina for a 10 year term.
On February 28, 2011, we entered into a $33,000,000 secured term loan with TD Bank secured by the 100 Kimball Drive property. Upon closing the 100 Kimball Drive loan, we simultaneously entered into an interest rate swap agreement with TD Bank to effectively fix the interest rate on the entire outstanding loan amount to 5.25% for its 10 year term.
12
On March 24, 2011, the Duke joint venture acquired fee interests in the second and third tranches of properties (the “Remaining Properties”), thus completing the acquisition of the Office Portfolio, as described further below.
| | | | | | | | | | | | | | | | | | | | | | | | | | | | | | | | |
Property and Market | | Address | | Year
Built | | | Tenant(1) | | Net
Rentable
Square
Feet | | | Lease
Expiration | | | Approximate
Purchase
Price(2) | | | Pro Rata
Share of
Approximate
Purchase
Price(3) | | | Percentage
Leased | | | Acquisition
Fee(4) | |
Norman Pointe I /
Minneapolis, MN | | 5601 Green Valley Drive Bloomington, MN | | | 2000 | | | NCS Pearson, Inc.(5) | | | 212,722 | | | | 02/2017 | | | $ | 42,600,000 | | | $ | 34,080,000 | | | | 100 | % | | $ | 511,200 | |
| | | | | | | | | |
Norman Pointe II /
Minneapolis, MN | | 5600 West American Boulevard, Bloomington, MN | | | 2007 | | | General Services Administration(6); Hartford Fire Insurance Company(7) | | | 324,296 | | |
| 02/2016;
06/2013 |
| | $ | 46,900,000 | | | $ | 37,520,000 | | | | 100 | % | | $ | 562,800 | |
| | | | | | | | | |
The Landings I /
Cincinnati, Ohio | | 9997 Carver Road, Blue Ash, OH | | | 2006 | | | Citicorp North America(8) | | | 175,695 | | | | 01/2022 | | | $ | 29,659,500 | | | $ | 23,727,600 | | | | 100 | % | | $ | 355,914 | |
| | | | | | | | | |
The Landings II /
Cincinnati, Ohio | | 9987 Carver Road, Blue Ash, OH | | | 2007 | | | — | | | 175,076 | | | | — | | | $ | 26,160,500 | | | $ | 20,928,400 | | | | 96.1 | % | | $ | 313,926 | |
| | | | | | | | | |
One Easton Oval /
Columbus, Ohio | | One Easton Oval, Columbus, Ohio | | | 1997 | | | — | | | 125,031 | | | | — | | | $ | 11,911,000 | | | $ | 9,528,800 | | | | 89.4 | % | | $ | 142,932 | |
| | | | | | | | | |
Two Easton Oval /
Columbus, Ohio | | Two Easton Oval, Columbus, Ohio | | | 1995 | | | — | | | 128,674 | | | | — | | | $ | 12,744,000 | | | $ | 10,195,200 | | | | 74.6 | % | | $ | 152,928 | |
| | | | | | | | | |
Weston Pointe I /
Ft. Lauderdale, Florida | | 2400 North Commerce Parkway, Weston, FL | | | 1999 | | | — | | | 97,579 | | | | — | | | $ | 19,384,250 | | | $ | 15,507,400 | | | | 87.1 | % | | $ | 232,611 | |
| | | | | | | | | |
Weston Pointe II /
Ft. Lauderdale, Florida | | 2200 North Commerce Parkway, Weston, FL | | | 2000 | | | — | | | 97,180 | | | | — | | | $ | 23,375,950 | | | $ | 18,700,760 | | | | 100 | % | | $ | 280,511 | |
| | | | | | | | | |
Weston Pointe III /
Ft. Lauderdale, Florida | | 2250 North Commerce Parkway, Weston, FL | | | 2003 | | | American Intercontinental University(9) | | | 97,178 | | | | 09/2015 | | | $ | 23,583,550 | | | $ | 18,866,840 | | | | 100 | % | | $ | 283,003 | |
| | | | | | | | | |
Weston Pointe IV /
Ft. Lauderdale, Florida | | 2100 North Commerce Parkway, Weston, FL | | | 2006 | | | General Services Administration(6) | | | 96,175 | | | | 04/2019 | | | $ | 28,256,250 | | | $ | 22,605,000 | | | | 100 | % | | $ | 339,075 | |
| | | | | | | | | |
One Conway Park /Chicago, Illinois | | 100 Field Drive, Lake Forest, IL | | | 1989 | | | — | | | 105,000 | | | | — | | | $ | 15,400,000 | | | $ | 12,320,000 | | | | 86.5 | % | | $ | 184,800 | |
| | | | | | | | | |
West Lake at Conway /
Chicago, Illinois | | 1925 West Field Ct., Lake Forest, IL | | | 2008 | | | — | | | 99,538 | | | | — | | | $ | 17,575,000 | | | $ | 14,060,000 | | | | 90.1 | % | | $ | 210,900 | |
| | | | | | | | | |
Atrium I /Columbus, Ohio | | 5525 Parkcenter Circle, Dublin, OH | | | 1996 | | | Nationwide Mutual Insurance Company(10) | | | 315,102 | | |
| 05/2018;
05/2019 |
(11) | | $ | 45,250,000 | | | $ | 36,200,000 | | | | 100 | % | | $ | 543,000 | |
| (1) | This column represents tenants that currently occupy more than 50,000 net rentable square feet of each property. Properties which do not list a tenant are multi-tenant properties that do not currently have a tenant that occupies more than 50,000 net rentable square feet. |
| (2) | Approximate total purchase price, exclusive of customary closing costs, paid by the Duke Joint Venture for each property. |
| (3) | Pro rata share of approximate purchase price is at the Company’s pro rata share of effective ownership for each of these properties, which was funded using net proceeds of the Company’s current public offering. |
| (4) | Acquisition fees payable to the Investment Advisor are not included in the total acquisition cost for the properties. |
| (5) | NCS Pearson, Inc. provides services, software, systems, and Internet-based technologies for the collection, management, and interpretation of data. |
| (6) | The General Services Administration is an independent agency of the Federal Government of the United States of America, which supplies products and communications for U.S. government offices, provides transportation and office space to federal employees and develops government-wide cost-minimizing policies and other management tasks. |
| (7) | Hartford Fire Insurance Company is a subsidiary of The Hartford Financial Services Group and one of the world’s leading providers of fire, marine and casualty insurance. |
| (8) | Citicorp North America, Inc., provides regional banking services and is a subsidiary of Citigroup, Inc. (NYSE: C). |
| (9) | American Intercontinental University is an international for-profit university with both physical and online campuses. |
| (10) | Nationwide Mutual Insurance Company is one of the nation’s largest insurance and financial services companies. |
| (11) | This tenant has two separate leases within this property, as they rent two separate spaces. |
13
On March 24, 2011, in connection with the acquisition of the Remaining Properties as described above, the Duke joint venture entered into a $275,000,000 unsecured term loan (the “Term Loan Agreement”) with Wells Fargo Bank, National Association. While the term loan is non-recourse to us, the pro rata share of the term loan obligation attributable to us is $220,000,000 in accordance with our ownership interest in the Duke joint venture. The loan proceeds were used to accelerate the acquisition of the Remaining Properties. The loan has a six-month term and two six-month extension options. The term loan has an interest rate of LIBOR plus 2.50% and is fully pre-payable at any time, subject to any customary costs. An origination fee of $1,650,000 was paid to Wells Fargo Bank, National Association at the closing of the term loan. The Term Loan Agreement contains customary representations and warrants and covenants. During the term of the loan, the Duke Joint Venture has agreed to comply with certain financial covenants related to its leverage ratio, net asset value, unencumbered leverage ratio and the inability to enter into certain types of investments.
14
Risks Related To Our Business
The Investment Advisor has limited experience operating a REIT and we cannot assure you that the past experience of its management will be sufficient to successfully manage our business as a REIT.
The Investment Advisor has limited experience operating a REIT, and the Investment Advisor has limited direct experience in complying with the income, asset and other limitations imposed by the REIT provisions of the Internal Revenue Code. Those provisions are complex and the failure to comply with those provisions in a timely manner could cause us to fail to qualify as a REIT or could force us to pay unexpected taxes and penalties. The Investment Advisor’s limited experience in managing a portfolio of assets under such constraints may hinder its ability to achieve our investment objectives. We can offer no assurance that the Investment Advisor will replicate CBRE Investors’ historical success or our management team’s success in its previous endeavors.
You must rely entirely upon the ability of the Investment Advisor with respect to the selection and timing of investments in and the management of unspecified assets, and you will not have an opportunity to evaluate for yourself the relevant economic, financial and other information regarding the assets in which the proceeds of our public offerings will be invested.
Our ability to achieve our investment objectives and to pay dividends is dependent upon the performance of the Investment Advisor, the real estate market and general economic conditions in the geographic regions where we invest. You must rely totally on the Investment Advisor in the selection of assets. We cannot be sure that the Investment Advisor will be successful in obtaining suitable investments on financially attractive terms or that, if investments are made, our objectives will be achieved. Furthermore, you should be aware that any appraisals we obtain are merely estimates of value and should not be relied upon as accurate measures of true worth or realizable value. Moreover, delays in investing the net proceeds of our public offerings may reduce our income. Our shareholders will not have the opportunity to evaluate the manner in which the net proceeds received by us from our public offerings are to be invested or the economic merits of particular assets to be acquired.
We are dependent on the Investment Advisor and may not find a suitable replacement if the advisory agreement is terminated, in which case we may not be able to operate our business.
We have no employees and are completely reliant on the Investment Advisor, which has significant discretion as to the implementation and execution of our operating policies and strategies. We depend on the diligence, skill and network of business contacts of the management of our Investment Advisor, and, through our sponsor, CBRE Investors. We can offer no assurance that the Investment Advisor will remain our investment advisor or that we will continue to have access to the Investment Advisor’s professionals, and, through the Investment Advisor, the resources and experience of CBRE Investors. We are subject to the risk that the advisory agreement may be terminated by either party. If the advisory agreement is terminated and no suitable replacement is found to manage us or key personnel leave our Investment Advisor, we may not be able to execute our business plan.
If the Investment Advisor loses or is unable to obtain key personnel, our ability to implement our investment strategies could be delayed or hindered.
Our success depends to a significant degree upon the continued contributions of certain key personnel of the Investment Advisor who would be difficult to replace. None of our key personnel are currently subject to employment agreements with us, nor do we maintain any key person life insurance on these key personnel. If the Investment Advisor were to lose the benefit of the experience, efforts and abilities of one or more of these individuals, our operating results could suffer. We also believe that our future success depends, in large part, upon the Investment Advisor’s ability to obtain and retain highly skilled managerial, operational and marketing personnel. Competition for such personnel is intense, and we cannot assure you the Investment Advisor will be successful in attracting and retaining such skilled personnel.
Your investment return may be reduced if we are required to register as an investment company under the Investment Company Act of 1940, as amended.
We do not intend to invest in marketable securities and we do not intend to register as an investment company under the Investment Company Act of 1940, as amended, (“the Investment Company Act”). If we were obligated to register as an investment company, we would have to comply with a variety of substantive requirements under the Investment Company Act that impose, among other things:
| | ¡ | | limitations on capital structure; |
15
| | ¡ | | restrictions on specified investments; |
| | ¡ | | prohibitions on transactions with affiliates; and |
| | ¡ | | compliance with reporting, record keeping, voting, proxy disclosure and other rules and regulations that would significantly increase our operating expenses. |
In general, we expect to be able to rely on the exemption from registration provided by Section 3(c)(5)(C) of the Investment Company Act. In order to qualify for this exemption, at least 55% of our portfolio must be comprised of real property and mortgages and other liens on an interest in real estate (collectively, “qualifying assets”) and at least 80% of our portfolio must be comprised of real estate-related assets. Qualifying assets include mortgage loans, mortgage-backed securities that represent the entire ownership in a pool of mortgage loans and other interests in real estate. In order to maintain our exemption from regulation under the Investment Company Act, we must continue to engage primarily in the business of buying real estate, and these investments must be made within a year after our offering ends. If we are unable to invest a significant portion of the proceeds of our offering in properties within one year of the termination of our offering, we may be able to avoid being required to register as an investment company by temporarily investing any unused proceeds in government securities with low returns. This would reduce the cash available for distribution to shareholders and possibly lower your returns.
To maintain compliance with the Investment Company Act exemption, we may be unable to sell assets we would otherwise want to sell and may need to sell assets we would otherwise wish to retain. In addition, we may have to acquire additional income or loss generating assets that we might not otherwise have acquired or may have to forego opportunities to acquire interests in companies that we would otherwise want to acquire and would be important to our investment strategy. If we were required to register as an investment company we would be prohibited from engaging in our business as currently contemplated because the Investment Company Act imposes significant limitations on leverage. In addition, we would have to seek to restructure the advisory agreement because the compensation that it contemplates would not comply with the Investment Company Act. Criminal and civil actions could also be brought against us if we failed to comply with the Investment Company Act. In addition, our contracts would be unenforceable unless a court was to require enforcement, and a court could appoint a receiver to take control of us and liquidate our business.
Conflicts of Interest Risks
The Investment Advisor faces conflicts of interest relating to time management.
Although the Investment Advisor does not currently advise any other real estate investment programs, the Investment Advisor’s affiliates, including CBRE Investors, are sponsors of other real estate programs having investment objectives and legal and financial obligations similar to ours. In addition, certain members of the management team of the Investment Advisor may also work with or for other affiliates. As a result, they may have interests in other real estate programs and also engage in other business activities, and may have conflicts of interest in allocating their time between our business and these other activities. During times of intense activity in other programs and ventures, they may devote less time and resources to our business than is necessary or appropriate. If the Investment Advisor, for any reason, is not able to provide investment opportunities to us consistent with our investment objectives in a timely manner, we may have lower returns on our investments.
The Investment Advisor faces conflicts of interest relating to the purchase and leasing of assets.
We may be buying assets at the same time as other existing or future affiliates of the Investment Advisor are buying assets. There is a risk that the Investment Advisor will choose an asset that provides lower returns to us than an asset purchased by an affiliate of the Investment Advisor. We may acquire assets in geographic areas where other affiliates own assets. If another affiliate attracts a tenant that we are competing for, we could suffer a loss of revenue due to delays in locating another suitable tenant.
The Investment Advisor may have conflicting fiduciary obligations if we acquire properties with its affiliates or other related entities; as a result, in any such transaction we may not have the benefit of arm’s length negotiations of the type normally conducted between unrelated parties.
The Investment Advisor may cause us to acquire an interest in a property from its affiliates or through a joint venture with its affiliates or to dispose of an interest in a property to its affiliates. In these circumstances, the Investment Advisor will have a conflict of interest when fulfilling its fiduciary obligation to us. In any such transaction we may not have the benefit of arm’s length negotiations of the type normally conducted between unrelated parties.
16
We pay substantial fees and expenses to the Investment Advisor, its affiliates and the Dealer Manager, which payments increase the risk that you will not earn a profit on your investment.
The Investment Advisor and its affiliates perform services for us in connection with the selection and acquisition of our investments, the management and leasing of our properties and the administration of our other investments. We pay the Investment Advisor an acquisition fee that is not tied to the performance of our portfolio. The Investment Advisor is a party to a sub-advisory agreement with the CNL Fund Management Company, which is an affiliate of the Dealer Manager, and the Investment Advisor will compensate the Sub-Advisor through certain fees and reimbursable expenses the Investment Advisor receives from us. We pay fees and commissions to the Dealer Manager in connection with the offer and sale of the shares. We also have issued to CBRE REIT Holdings LLC, an affiliate of the Investment Advisor, one class B limited partnership interest (representing 100% of the class B interest outstanding) in CBRE OP in exchange for the services provided to us relating to our formation and future services. Our sponsor (including certain of its executive officers) and our executive officers own an aggregate 75.1% distribution interest and affiliates of the Dealer Manager own an aggregate 24.9% distribution interest (excluding distributions that CBRE Investors is entitled to with respect to 29,937 class A units) in CBRE REIT Holdings LLC. These fees and partnership interest distributions reduce the amount of cash available for investment in properties or distribution to shareholders. These fees also increase the risk that the amount available for distribution to common shareholders upon a liquidation of our portfolio would be less than the purchase price of the shares in our current public offering and that you may not earn a profit on your investment.
Termination of the Advisory Agreement could be costly.
If the advisory agreement is terminated without cause, CBRE OP will redeem the class B limited partnership interest for a newly created class of partnership interest, which we refer to as the advisor redemption interest, which shall initially have a capital account equal to the fair value of the class B limited partnership interest as of such date, and if the advisory agreement is terminated for cause, CBRE OP will redeem the class B limited partnership interest for $100. These provisions may increase the effective cost to us of terminating the advisory agreement, thereby discouraging us from terminating the Investment Advisor without cause.
Certain of our officers and trustees face conflicts of interest.
One of our trustees serves as the Global Chief Operating Officer of CBRE Investors. Our Chief Financial Officer serves as a Managing Director of the Investment Advisor, as the Executive Managing Director and Global Head of Investment Reporting of CBRE Investors and as a member of the investment committee of CBRE Strategic Partners Asia, an entity in which we are a limited partner. Our Chairman, President and Chief Executive Officer serves as the President and Chief Executive Officer of the Investment Advisor and also serves as a Managing Director of CBRE Investors. Our Chief Operating Officer and Executive Vice President serves as the Director of Operations of the Investment Advisor. Our Chairman, President and Chief Executive Officer and our Chief Financial Officer directly hold an aggregate of approximately a 12.9% economic interest in the Investment Advisor. These individuals owe fiduciary duties to these entities and their shareholders. Such fiduciary duties may from time to time conflict with the fiduciary duties owed to our shareholders and us. An affiliate of the Investment Advisor owns one class B limited partnership interest (representing 100% of the class B interest outstanding) in CBRE OP. This interest entitles such affiliate to receive distributions in an amount equal to a percentage of the net proceeds we receive from a sale of a property after certain amounts are paid or provided for. This interest may incentivize the Investment Advisor to recommend the sale of a property or properties that may not be in our best interest at the time. In addition, the premature sale of a property may add concentration risk to the portfolio or may be at a price lower than if we held on to the property and sold it at a later date.
We will be subject to additional risks as a result of any joint ventures.
We have entered, and may in the future enter, into joint ventures for the acquisition, development or improvement of properties. We have purchased and developed, and may in the future purchase and develop, properties in joint ventures or in partnerships, co-tenancies or other co-ownership arrangements with sellers of properties, affiliates of sellers, developers or other persons. Such investments may involve risks not otherwise present with an investment in real estate, including, for example:
| | ¡ | | the possibility that our co-venturer, co-tenant or partner in an investment might become bankrupt; |
| | ¡ | | that maturities of debt encumbering our jointly owned investments may not be able to be refinanced at all or on terms that are as favorable as the current terms; |
| | ¡ | | that such co-venturer, co-tenant or partner may at any time have economic or business interests or goals which are or become inconsistent with our business interests or goals; or |
| | ¡ | | that such co-venturer, co-tenant or partner may be in a position to take action contrary to our instructions or requests or contrary to our policies or objectives. |
17
Actions by such a co-venturer, co-tenant or partner might have the result of subjecting the property to liabilities in excess of those contemplated and may have the effect of reducing your returns. We have ownership interests in five unconsolidated entities that, as of December 31, 2010, owned interests in 38 properties.
It may be difficult for us to exit a joint venture after an impasse.
In our joint ventures, there will be a potential risk of impasse in some business decisions because our approval and the approval of each co-venturer may be required for some significant operating decisions. In any joint venture, we may have the right to buy the other co-venturer’s interest or to sell our own interest on specified terms and conditions in the event of an impasse. In the event of an impasse, it is possible that neither party will have the funds necessary to complete a buy-out. In addition, we may experience difficulty in locating a third-party purchaser for our joint venture interest and in obtaining a favorable sale price for the interest. As a result, it is possible that we may not be able to exit the relationship if an impasse develops.
Our ability to redeem all or a portion of our investment in CBRE Strategic Partners Asia is subject to significant restrictions.
CBRE Strategic Partners Asia is not obligated to redeem the interests of any of its investors, including us, prior to 2017. Except in certain limited circumstances such as transfers to affiliates or successor trustees or state agencies, we will not be permitted to sell our interest in CBRE Strategic Partners Asia without the prior written consent of the general partner, which the general partner may withhold in its sole discretion.
General Investment Risks
No market currently exists for our common shares. If you are able to sell your shares, you would likely have to sell them at a substantial discount.
There is no current market for our shares and, therefore, it will be difficult for you to sell your shares promptly. We cannot assure you that any trading market will develop or, if developed, that any such market will be sustained. Additionally, our declaration of trust contains restrictions on the ownership and transfer of our shares, and these restrictions may inhibit your ability to sell your shares. You may not sell your shares unless the buyer meets applicable suitability and minimum purchase standards. Therefore, it will be difficult for you to sell your shares promptly or at all. In addition, the price received for any shares sold is likely to be less than the proportionate value of the real estate we own. Therefore, you should purchase our shares only as a long-term investment.
We are conducting a “best efforts” offering and if we are unable to raise substantial funds, we may have substantial limitations on our ability to maintain a diversified portfolio of assets.
The Dealer Manager is selling our shares on a “best efforts” basis, whereby it and the other broker-dealers participating in our current public offering are only required to use their best efforts to sell our common shares and have no firm commitment or obligation to purchase any of our common shares. As a result, we cannot assure you as to the amount of proceeds that will be raised in our current offering. If we are unable to raise substantial funds in our current offering, we will make fewer additional investments resulting in less diversification in terms of the number of assets owned, the geographic regions in which our properties and real estate—related assets are located and the types of assets that we acquire. In such event, the likelihood of our profitability being affected by the performance of any one of our assets will increase.
Restrictions on ownership of a controlling percentage of our shares may limit your opportunity to receive a premium on your shares.
To assist us in complying with the share ownership requirements necessary for us to qualify as a REIT, our declaration of trust prohibits, with certain exceptions, direct or constructive ownership by any person of more than 3.0% by number or value, whichever is more restrictive, of our outstanding common shares or more than 3.0% by number or value, whichever is more restrictive, of our outstanding shares. Our Board of Trustees, in its sole discretion, may exempt a person from the share ownership limit. Additionally, our declaration of trust prohibits direct or constructive ownership of our shares that would otherwise result in our failure to qualify as a REIT. The constructive ownership rules in our declaration of trust are complex and may cause the outstanding shares owned by a group of related individuals or entities to be deemed to be constructively owned by one individual or entity. As a result, the acquisition of less than any ownership limit by an individual or entity could cause that individual or entity to own constructively in excess of any ownership limit of our outstanding shares. Any attempt to own or transfer our shares in excess of the ownership limit without the consent of our Board of Trustees shall be void, and will result in the shares being transferred to a charitable trust. These provisions may inhibit market activity
18
and the resulting opportunity for our shareholders to receive a premium for their shares that might otherwise exist if any person were to attempt to assemble a block of our shares in excess of the number of shares permitted under our declaration of trust and which may be in the best interests of our shareholders.
Maryland takeover statutes could restrict a change of control, which could have the affect of inhibiting a change in control even if a change in control were in our shareholders’ interests.
Under Maryland law, certain “business combinations” between a Maryland REIT and an interested shareholder or an affiliate of an interested shareholder are prohibited for five years after the most recent date on which the interested shareholder becomes an interested shareholder. These business combinations include a merger, consolidation, share exchange, or asset transfers or issuance or reclassification of equity securities. An interested shareholder is defined as:
| | ¡ | | any person who beneficially owns 10% or more of the voting power of our company’s shares; or |
| | ¡ | | an affiliate or associate of our company who, at any time within the two-year period prior to the date in question, was the beneficial owner of 10% or more of the voting power of the then outstanding voting shares of our company. |
A person is not an interested shareholder under the statute if our Board of Trustees approves in advance the transaction by which he otherwise would have become an interested shareholder.
After the five-year prohibition, any business combination between the Maryland REIT and an interested shareholder generally must be recommended by our Board of Trustees and approved by the affirmative vote of at least:
| | ¡ | | 80% of the votes entitled to be cast by holders of outstanding shares of voting shares of our company; and |
| | ¡ | | 66% of the votes entitled to be cast by holders of voting shares of our company other than shares held by the interested shareholder with whom or with whose affiliate the business combination is to be effected or by the interested shareholder’s affiliates or associates, voting together as a single group. |
The business combination statute may discourage others from trying to acquire control of us and increase the difficulty of consummating any offer, including potential acquisitions that might involve a premium price for our common shares or otherwise be in the best interest of our shareholders.
Our Board of Trustees has adopted a resolution exempting our company from the provisions of the Maryland General Corporate Law (the “MGCL”) relating to business combinations with interested shareholders or affiliates of interested shareholders. However, such resolution can be altered or repealed, in whole or in part, at any time by our Board of Trustees. If such resolution is repealed, the business combination statute could have the effect of discouraging offers to acquire us and of increasing the difficulty of consummating these offers, even if our acquisition would be in our shareholders’ best interests.
Maryland law also limits the ability of a third-party to buy a large stake in us and exercise voting power in electing trustees.
The MGCL, as applicable to REITs, provides that “control shares” of a Maryland real estate investment trust acquired in a “control share acquisition” have no voting rights except to the extent approved by a vote of two-thirds of the votes entitled to be cast on the matter, excluding shares owned by the acquiror, by officers or by directors who are employees of the corporation. “Control shares” are voting shares that would entitle the acquirer to exercise voting power in electing trustees within specified ranges of voting power. Control shares do not include shares the acquiring person is then entitled to vote as a result of having previously obtained shareholder approval. A “control share acquisition” means the acquisition of control shares. The control share acquisition statute does not apply (i) to shares acquired in a merger, consolidation or share exchange if we are a party to the transaction, or (ii) to acquisitions approved or exempted by our declaration of trust or bylaws. Our bylaws contain a provision exempting from the control share acquisition statute any and all acquisitions by any person of our shares. We cannot assure you that such provision will not be amended or eliminated at any time in the future. If such provision is eliminated, the control share acquisition statute could have the effect of discouraging offers to acquire us and increasing the difficulty of consummating any such offers, even if our acquisition would be in our shareholders’ best interests.
You are limited in your ability to sell your shares pursuant to our share redemption program.
Our share redemption program provides you with the opportunity, on a quarterly basis, to request that we redeem all or a portion of your shares after you have held them for one year, subject to certain restrictions and limitations. In the event that an eligible shareholder presents fewer than all of his or her shares to us for redemption, such shareholder must present at least 25% of his or her
19
shares to us for redemption and must retain at least $5,000 of common shares if any shares are held after such redemption. Shares will be redeemed only to the extent of cash available after the payment of dividends necessary to maintain our qualification as a REIT and to avoid the payment of any U.S. federal income tax or excise tax on our net taxable income. This will significantly limit our ability to redeem your shares. To the extent our available cash flow is insufficient to fund all redemption requests, each shareholder’s request will be reduced on a pro rata basis, unless you withdraw your request for redemption or ask that we carry over your request to the next quarterly period, if any, when sufficient funds become available. Our Board of Trustees reserves the right to amend or terminate the share redemption program at any time. Our Board of Trustees has delegated to our officers the right to waive the one-year holding period and pro rata redemption requirements in the event of the death, disability (as such term is defined in the Internal Revenue Code) or bankruptcy of a shareholder. You will have no right to request redemption of your shares should our shares become listed on a national exchange, the NASDAQ Global Select Market or the NASDAQ Global Market. Therefore, in making a decision to purchase shares, you should not assume that you will be able to sell any of your shares back to us pursuant to our share redemption program.
We established the offering price on an arbitrary basis.
Our Board of Trustees has arbitrarily determined the selling price of the shares being offered in our current public offering. The offering price of our common shares is fixed and will not vary based on the underlying value of our assets at any time. The offering price of our common shares has not been based on appraisals for any assets we currently own or may own nor do we currently intend to obtain such appraisals. Therefore, the fixed offering price established for our common shares may not accurately represent the current value of our assets per common share at any particular time and may be higher or lower than the actual value of our assets per common share at such time. In addition, our offering price may not be indicative of the price at which our shares would trade if they were listed on an exchange or actively traded by brokers nor of the proceeds that a shareholder would receive if we were liquidated or dissolved.
Investors who purchased common shares in our offering incurred, as of December 31, 2010, an immediate dilution of up to approximately ($1.89), or (18.86)%, in the book value per share of our common shares from the price paid in our offering. Investors purchasing common shares in our offering may experience further dilution if we issue additional equity.
The initial offering price of our common shares is substantially higher than the book value per share of our outstanding common shares will be after our offering. Therefore, investors who purchase our common shares will incur, if calculated as of December 31, 2010, an immediate dilution of up to approximately ($1.89), or (18.86) %, in the book value per share of our common shares from the price paid in our offering. Existing shareholders and potential investors in our offering do not have preemptive rights to any common shares issued by us in the future. Therefore, investors purchasing shares in our offering may experience further dilution of their equity investment in the event that we sell additional common shares in the future, if we sell securities that are convertible into common shares or if we issue shares upon the exercise of options.
We may be unable to pay or maintain cash distributions or increase distributions over time.
There are many factors that can affect the availability and timing of cash distributions to shareholders. Cash distributions will be based principally on cash available from our operations. The amount of cash available for distributions is affected by many factors, such as our ability to buy properties as offering proceeds become available, rental income from such properties, and our operating expense levels, as well as many other variables. Actual cash available for distributions may vary substantially from estimates. We cannot assure investors that we will be able to pay or maintain our current anticipated level of distributions or that distributions will increase over time. We cannot give any assurance that rents from the properties will increase, or that future acquisitions of real properties or other real estate assets will increase our cash available for distributions to shareholders. Our actual results may differ significantly from the assumptions used by our Board of Trustees in establishing the distribution rate to shareholders. We may not have sufficient legally available cash from operations to make a distribution required to qualify for or maintain our REIT status. We may increase borrowings or use proceeds from our current public offering to make distributions, each of which could be deemed to be a return of investors’ capital. We may make distributions from the proceeds of our current public offering or from borrowings in anticipation of future cash flow. Any such distributions will constitute a return of capital and may reduce the amount of capital we ultimately invest in properties and negatively impact the value of investors’ investment.
The amount and timing of cash dividends is uncertain.
Subject to certain limitations, we bear all expenses incurred in our operations, which reduces cash generated by operations and amounts available for distribution to our shareholders. In addition, our Board of Trustees, in its discretion, may retain any portion of such funds for working capital, subject to the REIT distribution requirements. We have not set any future dividend payment amount and cannot assure you that sufficient cash will be available to pay dividends to you.
20
We are uncertain of our sources for funding of future capital needs.
Substantially all of the net proceeds of the offering will be used for investment in assets and for payment of various fees and expenses. Accordingly, in the event that we develop a need for additional capital in the future for the improvement of our assets or for any other reason, we will need to identify sources for such funding, other than reserves we may establish, and we cannot assure you that such sources of funding will be available to us for capital needs in the future.
We are authorized to issue preferred shares. The issuance of preferred shares could adversely affect the holders of our common shares issued pursuant to our public offerings.
Our declaration of trust authorizes us to issue 1,000,000,000 shares, of which 10,000,000 shares are designated as preferred shares. Subject to approval by our Board of Trustees, we may issue preferred shares with rights, preferences, and privileges that are more beneficial than the rights, preferences, and privileges of our common shares. Holders of our common shares do not have preemptive rights to acquire any shares issued by us in the future. If we ever create and issue preferred shares with a distribution preference over common shares, payment of any distribution preferences on outstanding preferred shares would reduce the amount of funds available for the payment of distributions on our common shares. In addition, holders of preferred shares are normally entitled to receive a preference payment in the event we liquidate, dissolve or wind up before any payment is made to our common shareholders, thereby reducing the amount a common shareholder might otherwise receive upon such an occurrence. In addition, under certain circumstances, the issuance of preferred shares may have the effect of delaying or preventing a change in control of our company.
Our Board of Trustees may change our investment policies without shareholder approval, which could alter the nature of investors’ investments.
Our declaration of trust requires that our independent trustees review our investment policies at least annually to determine that the policies we are following are in the best interest of the shareholders. These policies may change over time. The methods of implementing our investment policies may also vary, as new real estate development trends emerge and new investment techniques are developed. Our investment policies, the methods for their implementation, and our other objectives, policies and procedures may be altered by our Board of Trustees without the approval of our shareholders. As a result, the nature of investors’ investments could change without investors’ consent.
General Real Estate Risks
Real estate investments are long-term illiquid investments and may be difficult to sell in response to changing economic conditions.
Real estate investments are subject to certain inherent risks. Real estate investments are generally long-term investments that cannot be quickly converted to cash. Real estate investments are also subject to adverse changes in general economic conditions or local conditions that may reduce the demand for office, industrial, retail and multi-family residential or other types of properties. Other factors can also affect real estate values, including:
| | ¡ | | possible international and U.S. federal, state or local regulations and controls affecting rents, prices of goods, fuel and energy consumption and prices, water and environmental restrictions; |
| | ¡ | | increasing labor and material costs; |
| | ¡ | | the perceptions of tenants and prospective tenants of the convenience, attractiveness and safety of our properties; |
| | ¡ | | competition from comparable properties; |
| | ¡ | | the occupancy rate of our properties; |
| | ¡ | | the ability to collect on a timely basis all rents from tenants; |
| | ¡ | | the effects of any bankruptcies or insolvencies of major tenants; |
| | ¡ | | acts of nature, including earthquakes, hurricanes and other natural disasters (which may result in uninsured losses); |
| | ¡ | | acts of terrorism or war; |
| | ¡ | | rises in operating costs, taxes and insurance costs; |
| | ¡ | | changes in interest rates and in the availability, cost and terms of mortgage funding; and |
| | ¡ | | other factors which are beyond our control. |
21
Increases in interest rates could increase the amount of our debt payments and adversely affect our ability to pay dividends to our shareholders.
We expect that we will incur additional indebtedness in the future. Interest we pay could reduce cash available for distributions. Additionally, if we incur variable rate debt, increases in interest rates would increase our interest costs, which would reduce our cash flows and our ability to pay dividends to you. In addition, if we need to repay existing debt during periods of rising interest rates, we could be required to liquidate one or more of our investments in properties at times which may not permit realization of the maximum return on such investments.
Adverse economic conditions in the geographic regions in which we purchase properties may negatively impact your overall returns.
Adverse economic conditions in the geographic regions in which we buy our properties could affect real estate values in these regions and, to the extent that any of our tenants in these regions rely upon the local economy for their revenues, our tenants’ businesses could also be affected by such conditions. Therefore, changes in local economic conditions could reduce our ability to pay dividends and the amounts we could otherwise receive upon a sale of a property in a negatively affected region.
Adverse economic conditions affecting the particular industries of our tenants may negatively impact your overall returns.
Adverse economic conditions affecting a particular industry of one or more of our tenants could affect the financial ability of one or more of our tenants to make payments under their leases, which could cause delays in our receipt of rental revenues or a vacancy in one or more of our properties for a period of time. Therefore, changes in economic conditions of the particular industry of one or more of our tenants could reduce our ability to pay dividends and the value of one or more of our properties at the time of sale of such properties.
Because we are dependent on our tenants for substantially all of our revenue, our success is materially dependent on the financial stability of our tenants.
Lease payment defaults by tenants could cause us to reduce the amount of distributions to shareholders. A default of a tenant on its lease payments would cause us to lose the revenue from the property. In the event of such a default, we may experience delays in enforcing our rights as landlord and may incur substantial costs in protecting our investment and leasing our property. If a lease is terminated, we cannot assure you that we will be able to lease the property for the rent previously received or sell the property without incurring a loss. Further, we may be required to make rent or other concessions to tenants, accommodate requests for renovations, build-to-suit remodeling and other improvements or provide additional services to our tenants. As a result, we may have to make significant capital or other expenditures in order to retain tenants whose leases expire and to attract new tenants in sufficient numbers. A default by a tenant, the failure of a guarantor to fulfill its obligations or other premature termination of a lease, or a tenant’s election not to extend a lease upon its expiration, could have an adverse effect on our financial condition and our ability to pay distributions. Certain of our properties are occupied by only a single tenant and, therefore, the success of those properties will be materially dependent on the financial stability of such tenants.
If one or more of our tenants file for bankruptcy protection, we may be precluded from collecting all sums due.
If one or more of our tenants, or the guarantor of a tenant’s lease, commences, or has commenced against it, any proceeding under any provision of the U.S. federal bankruptcy code, as amended, or any other legal or equitable proceeding under any bankruptcy, insolvency, rehabilitation, receivership or debtor’s relief statute or law (bankruptcy proceeding), we may be unable to collect sums due under relevant leases. Any or all of the tenants, or a guarantor of a tenant’s lease obligations, could be subject to a bankruptcy proceeding.
Such a bankruptcy proceeding may bar our efforts to collect pre-bankruptcy debts from these entities or their properties, unless we are able to obtain an enabling order from the bankruptcy court. If a lease is rejected by a tenant in bankruptcy, we would only have a general unsecured claim against the tenant, and may not be entitled to any further payments under the lease. A tenant’s or lease guarantor’s bankruptcy proceeding could hinder or delay efforts to collect past due balances under relevant leases, and could ultimately preclude collection of these sums. Such an event could cause a decrease or cessation of rental payments which would mean a reduction in our cash flow and the amount available for distribution to our shareholders. In the event of a bankruptcy proceeding, we cannot assure you that the tenant or its trustee will assume our lease. If a given lease, or guaranty of a lease, is not assumed, our cash flow and the amounts available for distribution to our shareholders may be adversely affected.
22
If third party managers providing property management services for certain of our properties or their personnel are negligent in their performance of, or default on, their management obligations, our tenants may not renew their leases or we may become subject to unforeseen liabilities. If this occurs, our financial condition and operating results, as well as our ability to pay dividends to shareholders at historical levels or at all, could be substantially harmed.
We have entered into agreements with third party management companies and certain affiliates of CBRE Investors to provide property management services for certain of our properties, and we expect to enter into similar agreements with respect to properties we acquire in the future. We cannot supervise these third party managers and their personnel on a day-to-day basis and we cannot assure you that they will manage our properties in a manner that is consistent with their obligations under our agreements, that they will not be negligent in their performance or engage in other criminal or fraudulent activity, or that these managers will not otherwise default on their management obligations to us. If any of the foregoing occurs, our relationships with our tenants could be damaged, which may prevent the tenants from renewing their leases, and we could incur liabilities resulting from loss or injury to our properties or to persons at our properties. If we are unable to lease our properties or we become subject to significant liabilities as a result of third party management performance issues, our operating results and financial condition, as well as our ability to pay distributions to our shareholders, could be adversely affected.
We may obtain only limited warranties when we purchase a property and would have only limited recourse in the event our due diligence did not identify any issues that lower the value of our property.
The seller of a property often sells such property in its “as is” condition on a “where is” basis and “with all faults,” without any warranties of merchantability or fitness for a particular use or purpose. In addition, purchase agreements may contain only limited warranties, representations and indemnifications that will only survive for a limited period after the closing. The purchase of properties with limited warranties increases the risk that we may lose some or all of our invested capital in the property as well as the loss of rental income from that property.
We may not have funding for future tenant improvements, which may reduce your returns and make it difficult to attract one or more new tenants.
When a tenant at one of our properties does not renew its lease or otherwise vacates its space in one of our buildings, it is likely that, in order to attract one or more new tenants, we will be required to expend substantial funds for tenant improvements and tenant refurbishments to the vacated space and other lease-up costs. Substantially all of our net offering proceeds available for investment may be used for investment in real estate properties. We may maintain working capital reserves but cannot guarantee they will be adequate. We also have no identified funding source to provide funds that may be required in the future for tenant improvements, tenant refurbishments and other lease-up costs in order to attract new tenants. We cannot assure you that any such source of funding will be available to us for such purposes in the future and, to the extent we are required to use net cash from operations to fund such tenant improvements, tenant refurbishments and other lease-up costs, cash distributions to our shareholders will be reduced.
The actual rents we receive for the properties in our portfolio may be less than our asking rents, and we may experience lease roll down from time to time, which could negatively impact our ability to generate cash flow growth.
As a result of various factors, including potential competitive pricing pressure specific to certain submarkets, general economic weakness and the desirability of our properties compared to other properties in our submarkets, we may be unable to realize the asking rents across the properties in our portfolio. In addition, the degree of discrepancy between our asking rents and the actual rents we are able to obtain may vary both from property to property and among different leased spaces within a single property. If we are unable to obtain rental rates that are on average comparable to our asking rents across our portfolio, then our ability to generate cash flow growth will be negatively impacted. In addition, depending on asking rental rates at any given time as compared to expiring leases in our portfolio, from time to time rental rates for expiring leases may be higher than starting rental rates for new leases.
A property that incurs a significant vacancy could be difficult to sell or lease.
A property may incur a vacancy either by the continued default of a tenant under its lease or the expiration of one of our leases. Some of our properties may be specifically suited to the particular needs of the tenant based on the type of business the tenant operates. As of December 31, 2010, leases representing 1.61% of our annualized base rent are scheduled to expire during 2011. We cannot assure you that leases will be renewed or that our properties will be re-let at rental rates equal to or above our current average rental rates or that substantial rent abatements, tenant improvements, early termination rights or below-market renewal options will not be offered to attract new tenants or retain existing tenants. We may have difficulty obtaining a new tenant for any vacant space in our properties,
23
particularly if the space limits the types of businesses that can use the space without major renovation. If a vacancy on any of our properties continues for a long period of time, we may suffer reduced revenues resulting in less cash to be distributed to shareholders. In addition, the resale value of the property could be diminished because the market value of a particular property may depend principally upon the value of the leases of such property.
Uninsured losses relating to real property may adversely affect your returns.
In the event that any of our properties incurs a casualty loss that is not fully covered by insurance, the value of our assets will be reduced by any such uninsured loss. In addition, we may have limited funding to repair or reconstruct the damaged property, and we cannot assure you that any such source of funding will be available to us for such purposes in the future. Furthermore, insurance may be unavailable or uneconomical. In particular, insurance coverage relating to flood or earthquake damage or terrorist acts may not be available or affordable.
Development and construction of our properties may result in delays and increased costs and risks.
We have invested, and may in the future invest, some or all of the net proceeds available for investment in the acquisition and development of properties upon which we (or a joint venture partner) will develop and construct improvements. We will be subject to the following risks associated with such development and redevelopment activities:
| | ¡ | | unsuccessful development or redevelopment opportunities could result in direct expenses to us; |
| | ¡ | | construction or redevelopment costs of a project may exceed original estimates, possibly making the project less profitable than originally estimated, or unprofitable; |
| | ¡ | | time required to complete the construction or redevelopment of a project or to lease up the completed project may be greater than originally anticipated, thereby adversely affecting our cash flow and liquidity; |
| | ¡ | | contractor and subcontractor disputes, strikes, labor disputes or supply disruptions; |
| | ¡ | | the builder’s failure to perform may necessitate legal action by us to rescind the purchase or the construction contract or to compel performance; |
| | ¡ | | we may incur additional risks when we make periodic progress payments or other advances to such builders prior to completion of construction; |
| | ¡ | | failure to achieve expected occupancy and/or rent levels within the projected time frame, if at all (delays in completion of construction could also give tenants the right to terminate pre-construction leases for space at a newly developed project); |
| | ¡ | | delays with respect to obtaining or the inability to obtain necessary zoning, occupancy, land use and other governmental permits, and changes in zoning and land use laws; |
| | ¡ | | occupancy rates and rents of a completed project may not be sufficient to make the project profitable; |
| | ¡ | | if our projections of rental income and expenses and estimates of the fair market value of a property upon completion of construction are inaccurate, we may pay too much for a property; |
| | ¡ | | our ability to dispose of properties developed or redeveloped with the intent to sell could be impacted by the ability of prospective buyers to obtain financing given the current state of the credit markets; and |
| | ¡ | | the availability and pricing of financing to fund our development activities on favorable terms or at all. |
Factors such as those discussed above can result in increased costs of a project or loss of our investment, which could adversely impact our ability to make distributions to our shareholders. In addition, we may not be able to find suitable tenants to lease our newly constructed projects. Furthermore, we must rely upon projections of rental income and expenses and estimates of the fair market value of a property upon completion of construction when agreeing upon a price to be paid for the property at the time of acquisition of the property. If our projections are inaccurate, we may pay too much for a property.
Competition for investments may increase costs and reduce returns.
The current market for acquisitions is extremely competitive. We experience competition for real property investments from corporations, other real estate investment trusts, pension plans and other entities engaged in real estate investment activities. This competition may increase the demand for the types of properties in which we typically invest and, therefore, reduce the number of suitable acquisition opportunities available to us and increase the prices paid for such acquisition properties. In addition, the number of
24
entities and the amount of funds competing for suitable investments may increase. This competition will increase if investments in real estate become more attractive relative to other forms of investment. Any such increase would result in increased demand for these assets and therefore increased prices paid for them. If we pay higher prices for properties and other investments, our profitability will be reduced and investors may experience a lower return on their investments.
Delays in acquisitions of properties may adversely affect your investment and reduce returns.
Delays we encounter in the selection, acquisition and development of properties could adversely affect your returns. When we acquire properties prior to the start of construction or during the early stages of construction, it typically takes several months to complete construction and rent available space. Therefore, you could suffer delays in the distribution of cash dividends attributable to any such properties.
Uncertain market conditions and the broad discretion of the Investment Advisor relating to the future disposition of properties could adversely affect the return on your investment.
We intend to hold the various real properties in which we invest until such time as the Investment Advisor determines that the sale or other disposition thereof appears to be advantageous to achieve our investment objectives or until it appears that such objectives will not be met. The Investment Advisor, subject to the approval in certain cases of our Board of Trustees, may exercise its discretion as to whether and when to sell a property. We have no obligation to sell properties at any particular time, except that if our shares are not listed on a national securities exchange, the NASDAQ Global Select Market or the NASDAQ Global Market on or before December 31, 2011, our declaration of trust requires our Board of Trustees to consider (but is not required to commence) an orderly liquidation of our assets, which liquidation would require the approval of our shareholders and could last several years. We cannot predict with any certainty the various market conditions affecting real estate investments that will exist at any particular time in the future. Due to the uncertainty of market conditions that may affect the future disposition of our properties, we cannot assure you that we will be able to sell our properties at a profit in the future. Accordingly, the extent to which you will receive cash distributions and realize potential appreciation on our real estate investments will be dependent upon fluctuating market conditions.
General economic conditions may affect the timing of the sale of our properties and the purchase price we receive.
We may be unable to sell a property if or when we decide to do so. The real estate market is affected by many factors, such as general economic conditions, the availability of financing, interest rates and other factors, including supply and demand for real estate investments, all of which are beyond our control. We cannot predict whether we will be able to sell any property for the price or on terms that are acceptable to us. Further, we cannot predict the length of time that will be needed to find a willing purchaser and to close the sale of a property.
We may acquire or finance properties with lock-out provisions, which may prohibit us from selling a property, or may require us to maintain specified debt levels for a period of years on some properties.
Lock-out provisions, which preclude pre-payments of a loan, could materially restrict us from selling or otherwise disposing of or refinancing properties. These provisions would affect our ability to turn our investments into cash and thus affect cash available for distributions to investors. Lock-out provisions may prohibit us from reducing the outstanding indebtedness with respect to any properties, refinancing such indebtedness on a non-recourse basis at maturity, or increasing the amount of indebtedness with respect to such properties. Lock-out provisions could impair our ability to take other actions during the lock-out period that could be in the best interests of our shareholders and, therefore, may have an adverse impact on the value of the shares, relative to the value that would result if the lock-out provisions did not exist. In particular, lock-out provisions could preclude us from participating in major transactions that could result in a disposition of our assets or a change in control even though that disposition or change in control might be in the best interests of our shareholders.
A concentration of our investments in a limited number of property classes may leave our profitability vulnerable to a downturn in such sectors.
At any one time, a significant portion of our property investments may be in a limited number of property classes. As of December 31, 2010, a majority of our investments were in two property classes, office and industrial (primarily warehouse/distribution). As a result, we are subject to risks inherent in investments in these classes. The potential effects on our revenues, and as a result on cash available for distribution to our shareholders, resulting from a downturn in the business conducted on those properties could be more pronounced than if we had a more diversified portfolio.
25
Geographic concentration of our portfolio may make us particularly susceptible to adverse economic developments in those geographic areas.
A concentration of our properties in a particular geographic area may impact our operating results and abilities to make distributions if that area is impacted by negative economic developments. Your investment will be subject to greater risk to the extent that we lack a geographically diversified portfolio. As of December 31, 2010, approximately 37.13% of our portfolio (based on approximate total acquisition costs, with our unconsolidated properties included at our pro rata share of effective ownership, however, excluding our investments in CBRE Strategic Partners Asia) consisted of properties located in the Southeastern region (Florida, Georgia, North Carolina, South Carolina and Virginia) of the United States.
We are particularly susceptible to adverse economic or other conditions in these markets (such as periods of economic slowdown or recession, business layoffs or downsizing, industry slowdowns, relocations of businesses, increases in real estate and other taxes and the cost of complying with governmental regulations or increased regulation), as well as to natural disasters that occur in these markets. Our financial condition and our ability to make distributions to our shareholders would be adversely affected by any significant adverse developments in those markets. We cannot assure you that these markets will grow or that underlying real estate fundamentals will be favorable to owners and operators of properties similar to ours. Our operations may also be affected if competing properties are built in either of these markets. Moreover, submarkets within any of our core markets may be dependent upon a limited number of industries.
Economic conditions may adversely affect our income.
Our business may be affected by potential adverse market and economic conditions experienced by the economy or real estate industry as a whole or by local economic conditions in the markets in which our properties are located, including potential dislocations in the credit markets and an elevated rate of unemployment. Such economic weakness may reduce demand for space and remove support for rents and property values.
A commercial property’s income and value may be adversely affected by national and regional economic conditions, local real estate conditions such as an oversupply of properties or a reduction in demand for properties, availability of “for sale” properties, competition from other similar properties, our ability to provide adequate maintenance, insurance and management services, increased operating costs (including real estate taxes), the attractiveness and location of the property and changes in market rental rates. Changes or fluctuations in energy costs could result in higher operating costs, which may affect our results from operations. Our income will be adversely affected if a significant number of tenants are unable to pay rent or if our properties cannot be rented on favorable terms. Additionally, if tenants of properties that we lease on a triple-net basis fail to pay required tax, utility and other impositions, we could be required to pay those costs, which would adversely affect funds available for future acquisitions or cash available for distributions. Our performance is linked to economic conditions in the regions where our properties are located and in the market for office, industrial (primarily warehouse/ distribution), retail and multi-family residential properties generally. Therefore, to the extent that there are adverse economic conditions in those regions, and in these markets generally, that impact the applicable market rents, such conditions could result in a reduction of our income and cash available for distributions and thus affect the amount of distributions we can make to investors.
Real estate related taxes may increase and if these increases are not passed on to tenants, our income will be reduced.
Some local real property tax assessors may seek to reassess some of our properties as a result of our acquisition of the property. Generally, from time to time our property taxes increase as property values or assessment rates change or for other reasons deemed relevant by the assessors. An increase in the assessed valuation of a property for real estate tax purposes will result in an increase in the related real estate taxes on that property. In some areas where we have properties, declines in other tax revenues for the states are resulting in the states considering increases to future property and other business related tax rates. Although some tenant leases may permit us to pass through such tax increases to the tenants for payment, there is no assurance that renewal leases or future leases will be negotiated on the same basis. Increases not passed through to tenants will adversely affect our income, cash available for distributions, and the amount of distributions to investors.
If we purchase environmentally hazardous property, our operating results could be adversely affected.
Under various U.S. federal, state and local environmental laws, ordinances and regulations, a current or previous owner or operator of real property may be liable for the cost of removal or remediation of hazardous or toxic substances on, under or in such property. Such laws often impose liability whether or not the owner or operator knew of, or was responsible for, the presence of such hazardous or
26
toxic substances. Environmental laws also may impose restrictions on the manner in which property may be used or businesses may be operated, and these restrictions may require expenditures. Environmental laws provide for sanctions in the event of noncompliance and may be enforced by governmental agencies or, in certain circumstances, by private parties. In connection with the acquisition and ownership of our properties, we may be potentially liable for such costs. The cost of defending against claims of liability, complying with environmental regulatory requirements or remediating any contaminated property could have a material adverse effect on our business, assets or results of operations and, consequently, amounts available for distribution to you. Any costs or expenses relating to environmental matters may not be covered by insurance.
We may incur significant costs complying with various federal, state and local laws, regulations and covenants that are applicable to our properties and, in particular costs associated with complying with regulations such as the Americans with Disabilities Act of 1990 may result in unanticipated expenses.
The properties in our portfolio are subject to various covenants and federal, state and local laws and regulatory requirements, including permitting and licensing requirements. Local regulations, including municipal or local ordinances, zoning restrictions and restrictive covenants imposed by community developers may restrict our use of our properties and may require us to obtain approval from local officials or restrict our use of our properties and may require us to obtain approval from local officials of community standards organizations at any time with respect to our properties, including prior to acquiring a property or when undertaking renovations of any of our existing properties. Among other things, these restrictions may relate to fire and safety, seismic or hazardous material abatement requirements. There can be no assurance that existing laws and regulatory policies will not adversely affect us or the timing or cost of any future acquisitions or renovations, or that additional regulations will not be adopted that increase such delays or result in additional costs. Our growth strategy may be affected by our ability to obtain permits, licenses and zoning relief. Our failure to obtain such permits, licenses and zoning relief or to comply with applicable laws could have an adverse effect on our financial condition, results of operations and cash flow.
In addition, under the Americans with Disabilities Act of 1990, or ADA, all places of public accommodation are required to meet certain U.S. federal requirements related to access and use by disabled persons. These requirements became effective in 1992. A number of additional U.S. federal, state and local laws may also require modifications to our properties, or restrict further renovations of the properties, with respect to access thereto by disabled persons. For example, the Fair Housing Amendments Act of 1988, or FHAA, requires apartment properties first occupied after March 13, 1991 to be accessible to the handicapped. On September 25, 2010, the Department of Justice published revised final regulations implementing a substantial number of changes to the Accessibility Guidelines under the ADA. These new guidelines could cause some of our properties to incur costly measures to become fully compliant. Noncompliance with the ADA or the FHAA could result in an order to correct any non-complying feature, which could result in substantial capital expenditures. We do not conduct audits or investigations of all of these properties to determine their compliance and we cannot predict the ultimate cost of compliance with the ADA, the FHAA or other legislation. If one or more of our properties in which we invest is not in compliance with the ADA, the FHAA or other legislation, then we would be required to incur additional costs to bring the property into compliance. If we incur substantial costs to comply with the ADA and the FHAA or other legislation, our financial condition, results of operations, cash flow, price per share of our common shares and our ability to satisfy debt service obligations and to pay distributions could be adversely affected.
If we make or invest in mortgage loans, our mortgage loans may be impacted by unfavorable real estate market conditions, which could decrease the value of our mortgage investments.
If we make or invest in mortgage loans, we will be at risk of defaults by the borrowers on those mortgage loans. These defaults may be caused by many conditions beyond our control, including interest rate levels and local and other economic conditions affecting real estate values. We will not know whether the values of the properties securing the mortgage loans will remain at the levels existing on the dates of origination of the mortgage loans. If the values of the underlying properties drop, our risk will increase because of the lower value of the security associated with such loans.
High mortgage rates and/or unavailability of mortgage debt may make it difficult for us to finance or refinance properties, which could reduce the number of properties we can acquire, our net income and the amount of cash distributions we can make.
If mortgage debt is unavailable at reasonable rates, we may not be able to finance the purchase of properties. If we place mortgage debt on properties, we may be unable to refinance the properties when the loans become due, or to refinance on favorable terms. If interest rates are higher when we refinance our properties, our income could be reduced. If any of these events occur, our cash flow could be reduced. This, in turn, could reduce cash available for distribution to our shareholders and may hinder our ability to raise more capital by issuing more shares or by borrowing more money.
27
If we make or invest in mortgage loans, our mortgage loans will be subject to interest rate fluctuations which could reduce our returns as compared to market interest rates as well as the value of the mortgage loans in the event we sell the mortgage loans.
If we invest in fixed-rate, long-term mortgage loans and interest rates rise, the mortgage loans could yield a return that is lower than then-current market rates. If interest rates decrease, we will be adversely affected to the extent that mortgage loans are prepaid, because we may not be able to make new loans at the previously higher interest rate. If we invest in variable interest rate loans, if interest rates decrease, our revenues will likewise decrease. Finally, if interest rates increase, the value of loans we own at such time would decrease which would lower the proceeds we would receive in the event we sell such loans.
Your investment may be subject to additional risks when we make international investments.
We purchase properties located outside the United States. These investments may be affected by factors peculiar to the laws and business practices of the jurisdictions in which the properties are located. These laws may expose us to risks that are different from and in addition to those commonly found in the United States. Foreign investments could be subject to the following risks:
| | ¡ | | changing governmental rules and policies, including changes in land use and zoning laws; |
| | ¡ | | enactment of laws relating to the foreign ownership of real property and laws restricting the ability of foreign persons or companies to remove profits earned from activities within the country to the person’s or company’s country of origin; |
| | ¡ | | fluctuations in foreign currency exchange rates, which may adversely impact the fair values and earnings streams of our international holdings and, therefore, the returns on our non-dollar denominated investments. Although we may hedge our foreign currency risk subject to the REIT income qualification tests, it is possible that we may not be able to do so successfully and may incur losses on these investments as a result of exchange rate fluctuations; |
| | ¡ | | adverse market conditions caused by terrorism, civil unrest, natural disasters and changes in national or local governmental or economic conditions; |
| | ¡ | | the willingness of domestic or foreign lenders to make mortgage loans in certain countries and changes in the availability, cost and terms of mortgage funds resulting from varying national economic policies; |
| | ¡ | | the imposition of unique tax structures and changes in real estate and other tax rates and other operating expenses in particular countries; |
| | ¡ | | our ability to qualify as a REIT may be affected; and |
| | ¡ | | general political and economic instability. |
Retail properties depend on anchor tenants to attract shoppers and could be adversely affected by the loss of a key anchor tenant.
We have acquired, and may in the future acquire, properties with retail components. As with all rental properties, we are subject to the risk that tenants may be unable to make their lease payments or may decline to extend a lease upon its expiration. A lease termination by a tenant that occupies a large area of a retail center (commonly referred to as an anchor tenant) could impact leases of other tenants. Other tenants may be entitled to modify the terms of their existing leases in the event of a lease termination by an anchor tenant, or the closure of the business of an anchor tenant that leaves its space vacant even if the anchor tenant continues to pay rent. Any such modifications or conditions could be unfavorable to us as the property owner and could decrease rents, expense recoveries or the market value of the property. Additionally, major tenant closures may result in decreased customer traffic, which could lead to decreased sales at other stores. In the event of a default by a tenant or anchor store, we may experience delays and costs in enforcing our rights as landlord to recover amounts due to us under the terms of our agreements with those parties.
We are subject to risks that affect the general retail environment, such as weakness in the economy, the level of consumer spending, the adverse financial condition of large retailing companies and competition from discount and internet retailers, any of which could adversely affect market rents for retail space and the willingness or ability of retailers to lease space in our properties.
A portion of our properties are in the retail real estate market. This means that we are subject to factors that affect the retail sector generally, as well as the market for retail space. The retail environment and the market for retail space have been, and could continue to be, adversely affected by weakness in the national, regional and local economies, the level of consumer spending and consumer confidence, the adverse financial condition of some large retailing companies, the ongoing consolidation in the retail sector, the excess amount of retail space in a number of markets and increasing competition from discount retailers, outlet malls, internet retailers and
28
other online businesses. Increases in consumer spending via the internet may significantly affect our retail tenants’ ability to generate sales in their stores. New and enhanced technologies, including new digital technologies and new web services technologies, may increase competition for certain of our retail tenants.
Any of the foregoing factors could adversely affect the financial condition of our retail tenants and the willingness of retailers to lease space. In turn, these conditions could negatively affect market rents for retail space and could materially and adversely affect our distributions to our shareholders.
Delays in liquidating defaulted mortgage loans could reduce our investment returns.
If there are defaults under mortgage loans that we may make or invest in, we may not be able to repossess and sell the underlying properties quickly. The resulting time delay could reduce the value of our investment in the defaulted mortgage loans. An action to foreclose on a property securing a mortgage loan is regulated by state statutes and rules and is subject to many of the delays and expenses of other lawsuits if the defendant raises defenses or counterclaims. In the event of default by a mortgagor, these restrictions, among other things, may impede our ability to foreclose on or sell the mortgaged property or to obtain proceeds sufficient to repay all amounts due to us on the mortgage loan.
We may make or invest in mezzanine loans, which involve greater risks of loss than senior loans secured by real properties.
We may make or invest in mezzanine loans that generally take the form of subordinated loans secured by second mortgages on the underlying real property or loans secured by a pledge of the ownership interests of an entity that directly or indirectly owns real property. These types of investments involve a higher degree of risk than long-term senior mortgage loans secured by real property because the investment may become unsecured as a result of foreclosure by the senior lender. In the event of a bankruptcy of the entity providing the pledge of its ownership interests as security, we may not have full recourse to the assets of such entity, or the assets of the entity may not be sufficient to satisfy our mezzanine loan. If a borrower defaults on our mezzanine loan or debt senior to our mezzanine loan, or in the event of a borrower bankruptcy, our mezzanine loan will be satisfied only after the senior debt. As a result, we may not recover some or all of our investment. In addition, mezzanine loans may have higher loan-to-value ratios than traditional mortgage loans, resulting in less equity in the real property and increasing our risk of loss of principal. We will make mortgage loans only in accordance with the investment restrictions we have adopted.
We will be subject to risks that result from our passive ownership of real estate, including our investment in CBRE Strategic Partners Asia.
We have invested and may make future investments in which we passively own real estate. A passive investment in real estate, such as our investment in CBRE Strategic Partners Asia, involves risks not otherwise present with other methods of owning real estate. Examples of these risks include:
| | ¡ | | we cannot take part in the operation, management, direction or control of the real estate; |
| | ¡ | | the party controlling the real estate may have economic or other business interests or goals that are inconsistent with our business interests or goals, including inconsistent goals relating to the sale of properties owned by such controlling party or the timing of the termination and liquidation of the controlling party; or |
| | ¡ | | the possibility that we may incur liabilities as the result of actions taken by the controlling party. |
Terrorist attacks and other acts of violence or war may affect the market for our common shares, the industry in which we conduct our operations and our profitability.
Terrorist attacks may harm our results of operations and your investment. We cannot assure you that there will not be terrorist attacks in the localities in which we conduct business. These attacks or armed conflicts may directly impact the property underlying our asset-based securities or the securities markets in general. Losses resulting from these types of events are uninsurable.
More generally, any of these events could cause consumer confidence and spending to decrease or result in increased volatility in the worldwide financial markets and economy. Adverse economic conditions could harm the value of the property underlying our asset-backed securities or the securities markets in general which could harm our operating results and revenues.
29
Financing Risks
Dislocations or volatility in the capital and credit markets could adversely affect us.
Dislocations or volatility in the financial markets have the potential to affect, particularly in the near term, the value of our properties and our investments in unconsolidated joint ventures, the availability or the terms of financing that we and our unconsolidated joint ventures have or may anticipate utilizing, the ability of us and our unconsolidated joint ventures to make principal and interest payments on or refinance any outstanding debt when due. It may also impact the ability of our tenants and potential tenants to enter into new leases or satisfy rental payments under existing leases.
Capital market dislocations or volatility may potentially cause certain financial institutions to fail or to seek federal assistance. In the event of a failure of a lender or counterparty to a financial contract, obligations under the financial contract might not be honored and many forms of assets may be at risk and may not be fully returned to us. Should a financial institution fail to fund its committed amounts when contractually obligated to do so, our ability to meet our obligations could be materially and adversely impacted.
We could become more highly leveraged and an increase in debt service could adversely affect our cash flow and ability to make distributions.
We had approximately $425,353,000 of consolidated outstanding indebtedness, excluding discount and fair value adjustment, representing approximately 35% of our net assets (or approximately 33% of the approximate total acquisition cost of our consolidated properties, including intangibles) as of December 31, 2010. Although we have adopted a policy to limit our aggregate borrowing to no more than 65% of the cost of our assets before non-cash reserves and depreciation, subject to the 300% of net assets borrowing restriction described below, this policy may be altered at any time or suspended by our Board of Trustees if necessary to pursue attractive investment opportunities. Our organizational documents contain a limitation on the amount of indebtedness that we may incur, so that until our shares are listed on a national securities exchange, our aggregate borrowing may not exceed 300% of our net assets unless any excess borrowing is approved by a majority of our independent trustees and is disclosed to shareholders in our next quarterly report.
Our level of debt and the limitations imposed on us by our debt agreements could have significant adverse consequences, including the following:
| | ¡ | | our cash flow may be insufficient to meet our required principal and interest payments; |
| | ¡ | | we may be unable to borrow additional funds as needed or on favorable terms, which could, among other things, adversely affect our ability to meet operational needs; |
| | ¡ | | we may be unable to refinance our indebtedness at maturity or the refinancing terms may be less favorable than the terms of our original indebtedness; |
| | ¡ | | we may be forced to dispose of one or more of our properties, possibly on unfavorable terms or in violation of certain covenants to which we may be subject; |
| | ¡ | | we may violate restrictive covenants in our loan documents, which would entitle the lenders to accelerate our debt obligations; and |
| | ¡ | | our default under any loan with cross default provisions could result in a default on other indebtedness. |
If we become more highly leveraged, then the resulting increase in debt service could adversely affect our ability to make payments on outstanding indebtedness and to pay our anticipated distributions and/or the distributions required to qualify as a REIT, and could harm our financial condition.
If we fail to make our debt payments, we could lose our investment in a property.
We intend to secure the loans we obtain to fund future property acquisitions with mortgages on some of our properties. If we are unable to make our debt payments as required, a lender could foreclose on the property or properties securing its debt. This could cause us to lose part or all of our investment which in turn could cause a reduction in the value of the shares and the dividends payable to our shareholders.
30
Lenders may require us to enter into restrictive covenants relating to our operations.
In connection with obtaining certain financing, a lender could impose restrictions on us that would affect our ability to incur additional debt and our distribution and operating policies. Loan documents we enter into may contain customary negative covenants that may limit our ability to further mortgage the property, to discontinue insurance coverage, replace the Investment Advisor as our investment advisor or impose other limitations.
Rising interest rates could increase our borrowing costs and reduce cash available for distributions and could also adversely affect the values of the properties we own.
We have borrowed and in the future may borrow money to purchase assets. An increase in interest rates could increase our interest expense and adversely affect our cash flow and our ability to service indebtedness and to make distributions to our shareholders.
If we enter into financing arrangements involving balloon payment obligations, it may adversely affect our ability to pay dividends.
Our financing arrangements may require us to make a lump-sum or “balloon” payment at maturity. Our ability to make a balloon payment at maturity is uncertain and may depend upon our ability to obtain additional financing or our ability to sell the property. At the time the balloon payment is due, we may or may not be able to refinance the balloon payment on terms as favorable as the original loan or sell the property at a price sufficient to make the balloon payment. A refinancing or sale under these circumstances could affect the rate of return to shareholders and the projected time of disposition of our assets. In addition, payments of principal and interest made to service our debts may leave us with insufficient cash to pay the distributions that we are required to pay to qualify as a REIT. In such case, we may be forced to borrow funds to make the distributions required to qualify as a REIT.
Failure to hedge effectively against interest rate changes may adversely affect results of operations.
Subject to maintaining our qualification as a REIT, we may seek to manage our exposure to interest rate volatility by using interest rate hedging arrangements, such as interest cap agreements and interest rate swap agreements. These agreements may fail to protect or could adversely affect us because, among other things:
| | ¡ | | interest rate hedging can be expensive, particularly during periods of rising and volatile interest rates; |
| | ¡ | | available interest rate hedges may not correspond directly with the interest rate risk for which protection is sought; |
| | ¡ | | the duration of the hedge may not match the duration of the related liability; |
| | ¡ | | the amount of income that a REIT may earn from hedging transactions (other than through taxable REIT subsidiaries) is limited by U.S. federal tax provisions governing REITs; |
| | ¡ | | the credit quality of the party owing money on the hedge may be downgraded to such an extent that it impairs our ability to sell or assign our side of the hedging transaction; |
| | ¡ | | the party owing money in the hedging transaction may default on its obligation to pay; |
| | ¡ | | we could incur significant costs associated with the settlement of the agreements; |
| | ¡ | | the underlying transactions could fail to qualify as highly-effective cash flow hedges under FASB ASC “Derivative and Hedging”; and |
| | ¡ | | a court could rule that such an agreement is not legally enforceable. |
We have adopted a policy relating to the use of derivative financial instruments to hedge interest rate risks related to our borrowings. This policy governs our use of derivative financial instruments to manage the interest rates on our variable rate borrowings. Our policy states that we will not use derivatives for speculative or trading purposes and intend only to enter into contracts with major financial institutions based on their credit rating and other factors, but our Board of Trustees may choose to change these policies in the future. Hedging may reduce the overall returns on our investments, which could reduce our cash available for distribution to our shareholders. Failure to hedge effectively against interest rate changes may materially adversely affect our financial condition, results of operations and cash flow.
If we sell properties by providing financing to purchasers, defaults by the purchasers would adversely affect our cash flows.
If we decide to sell any of our properties, we intend to use our best efforts to sell them for cash. However, in some instances we may sell our properties by providing financing to purchasers. When we provide financing to purchasers, we will bear the risk that the
31
purchaser may default, which could negatively impact our cash distributions to shareholders. Even in the absence of a purchaser default, the distribution of the proceeds of sales to our shareholders, or their reinvestment in other assets, will be delayed until the promissory notes or other property we may accept upon the sale are actually paid, sold, refinanced or otherwise disposed of. In some cases, we may receive initial down payments in cash and other property in the year of sale in an amount less than the selling price and subsequent payments will be spread over a number of years. If any purchaser defaults under a financing arrangement with us, it could negatively impact our ability to pay cash distributions to our shareholders.
U.S. Federal Income Tax Risks
If we fail to qualify as a REIT in any taxable year, our operations and ability to make distributions will be adversely affected because we will be subject to U.S. federal income tax on our taxable income at regular corporate rates with no deductions for distributions made to shareholders.
We believe that we are organized and operate in conformity with the requirements for qualification and taxation as a REIT under the Internal Revenue Code, and that our method of operation enables us to continue to meet the requirements for qualification and taxation as a REIT under the Internal Revenue Code. So long as we qualify as a REIT, we generally will not be subject to U.S. federal income tax on our net taxable income we distribute currently to our shareholders. In order for us to qualify as a REIT, we must satisfy certain requirements established under highly technical and complex provisions of the Internal Revenue Code and Treasury Regulations for which there are only limited judicial or administrative interpretations, and which involve the determination of various factual matters and circumstances not entirely within our control.
In March 2005, we mortgaged one of our real estate properties and invested the proceeds in a money market mutual fund until June 2005 when the proceeds were used to purchase another real estate property. During the time the proceeds were invested in the fund, we treated the investment as a “qualified temporary investment” for purposes of the REIT asset test requirements. If our investment in the fund was not eligible for treatment as a qualified temporary investment, we may not have satisfied the REIT 5% gross asset test for the first quarter of 2005. If our investment in the fund resulted in our noncompliance with the REIT 5% gross asset test, however, we would retain our qualification as a REIT pursuant to certain mitigation provisions of the Internal Revenue Code provided our noncompliance was due to reasonable cause and not to willful neglect, and certain other requirements are met including the payment of a $50,000 penalty tax. Any potential noncompliance with the 5% gross asset test would be due to reasonable cause and not willful neglect so long as we are considered to have exercised ordinary business care and prudence in attempting to satisfy such test. We believe that we have exercised ordinary business care and prudence in attempting to satisfy the REIT income and asset tests, including the 5% gross asset test, and, accordingly, we believe that any noncompliance with the REIT 5% gross asset test resulting from our investment in the fund should be due to reasonable cause and not willful neglect. We have complied with the other requirements of the mitigation provisions of the Internal Revenue Code with respect to such potential noncompliance with the 5% gross asset test, including paying the $50,000 penalty tax, and, therefore, our qualification as a REIT should not be affected. The IRS is not bound by our determination, however, and no assurance can be provided that the IRS will not assert that we failed to comply with the REIT 5% gross asset test as a result of our investment in the fund and that such failure was not due to reasonable cause.
In order for distributions to be deductible for U.S. federal income tax purposes and count towards our distribution requirement, they must not be “preferential dividends.” A distribution will not be treated as preferential if it is pro rata among all outstanding shares of stock within a particular class. IRS guidance, however, allows a REIT to offer shareholders participating in its dividend reinvestment program (“DRIP”) up to a 5% discount on shares purchased through the DRIP without treating such reinvested dividends as preferential. Our DRIP offers a 5% discount. In 2007, 2008 and the first two quarters of 2009, common shares issued pursuant to our DRIP were treated as issued as of the first day following the close of the quarter for which the distributions were declared, and not on the date that the cash distributions were paid to shareholders not participating in our DRIP. Because we declare dividends on a daily basis, including with respect to common shares issued pursuant to our DRIP, the IRS could take the position that distributions paid by us during these periods were preferential on the grounds that the discount provided to DRIP participants effectively exceeded the authorized 5% discount or, alternatively, that the overall distributions were not pro rata among all shareholders. In addition, in the years 2007 through 2009 we paid certain individual retirement account (“IRA”) custodial fees in respect of IRA accounts that invested in our common shares. The payment of certain of such amounts could be treated as dividend distributions to the IRAs, and therefore as preferential dividends as such amounts were not paid in respect of our other outstanding common shares. Although we believe that the effect of the operation of our DRIP and the payment of such fees was immaterial, the REIT rules do not provide an exception for de minimis preferential dividends.
Accordingly, we submitted a request to the IRS for a closing agreement under which the IRS would grant us relief for preferential dividends that may have been paid as a result of the manner in which we operated our DRIP and in respect of our payment of certain of such custodial fees. There can be no assurance that the IRS will accept our proposal for a closing agreement. Even if the IRS accepts the proposal, we may be required to pay a fine if the IRS were to view the prior operation of our DRIP or the payment of such fees as
32
preferential dividends. We cannot predict whether such a penalty would be imposed or, if so, the amount of the penalty. If the IRS does not agree to our proposal for a closing agreement and treats the foregoing amounts as preferential dividends, we may be able to rectify our failure to meet the REIT distribution requirements for a year by paying “deficiency dividends,” which would be paid in respect of all of our common shares pro rata and which would be included in our deduction for dividends paid in the prior years. If required, such deficiency dividends could be as much as approximately $22 million. In such a case, we would be able to avoid losing our qualification as a REIT or being taxed on amounts distributed as deficiency dividends. However, we would be required to pay an interest-like penalty based on the amount of our deficiency dividends. Amounts paid as deficiency dividends should generally be treated as taxable income for U.S. federal income tax purposes.
If we were to fail to qualify as a REIT for any taxable year, including if we were found to have violated the 5% gross asset test and our failure was not due to reasonable cause, or if we failed to meet our distribution requirements we would be subject to U.S. federal income tax on our taxable income at regular corporate rates with no deductions for distributions made to shareholders. Further, in such event, we would generally be disqualified from treatment as a REIT for the four taxable years following the year in which we lose our REIT qualification. Accordingly, the loss of our REIT qualification would reduce our net earnings available for investment or distribution to shareholders because of the substantial tax liabilities that would be imposed on us. We might also be required to borrow funds or sell investments to pay the applicable tax.
We may be subject to tax on our undistributed net taxable income or be forced to borrow funds to make distributions required to qualify as a REIT.
As a REIT, we generally must distribute at least 90% of our annual net taxable income (excluding net capital gain) to our shareholders and we are subject to regular corporate income tax to the extent that we distribute less than 100% of our annual net taxable income. In addition, we are subject to a 4% nondeductible excise tax on the amount, if any, by which distributions paid by us in any calendar year are less than the sum of 85% of our ordinary income, 95% of our capital gain net income and 100% of our undistributed income from prior years. In order to make distributions necessary to qualify as a REIT and avoid the payment of income and excise taxes, we may need to borrow funds on a short-term, or possibly long-term, basis, use proceeds from our current public offering or future public offerings, or sell properties, even if the then prevailing market conditions are not favorable for borrowings or sales. In addition, we may utilize these funding sources to make distributions that exceed the amount we are required to distribute to qualify as a REIT. Our need for cash to make distributions could result from, among other things, a difference in timing between the actual receipt of cash and inclusion of income for U.S. federal income tax purposes, the effect of non-deductible capital expenditures, the creation of reserves and the repayment of indebtedness.
Dividends payable by REITs generally do not qualify for reduced U.S. federal income tax rates.
The maximum U.S. federal income tax rate for dividends payable by domestic corporations to individual U.S. shareholders is 15% (through 2012). Dividends payable by REITs, however, are generally not eligible for the reduced rates. The more favorable rates applicable to regular corporate dividends could cause investors who are individuals to perceive investments in REITs to be relatively less attractive than investments in the stocks of non-REIT corporations that pay dividends, which could adversely affect the value of the shares of REITs, including our shares.
We will pay some taxes.
Even if we qualify as a REIT for U.S. federal income tax purposes, we will be required to pay some U.S. federal, state, local and foreign taxes on our income and property, including a 100% penalty tax on any gain recognized on property held primarily for sale to customers in the ordinary course of a trade or business. To the extent that we are required to pay U.S. federal, state, local or foreign taxes, we will have less cash available for distribution to our shareholders.
The ability of our Board of Trustees to revoke our REIT election without shareholder approval may cause adverse consequences to our shareholders.
Our charter provides that our Board of Trustees may revoke or otherwise terminate our REIT election, without the approval of our shareholders, if it determines that it is no longer in our best interests to qualify as a REIT. If we cease to qualify as a REIT, we would become subject to U.S. federal income tax on our taxable income and we would no longer be required to distribute most of our taxable income to our shareholders, which may have adverse consequences on the total return to our shareholders and the value of our shares.
Legislative or regulatory action could adversely affect investors.
In recent years, numerous legislative, judicial and administrative changes have been made to the U.S. federal income tax laws applicable to investments similar to an investment in our shares. Additional changes to tax laws are likely to continue to occur in the
33
future, and we cannot assure you that any such changes will not adversely affect the taxation of us or our shareholders. Any such changes could have an adverse effect on an investment in our shares or on the market value or the resale potential of our properties.
If our assets are deemed to be ERISA plan assets, the Investment Advisor and we may be exposed to liabilities under Title I of ERISA and the Internal Revenue Code.
In some circumstances where an ERISA plan holds an interest in an entity, the assets of the entire entity are deemed to be ERISA plan assets unless an exception applies. This is known as the “look-through rule.” Under those circumstances, the obligations and other responsibilities of plan sponsors, plan fiduciaries and plan administrators, and of parties in interest and disqualified persons, under Title I of ERISA and Section 4975 of the Internal Revenue Code, may be applicable, and there may be liability under these and other provisions of ERISA and the Internal Revenue Code. If the Investment Advisor or we are exposed to liability under ERISA or the Internal Revenue Code, our performance and results of operations could be adversely affected. Prior to making an investment in us, you should consult with your legal and other advisors concerning the impact of ERISA and the Internal Revenue Code on your investment and our performance.
| ITEM 1B. | UNRESOLVED STAFF COMMENTS |
As of December 31, 2010, we did not have any unresolved comments with the staff of the SEC.
34
Properties
As of December 31, 2010, we owned, on a consolidated basis, 73 office, industrial (primarily warehouse/distribution) and retail properties located in 15 states (Arizona, California, Florida, Georgia, Illinois, Kentucky, Massachusetts, Minnesota, New Jersey, North Carolina, Ohio, South Carolina, Texas, Utah and Virginia) and in the United Kingdom, encompassing approximately 12,800,000 rentable square feet. Our consolidated properties were approximately 85.12% leased (based upon square feet) as of December 31, 2010. As of December 31, 2010, certain of our consolidated properties were subject to mortgage debt, a description of which is set forth in Item 7 “Management’s Discussion and Analysis of Financial Condition and Results of Operations—Financial Condition, Liquidity and Capital Resources—Financing.”
In addition, we have ownership interests in five unconsolidated entities that, as of December 31, 2010, owned interests in 38 properties. Excluding those properties owned through our investment in CBRE Strategic Partners Asia, we owned, on an unconsolidated basis, 30 industrial, office and retail properties located in eight states (Arizona, Florida, Indiana, Missouri, North Carolina, Ohio, Tennessee and Texas) and in the United Kingdom and Europe encompassing approximately 9,901,000 rentable square feet. Our unconsolidated properties were approximately 99.40% leased (based upon square feet) as of December 31, 2010. As of December 31, 2010, certain of our unconsolidated properties were subject to mortgage debt, a description of which is set forth in Item 7 “Management’s Discussion and Analysis of Financial Condition and Results of Operations—Financial Condition, Liquidity and Capital Resources—Financing.”
The average effective annual rents for our industrial properties, office properties and retail properties were approximately $88,144,000, $55,002,000 and $8,259,000 as of December 31, 2010, respectively.
The following table provides information relating to our properties, excluding those owned through our investment in CBRE Strategic Partners Asia, as of December 31, 2010. These properties consisted of 62 industrial properties, encompassing 17,118,000 rentable square feet, 38 office properties, encompassing 5,086,000 rentable square feet and three retail properties, encompassing 497,000 rentable square feet.
| | | | | | | | | | | | | | | | | | | | | | | | | | |
Property and Market | | Date
Acquired | | | Year
Built | | | Property Type | | Our
Effective
Ownership | | | Net Rentable
Square Feet
(in thousands) | | | Percentage
Leased | | | Approximate
Total
Acquisition Cost(1)
(in thousands) | |
Domestic Consolidated Properties: | | | | | | | | | | | | | | | | | | | | | | | | | | |
REMEC Corporate Campus 1
San Diego, CA | | | 9/15/2004 | | | | 1983 | | | Office | | | 100.00 | % | | | 34 | | | | 100.00 | % | | $ | 6,833 | |
REMEC Corporate Campus 2
San Diego, CA | | | 9/15/2004 | | | | 1983 | | | Office | | | 100.00 | % | | | 30 | | | | 100.00 | % | | | 6,125 | |
REMEC Corporate Campus 3
San Diego, CA | | | 9/15/2004 | | | | 1983 | | | Office | | | 100.00 | % | | | 37 | | | | 100.00 | % | | | 7,523 | |
REMEC Corporate Campus 4
San Diego, CA | | | 9/15/2004 | | | | 1983 | | | Office | | | 100.00 | % | | | 31 | | | | 100.00 | % | | | 6,186 | |
300 Constitution Drive
Boston, MA | | | 11/3/2004 | | | | 1998 | | | Warehouse/Distribution | | | 100.00 | % | | | 330 | | | | 100.00 | % | | | 19,805 | |
Deerfield Commons(2)
Atlanta, GA | | | 6/21/2005 | | | | 2000 | | | Office | | | 100.00 | % | | | 122 | | | | 100.00 | % | | | 21,834 | |
505 Century(3)
Dallas, TX | | | 1/9/2006 | | | | 1997 | | | Warehouse/Distribution | | | 100.00 | % | | | 100 | | | | 100.00 | % | | | 6,095 | |
631 International(3)
Dallas, TX | | | 1/9/2006 | | | | 1998 | | | Warehouse/Distribution | | | 100.00 | % | | | 73 | | | | 100.00 | % | | | 5,407 | |
660 North Dorothy(3)
Dallas, TX | | | 1/9/2006 | | | | 1997 | | | Warehouse/Distribution | | | 100.00 | % | | | 120 | | | | 87.50 | % | | | 6,836 | |
Bolingbrook Point III
Chicago, IL | | | 8/29/2007 | | | | 2006 | | | Warehouse/Distribution | | | 100.00 | % | | | 185 | | | | 53.18 | % | | | 18,170 | |
Cherokee Corporate Park(3)
Spartanburg, SC | | | 8/30/2007 | | | | 2000 | | | Warehouse/Distribution | | | 100.00 | % | | | 60 | | | | 0.00 | % | | | 3,775 | |
Community Cash Complex 1(3)
Spartanburg, SC | | | 8/30/2007 | | | | 1960 | | | Warehouse/Distribution | | | 100.00 | % | | | 205 | | | | 39.64 | % | | | 2,690 | |
Community Cash Complex 2(3)
Spartanburg, SC | | | 8/30/2007 | | | | 1978 | | | Warehouse/Distribution | | | 100.00 | % | | | 145 | | | | 85.50 | % | | | 2,225 | |
Community Cash Complex 3(3)
Spartanburg, SC | | | 8/30/2007 | | | | 1981 | | | Warehouse/Distribution | | | 100.00 | % | | | 116 | | | | 100.00 | % | | | 1,701 | |
Community Cash Complex 4(3)
Spartanburg, SC | | | 8/30/2007 | | | | 1984 | | | Warehouse/Distribution | | | 100.00 | % | | | 33 | | | | 100.00 | % | | | 547 | |
Community Cash Complex 5(3)
Spartanburg, SC | | | 8/30/2007 | | | | 1984 | | | Warehouse/Distribution | | | 100.00 | % | | | 53 | | | | 100.00 | % | | | 824 | |
35
| | | | | | | | | | | | | | | | | | | | | | | | | | |
Property and Market | | Date
Acquired | | | Year
Built | | | Property Type | | Our
Effective
Ownership | | | Net Rentable
Square Feet
(in thousands) | | | Percentage
Leased | | | Approximate
Total
Acquisition Cost(1)
(in thousands) | |
Fairforest Building 1(3)
Spartanburg, SC | | | 8/30/2007 | | | | 2000 | | | Manufacturing | | | 100.00 | % | | | 51 | | | | 100.00 | % | | | 2,974 | |
Fairforest Building 2(3)
Spartanburg, SC | | | 8/30/2007 | | | | 1999 | | | Manufacturing | | | 100.00 | % | | | 104 | | | | 100.00 | % | | | 5,379 | |
Fairforest Building 3(3)
Spartanburg, SC | | | 8/30/2007 | | | | 2000 | | | Manufacturing | | | 100.00 | % | | | 100 | | | | 100.00 | % | | | 5,760 | |
Fairforest Building 4(3)
Spartanburg, SC | | | 8/30/2007 | | | | 2001 | | | Manufacturing | | | 100.00 | % | | | 101 | | | | 100.00 | % | | | 5,640 | |
Fairforest Building 5
Spartanburg, SC | | | 8/30/2007 | | | | 2006 | | | Warehouse/Distribution | | | 100.00 | % | | | 316 | | | | 100.00 | % | | | 16,968 | |
Fairforest Building 6
Spartanburg, SC | | | 8/30/2007 | | | | 2005 | | | Manufacturing | | | 100.00 | % | | | 101 | | | | 100.00 | % | | | 7,469 | |
Fairforest Building 7(3)
Spartanburg, SC | | | 8/30/2007 | | | | 2006 | | | Warehouse/Distribution | | | 100.00 | % | | | 101 | | | | 83.78 | % | | | 5,626 | |
Greenville/Spartanburg Industrial Park(3)
Spartanburg, SC | | | 8/30/2007 | | | | 1990 | | | Manufacturing | | | 100.00 | % | | | 67 | | | | 100.00 | % | | | 3,388 | |
Highway 290 Commerce Park Building 1(3)
Spartanburg, SC | | | 8/30/2007 | | | | 1995 | | | Warehouse/Distribution | | | 100.00 | % | | | 150 | | | | 100.00 | % | | | 5,388 | |
Highway 290 Commerce Park Building 5(3)
Spartanburg, SC | | | 8/30/2007 | | | | 1993 | | | Warehouse/Distribution | | | 100.00 | % | | | 30 | | | | 100.00 | % | | | 1,420 | |
Highway 290 Commerce Park Building 7(3)
Spartanburg, SC | | | 8/30/2007 | | | | 1994 | | | Warehouse/Distribution | | | 100.00 | % | | | 88 | | | | 0.00 | % | | | 4,889 | |
HJ Park Building 1
Spartanburg, SC | | | 8/30/2007 | | | | 2003 | | | Manufacturing | | | 100.00 | % | | | 70 | | | | 100.00 | % | | | 4,216 | |
Jedburg Commerce Park(3)
Charleston, SC | | | 8/30/2007 | | | | 2007 | | | Manufacturing | | | 100.00 | % | | | 513 | | | | 100.00 | % | | | 41,991 | |
Kings Mountain I
Charlotte, NC | | | 8/30/2007 | | | | 1998 | | | Warehouse/Distribution | | | 100.00 | % | | | 100 | | | | 100.00 | % | | | 5,497 | |
Kings Mountain II
Charlotte, NC | | | 8/30/2007 | | | | 2002 | | | Warehouse/Distribution | | | 100.00 | % | | | 301 | | | | 100.00 | % | | | 11,311 | |
Mount Holly Building
Charleston, SC | | | 8/30/2007 | | | | 2003 | | | Warehouse/Distribution | | | 100.00 | % | | | 101 | | | | 100.00 | % | | | 6,208 | |
North Rhett I
Charleston, SC | | | 8/30/2007 | | | | 1973 | | | Warehouse/Distribution | | | 100.00 | % | | | 285 | | | | 100.00 | % | | | 10,302 | |
North Rhett II
Charleston, SC | | | 8/30/2007 | | | | 2001 | | | Warehouse/Distribution | | | 100.00 | % | | | 102 | | | | 0.00 | % | | | 7,073 | |
North Rhett III
Charleston, SC | | | 8/30/2007 | | | | 2002 | | | Warehouse/Distribution | | | 100.00 | % | | | 80 | | | | 100.00 | % | | | 4,812 | |
North Rhett IV
Charleston, SC | | | 8/30/2007 | | | | 2005 | | | Warehouse/Distribution | | | 100.00 | % | | | 316 | | | | 100.00 | % | | | 17,060 | |
Orangeburg Park Building
Charleston, SC | | | 8/30/2007 | | | | 2003 | | | Warehouse/Distribution | | | 100.00 | % | | | 101 | | | | 100.00 | % | | | 5,474 | |
Orchard Business Park 2(3)
Spartanburg, SC | | | 8/30/2007 | | | | 1993 | | | Warehouse/Distribution | | | 100.00 | % | | | 18 | | | | 100.00 | % | | | 761 | |
Union Cross Building I
Winston-Salem, NC | | | 8/30/2007 | | | | 2005 | | | Warehouse/Distribution | | | 100.00 | % | | | 101 | | | | 100.00 | % | | | 6,585 | |
Union Cross Building II
Winston-Salem, NC | | | 8/30/2007 | | | | 2005 | | | Warehouse/Distribution | | | 100.00 | % | | | 316 | | | | 36.38 | % | | | 17,216 | |
Highway 290 Commerce Park Building 2(3)
Spartanburg, SC | | | 9/24/2007 | | | | 1995 | | | Warehouse/Distribution | | | 100.00 | % | | | 100 | | | | 100.00 | % | | | 4,626 | |
Highway 290 Commerce Park Building 6(3)
Spartanburg, SC | | | 11/1/2007 | | | | 1996 | | | Warehouse/Distribution | | | 100.00 | % | | | 105 | | | | 42.86 | % | | | 3,760 | |
Orchard Business Park 1(3)
Spartanburg, SC | | | 11/1/2007 | | | | 1994 | | | Warehouse/Distribution | | | 100.00 | % | | | 33 | | | | 0.00 | % | | | 1,378 | |
Lakeside Office Center
Dallas, TX | | | 3/5/2008 | | | | 2006 | | | Office | | | 100.00 | % | | | 99 | | | | 90.61 | % | | | 17,994 | |
Kings Mountain III(3)
Charlotte, NC | | | 3/14/2008 | | | | 2007 | | | Warehouse/Distribution | | | 100.00 | % | | | 542 | | | | 0.00 | % | | | 25,728 | |
Enclave on the Lake
Houston, TX | | | 7/1/2008 | | | | 1999 | | | Office | | | 100.00 | % | | | 171 | | | | 100.00 | % | | | 37,827 | |
Avion Midrise III
Washington, DC | | | 11/18/2008 | | | | 2002 | | | Office | | | 100.00 | % | | | 71 | | | | 100.00 | % | | | 21,111 | |
Avion Midrise IV
Washington, DC | | | 11/18/2008 | | | | 2002 | | | Office | | | 100.00 | % | | | 72 | | | | 100.00 | % | | | 21,112 | |
13201 Wilfred
Minneapolis, MN | | | 6/29/2009 | | | | 1999 | | | Warehouse/Distribution | | | 100.00 | % | | | 335 | | | | 100.00 | % | | | 15,340 | |
3011, 3055 & 3077 Comcast Place
East Bay, CA | | | 7/1/2009 | | | | 1988 | | | Office | | | 100.00 | % | | | 220 | | | | 100.00 | % | | | 49,000 | |
36
| | | | | | | | | | | | | | | | | | | | | | | | | | |
Property and Market | | Date
Acquired | | | Year
Built | | | Property Type | | Our
Effective
Ownership | | | Net Rentable
Square Feet
(in thousands) | | | Percentage
Leased | | | Approximate
Total
Acquisition Cost(1)
(in thousands) | |
140 Depot Street
Boston, MA | | | 7/31/2009 | | | | 2007 | | | Warehouse/Distribution | | | 100.00 | % | | | 238 | | | | 100.00 | % | | | 18,950 | |
12650 Ingenuity Drive
Orlando, FL | | | 8/5/2009 | | | | 1999 | | | Office | | | 100.00 | % | | | 125 | | | | 100.00 | % | | | 25,350 | |
Crest Ridge Corporate Center 1
Minneapolis, MN | | | 8/17/2009 | | | | 2009 | | | Office | | | 100.00 | % | | | 116 | | | | 100.00 | % | | | 28,419 | |
West Point Trade Center
Jacksonville, FL | | | 12/30/2009 | | | | 2009 | | | Warehouse/Distribution | | | 100.00 | % | | | 602 | | | | 100.00 | % | | | 29,000 | |
5160 Hacienda Drive
East Bay, CA | | | 4/8/2010 | | | | 1988 | | | Office | | | 100.00 | % | | | 202 | | | | 100.00 | % | | | 38,500 | |
10450 Pacific Center Court
San Diego, CA | | | 5/7/2010 | | | | 1985 | | | Office | | | 100.00 | % | | | 134 | | | | 100.00 | % | | | 32,750 | |
225 Summit Ave
New York, NY | | | 6/21/2010 | | | | 1966 | | | Office | | | 100.00 | % | | | 143 | | | | 100.00 | % | | | 40,600 | |
One Wayside Road
Boston, MA | | | 6/24/2010 | | | | 1998 | | | Office | | | 100.00 | % | | | 200 | | | | 100.00 | % | | | 55,525 | |
100 Tice Blvd.
New York, NY | | | 9/28/2010 | | | | 2007 | | | Office | | | 100.00 | % | | | 209 | | | | 100.00 | % | | | 67,600 | |
Ten Parkway North
Chicago, IL | | | 10/12/2010 | | | | 1999 | | | Office | | | 100.00 | % | | | 100 | | | | 100.00 | % | | | 25,000 | |
4701 Gold Spike Drive(3)
Dallas, TX | | | 10/27/2010 | | | | 2002 | | | Warehouse/Distribution | | | 100.00 | % | | | 420 | | | | 100.00 | % | | | 20,300 | |
1985 International Way(3)
Cincinnati, OH | | | 10/27/2010 | | | | 1998 | | | Warehouse/Distribution | | | 100.00 | % | | | 189 | | | | 100.00 | % | | | 14,800 | |
Rickenbacker II(3)(10)
Columbus, OH | | | 10/27/2010 | | | | 1999 | | | Warehouse/Distribution | | | 100.00 | % | | | 434 | | | | 47.37 | % | | | 8,600 | |
Summit Distribution Center(3)
Salt Lake City, UT | | | 10/27/2010 | | | | 2001 | | | Warehouse/Distribution | | | 100.00 | % | | | 275 | | | | 100.00 | % | | | 13,400 | |
3660 Deerpark Boulevard(3)
Jacksonville, FL | | | 10/27/2010 | | | | 2002 | | | Warehouse/Distribution | | | 100.00 | % | | | 322 | | | | 100.00 | % | | | 15,300 | |
Tolleson Commerce Park II(3)
Phoenix, AZ | | | 10/27/2010 | | | | 1999 | | | Warehouse/Distribution | | | 100.00 | % | | | 217 | | | | 100.00 | % | | | 9,200 | |
Pacific Corporate Park(2)
Washington, DC | | | 11/15/2010 | | | | 2002 | | | Office | | | 100.00 | % | | | 696 | | | | 100.00 | % | | | 144,500 | |
100 Kimball Drive(3)
Newark, NJ | | | 12/10/2010 | | | | 2006 | | | Office | | | 100.00 | % | | | 175 | | | | 100.00 | % | | | 60,250 | |
Rickenbacker III(3)(10)
Columbus, OH | | | 12/17/2010 | | | | 2001 | | | Warehouse/Distribution | | | 100.00 | % | | | 676 | | | | 60.71 | % | | | 13,400 | |
| | | | | | | | | | | | | | | | | | | | | | | | | | |
Total Domestic Consolidated Properties | | | | 12,510 | | | | 85.17 | % | | | 1,179,303 | |
| | | | | | | | | | | | | | | | | | | | | | | | | | |
International Consolidated Properties: | | | | | | | | | | | | | | | | | | | | | | | | | | |
602 Central Blvd.(3)
Coventry, UK | | | 4/27/2007 | | | | 2001 | | | Office | | | 100.00 | % | | | 50 | | | | 0.00 | % | | | 23,847 | |
Thames Valley Five
Reading, UK | | | 3/20/2008 | | | | 1998 | | | Office | | | 100.00 | % | | | 40 | | | | 100.00 | % | | | 29,572 | |
Albion Mills Retail Park
Wakefield, UK | | | 7/11/2008 | | | | 2000 | | | Retail | | | 100.00 | % | | | 55 | | | | 100.00 | % | | | 22,098 | |
Maskew Retail Park
Peterborough, UK | | | 10/23/2008 | | | | 2007 | | | Retail | | | 100.00 | % | | | 145 | | | | 100.00 | % | | | 53,740 | |
| | | | | | | | | | | | | | | | | | | | | | | | | | |
Total International Consolidated Properties | | | | 290 | | | | 82.77 | % | | | 129,257 | |
| | | | | | | | | | | | | | | | | | | | | | | | | | |
Total Consolidated Properties | | | | 12,800 | | | | 85.12 | % | | | 1,308,560 | |
| | | | | | | | | | | | | | | | | | | | | | | | | | |
Domestic Unconsolidated Properties(4): | | | | | | | | | | | | | | | | | | | | | | | | | | |
Buckeye Logistics Center(5)
Phoenix, AZ | | | 6/12/2008 | | | | 2008 | | | Warehouse/Distribution | | | 80.00 | % | | | 605 | | | | 100.00 | % | | | 35,573 | |
Afton Ridge Shopping Center(6)
Charlotte, NC | | | 9/18/2008 | | | | 2007 | | | Retail | | | 90.00 | % | | | 296 | | | | 95.43 | % | | | 44,530 | |
AllPoints at Anson Bldg. 1(5)
Indianapolis, IN | | | 9/30/2008 | | | | 2008 | | | Warehouse/Distribution | | | 80.00 | % | | | 631 | | | | 100.00 | % | | | 27,150 | |
12200 President’s Court(5)
Jacksonville, FL | | | 9/30/2008 | | | | 2008 | | | Warehouse/Distribution | | | 80.00 | % | | | 772 | | | | 100.00 | % | | | 29,995 | |
201 Sunridge Blvd.(5)
Dallas, TX | | | 9/30/2008 | | | | 2008 | | | Warehouse/Distribution | | | 80.00 | % | | | 823 | | | | 100.00 | % | | | 25,690 | |
Aspen Corporate Center 500(5)
Nashville, TN | | | 9/30/2008 | | | | 2008 | | | Office | | | 80.00 | % | | | 180 | | | | 100.00 | % | | | 30,033 | |
125 Enterprise Parkway(5)
Columbus, OH | | | 12/10/2008 | | | | 2008 | | | Warehouse/Distribution | | | 80.00 | % | | | 1,142 | | | | 100.00 | % | | | 38,088 | |
AllPoints Midwest Bldg. I(5)
Indianapolis, IN | | | 12/10/2008 | | | | 2008 | | | Warehouse/Distribution | | | 80.00 | % | | | 1,200 | | | | 100.00 | % | | | 41,428 | |
37
| | | | | | | | | | | | | | | | | | | | | | | | | | |
Property and Market | | Date
Acquired | | | Year
Built | | | Property Type | | Our
Effective
Ownership | | | Net Rentable
Square Feet
(in thousands) | | | Percentage
Leased | | | Approximate
Total
Acquisition Cost(1)
(in thousands) | |
Celebration Office Center(5)
Orlando, FL | | | 5/13/2009 | | | | 2009 | | | Office | | | 80.00 | % | | | 101 | | | | 100.00 | % | | | 13,640 | |
22535 Colonial Pkwy(5)
Houston, TX | | | 5/13/2009 | | | | 2009 | | | Office | | | 80.00 | % | | | 90 | | | | 100.00 | % | | | 11,596 | |
Fairfield Distribution Ctr. IX(3)(5)
Tampa, FL | | | 5/13/2009 | | | | 2008 | | | Warehouse/Distribution | | | 80.00 | % | | | 136 | | | | 100.00 | % | | | 7,151 | |
Northpoint III(5)
Orlando, FL | | | 10/15/2009 | | | | 2001 | | | Office | | | 80.00 | % | | | 108 | | | | 100.00 | % | | | 14,592 | |
Goodyear Crossing Ind. Park II(5)
Phoenix, AZ | | | 12/07/2009 | | | | 2009 | | | Warehouse/Distribution | | | 80.00 | % | | | 820 | | | | 100.00 | % | | | 36,516 | |
3900 North Paramount Parkway(5)
Raleigh, NC | | | 3/31/2010 | | | | 1999 | | | Office | | | 80.00 | % | | | 101 | | | | 100.00 | % | | | 11,176 | |
3900 South Paramount Parkway(5)
Raleigh, NC | | | 3/31/2010 | | | | 1999 | | | Office | | | 80.00 | % | | | 119 | | | | 100.00 | % | | | 13,055 | |
1400 Perimeter Park Drive(5)
Raleigh, NC | | | 3/31/2010 | | | | 1991 | | | Office | | | 80.00 | % | | | 45 | | | | 100.00 | % | | | 3,970 | |
Miramar I(5)(7)
Fort Lauderdale, FL | | | 3/31/2010 | | | | 2001 | | | Office | | | 80.00 | % | | | 94 | | | | 100.00 | % | | | 13,645 | |
Miramar II(5)(7)
Fort Lauderdale, FL | | | 3/31/2010 | | | | 2001 | | | Office | | | 80.00 | % | | | 129 | | | | 100.00 | % | | | 20,899 | |
McAuley Place(3)(5)
Cincinnati, OH | | | 12/21/2010 | | | | 2001 | | | Office | | | 80.00 | % | | | 191 | | | | 97.60 | % | | | 28,000 | |
Point West I(3)(5)
Dallas, TX | | | 12/21/2010 | | | | 2008 | | | Office | | | 80.00 | % | | | 183 | | | | 100.00 | % | | | 23,600 | |
Sam Houston Crossing I(3)(5)
Houston, TX | | | 12/21/2010 | | | | 2007 | | | Office | | | 80.00 | % | | | 160 | | | | 100.00 | % | | | 20,400 | |
Regency Creek(3)(5)
Raleigh, NC | | | 12/21/2010 | | | | 2008 | | | Office | | | 80.00 | % | | | 122 | | | | 100.00 | % | | | 18,000 | |
Easton III(3)(5)
Columbus, OH | | | 12/21/2010 | | | | 1999 | | | Office | | | 80.00 | % | | | 135 | | | | 100.00 | % | | | 14,400 | |
533 Maryville Centre(3)(5)
St. Louis, MD | | | 12/21/2010 | | | | 2000 | | | Office | | | 80.00 | % | | | 125 | | | | 100.00 | % | | | 19,102 | |
555 Maryville Centre(3)(5)
St. Louis, MD | | | 12/21/2010 | | | | 1999 | | | Office | | | 80.00 | % | | | 127 | | | | 67.84 | % | | | 15,578 | |
| | | | | | | | | | | | | | | | | | | | | | | | | | |
Total Domestic Unconsolidated Properties | | | | 8,435 | | | | 99.30 | % | | | 557,807 | |
| | | | | | | | | | | | | | | | | | | | | | | | | | |
International Unconsolidated Properties | | | | | | | | | | | | | | | | | | | | | | | | | | |
Amber Park(3)(8)
South Normanton, UK | | | 6/10/2010 | | | | 1997 | | | Warehouse/Distribution | | | 80.00 | % | | | 208 | | | | 100.00 | % | | | 12,514 | |
Brackmills(3)(8)
Northampton, UK | | | 6/10/2010 | | | | 1984 | | | Warehouse/Distribution | | | 80.00 | % | | | 187 | | | | 100.00 | % | | | 13,407 | �� |
Düren(3)(9)
Düren, Germany | | | 6/10/2010 | | | | 2008 | | | Warehouse/Distribution | | | 80.00 | % | | | 392 | | | | 100.00 | % | | | 13,148 | |
Schönberg(3)(9)
Schönberg, Germany | | | 6/10/2010 | | | | 2009 | | | Warehouse/Distribution | | | 80.00 | % | | | 454 | | | | 100.00 | % | | | 13,819 | |
Langenbach(3)(9)
Langenbach, Germany | | | 10/28/2010 | | | | 2010 | | | Warehouse/Distribution | | | 80.00 | % | | | 225 | | | | 100.00 | % | | | 18,573 | |
| | | | | | | | | | | | | | | | | | | | | | | | | | |
Total International Unconsolidated Properties | | | | 1,466 | | | | 100.00 | % | | | 71,461 | |
| | | | | | | | | | | | | | | | | | | | | | | | | | |
Total Unconsolidated Properties(4) | | | | 9,901 | | | | 99.40 | % | | | 629,268 | |
| | | | | | | | | | | | | | | | | | | | | | | | | | |
Total Properties(4) | | | | 22,701 | | | | 91.35 | % | | $ | 1,937,828 | |
| | | | | | | | | | | | | | | | | | | | | | | | | | |
| (1) | Approximate total acquisition cost represents the pro rata purchase price inclusive of customary closing costs and acquisition fees/acquisition expenses. |
| (2) | Includes undeveloped land zoned for future use. |
| (3) | This property is unencumbered and not secured by mortgage debt. |
| (4) | Does not include CBRE Strategic Partners Asia properties. |
| (5) | This property is held through the Duke joint venture. |
| (6) | This property is held through the Afton Ridge joint venture. |
| (7) | Consolidated properties acquired on December 31, 2009 and contributed to the Duke joint venture during March 2010. |
| (8) | This property is held through the UK JV. |
| (9) | This property is held through the European JV. |
| (10) | Real estate held for sale as of December 31, 2010 |
38
Additional information relating to our consolidated and unconsolidated properties as of December 31, 2010 is provided below.
Domestic Properties—Consolidated
REMEC Corporate Campus—San Diego, CA
The REMEC Corporate Campus is a research and development office property which consists of four properties on three separate parcels, and application has been made to the city of San Diego to split one parcel, creating a fourth parcel. It is 100% leased to REMEC Defense and Space, Inc. a subsidiary of Cobham Defense Electronic System Corporation (a subsidiary of Cobham plc in the United Kingdom), a designer and manufacturer of sophisticated wireless communications networks for the defense, space and commercial sectors. Such lease is scheduled to expire in April 2017. The property serves as the corporate headquarters for REMEC’s Defense and Space division. REMEC has occupied the property for more than 17 years. The REMEC Corporate Campus is located in the Kearny Mesa submarket in the heart of central San Diego bounded by I-52 to the north, I-805 to the west and I-15 to the east. The property offers easy access off Kearny Villa Road and I-52. Kearny Mesa’s central location, freeway access, numerous points of ingress and egress, lack of congestion, and nearby retail support services allow this central suburban industrial submarket to compete advantageously with other adjacent San Diego industrial submarkets.
300 Constitution Drive—Boston, MA
300 Constitution Drive is a property comprised of 330,000 square feet of primarily distribution space on 27 acres of land. The property has potential for additional development, allowing for expansion of the existing distribution space. It was previously 100% leased to Chadwick’s of Boston, Inc. under a long-term lease that is scheduled to expire in March 2013. On July 25, 2008, the lease was assigned to Women’s Apparel Group, LLC, by Chadwick’s of Boston, Inc. Women’s Apparel Group, LLC, an owner and operator of women’s apparel companies, is now the tenant of the 300 Constitution Drive property.
Deerfield Commons I & II—Atlanta, GA
Deerfield Commons I is a multi-tenant office building located in Alpharetta, GA, a suburb of Atlanta, which is 100% leased to tenants encompassing a variety of business uses including financial services, publishing, and executive suites. Lease terms range from three to ten years. Regus Business Centers is the largest tenant at this property, and occupies approximately 45,321 square feet with a lease scheduled to expire in May 2018. Also included with this asset is Deerfield Commons II, ten acres of undeveloped land zoned for office use.
Texas Portfolio—Dallas, TX
The Texas Portfolio is comprised of three multi-tenant warehouse/distribution buildings (660 Dorothy, 505 Century, and 631 International) located in Allen and Richardson, Texas, both suburbs of Dallas, which is 95% leased to nine tenants encompassing a variety of business uses including communication, commercial and information technology services.
Bolingbrook Point III—Chicago, IL
Bolingbrook Point III located in Bolingbrook, IL, a suburb of Chicago, consists of a 185,045 square foot, multi-tenant warehouse distribution building completed in May 2006. The building is currently 53% leased, 98,414 square feet, to Compass Group USA, Inc., a managed foodservices company.
Carolina Portfolio
The Carolina Portfolio consists of 34 warehouse/distribution and manufacturing buildings located in the markets of Greenville/Spartanburg, SC; Charleston, SC; Charlotte, NC; and Winston-Salem, NC. The Carolina Portfolio totals approximately 5,005,452 square feet of industrial space and is currently 75% leased to tenants encompassing a variety of business uses including automotive, consumer products and logistics services. Jedburg Commerce Park is 100% leased to American La France LLC, a manufacturer of fire, rescue and vocational vehicles, under a lease that is scheduled to expire in July 2013 and each of Fairforest Bldg. 5, Kings Mountain II, and North Rhett IV is 100% leased to tenants under leases that are scheduled to expire in February 2013, December 2019 and January 2022, respectively.
Lakeside Office Center—Dallas, TX
The Lakeside Office Center consists of a 98,750 square foot, three-story office building and surface parking. The building is 91% leased to several tenants, one of which is Teachers Insurance and Annuity Association of America, one of the nation’s largest financial services companies, who occupy 67,516 square feet.
39
Enclave on the Lake—Houston, TX
Enclave on the Lake consists of a 171,091 square foot, six-story office building with structured and surface parking lots completed in 1999. The office building is 100% leased to SBM Offshore, a Netherlands based supplier of products and services to the oil and gas industry under a lease that expires in February 2012. In connection with the acquisition of this property, we assumed a $18,790,000 fixed-rate mortgage loan that bears interest at a rate of 5.45% per annum and matures on May 1, 2011.
Avion Midrise III & IV—Washington, D.C.
Avion Midrise III & IV each consist of a three-story office building, with surface parking lots, completed in 2003 and 2002, respectively. Avion Midrise III has 71,507 rentable square feet and is 100% leased to Lockheed Martin Corporation, a leading supplier of aerospace and defense products and services, under a lease that expires in September 2012. Avion Midrise IV has 71,504 rentable square feet and is 100% leased to the U.S. General Services Administration, under a lease that expires in January 2012. Both buildings have been improved to meet Sensitive Compartmentalized Information Facilities standards that include enhanced access control systems which meet specific security requirements for handling federal classified information.
13201 Wilfred Lane—Minneapolis, MN
13201 Wilfred Lane is a 335,400 square foot warehouse/distribution building completed in 1999 and is 100% leased to Walgreens Co. through July 2018. Walgreens Co. is one of the nation’s largest retailers of pharmaceuticals and consumer goods and currently utilizes the property for distribution of non-pharmaceutical goods to Walgreens stores in three states.
3011, 3055 & 3077 Comcast—East Bay, CA
3011, 3055 & 3077 Comcast Place is a 219,631 square foot office campus consisting of one two-story building and two one-story buildings with surface parking lots, completed in 1987/88 and fully renovated in 2009. The property is 100% leased to Comcast of California/Colorado/Washington I, Inc, a subsidiary of Comcast Corporation, through December 2023, and guaranteed by Comcast Corporation. Comcast Corporation is one of the nation’s largest providers of cable, entertainment and communications products and services and utilizes the property as a regional headquarters, call-center and operations center.
140 Depot Street—Boston, MA
140 Depot Street is a 238,370 square foot warehouse/distribution building to be completed in 2009 and has no operating history. The property is 100% leased to Best Buy Stores, L.P. through July 2019. Best Buy Stores, L.P. is one of the nation’s leading retailers of consumer appliances and electronic goods and plans to utilize the property as a regional distribution center for large electronics and appliances of the type generally delivered directly to consumers’ homes.
12650 Ingenuity Drive—Orlando, FL
12650 Ingenuity Drive is a 124,500 square foot, two-story office building, with surface parking lots, completed in 1999 and is 100% leased to Iowa College Acquisition Corp. through December 2021. The tenant is an operating subsidiary of Kaplan, Inc., the for-profit education subsidiary of The Washington Post Company. The lease is guaranteed by Kaplan, Inc., which utilizes the property as a call-center for online students of Kaplan University, a higher-education division providing certificates, associate degrees, bachelor degrees and postgraduate degrees in a variety of subjects.
Crest Ridge Corporate Center I—Minneapolis, MN
Crest Ridge Corporate Center I is a 116,338 square foot, three-story office building, with structured parking, completed in 2009. The property is 100% leased to Syngenta Seeds, Inc. to be utilized as its corporate headquarters through June 2019. Syngenta Seeds, Inc. is a subsidiary of global agri-business company Syngenta AG and provides corn, soybean, sugar-beet and vegetable seeds to growers throughout the U.S. The lease is guaranteed by the U.S. parent, Syngenta US Holdings, Inc.
West Point Trade Center—Jacksonville, FL
West Point Trade Center is a 601,500 square foot warehouse/distribution building that was completed in 2009. The property is 100% leased to Dr Pepper/Seven Up, Inc., and guaranteed by Dr Pepper Snapple Group, Inc., through October 2019. Dr Pepper Snapple Group, Inc. is one of the nation’s largest beverage companies and utilizes the property as a regional distribution center.
40
Miramar I & II—Miami, FL
Miramar I is a two-story, 94,060 square foot office building, with a surface parking lot, completed in 2002. The property is 100% leased to DeVry Inc., through November 2017. DeVry Inc. operates DeVry University, one of the nation’s largest for-profit universities and utilizes the property for classroom space. Miramar II is a three story, 128,540 square foot office building with surface parking lot, completed in 2001. The property is 100% leased to Royal Caribbean Cruises Ltd. through May 2016. Royal Caribbean Cruises Ltd. is one of the world’s largest cruise ship lines and utilizes the property for corporate support operations.
Miramar I and II were contributed to the Duke joint venture on March 31, 2010.
5160 Hacienda Drive—East Bay, CA
5160 Hacienda Drive is a 201,620 square foot corporate headquarters and research and development building that was completed in 1998. The property is 100% leased to Carl Zeiss Meditec, Inc. and guaranteed by Carl Zeiss Meditec AG, through September 2019. Carl Zeiss Meditec, Inc. is a market leader in the medical optics industry and utilizes the property as its U.S. corporate headquarters and research and development facility.
10450 Pacific Center Court—San Diego, CA
10450 Pacific Center Court is a 134,000 square foot office building that was completed in 1985. The property is 100% leased to Time Warner Cable Inc. through February 2018. Time Warner Cable Inc. is one of the nation’s largest cable services providers and utilizes the property as its regional corporate headquarters for its San Diego operations.
225 Summit Avenue—New York, NY
225 Summit Avenue is a 142,500 square foot two-story corporate headquarters office building that was completely renovated in 2007. The property is 100% leased to Barr Laboratories, Inc. and guaranteed by its parent company, Teva Pharmaceutical Industries Limited, through September 2020. Teva Pharmaceutical Industries Limited is a global leader in the generic pharmaceuticals industry and currently subleases 225 Summit Avenue to Medco Health Services, Inc.
One Wayside Road—Boston, MA
One Wayside Road is a 200,411 square foot four-story corporate headquarters office building that was completed in 1998 and expanded in 2008. The property is 100% leased to Nuance Communications, Inc., through March 2018. Nuance Communications, Inc. is a leading provider of speech recognition, imaging and customer interactions software solutions.
100 Tice Blvd.—New York, NY
100 Tice Blvd. is a 208,911 square foot office building with underground parking constructed in 2007 that is 100% leased to Eisai Inc. through December 2021 and is used as Eisai’s North American headquarters. Eisai Inc. is the U.S. operating subsidiary of the Japanese company Eisai Co., Ltd. Eisai Inc. is a producer of pharmaceuticals for the treatment of Alzheimer’s disease, various cancers and other diseases/disorders.
Ten Parkway North—Chicago, IL
Ten Parkway North is a 99,566 square foot, three-story office building constructed in 1999 that is 100% leased to Markel Midwest, Inc. through January 2020 and is used as a regional headquarters building. Markel Midwest, Inc. is an operating subsidiary of Markel Corporation (NYSE: MKL), an international insurance holding company that sells specialty insurance products and programs to a variety of niche markets.
National Industrial Portfolio
The National Industrial Portfolio warehouse distribution properties total 2,534,037 rentable square feet with various lease expiration dates. Five of the properties are 100% leased and overall occupancy is 81% as of December 31, 2010. Two of the properties, Rickenbacker II and Rickenbacker III, have been designated as Real Estate Assets Held for Sale as of December 31, 2010.
Pacific Corporate Park
Pacific Corporate Park consists of four office buildings constructed between 2000 and 2002 totaling approximately 696,387 square feet plus 22 acres of additional land entitled for two 180,000 square foot buildings. Pacific Corporate Park is currently 100% net-leased, with 96% leased through February 2021 to Raytheon Company (NYSE: RTN), a developer of products, services and solutions in the defense industry.
41
100 Kimball Drive—Newark, NJ
100 Kimball Drive is a five-story, 175,000 square foot office building completed in 2007 that is currently 100% net-leased to Deloitte LLP through July 2020. Deloitte LLP is the US member firm of Deloitte Touché Tohmatsu and one of the largest professional services firms in the United States.
Domestic Properties—Unconsolidated
Joint Venture with Duke Realty
On May 5, 2008, we entered into a contribution agreement with Duke Realty Limited Partnership (“Duke”), a subsidiary of Duke Realty Corporation (NYSE: DRE), to form the Duke joint venture to acquire $248,900,500 in industrial real property assets (the “Industrial Portfolio”). The Industrial Portfolio consists of six bulk industrial built-to-suit, fully leased properties. On September 12, 2008, we entered into a first amendment to the contribution agreement to acquire a fully leased office building for $37,111,000 and to increase and revise the total purchase commitment to $282,400,000. We own an 80% interest and Duke owns a 20% interest in the Duke joint venture.
On June 12, 2008, September 30, 2008 and December 10, 2008, the Duke joint venture acquired fee interests in seven properties pursuant to the contribution agreement. All of the properties acquired were new built-to-suit, 100% leased, single-tenant buildings that did not have an operating history. The Duke joint venture obtained financing from 40/86 Mortgage Capital, Inc. for each of the seven properties. The financings, totaling $150,000,000, carry an interest rate of 5.58%, a term of five years and are cross-collateralized among the properties. The seven buildings were completed in 2007 and 2008.
On May 13, 2009, the Duke joint venture acquired each of (i) 22535 Colonial Pkwy., located at 22535 Colonial Pkwy., Katy, TX, a suburb of Houston, (ii) Celebration Office Center III, located at 1390 Celebration Blvd., Celebration, FL, a suburb of Orlando, and (iii) Fairfield Distribution Ctr. IX located at 4543-4561 Oak Fair Blvd., Tampa, FL. The Duke joint venture acquired 22535 Colonial Pkwy. for approximately $14,700,000, Celebration Office Center III for approximately $17,050,000 and Fairfield Distribution Ctr. IX for approximately $9,300,000, exclusive of customary closing costs. We made cash contributions totaling approximately $32,840,000 to the Duke joint venture in connection with these acquisitions. Upon closing, we paid the Investment Advisor a $493,000 acquisition fee.
22535 Colonial Pkwy. consists of a 89,750 square foot two-story office building that was completed in March 2009 and has no operating history. 22535 Colonial Pkwy. was built-to-suit and is 100% leased to Det Norske Veritas a third-party provider of risk management services for the maritime industry, and is under a lease that expires in June 2019. Celebration Office Center III consists of a 100,924 square foot three-story office building that was completed in April 2009 and has no operating history. Celebration Office Center III is being built-to-suit and is 100% leased to Disney Vacation Development, a subsidiary of Disney Enterprises Inc. and the developer and operator of Disney Vacation Club timeshares, and is under a lease that expires in March 2016. Fairfield Distribution Ctr. IX consists of a 136,212 square foot warehouse/distribution building that was completed in September 2008 and has a limited operating history. Fairfield Distribution Ctr. IX was built-to-suit and is 100% leased to Iron Mountain, the leading records management company in the U.S., and is under a lease that expires in August 2025.
On October 15, 2009, the Duke joint venture acquired Northpoint III, located in Lake Mary, FL, a suburb of Orlando, for approximately $18,240,000, exclusive of customary closing costs and acquisition fees which are both expensed as incurred. We made cash contributions totaling approximately $14,592,000 to the Duke joint venture in connection with the acquisition. Upon closing, we paid the Investment Advisor a $219,000 acquisition fee.
Northpoint III is a 108,499 square foot four-story office building that was completed in 2001. Northpoint III is 100% leased to Florida Power Corporation d/b/a Progress Energy Florida, Inc., a major electric utility in Florida through October, 2021.
On December 7, 2009, the Duke joint venture acquired Goodyear Crossing Ind. Park II, located in Goodyear, AZ, a suburb of Phoenix, for approximately $45,645,000, exclusive of customary closing costs and acquisition fees which are both expensed as incurred. We made cash contributions of approximately $36,516,000 to the Duke joint venture in connection with the acquisition. Upon closing, we paid the Investment Advisor a $548,000 acquisition fee.
Goodyear Crossing Ind. Park II is an 820,384 square foot warehouse/distribution building that was built in 2008 and expanded in 2009. The property is 100% leased to Amazon.com.azdc, Inc., with a guarantee from its parent Amazon.com until September 2019.
On March 31, 2010, the Duke joint venture acquired 3900 North Paramount Parkway, 3900 South Paramount Parkway and 1400 Perimeter Park Drive in Morrisville, NC, a suburb of Raleigh, for approximately $35,250,000, exclusive of customary closing costs and acquisition fees which are both expensed as incurred. We made contributions of approximately $28,125,000 ($19,649,000 was made in cash and $8,476,000 in-kind as discussed below) to the Duke joint venture in connection with the acquisition.
42
On March 31, 2010, we contributed our Miramar I and Miramar II properties, located at 2300 and 2200 SW 145th Avenue in Miramar, FL, a suburb of Miami, to the Duke joint venture for approximately our cost of $42,650,000. Our cost of $42,650,000, of which $8,476,000 was considered an in-kind contribution by us to the Duke joint venture representing our 20% divestiture of the Miramar I and Miramar II properties, was part of a structured transaction as an offset to the $28,125,000 owed by us for our 80% share of the Duke joint venture’s purchase of 3900 North Paramount Parkway, 3900 South Paramount Parkway and 1400 Perimeter Park Drive.
On August 24, 2010, the Duke joint venture closed on the acquisition of additional land and entered into a construction agreement and lease amendments (collectively, the “Expansion Agreements”) to expand the AllPoints at Anson Bldg. 1 property, a warehouse/distribution center located in Whitestown, IN, a suburb of Indianapolis. The existing property is 100% leased to a subsidiary of Amazon.com through July 2018. Pursuant to the Expansion Agreements, AllPoints at Anson Bldg. 1 (i) will be expanded from the current 630,573 square feet to approximately 1,036,573 square feet and (ii) will remain 100% leased to a subsidiary of Amazon.com, which lease will be extended through April 2021. The total cost of the expansion is anticipated to be approximately $16,900,000 to the Duke joint venture. As of December 31, 2010, the Duke joint venture had incurred land acquisition and construction costs totaling approximately $13,595,000. We expect to make cash contributions of approximately $13,541,000 to the Duke joint venture over the construction period in connection with the Expansion Agreements.
On December 17, 2010, the Duke joint venture entered into a purchase and sale agreement (the “Purchase Agreement”) with Duke, Duke Secured Financing 2009-1PAC, LLC and Duke Realty Ohio, affiliates of Duke, for the acquisition of up to $516,650,000 in office real property assets (the “Office Portfolio”). The Office Portfolio consists of 20 office properties (each a “Property” and together the “Properties”) that are expected to be contributed to the Duke Joint Venture in three separate tranches.
On December 21, 2010, the Duke joint venture acquired fee interests in the first tranche of the Office Portfolio by acquiring seven properties for $173,850,000, exclusive of closing costs and acquisition fees which were both expensed as incurred. We made a cash contribution of approximately $139,080,000 to the Duke joint venture in connection with the closing of the first tranche.
As of December 31, 2010, the Duke joint venture had purchased approximately $639,615,000 of assets, exclusive of acquisition fees and closing costs, and holds interests in 24 properties, six located in Florida, four located in North Carolina, four located in Texas, three located in Ohio, two located in Arizona, two located in Indiana, two located in Missouri and one in Tennessee.
We entered into an operating agreement for the Duke joint venture with Duke on June 12, 2008. Duke acts as the managing member of the Duke joint venture and is entitled to receive fees in connection with the services it provides to the Duke joint venture, including asset management, construction, development, leasing and property management services. Duke is also entitled to a promoted interest in the Duke joint venture. We have joint approval rights over all major decisions.
On December 17, 2010 in connection with the entry into of the Purchase Agreement for the Office Portfolio, we entered into an amended and restated operating agreement for the Duke joint venture. The amended and restated operating agreement generally contains the same terms and conditions as the operating agreement dated June 12, 2008 described above, except for the following material changes: (i) Duke has granted us a call option to acquire Duke’s entire interest in the Duke joint venture which such interest shall be valued based on the opinions of qualified appraisers and which we can elect to exercise anytime after June 30, 2012 upon the occurrence and adoption by resolution of certain triggering events and (ii) the Duke joint venture has certain rights to participate in the development of certain adjacent and nearby parcels of land currently owned by Duke.
For a period of three years from the date of the initial operating agreement, the Duke joint venture will have the right to acquire additional newly developed bulk industrial built-to-suit properties from Duke if such properties satisfy certain specified conditions. We will retain the right to approve the acquisition and purchase price of each such property.
We carry our investment in the Duke joint venture on the equity method of accounting because it is an entity under common control with Duke. Those investments where we have the ability to exercise significant influence (but not control) over operating and financial policies of such entities are accounted for using the equity method. We eliminate transactions with such equity method subsidiaries to the extent of our ownership in such entities.
For a detailed description of the properties held by the Duke joint venture as of December 31, 2010, see Note 5 “Investments in Unconsolidated Entities and for a detailed description of the recent transaction activity of the Duke joint venture, see “—Recent Developments.”
Afton Ridge Joint Venture
On September 18, 2008, we acquired a 90% ownership interest in Afton Ridge Joint Venture, LLC, or Afton Ridge, the owner of Afton Ridge Shopping Center, from unrelated third parties. CK Afton Ridge Shopping Center, LLC, a subsidiary of Childress Klein Properties, Inc.,
43
or CK Afton Ridge, retained a 10% ownership interest in Afton Ridge and continues to manage Afton Ridge Shopping Center. In connection with the services it provides, CK Afton Ridge is entitled to receive fees, including management, construction management and property management fees. Afton Ridge Shopping Center is located at the intersection of I-85 and Kannapolis Parkway, in Kannapolis, NC.
Afton Ridge Shopping Center is a 470,288 square foot regional shopping center, completed in 2007, in which we own 296,388 rentable square feet that is currently 95% leased. One of the shopping center’s anchors, a 173,900 square foot SuperTarget, is not owned by us. Additional anchor tenants in Afton Ridge Shopping Center are Best Buy, Marshalls, PetSmart, Dick’s Sporting Goods, Stein Mart and Ashley Furniture. Afton Ridge Shopping Center is the retail component of a 260 acre master planned mixed-use development.
International Properties—Consolidated
602 Central Blvd.—Coventry, UK
602 Central Blvd. consists of a three-story office building containing approximately 49,985 rentable square feet and a surface parking lot completed in 2001. The office building is currently vacant.
Thames Valley Five—Reading, UK
Thames Valley Five consists of a four story office building and surface parking lot completed in 1998. The office building is 100% leased to Regus (Reading Thames Valley Park) Limited, a subsidiary of Regus Group PLC, one of the world’s largest providers of outsourced workplace solutions under a lease that expires in November 2023.
Albion Mills Retail Park—Wakefield, UK
Albion Mills Retail Park consists of a 55,294 square foot, two unit retail building and surface parking lot completed in 2000. The retail building is 100% leased to Wickes Building Supplies Ltd, one of the United Kingdom’s leading hardware and building supplies retailers, under a lease that expires in May 2030, and DSG Retail Ltd. (d/b/a PC World), one of the largest retailers in the United Kingdom, under a lease that expires in September 2020.
Maskew Retail Park—Peterborough, UK
Maskew Retail Park consists of a three unit retail development and surface parking lot completed in 2007. The property is 100% leased to three tenants: B&Q plc, the largest home improvement, hardware and building supply retailer in the United Kingdom, under a lease that expires in September 2027; Matalan Retail Limited, one of the largest clothing and household goods retailers in the United Kingdom, under a lease that expires in September 2022; and Argos Limited, a major household goods and general merchandise retailer, under a lease that expires in April 2023.
International Properties—Unconsolidated
CBRE Strategic Partners Asia
We have agreed to a capital commitment of up to $20,000,000 in CB Richard Ellis Strategic Partners Asia II-A, L.P., or CBRE Strategic Partners Asia. As of December 31, 2010, we had funded $15,040,000 of our capital commitment. CBRE Investors, our sponsor, formed CBRE Strategic Partners Asia to purchase, reposition, develop, hold for investment and sell institutional quality real estate and related assets in targeted markets in Asia, including China, Japan, India, South Korea, Hong Kong, Singapore and other Asia Pacific markets. The initial closing of CBRE Strategic Partners Asia was in October 2007 with additional commitments being accepted through January 2008. CBRE Strategic Partners Asia closed on January 31, 2008, with aggregate capital commitments of $394,203,000. CBRE Strategic Partners Asia has an eight-year term, which may be extended for up to two one-year periods with the approval of two-thirds of the limited partners.
As of December 31, 2010, CBRE Strategic Partners Asia, with its parallel fund CB Richard Ellis Strategic Partners Asia II, L.P., had aggregate investor commitments of approximately $394,203,000 from institutional investors including CBRE Investors and had acquired ownership interests in 10 properties, five in China and five in Japan. Two of the five original ownership interest located in China were sold in 2010. As of December 31, 2010, we owned an ownership interest of approximately 5.07% in CBRE Strategic Partners Asia. Our capital commitment is currently being pledged as collateral on borrowings of CBRE Strategic Partners Asia of which our pro rata portion of such borrowings was approximately $218,000 based on our 5.07% ownership interest in CBRE Strategic Partners Asia at December 31, 2010.
CBRE Strategic Partners Asia is managed by CB Richard Ellis Investors SP Asia II, LLC, or the Investment Manager, an affiliate of CBRE Investors. The Investment Manager is entitled to an annual management fee at an annual rate equal to 1.25% of the capital commitments (or an annual rate of 1.5% of the capital commitments for limited partners (which includes us) with aggregate capital
44
commitments of less than $50,000,000). The Investment Manager is also entitled to an acquisition fee equal to (i) for assets acquired for ground up, new development or asset repositioning involving refurbishment activity, 0.75% of CBRE Strategic Partners Asia’s pro rata share of the total acquisition cost of such investment, plus 0.375% of the amount of projected capital expenditures required for such development or refurbishment activity, or (ii) for all other assets, 0.75% of CBRE Strategic Partners Asia’s pro rata share of the total acquisition cost of such investment. Our share of investment management fees paid to the Investment Manager were approximately $282,000, $300,000 and $271,000, for the years ended December 31, 2010, 2009 and 2008, respectively. In addition our share of the acquisition fees was $104,000 for the year ended December 31, 2008, no acquisition fees were paid to the investment manager in 2010 and 2009.
We will pay our Investment Advisor investment management and acquisition fees with respect to our investment in CBRE Strategic Partners Asia. Such fees paid to our investment advisor will be reduced, but not below zero, by our proportionate share of the management and acquisition fees paid to the Investment Manager. As of December 31, 2010, we had paid no fees to our Investment Advisor relating to this investment.
CBRE Strategic Partners Asia is not obligated to redeem the interests of any of its investors, including us, prior to 2017. Except in certain limited circumstances such as transfers to affiliates or successor trustees or state agencies, we will not be permitted to sell our interest in CBRE Strategic Partners Asia without the prior written consent of the general partner, which the general partner may withhold in its sole discretion.
UK JV and European JV
On June 10, 2010, we entered into two joint ventures with subsidiaries of the Goodman Group (ASX: GMG), (“Goodman”), one of which will seek to invest in logistics focused warehouse/distribution properties in the United Kingdom, (the “UK JV”), and the other which will seek to invest in logistics focused warehouse/distribution properties in France, Belgium, the Netherlands, Luxembourg and Germany, (the “European JV”). We own an 80% interest in each joint venture and Goodman owns a 20% interest in each joint venture. The UK JV and European JV each acquired two properties on June 10, 2010.
UK JV
The shareholders’ agreement pertaining to the UK JV is by and among RT Princeton UK Holdings, LLC (our wholly-owned subsidiary), Goodman Jersey Holding Trust and Goodman Princeton Holdings (Jersey) Limited, the UK JV, for the purpose of acquiring and holding, either directly or indirectly, up to £400,000,000 in logistics focused warehouse/distribution properties. On June 10, 2010, we initially funded the UK JV with capital contributions of $26,180,000. The UK JV has acquired an initial portfolio of two properties, as described further in the table below, which were previously owned by a subsidiary of Goodman and which were purchased by the UK JV simultaneously with the closing of the UK JV.
| | | | | | | | | | | | | | | | | | | | | | |
Property and Market | | Year
Built | | Property Type | | Tenant | | Net Rentable
Sq. Feet | | | Percentage
Leased | | | Lease
Expiration | | | Approximate
Total
Acquisition Cost
(in thousands) | |
Amber Park, South Normanton UK | | 1997 | | Warehouse/Distribution | | UniDrug Distribution Group | | | 208,423 | | | | 100 | % | | | 3/2017 | | | $ | 15,642 | |
Brackmills, Northampton, UK | | 1984 | | Warehouse/Distribution | | GE Lighting Operations Limited | | | 186,618 | | | | 100 | % | | | 3/2017 | | | $ | 16,759 | |
The initial investment term of the UK JV is three years. A board of directors, comprised of members representing us and Goodman, in each case with an equal number of votes, has the responsibility for the supervision, management and major operating decisions of the UK JV and its business, except with respect to certain reserved matters which will require the unanimous approval of us and Goodman.
During the investment period, the UK JV has a right of first offer, with respect to certain logistics development or logistics investment assets considered for investment in the UK by Goodman or us. If a deadlock has arisen pertaining to a major decision regarding a specific property, either shareholder may exercise a buy-sell option in relation to the relevant property. After the initial investment period, either shareholder wishing to exit the UK JV may exercise a buy-sell option with respect to their entire interest in the UK JV.
The UK JV will pay certain fees to certain Goodman subsidiaries in connection with the services they provide to the UK JV, including but not limited to investment advisory, development management and property management services. Goodman may also be entitled to a promoted interest in the UK JV.
45
European JV
The shareholders’ agreement pertaining to the European JV is by and among RT Princeton CE Holdings, LLC (our wholly-owned subsidiary), Goodman Europe Development Trust acting by its trustee Goodman Europe Development Pty Ltd. and Goodman Princeton Holdings (LUX) S.À.R.L., the European JV, for the purpose of acquiring and holding, either directly or indirectly, up to€ 400,000,000 in logistics focused warehouse/ distribution properties. On June 10, 2010, we initially funded the European JV with capital contributions of $26,802,000. The European JV acquired an initial portfolio of two properties, Duren and Schönberg, which were previously owned by a subsidiary of Goodman and which were purchased by the European JV simultaneously with the closing of the European JV.
On October 28, 2010 we contributed an additional capital contribution of $18,672,000 to the European JV to acquire Langenbach which was also previously owned by subsidiary of Goodman.
| | | | | | | | | | | | | | | | | | | | | | |
Property and Market | | Year
Built | | Property Type | | Tenant | | Net Rentable
Sq. Feet | | | Percentage
Leased | | | Lease
Expiration | | | Approximate
Total
Acquisition Cost
(in thousands) | |
Düren, Düren Germany | | 2008 | | Warehouse/Distribution | | Metsä Tissue GmbH | | | 391,494 | | | | 100 | % | | | 01/2013 | | | $ | 16,435 | |
Schönberg, Schönberg, Germany | | 2009 | | Warehouse/Distribution | | LK Logistik GmbH | | | 453,979 | | | | 100 | % | | | 05/2017 | | | $ | 17,274 | |
Langenbach, Munich, Germany | | 2010 | | Warehouse/Distribution | | DSV Stuttgart GmbH & Co. KG | | | 225,106 | | | | 100 | % | | | 07/2015 | | | $ | 23,216 | |
The initial investment term of the European JV is three years. A board of directors, comprised of members representing us and Goodman, in each case with an equal number of votes, has the responsibility for the supervision, management and major operating decisions of the European JV and its business, except with respect to certain reserved matters which will require the unanimous approval of us and Goodman.
During the investment period, the European JV has a right of second offer (after another investment vehicle managed by Goodman) with respect to certain logistics development or logistics investment assets considered for investment by Goodman, and has a right of first offer with respect to certain logistics development or logistics investment assets considered for investment by us. If a deadlock has arisen pertaining to a major decision regarding a specific property, either shareholder may exercise a buy-sell option in relation to the relevant property. After the initial investment period, either shareholder wishing to exit the European JV may exercise a buy-sell option with respect to their entire interest in the European JV. The European JV will pay certain fees to certain Goodman subsidiaries in connection with the services they provide to the European JV, including but not limited to investment advisory, development management and property management services. Certain Goodman subsidiaries may also be entitled to a promoted interest in the European JV.
Property Type Concentration
Our property type concentrations as of December 31, 2010 are as follows (Net Rentable Square Feet and Approximate Total Acquisition Cost in thousands):
| | | | | | | | | | | | | | | | | | | | | | | | | | | | | | | | | | | | |
| | | Consolidated
Properties | | | Unconsolidated
Properties(1) | | | Consolidated &
Unconsolidated
Properties(1) | |
Property Type | | Properties | | | Net Rentable
Square Feet | | | Approximate
Total
Acquisition
Cost | | | Properties | | | Net Rentable
Square Feet | | | Approximate
Total
Acquisition
Cost | | | Properties | | | Net Rentable
Square Feet | | | Approximate
Total
Acquisition
Cost | |
Office | | | 22 | | | | 3,076 | | | $ | 767,458 | | | | 16 | | | | 2,010 | | | $ | 271,686 | | | | 38 | | | | 5,086 | | | $ | 1,039,144 | |
Warehouse/Distribution | | | 41 | | | | 8,416 | | | | 388,447 | | | | 13 | | | | 7,595 | | | | 313,052 | | | | 54 | | | | 16,011 | | | | 701,499 | |
Retail | | | 2 | | | | 201 | | | | 75,838 | | | | 1 | | | | 296 | | | | 44,530 | | | | 3 | | | | 497 | | | | 120,368 | |
Manufacturing | | | 8 | | | | 1,107 | | | | 76,817 | | | | — | | | | — | | | | — | | | | 8 | | | | 1,107 | | | | 76,817 | |
| | | | | | | | | | | | | | | | | | | | | | | | | | | | | | | | | | | | |
Total | | | 73 | | | | 12,800 | | | $ | 1,308,560 | | | | 30 | | | | 9,901 | | | $ | 629,268 | | | | 103 | | | | 22,701 | | | $ | 1,937,828 | |
| | | | | | | | | | | | | | | | | | | | | | | | | | | | | | | | | | | | |
| (1) | Number of Properties and Net Rentable Square Feet for Unconsolidated Properties are at 100%. Approximate Total Acquisition Cost for Unconsolidated Properties is at our pro rata share of effective ownership. Does not include our investment in CBRE Strategic Partners Asia. |
46
Geographic Concentration
Our geographic concentrations as of December 31, 2010 are as follows (Net Rentable Square Feet and Approximate Total Acquisition Cost in thousands):
| | | | | | | | | | | | | | | | | | | | | | | | | | | | | | | | | | | | |
| | | Consolidated
Properties | | | Unconsolidated
Properties(1) | | | Consolidated & Unconsolidated
Properties(1) | |
Domestic | | Properties | | | Net Rentable
Square Feet | | | Approximate
Total
Acquisition
Cost | | | Properties | | | Net Rentable
Square Feet | | | Approximate
Total
Acquisition
Cost | | | Properties | | | Net Rentable
Square Feet | | | Approximate
Total
Acquisition
Cost | |
Virginia | | | 3 | | | | 839 | | | $ | 186,723 | | | | — | | | | — | | | $ | — | | | | 3 | | | | 839 | | | $ | 186,723 | |
South Carolina | | | 29 | | | | 3,647 | | | | 184,324 | | | | — | | | | — | | | | — | | | | 29 | | | | 3,647 | | | | 184,324 | |
Texas | | | 6 | | | | 983 | | | | 94,459 | | | | 4 | | | | 1,256 | | | | 81,286 | | | | 10 | | | | 2,239 | | | | 175,745 | |
Florida | | | 3 | | | | 1,048 | | | | 69,650 | | | | 6 | | | | 1,340 | | | | 99,922 | | | | 9 | | | | 2,388 | | | | 169,572 | |
New Jersey | | | 3 | | | | 526 | | | | 168,450 | | | | — | | | | — | | | | — | | | | 3 | | | | 526 | | | | 168,450 | |
North Carolina | | | 5 | | | | 1,360 | | | | 66,337 | | | | 5 | | | | 683 | | | | 90,731 | | | | 10 | | | | 2,043 | | | | 157,068 | |
California | | | 7 | | | | 688 | | | | 146,917 | | | | — | | | | — | | | | — | | | | 7 | | | | 688 | | | | 146,917 | |
Ohio | | | 2 | | | | 1,110 | | | | 22,000 | | | | 3 | | | | 1,468 | | | | 80,488 | | | | 5 | | | | 2,578 | | | | 102,488 | |
Massachusetts | | | 3 | | | | 769 | | | | 94,280 | | | | — | | | | — | | | | — | | | | 3 | | | | 769 | | | | 94,280 | |
Arizona | | | 1 | | | | 217 | | | | 9,200 | | | | 2 | | | | 1,425 | | | | 72,089 | | | | 3 | | | | 1,642 | | | | 81,289 | |
Indiana | | | — | | | | — | | | | — | | | | 2 | | | | 1,831 | | | | 68,578 | | | | 2 | | | | 1,831 | | | | 68.578 | |
Minnesota | | | 2 | | | | 452 | | | | 43,759 | | | | — | | | | — | | | | — | | | | 2 | | | | 452 | | | | 43,759 | |
Illinois | | | 2 | | | | 285 | | | | 43,170 | | | | — | | | | — | | | | — | | | | 2 | | | | 285 | | | | 43,170 | |
Missouri | | | — | | | | — | | | | — | | | | 2 | | | | 252 | | | | 34,680 | | | | 2 | | | | 252 | | | | 34,680 | |
Tennessee | | | — | | | | — | | | | — | | | | 1 | | | | 180 | | | | 30,033 | | | | 1 | | | | 180 | | | | 30,033 | |
Georgia | | | 1 | | | | 122 | | | | 21,834 | | | | — | | | | — | | | | — | | | | 1 | | | | 122 | | | | 21,834 | |
Kentucky | | | 1 | | | | 189 | | | | 14,800 | | | | — | | | | — | | | | — | | | | 1 | | | | 189 | | | | 14,800 | |
Utah | | | 1 | | | | 275 | | | | 13,400 | | | | — | | | | — | | | | — | | | | 1 | | | | 275 | | | | 13,400 | |
| | | | | | | | | | | | | | | | | | | | | | | | | | | | | | | | | | | | |
Total Domestic | | | 69 | | | | 12,510 | | | | 1,179,303 | | | | 25 | | | | 8,435 | | | | 557,807 | | | | 94 | | | | 20,945 | | | | 1,737,110 | |
| | | | | | | | | |
International | | | | | | | | | | | | | | | | | | | | | | | | | | | |
United Kingdom | | | 4 | | | | 290 | | | | 129,257 | | | | 2 | | | | 395 | | | | 25,921 | | | | 6 | | | | 685 | | | | 155,178 | |
Germany | | | — | | | | — | | | | — | | | | 3 | | | | 1,071 | | | | 45,540 | | | | 3 | | | | 1,071 | | | | 45,540 | |
| | | | | | | | | | | | | | | | | | | | | | | | | | | | | | | | | | | | |
Total International | | | 4 | | | | 290 | | | | 129,257 | | | | 5 | | | | 1,466 | | | | 71,461 | | | | 9 | | | | 1,756 | | | | 200,718 | |
| | | | | | | | | | | | | | | | | | | | | | | | | | | | | | | | | | | | |
Total | | | 73 | | | | 12,800 | | | $ | 1,308,560 | | | | 30 | | | | 9,901 | | | $ | 629,268 | | | | 103 | | | | 22,701 | | | $ | 1,937,828 | |
| | | | | | | | | | | | | | | | | | | | | | | | | | | | | | | | | | | | |
| (1) | Number of Properties and Net Rentable Square Feet for Unconsolidated Properties are at 100%. Approximate Total Acquisition Cost for Unconsolidated Properties is at our pro rata share of effective ownership. Does not include our investment in CBRE Strategic Partners Asia. |
47
Significant Tenants
The following table details our largest tenants as of December 31, 2010 (in thousands):
| | | | | | | | | | | | | | | | | | | | | | | | | | | | |
| | | | | | | Consolidated Properties | | | Unconsolidated
Properties(1) | | | Consolidated &
Unconsolidated
Properties(1) | |
| | Tenant | | Primary Industry | | Net Rentable
Square Feet | | | Annualized
Base Rent | | | Net Rentable
Square Feet | | | Annualized
Base Rent | | | Net Rentable
Square Feet | | | Annualized
Base Rent | |
1 | | Raytheon Company | | Defense and Aerospace | | | 666 | | | $ | 8,902 | | | | — | | | $ | — | | | | 666 | | | $ | 8,902 | |
2 | | Amazon.com, Inc(2) | | Internet Retail | | | — | | | | — | | | | 2,056 | | | | 7,811 | | | | 2,056 | | | | 7,811 | |
3 | | Nuance | | Software | | | 201 | | | | 5,263 | | | | — | | | | — | | | | 201 | | | | 5,263 | |
4 | | Eisai | | Pharmaceutical and Health Care Related | | | 209 | | | | 4,772 | | | | — | | | | — | | | | 209 | | | | 4,772 | |
5 | | Comcast | | Telecommunications | | | 220 | | | | 4,578 | | | | — | | | | — | | | | 220 | | | | 4,578 | |
6 | | Deloitte | | Professional Service | | | 175 | | | | 4,390 | | | | — | | | | — | | | | 175 | | | | 4,390 | |
7 | | SBM Offshore(3) | | Petroleum and Mining | | | 171 | | | | 4,277 | | | | — | | | | — | | | | 171 | | | | 4,277 | |
8 | | Barr Laboratories | | Pharmaceutical and Health Care Related | | | 143 | | | | 4,061 | | | | — | | | | — | | | | 143 | | | | 4,061 | |
9 | | Eveready Battery Company | | Consumer Products | | | — | | | | — | | | | 168 | | | | 4,016 | | | | 168 | | | | 4,016 | |
10 | | Unilever(4) | | Consumer Products | | | — | | | | — | | | | 1,595 | | | | 3,864 | | | | 1,595 | | | | 3,864 | |
11 | | PPD Development | | Pharmaceutical and Health Care Related | | | — | | | | — | | | | 251 | | | | 3,616 | | | | 251 | | | | 3,616 | |
12 | | Carl Zeiss | | Pharmaceutical and Health Care Related | | | 202 | | | | 3,337 | | | | — | | | | — | | | | 202 | | | | 3,337 | |
13 | | ConAgra Foods | | Food Service and Retail | | | 742 | | | | 3,028 | | | | — | | | | — | | | | 742 | | | | 3,028 | |
14 | | American LaFrance | | Vehicle Related Manufacturing | | | 513 | | | | 2,979 | | | | — | | | | — | | | | 513 | | | | 2,979 | |
15 | | Prime Distribution Services | | Logistics and Distribution | | | — | | | | — | | | | 1,200 | | | | 2,958 | | | | 1,200 | | | | 2,958 | |
16 | | Kellogg | | Consumer Products | | | — | | | | — | | | | 1,142 | | | | 2,817 | | | | 1,142 | | | | 2,817 | |
17 | | B&Q | | Home Furnishings/Home Improvement | | | 104 | | | | 2,601 | | | | — | | | | — | | | | 104 | | | | 2,601 | |
18 | | Syngenta Seed | | Agriculture | | | 116 | | | | 2,472 | | | | — | | | | — | | | | 116 | | | | 2,472 | |
19 | | REMEC | | Defense and Aerospace | | | 133 | | | | 2,431 | | | | — | | | | — | | | | 133 | | | | 2,431 | |
20 | | Time Warner | | Telecommunications | | | 134 | | | | 2,412 | | | | — | | | | — | | | | 134 | | | | 2,412 | |
21 | | Dr. Pepper | | Food Service and Retail | | | 602 | | | | 2,388 | | | | — | | | | — | | | | 602 | | | | 2,388 | |
22 | | Verizon Wireless(5) | | Telecommunications | | | — | | | | — | | | | 180 | | | | 2,246 | | | | 180 | | | | 2,246 | |
23 | | US General Services Administration | | Government | | | 72 | | | | 2,197 | | | | — | | | | — | | | | 72 | | | | 2,197 | |
24 | | Royal Caribbean | | Travel/Leisure | | | — | | | | — | | | | 129 | | | | 2,139 | | | | 129 | | | | 2,139 | |
25 | | Kaplan(6) | | Education | | | 125 | | | | 2,117 | | | | — | | | | — | | | | 125 | | | | 2,117 | |
26 | | American Home Mortgage | | Financial Service | | | 183 | | | | 2,024 | | | | — | | | | — | | | | 183 | | | | 2,024 | |
27 | | Best Buy | | Specialty Retail | | | 238 | | | | 1,657 | | | | 30 | | | | 317 | | | | 268 | | | | 1,974 | |
28 | | Markel Midwest, Inc. | | Financial Service | | | 100 | | | | 1,882 | | | | — | | | | — | | | | 100 | | | | 1,882 | |
29 | | Lockheed Martin | | Defense and Aerospace | | | 72 | | | | 1,847 | | | | — | | | | — | | | | 72 | | | | 1,847 | |
30 | | Disney | | Travel/Leisure | | | — | | | | — | | | | 101 | | | | 1,800 | | | | 101 | | | | 1,800 | |
31 | | Mercy Health Partners of SW Ohio | | Pharmaceutical and Health Care Related | | | — | | | | — | | | | 111 | | | | 1,793 | | | | 111 | | | | 1,793 | |
32 | | ABB, Inc. | | Other Manufacturing | | | — | | | | — | | | | 91 | | | | 1,641 | | | | 91 | | | | 1,641 | |
33 | | Devry | | Education | | | — | | | | — | | | | 94 | | | | 1,548 | | | | 94 | | | | 1,548 | |
34 | | DSV Stuttgart Gmbh & Co KG | | Logistics and Distribution | | | — | | | | — | | | | 225 | | | | 1,431 | | | | 225 | | | | 1,431 | |
35 | | Women’s Apparel Group, LLC | | Internet Retail | | | 330 | | | | 1,426 | | | | — | | | | — | | | | 330 | | | | 1,426 | |
36 | | Regus | | Executive Office Suites | | | 86 | | | | 1,424 | | | | — | | | | — | | | | 86 | | | | 1,424 | |
37 | | McLane Foodservice, Inc. | | Logistics and Distribution | | | 189 | | | | 1,381 | | | | — | | | | — | | | | 189 | | | | 1,381 | |
38 | | Walgreen | | Pharmaceutical and Health Care Related | | | 335 | | | | 1,378 | | | | — | | | | — | | | | 335 | | | | 1,378 | |
39 | | LK Logistik Gmbh | | Logistics and Distribution | | | — | | | | — | | | | 454 | | | | 1,335 | | | | 454 | | | | 1,335 | |
40 | | Florida Power | | Utilities | | | — | | | | — | | | | 108 | | | | 1,280 | | | | 108 | | | | 1,280 | |
| | Other (138 tenants) | | | 4,834 | | | | 19,731 | | | | 1,907 | | | | 15,838 | | | | 6,741 | | | | 35,569 | |
| | | | | | | | | | | | | | | | | | | | | | | | | | | | |
| | | | | | | 10,895 | | | $ | 94,955 | | | | 9,842 | | | $ | 56,450 | | | | 20,737 | | | $ | 151,405 | |
| | | | | | | | | | | | | | | | | | | | | | | | | | | | |
| (1) | Net Rentable Square Feet for Unconsolidated Properties is at 100%. Annualized Base Rent for Unconsolidated Properties is at our pro rata share of effective ownership. Does not include our investment in CBRE Strategic Partners Asia. |
| (2) | Our tenants are Amazon.com.azdc, Inc., in our Buckeye Logistics Center and Goodyear Crossing Park II properties, and Amazon.com.indc, LLC, in our AllPoints at Anson Bldg. 1 property, which are all wholly-owned subsidiaries of Amazon.com. |
| (3) | Our tenant is Atlantic Offshore Ltd., a wholly-owned subsidiary of SBM Offshore. |
| (4) | Our tenant is CONOPCO, Inc., a wholly-owned subsidiary of Unilever. |
| (5) | Verizon Wireless is the d/b/a for Cellco Partnership. |
| (6) | Our tenant is Iowa College Acquisitions Corp., an operating subsidiary of Kaplan, Inc. The lease is guaranteed by Kaplan Inc. |
48
Tenant Industries
Our tenants operate across a wide range of industries. The following table details our tenant-industry concentrations as of December 31, 2010 (in thousands):
| | | | | | | | | | | | | | | | | | | | | | | | |
| | | Consolidated Properties | | | Unconsolidated
Properties(1) | | | Consolidated &
Unconsolidated
Properties(1) | |
Primary Tenant Industry Category | | Net Rentable
Square Feet | | | Annualized
Base Rent | | | Net Rentable
Square Feet | | | Annualized
Base Rent | | | Net Rentable
Square Feet | | | Annualized
Base Rent | |
Pharmaceutical and Health Care Related | | | 905 | | | $ | 13,769 | | | | 594 | | | $ | 6,815 | | | | 1,499 | | | $ | 20,584 | |
Consumer Products | | | 164 | | | | 913 | | | | 3,493 | | | | 13,371 | | | | 3,657 | | | | 14,284 | |
Defense and Aerospace | | | 901 | | | | 13,912 | | | | — | | | | — | | | | 901 | | | | 13,912 | |
Logistics and Distribution | | | 1,671 | | | | 5,862 | | | | 2,023 | | | | 6,472 | | | | 3,694 | | | | 12,334 | |
Telecommunications | | | 673 | | | | 8,279 | | | | 182 | | | | 2,279 | | | | 855 | | | | 10,558 | |
Internet Retailer | | | 330 | | | | 1,426 | | | | 2,056 | | | | 7,811 | | | | 2,386 | | | | 9,237 | |
Food Service and Retail | | | 1,485 | | | | 6,267 | | | | 16 | | | | 308 | | | | 1,501 | | | | 6,575 | |
Financial Services | | | 281 | | | | 3,458 | | | | 235 | | | | 2,720 | | | | 516 | | | | 6,178 | |
Professional Services | | | 240 | | | | 5,039 | | | | 41 | | | | 535 | | | | 281 | | | | 5,574 | |
Home Furnishings/Home Improvement | | | 462 | | | | 4,480 | | | | 62 | | | | 1,019 | | | | 524 | | | | 5,499 | |
Software | | | 201 | | | | 5,263 | | | | — | | | | — | | | | 201 | | | | 5,263 | |
Other Manufacturing | | | 909 | | | | 3,134 | | | | 116 | | | | 1,938 | | | | 1,025 | | | | 5,072 | |
Petroleum and Mining | | | 171 | | | | 4,277 | | | | 55 | | | | 646 | | | | 226 | | | | 4,923 | |
Business Services | | | 747 | | | | 2,835 | | | | 135 | | | | 1,766 | | | | 882 | | | | 4,601 | |
Vehicle Related Manufacturing | | | 828 | | | | 4,537 | | | | — | | | | — | | | | 828 | | | | 4,537 | |
Specialty Retail | | | 391 | | | | 3,150 | | | | 111 | | | | 1,178 | | | | 502 | | | | 4,328 | |
Travel and Leisure | | | — | | | | — | | | | 229 | | | | 3,939 | | | | 229 | | | | 3,939 | |
Education | | | 125 | | | | 2,117 | | | | 94 | | | | 1,548 | | | | 219 | | | | 3,665 | |
Agriculture | | | 116 | | | | 2,472 | | | | — | | | | — | | | | 116 | | | | 2,472 | |
Government | | | 187 | | | | 2,217 | | | | — | | | | — | | | | 187 | | | | 2,217 | |
Apparel Retail | | | — | | | | — | | | | 227 | | | | 1,944 | | | | 227 | | | | 1,944 | |
Utilities | | | — | | | | — | | | | 127 | | | | 1,516 | | | | 127 | | | | 1,516 | |
Executive Office Suites | | | 86 | | | | 1,424 | | | | — | | | | — | | | | 86 | | | | 1,424 | |
Other Retail | | | 22 | | | | 124 | | | | 46 | | | | 645 | | | | 68 | | | | 769 | |
| | | | | | | | | | | | | | | | | | | | | | | | |
Total | | | 10,895 | | | $ | 94,955 | | | | 9,842 | | | $ | 56,450 | | | | 20,737 | | | $ | 151,405 | |
| | | | | | | | | | | | | | | | | | | | | | | | |
| (1) | Net Rentable Square Feet for Unconsolidated Properties is at 100%. Annualized Base Rent for Unconsolidated Properties is at our pro rata share of effective ownership. Does not include our investment in CBRE Strategic Partners Asia. |
Tenant Lease Expirations
The following table sets forth a schedule of expiring leases for our consolidated and unconsolidated properties as of December 31, 2010 (in thousands):
| | | | | | | | | | | | | | | | | | | | | | | | |
| | | Consolidated Properties | | | Unconsolidated
Properties(1) | | | Consolidated &
Unconsolidated
Properties(1) | |
| | | Expiring
Net Rentable
Square Feet | | | Expiring
Base Rent | | | Expiring
Net Rentable
Square Feet | | | Expiring
Base Rent | | | Expiring
Net Rentable
Square Feet | | | Expiring
Base Rent | |
2011 | | | 694 | | | | 2,508 | | | | 14 | | | | 234 | | | | 708 | | | | 2,742 | |
2012 | | | 823 | | | | 10,514 | | | | 61 | | | | 823 | | | | 884 | | | | 11,337 | |
2013 | | | 1,603 | | | | 8,551 | | | | 460 | | | | 2,537 | | | | 2,063 | | | | 11,088 | |
2014 | | | 581 | | | | 3,563 | | | | 74 | | | | 1,021 | | | | 655 | | | | 4,584 | |
2015 | | | 1,821 | | | | 6,661 | | | | 238 | | | | 1,638 | | | | 2,059 | | | | 8,299 | |
2016 | | | 306 | | | | 1,711 | | | | 442 | | | | 6,855 | | | | 748 | | | | 8,566 | |
2017 | | | 267 | | | | 3,832 | | | | 1,180 | | | | 8,969 | | | | 1,447 | | | | 12,801 | |
2018 | | | 743 | | | | 8,510 | | | | 3,174 | | | | 14,152 | | | | 3,917 | | | | 22,662 | |
2019 | | | 1,697 | | | | 13,239 | | | | 3,424 | | | | 13,157 | | | | 5,121 | | | | 26,396 | |
2020 | | | 600 | | | | 12,949 | | | | — | | | | | | | | 600 | | | | 12,949 | |
Thereafter | | | 1,760 | | | | 34,973 | | | | 775 | | | | 13,414 | | | | 2,535 | | | | 48,387 | |
| | | | | | | | | | | | | | | | | | | | | | | | |
Total | | | 10,895 | | | $ | 107,011 | | | | 9,842 | | | $ | 62,800 | | | | 20,737 | | | $ | 169,811 | |
| | | | | | | | | | | | | | | | | | | | | | | | |
Weighted Average Expiration (years) | | | | | | | 8.20 | | | | | | | | 8.27 | | | | | | | | 8.23 | |
49
| (1) | Expiring Net Rentable Square Feet for Unconsolidated Properties is at 100%. Expiring Base Rent for Unconsolidated Properties is at our pro rata share of effective ownership. Does not include our investment in CBRE Strategic Partners Asia. |
Property Portfolio Size
Our portfolio size at the end of each quarter since commencement of our initial public offering through December 31, 2010 is as follows (Net Rentable Square Feet and Approximate Total Acquisition Cost in thousands):
| | | | | | | | | | | | | | | | | | | | | | | | | | | | | | | | | | | | |
| | | Consolidated Properties | | | Unconsolidated Properties(1) | | | Consolidated &
Unconsolidated
Properties(1) | |
Cumulative Property Portfolio as of: | | Properties | | | Net Rentable
Square Feet | | | Approximate
Total
Acquisition
Cost | | | Properties | | | Net Rentable
Square Feet | | | Approximate
Total
Acquisition
Cost | | | Properties | | | Net Rentable
Square Feet | | | Approximate
Total
Acquisition
Cost | |
9/30/2006 | | | 9 | | | | 878 | | | $ | 86,644 | | | | — | | | | — | | | $ | — | | | | 9 | | | | 878 | | | $ | 86,644 | |
12/31/2006 | | | 9 | | | | 878 | | | | 86,644 | | | | — | | | | — | | | | — | | | | 9 | | | | 878 | | | | 86,644 | |
3/31/2007 | | | 9 | | | | 878 | | | | 86,644 | | | | — | | | | — | | | | — | | | | 9 | | | | 878 | | | | 86,644 | |
6/30/2007 | | | 10 | | | | 928 | | | | 110,491 | | | | — | | | | — | | | | — | | | | 10 | | | | 928 | | | | 110,491 | |
9/30/2007 | | | 42 | | | | 5,439 | | | | 348,456 | | | | — | | | | — | | | | — | | | | 42 | | | | 5,439 | | | | 348,456 | |
12/31/2007 | | | 44 | | | | 5,576 | | | | 353,594 | | | | — | | | | — | | | | — | | | | 44 | | | | 5,576 | | | | 353,594 | |
3/31/2008 | | | 47 | | | | 6,257 | | | | 426,856 | | | | — | | | | — | | | | — | | | | 47 | | | | 6,257 | | | | 426,856 | |
6/30/2008 | | | 47 | | | | 6,257 | | | | 426,856 | | | | 1 | | | | 605 | | | | 35,636 | | | | 48 | | | | 6,862 | | | | 462,492 | |
9/30/2008 | | | 49 | | | | 6,483 | | | | 486,777 | | | | 6 | | | | 3,307 | | | | 193,773 | | | | 55 | | | | 9,790 | | | | 680,550 | |
12/31/2008 | | | 52 | | | | 6,771 | | | | 582,682 | | | | 8 | | | | 5,649 | | | | 273,205 | | | | 60 | | | | 12,420 | | | | 855,887 | |
3/31/2009 | | | 52 | | | | 6,771 | | | | 582,717 | | | | 8 | | | | 5,649 | | | | 273,130 | | | | 60 | | | | 12,420 | | | | 855,847 | |
6/30/2009 | | | 53 | | | | 7,106 | | | | 598,103 | | | | 11 | | | | 5,976 | | | | 305,308 | | | | 64 | | | | 13,082 | | | | 903,411 | |
9/30/2009 | | | 57 | | | | 7,805 | | | | 719,822 | | | | 11 | | | | 5,976 | | | | 305,202 | | | | 68 | | | | 13,781 | | | | 1,025,024 | |
12/31/2009 | | | 60 | | | | 8,630 | | | | 791,314 | | | | 13 | | | | 6,904 | | | | 356,158 | | | | 73 | | | | 15,534 | | | | 1,147,472 | |
3/31/2010 | | | 58 | | | | 8,407 | | | | 748,835 | | | | 18 | | | | 7,392 | | | | 418,818 | | | | 76 | | | | 15,799 | | | | 1,167,653 | |
6/30/2010 | | | 62 | | | | 9,086 | | | | 916,210 | | | | 22 | | | | 8,633 | | | | 471,615 | | | | 84 | | | | 17,719 | | | | 1,387,825 | |
9/30/2010 | | | 63 | | | | 9,295 | | | | 983,810 | | | | 22 | | | | 8,633 | | | | 471,615 | | | | 85 | | | | 17,928 | | | | 1,455,425 | |
12/31/2010 | | | 73 | | | | 12,800 | | | | 1,308,560 | | | | 30 | | | | 9,901 | | | | 629,268 | | | | 103 | | | | 22,701 | | | | 1,937,828 | |
| (1) | Net Rentable Square Feet for unconsolidated properties is at 100%. Approximate Total Acquisition Cost is at our pro rata share of effective ownership and does not include our investment in CBRE Strategic Partners Asia. |
50
Rental Operations
Our reportable segments consist of three types of commercial real estate properties for which our management internally evaluates operating performance and financial results: the Domestic Industrial Properties, Domestic Office Properties and International Office/Retail Properties. We evaluate the performance of our segments based on net operating income, defined as: rental income and tenant reimbursements less property and related expenses (operating and maintenance, management fees and real estate taxes) and excludes other non-property income and expenses, interest expense, depreciation and amortization, and our company-level general and administrative expenses. The following tables compare the net operating income for the years ended December 31, 2010, 2009 and 2008 (in thousands):
| | | | | | | | | | | | |
| | | Year Ended December 31, | |
| | | 2010 | | | 2009 | | | 2008 | |
Domestic Industrial Properties | | | | | | | | | | | | |
Revenues: | | | | | | | | | | | | |
Rental | | $ | 23,903 | | | $ | 19,473 | | | $ | 20,350 | |
Tenant Reimbursements | | | 5,481 | | | | 5,057 | | | | 4,323 | |
| | | | | | | | | | | | |
Total Revenues | | | 29,384 | | | | 24,530 | | | | 24,673 | |
| | | | | | | | | | | | |
Property and Related Expenses: | | | | | | | | | | | | |
Operating and Maintenance | | | 1,546 | | | | 1,297 | | | | 1,146 | |
General and Administrative | | | 257 | | | | 312 | | | | 147 | |
Property Management Fee to Related Party | | | 289 | | | | 346 | | | | 376 | |
Property Taxes | | | 5,735 | | | | 4,916 | | | | 4,054 | |
| | | | | | | | | | | | |
Total Expenses | | | 7,827 | | | | 6,871 | | | | 5,723 | |
| | | | | | | | | | | | |
Net Operating Income | | | 21,557 | | | | 17,659 | | | | 18,950 | |
| | | | | | | | | | | | |
Domestic Office Properties | | | | | | | | | | | | |
Revenues: | | | | | | | | | | | | |
Rental | | | 38,792 | | | | 19,430 | | | | 8,429 | |
Tenant Reimbursements | | | 8,294 | | | | 3,974 | | | | 2,290 | |
| | | | | | | | | | | | |
Total Revenues | | | 47,086 | | | | 23,404 | | | | 10,719 | |
Property and Related Expenses: | | | | | | | | | | | | |
Operating and Maintenance | | | 6,142 | | | | 3,395 | | | | 1,974 | |
General and Administrative | | | 433 | | | | 174 | | | | 61 | |
Property Management Fee to Related Party | | | 370 | | | | 139 | | | | 94 | |
Property Taxes | | | 5,230 | | | | 2,708 | | | | 1,425 | |
| | | | | | | | | | | | |
Total Expenses | | | 12,175 | | | | 6,416 | | | | 3,554 | |
| | | | | | | | | | | | |
Net Operating Income | | | 34,911 | | | | 16,988 | | | | 7,165 | |
| | | | | | | | | | | | |
International Office/Retail Properties | | | | | | | | | | | | |
Revenues: | | | | | | | | | | | | |
Rental | | | 6,678 | | | | 8,120 | | | | 4,617 | |
Tenant Reimbursements | | | 391 | | | | 270 | | | | 140 | |
| | | | | | | | | | | | |
Total Revenues | | | 7,069 | | | | 8,390 | | | | 4,757 | |
| | | | | | | | | | | | |
Property and Related Expenses: | | | | | | | | | | | | |
Operating and Maintenance | | | 930 | | | | 282 | | | | 128 | |
General and Administrative | | | 213 | | | | 142 | | | | 82 | |
Property Management Fee to Related Party | | | 289 | | | | 171 | | | | 21 | |
| | | | | | | | | | | | |
Total Expenses | | | 1,432 | | | | 595 | | | | 231 | |
| | | | | | | | | | | | |
Net Operating Income | | | 5,637 | | | | 7,795 | | | | 4,526 | |
| | | | | | | | | | | | |
Reconciliation to Consolidated Net Loss | | | | | | | | | | | | |
Total Segment Net Operating Income | | | 62,105 | | | | 42,442 | | | | 30,641 | |
Interest Expense | | | 14,881 | | | | 11,378 | | | | 10,323 | |
General and Administrative | | | 4,623 | | | | 3,618 | | | | 3,030 | |
Investment Management Fee to Related Party | | | 11,595 | | | | 7,803 | | | | 3,964 | |
Acquisition Expenses | | | 17,531 | | | | 5,832 | | | | — | |
Depreciation and Amortization | | | 32,125 | | | | 25,093 | | | | 17,171 | |
Loss on Impairment | | | — | | | | 9,160 | | | | — | |
| | | | | | | | | | | | |
| | | (18,650 | ) | | | (20,442 | ) | | | (3,847 | ) |
| | | | | | | | | | | | |
51
| | | | | | | | | | | | |
| | | Year Ended December 31, | |
| | | 2010 | | | 2009 | | | 2008 | |
Other Income and Expenses | | | | | | | | | | | | |
Interest and Other Income | | | 1,260 | | | | 344 | | | | 2,039 | |
Net Settlement (Payments) Receipts on Interest Rate Swaps | | | (1,096 | ) | | | (660 | ) | | | 65 | |
Gain (Loss) on Interest Rate Swaps and Cap | | | 23 | | | | 89 | | | | (1,496 | ) |
(Loss) Gain on Note Payable at Fair Value | | | (118 | ) | | | (807 | ) | | | 1,168 | |
Loss on Early Extinguishment of Debt | | | (72 | ) | | | — | | | | — | |
Loss on Transfer of Held for Sale Real Estate to Continuing Operations | | | — | | | | — | | | | (3,451 | ) |
| | | | | | | | | | | | |
Loss Before (Provision) Benefit for Income Taxes and Equity in Income (Loss) of Unconsolidated Entities | | | (18,653 | ) | | | (21,476 | ) | | | (5,522 | ) |
| | | | | | | | | | | | |
(Provision) Benefit for Income Taxes | | | (296 | ) | | | (169 | ) | | | 82 | |
Equity in Income (Loss) of Unconsolidated Entities | | | 8,838 | | | | 2,743 | | | | (1,242 | ) |
| | | | | | | | | | | | |
Net Loss from Continuing Operations | | | (10,111 | ) | | | (18,902 | ) | | | (6,682 | ) |
Loss from Discontinued Operations | | | (507 | ) | | | — | | | | — | |
| | | | | | | | | | | | |
Net Loss | | | (10,618 | ) | | | (18,902 | ) | | | (6,682 | ) |
| | | | | | | | | | | | |
Net Loss Attributable to Non-Controlling Operating Partnership Units | | | 18 | | | | 54 | | | | 26 | |
| | | | | | | | | | | | |
Net Loss Attributable to CB Richard Ellis Realty Trust Shareholders | | $ | (10,600 | ) | | $ | (18,848 | ) | | $ | (6,656 | ) |
| | | | | | | | | | | | |
| (1) | Total Segment Net Operating Income is a Non-GAAP financial measure which may be useful as a supplemental measure for evaluating the relationship of each reporting segment to the combined total. This measure should not be viewed as an alternative measure of operating performance to our U.S. GAAP presentations provided. Segment “Net Operating Income” is defined as operating revenues (rental income, tenant reimbursements and other property income) less property and related expenses (property expenses, including real estate taxes) before depreciation and amortization expense. The Net Operating Income segment information presented consists of the same Net Operating Income segment information disclosed in Note 10 to our consolidated financial statements in this Annual Report on Form 10-K. |
Insurance Coverage on Properties
We carry comprehensive general liability coverage and umbrella liability coverage on all of our properties with limits of liability which we deem adequate. Similarly, we are insured against the risk of direct physical damage in amounts we believe to be adequate to reimburse us on a replacement basis for costs incurred to repair or rebuild each property, including loss of rental income during the reconstruction period. The cost of such insurance is passed through to tenants whenever possible.
52
Tax Basis and Real Estate Tax
The following table provides information regarding our tax basis and real estate taxes at each of our consolidated properties as of December 31, 2010:
| | | | | | | | | | |
Location | | Property | | Original Income
Tax Basis | | | 2010 Annualized Real
Estate Taxes | |
San Diego, CA | | REMEC Corporate Campus | | $ | 26,667,000 | | | $ | 316,000 | |
Taunton, MA | | 300 Constitution Drive | | | 19,805,000 | | | | 306,000 | |
Alpharetta, GA | | Deerfield Commons I | | | 19,572,000 | | | | 291,000 | |
Alpharetta, GA | | Deerfield Commons II | | | 2,262,000 | | | | 52,000 | |
Allen, TX | | 505 Century | | | 6,095,000 | | | | 102,000 | |
Richardson, TX | | 631 International | | | 5,407,000 | | | | 95,000 | |
Richardson, TX | | 660 North Dorothy | | | 6,836,000 | | | | 99,000 | |
Bolingbrook, IL | | Bolingbrook Point III | | | 18,170,000 | | | | 218,000 | |
Spartanburg, SC | | Cherokee Corporate Park | | | 3,775,000 | | | | 38,000 | |
Spartanburg, SC | | Community Cash Complex 1-5 | | | 7,987,000 | | | | 147,000 | |
Spartanburg, SC | | Fairforest Bldgs 1-4 | | | 19,753,000 | | | | 363,000 | |
Spartanburg, SC | | Fairforest Bldg. 5 | | | 16,968,000 | | | | 267,000 | |
Spartanburg, SC | | Fairforest Bldg. 6 | | | 7,469,000 | | | | 163,000 | |
Spartanburg, SC | | Fairforest Bldg. 7 | | | 5,626,000 | | | | 123,000 | |
Spartanburg, SC | | Greenville/Spartanburg Ind. Pk | | | 3,388,000 | | | | 70,000 | |
Spartanburg, SC | | Highway 290 Commerce Pk Bldgs | | | 20,083,000 | | | | 323,000 | |
Spartanburg, SC | | HJ Park Bldg. 1 | | | 4,216,000 | | | | 107,000 | |
Charleston, SC | | Jedburg Commerce Park | | | 41,991,000 | | | | 634,000 | |
Charlotte, NC | | Kings Mountain I | | | 5,497,000 | | | | 35,000 | |
Charlotte, NC | | Kings Mountain II | | | 11,311,000 | | | | 55,000 | |
Charleston, SC | | Mount Holly Building | | | 6,208,000 | | | | 54,000 | |
Charleston, SC | | North Rhett I | | | 10,302,000 | | | | 140,000 | |
Charleston, SC | | North Rhett II | | | 7,073,000 | | | | 67,000 | |
Charleston, SC | | North Rhett III | | | 4,812,000 | | | | 55,000 | |
Charleston, SC | | North Rhett IV | | | 17,060,000 | | | | 226,000 | |
Charleston, SC | | Orangeburg Park Bldg. | | | 5,474,000 | | | | 128,000 | |
Spartanburg, SC | | Orchard Business Park 1 & 2 | | | 2,139,000 | | | | 46,000 | |
Winston-Salem, NC | | Union Cross Bldg. I | | | 6,585,000 | | | | 179,000 | |
Winston-Salem, NC | | Union Cross Bldg. II | | | 17,216,000 | | | | 173,000 | |
Lewisville, TX | | Lakeside Office Center | | | 17,994,000 | | | | 277,000 | |
Charlotte, NC | | Kings Mountain III | | | 25,728,000 | | | | 73,000 | |
Houston, TX | | Enclave on the Lake | | | 37,827,000 | | | | 577,000 | |
Washington, DC | | Avion Midrise III | | | 21,111,000 | | | | 217,000 | |
Washington, DC | | Avion Midrise IV | | | 21,112,000 | | | | 217,000 | |
Minneapolis, MN | | 13201 Wilfred | | | 15,340,000 | | | | 530,000 | |
East Bay, CA | | 3011, 3055 & 3077 Comcast Place | | | 49,000,000 | | | | 775,000 | |
Boston, MA | | 140 Depot Street | | | 18,950,000 | | | | 254,000 | |
Orlando, FL | | 12650 Ingenuity Drive | | | 25,350,000 | | | | 349,000 | |
Minneapolis, MN | | Crest Ridge Corporate Center I | | | 28,419,000 | | | | 285,000 | |
Jacksonville, FL | | West Point Trade Center | | | 29,000,000 | | | | 483,000 | |
East Bay, CA | | 5160 Hacienda Dr | | | 38,500,000 | | | | 464,000 | |
San Diego, CA | | 10450 Pacific Center Ct | | | 32,750,000 | | | | 315,000 | |
Metro New York, NY | | 225 Summit | | | 40,600,000 | | | | 457,000 | |
Boston, MA | | One Wayside | | | 55,525,000 | | | | 544,000 | |
Metro New York, NY | | 100 Tice Blvd | | | 67,600,000 | | | | 609,000 | |
Chicago, IL | | Ten Parkway North | | | 25,000,000 | | | | 140,000 | |
Washington, DC | | Pacific Corporate Park | | | 144,500,000 | | | | 1,675,000 | |
Newark, NJ | | 100 Kimball Drive | | | 60,250,000 | | | | 777,000 | |
Dallas, TX | | 4701 Gold Spike Drive | | | 20,300,000 | | | | 315,000 | |
Cincinnati, OH | | 1985 International Way | | | 14,800,000 | | | | 130,000 | |
Columbus, OH | | Rickenbacker II | | | 8,600,000 | | | | 56,000 | |
53
| | | | | | | | | | |
Location | | Property | | Original Income
Tax Basis | | | 2010 Annualized Real
Estate Taxes | |
Columbus, OH | | Rickenbacker III | | | 13,400,000 | | | | 90,000 | |
Salt Lake City, UT | | Summit Distribution Center | | | 13,400,000 | | | | 147,000 | |
Jacksonville, FL | | 3660 Deerpark Boulevard | | | 15,300,000 | | | | 170,000 | |
Phoenix, AZ | | Tolleson Commerce Park II | | | 9,200,000 | | | | 235,000 | |
Coventry, UK | | 602 Central Blvd. | | | 23,847,000 | | | | N/A | |
Reading, UK | | Thames Valley Five | | | 29,572,000 | | | | N/A | |
Wakefield, UK | | Albion Mills Retail Park | | | 22,098,000 | | | | N/A | |
Peterborough, UK | | Maskew Retail Park | | | 53,740,000 | | | | N/A | |
| | | | | | | | | | |
Total | | | | $ | 1,308,560,000 | | | $ | 15,033,000 | |
| | | | | | | | | | |
| (1) | This amount is based on the pre-construction completion assessed value of this property and a forthcoming post-construction completion date assessment is likely to increase our future annualized real-estate taxes on this property. |
Regulations
Our properties, as well as any other properties that we may acquire in the future, are subject to various international, U.S. federal, state and local laws, ordinances and regulations, including, among other things, zoning regulations, land use controls, environmental controls relating to air and water quality, noise pollution and indirect environmental impacts such as increased motor vehicle activity. Our properties are subject to regulation under federal laws, such as the ADA, under which all public accommodations must meet federal requirements related to access and use by disabled persons, and state and local laws addressing earthquake, fire and life safety requirements. Although we believe that our properties substantially comply with present requirements under applicable governmental regulations, none of our properties have been audited or investigated for compliance by any regulatory agency. If we were not in compliance with material provisions of the ADA or other regulations affecting our properties, we might be required to take remedial action, which could include making modifications or renovations to properties. Federal, state or local governments may also enact future laws and regulations that could require us to make significant modifications or renovations to our properties. If we were to incur substantial costs to comply with the ADA or any other regulations, our financial condition, results of operations, cash flow, the quoted trading prices of our securities and ability to satisfy our debt service obligations and to pay distributions to shareholders could be adversely affected. We believe that we have all permits and approvals necessary under current law to operate our properties.
Recent Developments
From January 1, 2011 through March 17, 2011, we received gross proceeds from our public offering of approximately $80,515,423 from the sale of 8,105,529 common shares.
On January 20, 2011 and February 14, 2011, we paid down the Amended Wells Fargo Credit Facility loan payable by $20,000,000 and $15,000,000, respectively. On March 30, 2011, an additional $30,000,000 was drawn down on the Amended Wells Fargo Credit Facility.
On January 31, 2011, we were notified that the investment commitment period of CBRE Strategic Partners Asia was extended for one year from January 31, 2011 to January 31, 2012.
On February 8, 2011, we entered into five secured term loans totaling $37,000,000 with ING USA Annuity and Life Insurance Company secured by the following properties: 4701 Gold Spike Road, $10,650,000, Summit Distribution Center, $6,700,000, Tolleson Commerce Park II, $4,600,000, 3660 Deerpark Blvd., $7,650,000 and 1985 International Way, $7,400,000. The loans bear interest at a fixed rate of 4.45% and mature on February 8, 2018.
On February 22, 2011, we entered into a lease for the Kings Mountain III property, a 541,910 square foot warehouse/distribution building located in Charlotte, North Carolina for a 10 year term.
On February 28, 2011, we entered into a $33,000,000 secured term loan with TD Bank secured by the 100 Kimball Drive property. Upon closing the 100 Kimball Drive loan, we simultaneously entered into an interest rate swap agreement with TD Bank to effectively fix the interest rate on the entire outstanding loan amount to 5.25% for its 10 year term.
54
On March 24, 2011, the Duke joint venture acquired fee interests in the Remaining Properties, thus completing the acquisition of the Office Portfolio, as described further below.
| | | | | | | | | | | | | | | | | | | | | | | | | | | | | | | | |
Property and Market | | Address | | Year
Built | | | Tenant(1) | | Net
Rentable
Square
Feet | | | Lease
Expiration | | | Approximate
Purchase
Price(2) | | | Pro Rata
Share of
Approximate
Purchase
Price(3) | | | Percentage
Leased | | | Acquisition
Fee(4) | |
Norman Pointe I /
Minneapolis, MN | | 5601 Green Valley Drive Bloomington, MN | | | 2000 | | | NCS Pearson, Inc.(5) | | | 212,722 | | | | 02/2017 | | | $ | 42,600,000 | | | $ | 34,080,000 | | | | 100 | % | | $ | 511,200 | |
| | | | | | | | | |
Norman Pointe II /
Minneapolis, MN | | 5600 West American Boulevard, Bloomington, MN | | | 2007 | | | General Services Administration(6); Hartford Fire Insurance Company(7) | | | 324,296 | | |
| 02/2016;
06/2013 |
| | $ | 46,900,000 | | | $ | 37,520,000 | | | | 100 | % | | $ | 562,800 | |
| | | | | | | | | |
The Landings I /
Cincinnati, Ohio | | 9997 Carver Road, Blue Ash, OH | | | 2006 | | | Citicorp North America(8) | | | 175,695 | | | | 01/2022 | | | $ | 29,659,500 | | | $ | 23,727,600 | | | | 100 | % | | $ | 355,914 | |
| | | | | | | | | |
The Landings II /
Cincinnati, Ohio | | 9987 Carver Road, Blue Ash, OH | | | 2007 | | | — | | | 175,076 | | | | — | | | $ | 26,160,500 | | | $ | 20,928,400 | | | | 96.1 | % | | $ | 313,926 | |
| | | | | | | | | |
One Easton Oval /
Columbus, Ohio | | One Easton Oval, Columbus, Ohio | | | 1997 | | | — | | | 125,031 | | | | — | | | $ | 11,911,000 | | | $ | 9,528,800 | | | | 89.4 | % | | $ | 142,932 | |
| | | | | | | | | |
Two Easton Oval /
Columbus, Ohio | | Two Easton Oval, Columbus, Ohio | | | 1995 | | | — | | | 128,674 | | | | — | | | $ | 12,744,000 | | | $ | 10,195,200 | | | | 74.6 | % | | $ | 152,928 | |
| | | | | | | | | |
Weston Pointe I /
Ft. Lauderdale, Florida | | 2400 North Commerce Parkway, Weston, FL | | | 1999 | | | — | | | 97,579 | | | | — | | | $ | 19,384,250 | | | $ | 15,507,400 | | | | 87.1 | % | | $ | 232,611 | |
| | | | | | | | | |
Weston Pointe II /
Ft. Lauderdale, Florida | | 2200 North Commerce Parkway, Weston, FL | | | 2000 | | | — | | | 97,180 | | | | — | | | $ | 23,375,950 | | | $ | 18,700,760 | | | | 100 | % | | $ | 280,511 | |
| | | | | | | | | |
Weston Pointe III /
Ft. Lauderdale, Florida | | 2250 North Commerce Parkway, Weston, FL | | | 2003 | | | American Intercontinental University(9) | | | 97,178 | | | | 09/2015 | | | $ | 23,583,550 | | | $ | 18,866,840 | | | | 100 | % | | $ | 283,003 | |
| | | | | | | | | |
Weston Pointe IV /
Ft. Lauderdale, Florida | | 2100 North Commerce Parkway, Weston, FL | | | 2006 | | | General Services Administration(6) | | | 96,175 | | | | 04/2019 | | | $ | 28,256,250 | | | $ | 22,605,000 | | | | 100 | % | | $ | 339,075 | |
| | | | | | | | | |
One Conway Park /Chicago, Illinois | | 100 Field Drive, Lake Forest, IL | | | 1989 | | | — | | | 105,000 | | | | — | | | $ | 15,400,000 | | | $ | 12,320,000 | | | | 86.5 | % | | $ | 184,800 | |
| | | | | | | | | |
West Lake at Conway /
Chicago, Illinois | | 1925 West Field Ct., Lake Forest, IL | | | 2008 | | | — | | | 99,538 | | | | — | | | $ | 17,575,000 | | | $ | 14,060,000 | | | | 90.1 | % | | $ | 210,900 | |
| | | | | | | | | |
Atrium I /Columbus, Ohio | | 5525 Parkcenter Circle, Dublin, OH | | | 1996 | | | Nationwide Mutual Insurance Company(10) | | | 315,102 | | |
| 05/2018;
05/2019 |
(11) | | $ | 45,250,000 | | | $ | 36,200,000 | | | | 100 | % | | $ | 543,000 | |
| (1) | This column represents tenants that currently occupy more than 50,000 net rentable square feet of each property. Properties which do not list a tenant are multi-tenant properties that do not currently have a tenant that occupies more than 50,000 net rentable square feet. |
| (2) | Approximate total purchase price, exclusive of customary closing costs, paid by the Duke Joint Venture for each property. |
| (3) | Pro rata share of approximate purchase price is at the Company’s pro rata share of effective ownership for each of these properties, which was funded using net proceeds of the Company’s current public offering. |
| (4) | Acquisition fees payable to the Investment Advisor are not included in the total acquisition cost for the properties. |
| (5) | NCS Pearson, Inc. provides services, software, systems, and Internet-based technologies for the collection, management, and interpretation of data. |
| (6) | The General Services Administration is an independent agency of the Federal Government of the United States of America, which supplies products and communications for U.S. government offices, provides transportation and office space to federal employees and develops government-wide cost-minimizing policies and other management tasks. |
| (7) | Hartford Fire Insurance Company is a subsidiary of The Hartford Financial Services Group and one of the world’s leading providers of fire, marine and casualty insurance. |
| (8) | Citicorp North America, Inc., provides regional banking services and is a subsidiary of Citigroup, Inc. (NYSE: C). |
| (9) | American Intercontinental University is an international for-profit university with both physical and online campuses. |
| (10) | Nationwide Mutual Insurance Company is one of the nation’s largest insurance and financial services companies. |
| (11) | This tenant has two separate leases within this property, as they rent two separate spaces. |
55
On March 24, 2011, in connection with the acquisition of the Remaining Properties as described above, the Duke joint venture entered into the Term Loan Agreement with Wells Fargo Bank, National Association. While the term loan is non-recourse to us, the pro rata share of the term loan obligation attributable to us is $220,000,000 in accordance with our ownership interest in the Duke joint venture. The loan proceeds were used to accelerate the acquisition of the Remaining Properties. The loan has a six-month term and two six-month extension options. The term loan has an interest rate of LIBOR plus 2.50% and is fully pre-payable at any time, subject to any customary costs. An origination fee of $1,650,000 was paid to Wells Fargo Bank, National Association at the closing of the term loan. The Term Loan Agreement contains customary representations and warrants and covenants. During the term of the loan, the Duke Joint Venture has agreed to comply with certain financial covenants related to its leverage ratio, net asset value, unencumbered leverage ratio and the inability to enter into certain types of investments.
We were not party to any material legal proceedings at December 31, 2010.
| ITEM 4. | REMOVED AND RESERVED |
56
PART II
| ITEM 5. | MARKET FOR REGISTRANT’S COMMON EQUITY, RELATED SHAREHOLDERS MATTERS AND ISSUER PURCHASES OF EQUITY SECURITIES |
Market Information
We are currently offering up to $3,000,000,000 in our common shares pursuant to an effective registration statement, 90% of which are being offered at a price of $10.00 per share, and 10% of which are being offered pursuant to our distribution reinvestment plan at a price of $9.50 per share. In each case, the offering price was arbitrarily determined by our Board of Trustees. We reserve the right to reallocate the common shares we are offering between the primary offering and our distribution reinvestment plan.
In accordance with Financial Industry Regulatory Authority Rule 5110, the estimated value of our common shares was deemed to be $10.00 per share as of December 31, 2010. The basis for this estimated value is the fact that, as of December 31, 2010, we were conducting our public offering of our common shares at the price of $10.00 per share to third-party investors through arms-length transactions. However, there is no established public trading market for the common shares at this time, and there can be no assurance that shareholders could receive $10.00 per share if such a market did exist and they sold their common shares or that they will be able to receive such amount for their common shares in the future. Moreover, we have not performed an appraisal of our properties; as such, this estimated value is not necessarily based upon the appraised value of our properties, nor does it necessarily represent the amount shareholders would receive if our properties were sold and the proceeds distributed to our shareholders in a liquidation, which amount may be less than $10.00 per share, because at the time we were purchasing our properties, the amount of funds available for investments was reduced by selling commissions, dealer manager fees and marketing support fees, organization and offering costs and acquisition and advisory fees and expenses, as described in more detail in the notes to our consolidated financial statements included in this report. As a result, it would be expected that, in the absence of other factors affecting property values, our aggregate net asset value may be less than the proceeds of our public offering and may not be the best indicator of the value of shares purchased as a long-term income producing investment. In addition, we may conduct additional public offerings of our common shares. Prior to providing a liquidity event for our shareholders, our Board of Trustees will determine the public offering price of our common shares for future public offerings, which may or may not be the same as our current public offering price.
Dividend Reinvestment Plan
The following is a summary of our dividend reinvestment plan that allows you to have dividends and other distributions otherwise distributable to you invested in additional common shares. As of December 31, 2010, we had issued 6,244,924 common shares pursuant to our dividend reinvestment plan.
Administrator
Boston Financial Data Services, Inc. serves as the plan administrator. The plan administrator administers the plan, keeps records and provides each participant with purchase confirmations.
Eligibility
Our existing shareholders, persons who receive our shares upon conversion of OP units of CBRE OP and investors who have purchased shares in our public offerings are eligible to participate in our dividend reinvestment plan, provided such persons meet the investor suitability and minimum purchase requirements of their states of residence. We may elect to deny your participation in the dividend reinvestment plan if you reside in a jurisdiction or foreign country where, in our judgment, the burden or expense of compliance with applicable securities laws makes your participation impracticable or inadvisable.
Election to Participate
Assuming you are eligible, you may elect to participate in the dividend reinvestment plan by completing the subscription agreement or other approved enrollment form available from the plan administrator. Your participation in the dividend reinvestment plan will begin with the next dividend made after receipt of your enrollment form provided such notice is received more than 30 days prior to the last day of the fiscal quarter. Once enrolled, you may continue to purchase shares under our dividend reinvestment plan until we have sold all of the shares registered in an offering, have terminated the offering or have terminated the dividend reinvestment plan. If you participate in the dividend reinvestment plan, all of your dividends will be reinvested through the plan.
57
Share Purchases
Shares will be purchased under the dividend reinvestment plan on the quarterly dividend payment dates. Shares will be purchased at a purchase price equal to the higher of $9.50 per share or 95% of the fair market value of a common share on the reinvestment date, as determined by the Investment Advisor or another firm we choose for that purpose. The purchase of fractional shares is a permissible, and likely, result of the reinvestment of dividends under the dividend reinvestment plan. Shares may be issued under the dividend reinvestment plan until all shares registered as part of our offering have been sold. After that time, we may purchase shares either through purchases on the open market, if a market then exists, or through an additional issuance of shares. In either case, the price per share will be equal to the then-prevailing market price, which shall equal the price on a national securities exchange, the Nasdaq Global Select Market or the Nasdaq Global Market on which such shares are listed on the dividend reinvestment date if such shares are then listed.
Investment of Distribution
Our plan administrator uses the aggregate amount of distributions to all participants for each fiscal quarter to purchase shares (including fractional shares) for the participants. If the aggregate amount of distributions to participants exceeds the amount necessary to purchase all shares then available for purchase, the plan administrator will purchase all available shares and will return all remaining distributions to the participants within 30 days after the date such distributions are made. Any distributions not so invested will be returned to participants.
At this time, participants do not have the option to make voluntary contributions to the dividend reinvestment plan to purchase shares in excess of the amount of shares that can be purchased with their distributions. Our Board of Trustees reserves the right, however, to amend the dividend reinvestment plan in the future to permit voluntary contributions to the dividend reinvestment plan by participants, to the extent consistent with our objective of qualifying as a REIT.
Purchase Confirmations
The plan administrator provides a confirmation of your quarterly purchases under the dividend reinvestment plan. The plan administrator is to provide the confirmation to you or your designee within 30 days after the end of each quarter, which confirmation is to disclose the following information:
| | ¡ | | each dividend reinvested for your account during the quarter; |
| | ¡ | | the date of the reinvestment; |
| | ¡ | | the number and price of the shares purchased by you; and |
| | ¡ | | the total number of shares in your account. |
Fees and Commissions
We do not pay selling commissions, the dealer manager fee or the marketing support fee on shares sold under our dividend reinvestment plan. We do not receive a fee for selling shares under the dividend reinvestment plan. We are responsible for all administrative charges and expenses charged by the plan administrator. Any interest earned on such distributions will be paid to us to defray certain costs relating to the dividend reinvestment plan. The administrative charge for each fiscal quarter is the lesser of 5% of the amount reinvested for the participant or $2.50, with a minimum charge of $0.50.
Voting
You may vote all whole shares acquired through the dividend reinvestment plan.
Tax Consequences of Participation
The reinvestment of dividends does not relieve you of any taxes which may be payable on such dividends. When your dividends are reinvested to acquire shares (including any fractional share), you will be treated as having received a distribution in the amount of the fair market value of our common shares on the dividend payment date, multiplied by the number of shares (including any fractional share) purchased plus any brokerage fees, commissions or administrative costs paid by us on your behalf in connection with the reinvestment. You should be aware that, because shares purchased with reinvested dividends may be purchased at up to a 5% discount, the taxable income received by you as a participant in our dividend reinvestment plan may be greater than the taxable income that would have resulted from the receipt of the dividend in cash. We will withhold 28% of the amount of dividends or distributions paid if you fail to furnish a valid taxpayer identification number, fail to properly report interest or dividends or fail to certify that you are not subject to withholding.
58
Termination of Participation
You may terminate your participation (in whole and not in part) in the dividend reinvestment plan at any time, without penalty, by providing written notice to us at least ten business days prior to the last day of the fiscal period to which the distribution relates. If you terminate your participation in the dividend reinvestment plan, the plan administrator will send you a check in payment for the amount of any distributions that have not been reinvested in shares, and our record books will be revised to reflect the ownership records of your whole and fractional shares. Any transfer of your shares will effect a termination of the participation of those shares in the dividend reinvestment plan. You must promptly notify us should you no longer meet the suitability standards described under the “Suitability Standards” section of the prospectus relating to our current public offering or cannot make the other representations or warranties set forth in the subscription agreement at any time prior to the listing of our shares on the New York Stock Exchange or another national exchange. We will terminate your participation to the extent that a reinvestment of your dividends in our shares would cause you to exceed the ownership limitation contained in our declaration of trust. In the event you terminate your participation in the dividend reinvestment plan, you may subsequently re-enroll in the plan upon receipt of the then current version of the prospectus relating to our current public offering or a separate current prospectus relating solely to the plan by notifying the plan agent and completing any required documents.
Amendment or Termination of Plan
We may amend or terminate the dividend reinvestment plan for any reason at any time upon ten days prior written notice to participants.
Share Redemption Program
Our share redemption program is designed to provide eligible shareholders with limited, interim liquidity by enabling them to sell shares back to us prior to a liquidity event. Shareholders who have held their shares for at least one year may, on a quarterly basis, present to us for redemption all or any portion of their shares. However, in the event that an eligible shareholder presents fewer than all of his or her shares to us for redemption, such shareholder must present at least 25% of his or her shares to us for redemption and must retain at least $5,000 of common shares if any shares are held after such redemption. At that time, we may, subject to the conditions and limitations described below, redeem such shares for cash to the extent that we have sufficient funds available to fund such redemption after the payment of dividends necessary to maintain our qualification as a REIT and to avoid payment of any U.S. federal income tax or excise tax on our net taxable income.
The amount received from the redemption of shares issued will be equal to a percentage of the price actually paid for the shares, which percentage is dependent upon the number of years the shares are held, as described in the following table:
| | |
Share Purchase Anniversary | | Redemption Price as a Percentage of Purchase Price |
Less than 1 year | | No Redemption Allowed |
1 year | | 92.0% |
2 years | | 93.5% |
3 years | | 95.0% |
4 and longer | | 100.0% |
During our current public offering and subsequent public offerings of our common shares, the amount received from the redemption of shares will also be equal to a percentage of the price actually paid for the shares, which percentage is dependent upon the number of years the shares are held, as described in the table above. However, in no event may the amount received from the redemption of shares during an offering exceed the offering price of our common shares in such offering.
For purposes of the one-year holding period, limited partners of CBRE OP who redeem their limited partnership interests for shares in us shall be deemed to have owned their shares as of the date they were issued their limited partnership interests in CBRE OP. In addition, our Board of Trustees has delegated to our officers the right to waive the one-year holding period and pro rata redemption requirements described below in the event of the death, disability (as such term is defined in the Internal Revenue Code) or bankruptcy of a shareholder. Shares that are redeemed in connection with the death, disability or bankruptcy of a shareholder will be redeemed at the time of showing death, disability or bankruptcy and at 100% of the price at which the investor purchased such shares while the share redemption program is in effect and sufficient funds are available. However, in the event that an eligible shareholder presents fewer than all of his or her shares to us for redemption, such shareholder must present at least 25% of his or her shares to us for redemption and must retain at least $5,000 of common shares if any shares are held after such redemption.
59
Redemption of shares, when requested, will be made quarterly and, in the event our available cash flow is insufficient to fund all redemption requests, each shareholder’s request will be reduced on a pro rata basis. Alternatively, if we do not have such funds available, at the time when redemption is requested, a shareholder can (i) withdraw his or her request for redemption, or (ii) ask that we carry over his or her request to the next quarterly period, if any, when sufficient funds become available. If a shareholder does not make a subsequent request, we will treat the initial redemption request as cancelled.
We are not obligated to redeem common shares under our share redemption program. During any calendar year, we will not redeem more than 5% of the weighted average number of shares outstanding during the prior calendar year. The aggregate amount of redemptions under our share redemption program is not expected to exceed the aggregate proceeds received from the sale of shares pursuant to our dividend reinvestment plan. However, to the extent that the aggregate proceeds received from the sale of shares pursuant to our dividend reinvestment plan are not sufficient to fund redemption requests pursuant to the 5% limitation outlined above, the Board of Trustees may, in its sole discretion, choose to use other sources of funds to redeem common shares. Such sources of funds could include cash on hand and cash available from borrowings. We cannot guarantee that any funds set aside for our share redemption program will be sufficient to accommodate any or all requests made in any year.
The Board of Trustees, in its sole discretion, may choose to terminate or otherwise amend the terms of the share redemption program or to reduce the number of shares purchased under the share redemption program if it determines the funds otherwise available to fund our share redemption program are needed for other purposes If we terminate, amend or suspend the share redemption program or reduce the number of shares to be redeemed under the share redemption program, we will provide 30 days’ advance notice to shareholders, and we will disclose the change in quarterly and annual reports filed with the SEC on Form 10-Q and Form 10-K.
A shareholder who wishes to have his or her shares redeemed must mail or deliver a written request on a form we provide, executed by the shareholder, its trustee or authorized agent, to the redemption agent, which is currently Boston Financial Data Services, Inc. Within 30 days following the redemption agent’s receipt of the shareholder’s request, the redemption agent will forward to such shareholder the documents necessary to affect the redemption, including any signature guarantee we or the redemption agent may require. The redemption agent will affect such redemption for the calendar quarter provided that it receives the properly completed redemption documents relating to the shares to be redeemed from the shareholder at least one calendar month prior to the last day of the current calendar quarter and has sufficient funds available to redeem such shares. The effective date of any redemption will be the last date during a quarter during which the redemption agent receives the properly completed redemption documents. As a result, we anticipate that, assuming sufficient funds are available for redemption, the redemptions will be paid no later than 30 days after the quarterly determination of the availability of funds for redemption.
You will have no right to request redemption of your shares should our shares become listed on a national securities exchange, the Nasdaq Global Select Market or the Nasdaq Global Market. Our share redemption program is only intended to provide interim liquidity for shareholders until a secondary market develops for the shares, at which time the program would terminate. No such market presently exists, and we cannot assure you that any market for your shares will ever develop.
For the years ended December 31, 2010 and 2009, we received requests to redeem 2,057,122 common shares and 2,301,682, common shares, respectively, pursuant to our share redemption program. We redeemed 100% and 94% of the redemption requests for the years ended December 31, 2010 and 2009 at an average price per share of $9.16 and $9.00. We funded share redemptions for the periods noted above from the proceeds of the sale of our common shares pursuant to our dividend reinvestment plan.
Shares
The number of our common shares issued and outstanding as of March 17, 2011 was 172,025,430.
Distribution Policy
We intend to distribute all or substantially all of our net taxable income (which does not ordinarily equate to net income as calculated in accordance with GAAP) to our shareholders in each year. We intend to declare dividends on a daily basis, but aggregate and pay dividends on a quarterly basis. Our dividend policy is subject to revision at the discretion of our Board of Trustees without notice to you or shareholder approval. All distributions will be made by us at the discretion of our Board of Trustees and will be based upon our Board of Trustee’s evaluation of our assets, operating results, historical and projected cash flows (and sources thereof), historical and projected equity offering proceeds from our offerings, historical and projected debt incurred, projected investments and capital requirements, the anticipated timing between receipt of our equity offering proceeds and investment of those proceeds, maintenance of REIT qualification, applicable provisions of Maryland law, general economic, market and industry conditions, and such other factors as our Board of Trustees deems relevant.
60
In order to qualify as a REIT under the Internal Revenue Code, we generally must make distributions to our shareholders each year in an amount at least equal to (i) 90% of our net taxable income, excluding net capital gains, plus (ii) 90% of the excess of our net income from foreclosure property over the tax imposed on such income by the Internal Revenue Code, minus (iii) any excess non-cash income. In general, our dividends will be applied toward these requirements only if paid in the taxable year to which they relate, or in the following taxable year if the dividends are declared before we timely file our tax return for that year, the dividends are paid on or before the first regular dividend payment following the declaration and we elect on our tax return to have a specified dollar amount of such distributions treated as if paid in the prior year. In addition, dividends declared by us in October, November or December of one taxable year and payable to a shareholder of record on a specific date in such a month are treated as both paid by us and received by the shareholder during such taxable year, provided that the dividend is actually paid by us by January 31 of the following taxable year.
It is anticipated that distributions generally will be taxable as ordinary income to our shareholders, although a portion of such distributions may be designated by us as a return of capital or as capital gain. We will furnish annually to each of our shareholders a statement setting forth distributions paid during the preceding year and their characterization as ordinary income, return of capital or capital gains.
The following table sets forth the distributions per common share declared by our Board of Trustees and dates of such distributions:
| | | | | | |
Quarter | | Declared | | | Date of Distribution |
First Quarter, 2009 | | $ | 0.15 | | | April 17, 2009 |
Second Quarter, 2009 | | $ | 0.15 | | | July 17, 2009 |
Third Quarter, 2009 | | $ | 0.15 | | | October 16, 2009 |
Fourth Quarter, 2009 | | $ | 0.15 | | | January 15, 2010 |
First Quarter, 2010 | | $ | 0.15 | | | April 16, 2010 |
Second Quarter, 2010 | | $ | 0.15 | | | July 16, 2010 |
Third Quarter, 2010 | | $ | 0.15 | | | October 15, 2010 |
Fourth Quarter, 2010 | | $ | 0.15 | | | January 14, 2011 |
First Quarter, 2011 | | $ | 0.15 | | | April 15, 2011* |
Second Quarter, 2011 | | $ | 0.15 | | | July 15, 2011* |
| * | Anticipated payment date |
The following table presents total distributions declared and paid and distributions per share:
| | | | | | | | | | | | | | | | |
2010 Quarters | | First | | | Second | | | Third | | | Fourth | |
Total distributions declared and paid | | $ | 16,841,000 | | | $ | 19,266,000 | | | $ | 21,623,000 | | | $ | 24,053,000 | |
Distributions per share | | $ | 0.15 | | | $ | 0.15 | | | $ | 0.15 | | | $ | 0.15 | |
Amount of distributions per share funded by cash flows provided by operating entities | | $ | 0.1212 | | | $ | 0.0540 | | | $ | 0.0826 | | | $ | 0.0444 | |
Amount of distributions per share funded by uninvested proceeds from financings of our properties | | $ | 0.0288 | | | $ | 0.0960 | | | $ | 0.0674 | | | $ | 0.1056 | |
| | | | |
2009 Quarters | | First | | | Second | | | Third | | | Fourth | |
Total distributions declared and paid | | $ | 10,066,000 | | | $ | 11,181,000 | | | $ | 12,767,000 | | | $ | 14,750,000 | |
Distributions per share | | $ | 0.15 | | | $ | 0.15 | | | $ | 0.15 | | | $ | 0.15 | |
Amount of distributions per share funded by cash flows provided by operating activities | | $ | 0.0903 | | | $ | 0.0643 | | | $ | 0.1309 | | | $ | 0.0430 | |
Amount of distributions per share funded by uninvested proceeds from financings of our properties | | $ | 0.0597 | | | $ | 0.0857 | | | $ | 0.0191 | | | $ | 0.1070 | |
On March 15, 2011, our Board of Trustees approved a quarterly distribution to shareholders of $0.15 per common share for the second quarter of 2011. The distribution will be calculated on a daily basis and paid on July 15, 2011 to shareholders of record during the period April 1, 2011 through and including June 30, 2011. On an annualized basis, this distribution amount represents a 6.0% yield based on the current $10.00 per share offering price of our common shares. However, no assurance can be made that distributions will be sustained at current levels.
On December 14, 2010, our Board of Trustees approved a quarterly distribution to shareholders of $0.15 per common share for the first quarter of 2011. The distribution will be calculated on a daily basis and paid on April 15, 2011 to shareholders of record during the period January 1, 2011 through and including March 31, 2011.
61
Our first quarter 2010 distributions, paid on April 16, 2010, were funded 80.79% by cash flows provided by operating activities and 19.21% from uninvested proceeds from financings of our properties. In addition, distributions totaling $7,318,000 were reinvested in our common shares pursuant to our dividend reinvestment plan. Our second quarter 2010 distributions, paid on July 16, 2010, were funded 35.98% by cash flows provided by operating activities and 64.02% from uninvested proceeds from financings of our properties. In addition, distributions totaling $8,390,000 were reinvested in our common shares pursuant to our dividend reinvestment plan. Our third quarter 2010 distributions, paid on October 15, 2010, were funded 55.08% by cash flows provided by operating activities and 44.92% from uninvested proceeds from financings of our properties. In addition, distributions totaling $9,349,000 were reinvested in our common shares pursuant to our dividend reinvestment plan. Our fourth quarter 2010 distributions, paid on January 14, 2011, were funded 29.60.% by cash flows provided by operating activities and 71.40% from uninvested proceeds from financings of our properties. In addition, distributions totaling $10,260,000 were reinvested in our common shares pursuant to our dividend reinvestment plan.
Our 2010 distributions were funded 48.38% by cash flows provided by operating activities and 51.62% from uninvested proceeds from financings of our properties. In addition, 2010 distributions totaling $35,317,000 were reinvested in our common shares pursuant to our dividend reinvestment plan during 2010.
Our first quarter 2009 distributions, paid on April 17, 2009, were funded 60.22% by cash flows provided by operating activities and 39.78% from uninvested proceeds from financings of our properties. In addition, first quarter distributions totaling $4,120,000 were reinvested in our common shares pursuant to our dividend reinvestment plan. Our second quarter 2009 distributions, paid on July 17, 2009, were funded 42.90% by cash flows provided by operating activities and 57.10% from uninvested proceeds from financings of our properties. In addition, second quarter distributions totaling $4,563,000 were reinvested in our common shares pursuant to our dividend reinvestment plan. Our third quarter 2009 distributions, paid on October 16, 2009, were funded 87.25% by cash flows provided by operating activities and 12.75% from uninvested proceeds from financings of our properties. In addition, third quarter distributions totaling $5,255,000 were reinvested in our common shares to our dividend reinvestment plan. Our fourth quarter 2009 distributions, paid on January 15, 2010, were funded 28.67% by cash flows provided by operating activities and 71.33% from uninvested proceeds from financings of our properties. In addition, fourth quarter distributions totaling $6,196,000 were reinvested in our common shares pursuant to our dividend reinvestment plan.
Our 2009 distributions were funded 53.78% by cash flows provided by operating activities and 46.22% from uninvested proceeds from financings of our properties. In addition, 2009 distributions totaling $20,135,000 were reinvested in our common shares pursuant to our dividend reinvestment plan during 2009.
To the extent that our cash available for distribution is less than the amount we are required to distribute to qualify as a REIT, we may consider various funding sources to cover any shortfall, including borrowing funds on a short-term, or possibly long-term, basis, using proceeds from our public offerings, or selling properties. In addition, we may utilize these funding sources to make distributions that exceed the amount we are required to distribute to qualify as a REIT.
Unregistered Sales and Repurchases of Securities
During the year ended December 31, 2010, we did not sell any equity securities that are not registered under the Securities Act of 1933, as amended. See “Share Redemption Program” for a discussion of our share redemption program, including shares that we have redeemed thereunder.
The following table provides information with respect to our share redemption program for the three months ended December 31, 2010:
| | | | | | | | | | | | | | | | |
Period | | Total Number of
Shares Purchased | | | Average Price
Paid Per
Share | | | Total Number of Shares
Purchased as Part of
Publicly Announced Plans
or Programs | | | Maximum Number (or
approximate dollar value) of
Shares that May Yet Be Purchased
Under the Plans or Programs | |
October | | | 574,234 | | | $ | 9.25 | | | | N/A | | | | N/A | |
November | | | — | | | | — | | | | N/A | | | | N/A | |
December | | | — | | | | — | | | | N/A | | | | N/A | |
Total | | | 574,234 | | | $ | 9.25 | | | | N/A | | | | N/A | |
Use of Proceeds from Sale of Registered Securities
The registration statement relating to our initial public offering (No. 333-127405) was declared effective on October 24, 2006. CNL Securities Corp. is the Dealer Manager of our offering. The registration statement covered up to $2,000,000,000 in common shares of beneficial interest, 90% of which were offered at a price of $10.00 per share, and 10% of which were offered pursuant to our dividend reinvestment plan at a purchase price equal to the higher of $9.50 per share or 95% of the fair market value of a common share on the
62
reinvestment date, as determined by the Investment Advisor or another firm we choose for that purpose. Our initial public offering was terminated effective as of the close of business on January 29, 2009. As of the close of business on January 29, 2009, we had sold a total of 60,808,967 common shares in the initial public offering, including 1,487,943 common shares which were issued pursuant to our dividend reinvestment plan. We withdrew from registration a total of 140,243,665 common shares that were registered but not sold in connection with the initial public offering. From October 24, 2006 (effective date) through January 29, 2009 (termination date), we had accepted subscriptions from 13,270 investors, issued 60,808,967 common shares and received $607,345,702 in gross offering proceeds pursuant to our initial public offering. After payment of approximately $8,290,000 in acquisition fees and related expenses, payment of approximately $26,335,000 in selling commission, $8,898,000 in dealer manager fees, $4,008,000 in marketing support fees and payment of approximately $12,147,000 in organization and offering expenses, as of January 29, 2009, we had raised aggregate net offering proceeds of approximately $548,000,000.
The registration statement relating to our follow-on public offering (No. 333-152653) was declared effective on January 30, 2009. CNL Securities Corp. is the Dealer Manager of our follow-on offering. The registration statement covers up to $3,000,000,000 in common shares of beneficial interest, 90% of which will be offered at a price of $10.00 per share, and 10% of which will be offered pursuant to our dividend reinvestment plan at a purchase price equal to the higher of $9.50 per share or 95% of the fair market value of a common share on the reinvestment date, as determined by the Investment Advisor or another firm we choose for that purpose. We reserve the right to reallocate the shares between the primary offering and our dividend reinvestment plan. From January 30, 2009 (effective date) through December 31, 2010, we had accepted subscriptions from 26,244 investors, issued 101,245,478 common shares and received $1,010,076,294 in gross offering proceeds pursuant to our public offering after payment of $23,838,944 in acquisition fees and related expenses, payment of approximately $51,144,000 in selling commission, $21,171,000 in dealer manager fees, $7,771,000 in marketing support fees and payment of approximately $15,863,000 in organization and offering expenses, as of December 31, 2010, we had raised aggregate net offering proceeds of approximately $890,288,000.
Equity Incentive Plan
We have adopted a 2004 equity incentive plan. The purpose of the 2004 equity incentive plan is to provide us with the flexibility to use share options and other awards to provide a means of performance-based compensation. Key employees, directors, trustees, officers, advisors, consultants or other personnel of ours and our subsidiaries or other persons expected to provide significant services to us or our subsidiaries, including employees of the Investment Advisor, would be eligible to be granted share options, restricted shares, phantom shares, dividend equivalent rights and other share-based awards under the 2004 equity incentive plan.
On April 20, 2010, our Board’s independent trustees, Messrs. Black, Reid and Orphanides, were awarded equity grants under our 2004 equity incentive plan on the following terms: (i) each award was for $80,000 in restricted common shares of the Trust (or 8,000 shares at $10.00 per share) for a total of $240,000; (ii) each award vested in its entirety, upon issuance; and (iii) the independent trustee would not be able to redeem any of the restricted common shares prior to the third anniversary of date of issuance, but retains the rights to dividends declared and paid during such restriction period. We recognized a stock based compensation expense of $240,000 during the year ended December 31, 2010 as a result of granting these awards to our independent trustees. No awards of any kind were made under this plan during the years ended December 31, 2009 and 2008.
Administration
The Compensation Committee, appointed by our Board of Trustees, has the full authority to administer and interpret the 2004 equity incentive plan, to authorize the granting of awards, to determine the eligibility of an employee, trustee or consultant to receive an award, to determine the number of common shares to be covered by each award, to determine the terms, provisions and conditions of each award, to prescribe the form of instruments evidencing awards and to take any other actions and make all other determinations that it deems necessary or appropriate. Our Compensation Committee may, among other things, establish performance goals that must be met in order for awards to be granted or to vest, or for the restrictions on any such awards to lapse. From and after the closing of our initial public offering, the 2004 equity incentive plan will be administered by a Compensation Committee consisting of two or more non-employee trustees, each of whom is intended to be, to the extent required by Rule 16b-3 under the Securities Exchange Act of 1934, as amended, a nonemployee trustee and will, at such times as we are subject to Section 162(m) of the Internal Revenue Code, qualify as an “outside director” for purposes of Section 162(m) of the Internal Revenue Code, or, if no committee exists, the Board of Trustees. References below to our Compensation Committee include a reference to the board for those periods in which the board is acting.
Available shares
Subject to adjustment upon certain corporate transactions or events, a maximum of 20,000,000 common shares (but not more than 10% of the common shares outstanding at the time of grant) may be subject to share options, shares of restricted shares, phantom shares and dividend equivalent rights under the 2004 equity incentive plan. Any common shares withheld or surrendered by plan
63
participants in connection with the payment of an option exercise price or in connection with tax withholding will not count towards the share limitation and will be available for issuance under the 2004 equity incentive plan. If an option or other award granted under the 2004 equity incentive plan expires or terminates, the shares subject to any portion of the award that expires or terminates without having been exercised or paid, as the case may be, will again become available for the issuance of additional awards. Unless previously terminated by our Board of Trustees, no new award may be granted under the 2004 equity incentive plan after the tenth anniversary of the date that such plan was initially approved by our Board of Trustees. No award may be granted under our 2004 equity incentive plan to any person who, assuming exercise of all options and payment of all awards held by such person would own or be deemed to own more than 3.0% of our outstanding common shares. As of December 31, 2010, the number of common shares remaining or available for future issuance under the 2004 equity incentive plan was 19,976,000.
Awards Under the 2004 Equity Incentive Plan
Options
The terms of specific options, including whether options shall constitute “incentive stock options” for purposes of Section 422(b) of the Internal Revenue Code, shall be determined by our Compensation Committee. The exercise price of an option shall be determined by our Compensation Committee and reflected in the applicable award agreement. The exercise price with respect to incentive share options may not be lower than 100%, or 110% in the case of an incentive share option granted to a 10% shareholder, if permitted under the plan, of the fair market value of one of our common shares on the date of grant. Each option will be exercisable after the period or periods specified in the award agreement, which will generally not exceed ten years from the date of grant (or five years in the case of an incentive share option granted to a 10% shareholder, if permitted under the plan). Options will be exercisable at such times and subject to such terms as determined by our Compensation Committee.
Restricted Shares
A restricted share award is an award of common shares that is subject to restrictions on transferability and such other restrictions, if any, as our Board of Trustees or Compensation Committee may impose at the date of grant. Grants of restricted shares will be subject to vesting schedules as determined by our Compensation Committee. The restrictions may lapse separately or in combination at such times, under such circumstances, including, without limitation, a specified period of employment or the satisfaction of pre-established criteria, in such installments or otherwise, as our Compensation Committee may determine. Except to the extent restricted under the award agreement relating to the restricted shares, a participant granted restricted shares has all of the rights of a shareholder, including, without limitation, the right to vote and the right to receive dividends on the restricted shares. Although dividends are paid on all restricted shares, whether or not vested, at the same rate and on the same date as our common shares, holders of restricted shares are prohibited from selling such shares until they vest.
Phantom Shares
Phantom shares will vest as provided in the applicable award agreement. A phantom share represents a right to receive the fair market value of a share of our common shares, or, if provided by our Compensation Committee, the right to receive the fair market value of a share of our common shares in excess of a base value established by our Compensation Committee at the time of grant. Phantom shares may generally be settled in cash or by transfer of common shares (as may be elected by the participant or our Compensation Committee, as may be provided by our Compensation Committee at grant). Our Compensation Committee may, in its discretion and under certain circumstances, permit a participant to receive as settlement of the phantom shares installments over a period not to exceed ten years. In addition, our Compensation Committee may establish a program under which distributions with respect to phantom shares may be deferred for additional periods as set forth in the preceding sentence.
Dividend Equivalents
A dividend equivalent is a right to receive (or have credited) the equivalent value of dividends declared on common shares otherwise subject to an award. Our Compensation Committee may provide that amounts payable with respect to dividend equivalents shall be converted into cash or additional common shares. Our Compensation Committee will establish all other limitations and conditions of awards of dividend equivalents as it deems appropriate.
Other Share-Based Awards
Our 2004 equity incentive plan authorizes the granting of other awards based upon the common shares (including the grant of securities convertible into common shares and shares appreciation rights), and subject to terms and conditions established at the time of grant.
64
Adjustments in General; Certain Change in Control Provisions
In the event of certain corporate reorganizations or other events, our Compensation Committee generally may make certain adjustments in its discretion to the manner in which the 2004 equity incentive plan operates (including, for example, to the number of shares available under the plan), and may otherwise take actions which, in its judgment, are necessary to preserve the rights of plan participants. Upon a change in control (as defined in the plan), our Compensation Committee generally may make such adjustments as it, in its discretion, determines are necessary or appropriate in light of the change in control, if our Compensation Committee determines that the adjustments do not have an adverse economic impact on the participants, and certain other special provisions may apply.
Amendment and Termination
Our Board of Trustees may generally amend the 2004 equity incentive plan as it deems advisable, except in certain respects regarding outstanding awards. In addition, the 2004 equity incentive plan may not be amended without shareholder approval if the absence of such approval would cause the 2004 equity incentive plan to fail to comply with any applicable legal requirement or applicable exchange or similar rule.
Performance Bonus Plan
We have adopted a 2004 performance bonus plan. Annual bonuses under our 2004 performance bonus plan may be awarded by our Compensation Committee to selected officers or other employees of ours, or key employees, based on corporate factors or individual factors (or a combination of both). Subject to the provisions of the 2004 performance bonus plan, the Compensation Committee (i) determines and designate those key employees to whom bonuses are to be granted; (ii) determines, consistently with the 2004 performance bonus plan, the amount of the bonus to be granted to any key employee for any performance period; and (iii) determines, consistently with the 2004 performance bonus plan, the terms and conditions of each bonus. Bonuses may be so awarded by our Compensation Committee prior to the commencement of any performance period, during or after any performance period. No bonus shall exceed 200% of the key employee’s aggregate salary for the year. The Compensation Committee may provide for partial bonus payments at target and other levels. Corporate performance hurdles for bonuses may be adjusted by our Compensation Committee in its discretion to reflect (i) dilution from corporate acquisitions and share offerings and (ii) changes in applicable accounting rules and standards. Our Compensation Committee may determine that bonuses shall be paid in cash or shares or other equity-based grants, or a combination thereof. Our Compensation Committee may also provide that any such share grants be made under our 2004 equity incentive plan or any other equity-based plan or program we may establish. Our Compensation Committee may provide for programs under which the payment of bonuses may be deferred at the election of the employee. To the extent that compensation under our 2004 performance bonus plan is intended to qualify for certain transitional rules applicable for purposes of 162(m) of the Internal Revenue Code, it is possible that additional requirements will apply with respect to the establishment (including as to timing) of the performance goals.
As of December 31, 2010, no awards have been granted under our 2004 performance bonus plan.
65
| ITEM 6. | SELECTED FINANCIAL DATA |
The following table sets forth our consolidated financial data on a historical basis for the periods ended December 31, 2010, 2009, 2008, 2007, and 2006.
CB Richard Ellis Realty Trust
(in thousands, except share data)
| | | | | | | | | | | | | | | | | | | | |
| | | 2010 | | | 2009 | | | 2008 | | | 2007 | | | 2006 | |
Statement of Operations Data: | | | | | | | | | | | | | | | | | | | | |
Revenue | | | | | | | | | | | | | | | | | | | | |
Rental | | $ | 69,373 | | | $ | 47,023 | | | $ | 33,396 | | | $ | 14,028 | | | $ | 6,630 | |
Tenant Reimbursements | | | 14,166 | | | | 9,301 | | | | 6,753 | | | | 2,633 | | | | 1,830 | |
| | | | | | | | | | | | | | | | | | | | |
Total Revenue | | | 83,539 | | | | 56,324 | | | | 40,149 | | | | 16,661 | | | | 8,460 | |
| | | | | | | | | | | | | | | | | | | | |
Expenses | | | | | | | | | | | | | | | | | | | | |
Operating and Maintenance | | | 8,618 | | | | 4,974 | | | | 3,248 | | | | 1,057 | | | | 860 | |
Property Taxes | | | 10,965 | | | | 7,624 | | | | 5,479 | | | | 1,778 | | | | 1,103 | |
Interest | | | 14,881 | | | | 11,378 | | | | 10,323 | | | | 5,049 | | | | 1,784 | |
General and Administrative Expense | | | 5,526 | | | | 4,246 | | | | 3,320 | | | | 1,853 | | | | 851 | |
Property Management Fee to Related Party | | | 948 | | | | 656 | | | | 491 | | | | 160 | | | | 41 | |
Investment Management Fee to Related Party | | | 11,595 | | | | 7,803 | | | | 3,964 | | | | 1,547 | | | | 739 | |
Class C Fee to Related Party | | | — | | | | — | | | | — | | | | — | | | | 145 | |
Acquisition Expenses | | | 17,531 | | | | 5,832 | | | | — | | | | — | | | | — | |
Depreciation and Amortization | | | 32,125 | | | | 25,093 | | | | 17,171 | | | | 8,050 | | | | 4,618 | |
Loss on Impairment | | | — | | | | 9,160 | | | | — | | | | — | | | | — | |
| | | | | | | | | | | | | | | | | | | | |
Total Expenses | | | 102,189 | | | | 76,766 | | | | 43,996 | | | | 19,494 | | | | 10,141 | |
| | | | | | | | | | | | | | | | | | | | |
Other Income and Expenses | | | | | | | | | | | | | | | | | | | | |
Interest and Other Income | | | 1,260 | | | | 344 | | | | 2,039 | | | | 2,855 | | | | 255 | |
Net Settlement (Payments) Receipts on Interest Rate Swaps | | | (1,096 | ) | | | (660 | ) | | | 65 | | | | — | | | | — | |
Gain (Loss) on Interest Rate Swaps and Cap | | | 23 | | | | 89 | | | | (1,496 | ) | | | — | | | | — | |
(Loss) Gain on Note Payable at Fair Value | | | (118 | ) | | | (807 | ) | | | 1,168 | | | | — | | | | — | |
Loss on Early Extinguishment of Debt | | | (72 | ) | | | — | | | | — | | | | — | | | | — | |
Loss on Transfer of Real Estate Held for Sale to Continuing Operations | | | — | | | | — | | | | (3,451 | ) | | | — | | | | — | |
| | | | | | | | | | | | | | | | | | | | |
Total Other Income and (Expenses) | | | (3 | ) | | | (1,034 | ) | | | (1,675 | ) | | | 2,855 | | | | 255 | |
| | | | | | | | | | | | | | | | | | | | |
(Loss) Income Before (Provision) Benefit for Income Taxes and Equity in Income (Loss) of Unconsolidated Entities | | | (18,653 | ) | | | (21,476 | ) | | | (5,522 | ) | | | 22 | | | | (1,426 | ) |
(Provision) Benefit for Income Taxes | | | (296 | ) | | | (169 | ) | | | 82 | | | | (279 | ) | | | — | |
Equity in Income (Loss) of Unconsolidated Entities | | | 8,838 | | | | 2,743 | | | | (1,242 | ) | | | (150 | ) | | | — | |
| | | | | | | | | | | | | | | | | | | | |
Net Loss From Continuing Operations | | | (10,111 | ) | | | (18,902 | ) | | | (6,682 | ) | | | (407 | ) | | | (1,426 | ) |
Loss From Discontinued Operations | | | (507 | ) | | | — | | | | — | | | | — | | | | — | |
| | | | | | | | | | | | | | | | | | | | |
Net Loss | | | (10,618 | ) | | | (18,902 | ) | | | (6,682 | ) | | | (407 | ) | | | (1,426 | ) |
Net Loss Attributable to Non-Controlling Operating Partnership Units | | | 18 | | | | 54 | | | | 26 | | | | 4 | | | | (1,058 | ) |
| | | | | | | | | | | | | | | | | | | | |
Net Loss Attributable to CB Richard Ellis Realty Trust Shareholders | | $ | (10,600 | ) | | $ | (18,848 | ) | | $ | (6,656 | ) | | $ | (403 | ) | | $ | (2,484 | ) |
| | | | | | | | | | | | | | | | | | | | |
Per Share Data: | | | | | | | | | | | | | | | | | | | | |
Basic and Diluted Net Loss Per Share from Continuing Operations | | $ | (0.08 | ) | | $ | (0.23 | ) | | $ | (0.14 | ) | | $ | (0.02 | ) | | $ | (0.35 | ) |
Basic and Diluted Net Loss Per Share from Discontinued Operations | | $ | — | | | $ | — | | | $ | — | | | $ | — | | | $ | — | |
| | | | | | | | | | | | | | | | | | | | |
Weighted Average Common Shares Outstanding—Basic and Diluted | | | 136,456,565 | | | | 81,367,593 | | | | 46,089,680 | | | | 18,545,418 | | | | 7,010,722 | |
Dividends Declared Per Share | | $ | 0.60 | | | $ | 0.60 | | | $ | 0.59 | | | $ | 0.54 | | | $ | 0.50 | |
66
| | | | | | | | | | | | | | | | | | | | |
| | | December 31, | |
| | | 2010 | | | 2009 | | | 2008 | | | 2007 | | | 2006 | |
Balance Sheet Data: | | | | | | | | | | | | | | | | | | | | |
Investments in Real Estate, After Accumulated Depreciation and Amortization | | $ | 1,055,975 | | | $ | 639,573 | | | $ | 484,827 | | | $ | 309,805 | | | $ | 70,650 | |
Investments in Unconsolidated Entities | | | 410,062 | | | | 214,097 | | | | 131,703 | | | | 101 | | | | — | |
Real Estate and Other Assets Held for Sale | | | 22,056 | | | | — | | | | — | | | | — | | | | — | |
Total Assets | | | 1,716,720 | | | | 1,059,019 | | | | 709,920 | | | | 435,751 | | | | 97,807 | |
Notes Payable | | | 365,592 | | | | 212,425 | | | | 177,161 | | | | 116,876 | | | | 34,975 | |
Loan Payable | | | 60,000 | | | | — | | | | — | | | | 45,000 | | | | — | |
Liabilities Related to Real Estate and Other Assets Held for Sale | | | 441 | | | | — | | | | — | | | | — | | | | — | |
Total Liabilities | | | 491,954 | | | | 256,556 | | | | 220,249 | | | | 189,224 | | | | 44,834 | |
Non-controlling Interest | | | 2,464 | | | | 2,464 | | | | 2,464 | | | | 2,464 | | | | 2,464 | |
Shareholders’ Equity | | | 1,222,302 | | | | 799,999 | | | | 487,207 | | | | 244,063 | | | | 50,509 | |
Total Liabilities and Shareholders’ Equity | | | 1,716,720 | | | | 1,059,019 | | | | 709,920 | | | | 435,751 | | | | 97,807 | |
67
| ITEM 7. | MANAGEMENT’S DISCUSSION AND ANALYSIS OF FINANCIAL CONDITION AND RESULTS OF OPERATIONS |
Explanatory Note
The following discussion and analysis of our financial condition and results of operations should be read in conjunction with our audited consolidated financial statements, the notes thereto, and the other financial data included elsewhere in this Form 10-K.
Cautionary Note Regarding Forward-Looking Statements
This document contains various “forward-looking statements.” You can identify forward-looking statements by the use of forward-looking terminology such as “believes,” “expects,” “may,” “will,” “would,” “could,” “should,” “seeks,” “approximately,” “intends,” “plans,” “projects,” “estimates” or “anticipates” or the negative of these words and phrases or similar words or phrases. You can also identify forward-looking statements by discussions of strategy, plans or intentions. Statements regarding the following subjects may be impacted by a number of risks and uncertainties:
| | ¡ | | our ability to obtain future financing arrangements; |
| | ¡ | | estimates relating to our future distributions; |
| | ¡ | | our understanding of our competition; |
| | ¡ | | projected capital expenditures; |
| | ¡ | | the impact of technology on our products, operations and business; and |
| | ¡ | | the use of the proceeds of our current offering and subsequent offerings. |
The forward-looking statements are based on our beliefs, assumptions and expectations of our future performance, taking into account all information currently available to us. These beliefs, assumptions and expectations are subject to risks and uncertainties and can change as a result of many possible events or factors, not all of which are known to us. If a change occurs, our business, financial condition, liquidity and results of operations may vary materially from those expressed in our forward-looking statements. You should carefully consider these risks before you make an investment decision with respect to our common shares, along with the following factors that could cause actual results to vary from our forward-looking statements:
| | ¡ | | national, regional and local economic climates; |
| | ¡ | | the continued volatility and disruption of capital and credit markets; |
| | ¡ | | changes in supply and demand for office, industrial, retail and multi-family residential properties; |
| | ¡ | | adverse changes in the real estate markets, including increasing vacancy, decreasing rental revenue and increasing insurance costs; |
| | ¡ | | availability and credit worthiness of prospective tenants; |
| | ¡ | | our ability to maintain rental rates and maximize occupancy; |
| | ¡ | | our ability to identify acquisitions; |
| | ¡ | | our pace of acquisitions and/or dispositions of properties; |
| | ¡ | | our corporate debt ratings and changes in the general interest rate environment; |
| | ¡ | | availability of capital (debt and equity); |
| | ¡ | | our ability to refinance existing indebtedness or incur additional indebtedness; |
| | ¡ | | unanticipated increases in financing and other costs, including a rise in interest rates; |
| | ¡ | | the actual outcome of the resolution of any conflict; |
| | ¡ | | our ability to successfully operate acquired properties; |
| | ¡ | | availability of and ability to retain qualified personnel; |
68
| | ¡ | | CBRE Advisors LLC remaining as our Investment Advisor; |
| | ¡ | | future terrorist attacks in the United States or abroad; |
| | ¡ | | our ability to qualify as a partnership for U.S. federal income tax purposes; |
| | ¡ | | foreign currency fluctuations; |
| | ¡ | | accounting principles and policies and guidelines applicable to REITs; |
| | ¡ | | legislative or regulatory changes adversely affecting REITs and the real estate business; |
| | ¡ | | environmental, regulatory and/or safety requirements; and |
| | ¡ | | other factors discussed under Item 1A Risk Factors of this Annual Report on Form 10-K for the year ended December 31, 2010 and those factors that may be contained in any filing we make with the SEC, including Part II, Item 1A of Form 10-Qs |
We undertake no obligation to publicly update or revise any forward-looking statements, whether as a result of future events, new information or otherwise. For a further discussion of these and other factors that could impact our future results, performance or transactions, see Item 1A. “Risk Factors.”
Overview
We are a Maryland real estate investment trust that invests in real estate properties, focusing on office, industrial (primarily warehouse/distribution), retail and potentially multi-family residential properties, as well as other real estate-related assets. We may also utilize our expertise and resources to capitalize on unique opportunities that may exist elsewhere in the marketplace, in which we might also acquire interests in mortgages or other investments where we could seek to acquire the underlying property. We will not invest more than 20% of our total assets in any single investment. We intend to invest primarily in properties located in geographically-diverse major metropolitan areas in the United States. In addition, we currently intend to invest up to 30% of our total assets in properties outside of the United States. Our international investments may be in markets in which CBRE Investors has existing operations or previous investment experience, or may be in partnership with other entities that have significant local-market expertise. We expect that our international investments will focus on properties typically located in significant business districts and suburban markets.
As of December 31, 2010, we owned, on a consolidated basis, 73 office, industrial (primarily warehouse/distribution) and retail properties located in 15 states (Arizona, California, Florida, Georgia, Illinois, Massachusetts, Minnesota, New Jersey, North Carolina, Ohio, South Carolina, Texas, Utah and Virginia) and in the United Kingdom encompassing approximately 12,800,000 rentable square feet in the aggregate. In addition, we have ownership interests in five unconsolidated entities that, as of December 31, 2010, owned interests in 38 properties. Excluding those properties owned through our investment in CB Richard Ellis Strategic Partners Asia II, L.P. (“CBRE Strategic Partners Asia”), we owned, on an unconsolidated basis, 30 industrial, office and retail properties located in eight states (Arizona, Florida, Indiana, Missouri, North Carolina, Ohio, Tennessee and Texas) and in the United Kingdom and Europe encompassing approximately 9,901,000 rentable square feet in the aggregate.
We commenced operations in July 2004, following an initial private placement of our common shares of beneficial interest. We raised aggregate net proceeds (after commissions and expenses) of approximately $55,500,000 from July 2004 to October 2004 in private placements of our common shares. On October 24, 2006, we commenced an initial public offering of up to $2,000,000,000 in our common shares.
Our initial public offering was terminated effective as of the close of business on January 29, 2009. As of the close of business on January 29, 2009, we had sold a total of 60,808,967 common shares in the initial public offering, including 1,487,943 common shares which were issued pursuant to our dividend reinvestment plan, and received $607,345,702 in gross proceeds. We withdrew from registration a total of 140,243,665 common shares that were registered but not sold in connection with the initial public offering.
The registration statement relating to our follow-on public offering was declared effective by the Securities and Exchange Commission (the “SEC”) on January 30, 2009. CNL Securities Corp. is the dealer manager of our offering. The registration statement covers up to $3,000,000,000 in common shares of beneficial interest, 90% of which will be offered at a price of $10.00 per share, and 10% of which will be offered pursuant to our dividend reinvestment plan at a purchase price equal to the higher of $9.50 per share or 95% of the fair market value of a common share on the reinvestment date, as determined by the Investment Advisor, or another firm we choose for that purpose. We reserve the right to reallocate the shares between the primary offering and our dividend reinvestment plan. From January 30, 2009 (effective date) through December 31, 2010, we received gross offering proceeds of approximately $1,010,076,294 from the sale of 101,245,478 shares.
69
We are externally managed by CBRE Advisors LLC, or the Investment Advisor, and all of our real estate investments are held directly by, or indirectly through wholly owned subsidiaries of, CBRE Operating Partnership, L.P., or CBRE OP. Generally, we contribute the proceeds we receive from the issuance of common shares for cash to CBRE OP and CBRE OP, in turn, issues units of limited partnership to us, which entitle us to receive our share of CBRE OP’s earnings or losses and net cash flow. Provided we have sufficient available cash flow, we intend to pay our shareholders quarterly cash dividends. We are structured in a manner that allows CBRE OP to issue limited partnership interests from time to time in exchange for real estate properties. By structuring our acquisitions in this manner, the contributors of real estate to CBRE OP are generally able to defer gain recognition for U.S. federal income tax purposes. We have elected to be taxed as a real estate investment trust, or REIT, for U.S. federal income tax purposes. As a REIT, we generally will not be subject to U.S. federal income tax on that portion of our income that is distributed to our shareholders if at least 90% of our net taxable income is distributed to our shareholders.
Our business objective is to maximize shareholder value through: (1) maintaining an experienced management team of investment professionals; (2) investing in properties in certain markets where property fundamentals will support stable income returns and where capital appreciation is expected to be above average; (3) acquiring properties at a discount to replacement cost and where there is expected positive rent growth; and (4) repositioning properties to increase their value in the market place. Operating results at our individual properties are impacted by the supply and demand for office, industrial, retail and multifamily space, trends of the national regional economies, the financial health of current and prospective tenants and their customers, capital and credit market trends, construction costs, and interest rate movements. Individual operating property performance is monitored and calculated using certain non-GAAP financial measures such as an analysis of net operating income. An analysis of net operating income as compared to local regional and national statistics may provide insight into short or longer term trends exclusive of capital markets or capital structuring issues. Interest rates are a critical factor in our results of operations. Our properties may be financed with significant amounts of debt, so changes in interest rates may affect both net income and the health of capital markets. For investments outside of the United States, in addition to monitoring local property market fundamentals and capital and credit market trends, we evaluate currency hedging strategies, taxes, the stability of the local government and economy and the experience of our management team in the region.
Beginning in the second half of 2007, U.S. economic activity weakened due initially to stresses in the residential housing and financial sectors. The weak economic environment continued through 2008 and 2009, but strengthened somewhat in 2010, yet the timing of a full economic recovery remains uncertain at this time. A weakened economic environment may result in declining demand for office, industrial and retail space, increasing tenant bankruptcies, lower average occupancy rates and effective rents, including potentially in our real estate portfolio, which may impact our net income, funds from operations and cash flow.
Additionally, during the first half of 2009, the capital markets experienced significant distress during which many financial industry participants, including commercial real estate owners, operators, investors and lenders found it challenging to obtain cost-effective debt capital to finance new investment activity or to refinance maturing debt. During the later part of 2009 the capital market environment improved such that it appeared to show signs of stabilizing over this period. Further, during 2010, the capital market environment continued to improve, building upon the stabilization that occurred during the end of 2009. During 2010, we experienced indications of that stabilization and have had improved access to debt financing on attractive terms. Also, during 2010 we have noted a strengthening of the commercial real estate market, especially for high-quality stabilized properties leased to credit worthy tenants on a long-tern basis. Nonetheless, we expect that certain highly-levered real estate investors may continue to face significantly-reduced, or even eliminated, availability of funding sources, or at significantly-increased cost. As such, with our modest levels of leverage, we expect we will continue to benefit from improved access to attractive investment opportunities and reduced competition to acquire real estate assets.
70
The table below provides information relating to our properties, excluding those owned through our investment in CBRE Strategic Partners Asia, as of December 31, 2010. We purchased all of these properties from unaffiliated third parties. These properties are subject to competition from similar properties within their market areas and their economic performance could be affected by changes in local economic conditions. In evaluating these properties for acquisition, we considered a variety of factors including location, functionality and design, price per square foot, the credit worthiness of tenants, length of lease terms, market fundamentals and the in-place rental rates compared to market rates.
| | | | | | | | | | | | | | | | | | | | | | | | | | |
Property and Market | | Date
Acquired | | | Year
Built | | | Property Type | | Our
Effective
Ownership | | | Net Rentable
Square Feet
(in thousands) | | | Percentage
Leased | | | Approximate
Total
Acquisition Cost(1)
(in thousands) | |
Domestic Consolidated Properties: | | | | | | | | | | | | | | | | | | | | | | | | | | |
REMEC Corporate Campus 1
San Diego, CA | | | 9/15/2004 | | | | 1983 | | | Office | | | 100.00 | % | | | 34 | | | | 100.00 | % | | $ | 6,833 | |
REMEC Corporate Campus 2
San Diego, CA | | | 9/15/2004 | | | | 1983 | | | Office | | | 100.00 | % | | | 30 | | | | 100.00 | % | | | 6,125 | |
REMEC Corporate Campus 3
San Diego, CA | | | 9/15/2004 | | | | 1983 | | | Office | | | 100.00 | % | | | 37 | | | | 100.00 | % | | | 7,523 | |
REMEC Corporate Campus 4
San Diego, CA | | | 9/15/2004 | | | | 1983 | | | Office | | | 100.00 | % | | | 31 | | | | 100.00 | % | | | 6,186 | |
300 Constitution Drive
Boston, MA | | | 11/3/2004 | | | | 1998 | | | Warehouse/Distribution | | | 100.00 | % | | | 330 | | | | 100.00 | % | | | 19,805 | |
Deerfield Commons(2)
Atlanta, GA | | | 6/21/2005 | | | | 2000 | | | Office | | | 100.00 | % | | | 122 | | | | 100.00 | % | | | 21,834 | |
505 Century(3)
Dallas, TX | | | 1/9/2006 | | | | 1997 | | | Warehouse/Distribution | | | 100.00 | % | | | 100 | | | | 100.00 | % | | | 6,095 | |
631 International(3)
Dallas, TX | | | 1/9/2006 | | | | 1998 | | | Warehouse/Distribution | | | 100.00 | % | | | 73 | | | | 100.00 | % | | | 5,407 | |
660 North Dorothy(3)
Dallas, TX | | | 1/9/2006 | | | | 1997 | | | Warehouse/Distribution | | | 100.00 | % | | | 120 | | | | 87.50 | % | | | 6,836 | |
Bolingbrook Point III
Chicago, IL | | | 8/29/2007 | | | | 2006 | | | Warehouse/Distribution | | | 100.00 | % | | | 185 | | | | 53.18 | % | | | 18,170 | |
Cherokee Corporate Park(3)
Spartanburg, SC | | | 8/30/2007 | | | | 2000 | | | Warehouse/Distribution | | | 100.00 | % | | | 60 | | | | 0.00 | % | | | 3,775 | |
Community Cash Complex 1(3)
Spartanburg, SC | | | 8/30/2007 | | | | 1960 | | | Warehouse/Distribution | | | 100.00 | % | | | 205 | | | | 39.64 | % | | | 2,690 | |
Community Cash Complex 2(3)
Spartanburg, SC | | | 8/30/2007 | | | | 1978 | | | Warehouse/Distribution | | | 100.00 | % | | | 145 | | | | 85.50 | % | | | 2,225 | |
Community Cash Complex 3(3)
Spartanburg, SC | | | 8/30/2007 | | | | 1981 | | | Warehouse/Distribution | | | 100.00 | % | | | 116 | | | | 100.00 | % | | | 1,701 | |
Community Cash Complex 4(3)
Spartanburg, SC | | | 8/30/2007 | | | | 1984 | | | Warehouse/Distribution | | | 100.00 | % | | | 33 | | | | 100.00 | % | | | 547 | |
Community Cash Complex 5(3)
Spartanburg, SC | | | 8/30/2007 | | | | 1984 | | | Warehouse/Distribution | | | 100.00 | % | | | 53 | | | | 100.00 | % | | | 824 | |
Fairforest Building 1(3)
Spartanburg, SC | | | 8/30/2007 | | | | 2000 | | | Manufacturing | | | 100.00 | % | | | 51 | | | | 100.00 | % | | | 2,974 | |
Fairforest Building 2(3)
Spartanburg, SC | | | 8/30/2007 | | | | 1999 | | | Manufacturing | | | 100.00 | % | | | 104 | | | | 100.00 | % | | | 5,379 | |
Fairforest Building 3(3)
Spartanburg, SC | | | 8/30/2007 | | | | 2000 | | | Manufacturing | | | 100.00 | % | | | 100 | | | | 100.00 | % | | | 5,760 | |
Fairforest Building 4(3)
Spartanburg, SC | | | 8/30/2007 | | | | 2001 | | | Manufacturing | | | 100.00 | % | | | 101 | | | | 100.00 | % | | | 5,640 | |
Fairforest Building 5
Spartanburg, SC | | | 8/30/2007 | | | | 2006 | | | Warehouse/Distribution | | | 100.00 | % | | | 316 | | | | 100.00 | % | | | 16,968 | |
Fairforest Building 6
Spartanburg, SC | | | 8/30/2007 | | | | 2005 | | | Manufacturing | | | 100.00 | % | | | 101 | | | | 100.00 | % | | | 7,469 | |
Fairforest Building 7(3)
Spartanburg, SC | | | 8/30/2007 | | | | 2006 | | | Warehouse/Distribution | | | 100.00 | % | | | 101 | | | | 83.78 | % | | | 5,626 | |
Greenville/Spartanburg Industrial Park(3)
Spartanburg, SC | | | 8/30/2007 | | | | 1990 | | | Manufacturing | | | 100.00 | % | | | 67 | | | | 100.00 | % | | | 3,388 | |
Highway 290 Commerce Park Building 1(3)
Spartanburg, SC | | | 8/30/2007 | | | | 1995 | | | Warehouse/Distribution | | | 100.00 | % | | | 150 | | | | 100.00 | % | | | 5,388 | |
Highway 290 Commerce Park Building 5(3)
Spartanburg, SC | | | 8/30/2007 | | | | 1993 | | | Warehouse/Distribution | | | 100.00 | % | | | 30 | | | | 100.00 | % | | | 1,420 | |
Highway 290 Commerce Park Building 7(3)
Spartanburg, SC | | | 8/30/2007 | | | | 1994 | | | Warehouse/Distribution | | | 100.00 | % | | | 88 | | | | 0.00 | % | | | 4,889 | |
HJ Park Building 1
Spartanburg, SC | | | 8/30/2007 | | | | 2003 | | | Manufacturing | | | 100.00 | % | | | 70 | | | | 100.00 | % | | | 4,216 | |
Jedburg Commerce Park(3)
Charleston, SC | | | 8/30/2007 | | | | 2007 | | | Manufacturing | | | 100.00 | % | | | 513 | | | | 100.00 | % | | | 41,991 | |
71
| | | | | | | | | | | | | | | | | | | | | | | | | | |
Property and Market | | Date
Acquired | | | Year
Built | | | Property Type | | Our
Effective
Ownership | | | Net Rentable
Square Feet
(in thousands) | | | Percentage
Leased | | | Approximate
Total
Acquisition Cost(1)
(in thousands) | |
Kings Mountain I
Charlotte, NC | | | 8/30/2007 | | | | 1998 | | | Warehouse/Distribution | | | 100.00 | % | | | 100 | | | | 100.00 | % | | | 5,497 | |
Kings Mountain II
Charlotte, NC | | | 8/30/2007 | | | | 2002 | | | Warehouse/Distribution | | | 100.00 | % | | | 301 | | | | 100.00 | % | | | 11,311 | |
Mount Holly Building
Charleston, SC | | | 8/30/2007 | | | | 2003 | | | Warehouse/Distribution | | | 100.00 | % | | | 101 | | | | 100.00 | % | | | 6,208 | |
North Rhett I
Charleston, SC | | | 8/30/2007 | | | | 1973 | | | Warehouse/Distribution | | | 100.00 | % | | | 285 | | | | 100.00 | % | | | 10,302 | |
North Rhett II
Charleston, SC | | | 8/30/2007 | | | | 2001 | | | Warehouse/Distribution | | | 100.00 | % | | | 102 | | | | 100.00 | % | | | 7,073 | |
North Rhett III
Charleston, SC | | | 8/30/2007 | | | | 2002 | | | Warehouse/Distribution | | | 100.00 | % | | | 80 | | | | 100.00 | % | | | 4,812 | |
North Rhett IV
Charleston, SC | | | 8/30/2007 | | | | 2005 | | | Warehouse/Distribution | | | 100.00 | % | | | 316 | | | | 100.00 | % | | | 17,060 | |
Orangeburg Park Building
Charleston, SC | | | 8/30/2007 | | | | 2003 | | | Warehouse/Distribution | | | 100.00 | % | | | 101 | | | | 100.00 | % | | | 5,474 | |
Orchard Business Park 2(3)
Spartanburg, SC | | | 8/30/2007 | | | | 1993 | | | Warehouse/Distribution | | | 100.00 | % | | | 18 | | | | 100.00 | % | | | 761 | |
Union Cross Building I
Winston-Salem, NC | | | 8/30/2007 | | | | 2005 | | | Warehouse/Distribution | | | 100.00 | % | | | 101 | | | | 100.00 | % | | | 6,585 | |
Union Cross Building II
Winston-Salem, NC | | | 8/30/2007 | | | | 2005 | | | Warehouse/Distribution | | | 100.00 | % | | | 316 | | | | 36.38 | % | | | 17,216 | |
Highway 290 Commerce Park Building 2(3)
Spartanburg, SC | | | 9/24/2007 | | | | 1995 | | | Warehouse/Distribution | | | 100.00 | % | | | 100 | | | | 100.00 | % | | | 4,626 | |
Highway 290 Commerce Park Building 6(3)
Spartanburg, SC | | | 11/1/2007 | | | | 1996 | | | Warehouse/Distribution | | | 100.00 | % | | | 105 | | | | 42.86 | % | | | 3,760 | |
Orchard Business Park 1(3)
Spartanburg, SC | | | 11/1/2007 | | | | 1994 | | | Warehouse/Distribution | | | 100.00 | % | | | 33 | | | | 0.00 | % | | | 1,378 | |
Lakeside Office Center
Dallas, TX | | | 3/5/2008 | | | | 2006 | | | Office | | | 100.00 | % | | | 99 | | | | 90.61 | % | | | 17,994 | |
Kings Mountain III(3)
Charlotte, NC | | | 3/14/2008 | | | | 2007 | | | Warehouse/Distribution | | | 100.00 | % | | | 542 | | | | 0.00 | % | | | 25,728 | |
Enclave on the Lake
Houston, TX | | | 7/1/2008 | | | | 1999 | | | Office | | | 100.00 | % | | | 171 | | | | 100.00 | % | | | 37,827 | |
Avion Midrise III
Washington, DC | | | 11/18/2008 | | | | 2002 | | | Office | | | 100.00 | % | | | 71 | | | | 100.00 | % | | | 21,111 | |
Avion Midrise IV
Washington, DC | | | 11/18/2008 | | | | 2002 | | | Office | | | 100.00 | % | | | 72 | | | | 100.00 | % | | | 21,112 | |
13201 Wilfred
Minneapolis, MN | | | 6/29/2009 | | | | 1999 | | | Warehouse/Distribution | | | 100.00 | % | | | 335 | | | | 100.00 | % | | | 15,340 | |
3011, 3055 & 3077 Comcast Place
East Bay, CA | | | 7/1/2009 | | | | 1988 | | | Office | | | 100.00 | % | | | 220 | | | | 100.00 | % | | | 49,000 | |
140 Depot Street
Boston, MA | | | 7/31/2009 | | | | 2007 | | | Warehouse/Distribution | | | 100.00 | % | | | 238 | | | | 100.00 | % | | | 18,950 | |
12650 Ingenuity Drive
Orlando, FL | | | 8/5/2009 | | | | 1999 | | | Office | | | 100.00 | % | | | 125 | | | | 100.00 | % | | | 25,350 | |
Crest Ridge Corporate Center 1
Minneapolis, MN | | | 8/17/2009 | | | | 2009 | | | Office | | | 100.00 | % | | | 116 | | | | 100.00 | % | | | 28,419 | |
West Point Trade Center
Jacksonville, FL | | | 12/30/2009 | | | | 2009 | | | Warehouse/Distribution | | | 100.00 | % | | | 602 | | | | 100.00 | % | | | 29,000 | |
5160 Hacienda Drive
East Bay, CA | | | 4/8/2010 | | | | 1988 | | | Office | | | 100.00 | % | | | 202 | | | | 100.00 | % | | | 38,500 | |
10450 Pacific Center Court
San Diego, CA | | | 5/7/2010 | | | | 1985 | | | Office | | | 100.00 | % | | | 134 | | | | 100.00 | % | | | 32,750 | |
225 Summit Ave
New York, NY | | | 6/21/2010 | | | | 1966 | | | Office | | | 100.00 | % | | | 143 | | | | 100.00 | % | | | 40,600 | |
One Wayside Road
Boston, MA | | | 6/24/2010 | | | | 1998 | | | Office | | | 100.00 | % | | | 200 | | | | 100.00 | % | | | 55,525 | |
100 Tice Blvd.
New York, NY | | | 9/28/2010 | | | | 2007 | | | Office | | | 100.00 | % | | | 209 | | | | 100.00 | % | | | 67,600 | |
Ten Parkway North
Chicago, IL | | | 10/12/2010 | | | | 1999 | | | Office | | | 100.00 | % | | | 100 | | | | 100.00 | % | | | 25,000 | |
4701 Gold Spike Drive(3)
Dallas, TX | | | 10/27/2010 | | | | 2002 | | | Warehouse/Distribution | | | 100.00 | % | | | 420 | | | | 100.00 | % | | | 20,300 | |
1985 International Way(3)
Cincinnati, OH | | | 10/27/2010 | | | | 1998 | | | Warehouse/Distribution | | | 100.00 | % | | | 189 | | | | 100.00 | % | | | 14,800 | |
Rickenbacker II(3)(10)
Columbus, OH | | | 10/27/2010 | | | | 1999 | | | Warehouse/Distribution | | | 100.00 | % | | | 434 | | | | 47.37 | % | | | 8,600 | |
72
| | | | | | | | | | | | | | | | | | | | | | | | | | |
Property and Market | | Date
Acquired | | | Year
Built | | | Property Type | | Our
Effective
Ownership | | | Net Rentable
Square Feet
(in thousands) | | | Percentage
Leased | | | Approximate
Total
Acquisition Cost(1)
(in thousands) | |
Summit Distribution Center(3)
Salt Lake City, UT | | | 10/27/2010 | | | | 2001 | | | Warehouse/Distribution | | | 100.00 | % | | | 275 | | | | 100.00 | % | | | 13,400 | |
3660 Deerpark Boulevard(3)
Jacksonville, FL | | | 10/27/2010 | | | | 2002 | | | Warehouse/Distribution | | | 100.00 | % | | | 322 | | | | 100.00 | % | | | 15,300 | |
Tolleson Commerce Park II(3)
Phoenix, AZ | | | 10/27/2010 | | | | 1999 | | | Warehouse/Distribution | | | 100.00 | % | | | 217 | | | | 100.00 | % | | | 9,200 | |
Pacific Corporate Park(2)
Washington, DC | | | 11/15/2010 | | | | 2002 | | | Office | | | 100.00 | % | | | 696 | | | | 100.00 | % | | | 144,500 | |
100 Kimball Drive(3)
Newark, NJ | | | 12/10/2010 | | | | 2006 | | | Office | | | 100.00 | % | | | 175 | | | | 100.00 | % | | | 60,250 | |
Rickenbacker III(3)(10)
Columbus, OH | | | 12/17/2010 | | | | 2001 | | | Warehouse/Distribution | | | 100.00 | % | | | 676 | | | | 60.71 | % | | | 13,400 | |
| | | | | | | | | | | | | | | | | | | | | | | | | | |
Total Domestic Consolidated Properties | | | | 12,510 | | | | 85.17 | % | | | 1,179,303 | |
| | | | | | | | | | | | | | | | | | | | | | | | | | |
International Consolidated Properties: | | | | | | | | | | | | | | | | | | | | | | | |
602 Central Blvd.(3)
Coventry, UK | | | 4/27/2007 | | | | 2001 | | | Office | | | 100.000.00 | % | | | 50 | | | | 0.00 | % | | | 23,847 | |
Thames Valley Five
Reading, UK | | | 3/20/2008 | | | | 1998 | | | Office | | | 100.000.00 | % | | | 40 | | | | 100.00 | % | | | 29,572 | |
Albion Mills Retail Park
Wakefield, UK | | | 7/11/2008 | | | | 2000 | | | Retail | | | 100.000.00 | % | | | 55 | | | | 100.00 | % | | | 22,098 | |
Maskew Retail Park
Peterborough, UK | | | 10/23/2008 | | | | 2007 | | | Retail | | | 100.000.00 | % | | | 145 | | | | 100.00 | % | | | 53,740 | |
| | | | | | | | | | | | | | | | | | | | | | | | | | |
Total International Consolidated Properties | | | | 290 | | | | 82.77 | % | | | 129,257 | |
| | | | | | | | | | | | | | | | | | | | | | | | | | |
Total Consolidated Properties | | | | 12,800 | | | | 85.12 | % | | | 1,308,560 | |
| | | | | | | | | | | | | | | | | | | | | | | | | | |
Domestic Unconsolidated Properties(4) : | | | | | | | | | | | | | | | | | | | | | | | |
Buckeye Logistics Center(5)
Phoenix, AZ | | | 6/12/2008 | | | | 2008 | | | Warehouse/Distribution | | | 80.00 | % | | | 605 | | | | 100.00 | % | | | 35,573 | |
Afton Ridge Shopping Center(6)
Charlotte, NC | | | 9/18/2008 | | | | 2007 | | | Retail | | | 90.00 | % | | | 296 | | | | 95.43 | % | | | 44,530 | |
AllPoints at Anson Bldg. 1(5)
Indianapolis, IN | | | 9/30/2008 | | | | 2008 | | | Warehouse/Distribution | | | 80.00 | % | | | 631 | | | | 100.00 | % | | | 27,150 | |
12200 President’s Court(5)
Jacksonville, FL | | | 9/30/2008 | | | | 2008 | | | Warehouse/Distribution | | | 80.00 | % | | | 772 | | | | 100.00 | % | | | 29,995 | |
201 Sunridge Blvd.(5)
Dallas, TX | | | 9/30/2008 | | | | 2008 | | | Warehouse/Distribution | | | 80.00 | % | | | 823 | | | | 100.00 | % | | | 25,690 | |
Aspen Corporate Center 500(5)
Nashville, TN | | | 9/30/2008 | | | | 2008 | | | Office | | | 80.00 | % | | | 180 | | | | 100.00 | % | | | 30,033 | |
125 Enterprise Parkway(5)
Columbus, OH | | | 12/10/2008 | | | | 2008 | | | Warehouse/Distribution | | | 80.00 | % | | | 1,142 | | | | 100.00 | % | | | 38,088 | |
AllPoints Midwest Bldg.I(5)
Indianapolis, IN | | | 12/10/2008 | | | | 2008 | | | Warehouse/Distribution | | | 80.00 | % | | | 1,200 | | | | 100.00 | % | | | 41,428 | |
Celebration Office Center(5)
Orlando, FL | | | 5/13/2009 | | | | 2009 | | | Office | | | 80.00 | % | | | 101 | | | | 100.00 | % | | | 13,640 | |
22535 Colonial Pkwy(3)(5)
Houston, TX | | | 5/13/2009 | | | | 2009 | | | Office | | | 80.00 | % | | | 90 | | | | 100.00 | % | | | 11,596 | |
Fairfield Distribution Ctr. IX(3)(5)
Tampa, FL | | | 5/13/2009 | | | | 2008 | | | Warehouse/Distribution | | | 80.00 | % | | | 136 | | | | 100.00 | % | | | 7,151 | |
Northpoint III(5)
Orlando, FL | | | 10/15/2009 | | | | 2001 | | | Office | | | 80.00 | % | | | 108 | | | | 100.00 | % | | | 14,592 | |
Goodyear Crossing Ind. Park II(5)
Phoenix, AZ | | | 12/07/2009 | | | | 2009 | | | Warehouse/Distribution | | | 80.00 | % | | | 820 | | | | 100.00 | % | | | 36,516 | |
3900 North Paramount Parkway(5)
Raleigh, NC | | | 3/31/2010 | | | | 1999 | | | Office | | | 80.00 | % | | | 101 | | | | 100.00 | % | | | 11,176 | |
3900 South Paramount Parkway(5)
Raleigh, NC | | | 3/31/2010 | | | | 1999 | | | Office | | | 80.00 | % | | | 119 | | | | 100.00 | % | | | 13,055 | |
1400 Perimeter Park Drive(5)
Raleigh, NC | | | 3/31/2010 | | | | 1991 | | | Office | | | 80.00 | % | | | 45 | | | | 100.00 | % | | | 3,970 | |
Miramar I(5)(7)
Fort Lauderdale, FL | | | 3/31/2010 | | | | 2001 | | | Office | | | 80.00 | % | | | 94 | | | | 100.00 | % | | | 13,645 | |
Miramar II(5)(7)
Fort Lauderdale, FL | | | 3/31/2010 | | | | 2001 | | | Office | | | 80.00 | % | | | 129 | | | | 100.00 | % | | | 20,899 | |
McAuley Place(3)(5)
Cincinnati, OH | | | 12/21/2010 | | | | 2001 | | | Office | | | 80.00 | % | | | 191 | | | | 97.60 | % | | | 28,000 | |
Point West I(3)(5)
Dallas, TX | | | 12/21/2010 | | | | 2008 | | | Office | | | 80.00 | % | | | 183 | | | | 100.00 | % | | | 23,600 | |
Sam Houston Crossing I(3)(5)
Houston, TX | | | 12/21/2010 | | | | 2007 | | | Office | | | 80.00 | % | | | 160 | | | | 100.00 | % | | | 20,400 | |
73
| | | | | | | | | | | | | | | | | | | | | | | | | | |
Property and Market | | Date
Acquired | | | Year
Built | | | Property Type | | Our
Effective
Ownership | | | Net Rentable
Square Feet
(in thousands) | | | Percentage
Leased | | | Approximate
Total
Acquisition Cost(1)
(in thousands) | |
Regency Creek(3)(5)
Raleigh, NC | | | 12/21/2010 | | | | 2008 | | | Office | | | 80.00 | % | | | 122 | | | | 100.00 | % | | | 18,000 | |
Easton III(3)(5)
Columbus, OH | | | 12/21/2010 | | | | 1999 | | | Office | | | 80.00 | % | | | 135 | | | | 100.00 | % | | | 14,400 | |
533 Maryville Centre(3)(5)
St. Louis, MD | | | 12/21/2010 | | | | 2000 | | | Office | | | 80.00 | % | | | 125 | | | | 100.00 | % | | | 19,102 | |
555 Maryville Centre(3)(5)
St. Louis, MD | | | 12/21/2010 | | | | 1999 | | | Office | | | 80.00 | % | | | 127 | | | | 67.84 | % | | | 15,578 | |
| | | | | | | | | | | | | | | | | | | | | | | | | | |
Total Domestic Unconsolidated Properties | | | | 8,435 | | | | 99.30 | % | | | 557,807 | |
| | | | | | | | | | | | | | | | | | | | | | | | | | |
International Unconsolidated Properties | | | | | | | | | | | | | | | | | | | | | | | |
Amber Park(3)(8)
South Normanton, UK | | | 6/10/2010 | | | | 1997 | | | Warehouse/Distribution | | | 80.00 | % | | | 208 | | | | 100.00 | % | | | 12,514 | |
Brackmills(3)(8)
Northampton, UK | | | 6/10/2010 | | | | 1984 | | | Warehouse/Distribution | | | 80.00 | % | | | 187 | | | | 100.00 | % | | | 13,407 | |
Düren(3) (9)
Düren, Germany | | | 6/10/2010 | | | | 2008 | | | Warehouse/Distribution | | | 80.00 | % | | | 392 | | | | 100.00 | % | | | 13,148 | |
Schönberg(3)(9)
Schönberg, Germany | | | 6/10/2010 | | | | 2009 | | | Warehouse/Distribution | | | 80.00 | % | | | 454 | | | | 100.00 | % | | | 13,819 | |
Langenbach(3)(9)
Langenbach, Germany | | | 10/28/2010 | | | | 2010 | | | Warehouse/Distribution | | | 80.00 | % | | | 225 | | | | 100.00 | % | | | 18,573 | |
| | | | | | | | | | | | | | | | | | | | | | | | | | |
Total International Unconsolidated Properties | | | | 1,466 | | | | 100.00 | % | | | 71,461 | |
| | | | | | | | | | | | | | | | | | | | | | | | | | |
Total Unconsolidated Properties(4) | | | | 9,901 | | | | 99.40 | % | | | 629,268 | |
| | | | | | | | | | | | | | | | | | | | | | | | | | |
Total Properties(4) | | | | 22,701 | | | | 91.35 | % | | $ | 1,937,828 | |
| | | | | | | | | | | | | | | | | | | | | | | | | | |
| (1) | Approximate total acquisition cost represents the pro rata purchase price inclusive of customary closing costs and acquisition fees/acquisition expenses. |
| (2) | Includes undeveloped land zoned for future use. |
| (3) | This property is unencumbered and not secured by mortgage debt. |
| (4) | Does not include CBRE Strategic Partners Asia properties. |
| (5) | This property is held through the Duke joint venture. |
| (6) | This property is held through the Afton Ridge joint venture. |
| (7) | Consolidated properties acquired on December 31, 2009 and contributed to the Duke joint venture during March 2010. |
| (8) | This property is held through the UK JV. |
| (9) | This property is held through the European JV. |
| (10) | Real estate held for sale as of December 31, 2010. |
Critical Accounting Policies
Management believes our most critical accounting policies are accounting for lease revenues (including straight-line rent), regular evaluation of whether the value of a real estate asset has been impaired, real estate purchase price allocations and accounting for our derivatives and hedging activities, if any. Each of these items involves estimates that require management to make judgments that are subjective in nature. Management relies on its experience, collects historical data and current market data, and analyzes these assumptions in order to arrive at what it believes to be reasonable estimates. Under different conditions or assumptions, materially different amounts could be reported related to the accounting policies described below. In addition, application of these accounting policies involves the exercise of judgments on the use of assumptions as to future uncertainties and, as a result, actual results could materially differ from these estimates.
Revenue Recognition and Valuation of Receivables
All leases are classified as operating leases and minimum rents are recognized on a straight-line basis over the terms of the leases. The excess of rents recognized over amounts contractually due pursuant to the underlying leases is recorded as deferred rent. In connection with various leases, we have received irrevocable stand-by letters of credit totaling $6,515,000 and $6,785,000 as security for such leases at December 31, 2010 and 2009.
Reimbursements from tenants, consisting of amounts due from tenants for common area maintenance, real estate taxes, insurance and other recoverable costs, are recognized as revenue in the period the expenses are incurred. Tenant reimbursements are recognized and presented on a gross basis, when we are the primary obligor with respect to incurring expenses and with respect to having the credit risk.
74
Tenant receivables and deferred rent receivables are carried net of the allowances for uncollectible current tenant receivables and deferred rent. Management’s determination of the adequacy of these allowances is based primarily upon evaluations of historical loss experience, individual receivables, current economic conditions, and other relevant factors. The allowances are increased or decreased through the provision for bad debts. The allowance for uncollectible rent receivable was $83,000 and $183,000 as of December 31, 2010 and December 31, 2009, respectively. During the year ended December 31, 2010, we wrote off $310,000 of the uncollectible rent receivables for the tenant Randal C. Espey at the Deerfield Commons I property, tenants Cell Arch Technologies, Inc. and Keogh Consulting, Inc. at Lakeside Office Center, tenant Romeo Rim, Inc. at Cherokee Corporate Park, and the tenant Amax Engineering Corporation at 660 North Dorothy. $209,000 of allowance for doubtful accounts was recognized during the year ended December 31, 2010. In addition, the unamortized tangible and intangible asset balances totaling $27,000 were also written off during the year ended December 31, 2010, of which ($10,000), $5,000, $8,000 and $24,000 are related to above/below market leases, lease commissions, tenant improvements and in place lease value, respectively.
Investments in Real Estate and Related Long-Lived Assets (Impairment Evaluation)
We record investments in real estate at cost (including third-party acquisition expenses) and we capitalize improvements and replacements when they extend the useful life or improve the efficiency of the asset. We expense costs of repairs and maintenance as incurred. We compute depreciation using the straight-line method over the estimated useful lives of our real estate assets, which we expect to be approximately 39 years for buildings and improvements, three to five years for equipment and fixtures and the shorter of the useful life or the remaining lease term for tenant improvements and leasehold interests.
We are required to make subjective assessments as to the useful lives of our properties for purposes of determining the amount of depreciation to record on an annual basis with respect to our investments in real estate. These assessments have a direct impact on our net income because, if we were to shorten the expected useful lives of our investments in real estate, we would depreciate these investments over fewer years, resulting in more depreciation expense and lower net income on an annual basis throughout the expected useful lives of the related assets.
We have adopted,“Accounting for the Impairment or Disposal of Long-Lived Assets” (“FASB ASC 360-10”), which establishes a single accounting model for the impairment or disposal of long-lived assets including discontinued operations. This accounting provision requires that the operations related to properties that have been sold or that we intend to sell be presented as discontinued operations in the statement of operations for all periods presented, and properties we intend to sell be designated as “held for sale” on our balance sheet.
When circumstances such as adverse market conditions indicate a possible impairment of the value of a property, we review the recoverability of the property’s carrying value. The review of recoverability is based on our estimate of the future undiscounted cash flows, excluding interest charges, expected to result from the property’s use and eventual disposition. Our forecast of these cash flows considers factors such as expected future operating income, market and other applicable trends and residual value, as well as the effects of leasing demand, competition and other factors. These factors contain subjectivity and thus are not able to be precisely estimated. If impairment exists due to the inability to recover the carrying value of a property, an impairment loss is recorded to the extent that the carrying value exceeds the estimated fair value of the property. We are required to make subjective assessments as to whether there are impairments in the values of our investments in real estate.
We assess whether there has been impairment in the value of our long-lived assets whenever events or changes in circumstances indicate the carrying amount of an asset may not be recoverable. Recoverability of assets to be held and used is measured by a comparison of the carrying amount to the future net cash flows, undiscounted and without interest, expected to be generated by the asset. If such assets are considered to be impaired, the impairment to be recognized is measured by the amount by which the carrying amount of the assets exceeds the estimated fair value of the assets. The estimated fair value of the asset group identified for step two testing is based on either the income approach with market discount rate, terminal capitalization rate and rental rate assumptions being most critical, or on the sales comparison approach to similar properties. Assets to be disposed of are reported at the lower of the carrying amount or fair value, less costs to sell. In spite of intensive leasing efforts and preliminary interest exhibited by a variety of tenants since our acquisition in 2008, the Kings Mountain III property remained vacant through December 31, 2010; however, we entered into a long term lease with a food services company during February 2011. The tenant will occupy the entire 542,000 square foot building.
We recognized impairment for our consolidated investment in Kings Mountain III in the amount of $9,160,000 during the year ended December 31, 2009 which reduced our carrying value of the property to $15,300,000. The impairment reflects our estimates of the fair value of the Kings Mountain III property which is based on an appraisal using the sales comparable method which is a Level 3 Valuation Method as described in Note 18 to the consolidated financial statements “Fair Value of Financial Instruments and Investments.” No impairment for consolidated investments was recognized during 2010.
75
Purchase Accounting for Acquisition of Investments in Real Estate
We apply the acquisition method to all acquired real estate investments. The purchase consideration of the real estate is allocated to the acquired tangible assets, consisting primarily of land, site improvements, building and tenant improvements and identified intangible assets and liabilities, consisting of the value of above-market and below-market leases, other value of in-place leases, value of tenant relationships and acquired ground leases, based in each case on their fair values. Loan premiums, in the case of above-market rate loans, or loan discounts, in the case of below-market loans, will be recorded based on the fair value of any loans assumed in connection with acquiring the real estate.
The fair value of the tangible assets of an acquired property is determined by valuing the property as if it were vacant, and the “as-if-vacant” value is then allocated to land (or acquired ground lease if the land is subject to a ground lease), site improvements, building and tenant improvements based on management’s determination of the relative fair values of these assets. Management determines the as-if-vacant fair value of a property using methods similar to those used by independent appraisers. Factors considered by management in performing these analyses include an estimate of carrying costs during the expected lease-up periods considering current market conditions and costs to execute similar leases. In estimating carrying costs, management includes real estate taxes, insurance and other operating expenses and estimates of lost rental revenue during the expected lease-up periods based on current market demand. Management also estimates costs to execute similar leases including leasing commissions, legal and other related costs.
In allocating the purchase consideration of the identified intangible assets and liabilities of an acquired property, above-market and below-market in-place lease values are recorded based on the present value (using an interest rate which reflects the risks associated with the leases acquired) of the difference between (i) the contractual amounts to be paid pursuant to the in-place leases; and (ii) management’s estimate of fair market lease rates for the corresponding in-place leases measured over a period equal to the remaining non-cancelable term of the lease and, for below-market leases, over a period equal to the initial term plus any below-market fixed rate renewal periods. The capitalized below-market lease values, also referred to as acquired lease obligations, are amortized as an increase to rental income over the initial terms of the respective leases and any below-market fixed rate renewal periods. The capitalized above-market lease values are amortized as a decrease to rental income over the initial terms of the prospective leases.
The aggregate value of other acquired intangible assets, consisting of in-place leases and tenant relationships, is measured by the estimated cost of operations during a theoretical lease-up period to replace in-place leases, including lost revenues and any unreimbursed operating expenses, plus an estimate of deferred leasing commissions for in-place leases. This aggregate value is allocated between in-place lease value and tenant relationships based on management’s evaluation of the specific characteristics of each tenant’s lease; however, the value of tenant relationships has not been separated from in-place lease value for the real estate acquired as such value and its consequence to amortization expense is immaterial for these particular acquisitions. Should future acquisitions of properties result in allocating material amounts to the value of tenant relationships, an amount would be separately allocated and amortized over the estimated life of the relationship. The value of in-place leases is amortized to expense over the remaining non-cancelable periods of the respective leases
Accounting for Derivative Financial Investments and Hedging Activities
All of our derivative instruments are carried at fair value on the balance sheet. Derivative instruments designated in a hedge relationship to mitigate exposure to variability in expected future cash flows, or other types of forecasted transactions, are considered cash flow hedges. We formally document all relationships between hedging instruments and hedged items, as well as our risk-management objective and strategy for undertaking each hedge transaction. We periodically review the effectiveness of each hedging transaction, which involves estimating future cash flows. Cash flow hedges are accounted for by recording the fair value of the derivative instrument on the balance sheet as either an asset or liability, with a corresponding amount recorded in other comprehensive income within shareholders’ equity. Calculation of a fair value of derivative instruments also requires management to use estimates. Amounts will be reclassified from other comprehensive income to the income statement in the period or periods the hedged forecasted transaction affects earnings. If a lease were to be terminated prior to its stated expiration, all unamortized amounts relating to that lease would be written-off.
Derivative instruments designated in a hedge relationship to mitigate exposure to changes in the fair value of an asset, liability, or firm commitment attributable to a particular risk, such as interest rate risk, are considered fair value hedges. The changes in fair value hedges are accounted for by recording the fair value of the derivative instruments on the balance sheet as either assets or liabilities, with the corresponding amount recorded in current period earnings. We have certain interest rate swap derivatives that are designated as qualifying cash flow hedges and follow the accounting treatment discussed above. We also have certain interest rate swap derivatives that do not qualify for hedge accounting, and accordingly, changes in fair values are recognized in current earnings.
76
We disclose the fair values of derivative instruments and their gains and losses in a tabular format. We also provide more information about our liquidity by disclosing derivative features that are credit risk-related. Finally, we cross-reference within footnotes to enable financial statement users to locate important information about derivative instruments; See Note 16 “Derivative Instruments” and Note 18 “Fair Value of Financial Instruments and Investments” for a further discussion of our derivative financial instruments.
Fair Value of Financial Instruments and Investments
We elected to apply the fair value option for one of our eligible mortgage notes payable that was newly issued debt during the year ended December 31, 2008. The measurement of the elected mortgage note payable at its fair value and its impact on the statement of operations is described in Note 17 to the consolidated financial statements “Fair Value Option—Note Payable” and Note 18 to the consolidated financial statements “Fair Value of Financial Instruments and Investments.”
We generally determine or calculate the fair value of financial instruments using the appropriate present value or other valuation techniques, such as discounted cash flow analyses, incorporating available market discount rate information for similar types of instruments and our estimates for non-performance and liquidity risk. These techniques are significantly affected by the assumptions used, including the discount rate, credit spreads, and estimates of future cash flow. The Investment Manager of CBRE Strategic Partners Asia applies valuation techniques for our investment carried at fair value based upon the application of the income approach, the direct market comparison approach, the replacement cost approach or third party appraisals to the underlying assets held in the unconsolidated entity in determining the net asset value attributable to our ownership interest therein. The financial assets and liabilities recorded at fair value in our consolidated financial statements are the five interest rate swaps, our investment in CBRE Strategic Partners Asia (a real estate entity which qualifies as an investment company under the Investment Company Act) and one mortgage note payable that is economically hedged by one of the interest rate swaps.
The remaining financial assets and liabilities which are only disclosed at fair value are comprised of all other notes payable, the unsecured line of credit and other debt instruments. We determined the fair value of our secured notes payable and other debt instruments by performing discounted cash flow analyses using an appropriate market discount rate. We calculate the market discount rate by obtaining period-end treasury rates for fixed-rate debt, or London Inter-Bank Offering Rate (“LIBOR”) rates for variable-rate debt, for maturities that correspond to the maturities of our debt and then adding an appropriate credit spread derived from information obtained from third-party financial institutions. These credit spreads take into account factors such as our credit standing, the maturity of the debt, whether the debt is secured or unsecured, and the loan-to-value ratios of the debt.
The carrying amounts of our cash and cash equivalents, restricted cash, accounts receivable and accounts payable approximate fair value due to their short-term maturities.
We adopted the fair value measurement criteria described herein for our non-financial assets and non-financial liabilities on January 1, 2009. The adoption of the fair value measurement criteria to our non-financial assets and liabilities did not have a material impact on our consolidated financial statements. Assets and liabilities typically recorded at fair value on a non-recurring basis include:
| | ¡ | | Non-financial assets and liabilities initially measured at fair value in an acquisition or business combination; |
| | ¡ | | Long-lived assets measured at fair value due to an impairment assessment and |
| | ¡ | | Asset retirement obligations initially measured under the Codification Topic“Asset Retirement and Environmental Obligations” (“FASB ASC 410”). |
Investments in Unconsolidated Entities
Our determination of the appropriate accounting method with respect to our investment in CB Richard Ellis Strategic Partners Asia II-A, L.P. (“CBRE Strategic Partners Asia”), which is not considered a Variable Interest Entity (“VIE”), is partially based on CBRE Strategic Partners Asia’s sufficiency of equity investment at risk which was triggered by a substantial paydown during 2009 and 2010 of its subscription line of credit backed by investor capital commitments to fund its operations. We account for this investment under the equity method of accounting.
We determine if an entity is a VIE based on several factors, including whether the entity’s total equity investment at risk upon inception is sufficient to finance the entity’s activities without additional subordinated financial support. We make judgments regarding the sufficiency of the equity at risk based first on a qualitative analysis, then a quantitative analysis, if necessary. In a quantitative analysis, we incorporate various estimates, including estimated future cash flows, asset hold periods and discount rates, as well as estimates of the probabilities of various scenarios occurring. If the entity is a VIE, we then determine whether we consolidate the entity as the primary beneficiary. We determine whether an entity is a VIE and, if so, whether it should be consolidated by utilizing judgments and estimates that are inherently subjective. If we made different judgments or utilized different estimates in these evaluations, it could result in differing conclusions as to whether or not an entity is a VIE and whether or not we consolidate such entity.
77
With respect to our majority limited membership interest in the Duke/Hulfish, LLC joint venture (the “Duke joint venture”), the Afton Ridge Joint Venture, LLC (“Afton Ridge”), the Goodman Princeton Holdings (Jersey) Limited joint venture (the “UK JV”) and the Goodman Princeton Holdings (LUX) SARL joint venture (the “European JV”), we considered Financial Accounting Standard Board (“FASB”) the Accounting Standard Codification Topic“Consolidation” (“FASB ASC 810”) in determining that we did not have control over the financial and operating decisions of such entities due to the existence of substantive participating rights held by the minority limited members who are also the managing members of the Duke joint venture and Afton Ridge, and the investment advisors/managers of the UK JV and the European JV, respectively.
We carry our investments in CBRE Strategic Partners Asia, the Duke joint venture, Afton Ridge, the UK JV and the European JV on the equity method of accounting because we have the ability to exercise significant influence (but not control) over operating and financial policies of each such entity.
We eliminate transactions with such equity method entities to the extent of our ownership in each such entity. Accordingly, our share of net income (loss) of these equity method entities is included in consolidated net income (loss). CBRE Strategic Partners Asia is a limited partnership that qualifies for specialized industry accounting for investment companies. Specialized industry accounting allows investment companies to carry their investments at fair value, with changes in the fair value of the investments recorded in the statement of operations. On the basis of the guidance in ASC 970-323, the Company accounts for its investment in CBRE Strategic Partners Asia under the equity method. As a result, and in accordance with FASB ASC 810 the specialized accounting treatment, principally the fair value basis applied by CBRE Strategic Partners Asia under the investment company guide, is retained in the recognition of equity method earnings in the statement of operations of the Company. See Note 18 to the consolidated financial statements “Fair Value of Financial Instruments and Investments” for further discussion of the application of the fair value accounting to our investment in CBRE Strategic Partners Asia.
Use of Estimates
The preparation of financial statements, in conformity with U.S. GAAP, requires us to make estimates and assumptions that affect the reported amounts of assets and liabilities and disclosure of contingent assets and liabilities at the date of the financial statements and the reported amounts of revenues and expenses during the reporting period. Actual results could differ from those estimates.
Income Taxes
We have elected to be taxed as a REIT under Sections 856 through 860 of the Internal Revenue Code, beginning with our taxable period ended December 31, 2004. To qualify as a REIT, we must distribute annually at least 90% of our REIT taxable income (determined without regard to the dividends paid deduction and excluding net capital gains) as defined in the Internal Revenue Code, to our shareholders and satisfy certain other organizational and operating requirements. We generally will not be subject to U.S. federal income taxes if we distribute 100% of our net taxable income each year to our shareholders. If we fail to qualify as a REIT in any taxable year, we will be subject to U.S. federal income taxes (including any applicable alternative minimum tax) on our taxable income at regular corporate rates and may not be able to qualify as a REIT for the four subsequent taxable years. Even if we qualify for taxation as a REIT, we may be subject to certain state and local taxes on our income and property, and to U.S. federal income taxes and excise taxes on our undistributed taxable income. Except as discussed below, we believe that we have met all of the REIT distribution and technical requirements for the nine months ended September 30, 2010 and the year ended December 31, 2010. We intend to continue to adhere to these requirements and maintain our REIT qualification.
In order for distributions to be deductible for U.S. federal income tax purposes and count towards our distribution requirement, they must not be “preferential dividends.” A distribution will not be treated as preferential if it is pro rata among all outstanding shares of stock within a particular class. IRS guidance, however, allows a REIT to offer shareholders participating in its dividend reinvestment program (“DRIP”) up to a 5% discount on shares purchased through the DRIP without treating such reinvested dividends as preferential. Our DRIP offers a 5% discount. In 2007, 2008 and the first two quarters of 2009, common shares issued pursuant to our DRIP were treated as issued as of the first day following the close of the quarter for which the distributions were declared, and not on the date that the cash distributions were paid to shareholders not participating in our DRIP. Because we declare dividends on a daily basis, including with respect to common shares issued pursuant to our DRIP, the IRS could take the position that distributions paid by us during these periods were preferential on the grounds that the discount provided to DRIP participants effectively exceeded the authorized 5% discount or, alternatively, that the overall distributions were not pro rata among all shareholders. In addition, in the years 2007 through 2009 we paid certain individual retirement account (“IRA”) custodial fees in respect of IRA accounts that invested in our common shares. The payment of certain of such amounts could be treated as dividend distributions to the IRAs, and therefore as preferential dividends as such amounts were not paid in respect of our other outstanding common shares. Although we believe that the effect of the operation of our DRIP and the payment of such fees was immaterial, the REIT rules do not provide an exception for de minimis preferential dividends.
78
Accordingly, we submitted a request to the IRS for a closing agreement under which the IRS would grant us relief for preferential dividends that may have been paid as a result of the manner in which we operated our DRIP and in respect of our payment of certain of such custodial fees. There can be no assurance that the IRS will accept our proposal for a closing agreement. Even if the IRS accepts the proposal, we may be required to pay a fine if the IRS were to view the prior operation of our DRIP or the payment of such fees as preferential dividends. We cannot predict whether such a penalty would be imposed or, if so, the amount of the penalty. If the IRS does not agree to our proposal for a closing agreement and treats the foregoing amounts as preferential dividends, we may be able to rectify our failure to meet the REIT distribution requirements for a year by paying “deficiency dividends,” which would be paid in respect of all of our common shares pro rata and which would be included in our deduction for dividends paid in the prior years. If required, such deficiency dividends could be as much as approximately $22,000,000. In such a case, we would be able to avoid losing our qualification as a REIT or being taxed on amounts distributed as deficiency dividends. However, we would be required to pay an interest-like penalty based on the amount of our deficiency dividends. Amounts paid as deficiency dividends should generally be treated as taxable income for U.S. federal income tax purposes.
Other Accounting Policies
Pronouncement Affecting Operating Property Acquisitions
Effective January 1, 2009, we adopted the provisions of FASB ASC 805 which requires an acquiring entity to recognize acquired assets and assumed liabilities in a transaction at fair value as of the acquisition date and changes the accounting treatment for certain items, including acquisition costs, which is required to be expensed as incurred. The provision of“Business Combinations” is required to be applied on a prospective basis.
The adoption of the provisions of the FASB ASC 805 could have an impact on the cost allocation of future acquisitions and requires us to expense acquisition costs for future property acquisitions. The adoption of the provisions of the new accounting standard FASB ASC 805 had an effect on our consolidated financial statements, results of operations and cash flows for the year ended December 31, 2009. We expensed $17,531,000 and $5,832,000 of acquisition costs during the years ended December 31, 2010 and 2009.
Subsequent Events
In preparing our accompanying financial statements, management has evaluated subsequent events through the financial statement issuance date. We believe that the disclosures contained herein are adequate to prevent the information presented from being misleading.
Adoption of Accounting Standards
Consolidations
In December 2009, FASB issued Accounting Standard Update (“ASU”) 2009-17,“Consolidations (Topic 810): Improvements to Financial Reporting by Enterprises Involved with Variable Interest Entities” which incorporates Statement of Financial Accounting Standards (SFAS) No. 167,“ Amendments to FASB Interpretation No. 46(R) ,” issued by the FASB in June 2009. The amendments in ASU 2009–17 replace the quantitative-based risks and rewards calculation for determining which reporting entity, if any, has a controlling financial interest in a VIE with an approach focused on identifying which reporting entity has the power to direct the activities of a VIE that most significantly impact such entity’s economic performance and (i) the obligation to absorb losses of such entity or (ii) the right to receive benefits from such entity. ASU 2009-17 also requires additional disclosures about a reporting entity’s involvement in VIEs, which enhances the information provided to users of financial statements. We adopted ASU 2009-17 effective January 1, 2010. As a result of the fact that we have no variable interests in VIEs, the adoption of ASU 2009-17 did not have a material impact on our consolidated financial statements.
Fair Value Measurements and Disclosures
In January 2010, the FASB issued ASU 2010-06Fair Value Measurements and Disclosures. ASU 2010-06 clarifies disclosure requirements relating to the level of disaggregation of disclosures relating to classes of assets and liabilities and disclosures about inputs and valuation techniques used to measure fair value for both recurring and nonrecurring fair value estimates for Level 2 or Level 3 assets and liabilities. These requirements of ASU 2010-06 are effective for interim and annual disclosures for interim and annual reporting periods beginning after December 15, 2009. The adoption of these requirements of the ASU did not have a material impact on our consolidated financial statements.
79
New Accounting Standards
ASU 2010-06 also requires additional disclosures regarding the transfers of classifications among the fair value classification levels as well as the reasons for those changes and a separate presentation of purchases, sales, issuances and settlements in the presentation of the roll-forward of Level 3 assets and liabilities. Those disclosures are effective for interim and annual reporting periods for fiscal years beginning after December 15, 2010. The adoption of this portion of ASU 2010-06 is not expected to have a material impact on our consolidated financial statements.
Other Accounting Standards Updates not effective until after December 31, 2010 are not expected to have a significant effect on our consolidated financial position or results of operations.
Treatment of Management Compensation, Expense Reimbursements
Management of our operations is conducted by the Investment Advisor. Fees related to services provided by our Investment Advisor are accounted for based on the nature of such service and the relevant accounting literature. Fees for services performed that represent our period costs, such as cash payments for investment management fees paid to the Investment Advisor, are expensed as incurred. In addition, an affiliate of the Investment Advisor owns a partnership interest which represents a profits interest in CBRE OP related to these services.
Subject to certain limitations, we are obligated to reimburse the Investment Advisor for the organizational and offering costs incurred on our behalf. This treatment is consistent with Staff Accounting Bulletin, or SAB, Topic 1.B.1, which requires that we include all of the costs associated with our operations and formation in our financial statements. These costs will then be analyzed and segregated between those which are organizational in nature, those which are offering-related salaries and other general and administrative expenses of the Investment Advisor and its affiliates, and those which qualify as offering expenses in accordance with SAB Topic 5.A. Organizational costs are expensed as incurred in accordance with AICPA Statement of Position 98-5,“Reporting on the Costs of Start-Up Activities”. Offering-related salaries and other general and administrative costs of the Investment Advisor and its affiliates will be expensed as incurred and third-party offering expenses will be taken as a reduction against the net proceeds of the offering within additional paid-in capital, or APIC, in accordance with SAB Topic 5.A. Offering costs incurred through December 31, 2010 totaling $147,338,000 including $54,837,000, $40,348,000 and $26,744,000 during the years ended December 31, 2010, 2009 and 2008, respectively, are recorded as a reduction of additional paid-in-capital in the consolidated statements of shareholders’ equity. Of the total amount, $133,174,000 was incurred to CNL Securities Corp., as dealer manager; $3,969,000 was incurred to CB Richard Ellis, an affiliate of the Investment Advisor, $559,000 was incurred to our Investment Advisor for reimbursable marketing costs and $9,636,000 was incurred to other service providers. As of December 31, 2010 and 2009 the accrued offering costs included on our consolidated balance sheets is $1,032,000 and $1,197,000, respectively.
The Investment Advisor earned investment management fees of $11,611,000, $7,803,000 and $3,964,000 for the years ended December 31, 2010, 2009 and 2008, respectively. As of December 31, 2010 and 2009, the investment management fees payable to related party in our consolidated balance sheets were $1,330,000 and $757,000, respectively. In connection with services provided to the Investment Advisor, CNL Fund Management Company, the Sub-Advisor and affiliate of the Dealer Manager pursuant to a sub-advisory agreement dated August 21, 2006, was paid by the Investment Advisor $1,604,000, $1,078,000 and $547,000 for the years ended December 31, 2010, 2009 and 2008, respectively.
Acquisition Fee and Expenses to Related Party
On January 30, 2009, we entered into that certain Second Amendment Advisory Agreement that permits the Investment Advisor to earn an acquisition fee of up to 1.5% of (i) the purchase price of real estate investments acquired by us, including any debt attributable to such investments, or (ii) when we make an investment indirectly through another entity, such investment’s pro rata share of the gross asset value of real estate investments held by that entity. The Investment Advisor earned acquisition fees of $11,851,000, $4,387,000 and $4,927,000 for the years ended December 31, 2010, 2009 and 2008, respectively. In connection with services provided to the Investment Advisor, the Sub Advisor, pursuant to a sub advisory agreement, was paid by the Investment Advisor acquisition fees of $2,216,000, $820,000 and $921,000 for the years ended December 31, 2010, 2009 and 2008, respectively. The Investment Advisor earned $1,204,000, $439,000 and $743,000 in acquisition related expenses during the years ended December 31, 2010 and 2009. Prior to the adoption of “Business Combinations” on January 1, 2009, these acquisitions fees and expenses were capitalized to investments in real estate and related intangibles.
80
Rental Operations
Our reportable segments consist of three types of commercial real estate properties for which our management internally evaluates operating performance and financial results: the Domestic Industrial Properties, Domestic Office Properties and International Office/Retail Properties. We evaluate the performance of our segments based on net operating income, defined as: rental income and tenant reimbursements less property and related expenses (operating and maintenance, management fees and real estate taxes) and excludes other non-property income and expenses, interest expense, depreciation and amortization, and our company-level general and administrative expenses. The following tables compare the net operating income for the years ended December 31, 2010, 2009 and 2008 (in thousands):
| | | | | | | | | | | | |
| | | Year Ended December 31, | |
| | | 2010 | | | 2009 | | | 2008 | |
Domestic Industrial Properties | | | | | | | | | | | | |
Revenues: | | | | | | | | | | | | |
Rental | | $ | 23,903 | | | $ | 19,473 | | | $ | 20,350 | |
Tenant Reimbursements | | | 5,481 | | | | 5,057 | | | | 4,323 | |
| | | | | | | | | | | | |
Total Revenues | | | 29,384 | | | | 24,530 | | | | 24,673 | |
| | | | | | | | | | | | |
Property and Related Expenses: | | | | | | | | | | | | |
Operating and Maintenance | | | 1,546 | | | | 1,297 | | | | 1,146 | |
General and Administrative | | | 257 | | | | 312 | | | | 147 | |
Property Management Fee to Related Party | | | 289 | | | | 346 | | | | 376 | |
Property Taxes | | | 5,735 | | | | 4,916 | | | | 4,054 | |
| | | | | | | | | | | | |
Total Expenses | | | 7,827 | | | | 6,871 | | | | 5,723 | |
| | | | | | | | | | | | |
Net Operating Income | | | 21,557 | | | | 17,659 | | | | 18,950 | |
| | | | | | | | | | | | |
Domestic Office Properties | | | | | | | | | | | | |
Revenues: | | | | | | | | | | | | |
Rental | | | 38,792 | | | | 19,430 | | | | 8,429 | |
Tenant Reimbursements | | | 8,294 | | | | 3,974 | | | | 2,290 | |
| | | | | | | | | | | | |
Total Revenues | | | 47,086 | | | | 23,404 | | | | 10,719 | |
| | | | | | | | | | | | |
Property and Related Expenses: | | | | | | | | | | | | |
Operating and Maintenance | | | 6,142 | | | | 3,395 | | | | 1,974 | |
General and Administrative | | | 433 | | | | 174 | | | | 61 | |
Property Management Fee to Related Party | | | 370 | | | | 139 | | | | 94 | |
Property Taxes | | | 5,230 | | | | 2,708 | | | | 1,425 | |
| | | | | | | | | | | | |
Total Expenses | | | 12,175 | | | | 6,416 | | | | 3,554 | |
| | | | | | | | | | | | |
Net Operating Income | | | 34,911 | | | | 16,988 | | | | 7,165 | |
| | | | | | | | | | | | |
81
| | | | | | | | | | | | |
| | | Year Ended December 31, | |
| | | 2010 | | | 2009 | | | 2008 | |
International Office/Retail Properties | | | | | | | | | | | | |
Revenues: | | | | | | | | | | | | |
Rental | | | 6,678 | | | | 8,120 | | | | 4,617 | |
Tenant Reimbursements | | | 391 | | | | 270 | | | | 140 | |
| | | | | | | | | | | | |
Total Revenues | | | 7,069 | | | | 8,390 | | | | 4,757 | |
| | | | | | | | | | | | |
Property and Related Expenses: | | | | | | | | | | | | |
Operating and Maintenance | | | 930 | | | | 282 | | | | 128 | |
General and Administrative | | | 213 | | | | 142 | | | | 82 | |
Property Management Fee to Related Party | | | 289 | | | | 171 | | | | 21 | |
| | | | | | | | | | | | |
Total Expenses | | | 1,432 | | | | 595 | | | | 231 | |
| | | | | | | | | | | | |
Net Operating Income | | | 5,637 | | | | 7,795 | | | | 4,526 | |
| | | | | | | | | | | | |
Reconciliation to Consolidated Net Loss | | | | | | | | | | | | |
Total Segment Net Operating Income | | | 62,105 | | | | 42,442 | | | | 30,641 | |
Interest Expense | | | 14,881 | | | | 11,378 | | | | 10,323 | |
General and Administrative | | | 4,623 | | | | 3,618 | | | | 3,030 | |
Investment Management Fee to Related Party | | | 11,595 | | | | 7,803 | | | | 3,964 | |
Acquisition Expenses | | | 17,531 | | | | 5,832 | | | | — | |
Depreciation and Amortization | | | 32,125 | | | | 25,093 | | | | 17,171 | |
Loss on Impairment | | | — | | | | 9,160 | | | | — | |
| | | | | | | | | | | | |
| | | (18,650 | ) | | | (20,442 | ) | | | (3,847 | ) |
| | | | | | | | | | | | |
Other Income and Expenses | | | | | | | | | | | | |
Interest and Other Income | | | 1,260 | | | | 344 | | | | 2,039 | |
Net Settlement (Payments) Receipts on Interest Rate Swaps | | | (1,096 | ) | | | (660 | ) | | | 65 | |
Gain (Loss) on Interest Rate Swaps and Cap | | | 23 | | | | 89 | | | | (1,496 | ) |
(Loss) Gain on Note Payable at Fair Value | | | (118 | ) | | | (807 | ) | | | 1,168 | |
Loss on Early Extinguishment of Debt | | | (72 | ) | | | — | | | | — | |
Loss on Transfer of Held for Sale Real Estate to Continuing Operations | | | — | | | | — | | | | (3,451 | ) |
| | | | | | | | | | | | |
Loss Before (Provision) Benefit for Income Taxes and Equity in Income (Loss) of Unconsolidated Entities | | | (18,653 | ) | | | (21,476 | ) | | | (5,522 | ) |
| | | | | | | | | | | | |
(Provision) Benefit for Income Taxes | | | (296 | ) | | | (169 | ) | | | 82 | |
Equity in Income (Loss) of Unconsolidated Entities | | | 8,838 | | | | 2,743 | | | | (1,242 | ) |
| | | | | | | | | | | | |
Net Loss from Continuing Operations | | | (10,111 | ) | | | (18,902 | ) | | | (6,682 | ) |
Loss from Discontinued Operations | | | (507 | ) | | | — | | | | — | |
| | | | | | | | | | | | |
Net Loss | | | (10,618 | ) | | | (18,902 | ) | | | (6,682 | ) |
| | | | | | | | | | | | |
Net Loss Attributable to Non-Controlling Operating Partnership Units | | | 18 | | | | 54 | | | | 26 | |
| | | | | | | | | | | | |
Net Loss Attributable to CB Richard Ellis Realty Trust Shareholders | | $ | (10,600 | ) | | $ | (18,848 | ) | | $ | (6,656 | ) |
| | | | | | | | | | | | |
| (1) | Total Segment Net Operating Income is a Non-GAAP financial measure which may be useful as a supplemental measure for evaluating the relationship of each reporting segment to the combined total. This measure should not be viewed as an alternative measure of operating performance to our U.S. GAAP presentations provided. Segment “Net Operating Income” is defined as operating revenues (rental income, tenant reimbursements and other property income) less property and related expenses (property expenses, including real estate taxes) before depreciation and amortization expense. The Net Operating Income segment information presented consists of the same Net Operating Income segment information disclosed in Note 11 to our consolidated financial statements in this Annual Report on Form 10-K. |
82
Consolidated Results of Operations
Comparison of Year Ended December 31, 2010 to Year Ended December 31, 2009
Revenues
Rental
Rental revenue increased $22,350,000, or 48%, to $69,373,000 during the year ended December 31, 2010 as compared to $47,023,000 for the year ended December 31, 2009. The increase was due to the ownership of 13201 Wilfred Lane, 3011, 3055 & 3077 Comcast Lane, 140 Depot Street, 12650 Ingenuity Drive, Crest Ridge Corporate Center 1, West Point Trade Center (the “2009 Acquisitions”) for the year ended December 31, 2009, and the acquisitions of 5160 Hacienda Drive, 10450 Pacific Center Court, 225 Summit Avenue, One Wayside Road, 100 Tice Blvd., Ten Parkway North, Pacific Corporate Park, 100 Kimball Drive, 4701 Gold Spike Drive, 1985 International Way, Rickenbacker II, Rickenbacker III, Summit Distribution Center, 3660 Deerpark Boulevard, and Tolleson Commerce Park II (the “2010 Acquisitions”, together with the “2009 Acquisitions”, the “2009 & 2010 Acquisitions”) during the year ended December 31, 2010.
Tenant Reimbursements
Tenant reimbursements increased $4,865,000, or 52%, to $14,166,000 for the year ended December 31, 2010 compared to $9,301,000 for the year ended December 31, 2009, due to tenant reimbursement revenue from the 2009 & 2010 Acquisitions.
Expenses
Operating and Maintenance
Property operating and maintenance expenses increased $3,644,000, or 73%, to $8,618,000 for the year ended December 31, 2010 compared to $4,974,000 for the year ended December 31, 2009. The increase was due to the 2009 & 2010 Acquisitions and increased operating and maintenance expenses associated with our vacant properties.
Property Taxes
Property tax expense increased $3,341,000, or 44%, to $10,965,000 for the year ended December 31, 2010 compared to $7,624,000 for the year ended December 31, 2009. The increase in property taxes was due to the 2009 & 2010 Acquisitions and increased property taxes in the Carolina portfolio.
Interest
Interest expense increased $3,503,000, or 31%, to $14,881,000 for the year ended December 31, 2010 compared to $11,378,000 for the year ended December 31, 2009 as a result of placing debt on Maskew Retail Park during 2009, the assumption of debt related to the 2009 acquisition of 12650 Ingenuity Drive, placing debt on Ten Parkway North and Pacific Corporate Park during 2010, the assumption of debt related to the 2010 acquisition of One Wayside Road and 100 Tice Blvd., and interest related to the revolving credit facility with Wells Fargo Bank, N.A., (the “Wells Fargo Credit Facility”).
General and Administrative
General and administrative expense increased $1,280,000, or 30%, to $5,526,000 for the year ended December 31, 2010 compared to $4,246,000 for the year ended December 31, 2009. Of the total increase, $368,000 was due to the increase in professional fees; $774,000 was due to the increase in organization costs associated with the UK JV and European JV; $39,000 was due to increase in non-recoverable operating and maintenance expenses; $240,000 was due to restricted common shares granted to our independent trustees in 2010; $33,000 was due to the increase in directors’ and officers’ insurance and expenses offset by the reduction of $97,000 in legal expenses; $55,000 in shareholders servicing fees and report production costs; and $22,000 in general audit fees and Sarbanes-Oxley assistance.
Property Management Fee and Investment Management Fee
Property management fee and investment management fee increased $4,084,000, or 48%, to $12,543,000 for the year ended December 31, 2010 compared to $8,459,000 for the year ended December 31, 2009 resulting from an increase in assets under management.
83
Acquisition Expenses
Acquisition expenses increased $11,699,000, or 201%, to $17,531,000 for the year ended December 31, 2010 compared to $5,832,000 for the year ended December 31, 2009. The increase was related to the 2010 Acquisitions and the acquisitions by the UK JV, European JV and the acquisition by the Duke joint venture of McAuley Place, Easton III, Point West I, Sam Houston Crossing I, Regency Creek, 533 Maryville Center, 555 Maryville Center (the “Duke Office Portfolio Tranche I”).
Depreciation and Amortization
Depreciation and amortization expense increased $7,032,000, or 28%, to $32,125,000 for the year ended December 31, 2010 as compared to $25,093,000 for the year ended December 31, 2009. The net increase was related to the acquisitions of consolidated properties in late 2009 and during 2010.
Interest and Other Income
Interest and other income increased $916,000, or 266%, to $1,260,000 for the year ended December 31, 2010 compared to $344,000 for the year ended December 31, 2009 primarily as a result of proceeds received from lease settlements at Kings Mountain I and 602 Central Blvd. as well as a gain recognized on the transfer of Miramar I and II to the Duke joint venture during the year ended December 31, 2010.
Net Settlement (Payments) Receipts on Interest Rate Swaps
During the year ended December 31, 2010, we made net payments on interest rate swaps of ($1,096,000) as compared to ($660,000) on interest rate swaps during the year ended December 31, 2009. The increase is a result of a one-time payment for Thames Valley Five to unwind a portion of the swap and lower variable interest rates for the year ended December 31, 2010 as compared to the year ended December 31, 2009.
Gain (Loss) on Interest Rate Swaps and Cap
During the year ended December 31, 2010, our derivative instruments generated income of $23,000 as compared to $89,000 for the year ended December 31, 2009 or a year to year decrease of $66,000.
(Loss) Gain on Note Payable at Fair Value
Loss on notes payables decreased by $689,000, or 85%, to ($118,000) for year ended December 31, 2010 compared to ($807,000) for the year ended December 31, 2009. The year to year change is attributable to a stabilization of UK interest rate spreads and base rates used to value the loan.
Loss on Early Extinguishment of Debt
During the year ended December 31, 2010, we repaid in full the existing loan at 602 Central Blvd. and incurred expense of $72,000. There was no extinguishment of debt activity during the year ended December 31, 2009.
Loss on Impairment
During the year ended December 31, 2009, we incurred an impairment loss of $9,160,000 for Kings Mountain III. There was no impairment loss during the year ended December 31, 2010.
Provision for Income Taxes
Provision for income taxes increased $127,000, or 75%, to $296,000 for the year ended December 31, 2010 compared to $169,000 for the year ended December 31, 2009 resulting primarily from increased state liabilities in a number of states in which we hold properties.
Equity in Income (Loss) of Unconsolidated Entities
Equity in income (loss) of unconsolidated entities increased $6,095,000, or 222%, to $8,838,000 for the year ended December 31, 2010 compared to $2,743,000 for the year ended December 31, 2009. The increase was primarily due to the acquisition of additional properties by the Duke joint venture, improved CBRE Strategic Partners Asia performance and the operating results attributable to our investment in the UK JV and European JV entities during the year ended December 31, 2010.
84
Discontinued Operations
Loss from discontinued operations for the year ended December 31, 2010 was $507,000. Revenues and expenses from discontinued operations represent the activities of the held for sale portfolio of light industrial and warehouse distribution buildings acquired during the year ended December 31, 2010. The properties are currently being marketed for sale. There were no discontinued operations in 2009 and 2008.
Net Loss Attributable to Non-Controlling Operating Partnership Unit
Net loss attributable to non-controlling interest decreased $36,000, or 67%, to $18,000 for the year ended December 31, 2010 as compared to $54,000 for the year ended December 31, 2009.
Comparison of Year Ended December 31, 2009 to Year Ended December 31, 2008
Revenues
Rental
Rental revenue increased $13,627,000, or 41%, to $47,023,000 during the year ended December 31, 2009 as compared to $33,396,000 for the year ended December 31, 2008. The increase was due to the acquisitions of Maskew Retail Park, Avion Midrise III & IV in late 2008 and the acquisition of 13201 Wilfred Lane, 3011, 3055 & 3077 Comcast Place, 140 Depot Street, 12650 Ingenuity Drive and Crest Ridge Corporate Center I in 2009 offset by lower rental revenue for 602 Central Blvd., Thames Valley Five, Jedburg Commerce Park and the write-off of unamortized above-market rent during 2009 for the bankrupt tenant, Aleris, at Kings Mountain I.
Tenant Reimbursements
Tenant reimbursements increased $2,548,000, or 38%, to $9,301,000 for the year ended December 31, 2009 compared to $6,753,000 for the year ended December 31, 2008, primarily as a result of increased tenant operating expense due to the late 2008 and 2009 acquisitions of Maskew Retail Park, Avion Midrise III & IV, 13201 Wilfred Lane, 3011, 3055 & 3077 Comcast Place, 140 Depot Street, 12650 Ingenuity Drive and Crest Ridge Corporate Center I and increased reimbursements at Lakeside Office Center and the Carolina portfolio.
Expenses
Operating and Maintenance
Property operating and maintenance expenses increased $1,726,000, or 53%, to $4,974,000 for the year ended December 31, 2009 compared to $3,248,000 for the year ended December 31, 2008. The increase was primarily due to the late 2008 and 2009 acquisitions of Maskew Retail Park, Avion Midrise III & IV, 13201 Wilfred Lane, 3011, 3055 & 3077 Comcast Place, 140 Depot Street, 12650 Ingenuity Drive and Crest Ridge Corporate Center I.
Property Taxes
Property tax expense increased $2,145,000, or 39%, to $7,624,000 for the year ended December 31, 2009 compared to $5,479,000 for the year ended December 31, 2008. The increase was due to the acquisitions of Maskew Retail Park, Avion Midrise III & IV, 13201 Wilfred Lane, 3011, 3055 & 3077 Comcast Place, 140 Depot Street, 12650 Ingenuity Drive and Crest Ridge Corporate Center I and increased taxes resulting from the reassessment of properties located in North Carolina and South Carolina.
Interest
Interest expense increased $1,055,000, or 10%, to $11,378,000 for the year ended December 31, 2009 compared to $10,323,000 for the year ended December 31, 2008 as a result of a full year of interest expense associated with Lakeside Office Center, Avion Midrise III & IV, Thames Valley Five, Albion Mills Retail Park, and the assumption of debt during 2009 for Maskew Retail Park and 12650 Ingenuity Drive offset by lower interest expense on the line of credit borrowing.
General and Administrative
General and administrative expense increased $926,000, or 28%, to $4,246,000 for the year ended December 31, 2009 compared to $3,320,000 for the year ended December 31, 2008; $954,000 was due to the increase in professional fees; $181,000 was due to the increase in legal expense; $116,000 was due to the increase in shareholder servicing fees and report production costs; $23,000 was
85
due to the increase in directors’ and officers’ insurance and expenses offset by the reduction of general audit fees and Sarbanes-Oxley assistance of $209,000 and payment of organization costs associated with the formation of the Duke joint venture and Afton Ridge joint venture of $139,000.
Property Management Fee and Investment Management Fee
Property management fee and investment management fee increased $4,004,000, or 90%, to $8,459,000 for the year ended December 31, 2009 compared to $4,455,000 for the year ended December 31, 2008 resulting from an increase in assets under management.
Acquisition Expenses
During the year ended December 31, 2009, we expensed acquisition costs of $5,832,000. Prior to January 1, 2009, acquisition costs were capitalized.
Depreciation and Amortization
Depreciation and amortization expense increased $7,922,000, or 46%, to $25,093,000 for the year ended December 31, 2009 as compared to $17,171,000 for the year ended December 31, 2008. The net increase was related to the acquisitions of consolidated properties in late 2008 and during 2009.
Interest and Other Income
Interest and other income decreased $1,695,000, or 83%, to $344,000 for the year ended December 31, 2009 compared to $2,039,000 for the year ended December 31, 2008. The decrease was due to significantly lower money market interest rates.
Net Settlement (Payments) Receipts on Interest Rate Swaps
During the year ended December 31, 2009, we made net payments on interest rate swaps of ($660,000) versus net receipts of $65,000 on interest rate swaps during the year ended December 31, 2008.
Gain (Loss) on Interest Rate Swaps and Cap
During the year ended December 31, 2009, our derivative instruments generated income of $89,000 versus a loss of $1,496,000 for the year ended December 31, 2008 or a year to year increase of $1,585,000.
(Loss) Gain on Note Payable at Fair Value
The fair value of the Albion Mills Retail Park note payable decreased $1,975,000 or 169%, to ($807,000) for the year ended December 31, 2009 compared to $1,168,000 for the year ended December 31, 2008.
Loss on Transfer of Held for Sale Real Estate to Continuing Operations
During the year ended December 31, 2008, we incurred a loss of $3,451,000 on the transfer of held for sale real estate to investments in real estate. There was no similar transaction in 2009.
Loss on Impairment
During the year ended December 31, 2009, we incurred an impairment loss of $9,160,000 for Kings Mountain III. There was no impairment loss during the year ended December 31, 2008.
(Provision) Benefit for Income Taxes
Provision for income taxes decreased $251,000, or 306%, to ($169,000) for the year ended December 31, 2009 compared to $82,000 for the year ended December 31, 2008 resulting primarily from the transfer of the Carolina TRS discontinued operations portfolio to continuing operations as of September 30, 2008.
86
Equity in Income (Loss) of Unconsolidated Entities
Equity in income (loss) of unconsolidated entities increased $3,985,000, or 321%, to $2,743,000 for the year ended December 31, 2009 compared to ($1,242,000) for the year ended December 31, 2008. The increase was due to the positive operational activities of CBRE Strategic Partners Asia, the Duke joint venture and Afton Ridge.
Net Loss Attributable to Non-Controlling Operating Partnership Units
Net loss attributable to non-controlling operating partnership units increased $28,000, or 108%, to $54,000 for the year ended December 31, 2009 as compared to $26,000 for the year ended December 31, 2008.
Financial Condition, Liquidity and Capital Resources
Overview
Liquidity is a measurement of the ability to meet cash requirements, including funding investments and ongoing commitments, to repay borrowings as well as paying dividends, fees and other costs associated with our public offerings and other general business needs. Our sources of funds will primarily be the net proceeds of our initial public and follow-on offerings, operating cash flows and borrowings, including under our Amended Wells Fargo Credit Facility. We believe that these cash resources will be sufficient to satisfy our cash requirements and we do not anticipate a need to raise funds from other than these sources within the next twelve months. Cash flow from operations is primarily dependent upon the occupancy level of our portfolio, the net effective rental rates achieved on our leases, the collectability of rent and operating escalations and recoveries from our tenants and the level of operating and other costs. Depending on market conditions, we expect that once the net proceeds of our initial public and follow-on offerings are fully invested, our debt financing will be approximately 65% of the value of the cost of our assets before non-cash reserves and depreciation. The amount of debt we place on an individual property, or the amount of debt incurred by an individual entity in which we invest, may be more or less than 65% of the value of such property or the value of the assets owned by such entity, depending on market conditions and other factors. In fact, depending on market conditions and other factors, we may choose not to place debt on our portfolio or our assets and may choose not to borrow to finance our operations or to acquire properties. Our declaration of trust limits our borrowing to 300% of our net assets unless any excess borrowing is approved by a majority of our independent trustees and is disclosed to our shareholders in our next quarterly report. Our declaration of trust defines “net assets” as our total assets (other than intangibles) at cost, before deducting depreciation, reserves for bad debts or other non-cash reserves, less total liabilities, calculated at least quarterly by us on a basis consistently applied; provided, however, that during such periods in which we are obtaining regular independent valuations of the current value of its net assets for purposes of enabling fiduciaries of employee benefit plan shareholders to comply with applicable Department of Labor reporting requirements, “net assets” means the greater of (i) the amount determined pursuant to the foregoing and (ii) the assets’ aggregate valuation established by the most recent such valuation report without reduction for depreciation, bad debts or other non-cash reserves. Any indebtedness we do incur will likely be subject to continuing covenants, and we will likely be required to make continuing representations and warranties in connection with such debt. Moreover, some or all of our debt may be secured by some or all of our assets. If we default in the payment of interest or principal on any such debt, breach any representation or warranty in connection with any borrowing or violate any covenant in any loan document, our lender may accelerate the maturity of such debt requiring us to immediately repay all outstanding principal. If we are unable to make such payment, our lender could foreclose on our assets that are pledged as collateral to such lender. The lender could also sue us or force us into bankruptcy. Any such event would have a material adverse effect on the value of our common shares. We believe that, even without any proceeds raised from our public offering, we have sufficient cash flow from operations to continue as a going concern for the next twelve months and into the foreseeable future.
In addition to making investments in accordance with our investment objectives, we expect to use our capital resources to make certain payments to the Investment Advisor and the Dealer Manager. During the offering stage, assuming all of the shares in our primary offering are sold, these payments will include payments of up to $189,000,000 for selling commissions, up to $54,000,000 for the dealer manager fee, up to $27,000,000 for the marketing support fee and up to $20,750,000 for organizational and offering expenses. During the acquisition and operational stages, certain services related to the acquisition and management of our investments and our operations will be provided to us by the Investment Advisor pursuant to an advisory agreement entered into in July 2004 which was amended and restated in October 2006 and again in January 2009. Pursuant to that agreement, we expect to make various payments to the Investment Advisor, including acquisition fees, investment management fees and payments for reimbursements of certain costs incurred by the Investment Advisor in providing related services to us. As the actual amounts to be paid are dependent upon the total equity and debt capital we raise and our results of operations, we cannot determine these amounts at this time.
In order to avoid corporate-level tax on our net taxable income, we are required to pay distributions to our shareholders equal to our net taxable income. In addition, to qualify as a REIT, we generally are required to pay annual distributions to our shareholders equal to
87
at least 90% of our net ordinary taxable income. Therefore, once the net proceeds we receive from our public offerings are substantially fully invested, we will need to raise additional capital in order to grow our business and acquire additional real estate investments. We anticipate borrowing funds to obtain additional capital, but there can be no assurance that we will be able to do so on terms acceptable to us, if at all.
Historical Cash Flows
Our net cash provided by operating activities increased by $13,341,000 to $39,567,000 for the year ended December 31, 2010, compared to $26,226,000 for the year ended December 31, 2009. The increase was due to operating distributions from the Duke joint venture of $23,360,000, Afton Ridge of $1,580,000 and the UK JV and European JV of $1,322,000 plus positive operating results from consolidated properties offset by a significant increase in acquisition costs during the year ended December 31, 2010.
Net cash used in investing activities increased by $392,501,000 to $681,120,000 for the year ended December 31, 2010, compared to $288,619,000 for the year ended December 31, 2009. The increase was due to the acquisition of real estate properties, investments in unconsolidated entities and funding of purchase deposits offset by the distribution of loan proceeds from the Duke joint venture, sales proceeds from CBRE Strategic Partners Asia and master lease reimbursements from the Afton Ridge purchase agreement during the year ended December 31, 2010.
Net cash provided by financing activities increased by $232,535,000 to $577,216,000 for the year ended December 31, 2010, compared to $344,681,000 for the year ended December 31, 2009. The increase was due to the borrowing of loan payable of $60,000,000, an increase in proceeds from the public offering of $137,148,000, a decrease in shareholders redemption of $4,089,000, an increase in security deposits of $280,000 and an increase in debt financing of $74,940,000 offset by an increase in deferred financing costs of $4,512,000, an increase in offering costs of $11,376,000, an increase in distributions to shareholders and non-controlling interest holders of $15,825,000 and an increase in principal payments on notes payable of $12,209,000.
Non-GAAP Supplemental Financial Measure: Funds from Operations
Historical cost accounting for real estate assets in accordance with GAAP implicitly assumes that the value of real estate assets diminishes predictably over time. Since real estate values instead have historically risen or fallen with market conditions, many industry analysts and investors consider presentations of operating results for REITs that use historical cost accounting to be insufficient by themselves. Consequently, the National Association of Real Estate Investment Trusts, or NAREIT, created Funds from Operations, or FFO, as a supplemental measure of REIT operating performance.
FFO is a non-GAAP measure that is commonly used in the real estate industry. The most directly comparable GAAP measure to FFO is net income. FFO, as we define it, is presented as a supplemental financial measure. Management believes that FFO is a useful supplemental measure of REIT performance. FFO does not present, nor do we intend for it to present, a complete picture of our financial condition and/or operating performance. We believe that net income, as computed under GAAP, appropriately remains the primary measure of our performance and that FFO, when considered in conjunction with net income, improves the investing public’s understanding of the operating results of REITs and makes comparisons of REIT operating results more meaningful.
We compute FFO in accordance with standards established by NAREIT. Modifications to the NAREIT calculation of FFO are common among REITs, as companies seek to provide financial measures that meaningfully reflect their business and provide greater transparency to the investing public as to how our management team considers our results of operations. As a result, our FFO may not be comparable to FFO as reported by other REITs that do not compute FFO in accordance with the NAREIT definition, or that interpret the NAREIT definition differently than we do. The revised NAREIT White Paper on FFO defines FFO as net income or loss computed in accordance with GAAP, excluding extraordinary items, as defined by GAAP, and gains and losses from sales of depreciable operating property, plus real estate related depreciation and amortization (excluding amortization of deferred financing costs and depreciation of non-real estate assets), and after adjustment for unconsolidated partnerships and joint ventures.
Management believes that NAREIT’s definition of FFO reflects the fact that real estate, as an asset class, generally appreciates over time, and that depreciation charges required by GAAP do not always reflect the underlying economic realities. Likewise, the exclusion from NAREIT’s definition of FFO of gains and losses from the sales of previously depreciated operating real estate assets allows investors and analysts to readily identify the operating results of the long-term assets that form the core of a REIT’s activity and assists in comparing those operating results between periods. Thus, FFO provides a performance measure that, when compared year over year, reflects the impact on our operations from trends in occupancy rates, rental rates and operating costs. Management also believes that FFO provides useful information to the investment community about our financial performance when compared to other REITs, since FFO is generally recognized as the industry standard for reporting the operations of REITs.
88
In addition to presenting FFO in accordance with the NAREIT definition, we also disclose FFO, as adjusted, which excludes the effects of acquisition costs and non-cash impairment charges. We believe that adjusting FFO to exclude these acquisition costs and impairment charges more appropriately presents our results of operations on a comparative basis. The items that we exclude from net income are subject to significant fluctuations from period to period that cause both positive and negative effects on our results of operations, often in inconsistent and unpredictable directions. The economics underlying these excluded items are not the primary factors in management’s decision-making process. Period to period fluctuations in these items can be driven by accounting for short-term factors that are not relevant to long-term investment decisions, long-term capital structures or long-term tax planning and tax structuring decisions. Therefore, while our FFO, as adjusted, clearly differs from NAREIT’s definition of FFO, and may not be comparable to similarly named measures of other REITs and real estate companies, we believe that it provides a meaningful supplemental measure of our operating performance. We believe that investors are best served if the information that is made available to them allows them to align their analysis and evaluation of our operating results along the same lines that our management uses in planning and executing our business strategy, thus fostering a greater degree of transparency into our management process.
Neither FFO, FFO as adjusted represents cash generated from operating activities in accordance with GAAP and should not be considered as alternatives to (i) net income (determined in accordance with GAAP), as indications of our financial performance, or (ii) to cash flow from operating activities (determined in accordance with GAAP) as measures of our liquidity, nor are they indicative of funds available to fund our cash needs, including our ability to make cash distributions. We believe that to further understand our performance, each of FFO and FFO, as adjusted, should be compared with our reported net income and considered in addition to cash flows in accordance with GAAP, as presented in our Consolidated Financial Statements.
The following table presents our FFO and FFO as adjusted for the years ended December 31, 2010, 2009 and 2008 (in thousands):
| | | | | | | | | | | | |
| | | Year Ended December 31, | |
| | | 2010 | | | 2009 | | | 2008 | |
Reconciliation of net loss to funds from operations | | | | | | | | | | | | |
Net Loss Attributable to CB Richard Ellis Realty Trust Shareholders | | $ | (10,600 | ) | | $ | (18,848 | ) | | $ | (6,656 | ) |
Adjustments: | | | | | | | | | | | | |
Non-controlling interest | | | (18 | ) | | | (54 | ) | | | (26 | ) |
Real estate depreciation and amortization | | | 32,125 | | | | 25,093 | | | | 17,171 | |
Realized gain from transfer of real estate to unconsolidated entity | | | (154 | ) | | | — | | | | — | |
Net effect of FFO adjustment from unconsolidated entities(1) | | | 17,209 | | | | 14,355 | | | | 3,275 | |
Loss from transfer of held for sale real estate to continuing operations | | | — | | | | — | | | | 3,451 | |
| | | | | | | | | | | | |
FFO | | $ | 38,562 | | | $ | 20,546 | | | $ | 17,215 | |
Other Adjustments: | | | | | | | | | | | | |
Acquisition and related expenses | | | 18,806 | | | | 5,832 | | | | — | |
Real estate impairment loss | | | — | | | | 9,160 | | | | — | |
Unrealized gain/impairment loss in unconsolidated entity | | | 1,043 | | | | (1,483 | ) | | | 1,064 | |
| | | | | | | | | | | | |
FFO, as adjusted | | $ | 58,411 | | | $ | 34,055 | | | $ | 18,279 | |
| (1) | Represents our share of the FFO adjustments allowable under the NAREIT definition (primarily depreciation) for each of our unconsolidated entities multiplied by the percentage of income or loss recognized by us for each of these unconsolidated entities during each of the quarters. |
Financing
Notes Payable
On April 27, 2007, we, in connection with the acquisition of 602 Central Blvd., entered into a £5,500,000 financing arrangement with the Royal Bank of Scotland secured by the property. The loan was for a term of seven years with interest at a variable rate, adjusted quarterly, based on three month GBP-based LIBOR plus 0.67%, per annum. On March 11, 2010, we paid off the £5,500,000 ($8,281,000 at March 11, 2010) loan and expensed certain closing costs plus the unamortized deferred financing costs associated with obtaining the loan totaling $73,000. The interest rate cap agreement was cancelled concurrent with the loan payoff.
In connection with our acquisition of the Carolina Portfolio on August 30, 2007, we assumed 13 loans with principal balances totaling $66,110,000 ($62,944,000 at estimated fair value including the discount of $3,166,000) from various lenders that are secured by first deeds of trust on the properties and the assignment of related rents and leases. Assumption fees and other loan closing costs totaling $765,500 were capitalized as incurred. The loans bear interest at rates ranging from 4.98% to 6.33% per annum and mature between
89
March 1, 2013 and February 1, 2025. The loans require monthly payments of interest and principal, fully amortized over the lives of the loans. Principal payments totaling $3,788,000 were made during the year ended December 31, 2010. We indemnify the lenders against environmental costs and expenses and guarantee the loans under certain conditions.
On May 30, 2008, we entered into a £7,500,000 financing arrangement with the Royal Bank of Scotland plc secured by the Thames Valley Five property. On July 27, 2010, we paid down the loan by £1,860,000 leaving a loan balance of £5,640,000 ($8,781,000 at December 31, 2010). The loan is for a term of five years (with a two year extension option) and bears interest at a variable rate adjusted quarterly, based on nine month GBP-based LIBOR plus 1.01%. In addition, we incurred financing costs of approximately £67,000 ($104,000 at December 31, 2010) associated with obtaining this loan. On August 14, 2008, we entered into the interest rate swap agreement that fixed the GBP-based LIBOR rate at 5.41% plus 1.01% or 6.42% per annum as of December 31, 2010, and expires on May 30, 2013. In conjunction with the loan paydown, we incurred a cost of £227,000 ($361,000 at August 3, 2010) to reduce the notional amount of the interest rate swap from £7,500,000 to £5,640,000. Interest only payments are due quarterly for the term of the loan with principal due at maturity.
On July 1, 2008, in connection with the acquisition of Enclave on the Lake, we assumed an $18,281,000 ($18,790,000 face value less discount of $509,000) loan from NorthMarq Capital, Inc. that bears interest at a fixed rate of 5.45% per annum and matures on May 1, 2011. Principal and interest payments are due monthly for the remaining loan term and principal payments totaling $368,000 were made during the year ended December 31, 2010. In addition, we incurred financing costs totaling $241,000 in conjunction with the assumption of the loan.
On October 10, 2008, we entered into a £5,771,000 ($8,985,000 at December 31, 2010) financing agreement with the Royal Bank of Scotland plc secured by Albion Mills Retail Park property. The loan is for a term of five years and bears interest at a variable rate adjusted quarterly, based on three month GBP-based LIBOR plus 1.31%. In addition, we incurred financing costs of approximately £75,000 ($118,000 at December 31, 2010) associated with obtaining this loan. On November 25, 2008, we entered into the interest rate swap agreement that fixed the GBP-based LIBOR rate at 3.94% plus 1.31% or 5.25% per annum as of December 31, 2010 and expires on October 10, 2013. Interest only payments are due quarterly for the term of the loan with principal due at maturity.
On November 18, 2008, in connection with the acquisition of Avion Midrise III & IV, we assumed $20,851,000 ($22,186,000 face value less discount of $1,335,000) fixed rate mortgage loan from Capmark Finance, Inc. that bears interest at a rate of 5.52% per annum and matures on April 1, 2014. Principal and interest payments are due monthly for the remaining loan term and principal payments totaling $411,000 were made during the year ended December 31, 2010. In addition, we incurred financing costs totaling $344,000 in conjunction with the assumption of the loan.
On August 5, 2009, in connection with the acquisition of 12650 Ingenuity Drive, we assumed a $12,572,000 ($13,539,000 face value less a discount of $967,000) fixed rate mortgage loan from PNC Bank, National Association that bears interest at a rate of 5.62% and matures on October 1, 2014. Principal and interest payments are due monthly for the remaining loan term and principal payments totaling $363,000 were made during the year ended December 31, 2010. In addition, we incurred financing costs totaling $284,000 in conjunction with the assumption of the loan.
On August 10, 2009, we entered into a £13,975,000 ($21,759,000 at December 31, 2010) financing agreement with the Abbey National Treasury Services plc secured by the Maskew Retail Park property. On September 24, 2009, we drew the full amount of the loan and concurrently entered into an interest rate swap agreement that fixed the GBP-based LIBOR rate at 3.42% plus 2.26% or 5.68% per annum for the five-year term of the loan. Interest only payments are due quarterly for the term of the loan with principal due at maturity. In addition, we incurred financing costs of approximately £268,000 ($422,000 at December 31, 2010) associated with obtaining this loan.
On June 24, 2010, we assumed two loans in connection with the acquisition of One Wayside Road: (i) a $14,888,000 ($14,633,000 at face value plus a premium of $255,000) fixed rate mortgage loan from State Farm Life Insurance Company that bears interest at a rate of 5.66% and matures on August 1, 2015; and (ii) a $12,479,000 ($12,132,000 at face value plus a premium of $347,000) fixed rate mortgage loan from State Farm Life Insurance Company that bears interest at a rate of 5.92% and matures on August 1, 2015. Principal and interest payments are due monthly for the remaining loan terms and principal payments totaling $294,000 were made during the year ended December 31, 2010 on the two loans. In addition, we incurred financing costs totaling $342,000 in conjunction with the assumption of the loans.
On September 28, 2010, we assumed two loans in connection with the acquisition of 100 Tice Blvd.: (i) a $23,136,000 (21,218,000 at face value plus a premium of $1,918,000) fixed rate loan from Principal Life Insurance Company that bears interest at a rate of 5.97%, matures on September 15, 2022 and the lender has the right to call the loan due and payable on September 15, 2017; and (ii) a $23,136,000 ($21,217,000 at a face value plus a premium of $1,919,000) fixed rate mortgage from Hartford Life and Accidental
90
Insurance Company that bears interest at a rate of 5.97%, matures on September 15, 2022 and the lender has the right to call the loan due and payable on September 15, 2017. Principal and interest payments are due monthly for the remaining loan terms and principal payments totaling $235,000 were made during the year ended December 31, 2010 on the two loans. In addition, we incurred financing costs totaling $476,000 in conjunction with the assumption of the loans.
On December 7, 2010, we entered into a $85,000,000 secured term loan through a subsidiary with Wells Fargo Bank, National Association, or the Pacific Corporate Park Loan. The Pacific Corporate Park Loan has a seven-year term, monthly amortization of $250,000 and is secured by Pacific Corporate Park. Upon closing of the Pacific Corporate Park Loan on December 7, 2010, we entered into an interest rate swap agreement with Wells Fargo Bank, National Association to effectively fix the interest rate on the entire outstanding Pacific Corporate Park Loan amount at 4.89% for its seven-year term. Principal and interest payments are due monthly. There were no principal payments made during the period ended December 31, 2010. In addition, we incurred financing costs of approximately $1,510,000 in conjunction with obtaining the loan.
On December 29, 2010, we entered into a $12,600,000 secured term loan through Woodmen of The World Life Insurance Society secured by the Ten Parkway North property. The Ten Parkway North loan bears interest at a fixed rate of 4.75% per annum and matures on January 1, 2021. Principal and interest payments are due monthly. There were no principal payments made during the period ended December 31, 2010. In addition, we incurred financing costs of approximately $160,000 in conjunction with obtaining the loan.
Loan Payable
On August 8, 2008, we entered into an amended and restated credit agreement with Bank of America, N.A. (“Bank of America”), which amended the terms of our prior credit agreement with Bank of America, to provide us with a new $45,000,000 unsecured revolving line of credit (the “Revolving Credit Facility”), and to replace our prior Bank of America term loan and revolving credit facility which matured in August 2008. The new Revolving Credit Facility was fully drawn upon at closing, with such proceeds utilized to pay down the full $45,000,000 amount outstanding under our prior Bank of America term loan (as of August 8, 2008, no amount was outstanding under our prior $10,000,000 Bank of America revolving credit facility). The new Revolving Credit Facility matures in August 2010 and bears interest at a floating rate of LIBOR plus 2.00% to 2.75%, based upon our leverage ratio as defined in the credit agreement (at our current leverage ratio, the Revolving Credit Facility bears interest at a floating rate of LIBOR plus 2.00%). An upfront fee of $292,500 was paid to Bank of America, and a fee equal to the actual daily amount by which the aggregate commitments exceed the total outstanding (both as defined in the amended and restated credit agreement) times 0.20% per annum if the total outstandings are equal to or more than 50% of the aggregate commitments, or 0.25% per annum otherwise, is accrued on unfunded balances under the Revolving Credit Facility. The loan contains various financial covenants and restrictions including a fixed charge coverage ratio of at least 1.75 to 1.00, as defined in the amended and restated credit agreement. The Revolving Credit Facility expired on August 8, 2010 in accordance with its terms.
On May 26, 2010, we entered into a $70,000,000 revolving credit facility with Wells Fargo Bank, N.A., or the Wells Fargo Credit Facility. The initial maturity date of the Wells Fargo Credit Facility is May 26, 2014, however we may extend the maturity date to May 26, 2015, subject to certain conditions. $15,000,000 of the Wells Fargo Credit Facility was initially drawn upon closing on May 26, 2010, with $55,000,000 initially remaining available for disbursement during the term of the facility. We have the right to prepay any outstanding amount of the Wells Fargo Credit Facility, in whole or in part, without premium or penalty at any time during the term of this Wells Fargo Credit Facility, however, we initially could not reduce the outstanding principal balance below a minimum outstanding amount of $15,000,000, without reducing the total $70,000,000 Wells Fargo Credit Facility capacity. Initially, the Wells Fargo Credit Facility had a floating interest rate of 300 basis points over the LIBOR, however this interest rate would be at least 4.00% for any of the outstanding balance that was not subject to an interest rate swap with an initial term of at least two years. Upon closing on May 26, 2010, we entered into an interest rate swap agreement with Wells Fargo Bank, N.A. to effectively fix the interest rate on the initial $15,000,000 outstanding loan amount at 5.10% for the four-year term of the facility. The interest rate swap was designated as a qualifying cash flow hedge at the start date of the hedge relationship as described in Note 16 “Derivative Instruments.” The Wells Fargo Credit Facility was initially secured by our 13201 Wilfred, 3011, 3055 & 3077 Comcast Place, 140 Depot Street, Crest Ridge Corporate Center I and West Point Trade Center properties. In addition, CBRE OP provides a limited guarantee for the Wells Fargo Credit Facility. The Wells Fargo Credit Facility is subject to certain customary financial covenants, including certain negative financial covenants, which we believe we were in compliance with as of December 31, 2010. A commitment fee of $1,050,000 was paid to Wells Fargo Bank, N.A. at the initial closing and has been deferred to future periods.
On August 31, 2010, we entered into an amended and restated credit agreement with Wells Fargo Bank, N.A. to expand the Wells Fargo Credit Facility from its initial capacity of $70,000,000 to an amended capacity of $125,000,000 (the “Amended Wells Fargo Credit Facility”). In connection with the Amended Wells Fargo Credit Facility, the minimum outstanding amount was increased to $25,000,000 and as such an additional $10,000,000 was drawn (in addition to the $15,000,000 initially drawn on May 26, 2010) with
91
the remaining $100,000,000 available for disbursement during the term of the facility. The Amended Wells Fargo Credit Facility is secured by an additional three of our properties, for a total of eight properties in all: 13201 Wilfred Lane, 3011, 3055 & 3077 Comcast Place, 140 Depot Street, Crest Ridge Corporate Center, West Point Trade Center, 5160 Hacienda Drive, 10450 Pacific Center Court and 225 Summit Avenue. The interest rate was reduced by 25 basis points to 275 basis points over LIBOR (which rate will apply to all withdrawals from the Amended Wells Fargo Credit Facility other than the initial $15,000,000 that was drawn on May 26, 2010) and the initial interest rate floor of 4.00% was eliminated. The initial maturity date remains May 26, 2014, however we may extend the maturity date to May 26, 2015, subject to certain conditions. The Amended Wells Fargo Credit Facility is subject to certain representations and warranties and customary financial covenants (including certain negative financial covenants) with which we believe we were in compliance as of December��31, 2010. A commitment fee of $632,500 was paid to Wells Fargo Bank, N.A. at closing of the Amended Wells Fargo Credit and has been deferred to future periods.
On December 16, 2010, an additional $35,000,000 was drawn (in addition to the $15,000,000 initially drawn on May 26, 2010 and $10,000,000 second draw on August 31, 2010) in connection with the Amended Wells Fargo Credit Facility, with the remaining $65,000,000 available for disbursement during the term of the facility. The $60,000,000 is included in Loan Payable on our consolidated balance sheet.
Distribution Policy
In order to qualify as a REIT under the Internal Revenue Code we generally must make distributions to our shareholders each year in an amount at least equal to 90% of our REIT taxable income (as determined without regard to the dividends paid deduction and excluding net capital gain).
It is anticipated that distributions generally will be taxable as ordinary income to our shareholders, although a portion of such distributions may be designated by us as a return of capital or as capital gain. We will furnish annually to each of our shareholders a statement setting forth distributions paid during the preceding year and their characterization as ordinary income, return of capital or capital gains.
| | | | | | | | | | | | | | | | |
2010 Quarters | | First | | | Second | | | Third | | | Fourth | |
Total distributions declared and paid | | $ | 16,841,000 | | | $ | 19,266,000 | | | $ | 21,623,000 | | | $ | 24,053,000 | |
Distributions per share | | $ | 0.15 | | | $ | 0.15 | | | $ | 0.15 | | | $ | 0.15 | |
| | | | |
2009 Quarters | | First | | | Second | | | Third | | | Fourth | |
Total distributions declared and paid | | $ | 10,066,000 | | | $ | 11,181,000 | | | $ | 12,767,000 | | | $ | 14,750,000 | |
Distributions per share | | $ | 0.15 | | | $ | 0.15 | | | $ | 0.15 | | | $ | 0.15 | |
| | | | |
2008 Quarters | | First | | | Second | | | Third | | | Fourth | |
Total distributions declared and paid | | $ | 4,882,000 | | | $ | 5,907,000 | | | $ | 7,511,000 | | | $ | 8,989,000 | |
Distributions per share | | $ | 0.14375 | | | $ | 0.14375 | | | $ | 0.15 | | | $ | 0.15 | |
To the extent that our cash available for distribution is less than the amount we are required to distribute to qualify as a REIT, we may consider various funding sources to cover any shortfall, including borrowing funds on a short-term, or possibly long-term, basis or selling properties. In addition, we may utilize these funding sources to make distributions that exceed the amount we are required to distribute to qualify as a REIT.
Off-Balance Sheet Arrangements
As of December 31, 2010, we had five Investments in Unconsolidated Entities: (i) a 5.07% ownership interest in CBRE Strategic Partners Asia; (ii) an 80% ownership interest in the Duke joint venture; (iii) a 90% ownership interest in Afton Ridge; (iv) an 80% ownership interest in the UK JV; and (v) an 80% ownership interest in the European JV. Our investments are discussed in Item 2, “Properties,” and Note 5, “Investments in Unconsolidated Entities” in the accompanying consolidated financial statements.
92
Contractual Obligations and Commitments
The following table provides information with respect to our consolidated property contractual obligations at December 31, 2010 (in thousands):
| | | | | | | | | | | | | | | | | | | | |
Contractual Obligations | | Total | | | Less than
One Year | | | One to Three Years | | | Three to Five Years | | | More than
Five Years | |
Note Payable (and interest payments) Collateralized by REMEC Corporate Campus | | $ | (13,832 | ) | | $ | (13,832 | ) | | $ | — | | | $ | — | | | $ | — | |
Note Payable (and interest payments) Collateralized by 300 Constitution Drive | | | (12,774 | ) | | | (581 | ) | | | (12,193 | ) | | | — | | | | — | |
Note Payable (and interest payments) Collateralized by Deerfield Commons I | | | (12,174 | ) | | | (643 | ) | | | (1,286 | ) | | | (10,245 | ) | | | — | |
Note Payable (and interest payments) Collateralized by Bolingbrook Point III | | | (10,697 | ) | | | (1,516 | ) | | | (831 | ) | | | (8,350 | ) | | | — | |
Notes Payable (and interest payments) Collateralized by the Carolina Portfolio | | | (73,412 | ) | | | (6,981 | ) | | | (13,732 | ) | | | (13,351 | ) | | | (39,348 | ) |
Note Payable (and interest payments) Collateralized by Lakeside Office Center | | | (11,477 | ) | | | (578 | ) | | | (1,299 | ) | | | (9,600 | ) | | | — | |
Note Payable (and interest payments) Collateralized by Thames Valley Five (1) | | | (9,196 | ) | | | (151 | ) | | | (9,045 | ) | | | — | | | | — | |
Note Payable (and interest payments) Collateralized by Enclave on the Lake | | | (18,311 | ) | | | (18,311 | ) | | | — | | | | — | | | | — | |
Note Payable (and interest payments) Collateralized by Albion Mills Retail Park (1) | | | (9,535 | ) | | | (183 | ) | | | (9,352 | ) | | | — | | | | — | |
Note Payable (and interest payments) Collateralized by Avion Midrise III & IV | | | (25,203 | ) | | | (1,618 | ) | | | (3,237 | ) | | | (20,348 | ) | | | — | |
Note Payable (and interest payments) Collateralized by 12650 Ingenuity Drive | | | (15,751 | ) | | | (1,118 | ) | | | (2,237 | ) | | | (12,396 | ) | | | — | |
Note Payable (and interest payments) Collateralized by Maskew Retail Park(1) | | | (24,362 | ) | | | (651 | ) | | | (1,301 | ) | | | (22,410 | ) | | | — | |
Loan Payable (and interest payments) Wells Fargo Credit
Facility(1)(2) | | | (29,342 | ) | | | (1,275 | ) | | | (2,550 | ) | | | (25,517 | ) | | | — | |
Loan Payable Wells Fargo Credit Facility(2)(3) | | | (35,000 | ) | | | (35,000 | ) | | | — | | | | — | | | | — | |
Note Payable (and interest payments) Collateralized by One Wayside Road | | | (33,207 | ) | | | (2,127 | ) | | | (4,254 | ) | | | (26,826 | ) | | | — | |
Note Payable (and interest payments) Collateralized by 100 Tice Blvd. | | | (57,745 | ) | | | (3,469 | ) | | | (6,939 | ) | | | (6,939 | ) | | | (40,398 | ) |
Note Payable (and interest payments) Collateralized by Ten Parkway | | | (17,855 | ) | | | (862 | ) | | | (1,724 | ) | | | (1,724 | ) | | | (13,545 | ) |
Note Payable (and interest payments) Collateralized by Pacific Corporate Park | | | (110,187 | ) | | | (7,066 | ) | | | (13,714 | ) | | | (13,127 | ) | | | (76,280 | ) |
| | | | | | | | | | | | | | | | | | | | |
Total | | $ | (520,060 | ) | | $ | (95,962 | ) | | $ | (83,694 | ) | | $ | (170,833 | ) | | $ | (169,571 | ) |
| | | | | | | | | | | | | | | | | | | | |
| (1) | These contractual obligations included the expected net payments due under interest rate swap agreements where in each case we have swapped our variable interest rate payments due under the debt agreements for fixed rates of interest payments. |
| (2) | Includes the eight properties (see Note 8 “Debt”) that secure the Amended Wells Fargo Credit Facility. |
| (3) | Excludes interest for this presentation because of the short-term nature of the revolving portion of this credit facility which is available through May 2014. |
93
The following table provides information with respect to our unconsolidated property contractual obligations at December 31, 2010 (in thousands):
| | | | | | | | | | | | | | | | | | | | |
Contractual Obligations | | Total | | | Less than
One Year | | | One to
Three Years | | | Three to
Five Years | | | More than
Five Years | |
Note Payable (and interest payments) Collateralized by Duke Joint Venture | | $ | (227,539 | ) | | $ | (11,041 | ) | | $ | (100,335 | ) | | $ | (116,164 | ) | | $ | — | |
Note Payable (and interest payments) Collateralized by Afton Ridge Joint Venture | | | (26,656 | ) | | | (1,308 | ) | | | (25,348 | ) | | | — | | | | — | |
| | | | | | | | | | | | | | | | | | | | |
Total Notes Payable Collateralized by Unconsolidated Properties(1) | | $ | (254,195 | ) | | $ | (12,349 | ) | | $ | (125,683 | ) | | $ | (116,164 | ) | | $ | — | |
| | | | | | | | | | | | | | | | | | | | |
| (1) | Unconsolidated payment amounts are at our pro rata share of effective ownership and exclude our investment in CBRE Strategic Partners Asia. |
As of December 31, 2010, we were committed to pay $1,032,000 in accrued offering costs. The timing of future payments is uncertain.
As of December 31, 2010, we had an unfunded investment commitment in CBRE Strategic Partners Asia totaling $4,960,000. The timing of future payments is uncertain.
Income Taxes
We have elected to be taxed as a REIT for U.S. federal income tax purposes commencing with our taxable year ended December 31, 2004. As a REIT, we generally will not be subject to U.S. federal income tax on income that we distribute currently to our shareholders. Under the Internal Revenue Code, REITs are subject to numerous organizational and operational requirements, including a requirement that they generally distribute at least 90% of their annual net taxable income (excluding net capital gains) to their shareholders. If we fail to qualify for taxation as a REIT in any year, our income will be taxed at regular corporate rates, and we may be precluded from qualifying for treatment as a REIT for the four-year period following our failure to qualify. Even if we qualify as a REIT, we may still be subject to state, local and foreign taxes on our income and property and to U.S. federal income and excise taxes on our undistributed gross income. Our properties located in Texas are subject to a Texas Gross Margin Tax, Deerfield Commons I is subject to a Georgia Corporation Income Tax and properties located in North Carolina are subject to a North Carolina Franchise Tax under which we incurred a total of approximately $296,000 and $169,000 of taxes for the years ended December 31, 2010 and 2009.
Inflation
The real estate market has not been affected significantly by inflation in the past several years due to the relatively low inflation rate. With the exception of leases with tenants in multifamily properties, we expect to include provisions in the majority of our tenant leases designed to protect us from the impact of inflation. These provisions will include reimbursement billings for operating expense pass-through charges, real estate tax and insurance reimbursements, or in some cases, annual reimbursement of operating expenses above a certain allowance. Due to the generally long-term nature of these leases, annual rent increases may not be sufficient to cover inflation and rent may be below market. Leases in multifamily properties generally turn over on an annual basis and do not typically present the same issue regarding inflation protection due to their short-term nature.
Quantitative and Qualitative Disclosures About Market Risk
Market risk includes risks that arise from changes in interest rates, foreign currency exchange rates, commodity prices, equity prices and other market changes that affect market sensitive instruments. In pursuing our business plan, we expect that the primary market risk to which we will be exposed is interest rate risk.
We may be exposed to the effects of interest rate changes primarily as a result of long-term debt used to maintain liquidity and fund expansion of our real estate investment portfolio and operations. Our interest rate risk management objectives are to limit the impact of interest rate changes on earnings and cash flows and to lower overall borrowing costs. To achieve our objectives, we will borrow primarily at fixed rates or variable rates and, in some cases, with the ability to convert variable rates to fixed rates. We may also enter into derivative financial instruments such as interest rate swaps and caps in order to mitigate our interest rate risk on a related financial instrument. We will not enter into derivative or interest rate transactions for speculative purposes.
94
Notes Payable secured by real property are summarized as follows (in thousands):
| | | | | | | | | | | | | | | | | | |
| | | Interest Rate as of December 31, | | | | | | |
Property | | 2010 | | | 2009 | | | Maturity Date | | 2010 | | | 2009 | |
REMEC | | | 4.79 | % | | | 4.79 | % | | November 1, 2011 | | $ | 13,250 | | | $ | 13,250 | |
300 Constitution | | | 4.84 | | | | 4.84 | | | April 1, 2012 | | | 12,000 | | | | 12,000 | |
Deerfield Commons I.(1) | | | 5.23 | | | | 5.23 | | | December 1, 2015 | | | 9,725 | | | | 9,725 | |
602 Central Blvd.(2) | | | — | | | | 6.79 | | | — | | | — | | | | 8,886 | |
Bolingbrook Point III | | | 5.26 | | | | 5.26 | | | January 1, 2015 | | | 9,000 | | | | 9,000 | |
Fairforest Bldg. 5(3) | | | 6.33 | | | | 6.33 | | | February 1, 2024 | | | 9,864 | | | | 10,330 | |
Fairforest Bldg. 6(3) | | | 5.42 | | | | 5.42 | | | June 1, 2019 | | | 2,987 | | | | 3,257 | |
HJ Park—Bldg. 1(3) | | | 4.98 | | | | 4.98 | | | March 1, 2013 | | | 648 | | | | 914 | |
North Rhett I(3) | | | 5.65 | | | | 5.65 | | | August 1, 2019 | | | 3,906 | | | | 4,246 | |
North Rhett II(3) | | | 5.20 | | | | 5.20 | | | October 1, 2020 | | | 2,180 | | | | 2,345 | |
North Rhett III(3) | | | 5.75 | | | | 5.75 | | | February 1, 2020 | | | 1,759 | | | | 1,903 | |
North Rhett IV(3) | | | 5.80 | | | | 5.80 | | | February 1, 2025 | | | 9,892 | | | | 10,328 | |
Mt Holly Bldg. (3) | | | 5.20 | | | | 5.20 | | | October 1, 2020 | | | 2,180 | | | | 2,345 | |
Orangeburg Park Bldg.(3) | | | 5.20 | | | | 5.20 | | | October 1, 2020 | | | 2,217 | | | | 2,385 | |
Kings Mountain I(3) | | | 5.27 | | | | 5.27 | | | October 1, 2020 | | | 1,887 | | | | 2,030 | |
Kings Mountain II(3) | | | 5.47 | | | | 5.47 | | | January 1, 2020 | | | 5,594 | | | | 6,057 | |
Union Cross Bldg. I(3) | | | 5.50 | | | | 5.50 | | | July 1, 2021 | | | 2,749 | | | | 2,935 | |
Union Cross Bldg. II(3) | | | 5.53 | | | | 5.53 | | | June 1, 2021 | | | 8,398 | | | | 8,972 | |
Thames Valley Five(4)(5) | | | 6.42 | | | | 6.42 | | | May 30, 2013 | | | 8,781 | | | | 12,117 | |
Lakeside Office Center(6) | | | 6.03 | | | | 6.03 | | | September 1, 2015 | | | 9,000 | | | | 9,000 | |
Enclave on the Lake(7) | | | 5.45 | | | | 5.45 | | | May 1, 2011 | | | 17,906 | | | | 18,274 | |
Albion Mills Retail Park(4)(8)(9) | | | 5.25 | | | | 5.25 | | | October 10, 2013 | | | 8,985 | | | | 9,323 | |
Avion Midrise III & IV(10) | | | 5.52 | | | | 5.52 | | | April 1, 2014 | | | 21,354 | | | | 21,765 | |
12650 Ingenuity Drive(11) | | | 5.62 | | | | 5.62 | | | October 1, 2014 | | | 13,061 | | | | 13,424 | |
Maskew Retail Park(4) (12) | | | 5.68 | | | | 5.68 | | | August 10, 2014 | | | 21,759 | | | | 22,578 | |
One Wayside Road(13) | | | 5.66 | | | | — | | | August 1, 2015 | | | 14,465 | | | | — | |
One Wayside Road(13) | | | 5.92 | | | | — | | | August 1, 2015 | | | 12,006 | | | | — | |
100 Tice Blvd(14) | | | 5.97 | | | | — | | | September 15, 2017 | | | 21,100 | | | | — | |
100 Tice Blvd(14) | | | 5.97 | | | | — | | | September 15, 2017 | | | 21,100 | | | | — | |
Ten Parkway North | | | 4.75 | | | | — | | | January 1, 2021 | | | 12,600 | | | | — | |
Pacific Corporate Park(15) | | | 4.89 | | | | — | | | December 7, 2017 | | | 85,000 | | | | — | |
| | | | | | | | | | | | | | | | | | |
Notes Payable | | | | | | | | | | | | | 365,353 | | | | 217,389 | |
Plus Premium | | | | | | | | | | | | | 4,155 | | | | — | |
Less Discount | | | | | | | | | | | | | (3,700 | ) | | | (4,615 | ) |
Less Albion Mills Retail Park Fair Value Adjustment | | | | | | | | | | | | | (216 | ) | | | (349 | ) |
| | | | | | | | | | | | | | | | | | |
Notes Payable Less Discount and Fair Value Adjustment | | | | | | | | | | | | $ | 365,592 | | | $ | 212,425 | |
| | | | | | | | | | | | | | | | | | |
| (1) | Interest only payments are due monthly for the first 60 months of the loan term. Principal and interest payments are due monthly for the remaining 60 months of the loan term. |
| (2) | This loan was fully paid off on March 11, 2010. |
| (3) | These notes payable were assumed from the seller of the Carolina Portfolio on August 30, 2007 as part of the property acquisitions and were recorded at estimated fair value which includes the discount. |
| (4) | These loans are subject to certain financial covenants (interest coverage and loan to value). |
| (5) | We entered into the interest rate swap agreement that fixes the GBP-based LIBOR rate at 5.41% plus 1.01% or 6.42% per annum as of December 31, 2010 and expires on May 30, 2013. The stated rates on the mortgage note payable were 1.74% and 1.59% at December 31, 2010 and 2009 and were based on GBP-based LIBOR plus a spread of 1.01%. |
| (6) | Interest only payments are due monthly for the first 36 months of the loan term. Principal and interest payments are due monthly for the remaining 48 months of the loan term. |
| (7) | The loan was assumed from the seller of Enclave on the Lake on July 1, 2008 and was recorded at estimated fair value which includes the discount. |
95
| (8) | The Albion Mills Retail Park notes payable balance is presented at cost basis. This loan is carried on our balance sheet at fair value (See Note 17). |
| (9) | We entered into the interest rate swap agreement that fixed the GBP-based LIBOR rate at 3.94% plus 1.31% or 5.25% per annum as of December 31, 2010 and expires on October 10, 2013. The stated rates on the mortgage note payable were 2.04% and 1.88% at December 31, 2010 and 2009 and were based on GBP-based LIBOR plus a spread of 1.31%. |
| (10) | The loan was assumed from the seller of Avion Midrise III & IV on November 18, 2008 and was recorded at estimated fair value which includes the discount. |
| (11) | The loan was assumed from the seller of 12650 Ingenuity Drive on August 5, 2009 and was recorded at estimated fair value which includes the discount. |
| (12) | We entered into the interest rate swap agreement that fixes the GBP-based LIBOR rate at 3.42% plus 2.26 or 5.68% per annum as of December 31, 2010 and expires on August 10, 2014. The stated rate on the mortgage note payable was 2.99% and 2.83% at December 31, 2010 and 2009 and was based on GBP-based LIBOR plus a spread of 2.26%. |
| (13) | The two loans were assumed from the seller of One Wayside Road on June 24, 2010 and were recorded at estimated fair value which include the premiums. |
| (14) | The two loans were assumed from the seller of 100 Tice Blvd. on September 28, 2010 and were recorded at estimated fair value which includes the premiums. The maturity date for the loans is September 17, 2022; however, the lenders, at their option, can declare the note due and payable on September 17, 2017 or provide for a five year extension through the maturity date. |
| (15) | We entered into the interest rate swap agreement that fixed the LIBOR rate at 2.69% plus 2.20% or 4.89% per annum as of December 31, 2010 and expires on December 7, 2017. The stated rate on the mortgage note payable was 2.52% at December 31, 2010, and was based on LIBOR plus a spread of 2.20%. |
Upon the maturity of our debt, there is a market risk as to the prevailing rates at the time of refinancing. Changes in market rates on our fixed-rate debt affect the fair market value of our debt but it has no impact on interest expense or cash flow. A 100 basis point increase or decrease in interest rates on our fixed rate debt would not increase or decrease our annual interest expense on our fixed rate debt.
The fair value of long-term debt was estimated based on current interest rates available to us for debt instruments with similar terms. The following table summarizes our financial instruments and their calculated fair value at December 31, 2010 and 2009 (in thousands):
| | | | | | | | |
| | | As of December 31, 2010 | |
| | | Carrying
Value | | | Total Fair
Value | |
Financial Assets (Liabilities): | | | | | | | | |
Interest Rate Swaps—Non Qualifying | | $ | (1,349 | ) | | $ | (1,349 | ) |
Interest Rate Swaps—Qualifying | | | (1,932 | ) | | | (1,932 | ) |
Notes Payable | | | (365,592 | ) | | | (370,187 | ) |
Loan Payable | | | (60,000 | ) | | | (60,000 | ) |
A 100 basis point increase or decrease in interest rates would increase or decrease the fair market value of our notes payable by $14,112,000 at December 31, 2010. In addition, a 100 basis point increase or decrease in interest rates would either increase or decrease annual variable interest expense by $88,000 on the Thames Valley Five property and approximately $90,000 on the Albion Mills Retail Park property and approximately $218,000 on the Maskew Retail Park property.
| | | | | | | | |
| | | As of December 31, 2009 | |
| | | Carrying
Value | | | Total Fair
Value | |
Financial Assets (Liabilities): | | | | | | | | |
Interest Rate CAP | | $ | 1 | | | $ | 1 | |
Interest Rate Swaps—Non Qualifying | | | (1,410 | ) | | | (1,410 | ) |
Interest Rate Swaps—Qualifying | | | (293 | ) | | | (293 | ) |
Notes Payable | | | (212,425 | ) | | | (210,087 | ) |
In addition to changes in interest rates, the value of our real estate is subject to fluctuations based on changes in local and regional economic conditions and changes in the creditworthiness of lessees, which may affect our ability to refinance our debt if necessary.
96
Debt Maturities
The following table details our consolidated and unconsolidated debt maturities as of December 31, 2010 (in thousands):
| | | | | | | | | | | | | | | | | | | | | | | | | | | | | | | | | | | | |
| | | Consolidated Debt | | | Unconsolidated Debt(1) | | | Consolidated &
Unconsolidated Debt (1) | |
| | | Scheduled
Amortization | | | Term
Maturities | | | Total | | | Scheduled
Amortization | | | Term
Maturities | | | Total | | | Scheduled
Amortization | | | Term
Maturities | | | Total | |
2011 | | $ | 11,083 | | | $ | 66,028 | | | $ | 77,111 | | | $ | 1,241 | | | $ | — | | | $ | 1,241 | | | $ | 12,324 | | | $ | 66,028 | | | $ | 78,352 | |
2012 | | | 10,319 | | | | 12,000 | | | | 22,319 | | | | 1,295 | | | | — | | | | 1,295 | | | | 11,614 | | | | 12,000 | | | | 23,614 | |
2013(2) | | | 10,514 | | | | 17,767 | | | | 28,281 | | | | 1,351 | | | | 102,310 | | | | 103,661 | | | | 11,865 | | | | 120,077 | | | | 131,942 | |
2014 | | | 10,410 | | | | 78,072 | | | | 88,482 | | | | 1,409 | | | | 40,640 | | | | 42,049 | | | | 11,819 | | | | 118,712 | | | | 130,531 | |
2015 | | | 9,915 | | | | 48,738 | | | | 58,653 | | | | 1,345 | | | | 66,959 | | | | 68,304 | | | | 11,260 | | | | 115,697 | | | | 126,957 | |
2016 | | | 9,587 | | | | — | | | | 9,587 | | | | — | | | | — | | | | — | | | | 9,587 | | | | — | | | | 9,587 | |
2017 | | | 9,612 | | | | 98,327 | | | | 107,939 | | | | — | | | | — | | | | — | | | | 9,612 | | | | 98,327 | | | | 107,939 | |
2018 | | | 5,891 | | | | — | | | | 5,891 | | | | — | | | | — | | | | — | | | | 5,891 | | | | — | | | | 5,891 | |
2019 | | | 5,814 | | | | — | | | | 5,814 | | | | — | | | | — | | | | — | | | | 5,814 | | | | — | | | | 5,814 | |
2020 | | | 4,336 | | | | 9,270 | | | | 13,606 | | | | — | | | | — | | | | — | | | | 4,336 | | | | 9,270 | | | | 13,606 | |
Thereafter | | | 7,670 | | | | — | | | | 7,670 | | | | — | | | | — | | | | — | | | | 7,670 | | | | — | | | | 7,670 | |
| | | | | | | | | | | | | | | | | | | | | | | | | | | | | | | | | | | | |
Total | | $ | 95,151 | | | $ | 330,202 | | | $ | 425,353 | | | $ | 6,641 | | | $ | 209,909 | | | $ | 216,550 | | | $ | 101,792 | | | $ | 540,111 | | | $ | 641,903 | |
| | | | | | | | | | | | | | | | | | | | | | | | | | | | | | | | | | | | |
Weighted Average Maturity (years) | | | | | | | | | | | 4.69 | | | | | | | | | | | | 3.81 | | | | | | | | | | | | 4.40 | |
Weighted Average Interest Rate | | | | | | | | | | | 5.39 | % | | | | | | | | | | | 5.14 | % | | | | | | | | | | | 5.31 | % |
| (1) | Unconsolidated debt amounts are at our pro rata share of effective ownership. |
| (2) | The Thames Valley Five consolidated debt ($8,781,000 at December 31, 2010) maturity date may be extended for an additional two years from May, 2013 to May, 2015. In addition, Afton Ridge has the option to extend the maturity date of the unconsolidated debt ($22,950,000 at December 31, 2010—our share) for one additional year from October, 2013 to October, 2014. |
Encumbered and Unencumbered Properties
The following table details our Encumbered and Unencumbered properties as of December 31, 2010 (Approximate Acquisition Cost and Debt Balance in thousands):
| | | | | | | | | | | | | | | | | | | | | | | | | | | | | | | | | | | | |
| | | Consolidated Properties | | | Unconsolidated Properties(1) | | | Consolidated &
Unconsolidated Properties (1) | |
| | | Properties | | | Approximate
Acquisition Cost | | | Debt
Balance | | | Properties | | | Approximate
Acquisition Cost | | | Debt
Balance | | | Properties | | | Approximate
Acquisition Cost | | | Debt
Balance | |
Encumbered Properties(2) | | | 40 | | | $ | 980,655 | | | $ | 425,353 | | | | 17 | | | $ | 411,576 | | | $ | 216,550 | | | | 57 | | | $ | 1,392,231 | | | $ | 641,903 | |
Unencumbered Properties | | | 33 | | | | 327,905 | | | | — | | | | 13 | | | | 217,692 | | | | — | | | | 46 | | | | 545,597 | | | | — | |
| | | | | | | | | | | | | | | | | | | | | | | | | | | | | | | | | | | | |
Total Properties | | | 73 | | | $ | 1,308,560 | | | $ | 425,353 | | | | 30 | | | $ | 629,268 | | | $ | 216,550 | | | | 103 | | | $ | 1,937,828 | | | $ | 641,903 | |
| | | | | | | | | | | | | | | | | | | | | | | | | | | | | | | | | | | | |
| (1) | Number of Properties at 100%. Approximate Acquisition Cost and Debt Balance for Unconsolidated Properties is at our pro rata share of effective ownership. Does not include our investment in CBRE Strategic Partners Asia. |
| (2) | Includes eight properties secured by the Wells Fargo Credit Facility. |
Subsequent Events
From January 1, 2011 through March 17, 2011, we received gross proceeds from our public offering of approximately $80,515,423 from the sale of 8,105,529 common shares.
On January 20, 2011 and February 14, 2011, we paid down the Amended Wells Fargo Credit Facility loan payable by $20,000,000 and $15,000,000, respectively. On March 30, 2011, an additional $30,000,000 was drawn down on the Amended Wells Fargo Credit Facility.
On January 31, 2011, we were notified that the investment commitment period of CBRE Strategic Partners Asia was extended for one year from January 31, 2011 to January 31, 2012.
On February 8, 2011, we entered into five secured term loans totaling $37,000,000 with ING USA Annuity and Life Insurance Company secured by the following properties: 4701 Gold Spike Road, $10,650,000, Summit Distribution Center, $6,700,000, Tolleson Commerce Park II, $4,600,000, 3660 Deerpark Blvd., $7,650,000 and 1985 International Way, $7,400,000. The loans bear interest at a fixed rate of 4.45% and mature on February 8, 2018.
On February 22, 2011, we entered into a lease for the Kings Mountain III property, a 541,910 square foot warehouse/distribution building located in Charlotte, North Carolina for a 10 year term.
97
On February 28, 2011, we entered into a $33,000,000 secured term loan with TD Bank secured by the 100 Kimball Drive property. Upon closing the 100 Kimball Drive loan, we simultaneously entered into an interest rate swap agreement with TD Bank to effectively fix the interest rate on the entire outstanding loan amount to 5.25% for its 10 year term.
On March 24, 2011, the Duke joint venture acquired fee interests in the Remaining Properties, thus completing the acquisition of the Office Portfolio, as described further below.
| | | | | | | | | | | | | | | | | | | | | | | | | | | | | | | | |
Property and Market | | Address | | Year
Built | | | Tenant(1) | | Net
Rentable
Square
Feet | | | Lease
Expiration | | | Approximate
Purchase
Price(2) | | | Pro Rata
Share of
Approximate
Purchase
Price(3) | | | Percentage
Leased | | | Acquisition
Fee(4) | |
Norman Pointe I /
Minneapolis, MN | | 5601 Green Valley Drive Bloomington, MN | | | 2000 | | | NCS Pearson, Inc.(5) | | | 212,722 | | | | 02/2017 | | | $ | 42,600,000 | | | $ | 34,080,000 | | | | 100 | % | | $ | 511,200 | |
| | | | | | | | | |
Norman Pointe II /
Minneapolis, MN | | 5600 West American Boulevard, Bloomington, MN | | | 2007 | | | General Services Administration(6); Hartford Fire Insurance Company(7) | | | 324,296 | | |
| 02/2016;
06/2013 |
| | $ | 46,900,000 | | | $ | 37,520,000 | | | | 100 | % | | $ | 562,800 | |
| | | | | | | | | |
The Landings I /
Cincinnati, Ohio | | 9997 Carver Road, Blue Ash, OH | | | 2006 | | | Citicorp North America(8) | | | 175,695 | | | | 01/2022 | | | $ | 29,659,500 | | | $ | 23,727,600 | | | | 100 | % | | $ | 355,914 | |
| | | | | | | | | |
The Landings II /
Cincinnati, Ohio | | 9987 Carver Road, Blue Ash, OH | | | 2007 | | | — | | | 175,076 | | | | — | | | $ | 26,160,500 | | | $ | 20,928,400 | | | | 96.1 | % | | $ | 313,926 | |
| | | | | | | | | |
One Easton Oval /
Columbus, Ohio | | One Easton Oval, Columbus, Ohio | | | 1997 | | | — | | | 125,031 | | | | — | | | $ | 11,911,000 | | | $ | 9,528,800 | | | | 89.4 | % | | $ | 142,932 | |
| | | | | | | | | |
Two Easton Oval /
Columbus, Ohio | | Two Easton Oval, Columbus, Ohio | | | 1995 | | | — | | | 128,674 | | | | — | | | $ | 12,744,000 | | | $ | 10,195,200 | | | | 74.6 | % | | $ | 152,928 | |
| | | | | | | | | |
Weston Pointe I /
Ft. Lauderdale, Florida | | 2400 North Commerce Parkway, Weston, FL | | | 1999 | | | — | | | 97,579 | | | | — | | | $ | 19,384,250 | | | $ | 15,507,400 | | | | 87.1 | % | | $ | 232,611 | |
| | | | | | | | | |
Weston Pointe II /
Ft. Lauderdale, Florida | | 2200 North Commerce Parkway, Weston, FL | | | 2000 | | | — | | | 97,180 | | | | — | | | $ | 23,375,950 | | | $ | 18,700,760 | | | | 100 | % | | $ | 280,511 | |
| | | | | | | | | |
Weston Pointe III /
Ft. Lauderdale, Florida | | 2250 North Commerce Parkway, Weston, FL | | | 2003 | | | American Intercontinental University(9) | | | 97,178 | | | | 09/2015 | | | $ | 23,583,550 | | | $ | 18,866,840 | | | | 100 | % | | $ | 283,003 | |
| | | | | | | | | |
Weston Pointe IV /
Ft. Lauderdale, Florida | | 2100 North Commerce Parkway, Weston, FL | | | 2006 | | | General Services Administration(6) | | | 96,175 | | | | 04/2019 | | | $ | 28,256,250 | | | $ | 22,605,000 | | | | 100 | % | | $ | 339,075 | |
| | | | | | | | | |
One Conway Park /Chicago, Illinois | | 100 Field Drive, Lake Forest, IL | | | 1989 | | | — | | | 105,000 | | | | — | | | $ | 15,400,000 | | | $ | 12,320,000 | | | | 86.5 | % | | $ | 184,800 | |
| | | | | | | | | |
West Lake at Conway /
Chicago, Illinois | | 1925 West Field Ct., Lake Forest, IL | | | 2008 | | | — | | | 99,538 | | | | — | | | $ | 17,575,000 | | | $ | 14,060,000 | | | | 90.1 | % | | $ | 210,900 | |
| | | | | | | | | |
Atrium I /Columbus, Ohio | | 5525 Parkcenter Circle, Dublin, OH | | | 1996 | | | Nationwide Mutual Insurance Company(10) | | | 315,102 | | |
| 05/2018;
05/2019 |
(11) | | $ | 45,250,000 | | | $ | 36,200,000 | | | | 100 | % | | $ | 543,000 | |
| (1) | This column represents tenants that currently occupy more than 50,000 net rentable square feet of each property. Properties which do not list a tenant are multi-tenant properties that do not currently have a tenant that occupies more than 50,000 net rentable square feet. |
| (2) | Approximate total purchase price, exclusive of customary closing costs, paid by the Duke Joint Venture for each property. |
| (3) | Pro rata share of approximate purchase price is at the Company’s pro rata share of effective ownership for each of these properties, which was funded using net proceeds of the Company’s current public offering. |
| (4) | Acquisition fees payable to the Investment Advisor are not included in the total acquisition cost for the properties. |
| (5) | NCS Pearson, Inc. provides services, software, systems, and Internet-based technologies for the collection, management, and interpretation of data. |
| (6) | The General Services Administration is an independent agency of the Federal Government of the United States of America, which supplies products and communications for U.S. government offices, provides transportation and office space to federal employees and develops government-wide cost-minimizing policies and other management tasks. |
| (7) | Hartford Fire Insurance Company is a subsidiary of The Hartford Financial Services Group and one of the world’s leading providers of fire, marine and casualty insurance. |
| (8) | Citicorp North America, Inc., provides regional banking services and is a subsidiary of Citigroup, Inc. (NYSE: C). |
98
| (9) | American Intercontinental University is an international for-profit university with both physical and online campuses. |
| (10) | Nationwide Mutual Insurance Company is one of the nation’s largest insurance and financial services companies. |
| (11) | This tenant has two separate leases within this property, as they rent two separate spaces. |
On March 24, 2011, in connection with the acquisition of the Remaining Properties as described above, the Duke joint venture entered into the Term Loan Agreement with Wells Fargo Bank, National Association. While the term loan is non-recourse to us, the pro rata share of the term loan obligation attributable to us is $220,000,000 in accordance with our ownership interest in the Duke joint venture. The loan proceeds were used to accelerate the acquisition of the Remaining Properties. The loan has a six-month term and two six-month extension options. The term loan has an interest rate of LIBOR plus 2.50% and is fully pre-payable at any time, subject to any customary costs. An origination fee of $1,650,000 was paid to Wells Fargo Bank, National Association at the closing of the term loan. The Term Loan Agreement contains customary representations and warrants and covenants. During the term of the loan, the Duke Joint Venture has agreed to comply with certain financial covenants related to its leverage ratio, net asset value, unencumbered leverage ratio and the inability to enter into certain types of investments.
99
| ITEM 7A. | QUANTITATIVE AND QUALITATIVE DISCLOSURES ABOUT MARKET RISK |
For a discussion of quantitative and qualitative disclosures about market risk, see the “Quantitative and Qualitative Disclosures About Market Risk” section of Management’s Discussion and Analysis of Financial Condition and Results of Operations above.
| ITEM 8. | FINANCIAL STATEMENTS AND SUPPLEMENTARY DATA |
See Part IV Item 15 beginning on page F-1 of this Annual Report on Form 10-K incorporated herein by reference.
| ITEM 9. | CHANGES IN AND DISAGREEMENTS WITH ACCOUNTANTS ON ACCOUNTING AND FINANCIAL DISCLOSURE |
None.
| ITEM 9A. | CONTROLS AND PROCEDURES |
Disclosure Controls and Procedures
We have formally adopted a policy for disclosure controls and procedures that provides guidance on the evaluation of disclosure controls and procedures and is designed to ensure that all corporate disclosure is complete and accurate in all material respects and that all information required to be disclosed in the periodic reports submitted by us under the Securities Exchange Act of 1934 is recorded, processed, summarized and reported within the time periods and in the manner specified in the Securities and Exchange Commission’s rules and forms and that disclosure controls and procedures were effective to ensure that the information required to be disclosed by us is accumulated and communicated to our management, including our chief executive officer and chief financial offer, as appropriate to allow timely decisions regarding required disclosure. Notwithstanding the foregoing, a control system, no matter how well designed and operated, can provide only reasonable, not absolute, assurance that it will detect or uncover failures within our company to disclose material information otherwise required to be set forth in our periodic reports. Also, we have an investment in five unconsolidated entities. As we do not control these entities, our disclosure controls and procedures with respect to these entities are necessarily substantially more limited than those we maintain with respect to our consolidated subsidiaries.
As of the end of the period covered by this report, we carried out an evaluation, under the supervision and with the participation of our management, including our chief executive officer and chief financial officer, of the effectiveness of our disclosure controls and procedures. Based upon that evaluation, as required by the Securities Exchange Act Rule 13(a)-15(e) , our chief executive officer and chief financial officer concluded that our disclosure controls and procedures were effective as of the end of the period covered by this report.
Management’s Report on Internal Control Over Financial Reporting
Our management is responsible for establishing and maintaining adequate internal control over financial reporting, as such term is defined in Securities Exchange Act Rules 13a-15(f), including maintenance of (i) records that in reasonable detail accurately and fairly reflect the transactions and dispositions of our assets, and (ii) policies and procedures that provide reasonable assurance that (a) transactions are recorded as necessary to permit preparation of financial statements in accordance with accounting principles generally accepted in the United States of America, (b) our receipts and expenditures are being made only in accordance with authorizations of management and our Board of Trustees and (c) we will prevent or timely detect unauthorized acquisition, use, or disposition of our assets that could have a material effect on the financial statements.
Internal control over financial reporting cannot provide absolute assurance of achieving financial reporting objectives because of the inherent limitations of any system of internal control. Internal control over financial reporting is a process that involves human diligence and compliance and is subject to lapses of judgment and breakdowns resulting from human failures. Internal control over financial reporting also can be circumvented by collusion or improper overriding of controls. As a result of such limitations, there is risk that material misstatements may not be prevented or detected on a timely basis by internal control over financial reporting. However, these inherent limitations are known features of the financial reporting process. Therefore, it is possible to design into the process safeguards to reduce, though not eliminate, this risk.
Under the supervision and with the participation of our management, including our chief executive officer and chief financial officer, we conducted an evaluation of the effectiveness of our internal control over financial reporting based on the criteria established in Internal Control—Integrated Framework issued by the Committee of Sponsoring Organizations (“COSO”) of the Treadway Commission. Based on our evaluation under the COSO framework, our management concluded that our internal control over financial reporting was effective as of December 31, 2010. The effectiveness of internal control over financial reporting as of December 31, 2010 has been audited by Deloitte & Touche LLP, an independent registered public accounting firm, as stated in their report which is included herein.
Changes in Internal Controls Over Financial Reporting
No changes in internal control over financial reporting occurred during the last fiscal quarter that have materially affected, or are reasonably likely to materially affect, our internal control over financial reporting.
100
REPORT OF INDEPENDENT REGISTERED PUBLIC ACCOUNTING FIRM
To the Board of Trustees of
CB Richard Ellis Realty Trust
Los Angeles, California
We have audited the internal control over financial reporting of CB Richard Ellis Realty Trust and subsidiaries (the “Company”) as of December 31, 2010, based on criteria established inInternal Control—Integrated Framework issued by the Committee of Sponsoring Organizations of the Treadway Commission. The Company’s management is responsible for maintaining effective internal control over financial reporting and for its assessment of the effectiveness of internal control over financial reporting, included in the accompanying Management’s Report on Internal Control Over Financial Reporting. Our responsibility is to express an opinion on the Company’s internal control over financial reporting based on our audit.
We conducted our audit in accordance with the standards of the Public Company Accounting Oversight Board (United States). Those standards require that we plan and perform the audit to obtain reasonable assurance about whether effective internal control over financial reporting was maintained in all material respects. Our audit included obtaining an understanding of internal control over financial reporting, assessing the risk that a material weakness exists, testing and evaluating the design and operating effectiveness of internal control based on the assessed risk, and performing such other procedures as we considered necessary in the circumstances. We believe that our audit provides a reasonable basis for our opinion.
A company’s internal control over financial reporting is a process designed by, or under the supervision of, the company’s principal executive and principal financial officers, or persons performing similar functions, and effected by the company’s board of directors, management, and other personnel to provide reasonable assurance regarding the reliability of financial reporting and the preparation of financial statements for external purposes in accordance with generally accepted accounting principles. A company’s internal control over financial reporting includes those policies and procedures that (1) pertain to the maintenance of records that, in reasonable detail, accurately and fairly reflect the transactions and dispositions of the assets of the company; (2) provide reasonable assurance that transactions are recorded as necessary to permit preparation of financial statements in accordance with generally accepted accounting principles, and that receipts and expenditures of the company are being made only in accordance with authorizations of management and directors of the company; and (3) provide reasonable assurance regarding prevention or timely detection of unauthorized acquisition, use, or disposition of the company’s assets that could have a material effect on the financial statements.
Because of the inherent limitations of internal control over financial reporting, including the possibility of collusion or improper management override of controls, material misstatements due to error or fraud may not be prevented or detected on a timely basis. Also, projections of any evaluation of the effectiveness of the internal control over financial reporting to future periods are subject to the risk that the controls may become inadequate because of changes in conditions, or that the degree of compliance with the policies or procedures may deteriorate.
In our opinion, the Company maintained, in all material respects, effective internal control over financial reporting as of December 31, 2010, based on the criteria established in Internal Control—Integrated Framework issued by the Committee of Sponsoring Organizations of the Treadway Commission.
We have also audited, in accordance with the standards of the Public Company Accounting Oversight Board (United States), the consolidated financial statements and financial statement schedules as of and for the year ended December 31, 2010 of the Company and our report dated March 30, 2011 expressed an unqualified opinion on those financial statements and financial statement schedules.
/s/ DELOITTE & TOUCHE LLP
Los Angeles, California
March 30, 2011
| ITEM 9B. | OTHER INFORMATION |
None.
101
PART III
| ITEM 10. | TRUSTEES, EXECUTIVE OFFICERS OF THE REGISTRANT AND CORPORATE GOVERNANCE |
Certain of the information required by Item 10 will be set forth in our Definitive Proxy Statement for our 2011 Annual Meeting of Shareholders, expected to be filed pursuant to Regulation 14A under the Securities and Exchange Act of 1934, as amended, on or prior to April 30, 2011 (the “2011 Proxy Statement”), and is incorporated herein by reference.
The following table and biographical descriptions set forth certain information, as of the date of the filing of this Annual Report on Form 10-K, regarding our executive officers and trustees. Our Board of Trustees currently consists of five individuals, three of whom are independent. The biographical descriptions for each trustee include the specific experience, qualifications, attributes and skills that led to the conclusion by our Board of Trustees that such person should serve as a trustee.
| | | | | | |
Name | | Age | | | Position |
Jack A. Cuneo | | | 63 | | | Chairman of the Board of Trustees, President and Chief Executive Officer |
Charles E. Black | | | 62 | | | Trustee |
Martin A. Reid | | | 55 | | | Trustee |
James M. Orphanides | | | 60 | | | Trustee |
Peter E. DiCorpo | | | 39 | | | Trustee |
Laurie E. Romanak | | | 51 | | | Senior Vice President and Chief Financial Officer and Secretary |
Philip L. Kianka | | | 54 | | | Chief Operating Officer and Executive Vice President |
| * | Denotes independent trustee |
Jack A. Cuneo. Mr. Cuneo has been the Chairman of the Board of Trustees since January 2009 and our President and Chief Executive Officer and the President and Chief Executive Officer of our Investment Advisor since March 2004. Mr. Cuneo has over 41 years of experience in the real estate industry and had been involved in a wide range of real estate investment activity including acquisitions, development, joint venture structuring, property sales, work outs and private equity financing for REITs and real estate operating companies. Prior to joining CB Richard Ellis Investors L.L.C., or CBRE Investors, in June 2003, Mr. Cuneo served as President of Cuneo Capital Group which engaged in advisory and private equity investment activities from 2002 to 2003. Mr. Cuneo also spent 26 years at Merrill Lynch where he served from 1997 to 2000 as the Chairman and Chief Executive Officer of Merrill Lynch Hubbard, a real estate investment subsidiary which acquired, operated and sold over 100 properties valued at $1.8 billion on behalf of over 240,000 individual investors. Mr. Cuneo was a Managing Director of the Global Real Estate and Hospitality Group at Merrill Lynch from 2000 to 2002 where he led private equity, advisory and asset sales activities. He is a member of the Urban Land Institute (ULI), the Policy Advisory Board at the Haas School of Business, University of California at Berkeley and the Real Estate Board of New York. Mr. Cuneo received a B.A. from City College of New York and pursued graduate studies at the University of Massachusetts at Amherst.
Charles E. Black. Mr. Black has been one of our trustees since June 2004. Mr. Black is an attorney in private practice who represents developers, land owners and businesses in the development, entitlement, financing and implementation of politically sensitive, public and private real estate projects through the firm, Luce, Forward, Hamilton & Scripps LLP, where Mr. Black is of counsel. Mr. Black’s area of special focus in the real estate industry relates to structuring the entitlement and financing of large public/private mixed-use developments anchored by sports venues, convention centers and other public facilities. Mr. Black is the Chief Executive Officer of CB Urban Development, a development company he founded in 2007 which specializes in mixed-use urban development projects. Prior to that, Mr. Black was the Regional Senior Vice President (San Diego region) of The Irvine Company. Prior to joining The Irvine Company in March 2006, Mr. Black was the Executive Vice President of JMI Realty, where he had overall management responsibility for the development of Petco Park, the $450 million San Diego Padres baseball park that was completed in February 2004. Prior to joining JMI Realty in 2002, Mr. Black was the President and Chief Operating Officer of the San Diego Padres Baseball Club. From 1991 to 2002, Mr. Black was a partner in the law firm of Gray, Cary, Ware and Freidenrich, where his areas of expertise included real estate acquisition and development, urban planning and development law and development financing. Mr. Black is a member of the Urban Land Institute (ULI) and the land economics society Lambda Alpha. Mr. Black received a B.S. from the United States Air Force Academy and a J.D. from the University of California at Davis.
Martin A. Reid. Mr. Reid has been one of our trustees since March 2005. Mr. Reid is the Executive Vice President, Development and Acquisitions at Interstate Hotels & Resorts where he focuses on sourcing and acquiring hotels and identifying management contract opportunities. Prior to joining Interstate, Mr. Reid is a partner in Cheswold Real Estate Investment management. Prior to joining Cheswold, Mr. Reid was the Chief Executive Officer of the General Partner of Redstone Hotel Partners, advising on hotel transactions and fund raising activities. From 1998 until 2006, Mr. Reid was a Managing Director of Thayer Lodging where he was responsible for acquisitions and dispositions. Mr. Reid has a broad professional background in real estate investment, capital markets and finance,
102
including experience in public accounting and financial reporting. Prior to joining Thayer Lodging in 1998, Mr. Reid spent four years as a Principal at LaSalle Advisors in Baltimore, Maryland, successor through merger to Alex. Brown Kleinwort Benson, where he originated and closed real estate transactions for pension fund clients. Prior to his tenure with LaSalle, Mr. Reid spent several years in acquisitions and dispositions with real estate investment and advisory affiliates of Merrill Lynch & Co. and Chase Manhattan Bank, where he was involved in the acquisition of several office, retail and residential properties and portfolios. Mr. Reid received a B.S. in Accounting from the State University of New York at Albany and an M.B.A. in Financial Management from Pace University. Mr. Reid is a Member of the American Institute of Certified Public Accountants and is a Full Member of the Urban Land Institute (ULI).
James M. Orphanides. Mr. Orphanides has been one of our trustees since October 2005. Since January 2010, Mr. Orphanides has been a Partner and the President of Centurion Holdings LLC. Mr. Orphanides has been retired since 2008 where he had served as Chairman Emeritus of First American Title Insurance Company of New York and as a director until the company merged with its parent, First American Title Insurance Company in November 2010. Mr. Orphanides worked for First American since 1992 in key executive positions and from 1996 through 2007 he was President, CEO and Chairman of the Board. Prior to joining First American, Mr. Orphanides was a Principal and President of Preferred Land Title Services, Inc. from 1982 to 1992. Mr. Orphanides was an executive at Commonwealth Land Title Insurance Company from 1979 to 1982 and an executive at Chicago Title Insurance Company from 1972 to 1979. Mr. Orphanides was a trustee of Wilshire Enterprises, Inc. from January 2009 through January 2010 where he was a member of the Audit committee and chaired strategic planning. Mr. Orphanides has been actively involved in many non-for profit organizations. Currently, Mr. Orphanides sits on the Boards of: the Foundation for Medical Evaluation and Early Detection, Citizen Budget Commission, The American Ballet Theatre and CUNY TV Foundation. Mr. Orphanides is also a member of the Hellenic American Bankers Association (HABA) and the Economic Club of New York; TPC Golf Club at Jasna Polona in Princeton, New Jersey; the Nassau Club in Princeton, New Jersey and the Union League Club in New York City. Mr. Orphanides received a B.A. from Heidelberg College and an M.A. from Queens College of New York.
Peter E. DiCorpo. Mr. DiCorpo has been one of our trustees since March 2009. Mr. DiCorpo joined CBRE Investors in 2008 as Global Chief Operating Officer. In this capacity, he is responsible for the global execution of the company’s business plan and oversight of day-to-day business operations. He is a member of the firm’s Executive Committee and Global Leadership Team. Mr. DiCorpo is a seasoned real estate professional who has a broad range of experience in many facets of the industry, including accounting, auditing and operations experience. He joined CBRE Investors from AIG Global Real Estate Investment Corp., where he served in various capacities since 1995, including Chief Administrative Officer. He also served as Head of Residential Production where he created a national investment team and oversaw all multifamily investments. Mr. DiCorpo earned a B.A. degree in Mathematical Economics from Colgate University, a M.S. in Professional Accounting from the University of Hartford and an M.B.A. in Finance and Management from New York University Stern School of Business.
Laurie E. Romanak. Ms. Romanak has been our Senior Vice President, Chief Financial Officer and Secretary and a Managing Director of our Investment Advisor since March 2004. Ms. Romanak is also the Executive Managing Director and Global Head of Investment Reporting of CBRE Investors and is responsible for global accounting/reporting and finance activities for the organization’s approximately $37.6 billion real estate investment portfolio. Ms. Romanak directs fund accounting and administration for the firm’s offices in the US, Asia and Europe. Ms. Romanak joined CBRE Investors in 1986 and has served in her current role since 1995. Ms. Romanak is a C.P.A. and has more than 25 years of experience in the commercial real estate industry. Ms. Romanak previously served on the Board of Directors of the National Council of Real Estate Investment Fiduciaries (NCREIF) and as its past President, and is an active member of the National Association of Real Estate Investment Managers (NAREIM). Ms. Romanak received a B.B.A. from the University of Michigan at Ann Arbor.
Philip L. Kianka. Mr. Kianka has been our Chief Operating Officer and Executive Vice President since October 2008. Mr. Kianka has also been the Director of Operations of the Investment Advisor since January 2006. Mr. Kianka is also a Senior Director of CBRE Investors. Mr. Kianka has over 27 years of experience in acquisitions, asset and portfolio management, development and dispositions of real estate. Prior to joining the Investment Advisor, Mr. Kianka was a Vice President and senior asset manager for Lexington Corporate Properties Trust from 1997 to December 2005. Mr. Kianka also spent 13 years as Vice President at Merrill Lynch Hubbard, a real estate investment subsidiary of Merrill Lynch, which acquired, operated and sold over 100 properties valued at $1.8 billion on behalf of over 240,000 investors. Mr. Kianka received a B.A. and a MARCH from Clemson University in Clemson, South Carolina and is a licensed architect and member of the American Institute of Architects.
Our trustees and executive officers will serve until their successors are duly elected and qualified.
Section 16(a) Beneficial Ownership Reporting Compliance
Section 16(a) of the Exchange Act requires our executive officers and trustees, and persons who own more than 10% of a registered class of our equity securities, to file reports of ownership and changes in ownership on Forms 3, 4 and 5 with the SEC. Based solely on
103
a review of the copies of the forms received and written representations, we believe that during fiscal year 2010, our executive officers, trustees and persons who own more than 10% of a registered class of our equity securities complied with the beneficial ownership reporting requirements of Section 16(a) of the Securities Exchange Act of 1934, as amended.
Code of Business Conduct and Ethics
Our Board of Trustees has adopted a code of business conduct and ethics that applies to our trustees, executive officers and officers and employees of our Investment Advisor. Among other matters, our code of business conduct and ethics was designed to deter wrongdoing and to assist our trustees, executive officers and officers and employees of our Investment Advisor in promoting honest and ethical conduct, including the ethical handling of actual or apparent conflicts of interest between personal and professional relationships; full, fair, accurate, timely and understandable disclosure in our SEC reports and other public communications; compliance with applicable governmental laws, rules and regulations; prompt internal reporting of violations of the code to appropriate persons identified in the code; and accountability for adherence to the code.
Any amendment to, or waiver of, this code of business conduct and ethics for our executive officers or trustees may be made only by our Board of Trustees or one of our board committees specifically authorized for this purpose and must be promptly disclosed as required by law or stock exchange regulations. Our Code of Business Conduct and Ethics is available on our websitehttp://www.cbrerealtytrust.com. You may also obtain, free of charge, a copy of our code of business conduct and ethics by directing your request in writing to CB Richard Ellis Realty Trust, 515 South Flower Street, Suite 3100, Los Angeles, California 90071, Attn: Laurie E. Romanak.
Audit Committee and Audit Committee Financial Expert
We have a standing Audit Committee, consisting of Messrs. Reid (Chairman) and Black, each of whom is “independent” as such term is defined by the applicable rules of the SEC and our declaration of trust. Our Board of Trustees has determined that Mr. Martin A. Reid is an “audit committee financial expert,” as defined in the rules promulgated by the SEC under the Sarbanes-Oxley Act of 2002, as amended. Our Audit Committee’s primary function is to assist the Board of Trustees in fulfilling its oversight responsibilities by reviewing the financial information to be provided to the shareholders and others, the system of internal controls that management has established, and the audit and financial reporting process.
| ITEM 11. | EXECUTIVE COMPENSATION |
Certain of the information required by Item 11 will be set forth in the 2011 Proxy Statement and is incorporated herein by reference.
Compensation of Trustees
Trustees of our company who are not independent receive no additional compensation for their services as trustees. The following table sets forth the compensation earned by our independent trustees for the year ended December 31, 2010:
| | | | | | | | | | | | | | | | |
Name | | Fees Earned or
Paid in Cash
($) | | | Stock
Awards(1)
($) | | | All Other
Compensation
($) | | | Total
($) | |
Charles E. Black | | $ | 64,500 | | | $ | 80,000 | | | | — | | | $ | 144,500 | |
Martin A. Reid | | $ | 68,750 | | | $ | 80,000 | | | | — | | | $ | 148,750 | |
James M. Orphanides | | $ | 55,250 | | | $ | 80,000 | | | | — | | | $ | 135,250 | |
| * | The columns “Option Awards,” “Non-Equity Incentive Plan Compensation,” and “Change in Pension Value and Nonqualified Deferred Compensation Earnings” were omitted from this table as no such compensation was earned by our independent trustees for the year ended December 31, 2010. |
| (1) | On April 20, 2010, we awarded each of our independent trustees equity grants under the 2004 equity incentive plan on the following terms: (i) each award was for $80,000 in restricted common shares (or 8,000 shares at $10.00 per share) for a total of $240,000; (ii) each award vested in its entirety, upon issuance; and (iii) the independent trustee may not redeem any of the restricted common shares prior to the third anniversary of date of issuance, but he retains the rights to dividends declared and paid during such restriction period. |
For the 2010 fiscal year, we paid each of our independent trustees $40,000 per year and $1,000 per regularly scheduled committee meeting attended (other than those meetings of the Special Committee that were held in conjunction with meetings of the Board of Trustees) and $1,000 per special board meeting attended whether held in person or by telephone conference. The chairperson of the
104
Audit Committee is entitled to an additional annual fee of $7,500, the chairperson of the Compensation Committee is entitled to an additional annual fee of $5,000 and the chairperson of the Special Committee is entitled to an additional annual fee of $10,000. Members of the Special Committee (other than the chairperson) are entitled to an additional annual fee of $5,000. All trustees receive reimbursement of reasonable out-of-pocket expenses incurred in connection with attendance at meetings of our Board of Trustees. If a trustee also is an officer of ours, we do not pay separate compensation for those services rendered as a trustee.
Equity Incentive Plans
We have adopted a 2004 equity incentive plan. The purpose of the 2004 equity incentive plan is to provide us with the flexibility to use share options and other awards to provide a means of performance-based compensation. Key employees, directors, trustees, officers, advisors, consultants or other personnel of ours and our subsidiaries or other persons expected to provide significant services to us or our subsidiaries, including employees of our Investment Advisor, would be eligible to be granted share options, restricted shares, phantom shares, dividend equivalent rights and other share-based awards under the 2004 equity incentive plan. As of December 31, 2010, no stock options, warrants or other rights were outstanding under this plan, other than the equity awards made on April 20, 2010.
We have adopted a 2004 performance bonus plan. Annual bonuses under our 2004 performance bonus plan are awarded by our Compensation Committee to selected officers or other employees of ours, or key employees, based on corporate factors or individual factors (or a combination of both). As of December 31, 2010, no awards have been granted under this plan.
See Item 5. “Market for Registrant’s Common Equity, Related Shareholders Matters and Issuer Purchases of Equity Securities,” for a detailed description of these equity incentive plans.
Compensation Committee Interlocks and Insider Participation
There are no Compensation Committee interlocks and we do not have any employees. The members of our Compensation Committee for the year ended December 31, 2010 were Messrs. Black (chairman) and Reid.
| ITEM 12. | SECURITY OWNERSHIP OF CERTAIN BENEFICIAL OWNERS AND MANAGEMENT AND RELATED MATTERS |
Certain of the information required by Item 12 will be set forth in the 2011 Proxy Statement and is incorporated herein by reference.
Equity Compensation Plan Information
On April 20, 2010, our Board’s independent trustees, Messrs. Black, Reid and Orphanides, were awarded equity grants under our 2004 equity incentive plan on the following terms: (i) each award was for $80,000 in restricted common shares of the Trust (or 8,000 shares at $10.00 per share) for a total of $240,000; (ii) each award vested in its entirety, upon issuance; and (iii) the independent trustee would not be able to redeem any of the restricted common shares prior to the third anniversary of date of issuance, but retains the rights to dividends declared and paid during such restriction period. We recognized a stock based compensation expense of $240,000 during the year ended December 31, 2010 as a result of granting these awards to our independent trustees. No awards of any kind were made under this plan during the years ended December 31, 2009 and 2008.
As of December 31, 2010, no stock options, warrants, or other rights were outstanding under the 2004 equity incentive plan other than the equity awards made on April 20, 2010. As of December 31, 2010, no awards have been granted under the 2004 performance bonus plan.
Security Ownership of Certain Beneficial Owners and Management
The following table presents information regarding the beneficial ownership of our common shares as of March 20, 2011 with respect to:
| | ¡ | | each person who is the beneficial owner of more than five percent of our outstanding common shares; |
| | ¡ | | each of our named executive officers; and |
| | ¡ | | all trustees and executive officers as a group. |
105
Unless otherwise indicated, all common shares are owned directly and the indicated person has sole voting and investment powers.
| | | | | | | | |
Name and Address(1) | | Shares Owned(2) | | | Percentage | |
Trustees and Executive Officers: | | | | | | | | |
Jack A. Cuneo | | | 120 | | | | * | |
Charles E. Black(3) | | | 8,000 | | | | * | |
Martin A. Reid(3) | | | 8,000 | | | | * | |
James M. Orphanides(3) | | | 89,522 | | | | * | |
Peter E. DiCorpo | | | — | | | | — | |
Laurie E. Romanak | | | — | | | | — | |
Philip L. Kianka | | | — | | | | — | |
All executive officers and trustees as a group | | | 105,642 | | | | * | |
| (1) | The address for each of our named executive officers is 47 Hulfish Street, Suite 210, Princeton, New Jersey 08542. |
| (2) | Beneficial ownership is determined in accordance with Rule 13d-3 of the Exchange Act. A person is deemed to be the beneficial owner of any shares of common shares if that person has or shares voting power or investment power with respect to those shares, or has the right to acquire beneficial ownership at any time within 60 days of the date of the table. As used herein, “voting power” is the power to vote or direct the voting of shares and “investment power” is the power to dispose or direct the disposition of shares. |
| (3) | Includes 8,000 common shares awarded to our independent trustees during 2010. |
| ITEM 13. | CERTAIN RELATIONSHIPS, RELATED TRANSACTIONS AND TRUSTEE INDEPENDENCE |
Certain of the information required by Item 13 will be set forth in the 2011 Proxy Statement and is incorporated herein by reference.
The Advisory Agreement
We entered into an advisory agreement with our Investment Advisor in July 2004, which was amended and restated in October 2006, January 2009 and December 2010. Pursuant to this agreement, which was unanimously approved by our Board of Trustees, including our independent trustees, we appointed our Investment Advisor to manage, operate, direct and supervise our operations. Our Investment Advisor performs its duties as a fiduciary of us and our shareholders. Many of the services to be performed by our Investment Advisor in managing our day-to-day activities are summarized below. This summary is provided to illustrate the material functions that our Investment Advisor performs for us as our Investment Advisor, and it is not intended to include all of the services that may be provided to us by our Investment Advisor or by third parties. Our Investment Advisor may subcontract with third parties for the performance of certain duties on our behalf. Our Investment Advisor will only subcontract with third parties that are believed to have the requisite experience to perform their duties. Our Investment Advisor will supervise the activities of any such third parties consistent with its fiduciary duty to us. Under the terms of the advisory agreement, our Investment Advisor undertakes to use its best efforts to present to us investment opportunities consistent with our investment policies and objectives as adopted by our Board of Trustees. In its performance of this undertaking, our Investment Advisor shall, subject to the authority of our Board of Trustees:
| | ¡ | | find, present and recommend to us real estate investment opportunities consistent with our investment policies and objectives; |
| | ¡ | | structure the terms and conditions of transactions pursuant to which acquisitions of properties will be made; |
| | ¡ | | acquire assets on our behalf in compliance with our investment objectives and policies; |
| | ¡ | | arrange for financing and refinancing of properties; and |
| | ¡ | | enter into leases and service contracts for the properties acquired. |
The initial term of the advisory agreement was for one year and the term may be renewed at the end of each year of the agreement for an additional one-year period. The current term of the advisory agreement expires on April 30, 2011. Prior to any renewal, our trustees will evaluate the performance of our Investment Advisor and the criteria used in such evaluation will be reflected in the minutes of such meeting. Additionally, the advisory agreement may be terminated:
| | ¡ | | immediately by us (i) in the event our Investment Advisor commits fraud, criminal conduct, willful misconduct or willful or negligent breach of fiduciary duty by our Investment Advisor, (ii) upon the bankruptcy or insolvency of our Investment Advisor, CBRE Investors and/or CB Richard Ellis Group, Inc., (iii) upon material breach of the advisory agreement by our Investment Advisor, which remains uncured after 30 days’ written notice or (iv) if there is a dissolution of CBRE Investors and/or CB Richard Ellis Group, Inc.; |
106
| | ¡ | | without cause or penalty by a majority of our independent trustees or by our Investment Advisor upon 60 days’ written notice; or |
| | ¡ | | immediately by our Investment Advisor upon our bankruptcy or any material breach of the advisory agreement by us, which remains uncured after 10 days’ written notice. |
Our advisory agreement was negotiated between related parties and we did not have the benefit of arm’s length negotiations of the type normally conducted with an unaffiliated third party. Our Investment Advisor and its affiliates are paid fees, and can be reimbursed for all costs it incurs, in connection with services provided to us. Certain fees payable to our Investment Advisor are not tied to the performance of our portfolio. These payments are summarized under “—Receipt of Fees and Other Compensation and Equity Interest in us by our Investment Advisor and its Affiliates and our Dealer Manager and its Affiliates.” In the event the advisory agreement is terminated, our Investment Advisor will be paid all accrued and unpaid fees and expense reimbursements. In addition, an affiliate of our Investment Advisor has received one class B limited partnership interest in CBRE OP (representing 100% of the class B interest outstanding) in exchange for the services provided to us relating to our formation and future services. The class B limited partnership interest is subject to redemption by CBRE OP in the event of termination of the advisory agreement.
A majority of our independent trustees, and a majority of trustees not otherwise interested in the transaction, must approve all transactions with our Investment Advisor or any of its affiliates. Until our shares are listed on a national securities exchange, the Nasdaq Global Select Market or the Nasdaq Global Market, our independent trustees must determine from time to time, but at least annually, that our fees and expenses are reasonable in light of our performance, our net assets and net income and the fees and expenses of other comparable unaffiliated REITs. During this period, our independent trustees are also responsible for reviewing the performance of our Investment Advisor and determining that the compensation to be paid to our Investment Advisor is reasonable in relation to the nature and quality of services to be performed and that the provisions of the advisory agreement are being carried out.
Our Investment Advisor receives advisory services relating to real estate acquisitions, property management and communications with existing investors and, in addition, receives marketing and other operational services from CNL Fund Management Company, an affiliate of CNL Securities Corp., our Dealer Manager, pursuant to a sub-advisory agreement. Our Investment Advisor compensates the Sub-Advisor through certain investment management and acquisition fees, which are in an aggregate amount of approximately 14% to 19%, respectively, of such fees our Investment Advisor receives from us. The Sub-Advisor may also provide certain marketing and operational services to our Investment Advisor, for which it is entitled to receive fees, and the Sub-Advisor is also entitled to reimbursement by our Investment Advisor for certain expenses it incurs. In the event the sub-advisory agreement is terminated, the Sub-Advisor will be paid all accrued and unpaid fees and expense reimbursements. Our Investment Advisor retains ultimate responsibility for the performance of all of the matters entrusted to it under the advisory agreement.
Ownership by our Investment Advisor and its Affiliates
As of December 31, 2010, CBRE REIT Holdings LLC, an affiliate of our Investment Advisor, owned 246,361 limited partnership units, representing 0.15% of the outstanding limited partnership units in CBRE OP. CBRE REIT Holdings LLC also owned all of the class B limited partnership interest in CBRE OP. CBRE REIT Holdings LLC was formed solely to hold these ownership interests in CBRE OP and is controlled by CBRE Investors, which is an indirect wholly-owned subsidiary of CB Richard Ellis Group, Inc., or CB Richard Ellis. CBRE REIT Holdings LLC purchased the limited partnership units for an aggregate amount of $242,500, or $8.10 per unit in July 2004. The class B limited partnership interest was issued to CBRE REIT Holdings LLC as part of the consideration for our Investment Advisor entering into the advisory agreement with us and for services provided to us in connection with our formation and ongoing advisory services, such as selecting the placement agent relating to our initial private placement, sourcing members to serve on our executive management team and seeking initial investments for our portfolio. The issuance of this interest was negotiated between related parties and we did not have the benefit of arm’s length negotiations of the type normally conducted with an unaffiliated third party. CBRE Investors, an affiliate of our Investment Advisor, also purchased 269,428 of our common shares for $2,182,500, or $8.10 per share, in an initial private placement of our common shares prior to our initial public offering.
In July 2004, CBRE REIT Holdings LLC received a class C limited partnership interest in CBRE OP in exchange for the services provided to us relating to our formation and future services. Effective October 24, 2006, CBRE REIT Holdings LLC contributed the class C limited partnership interest it held in CBRE OP to CBRE OP in exchange for 216,424 limited partnership units (with an aggregate value of approximately $1,928,000). The number of units received in exchange for the class C limited partnership interest was based on an independent valuation approved by our Board of Trustees, including our independent trustees.
Peter E. DiCorpo, one of our trustees, serves as the Global Chief Operating Officer of CBRE Investors, our sponsor. Laurie E. Romanak, our Senior Vice President, Chief Financial Officer and Secretary, serves as a Managing Director of our Investment Advisor, as the Executive Managing Director and Global Head of Investment Reporting of CBRE Investors and is also a member of the investment
107
committee of CBRE Strategic Partners Asia, an entity in which we are a limited partner. Jack A. Cuneo, our President and Chief Executive Officer and the Chairman of our Board of Trustees, serves as the President and Chief Executive Officer of our Investment Advisor and also serves as a Managing Director of CBRE Investors. Philip L. Kianka, our Chief Operating Officer and Executive Vice President serves as the Director of Operations of our Investment Advisor. Our Chairman, President and Chief Executive Officer and our Chief Financial Officer directly hold an aggregate of approximately a 12.9% economic interest in our Investment Advisor. Given these positions and ownership interest, these individuals owe fiduciary duties to these entities and their shareholders. Such fiduciary duties may from time to time conflict with the fiduciary duties owed to us and our shareholders.
Ownership by Affiliates of the Dealer Manager and the Sub-Advisor
Fund Investors, LLC, an affiliate of our Dealer Manager, owns 10,903 of our common shares. Additionally, CNL Fund Management Company, an affiliate of our Dealer Manager, serves as the Sub-Advisor to our Investment Advisor. Fund Investors, LLC and CNL Fund Management Company owns an aggregate 23% distribution interest in the net proceeds upon a sale of our Investment Advisor and an aggregate 24.9% voting and distribution interest (excluding distributions that CBRE Investors is entitled to with respect to 29,937 class A units) in CBRE REIT Holdings LLC. CNL Fund Management Company and Fund Investors, LLC received their interests in our Investment Advisor and in CBRE REIT Holdings LLC in return for capital contributions made to each respective entity. CNL Fund Management Company and our Dealer Manager are wholly-owned subsidiaries of CNL Capital Markets Corp.
Joint Ventures with Affiliates of our Investment Advisor
We have agreed to a capital commitment of up to $20,000,000 in CB Richard Ellis Strategic Partners Asia II-A, L.P., or CBRE Strategic Partners Asia. As of December 31, 2010, we had funded $15,040,000 of our capital commitment. CBRE Investors, our sponsor, formed CBRE Strategic Partners Asia to purchase, reposition, develop, hold for investment and sell institutional quality real estate and related assets in targeted markets in Asia, including China, Japan, India, South Korea, Hong Kong, Singapore and other Asia Pacific markets. The initial closing of CBRE Strategic Partners Asia was in October 2007 with additional commitments being accepted through January 2008. CBRE Strategic Partners Asia closed on January 31, 2008, with aggregate capital commitments of $394,203,000. CBRE Strategic Partners Asia has an eight-year term, which may be extended for up to two one-year periods with the approval of two-thirds of the limited partners.
As of December 31, 2010, CBRE Strategic Partners Asia, with its parallel fund CB Richard Ellis Strategic Partners Asia II, L.P., had aggregate investor commitments of approximately $394,203,000 from institutional investors including CBRE Investors and had acquired ownership interests in ten properties, five in China and five in Japan. Two of the original five ownership interests located in China were sold during 2010. As of December 31, 2010, we owned an ownership interest of approximately 5.07% in CBRE Strategic Partners Asia. Our capital commitment is currently being pledged as collateral on borrowings of CBRE Strategic Partners Asia of which our pro rata portion of such borrowings was $218,000 based on our 5.07% ownership interest in CBRE Strategic Partners Asia at December 31, 2010.
CBRE Strategic Partners Asia is managed by CB Richard Ellis Investors SP Asia II, LLC, or the Investment Manager, an affiliate of CBRE Investors. The Investment Manager is entitled to an annual management fee at an annual rate equal to 1.25% of the capital commitments (or an annual rate of 1.5% of the capital commitments for limited partners (which include us) with aggregate capital commitments of less than $50,000,000). The Investment Manager is also entitled to an acquisition fee equal to (i) for assets acquired for ground up, new development or asset repositioning involving refurbishment activity, 0.75% of CBRE Strategic Partners Asia’s pro rata share of the total acquisition cost of such investment, plus 0.375% of the amount of projected capital expenditures required for such development or refurbishment activity, or (ii) for all other assets, 0.75% of CBRE Strategic Partners Asia’s pro rata share of the total acquisition cost of such investment. Our share of investment management fees paid to the Investment Manager were approximately $282,000, $300,000 and $271,000, for the years ended December 31, 2010, 2009 and 2008, respectively. In addition our share of the acquisition fees was $104,000 for the year ended December 31, 2008, no acquisition fees were paid to the investment manager in 2010 and 2009.
We will pay our Investment Advisor investment management and acquisition fees with respect to our investment in CBRE Strategic Partners Asia. Such fees paid to our Investment Advisor will be reduced, but not below zero, by our proportionate share of the management and acquisition fees paid to the Investment Manager. As of December 31, 2010, we had paid no fees to our Investment Advisor relating to this investment.
CBRE Strategic Partners Asia is not obligated to redeem the interests of any of its investors, including us, prior to 2017. Except in certain limited circumstances such as transfers to affiliates or successor trustees or state agencies, we will not be permitted to sell our interest in CBRE Strategic Partners Asia without the prior written consent of the general partner, which the general partner may withhold in its sole discretion.
A majority of our trustees (including a majority of our independent trustees) not otherwise interested in this transaction approved the transaction as being fair, competitive and commercially reasonable.
108
Receipt of Fees and Other Compensation and Equity in Us by our Investment Advisor and its Affiliates and our Dealer Manager and its Affiliates
Our Investment Advisor and its affiliates perform services relating to our public offering and the investment and management of our assets. In addition, our Dealer Manager performs services in connection with the offer and sale of shares. Although we do not rely exclusively on, or have a written agreement to exclusively receive services from, CB Richard Ellis as a service provider, our Investment Advisor may seek certain services from it or an affiliated entity.
Our Investment Advisor will be paid acquisition fees up to 1.5% of (i) the purchase price of real estate investments acquired by us, or (ii) when we make an investment indirectly through another entity, such investment’s pro rata share of the gross asset value of real estate investments held by that entity. We may pay acquisition fees to affiliates of our Investment Advisor for a particular property acquisition in the form of brokerage fees and mortgage loan origination fees (in the event debt is placed on a property). In the event that we pay these types of acquisition fees to affiliates of our Investment Advisor, such fees will be in addition to the 1.5% paid to our Investment Advisor and our Investment Advisor will not receive any portion of such fees.
For investment management services of our real estate assets, we pay our Investment Advisor (i) a monthly fee equal to one-twelfth of 0.5% of the aggregate cost (before non-cash reserves and depreciation) of all real estate investments in our portfolio and (ii) a monthly fee equal to 5.0% of the aggregate monthly net operating income derived from all real estate investments in our portfolio. All or any portion of the investment management fee not taken as to any fiscal year may be deferred or waived without interest at the option of our Investment Advisor.
The holder of the class B limited partnership interest in CBRE OP, CBRE REIT Holdings LLC, an affiliate of our Investment Advisor, is entitled to distributions made by the CBRE OP in an amount equal to 15% of all net sales proceeds received by CBRE OP on dispositions of properties or other assets (including by liquidation, merger or otherwise) after the other partners, including us, have received, in the aggregate, cumulative distributions from operating income, sales proceeds or other sources equal to (i) the total capital contributions made to CBRE OP and (ii) a 7% annual, uncompounded return on such capital contributions.
Additionally, we will reimburse our Investment Advisor for all actual expenses it incurs in connection with our administration on an ongoing basis. Our annual operating expenses will not exceed the greater of (i) 2% of our average invested assets or (ii) 25% of our net income in any year.
In connection with the sale of properties (which shall include the sale of a specific property or the sale of a portfolio of properties through a sale of assets, merger or similar transaction), we will pay to our Investment Advisor or its affiliates a real estate commission in an amount not to exceed 50% of the brokerage commission paid; provided that 50% of such commission may not exceed 3% of the contract price of each property sold and the total brokerage commission may not exceed the lesser of a competitive total real estate commission or 6% of the contract price of the property sold.
We are a party to a dealer manager agreement with our Dealer Manager. Under the dealer manager agreement, our Dealer Manager provides certain sales, promotional and marketing services to us in connection with the distribution of common shares offered pursuant to the prospectus relating to our initial public offering. Our Dealer Manager will receive compensation for selling shares of up to 7.0% of gross proceeds from the sale of shares in the primary offering (all or a portion may be reallowed to participating broker-dealers). Our Dealer Manager is also entitled to a dealer manager fee of up to 2.0% of the gross proceeds from the sale of shares in the primary offering (all or a portion may be reallowed to participating broker-dealers) and a marketing support fee of up to 1.0% of the gross proceeds from the sale of shares in the primary offering (all or a portion may be reallowed to participating broker-dealers).
We are also a party to a selected dealer agreement with our Dealer Manager, our Investment Advisor, CBRE Investors and Ameriprise Financial Services, Inc. (“Ameriprise”), pursuant to which Ameriprise was appointed as a soliciting dealer in our current follow-on offering. Subject to certain limitations set forth in the selected dealer agreement, we, our Dealer Manager, our Investment Advisor and CBRE Investors, jointly and severally, have agreed to indemnify Ameriprise against certain liabilities, including liabilities under the Securities Act of 1933, as amended, and liabilities resulting from the breach by us, our Dealer Manager, our Investment Advisor, or CBRE Investors of the selected dealer agreement. In connection with the selected dealer agreement, we separately agreed to indemnify and reimburse our Dealer Manager, our Investment Advisor and CBRE Investors under certain circumstances for any amounts each of them is required to pay pursuant to the indemnification. The selected dealer agreement contains customary representations, warranties, covenants and closing conditions. The selected dealer agreement also contains customary termination provisions and an additional right of termination by any party at any time for any reason with two days prior written notice to the other parties.
Our Investment Advisor will also receive reimbursement for all cumulative organizational and offering expenses (excluding selling commissions, our dealer manager fee and the marketing support fee) incurred by our Investment Advisor estimated to be 0.8% of aggregate gross proceeds.
109
Fees Paid in Connection with Our Offerings
For the years ended December 31, 2010, 2009, and 2008, our Dealer Manager earned the following fees:
| | | | | | | | | | | | | | | | | | | | | | | | |
| | | Years Ended December 31, | |
| | | 2010 | | | 2009 | | | 2008 | |
| | | Earned(1) | | | Payable(2) | | | Earned(1) | | | Payable(2) | | | Earned(1) | | | Payable(2) | |
Selling commissions | | $ | 29,388,000 | | | $ | 347,000 | | | $ | 23,204,000 | | | $ | 347,000 | | | $ | 13,703,000 | | | $ | 426,000 | |
Dealer manager fees | | $ | 13,179,000 | | | $ | 99,000 | | | $ | 8,359,000 | | | $ | 412,000 | | | $ | 4,929,000 | | | $ | 194,000 | |
Marketing support fees | | $ | 4,523,000 | | | $ | 50,000 | | | $ | 3,462,000 | | | $ | 111,000 | | | $ | 2,074,000 | | | $ | 80,000 | |
| (1) | Earned represents the amount expensed on an accrual basis for services provided by the Dealer Manager during the period. |
| (2) | Payable represents the unpaid amount due on an accrual basis to the Dealer Manager for services provided as of the balance sheet date specified. |
For the years ended December 31, 2010, 2009 and 2008, our Dealer Manager and our Investment Advisor and/or its affiliates earned the following other offering costs:
| | | | | | | | | | | | | | | | | | | | | | | | |
| | | Years Ended December 31, | |
| | | 2010 | | | 2009 | | | 2008 | |
| | | Earned(1) | | | Payable(2) | | | Earned(3) | | | Payable(4) | | | Earned(5) | | | Payable(6) | |
Other Offering Costs | | $ | 4,633,000 | | | $ | 422,000 | | | $ | 1,426,000 | | | $ | 244,000 | | | $ | 4,115,000 | | | $ | 3,704,000 | |
| (1) | Included in the other offering costs earned is $4,412,000 and $221,000 for the Dealer Manager and the Investment Advisor, respectively. |
| (2) | Included in the payable amount is $407,000 and $15,000 due to the Dealer Manager and the Investment Advisor, respectively. |
| (3) | Included in the other offering costs earned is $1,266,000 and $160,000 for the Dealer Manager and the Investment Advisor, respectively. |
| (4) | Included in the payable amount is $243,000 and $1,000 due to the Dealer Manager and the Investment Advisor, respectively. |
| (5) | Included in the other offering costs earned is $3,999,000 and $116,000 for the Dealer Manager and the Investment Advisor, respectively. |
| (6) | Included in the payable amount is $2,692,000, $13,000 and 999,000 due to the Dealer Manager, the Investment Advisor and CB Richard Ellis Group, Inc., respectively. |
Fees Paid in Connection with Our Operations
For the years ended December 31, 2010, 2009 and 2008, our Investment Advisor and/or its affiliates earned the following fees:
| | | | | | | | | | | | | | | | | | | | | | | | |
| | | Years Ended December 31, | |
| | | 2010 | | | 2009 | | | 2008 | |
| | | Earned(1) | | | Payable(2) | | | Earned(1) | | | Payable(2) | | | Earned(1) | | | Payable(2) | |
Acquisition Fees and Expenses(3) | | $ | 13,056,000 | | | $ | — | | | $ | 4,826,000 | | | $ | — | | | $ | 5,670,000 | | | $ | 743,000 | |
Investment management fees(4) | | $ | 11,611,000 | | | $ | 1,330,000 | | | $ | 7,803,000 | | | $ | 757,000 | | | $ | 3,964,000 | | | $ | 625,000 | |
Property management fees | | $ | 955,000 | | | $ | 191,000 | | | $ | 656,000 | | | $ | 106,000 | | | $ | 491,000 | | | $ | 126,000 | |
| (1) | Earned represents the amount expensed on an accrual basis for services provided by the Investment Advisor during the period. |
| (2) | Payable represents the unpaid amount due on an accrual basis to the Investment Advisor for services provided as of the balance sheet date specified. |
| (3) | In connection with services provided to the Investment Advisor, the Sub-Advisor, pursuant to a sub-advisory agreement, was paid $2,216,000, $820,000, and, $921,000 by the Investment Advisor for the years ended December 31, 2010, 2009 and 2008, respectively. |
| (4) | The Investment Advisor waived investment management fees of $0, $0 and $1,529,000 for the years ended December 31, 2010, 2009 and 2008, respectively. In connection with services provided to the Investment Advisor, the Sub-Advisor, pursuant to a sub-advisory agreement, was paid $1,604,000, $1,078,000, and $547,000 by the Investment Advisor for the years ended December 31, 2010, 2009 and 2008, respectively. |
110
CBRE Capital Markets, an affiliate of the Investment Advisor, received none, $1,217,000, $0 and $636,000 in mortgage banking fees for the years ended December 31, 2010, 2009 and 2008, respectively. Leasing and brokerage fees aggregating $895,000, $198,000 and $15,000 were paid to the Investment Advisor or its affiliates for the years ended December 31, 2010, 2009 and 2008, respectively. In addition, CB Richard Ellis, UK, an affiliate of the Investment Advisor, received a service fee in conjunction with the acquisition of Thames Valley Five totaling £24,000 ($42,000) in 2008.
Conflict Resolution Procedures
In order to reduce or eliminate certain potential conflicts of interest, our Board of Trustees has established a Conflicts Committee to review and approve all matters our board believes may involve a conflict of interest. In addition, our declaration of trust contains a number of restrictions relating to (i) transactions we enter into with our Investment Advisor and its affiliates, (ii) allocation of properties among affiliated entities and (iii) retention of affiliated service providers. These restrictions, which apply until our shares are listed for trading on a national securities exchange, the Nasdaq Global Select Market, or the Nasdaq Global Market, include among others, the following:
Transactions with our Investment Advisor. Except for transactions under the advisory agreement or as otherwise described in the prospectus related to our public offering, we will not accept goods or services from our Investment Advisor or its affiliates unless a majority of our trustees, including a majority of any independent trustees not otherwise interested in the transactions, approve such transactions as fair and reasonable to us and on terms and conditions not less favorable to us than those available from unaffiliated third parties.
Property Transactions with our Investment Advisor and its Affiliates. We will not purchase or lease properties in which our Investment Advisor or its affiliates has an ownership interest without a determination by a majority of our trustees, including a majority of any independent trustees not otherwise interested in such transaction, that such transaction is competitive and commercially reasonable to us and at a price to us no greater than the cost of the property to our Investment Advisor or its affiliates, unless there is substantial justification for any amount that exceeds such cost and such excess amount is determined to be reasonable. In no event will we acquire any such property at an amount in excess of its current appraised value. We will not sell or lease properties to our Investment Advisor or its affiliates or to our trustees unless a majority of our trustees, including a majority of any independent trustees not otherwise interested in the transaction, determine the transaction is fair and reasonable to us.
Loans. We will not make any loans to our Investment Advisor or its affiliates or to our trustees. We may not borrow money from any of our trustees or from our Investment Advisor and its affiliates unless approved by a majority of our trustees, including a majority of any independent trustees not otherwise interested in the transaction, as fair, competitive and commercially reasonable, and no less favorable to us than comparable loans between unaffiliated parties.
Asset Acquisitions. In the event that an investment opportunity becomes available to us through the CBRE Investors network that is suitable, under all of the factors considered by our Investment Advisor, for us and another program or account managed by CBRE Investors, then the entity that has had the longest period of time elapse since it was offered an investment opportunity will first be offered such investment opportunity. Investment opportunities sourced directly by our Investment Advisor and suitable for us are first presented to us before being offered to other programs or accounts. In determining whether or not such an investment opportunity is suitable for more than one program or account, our Investment Advisor shall examine, among others, the following factors:
| | ¡ | | the degree to which the potential acquisition meets the investment objectives and parameters of each program or account; |
| | ¡ | | the amount of funds available to each program or account and the length of time such funds have been available for investment; |
| | ¡ | | the effect of the acquisition both on diversification of each program’s or account’s investments by type of property and geographic area, and on diversification of the tenants of its properties; |
| | ¡ | | the policy of each program or account relating to leverage of properties; |
| | ¡ | | the anticipated cash flow of each program or account; |
| | ¡ | | the tax effects of the purchase of each program or account; and |
| | ¡ | | the size of the investment. |
If a subsequent event or development, such as a delay in the closing of a property or a delay in the construction of a property, causes any such investment, in the opinion of our Board of Trustees and our Investment Advisor, to be more appropriate for a program or account other than the program or account that committed to make the investment, our Investment Advisor may determine that another program or account affiliated with our Investment Advisor will make the investment. Our Board of Trustees (including our
111
independent trustees) has a duty to ensure that the method used by our Investment Advisor for the allocation of the acquisition of properties by two or more affiliated programs seeking to acquire similar types of properties shall be reasonable, and has concluded that the procedures described above are reasonable. Such procedures are reviewed regularly by our Board of Trustees.
Affiliated Service Providers
Our Investment Advisor will attempt to retain the best real estate service providers available in the market. Although we do not rely exclusively on, nor have a written agreement to exclusively receive services from, CB Richard Ellis as a service provider, our Investment Advisor may seek certain services, such as leasing, property management and brokerage, from it or an affiliated entity. CB Richard Ellis, directly or indirectly, has the capability to provide services relating to acquisitions, dispositions, leasing, property management, construction supervision and mortgage banking. We have engaged affiliates of CB Richard Ellis to provide certain property management services and mortgage banking services in connection with properties we own. See “—Fees Paid in Connection with Our Operations.” Our Investment Advisor must review any proposal for services from an affiliate and determine, based on research conducted by our Investment Advisor’s investment team, that it is the best combination of service, staffing and cost available in the market.
Trustee Independence
Our “independent” trustees are Charles Black, Martin Reid and James Orphanides, as such term is defined by the applicable rules of the SEC and our declaration of trust which is available on our website at http://www.cbrerealtytrust.com.
| ITEM 14. | PRINCIPAL ACCOUNTING FEES AND SERVICES |
Certain of the information required by Item 14 will be set forth in the 2011 Proxy Statement and is incorporated herein by reference.
We have engaged Deloitte & Touche LLP to provide us with audit and tax services. Services may include examination of annual financial statements, review of unaudited quarterly financial information, review and consultation regarding filings with the SEC, assistance with management’s evaluation of internal accounting controls, consultation on financial accounting and reporting matters, tax planning, tax consultation and tax return preparation. Deloitte & Touche LLP has served as our independent registered public accounting firm since July 1, 2004 and audited our consolidated financial statements for the years ended December 31, 2010, 2009, 2008, 2007 and 2006.
The following table lists the fees for services rendered by our independent registered public accounting firm for the years ended December 31, 2010 and 2009:
| | | | | | | | |
Services | | 2010 | | | 2009 | |
Audit Fees(1) | | $ | 660,000 | | | $ | 660,000 | |
Audit Related Fees(2) | | | 162,000 | | | | 172,000 | |
Tax Fees(3) | | | 290,000 | | | | 190,000 | |
All Other Fees | | | | | | | — | |
| | | | | | | | |
Total | | $ | 1,112,000 | | | $ | 1,022,000 | |
| | | | | | | | |
| (1) | Audit fees billed in 2010 and 2009 consisted of the audit of our annual consolidated financial statements, acquisition audits, reviews of our quarterly consolidated financial statements, statutory and regulatory audits, consents and other services related to filings with the SEC. |
| (2) | Audit-related fees consist of Sarbanes Oxley compliance, review and consultation. |
| (3) | Tax services consist of tax compliance, preparation, planning and advice. |
Our Audit Committee must pre-approve, to the extent required by applicable law, all audit services and permissible non-audit services provided by our independent registered public accounting firm, except for anyde minimis non-audit services. Non-audit services are consideredde minimis if (i) the aggregate amount of all such non-audit services constitutes less than 5% of the total amount of revenues we paid to our independent registered public accounting firm during the fiscal year in which they are provided; (ii) we did not recognize such services at the time of the engagement to be non-audit services; and (iii) such services are promptly brought to our Audit Committee’s attention and approved prior to the completion of the audit by our Audit Committee or any of its member(s) who has authority to give such approval. None of the fees reflected above were approved by our Audit Committee pursuant to thisde minimis exception. Our Audit Committee may delegate to one or more of its members the authority to grant pre-approvals. All services provided by Deloitte & Touche LLP in 2010 were pre-approved by our Audit Committee.
112
PART IV
| ITEM 15. | EXHIBITS, FINANCIAL STATEMENT SCHEDULES |
| a) | Financial Statements and Schedules |
Reference is made to the “Index to Consolidated Financial Statements” on page F-1 of this report and the Consolidated Financial Statements included herein, beginning on page F-2.
In reviewing the agreements included as exhibits to this Annual Report on Form 10-K, please remember they are included to provide you with information regarding their terms and are not intended to provide any other factual or disclosure information about us or the other parties to the agreements. The agreements contain representations and warranties by each of the parties to the applicable agreement. These representations and warranties have been made solely for the benefit of the other parties to the applicable agreement and:
| | ¡ | | should not in all instances be treated as categorical statements of fact, but rather as a way of allocating the risk to one of the parties if those statements prove to be inaccurate; |
| | ¡ | | have been qualified by disclosures that were made to the other party in connection with the negotiation of the applicable agreement, which disclosures are not necessarily reflected in the agreement; |
| | ¡ | | may apply standards of materiality in a way that is different from what may be viewed as material to you or other investors; and |
| | ¡ | | were made only as of the date of the applicable agreement or such other date or dates as may be specified in the agreement and are subject to more recent developments. |
Accordingly, these representations and warranties may not describe the actual state of affairs as of the date they were made or at any other time. Additional information about us may be found elsewhere in this Annual Report on Form 10-K and our other public filings, which are available without charge through the SEC’s website at http://www.sec.gov.
The following exhibits are filed as part of this annual report on Form 10-K.
| | |
Exhibit No. | | |
| |
| 3.1 | | Second Amended and Restated Declaration of Trust of CB Richard Ellis Realty Trust (Previously filed as Exhibit 3.1 to Pre-Effective Amendment No. 5 to the Registration Statement on Form S-11 (File No. 333-127405) filed September 13, 2006 and incorporated herein by reference). |
| |
| 3.2 | | Articles of Amendment of Declaration of Trust of CB Richard Ellis Realty Trust (Previously filed as exhibit 3.1 to the current report on Form 8-K (File No. 000-53200) filed June 22, 2009 and incorporated herein by reference). |
| |
| 3.3 | | Amended and Restated Bylaws of CB Richard Ellis Realty Trust (Previously filed as Exhibit 3.2 to Pre-Effective Amendment No. 5 to the Registration Statement on Form S-11 (File No. 333-127405) filed September 13, 2006 and incorporated herein by reference). |
| |
| 4.1 | | Subscription Agreement (Previously filed as Appendix A to Pre-Effective Amendment No. 2 to the Registration Statement on Form S-11 (File No. 333-152653) filed January 23, 2009 and incorporated herein by reference). |
| |
| 10.1 | | 2004 Equity Incentive Plan (Previously filed as Exhibit 10.1 to Pre-Effective Amendment No. 1 to the Registration Statement on Form S-11 (File No. 333-127405) filed October 27, 2005 and incorporated herein by reference). |
| |
| 10.2 | | 2004 Performance Bonus Plan (Previously filed as Exhibit 10.1 to Pre-Effective Amendment No. 1 to the Registration Statement on Form S-11 (File No. 333-127405) filed October 27, 2005 and incorporated herein by reference). |
| |
| 10.3 | | Third Amended and Restated Advisory Agreement, by and among CB Richard Ellis Realty Trust, CBRE Operating Partnership, L.P., and CBRE Advisors LLC, dated December 21, 2010 (Previously filed as Exhibit 10.1 to the Current Report on Form 8-K (File No. 000-53200) filed December 23, 2010 and incorporated herein by reference). |
| |
| 10.4 | | Second Amended and Restated Agreement of Limited Partnership, by and among CB Richard Ellis Realty Trust and the limited partners named therein, dated January 30, 2009 (Previously filed as Exhibit 10.2 to the Current Report on Form 8-K (File No. 000-53200) filed February 5, 2009 and incorporated herein by reference). |
113
| | |
Exhibit No. | | |
| |
| 10.5 | | CB Richard Ellis Realty Trust Dividend Reinvestment Plan (Previously filed as Appendix B to Pre-Effective Amendment No. 2 to the Registration Statement on Form S-11 (File No. 333-152653) filed January 23, 2009 and incorporated herein by reference). |
| |
| 10.6 | | Purchase and Sale Agreement, dated as of August 6, 2004, by and between WS Roscoe, LLC and CBRE Operating Partnership, L.P. (Previously filed as Exhibit 10.6 to Pre-Effective Amendment No. 2 to the Registration Statement on Form S-11 (File No. 333-127405) filed May 11, 2006 and incorporated herein by reference). |
| |
| 10.7 | | Purchase and Sale Agreement, dated as of November 2, 2004, by and between Taunton Industrial Associates LLC and RT Taunton, LLC (Previously filed as Exhibit 10.7 to Pre-Effective Amendment No. 2 to the Registration Statement on Form S-11 (File No. 333-127405) filed May 11, 2006 and incorporated herein by reference). |
| |
| 10.8 | | Purchase and Sale Agreement, dated as of May 10, 2005, by and between Deerfield Commons I LLC and RT Deerfield I, LLC (Previously filed as Exhibit 10.8 to Pre-Effective Amendment No. 2 to the Registration Statement on Form S-11 (File No. 333-127405) filed May 11, 2006 and incorporated herein by reference). |
| |
| 10.9 | | License Agreement, dated as of July 19, 2005, by and among CB Richard Ellis Realty Trust, CB Richard Ellis, Inc. and CB Richard Ellis of California, Inc. (Previously filed as Exhibit 10.9 to Pre-Effective Amendment No. 1 to the Registration Statement on Form S-11 (File No. 333-127405) filed October 27, 2005 and incorporated herein by reference). |
| |
| 10.10 | | Purchase and Sale Agreement, dated May 10, 2005, by and between Deerfield Park LLC and RT Deerfield II, LLC (Previously filed as Exhibit 10.10 to Pre-Effective Amendment No. 2 to the Registration Statement on Form S-11 (File No. 333-127405) filed May 11, 2006 and incorporated herein by reference). |
| |
| 10.11 | | Promissory Note, dated as of October 25, 2004, made by CBRE Operating Partnership, L.P. to the order of The Northwestern Mutual Life Insurance Company (Previously filed as Exhibit 10.11 to Pre-Effective Amendment No. 2 to the Registration Statement on Form S-11 (File No. 333-127405) filed May 11, 2006 and incorporated herein by reference). |
| |
| 10.12 | | Deed of Trust and Security Agreement, dated as of October 25, 2004, by and between CBRE Operating Partnership, L.P. and The Northwestern Mutual Life Insurance Company (Previously filed as Exhibit 10.12 to Pre-Effective Amendment No. 2 to the Registration Statement on Form S-11 (File No. 333-127405) filed May 11, 2006 and incorporated herein by reference). |
| |
| 10.13 | | Promissory Note, dated as of February 28, 2005, made by RT Taunton, LLC to the order of The Northwestern Mutual Life Insurance Company (Previously filed as Exhibit 10.13 to Pre-Effective Amendment No. 2 to the Registration Statement on Form S-11 (File No. 333-127405) filed May 11, 2006 and incorporated herein by reference). |
| |
| 10.14 | | Mortgage and Security Agreement, dated as of February 28, 2005, by and between RT Taunton, LLC and The Northwestern Mutual Life Insurance Company (Previously filed as Exhibit 10.14 to Pre-Effective Amendment No. 2 to the Registration Statement on Form S-11 (File No. 333-127405) filed May 11, 2006 and incorporated herein by reference). |
| |
| 10.15 | | Promissory Note, dated as of November 29, 2005, made by CBRE Operating Partnership, L.P. to the order of Allianz Life Insurance Company of North America LLC (Previously filed as Exhibit 10.15 to Pre-Effective Amendment No. 2 to the Registration Statement on Form S-11 (File No. 333-127405) filed May 11, 2006 and incorporated herein by reference). |
| |
| 10.16 | | Deed to Secure Debt and Security Agreement, dated as of November 29, 2005, by RT Deerfield I, LLC to and in favor of Allianz Life Insurance Company of North America LLC (Previously filed as Exhibit 10.16 to Pre-Effective Amendment No. 2 to the Registration Statement on Form S-11 (File No. 333-127405) filed May 11, 2006 and incorporated herein by reference). |
| |
| 10.17 | | Agreement of Purchase and Sale, dated as of December 15, 2005, by and among Millennium Associates, Ltd., Telecom Commerce Associates, Ltd., Telecom Commerce II, Ltd. and RT Texas Industrial, L.P. (Previously filed as Exhibit 10.17 to Pre-Effective Amendment No. 3 to the Registration Statement on Form S-11 (File No. 333-127405) filed June 28, 2006 and incorporated herein by reference). |
| |
| 10.18 | | Form of Amended and Restated Indemnification Agreement (Previously filed as Exhibit 10.18 to Pre-Effective Amendment No. 5 to the Registration Statement on Form S-11 (File No. 333-127405) filed September 13, 2006 and incorporated herein by reference). |
| |
| 10.19 | | Agreement between Henderson Global Investors Real Estate (No. 2) L.P. (acting by its general partner Henderson Global Investors Property (No. 2) Limited), as Seller and CBRERT Coventry, Limited (Previously filed as Exhibit 10.1 to the Current Report on Form 8-K (File No. 333-127405) filed March 29, 2007 and incorporated herein by reference). |
114
| | |
Exhibit No. | | |
| |
| 10.20 | | Purchase and Sale Agreement, dated June 22, 2007, by and among CBRE Operating Partnership, L.P. (including certain of its subsidiaries as named in the agreement) and certain affiliates of Johnson Development Associates, Inc. as named in the agreement (Previously filed as Exhibit 10.1 to the Current Report on Form 8-K (File No. 333-127405) filed June 28, 2007 and incorporated herein by reference). |
| |
| 10.21 | | Purchase and Sale Agreement, dated June 22, 2007, by and among CBRE Operating Partnership, L.P. and RT Kings Mountain IV, LLC and Kings Mountain North, LLC (an affiliate of Johnson Development Associates, Inc.) (Previously filed as Exhibit 10.2 to the Current Report on Form 8-K (File No. 333-127405) filed June 28, 2007 and incorporated herein by reference). |
| |
| 10.22 | | Purchase and Sale Agreement, dated July 3, 2007, by and among CBRE Operating Partnership, L.P. (including certain of its subsidiaries as named in the agreement) and an affiliate of Johnson Development Associates, Inc. as named in the agreement (Previously filed as Exhibit 10.1 to the Current Report on Form 8-K (File No. 333-127405) filed July 9, 2007 and incorporated herein by reference). |
| |
| 10.23 | | Loan Agreement between CBRERT Coventry Limited and The Royal Bank of Scotland plc (Previously filed as Exhibit 10.1 to the Current Report on Form 8-K (File No. 333-127405) filed May 3, 2007 and incorporated herein by reference). |
| |
| 10.24 | | Credit Agreement, dated August 30, 2007, by and among CBRE Operating Partnership, L.P. and CBRERT Carolina TRS, Inc., as borrowers, CB Richard Ellis Realty Trust, Bank of America, N.A. as Administrative Agent, and the other lenders thereto (Previously filed as Exhibit 10.1 to the Current Report on Form 8-K (File No. 333-127405) filed September 5, 2007 and incorporated herein by reference). |
| |
| 10.25 | | Contribution Agreement, dated May 5, 2008, by and among Duke Realty Limited Partnership, Duke/Hulfish, LLC and CBRE Operating Partnership, L.P. (Previously filed as Exhibit 10.1 to the Current Report on Form 8-K (File No. 000-53200) filed May 6, 2008 and incorporated herein by reference). |
| |
| 10.26 | | Duke/Hulfish, LLC Limited Liability Company Agreement, by and among CBRE Operating Partnership, L.P. and Duke Realty Limited Partnership, dated June 12, 2008 (Previously filed as Exhibit 10.3 to Form 10-Q (File No. 000-53200) filed November 14, 2008 and incorporated herein by reference). |
| |
| 10.27 | | First Amendment to the Contribution Agreement, by and between Duke Realty Limited Partnership, Duke/Hulfish LLC and CBRE Operating Partnership, L.P. dated September 12, 2008 (Previously filed as Exhibit 10.7 to the Quarterly Report on Form 10-Q (File No. 000-53200) filed November 14, 2008 and incorporated herein by reference). |
| |
| 10.28 | | Managing Dealer Agreement dated January 30, 2009, between CB Richard Ellis Realty Trust, and CNL Securities Corp. (Previously filed as Exhibit 1.1 to the Current Report on Form 8-K (File No. 000-53200) filed February 5, 2009 and incorporated herein by reference). |
| |
| 10.29 | | Selected Dealer Agreement, by and among, CB Richard Ellis Realty Trust, CNL Securities Corp., CBRE Advisors LLC, CB Richard Ellis Investors, LLC and Ameriprise Financial Services, Inc. dated as of February 12, 2009 (Previously filed as Exhibit 1.1 to the Current Report on Form 8-K (File No. 000-53200) filed February 18, 2009 and incorporated herein by reference). |
| |
| 10.30 | | Side Letter, between CB Richard Ellis Realty Trust, CB Richard Ellis Investors, LLC and CBRE Advisors LLC dated February 12, 2009 (Previously filed as Exhibit 1.2 to the Current Report on Form 8-K (File No. 000-53200) filed February 18, 2009 and incorporated herein by reference). |
| |
| 10.31 | | Side Letter between CB Richard Ellis Realty Trust and CNL Securities Corp. dated February 12, 2009 (Previously filed as Exhibit 1.3 to the Current Report on Form 8-K (File No. 000-53200) filed February 18, 2009 and incorporated herein by reference). |
| |
| 10.32 | | Shareholders’ Agreement by and among Goodman Europe Development Trust, RT Princeton CE Holdings, LLC and Goodman Princeton Holdings (LUX) S.À R.L., dated June 10, 2010 (Previously filed as Exhibit 10.1 to the Quarterly Report on Form 10-Q (File No. 000-53200) filed August 13, 2010 and incorporated herein by reference). |
| |
| 10.33 | | Shareholders’ Agreement by and among Goodman Jersey Holdings Trust, RT Princeton UK Holdings, LLC and Goodman Princeton Holdings (Jersey) Limited, dated June 10, 2010 (Previously filed as Exhibit 10.2 to the Quarterly Report on Form 10-Q (File No. 000-53200) filed August 13, 2010 and incorporated herein by reference). |
| |
| 10.34 | | Agreement of Sale, by and among 70 Hudson Street, L.L.C., 70 Hudson Street Urban Renewal Associates, L.L.C. and RT 70 Hudson, LLC dated October 15, 2010 (Previously filed as Exhibit 10.1 to the Quarterly Report on Form 10-Q (File 000-53200) filed November 12, 2010 and incorporated herein by reference). |
115
| | |
Exhibit No. | | |
| |
| 10.35 | | Agreement of Sale, by and among 90 Hudson Street, L.L.C., 90 Hudson Street Urban Renewal Associates, L.L.C. and RT 90 Hudson, LLC dated October 15, 2010 (Previously filed as Exhibit 10.2 to the Quarterly Report on Form 10-Q (File 000-53200) filed November 12, 2010 and incorporated herein by reference). |
| |
| 10.36 | | Agreement for Purchase and Sale of Real Property, by and between AOL Inc. and RT Pacific Blvd, LLC, dated October 29, 2010 (Previously filed as Exhibit 10.3 to the Quarterly Report on Form 10-Q (File 000-53200) filed November 12, 2010 and incorporated herein by reference). |
| |
| 10.37 | | Purchase and Sale Agreement, by and among Duke Realty Limited Partnership, Duke Secured Financing 2009-1PAC, LLC, Duke Realty Ohio and Duke/Princeton, LLC, dated December 17, 2010 (Previously filed as Exhibit 10.2 to the Current Report on Form 8-K (File 000-53200) filed December 23, 2010 and incorporated herein by reference). |
| |
| 10.38 | | Duke/Hulfish, LLC Amended and Restated Limited Liability Company Agreement, by and among CBRE Operating Partnership, L.P. and Duke Realty Limited Partnership, dated December 17, 2010 (Previously filed as Exhibit 10.3 to the Current Report on Form 8-K (File 000-53200) filed December 23, 2010 and incorporated herein by reference). |
| |
| 10.39 | | Loan Agreement dated March 24, 2011, between Duke/Hulfish, LLC and Wells Fargo Bank, National Association (Previously filed as Exhibit 10.1 to the Current Report on Form 8-K/A (File No. 000-53200) filed March 29, 2011 and incorporated herein by reference). |
| |
| 21.1 | | List of Subsidiaries of CB Richard Ellis Realty Trust, filed herewith. |
| |
| 23.1 | | Consent of Deloitte & Touche LLP, filed herewith. |
| |
| 23.2 | | Consent of KPMG LLP, filed herewith. |
| |
| 23.3 | | Consent of KPMG, filed herewith. |
| |
| 24.1 | | Power of Attorney (included on the signature page to this Annual Report on Form 10-K). |
| |
| 31.1 | | Certification by the Chief Executive Officer pursuant to Section 302 of the Sarbanes-Oxley Act of 2002, filed herewith. |
| |
| 31.2 | | Certification by the Chief Financial Officer pursuant to Section 302 of the Sarbanes-Oxley Act of 2002, filed herewith. |
| |
| 32.1 | | Certification by the Chief Executive Officer pursuant to 18 U.S.C. Section 1350, as adopted pursuant to Section 906 of the Sarbanes-Oxley Act of 2002, filed herewith. |
| |
| 32.2 | | Certification by the Chief Financial Officer pursuant to 18 U.S.C. Section 1350, as adopted pursuant to Section 906 of the Sarbanes-Oxley Act of 2002, filed herewith. |
| |
| 99.1 | | Form of Sub-Advisory Agreement, by and among CBRE Advisors LLC and CNL Fund Management Company (Previously filed to Pre-Effective Amendment No. 1 to the Registration Statement on Form S-11 (File No. 333-152653) filed January 14, 2009 and incorporated herein by reference). |
116
CB RICHARD ELLIS REALTY TRUST
INDEX TO CONSOLIDATED FINANCIAL STATEMENTS
| | | | |
| | | Page | |
Report of Independent Registered Public Accounting Firm | | | F-2 | |
Consolidated Balance Sheets as of December 31, 2010 and 2009 | | | F-3 | |
Consolidated Statements of Operations for the Years Ended December 31, 2010, 2009 and 2008 | | | F-4 | |
Consolidated Statements of Cash Flows for the Years Ended December 31, 2010, 2009 and 2008 | | | F-5 | |
Consolidated Statements of Shareholders’ Equity for the Years Ended December 31, 2010, 2009 and 2008 | | | F-7 | |
Notes to the Consolidated Financial Statements for the Years Ended December 31, 2010, 2009 and 2008 | | | F-9 | |
Schedule III—Properties and Accumulated Depreciation Through December 31, 2010 | | | F-58 | |
| |
Duke/Hulfish, LLC and Subsidiaries | | | | |
Report of Independent Registered Public Accounting Firm | | | F-59 | |
Consolidated Balance Sheets as of December 31, 2010 and 2009 | | | F-60 | |
Consolidated Statements of Operations for the Years Ended December 31, 2010 and 2009 and for the Period from April 29, 2008 (inception) through December 31, 2008 | | | F-61 | |
Consolidated Statements of Members’ Equity for the Years Ended December 31, 2010 and 2009 and for the Period from April 29, 2008 (inception) through December 31, 2008 | | | F-62 | |
Consolidated Statements of Cash Flows for the Years Ended December 31, 2010 and 2009 and for the Period from April 29, 2008 (inception) through December 31, 2008 | | | F-63 | |
Notes to the Consolidated Financial Statements—December 31, 2010 and 2009 | | | F-64 | |
Schedule III—Properties and Accumulated Depreciation through December 31, 2010 | | | F-73 | |
| |
CBRE Strategic Partners Asia | | | | |
Independent Auditors’ Report (KPMG) | | | F-74 | |
Combined Statements of Assets, Liabilities and Partners’ Capital as of December 31, 2010, 2009 and 2008 | | | F-75 | |
Combined Schedule of Real Estate Related Assets as of December 31, 2010, 2009 and 2008 | | | F-76 | |
Combined Statements of Operations for the Years Ended December 31, 2010, 2009 and 2008 | | | F-77 | |
Combined Statements of Partners’ Capital for the Years Ended December 31, 2010, 2009 and 2008 | | | F-78 | |
Combined Statements of Cash Flows for the Years Ended December 31, 2010, 2009 and 2008 | | | F-79 | |
Notes to the Combined Financial Statements for the Years Ended December 31, 2010, 2009 and 2008 | | | F-80 | |
F-1
REPORT OF INDEPENDENT REGISTERED PUBLIC ACCOUNTING FIRM
To the Board of Trustees of
CB Richard Ellis Realty Trust
Los Angeles, California
We have audited the accompanying consolidated balance sheets of CB Richard Ellis Realty Trust and subsidiaries (the “Company”) as of December 31, 2010 and 2009, and the related consolidated statements of income, shareholders’ equity, and cash flows for each of the three years in the period ended December 31, 2010. Our audits also included the financial statement schedules listed in the Index at Item 15. These financial statements and financial statement schedules are the responsibility of the Company’s management. Our responsibility is to express an opinion on the financial statements and financial statement schedules based on our audits. We did not audit the financial statements of Duke/Hulfish, LLC (a joint venture), which statements reflect total assets constituting 18% and 17% of consolidated total assets as of December 31, 2010 and 2009, respectively. Those statements were audited by other auditors whose report has been furnished to us, and our opinion, insofar as it relates to the amounts included for Duke/Hulfish, LLC, is based solely on the report of the other auditors.
We conducted our audits in accordance with the standards of the Public Company Accounting Oversight Board (United States). Those standards require that we plan and perform the audit to obtain reasonable assurance about whether the financial statements are free of material misstatement. An audit includes examining, on a test basis, evidence supporting the amounts and disclosures in the financial statements. An audit also includes assessing the accounting principles used and significant estimates made by management, as well as evaluating the overall financial statement presentation. We believe that our audits and the report of the other auditors provide a reasonable basis for our opinion.
In our opinion, based on our audits and the report of the other auditors, such consolidated financial statements present fairly, in all material respects, the financial position of CB Richard Realty Trust and subsidiaries as of December 31, 2010 and 2009, and the results of their operations and their cash flows for each of the three years in the period ended December 31, 2010, in conformity with accounting principles generally accepted in the United States of America. Also, in our opinion, based on our audits and (as to the amounts included for Duke/Hulfish, LLC) the report of the other auditors, such financial statement schedules, when considered in relation to the basic consolidated financial statements taken as a whole, present fairly, in all material respects, the information set forth therein.
As discussed in Note 2 to the consolidated financial statements, due to recent accounting pronouncements that became effective on January 1, 2009, the Company changed its method of accounting for acquisition costs in business combinations.
We have also audited, in accordance with the standards of the Public Company Accounting Oversight Board (United States), the Company’s internal control over financial reporting as of December 31, 2010, based on the criteria established in Internal Control—Integrated Framework issued by the Committee of Sponsoring Organizations of the Treadway Commission and our report dated March 30, 2011 expressed an unqualified opinion on the Company’s internal control over financial reporting.
/s/ DELOITTE & TOUCHE LLP
Los Angeles, California
March 30, 2011
F-2
CB RICHARD ELLIS REALTY TRUST
Consolidated Balance Sheets
as of December 31, 2010 and 2009
(In Thousands, Except Share Data)
| | | | | | | | |
| | | December 31, | |
| | | 2010 | | | 2009 | |
ASSETS | | | | | | | | |
Investments in Real Estate: | | | | | | | | |
Land | | $ | 212,858 | | | $ | 140,892 | |
Site Improvements | | | 94,545 | | | | 45,859 | |
Buildings and Improvements | | | 744,058 | | | | 456,285 | |
Tenant Improvements | | | 55,834 | | | | 28,095 | |
| | | | | | | | |
| | | 1,107,295 | | | | 671,131 | |
Less: Accumulated Depreciation and Amortization | | | (51,320 | ) | | | (31,558 | ) |
| | | | | | | | |
Net Investments in Real Estate | | | 1,055,975 | | | | 639,573 | |
Investments in Unconsolidated Entities | | | 410,062 | | | | 214,097 | |
Real Estate and Other Assets Held for Sale | | | 22,056 | | | | — | |
Cash and Cash Equivalents | | | 48,218 | | | | 112,631 | |
Restricted Cash | | | 2,058 | | | | 1,923 | |
Accounts and Other Receivables, Net of Allowance of $83 and $183, respectively | | | 5,677 | | | | 4,246 | |
Deferred Rent | | | 8,605 | | | | 3,570 | |
Acquired Above-Market Leases, Net of Accumulated Amortization of $9,345 and $5,886, respectively | | | 22,867 | | | | 17,996 | |
Acquired In-Place Lease Value, Net of Accumulated Amortization of $36,931 and $25,566, respectively | | | 111,005 | | | | 61,375 | |
Deferred Financing Costs, Net of Accumulated Amortization of $2,513 and $1,380, respectively | | | 6,444 | | | | 2,342 | |
Lease Commissions, Net of Accumulated Amortization of $528 and $263, respectively | | | 1,643 | | | | 889 | |
Other Assets | | | 22,110 | | | | 377 | |
| | | | | | | | |
Total Assets | | $ | 1,716,720 | | | $ | 1,059,019 | |
| | | | | | | | |
| | |
LIABILITIES AND SHAREHOLDERS’ EQUITY | | | | | | | | |
LIABILITIES | | | | | | | | |
Notes Payable, Less Discount of $3,700 and $4,615, plus premium of $4,155 and $0, respectively | | $ | 356,823 | | | $ | 203,451 | |
Note Payable at Fair Value | | | 8,769 | | | | 8,974 | |
Loan Payable | | | 60,000 | | | | — | |
Liabilities Related to Real Estate and Other Assets Held for Sale | | | 441 | | | | — | |
Security Deposits | | | 899 | | | | 593 | |
Accounts Payable and Accrued Expenses | | | 15,934 | | | | 11,000 | |
Accrued Offering Costs Payable to Related Parties | | | 917 | | | | 1,114 | |
Acquired Below-Market Leases, Net of Accumulated Amortization of $9,626 and $6,687, respectively | | | 19,323 | | | | 14,108 | |
Property Management Fee Payable to Related Party | | | 184 | | | | 106 | |
Investment Management Fee Payable to Related Party | | | 1,330 | | | | 757 | |
Distributions Payable | | | 24,053 | | | | 14,750 | |
Interest Rate Swaps at Fair Value—Non-Qualifying Hedges | | | 1,349 | | | | 1,410 | |
Interest Rate Swap at Fair Value—Qualifying Hedges | | | 1,932 | | | | 293 | |
| | | | | | | | |
Total Liabilities | | | 491,954 | | | | 256,556 | |
| | |
COMMITMENTS AND CONTINGENCIES (NOTE 19) | | | | | | | | |
NON-CONTROLLING INTEREST | | | | | | | | |
Operating Partnership Units | | | 2,464 | | | | 2,464 | |
SHAREHOLDERS’ EQUITY | | | | | | | | |
Common Shares of Beneficial Interest, $0.01 par value, 990,000,000 shares authorized; 164,511,252 and 106,465,683 issued and outstanding as of December 31, 2010 and 2009, respectively | | | 1,645 | | | | 1,065 | |
Additional Paid-in-Capital | | | 1,446,559 | | | | 933,088 | |
Accumulated Deficit | | | (214,216 | ) | | | (121,832 | ) |
Accumulated Other Comprehensive Loss | | | (11,686 | ) | | | (12,322d | ) |
| | | | | | | | |
Total Shareholders’ Equity | | | 1,222,302 | | | | 799,999 | |
| | | | | | | | |
Total Liabilities and Shareholders’ Equity | | $ | 1,716,720 | | | $ | 1,059,019 | |
| | | | | | | | |
See accompanying notes to consolidated financial statements.
F-3
CB RICHARD ELLIS REALTY TRUST
Consolidated Statements of Operations
For the Years Ended December 31, 2010, 2009 and 2008
(In Thousands, Except Share Data)
| | | | | | | | | | | | |
| | | Year Ended December 31, | |
| | | 2010 | | | 2009 | | | 2008 | |
REVENUES | | | | | | | | | | | | |
Rental | | $ | 69,373 | | | $ | 47,023 | | | $ | 33,396 | |
Tenant Reimbursements | | | 14,166 | | | | 9,301 | | | | 6,753 | |
| | | | | | | | | | | | |
Total Revenues | | | 83,539 | | | | 56,324 | | | | 40,149 | |
| | | | | | | | | | | | |
| | | |
EXPENSES | | | | | | | | | | | | |
Operating and Maintenance | | | 8,618 | | | | 4,974 | | | | 3,248 | |
Property Taxes | | | 10,965 | | | | 7,624 | | | | 5,479 | |
Interest | | | 14,881 | | | | 11,378 | | | | 10,323 | |
General and Administrative | | | 5,526 | | | | 4,246 | | | | 3,320 | |
Property Management Fee to Related Party | | | 948 | | | | 656 | | | | 491 | |
Investment Management Fee to Related Party | | | 11,595 | | | | 7,803 | | | | 3,964 | |
Acquisition Expenses | | | 17,531 | | | | 5,832 | | | | — | |
Depreciation and Amortization | | | 32,125 | | | | 25,093 | | | | 17,171 | |
Loss on Impairment | | | — | | | | 9,160 | | | | — | |
| | | | | | | | | | | | |
Total Expenses | | | 102,189 | | | | 76,766 | | | | 43,996 | |
| | | | | | | | | | | | |
| | | |
OTHER INCOME AND EXPENSES | | | | | | | | | | | | |
Interest and Other Income | | | 1,260 | | | | 344 | | | | 2,039 | |
Net Settlement (Payments) Receipts on Interest Rate Swaps | | | (1,096 | ) | | | (660 | ) | | | 65 | |
Gain (Loss) on Interest Rate Swaps and Cap | | | 23 | | | | 89 | | | | (1,496 | ) |
(Loss) Gain on Note Payable at Fair Value | | | (118 | ) | | | (807 | ) | | | 1,168 | |
Loss on Early Extinguishment of Debt | | | (72 | ) | | | — | | | | — | |
Loss on Transfer of Held for Sale Real Estate to Continuing Operations | | | — | | | | — | | | | (3,451 | ) |
| | | | | | | | | | | | |
Total Other Income and (Expenses) | | | (3 | ) | | | (1,034 | ) | | | (1,675 | ) |
| | | | | | | | | | | | |
| | | |
LOSS BEFORE (PROVISION) BENEFIT FOR INCOME TAXES AND EQUITY IN INCOME (LOSS) OF UNCONSOLIDATED ENTITIES | | | (18,653 | ) | | | (21,476 | ) | | | (5,522 | ) |
(PROVISION) BENEFIT FOR INCOME TAXES | | | (296 | ) | | | (169 | ) | | | 82 | |
EQUITY IN INCOME (LOSS) OF UNCONSOLIDATED ENTITIES | | | 8,838 | | | | 2,743 | | | | (1,242 | ) |
| | | | | | | | | | | | |
NET LOSS FROM CONTINUING OPERATIONS | | | (10,111 | ) | | | (18,902 | ) | | | (6,682 | ) |
| | | | | | | | | | | | |
DISCONTINUED OPERATIONS | | | | | | | | | | | | |
Revenue from Discontinued Operations | | | 164 | | | | — | | | | — | |
Expense from Discontinued Operations | | | 603 | | | | — | | | | — | |
Property Management Fee to Related Party from Discontinued Operations | | | 7 | | | | — | | | | — | |
Provision for Income Taxes—Discontinued Operations | | | 61 | | | | — | | | | — | |
| | | | | | | | | | | | |
LOSS FROM DISCONTINUED OPERATIONS | | | (507 | ) | | | | | | | | |
| | | | | | | | | | | | |
NET LOSS | | | (10,618 | ) | | | (18,902 | ) | | | (6,682 | ) |
| | | | | | | | | | | | |
Net Loss Attributable to Non-Controlling Operating Partnership Units | | | 18 | | | | 54 | | | | 26 | |
NET LOSS ATTRIBUTABLE TO CB RICHARD ELLIS REALTY TRUST SHAREHOLDERS | | $ | (10,600 | ) | | $ | (18,848 | ) | | $ | (6,656 | ) |
| | | | | | | | | | | | |
Basic and Diluted Net Loss Per Share from Continuing Operations Attributable to CB Richard Ellis Realty Trust Shareholders | | $ | (0.08 | ) | | $ | (0.23 | ) | | $ | (0.14 | ) |
| | | | | | | | | | | | |
Basic and Diluted Net Loss Per Share from Discontinued Operations Attributable to CB Richard Ellis Realty Trust Shareholders | | $ | (0.00 | ) | | $ | — | | | $ | — | |
| | | | | | | | | | | | |
Weighted Average Common Shares Outstanding—Basic and Diluted | | | 136,456,565 | | | | 81,367,593 | | | | 46,089,680 | |
Dividends Declared Per Share | | $ | 0.60 | | | $ | 0.60 | | | $ | 0.59 | |
See accompanying notes to consolidated financial statements
F-4
CB RICHARD ELLIS REALTY TRUST
Consolidated Statements of Cash Flows
For the Years Ended December 31, 2010, 2009 and 2008
(In Thousands)
| | | | | | | | | | | | |
| | | Year Ended December 31, | |
| | | 2010 | | | 2009 | | | 2008 | |
CASH FLOWS FROM OPERATING ACTIVITIES | | | | | | | | | | | | |
Net Loss | | $ | (10,618 | ) | | $ | (18,902 | ) | | $ | (6,682 | ) |
Adjustments to Reconcile Net Loss to Net Cash Flows Provided by Operating Activities: | | | | | | | | | | | | |
Equity in (Income) Loss of Unconsolidated Entities | | | (8,838 | ) | | | (2,743 | ) | | | 1,242 | |
Loss on Impairment | | | — | | | | 9,160 | | | | — | |
Loss on Transfer of Real Estate Held for Sale to Continuing Operations | | | — | | | | — | | | | 3,451 | |
Distributions from Unconsolidated Entities | | | 26,262 | | | | 11,397 | | | | — | |
(Gain) Loss on Interest Rate Swaps and Cap | | | (23 | ) | | | (89 | ) | | | 1,496 | |
Loss on Note Payable at Fair Value | | | 118 | | | | 807 | | | | (1,168 | ) |
Loss on Early Extinguishment of Debt | | | 53 | | | | — | | | | — | |
Gain on Transfer of Real Estate | | | (154 | ) | | | — | | | | — | |
Depreciation and Amortization of Building and Improvements | | | 20,082 | | | | 14,671 | | | | 9,759 | |
Amortization of Deferred Financing Costs | | | 1,081 | | | | 644 | | | | 469 | |
Amortization of Acquired In-Place Lease Value | | | 11,778 | | | | 10,262 | | | | 7,355 | |
Amortization of Above and Below Market Leases | | | 604 | | | | 346 | | | | (371 | ) |
Amortization of Lease Commissions | | | 265 | | | | 160 | | | | 57 | |
Amortization of Discount and Premium on Notes Payable | | | 732 | | | | 796 | | | | 450 | |
Deferred Income Taxes | | | 61 | | | | — | | | | (217 | ) |
Share Based Compensation | | | 240 | | | | — | | | | — | |
Changes in Assets and Liabilities: | | | | | | | | | | | | |
Accounts and Other Receivables | | | (1,431 | ) | | | (562 | ) | | | (1,737 | ) |
Deferred Rent | | | (5,035 | ) | | | (1,253 | ) | | | (1,121 | ) |
Other Assets | | | (1,543 | ) | | | 803 | | | | (788 | ) |
Accounts Payable and Accrued Expenses | | | 5,282 | | | | 617 | | | | 5,969 | |
Investment and Property Management Fees Payable to Related Party | | | 651 | | | | 112 | | | | 272 | |
| | | | | | | | | | | | |
Net Cash Flows Provided By Operating Activities | | | 39,567 | | | | 26,226 | | | | 18,436 | |
| | | | | | | | | | | | |
CASH FLOWS FROM INVESTING ACTIVITIES | | | | | | | | | | | | |
Acquisitions of Real Estate Property | | | (468,765 | ) | | | (195,435 | ) | | | (188,097 | ) |
Acquisition of Real Estate Held for Sale | | | (22,000 | ) | | | — | | | | — | |
Investments in Unconsolidated Entities | | | (235,701 | ) | | | (91,986 | ) | | | (155,421 | ) |
Distributions from Unconsolidated Entities | | | 68,343 | | | | 389 | | | | 23,075 | |
Purchase Deposit | | | (20,005 | ) | | | — | | | | — | |
Restricted Cash | | | (135 | ) | | | (617 | ) | | | (877 | ) |
Lease Commissions | | | (1,019 | ) | | | (496 | ) | | | (429 | ) |
Improvements to Investments in Real Estate | | | (1,838 | ) | | | (474 | ) | | | (283 | ) |
| | | | | | | | | | | | |
Net Cash Flows Used in Investing Activities | | | (681,120 | ) | | | (288,619 | ) | | | (322,032 | ) |
| | | | | | | | | | | | |
CASH FLOWS FROM FINANCING ACTIVITIES | | | | | | | | | | | | |
Proceeds from Common Shares—Public Offering | | | 565 | | | | 425 | | | | 338 | |
Proceeds from Additional Paid-in-Capital—Public Offering | | | 553,402 | | | | 416,394 | | | | 326,548 | |
Redemption of Common Shares | | | (16,407 | ) | | | (20,496 | ) | | | (3,431 | ) |
Payment of Offering Costs | | | (55,000 | ) | | | (43,624 | ) | | | (27,594 | ) |
Payment of Distributions | | | (41,227 | ) | | | (25,402 | ) | | | (22,316 | ) |
Distribution to Non-Controlling Interest | | | (148 | ) | | | (148 | ) | | | (143 | ) |
Borrowing on Loan Payable | | | 60,000 | | | | — | | | | — | |
Principal Payment on Loan Payable | | | — | | | | — | | | | (45,000 | ) |
Proceeds from Notes Payable | | | 97,600 | | | | 22,660 | | | | 33,630 | |
Principal Payments on Notes Payable | | | (16,645 | ) | | | (4,436 | ) | | | (3,590 | ) |
Deferred Financing Costs | | | (5,229 | ) | | | (717 | ) | | | (1,446 | ) |
Security Deposits | | | 305 | | | | 25 | | | | 413 | |
| | | | | | | | | | | | |
Net Cash Flows Provided by Financing Activities | | | 577,216 | | | | 344,681 | | | | 257,409 | |
| | | | | | | | | | | | |
F-5
CB RICHARD ELLIS REALTY TRUST
Consolidated Statements of Cash Flows—(Continued)
For the Years Ended December 31, 2010, 2009 and 2008
(In Thousands)
| | | | | | | | | | | | |
| | | Year Ended December 31, | |
| | | 2010 | | | 2009 | | | 2008 | |
EFFECT OF FOREIGN CURRENCY TRANSLATION | | | (76 | ) | | | 13 | | | | (1,037 | ) |
| | | | | | | | | | | | |
Net (Decrease) Increase in Cash and Cash Equivalents | | | (64,413 | ) | | | 82,301 | | | | (47,224 | ) |
Cash and Cash Equivalents, Beginning of Year | | | 112,631 | | | | 30,330 | | | | 77,554 | |
| | | | | | | | | | | | |
Cash and Cash Equivalents, End of Year | | $ | 48,218 | | | $ | 112,631 | | | $ | 30,330 | |
| | | | | | | | | | | | |
SUPPLEMENTAL DISCLOSURE OF CASH FLOW INFORMATION | | | | | | | | | | | | |
Cash Paid During the Year for Interest | | $ | 12,793 | | | $ | 9,748 | | | $ | 8,833 | |
SUPPLEMENTAL DISCLOSURE OF NON-CASH INVESTING AND FINANCING ACTIVITIES | | | | | | | | | | | | |
Distributions Declared and Payable | | $ | 24,053 | | | $ | 14,750 | | | $ | 8,989 | |
Proceeds from Dividend Reinvestment | | $ | 31,254 | | | $ | 17,600 | | | $ | 8,918 | |
Application of Deposit to Purchase Price of Real Estate | | $ | — | | | $ | — | | | $ | 551 | |
Accrued Acquisition Costs Related to Real Property | | $ | — | | | $ | 10 | | | $ | 350 | |
Accrued Acquisition Costs Related to Investment in Unconsolidated Entities Due To Related Party | | $ | — | | | | — | | | | 407 | |
Duke joint venture Contribution/Distribution—Anson Expansion | | $ | 10,640 | | | | — | | | | — | |
Deconsolidation of Real Estate Transferred to Duke joint venture | | $ | (41,888 | ) | | | — | | | | — | |
Notes Payable Assumed on Acquisition of Real Estate | | $ | 73,540 | | | $ | 12,572 | | | $ | 39,132 | |
Increase in Investment in Duke joint venture from Transfer of Real Estate | | $ | 42,042 | | | | — | | | | — | |
Awards Increase in APIC | | $ | 240 | | | | — | | | | — | |
See accompanying notes to consolidated financial statements.
F-6
CB RICHARD ELLIS REALTY TRUST
Consolidated Statements of Shareholders’ Equity
For the Years Ended December 31, 2010, 2009 and 2008
(In Thousands, Except Share Data)
| | | | | | | | | | | | | | | | | | | | | | | | | | | | | | | | |
| | | Common Shares | | | Additional
Paid-in-
Capital | | | Accumulated
Deficit | | | Accumulated
Other
Comprehensive
Income (Loss) | | | Total
Shareholders’
Equity | | | Non-Controlling
Interest
Operating
Partnership
Units | | | Total
Shareholders’
And
Non-Controlling
Interest | |
| | | Shares | | | Amount | | | | | | | |
Balance at
January 1, 2008 | | | 31,076,709 | | | | 311 | | | | 263,987 | | | | (20,274 | ) | | | 39 | | | | 244,063 | | | | 2,464 | | | | 246,527 | |
Net Loss | | | — | | | | — | | | | — | | | | (6,656 | ) | | | — | | | | (6,656 | ) | | | (26 | ) | | | (6,682 | ) |
Foreign Currency Translation Loss | | | — | | | | — | | | | — | | | | — | | | | (19,366 | ) | | | (19,366 | ) | | | (84 | ) | | | (19,450 | ) |
| | | | | | | | | | | | | | | | | | | | | | | | | | | | | | | | |
Total Comprehensive Loss | | | — | | | | — | | | | — | | | | (6,656 | ) | | | (19,366 | ) | | | (26,022 | ) | | | (110 | ) | | | (26,132 | ) |
| | | | | | | | | | | | | | | | | | | | | | | | | | | | | | | | |
Net Contributions From Public Offering of Common Shares, $0.01 Par Value | | | 33,796,594 | | | | 338 | | | | 326,548 | | | | — | | | | — | | | | 326,886 | | | | — | | | | 326,886 | |
Costs Associated with Public Offering | | | — | | | | — | | | | (26,744 | ) | | | — | | | | — | | | | (26,744 | ) | | | — | | | | (26,744 | ) |
Redemption of Common Shares | | | (383,235 | ) | | | (4 | ) | | | (3,427 | ) | | | — | | | | — | | | | (3,431 | ) | | | — | | | | (3,431 | ) |
Adjustment to Record Non-Controlling Interest at Redemption Value | | | — | | | | — | | | | (254 | ) | | | — | | | | — | | | | (254 | ) | | | 254 | | | | — | |
Distributions | | | — | | | | — | | | | — | | | | (27,291 | ) | | | — | | | | (27,291 | ) | | | (144 | ) | | | (27,435 | ) |
| | | | | | | | | | | | | | | | | | | | | | | | | | | | | | | | |
Balance at December 31, 2008 | | | 64,490,068 | | | | 645 | | | | 560,110 | | | | (54,221 | ) | | | (19,327 | ) | | | 487,207 | | | | 2,464 | | | | 489,671 | |
Net Loss | | | — | | | | — | | | | — | | | | (18,848 | ) | | | — | | | | (18,848 | ) | | | (54 | ) | | | (18,902 | ) |
Foreign Currency Translation Gain | | | — | | | | — | | | | — | | | | — | | | | 7,297 | | | | 7,297 | | | | 25 | | | | 7,322 | |
Swap Fair Value Adjustment | | | — | | | | — | | | | — | | | | — | | | | (292 | ) | | | (292 | ) | | | (1 | ) | | | (293 | ) |
| | | | | | | | | | | | | | | | | | | | | | | | | | | | | | | | |
Total Comprehensive Loss | | | — | | | | — | | | | — | | | | (18,848 | ) | | | 7,005 | | | | (11,843 | ) | | | (30 | ) | | | (11,873 | ) |
| | | | | | | | | | | | | | | | | | | | | | | | | | | | | | | | |
Net Contributions From Public Offering of Common Shares, $0.01 Par Value | | | 44,260,531 | | | | 443 | | | | 433,977 | | | | — | | | | — | | | | 434,420 | | | | — | | | | 434,420 | |
Costs Associated with Public Offering | | | — | | | | — | | | | (40,348 | ) | | | — | | | | — | | | | (40,348 | ) | | | — | | | | (40,348 | ) |
Redemption of Common Shares | | | (2,284,916 | ) | | | (23 | ) | | | (20,473 | ) | | | — | | | | — | | | | (20,496 | ) | | | — | | | | (20,496 | ) |
Adjustment to Record Non-Controlling Interest at Redemption Value | | | — | | | | — | | | | (178 | ) | | | — | | | | — | | | | (178 | ) | | | 178 | | | | — | |
Distributions | | | — | | | | — | | | | — | | | | (48,763 | ) | | | — | | | | (48,763 | ) | | | (148 | ) | | | (48,911 | ) |
| | | | | | | | | | | | | | | | | | | | | | | | | | | | | | | | |
F-7
CB RICHARD ELLIS REALTY TRUST
Consolidated Statements of Shareholders’ Equity—(Continued)
For the Years Ended December 31, 2010, 2009 and 2008
(In Thousands, Except Share Data)
| | | | | | | | | | | | | | | | | | | | | | | | | | | | | | | | |
| | | Common Shares | | | Additional
Paid-in-
Capital | | | Accumulated
Deficit | | | Accumulated
Other
Comprehensive
Income (Loss) | | | Total
Shareholders’
Equity | | | Non-Controlling
Interest
Operating
Partnership
Units | | | Total
Shareholders’
And
Non-Controlling
Interest | |
| | | Shares | | | Amount | | | | | | | |
Balance at December 31, 2009 | | | 106,465,683 | | | $ | 1,065 | | | $ | 933,088 | | | $ | (121,832 | ) | | $ | (12,322 | ) | | $ | 799,999 | | | $ | 2,464 | | | $ | 802,463 | |
Net Loss | | | — | | | | — | | | | — | | | | (10,600 | ) | | | — | | | | (10,600 | ) | | | (18 | ) | | | (10,618 | ) |
Foreign Currency Translation Gain | | | — | | | | — | | | | — | | | | — | | | | 2,272 | | | | 2,272 | | | | 3 | | | | 2,275 | |
Swap Fair Value Adjustment | | | — | | | | — | | | | — | | | | — | | | | (1,636 | ) | | | (1,636 | ) | | | (3 | ) | | | (1,639 | ) |
| | | | | | | | | | | | | | | | | | | | | | | | | | | | | | | | |
Total Comprehensive Loss | | | — | | | | — | | | | — | | | | (10,600 | ) | | | 636 | | | | (9,964 | ) | | | (18 | ) | | | (9,982 | ) |
| | | | | | | | | | | | | | | | | | | | | | | | | | | | | | | | |
Net Contributions From Public Offering of Common Shares, $0.01 Par Value | | | 59,817,671 | | | | 598 | | | | 584,623 | | | | — | | | | — | | | | 585,221 | | | | — | | | | 585,221 | |
Trustee Common Shares Granted | | | 24,000 | | | | — | | | | 240 | | | | — | | | | — | | | | 240 | | | | — | | | | 240 | |
Costs Associated with Public Offering | | | — | | | | — | | | | (54,837 | ) | | | — | | | | — | | | | (54,837 | ) | | | — | | | | (54,837 | ) |
Redemption of Common Shares | | | (1,796,101 | ) | | | (18 | ) | | | (16,389 | ) | | | — | | | | — | | | | (16,407 | ) | | | — | | | | (16,407 | ) |
Adjustment to Record Non-Controlling Interest at Redemption Value | | | — | | | | — | | | | (166 | ) | | | — | | | | — | | | | (166 | ) | | | 166 | | | | — | |
Distributions | | | — | | | | — | | | | — | | | | (81,784 | ) | | | — | | | | (81,784 | ) | | | (148 | ) | | | (81,932 | ) |
| | | | | | | | | | | | | | | | | | | | | | | | | | | | | | | | |
Balance at December 31, 2010 | | | 164,511,253 | | | | 1,645 | | | | 1,446,559 | | | | (214,216 | ) | | | (11,686 | ) | | | 1,222,302 | | | | 2,464 | | | | 1,224,766 | |
| | | | | | | | | | | | | | | | | | | | | | | | | | | | | | | | |
See accompanying notes to consolidated financial statements.
F-8
CB RICHARD ELLIS REALTY TRUST
NOTES TO THE CONSOLIDATED FINANCIAL STATEMENTS
For the Years Ended December 31, 2010, 2009 and 2008
1. Organization and Nature of Business
CB Richard Ellis Realty Trust (the “Company”) was formed on March 30, 2004 under the laws of the state of Maryland. CBRE Operating Partnership, L.P. (“CBRE OP”) was formed in Delaware on March 30, 2004, with the Company as the sole general partner (the “General Partner”). The Company has elected to be taxed as a real estate investment trust (“REIT”) under sections 856 through 860 of the Internal Revenue Code of 1986, as amended (the “Internal Revenue Code”), beginning with its taxable period ended December 31, 2004. The Company was incorporated to raise capital and acquire ownership interests in high quality real estate properties, including office, industrial (primarily warehouse/distribution), retail and potentially multi-family residential properties, as well as other real estate related assets.
On July 1, 2004, the Company commenced operations and issued 6,844,313 common shares of beneficial interest in connection with the initial capitalization of the Company. For each common share the Company issued, one limited partnership unit in CBRE OP was issued to the Company in exchange for the cash proceeds from the issuance of the common shares. In addition, CBRE REIT Holdings, LLC (“REIT Holdings”) an affiliate of CBRE Advisors LLC (the “Investment Advisor”), purchased 29,937 limited partnership units in CBRE OP as a limited partner. During October 2004, the Company issued an additional 123,449 common shares of beneficial interest to an unrelated third-party investor.
On July 2, 2007, in conjunction with the Carolina Portfolio acquisition, the Company formed a taxable REIT subsidiary, CBRE RT Carolina TRS, Inc., (“Carolina TRS”), to hold certain real estate assets designated by management as held for sale which represent non-qualified REIT assets. On September 30, 2008, the real estate assets held by Carolina TRS were reclassified as held for investment and were transferred to CBRE OP. On January 5, 2011 and on February 23, 2011, the Company formed taxable REIT subsidiaries (Rickenbacker II, LLC and Rickenbacker III, LLC, respectively) to hold two real estate assets designated by management as held for sale which represent non-qualified REIT assets.
The registration statement relating to our initial public offering was declared effective by the Securities Exchange Commission (the “SEC”) on October 24, 2006. CNL Securities Corp., a related party, acted as the dealer manager of this offering. The registration statement covered up to $2,000,000,000 in common shares of beneficial interest, 90% of which were offered at a price of $10.00 per share, and 10% of which were offered pursuant to our dividend reinvestment plan at a purchase price equal to the higher of $9.50 per share or 95% of the fair market value of a common share on the reinvestment date, as determined by the Investment Advisor, or another firm we choose for that purpose. During the period October 24, 2006 through January 29, 2009, the Company issued 60,808,967 additional common shares of beneficial interest. We terminated the initial public offering effective as of the close of business on January 29, 2009.
The registration statement relating to our follow-on public offering was declared effective by the SEC on January 30, 2009. CNL Securities Corp. is the dealer manager of this offering. The registration statement covers up to $3,000,000,000 in common shares of beneficial interest, 90% of which will be offered at a price of $10.00 per share, and 10% of which will be offered pursuant to our dividend reinvestment plan at a purchase price equal to the higher of $9.50 per share or 95% of the fair market value of a common share on the reinvestment date, as determined by the Investment Advisor, or another firm we choose for that purpose. We reserve the right to reallocate the shares between the primary offering and our dividend reinvestment plan. From January 30, 2009 (effective date) through December 31, 2010, the Company received gross offering proceeds of approximately $1,010,076,294 from the sale of 101,245,478 shares.
The Company operates in an umbrella partnership REIT structure in which its majority-owned subsidiary, CBRE OP, owns, directly or indirectly, substantially all of the properties acquired on behalf of the Company. The Company, as the sole general partner of CBRE OP, owns approximately 99.85% of the common partnership units therein. REIT Holdings, an affiliate of the Investment Advisor, holds the remaining interest through 246,361 limited partnership units representing approximately a 0.15% ownership interest in the total limited partnership units. In exchange for services provided to the Company relating to its formation and future services, REIT Holdings also owns a Class B limited partnership interest (“Class B interest”). The Investment Advisor is affiliated with the Company in that the two entities have common officers and trustees, some of whom also own equity interests in the Investment Advisor and the Company. All business activities of the Company are managed by the Investment Advisor.
Unless the context otherwise requires or indicates, references to “CBRE REIT,” “we,” “the Company” “our,” and “us” refer to the activities of and the assets and liabilities of the business and operations of CB Richard Ellis Realty Trust and its subsidiaries.
F-9
CB RICHARD ELLIS REALTY TRUST
NOTES TO THE CONSOLIDATED FINANCIAL STATEMENTS—(Continued)
For the Years Ended December 31, 2010, 2009 and 2008
2. Basis of Presentation and Summary of Significant Accounting Policies
Basis of Presentation
The accompanying consolidated financial statements have been prepared in accordance with the rules applicable to Form 10-K and include all information and footnotes required for financial statement presentation, including disclosures required under Generally Accepted Accounting Principles (“U.S. GAAP”) for complete financial statements.
Principles of Consolidation
Because we are the sole general partner and majority owner of CBRE OP and have majority control over their management and major operating decisions, the accounts of CBRE OP are consolidated in our financial statements. The interests of REIT Holdings are reflected in non-controlling interest in the accompanying consolidated financial statements. All significant inter-company accounts and transactions are eliminated in consolidation. CB Richard Ellis Investors, LLC (“CBRE Investors”), an affiliate of the Investment Advisor, also owns an interest in us through its ownership of 243,229 common shares of beneficial interest at December 31, 2010 and 2009.
Accounting Standards Updates
In June 2009, the Financial Accounting Standards Board (“FASB”) issued its final Statement of Financial Accounting Standards (“SFAS”) No. 168 entitled“The FASB Accounting Standards Codification and the Hierarchy of Generally Accepted Accounting Principles” (“SFAS No. 168”) which was a replacement of FASB Statement No. 162,“the Hierarchy Generally Accepted Accounting Principles.” SFAS No. 168 made the FASB Accounting Standards Codification (the “Codification”) the single source of U.S. GAAP used by nongovernmental entities in the preparation of financial statements, except for the rules and interpretive releases of the SEC under authority of federal securities laws, which are sources of authoritative accounting guidance for SEC registrants. The Codification is meant to simplify user access to all authoritative accounting guidance by reorganizing U.S. GAAP pronouncements into approximately 90 accounting topics within a consistent structure and not to create new accounting and reporting guidance. The Codification supersedes all existing non-SEC accounting and reporting standards and was effective for our Company beginning July 1, 2009. Following SFAS No. 168, the FASB will not issue new standards in the form of Statements, FASB Staff Positions, or Emerging Issues Task Force Abstracts; instead, it will issue Accounting Standards Updates. The FASB will not consider Accounting Standards Updates as authoritative in their own right; these updates will serve only to update the Codification, provide background information about the guidance, and provide the basis for conclusions on the change(s) in the Codification. In the description of Accounting Standards Updates that follows, references in “italics” relate to Codification Topics and Sub-Topics, and their descriptive titles, as appropriate.
Investment in Unconsolidated Entities
Our determination of the appropriate accounting method with respect to our investment in CB Richard Ellis Strategic Partners Asia II-A, L.P. (“CBRE Strategic Partners Asia”), which is not considered a Variable Interest Entity (“VIE”), is partially based on CBRE Strategic Partners Asia’s sufficiency of equity investment at risk which was triggered by a substantial paydown during 2009 of its subscription line of credit backed by investor capital commitments to fund its operations. We account for this investment under the equity method of accounting.
We determine if an entity is a VIE based on several factors, including whether the entity’s total equity investment at risk upon inception is sufficient to finance the entity’s activities without additional subordinated financial support. We make judgments regarding the sufficiency of the equity at risk based first on a qualitative analysis, then a quantitative analysis, if necessary. In a quantitative analysis, we incorporate various estimates, including estimated future cash flows, asset hold periods and discount rates, as well as estimates of the probabilities of various scenarios occurring. If the entity is a VIE, we then determine whether we consolidate the entity as the primary beneficiary. We determine whether an entity is a VIE and, if so, whether it should be consolidated by utilizing judgments and estimates that are inherently subjective. If we made different judgments or utilized different estimates in these evaluations, it could result in differing conclusions as to whether or not an entity is a VIE and whether or not we consolidate such entity.
With respect to our majority limited membership interest in the Duke/Hulfish, LLC joint venture (the “Duke joint venture”), the Afton Ridge Joint Venture, LLC (“Afton Ridge”), the Goodman Princeton Holdings (Jersey) Limited joint venture (the “UK JV”) and the Goodman Princeton Holdings (LUX) SARL joint venture (the “European JV”), we considered FASB the Accounting Standard Codification
F-10
CB RICHARD ELLIS REALTY TRUST
NOTES TO THE CONSOLIDATED FINANCIAL STATEMENTS—(Continued)
For the Years Ended December 31, 2010, 2009 and 2008
TopicConsolidation FASB ASC 810 in determining that we did not have control over the financial and operating decisions of such entities due to the existence of substantive participating rights held by the minority limited members who are also the managing members of the Duke joint venture and Afton Ridge, and the investment advisors/managers of the UK JV and the European JV, respectively.
We carry our investments in CBRE Strategic Partners Asia, the Duke joint venture, Afton Ridge, the UK JV and the European JV on the equity method of accounting because we have the ability to exercise significant influence (but not control) over operating and financial policies of each such entity.
We eliminate transactions with such equity method entities to the extent of our ownership in each such entity. Accordingly, our share of net income (loss) of these equity method entities is included in consolidated net income (loss). CBRE Strategic Partners Asia is a limited partnership that qualifies for specialized industry accounting for investment companies. Specialized industry accounting allows investment companies to carry their investments at fair value, with changes in the fair value of the investments recorded in the statement of operations. On the basis of the guidance in ASC 970-323, the Company accounts for its investment in CBRE Strategic Partners Asia under the equity method. As a result, and in accordance with ASC 810-10-25-15 the specialized accounting treatment, principally the fair value basis applied by CBRE Strategic Partners Asia under the investment company guide, is retained in the recognition of equity method earnings in the statement of operations of the Company. See Note 18 “Fair Value of Financial Instruments and Investments” for further discussion of the application of the fair value accounting to our investment in CBRE Strategic Partners Asia.
Use of Estimates
The preparation of financial statements, in conformity with U.S. GAAP, requires us to make estimates and assumptions that affect the reported amounts of assets and liabilities and disclosure of contingent assets and liabilities at the date of the financial statements and the reported amounts of revenues and expenses during the reporting period. Actual results could differ from those estimates.
Segment Information
We currently operate in two geographic areas, the United States and the United Kingdom. We view our consolidated property operations as three reportable segments, a Domestic Industrial segment, a Domestic Office segment and an International Office/Retail segment, which participate in the acquisition, development, ownership, and operation of high quality real estate in their respective segments.
Cash Equivalents
We consider short-term investments with maturities of three months or less when purchased to be cash equivalents. As of December 31, 2010 and 2009, cash equivalents consisted primarily of investments in money market funds.
Restricted Cash
Restricted cash represents those cash accounts for which the use of funds is restricted by loan covenants. As of December 31, 2010 and 2009 our restricted cash balance was $2,058,000 and $1,923,000, respectively, which represents amounts set aside as impounds for future property tax payments, property insurance payments and tenant improvement payments as required by our agreements with our lenders.
Discontinued Operations and Real Estate Held for Sale
In a period in which a property has been disposed of or is classified as held for sale, the statements of operations for current and prior periods report the results of operations of the property as discontinued operations.
At such time as a property is deemed held for sale, such property is carried at the lower of: (1) its carrying amount or (2) fair value less costs to sell. In addition, a property being held for sale ceases to be depreciated. We classify operating properties as property held for sale in the period in which all of the following criteria are met:
| | ¡ | | management, having the authority to approve the action, commits to a plan to sell the asset; |
| | ¡ | | the asset is available for immediate sale in its present condition subject only to terms that are usual and customary for sales of such assets; |
F-11
CB RICHARD ELLIS REALTY TRUST
NOTES TO THE CONSOLIDATED FINANCIAL STATEMENTS—(Continued)
For the Years Ended December 31, 2010, 2009 and 2008
| | ¡ | | an active program to locate a buyer and other actions required to complete the plan to sell the asset has been initiated; |
| | ¡ | | the sale of the asset is probable and the transfer of the asset is expected to qualify for recognition as a completed sale within one year; |
| | ¡ | | the asset is being actively marketed for sale at a price that is reasonable in relation to its current fair value; and |
| | ¡ | | given the actions required to complete the plan to sell the asset, it is unlikely that significant changes to the plan would be made or that the plan would be withdrawn. |
As of December 31, 2010, we had two properties (Rickenbacker II and Rickenbacker III) held for sale. There were no properties held for sale as of December 31, 2009.
Accounting for Derivative Financial Instruments and Hedging Activities
All of our derivative instruments are carried at fair value on the balance sheet. Derivative instruments designated in a hedge relationship to mitigate exposure to variability in expected future cash flows, or other types of forecasted transactions, are considered cash flow hedges. We formally document all relationships between hedging instruments and hedged items, as well as our risk-management objective and strategy for undertaking each hedge transaction. We periodically review the effectiveness of each hedging transaction, which involves estimating future cash flows. Cash flow hedges are accounted for by recording the fair value of the derivative instrument on the balance sheet as either an asset or liability, with a corresponding amount recorded in other comprehensive income within shareholders’ equity. Calculation of a fair value of derivative instruments also requires management to use estimates. Amounts will be reclassified from other comprehensive income to the income statement in the period or periods the hedged forecasted transaction affects earnings. If a lease were to be terminated prior to its stated expiration, all unamortized amounts relating to that lease would be written-off.
Derivative instruments designated in a hedge relationship to mitigate exposure to changes in the fair value of an asset, liability, or firm commitment attributable to a particular risk, such as interest rate risk, are considered fair value hedges. The changes in fair value hedges are accounted for by recording the fair value of the derivative instruments on the balance sheet as either assets or liabilities, with the corresponding amount recorded in current period earnings. We have certain interest rate swap derivatives that are designated as qualifying cash flow hedges and follow the accounting treatment discussed above. We also have certain interest rate swap derivatives that do not qualify for hedge accounting, and accordingly, changes in fair values are recognized in current earnings.
We disclose the fair values of derivative instruments and their gains and losses in a tabular format. We also provide more information about our liquidity by disclosing derivative features that are credit risk-related. Finally, we cross-reference within these footnotes to enable financial statement users to locate important information about derivative instruments (see Note 16 “Derivative Instruments” and Note 18 “Fair Value of Financial Instruments and Investments” for a further discussion of our derivative financial instruments).
Investments in Real Estate and Related Long Lived Assets (Impairment Evaluation)
Our investments in real estate is stated at depreciated cost. Depreciation and amortization are recorded on a straight-line basis over the estimated useful lives as follows:
| | |
Buildings and Improvements | | 39 years |
Site Improvements | | 15 and 25 years |
Tenant Improvements | | Shorter of the useful lives or the terms of the related leases |
Improvements and replacements are capitalized when they extend the useful life, increase capacity, or improve the efficiency of the asset. Repairs and maintenance are charged to expense as incurred. As of December 31, 2010 and 2009, we owned, on a consolidated basis, 71, exclusive of the two properties held for sale, and 60 real estate investments, respectively.
On June 29, 2009, we acquired 13201 Wilfred Lane, a single tenant warehouse distribution building located in Rogers, MN, a suburb of Minneapolis. The purchase price was $15,340,000.
F-12
CB RICHARD ELLIS REALTY TRUST
NOTES TO THE CONSOLIDATED FINANCIAL STATEMENTS—(Continued)
For the Years Ended December 31, 2010, 2009 and 2008
On July 1, 2009, we acquired 3011, 3055 & 3077 Comcast Place, a single tenant three office building campus located in Livermore, CA, a suburb in the eastern portion of the San Francisco Bay area. The purchase price was $49,000,000.
On July 31, 2009, we acquired 140 Depot Street, a single tenant warehouse distribution building located in Bellingham, MA, a suburb of Boston. The purchase price was $18,950,000.
On August 5, 2009, we acquired 12650 Ingenuity Drive, a single tenant office building located in Orlando, FL. The purchase price was $25,350,000.
On August 17, 2009, we acquired Crest Ridge Corporate Center I, a single tenant office building located in Minnetonka, MN, a suburb of Minneapolis. The purchase price was $28,419,000.
On December 30, 2009, we acquired West Point Trade Center, a single tenant warehouse distribution building located in Jacksonville, FL. The purchase price was $29,000,000.
On December 31, 2009, we acquired Miramar I & II, two single tenant office buildings, located in Miramar, FL, a suburb of Miami. The purchase price was $17,000,000 and $25,479,000, respectively. Miramar I & II were contributed to the Duke joint venture on March 31, 2010.
On April 8, 2010, we acquired 5160 Hacienda Drive, a single tenant corporate headquarters and research and development building located in Dublin, CA, in the eastern portion of the San Francisco Bay area. The purchase price was $38,500,000.
On May 7, 2010, we acquired 10450 Pacific Center Court, a single tenant office building located in San Diego, CA. The purchase price was $32,750,000.
On June 21, 2010, we acquired 225 Summit Avenue, a single tenant corporate headquarters office building located in Montvale, NJ, in the New York metropolitan area. The purchase price was $40,600,000.
On June 24, 2010, we acquired One Wayside Road, a single tenant corporate headquarters office building located in Burlington, MA, a suburb of Boston. The purchase price was $55,525,000.
On September 28, 2010, we acquired 100 Tice Blvd., a single tenant corporate headquarters office building located in Woodcliff Lake, NJ, a suburb in the New York Metropolitan area. The purchase price was $67,600,000.
On October 12, 2010, we acquired Ten Parkway North, a single tenant corporate headquarters office building located in Deerfield, IL, a suburb of Chicago. The purchase price was $25,000,000.
On October 27, 2010, we acquired 4710 Gold Spike Drive, a single tenant warehouse distribution building located in Jacksonville, FL. The purchase price was $20,300,000.
On October 27, 2010, we acquired 1958 International Way, a single tenant warehouse distribution building located in Hebron, KY, a suburb of Cincinnati, OH. The purchase price was $14,800,000.
On October 27, 2010, we acquired Summit Distribution Center, a multi-tenant warehouse distribution building located in Salt Lake City, UT. The purchase price was $13,400,000.
On October 27, 2010, we acquired 3660 Deerpark Boulevard , a single tenant warehouse distribution building located in Elkton, FL. The purchase price was $15,300,000.
On October 27, 2010, we acquired Tolleson Commerce Park II, a multi-tenant warehouse distribution building located in Tolleson, AZ, a suburb of Phoenix. The purchase price was $9,200,000.
On November 15, 2010, we acquired Pacific Corporate Park , a multi-tenant corporate headquarters office building located in Sterling, VA, a suburb of Washington, DC. The purchase price was $144,500,000.
F-13
CB RICHARD ELLIS REALTY TRUST
NOTES TO THE CONSOLIDATED FINANCIAL STATEMENTS—(Continued)
For the Years Ended December 31, 2010, 2009 and 2008
On December 10, 2010, we acquired 100 Kimball Drive, a single tenant corporate headquarters office building located in Parsippany, NJ. The purchase price was $60,250,000.
The adoption of the provisions of the ASC “Business Combinations” (“FASB ASC 805”) had an impact on the cost allocation of acquisitions made during the years ended December 31, 2010 and 2009 which required us to expense the related acquisition costs. The adoption of the provisions of the new accounting standard FASB ASC 805 effected our consolidated financial statements, results of operations and cash flows from operations for the years ended December 31, 2010 and 2009. We expensed $17,531,000 and $5,832,000 of acquisition costs during the years ended December 31, 2010 and 2009.
We assess whether there has been impairment in the value of our long-lived assets whenever events or changes in circumstances indicate the carrying amount of an asset may not be recoverable. Recoverability of assets to be held and used is measured by a comparison of the carrying amount to the future net cash flows, undiscounted and without interest, expected to be generated by the asset. If such assets are considered to be impaired, the impairment to be recognized is measured by the amount by which the carrying amount of the assets exceeds the estimated fair value of the assets. The estimated fair value of the asset group indentified for step two testing is based on either the income approach with market discount rate, terminal capitalization rate and rental rate assumptions being most critical, or on the sales comparison approach to similar properties. Assets to be disposed of are reported at the lower of the carrying amount or fair value, less costs to sell. In spite of intensive leasing efforts and preliminary interest exhibited by a variety of tenants since our acquisition in 2008, the Kings Mountain III property remained vacant through December 31, 2010; however, we entered into a long term lease with a food services company during February 2011. The tenant will occupy the entire 542,000 square foot building.
We recognized an impairment of our consolidated investment in Kings Mountain III in the amount of $9,160,000 during the year ended December 31, 2009 which reduced our carrying value of the property to $15,300,000. The impairment reflects our estimate of the fair value of the Kings Mountain III property which is based on an appraisal using the sales comparable method, which is a Level 3 Valuation Method as defined in Note 18 “Fair Value of Financial Instruments and Investments.” No impairment of consolidated investments was recognized during 2010 and 2008.
Other Assets
Other assets include the following as of December 31, 2010 and December 31, 2009 (in thousands):
| | | | | | | | |
| | | December 31,
2010 | | | December 31,
2009 | |
Purchase deposits | | $ | 20,005 | | | $ | — | |
Loan commitment fee | | | 740 | | | | — | |
Prepaid insurance | | | 308 | | | | 260 | |
Prepaid real estate taxes | | | — | | | | 76 | |
Interest rate cap at fair value | | | — | | | | 1 | |
Other | | | 1,057 | | | | 40 | |
| | | | | | | | |
Total | | $ | 22,110 | | | $ | 377 | |
| | | | | | | | |
Concentration of Credit Risk
Our properties are located throughout the United States and in the United Kingdom. The ability of the tenants to honor the terms of their respective leases is dependent upon the economic, regulatory, and social factors affecting the communities in which the tenants operate. Our credit risk relates primarily to cash, restricted cash, and interest rate swap and cap agreements. Cash accounts at each institution are insured by the Federal Deposit Insurance Corporation up to $250,000 through December 31, 2013.
We have not experienced any losses to date on our invested cash and restricted cash. The interest rate cap and swap agreements create credit risk. Credit risk arises from the potential failure of counterparties to perform in accordance with the terms of their contracts. Our risk management policies define parameters of acceptable market risk and limit exposure to credit risk. Credit exposure
F-14
CB RICHARD ELLIS REALTY TRUST
NOTES TO THE CONSOLIDATED FINANCIAL STATEMENTS—(Continued)
For the Years Ended December 31, 2010, 2009 and 2008
resulting from derivative financial instruments is represented by their fair value amounts, increased by an estimate of potential adverse position exposure arising from changes over time in interest rates, maturities, and other relevant factors. We do not anticipate nonperformance by any of our counterparties.
Non-Controlling Interest
We owned a 99.85%, and 99.77% partnership interest in CBRE OP as of December 31, 2010 and 2009, respectively. The remaining 0.15% and 0.23% partnership interest as of December 31, 2010 and 2009, respectively, was owned by REIT Holdings in the form of 246,361 non-controlling operating partnership units which were exchangeable on a one for one basis for common shares of CBRE REIT, with an estimated aggregate redemption value of $2,464,000.
With respect to the operating partnership units, FASB ASC 480-10Distinguishing Liabilities from Equity requires non-controlling interests with redemption provisions that permit the issuer to settle in either cash or common shares at the option of the issuer to be further evaluated under the Codification Sub-Topic “Derivatives and Hedging—Conditions Necessary for Equity Classification” (“FASB ASC 815-40-25-10”) to determine whether permanent equity or temporary equity classification on the balance sheet is appropriate. Since the operating partnership units contain such a provision, the Company evaluated this guidance and determined that the operating partnership units do not meet the requirements to qualify for equity presentation. As a result, upon the adoption of FASB ASC 810Consolidation and the related revisions to FASB ASC 480-10 the operating partnership units are presented in the temporary equity section of the consolidated balance sheets and reported at the higher of their proportionate share of the net assets of CBRE OP or fair value, with period to period changes in value reported as an adjustment to shareholder’s equity. Under the terms of the Second Amended Partnership Agreement, the fair value of the operating partnership units is determined as an amount equal to the redemption value as defined therein.
Purchase Accounting for Acquisition of Investments in Real Estate
We apply the acquisition method to all acquired real estate investments. The purchase consideration of the real estate is allocated to the acquired tangible assets, consisting primarily of land, site improvements, building and tenant improvements and identified intangible assets and liabilities, consisting of the value of above-market and below-market leases, other value of in-place leases, value of tenant relationships and acquired ground leases, based in each case on their fair values. Loan premiums, in the case of above-market rate loans, or loan discounts, in the case of below-market loans, will be recorded based on the fair value of any loans assumed in connection with acquiring the real estate.
The fair value of the tangible assets of an acquired property is determined by valuing the property as if it were vacant, and the “as-if-vacant” value is then allocated to land (or acquired ground lease if the land is subject to a ground lease), site improvements, building and tenant improvements based on management’s determination of the relative fair values of these assets. Management determines the as-if-vacant fair value of a property using methods similar to those used by independent appraisers. Factors considered by management in performing these analyses include an estimate of carrying costs during the expected lease-up periods considering current market conditions and costs to execute similar leases. In estimating carrying costs, management includes real estate taxes, insurance and other operating expenses and estimates of lost rental revenue during the expected lease-up periods based on current market demand. Management also estimates costs to execute similar leases including leasing commissions, legal and other related costs.
In allocating the purchase consideration of the identified intangible assets and liabilities of an acquired property, above-market and below-market in-place lease values are recorded based on the present value (using an interest rate which reflects the risks associated with the leases acquired) of the difference between (i) the contractual amounts to be paid pursuant to the in-place leases; and (ii) management’s estimate of fair market lease rates for the corresponding in-place leases measured over a period equal to the remaining non-cancelable term of the lease and, for below-market leases, over a period equal to the initial term plus any below-market fixed rate renewal periods. The capitalized below-market lease values, also referred to as acquired lease obligations, are amortized as an increase to rental income over the initial terms of the respective leases and any below-market fixed rate renewal periods. The capitalized above-market lease values are amortized as a decrease to rental income over the initial terms of the prospective leases.
The aggregate value of other acquired intangible assets, consisting of in-place leases and tenant relationships, is measured by the estimated cost of operations during a theoretical lease-up period to replace in-place leases, including lost revenues and any
F-15
CB RICHARD ELLIS REALTY TRUST
NOTES TO THE CONSOLIDATED FINANCIAL STATEMENTS—(Continued)
For the Years Ended December 31, 2010, 2009 and 2008
unreimbursed operating expenses, plus an estimate of deferred leasing commissions for in-place leases. This aggregate value is allocated between in-place lease value and tenant relationships based on management’s evaluation of the specific characteristics of each tenant’s lease; however, the value of tenant relationships has not been separated from in-place lease value for the real estate acquired as such value and its consequence to amortization expense is immaterial for these particular acquisitions. Should future acquisitions of properties result in allocating material amounts to the value of tenant relationships, an amount would be separately allocated and amortized over the estimated life of the relationship. The value of in-place leases is amortized to expense over the remaining non-cancelable periods of the respective leases. If a lease were to be terminated prior to its stated expiration, all unamortized amounts relating to that lease would be written-off.
Comprehensive Income (Loss)
Comprehensive income (loss) consists of net income (loss) and other comprehensive income (loss). In the accompanying consolidated balance sheets, accumulated other comprehensive income (loss) consists of foreign currency translation adjustments and swap fair value adjustments for qualifying hedges.
Income Taxes
We have elected to be taxed as a REIT under Sections 856 through 860 of the Internal Revenue Code, beginning with our taxable period ended December 31, 2004. To qualify as a REIT, we must distribute annually at least 90% of our REIT taxable income (determined without regard to the dividends paid deduction and excluding net capital gains) as defined in the Internal Revenue Code, to our shareholders and satisfy certain other organizational and operating requirements. We generally will not be subject to U.S. federal income taxes if we distribute 100% of our net taxable income each year to our shareholders. If we fail to qualify as a REIT in any taxable year, we will be subject to U.S. federal income taxes (including any applicable alternative minimum tax) on our taxable income at regular corporate rates and may not be able to qualify as a REIT for the four subsequent taxable years. Even if we qualify for taxation as a REIT, we may be subject to certain state and local taxes on our income and property, and to U.S. federal income taxes and excise taxes on our undistributed taxable income. Except as discussed below, we believe that we have met all of the REIT distribution and technical requirements for the nine months ended September 30, 2010 and the year ended December 31, 2010. We intend to continue to adhere to these requirements and maintain our REIT qualification.
In order for distributions to be deductible for U.S. federal income tax purposes and count towards our distribution requirement, they must not be “preferential dividends.” A distribution will not be treated as preferential if it is pro rata among all outstanding shares of stock within a particular class. IRS guidance, however, allows a REIT to offer shareholders participating in its dividend reinvestment program (“DRIP”) up to a 5% discount on shares purchased through the DRIP without treating such reinvested dividends as preferential. Our DRIP offers a 5% discount. In 2007, 2008 and the first two quarters of 2009, common shares issued pursuant to our DRIP were treated as issued as of the first day following the close of the quarter for which the distributions were declared, and not on the date that the cash distributions were paid to shareholders not participating in our DRIP. Because we declare dividends on a daily basis, including with respect to common shares issued pursuant to our DRIP, the IRS could take the position that distributions paid by us during these periods were preferential on the grounds that the discount provided to DRIP participants effectively exceeded the authorized 5% discount or, alternatively, that the overall distributions were not pro rata among all shareholders. In addition, in the years 2007 through 2009 we paid certain individual retirement account (“IRA”) custodial fees in respect of IRA accounts that invested in our common shares. The payment of certain of such amounts could be treated as dividend distributions to the IRAs, and therefore as preferential dividends as such amounts were not paid in respect of our other outstanding common shares. Although we believe that the effect of the operation of our DRIP and the payment of such fees was immaterial, the REIT rules do not provide an exception for de minimis preferential dividends.
Accordingly, we submitted a request to the IRS for a closing agreement under which the IRS would grant us relief for preferential dividends that may have been paid as a result of the manner in which we operated our DRIP and in respect of our payment of certain of such custodial fees. There can be no assurance that the IRS will accept our proposal for a closing agreement. Even if the IRS accepts the proposal, we may be required to pay a fine if the IRS were to view the prior operation of our DRIP or the payment of such fees as preferential dividends. We cannot predict whether such a penalty would be imposed or, if so, the amount of the penalty. If the IRS does not agree to our proposal for a closing agreement and treats the foregoing amounts as preferential dividends, we may be able to rectify our failure to meet the REIT distribution requirements for a year by paying “deficiency dividends,” which would be paid in respect of all of our common shares pro rata and which would be included in our deduction for dividends paid in the prior years. If
F-16
CB RICHARD ELLIS REALTY TRUST
NOTES TO THE CONSOLIDATED FINANCIAL STATEMENTS—(Continued)
For the Years Ended December 31, 2010, 2009 and 2008
required, such deficiency dividends could be as much as approximately $22,000,000. In such a case, we would be able to avoid losing our qualification as a REIT or being taxed on amounts distributed as deficiency dividends. However, we would be required to pay an interest-like penalty based on the amount of our deficiency dividends. Amounts paid as deficiency dividends should generally be treated as taxable income for U.S. federal income tax purposes.
Revenue Recognition and Valuation of Receivables
All leases are classified as operating leases and minimum rents are recognized on a straight-line basis over the terms of the leases. The excess of rents recognized over amounts contractually due pursuant to the underlying leases is recorded as deferred rent. In connection with various leases, we have received irrevocable stand-by letters of credit totaling $6,515,000 and $6,785,000 as security for such leases at December 31, 2010 and 2009.
Reimbursements from tenants, consisting of amounts due from tenants for common area maintenance, real estate taxes, insurance and other recoverable costs, are recognized as revenue in the period the expenses are incurred. Tenant reimbursements are recognized and presented on a gross basis, when we are the primary obligor with respect to incurring expenses and with respect to having the credit risk.
Tenant receivables and deferred rent receivables are carried net of the allowances for uncollectible current tenant receivables and deferred rent. Management’s determination of the adequacy of these allowances is based primarily upon evaluations of historical loss experience, individual receivables, current economic conditions, and other relevant factors. The allowances are increased or decreased through the provision for bad debts. The allowance for uncollectible rent receivable was $83,000 and $183,000 as of December 31, 2010 and December 31, 2009, respectively. During the year ended December 31, 2010, we wrote off $310,000 of the uncollectible rent receivables for the tenant Randal C. Espey at the Deerfield Commons I property, tenants Cell Arch Technologies, Inc. and Keogh Consulting, Inc. at the Lakeside Office Center, tenant Romeo Rim, Inc. at the Cherokee Corporate Park, and the tenant Amax Engineering Corporation at the 660 North Dorothy. $209,000 of allowance for doubtful accounts was recognized during the year ended December 31, 2010. In addition, the unamortized tangible and intangible asset balances totaling $27,000 were also written off during the year ended December 31, 2010, of which ($10,000), $5,000, $8,000 and $24,000 are related to above/below market leases, lease commissions, tenant improvements and in place lease value, respectively.
Offering Costs
Offering costs totaling $54,837,000 and $40,348,000 were incurred during the years ended December 31, 2010 and 2009, respectively, and are recorded as a reduction of additional paid-in-capital in the consolidated statement of shareholders’ equity. Offering costs incurred through December 31, 2010 totaled $147,338,000. Of the total amount, $133,174,000 was incurred to CNL Securities Corp., as Dealer Manager; $3,969,000 was incurred to CB Richard Ellis Group, Inc., an affiliate of the Investment Advisor; $559,000 was incurred to the Investment Advisor for reimbursable marketing costs and $9,636,000 was incurred to other service providers. Each party will be paid the amount incurred from proceeds of the public offering. As of December 31, 2010 and 2009, the accrued offering costs payable to related parties included in our consolidated balance sheets were $917,000 and $1,114,000, respectively. Offering costs payable to unrelated parties of $115,000 and $83,000 at December 31, 2010 and 2009, respectively, were included in accounts payable and accrued expenses.
Deferred Financing Costs and Discounts on Notes Payable
Direct costs incurred in connection with obtaining financing are amortized over the respective term of the loan on a straight-line basis, which approximates the effective interest method.
Discounts on notes payable are amortized to interest expense based on the effective interest method.
Translation of Non-U.S. Currency Amounts
The financial statements and transactions of our United Kingdom real estate operation are recorded in its functional currency, namely the Great Britain Pound (“GBP”) and is then translated into U.S. dollars (“USD”).
F-17
CB RICHARD ELLIS REALTY TRUST
NOTES TO THE CONSOLIDATED FINANCIAL STATEMENTS—(Continued)
For the Years Ended December 31, 2010, 2009 and 2008
Assets and liabilities of this operation are denominated in the functional currency and are then translated at exchange rates in effect at the balance sheet date. Revenues and expenses are translated at the average exchange rate for the reporting period. Translation adjustments are reported in “Accumulated Other Comprehensive Loss,” a component of Shareholders’ Equity.
The carrying value of our United Kingdom assets and liabilities fluctuate due to changes in the exchange rate between the USD and the GBP. The exchange rate of the USD to the GBP was $1.5570 and $1.6156 at December 31, 2010 and 2009, respectively. The profit and loss weighted average exchange rate of the USD to the GBP was approximately $1.5461, $1.5531 and $1.8720 for the years ended December 31, 2010, 2009 and 2008, respectively.
The carrying value of our European assets and liabilities fluctuate due to changes in the exchange rate between the USD and the EUR. The exchange rate of the USD to the EUR was $1.3338 at December 31, 2010. We acquired our first property in Europe on June 10, 2010. The profit and loss weighted average exchange rate of the USD to the EUR was approximately $1.3256 for the year ended December 31, 2010.
Class B Interest—Related Party
Effective July 1, 2004, REIT Holdings, an affiliate of the Investment Advisor, was granted a Class B interest in CBRE OP. The Class B interest is an equity instrument issued to non-employees in exchange for services. As modified by the second amended and restated agreement of limited partnership of CBRE OP entered into on January 30, 2009 (the “Second Amended Partnership Agreement”), the holder is entitled to receive distributions made by CBRE OP in an amount equal to 15% of all net sales proceeds on dispositions of properties or other assets (including by liquidation, merger or otherwise) after the other partners including us, have received in the aggregate, cumulative distributions from property income, sales proceeds or other services equal to (i) the total capital contributions made to CBRE OP and (ii) a 7% annual, uncompounded return on such capital contributions. The terms of the termination provision relating to the Class B interest requires its forfeiture in the event the Advisor unilaterally terminates the agreement between the Company, CBRE OP and the Investment Advisor (the “Advisory Agreement”). As a result future changes in the fair value of the Class B interest will be deferred from recognition in the financial statements until a listing of the common shares on a national securities exchange or a change in control transaction takes place.
Earnings Per Share Attributable to CB Richard Ellis Realty Trust Shareholders
Basic net income (loss) per share is computed by dividing income (loss) by the weighted average number of common shares outstanding during each period. The computation of diluted net income (loss) further assumes the dilutive effect of stock options, stock warrants and contingently issuable shares, if any. We have recorded a net loss for the years ended December 31, 2010 2009 and 2008 the effect of stock options, stock warrants and contingently issuable shares, if any, would be anti–dilutive, and accordingly, if there were any of these instruments outstanding, they would be excluded from the earnings per share computation. In addition, no stock options, stock warrants or contingently issuable shares have ever been issued. As a result, there is no difference in basic and diluted shares.
Fair Value of Financial Instruments and Investments
We elected to apply the fair value option for one of our eligible mortgage notes payable that was newly issued debt during the year ended December 31, 2008. The measurement of the elected mortgage note payable at its fair value and its impact on the statement of operations is described in Note 17 “Fair Value Option-Note Payable” and Note 18 “Fair Value of Financial Instruments and Investments”.
We generally determine or calculate the fair value of financial instruments using appropriate present value or other valuation techniques, such as discounted cash flow analyses, incorporating available market discount rate information for similar types of instruments and our estimates for non-performance and liquidity risk. These techniques are significantly affected by the assumptions used, including the discount rate, credit spreads, and estimates of future cash flow. The Investment Manager of CBRE Strategic Partners Asia applies valuation techniques for our investment carried at fair value based upon the application of the income approach, the direct market comparison approach, the replacement cost approach or third party appraisals to the underlying assets held in the unconsolidated entity in determining the net asset value attributable to our ownership interest therein. The financial assets and liabilities recorded at fair value in our consolidated financial statements are the five interest rate swaps, our investment in CBRE
F-18
CB RICHARD ELLIS REALTY TRUST
NOTES TO THE CONSOLIDATED FINANCIAL STATEMENTS—(Continued)
For the Years Ended December 31, 2010, 2009 and 2008
Strategic Partners Asia (a real estate entity which qualifies as an investment company under the Investment Company Act), and one mortgage note payable that is economically hedged by one of the interest rate swaps.
The remaining financial assets and liabilities which are only disclosed at fair value are comprised of all other notes payable, the unsecured line of credit and other debt instruments. We determined the fair value of our secured notes payable and other debt instruments by performing discounted cash flow analyses using an appropriate market discount rate. We calculate the market discount rate by obtaining period-end treasury rates for fixed-rate debt, or London Inter-Bank Offering Rate (“LIBOR”) rates for variable-rate debt, for maturities that correspond to the maturities of our debt and then adding an appropriate credit spread derived from information obtained from third-party financial institutions. These credit spreads take into account factors such as our credit standing, the maturity of the debt, whether the debt is secured or unsecured, and the loan-to-value ratios of the debt.
The carrying amounts of our cash and cash equivalents, restricted cash, accounts receivable and accounts payable approximate fair value due to their short-term maturities.
We adopted the fair value measurement criteria described herein for our non-financial assets and non-financial liabilities on January 1, 2009. The adoption of the fair value measurement criteria to our non-financial assets and liabilities did not have a material impact to our consolidated financial statements. Assets and liabilities typically recorded at fair value on a non-recurring basis include:
| | ¡ | | Non-financial assets and liabilities initially measured at fair value in an acquisition or business combination; |
| | ¡ | | Long-lived assets measured at fair value due to an impairment assessment and |
| | ¡ | | Asset retirement obligations initially measured under the Codification Topic “Asset Retirement and Environmental Obligations ” (“FASB ASC 410”). |
Pronouncement Affecting Operating Property Acquisitions
Effective January 1, 2009, we adopted the provisions of FASB ASC 805 which requires an acquiring entity to recognize acquired assets and assumed liabilities in a transaction at fair value as of the acquisition date and changes the accounting treatment for certain items, including acquisition costs, which is required to be expensed as incurred. The provision of“Business Combinations” is required to be applied on a prospective basis.
The adoption of the provisions of the FASB ASC 805 could have an impact on the cost allocation of future acquisitions and requires us to expense acquisition costs for future property acquisitions. The adoption of the provisions of the new accounting standard FASB ASC 805 had an effect on our consolidated financial statements, results of operations and cash flows for the year ended December 31, 2010 and 2009. We expensed $17,531,000 and $5,832,000 of acquisition costs during the years ended December 31, 2010 and 2009.
Subsequent Events
In preparing our accompanying financial statements, management has evaluated subsequent events through the financial statement issuance date. We believe that the disclosures contained herein are adequate to prevent the information presented from being misleading.
Adoption of Accounting Standards
Consolidations
In December 2009, FASB issued ASU 2009-17, “Consolidations (Topic 810): Improvements to Financial Reporting by Enterprises Involved with Variable Interest Entities” which incorporates Statement of Financial Accounting Standards (SFAS) No. 167, “Amendments to FASB Interpretation No. 46(R),” issued by the FASB in June 2009. The amendments in ASU 2009–17 replace the quantitative-based risks and rewards calculation for determining which reporting entity, if any, has a controlling financial interest in a VIE with an approach focused on identifying which reporting entity has the power to direct the activities of a VIE that most significantly impact such entity’s economic performance and (i) the obligation to absorb losses of such entity or (ii) the right to receive benefits from such entity. ASU 2009-17 also requires additional disclosures about a reporting entity’s involvement in VIEs, which enhances the information provided to users of financial statements. We adopted ASU 2009-17 effective January 1, 2010. As a result of the fact that we have no variable interests in VIEs, the adoption of ASU 2009-17 did not have a material impact on our consolidated financial statements.
F-19
CB RICHARD ELLIS REALTY TRUST
NOTES TO THE CONSOLIDATED FINANCIAL STATEMENTS—(Continued)
For the Years Ended December 31, 2010, 2009 and 2008
Fair Value Measurements and Disclosures
In January 2010, the FASB issued Accounting Standards Update (“ASU”) 2010-06,“Fair Value Measurements and Disclosures”. ASU 2010-06 clarifies disclosure requirements relating to the level of disaggregation of disclosures relating to classes of assets and liabilities and disclosures about inputs and valuation techniques used to measure fair value for both recurring and nonrecurring fair value estimates for Level 2 or Level 3 assets and liabilities. These requirements of ASU 2010-06 are effective for interim and annual disclosures for interim and annual reporting periods beginning after December 15, 2009. The adoption of these requirements of the ASU did not have a material impact on our consolidated financial statements.
New Accounting Standards
ASU 2010-06 also requires additional disclosures regarding the transfers of classifications among the fair value classification levels as well as the reasons for those changes and a separate presentation of purchases, sales, issuances and settlements in the presentation of the roll-forward of Level 3 assets and liabilities. Those disclosures are effective for interim and annual reporting periods for fiscal years beginning after December 15, 2010. Except for the Level 3 hierarchy guidance, which is not yet effective, the adoption of this portion of ASU 2010-06 did not have a material impact on our consolidated financial statements.
Other Accounting Standards Updates not effective until after December 31, 2010 are not expected to have a significant effect on our consolidated financial position or results of operations.
3. Acquisition of Real Estate
The fair value of the real estate acquired is allocated to the acquired tangible assets, consisting of land, site improvements, building and tenant improvements, and identified intangible assets and liabilities, consisting of the value of above and below-market leases and the value of in-place leases and tenant relationships, if any, based in each case on their respective fair values. Loan premiums, in the case of above-market rate loans, or loan discounts, in the case of below-market loans, will be recorded based on the fair value of any loans assumed in connection with acquiring the real estate. Effective January 1, 2009, we began expensing deal costs related to our consolidated acquisitions.
Acquisition related expenses of $17,531,000 and $5,832,000 associated with the acquisition of consolidated real estate were expensed as incurred during the years ended December 31, 2010 and 2009, respectively. The purchase price allocation to the assets and liabilities acquired are final except for properties acquired in the fourth quarter 2010 which are preliminary and are subject to revision based on the finalization of appraisals for the assets and liabilities.
13201 Wilfred Lane was acquired on June 29, 2009 for $15,340,000, 3011, 3055 & 3077 Comcast Place was acquired on July 1, 2009 for $49,000,000, 140 Depot Street was acquired on July 31, 2009 for $18,950,000, 12650 Ingenuity Drive was acquired on August 5, 2009 for $25,350,000, Crest Ridge Corporate Center I was acquired on August 17, 2009 for $28,419,000, West Point Trade Center was acquired for $29,000,000 on December 30, 2009, Miramar I was acquired on December 31, 2009 for $17,000,000, Miramar II was acquired on December 31, 2009 for $25,479,000.
5160 Hacienda Drive was acquired on April 8, 2010 for $38,500,000, 10450 Pacific Center Court was acquired on May 7, 2010, for $32,750,000, 225 Summit Avenue was acquired June 21, 2010 for $40,600,000, One Wayside Road was acquired on June 24, 2010 for $55,525,000, 100 Tice Blvd., was acquired on September 28, 2010 for $67,600,000, Ten Parkway North was acquired on October 12, 2010 for $25,000,000, 4701 Gold Spike Drive was acquired on October 27, 2010 for $20,300,000, 1985 International Way was acquired on October 27, 2010 for $14,800,000, Summit Distribution Center was acquired on October 27, 2010 for $13,400,000, 3660 Deerpark Boulevard was acquired on October 27, 2010 for $15,300,000, Tolleson Commerce Park II was acquired on October 27, 2010 for $9,200,000, Pacific Corporate Park was acquired on November 15, 2010 for $144,500,000 and 100 Kimball Drive was acquired on December 10, 2010 for $60,250,000.
F-20
CB RICHARD ELLIS REALTY TRUST
NOTES TO THE CONSOLIDATED FINANCIAL STATEMENTS—(Continued)
For the Years Ended December 31, 2010, 2009 and 2008
The following table summarizes the estimated fair values of the assets acquired and liabilities assumed for the above noted acquisitions during the years ended December 31, 2010 and 2009 and designated as real estate held for investment (in thousands):
| | | | | | | | | | | | | | | | | | | | | | | | | | | | | | | | | | | | | | | | | | | | |
Property | | Land | | | Site
Improvements | | | Building
Improvements | | | Tenant
Improvements | | | Acquired In-
Place Lease
Value | | | Above
Market
Lease
Value | | | Below
Market
Lease
Value | | | (Premium)
Discount
on Notes | | | Purchase
Price | | | Notes
Payable
Assumed | | | Net
Assets
Acquired | |
13201 Wilfred Lane | | $ | 2,274 | | | $ | 412 | | | $ | 11,050 | | | $ | 129 | | | $ | 2,463 | | | $ | — | | | $ | (988 | ) | | $ | — | | | $ | 15,340 | | | $ | — | | | $ | 15,340 | |
3011, 3055 & 3077 Comcast Place | | | 7,013 | | | | 998 | | | | 21,857 | | | | 7,739 | | | | 6,131 | | | | 5,262 | | | | — | | | | — | | | | 49,000 | | | | — | | | | 49,000 | |
140 Depot Street | | | 3,560 | | | | 1,172 | | | | 11,898 | | | | 158 | | | | 1,932 | | | | 230 | | | | — | | | | — | | | | 18,950 | | | | — | | | | 18,950 | |
12650 Ingenuity Drive | | | 3,520 | | | | 397 | | | | 13,330 | | | | 1,517 | | | | 4,107 | | | | 1,512 | | | | — | | | | 967 | | | | 25,350 | | | | (13,539 | ) | | | 11,811 | |
Crest Ridge Corporate Center I | | | 4,624 | | | | 335 | | | | 16,024 | | | | 3,174 | | | | 4,004 | | | | 258 | | | | — | | | | — | | | | 28,419 | | | | — | | | | 28,419 | |
West Point Trade Center | | | 5,844 | | | | 2,925 | | | | 16,067 | | | | 368 | | | | 3,406 | | | | 390 | | | | — | | | | — | | | | 29,000 | | | | — | | | | 29,000 | |
Miramar I | | | 3,347 | | | | 1,000 | | | | 7,607 | | | | 716 | | | | 3,380 | | | | 950 | | | | — | | | | — | | | | 17,000 | | | | — | | | | 17,000 | |
Miramar II | | | 4,477 | | | | 1,142 | | | | 13,110 | | | | 827 | | | | 4,550 | | | | 1,373 | | | | — | | | | — | | | | 25,479 | | | | — | | | | 25,479 | |
5160 Hacienda Drive | | | 8,100 | | | | 740 | | | | 20,776 | | | | 1,693 | | | | 5,600 | | | | 1,591 | | | | — | | | | — | | | | 38,500 | | | | — | | | | 38,500 | |
10450 Pacific Center Court | | | 5,000 | | | | 724 | | | | 20,410 | | | | 1,061 | | | | 3,848 | | | | 1,707 | | | | — | | | | — | | | | 32,750 | | | | — | | | | 32,750 | |
225 Summit Avenue | | | 7,100 | | | | 978 | | | | 25,460 | | | | 2,240 | | | | 6,730 | | | | — | | | | (1,908 | ) | | | — | | | | 40,600 | | | | — | | | | 40,600 | |
One Wayside Road | | | 7,500 | | | | 517 | | | | 37,870 | | | | 2,442 | | | | 8,302 | | | | 351 | | | | (855 | ) | | | (602 | ) | | | 55,525 | | | | (26,766 | ) | | | 28,759 | |
100 Tice Blvd | | | 7,300 | | | | 1,048 | | | | 47,114 | | | | 2,231 | | | | 11,168 | | | | 2,476 | | | | — | | | | (3,737 | ) | | | 67,600 | | | | (42,435 | ) | | | 25,165 | |
Ten Parkway North | | | 3,500 | | | | 276 | | | | 15,764 | | | | 1,368 | | | | 2,868 | | | | 1,224 | | | | — | | | | — | | | | 25,000 | | | | — | | | | 25,000 | |
4701 Gold Spike Drive | | | 3,500 | | | | 381 | | | | 14,078 | | | | 95 | | | | 1,930 | | | | 316 | | | | — | | | | — | | | | 20,300 | | | | — | | | | 20,300 | |
1958 International Way | | | 2,200 | | | | 360 | | | | 10,707 | | | | 30 | | | | 1,303 | | | | 200 | | | | — | | | | — | | | | 14,800 | | | | — | | | | 14,800 | |
Summit Distribution Center | | | 2,300 | | | | 525 | | | | 9,199 | | | | 64 | | | | 1,168 | | | | 157 | | | | (13 | ) | | | — | | | | 13,400 | | | | — | | | | 13,400 | |
3660 Deerpark Blvd | | | 2,400 | | | | 418 | | | | 10,127 | | | | 64 | | | | 1,372 | | | | 919 | | | | — | | | | — | | | | 15,300 | | | | — | | | | 15,300 | |
Tolleson Commerce Park II | | | 2,200 | | | | 488 | | | | 4,981 | | | | 54 | | | | 923 | | | | 554 | | | | — | | | | — | | | | 9,200 | | | | — | | | | 9,200 | |
Pacific Corporate Park | | | 21,128 | | | | 43,218 | | | | 54,202 | | | | 13,611 | | | | 16,925 | | | | 852 | | | | (5,436 | ) | | | — | | | | 144,500 | | | | — | | | | 144,500 | |
100 Kimball Drive | | | 8,800 | | | | 1,237 | | | | 39,708 | | | | 2,869 | | | | 7,329 | | | | 307 | | | | — | | | | — | | | | 60,250 | | | | — | | | | 60,250 | |
| | | | | | | | | | | | | | | | | | | | | | | | | | | | | | | | | | | | | | | | | | | | |
| | $ | 115,687 | | | $ | 59,291 | | | $ | 421,339 | | | $ | 42,450 | | | $ | 99,439 | | | $ | 20,629 | | | $ | (9,200 | ) | | $ | (3,372 | ) | | $ | 746,263 | | | $ | (82,740 | ) | | $ | 663,523 | |
| | | | | | | | | | | | | | | | | | | | | | | | | | | | | | | | | | | | | | | | | | | | |
Building Improvements are depreciated over 39 years; Site Improvements are depreciated over 15 and 25 years; Tenant Improvements, Acquired In-Place Lease Value, Above Market Lease Value and Below Market Lease Value are amortized over the remaining lease terms at the time of acquisition.
F-21
CB RICHARD ELLIS REALTY TRUST
NOTES TO THE CONSOLIDATED FINANCIAL STATEMENTS—(Continued)
For the Years Ended December 31, 2010, 2009 and 2008
The following table summarizes the net assets transferred to the Duke joint venture on March 31, 2010 relating to the contribution of 100% ownership interest in Miramar I and II properties (in thousands):
| | | | | | | | | | | | | | | | | | | | | | | | | | | | |
Property | | Land | | | Site
Improvements | | | Building
Improvements | | | Tenant
Improvements | | | Acquired In-
Place Lease
Value | | | Above
Market
Lease
Value | | | Net Assets
Transferred | |
Miramar I | | $ | 3,347 | | | $ | 1,000 | | | $ | 7,607 | | | $ | 716 | | | $ | 3,380 | | | $ | 950 | | | $ | 17,000 | |
Miramar II | | | 4,477 | | | | 1,142 | | | | 13,110 | | | | 827 | | | | 4,550 | | | | 1,373 | | | | 25,479 | |
| | | | | | | | | | | | | | | | | | | | | | | | | | | | |
Total Assets | | | 7,824 | | | | 2,142 | | | | 20,717 | | | | 1,543 | | | | 7,930 | | | | 2,323 | | | | 42,479 | |
| | | | | | | | | | | | | | | | | | | | | | | | | | | | |
Accumulated Depreciation and Amortization | | | — | | | | (36 | ) | | | (133 | ) | | | (55 | ) | | | (284 | ) | | | (83 | ) | | | (591 | ) |
| | | | | | | | | | | | | | | | | | | | | | | | | | | | |
Net Assets | | $ | 7,824 | | | $ | 2,106 | | | $ | 20,584 | | | $ | 1,488 | | | $ | 7,646 | | | $ | 2,240 | | | $ | 41,888 | |
| | | | | | | | | | | | | | | | | | | | | | | | | | | | |
The contribution resulted in the deconsolidation of the Miramar I and Miramar II properties from our balance sheet on March 31, 2010 based on the contribution from consolidated subsidiaries to an unconsolidated investee entity, the Duke joint venture. As a result of the contribution, our investment in the Duke joint venture increased by $42,378,000 (inclusive of proration credits of $281,000 transferred to the Duke joint venture). We recorded a gain on the contribution of $154,000. Included in operations for the three months ended March 31, 2010, were revenues of $1,348,000 and operating expenses of $817,000. There were no comparable amounts of operations during the year ended December 31, 2009 as the two contributed properties were not acquired until December 31, 2009.
The following table summarizes the estimated fair values, less cost of sales, of the properties acquired during 2010 and designated as real estate held for sale at December 31, 2010 (in thousands):
| | | | |
Rickenbacker II | | $ | 8,600 | |
Rickenbacker III | | | 13,400 | |
| | | | |
Total | | $ | 22,000 | |
| | | | |
At such time, the Company presents the respective assets separately on the consolidated balance sheet, presents the revenue and expenses separately as discontinued operations on the consolidated statement of operations and it ceases to record depreciation and amortization expense. See Note 4 “Real Estate and Other Assets Held for Sale and Related Liabilities.”
Unaudited pro forma results, assuming the above noted acquisitions had occurred as of January 1, 2010 and January 1, 2009 for purposes of the 2010 and 2009 pro forma disclosures, respectively, are presented below. These unaudited pro forma results have been prepared for comparative purposes only and include certain adjustments, such as increased depreciation and amortization expenses as a result of tangible and intangible assets acquired in the acquisitions. These unaudited pro forma results do not purport to be indicative of what operating results would have been had the acquisitions occurred on January 1, 2010 and January 1, 2009, respectively, and may not be indicative of future operating results (dollars in thousands, except share data):
| | | | | | | | |
| | | Year Ended December 31, | |
| | | 2010 | | | 2009 | |
Revenue | | $ | 102,627 | | | $ | 98,583 | |
Operating Loss | | | (12,879 | ) | | | (15,075 | ) |
Net Loss | | | (6,768 | ) | | | (13,325 | ) |
Basic and Diluted Loss Per Share | | $ | (0.05 | ) | | $ | (0.16 | ) |
Weighted Average Shares Outstanding for Basic and Diluted Loss | | | 136,456,565 | | | | 81,367,593 | |
4. Real Estate and Other Assets Held for Sale and Related Liabilities
Real estate and other assets held for sale include real estate for sale in their present condition that have met all of the “held for sale” criteria of ASC 360 “Accounting for the Impairment or Disposal of Long-Lived Assets,” and other assets directly related to such projects. Liabilities related to real estate and other assets held for sale have been included as a single line item in the accompanying consolidated balance sheets. There were no real estate assets held for sale at December 31, 2009.
F-22
CB RICHARD ELLIS REALTY TRUST
NOTES TO THE CONSOLIDATED FINANCIAL STATEMENTS—(Continued)
For the Years Ended December 31, 2010, 2009 and 2008
Real estate and other assets held for sale and related liabilities as of December 31, 2010 (in thousands):
| | | | |
Assets | | | | |
Real estate held for sale | | $ | 22,000 | |
Current assets. | | | 56 | |
| | | | |
Total real estate and other assets held for | | | 22,056 | |
Liabilities | | | | |
Accounts payable and accrued | | | 441 | |
| | | | |
Total liabilities related to real estate and other assets held for | | | 441 | |
| | | | |
Net real estate and other assets held for | | $ | 21,615 | |
| | | | |
5. Investments in Unconsolidated Entities
Investments in unconsolidated entities at December 31, 2010 and December 31, 2009 consist of the following (in thousands):
| | | | | | | | |
| | | December 31, | |
| | | 2010 | | | 2009 | |
CBRE Strategic Partners Asia | | $ | 9,471 | | | $ | 8,142 | |
Duke Joint Venture | | | 306,264 | | | | 185,088 | |
Afton Ridge Joint Venture | | | 19,167 | | | | 20,867 | |
UK JV | | | 27,822 | | | | — | |
European JV | | | 47,338 | | | | — | |
| | | | | | | | |
| | $ | 410,062 | | | $ | 214,097 | |
| | | | | | | | |
The following is a summary of the investments in unconsolidated entities for the years ended December��31, 2010 and December 31, 2009 (in thousands):
| | | | | | | | |
| | | December 31, | |
| | | 2010 | | | 2009 | |
Investment Balance, January 1, | | $ | 214,097 | | | $ | 131,703 | |
Contributions | | | 278,079 | | | | 91,536 | |
Company Basis Adjustments | | | (617 | ) | | | 43 | |
Other Comprehensive Income (Loss) of Unconsolidated Entities | | | 4,271 | | | | (142 | ) |
Company’s Equity in Net Income (including adjustments for basis differences) | | | 8,838 | | | | 2,743 | |
Distributions | | | (94,606 | ) | | | (11,786 | ) |
| | | | | | | | |
Investment Balance, December 31, | | $ | 410,062 | | | $ | 214,097 | |
| | | | | | | | |
CBRE Strategic Partners Asia
We have agreed to a capital commitment of $20,000,000 in CBRE Strategic Partners Asia, which extends for 48 months (to January 31, 2012) after the close of the final capital commitment. As of December 31, 2010, we have contributed $15,040,000 of our capital commitment which was funded using net proceeds from our public offerings. CBRE Investors, our sponsor, formed CBRE Strategic Partners Asia to purchase, reposition, develop, hold for investment and sell institutional quality real estate and related assets in targeted markets in Asia, including China, Japan, India, South Korea, Hong Kong, Singapore and other Asia Pacific markets. The initial closing date of CBRE Strategic Partners Asia was in July 2007, with additional commitments being accepted through January 2008. CBRE Strategic Partners Asia closed on January 31, 2008, with aggregate capital commitments of $394,203,000. CBRE Strategic Partners Asia has an eight year term, which may be extended for up to two one-year periods with the approval of two-thirds of the limited partners.
F-23
CB RICHARD ELLIS REALTY TRUST
NOTES TO THE CONSOLIDATED FINANCIAL STATEMENTS—(Continued)
For the Years Ended December 31, 2010, 2009 and 2008
As of December 31, 2010, CBRE Strategic Partners Asia, with its parallel fund, CB Richard Ellis Strategic Asia II, L.P., had aggregate investor commitments of $394,203,000 from institutional investors including CBRE Investors. We own an ownership interest of approximately 5.07% in CBRE Strategic Partners Asia. As of December 31, 2010, CBRE Strategic Partners Asia had acquired ownership interests in ten properties, five in China and five in Japan. Two of the five ownership interests in China were sold in 2010. Our capital commitment is currently being pledged as collateral for borrowings of CBRE Strategic Partners Asia of which our pro-rata portion of such borrowing was approximately $218,000 and $5,208,000 based on our 5.07% ownership interest at December 31, 2010 and 2009.
On March 4, 2010, we received a distribution of net sales proceeds from CBRE Strategic Partners Asia totaling $2,435,000 from the February 23, 2010 sale of a residential property located in Beijing, China. Approximately $2,000,000 of the cash distributions in connection with the Beijing residential property sale are subject to recall and reinvestment into appropriate investments until the expiration of the CBRE Strategic Partners Asia commitment period on January 31, 2012.
On May 26, 2010, we received a distribution of net sales proceeds from CBRE Strategic Partners Asia totaling $3,146,000 from the sale of a joint venture interest in a mixed use project located in Tianjin, China. The cash distributions from this transaction are not subject to recall.
We carry our investment in CBRE Strategic Partners Asia on the equity method of accounting. Those investments where we have the ability to exercise significant influence (but not control) over operating and financial policies of such entities (including certain entities where we have less than 20% ownership) are accounted for using the equity method. Accordingly, our share of the earnings or losses of these equity method entities is included in consolidated net loss.
CBRE Strategic Partners Asia is a limited partnership that qualifies for specialized industry accounting for investment companies. Specialized industry accounting allows investment companies to carry their investments at fair value, with changes in the fair value of the investments recorded in the statement of operations. On the basis of the guidance in ASC 970-323, the Company accounts for its investment in CBRE Strategic Partners Asia under the equity method. As a result, and in accordance with ASC 810-10-25-15 the specialized accounting treatment, principally fair value basis, applied by CBRE Strategic Partners Asia under the investment company guide is retained in the recognition of equity method earnings in the statement of operations of the Company. See Note 18 “Fair Value of Financial Instruments and Investments” for further discussion of the application of the fair value accounting to our investment in CBRE Strategic Partners Asia.
Consolidated Balance Sheets of CBRE Strategic Partners Asia as of December 31, 2010 and 2009 (in thousands):
| | | | | | | | |
| | | December 31, | |
| | | 2010 | | | 2009 | |
Assets | | | | | | | | |
Real Estate | | $ | 237,645 | | | $ | 332,712 | |
Other Assets | | | 16,354 | | | | 11,224 | |
| | | | | | | | |
Total Assets | | $ | 253,999 | | | $ | 343,936 | |
| | | | | | | | |
Liabilities and Equity | | | | | | | | |
Notes Payable | | $ | 43,019 | | | $ | 68,686 | |
Loan Payable | | | 4,307 | | | | 102,716 | |
Other Liabilities | | | 17,630 | | | | 10,509 | |
| | | | | | | | |
Total Liabilities | | | 64,956 | | | | 181,911 | |
| | | | | | | | |
Company’s Equity | | | 9,471 | | | | 8,142 | |
Other Investors’ Equity | | | 179,572 | | | | 153,883 | |
| | | | | | | | |
Total Liabilities and Equity | | $ | 253,999 | | | $ | 343,936 | |
| | | | | | | | |
F-24
CB RICHARD ELLIS REALTY TRUST
NOTES TO THE CONSOLIDATED FINANCIAL STATEMENTS—(Continued)
For the Years Ended December 31, 2010, 2009 and 2008
Consolidated Statements of Operations of CBRE Strategic Partners Asia for the years ended December 31, 2010, 2009 and 2008 (in thousands):
| | | | | | | | | | | | |
| | | Year Ended December 31, | |
| | | 2010 | | | 2009 | | | 2008 | |
Total Revenues and Appreciation (Depreciation) | | $ | 29,329 | | | $ | 27,226 | | | $ | 1,427 | |
Total Expenses | | | 9,924 | | | | 12,680 | | | | 32,614 | |
| | | | | | | | | | | | |
Net Income (Loss) | | | 19,405 | | | | 14,546 | | | | (31,187 | ) |
| | | | | | | | | | | | |
Company’s Equity in Net Income (Loss) | | $ | 949 | | | $ | 803 | | | $ | (1,590 | ) |
| | | | | | | | | | | | |
Duke Joint Venture
On May 5, 2008, we entered into a contribution agreement with Duke Realty Limited Partnership (“Duke”), a subsidiary of Duke Realty Corporation (NYSE: DRE), to form the Duke joint venture to acquire $248,900,500 in industrial real property assets (the “Industrial Portfolio”). The Industrial Portfolio consists of six bulk industrial built-to-suit, fully leased properties. On September 12, 2008, we entered into a first amendment to the contribution agreement to acquire a fully leased office building for $37,111,000 and to increase and revise the total purchase commitment to $282,400,000. We own an 80% interest and Duke owns a 20% interest in the Duke joint venture.
On June 12, 2008, September 30, 2008 and December 10, 2008, the Duke joint venture acquired fee interests in seven properties pursuant to the contribution agreement. All of the properties acquired are new built-to-suit, 100% leased, single-tenant buildings that do not have an operating history. The Duke joint venture obtained financing from 40/86 Mortgage Capital, Inc. for each of the seven properties. The financings, totaling $150,000,000, carry an interest rate of 5.58%, a term of five years and are cross-collateralized among the properties. The seven buildings were completed in 2007 and 2008.
On May 13, 2009, the Duke joint venture acquired each of (i) 22535 Colonial Pkwy., located at 22535 Colonial Pkwy., Katy, TX, a suburb of Houston, (ii) Celebration Office Center III, located at 1390 Celebration Blvd., Celebration, FL, a suburb of Orlando, and (iii) Fairfield Distribution Ctr. IX located at 4543-4561 Oak Fair Blvd., Tampa FL. The Duke joint venture acquired 22535 Colonial Pkwy. for approximately $14,700,000, Celebration Office Center III for approximately $17,050,000 and Fairfield Distribution Ctr. IX for approximately $9,300,000, exclusive of customary closing costs. We made cash contributions totaling approximately $32,840,000 to the Duke joint venture in connection with these acquisitions. Upon closing, we paid the Investment Advisor a $493,000 acquisition fee.
On October 15, 2009, the Duke joint venture acquired Northpoint III, located at 3300 Exchange Place, Lake Mary, FL, a suburb of Orlando, for approximately $18,240,000, exclusive of customary closing costs and acquisition fees which were both expensed as incurred. We made cash contributions totaling approximately $14,592,000 to the Duke joint venture in connection with the acquisition.
On December 7, 2009, the Duke joint venture acquired Goodyear Crossing Ind. Park II, located at 16920 W. Commerce Drive, Goodyear, AZ, a suburb of Phoenix, for approximately $45,645,000, exclusive of customary closing costs and acquisition fees which were both expensed as incurred. We made cash contributions of approximately $36,516,000 to the Duke joint venture in connection with the acquisition.
On March 31, 2010, the Duke joint venture acquired 3900 North Paramount Parkway, 3900 South Paramount Parkway and 1400 Perimeter Park Drive in Morrisville, NC, a suburb of Raleigh, for approximately $35,250,000, exclusive of customary closing costs and acquisition fees which are both expensed as incurred. We made contributions of approximately $28,125,000 ($19,649,000 was made in cash and $8,476,000 in-kind as discussed below) to the Duke joint venture in connection with the acquisition.
On March 31, 2010, we contributed our Miramar I and Miramar II properties, located at 2300 and 2200 SW 145th Avenue in Miramar, FL, a suburb of Miami, to the Duke joint venture for approximately our cost of $42,650,000. Our cost of $42,650,000, of which $8,476,000 was considered an in-kind contribution by us to the Duke joint venture representing our 20% divestiture of the Miramar I and Miramar II properties, was part of a structured transaction as an offset to the $28,125,000 owed by us for our 80% share of the Duke joint venture’s purchase of 3900 North Paramount Parkway, 3900 South Paramount Parkway and 1400 Perimeter Park Drive.
F-25
CB RICHARD ELLIS REALTY TRUST
NOTES TO THE CONSOLIDATED FINANCIAL STATEMENTS—(Continued)
For the Years Ended December 31, 2010, 2009 and 2008
On August 24, 2010, the Duke joint venture closed on the acquisition of additional land and entered into a construction agreement and lease amendments (collectively, the “Expansion Agreements”) to expand the AllPoints at Anson Bldg. 1 property, a warehouse/distribution center located in Whitestown, IN, a suburb of Indianapolis. The existing property is 100% leased to a subsidiary of Amazon.com through July 2018. Pursuant to the Expansion Agreements, AllPoints at Anson Bldg. 1 (i) will be expanded from the current 630,573 square feet to approximately 1,036,573 square feet and (ii) will remain 100% leased to a subsidiary of Amazon.com, which lease will be extended through April 2021. The total cost of the expansion is anticipated to be approximately $16,900,000 to the Duke joint venture. As of December 31, 2010, the Duke joint venture had incurred land acquisition and construction costs totaling approximately $13,485,000. We expect to make cash contributions of approximately $13,541,000 to the Duke joint venture over the construction period in connection with the Expansion Agreements.
On November 24, 2010, the Duke joint venture, through certain of its subsidiaries, entered into a $92,000,000 mortgage loan with Metropolitan Life Insurance Company. Our pro rata share of this mortgage is $73,600,000 based on our 80% ownership of the Duke joint venture. This mortgage carries a fixed interest rate of 4.25%, a term of five years, is secured on a cross-collateralized basis by nine of the Duke joint venture’s properties (22535 Colonial Pkwy, Celebration Office Center, Northpoint III, Goodyear Crossing Ind. Park II, 3900 North Paramount Parkway, 3900 South Paramount Parkway, 1400 Perimeter Park Drive, Miramar I and Miramar II) and may be prepaid subject to the satisfaction of certain conditions.
On December 17, 2010, the Duke joint venture entered into a purchase and sale agreement (the “Purchase Agreement”) with Duke, Duke Secured Financing 2009-1PAC, LLC and Duke Realty Ohio, affiliates of Duke, for the acquisition of up to $516,650,000 in office real property assets (the “Office Portfolio”). The Office Portfolio consists of 20 office properties (each a “Property” and together the “Properties”) that are expected to be contributed to the Duke Joint Venture in three separate tranches.
On December 21, 2010, the Duke joint venture acquired fee interests in the first tranche of the Office Portfolio by acquiring seven properties for $173,850,000, exclusive of closing costs and acquisition fees which were both expensed as incurred. We made a cash contribution of approximately $139,080,000 to the Duke joint venture in connection with the closing of the first tranche.
F-26
CB RICHARD ELLIS REALTY TRUST
NOTES TO THE CONSOLIDATED FINANCIAL STATEMENTS—(Continued)
For the Years Ended December 31, 2010, 2009 and 2008
The following table provides further detailed information concerning the properties held in the Duke joint venture at December 31, 2010:
| | | | | | | | | | | | | | | | | | | | | | | | | | | | |
Property and Market | | Property
Type | | Net
Rentable
Square
Feet | | | Tenant | | Lease
Expiration | | | Approximate
Purchase
Price(1) | | | Pro Rata
Share of
Approximate
Purchase
Price(2) | | | Approximate
Debt
Financing | | | Acquisition
Fee(3) | |
Buckeye Logistics Center/ Phoenix, AZ | | Warehouse/ Distribution | | | 604,678 | | | Amazon.com(5) | | | 06/2018 | | | $ | 43,601,000 | | | $ | 34,880,800 | | | $ | 20,000,000 | | | $ | 349,000 | |
201 Sunridge Blvd./Dallas, TX | | Warehouse/ Distribution | | | 822,550 | | | Unilever(4) | | | 09/2018 | | | | 31,626,000 | | | | 25,300,800 | | | | 19,400,000 | | | | 253,000 | |
12200 President’s Court/ Jacksonville, FL | | Warehouse/ Distribution | | | 772,210 | | | Unilever(4) | | | 09/2018 | | | | 36,956,000 | | | | 29,564,800 | | | | 21,600,000 | | | | 296,000 | |
AllPoints at Anson Bldg. 1/ Indianapolis, IN | | Warehouse/ Distribution | | | 630,573 | | | Amazon.com(4) | | | 07/2018 | | | | 33,401,000 | | | | 26,720,800 | | | | 17,000,000 | | | | 267,000 | |
Aspen Corporate Center 500/Nashville, TN | | Office | | | 180,147 | | | Verizon Wireless(6) | | | 10/2018 | | | | 37,111,000 | | | | 29,688,800 | | | | 21,200,000 | | | | 297,000 | |
125 Enterprise Parkway/Columbus, OH | | Warehouse/ Distribution | | | 1,142,400 | | | Kellogg’s | | | 03/2019 | | | | 47,905,000 | | | | 38,324,000 | | | | 26,800,000 | | | | 383,000 | |
AllPoints Midwest Bldg. 1/ Indianapolis, IN | | Warehouse/ Distribution | | | 1,200,420 | | | Prime Distribution | | | 05/2019 | | | | 51,800,000 | | | | 41,440,000 | | | | 24,000,000 | | | | 414,000 | |
22535 Colonial Pkwy./ Houston, TX | | Office | | | 89,750 | | | Det Norske Veritas | | | 06/2019 | | | | 14,700,000 | | | | 11,760,000 | | | | 8,500,000 | | | | 176,000 | |
Celebration Office Center III/ Orlando, FL | | Office | | | 100,924 | | | Disney Vacation Development | | | 04/2016 | | | | 17,050,000 | | | | 13,640,000 | | | | 9,500,000 | | | | 205,000 | |
Fairfield Distribution Ctr. IX/ Tampa, FL | | Warehouse/ Distribution | | | 136,212 | | | Iron Mountain | | | 08/2025 | | | | 9,300,000 | | | | 7,440,000 | | | | — | | | | 112,000 | |
Northpoint III/Orlando, FL | | Office | | | 108,499 | | | Florida Power Corporation | | | 10/2021 | | | | 18,240,000 | | | | 14,592,000 | | | | 11,000,000 | | | | 219,000 | |
Goodyear Crossing Ind. Park II/ Phoenix, AZ | | Warehouse/ Distribution | | | 820,384 | | | Amazon.com(5) | | | 09/2019 | | | | 45,645,000 | | | | 36,516,000 | | | | 21,000,000 | | | | 548,000 | |
3900 N. Paramount Pkwy. / Raleigh, NC | | Office | | | 100,987 | | | PPD Development | | | 11/2023 | | | | 13,970,000 | | | | 11,176,000 | | | | 8,250,000 | | | | 168,000 | |
3900 S. Paramount Pkwy. / Raleigh, NC | | Office | | | 119,170 | | | PPD Development/ LSSI | | | 11/2023 | | | | 16,319,000 | | | | 13,055,000 | | | | 8,250,000 | | | | 196,000 | |
1400 Perimeter Park Drive / Raleigh, NC | | Office | | | 44,916 | | | PPD Development | | | 11/2023 | | | | 4,962,000 | | | | 3,969,600 | | | | 2,500,000 | | | | 60,000 | |
Miramar I/ Miami, FL(7) | | Office | | | 94,060 | | | DeVry | | | 11/2017 | | | | 17,056,000 | | | | 13,644,800 | | | | 9,800,000 | | | | — | |
Miramar II/ Miami, FL(7) | | Office | | | 128,540 | | | Royal Caribbean | | | 05/2016 | | | | 26,124,000 | | | | 20,899,200 | | | | 13,200,000 | | | | — | |
McAuley Place / Cincinnati, OH | | Office | | | 190,733 | | | Mercy Health(9)(10) Partners of South West Ohio | | | 08/2023 | | | | 35,000,000 | | | | 28,000,000 | | | | — | | | | 420,000 | |
Easton III / Columbus, OH | | Office | | | 135,485 | | | Lane Bryant(9)(11) | | | 01/2019 | | | | 18,000,000 | | | | 14,400,000 | | | | — | | | | 216,000 | |
Point West I / Dallas, TX | | Office | | | 182,700 | | | American Home(9)(12) Mortgage Services, Inc. | | | 12/2016 | | | | 29,500,000 | | | | 23,600,000 | | | | — | | | | 354,000 | |
Sam Houston Crossing I / Houston, TX | | Office | | | 159,175 | | | AMEC Paragon, Inc.(9)(13) | | | 05/2018 | | | | 25,500,000 | | | | 20,400,000 | | | | — | | | | 306,000 | |
Regency Creek I / Raleigh, NC | | Office | | | 122,087 | | | ABB, Inc.(9)(14) | | | 08/2017 | | | | 22,500,000 | | | | 18,000,000 | | | | — | | | | 270,000 | |
533 Maryville Centre / St. Louis, MO | | Office | | | 125,296 | | | Eveready Battery Company, Inc.(9)(15) | | | 04/2021 | | | | 23,878,000 | | | | 19,102,400 | | | | — | | | | 287,000 | |
555 Maryville Centre / St. Louis, MO | | Office | | | 127,082 | | | Eveready Battery Company, Inc.(9)(15) | | | 04/2021 | | | | 19,472,000 | | | | 15,577,600 | | | | — | | | | 234,000 | |
| | | | | | | | | | | | | | | | | | | | | | | | | | | | |
| | | | | | | | | | | | | | $ | 639,615,000 | | | $ | 511,692,600 | | | $ | 242,000,000 | | | $ | 6,030,000 | |
| | | | | | | | | | | | | | | | | | | | | | | | | | | | |
| (1) | Approximate total purchase price, exclusive of closing costs, paid by the Duke joint venture for each of these properties. |
| (2) | Pro rata share of approximate purchase price is at our pro rata share of effective ownership for each of these properties, which was funded using net proceeds of our public offerings. |
| (3) | Acquisition fees paid to our Investment Advisor are included in the total acquisition cost for the properties acquired prior to January 1, 2009, but are included as acquisition expenses for properties acquired subsequent to December 31, 2008. |
F-27
CB RICHARD ELLIS REALTY TRUST
NOTES TO THE CONSOLIDATED FINANCIAL STATEMENTS—(Continued)
For the Years Ended December 31, 2010, 2009 and 2008
| (4) | Our tenant CONOPCO, Inc. is a wholly-owned subsidiary of Unilever United States, Inc., which is wholly-owned by Unilever N.V. and Unilever PLC, together Unilever. |
| (5) | Our tenants Amazon.com.indc, LLC, Amazon.com.axdc, Inc. and Amazon.com.azdc, Inc. are wholly-owned subsidiaries of Amazon.com. AllPoints at Anson Bldg. 1, Buckeye Logistics Center and Goodyear Crossing Ind. Park II are three of Amazon’s largest fulfillment centers in North America. |
| (6) | Our tenant Cellco Partnership does business as Verizon Wireless. |
| (7) | Consolidated properties acquired on December 31, 2009 and contributed to the Duke joint venture on March 31, 2010. |
| (8) | Excludes costs associated with the Expansion Agreements. |
| (9) | This tenant is the tenant that currently occupies more than 50,000 of net rentable square feet. |
| (10) | Mercy Health Partners of South West Ohio is a healthcare system comprised of five hospitals and 38 physician practices serving the greater Cincinnati, Ohio area. |
| (11) | Lane Bryant, a division of Charming Shoppes, Inc. (NASDAQ:CHRS), is a chain of women’s retail clothing stores with over 850 stores in 48 states. |
| (12) | American Home Mortgage Services, Inc. is one of the country’s largest servicers of Alt-A and subprime loans on behalf of banks and other investors. |
| (13) | AMEC Paragon, Inc. is a provider of project management and engineering services to the oil and gas industry. |
| (14) | ABB, Inc. is a leader in power and automation technologies for utility and industrial customers. |
| (15) | Eveready Battery Company, Inc. is a division of Energizer Holdings, Inc. (NYSE:ENR), which manufactures batteries and lighting products. |
As of December 31, 1010, the Duke joint venture has purchased approximately $639,615,000 of assets, since inception, exclusive of acquisition fees and closing costs, and holds interests in 24 properties, six located in Florida, four each located in North Carolina and Texas, three located in Ohio, two each located in Arizona, Indiana and Missouri and one in Tennessee.
We entered into an operating agreement for the Duke joint venture with Duke on June 12, 2008. Duke acts as the managing member of the Duke joint venture and is entitled to receive fees in connection with the services it provides to the Duke joint venture, including asset management, construction, development, leasing and property management services. Duke is also entitled to a promoted interest in the Duke joint venture. We have joint approval rights over all major policy decisions.
On December 17, 2010 in connection with the entry into of the Purchase Agreement for the Office Portfolio, we entered into an amended and restated operating agreement for the Duke joint venture. The amended and restated operating agreement generally contains the same terms and conditions as the operating agreement dated June 12, 2008 described above, except for the following material changes: (i) Duke has granted us a call option to acquire Duke’s entire interest in the Duke joint venture which such interest shall be valued based on the opinions of qualified appraisers and which we can elect to exercise anytime after June 30, 2012 upon the occurrence and adoption by resolution of certain triggering events and (ii) the Duke joint venture has certain rights to participate in the development of certain adjacent and nearby parcels of land currently owned by Duke.
For a period of three years from the date of the initial operating agreement, the Duke joint venture will have the right to acquire additional newly developed bulk industrial built-to-suit properties from Duke if such properties satisfy certain specified conditions. We will retain the right to approve the acquisition and purchase price of each such property.
We carry our investment in the Duke joint venture on the equity method of accounting because it is an entity under common control with Duke. Those investments where we have the ability to exercise significant influence (but not control) over operating and financial policies of such entities are accounted for using the equity method. We eliminate transactions with such equity method subsidiaries to the extent of our ownership in such entities.
For a detailed description of the properties held by the Duke joint venture as of March 30, 2011, see Note 23 “Subsequent Events.”
F-28
CB RICHARD ELLIS REALTY TRUST
NOTES TO THE CONSOLIDATED FINANCIAL STATEMENTS—(Continued)
For the Years Ended December 31, 2010, 2009 and 2008
Consolidated Balance Sheet of the Duke joint venture as of December 31, 2010 (in thousands):
| | | | | | | | | | | | |
| | | December 31,
2010 | | | REIT Basis
Adjustments(1) | | | Total | |
Assets | | | | | | | | | | | | |
Real Estate Net | | $ | 535,992 | | | $ | 2,171 | | | $ | 538,163 | |
Other Assets | | | 96,820 | | | | — | | | | 96,820 | |
| | | | | | | | | | | | |
Total Assets | | $ | 632,812 | | | $ | 2,171 | | | $ | 634,983 | |
| | | | | | | | | | | | |
Liabilities and Equity | | | | | | | | | | | | |
Notes Payable | | $ | 242,000 | | | | — | | | $ | 242,000 | |
Other Liabilities | | | 10,696 | | | | — | | | | 10,696 | |
| | | | | | | | | | | | |
Total Liabilities | | | 252,696 | | | | — | | | | 252,696 | |
| | | | | | | | | | | | |
Company’s Equity | | | 304,093 | | | | 2,171 | | | | 306,264 | |
Other Investor’s Equity | | | 76,023 | | | | — | | | | 76,023 | |
| | | | | | | | | | | | |
Total Liabilities and Equity | | $ | 632,812 | | | $ | 2,171 | | | $ | 634,983 | |
| | | | | | | | | | | | |
| (1) | REIT Basis Adjustments include those costs incurred by the Company outside of the Duke joint venture that are directly capitalizable to its investment in real estate assets acquired within the Duke joint venture including acquisition costs paid to our Investment Advisor prior to January 1, 2009. Thereafter such acquisition fees were expensed as incurred. |
Consolidated Balance Sheet of the Duke joint venture as of December 31, 2009 (in thousands):
| | | | | | | | | | | | |
| | | December 31,
2009 | | | REIT Basis
Adjustments(1) | | | Total | |
Assets | | | | | | | | | | | | |
Real Estate Net | | $ | 339,746 | | | $ | 2,906 | | | $ | 342,652 | |
Other Assets | | | 41,979 | | | | — | | | | 41,979 | |
| | | | | | | | | | | | |
Total Assets | | $ | 381,725 | | | $ | 2,906 | | | $ | 384,631 | |
| | | | | | | | | | | | |
Liabilities and Equity | | | | | | | | | | | | |
Notes Payable | | $ | 150,000 | | | | — | | | $ | 150,000 | |
Other Liabilities | | | 4,295 | | | | — | | | | 4,295 | |
| | | | | | | | | | | | |
Total Liabilities | | | 154,295 | | | | — | | | | 154,295 | |
| | | | | | | | | | | | |
Company’s Equity | | | 182,182 | | | | 2,906 | | | | 185,088 | |
Other Investor’s Equity | | | 45,248 | | | | — | | | | 45,248 | |
| | | | | | | | | | | | |
Total Liabilities and Equity | | $ | 381,725 | | | $ | 2,906 | | | $ | 384,631 | |
| | | | | | | | | | | | |
| (1) | REIT Basis Adjustments include those costs incurred by the Company outside of the Duke joint venture that are directly capitalizable to its investment in real estate assets acquired within the Duke joint venture including acquisition costs paid to our Investment Advisor prior to January 1, 2009. Thereafter such acquisition fees were expensed as incurred. |
F-29
CB RICHARD ELLIS REALTY TRUST
NOTES TO THE CONSOLIDATED FINANCIAL STATEMENTS—(Continued)
For the Years Ended December 31, 2010, 2009 and 2008
Consolidated Statement of Operations of the Duke joint venture for the year ended December 31, 2010, 2009 and for the period June 12, 2008 through December 31, 2008 (in thousands);
| | | | | | | | | | | | |
| | | For the Year Ended
December 31, 2010 | | | For the Year Ended
December 31, 2009 | | | For the Period
June 12, 2008 Through
December 31, 2008 | |
Total Revenues | | $ | 47,595 | | | $ | 29,309 | | | $ | 5,307 | |
Operating Expenses | | | 10,684 | | | | 5,974 | | | | 755 | |
Interest | | | 8,893 | | | | 8,576 | | | | 1,612 | |
Depreciation and Amortization | | | 18,893 | | | | 12,715 | | | | 2,664 | |
| | | | | | | | | | | | |
Net Income | | $ | 9,125 | | | $ | 2,044 | | | $ | 276 | |
| | | | | | | | | | | | |
Company’s Share in Net Income | | $ | 7,063 | | | $ | 1,817 | | | $ | 276 | |
Adjustments for Company Basis | | | (118 | ) | | | (138 | ) | | | (28 | ) |
| | | | | | | | | | | | |
Company’s Equity in Net Income | | $ | 6,945 | | | $ | 1,679 | | | $ | 248 | |
| | | | | | | | | | | | |
Afton Ridge Joint Venture
On September 18, 2008, we acquired a 90% ownership interest in Afton Ridge, the owner of Afton Ridge Shopping Center, from unrelated third parties. CK Afton Ridge Shopping Center, LLC, a subsidiary of Childress Klein Properties, Inc. (“CK Afton Ridge”), retained a 10% ownership interest in Afton Ridge and continues to manage Afton Ridge Shopping Center. CK Afton Ridge acts as the managing member of Afton Ridge and is entitled to receive fees, including management, construction management and property management fees. We have joint approval rights over all major policy decisions.
Afton Ridge Shopping Center is located at the intersection of I-85 and Kannapolis Parkway, in Kannapolis, North Carolina. We acquired our ownership interest in Afton Ridge for approximately $45,000,000, exclusive of customary closing costs, which was funded using net proceeds from our initial public offering. Upon closing, we paid our Investment Advisor an acquisition fee of approximately $450,000. This acquisition fee is not included in the $45,000,000 total acquisition cost of Afton Ridge, but is included as additional cost basis at our wholly-owned investment subsidiary.
The purchase agreement with the seller contained a two year master lease agreement whereby rental revenues were guaranteed by the seller on the 9% unoccupied space at the date of the acquisition up to a maximum of $1,102,000. In addition, leasing commissions and tenant improvement allowances were to be reimbursed under the purchase agreement up to $934,000 over the same two year period for leasing activities incurred by Afton Ridge to lease this unoccupied space. During the quarter ended December 31, 2010, we reached agreement with CK Afton Ridge as to the final payout under the master lease agreement. As of December 31, 2010 and 2009, $842,000 and $601,000 in rental revenue guarantee payments and $923,000 and $517,000 in leasing commission and tenant reimbursement payments, respectively, have been received by Afton Ridge and treated as purchase price adjustments in the period when the contingency was resolved on the Afton Ridge standalone financial statements. Our pro rata share of such purchase price adjustments have been treated as a reduction of our investment in Afton Ridge.
Afton Ridge Shopping Center is a 470,288 square foot regional shopping center, completed in 2006, in which Afton Ridge owns 296,388 rentable square feet that is currently 95% leased. One of the shopping center’s anchors, a 173,900 square foot SuperTarget, is not owned by us. Additional anchor tenants in Afton Ridge Shopping Center are Best Buy, Marshalls, PetSmart, Dick’s Sporting Goods, Stein Mart and Ashley Furniture. Afton Ridge Shopping Center is the retail component of a 260 acre master planned mixed-use development.
On October 15, 2008, Afton Ridge obtained a $25,500,000 loan from the Metropolitan Life Insurance Company, secured by the Afton Ridge Shopping Center originally acquired on September 18, 2008. The loan is for a term of five years, plus a 12 month extension option, and bears interest at a fixed rate of 5.70%. Interest payments only are due monthly for the term of the loan with principal due at maturity.
We carry our investment in Afton Ridge on the equity method of accounting because it is an entity under common control with CK Afton Ridge. Those investments where we have the ability to exercise significant influence (but not control) over operating and financial policies of such entities are accounted for using the equity method. We eliminate transactions with such equity investees to the extent of our ownership in such entities.
F-30
CB RICHARD ELLIS REALTY TRUST
NOTES TO THE CONSOLIDATED FINANCIAL STATEMENTS—(Continued)
For the Years Ended December 31, 2010, 2009 and 2008
Consolidated Balance Sheet of Afton Ridge as of December 31, 2010 (in thousands):
| | | | | | | | | | | | |
| | | December 31,
2010 | | | REIT Basis
Adjustments(1) | | | Total | |
Assets | | | | | | | | | | | | |
Real Estate Net | | $ | 45,943 | | | $ | 603 | | | $ | 46,546 | |
Other Assets | | | 3,458 | | | | — | | | | 3,458 | |
| | | | | | | | | | | | |
Total Assets | | $ | 49,401 | | | $ | 603 | | | $ | 50,004 | |
| | | | | | | | | | | | |
Liabilities and Equity | | | | | | | | | | | | |
Note Payable | | $ | 25,500 | | | $ | — | | | $ | 25,500 | |
Other Liabilities | | | 3,274 | | | | — | | | | 3,274 | |
| | | | | | | | | | | | |
Total Liabilities | | | 28,774 | | | | — | | | | 28,774 | |
| | | | | | | | | | | | |
Company’s Equity | | | 18,564 | | | | 603 | | | | 19,167 | |
Other Investor’s Equity | | | 2,063 | | | | — | | | | 2,063 | |
| | | | | | | | | | | | |
Total Liabilities and Equity | | $ | 49,401 | | | $ | 603 | | | $ | 50,004 | |
| | | | | | | | | | | | |
| (1) | REIT Basis Adjustments include those costs incurred outside of Afton Ridge that are directly capitalizable to its investment in real estate assets acquired within Afton Ridge including acquisition costs paid to our Investment Advisor prior to January 1, 2009. Thereafter such acquisitions fees were expensed as incurred. |
Consolidated Balance Sheet of Afton Ridge as of December 31, 2009 (in thousands):
| | | | | | | | | | | | |
| | | December 31,
2009 | | | REIT Basis
Adjustments(1) | | | Total | |
Assets | | | | | | | | | | | | |
Real Estate Net | | $ | 47,743 | | | $ | 623 | | | $ | 48,366 | |
Other Assets | | | 4,073 | | | | — | | | | 4,073 | |
| | | | | | | | | | | | |
Total Assets | | $ | 51,816 | | | $ | 623 | | | $ | 52,439 | |
| | | | | | | | | | | | |
Liabilities and Equity | | | | | | | | | | | | |
Note Payable | | $ | 25,500 | | | $ | — | | | $ | 25,500 | |
Other Liabilities | | | 3,822 | | | | — | | | | 3,822 | |
| | | | | | | | | | | | |
Total Liabilities | | | 29,322 | | | | — | | | | 29,322 | |
| | | | | | | | | | | | |
Company’s Equity | | | 20,244 | | | | 623 | | | | 20,867 | |
Other Investor’s Equity | | | 2,250 | | | | — | | | | 2,250 | |
| | | | | | | | | | | | |
Total Liabilities and Equity | | $ | 51,816 | | | $ | 623 | | | $ | 52,439 | |
| | | | | | | | | | | | |
| (1) | REIT Basis Adjustments include those costs incurred by the Company outside of Afton Ridge that are directly capitalizable to its investment in real estate assets acquired within Afton Ridge including acquisition costs paid to our Investment Advisor prior to January 1, 2009. Thereafter such acquisitions fees were expensed as incurred. |
F-31
CB RICHARD ELLIS REALTY TRUST
NOTES TO THE CONSOLIDATED FINANCIAL STATEMENTS—(Continued)
For the Years Ended December 31, 2010, 2009 and 2008
Consolidated Statements of Operations of Afton Ridge for the year end December 31, 2010, 2009 for the period September 18, 2008 through December 31, 2008 (in thousands);
| | | | | | | | | | | | |
| | | For the Year Ended
December 31, 2010 | | | For the Year Ended
December 31, 2009 | | | For the Period
September 18, 2008
Through
December 31, 2008 | |
Total Revenues | | $ | 5,043 | | | $ | 4,991 | | | $ | 1,333 | |
Operating Expenses | | | 1,265 | | | | 1,260 | | | | 373 | |
Interest | | | 1,503 | | | | 1,504 | | | | 320 | |
Depreciation and Amortization | | | 1,815 | | | | 1,916 | | | | 522 | |
| | | | | | | | | | | | |
Net Income | | $ | 460 | | | $ | 311 | | | $ | 118 | |
| | | | | | | | | | | | |
Company’s Share in Net Income | | $ | 414 | | | $ | 280 | | | $ | 106 | |
Adjustments for REIT Basis | | | (20 | ) | | | (20 | ) | | | (6 | ) |
| | | | | | | | | | | | |
Company’s Equity in Net Income | | $ | 394 | | | $ | 260 | | | $ | 100 | |
| | | | | | | | | | | | |
UK JV and European JV
On June 10, 2010, we entered into two joint ventures with subsidiaries of the Goodman Group (ASX: GMG), or Goodman, one of which will seek to invest in logistics focused warehouse/distribution properties in the United Kingdom, or the UK JV, and the other which will seek to invest in logistics focused warehouse/distribution properties in France, Belgium, the Netherlands, Luxembourg and Germany, or the European JV. We own an 80% interest in each joint venture and Goodman owns a 20% interest in each joint venture. The terms of each joint venture are described in more detail below.
UK JV
The shareholders’ agreement pertaining to the UK JV is by and among RT Princeton UK Holdings, LLC (our wholly-owned subsidiary), Goodman Jersey Holding Trust and Goodman Princeton Holdings (Jersey) Limited, the UK JV, for the purpose of acquiring and holding, either directly or indirectly, up to £400,000,000 in logistics focused warehouse/distribution properties. On June 10, 2010, we initially funded the UK JV with capital contributions of $26,180,000. The UK JV has acquired an initial portfolio of two properties, as described further in the table below, which were previously owned by a subsidiary of Goodman and which were purchased by the UK JV simultaneously with the closing of the UK JV.
| | | | | | | | | | | | | | | | | | | | | | | | | | | | |
Property and Market | | Year
Built | | | Property Type | | | Tenant | | | Net
Rentable
Sq. Feet | | | Percentage
Leased | | | Lease
Expiration | | | Approximate
Total
Acquisition Cost
(in thousands) | |
Amber Park,
South Normanton, UK | | | 1997 | | | | Warehouse/Distribution | | | | UniDrug Distribution Group | | | | 208,423 | | | | 100 | % | | | 3/2017 | | | $ | 15,642 | |
Brackmills,
Northampton, UK | | | 1984 | | | | Warehouse/Distribution | | | | GE Lighting Operations Limited | | | | 186,618 | | | | 100 | % | | | 3/2017 | | | $ | 16,759 | |
The initial investment term of the UK JV is three years. A board of directors, comprised of members representing us and Goodman, in each case with an equal number of votes, has the responsibility for the supervision, management and major operating decisions of the UK JV and its business, except with respect to certain reserved matters which will require the unanimous approval of us and Goodman.
During the investment period, the UK JV has a right of first offer, with respect to certain logistics development or logistics investment assets considered for investment in the UK by Goodman or us. If a deadlock has arisen pertaining to a major decision regarding a specific property, either shareholder may exercise a buy-sell option in relation to the relevant property. After the initial investment period, either shareholder wishing to exit the UK JV may exercise a buy-sell option with respect to their entire interest in the UK JV.
The UK JV will pay certain fees to certain Goodman subsidiaries in connection with the services they provide to the UK JV, including but not limited to investment advisory, development management and property management services. Goodman may also be entitled to a promoted interest in the UK JV.
F-32
CB RICHARD ELLIS REALTY TRUST
NOTES TO THE CONSOLIDATED FINANCIAL STATEMENTS—(Continued)
For the Years Ended December 31, 2010, 2009 and 2008
Consolidated Balance Sheet of UK JV as of December 31, 2010 (in thousands):
| | | | |
| | | December 31,
2010 | |
Assets | | | | |
Real Estate Net | | $ | 34,092 | |
Other Assets | | | 1,623 | |
| | | | |
Total Assets | | $ | 35,715 | |
| | | | |
| |
Liabilities and Equity | | | | |
Other Liabilities | | $ | 938 | |
| | | | |
Total Liabilities | | | 938 | |
| | | | |
Company’s Equity | | | 27,822 | |
Other Investor’s Equity | | | 6,955 | |
| | | | |
Total Liabilities and Equity | | $ | 35,715 | |
| | | | |
Consolidated Statements of Operations of UK JV for the period June 10, 2010 through December 31, 2010 (in thousands); there were no activities in 2009:
| | | | |
| | | For the Period
June 10, 2010
Through
December 31, 2010 | |
Total Revenues | | $ | 1,832 | |
Operating Expenses | | | 601 | |
Depreciation and Amortization | | | 810 | |
| | | | |
Net Income | | $ | 421 | |
| | | | |
Company’s Equity in Net Income | | $ | 337 | |
| | | | |
European JV
The shareholders’ agreement pertaining to the European JV is by and among RT Princeton CE Holdings, LLC (our wholly-owned subsidiary), Goodman Europe Development Trust acting by its trustee Goodman Europe Development Pty Ltd. and Goodman Princeton Holdings (LUX) S.À.R.L., the European JV, for the purpose of acquiring and holding, either directly or indirectly, up to€ 400,000,000 in logistics focused warehouse/ distribution properties. On June 10, 2010, we initially funded the European JV with capital contributions of $26,802,000. The European JV acquired an initial portfolio of two properties, Duren and Schönberg, which were previously owned by a subsidiary of Goodman and which were purchased by the European JV simultaneously with the closing of the European JV.
On October 28, 2010 we contributed an additional capital contribution of $18,672,000 to the European JV to acquire Langenbach which was also previously owned by subsidiary of Goodman.
| | | | | | | | | | | | | | | | | | | | | | | | |
Property and Market | | Year
Built | | | Property Type | | Tenant | | Net
Rentable
Sq. Feet | | | Percentage
Leased | | | Lease
Expiration | | | Approximate
Total
Acquisition Cost
(in thousands) | |
Düren, Düren
Germany | | | 2008 | | | Warehouse/Distribution | | Metsä Tissue GmbH | | | 391,494 | | | | 100 | % | | | 01/2013 | | | $ | 16,435 | |
Schönberg, Schönberg,
Germany | | | 2009 | | | Warehouse/Distribution | | LK Logistik GmbH | | | 453,979 | | | | 100 | % | | | 05/2017 | | | $ | 17,274 | |
Langenbach, Munich,
Germany | | | 2010 | | | Warehouse/Distribution | | DSV Stuttgart GmbH & Co. KG | | | 225,106 | | | | 100 | % | | | 07/2015 | | | $ | 23,216 | |
F-33
CB RICHARD ELLIS REALTY TRUST
NOTES TO THE CONSOLIDATED FINANCIAL STATEMENTS—(Continued)
For the Years Ended December 31, 2010, 2009 and 2008
The initial investment term of the European JV is three years. A board of directors, comprised of members representing us and Goodman, in each case with an equal number of votes, has the responsibility for the supervision, management and major operating decisions of the European JV and its business, except with respect to certain reserved matters which will require the unanimous approval of us and Goodman.
During the investment period, the European JV has a right of second offer (after another investment vehicle managed by Goodman) with respect to certain logistics development or logistics investment assets considered for investment by Goodman, and has a right of first offer with respect to certain logistics development or logistics investment assets considered for investment by us. If a deadlock has arisen pertaining to a major decision regarding a specific property, either shareholder may exercise a buy-sell option in relation to the relevant property. After the initial investment period, either shareholder wishing to exit the European JV may exercise a buy-sell option with respect to their entire interest in the European JV. The European JV will pay certain fees to certain Goodman subsidiaries in connection with the services they provide to the European JV, including but not limited to investment advisory, development management and property management services. Certain Goodman subsidiaries may also be entitled to a promoted interest in the European JV.
Consolidated Balance Sheet of European JV as of December 31, 2010 (in thousands):
| | | | |
| | | December 31,
2010 | |
Assets | | | | |
Real Estate Net | | $ | 58,614 | |
Other Assets | | | 4,355 | |
| | | | |
Total Assets | | $ | 62,969 | |
| | | | |
Liabilities and Equity | | | | |
Other Liabilities | | $ | 3,797 | |
| | | | |
Total Liabilities | | | 3,797 | |
| | | | |
Company’s Equity | | | 47,338 | |
Other Investor’s Equity | | | 11,834 | |
| | | | |
Total Liabilities and Equity | | $ | 62,969 | |
| | | | |
Consolidated Statements of Operations of European JV for the period June 10, 2010 through December 31, 2010 (in thousands); there were no activities in 2009:
| | | | |
| | | For the Period
June 10, 2010
Through
December 31, 2010 | |
Total Revenues | | $ | 2,461 | |
Operating Expenses | | | 819 | |
Depreciation and Amortization | | | 1,376 | |
| | | | |
Net Income | | $ | 266 | |
| | | | |
Company’s Equity in Net Income | | $ | 213 | |
| | | | |
6. Acquisition Related Intangible Assets
Our acquisition related intangible assets are included in the consolidated balance sheets as acquired in-place lease value, acquired above market lease value and acquired below market lease value.
F-34
CB RICHARD ELLIS REALTY TRUST
NOTES TO THE CONSOLIDATED FINANCIAL STATEMENTS—(Continued)
For the Years Ended December 31, 2010, 2009 and 2008
The following is a schedule of future amortization of acquisition related intangible assets as of December 31, 2010 (in thousands):
| | | | | | | | | | | | |
| | | Above Market
Lease Value | | | Acquired In-
Place Lease Value | | | Below Market
Lease Value | |
2011 | �� | | 4,344 | | | $ | 16,918 | | | $ | 3,604 | |
2012 | | | 4,228 | | | | 14,932 | | | | 2,867 | |
2013 | | | 3,402 | | | | 13,328 | | | | 2,086 | |
2014 | | | 1,911 | | | | 11,178 | | | | 1,987 | |
2015 | | | 1,599 | | | | 10,416 | | | | 1,951 | |
Thereafter | | | 7,383 | | | | 44,233 | | | | 6,828 | |
| | | | | | | | | | | | |
| | $ | 22,867 | | | $ | 111,005 | | | $ | 19,323 | |
| | | | | | | | | | | | |
The amortization of the above and below-market lease values included in rental revenue were ($3,460,000) and $2,939,000, respectively, for the year ended December 31, 2010, ($3,300,000) and $2,955,000, respectively, for the year ended December 31, 2009 and ($1,665,000) and $2,036,000, respectively, for the year ended December 31, 2008. The amortization of in-place lease value included in amortization expense was $11,778,000, $10,262,000 and $7,355,000, for the years ended December 31, 2010, 2009 and 2008, respectively.
7. Discontinued Operations
In accordance withASC 205-20 Presentation of Financial Statement-Discontinued Operation, the income and the net gain on dispositions of operating properties are reflected in the consolidated statements of operations as discontinued operations for all periods presented.
Revenues and expenses from discontinued operations for the year ended December 31, 2010 represent the activities of the held for sale portfolio of warehouse distribution buildings acquired during the year ended December 31, 2010 for $22,000,000. The Rickenbacker II and Rickenbacker III properties are currently being marketed for sale. There were no discontinued operations in 2009 and 2008.
| | | | |
| | | Year Ended
December 31,
2010 | |
Revenues: | | | | |
Rental | | $ | 138 | |
Tenant Reimbursement | | | 26 | |
| | | | |
Total Revenues | | | 164 | |
| | | | |
Expenses: | | | | |
Operating and Maintenance | | | 71 | |
Property Taxes | | | 14 | |
General and Administrative | | | 2 | |
Investment Management Fee to Related Party | | | 16 | |
Property Management Fee to Related Party | | | 7 | |
Acquisition Expenses | | | 500 | |
| | | | |
Total Expenses | | | 610 | |
| | | | |
Provision for Income Taxes in Discontinued Operations | | | 61 | |
| | | | |
Total Loss from Discontinued Operations | | $ | (507 | ) |
| | | | |
F-35
CB RICHARD ELLIS REALTY TRUST
NOTES TO THE CONSOLIDATED FINANCIAL STATEMENTS—(Continued)
For the Years Ended December 31, 2010, 2009 and 2008
8. Debt
Notes Payable secured by real property are summarized as follows (in thousands):
| | | | | | | | | | | | | | | | | | |
| | | Interest Rate as of December 31, | | | | | | |
Property | | 2010 | | | 2009 | | | Maturity Date | | 2010 | | | 2009 | |
REMEC | | | 4.79 | % | | | 4.79 | % | | November 1, 2011 | | $ | 13,250 | | | $ | 13,250 | |
300 Constitution | | | 4.84 | | | | 4.84 | | | April 1, 2012 | | | 12,000 | | | | 12,000 | |
Deerfield Commons I.(1) | | | 5.23 | | | | 5.23 | | | December 1, 2015 | | | 9,725 | | | | 9,725 | |
602 Central Blvd.(2) | | | — | | | | 6.79 | | | — | | | — | | | | 8,886 | |
Bolingbrook Point III | | | 5.26 | | | | 5.26 | | | January 1, 2015 | | | 9,000 | | | | 9,000 | |
Fairforest Bldg. 5(3) | | | 6.33 | | | | 6.33 | | | February 1, 2024 | | | 9,864 | | | | 10,330 | |
Fairforest Bldg. 6(3) | | | 5.42 | | | | 5.42 | | | June 1, 2019 | | | 2,987 | | | | 3,257 | |
HJ Park—Bldg. 1(3) | | | 4.98 | | | | 4.98 | | | March 1, 2013 | | | 648 | | | | 914 | |
North Rhett I(3) | | | 5.65 | | | | 5.65 | | | August 1, 2019 | | | 3,906 | | | | 4,246 | |
North Rhett II(3) | | | 5.20 | | | | 5.20 | | | October 1, 2020 | | | 2,180 | | | | 2,345 | |
North Rhett III(3) | | | 5.75 | | | | 5.75 | | | February 1, 2020 | | | 1,759 | | | | 1,903 | |
North Rhett IV(3) | | | 5.80 | | | | 5.80 | | | February 1, 2025 | | | 9,892 | | | | 10,328 | |
Mt Holly Bldg.(3) | | | 5.20 | | | | 5.20 | | | October 1, 2020 | | | 2,180 | | | | 2,345 | |
Orangeburg Park Bldg.(3) | | | 5.20 | | | | 5.20 | | | October 1, 2020 | | | 2,217 | | | | 2,385 | |
Kings Mountain I(3) | | | 5.27 | | | | 5.27 | | | October 1, 2020 | | | 1,887 | | | | 2,030 | |
Kings Mountain II(3) | | | 5.47 | | | | 5.47 | | | January 1, 2020 | | | 5,594 | | | | 6,057 | |
Union Cross Bldg. I(3) | | | 5.50 | | | | 5.50 | | | July 1, 2021 | | | 2,749 | | | | 2,935 | |
Union Cross Bldg. II(3) | | | 5.53 | | | | 5.53 | | | June 1, 2021 | | | 8,398 | | | | 8,972 | |
Thames Valley Five(4)(5) | | | 6.42 | | | | 6.42 | | | May 30, 2013 | | | 8,781 | | | | 12,117 | |
Lakeside Office Center(6) | | | 6.03 | | | | 6.03 | | | September 1, 2015 | | | 9,000 | | | | 9,000 | |
Enclave on the Lake(7) | | | 5.45 | | | | 5.45 | | | May 1, 2011 | | | 17,906 | | | | 18,274 | |
Albion Mills Retail Park(4)(8)(9) | | | 5.25 | | | | 5.25 | | | October 10, 2013 | | | 8,985 | | | | 9,323 | |
Avion Midrise III & IV(10) | | | 5.52 | | | | 5.52 | | | April 1, 2014 | | | 21,354 | | | | 21,765 | |
12650 Ingenuity Drive(11) | | | 5.62 | | | | 5.62 | | | October 1, 2014 | | | 13,061 | | | | 13,424 | |
Maskew Retail Park(4) (12) | | | 5.68 | | | | 5.68 | | | August 10, 2014 | | | 21,759 | | | | 22,578 | |
One Wayside Road(13) | | | 5.66 | | | | — | | | August 1, 2015 | | | 14,465 | | | | — | |
One Wayside Road(13) | | | 5.92 | | | | — | | | August 1, 2015 | | | 12,006 | | | | — | |
100 Tice Blvd(14) | | | 5.97 | | | | — | | | September 15, 2017 | | | 21,100 | | | | — | |
100 Tice Blvd(14) | | | 5.97 | | | | — | | | September 15, 2017 | | | 21,100 | | | | — | |
Ten Parkway North | | | 4.75 | | | | — | | | January 1, 2021 | | | 12,600 | | | | — | |
Pacific Corporate Park(15) | | | 4.89 | | | | — | | | December 7, 2017 | | | 85,000 | | | | — | |
| | | | | | | | | | | | | | | | | | |
Notes Payable | | | | | | | | | | | | | 365,353 | | | | 217,389 | |
Plus Premium | | | | | | | | | | | | | 4,155 | | | | — | |
Less Discount | | | | | | | | | | | | | (3,700 | ) | | | (4,615 | ) |
Less Albion Mills Retail Park Fair Value Adjustment | | | | | | | | | | | | | (216 | ) | | | (349 | ) |
| | | | | | | | | | | | | | | | | | |
Notes Payable Less Discount and Fair Value Adjustment | | | | | | | | | | | | $ | 365,592 | | | $ | 212,425 | |
| | | | | | | | | | | | | | | | | | |
| (1) | Interest only payments are due monthly for the first 60 months of the loan term. Principal and interest payments are due monthly for the remaining 60 months of the loan term. |
| (2) | This loan was fully paid off on March 11, 2010. |
| (3) | These notes payable were assumed from the seller of the Carolina Portfolio on August 30, 2007 as part of the property acquisitions and were recorded at estimated fair value which includes the discount. |
| (4) | These loans are subject to certain financial covenants (interest coverage and loan to value). |
| (5) | We entered into the interest rate swap agreement that fixes the GBP-based LIBOR rate at 5.41% plus 1.01% or 6.42% per annum as of December 31, 2010 and expires on May 30, 2013. The stated rates on the mortgage note payable were 1.74% and 1.59% at December 31, 2010 and 2009 and were based on GBP-based LIBOR plus a spread of 1.01%. |
F-36
CB RICHARD ELLIS REALTY TRUST
NOTES TO THE CONSOLIDATED FINANCIAL STATEMENTS—(Continued)
For the Years Ended December 31, 2010, 2009 and 2008
| (6) | Interest only payments are due monthly for the first 36 months of the loan term. Principal and interest payments are due monthly for the remaining 48 months of the loan term. |
| (7) | The loan was assumed from the seller of Enclave on the Lake on July 1, 2008 and was recorded at estimated fair value which includes the discount. |
| (8) | The Albion Mills Retail Park notes payable balance is presented at cost basis. This loan is carried on our balance sheet at fair value (see Note 16). |
| (9) | We entered into the interest rate swap agreement that fixed the GBP-based LIBOR rate at 3.94% plus 1.31% or 5.25% per annum as of December 31, 2010 and expires on October 10, 2013. The stated rates on the mortgage note payable were 2.04% and 1.88% at December 31, 2010 and 2009 and were based on GBP-based LIBOR plus a spread of 1.31%. |
| (10) | The loan was assumed from the seller of Avion Midrise III & IV on November 18, 2008 and was recorded at estimated fair value which includes the discount. |
| (11) | The loan was assumed from the seller of 12650 Ingenuity Drive on August 5, 2009 and was recorded at estimated fair value which includes the discount. |
| (12) | We entered into the interest rate swap agreement that fixes the GBP-based LIBOR rate at 3.42% plus 2.26 or 5.68% per annum as of December 31, 2010 and expires on August 10, 2014. The stated rate on the mortgage note payable was 2.99% and 2.83% at December 31, 2010 and 2009 and was based on GBP-based LIBOR plus a spread of 2.26%. |
| (13) | The two loans were assumed from the seller of One Wayside Road on June 24, 2010 and were recorded at estimated fair value which include the premiums. |
| (14) | The two loans were assumed from the seller of 100 Tice Blvd. on September 28, 2010 and were recorded at estimated fair value which include the premiums. The maturity date for the loans is September 17, 2022; however, the lenders, at their option, can declare the note due and payable on September 17, 2017 or provide for a five year extension through the maturity date. |
| (15) | We entered into the interest rate swap agreement that fixed the LIBOR rate at 2.69% plus 2.20% or 4.89% per annum as of December 31, 2010 and expires on December 7, 2017. The stated rate on the mortgage note payable was 2.52% at December 31, 2010, and was based on LIBOR plus a spread of 2.20%. |
Notes Payable
On April 27, 2007, we, in connection with the acquisition of 602 Central Blvd., entered into a £5,500,000 financing arrangement with the Royal Bank of Scotland secured by the property. The loan was for a term of seven years with interest at a variable rate, adjusted quarterly, based on three month GBP-based LIBOR plus 0.67%, per annum. On March 11, 2010, we paid off the £5,500,000 ($8,281,000 at March 11, 2010) loan and expensed certain closing costs plus the unamortized deferred financing costs associated with obtaining the loan totaling $73,000. The interest rate cap agreement was cancelled concurrent with the loan payoff.
In connection with our acquisition of the Carolina Portfolio on August 30, 2007, we assumed 13 loans with principal balances totaling $66,110,000 ($62,944,000 at estimated fair value including the discount of $3,166,000) from various lenders that are secured by first deeds of trust on the properties and the assignment of related rents and leases. Assumption fees and other loan closing costs totaling $765,500 were capitalized as incurred. The loans bear interest at rates ranging from 4.98% to 6.33% per annum and mature between March 1, 2013 and February 1, 2025. The loans require monthly payments of interest and principal, fully amortized over the lives of the loans. Principal payments totaling $3,788,000 were made during the year ended December 31, 2010. We indemnify the lenders against environmental costs and expenses and guarantee the loans under certain conditions.
On May 30, 2008, we entered into a £7,500,000 financing arrangement with the Royal Bank of Scotland plc secured by the Thames Valley Five property. On July 27, 2010 we paid down the loan by £1,860,000 leaving a loan balance of £5,640,000 ($8,781,000 at December 31, 2010). The loan is for a term of five years (with a two year extension option) and bears interest at a variable rate adjusted quarterly, based on nine month GBP-based LIBOR plus 1.01%. In addition, we incurred financing costs of approximately £67,000 ($104,000 at December 31, 2010) associated with obtaining this loan. On August 14, 2008, we entered into the interest rate swap agreement that fixed the GBP-based LIBOR rate at 5.41% plus 1.01% or 6.42% per annum as of December 31, 2010, and expires on May 30, 2013. In conjunction with the loan paydown, we incurred a cost of £227,000 ($361,000 at August 3, 2010) to reduce the notional amount of the interest rate swap from £7,500,000 to £5,640,000. Interest only payments are due quarterly for the term of the loan with principal due at maturity.
F-37
On July 1, 2008, in connection with the acquisition of Enclave on the Lake, we assumed an $18,281,000 ($18,790,000 face value less discount of $509,000) loan from NorthMarq Capital, Inc. that bears interest at a fixed rate of 5.45% per annum and matures on May 1, 2011. Principal and interest payments are due monthly for the remaining loan term and principal payments totaling $368,000 were made during the year ended December 31, 2010. In addition, we incurred financing costs totaling $241,000 in conjunction with the assumption of the loan.
On October 10, 2008, we entered into a £5,771,000 ($8,985,000 at December 31, 2010) financing agreement with the Royal Bank of Scotland plc secured by Albion Mills Retail Park property. The loan is for a term of five years and bears interest at a variable rate adjusted quarterly, based on three month GBP-based LIBOR plus 1.31%. In addition, we incurred financing costs of approximately £75,000 ($118,000 at December 31, 2010) associated with obtaining this loan. On November 25, 2008, we entered into the interest rate swap agreement that fixed the GBP-based LIBOR rate at 3.94% plus 1.31% or 5.25% per annum as of December 31, 2010 and expires on October 10, 2013. Interest only payments are due quarterly for the term of the loan with principal due at maturity.
On November 18, 2008, in connection with the acquisition of Avion Midrise III & IV, we assumed $20,851,000 ($22,186,000 face value less discount of $1,335,000) fixed rate mortgage loan from Capmark Finance, Inc. that bears interest at a rate of 5.52% per annum and matures on April 1, 2014. Principal and interest payments are due monthly for the remaining loan term and principal payments totaling $411,000 were made during the year ended December 31, 2010. In addition, we incurred financing costs totaling $344,000 in conjunction with the assumption of the loan.
On August 5, 2009, in connection with the acquisition of 12650 Ingenuity Drive, we assumed a $12,572,000 ($13,539,000 face value less a discount of $967,000) fixed rate mortgage loan from PNC Bank, National Association that bears interest at a rate of 5.62% and matures on October 1, 2014. Principal and interest payments are due monthly for the remaining loan term and principal payments totaling $363,000 were made during the year ended December 31, 2010. In addition, we incurred financing costs totaling $284,000 in conjunction with the assumption of the loan.
On August 10, 2009, we entered into a £13,975,000 ($21,759,000 at December 31, 2010) financing agreement with the Abbey National Treasury Services plc secured by the Maskew Retail Park property. On September 24, 2009, we drew the full amount of the loan and concurrently entered into an interest rate swap agreement that fixed the GBP-based LIBOR rate at 3.42% plus 2.26% or 5.68% per annum for the five-year term of the loan. Interest only payments are due quarterly for the term of the loan with principal due at maturity. In addition, we incurred financing costs of approximately £268,000 ($422,000 at December 31, 2010) associated with obtaining this loan.
On June 24, 2010, we assumed two loans in connection with the acquisition of One Wayside Road: (i) a $14,888,000 ($14,633,000 at face value plus a premium of $255,000) fixed rate mortgage loan from State Farm Life Insurance Company that bears interest at a rate of 5.66% and matures on August 1, 2015; and (ii) a $12,479,000 ($12,132,000 at face value plus a premium of $347,000) fixed rate mortgage loan from State Farm Life Insurance Company that bears interest at a rate of 5.92% and matures on August 1, 2015. Principal and interest payments are due monthly for the remaining loan terms and principal payments totaling $294,000 were made during the year ended December 31, 2010 on the two loans. In addition, we incurred financing costs totaling $342,000 in conjunction with the assumption of the loans.
On September 28, 2010, we assumed two loans in connection with the acquisition of 100 Tice Blvd.: (i) a $23,136,000 ($21,218,000 at face value plus a premium of $1,918,000) fixed rate loan from Principal Life Insurance Company that bears interest at a rate of 5.97%, matures on September 15, 2022 and the lender has the right to call the loan due and payable on September 15, 2017; (ii) a $23,136,000 ($21,217,000 at a face value plus a premium of $1,919,000) fixed rate mortgage from Hartford Life and Accidental Insurance Company that bears interest at a rate of 5.97%, matures on September 15, 2022 and the lender has the right to call the loan due and payable on September 15, 2017. Principal and interest payments are due monthly for the remaining loan terms and principal payments totaling $235,000 were made during the year ended December 31, 2010 on the two loans. In addition, we incurred financing costs totaling $476,000 in conjunction with the assumption of the loans.
On December 7, 2010, we entered into a $85,000,000 secured term loan through a subsidiary with Wells Fargo Bank, National Association, or the Pacific Corporate Park Loan. The Pacific Corporate Park Loan has a seven-year term, monthly amortization of $250,000 and is secured by Pacific Corporate Park. Upon closing of the Pacific Corporate Park Loan on December 7, 2010, we entered into an interest rate swap agreement with Wells Fargo Bank, National Association to effectively fix the interest rate on the entire
F-38
CB RICHARD ELLIS REALTY TRUST
NOTES TO THE CONSOLIDATED FINANCIAL STATEMENTS—(Continued)
For the Years Ended December 31, 2010, 2009 and 2008
CB RICHARD ELLIS REALTY TRUST
NOTES TO THE CONSOLIDATED FINANCIAL STATEMENTS—(Continued)
For the Years Ended December 31, 2010, 2009 and 2008
outstanding Pacific Corporate Park Loan amount at 4.89% for its seven-year term. Principal and interest payments are due monthly. There were no principal payments made during the period ended December 31, 2010. In addition, we incurred financing costs of approximately $1,510,000 in conjunction with obtaining the loan.
On December 29, 2010, we entered into a $12,600,000 secured term loan through Woodmen of The World Life Insurance Society secured by the Ten Parkway North property. The Ten Parkway North loan bears interest at a fixed rate of 4.75% per annum and matures on January 1, 2021. Principal and interest payments are due monthly. There were no principal payments made during the period ended December 31, 2010. In addition, we incurred financing costs of approximately $160,000 in conjunction with obtaining the loan.
The minimum principal payments due for the notes payable and loan payable are as follows as of December 31, 2010 (in thousands):
| | | | |
2011 | | $ | 77,111 | |
2012 | | | 22,319 | |
2013 | | | 28,281 | |
2014 | | | 88,482 | |
2015 | | | 58,653 | |
Thereafter | | | 150,507 | |
| | | | |
| | $ | 425,353 | |
| | | | |
Loan Payable
On August 8, 2008, we entered into an amended and restated credit agreement with Bank of America, N.A. (“Bank of America”), which amended the terms of our prior credit agreement with Bank of America, to provide us with a new $45,000,000 unsecured revolving line of credit (the “Revolving Credit Facility”), and to replace our prior Bank of America term loan and revolving credit facility which matured in August 2008. The new Revolving Credit Facility was fully drawn upon at closing, with such proceeds utilized to pay down the full $45,000,000 amount outstanding under our prior Bank of America term loan (as of August 8, 2008, no amount was outstanding under our prior $10,000,000 Bank of America revolving credit facility). The new Revolving Credit Facility matures in August 2010 and bears interest at a floating rate of LIBOR plus 2.00% to 2.75%, based upon our leverage ratio as defined in the credit agreement (at our current leverage ratio, the Revolving Credit Facility bears interest at a floating rate of LIBOR plus 2.00%). An upfront fee of $292,500 was paid to Bank of America, and a fee equal to the actual daily amount by which the aggregate commitments exceed the total outstanding (both as defined in the amended and restated credit agreement) times 0.20% per annum if the total outstandings are equal to or more than 50% of the aggregate commitments, or 0.25% per annum otherwise, is accrued on unfunded balances under the Revolving Credit Facility. The loan contains various financial covenants and restrictions including a fixed charge coverage ratio of at least 1.75 to 1.00, as defined in the amended and restated credit agreement. The Revolving Credit Facility expired on August 8, 2010 in accordance with its terms.
On May 26, 2010, we entered into a $70,000,000 revolving credit facility with Wells Fargo Bank, N.A., or the Wells Fargo Credit Facility. The initial maturity date of the Wells Fargo Credit Facility is May 26, 2014, however we may extend the maturity date to May 26, 2015, subject to certain conditions. $15,000,000 of the Wells Fargo Credit Facility was initially drawn upon closing on May 26, 2010, with $55,000,000 initially remaining available for disbursement during the term of the facility. We have the right to prepay any outstanding amount of the Wells Fargo Credit Facility, in whole or in part, without premium or penalty at any time during the term of this Wells Fargo Credit Facility, however, we initially could not reduce the outstanding principal balance below a minimum outstanding amount of $15,000,000, without reducing the total $70,000,000 Wells Fargo Credit Facility capacity. Initially, the Wells Fargo Credit Facility had a floating interest rate of 300 basis points over the LIBOR, however this interest rate would be at least 4.00% for any of the outstanding balance that was not subject to an interest rate swap with an initial term of at least two years. Upon closing on May 26, 2010, we entered into an interest rate swap agreement with Wells Fargo Bank, N.A. to effectively fix the interest rate on the initial $15,000,000 outstanding loan amount at 5.10% for the four-year term of the facility. The interest rate swap was designated as a qualifying cash flow hedge at the start date of the hedge relationship as described in Note 16 “Derivative Instruments.” The Wells Fargo Credit Facility was initially secured by our 13201 Wilfred, 3011, 3055 & 3077 Comcast Place, 140 Depot Street, Crest Ridge Corporate Center I and West Point Trade Center properties. In addition, CBRE OP provides a limited guarantee for the Wells Fargo Credit Facility. The Wells Fargo Credit Facility is subject to certain customary financial covenants, including certain negative financial covenants, which we believe we were in compliance with as of December 31, 2010. A commitment fee of $1,050,000 was paid to Wells Fargo Bank, N.A. at the initial closing.
F-39
CB RICHARD ELLIS REALTY TRUST
NOTES TO THE CONSOLIDATED FINANCIAL STATEMENTS—(Continued)
For the Years Ended December 31, 2010, 2009 and 2008
On August 31, 2010, we entered into an amended and restated credit agreement with Wells Fargo Bank, N.A. to expand the Wells Fargo Credit Facility from its initial capacity of $70,000,000 to an amended capacity of $125,000,000 (the “Amended Wells Fargo Credit Facility”). In connection with the Amended Wells Fargo Credit Facility, the minimum outstanding amount was increased to $25,000,000 and as such an additional $10,000,000 was drawn (in addition to the $15,000,000 initially drawn on May 26, 2010) with the remaining $100,000,000 available for disbursement during the term of the facility. The Amended Wells Fargo Credit Facility is secured by an additional three of our properties, for a total of eight properties in all: 13201 Wilfred Lane, 3011, 3055 & 3077 Comcast Place, 140 Depot Street, Crest Ridge Corporate Center, West Point Trade Center, 5160 Hacienda Drive, 10450 Pacific Center Court and 225 Summit Avenue. The interest rate was reduced by 25 basis points to 275 basis points over LIBOR (which rate will apply to all withdrawals from the Amended Wells Fargo Credit Facility other than the initial $15,000,000 that was drawn on May 26, 2010) and the initial interest rate floor of 4.00% was eliminated. The initial maturity date remains May 26, 2014, however we may extend the maturity date to May 26, 2015, subject to certain conditions. The Amended Wells Fargo Credit Facility is subject to certain representations and warranties and customary financial covenants (including certain negative financial covenants) with which we believe we were in compliance as of December 31, 2010. A commitment fee of $632,500 was paid to Wells Fargo Bank, N.A. at closing of the Amended Wells Fargo Credit
On December 16, 2010, an additional $35,000,000 was drawn (in addition to the $15,000,000 initially drawn on May 26, 2010 and $10,000,000 second draw on August 31, 2010) in connection with the Amended Wells Fargo Credit Facility, with the remaining $65,000,000 available for disbursement during the term of the facility. The $60,000,000 is included in Loan Payable on our condensed consolidated balance sheet.
9. Minimum Future Rents Receivable
The following is a schedule of minimum future rentals to be received on non-cancelable operating leases from consolidated properties as of December 31, 2010 (in thousands):
| | | | |
2011 | | $ | 94,124 | |
2012 | | | 89,173 | |
2013 | | | 82,787 | |
2014 | | | 78,578 | |
2015 | | | 74,183 | |
Thereafter | | | 357,202 | |
| | | | |
| | $ | 776,047 | |
| | | | |
10. Concentrations
Tenant Revenue Concentrations
For the year ended December 31, 2010, there were no significant revenue concentrations.
For the year ended December 31, 2009, the tenant in Enclave on the Lake accounted for approximately $5,353,000 or approximately 10% of total revenues from consolidated properties. The lease under which the tenant occupies our Enclave on the Lake property expires in February 2012.
For the year ended December 31, 2008, there were no significant revenue concentrations.
Geographic Concentrations
As of December 31, 2010, we owned 71 consolidated properties, excluding two properties held for sale, located 14 states (Arizona, California, Georgia, Florida, Illinois, Kentucky, Massachusetts, Minnesota, New Jersey, North Carolina, South Carolina, Texas, Utah, and Virginia) and in the United Kingdom. As of December 31, 2009, we owned 60 consolidated properties located in ten states (California, Florida, Georgia, Illinois, Massachusetts, Minnesota, North Carolina, South Carolina, Texas and Virginia) and in the United Kingdom.
F-40
CB RICHARD ELLIS REALTY TRUST
NOTES TO THE CONSOLIDATED FINANCIAL STATEMENTS—(Continued)
For the Years Ended December 31, 2010, 2009 and 2008
Our geographic revenue concentrations from consolidated properties for the years ended December 31, 2010, 2009 and 2008 are as follows:
| | | | | | | | | | | | |
| | | Year Ended December 31, | |
| | | 2010 | | | 2009 | | | 2008 | |
Domestic | | | | | | | | | | | | |
California | | | 16.54 | % | | | 10.32 | % | | | 6.83 | % |
South Carolina | | | 15.76 | | | | 26.09 | | | | 39.47 | |
Texas | | | 11.12 | | | | 17.12 | | | | 16.48 | |
Massachusetts | | | 9.32 | | | | 5.21 | | | | 4.96 | |
Florida | | | 9.12 | | | | 2.01 | | | | — | |
Virginia | | | 7.88 | | | | 8.18 | | | | 1.26 | |
Minnesota | | | 6.88 | | | | 4.13 | | | | — | |
New Jersey | | | 5.66 | | | | — | | | | — | |
Georgia | | | 2.87 | | | | 4.78 | | | | 6.68 | |
Illinois | | | 2.78 | | | | 2.58 | | | | 3.64 | |
North Carolina | | | 2.76 | | | | 4.68 | | | | 8.83 | |
Kentucky | | | 0.32 | | | | — | | | | — | |
Utah | | | 0.28 | | | | — | | | | — | |
Arizona | | | 0.25 | | | | — | | | | — | |
| | | | | | | | | | | | |
Total Domestic | | | 91.54 | | | | 85.10 | | | | 88.15 | |
International | | | | | | | | | | | | |
United Kingdom | | | 8.46 | | | | 14.90 | | | | 11.85 | |
| | | | | | | | | | | | |
Total | | | 100.00 | % | | | 100.00 | % | | | 100.00 | % |
| | | | | | | | | | | | |
Our geographic long-lived asset concentrations from consolidated properties as of December 31, 2010 and 2009 are as follows:
| | | | | | | | |
| | | December 31, | |
| | | 2010 | | | 2009 | |
Domestic | | | | | | | | |
Virginia | | | 15.71 | % | | | 5.53 | % |
New Jersey | | | 14.49 | | | | — | |
South Carolina | | | 13.86 | | | | 23.95 | |
California | | | 11.59 | | | | 9.90 | |
Massachusetts | | | 7.72 | | | | 5.22 | |
Texas | | | 7.14 | | | | 9.43 | |
Florida | | | 5.55 | | | | 13.26 | |
North Carolina | | | 4.30 | | | | 7.35 | |
Minnesota | | | 3.55 | | | | 6.12 | |
Illinois | | | 3.42 | | | | 2.33 | |
Kentucky | | | 1.23 | | | | — | |
Utah | | | 1.12 | | | | — | |
Georgia | | | 1.10 | | | | 1.95 | |
Arizona | | | 0.76 | | | | — | |
| | | | | | | | |
Total Domestic | | | 91.54 | | | | 85.04 | |
International | | | | | | | | |
United Kingdom | | | 8.46 | | | | 14.96 | |
| | | | | | | | |
Total | | | 100.00 | % | | | 100.00 | % |
| | | | | | | | |
F-41
CB RICHARD ELLIS REALTY TRUST
NOTES TO THE CONSOLIDATED FINANCIAL STATEMENTS—(Continued)
For the Years Ended December 31, 2010, 2009 and 2008
11. Segment Disclosure
Our reportable segments consist of three types of commercial real estate properties, namely, Domestic Industrial Properties, Domestic Office Properties and International Office/Retail Properties. Management internally evaluates the operating performance and financial results of our segments based on net operating income. We also have certain general and administrative level activities including legal, accounting, tax preparation and shareholder servicing costs that are not considered separate operating segments. Our reportable segments are on the same basis of accounting as described in footnote 2.
We evaluate the performance of our segments based on net operating income, defined as: rental income and tenant reimbursements less property and related expenses (operating and maintenance, property management fees, property level general and administrative expenses and real estate taxes) and excludes other non-property income and expenses, interest expense, depreciation and amortization, and our general and administrative expenses. The following table compares the net operating income for the years ended December 31, 2010, 2009 and 2008 (in thousands):
| | | | | | | | | | | | |
| | | Year Ended December 31, | |
| | | 2010 | | | 2009 | | | 2008 | |
Domestic Industrial Properties | | | | | | | | | | | | |
Revenues: | | | | | | | | | | | | |
Rental | | $ | 23,903 | | | $ | 19,473 | | | $ | 20,350 | |
Tenant Reimbursements | | | 5,481 | | | | 5,057 | | | | 4,323 | |
| | | | | | | | | | | | |
Total Revenues | | | 29,384 | | | | 24,530 | | | | 24,673 | |
| | | | | | | | | | | | |
Property and Related Expenses: | | | | | | | | | | | | |
Operating and Maintenance | | | 1,546 | | | | 1,297 | | | | 1,146 | |
General and Administrative | | | 257 | | | | 312 | | | | 147 | |
Property Management Fee to Related Party | | | 289 | | | | 346 | | | | 376 | |
Property Taxes | | | 5,735 | | | | 4,916 | | | | 4,054 | |
| | | | | | | | | | | | |
Total Expenses | | | 7,827 | | | | 6,871 | | | | 5,723 | |
| | | | | | | | | | | | |
Net Operating Income | | | 21,557 | | | | 17,659 | | | | 18,950 | |
| | | | | | | | | | | | |
Domestic Office Properties | | | | | | | | | | | | |
Revenues: | | | | | | | | | | | | |
Rental | | | 38,792 | | | | 19,430 | | | | 8,429 | |
Tenant Reimbursements | | | 8,294 | | | | 3,974 | | | | 2,290 | |
| | | | | | | | | | | | |
Total Revenues | | | 47,086 | | | | 23,404 | | | | 10,719 | |
| | | | | | | | | | | | |
Property and Related Expenses: | | | | | | | | | | | | |
Operating and Maintenance | | | 6,142 | | | | 3,395 | | | | 1,974 | |
General and Administrative | | | 433 | | | | 174 | | | | 61 | |
Property Management Fee to Related Party | | | 370 | | | | 139 | | | | 94 | |
Property Taxes | | | 5,230 | | | | 2,708 | | | | 1,425 | |
| | | | | | | | | | | | |
Total Expenses | | | 12,175 | | | | 6,416 | | | | 3,554 | |
| | | | | | | | | | | | |
Net Operating Income | | | 34,911 | | | | 16,988 | | | | 7,165 | |
| | | | | | | | | | | | |
International Office/Retail Properties | | | | | | | | | | | | |
Revenues: | | | | | | | | | | | | |
Rental | | | 6,678 | | | | 8,120 | | | | 4,617 | |
Tenant Reimbursements | | | 391 | | | | 270 | | | | 140 | |
| | | | | | | | | | | | |
Total Revenues | | | 7,069 | | | | 8,390 | | | | 4,757 | |
| | | | | | | | | | | | |
Property and Related Expenses: | | | | | | | | | | | | |
Operating and Maintenance | | | 930 | | | | 282 | | | | 128 | |
General and Administrative | | | 213 | | | | 142 | | | | 82 | |
Property Management Fee to Related Party | | | 289 | | | | 171 | | | | 21 | |
| | | | | | | | | | | | |
Total Expenses | | | 1,432 | | | | 595 | | | | 231 | |
| | | | | | | | | | | | |
Net Operating Income | | | 5,637 | | | | 7,795 | | | | 4,526 | |
| | | | | | | | | | | | |
F-42
CB RICHARD ELLIS REALTY TRUST
NOTES TO THE CONSOLIDATED FINANCIAL STATEMENTS—(Continued)
For the Years Ended December 31, 2010, 2009 and 2008
| | | | | | | | | | | | |
| | | Year Ended December 31, | |
| | | 2010 | | | 2009 | | | 2008 | |
Reconciliation to Consolidated Net Loss | | | | | | | | | | | | |
Total Segment Net Operating Income | | | 62,105 | | | | 42,442 | | | | 30,641 | |
Interest Expense | | | 14,881 | | | | 11,378 | | | | 10,323 | |
General and Administrative | | | 4,623 | | | | 3,618 | | | | 3,030 | |
Investment Management Fee to Related Party | | | 11,595 | | | | 7,803 | | | | 3,964 | |
Acquisition Expenses | | | 17,531 | | | | 5,832 | | | | — | |
Depreciation and Amortization | | | 32,125 | | | | 25,093 | | | | 17,171 | |
Loss on Impairment | | | — | | | | 9,160 | | | | — | |
| | | | | | | | | | | | |
| | | (18,650 | ) | | | (20,442 | ) | | | (3,847 | ) |
| | | | | | | | | | | | |
Other Income and Expenses | | | | | | | | | | | | |
Interest and Other Income | | | 1,260 | | | | 344 | | | | 2,039 | |
Net Settlement (Payments) Receipts on Interest Rate Swaps | | | (1,096 | ) | | | (660 | ) | | | 65 | |
Gain (Loss) on Interest Rate Swaps and Cap | | | 23 | | | | 89 | | | | (1,496 | ) |
(Loss) Gain on Note Payable at Fair Value | | | (118 | ) | | | (807 | ) | | | 1,168 | |
Loss on Early Extinguishment of Debt | | | (72 | ) | | | — | | | | — | |
Loss on Transfer of Held for Sale Real Estate to Continuing Operations | | | — | | | | — | | | | (3,451 | ) |
| | | | | | | | | | | | |
Loss Before (Provision) Benefit for Income Taxes and Equity in Income (Loss) of Unconsolidated Entities | | | (18,653 | ) | | | (21,476 | ) | | | (5,522 | ) |
| | | | | | | | | | | | |
(Provision) Benefit for Income Taxes | | | (296 | ) | | | (169 | ) | | | 82 | |
Equity in Income (Loss) of Unconsolidated Entities | | | 8,838 | | | | 2,743 | | | | (1,242 | ) |
| | | | | | | | | | | | |
Net Loss From Continuing Operations | | | (10,111 | ) | | | (18,902 | ) | | | (6,682 | ) |
Loss from Discontinued Operations | | | (507 | ) | | | — | | | | — | |
| | | | | | | | | | | | |
Net Loss | | | (10,618 | ) | | | (18,902 | ) | | | (6,682 | ) |
| | | | | | | | | | | | |
Net Loss Attributable to Non-Controlling Operating Partnership Units | | | 18 | | | | 54 | | | | 26 | |
| | | | | | | | | | | | |
Net Loss Attributable to CB Richard Ellis Realty Trust Shareholders | | $ | (10,600 | ) | | $ | (18,848 | ) | | $ | (6,656 | ) |
| | | | | | | | | | | | |
| | | | | | | | |
| | | December 31, | |
Condensed Assets | | 2010 | | | 2009 | |
Domestic Industrial Properties—Continuing Operations | | $ | 412,093 | | | $ | 346,681 | |
Domestic Office Properties—Continuing Operations | | | 711,084 | | | | 279,658 | |
Domestic Industrial Properties—Discontinued Operations | | | 22,056 | | | | — | |
International Office/Retail Properties | | | 104,076 | | | | 115,223 | |
Non-Segment Assets | | | 467,411 | | | | 317,457 | |
| | | | | | | | |
Total Assets | | $ | 1,716,720 | | | $ | 1,059,019 | |
| | | | | | | | |
| |
| | | Year Ended December 31, | |
Capital Expenditures | | 2010 | | | 2009 | |
Domestic Industrial Properties—Continuing Operations | | $ | 74,643 | | | $ | 63,754 | |
Domestic Office Properties—Continuing Operations | | | 465,050 | | | | 145,500 | |
Domestic Industrial Properties—Discontinued Operations | | | 22,000 | | | | — | |
International Office/Retail Properties | | | — | | | | 194 | |
Non-Segment Assets | | | 110 | | | | — | |
| | | | | | | | |
Total Capital Expenditures | | $ | 561,803 | | | $ | 209,448 | |
| | | | | | | | |
F-43
CB RICHARD ELLIS REALTY TRUST
NOTES TO THE CONSOLIDATED FINANCIAL STATEMENTS—(Continued)
For the Years Ended December 31, 2010, 2009 and 2008
12. Investment Management and Other Fees to Related Parties
Pursuant to the agreement between our company, CBRE OP and the Investment Advisor (the “Advisory Agreement”), the Investment Advisor and its affiliates perform services relating to our ongoing public offering and the management of our assets. Items of compensation and equity participation are as follows:
Offering Costs Relating to Public Offerings
Offering costs totaling $54,873,000, $40,348,000 and $26,744,000 were incurred during the years ended December 31, 2010, 2009 and 2008, respectively, and are recorded as a reduction of additional paid-in-capital in the consolidated statement of shareholders’ equity. Of the total amounts, $51,503,000, $36,290,000 and $24,707,000 was incurred to CNL Securities Corp., as dealer manager and $221,000, $160,000 and $115,000 was incurred to the Investment Advisor for reimbursable marketing for the years ended December 31, 2010, 2009 and 2008, respectively. Each party will be paid the amount incurred from proceeds of the public offering. As of December 31, 2010 and 2009, the accrued offering costs payable to related parties included in our consolidated balance sheets were $917,000 and $1,114,000.
Investment Management Fee to Related Party
Prior to October 24, 2006, the Investment Advisor received an annual fee equal to 0.75% of the book value of the total assets, as defined in the Advisory Agreement, based on the assets of CBRE OP. The investment management fee was calculated monthly based on the average of total assets, as defined, during such period. On October 24, 2006, the Board of Trustees, including our independent trustees, approved and the Company entered into the Amended and Restated Agreement of Limited Partnership of CBRE OP (the “Amended Partnership Agreement”) and the Amended and Restated Advisory Agreement (the “Amended Advisory Agreement” and, together with the Amended Partnership Agreement, the “Amended Agreements”). The Amended Advisory Agreement provides an investment management fee of (i) a monthly fee equal to one twelfth of 0.6% of the aggregate cost (before non-cash reserves and depreciation) of all real estate investments within our portfolio and (ii) a monthly fee equal to 7.0% of the aggregate monthly net operating income derived from all real estate investments within our portfolio. On January 30, 2009, we entered into that certain second amended and restated advisory agreement (the “Second Amended Advisory Agreement”) with CBRE OP and the Investment Advisor. The Second Amended Advisory Agreement modified, among other things, the investment management fee to consist of (a) a monthly fee equal to one twelfth of 0.5% of the aggregate costs (before non-cash reserves and depreciation) of all real estate investment in our portfolio and (b) a monthly fee equal to 5.0% of the aggregate monthly net operating income derived from all real estate investments in our portfolio. All or any portion of the investment management fee not taken as to any fiscal year may be deferred or waived without interest at the option of the Investment Advisor. The Investment Advisor waived investment management fees of $0, $0 and $1,529,000 for the years ended December 31, 2010, 2009 and 2008, respectively.
The Investment Advisor earned investment management fees of $11,611,000, $7,803,000 and $3,964,000 for the years ended December 31, 2010, 2009 and 2008, respectively. As of December 31, 2010 and 2009, the investment management fees payable to related party in our consolidated balance sheets were $1,330,000 and $757,000, respectively. In connection with services provided to the Investment Advisor, CNL Fund Management Company, the Sub-Advisor and affiliate of the Dealer Manager pursuant to a sub-advisory agreement dated August 21, 2006, was paid by the Investment Advisor $1,604,000, $1,078,000 and $547,000 for the years ended December 31, 2010, 2009 and 2008, respectively.
Acquisition Fee and Expenses to Related Party
On January 30, 2009, we entered into that certain Second Amendment Advisory Agreement that permits the Investment Advisor to earn an acquisition fee of up to 1.5% of (i) the purchase price of real estate investments acquired by us, including any debt attributable to such investments, or (ii) when we make an investment indirectly through another entity, such investment’s pro rata share of the gross asset value of real estate investments held by that entity. The Investment Advisor earned acquisition fees of $11,852,000, $4,387,000 and $4,927,000 for the years ended December 31, 2010, 2009 and 2008, respectively. In connection with services provided to the Investment Advisor, the Sub Advisor, pursuant to a sub advisory agreement, was paid by the Investment Advisor acquisition fees of $2,216,000, $820,000 and $921,000 for the years ended December 31, 2010, 2009 and 2008, respectively. The Investment Advisor earned $1,204,000, $439,000 and $743,000 in acquisition related expenses during the years ended December 31, 2010 and 2009. Prior to the adoption of “Business Combinations” on January 1, 2009, these acquisitions fees and expenses were capitalized to investments in real estate and related intangibles.
F-44
CB RICHARD ELLIS REALTY TRUST
NOTES TO THE CONSOLIDATED FINANCIAL STATEMENTS—(Continued)
For the Years Ended December 31, 2010, 2009 and 2008
CB Richard Ellis, UK was paid a service fee in conjunction with the acquisition of Thames Valley Five totaling £24,000 ($42,000) during 2008.
Management Services to Related Party
Affiliates of the Investment Advisor may also provide leasing, brokerage, property management, or mortgage banking services for us. CB Richard Ellis Group, Inc., an affiliate of the Investment Advisor, received property management fees of approximately $954,000, $656,000 and $491,000 for the years ended December 31, 2010, 2009 and 2008, respectively. As of December 31, 2010 and 2009, the property management fees payable to related party included in our consolidated balance sheets were $191,000 and $106,000, respectively. No brokerage fees were paid to affiliates of the Investment Advisor for the years ended December 31, 2010, 2009 and 2008. Mortgage banking fees of $1,217,000, $0 and $636,000 were paid to CBRE Capital Markets, as affiliate of the Investment Advisor, for the years ended December 31, 2010, 2009 and 2008 respectively.
Affiliates of the Investment Advisor received leasing fees of $895,000, $198,000 and $15,000 and construction management / appraisal fees of $20,700, $0 and $0 for the years ended December 31, 2010, 2009 and 2008, respectively.
CB Richard Ellis, UK was paid a management service fee totaling $75,000 for the year ended December 2009. No management service fees were paid in 2010 and 2008, respectively.
13. Equity Incentive Plan and Performance Bonus Plan
Equity Incentive Plan
We have adopted a 2004 equity incentive plan. The purpose of the 2004 equity incentive plan is to provide us with the flexibility to use share options and other awards to provide a means of performance-based compensation. Our key employees, directors, trustees, officers, advisors, consultants or other personnel and our subsidiaries or other persons expected to provide significant services or our subsidiaries, including employees of the Investment Advisor, would be eligible to be granted share options, restricted shares, phantom shares, distribution equivalent rights and other share-based awards under the 2004 equity incentive plan. On April 20, 2010, our Board’s independent trustees, Messrs. Black, Reid and Orphanides, were awarded equity grants under our 2004 equity incentive plan on the following terms: (i) each award was for $80,000 in restricted common shares of the Trust (or 8,000 shares at $10.00 per share) for a total of $240,000; (ii) each award vested in its entirety, upon issuance; and (iii) the independent trustee would not be able to redeem any of the restricted common shares prior to the third anniversary of date of issuance, but retains the rights to dividends declared and paid during such restriction period. We recognized a stock based compensation expense of $240,000 during the year ended December 31, 2010 as a result of granting these awards to our independent trustees. No awards of any kind were made under this plan during the years ended December 31, 2009 and 2008.
Performance Bonus Plan
We have adopted a 2004 performance bonus plan. Annual bonuses under our 2004 performance bonus plan are awarded by our Compensation Committee to selected key employees, including employees of the Investment Advisor, based on corporate factors or individual factors (or a combination of both). Subject to the provisions of the 2004 performance bonus plan, the Compensation Committee will (i) determine and designate those key employees to whom bonuses are to be granted; (ii) determine, consistently with the 2004 performance bonus plan, the amount of the bonus to be granted to any key employee for any performance period; and (iii) determine, consistently with the 2004 performance bonus plan, the terms and conditions of each bonus. Bonuses may be so awarded by the Compensation Committee prior to the commencement of any performance period, during or after any performance period. No bonus shall exceed 200% of the key employee’s aggregate salary for the year. The Compensation Committee may provide for partial bonus payments at target and other levels. Corporate performance hurdles for bonuses may be adjusted by the Compensation Committee in its discretion to reflect (i) dilution from corporate acquisitions and share offerings, and (ii) changes in applicable accounting rules and standards. The Compensation Committee may determine that bonuses shall be paid in cash or shares or other equity-based grants, or a combination thereof. The Compensation Committee may also provide that any such share grants be made under our 2004 equity incentive plan or any other equity-based plan or program we may establish. The Compensation Committee may provide for programs under which the payment of bonuses may be deferred at the election of the employee. No bonuses were awarded and no bonus related expenses were incurred by us during the periods ended December 31, 2010, 2009 and 2008, respectively.
F-45
CB RICHARD ELLIS REALTY TRUST
NOTES TO THE CONSOLIDATED FINANCIAL STATEMENTS—(Continued)
For the Years Ended December 31, 2010, 2009 and 2008
14. Shareholders’ Equity
Under our declaration of trust, we have the authority to issue a total of 1,000,000,000 shares of beneficial interest. Of the total shares authorized, 990,000,000 shares are designated as common shares with a par value of $0.01 per share and 10,000,000 shares are designated as preferred shares.
The registration statement relating to our initial public offering was declared effective by the SEC on October 24, 2006. CNL Securities Corp. acted as the dealer manager of this offering. The registration statement covered up to $2,000,000,000 in common shares of beneficial interest, 90% of which were offered at a price of $10.00 per share, and 10% of which were offered pursuant to our dividend reinvestment plan at a purchase price equal to the higher of $9.50 per share or 95% of the fair market value of a common share on the reinvestment date, as determined by the Investment Advisor, or another firm we choose for that purpose. As of January 29, 2009, we had issued 60,808,967 common shares in our initial public offering. We terminated the initial public offering effective as of the close of business on January 29, 2009. The registration statement relating to our follow-on public offering was declared effective by the SEC on January 30, 2009. CNL Securities Corp. is the dealer manager of this offering. The registration statement covers up to $3,000,000,000 in common shares of beneficial interest, 90% of which will be offered at a price of $10.00 per share, and 10% of which will be offered pursuant to our dividend reinvestment plan at a purchase price equal to the higher of $9.50 per share or 95% of the fair market value of a common share on the reinvestment date, as determined by the Investment Advisor, or another firm we choose for that purpose. We reserve the right to reallocate the shares between the primary offering and our dividend reinvestment plan. From January 30, 2009 (effective date) through December 31, 2010, we received gross offering proceeds of approximately $1,010,076,294 from the sale of 101,245,478 shares.
During the years ended December 31, 2010, 2009 and 2008, we repurchased 1,796,101 common shares, 2,284,916 common shares and 383,235 common shares respectively, under our Share Redemption Program.
15. Distributions
Earnings and profits, which determine the taxability of distributions to shareholders, will differ from income reported for financial reporting purposes due to the differences for federal income tax purposes including the treatment of loss on extinguishment of debt, revenue recognition, compensation expense and in the basis of depreciable assets and estimated useful lives used to compute depreciation.
The following table reconciles the distributions declared per common share to the distributions paid per common share during the years ended December 31, 2010, 2009, and 2008:
| | | | | | | | | | | | |
| | | 2010 | | | 2009 | | | 2008 | |
Distributions declared per common share | | $ | 0.600 | | | $ | 0.600 | | | $ | 0.588 | |
Less: Distributions declared in the current period, and paid in the subsequent period | | | (0.150 | ) | | | (0.150 | ) | | | (0.150 | ) |
Add: Distributions declared in the prior year, and paid in the current year | | | 0.150 | | | | 0.150 | | | | 0.144 | |
| | | | | | | | | | | | |
Distributions paid per common share | | $ | 0.600 | | | $ | 0.600 | | | $ | 0.582 | |
| | | | | | | | | | | | |
Distributions to shareholders during the years ended December 31, 2010, 2009, and 2008 totaled $72,481,000, $43,002,000, and $22,314,000, respectively.
We issued 3,289,918 common shares, 1,852,679 common shares and 938,779 common shares pursuant to our dividend reinvestment plan for the years ended December 31, 2010, 2009 and 2008 respectively.
The income tax treatment for distributions declared for the years ended December 31, 2010, 2009 and 2008 as identified above, were as follows:
| | | | | | | | | | | | | | | | | | | | | | | | |
| | | 2010 | | | 2009 | | | 2008 | |
Ordinary Income | | $ | 0.202 | | | | 33.7 | % | | $ | 0.139 | | | | 23.2 | % | | $ | 0.228 | | | | 38.7 | % |
Return of Capital | | | 0.398 | | | | 66.3 | | | | 0.461 | | | | 76.8 | | | | 0.360 | | | | 61.3 | |
| | | | | | | | | | | | | | | | | | | | | | | | |
| | $ | 0.600 | | | | 100.0 | % | | $ | 0.600 | | | | 100.0 | % | | $ | 0.588 | | | | 100.0 | % |
| | | | | | | | | | | | | | | | | | | | | | | | |
F-46
CB RICHARD ELLIS REALTY TRUST
NOTES TO THE CONSOLIDATED FINANCIAL STATEMENTS—(Continued)
For the Years Ended December 31, 2010, 2009 and 2008
16. Derivative Instruments
The following table sets forth the terms of our interest rate swap derivative instruments at December 31, 2010 (amounts in thousands):
| | | | | | | | | | | | | | | | | | | | |
Type of Instrument | | Notional Amount | | | Fair Value | | | Pay Fixed Rate | | | Receive Variable
Rate | | | Maturity Date | |
Non-qualifying Interest Rate Swap on Thames Valley debt(1) | | $ | 8,781 | | | | (802 | ) | | | 5.41 | % | | | 0.74 | % | | | May 30, 2013 | |
Non-qualifying Interest Rate Swap on Albion Mills debt(1) | | $ | 8,897 | | | | (547 | ) | | | 3.94 | % | | | 0.74 | % | | | October 10, 2013 | |
Qualifying Interest Rate Swap on Maskew debt(1) | | $ | 21,759 | | | | (1,090 | ) | | | 3.42 | % | | | 0.74 | % | | | August 10, 2014 | |
Qualifying Interest Rate Swap on Wells Fargo Credit Facility loan | | $ | 15,000 | | | | (371 | ) | | | 2.10 | % | | | 0.26 | % | | | May 26, 2014 | |
Qualifying Interest Rate Swap on Pacific Corporate Park debt | | $ | 85,000 | | | | (471 | ) | | | 2.69 | % | | | 0.32 | % | | | December 7, 2017 | |
| (1) | Based on three month GBP-based LIBOR BBA Index with variable rate reset dates every 90 days during the term of the swaps |
The following table sets forth the terms of our interest rate swap derivative instruments at December 31, 2009 (amounts in thousands):
| | | | | | | | | | | | | | | | | | | | |
Type of Instrument | | Notional Amount | | | Fair Value | | | Pay Fixed Rate | | | Receive Variable
Rate | | | Maturity Date | |
Non-qualifying Interest Rate Swap on Thames Valley debt(1) | | $ | 12,117 | | | | (1,049 | ) | | | 5.41 | % | | | 0.61 | % | | | May 30, 2013 | |
Non-qualifying Interest Rate Swap on Albion Mills debt(1) | | $ | 9,231 | | | | (361 | ) | | | 3.94 | % | | | 0.56 | % | | | October 10, 2013 | |
Qualifying Interest Rate Swap on Maskew debt(1) | | $ | 22,578 | | | | (293 | ) | | | 3.42 | % | | | 0.58 | % | | | August 10, 2014 | |
| (1) | Based on three month GBP-based LIBOR BBA Index with variable rate reset dates every 90 days during the term of the swaps |
We marked our two non-qualifying economic hedge interest rate swap instruments to their estimated fair value of ($1,349,000) and ($1,410,000) on the consolidated balance sheet at December 31, 2010 and 2009 included in Liabilities as Interest Rate Swaps at Fair Value. We recognized a gain on interest rate swaps of $23,000 and $89,000 and a loss of ($1,496,000) for the years ended December 31, 2010, 2009 and 2008, respectively, included in Gain (Loss) on Interest Rate Swaps and Cap on the Consolidated Statement of Operations.
Our $21,759,000 notional amount interest rate swap has been designated as a qualifying cash flow hedge of the LIBOR base payments due under our Maskew Retail Park variable rate note payable from its inception on September 24, 2009. The estimated fair value of the interest rate swap value of ($1,090,000) and ($293,000) as of December 31, 2010 and 2009, respectively, has resulted in a swap fair value adjustment being recorded to other comprehensive loss totaling $797,000 and $293,000 for the years ended December 31, 2010 and 2009, respectively.
Our $15,000,000 notional amount interest rate swap has been designated as a qualifying cash flow hedge of the LIBOR base payments due under our Wells Fargo Credit Facility variable rate loan payable from its inception on May 26, 2010. The estimated fair value of the interest rate swap value of ($371,000) as of December 31, 2010, has resulted in a swap fair value adjustment being recorded to other comprehensive loss totaling $371,000 for the year ended December 31, 2010. There was no measured ineffectiveness for the qualifying hedge during the year ended December 31, 2010.
Our $85,000,000 notional amount interest rate swap has been designated as a qualifying cash flow hedge of the LIBOR base payments due under our Pacific Corporate Park variable rate loan payable from its inception on December 7, 2010. The estimated fair value of the interest rate swap value of ($471,000) as of December 31, 2010, has resulted in a swap fair value adjustment being recorded to other comprehensive loss totaling $471,000 for the year ended December 31, 2010. There was no measured ineffectiveness for the qualifying hedge during the year ended December 31, 2010.
F-47
CB RICHARD ELLIS REALTY TRUST
NOTES TO THE CONSOLIDATED FINANCIAL STATEMENTS—(Continued)
For the Years Ended December 31, 2010, 2009 and 2008
17. Fair Value Option—Note Payable
During the fourth quarter of 2008 we elected to apply the fair value option on a note payable which bears interest at a variable rate and is currently subject to an economic hedge by an interest rate swap with similar terms and the same notional amount. We have elected to apply the fair value option on the Albion Mills Retail Park variable rate note payable to match the fair value treatment of interest rate swap derivative on the same note payable thereby achieving a reduction in the artificial volatility in net income or loss that occurs when related financial assets and liabilities are measured and reported on a different basis in the consolidated financial statements.
We applied the fair value option for the Albion Mills Retail Park note payable at each reporting period. Included in (loss) gain on notes payable at fair value in the statement of operations were ($118,000) and ($807,000) and $1,168,000 for the years ended December 31, 2010, 2009 and 2008, respectively. In addition, there were $87,000 and $916,000 translation losses recorded to Other Comprehensive Loss at December 31, 2010 and 2009, respectively.
18. Fair Value of Financial Instruments and Investments
We apply the three-tier fair value hierarchy, which prioritizes the inputs used in measuring fair value. These tiers include: Level 1, defined as observable inputs such as quoted prices for identical financial instruments in active markets; Level 2, defined as inputs other than quoted prices in active markets that are either directly or indirectly observable; and Level 3, defined as instruments that have little to no pricing observability as of the reported date. These financial instruments do not have two-way markets and are measured using management’s best estimate of fair value, where the inputs into the determination of fair value require significant management judgment or estimation. We have classified the Albion Mills Retail Park notes payable as Level 3 as of December 31, 2010 and 2009 due to the lack of current market activity and our reliance on unobservable inputs to estimate the fair value of the mortgage note payable.
As of December 31, 2010 and 2009, we held certain items that are required to be measured at fair value on a recurring basis. These included cash equivalents, an interest rate cap, interest rate swap derivative contracts and our equity method investment in CBRE Strategic Partners Asia. Cash equivalents consist of short-term, highly liquid, income-producing investments, all of which have maturities of 90 days or less, including money market funds and U.S. Government obligations. Derivative instruments are related to our economic hedging activities with respect to interest rates.
The fair values of the interest rate cap and swap derivative agreements are determined using the market standard methodology of discounting the future expected cash receipts that would occur if variable interest rates fell above the strike rate of the interest rate cap agreement, and by discounting the future expected cash payments and receipts on the pay and receive legs of the interest rate swap agreements that swap the estimated variable rate mortgage note payment stream for a fixed rate receive payment stream over the period of the loan. The variable interest rates used in the calculation of projected receipts on the interest rate cap agreement and on the interest rate swap agreements are based on an expectation of future interest rates derived from observable market interest rate curves and volatilities. We incorporate credit valuation adjustments to appropriately reflect both our own nonperformance risk and the respective counterparty’s nonperformance risk in the fair value measurements (where appropriate). Although we have determined that the majority of the inputs used to value our derivatives fall within Level 2 of the fair value hierarchy, the credit valuation adjustments associated with our derivatives utilize Level 3 inputs, such as estimates of current credit spreads to evaluate the likelihood of default by us and our counterparties. However, as of December 31, 2010 and 2009, we have assessed the significance of the impact of the credit valuation adjustments on the overall valuation and have determined that the credit valuation adjustments are not significant to the overall valuation of our derivatives. As a result, we have determined that our derivative valuations in their entirety are classified in Level 2 of the fair value hierarchy. We have consistently applied these valuation techniques in all periods presented and believe we have obtained the most accurate information available for the types of derivative contracts we hold.
Our investment in CBRE Strategic Partners Asia is based on the Level 3 valuation inputs applied by the Investment Manager of this investment company utilizing the following approaches for valuing the underlying real estate related investments within the investment company:
| | ¡ | | The income approach is generally based on a discounted cash flow analysis. Such an analysis for a real property includes projecting net cash flows from the property from a buyer’s perspective and computing the present value of the cash flows |
F-48
CB RICHARD ELLIS REALTY TRUST
NOTES TO THE CONSOLIDATED FINANCIAL STATEMENTS—(Continued)
For the Years Ended December 31, 2010, 2009 and 2008
| | using a market discount rate. The cash flows include a projection of the net sales proceeds at the end of our estimate of a market participant holding period, computed using market reversionary capitalization rates and projected cash flows from the property for the year following the holding period. |
| | ¡ | | The direct market comparison approach to property valuation is primarily based on the principle of substitution, which holds that the value of a property tends to be set by the price that would be paid to acquire a substitute property of similar utility and desirability within a reasonable amount of time. Transactions of similar properties are analyzed and compared to the subject property. Factors affecting value include differences in the location, size, quality of construction and other physical features, property rights appraised, timing of sale, and economic and market conditions. |
| | ¡ | | The replacement cost approach to property valuation is a theoretical breakdown of the property into land and building components. The theory is that the value of a property can be estimated by summing the land value and the depreciated value of any improvements. While the replacement cost of the improvements can be determined by adding the labor, material, and other costs, land values must be derived from an analysis of comparable data. The cost approach is considered reliable when used on newer structures, but the method tends to become less reliable for older properties. |
| | ¡ | | For investments owned more than one year, except for investments under construction or incurring significant renovation, it is CBRE Strategic Partners Asia’s policy to obtain a third-party appraisal. For investments in real estate under construction or incurring significant renovation, the valuation analysis is prepared by the Investment Manager. |
The following items are measured at fair value on a recurring basis at December 31, 2010 and 2009 (in thousands):
| | | | | | | | | | | | | | | | |
| | | | | | Fair Value Measurements Using: | |
| | | Total
Fair Value | | | Quoted
Markets
Prices
(Level 1) | | | Significant
Observable
Inputs
(Level 2) | | | Significant
Unobservable
Inputs
(Level 3) | |
Financial Assets (Liabilities) | | | | | | | | | | | | | | | | |
Cash and Cash Equivalents | | $ | 998 | | | $ | 998 | | | $ | — | | | $ | — | |
Interest Rate Swaps at Fair Value—Non Qualifying Hedges | | $ | (1,349 | ) | | $ | — | | | $ | (1,349 | ) | | $ | — | |
Interest Rate Swaps at Fair Value—Qualifying Hedges | | $ | (1,932 | ) | | $ | — | | | $ | (1,932 | ) | | $ | — | |
Investment in CBRE Strategic Partners Asia | | $ | 9,471 | | | $ | — | | | $ | — | | | $ | 9,471 | |
Note Payable at Fair Value | | $ | (8,769 | ) | | $ | — | | | $ | — | | | $ | (8,769 | ) |
| | | | | | | | | | | | | | | | |
| | | | | | Fair Value Measurements Using: | |
| | | Total
Fair Value | | | Quoted
Markets
Prices
(Level 1) | | | Significant
Observable
Inputs
(Level 2) | | | Significant
Unobservable
Inputs
(Level 3) | |
Financial Assets (Liabilities) | | | | | | | | | | | | | | | | |
Cash and Cash Equivalents | | $ | 79,997 | | | $ | 79,997 | | | $ | — | | | $ | — | |
Interest Rate Swaps at Fair Value—Non Qualifying Hedges | | $ | (1,410 | ) | | $ | — | | | $ | (1,410 | ) | | $ | — | |
Rate Cap at Fair Value | | $ | 1 | | | $ | — | | | $ | 1 | | | $ | — | |
Interest Rate Swaps at Fair Value—Qualifying Hedges | | $ | (293 | ) | | $ | — | | | $ | (293 | ) | | $ | — | |
Investment in CBRE Strategic Partners Asia | | $ | 8,142 | | | $ | — | | | $ | — | | | $ | 8,142 | |
Note Payable at Fair Value | | $ | (8,974 | ) | | $ | — | | | $ | — | | | $ | (8,974 | ) |
F-49
CB RICHARD ELLIS REALTY TRUST
NOTES TO THE CONSOLIDATED FINANCIAL STATEMENTS—(Continued)
For the Years Ended December 31, 2010, 2009 and 2008
The following table presents our activity for the variable rate note payable and our investment in CBRE Strategic Partners Asia measured at fair value on a recurring basis using significant unobservable inputs (Level 3) for the years ended December 31, 2010 and 2009 (in thousands):
| | | | | | | | |
Fair Value Measurements Using Significant Unobservable Inputs (Level 3) | | Investment in
CBRE Strategic
Partners Asia | | | Note Payable | |
Balance at January 1, 2010 | | $ | 8,142 | | | $ | (8,974 | ) |
Contributions | | | 5,961 | | | | — | |
Distributions | | | (5,581 | ) | | | — | |
Total Gain (Loss) on Fair Value Adjustment | | | 949 | | | | (118 | ) |
Translation Adjustment | | | — | | | | 323 | |
| | | | | | | | |
Balance at December 31, 2010 | | $ | 9,471 | | | $ | (8,769 | ) |
| | | | | | | | |
The Amount of Total Gain (Loss) for the Period Included in Equity in Income of Unconsolidated Entities and the Decrease in Unrealized Gain Relating to Note Payable Held at December 31, 2010 | | $ | 949 | | | $ | (118 | ) |
| | | | | | | | |
| | |
Fair Value Measurements Using Significant Unobservable Inputs (Level 3) | | Investment in
CBRE Strategic
Partners Asia | | | Note Payable | |
Balance at January 1, 2009 | | $ | (1,398 | ) | | $ | (7,251 | ) |
Contributions | | | 8,879 | | | | — | |
Total Gain (Loss) on Fair Value Adjustment | | | 803 | | | | (807 | ) |
Translation Adjustment | | | (142 | ) | | | (916 | ) |
| | | | | | | | |
Balance at December 31, 2009 | | $ | 8,142 | | | $ | (8,974 | ) |
| | | | | | | | |
The Amount of Total Gain (Loss) for the Period Included in Equity in Income of Unconsolidated Entities and the Decrease in Unrealized Gain Relating to Note Payable Held at December 31, 2009 | | $ | 803 | | | $ | (807 | ) |
| | | | | | | | |
Gains and losses (realized and unrealized) included in earnings related to the interest rate cap and swaps, as well as for the elected fair value note payable for the years ended December 31, 2010 and 2009 are reported as components of “Other Income and Expense” on the consolidated statements of operations.
Impaired Property—For assets measured on a non-recurring basis, such as real estate assets that are required to be recorded at fair value as a result of an impairment, our estimates of fair value are based on management’s best estimate derived from evaluating market sales data for comparable properties developed by a third party appraiser and arriving at management’s estimate of fair value based on such comparable data primarily based on properties with similar characteristics. For the year ended December 31, 2009, the fair value of our impaired property was estimated to be $15,300,000, which we used to record our impairment expense and was based on Level 3 inputs in developing management’s estimate of fair value. There were no impaired property adjustments for the year ended December 31, 2010.
Disclosure of Fair Value Financial Instruments
For disclosure purposes only, the following table summarizes our notes payable and their estimated fair value at December 31, 2010 and 2009 (in thousands):
| | | | | | | | | | | | | | | | |
| | | Book Value | | | Fair Value | |
Financial Instrument | | 2010 | | | 2009 | | | 2010 | | | 2009 | |
Notes Payable | | $ | 356,823 | | | $ | 203,451 | | | $ | 361,418 | | | $ | 201,113 | |
Note Payable at Fair Value | | $ | 8,769 | | | $ | 8,974 | | | $ | 8,769 | | | $ | 8,974 | |
| | | | | | | | | | | | | | | | |
| | $ | 365,592 | | | $ | 212,425 | | | $ | 370,187 | | | $ | 210,087 | |
| | | | | | | | | | | | | | | | |
F-50
CB RICHARD ELLIS REALTY TRUST
NOTES TO THE CONSOLIDATED FINANCIAL STATEMENTS—(Continued)
For the Years Ended December 31, 2010, 2009 and 2008
For purposes of this fair value disclosure, we based our fair value estimate for notes payable on our internal valuation that includes a representative sample of our lenders’ market interest rate quotes as of December 31, 2010 and 2009 for debt with similar risk characteristics and maturities. We based the Note Payable carried at fair value on our estimates of fair value which includes consideration of a third party appraisers valuation which used similar techniques as our internal valuation model as of December 31, 2010 and 2009.
19. Commitments and Contingencies
We have agreed to a capital commitment of up to $20,000,000 in CBRE Strategic Partners Asia, which extends to January 31, 2012. As of December 31, 2009, we funded $15,040,000 of our capital commitment. CBRE Investors, our sponsor, formed CBRE Strategic Partners Asia, to purchase, reposition, develop, hold for investment and sell institutional quality real estate and related assets in targeted markets in China, Japan, India, South Korea, Hong Kong, Singapore and other Asia Pacific markets. If we and all other currently committed capital investors had funded our entire commitments in CBRE Strategic Partners Asia as of December 31, 2010, we would have owned an ownership interest of approximately 5.07% in CBRE Strategic Partners Asia. A majority of our trustees (including a majority of our independent trustees) not otherwise interested in this transaction approved the transaction as being fair, competitive and commercially reasonable. CBRE Strategic Partners Asia is managed by CB Richard Ellis Investors SP Asia II, LLC or the Fund Manager, a subsidiary of CBRE Investors.
On June 23, 2010, we entered into a purchase and sale agreement to acquire, subject to customary closing conditions, Millers Ferry Road, located at Millers Ferry Road and Mars Road in Wilmer, TX, a suburb of Dallas. We will acquire Millers Ferry Road for approximately $44,000,000, exclusive of customary closing costs. We anticipate that the acquisition will be funded using the net proceeds from our current public offering. Millers Ferry Road, scheduled to be completed in the second quarter of 2011, will be a 1,020,000 square foot, warehouse/distribution center with no operating history. We expect that the property will be 100% leased to Whirlpool Corporation to be utilized as a regional distribution center through December 2020. Whirlpool Corporation is a leading global manufacturer and marketer of major home appliances. While we anticipate this acquisition will close during the second quarter of 2011, the agreement to acquire the property is subject to a number of contingencies, including, but not limited to, substantial completion of the construction of the property and acceptance by the tenant of the space and therefore there can be no assurances that this acquisition will occur. As of December 31, 2010, we have provided deposits of $1,500,000 in connection with the execution of the agreement that is refundable in the event that certain closing conditions are not met.
On August 24, 2010, the Duke joint venture closed on the acquisition of additional land and entered into a construction agreement, and lease amendments (collectively, the “Expansion Agreements”) to expand the AllPoints at Anson Bldg. 1 property, a warehouse/distribution center located in Whitestown, IN, a suburb of Indianapolis. The existing property is 100% leased to a subsidiary of Amazon.com through July 2018. Pursuant to the Expansion Agreements, AllPoints at Anson Bldg. 1 (i) will be expanded from the current 630,573 square feet to approximately 1,036,573 square feet and (ii) will remain 100% leased to a subsidiary of Amazon.com, which lease will be extended through April 2021. The total cost of the expansion is anticipated to be approximately $16,900,000 to the Duke joint venture. As of December 31, 2010, the Duke joint venture had incurred land acquisition and construction costs totaling approximately $13,485,000. We own an 80% interest in the Duke joint venture and we expect to make cash contributions of approximately $13,541,000 to the Duke joint venture over the construction period in connection with the Expansion Agreements. We will pay a construction supervision fee of $203,000 to our Investment Advisor in connection with the Expansion Agreements.
On October 15, 2010, we entered into two agreements of sale, one with 70 Hudson Street, L.L.C. and 70 Hudson Street Urban Renewal Associates, L.L.C. and the other with 90 Hudson Street, L.L.C. and 90 Hudson Street Urban Renewal Associates, L.L.C., all unrelated third parties, to acquire, subject to customary closing conditions, two office buildings located at 70 Hudson Street, or 70 Hudson, and 90 Hudson Street, or 90 Hudson, in Jersey City, New Jersey (collectively, “70 & 90 Hudson”). The total of the two purchase prices for 70 & 90 Hudson is $310,000,000, exclusive of customary closing costs and the assumption of approximately $240,000,000 in two existing mortgage loans. We anticipate that the estimated $70,000,000 balance of the aggregate purchase price will be funded using the net proceeds from our current public offering. 70 Hudson is a 409,272 square foot, 12-story office building constructed in 2000 that is 100% net-leased through January 2016 to Long Island Holding, LLC, a wholly-owned subsidiary of Barclays Capital, Inc., a leading global investment bank based in the United Kingdom. Barclay’s Capital Inc. is the investment banking division of Barclay’s Bank PLC (NYSE: BCS), a global bank. 90 Hudson is a 418,046 square foot, 12-story office building constructed in 1999 that is 100% leased with approximately 59% of the building leased through December 2024 to Lord Abbett & Co., LLC, an employee owned investment manager. While we anticipate that these acquisitions will close during the first quarter of 2011, the agreements to acquire the
F-51
CB RICHARD ELLIS REALTY TRUST
NOTES TO THE CONSOLIDATED FINANCIAL STATEMENTS—(Continued)
For the Years Ended December 31, 2010, 2009 and 2008
properties are subject to a number of contingencies and therefore there can be no assurances that these acquisitions will occur. As of December 31, 2010, we had provided deposits of $9,000,000 in connection with the execution of the agreement that is refundable in the event that certain closing conditions are not met.
On November 5, 2010, we entered into a purchase and sale agreement to acquire, subject to customary closing conditions, Sky Harbor Operations Center located at 1820 E. Sky Harbor Circle South, Phoenix, Arizona. The total purchase price for Sky Harbor Operations Center is $53,500,000, exclusive of customary closing costs. We anticipate that the acquisition will be funded using the net proceeds from our current public offering. We deposited $1,000,000 into an escrow account upon the execution of the agreement that is refundable in the event certain closing conditions are not met. Sky Harbor Operations Center is a two-story, 396,179 square foot office building constructed in 2003. Sky Harbor Operations Center is currently 100% net-leased to JPMorgan Chase Bank, National Association (“JPMorgan”) through September 2027. JPMorgan is a subsidiary of JP Morgan Chase & Co. and provides commercial banking and retail financial services. While we anticipate that this acquisition will close during the second quarter of 2011, the agreement to acquire Sky Harbor Operations Center is subject to a number of contingencies and therefore there can be no assurances that this acquisition will occur. As of December 31, 2010, we had provided deposits of $2,000,000 in connection with the execution of the agreement that is refundable in the event that certain closing conditions are not met.
Litigation—From time to time, we and our properties may be subject to legal proceedings, which arise in the ordinary course of our business. Currently, neither our company nor any of our properties are subject to, or threatened with, any legal proceedings for which the outcome is reasonably likely to have a material adverse effect on our consolidated financial statements.
Environmental Matters—We are not aware of any environmental liability or any unasserted claim or assessment with respect to an environmental liability that we believe would require additional disclosure or the recording of a loss contingency.
20. Quarterly Financial Information (unaudited)
Summarized quarterly financial data for the years ended December 31, 2010, 2009 and 2008 was as follows (in thousands, except per share amounts):
| | | | | | | | | | | | | | | | |
| | | 2010 Quarter Ended | |
| | | March 31 | | | June 30 | | | September 30 | | | December 31 | |
Revenues from Operations | | $ | 17,920 | | | $ | 17,451 | | | $ | 20,104 | | | $ | 28,064 | |
Net Income (Loss) | | | 146 | | | | (4,229 | ) | | | (1,208 | ) | | | (5,327 | ) |
Net Income (Loss) Attributable to CB Richard Ellis Realty Trust Shareholders | | | 145 | | | | (4,221 | ) | | | (1,206 | ) | | | (5,318 | ) |
Net Income (Loss) per common share-basic and diluted | | | 0.00 | | | | (0.03 | ) | | | (0.01 | ) | | | (0.03 | ) |
| | | | | | | | | | | | | | | | |
| | | 2009 Quarter Ended | |
| | | March 31 | | | June 30 | | | September 30 | | | December 31(a) | |
Revenues from Operations | | $ | 12,288 | | | $ | 11,885 | | | $ | 15,551 | | | $ | 16,600 | |
Net Loss | | | (3,542 | ) | | | (4,246 | ) | | | (3,428 | ) | | | (7,686 | ) |
Net Loss Attributable to CB Richard Ellis Realty Trust Shareholders | | | (3,529 | ) | | | (4,238 | ) | | | (3,412 | ) | | | (7,669 | ) |
Net Loss per common share-basic and diluted | | | (0.05 | ) | | | (0.06 | ) | | | (0.04 | ) | | | (0.08 | ) |
| | | | | | | | | | | | | | | | |
| | | 2008 Quarter Ended | |
| | | March 31 | | | June 30 | | | September 30(b) | | | December 31 | |
Revenues from Operations | | $ | 8,244 | | | $ | 9,323 | | | $ | 10,315 | | | $ | 12,267 | |
Net Income (Loss) | | | 588 | | | | (487 | ) | | | (2,947 | ) | | | (3,836 | ) |
Net Income (Loss) Attributable to CB Richard Ellis Realty Trust Shareholders | | | 583 | | | | (485 | ) | | | (2,933 | ) | | | (3,821 | ) |
Net Income (Loss) per common share-basic and diluted | | | 0.02 | | | | (0.01 | ) | | | (0.06 | ) | | | (0.06 | ) |
| (a) | Net loss includes an impairment loss on the KM III property of $9,160,000 for the period. |
| (b) | Net loss includes a loss on transfer of real estate held for sale to continuing operations of $3,451,000 for the period. |
F-52
CB RICHARD ELLIS REALTY TRUST
NOTES TO THE CONSOLIDATED FINANCIAL STATEMENTS—(Continued)
For the Years Ended December 31, 2010, 2009 and 2008
21. Comprehensive Loss
U.S. GAAP requires that the effect of foreign currency translation adjustments be classified as comprehensive income (loss). The following table sets forth our comprehensive loss for the years ended December 31, 2010, 2009 and 2008 (in thousands):
| | | | | | | | | | | | |
| | | Year Ended December 31, | |
| | | 2010 | | | 2009 | | | 2008 | |
Net Loss | | $ | (10,618 | ) | | $ | (18,902 | ) | | $ | (6,682 | ) |
Foreign Currency Translation Income (Loss) | | | 2,275 | | | | 7,322 | | | | (19,450 | ) |
Swap Fair Value Adjustment | | | (1,639 | ) | | | (293 | ) | | | — | |
| | | | | | | | | | | | |
Total Comprehensive Loss | | | (9,982 | ) | | | (11,873 | ) | | | (26,132 | ) |
Comprehensive Loss Attributable to Non-Controlling Interest | | | (18 | ) | | | (30 | ) | | | (110 | ) |
| | | | | | | | | | | | |
Comprehensive Loss Attributable to CB Richard Ellis Realty Trust Shareholders | | $ | (9,964 | ) | | $ | (11,843 | ) | | $ | (26,022 | ) |
| | | | | | | | | | | | |
22. Income Taxes
We elected to be taxed as a REIT under the Internal Revenue Code commencing with our taxable year ended December 31, 2004. To qualify as a REIT, we must meet a number of organizational and operational requirements, including a requirement that we generally distribute at least 90% of our REIT taxable income (determined without regard to the dividends paid deduction and excluding net capital gain). It is our current intention to adhere to these requirements and maintain our REIT qualification. As a REIT, we generally will not be subject to corporate level U.S. federal income tax on net income we distribute currently to our shareholders. If we fail to qualify as a REIT in any taxable year, then we will be subject to U.S. federal income taxes at regular corporate rates (including any applicable alternative minimum tax) and may not be able to qualify as a REIT for four subsequent taxable years. Even if we qualify for taxation as a REIT, we may be subject to certain state and local taxes on our income and property and to U.S. federal income and excise taxes on our undistributed taxable income, if any.
We have made taxable REIT subsidiary (“TRS”) elections for all of our held for sale property subsidiaries. The elections, effective for the tax year beginning January 1, 2010 and future years, were made pursuant to section 856(i) of the Internal Revenue Code. Our TRS’s are subject to corporate level income taxes which are recorded in our consolidated financial statements.
| | | | |
| | | 2010 | |
Net Loss Available from TRS(1) | | $ | (446 | ) |
Less: Tax Depreciation and Amortization | | | (33 | ) |
Add: Receipts of Prepaid Rent | | | 166 | |
Add: Capitalized Acquisition Expense for Tax | | | 501 | |
| | | | |
Taxable Income for TRS | | $ | 188 | |
| | | | |
| (1) | Net income available from the TRS is comprised of loss from discontinued operations of $446,000 (before a tax provision of $61,000). |
The following table summarizes the provision for income taxes of the TRS for the year ended December 31, 2010 (in thousands):
| | | | |
| | | 2010 | |
Current | | $ | 61 | |
Deferred. | | | — | |
| | | | |
Total Provision for Income Taxes | | $ | 61 | |
| | | | |
There was no provision for income taxes of the TRS for the year ended December 31, 2009.
F-53
CB RICHARD ELLIS REALTY TRUST
NOTES TO THE CONSOLIDATED FINANCIAL STATEMENTS—(Continued)
For the Years Ended December 31, 2010, 2009 and 2008
The following table reconciles the provision for U.S. Federal income taxes of the TRS for the year ended December 31, 2010 to the amount computed by applying the U.S. Federal Corporate tax rate (in thousands):
| | | | |
| | | 2010 | |
U.S. Federal Income Tax Provision Statutory U.S. Federal Rate for Taxable REIT Subsidiary | | $ | 57 | |
State Income Tax Provision | | | 4 | |
Loss (Income) not subject to Federal Tax Benefit/Provision | | | — | |
| | | | |
Total Provision for Income Taxes | | $ | 61 | |
| | | | |
ASC 740-10 Income Taxes requires recognition of deferred tax assets and liabilities for the expected future tax consequences of events that have been included in the financial statements or tax returns. Under this method, deferred tax assets and liabilities are determined based on the differences between the financial reporting and tax bases of assets and liabilities using enacted tax rates in effect for the year in which the differences are expected to reverse.
There are no deferred tax liabilities or assets at December 31, 2009.
In addition, included as a component of our tax provision, we have incurred income and other taxes (franchise, local and state government and international) related to our continuing operations in the amount of $296,000, $169,000 and $165,000 for California, Georgia, Minnesota, Texas, North Carolina, and United Kingdom impacting our operations during the years ended December 31, 2010, 2009 and 2008, respectively. The United Kingdom taxes real property operating results at a statutory rate of 22%. The United Kingdom taxable loss for the years ended December 31, 2010 and 2009 resulted in a deferred tax asset of approximately $615,000 and $176,000 net operating carryforwards for both years. We have provided for a full valuation allowance of ($615,000) and ($176,000) as of December 31, 2010 and 2009 on deferred tax assets because it is not likely that future operating profits in the United Kingdom would be sufficient to absorb the net operating losses.
23. Subsequent Events
From January 1, 2011 through March 17, 2011, we received gross proceeds from our public offering of approximately $80,515,423 from the sale of 8,105,529 common shares.
On January 20, 2011 and February 14, 2011, we paid down the Amended Wells Fargo Credit Facility loan payable by $20,000,000 and $15,000,000, respectively. On March 30, 2011, an additional $30,000,000 was drawn down on the Amended Wells Fargo Credit Facility.
On January 31, 2011, we were notified that the investment commitment period of CBRE Strategic Partners Asia was extended for one year from January 31, 2011 to January 31, 2012.
On February 8, 2011, we entered into five secured term loans totaling $37,000,000 with ING USA Annuity and Life Insurance Company secured by the following properties: 4701 Gold Spike Road, $10,650,000, Summit Distribution Center, $6,700,000, Tolleson Commerce Park II, $4,600,000, 3660 Deerpark Blvd., $7,650,000 and 1985 International Way, $7,400,000. The loans bear interest at a fixed rate of 4.45% and mature on February 8, 2018.
On February 22, 2011, we entered into a lease for the Kings Mountain III property, a 541,910 square foot warehouse/distribution building located in Charlotte, North Carolina for a 10 year term.
On February 28, 2011, we entered into a $33,000,000 secured term loan with TD Bank secured by the 100 Kimball Drive property. Upon closing the 100 Kimball Drive loan, we simultaneously entered into an interest rate swap agreement with TD Bank to effectively fix the interest rate on the entire outstanding loan amount to 5.25% for its 10 year term.
F-54
CB RICHARD ELLIS REALTY TRUST
NOTES TO THE CONSOLIDATED FINANCIAL STATEMENTS—(Continued)
For the Years Ended December 31, 2010, 2009 and 2008
On March 24, 2011, the Duke joint venture acquired fee interests in the second and third tranches of properties (the “Remaining Properties”), thus completing the acquisition of the Office Portfolio, as described further below.
| | | | | | | | | | | | | | | | | | | | | | | | | | | | | | | | |
Property and Market | | Address | | Year
Built | | | Tenant(1) | | Net
Rentable
Square
Feet | | | Lease
Expiration | | | Approximate
Purchase
Price(2) | | | Pro Rata
Share of
Approximate
Purchase
Price(3) | | | Percentage
Leased | | | Acquisition
Fee(4) | |
Norman Pointe I /
Minneapolis, MN | | 5601 Green Valley Drive Bloomington, MN | | | 2000 | | | NCS Pearson, Inc.(5) | | | 212,722 | | | | 02/2017 | | | $ | 42,600,000 | | | $ | 34,080,000 | | | | 100 | % | | $ | 511,200 | |
| | | | | | | | | |
Norman Pointe II /
Minneapolis, MN | | 5600 West American Boulevard, Bloomington, MN | | | 2007 | | | General Services Administration(6); Hartford Fire Insurance Company(7) | | | 324,296 | | |
| 02/2016;
06/2013 |
| | $ | 46,900,000 | | | $ | 37,520,000 | | | | 100 | % | | $ | 562,800 | |
| | | | | | | | | |
The Landings I /
Cincinnati, Ohio | | 9997 Carver Road, Blue Ash, OH | | | 2006 | | | Citicorp North America(8) | | | 175,695 | | | | 01/2022 | | | $ | 29,659,500 | | | $ | 23,727,600 | | | | 100 | % | | $ | 355,914 | |
| | | | | | | | | |
The Landings II /
Cincinnati, Ohio | | 9987 Carver Road, Blue Ash, OH | | | 2007 | | | — | | | 175,076 | | | | — | | | $ | 26,160,500 | | | $ | 20,928,400 | | | | 96.1 | % | | $ | 313,926 | |
| | | | | | | | | |
One Easton Oval /
Columbus, Ohio | | One Easton Oval, Columbus, Ohio | | | 1997 | | | — | | | 125,031 | | | | — | | | $ | 11,911,000 | | | $ | 9,528,800 | | | | 89.4 | % | | $ | 142,932 | |
| | | | | | | | | |
Two Easton Oval /
Columbus, Ohio | | Two Easton Oval, Columbus, Ohio | | | 1995 | | | — | | | 128,674 | | | | — | | | $ | 12,744,000 | | | $ | 10,195,200 | | | | 74.6 | % | | $ | 152,928 | |
| | | | | | | | | |
Weston Pointe I /
Ft. Lauderdale, Florida | | 2400 North Commerce Parkway, Weston, FL | | | 1999 | | | — | | | 97,579 | | | | — | | | $ | 19,384,250 | | | $ | 15,507,400 | | | | 87.1 | % | | $ | 232,611 | |
| | | | | | | | | |
Weston Pointe II /
Ft. Lauderdale, Florida | | 2200 North Commerce Parkway, Weston, FL | | | 2000 | | | — | | | 97,180 | | | | — | | | $ | 23,375,950 | | | $ | 18,700,760 | | | | 100 | % | | $ | 280,511 | |
| | | | | | | | | |
Weston Pointe III /
Ft. Lauderdale, Florida | | 2250 North Commerce Parkway, Weston, FL | | | 2003 | | | American Intercontinental University(9) | | | 97,178 | | | | 09/2015 | | | $ | 23,583,550 | | | $ | 18,866,840 | | | | 100 | % | | $ | 283,003 | |
| | | | | | | | | |
Weston Pointe IV /
Ft. Lauderdale, Florida | | 2100 North Commerce Parkway, Weston, FL | | | 2006 | | | General Services Administration(6) | | | 96,175 | | | | 04/2019 | | | $ | 28,256,250 | | | $ | 22,605,000 | | | | 100 | % | | $ | 339,075 | |
| | | | | | | | | |
One Conway Park /Chicago, Illinois | | 100 Field Drive, Lake Forest, IL | | | 1989 | | | — | | | 105,000 | | | | — | | | $ | 15,400,000 | | | $ | 12,320,000 | | | | 86.5 | % | | $ | 184,800 | |
| | | | | | | | | |
West Lake at Conway /
Chicago, Illinois | | 1925 West Field Ct., Lake Forest, IL | | | 2008 | | | — | | | 99,538 | | | | — | | | $ | 17,575,000 | | | $ | 14,060,000 | | | | 90.1 | % | | $ | 210,900 | |
| | | | | | | | | |
Atrium I /Columbus, Ohio | | 5525 Parkcenter Circle, Dublin, OH | | | 1996 | | | Nationwide Mutual Insurance Company(10) | | | 315,102 | | |
| 05/2018;
05/2019 |
(11) | | $ | 45,250,000 | | | $ | 36,200,000 | | | | 100 | % | | $ | 543,000 | |
| (1) | This column represents tenants that currently occupy more than 50,000 net rentable square feet of each property. Properties which do not list a tenant are multi-tenant properties that do not currently have a tenant that occupies more than 50,000 net rentable square feet. |
| (2) | Approximate total purchase price, exclusive of customary closing costs, paid by the Duke Joint Venture for each property. |
| (3) | Pro rata share of approximate purchase price is at the Company’s pro rata share of effective ownership for each of these properties, which was funded using net proceeds of the Company’s current public offering. |
| (4) | Acquisition fees payable to the Investment Advisor are not included in the total acquisition cost for the properties. |
| (5) | NCS Pearson, Inc. provides services, software, systems, and Internet-based technologies for the collection, management, and interpretation of data. |
| (6) | The General Services Administration is an independent agency of the Federal Government of the United States of America, which supplies products and communications for U.S. government offices, provides transportation and office space to federal employees and develops government-wide cost-minimizing policies and other management tasks. |
| (7) | Hartford Fire Insurance Company is a subsidiary of The Hartford Financial Services Group and one of the world’s leading providers of fire, marine and casualty insurance. |
F-55
CB RICHARD ELLIS REALTY TRUST
NOTES TO THE CONSOLIDATED FINANCIAL STATEMENTS—(Continued)
For the Years Ended December 31, 2010, 2009 and 2008
| (8) | Citicorp North America, Inc., provides regional banking services and is a subsidiary of Citigroup, Inc. (NYSE: C). |
| (9) | American Intercontinental University is an international for-profit university with both physical and online campuses. |
| (10) | Nationwide Mutual Insurance Company is one of the nation’s largest insurance and financial services companies. |
| (11) | This tenant has two separate leases within this property, as they rent two separate spaces. |
On March 24, 2011, in connection with the acquisition of the Remaining Properties as described above, the Duke joint venture entered into a $275,000,000 unsecured term loan (the “Term Loan Agreement”) with Wells Fargo Bank, National Association. While the term loan is non-recourse to us, the pro rata share of the term loan obligation attributable to us is $220,000,000 in accordance with our ownership interest in the Duke joint venture. The loan proceeds were used to accelerate the acquisition of the Remaining Properties. The loan has a six-month term and two six-month extension options. The term loan has an interest rate of LIBOR plus 2.50% and is fully pre-payable at any time, subject to any customary costs. An origination fee of $1,650,000 was paid to Wells Fargo Bank, National Association at the closing of the term loan. The Term Loan Agreement contains customary representations and warrants and covenants. During the term of the loan, the Duke Joint Venture has agreed to comply with certain financial covenants related to its leverage ratio, net asset value, unencumbered leverage ratio and the inability to enter into certain types of investments.
F-56
Schedule III—Properties and Accumulated Depreciation Through December 31, 2010 (in Thousands)
| | | | | | | | | | | | | | | | | | | | | | | | | | | | | | | | | | | | | | | | |
| | | Acquisition Costs | | | Improvements
Subsequent
to Purchase
Date | | | Total
Cost | | | Accumulated
Depreciation
and Amortiza-
tion | | | Net
Investments
in Real
Estate | |
Property | | Encumbrances
Net | | | Land | | | Site
Improve-
ments | | | Building
and
Improve-
ments | | | Tenant
Improve-
ments | | | Total | | | | | |
REMEC | | $ | 13,250 | | | $ | 11,862 | | | $ | — | | | $ | 8,933 | | | $ | 3,217 | | | $ | 24,012 | | | $ | 95 | | | $ | 24,107 | | | $ | (3,071 | ) | | $ | 21,036 | |
300 Constitution | | | 12,000 | | | | 5,591 | | | | — | | | | 13,826 | | | | 733 | | | | 20,150 | | | | — | | | | 20,150 | | | | (2,723 | ) | | | 17,427 | |
Deerfield Commons I | | | 9,725 | | | | 2,053 | | | | 934 | | | | 7,760 | | | | 1,363 | | | | 12,110 | | | | 906 | | | | 13,016 | | | | (3,176 | ) | | | 9,840 | |
Deerfield Commons II | | | — | | | | 2,262 | | | | — | | | | — | | | | — | | | | 2,262 | | | | — | | | | 2,262 | | | | — | | | | 2,262 | |
660 North Dorothy | | | — | | | | 1,576 | | | | 417 | | | | 3,402 | | | | 199 | | | | 5,594 | | | | 212 | | | | 5,806 | | | | (784 | ) | | | 5,022 | |
505 Century | | | — | | | | 950 | | | | 304 | | | | 3,685 | | | | 119 | | | | 5,058 | | | | 321 | | | | 5,379 | | | | (800 | ) | | | 4,579 | |
631 International | | | — | | | | 923 | | | | 238 | | | | 2,912 | | | | 285 | | | | 4,358 | | | | 101 | | | | 4,459 | | | | (657 | ) | | | 3,802 | |
602 Central Blvd. | | | — | | | | 2,840 | | | | 251 | | | | 13,952 | | | | — | | | | 17,043 | | | | — | | | | 17,043 | | | | (1,373 | ) | | | 15,670 | |
Bolingbrook Point III | | | 9,000 | | | | 2,423 | | | | 522 | | | | 13,434 | | | | 164 | | | | 16,543 | | | | 7 | | | | 16,550 | | | | (1,376 | ) | | | 15,174 | |
Fairforest Bldg 5 | | | 9,769 | | | | 1,788 | | | | 2,462 | | | | 12,017 | | | | 100 | | | | 16,367 | | | | — | | | | 16,367 | | | | (1,636 | ) | | | 14,731 | |
Fairforest Bldg. 6 | | | 2,864 | | | | 1,181 | | | | 506 | | | | 3,753 | | | | 459 | | | | 5,899 | | | | — | | | | 5,899 | | | | (625 | ) | | | 5,274 | |
Fairforest Bldg. 7 | | | — | | | | 660 | | | | 463 | | | | 4,503 | | | | — | | | | 5,626 | | | | 598 | | | | 6,224 | | | | (518 | ) | | | 5,706 | |
HJ Park Bldg. 1 | | | 637 | | | | 575 | | | | 468 | | | | 2,472 | | | | 12 | | | | 3,527 | | | | — | | | | 3,527 | | | | (322 | ) | | | 3,205 | |
North Rhett I | | | 3,776 | | | | 1,290 | | | | 366 | | | | 9,627 | | | | 428 | | | | 11,711 | | | | — | | | | 11,711 | | | | (1,077 | ) | | | 10,634 | |
North Rhett II | | | 2,057 | | | | 539 | | | | 144 | | | | 5,670 | | | | 26 | | | | 6,379 | | | | — | | | | 6,379 | | | | (542 | ) | | | 5,837 | |
North Rhett III | | | 1,705 | | | | 631 | | | | 209 | | | | 3,366 | | | | 18 | | | | 4,224 | | | | — | | | | 4,224 | | | | (342 | ) | | | 3,882 | |
North Rhett IV | | | 9,478 | | | | 2,433 | | | | 1,716 | | | | 12,445 | | | | 91 | | | | 16,685 | | | | — | | | | 16,685 | | | | (1,466 | ) | | | 15,219 | |
Jedburg Commerce Park | | | — | | | | 4,029 | | | | 3,026 | | | | 20,381 | | | | 149 | | | | 27,585 | | | | — | | | | 27,585 | | | | (2,489 | ) | | | 25,096 | |
Mount Holly Bldg. | | | 2,057 | | | | 1,012 | | | | 1,050 | | | | 3,699 | | | | 18 | | | | 5,779 | | | | — | | | | 5,779 | | | | (568 | ) | | | 5,211 | |
Orangeburg Park Bldg. | | | 2,092 | | | | 544 | | | | 641 | | | | 3,636 | | | | 93 | | | | 4,914 | | | | — | | | | 4,914 | | | | (546 | ) | | | 4,368 | |
Kings Mt. I | | | 1,786 | | | | 508 | | | | 362 | | | | 3,097 | | | | 166 | | | | 4,133 | | | | 40 | | | | 4,173 | | | | (515 | ) | | | 3,658 | |
Kings Mt. II | | | 5,360 | | | | 773 | | | | 1,351 | | | | 10,199 | | | | 958 | | | | 13,281 | | | | — | | | | 13,281 | | | | (1,431 | ) | | | 11,850 | |
Kings Mt. III | | | — | | | | 1,183 | | | | 1,647 | | | | 13,738 | | | | — | | | | 16,568 | | | | 5 | | | | 16,573 | | | | (1,714 | ) | | | 14,859 | |
Union Cross Bldg. I | | | 2,621 | | | | 852 | | | | 759 | | | | 3,905 | | | | 27 | | | | 5,543 | | | | — | | | | 5,543 | | | | (509 | ) | | | 5,034 | |
Union Cross Bldg. II | | | 8,022 | | | | 1,658 | | | | 1,576 | | | | 12,271 | | | | 65 | | | | 15,570 | | | | — | | | | 15,570 | | | | (1,464 | ) | | | 14,106 | |
Lakeside Office Center | | | 9,000 | | | | 4,328 | | | | 817 | | | | 10,497 | | | | 1,139 | | | | 16,781 | | | | 179 | | | | 16,960 | | | | (1,362 | ) | | | 15,598 | |
Thames Valley Five | | | 8,781 | | | | 6,268 | | | | 920 | | | | 12,397 | | | | 75 | | | | 19,660 | | | | — | | | | 19,660 | | | | (1,078 | ) | | | 18,582 | |
Enclave on the Lake | | | 17,829 | | | | 4,056 | | | | 10,230 | | | | 20,823 | | | | 1,197 | | | | 36,306 | | | | 36 | | | | 36,342 | | | | (3,286 | ) | | | 33,056 | |
Albion Mills Retail Park | | | 8,769 | | | | 7,277 | | | | 172 | | | | 7,144 | | | | — | | | | 14,593 | | | | — | | | | 14,593 | | | | (470 | ) | | | 14,123 | |
Fairforest Bldg 1 | | | — | | | | 334 | | | | 107 | | | | 2,509 | | | | 5 | | | | 2,955 | | | | — | | | | 2,955 | | | | (164 | ) | | | 2,791 | |
Fairforest Bldg 2 | | | — | | | | 396 | | | | 122 | | | | 4,654 | | | | 2 | | | | 5,174 | | | | 200 | | | | 5,374 | | | | (320 | ) | | | 5,054 | |
Fairforest Bldg 3 | | | — | | | | 608 | | | | 231 | | | | 4,695 | | | | 14 | | | | 5,548 | | | | — | | | | 5,548 | | | | (310 | ) | | | 5,238 | |
Fairforest Bldg 4 | | | — | | | | 661 | | | | 331 | | | | 4,566 | | | | 10 | | | | 5,568 | | | | — | | | | 5,568 | | | | (320 | ) | | | 5,248 | |
Highway 290 Commerce Pk Bldg 1 | | | — | | | | 704 | | | | 219 | | | | 4,347 | | | | 8 | | | | 5,278 | | | | — | | | | 5,278 | | | | (292 | ) | | | 4,986 | |
Highway 290 Commerce Pk Bldg 2 | | | — | | | | 1,131 | | | | 363 | | | | 3,008 | | | | 24 | | | | 4,526 | | | | — | | | | 4,526 | | | | (235 | ) | | | 4,291 | |
Highway 290 Commerce Pk Bldg 5 | | | — | | | | 421 | | | | 162 | | | | 800 | | | | 4 | | | | 1,387 | | | | 24 | | | | 1,411 | | | | (75 | ) | | | 1,336 | |
Highway 290 Commerce Pk Bldg 6 | | | — | | | | 572 | | | | 176 | | | | 3,012 | | | | — | | | | 3,760 | | | | 3 | | | | 3,763 | | | | (200 | ) | | | 3,563 | |
Highway 290 Commerce Pk Bldg 7 | | | — | | | | 1,233 | | | | 510 | | | | 2,949 | | | | 1 | | | | 4,693 | | | | — | | | | 4,693 | | | | (248 | ) | | | 4,445 | |
Orchard Business Park 1 | | | — | | | | 358 | | | | 134 | | | | 880 | | | | — | | | | 1,372 | | | | 3 | | | | 1,375 | | | | (71 | ) | | | 1,304 | |
Orchard Business Park 2 | | | — | | | | 173 | | | | 62 | | | | 526 | | | | — | | | | 761 | | | | 35 | | | | 796 | | | | (56 | ) | | | 740 | |
Greenville/Spartanburg Ind. Pk. | | | — | | | | 460 | | | | 200 | | | | 2,584 | | | | 2 | | | | 3,246 | | | | 240 | | | | 3,486 | | | | (198 | ) | | | 3,288 | |
Community Cash Complex 1 | | | — | | | | 867 | | | | 175 | | | | 1,622 | | | | — | | | | 2,664 | | | | 232 | | | | 2,896 | | | | (300 | ) | | | 2,596 | |
Community Cash Complex 2 | | | — | | | | 887 | | | | 136 | | | | 1,169 | | | | 3 | | | | 2,195 | | | | — | | | | 2,195 | | | | — | | | | 2,195 | |
Community Cash Complex 3 | | | — | | | | 205 | | | | 16 | | | | 1,190 | | | | 22 | | | | 1,433 | | | | 21 | | | | 1,454 | | | | (93 | ) | | | 1,361 | |
Community Cash Complex 4 | | | — | | | | 132 | | | | 15 | | | | 399 | | | | — | | | | 546 | | | | — | | | | 546 | | | | — | | | | 546 | |
Community Cash Complex 5 | | | — | | | | 138 | | | | 15 | | | | 671 | | | | — | | | | 824 | | | | — | | | | 824 | | | | — | | | | 824 | |
Cherokee Corporate Pk | | | — | | | | 294 | | | | 514 | | | | 2,903 | | | | 4 | | | | 3,715 | | | | — | | | | 3,715 | | | | (249 | ) | | | 3,466 | |
Avion Midrise III & IV | | | 20,496 | | | | 6,810 | | | | 1,179 | | | | 30,004 | | | | 1,105 | | | | 39,098 | | | | — | | | | 39,098 | | | | (2,417 | ) | | | 36,681 | |
Maskew Retail Park | | | 21,759 | | | | 16,547 | | | | 1,065 | | | | 26,770 | | | | — | | | | 44,382 | | | | — | | | | 44,382 | | | | (1,641 | ) | | | 42,741 | |
13201 Wilfred Lane | | | — | | | | 2,274 | | | | 412 | | | | 11,049 | | | | 129 | | | | 13,864 | | | | — | | | | 13,864 | | | | (488 | ) | | | 13,376 | |
3011, 3055 & 3077 Comcast Place | | | — | | | | 7,013 | | | | 998 | | | | 21,858 | | | | 7,739 | | | | 37,608 | | | | — | | | | 37,608 | | | | (1,675 | ) | | | 35,933 | |
140 Depot Street | | | — | | | | 3,560 | | | | 1,172 | | | | 11,898 | | | | 158 | | | | 16,788 | | | | — | | | | 16,788 | | | | (564 | ) | | | 16,224 | |
12650 Ingenuity Drive | | | 12,333 | | | | 3,520 | | | | 397 | | | | 13,330 | | | | 1,517 | | | | 18,764 | | | | — | | | | 18,764 | | | | (695 | ) | | | 18,069 | |
Crest Ridge Corporate Center I | | | — | | | | 4,624 | | | | 335 | | | | 16,024 | | | | 3,174 | | | | 24,157 | | | | — | | | | 24,157 | | | | (984 | ) | | | 23,173 | |
F-57
Schedule III—Properties and Accumulated Depreciation Through December 31, 2010 (in Thousands)
| | | | | | | | | | | | | | | | | | | | | | | | | | | | | | | | | | | | | | | | |
| | | Acquisition Costs | | | Improvements
Subsequent
to
Purchase Date | | | Total
Cost | | | Accumulated
Depreciation
and Amortiza-
tion | | | Net
Investments
in Real
Estate | |
Property | | Encumbrances
Net | | | Land | | | Site
Improve-
ments | | | Building
and
Improve-
ments | | | Tenant
Improve-
ments | | | Total | | | | | |
West Point Trade Center | | | — | | | | 5,843 | | | | 2,925 | | | | 16,067 | | | | 368 | | | | 25,203 | | | | — | | | | 25,203 | | | | (644 | ) | | | 24,559 | |
5160 Hacienda Drive | | | — | | | | 8,100 | | | | 740 | | | | 20,776 | | | | 1,693 | | | | 31,309 | | | | — | | | | 31,309 | | | | (445 | ) | | | 30,864 | |
10450 Pacific Center Court | | | — | | | | 5,000 | | | | 724 | | | | 20,410 | | | | 1,061 | | | | 27,195 | | | | — | | | | 27,195 | | | | (412 | ) | | | 26,783 | |
225 Summit Avenue | | | — | | | | 7,100 | | | | 978 | | | | 25,460 | | | | 2,240 | | | | 35,778 | | | | — | | | | 35,778 | | | | (464 | ) | | | 35,314 | |
One WaySide Road | | | 27,018 | | | | 7,500 | | | | 517 | | | | 37,870 | | | | 2,442 | | | | 48,329 | | | | — | | | | 48,329 | | | | (657 | ) | | | 47,672 | |
100 Tice Blvd. | | | 45,808 | | | | 7,300 | | | | 1,048 | | | | 47,114 | | | | 2,231 | | | | 57,693 | | | | — | | | | 57,693 | | | | (372 | ) | | | 57,321 | |
Ten Parkway North | | | 12,600 | | | | 3,500 | | | | 276 | | | | 15,764 | | | | 1,368 | | | | 20,908 | | | | — | | | | 20,908 | | | | (48 | ) | | | 20,860 | |
Pacific Corporate Park | | | 85,000 | | | | 21,128 | | | | 43,218 | | | | 54,202 | | | | 13,611 | | | | 132,159 | | | | — | | | | 132,159 | | | | (484 | ) | | | 131,675 | |
4701 Gold Spike Drive | | | — | | | | 3,500 | | | | 381 | | | | 14,078 | | | | 95 | | | | 18,054 | | | | — | | | | 18,054 | | | | (68 | ) | | | 17,986 | |
1985 International Way | | | — | | | | 2,200 | | | | 361 | | | | 10,707 | | | | 30 | | | | 13,298 | | | | — | | | | 13,298 | | | | (51 | ) | | | 13,247 | |
Summit Distribution Center | | | — | | | | 2,300 | | | | 525 | | | | 9,199 | | | | 64 | | | | 12,088 | | | | — | | | | 12,088 | | | | (49 | ) | | | 12,039 | |
3660 Deerpark Boulevard | | | — | | | | 2,400 | | | | 418 | | | | 10,127 | | | | 64 | | | | 13,009 | | | | — | | | | 13,009 | | | | (51 | ) | | | 12,958 | |
Tolleson Commerce Park II | | | — | | | | 2,200 | | | | 488 | | | | 4,981 | | | | 54 | | | | 7,723 | | | | — | | | | 7,723 | | | | (32 | ) | | | 7,691 | |
100 Kimball Drive | | | — | | | | 8,800 | | | | 1,237 | | | | 39,708 | | | | 2,869 | | | | 52,614 | | | | — | | | | 52,614 | | | | — | | | | 52,614 | |
| | | | | | | | | | | | | | | | | | | | | | | | | | | | | | | | | | | | | | | | |
| | $ | 365,592 | | | $ | 212,858 | | | $ | 94,433 | | | $ | 743,424 | | | $ | 53,212 | | | $ | 1,103,927 | | | $ | 3,258 | | | $ | 1,107,185 | | | $ | (51,292 | ) | | $ | 1,055,893 | |
| | | | | | | | | | | | | | | | | | | | | | | | | | | | | | | | | | | | | | | | |
| (1) | Included is an impairment of $9,160,000 at December 31, 2009 due to property vacancy associated with the current challenging economic environment. |
Investments in real estate (in thousands):
| | | | | | | | | | | | |
| | | December 31, | |
| | | 2010(1) | | | 2009(2) | | | 2008 | |
Balance, beginning of the year | | $ | 671,131 | | | $ | 501,539 | | | $ | 317,038 | |
Acquisitions | | | 466,554 | | | | 178,282 | | | | 184,214 | |
Improvements | | | 1,726 | | | | 470 | | | | 287 | |
Transfers to joint ventures | | | (32,226 | ) | | | — | | | | — | |
| | | | | | | | | | | | |
Balance, end of the year | | $ | 1,107,185 | | | $ | 680,291 | | | $ | 501,539 | |
| | | | | | | | | | | | |
| (1) | 2010 beginning balance includes an impairment of $9,160,000 at December 31, 2009, relative to Kings Mountain III. |
| (2) | This balance agrees to the total cost of our investments in real estate as presented in the Schedule III table above. Our net investment in real estate is inclusive of our revised cost basis in Kings Mountain III of $15,300,000 which includes the effect of the impairment charge of $9,160,000. |
Accumulated depreciation related to investments in real estate (in thousands):
| | | | | | | | | | | | |
| | | December 31, | |
| | | 2010 | | | 2009 | | | 2008 | |
Balance, beginning of year | | $ | (31,558 | ) | | $ | (16,712 | ) | | $ | (7,233 | ) |
Additions | | | (19,958 | ) | | | (14,846 | ) | | | (9,479 | ) |
Transfers to joint ventures | | | 224 | | | | — | | | | — | |
| | | | | | | | | | | | |
Balance, end of the year | | $ | (51,292 | ) | | $ | (31,558 | ) | | $ | (16,712 | ) |
| | | | | | | | | | | | |
The aggregate gross cost of our investments in real estate for U.S. Federal income tax purposes approximated $1,271,465,000, $777,449,000 and $556,945,000 as of December 31, 2010, 2009 and 2008.
F-58
Report of Independent Registered Public Accounting Firm
The Members
Duke/Hulfish, LLC:
We have audited the accompanying consolidated balance sheets of Duke/Hulfish, LLC and subsidiaries (the Company) as of December 31, 2010 and 2009, and the related consolidated statements of operations, members’ equity, and cash flows for the years ended December 31, 2010 and 2009 and for the period from April 29, 2008 (inception) through December 31, 2008. In connection with our audit of the consolidated financial statements, we have also audited the financial statement schedule III. These consolidated financial statements and financial statement schedule are the responsibility of the Company’s management. Our responsibility is to express an opinion on these consolidated financial statements and financial statement schedule based on our audits.
We conducted our audits in accordance with the standards of the Public Company Accounting Oversight Board (United States). Those standards require that we plan and perform the audit to obtain reasonable assurance about whether the financial statements are free of material misstatement. An audit includes examining, on a test basis, evidence supporting the amounts and disclosures in the financial statements. An audit also includes assessing the accounting principles used and significant estimates made by management, as well as evaluating the overall financial statement presentation. We believe that our audits provide a reasonable basis for our opinion.
In our opinion, the consolidated financial statements referred to above present fairly, in all material respects, the financial position of Duke/Hulfish, LLC and subsidiaries as of December 31, 2010 and 2009 and the results of their operations and their cash flows for the years ended December 31, 2010 and 2009 and for the period from April 29, 2008 (inception) through December 31, 2008 in conformity with U.S. generally accepted accounting principles. Also in our opinion, the related financial statement schedule III, when considered in relation to the basic consolidated financial statements taken as a whole, presents fairly, in all material respects, the information set forth therein.
/s/ KPMG LLP
Indianapolis, Indiana
March 17, 2011
F-59
DUKE/HULFISH, LLC AND SUBSIDIARIES
Consolidated Balance Sheets
December 31, 2010 and 2009
| | | | | | | | |
| | | 2010 | | | 2009 | |
| Assets | | | | | | | | |
Land and land improvements | | $ | 101,073,838 | | | | 68,462,328 | |
Buildings | | | 377,321,002 | | | | 236,469,087 | |
Tenant improvements | | | 71,053,738 | | | | 47,280,865 | |
Development in progress | | | 13,595,116 | | | | — | |
| | | | | | | | |
| | | 563,043,694 | | | | 352,212,280 | |
Accumulated depreciation | | | (27,051,517 | ) | | | (12,466,048 | ) |
| | | | | | | | |
Net investment property | | | 535,992,177 | | | | 339,746,232 | |
Cash and cash equivalents | | | 2,919,431 | | | | 4,821,323 | |
Accounts receivable, net of allowance for doubtful accounts of $50,924 and $0, respectively | | | 2,450,533 | | | | 1,904,649 | |
Accrued straight line rent | | | 6,301,237 | | | | 3,735,651 | |
Loan acquisition costs, net of accumulated amortization of $480,952 and $248,371, respectively | | | 2,110,767 | | | | 828,015 | |
Intangible lease assets and deferred leasing costs, net of accumulated amortization of $7,521,293 and $2,931,382, respectively | | | 82,511,399 | | | | 30,340,257 | |
Prepaid insurance and other assets | | | 526,903 | | | | 348,418 | |
| | | | | | | | |
| | $ | 632,812,447 | | | | 381,724,545 | |
| | | | | | | | |
| Liabilities and Members’ Equity | | | | | | | | |
Mortgage notes payable | | $ | 242,000,000 | | | | 150,000,000 | |
Accounts payable and accrued expenses | | | 1,080,619 | | | | 45,641 | |
Accrued real estate taxes | | | 3,428,300 | | | | 2,245,203 | |
Accrued interest | | | 1,023,333 | | | | 697,500 | |
Development in progress payables | | | 2,000,094 | | | | 480,921 | |
Prepaid rent and security deposits | | | 1,824,513 | | | | 634,676 | |
Other liabilities | | | 1,339,678 | | | | 190,651 | |
| | | | | | | | |
Total liabilities | | | 252,696,537 | | | | 154,294,592 | |
Members’ equity | | | 380,115,910 | | | | 227,429,953 | |
| | | | | | | | |
| | $ | 632,812,447 | | | | 381,724,545 | |
| | | | | | | | |
See accompanying notes to consolidated financial statements.
F-60
DUKE/HULFISH, LLC AND SUBSIDIARIES
Consolidated Statements of Operations
Years ended December 31, 2010 and 2009 and for the period
from April 29, 2008 (inception) through December 31, 2008
| | | | | | | | | | | | |
| | | 2010 | | | 2009 | | | 2008 | |
Revenues: | | | | | | | | | | | | |
Rental income | | $ | 45,028,210 | | | | 26,086,746 | | | | 4,789,154 | |
Straight line rental income | | | 2,565,586 | | | | 3,218,925 | | | | 516,726 | |
| | | | | | | | | | | | |
| | | 47,593,796 | | | | 29,305,671 | | | | 5,305,880 | |
| | | | | | | | | | | | |
| | | |
Operating expenses | | | | | | | | | | | | |
Rental expenses | | | 3,743,153 | | | | 1,897,063 | | | | 175,180 | |
Property management fees | | | 1,020,105 | | | | 550,356 | | | | 108,619 | |
Real estate taxes | | | 5,142,214 | | | | 2,930,322 | | | | 371,499 | |
Interest expense | | | 8,893,400 | | | | 8,576,140 | | | | 1,612,091 | |
Depreciation and amortization | | | 18,892,655 | | | | 12,714,850 | | | | 2,663,582 | |
| | | | | | | | | | | | |
| | | 37,691,527 | | | | 26,668,731 | | | | 4,930,971 | |
| | | | | | | | | | | | |
| | | |
Earnings from rental operations | | | 9,902,269 | | | | 2,636,940 | | | | 374,909 | |
General and administrative expenses | | | 778,291 | | | | 596,344 | | | | 99,734 | |
| | | | | | | | | | | | |
Operating income | | | 9,123,978 | | | | 2,040,596 | | | | 275,175 | |
Interest income | | | 1,693 | | | | 2,781 | | | | 821 | |
| | | | | | | | | | | | |
Net income | | $ | 9,125,671 | | | | 2,043,377 | | | | 275,996 | |
| | | | | | | | | | | | |
See accompanying notes to consolidated financial statements.
F-61
DUKE/HULFISH, LLC AND SUBSIDIARIES
Consolidated Statements of Members’ Equity
Years ended December 31, 2010 and 2009 and for the period
from April 29, 2008 (inception) through December 31, 2008
| | | | | | | | | | | | |
| | | CBRE
Operating
Partnership
L.P. | | | Duke Realty
Limited
Partnership | | | Total | |
Members’ equity—April 29, 2008 (inception) | | $ | — | | | | — | | | | — | |
Capital contributions | | | 107,080,823 | | | | 279,039,150 | | | | 386,119,973 | |
Capital distributions | | | — | | | | (252,268,945 | ) | | | (252,268,945 | ) |
Net income | | | 275,996 | | | | — | | | | 275,996 | |
| | | | | | | | | | | | |
Members’ equity—December 31, 2008 | | | 107,356,819 | | | | 26,770,205 | | | | 134,127,024 | |
Capital contributions | | | 82,657,642 | | | | 77,993,744 | | | | 160,651,386 | |
Capital distributions | | | (9,650,000 | ) | | | (59,741,834 | ) | | | (69,391,834 | ) |
Net income | | | 1,817,196 | | | | 226,181 | | | | 2,043,377 | |
| | | | | | | | | | | | |
Members’ equity—December 31, 2009 | | | 182,181,657 | | | | 45,248,296 | | | | 227,429,953 | |
Capital contributions | | | 219,572,078 | | | | 52,774,140 | | | | 272,346,218 | |
Capital distributions | | | (104,723,849 | ) | | | (24,062,083 | ) | | | (128,785,932 | ) |
Net income | | | 7,062,843 | | | | 2,062,828 | | | | 9,125,671 | |
| | | | | | | | | | | | |
Members’ equity—December 31, 2010 | | $ | 304,092,729 | | | | 76,023,181 | | | | 380,115,910 | |
| | | | | | | | | | | | |
See accompanying notes to consolidated financial statements.
F-62
DUKE/HULFISH, LLC AND SUBSIDIARIES
Consolidated Statements of Cash Flows
Years ended December 31, 2010 and 2009 and for the period
from April 29, 2008 (inception) through December 31, 2008
| | | | | | | | | | | | |
| | | 2010 | | | 2009 | | | 2008 | |
Cash flows from operating activities: | | | | | | | | | | | | |
Net income | | $ | 9,125,671 | | | | 2,043,377 | | | | 275,996 | |
Adjustments to reconcile net income to net cash provided by (used in) operating activities: | | | | | | | | | | | | |
Depreciation and amortization | | | 19,175,380 | | | | 12,733,848 | | | | 2,663,582 | |
Amortization of loan acquisition costs | | | 232,581 | | | | 206,140 | | | | 42,231 | |
Straight-line rent adjustment | | | (2,565,586 | ) | | | (3,218,925 | ) | | | (516,726 | ) |
Accounts receivable, net | | | (1,256,869 | ) | | | (2,401,954 | ) | | | (90,932 | ) |
Prepaid insurance and other assets | | | (178,485 | ) | | | 2,403,455 | | | | (2,752,303 | ) |
Accounts payable, accrued expenses and other liabilities | | | 907,759 | | | | (709,849 | ) | | | (51,728 | ) |
Accrued real estate taxes | | | 400,058 | | | | 1,170,931 | | | | (39,463 | ) |
Accrued interest | | | 325,833 | | | | 236,220 | | | | 461,280 | |
Prepaid rent and security deposits | | | 705,543 | | | | 396,228 | | | | (115,852 | ) |
| | | | | | | | | | | | |
Net cash provided by (used in) operating activities | | | 26,871,885 | | | | 12,859,471 | | | | (123,915 | ) |
| | | | | | | | | | | | |
Cash flows from investing activities: | | | | | | | | | | | | |
Acquisition of real estate assets | | | (208,056,574 | ) | | | (31,399,287 | ) | | | — | |
Development of real estate assets, net of amounts accrued as of year end | | | (11,595,022 | ) | | | — | | | | — | |
Recurring building improvements | | | (29,587 | ) | | | — | | | | — | |
Recurring leasing costs | | | (759,949 | ) | | | — | | | | — | |
| | | | | | | | | | | | |
Net cash used in investing activities | | | (220,441,132 | ) | | | (31,399,287 | ) | | | — | |
| | | | | | | | | | | | |
Cash flows from financing activities: | | | | | | | | | | | | |
Loan acquisition costs | | | (1,515,333 | ) | | | — | | | | (1,076,886 | ) |
Proceeds from mortgage borrowings | | | 92,000,000 | | | | — | | | | 150,000,000 | |
Contributions from members | | | 216,668,620 | | | | 88,941,896 | | | | 107,280,823 | |
Distributions to members | | | (115,485,932 | ) | | | (69,391,834 | ) | | | (252,268,945 | ) |
| | | | | | | | | | | | |
Net cash provided by financing activities | | | 191,667,355 | | | | 19,550,062 | | | | 3,934,992 | |
| | | | | | | | | | | | |
Net (decrease) increase in cash and cash equivalents | | | (1,901,892 | ) | | | 1,010,246 | | | | 3,811,077 | |
Cash and cash equivalents at beginning of period | | | 4,821,323 | | | | 3,811,077 | | | | — | |
| | | | | | | | | | | | |
Cash and cash equivalents at end of year | | $ | 2,919,431 | | | | 4,821,323 | | | | 3,811,077 | |
| | | | | | | | | | | | |
Supplemental cash flow disclosure: | | | | | | | | | | | | |
Cash paid for interest | | $ | 8,444,986 | | | | 8,133,780 | | | | 1,108,580 | |
Supplemental disclosure of noncash activities: | | | | | | | | | | | | |
Contribution of properties by CBRE Operating Partnership, L.P. and related net working capital | | $ | 42,377,598 | | | | — | | | | — | |
Contribution of properties by Duke Realty Limited Partnership and related net working capital | | | — | | | | 71,709,490 | | | | 278,839,150 | |
Declared distribution/contribution—Anson Expansion | | $ | 13,300,000 | | | | — | | | | — | |
See accompanying notes to consolidated financial statements.
F-63
DUKE/HULFISH, LLC AND SUBSIDIARIES
NOTES TO CONSOLIDATED FINANCIAL STATEMENTS
December 31, 2010 and 2009
(1) The Company
Duke/Hulfish, LLC (Company) was formed on April 29, 2008 (inception) by Duke Realty Limited Partnership (DRLP) and CBRE Operating Partnership, L.P. (CBOP) (collectively, the Members), to own and manage commercial real estate properties. DRLP’s and CBOP’s percentage membership interests in the Company are 20% and 80%, respectively. The term of the Company extends through December 31, 2033 unless the Company is dissolved earlier pursuant to other conditions as defined in the Company’s operating agreement (the Agreement).
On May 5, 2008, the Members entered into a Contribution Agreement with the Company whereby DRLP would contribute properties based on an agreed value to the Company in exchange for cash and a 20% membership interest in the Company. CBOP would contribute cash to the Company in exchange for an 80% membership interest in the Company.
On June 12, 2008, DRLP contributed one real estate property with an agreed value of $43,376,814 including prorations. A cash contribution of $34,941,451 was made by CBOP to the Company. A cash distribution of $34,641,451 was made to DRLP in order for CBOP to maintain an 80% interest in the Company.
In August 2008, CBOP and DRLP made working capital contributions of $800,000 and $200,000 to the Company, respectively.
On September 30, 2008, DRLP contributed four real estate properties with a combined agreed value of $138,809,514 including prorations. In connection with the indebtedness of the buildings contributed in the June 12, 2008 and September 30, 2008 contributions discussed in note 5, in order for CBOP to maintain an 80% interest in the Company, CBOP made a net cash contribution of $32,324,701 to the Company, which was net of a distribution of 80% of the $98,403,637 net financing proceeds received. A cash distribution of $111,047,611 was made to DRLP in order for DRLP to maintain a 20% interest in the Company. In connection with the indebtedness of the buildings contributed in the June 12, 2008 and September 30, 2008 contributions discussed in note 5, a distribution of $19,680,727, representing 20% of the $98,403,637 net financing proceeds received, was made to DRLP.
On December 10, 2008, DRLP contributed two real estate properties with a combined agreed value of $96,652,822 including prorations. In connection with the indebtedness discussed in note 5, in order for CBOP to maintain an 80% interest in the Company, CBOP made a net cash contribution of $39,014,671 to the Company, which was net of a distribution of 80% of the $47,767,229 net financing proceeds received. A cash distribution of $77,345,710 was made to DRLP in order for DRLP to maintain a 20% interest in the Company. In connection with the indebtedness discussed in note 5, a distribution of $9,553,446, representing 20% of the $47,767,229 net financing proceeds received, was made to DRLP.
On May 13, 2009, the Company acquired two real estate properties from an affiliate of DRLP with a combined agreed value of $31,399,287 including prorations. Cash contributions of $25,137,018 and $6,284,254 were made by CBOP and DRLP, respectively, to the Company.
On May 13, 2009, DRLP contributed one real estate property with an agreed value of $8,841,567 including prorations. A cash contribution of $7,078,496 was made by CBOP to the Company. A cash distribution of $7,071,943 was made to DRLP in order for CBOP to maintain an 80% interest in the Company.
On October 15, 2009, DRLP contributed one real estate property with an agreed value of $17,999,457 including prorations. A cash contribution of $14,404,125 was made by CBOP to the Company. A cash distribution of $14,398,426 was made to DRLP in order for CBOP to maintain an 80% interest in the Company.
On December 7, 2009, DRLP contributed one real estate property with an agreed value of $45,032,928 including prorations. A cash contribution of $36,038,003 was made by CBOP to the Company. A cash distribution of $35,858,965 was made to DRLP in order for CBOP to maintain an 80% interest in the Company.
On March 31, 2010, the Company acquired three real estate properties from DRLP with a combined agreed value of $35,150,615 including prorations and CBOP contributed two real estate properties with a combined agreed value of $42,377,598 including prorations. Cash contributions of $28,125,452 and $15,506,883 were made by CBOP and DRLP, respectively, to the Company. A cash distribution of $8,475,518 was made to CBOP in order for CBOP to maintain an 80% interest in the Company.
F-64
DUKE/HULFISH, LLC AND SUBSIDIARIES
NOTES TO CONSOLIDATED FINANCIAL STATEMENTS—(Continued)
December 31, 2010 and 2009
On August 24, 2010, the Company acquired 16.2 acres from a joint venture that DRLP had a 50% ownership interest in for an agreed value of $1,458,648 in order to expand a single tenant industrial building located in Indianapolis. The acquisition price is included in development in progress in the accompanying consolidated 2010 balance sheet.
On December 17, 2010, a wholly owned subsidiary of the Company, Duke Princeton, LLC, was formed to acquire directly or indirectly certain office properties. Upon formation, Duke Princeton, LLC entered into a purchase and sale agreement with DRLP and an affiliate of DRLP to acquire certain office properties for a total estimated gross agreed value of $516,650,000. The first tranche (Tranche 1) closed on December 21, 2010 and included seven office buildings located in the Midwest, South and Southeast with a combined gross agreed value of $173,850,000. The second tranche (Tranche 2) includes thirteen office buildings located in the Midwest and the Southeast and is expected to close in the first half of 2011 for an estimated combined gross agreed value of $342,800,000.
As part of Tranche I, the Company acquired five real estate properties from DRLP with a combined agreed value of $119,981,127 including prorations. Cash contributions of $96,065,493 and $24,016,373 were made by CBOP and DRLP, respectively, to the Company. In addition, as part of Tranche I, the Company acquired two real estate properties from an affiliate of DRLP with a combined agreed value of $52,924,832 including prorations. Cash contributions of $42,363,535 and $10,590,884, were made by CBOP and DRLP, respectively, to the Company.
As of December 31, 2010, the Company’s portfolio consisted of eight single tenant industrial buildings, 11 single tenant office buildings and five multi-tenant office buildings located in the Midwest, South, Southeast and Southwest comprising approximately 8.1 million square feet. The portfolio is 99.44% leased as of December 31, 2010.
(2) Summary of Significant Accounting Policies
a. Financial Accounting Standards Board (FASB) Codification
During 2009, the Company adopted the Financial Accounting Standards Board Accounting Standards Codification (FASB ASC), which reorganized all existing authoritative pronouncements from the various U.S. accounting standard setters into one comprehensive body of literature. The codification has no effect on any of the Company’s accounting policies.
b. Principles of Consolidation
The consolidated financial statements include the accounts of the Company and its wholly owned subsidiaries, DH Franklin, LLC, DH Anson, LLC, DH Jacksonville, LLC, DH Plainfield, LLC, DH Wilmer, LLC, DH Buckeye, LLC, DH West Jefferson, LLC, DH Katy, LLC, DH Orlando, LLC, DH Tampa LLC, DH Northpoint III, LLC, DH Goodyear, LLC and Duke Princeton, LLC.
All significant intercompany balances and transactions have been eliminated in the consolidated financial statements.
c. Real Estate Investments
Rental real property, including land, land improvements, buildings and building improvements, and tenant improvements, are included in investment property and are generally stated at cost. Buildings and land improvements are depreciated on the straight-line method over their estimated life not to exceed 40 and 15 years, respectively, and tenant improvement costs are depreciated on the straight-line method over the term of the related lease.
Cost Capitalization: Direct and certain indirect costs clearly associated with and incremental to the development, construction, leasing or expansion of real estate investments are capitalized as a cost of the property.
The Company capitalizes interest and direct and indirect project costs associated with the initial construction of a property up to the time the property is substantially complete and ready for its intended use. The Company believes the completion of the building shell is the proper basis for determining substantial completion and that this basis is the most widely accepted standard in the real estate industry. The interest rate used to capitalize interest is based upon the Company’s average borrowing rate on existing debt.
F-65
DUKE/HULFISH, LLC AND SUBSIDIARIES
NOTES TO CONSOLIDATED FINANCIAL STATEMENTS—(Continued)
December 31, 2010 and 2009
The Company capitalizes direct and indirect costs, including interest costs, on vacant space during extended lease-up periods after construction of the building shell has been completed if costs are being incurred to ready the vacant space for its intended use. If costs and activities incurred to ready the vacant space cease, then cost capitalization is also discontinued until such activities are resumed. Once necessary work has been completed on a vacant space, project costs are no longer capitalized. The Company ceases capitalization of all project costs on extended lease-up periods after the shorter of a one-year period after the completion of the building shell or when the property attains 90% occupancy. In addition, all leasing commissions paid to third parties for new leases or lease renewals are capitalized and amortized over the life of the related lease.
Impairment of Real Estate: Real estate investments are individually evaluated for impairment whenever events or changes in circumstances indicate that their carrying amounts may not be recoverable. If such an evaluation is considered necessary, the Company compares the carrying amount of that real estate investment with the expected undiscounted cash flows that are directly associated with, and that are expected to arise as a direct result of, the use and eventual disposition of that real estate investment. The Company’s estimate of the expected future cash flows used in testing for impairment is based on, among other things, estimates regarding future market conditions, rental rates, occupancy levels, costs of tenant improvements, leasing commissions and other tenant concessions, assumptions regarding the residual value of the real estate investments at the end of the anticipated holding period and the length of the anticipated holding period and is, therefore, subjective by nature. These assumptions could differ materially from actual results. If the Company’s strategy changes or if market conditions otherwise dictate a reduction in the holding period and an earlier sale date, an impairment loss could be recognized and such loss could be material. To the extent the carrying amount of a real estate investment exceeds the associated estimate of undiscounted cash flows, an impairment loss is recorded to reduce the carrying value of the asset to its fair value.
The determination of the fair value of real estate investments is also highly subjective, especially in markets where there is a lack of recent comparable transactions. The Company primarily utilizes the income approach to estimate the fair value, when necessary, of the income producing properties. To the extent that the assumptions used in testing long-lived assets for impairment differ from those of a marketplace participant, the assumptions are modified in order to estimate the fair value of a property when an impairment charge is measured. In addition to determining future cash flows, which make the estimation of a property’s undiscounted cash flows highly subjective, the selection of the discount rate and exit capitalization rate used in applying the income approach is also highly subjective.
Acquisition of Real Estate Property and Related Assets: On January 1, 2009, the Company adopted the new accounting standard (FASB ASC 805) on purchase accounting, which requires acquisition related costs to be expensed immediately as period costs. Acquisition costs amounted to $136,527 for the year ended December 31, 2010 and are included in rental expenses in the accompanying 2010 consolidated statement of operations. Acquisition costs for the year ended December 31, 2009 and for the period from April 29, 2008 (inception) through December 31, 2008 were not material to the accompanying financial statements.
The Company allocates the purchase price of acquired properties to net tangible and identified intangible assets based on their respective fair values. The allocation to tangible assets (buildings, tenant improvements and land) is based upon management’s determination of the value of the property as if it were vacant using discounted cash flow models similar to those used by independent appraisers. Factors considered by management include an estimate of carrying costs during the expected lease-up periods considering current market conditions, and costs to execute similar leases. The purchase price of real estate assets is also allocated among three categories of intangible assets consisting of the above or below market component of in-place leases, the value of in-place leases and the value of customer relationships.
| | ¡ | | The value allocable to the above or below market component of an acquired in-place lease is determined based upon the present value (using a discount rate that reflects the risks associated with the lease) of the difference between (i) the contractual amounts to be paid pursuant to the lease over its remaining term and (ii) management’s estimate of the amounts that would be paid using current fair market rates over the remaining term of the lease. The amounts allocated to above market leases and below market leases are included in intangible lease assets and other liabilities, respectively, in the consolidated balance sheet and are amortized to rental income over the remaining terms of the respective leases. |
| | ¡ | | The total amount of intangible assets is further allocated to in-place lease values, based upon management’s assessment of their respective values. These intangible assets are included in intangible lease assets in the consolidated balance sheet and are amortized to depreciation and amortization over the remaining term of the existing lease. |
d. Cash Equivalents
Highly liquid investments with a maturity of three months or less when purchased are classified as cash equivalents.
F-66
DUKE/HULFISH, LLC AND SUBSIDIARIES
NOTES TO CONSOLIDATED FINANCIAL STATEMENTS—(Continued)
December 31, 2010 and 2009
e. Valuation of Receivables
The Company reserves the entire receivable balance, including straight-line rent, of any tenant with an amount outstanding over 90 days. Additional reserves are recorded as necessary for more current amounts, where collectibility is deemed doubtful. Straight-line rent receivables for any tenant with long-term risk, regardless of the status of rent receivables, are reviewed and reserved as necessary.
f. Deferred Costs
Costs incurred in connection with obtaining financing are amortized to interest expense on the straight-line method, which approximates the interest method, over the term of the related loan. All direct and indirect costs, including estimated internal costs, associated with the leasing of real estate investments owned by the Company are capitalized and amortized over the term of the related lease. The Company includes lease incentive costs, which are payments made on behalf of a tenant to sign a lease, in intangible lease assets and amortizes them on a straight-line basis over the respective lease terms as a reduction of rental income. The Company includes as lease incentives amounts funded to construct tenant improvements owned by the tenant. Unamortized costs are charged to expense upon the early termination of the lease.
g. Revenues
The timing of revenue recognition under an operating lease is determined based upon ownership of the tenant improvements. If the Company is the owner of the tenant improvements, revenue recognition commences after the improvements are completed and the tenant takes possession or control of the space. In contrast, if the Company determines that the tenant allowances they are funding are lease incentives, then the Company commences revenue recognition when possession or control of the space is turned over to the tenant. Rental income from leases with scheduled rental increases during their terms is recognized on a straight-line basis. The Company includes reimbursements of specified operating expenses in rental income.
The Company records lease termination fees when a tenant has executed a definitive termination agreement with the Company and the payment of the termination fee is not subject to any material conditions that must be met or waived before the fee is due to the Company.
h. Income Taxes
For Federal and state income tax purposes, the Company is treated as a limited liability company and the allocated share of income or loss for the year is included in the income tax returns of the members; accordingly, no accounting for income taxes is required in the accompanying consolidated financial statements.
The Company accounts for uncertain tax positions in accordance with FASB ASC 740-10 (Interpretation 48) which prescribes the minimum recognition threshold a tax position is required to meet before being recognized in the financial statements. FASB ASC 740-10 also provides guidance on derecognition, measurement, classification, interest and penalties, accounting for interim periods and disclosures for uncertain tax positions. The tax years from April 29, 2008 (inception) through 2010 remain open to examination by the taxing jurisdictions to which the Company is subject.
i. Fair Value Measurements
On January 1, 2009, the Company adopted a new accounting standard that establishes a framework for measuring fair value of nonfinancial assets and liabilities that are not required or permitted to be measured at fair value on a recurring basis but only in certain circumstances, such as a business combination.
Assets and liabilities recorded at fair value on the consolidated balance sheets are categorized based on the inputs to the valuation techniques as follows:
| | ¡ | | Level 1 inputs utilize quoted prices (unadjusted) in active markets for identical assets or liabilities to which we have access. |
| | ¡ | | Level 2 inputs are inputs other than quoted prices included in Level 1 that are observable for the asset or liability, either directly or indirectly. Level 2 inputs may include quoted prices for similar assets and liabilities in active markets, as well as inputs that are observable for the asset or liability (other than quoted prices), such as interest rates and yield curves that are observable at commonly quoted intervals. |
| | ¡ | | Level 3 inputs are unobservable inputs for the asset or liability, which are typically based on an entity’s own assumptions, as there is little, if any, related market activity. |
F-67
DUKE/HULFISH, LLC AND SUBSIDIARIES
NOTES TO CONSOLIDATED FINANCIAL STATEMENTS—(Continued)
December 31, 2010 and 2009
In instances where the determination of the fair value measurement is based on inputs from different levels of the fair value hierarchy, the level in the fair value hierarchy within which the entire fair value measurement falls is based on the lowest level input that is significant to the fair value measurement in its entirety. The Company’s assessment of the significance of a particular input to the fair value measurement in its entirety requires judgment and considers factors specific to the asset or liability.
The fair value approximates the carrying value for all financial instruments except for indebtedness, which is discussed in note 5.
j. Use of Estimates
The preparation of the financial statements in conformity with U.S. generally accepted accounting principles requires management to make a number of estimates and assumptions that affect the reported amounts of assets and liabilities and the disclosure of contingent assets and liabilities at the date of the financial statements and the reported amounts of revenues and expenses during the reporting period. Actual results could differ from those estimates.
(3) Property Contributions and Acquisitions
During 2010 CBOP contributed two real estate properties to the Company. During 2010 the Company acquired eight real estate properties from DRLP. During 2010 and 2009, the Company acquired two real estate properties each year from an affiliate of DRLP. During 2009 and 2008, DRLP contributed three and seven real estate properties, respectively, to the Company. The 2010 and 2009 contributions and acquisitions were financed through cash contributions. The 2008 contributions were financed through cash contributions and mortgage note borrowings. The assets contributed and acquired were recorded at their agreed upon value at the date of contribution or acquisition, as summarized below:
| | | | | | | | | | | | |
| | | 2010 | | | 2009 | | | 2008 | |
Land and land improvements | | $ | 32,611,510 | | | | 15,963,234 | | | | 52,498,094 | |
Building | | | 140,826,903 | | | | 56,439,864 | | | | 180,031,798 | |
Tenant improvements | | | 23,772,873 | | | | 19,317,064 | | | | 27,964,801 | |
Intangible lease assets | | | 55,401,043 | | | | 12,648,312 | | | | 20,623,327 | |
| | | | | | | | | | | | |
Total assets acquired | | | 252,612,329 | | | | 104,368,474 | | | | 281,118,020 | |
Intangible lease liabilities | | | (198,479 | ) | | | — | | | | — | |
Net working capital assumed | | | (1,979,663 | ) | | | (1,259,697 | ) | | | (2,278,869 | ) |
| | | | | | | | | | | | |
Purchase price, net of assumed working capital | | $ | 250,434,187 | | | | 103,108,777 | | | | 278,839,151 | |
| | | | | | | | | | | | |
The allocation to tangible assets (buildings, tenant improvements and land and land improvements) is based upon management’s determination of the value of the property as if it were vacant using discounted cash flow models similar to those used by independent appraisers. Factors considered by management include an estimate of carrying costs during the expected lease-up periods considering current market conditions, and costs to execute similar leases. The Company’s valuation estimates primarily relied upon Level 3 inputs, as previously defined. The total amount of intangible assets is allocated to in-place lease values based upon management’s assessment of their respective values. The Company’s valuation estimates primarily relied upon Level 3 inputs, as previously defined. In-place lease intangible assets are amortized over the remaining life of the related leases, which is approximately nine years. Amortization expense for in-place lease intangible assets was $4,307,186, $2,399,882 and $512,502 for the years ended December 31, 2010 and 2009 and for the period from April 29, 2008 (inception) through December 31, 2008, respectively. Estimated amortization expense for the next five years and thereafter is as follows:
| | | | |
Year: | | | | |
2011 | | $ | 9,691,324 | |
2012 | | | 9,691,324 | |
2013 | | | 9,689,770 | |
2014 | | | 9,687,593 | |
2015 | | | 9,687,593 | |
Thereafter | | | 24,251,066 | |
| | | | |
| | $ | 72,698,670 | |
| | | | |
F-68
DUKE/HULFISH, LLC AND SUBSIDIARIES
NOTES TO CONSOLIDATED FINANCIAL STATEMENTS—(Continued)
December 31, 2010 and 2009
The value allocable to the above or below market component of an acquired in-place lease is determined based upon the present value (using an interest rate that reflects the risks associated with the lease) of the difference between (i) the contractual amounts to be paid pursuant to the lease over its remaining term and (ii) management’s estimate of the amounts that would be paid using current fair market rates over the remaining term of the lease. The Company’s valuation estimates primarily relied upon Level 3 inputs, as previously defined. Above and below market lease intangibles are amortized over the remaining life of the related leases, which is approximately 10 years. Net amortization expense of $282,725 and $18,998 is included as a reduction to rental income in the accompanying 2010 and 2009 consolidated statements of operations, respectively. There was no net amortization expense included as a reduction to rental income for the period from April 29, 2008 (inception) through December 31, 2008. Estimated net amortization expense for the next five years and thereafter is as follows:
| | | | |
Year: | | | | |
2011 | | $ | 1,010,103 | |
2012 | | | 973,898 | |
2013 | | | 839,508 | |
2014 | | | 812,630 | |
2015 | | | 812,348 | |
Thereafter | | | 3,804,471 | |
| | | | |
| | $ | 8,252,958 | |
| | | | |
The results of operations for the acquired properties have been included in operating income in the accompanying consolidated statements of operations since the date of contribution or acquisition.
Fair Value Measurements
The fair value estimates used in allocating the aggregate purchase price of each acquisition and contribution among the individual components of real estate assets and liabilities were determined primarily through calculating the “as-if vacant” value of each building, using the income approach, and relied significantly upon internally determined assumptions. The Company, thus, determined these estimates to have been primarily based upon Level 3 inputs, which are unobservable inputs based on the Company’s assumptions. The most significant assumptions utilized in these estimates, for 2010 acquisitions, are summarized as follows:
| | | | |
Discount rate | | | 9.6% – 10.3% | |
Capitalization rate | | | 7.2% – 9.5% | |
Lease up period | | | 12 – 24 months | |
Net rental rate per square foot | | $ | 12.75 – 18.00 | |
(4) Related Party Transactions
The following summarizes the significant arrangements with entities affiliated with DRLP that provide services to the Company:
| | ¡ | | Management, accounting and other professional services are provided for a fee equal to the greater of (1) 2% of the base rent under each lease or (2) the amount of property management fees recoverable from a tenant as additional rent under its lease, as defined. These fees amounted to $1,020,105, $550,356 and $108,619 for the years ended December 31, 2010 and 2009 and for the period from April 29, 2008 (inception) through December 31, 2008, respectively, and are included in property management fees in the accompanying statements of operations. |
| | ¡ | | Maintenance services are provided for a fee based on established hourly rates, which amounted to $252,923, $151,979 and $3,142 for the years ended December 31, 2010 and 2009 and for the period from April 29, 2008 (inception) through December 31, 2008, respectively, and are included in rental expenses in the accompanying statements of operations. |
| | ¡ | | Administration is provided for an administration fee equal to 15 basis points (0.15%) per annum of the stated value of the properties owned by the Company or its subsidiaries. These fees amounted to $681,603, $479,844 and $98,548 for the years ended December 31, 2010 and 2009 and for the period from April 29, 2008 (inception) through December 31, 2008, respectively, and are included in general and administrative expenses in the accompanying statements of operations. |
F-69
DUKE/HULFISH, LLC AND SUBSIDIARIES
NOTES TO CONSOLIDATED FINANCIAL STATEMENTS—(Continued)
December 31, 2010 and 2009
| | ¡ | | Pursuant to the management agreement, DRLP obtains insurance on behalf of the Company. Amounts incurred for insurance premiums were $858,759, $502,011 and $85,499 for the years ended December 31, 2010 and 2009 and for the period from April 29, 2008 (inception) through December 31, 2008, respectively, and are included in rental expenses in the accompanying statements of operations. |
| | ¡ | | Construction management services for tenant improvement costs and expansion projects are provided for a fee of 10% of hard costs, which amounted to $1,048,442 in 2010. There were no construction management fees incurred during 2009 or 2008. |
| | ¡ | | Development services are provided for a fee of 4% of defined project costs, which amounted to $461,314 in 2010. There were no development fees incurred during 2009 or 2008. |
A payable of $188,573 and $272,162 for operating expenses and administration fees due to DRLP or its affiliates are included in accounts payable and accrued expenses in the accompanying consolidated balance sheets as of December 31, 2010 and 2009, respectively.
(5) Indebtedness
On September 30, 2008, the Company entered into a loan agreement that allowed the Company to borrow up to $150,000,000 with 40/86 Mortgage Capital, Inc. (40/86).
In 2008, the Company entered into five mortgage notes with 40/86 totaling $99,200,000, which are secured by five properties contributed in 2008. These mortgage notes bear interest at a fixed rate of 5.58% per annum and provide for monthly interest-only payments through October 1, 2013, at which time all remaining unpaid interest and principal are due.
In 2008, the Company entered into two additional mortgage notes with 40/86 totaling $50,800,000 which are secured by two additional properties that were contributed in 2008. These mortgage notes bear interest at a fixed rate of 5.58% per annum and provide for monthly interest-only payments through January 1, 2014, at which time all remaining unpaid interest and principal are due.
On November 24, 2010, the Company entered into eight mortgage notes with MetLife totaling $92,000,000. These mortgage notes bear interest at a fixed rate of 4.25% per annum and provide for monthly interest and principal payments based on a 30 year amortization period through December 1, 2015, at which time all remaining unpaid interest and principal are due. These mortgage notes are secured by nine properties acquired or contributed during 2009 and 2010.
The Company is in compliance with the terms of the mortgage notes at December 31, 2010 and 2009.
At December 31, 2010, the future minimum principal payments of mortgage notes payable are as follows:
| | | | |
Year: | | | | |
2011 | | $ | 1,550,997 | |
2012 | | | 1,618,214 | |
2013 | | | 100,888,343 | |
2014 | | | 52,561,512 | |
2015 | | | 85,380,934 | |
| | | | |
| | $ | 242,000,000 | |
| | | | |
Interest capitalized amounted to $110,000 in 2010. There was no interest capitalized during 2009 or 2008.
The Company has estimated the fair value of the mortgage notes to be approximately $243,000,000 and $147,800,000 at December 31, 2010 and 2009, respectively. The estimated fair value has been determined by the Company using available market information and a discounted cash flow methodology using an interest rate of 4.8% and 6.00% at December 31, 2010 and 2009, respectively. Considerable judgment is however required in interpreting market data to develop the estimates of fair value. The current market rate the Company utilized was internally estimated; therefore, the Company concluded its determination of the fair value of its fixed rate secured debt was primarily based upon Level 3 inputs (as described in note 2). The Company’s assessment of the significance of a particular input to the fair value measurement in its entirety requires judgment, and considers factors specific to the liability. The use of different assumptions or estimation methodologies may have a material effect on the estimated fair value amounts.
F-70
DUKE/HULFISH, LLC AND SUBSIDIARIES
NOTES TO CONSOLIDATED FINANCIAL STATEMENTS—(Continued)
December 31, 2010 and 2009
The following table summarizes the book value and changes in the fair value of the Company’s mortgage notes for the year ended December 31, 2010:
| | | | | | | | | | | | | | | | | | | | | | | | | | | | |
| | | Book value at
December 31,
2009 | | | Book value at
December 31,
2010 | | | Fair value at
December 31,
2009 | | | Issuances | | | Payoffs | | | Adjustments
to fair value | | | Fair value at
December 31,
2010 | |
Mortgage notes | | $ | 150,000,000 | | | | 242,000,000 | | | | 147,800,000 | | | | 92,000,000 | | | | — | | | | 3,200,000 | | | | 243,000,000 | |
On February 28, 2011, the Company deposited $300,000 with Wells Fargo Bank, N.A. in acceptance of a term sheet to enter into a $275,000,000 unsecured credit facility (The Facility) with an anticipated closing date of March 31, 2011. The proceeds would be used to fund the acquisition of the Tranche 2 properties discussed in note 1. The Facility would have an initial loan term of six months and would include two six-month extension options if certain conditions are met. The Facility would require interest only payments of LIBOR plus 250 basis points. An origination fee of $1,650,000 would be due at closing.
(6) Leasing Activity
The Company leases its operating properties to tenants under agreements that are classified as operating leases. At December 31, 2010, future minimum receipts from tenants on leases for each of the next five years and thereafter are as follows:
| | | | |
Year: | | | | |
2011 | | $ | 58,834,375 | |
2012 | | | 59,553,227 | |
2013 | | | 59,505,764 | |
2014 | | | 60,383,347 | |
2015 | | | 61,032,876 | |
Thereafter | | | 233,926,005 | |
| | | | |
| | $ | 533,235,594 | |
| | | | |
In addition to minimum rents, certain leases require reimbursements of specified operating expenses, which amounted to $7,534,312, $4,525,455 and $722,632 for the years ended December 31, 2010 and 2009 and for the period from April 29, 2008 (inception) through December 31, 2008, respectively.
Two tenants occupy 28% of the Company’s 8.1 million total square feet in six industrial buildings. These two tenants account for approximately 33% of future minimum receipts.
(7) Members’ Equity
Operating and Financing Distributions
The Company pays operating distributions to its members in accordance with the appropriate provisions of the Agreement dated May 5, 2008 and amended and restated December 17, 2010. The Agreement provides the Members a first tier return equal to 6.25% per annum of the Members’ Unrecovered Capital, as defined, which shall be paid quarterly to the extent cash is available. CBOP has priority over DRLP for payment of first tier returns. To the extent any first tier return is not paid, it shall accumulate and compound with interest on the unpaid amount at the first tier rate.
If the first tier return is paid, then available cash shall be paid pro rata to the Members until the Members have received a return of their Unrecovered Capital. Once the Members have received the return of their Unrecovered Capital, then the balance is distributed to the Members in accordance with their membership interests (80% to CBOP and 20% to DRLP).
The primary distinction between the Members is the distribution priority and voting rights. CBOP has priority on distributions and has greater voting rights than DRLP. However, all Major Decisions, as defined in the Agreement, require unanimous consent of all members of the Company’s executive committee.
F-71
DUKE/HULFISH, LLC AND SUBSIDIARIES
NOTES TO CONSOLIDATED FINANCIAL STATEMENTS—(Continued)
December 31, 2010 and 2009
In addition, the Agreement provides for distributions of Net Capital Transaction Proceeds, as defined. Net capital transaction proceeds are distributed first to members who have made priority loans. Proceeds would then be allocated to the Members in proportion to their Unrecovered Capital balances, which is 80% and 20% to CBOP and DRLP, respectively. Excess proceeds would then be allocated to CBOP until those distributions equal CBOP’s cumulative First Tier Return (6.25%) from the inception of the Company to the date of such distribution; then to DRLP until the distributions equal DRLP’s cumulative First Tier Return (6.25%) from the inception of the Company to the date of such distribution; then to the Members in accordance with their percentage membership interests until the cumulative distributions received by CBOP equal an amount needed to attain a 10% internal rate of return for CBOP. The balance would then be allocated 25% to DRLP and 75% to CBOP.
Proceeds from debt financing of $29,234,174 were distributed to DRLP during 2008 and are reflected as a reduction of DRLP’s equity at December 31, 2008. In connection with the November 2010 financing discussed in note 5, proceeds from debt financing of $72,888,331 and $18,222,083 were distributed to CBOP and DRLP, respectively, during 2010 and are reflected as a reduction of CBOP’s and DRLP’s equity at December 31, 2010.
Operating proceeds of $12,720,000 and $3,180,000 were distributed to CBOP and DRLP, respectively, for the year ended December 31, 2010. In addition, operating distributions of $10,640,000 and $2,660,000 to CBOP and DRLP, respectively, were declared in 2010 and recontributed to the Company in order to fund development costs. The Company is treating these amounts as distributions and contributions in the accompanying consolidated 2010 Statement of Members’ Equity. Operating proceeds of $9,650,000 and $2,412,500 were distributed to CBOP and DRLP, respectively for the year ended December 31, 2009.
As of December 31, 2010, there were no unpaid and accumulated first tier returns due to CBOP or DRLP.
As of December 31, 2009, there were $237,694 and $55,947 of unpaid and accumulated first tier returns due to CBOP and DRLP, respectively.
Liquidation Distributions and Allocation of Net Income
Net income is allocated to the partners based on how proceeds would be allocated in connection with a hypothetical liquidation of the Company at book value. Proceeds would first be allocated to the Members in proportion to their Unrecovered Capital balances, which is 80% and 20% to CBOP and DRLP, respectively. Excess proceeds would then be allocated to CBOP until those distributions equal CBOP’s cumulative First Tier Return (6.25%) from the inception of the Company to the date of such distribution; then to DRLP until the distributions equal DRLP’s cumulative First Tier Return (6.25%) from the inception of the Company to the date of such distribution; then to the Members in accordance with their percentage membership interests until the cumulative distributions received by CBOP equal an amount needed to attain a 10% internal rate of return for CBOP. The balance would then be allocated 25% to DRLP and 75% to CBOP.
In connection with the amended and restated Agreement, the Agreement provides for a call option that upon the occurrence of a Trigger Event, as defined, CBOP may elect to acquire DRLP’s interest in the Company. The call price would be based on the average of each of the Members’ qualified appraiser’s written appraisals for the fair market value of the real estate properties if the appraisals are within 10% of the lower fair market value. If the appraisals are not within 10% of the lower fair market value then a third appraisal is performed and the call price is calculated in accordance with the provisions of the Agreement.
F-72
Schedule III
DUKE/HULFISH, LLC AND SUBSIDIARIES
Properties and Accumulated Depreciation
December 31, 2010
(In thousands)
| | | | | | | | | | | | | | | | | | | | | | | | | | | | | | | | | | | | |
| | | Initial cost to the real estate entity that acquired properties | |
Property | | Encumbrances,
net | | | Land | | | Site
improvements | | | Building and
improvements | | | Tenant
improvements | | | Total
acquisition
value | | | Improvements
subsequent to
purchase date | | | Total cost | | | Accumulated
depreciation
and
amortization | |
Buckeye Logistics Center | | $ | 20,000 | | | | 3,850 | | | | 3,575 | | | | 25,108 | | | | 6,651 | | | | 39,184 | | | | — | | | | 39,184 | | | | (3,904 | ) |
Aspen Corporate Center 500 | | | 21,200 | | | | 2,889 | | | | 2,876 | | | | 21,223 | | | | 7,089 | | | | 34,077 | | | | — | | | | 34,077 | | | | (3,207 | ) |
AllPoints at Anson Bldg. 1 | | | 17,000 | | | | 1,381 | | | | 4,228 | | | | 20,029 | | | | 5,618 | | | | 31,256 | | | | — | | | | 31,256 | | | | (3,046 | ) |
201 Sunridge Blvd. | | | 19,400 | | | | 5,310 | | | | 2,304 | | | | 21,136 | | | | 934 | | | | 29,684 | | | | (10 | ) | | | 29,674 | | | | (1,746 | ) |
12200 President’s Court | | | 21,600 | | | | 6,064 | | | | 5,985 | | | | 21,836 | | | | 776 | | | | 34,661 | | | | — | | | | 34,661 | | | | (2,302 | ) |
AllPoints Midwest Bldg. 1 | | | 24,000 | | | | 3,370 | | | | 6,720 | | | | 33,769 | | | | 3,889 | | | | 47,748 | | | | — | | | | 47,748 | | | | (3,423 | ) |
125 Enterprise Parkway | | | 26,800 | | | | 1,915 | | | | 2,053 | | | | 36,909 | | | | 3,008 | | | | 43,885 | | | | — | | | | 43,885 | | | | (2,769 | ) |
Fairfield Distribution IX | | | — | | | | 443 | | | | 1,438 | | | | 4,414 | | | | 875 | | | | 7,170 | | | | — | | | | 7,170 | | | | (424 | ) |
Celebration Office Center III | | | 9,500 | | | | 1,470 | | | | 1,659 | | | | 9,138 | | | | 3,028 | | | | 15,295 | | | | — | | | | 15,295 | | | | (1,262 | ) |
1400 Ravello Drive | | | 8,500 | | | | 1,645 | | | | 404 | | | | 7,540 | | | | 3,182 | | | | 12,771 | | | | — | | | | 12,771 | | | | (859 | ) |
Northpoint III | | | 11,000 | | | | 809 | | | | 1,213 | | | | 11,147 | | | | 3,255 | | | | 16,424 | | | | 7 | | | | 16,431 | | | | (760 | ) |
Goodyear Crossing II | | | 21,000 | | | | 2,940 | | | | 3,920 | | | | 24,223 | | | | 8,977 | | | | 40,060 | | | | — | | | | 40,060 | | | | (1,854 | ) |
1400 Perimeter Park Drive | | | 2,500 | | | | 346 | | | | 320 | | | | 2,892 | | | | 865 | | | | 4,423 | | | | — | | | | 4,423 | | | | (118 | ) |
3900 N. Paramount Parkway | | | 8,250 | | | | 612 | | | | 564 | | | | 8,532 | | | | 2,403 | | | | 12,111 | | | | 30 | | | | 12,141 | | | | (320 | ) |
3900 S. Paramount Parkway | | | 8,250 | | | | 612 | | | | 564 | | | | 9,790 | | | | 2,836 | | | | 13,802 | | | | — | | | | 13,802 | | | | (364 | ) |
RT Miramar I | | | 9,800 | | | | 3,350 | | | | 1,155 | | | | 7,375 | | | | 716 | | | | 12,596 | | | | — | | | | 12,596 | | | | (266 | ) |
RT Miramar II | | | 13,200 | | | | 4,500 | | | | 1,255 | | | | 14,079 | | | | 836 | | | | 20,670 | | | | — | | | | 20,670 | | | | (428 | ) |
McAuley Place | | | — | | | | 1,420 | | | | 951 | | | | 21,897 | | | | 850 | | | | 25,118 | | | | — | | | | 25,118 | | | | — | |
Easton III | | | — | | | | 2,002 | | | | 651 | | | | 10,246 | | | | 2,147 | | | | 15,046 | | | | — | | | | 15,046 | | | | — | |
533 Maryville Centre | | | — | | | | 1,768 | | | | 305 | | | | 16,609 | | | | 48 | | | | 18,730 | | | | — | | | | 18,730 | | | | — | |
555 Maryville Centre | | | — | | | | 1,765 | | | | 429 | | | | 13,371 | | | | 152 | | | | 15,717 | | | | — | | | | 15,717 | | | | — | |
Point West I | | | — | | | | 949 | | | | 2,313 | | | | 13,247 | | | | 6,479 | | | | 22,988 | | | | — | | | | 22,988 | | | | — | |
Regency Creek I | | | — | | | | 1,542 | | | | 1,619 | | | | 12,677 | | | | 2,251 | | | | 18,089 | | | | — | | | | 18,089 | | | | — | |
Sam Houston Crossing One | | | — | | | | 1,855 | | | | 1,766 | | | | 10,107 | | | | 4,189 | | | | 17,917 | | | | — | | | | 17,917 | | | | — | |
| | | | | | | | | | | | | | | | | | | | | | | | | | | | | | | | | | | | |
| | $ | 242,000 | | | | 52,807 | | | | 48,267 | | | | 377,294 | | | | 71,054 | | | | 549,422 | | | | 27 | | | | 549,449 | | | | (27,052 | ) |
| | | | | | | | | | | | | | | | | | | | | | | | | | | | | | | | | | | | |
Investments in real estate (in thousands): | | | | | | | | | | | | | | | | | | | | | | | | | | | | | | | | | | | | |
Balance, beginning of the year | | $ | 352,212 | | | | | | | | | | | | | | | | | | | | | | | | | | | | | | | | | |
Acquisitions | | | 197,207 | | | | | | | | | | | | | | | | | | | | | | | | | | | | | | | | | |
Improvements | | | 30 | | | | | | | | | | | | | | | | | | | | | | | | | | | | | | | | | |
| | | | | | | | | | | | | | | | | | | | | | | | | | | | | | | | | | | | |
Balance, end of the year | | $ | 549,449 | | | | | | | | | | | | | | | | | | | | | | | | | | | | | | | | | |
| | | | | | | | | | | | | | | | | | | | | | | | | | | | | | | | | | | | |
Accumulated depreciation related to investment in real estate (in thousands): | | | | | | | | | | | | | | | | | | | | | | | | | | | | | | | | | | | | |
Balance, beginning of the year | | $ | (12,466 | ) | | | | | | | | | | | | | | | | | | | | | | | | | | | | | | | | |
Additions | | | (14,586 | ) | | | | | | | | | | | | | | | | | | | | | | | | | | | | | | | | |
| | | | | | | | | | | | | | | | | | | | | | | | | | | | | | | | | | | | |
Balance, end of the year | | $ | (27,052 | ) | | | | | | | | | | | | | | | | | | | | | | | | | | | | | | | | |
| | | | | | | | | | | | | | | | | | | | | | | | | | | | | | | | | | | | |
See accompanying independent auditors’ report.
F-73
Independent Auditors’ Report
The Partners
CB Richard Ellis Strategic Partners Asia II, L.P. and
CB Richard Ellis Strategic Partners Asia II-A, L.P.:
We have audited the accompanying combined statement of assets, liabilities and partners’ capital and combined schedule of real estate related investments of CB Richard Ellis Strategic Partners Asia II, L.P. and CB Richard Ellis Strategic Partners Asia II-A, L.P., Cayman Islands exempted limited partnerships (collectively, the “Partnership”) as of December 31, 2008, and the related combined statements of operations, partners’ capital, and cash flows for the year then ended. These combined financial statements are the responsibility of the Partnership’s management. Our responsibility is to express an opinion on these combined financial statements based on our audit.
We conducted our audit in accordance with auditing standards generally accepted in the United States of America. Those standards require that we plan and perform the audit to obtain reasonable assurance about whether the financial statements are free of material misstatement. An audit includes consideration of internal control over financial reporting as a basis for designing audit procedures that are appropriate in the circumstances, but not for the purpose of expressing an opinion on the effectiveness of the Partnership’s internal control over financial reporting. Accordingly, we express no such opinion. An audit also includes examining, on a test basis, evidence supporting the amounts and disclosures in the financial statements, assessing the accounting principles used and significant estimates made by management, as well as evaluating the overall financial statement presentation. We believe that our audit provides a reasonable basis for our opinion.
In our opinion, the combined financial statements referred to above present fairly, in all material respects, the financial position of CB Richard Ellis Strategic Partners Asia II, L.P. and CB Richard Ellis Strategic Partners Asia II-A, L.P. as of December 31, 2008, and the results of their operations and their cash flows for the year then ended in conformity with U.S. generally accepted accounting principles.
/s/ KPMG
Hong Kong, China
June 25, 2009
F-74
CB Richard Ellis Strategic Partners Asia II, L.P. and
CB Richard Ellis Strategic Partners Asia II-A, L.P.
Combined Statements of Assets, Liabilities and Partners’ Capital
(Dollar Amounts in Thousands)
| | | | | | | | | | | | |
| | | December 31 | |
| | | 2010 | | | 2009 | | | 2008 | |
| | | (Unaudited) | | | (Unaudited) | | | | |
ASSETS | | | | | | | | | | | | |
Investments in Real Estate Related Assets at Estimated Fair Value (Cost of $236,915 (unaudited), $314,868 (unaudited) and $307,189 at December 31, 2010, 2009 and 2008, respectively) | | $ | 237,645 | | | $ | 332,712 | | | $ | 306,700 | |
Cash and Cash Equivalents | | | 10,209 | | | | 2,809 | | | | 4,163 | |
Restricted Cash | | | 5,139 | | | | 6,342 | | | | 2,212 | |
Deferred Loan Fees, Net of Amortization | | | 966 | | | | 1,235 | | | | 1,741 | |
Purchase Deposit | | | — | | | | — | | | | 3,702 | |
Prepaid Interest | | | — | | | | — | | | | 248 | |
Other Assets | | | 40 | | | | 838 | | | | 415 | |
| | | | | | | | | | | | |
| | $ | 253,999 | | | $ | 343,936 | | | $ | 319,181 | |
| | | | | | | | | | | | |
| | | |
LIABILITIES AND PARTNERS' CAPITAL | | | | | | | | | | | | |
LIABILITIES | | | | | | | | | | | | |
Mortgage and Mezzanine Loans | | $ | 43,019 | | | $ | 68,686 | | | $ | 95,606 | |
Note Payable to Banks Under Line of Credit | | | 4,307 | | | | 102,716 | | | | 230,016 | |
Fees Payable to Related Parties | | | 1,136 | | | | 1,544 | | | | 2,228 | |
Accrued Foreign Taxes on Dispositions of Investments in Real Estate Related Assets | | | 4,500 | | | | — | | | | 2,450 | |
Deferred Foreign Taxes on Unrealized Appreciation of Investments in Real Estate Related Assets | | | 3,876 | | | | — | | | | — | |
Unrealized Loss on Forward Purchase Contract | | | — | | | | 6,561 | | | | 14,453 | |
Unrealized Loss on Foreign Currency Contract at Fair Value | | | 5,296 | | | | 1,616 | | | | — | |
Other Liabilities | | | 2,822 | | | | 788 | | | | 1,836 | |
| | | | | | | | | | | | |
| | $ | 64,956 | | | $ | 181,911 | | | $ | 346,589 | |
| | | | | | | | | | | | |
| | | |
COMMITMENTS | | | | | | | | | | | | |
PARTNERS' CAPITAL | | | 189,043 | | | | 162,025 | | | | (27,408 | ) |
| | | | | | | | | | | | |
| | $ | 253,999 | | | $ | 343,936 | | | $ | 319,181 | |
| | | | | | | | | | | | |
See accompanying notes to combined financial statements.
F-75
CB Richard Ellis Strategic Partners Asia II, L.P. and
CB Richard Ellis Strategic Partners Asia II-A, L.P.
Combined Schedule of Real Estate Related Assets
(Dollar Amounts in Thousands)
| | | | | | | | | | | | | | | | | | | | | | | | | | | | | | | | | | | | | | |
| | | | | December 31, 2010 | | | December 31, 2009 | | | December 31, 2008 | |
| | | | | (Unaudited) | | | (Unaudited) | | | | | | | | | | |
Ownership
Interest(1) | | Description | | Cost | | | Fair
Value | | | % of Total
Real Estate
Related Assets | | | Cost | | | Fair
Value | | | % of Total
Real Estate
Related Assets | | | Cost | | | Fair
Value | | | % of Total
Real Estate
Related Assets | |
Investments in Real Estate: | |
99.999% | | Retail/Residential Tokyo, Japan | | $ | 51,003 | | | $ | 38,346 | | | | 16.0 | % | | $ | 44,628 | | | $ | 37,644 | | | | 11.2 | % | | $ | 45,500 | | | $ | 50,928 | | | | 16.5 | % |
| | | | | | | | | | |
99.94% | | Retail Tokyo, Japan | | | 63,624 | | | | 41,226 | | | | 17.1 | % | | | 55,724 | | | | 36,031 | | | | 10.7 | % | | | 52,120 | | | | 58,940 | | | | 19.1 | % |
| | | | | | | | | | |
SOLD | | Residential Beijing, China | | | — | | | | — | | | | — | | | | 69,613 | | | | 78,032 | | | | 23.2 | % | | | 65,206 | | | | 65,206 | | | | 21.2 | % |
| | | | | | | | | | | | | | | | | | | | | | | | | | | | | | | | | | | | | | |
| | | | $ | 114,627 | | | $ | 79,572 | | | | 33.1 | % | | $ | 169,965 | | | $ | 151,707 | | | | 45.1 | % | | $ | 162,826 | | | $ | 175,074 | | | | 56.8 | % |
Joint Venture Investments in Real Estate: | |
| | | | | | | | | | |
SOLD | | Mixed-use Tianjin, China | | $ | — | | | $ | — | | | | — | % | | $ | 25,692 | | | $ | 66,718 | | | | 19.8 | % | | $ | 25,072 | | | $ | 31,423 | | | | 10.2 | % |
| | | | | | | | | | |
52.00% | | Mixed-use Shanghai, China | | | 37,021 | | | | 55,949 | | | | 23.3 | % | | | 36,169 | | | | 36,610 | | | | 10.9 | % | | | 36,162 | | | | 30,315 | | | | 9.8 | % |
| | | | | | | | | | |
25.00% | | Residential Tianjin, China | | | 45,552 | | | | 45,373 | | | | 18.9 | % | | | 45,323 | | | | 36,660 | | | | 10.9 | % | | | 44,564 | | | | 37,755 | | | | 12.3 | % |
| | | | | | | | | | |
49.00% | | Residential Suzhou, China | | | 42,293 | | | | 59,329 | | | | 24.7 | % | | | 41,405 | | | | 44,703 | | | | 13.3 | % | | | 39,925 | | | | 33,493 | | | | 10.9 | % |
| | | | | | | | | | | | | | | | | | | | | | | | | | | | | | | | | | | | | | |
| | | | $ | 124,866 | | | $ | 160,651 | | | | 66.9 | % | | $ | 148,589 | | | $ | 184,691 | | | | 54.9 | % | | $ | 145,723 | | | $ | 132,986 | | | | 43.2 | % |
| | | | | | | | | | | | | | | | | | | | | | | | | | | | | | | | | | | | | | |
| | | | $ | 239,493 | | | $ | 240,223 | | | | 100.0 | % | | $ | 318,554 | | | $ | 336,398 | | | | 100.0 | % | | $ | 308,549 | | | $ | 308,060 | | | | 100.0 | % |
Investment Companies Guide Adjustments(2) | | $ | (2,578 | ) | | $ | (2,578 | ) | | | 0 | % | | $ | (3,686 | ) | | $ | (3,686 | ) | | | 0 | % | | $ | (1,360 | ) | | $ | (1,360 | ) | | | 0 | % |
| | | | | | | | | | | | | | | | | | | | | | | | | | | | | | | | | | | | | | |
Total Investments in Real Estate Related Assets | | $ | 236,915 | | | $ | 237,645 | | | | 100.0 | % | | $ | 314,868 | | | $ | 332,712 | | | | 100.0 | % | | $ | 307,189 | | | $ | 306,700 | | | | 100.0 | % |
| | | | | | | | | | | | | | | | | | | | | | | | | | | | | | | | | | | | | | |
| (1) | Other than residential property in Beijing with a 100% ownership interest and mixed- use property in Tianjin with a 25% ownership interest, which were sold during the first quarter and second quarter of 2010 respectively, there were no changes in the ownership percentages of the Investments in Real Estate Related Assets during the year ended December 31, 2010. |
| (2) | The Investment Companies Guide requires other assets and liabilities of the Investments in Real Estate to be classified under Investments in Real Estate Related Assets. |
See accompanying notes to combined financial statements.
F-76
CB Richard Ellis Strategic Partners Asia II, L.P. and
CB Richard Ellis Strategic Partners Asia II-A, L.P.
Combined Statements of Operations
(Dollar Amounts in Thousands)
| | | | | | | | | | | | |
| | | Years Ended December 31 | |
| | | 2010 | | | 2009 | | | 2008 | |
| | | (Unaudited) | | | (Unaudited) | | | | |
INCOME | | | | | | | | | | | | |
Net Income from Real Estate Operations | | $ | 2,383 | | | $ | 1,420 | | | $ | 1,387 | |
Other Revenue | | | — | | | | — | | | | 40 | |
| | | | | | | | | | | | |
| | | 2,383 | | | | 1,420 | | | | 1,427 | |
| | | | | | | | | | | | |
EXPENSES | | | | | | | | | | | | |
Investment Management Fees | | | 4,855 | | | | 5,165 | | | | 5,334 | |
Interest Expense | | | 2,720 | | | | 5,205 | | | | 2,187 | |
Loan Fees | | | 1,096 | | | | 1,378 | | | | 784 | |
Other Expenses | | | 1,248 | | | | 932 | | | | 1,228 | |
| | | | | | | | | | | | |
| | | 9,919 | | | | 12,680 | | | | 9,533 | |
| | | | | | | | | | | | |
OPERATING LOSS | | | (7,536 | ) | | | (11,260 | ) | | | (8,106 | ) |
NET REALIZED GAIN AND UNREALIZED APPRECIATION (DEPRECIATION) | | | | | | | | | | | | |
Dispositions of Investments in Real Estate Related Assets | | | | | | | | | | | | |
Net Sales Proceeds | | | 136,598 | | | | — | | | | — | |
Cost of Investments Inclusive of Investment Companies Guide Adjustments | | | (91,593 | ) | | | — | | | | — | |
Foreign Taxes on Dispositions of Investments in Real Estate Related Assets | | | (4,500 | ) | | | — | | | | — | |
| | | | | | | | | | | | |
Net Realized Gain | | | 40,505 | | | | — | | | | — | |
Reversal of Unrealized Appreciation Recorded in Prior Years | | | (49,445 | ) | | | — | | | | — | |
Unrealized Appreciation (Depreciation) of Investments in Real Estate Related Assets | | | 32,331 | | | | 18,333 | | | | (9,870 | ) |
Deferred Foreign Taxes on Unrealized Appreciation of Investments in Real Estate Related Assets | | | (3,876 | ) | | | 2,450 | | | | (592 | ) |
Unrealized and Realized Gain (Loss) on Forward Purchase Contracts | | | 6,561 | | | | 4,134 | | | | (20,962 | ) |
Unrealized Loss on Foreign Currency Contract at Fair Value | | | (3,680 | ) | | | (1,616 | ) | | | — | |
Unrealized Foreign Currency Translation Gain | | | 4,545 | | | | 2,505 | | | | 1,814 | |
| | | | | | | | | | | | |
Net Realized Gain and Unrealized Appreciation (Depreciation) | | | 26,941 | | | | 25,806 | | | | (29,610 | ) |
| | | | | | | | | | | | |
NET INCREASE (DECREASE) IN PARTNERS CAPITAL RESULTING FROM OPERATIONS | | $ | 19,405 | | | $ | 14,546 | | | $ | (37,716 | ) |
| | | | | | | | | | | | |
See accompanying notes to combined financial statements.
F-77
CB Richard Ellis Strategic Partners Asia II, L.P. and
CB Richard Ellis Strategic Partners Asia II-A, L.P.
Combined Statements of Partners’ Capital
(Dollar Amounts in Thousands)
| | | | | | | | | | | | | | | | | | | | | | | | | | | | | | | | | | | | | | | | | | | | | | | | | | | | | | | | | | | | |
| | | | | | Year Ended December 31, 2008 | | | Year Ended December 31, 2009 | | | Year Ended December 31, 2010 | |
| | | | | | (Unaudited) | | | (Unaudited) | |
PARTNERS | | Total
Capital
Commit-
ment | | | Capital at
January 1,
2008 | | | Contri-
butions
from
Partners | | | Operating
Loss | | | Net
Unrealized
Depre-
ciation | | | Capital at
December
31 | | | Contri-
butions
from
Partners | | | Operating
Loss | | | Net
Realized
and
Unrealized
Appre-
ciation | | | Capital at
December
31 | | | Contri-
butions
from
Partners | | | Operating
Loss | | | Net
Realized
Gain and
Unrealized
Appre-
ciation | | | Distri-
butions | | | Capital at
December
31 | |
LIMITED PARTNERS | | $ | 394,203 | | | $ | 9,608 | | | $ | 700 | | | $ | (8,106 | ) | | $ | (29,610 | ) | | $ | (27,408 | ) | | $ | 174,887 | | | $ | (11,260 | ) | | $ | 25,806 | | | $ | 162,025 | | | $ | 117,613 | | | $ | (7,536 | ) | | $ | 26,941 | | | $ | (110,000 | ) | | $ | 189,043 | |
GENERAL PARTNER | | | — | | | | — | | | | — | | | | — | | | | — | | | | — | | | | — | | | | — | | | | — | | | | — | | | | — | | | | — | | | | — | | | | — | | | | — | |
| | | | | | | | | | | | | | | | | | | | | | | | | | | | | | | | | | | | | | | | | | | | | | | | | | | | | | | | | | | | |
| | $ | 394,203 | | | $ | 9,608 | | | $ | 700 | | | $ | (8,106 | ) | | $ | (29,610 | ) | | $ | (27,408 | ) | | $ | 174,887 | | | $ | (11,260 | ) | | $ | 25,806 | | | $ | 162,025 | | | $ | 117,613 | | | $ | (7,536 | ) | | $ | 26,941 | | | $ | (110,000 | ) | | $ | 189,043 | |
| | | | | | | | | | | | | | | | | | | | | | | | | | | | | | | | | | | | | | | | | | | | | | | | | | | | | | | | | | | | |
See accompanying notes to combined financial statements.
F-78
CB Richard Ellis Strategic Partners Asia II, L.P. and
CB Richard Ellis Strategic Partners Asia II-A, L.P.
Combined Statements of Cash Flows
(Dollar Amounts in Thousands)
| | | | | | | | | | | | |
| | | Years Ended December 31 | |
| | | 2010 | | | 2009 | | | 2008 | |
| | | (Unaudited) | | | (Unaudited) | | | | |
CASH FLOWS FROM OPERATING ACTIVITIES: | | | | | | | | | | | | |
Net Increase (Decrease) in Partners' Capital Resulting from Operations | | $ | 19,405 | | | $ | 14,546 | | | $ | (37,716 | ) |
Adjustments to Reconcile to Net Cash Flows Provided by (Used in) Operating Activities: | | | | | | | | | | | | |
Proceeds from Dispositions of Investments in Real Estate Related Assets | | | 111,519 | | | | — | | | | — | |
Net Realized Gain on Dispositions of Investments in Real Estate Related Assets | | | (40,505 | ) | | | — | | | | — | |
Unrealized (Appreciation) Depreciation of Investments in Real Estate Related Assets | | | (32,331 | ) | | | (18,333 | ) | | | 9,870 | |
Reversal of Unrealized Appreciation Recorded in Prior Years | | | 49,445 | | | | — | | | | — | |
Accrual (Reversal) of Foreign Taxes on Unrealized Appreciation of Investments in Real Estate Related Assets | | | 3,876 | | | | (2,450 | ) | | | 592 | |
Unrealized and Realized (Gain) Loss on Forward Purchase Contracts | | | (6,561 | ) | | | (4,134 | ) | | | 20,962 | |
Unrealized Loss on Foreign Currency Contract at Fair Value | | | 3,680 | | | | 1,616 | | | | — | |
Unrealized Foreign Currency Translation Gain | | | (4,545 | ) | | | (2,505 | ) | | | (1,814 | ) |
Amortization and Loan Fees Paid | | | 445 | | | | 556 | | | | 990 | |
Increase in Investments in Real Estate Related Assets | | | (9,683 | ) | | | (32,094 | ) | | | (168,315 | ) |
Decrease (Increase) in Restricted Cash | | | 1,203 | | | | (4,130 | ) | | | 68 | |
Increase in Purchase Deposit | | | — | | | | (56 | ) | | | (10,211 | ) |
Decrease in Prepaid Interest | | | — | | | | 248 | | | | 887 | |
Decrease (Increase) in Other Assets | | | 798 | | | | (423 | ) | | | (365 | ) |
(Decrease) Increase in Fees Payable to Related Parties | | | (408 | ) | | | (684 | ) | | | 323 | |
Increase (Decrease) in Other Liabilities | | | 2,034 | | | | (1,048 | ) | | | 1,679 | |
| | | | | | | | | | | | |
Net Cash Flows Provided by (Used in) Operating Activities | | | 98,372 | | | | (48,891 | ) | | | (183,050 | ) |
| | | | | | | | | | | | |
| | | |
CASH FLOWS FROM FINANCING ACTIVITIES: | | | | | | | | | | | | |
Borrowings Under Line of Credit | | | 4,307 | | | | 44,353 | | | | 185,047 | |
Repayments Under Line of Credit | | | (102,716 | ) | | | (171,653 | ) | | | — | |
Loan Fees Paid | | | (176 | ) | | | (50 | ) | | | (1,392 | ) |
Contributions from Partners | | | 117,613 | | | | 174,887 | | | | 700 | |
Distributions to Partners | | | (110,000 | ) | | | — | | | | — | |
| | | | | | | | | | | | |
Net Cash Flows (Used in) Provided by Financing Activities | | | (90,972 | ) | | | 47,537 | | | | 184,355 | |
| | | | | | | | | | | | |
Net Increase (Decrease) in Cash and Cash Equivalents | | | 7,400 | | | | (1,354 | ) | | | 1,305 | |
Net Cash and Cash Equivalents, Beginning of the Year | | | 2,809 | | | | 4,163 | | | | 2,858 | |
| | | | | | | | | | | | |
Net Cash and Cash Equivalents, End of the Year | | $ | 10,209 | | | $ | 2,809 | | | $ | 4,163 | |
| | | | | | | | | | | | |
| | | |
SUPPLEMENTAL DISCLOSURE OF CASH FLOW INFORMATION: | | | | | | | | | | | | |
Cash Paid During the Year for Interest Including Amounts Capitalized | | $ | 1,310 | | | $ | 8,205 | | | $ | 5,624 | |
| | | |
SUPPLEMENTAL DISCLOSURE OF NONCASH FINANCING ACTIVITY: | | | | | | | | | | | | |
Mortgage Loan Paid Off by the Buyer Relating to the Sale of an Investment in Real Estate Related Assets | | $ | 25,079 | | | $ | — | | | $ | — | |
Mortgage and Mezzanine Loans Assumed upon Acquisition of Investments in Real Estate Related Assets | | $ | — | | | $ | — | | | $ | 24,994 | |
Deferred Loan Fees Recorded Relating to Assumed Loans | | $ | — | | | $ | — | | | $ | 868 | |
See accompanying notes to combined financial statements.
F-79
CB Richard Ellis Strategic Partners Asia II, L.P. and
CB Richard Ellis Strategic Partners Asia II-A, L.P.
Notes to Combined Financial Statements
December 31, 2010 (unaudited), 2009 (unaudited) and 2008
(1) Organization
CB Richard Ellis Strategic Partners Asia II, L.P., a Cayman Islands exempted limited partnership, and CB Richard Ellis Strategic Partners Asia II-A, L.P., a Cayman Islands exempted limited partnership (the “Parallel Fund”), were both formed pursuant to the Exempted Limited Partnership Law of the Cayman Islands, to jointly purchase, reposition, develop, hold for investment and sell institutional quality real estate and related assets in targeted markets in Asia, including China, Japan, India, South Korea, Hong Kong, Singapore and other Asia Pacific markets. The agreement of limited partnership of CB Richard Ellis Strategic Partners Asia II, L.P. permits formation of one or more parallel funds for investors with special legal, tax, regulatory, or other requirements. The terms of the agreements of limited partnership for CB Richard Ellis Strategic Partners Asia II, L.P. and the Parallel Fund (collectively, the “Partnership”) are substantially the same. Hereinafter these agreements will be referred to collectively as the Partnership Agreement.
The Partnership invests in real estate related assets through jointly owned subsidiaries based on the ratio of their respective investor committed capital to the aggregate investor committed capital.
The general partner of the Partnership is CB Richard Ellis SPA II GP, LLC, a Delaware limited liability company (General Partner), and pursuant to the Management Agreement, the investment manager is CB Richard Ellis Investors SP Asia, LLC (Investment Manager), which is an affiliate of the General Partner.
The final closing of the Partnership occurred on January 31, 2008 (Final Closing). As of January 31, 2008, committed capital totaled $394,202,500. Two years from the Final Closing (the Commitment Period), the limited partners of the Partnership (Limited Partners) will be released from any further obligation with respect to unfunded committed capital, except for certain instances as described in the Partnership Agreement. In early January 2010, the Partnership received consent from the Limited Partners for an extension of the Partnership’s Commitment Period for 12 months to January 31, 2011. In January 2011, the Partnership received consent from the Limited Partners for an extension of the Partnership’s Commitment Period for an additional 12 months to January 31, 2012 (see Note 13).
The Partnership has a term of eight years; however, the Partnership may be dissolved by a vote of at least two-thirds of the Limited Partners interests (excluding affiliates of the General Partner). The Partnership term may be extended by the General Partner, with consent of two-thirds of the Limited Partner interests, for up to two additional one-year periods to permit the orderly disposition of investments.
In accordance with the terms of the Partnership Agreement, net income and distributions of distributable cash, as defined, shall generally be allocated pro rata (based on capital committed by the partners), until the sum of such amounts equals the capital contributed plus a 10% cumulative preferred return compounded annually; then 80%, allocated pro rata, to the Limited Partners, which includes CBRE SPA II Co-Investment, LLC (the Co-Investment Limited Partner), and 20% to the Co-Investment Limited Partner until the sum of such amounts allocated to the Limited Partners excluding the Co-Investment Limited Partner equals a 13% preferred return compounded annually; then 50% to the Limited Partners, allocated pro rata, and 50% to the Co-Investment Limited Partner until the cumulative amount distributed to the Co-Investment Limited Partner in excess of capital contributed by the Co-Investment Limited Partner plus a 10% return equals 20% of the distributed profits of the Partnership in excess of a 10% return; thereafter 80% to the Limited Partners and 20% to the Co-Investment Limited Partner.
(2) Summary of Significant Accounting Policies
a. Combination
The combined financial statements include the financial statements of CB Richard Ellis Strategic Partners Asia II, L.P. and CB Richard Ellis Strategic Partners Asia II-A, L.P. All significant inter-company transactions and balances have been eliminated.
Although the Partnership does not use the consolidation method of accounting, it does look through its direct and indirect subsidiaries (which are 99.94 % and 99.999% owned) that were formed to invest in real estate. Accordingly, the accounts related to assets and liabilities that are effectively wholly-owned by the Partnership are treated for financial reporting purposes as accounts of the Partnership.
F-80
CB Richard Ellis Strategic Partners Asia II, L.P. and
CB Richard Ellis Strategic Partners Asia II-A, L.P.
Notes to Combined Financial Statements—(Continued)
December 31, 2010 (unaudited), 2009 (unaudited) and 2008
b. Valuation of Investments
Investments are carried at fair value and accounted for under the guidance of the accounting standard entitled “Fair Value Measurements” issued by the Financial Accounting Standards Board. This standard provides guidance for measuring fair value of assets and liabilities and clarifies the principle that fair value should be based on the assumptions that market participants would use when pricing an asset or liability in an orderly transaction. The standard also establishes a fair value hierarchy, giving the highest priority to quoted market prices in active markets and the lowest priority to unobservable data.
As of December 31, 2010, 2009 and 2008, investments in real estate related assets were carried at fair value based on an estimate of what a market participant would pay to acquire the Partnership’s interests and any resulting unrealized appreciation (depreciation) from inception or property acquisition, as applicable, through December 31, 2010, 2009 and 2008, is included in the accompanying Combined Statements of Operations for the years then ended.
The fair value measurement standard established a three-level hierarchy for fair value measurements that distinguishes between market participant assumptions developed based on market data obtained from sources independent of the reporting entity (observable inputs) and the reporting entity’s own assumptions about market participant assumptions developed based on the best information available in the circumstances (unobservable inputs). The hierarchy level assigned to each of the Partnership’s investments is based on the assessment of the transparency and reliability of the inputs used in the valuation of such investment at the measurement date. The three hierarchy levels are defined as follows:
| a. | Level 1—Valuations based on unadjusted quoted market prices in active markets for identical assets. The Partnership has no Level 1 category investments as of December 31, 2010, 2009 and 2008. |
| b. | Level 2—Valuations based on observable inputs (other than Level 1 prices), such as quoted prices for similar assets at the measurement date; quoted prices in markets that are not active; or other inputs that are observable, either directly or indirectly. The Partnership’s foreign currency contract is a Level 2 category financial instrument. |
| c. | Level 3—Valuations based on inputs that are unobservable and significant to the overall fair value measurement, and involve management judgment. The Level 3 category includes all of the Partnership’s investments in real estate related assets. |
The Partnership’s valuation methodology for each investment in the Partnership as of December 31, 2010 is listed in the following table.
Valuation Methodology for Investments in Strategic Partners Asia II
| | | | | | | | | | |
Property | | Location | | Property Type | | Development Stage | | Investment Date | | Valuation Methodology |
Property 1 | | Tokyo, Japan | | Retail/Residential | | Stabilized | | Nov-07 | | External Appraisal Income Approach |
| | | | | |
Property 2 | | Tokyo, Japan | | Retail | | Stabilized | | Nov-07 | | External Appraisal Income Approach |
| | | | | |
Joint Venture 2 | | Shanghai, China | | Mixed-use | | Stabilized | | Mar-08 | | External Appraisal Income Approach |
| | | | | |
Joint Venture 3 | | Tianjin, China | | Residential | | Development | | Mar-08 | | Replacement Cost and Direct Market Comparison Method |
| | | | | |
Joint Venture 4 | | Suzhou, China | | Residential | | Development | | Jul-08 | | Replacement Cost and Direct Market Comparison Method |
The investments in Strategic Partners Asia II are based on the Level 3 valuation which adopted the following approaches:
| | ¡ | | The income approach is generally based on a discounted cash flow analysis. Such an analysis for a real property includes projecting net cash flows from the property from a buyer’s perspective and computing the present value of the cash flows |
F-81
CB Richard Ellis Strategic Partners Asia II, L.P. and
CB Richard Ellis Strategic Partners Asia II-A, L.P.
Notes to Combined Financial Statements—(Continued)
December 31, 2010 (unaudited), 2009 (unaudited) and 2008
| | using a market discount rate. The holding period utilized in the analysis is typically ten years, consistent with how market participants often estimate values in connection with buying and selling commercial real estate. The cash flows include a projection of the net sales proceeds at the end of this holding period, computed using market reversionary capitalization rates and projected cash flows from the property for the year following the holding period. |
| | ¡ | | The direct market comparison approach to property valuation is primarily based on the principle of substitution, which holds that the value of a property tends to be set by the price that would be paid to acquire a substitute property of similar utility and desirability within a reasonable amount of time. Transactions of similar properties are analyzed and compared to the subject property. Factors affecting value include differences in the location, size, quality of construction and other physical features, property rights appraised, timing of sale, and economic and market conditions. |
| | ¡ | | The replacement cost approach to property valuation is a theoretical breakdown of the property into land and building components. The theory is that the value of a property can be estimated by summing the land value and the depreciated value of any improvements. While the replacement cost of the improvements can be determined by adding the labor, material, and other costs, land values must be derived from an analysis of comparable data. The cost approach is considered reliable when used on newer structures, but the method tends to become less reliable for older properties. |
| | ¡ | | For investments owned more than one year, except for investments under construction or incurring significant renovation, it is the Partnership’s policy to obtain a third-party appraisal. For assets owned less than one year, a determination is made whether the cost of a third-party appraisal is justified. For investments in real estate under construction or incurring significant renovation, the valuation analysis is prepared by the Investment Manager. All valuations of real estate involve subjective judgments, and the actual market price of real estate can only be determined by negotiation between independent parties in a sales transaction. |
December 31, 2010 (Dollar Amounts in Thousands):
| | | | | | | | | | | | | | | | |
| Unaudited | | Level 1 | | | Level 2 | | | Level 3 | | | Total | |
Investments in Real Estate | | $ | — | | | $ | — | | | $ | 76,994 | | | $ | 76,994 | |
Joint Venture Investments in Real Estate | | | — | | | | — | | | | 160,651 | | | | 160,651 | |
| | | | | | | | | | | | | | | | |
Total | | $ | — | | | $ | — | | | $ | 237,645 | | | $ | 237,645 | |
| | | | | | | | | | | | | | | | |
December 31, 2009 (Dollar Amounts in Thousands):
| | | | | | | | | | | | | | | | |
| Unaudited | | Level 1 | | | Level 2 | | | Level 3 | | | Total | |
Investments in Real Estate | | $ | — | | | $ | — | | | $ | 148,078 | | | $ | 148,078 | |
Joint Venture Investments in Real Estate | | | — | | | | — | | | | 184,634 | | | | 184,634 | |
| | | | | | | | | | | | | | | | |
Total | | $ | — | | | $ | — | | | $ | 332,712 | | | $ | 332,712 | |
| | | | | | | | | | | | | | | | |
December 31, 2008 (Dollar Amounts in Thousands):
| | | | | | | | | | | | | | | | |
| | | Level 1 | | | Level 2 | | | Level 3 | | | Total | |
Investments in Real Estate | | $ | — | | | $ | — | | | $ | 173,444 | | | $ | 173,444 | |
Joint Venture Investments in Real Estate | | | — | | | | — | | | | 133,256 | | | | 133,256 | |
| | | | | | | | | | | | | | | | |
Total | | $ | — | | | $ | — | | | $ | 306,700 | | | $ | 306,700 | |
| | | | | | | | | | | | | | | | |
| | ¡ | | The table below includes a roll forward of the amounts in the Combined Statements of Assets, Liabilities and Partners’ Capital (including the change in fair value) for Investments in Real Estate Related Assets classified by the Partnership within Level 3 of the fair value hierarchy. |
F-82
CB Richard Ellis Strategic Partners Asia II, L.P. and
CB Richard Ellis Strategic Partners Asia II-A, L.P.
Notes to Combined Financial Statements—(Continued)
December 31, 2010 (unaudited), 2009 (unaudited) and 2008
Investments in Real Estate Related Assets as of December 31, (Dollar Amounts in Thousands):
| | | | | | | | | | | | |
| | | 2010 | | | 2009 | | | 2008 | |
| | | (Unaudited) | | | (Unaudited) | | | | |
At January 1 | | $ | 332,712 | | | $ | 306,700 | | | $ | 108,376 | |
Increase in Investments in Real Estate Related Assets | | | 13,640 | | | | 7,679 | | | | 208,194 | |
Dispositions of Investments in Real Estate Related Assets | | | (141,038 | ) | | | — | | | | — | |
Unrealized Appreciation (Depreciation) | | | 32,331 | | | | 18,333 | | | | (9,870 | ) |
| | | | | | | | | | | | |
At December 31 | | $ | 237,645 | | | $ | 332,712 | | | $ | 306,700 | |
| | | | | | | | | | | | |
| | | |
Unrealized Appreciation (Depreciation) on Investments in Real Estate Related Assets | | | | | | | | | | | | |
| | | |
At January 1 | | $ | 17,844 | | | $ | (489 | ) | | $ | 9,381 | |
Reversal of Unrealized Appreciation Recorded in the Previous Years | | | (49,445 | ) | | | — | | | | — | |
Unrealized Appreciation (Depreciation) | | | 32,331 | | | | 18,333 | | | | (9,870 | ) |
| | | | | | | | | | | | |
At December 31 | | $ | 730 | | | $ | 17,844 | | | $ | (489 | ) |
| | | | | | | | | | | | |
Note payable to banks under line of credit, mortgage and mezzanine loans are stated at the outstanding principal amounts. The Partnership has not elected the fair value option accounting standard for any of its notes payable.
Foreign currency contracts are stated at fair value, which is the amount at which the contracts could be settled. Changes in fair value are recognized in the Combined Statements of Operations as unrealized gain or loss.
Restricted cash consists primarily of restricted deposits held as compensating balances for certain borrowing arrangements for Property 1 and Property 2.
Cash and Cash Equivalents are stated at fair value, which is equivalent to cost, and consist of investments in a cash management account.
Other assets and liabilities are stated at cost, which approximates fair value, since these are the amounts at which they are expected to be realized or liquidated.
c. Investments in Real Estate Related Assets
Investments in real estate related assets comprise the Partnership’s net investments in real estate and real estate joint ventures. For non-joint venture properties, in addition to the real estate, the investment includes accounts receivable, prepayments and other assets and is net of accounts payable and other liabilities. Mortgage and mezzanine loans payable related to the non-joint venture properties are classified as liabilities by the Partnership.
Investments in real estate related assets are recognized on the Combined Statements of Assets, Liabilities, and Partners’ Capital as of the closing date of acquisition. Expenditures that extend the economic life or represent additional capital investments benefiting future periods, including tenant improvements and leasing commissions, are capitalized. Maintenance and repair expenses are charged to the Combined Statements of Operations as incurred. Interest is capitalized for the investments in real estate assets that are under development. As investments in real estate assets are carried at estimated fair value, no depreciation of costs, nor amortization of tenant improvements and leasing commissions are made.
d. Property Operations
As the Partnership does not use the consolidation method or the equity method of accounting for investments in joint ventures, operating income from investments in real estate joint ventures is recognized when received. The Partnership’s share of changes in the joint ventures’ net assets resulting from operating income or losses is reflected as unrealized appreciation or depreciation as applicable. Undistributed operating income of the joint ventures is considered by the Partnership in estimating fair value of the Partnership’s investments in real estate related joint ventures.
F-83
CB Richard Ellis Strategic Partners Asia II, L.P. and
CB Richard Ellis Strategic Partners Asia II-A, L.P.
Notes to Combined Financial Statements—(Continued)
December 31, 2010 (unaudited), 2009 (unaudited) and 2008
Operating income from real estate operations for non-joint venture properties is recognized on an accrual basis of accounting and consists of rental and other revenue from operations net of operating expenses. Consistent with presenting notes payable secured by non-joint venture properties as liabilities instead of netting against the investments in real estate, the related interest and amortization of deferred loan costs is presented separately in the Combined Statements of Operations instead of as a reduction of income from real estate operations.
Rental revenue is recognized using the accrual method based on contractual amounts provided for in the lease agreements. Rental revenue is not accrued during periods of rent abatement, as the value of the future rental revenue is considered in connection with estimating the fair value of the investments in real estate. Expenses are recognized when incurred.
e. Loan Fees on Partnership Debt
Loan fees related to Partnership debt are capitalized and amortized over the life of the related debt on a straight-line basis, which approximates the effective interest method. Accumulated amortization of the loan fees related to the subscription line totaled $2,035,000 (unaudited), $1,490,000 (unaudited) and $562,000 as of December 31, 2010, 2009 and 2008, respectively. Accumulated amortization of the loan fees related to mortgage loans totaled $1,138,000 (unaudited), $675,000 (unaudited) and $459,000 as of December 31, 2010, 2009 and 2008, respectively.
f. Foreign Currency Exchange Translation
The financial statements related to investments in real estate related assets are denominated in the local currency of the market in which the real estate is located. The asset and liability accounts are translated to US Dollars using the exchange rates as of the end of the applicable reporting period and the accounts related to operations are translated using the average exchange rates on a monthly basis.
Changes in currency exchange rates and costs of conversion between the US Dollar and other currencies may adversely affect the US Dollar value of the Partnership’s investments, gains and losses realized on the sale of portfolio investments and the amount of distributions, if any to be made by the Partnership.
g. Income Taxes
Under the laws of the Cayman Islands, the Partnership is not subject to income taxes. If the Partnership incurs foreign taxes, a provision is made for such taxes. This includes recording foreign taxes that would be paid if the Partnership’s investments in real estate were sold at estimated fair value.
Income taxes are accounted for under the asset and liability method. Deferred tax assets and liabilities are recognized for the future tax consequences attributable to differences between the financial statement carrying amounts of exisiting assets and liabilities and their respective tax bases and operating loss and tax credit carryforwards. Deferred tax assets and liabilities are measured using enacted tax rates expected to apply to taxable income in the years in which those temporary differences are expected to be recovered or settled. The effect on deferred tax assets and liabilities of a change in tax rates is recognized in the combined statement of operations in the period that includes the enacted date.
The Partnership has provided for potential foreign taxes amounting to (i) $4,500,000 (unaudited) as of December 31, 2010, $0 (unaudited) as of December 31, 2009 and $0 as of December 31, 2008 relating to dispositions of investments in real estate related assets and (ii) $3,876,000 (unaudited) as of December 31, 2010, $0 (unaudited) as of December 31, 2009 and $2,450,000 as of December 31, 2008 relating to unrealized appreciation on investments in real estate related assets. These amounts are recorded as liabilities in the Combined Statements of Assets, Liabilities and Partners’ Capital.
The Partnership follows the authoritative guidance for uncertainty in income taxes. The General Partner evaluates tax positions taken or expected to be taken in the course of preparing the Partnership’s Combined Financial Statements to determine whether the tax positions are “more-likely-than-not” of being sustained by the applicable tax authority. Tax positions with respect to tax at the Partnership level deemed to meet the “more-likely-than-not” threshold would be recorded as a tax benefit or expense in the current year.
F-84
CB Richard Ellis Strategic Partners Asia II, L.P. and
CB Richard Ellis Strategic Partners Asia II-A, L.P.
Notes to Combined Financial Statements—(Continued)
December 31, 2010 (unaudited), 2009 (unaudited) and 2008
The General Partner has concluded that the Partnership has appropriately reflected the income taxes on the Combined Statements of Assets and Liabilities and Partners’ Capital and the Combined Statement of Operations for the years ended December 31, 2010, 2009 and 2008. The General Partner’s conclusions regarding the Partnership’s tax positions may be subject to review and may be adjusted at a later date based on factors including, but not limited to, changes in tax laws, regulations and interpretations thereof.
h. Use of Estimates
The preparation of financial statements in conformity with US generally accepted accounting principles requires management to make estimates and assumptions that affect the reported amounts of assets and liabilities, the disclosure of contingent assets and liabilities at the date of the financial statements, and the reported amounts of revenues and expenses during the reporting period. Actual results could differ from those estimates.
(3) Investments in Real Estate Related Assets
The Partnership’s investments in real estate related assets as of December 31, 2010 consist of equity investments in two wholly-owned properties and three joint ventures consisting of various property types located in China and Japan.
The Partnership entered into an agreement with an affiliate of the General Partner to manage a joint venture property, which commenced in July 2008. Total management fees paid to our affiliate amounted to $72,000 (unaudited), $70,000 (unaudited) and $35,000 for the years ended December 31, 2010, 2009 and 2008 respectively.
(4) Purchase Deposit
The Partnership committed to three forward purchase contracts in 2008 and paid a deposit on one of them in the amount of $10,211,000. Given the decline in property markets, the Partnership wrote down the carrying value of the deposit by JPY 590 million or $6,509,000 to reflect the difference between the fair value of that investment as of December 31, 2008 and the contract purchase price. On November 5, 2009, the Partnership cancelled the transaction, and the purchase deposit was retained by the seller in accordance with the forward purchase contract terms on cancellation. Accordingly, the remaining purchase deposit amount of $3,758,000 (unaudited) was written off as of December 31, 2009.
(5) Debt
(a) Secured Line of Credit
On June 26, 2009, the subscription line credit facility was reduced to a combined maximum borrowing capacity of $180 million. As of December 31, 2009, the Partnership had a $180 million secured revolving subscription line of credit facility. Advances under the credit facility can be drawn in either US Dollars or Japanese Yen. On April 1, 2010, the Partnership reduced the maximum borrowing capacity of the subscription line to a combined maximum borrowing capacity of $100 million, and on June 26, 2010, a US lender became the sole lender to Partnership’s subscription line. The maturity date of the subscription line of credit is June 25, 2011. Advances are secured by unfunded capital commitments of the Limited Partners.
Outstanding advances under the subscription line of credit bear interest at 125 basis points over USD LIBOR for US Dollar borrowings and 125 basis points over Japanese LIBOR for Japanese Yen borrowings. Base Rate borrowings are also permitted, for a limited amount of time, in US Dollars at lender’s prime rate minus 115 basis points, but no less than LIBOR plus the applicable margin then in effect for LIBOR loans with an interest period of three months. The weighted average borrowing rate for the Japanese Yen advances outstanding as of December 31, 2010, 2009 and 2008 were 1.93% (unaudited), 2.14% (unaudited) and 1.91%, respectively. The weighted average borrowing rate for US Dollar advances outstanding as of December 31, 2009 and 2008 was 2.96% (unaudited) and 4.20%, respectively. There were no US Dollar advances outstanding as of December 31, 2010.
In addition, as of December 31, 2008, there was an outstanding letter of credit issued under the subscription line to secure a forward purchase contract in the amount of JPY 1.96 billion (approximately $21.6 million as of December 31, 2008) at a cost of 125 basis points per year. This letter of credit was terminated without cost in June 2009, pursuant to the successful termination of one of the forward purchase contracts by the Partnership.
F-85
CB Richard Ellis Strategic Partners Asia II, L.P. and
CB Richard Ellis Strategic Partners Asia II-A, L.P.
Notes to Combined Financial Statements—(Continued)
December 31, 2010 (unaudited), 2009 (unaudited) and 2008
(b) Mortgage and Mezzanine Loans
The Partnership has mortgage and mezzanine loans secured by its retail/residential property located in Japan. The outstanding loan amounts, which are denominated in Japanese Yen, totaled $21,053,000 (unaudited), $19,168,000 (unaudited) and $35,306,000 based on the exchange rate as of December 31, 2010, 2009 and 2008, respectively. Of this, $16,130,000 (unaudited), $14,866,000 (unaudited) and $24,273,000 consists of mortgage loans and $4,923,000 (unaudited), $4,302,000 (unaudited) and $11,033,000 consists of mezzanine loans as of December 31, 2010, 2009 and 2008, respectively. The fixed interest rate on the mortgage loan borrowings is 3.87% for the years ended December 31, 2010 and 2009 (range from 1.75% to 1.84% for the year ended December 31, 2008) and the fixed interest rate on the mezzanine loan borrowings is 5.67% for the years ended December 31, 2010 and 2009 (range from 4.66% to 4.75% for the year ended December 31, 2008). Interest on the loans are due monthly and principal is due at maturity on August 28, 2012.
The Partnership has a mortgage loan secured by its retail property located in Tokyo, Japan. The outstanding loan amount, which is demoninated in Japanese Yen, totaled $21,966,000 (unaudited), $24,524,000 (unaudited) and $35,306,000 based on the exchange rate as of December 31, 2010, 2009, and 2008, respectively. On June 18, 2010, the Partnership refinanced the mortgage loan for a new term of five years at a fixed interest rate of 3.36% per annum (2009 and 2008: 3.21% per annum). The loan is payable monthly, and principal was due at maturity on June 19, 2015.
(c) Fair Value of Debt
December 31, 2010 (Dollar Amounts in Thousands):
(Unaudited)
| | | | | | | | | | | | | | | | | | | | |
Property Type/ Location | | Property | | | Outstanding
Balance | | | Fair
Value | | | Favorable/
(Unfavorable)
Value | | | Maturity | |
Retail/Residential | | | | | | | | | | | | | | | | | | | | |
| | | | | |
Tokyo, Japan | | | Property 1 | | | $ | 21,053 | | | $ | 21,208 | | | $ | (155 | ) | | | Aug-28-12 | |
| | | | | |
Retail | | | Property 2 | | | | 21,966 | | | | 21,430 | | | | 536 | | | | Jun-19-15 | |
| | | | | | | | | | | | | | | | | | | | |
Tokyo, Japan | | | | | | | | | | | | | | | | | | | | |
| | | | | |
Mortgage and Mezzanine Loans | | | | | | $ | 43,019 | | | $ | 42,638 | | | $ | 381 | | | | | |
| | | | | | | | | | | | | | | | | | | | |
| | | | | |
Subscription Line | | | SPA II Fund | | | $ | 4,307 | | | $ | 4,270 | | | $ | 37 | | | | Jun-25-11 | |
| | | | | | | | | | | | | | | | | | | | |
December 31, 2009 (Dollar Amounts in Thousands):
(Unaudited)
| | | | | | | | | | | | | | | | | | |
Property Type/ Location | | Property | | | Outstanding
Balance | | | Fair Value | | | Favorable/
(Unfavorable)
Value | | | Maturity |
Retail/Residential | | | Property 1 | | | $ | 19,168 | | | $ | 19,130 | | | $ | 38 | | | Aug-28-12 |
Tokyo, Japan | | | | | | | | | | | | | | | | | | |
| | | | | |
Retail | | | Property 2 | | | | 24,524 | | | | 24,379 | | | | 145 | | | Jun-21-10 |
Tokyo, Japan | | | | | | | | | | | | | | | | | | |
| | | | | |
Residential | | | Property 3 | | | | 24,994 | | | | 25,114 | | | | (120 | ) | | Dec-30-13 |
Beijing, China | | | | | | | | | | | | | | | | | | |
| | | | | | | | | | | | | | | | | | |
| | | | | |
Mortgage and Mezzanine Loans | | | | | | $ | 68,686 | | | $ | 68,623 | | | $ | 63 | | | |
| | | | | | | | | | | | | | | | | | |
Subscription Line | | | SPA II Fund | | | $ | 102,716 | | | $ | 101,636 | | | $ | 1,080 | | | Jun-25-10 |
| | | | | | | | | | | | | | | | | | |
F-86
CB Richard Ellis Strategic Partners Asia II, L.P. and
CB Richard Ellis Strategic Partners Asia II-A, L.P.
Notes to Combined Financial Statements—(Continued)
December 31, 2010 (unaudited), 2009 (unaudited) and 2008
December 31, 2008 (Dollar Amounts in Thousands):
| | | | | | | | | | | | | | | | | | |
Property Type/ Location | | Property | | | Outstanding
Balance | | | Fair Value | | | Favorable/
(Unfavorable)
Value
Differential | | | Maturity |
| | | | | |
Retail/Residential | | | Property 1 | | | $ | 35,306 | | | $ | 35,268 | | | $ | 38 | | | Mar-31-09 |
Tokyo, Japan | | | | | | | | | | | | | | | | | | |
| | | | | |
Retail | | | Property 2 | | | | 35,306 | | | | 35,164 | | | | 142 | | | Jun-21-10 |
Tokyo, Japan | | | | | | | | | | | | | | | | | | |
| | | | | |
Residential | | | Property 3 | | | | 24,994 | | | | 24,994 | | | | — | | | Dec-30-13 |
Beijing, China | | | | | | | | | | | | | | | | | | |
| | | | | | | | | | | | | | | | | | |
| | | | | |
Mortgage and Mezzanine Loans | | | | | | $ | 95,606 | | | $ | 95,426 | | | $ | 180 | | | |
| | | | | | | | | | | | | | | | | | |
| | | | | |
Subscription Line | | | SPA II Fund | | | $ | 230,016 | | | $ | 227,141 | | | $ | 2,875 | | | Jun-25-10 |
| | | | | | | | | | | | | | | | | | |
The fair value of the outstanding mortgage loans for the properties is shown in the table above. At December 31, 2010, 2009 and 2008, based on the borrowing rates available to the Partnership for loans with similar terms and maturities, the fair values of mortgage loans are lower than their carrying values by approximately $381,000 (unaudited), $63,000 (unaudited) and $180,000, respectively, which is favorable for the Partnership.
The Partnership’s subscription line of credit can be drawn either in US Dollars or Japanese Yen at a margin of 125 basis points over USD LIBOR or 125 basis points over JPY LIBOR. Given that the margin for similar lines of credit widened to 250 basis points or more as of December 31, 2010, 2009 and 2008, the estimated fair value of the subscription line of credit is lower than its carrying value by approximately $37,000 (unaudited), $1,080,000 (unaudited) and $2,875,000, respectively, as shown in the table above, which is favorable for the Partnership.
(6) Compensation of the Investment Manager
Initially, the Investment Manager receives an annual management fee from the Partnership at an annual rate equal to 1.25% of the committed capital for Limited Partners whose aggregate capital commitment to the Partnership equals or exceeds $50 million and 1.50% of the capital commitment for each Limited Partner whose capital commitment to the Partnership is less than $50 million. The management fee is computed as described above until the expiration of the Commitment Period of the Partnership or a shorter period if certain conditions exist as described in the Partnership Agreement. Thereafter, the investment management fees are calculated using these same percentages, but the calculation is based on the amount of each Limited Partner’s capital contributions with respect to investments that have not been disposed of.
During the first extension of the Partnership’s commitment period from February 1, 2010 through January 31, 2011, investment management fees were not charged on invested capital that had previously been called in connection with the Partnership’s investments that were sold, if that invested capital was not subject to recall for reinvestment. There was a reduction of invested capital during the first extension of the Fund’s commitment period relating to investments that were sold, and the capital invested in one of those investments was not recallable for reinvestment, so investment management fees for 2010 were reduced by $310,000 (unaudited).
Investment management fees totaling $4,855,000 (unaudited), $5,165,000 (unaudited), and $5,334,000 were incurred for the years ended December 31, 2010, 2009 and 2008, respectively, of which $1,064,000 (unaudited), $1,288,000 (unaudited), and $1,291,000 were included in fees payable to related parties in the accompanying Combined Statements of Assets, Liabilities and Partners’ Capital as of December 31, 2010, 2009 and 2008, respectively.
The Investment Manager also receives an acquisition fee of 0.75% of the Partnership’s total acquisition cost of each investment acquired. With respect to any asset acquired for ground up, new development or asset repositioning involving refurbishment activity, the acquisition fee also includes 0.375% of the amount of projected capital expenditures required for such development or
F-87
CB Richard Ellis Strategic Partners Asia II, L.P. and
CB Richard Ellis Strategic Partners Asia II-A, L.P.
Notes to Combined Financial Statements—(Continued)
December 31, 2010 (unaudited), 2009 (unaudited) and 2008
refurbishment activity. There were no acquisition fees paid or payable for the years ended December 31, 2010 and 2009, as the Partnership did not make any acquisitions during those years. Acquisition fees totaling $2,056,000 were incurred for the year ended December 31, 2008, of which $509,000 was included in fees payable to related parties as of December 31, 2008.
Affiliates of the Investment Manager also received fees from the Partnership for various services. All fees incurred were paid as of December 31, 2010, 2009 and 2008, with the exception of various reimbursable costs due to the affiliates of $72,000 (unaudited), $266,000 (unaudited), and $428,000, respectively. A summary of fees incurred related to such services for the years ended December 31, 2010, 2009 and 2008 consist of the following (dollar amounts in thousands):
| | | | | | | | | | | | |
| | | 2010 | | | 2009 | | | 2008 | |
| | | (Unaudited) | | | (Unaudited) | | | | |
Property Management Fees | | $ | 72 | | | $ | 104 | | | $ | 35 | |
Project Consulting Fees | | | — | | | | — | | | | 101 | |
Real Estate Brokerage Fees | | | 31 | | | | — | | | | 102 | |
Director Fees | | | 37 | | | | 35 | | | | 44 | |
Other* | | | 188 | | | | 353 | | | | 428 | |
| | | | | | | | | | | | |
| | $ | 328 | | | $ | 492 | | | $ | 710 | |
| | | | | | | | | | | | |
| *Other | includes travel expense reimbursement, fund/corporate entity formation expense reimbursement, and due diligence expense. |
(7) Unrealized Loss on Forward Purchase Contracts
The fair value of forward purchase contracts related to commitments to purchase investments in real estate is carried at estimated fair value. The Investment Manager estimates these Level 3 valuations based on the facts and circumstances related to each commitment from a market participant’s point of view. This includes estimating the fair value of the underlying real estate investment and comparing such value to the purchase price as stated in the purchase agreement, considering the impact of whether there is a non-refundable deposit or letter of credit associated with the commitment, considering the potential amount of liquidated damages that may be assessed by the seller if the Partnership does not close on the purchase, and considering the potential for a negotiated settlement if the commitment were terminated.
| a. | The Partnership committed on April 18, 2008, to purchase a to-be-built 27,000 square foot retail building in Japan through a forward purchase contract for JPY 6.1 billion (approximately $75 million). The building was completed in the first quarter of 2009. Notice of termination of the sale and purchase agreement was sent to the seller in March 2009 based on the seller’s breach of certain representations and warranties. In June 2010, the seller withdrew from a mediation process and may proceed with the filing of a lawsuit in the future. |
During the third quarter of 2010, the seller sold the property to a third party. The Partnership previously recorded in the Combined Statements of Assets, Liabilities and Partners’ Capital an unrealized loss on the forward purchase contract of JPY 610,000,000 ($6,561,000) (unaudited) as of December 31, 2009, representing a default penalty of 10% of the purchase price. As the property has been sold, and it is unlikely that the seller will proceed with the filing of a lawsuit, the unrealized loss has been reversed in the Combined Statement of Operations as of December 31, 2010. However, if the seller should proceed with the filing of a lawsuit against the Partnership and succeed in the lawsuit, the Partnership may be liable for up to JPY 610,000,000 representing a default penalty of 10% of the purchase price.
| b. | The Partnership paid a JPY 925 million purchase deposit to secure another forward purchase contracts. As of December 31, 2008, the Partnership had an unrealized loss of $6,509,000 on this forward purchase contract, and consequently wrote down the carrying value of the purchase deposit to $3,702,000. On November 5, 2009, the Partnership cancelled the transaction, and the purchase deposit was retained by the seller in accordance with the forward purchase contract terms on cancellation. Accordingly, the remaining purchase deposit balance of $3,758,000 (unaudited) was written off as of December 31, 2009. |
| c. | The forward purchase commitment of another forward purchase contracts was terminated by a memorandum of understanding with the seller executed on April 27, 2009, with the Partnership incurring no additional cost and without liability, and as a result, the Partnership wrote back an unrealized loss of $7,723,000 (unaudited). A JPY 1.96 billion letter of credit issued to the seller by a US lender to secure the Partnership’s forward purchase obligations was successfully terminated on June 10, 2009. |
F-88
CB Richard Ellis Strategic Partners Asia II, L.P. and
CB Richard Ellis Strategic Partners Asia II-A, L.P.
Notes to Combined Financial Statements—(Continued)
December 31, 2010 (unaudited), 2009 (unaudited) and 2008
(8) Capitalized Interest
Interest is capitalized for the real estate investments under development. Interest expense is net of capitalized interest of $4,221,000 (unaudited) and $5,560,000 for the years ended December 31 2009 and 2008, respectively. There was no interest capitalized for the year ended December 31, 2010 due to the repayment of the corresponding borrowings under the subscription line of credit.
(9) Hedging
JPY/USD FORWARD CURRENCY TRADE EXECUTION
On May 8, 2009, the Partnership entered into a two-year JPY/USD foreign currency forward contract with a US lender to sell JPY 2.75 billion for US dollars on value date June 24, 2011 to hedge the equity investments in retail/residential and retail assets against the possibility of future depreciation of the Japanese Yen against the US Dollar. The Partnership may roll over this forward contract until the time that the Partnership sells these investments in the future.
| | ¡ | | Trade Date: May 8, 2009 |
| | ¡ | | Value Date: June 24, 2011 (two years forward contract) |
| | ¡ | | Counterparty: US Lender |
| | ¡ | | SP Asia II Sold: JPY 2,750,000,000 |
| | ¡ | | SP Asia II Bought: US $28,453,181.58 |
| | ¡ | | JPY/USD Forward Exchange Rate: 96.65 |
An Unrealized Loss on Foreign Currency Contract at Fair Value of approximately $5,296,000 (unaudited) and $1,616,000 (unaudited) as of December 31, 2010 and 2009, respectively, from this foreign currency forward contract, as measured by the difference between the forward foreign exchange rate at the date of entry into the contract and the forward rate at the reporting date, is included in the Combined Statements of Assets, Liabilities and Partners’ Capital. This instrument involves market risk and credit risk that may result in a loss in excess of the amount recognized in the Combined Statements of Assets, Liabilities, and Partners’ Capital. Risks arise from the possible inability of the counterparty to meet the terms of the contract and from movement in currency, securities values and interest rates.
This is recorded as follows in the Combined Financial Statements as of December 31, (Dollar Amounts in Thousands):
| | | | | | | | | | | | | | |
Foreign Currency Contract | | Location | | 2010 | | | 2009 | | | 2008 | |
| | | | | (Unaudited) | | | (Unaudited) | | | | |
Fair value recognized in Combined Statements of Assets, Liabilities and Partners’ Capital | |
Unrealized Loss on Foreign Currency Contract at Fair Value | | $ | 5,296 | | | $ | 1,616 | | | $ | — | |
| | | | | | | | | | | | | | |
Amount of loss recognized in Combined Statements of Operations | |
Unrealized Loss on Foreign Currency Contract at Fair Value | | $ | (3,680 | ) | | $ | (1,616 | ) | | $ | — | |
| | | | | | | | | | | | | | |
(10) Dispositions of Investments in Real Estate Related Assets
The Partnership entered into a purchase and sale agreement with a third party buyer on December 7, 2009 to sell residential property (Property 3) in Beijing, China. The sale closed on February 23, 2010 for a gross sale price of $77,949,000 (unaudited), consisting of cash proceeds of $52,870,000 (unaudited), with the buyer separately paying off the existing property loan of $25,079,000 (unaudited).
The Partnership entered into a purchase and sale agreement with a third party buyer on December 24, 2009 to sell the mixed-use property (Joint Venture 1) in Tianjin, China. The sale closed on May 13, 2010 for a gross sale price of $69,754,000 (unaudited) consisting of cash proceeds of $64,901,000 (unaudited), with $4,853,000 (unaudited) held in escrow pending settlement of the remaining construction costs. In addition to the amount held in escrow, $2,270,000 (unaudited) has been recognized in Other Liabilities for additional construction costs potentially due to the buyer.
F-89
CB Richard Ellis Strategic Partners Asia II, L.P. and
CB Richard Ellis Strategic Partners Asia II-A, L.P.
Notes to Combined Financial Statements—(Continued)
December 31, 2010 (unaudited), 2009 (unaudited) and 2008
(11) Financial Highlights
The Internal Rate of Return since inception (“IRR”) to the Limited Partners, net of all fees and profit allocations to the General Partner, is 1.15% (unaudited) through December 31, 2010.
The IRR was computed based on quarterly cash inflows and the ending net asset value at the end of the period (residual value) of the Limited Partners’ capital accounts as of December 31, 2010.
The following details ratio to weighted average limited partners’ capital of the Partnership for the years ended December 31, 2010, 2009 and 2008:
| | | | | | | | | | | | |
| | | 2010 | | | 2009 | | | 2008 | |
| | | (Unaudited) | | | (Unaudited) | | | | |
Expenses excluding interest | | | 4.19 | % | | | 29.59 | % | | | 75.68 | % |
| | | | | | | | | | | | |
Investment Loss | | | (5.17 | %) | | | (54.65 | %) | | | (93.47 | %) |
| | | | | | | | | | | | |
(12) Other Assets and Other Liabilities
Other assets and liabilities consist of the following (in thousands):
| | | | | | | | | | | | |
| | | 2010 | | | 2009 | | | 2008 | |
| | | (Unaudited) | | | (Unaudited) | | | | |
Prepaid Expenditures | | $ | — | | | $ | 784 | | | $ | 373 | |
Other Receivables | | | 40 | | | | 54 | | | | 42 | |
| | | | | | | | | | | | |
Other Assets | | $ | 40 | | | $ | 838 | | | $ | 415 | |
| | | | | | | | | | | | |
| | | |
| | | 2010 | | | 2009 | | | 2008 | |
| | | (Unaudited) | | | (Unaudited) | | | | |
Accrued Liability Other (Note 10) | | $ | 2,270 | | | $ | — | | | $ | — | |
Accrued Professional Fees Audit | | | 335 | | | | 261 | | | | 465 | |
Accrued Expenses | | | 217 | | | | 527 | | | | 1,371 | |
| | | | | | | | | | | | |
Other Liabilities | | $ | 2,822 | | | $ | 788 | | | $ | 1,836 | |
| | | | | | | | | | | | |
(13) Subsequent Events
In January 2011, the Partnership received consent from the Limited Partners for a second extension of the Partnership’s Commitment Period for 12 months to January 31, 2012.
The Partnership has evaluated subsequent events through March 1, 2011, the date the financial statements are available to be issued.
F-90
Signatures
Pursuant to the requirements of Section 13 or 15(d) of the Securities Exchange Act of 1934, as amended, the registrant has duly caused this report to be signed on its behalf by the undersigned, thereunto duly authorized.
| | | | | | |
| | | | CB RICHARD ELLIS REALTY TRUST |
| | | |
| Date: March 30, 2011 | | | | By: | | /S/ LAURIE E. ROMANAK |
| | | | Name: | | Laurie E. Romanak |
| | | | Title: | | Chief Financial Officer |
Power of Attorney
KNOW ALL MEN BY THESE PRESENTS, that we, the undersigned officers and trustees of CB Richard Ellis Realty Trust hereby severally constitute Jack A. Cuneo and Laurie E. Romanak, and each of them singly, our true and lawful attorneys and with full power to them, and each of them singly, to sign for us and in our names in the capacities indicated below, the Annual Report on Form 10-K filed herewith and any and all amendments to said Annual Report on Form 10-K, and generally to do all such things in our names and in our capacities as officers and trustees to enable CB Richard Ellis Realty Trust to comply with the provisions of the Securities Exchange Act of 1934, as amended, and all requirements of the Securities and Exchange Commission, hereby ratifying and confirming our signatures as they may be signed by our said attorneys, or any of them, to said Annual Report on Form 10-K and any and all amendments thereto.
Pursuant to the requirements of the Securities Exchange Act of 1934, as amended, this report has been signed below by the following persons on behalf of the registrant and in the capacities and on the dates indicated:
| | | | |
Signature | | Title | | Date |
| | |
/S/ JACK A. CUNEO Jack A. Cuneo | | Chairman of the Board, President and Chief Executive Officer, (Principal Executive Officer) | | March 30, 2011 |
| | |
/S/ CHARLES E. BLACK Charles E. Black | | Trustee | | March 30, 2011 |
| | |
/S/ MARTIN A. REID Martin A. Reid | | Trustee | | March 30, 2011 |
| | |
/S/ JAMES M. ORPHANIDES James M. Orphanides | | Trustee | | March 30, 2011 |
| | |
/S/ PETER E. DICORPO Peter E. DiCorpo | | Trustee | | March 30, 2011 |
| | |
/S/ LAURIE E. ROMANAK Laurie E. Romanak | | Senior Vice President, Chief Financial Officer and Secretary (Principal Financial and Accounting Officer) | | March 30, 2011 |
EXHIBIT INDEX
| | |
Exhibit No. | | |
| |
| 3.1 | | Second Amended and Restated Declaration of Trust of CB Richard Ellis Realty Trust (Previously filed as Exhibit 3.1 to Pre-Effective Amendment No. 5 to the Registration Statement on Form S-11 (File No. 333-127405) filed September 13, 2006 and incorporated herein by reference). |
| |
| 3.2 | | Articles of Amendment of Declaration of Trust of CB Richard Ellis Realty Trust (Previously filed as exhibit 3.1 to the current report on Form 8-K (File No. 000-53200) filed June 22, 2009 and incorporated herein by reference). |
| |
| 3.3 | | Amended and Restated Bylaws of CB Richard Ellis Realty Trust (Previously filed as Exhibit 3.2 to Pre-Effective Amendment No. 5 to the Registration Statement on Form S-11 (File No. 333-127405) filed September 13, 2006 and incorporated herein by reference). |
| |
| 4.1 | | Subscription Agreement (Previously filed as Appendix A to Pre-Effective Amendment No. 2 to the Registration Statement on Form S-11 (File No. 333-152653) filed January 23, 2009 and incorporated herein by reference). |
| |
| 10.1 | | 2004 Equity Incentive Plan (Previously filed as Exhibit 10.1 to Pre-Effective Amendment No. 1 to the Registration Statement on Form S-11 (File No. 333-127405) filed October 27, 2005 and incorporated herein by reference). |
| |
| 10.2 | | 2004 Performance Bonus Plan (Previously filed as Exhibit 10.1 to Pre-Effective Amendment No. 1 to the Registration Statement on Form S-11 (File No. 333-127405) filed October 27, 2005 and incorporated herein by reference). |
| |
| 10.3 | | Third Amended and Restated Advisory Agreement, by and among CB Richard Ellis Realty Trust, CBRE Operating Partnership, L.P., and CBRE Advisors LLC, dated December 21, 2010 (Previously filed as Exhibit 10.1 to the Current Report on Form 8-K (File No. 000-53200) filed December 23, 2010 and incorporated herein by reference). |
| |
| 10.4 | | Second Amended and Restated Agreement of Limited Partnership, by and among CB Richard Ellis Realty Trust and the limited partners named therein, dated January 30, 2009 (Previously filed as Exhibit 10.2 to the Current Report on Form 8-K (File No. 000-53200) filed February 5, 2009 and incorporated herein by reference). |
| |
| 10.5 | | CB Richard Ellis Realty Trust Dividend Reinvestment Plan (Previously filed as Appendix B to Pre-Effective Amendment No. 2 to the Registration Statement on Form S-11 (File No. 333-152653) filed January 23, 2009 and incorporated herein by reference). |
| |
| 10.6 | | Purchase and Sale Agreement, dated as of August 6, 2004, by and between WS Roscoe, LLC and CBRE Operating Partnership, L.P. (Previously filed as Exhibit 10.6 to Pre-Effective Amendment No. 2 to the Registration Statement on Form S-11 (File No. 333-127405) filed May 11, 2006 and incorporated herein by reference). |
| |
| 10.7 | | Purchase and Sale Agreement, dated as of November 2, 2004, by and between Taunton Industrial Associates LLC and RT Taunton, LLC (Previously filed as Exhibit 10.7 to Pre-Effective Amendment No. 2 to the Registration Statement on Form S-11 (File No. 333-127405) filed May 11, 2006 and incorporated herein by reference). |
| |
| 10.8 | | Purchase and Sale Agreement, dated as of May 10, 2005, by and between Deerfield Commons I LLC and RT Deerfield I, LLC (Previously filed as Exhibit 10.8 to Pre-Effective Amendment No. 2 to the Registration Statement on Form S-11 (File No. 333-127405) filed May 11, 2006 and incorporated herein by reference). |
| |
| 10.9 | | License Agreement, dated as of July 19, 2005, by and among CB Richard Ellis Realty Trust, CB Richard Ellis, Inc. and CB Richard Ellis of California, Inc. (Previously filed as Exhibit 10.9 to Pre-Effective Amendment No. 1 to the Registration Statement on Form S-11 (File No. 333-127405) filed October 27, 2005 and incorporated herein by reference). |
| |
| 10.10 | | Purchase and Sale Agreement, dated May 10, 2005, by and between Deerfield Park LLC and RT Deerfield II, LLC (Previously filed as Exhibit 10.10 to Pre-Effective Amendment No. 2 to the Registration Statement on Form S-11 (File No. 333-127405) filed May 11, 2006 and incorporated herein by reference). |
| |
| 10.11 | | Promissory Note, dated as of October 25, 2004, made by CBRE Operating Partnership, L.P. to the order of The Northwestern Mutual Life Insurance Company (Previously filed as Exhibit 10.11 to Pre-Effective Amendment No. 2 to the Registration Statement on Form S-11 (File No. 333-127405) filed May 11, 2006 and incorporated herein by reference). |
| |
| 10.12 | | Deed of Trust and Security Agreement, dated as of October 25, 2004, by and between CBRE Operating Partnership, L.P. and The Northwestern Mutual Life Insurance Company (Previously filed as Exhibit 10.12 to Pre-Effective Amendment No. 2 to the Registration Statement on Form S-11 (File No. 333-127405) filed May 11, 2006 and incorporated herein by reference) |
| | |
Exhibit No. | | |
| |
| 10.13 | | Promissory Note, dated as of February 28, 2005, made by RT Taunton, LLC to the order of The Northwestern Mutual Life Insurance Company (Previously filed as Exhibit 10.13 to Pre-Effective Amendment No. 2 to the Registration Statement on Form S-11 (File No. 333-127405) filed May 11, 2006 and incorporated herein by reference). |
| |
| 10.14 | | Mortgage and Security Agreement, dated as of February 28, 2005, by and between RT Taunton, LLC and The Northwestern Mutual Life Insurance Company (Previously filed as Exhibit 10.14 to Pre-Effective Amendment No. 2 to the Registration Statement on Form S-11 (File No. 333-127405) filed May 11, 2006 and incorporated herein by reference). |
| |
| 10.15 | | Promissory Note, dated as of November 29, 2005, made by CBRE Operating Partnership, L.P. to the order of Allianz Life Insurance Company of North America LLC (Previously filed as Exhibit 10.15 to Pre-Effective Amendment No. 2 to the Registration Statement on Form S-11 (File No. 333-127405) filed May 11, 2006 and incorporated herein by reference). |
| |
| 10.16 | | Deed to Secure Debt and Security Agreement, dated as of November 29, 2005, by RT Deerfield I, LLC to and in favor of Allianz Life Insurance Company of North America LLC (Previously filed as Exhibit 10.16 to Pre-Effective Amendment No. 2 to the Registration Statement on Form S-11 (File No. 333-127405) filed May 11, 2006 and incorporated herein by reference). |
| |
| 10.17 | | Agreement of Purchase and Sale, dated as of December 15, 2005, by and among Millennium Associates, Ltd., Telecom Commerce Associates, Ltd., Telecom Commerce II, Ltd. and RT Texas Industrial, L.P. (Previously filed as Exhibit 10.17 to Pre-Effective Amendment No. 3 to the Registration Statement on Form S-11 (File No. 333-127405) filed June 28, 2006 and incorporated herein by reference). |
| |
| 10.18 | | Form of Amended and Restated Indemnification Agreement (Previously filed as Exhibit 10.18 to Pre-Effective Amendment No. 5 to the Registration Statement on Form S-11 (File No. 333-127405) filed September 13, 2006 and incorporated herein by reference). |
| |
| 10.19 | | Agreement between Henderson Global Investors Real Estate (No. 2) L.P. (acting by its general partner Henderson Global Investors Property (No. 2) Limited), as Seller and CBRERT Coventry, Limited (Previously filed as Exhibit 10.1 to the Current Report on Form 8-K (File No. 333-127405) filed March 29, 2007 and incorporated herein by reference). |
| |
| 10.20 | | Purchase and Sale Agreement, dated June 22, 2007, by and among CBRE Operating Partnership, L.P. (including certain of its subsidiaries as named in the agreement) and certain affiliates of Johnson Development Associates, Inc. as named in the agreement (Previously filed as Exhibit 10.1 to the Current Report on Form 8-K (File No. 333-127405) filed June 28, 2007 and incorporated herein by reference). |
| |
| 10.21 | | Purchase and Sale Agreement, dated June 22, 2007, by and among CBRE Operating Partnership, L.P. and RT Kings Mountain IV, LLC and Kings Mountain North, LLC (an affiliate of Johnson Development Associates, Inc.) (Previously filed as Exhibit 10.2 to the Current Report on Form 8-K (File No. 333-127405) filed June 28, 2007 and incorporated herein by reference). |
| |
| 10.22 | | Purchase and Sale Agreement, dated July 3, 2007, by and among CBRE Operating Partnership, L.P. (including certain of its subsidiaries as named in the agreement) and an affiliate of Johnson Development Associates, Inc. as named in the agreement (Previously filed as Exhibit 10.1 to the Current Report on Form 8-K (File No. 333-127405) filed July 9, 2007 and incorporated herein by reference). |
| |
| 10.23 | | Loan Agreement between CBRERT Coventry Limited and The Royal Bank of Scotland plc (Previously filed as Exhibit 10.1 to the Current Report on Form 8-K (File No. 333-127405) filed May 3, 2007 and incorporated herein by reference). |
| |
| 10.24 | | Credit Agreement, dated August 30, 2007, by and among CBRE Operating Partnership, L.P. and CBRERT Carolina TRS, Inc., as borrowers, CB Richard Ellis Realty Trust, Bank of America, N.A. as Administrative Agent, and the other lenders thereto (Previously filed as Exhibit 10.1 to the Current Report on Form 8-K (File No. 333-127405) filed September 5, 2007 and incorporated herein by reference). |
| |
| 10.25 | | Contribution Agreement, dated May 5, 2008, by and among Duke Realty Limited Partnership, Duke/Hulfish, LLC and CBRE Operating Partnership, L.P. (Previously filed as Exhibit 10.1 to the Current Report on Form 8-K (File No. 000-53200) filed May 6, 2008 and incorporated herein by reference). |
| |
| 10.26 | | Duke/Hulfish, LLC Limited Liability Company Agreement, by and among CBRE Operating Partnership, L.P. and Duke Realty Limited Partnership, dated June 12, 2008 (Previously filed as Exhibit 10.3 to Form 10-Q (File No. 000-53200) filed November 14, 2008 and incorporated herein by reference). |
| |
| 10.27 | | First Amendment to the Contribution Agreement, by and between Duke Realty Limited Partnership, Duke/Hulfish LLC and CBRE Operating Partnership, L.P. dated September 12, 2008 (Previously filed as Exhibit 10.7 to the Quarterly Report on Form 10-Q (File No. 000-53200) filed November 14, 2008 and incorporated herein by reference). |
| | |
Exhibit No. | | |
| |
| 10.28 | | Managing Dealer Agreement dated January 30, 2009, between CB Richard Ellis Realty Trust, and CNL Securities Corp. (Previously filed as Exhibit 1.1 to the Current Report on Form 8-K (File No. 000-53200) filed February 5, 2009 and incorporated herein by reference). |
| |
| 10.29 | | Selected Dealer Agreement, by and among, CB Richard Ellis Realty Trust, CNL Securities Corp., CBRE Advisors LLC, CB Richard Ellis Investors, LLC and Ameriprise Financial Services, Inc. dated as of February 12, 2009 (Previously filed as Exhibit 1.1 to the Current Report on Form 8-K (File No. 000-53200) filed February 18, 2009 and incorporated herein by reference). |
| |
| 10.30 | | Side Letter, between CB Richard Ellis Realty Trust, CB Richard Ellis Investors, LLC and CBRE Advisors LLC dated February 12, 2009 (Previously filed as Exhibit 1.2 to the Current Report on Form 8-K (File No. 000-53200) filed February 18, 2009 and incorporated herein by reference). |
| |
| 10.31 | | Side Letter between CB Richard Ellis Realty Trust and CNL Securities Corp. dated February 12, 2009 (Previously filed as Exhibit 1.3 to the Current Report on Form 8-K (File No. 000-53200) filed February 18, 2009 and incorporated herein by reference). |
| |
| 10.32 | | Shareholders’ Agreement by and among Goodman Europe Development Trust, RT Princeton CE Holdings, LLC and Goodman Princeton Holdings (LUX) S.À R.L., dated June 10, 2010 (Previously filed as Exhibit 10.1 to the Quarterly Report on Form 10-Q (File No. 000-53200) filed August 13, 2010 and incorporated herein by reference). |
| |
| 10.33 | | Shareholders’ Agreement by and among Goodman Jersey Holdings Trust, RT Princeton UK Holdings, LLC and Goodman Princeton Holdings (Jersey) Limited, dated June 10, 2010 (Previously filed as Exhibit 10.2 to the Quarterly Report on Form 10-Q (File No. 000-53200) filed August 13, 2010 and incorporated herein by reference). |
| |
| 10.34 | | Agreement of Sale, by and among 70 Hudson Street, L.L.C., 70 Hudson Street Urban Renewal Associates, L.L.C. and RT 70 Hudson, LLC dated October 15, 2010 (Previously filed as Exhibit 10.1 to the Quarterly Report on Form 10-Q (File 000-53200) filed November 12, 2010 and incorporated herein by reference). |
| |
| 10.35 | | Agreement of Sale, by and among 90 Hudson Street, L.L.C., 90 Hudson Street Urban Renewal Associates, L.L.C. and RT 90 Hudson, LLC dated October 15, 2010 (Previously filed as Exhibit 10.2 to the Quarterly Report on Form 10-Q (File 000-53200) filed November 12, 2010 and incorporated herein by reference). |
| |
| 10.36 | | Agreement for Purchase and Sale of Real Property, by and between AOL Inc. and RT Pacific Blvd, LLC, dated October 29, 2010 (Previously filed as Exhibit 10.3 to the Quarterly Report on Form 10-Q (File 000-53200) filed November 12, 2010 and incorporated herein by reference). |
| |
| 10.37 | | Purchase and Sale Agreement, by and among Duke Realty Limited Partnership, Duke Secured Financing 2009-1PAC, LLC, Duke Realty Ohio and Duke/Princeton, LLC, dated December 17, 2010 (Previously filed as Exhibit 10.2 to the Current Report on Form 8-K (File 000-53200) filed December 23, 2010 and incorporated herein by reference). |
| |
| 10.38 | | Duke/Hulfish, LLC Amended and Restated Limited Liability Company Agreement, by and among CBRE Operating Partnership, L.P. and Duke Realty Limited Partnership, dated December 17, 2010 (Previously filed as Exhibit 10.3 to the Current Report on Form 8-K (File 000-53200) filed December 23, 2010 and incorporated herein by reference). |
| |
| 10.39 | | Loan Agreement dated March 24, 2011, between Duke/Hulfish, LLC and Wells Fargo Bank, National Association (Previously filed as Exhibit 10.1 to the Current Report on Form 8-K/A (File No. 000-53200) filed March 29, 2011 and incorporated herein by reference). |
| |
| 21.1 | | List of Subsidiaries of CB Richard Ellis Realty Trust, filed herewith. |
| |
| 23.1 | | Consent of Deloitte & Touche LLP, filed herewith. |
| |
| 23.2 | | Consent of KPMG LLP, filed herewith. |
| |
| 23.3 | | Consent of KPMG, filed herewith. |
| |
| 24.1 | | Power of Attorney (included on the signature page to this Annual Report on Form 10-K). |
| |
| 31.1 | | Certification by the Chief Executive Officer pursuant to Section 302 of the Sarbanes-Oxley Act of 2002, filed herewith. |
| |
| 31.2 | | Certification by the Chief Financial Officer pursuant to Section 302 of the Sarbanes-Oxley Act of 2002, filed herewith. |
| |
| 32.1 | | Certification by the Chief Executive Officer pursuant to 18 U.S.C. Section 1350, as adopted pursuant to Section 906 of the Sarbanes-Oxley Act of 2002, filed herewith. |
| |
| 32.2 | | Certification by the Chief Financial Officer pursuant to 18 U.S.C. Section 1350, as adopted pursuant to Section 906 of the Sarbanes-Oxley Act of 2002, filed herewith. |
| |
| 99.1 | | Form of Sub-Advisory Agreement, by and among CBRE Advisors LLC and CNL Fund Management Company (Previously filed to Pre-Effective Amendment No. 1 to the Registration Statement on Form S-11 (File No. 333-152653) filed January 14, 2009 and incorporated herein by reference). |