Exhibit 99.1
|
Company Presentation
May 2013
|
Tender Offer Disclosure
This presentation is for informational purposes only and is not an offer to buy or the solicitation of an offer to sell any securities of Chambers Street Properties. The tender offer will be made only pursuant to an offer to purchase, letter of transmittal and related materials that Chambers Street Properties intends to distribute to its stockholders and file with the Securities and Exchange Commission (the _SEC_). The full details of the tender offer, including complete instructions on how to tender Shares, will be included in the offer to purchase, the letter of transmittal and other related materials, which Chambers Street Properties will distribute to shareholders and file with the SEC upon commencement of the tender offer. Shareholders are urged to carefully read the offer to purchase, the letter of transmittal and other related materials when they become available because they will contain important information, including the terms and conditions of the tender offer. Shareholders may obtain free copies of the offer to purchase, the letter of transmittal and other related materials that Chambers Street Properties files with the SEC at the SEC_s website at: http://www.sec.gov or by calling the information agent for the contemplated tender offer, who will be identified in the materials filed with the SEC at the commencement of the tender offer. In addition, shareholders may obtain free copies of the Company’s filings with the SEC from the Company’s website at: http://www.chambersstreet.com or by directing a request to: Mr. Martin A. Reid, Chambers Street Properties, 47 Hulfish Street, Suite 210, Princeton, NJ 08542; martin.reid@cspreit.com or (609) 683-4900.
1 |
|
|
Forward Looking Statements
This document contains various “forward-looking statements.” You can identify forward-looking statements by the use of forward-looking terminology such as “believes,” “expects,” “may,” “will,” “would,” “could,” “should,” “seeks,” “approximately,” “intends,” “plans,” “projects,” “estimates” or “anticipates” or the negative of these words and phrases or similar words or phrases. You can also identify forward-looking statements by discussions of strategy, plans or intentions, including statements about providing a liquidity event to our shareholders. Statements regarding the following subjects may be impacted by a number of risks and uncertainties: our business strategy, our ability to obtain future financing arrangements, estimates relating to our future distributions, our understanding of our competition, market trends, projected capital expenditures, the impact of technology on our products, operations and business, and the use of the proceeds of any offerings of securities.
The forward-looking statements are based on our beliefs, assumptions and expectations of our future performance, taking into account all information currently available to us. These beliefs, assumptions and expectations are subject to risks and uncertainties and can change as a result of many possible events or factors, not all of which are known to us. If a change occurs, our business, financial condition, liquidity and results of operations may vary materially from those expressed in our forward-looking statements. You should carefully consider these risks before you make an investment decision with respect to our common shares, along with the following factors that could cause actual results to vary from our forward-looking statements: our ability to complete the listing of our common shares on the NYSE, our ability to complete the tender offer; the price at which our common shares may trade on the NYSE, which may be higher or lower than the purchase price in the tender offer; the price and time at which we may make additional repurchases of common shares following completion of the tender offer; the number of common shares acquired in such repurchases and the terms, timing, costs, and interest rate on any indebtedness incurred to fund such repurchases; national, regional and local economic climates; changes in supply and demand for industrial and office properties; adverse changes in the real estate markets, including increasing vacancy, decreasing rental revenue and increasing insurance costs; availability and credit worthiness of prospective tenants; our ability to maintain rental rates and maximize occupancy; our ability to identify and secure acquisitions; our failure to successfully manage growth or operate acquired properties; our pace of acquisitions and/or dispositions of properties; risks related to development projects (including construction delay, cost overruns or our inability to obtain necessary permits); payment of distributions from sources other than cash flows and operating activities; receiving corporate debt ratings and changes in the general interest rate environment; availability of capital (debt and equity); our ability to refinance existing indebtedness or incur additional indebtedness; failure to comply with our debt covenants; unanticipated increases in financing and other costs, including a rise in interest rates; the actual outcome of the resolution of any conflict; material adverse actions or omissions by any of our joint venture partners; our ability to operate as a self-managed company; availability of and ability to retain our executive officers and other qualified personnel; future terrorist attacks in the United States or abroad; the ability of CSP Operating Partnership, LP to qualify as a partnership for U.S. federal income tax purposes; our ability to continue to qualify as a REIT for U.S. federal income tax purposes; foreign currency fluctuations; changes to accounting principles and policies and guidelines applicable to REITs; legislative or regulatory changes adversely affecting REITs and the real estate business; environmental, regulatory and/or safety requirements; and other factors discussed under Item 1A “Risk Factors” of the Annual Report on Form 10-K for the year ended December 31, 2012 and those factors that may be contained in any filing we make with the SEC, including Part II, Item 1A of Form 10-Qs.
Except as required by law, we undertake no obligation to publicly update or revise any forward-looking statements, whether as a result of future events, new information or otherwise. For a further discussion of these and other factors that could impact our future results, performance or transactions, see Item 1A “Risk Factors” of the Annual Report on Form 10-K for the year ended December 31, 2012.
Unless otherwise noted, the information in this document represents our portfolio as of December 31, 2012, which includes our consolidated and unconsolidated properties, at our pro rata share of effective ownership, however excluding our passive $17.5 million investment in CBRE Strategic Partners Asia II.
2
|
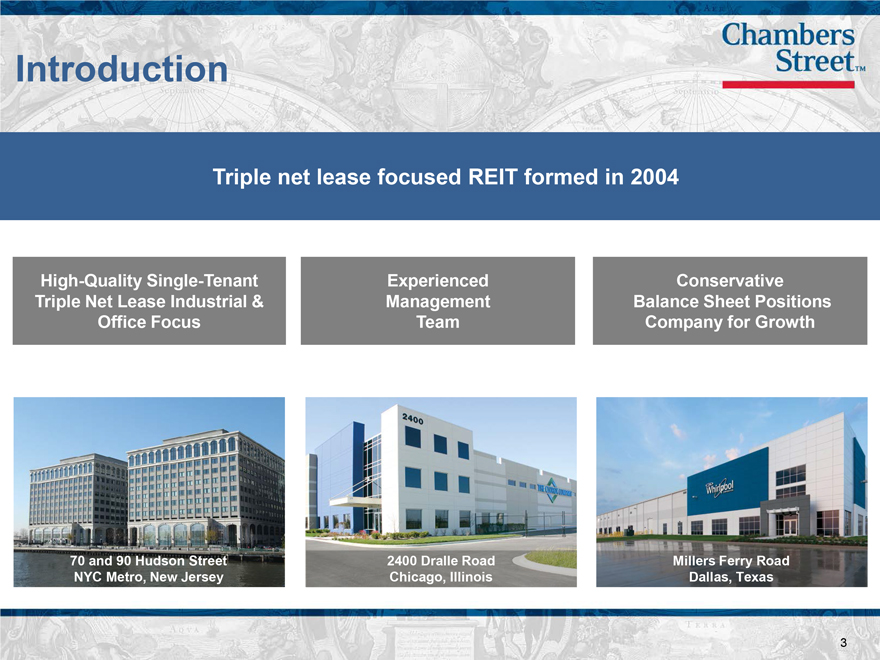
Introduction
Triple net lease focused REIT formed in 2004
High-Quality Single-Tenant Experienced Conservative
Triple Net Lease Industrial & Management Balance Sheet Positions
Office Focus Team Company for Growth
70 and 90 Hudson Street 2400 Dralle Road Millers Ferry Road
NYC Metro, New Jersey Chicago, Illinois Dallas, Texas
3
|
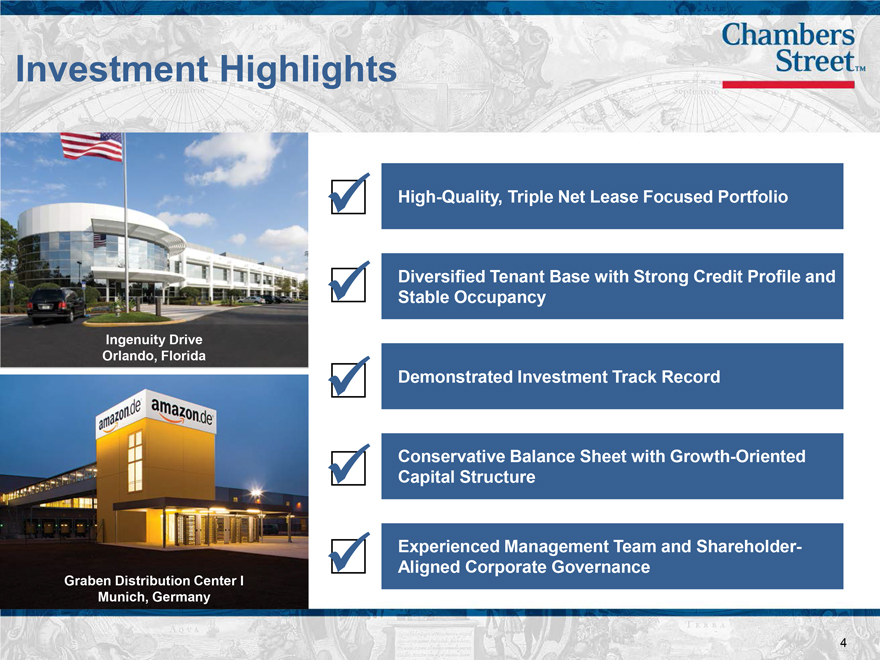
Investment Highlights
High-Quality, Triple Net Lease Focused Portfolio
Diversified Tenant Base with Strong Credit Profile and
Stable Occupancy
Demonstrated Investment Track Record
Conservative Balance Sheet with Growth-Oriented
Capital Structure
Experienced Management Team and Shareholder-
Aligned Corporate Governance
4
|
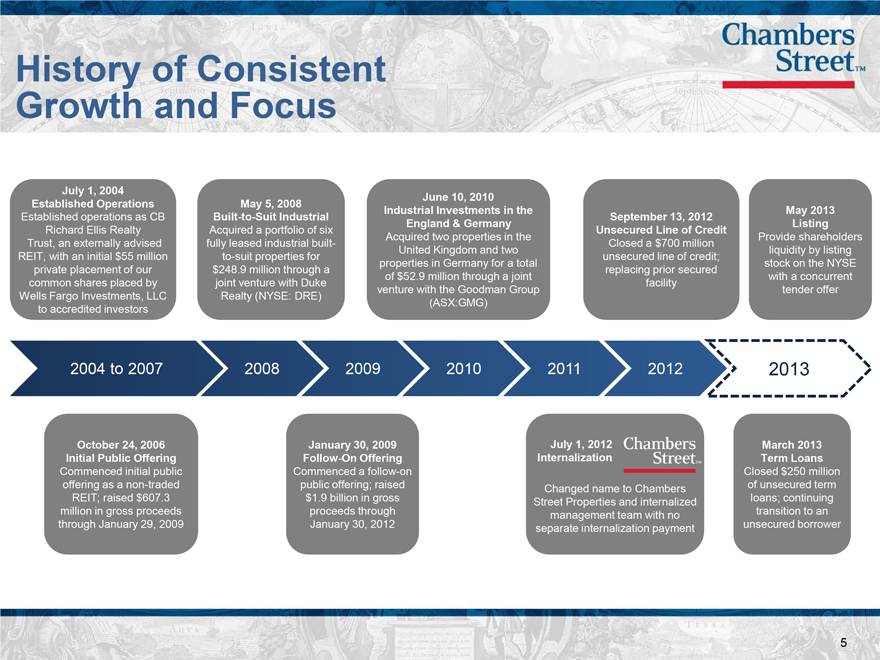
History of Consistent
Growth and Focus
July 1, 2004 June 10, 2010
Established Operations May 5, 2008 Industrial Investments in the May 2013
Established operations as CB Built-to-Suit Industrial September 13, 2012
England & Germany Listing
Richard Ellis Realty Acquired a portfolio of six Unsecured Line of Credit
Acquired two properties in the Provide shareholders
Trust, an externally advised fully leased industrial built- Closed a $700 million
United Kingdom and two liquidity by listing
REIT, with an initial $55 million to-suit properties for unsecured line of credit;
properties in Germany for a total stock on the NYSE
private placement of our $248.9 million through a replacing prior secured
of $52.9 million through a joint with a concurrent
common shares placed by joint venture with Duke facility
Wells Fargo Investments, LLC Realty (NYSE: DRE) venture with the Goodman Group tender offer
to accredited investors (ASX:GMG)
2004 to 2007 2008 2009 2010 2011 2012 2013
October 24, 2006 January 30, 2009 July 1, 2012 March 2013
Initial Public Offering Follow-On Offering Internalization Term Loans
Commenced initial public Commenced a follow-on Closed $250 million
offering as a non-traded public offering; raised Changed name to Chambers of unsecured term
REIT; raised $607.3 $1.9 billion in gross Street Properties and internalized loans; continuing
million in gross proceeds proceeds through management team with no transition to an
through January 29, 2009 January 30, 2012 separate internalization payment unsecured borrower
5
|
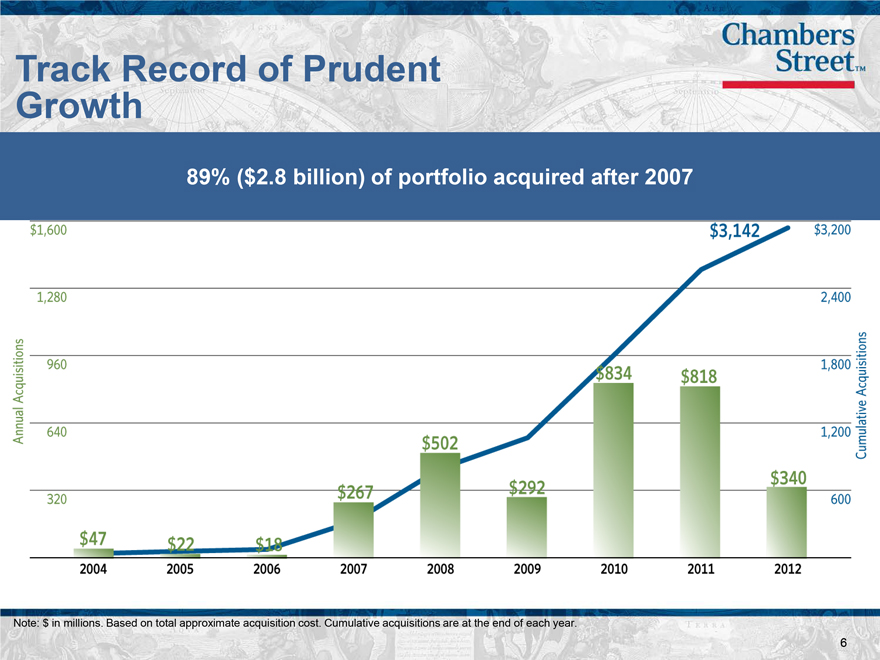
Track Record of Prudent Growth
89% ($2.8 billion) of portfolio acquired after 2007
Note: $ in millions. Based on total approximate acquisition cost. Cumulative acquisitions are at the end of each year.
6
|
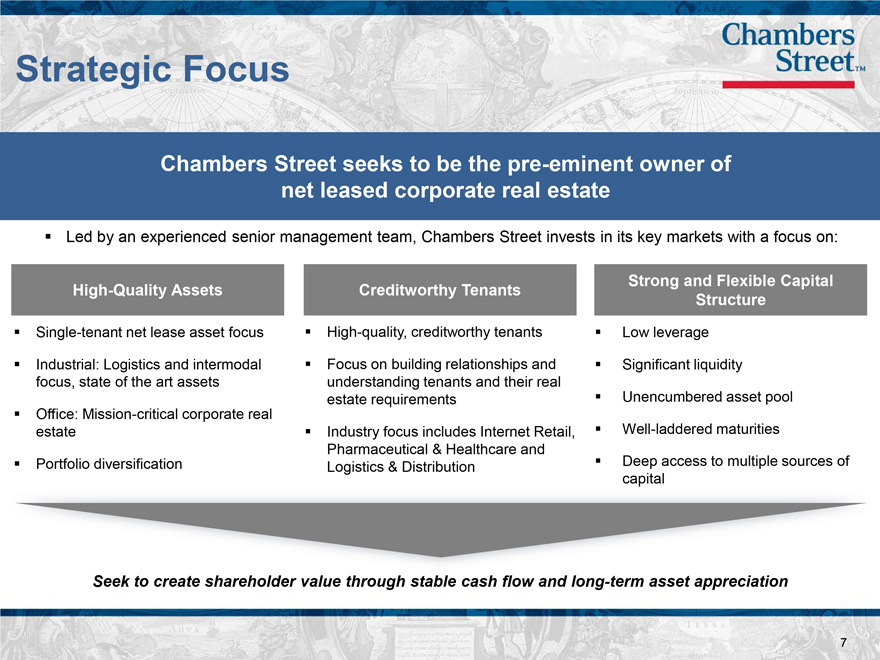
Strategic Focus
Chambers Street seeks to be the pre-eminent owner of net leased corporate real estate
§ Led by an experienced senior management team, Chambers Street invests in its key markets with a focus on:
High-Quality Assets Creditworthy Tenants Strong and Flexible Capital
Structure
Single-tenant net lease asset focus
Industrial: Logistics and intermodal focus, state of the art assets
Office: Mission-critical corporate real estate
Portfolio diversification
High-quality, creditworthy tenants
Focus on building relationships and understanding tenants and their real estate requirements
Industry focus includes Internet Retail, Pharmaceutical & Healthcare and Logistics & Distribution
Low leverage
Significant liquidity
Unencumbered asset pool
Well-laddered maturities
Deep access to multiple sources of capital
Seek to create shareholder value through stable cash flow and long-term asset appreciation
7
|
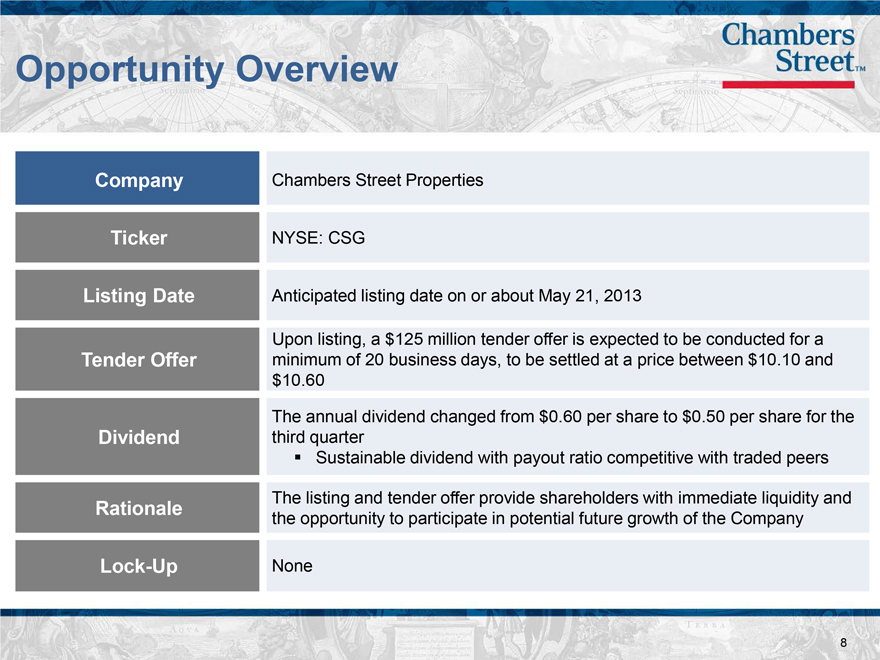
Opportunity Overview
Company Chambers Street Properties
Ticker NYSE: CSG
Listing Date Anticipated listing date on or about May 21, 2013
Upon listing, a $125 million tender offer is expected to be conducted for a
Tender Offer minimum of 20 business days, to be settled at a price between $10.10 and
$10.60
The annual dividend changed from $0.60 per share to $0.50 per share for the
Dividend third quarter
? Sustainable dividend with payout ratio competitive with traded peers
Rationale The listing and tender offer provide shareholders with immediate liquidity and
the opportunity to participate in potential future growth of the Company
Lock-Up None
8
|
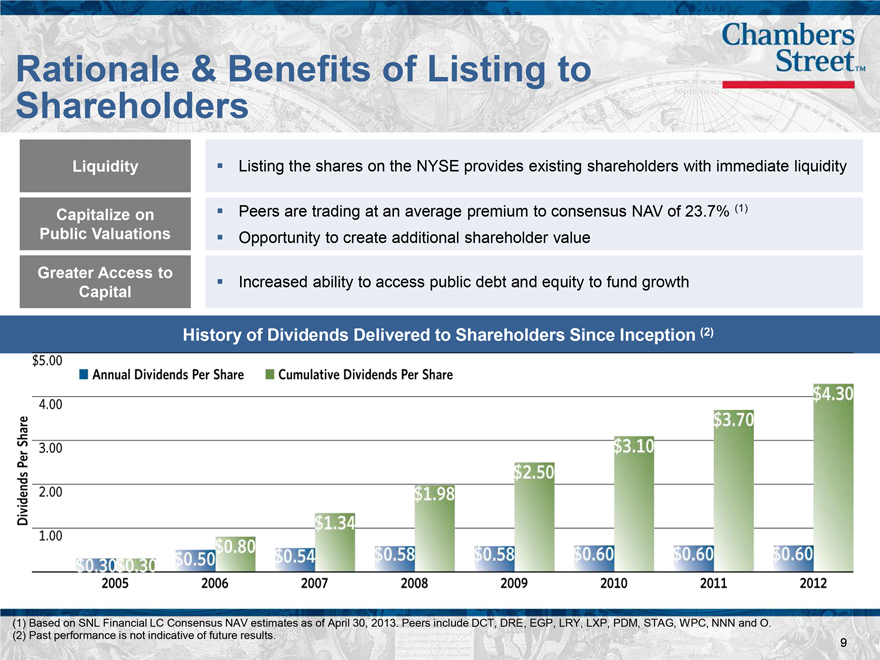
Rationale & Benefits of Listing to Shareholders
Liquidity ? Listing the shares on the NYSE provides existing shareholders with immediate liquidity
Capitalize on ? Peers are trading at an average premium to consensus NAV of 23.7% (1)
Public Valuations ? Opportunity to create additional shareholder value
Greater Access to ? Increased ability to access public debt and equity to fund growth
Capital
History of Dividends Delivered to Shareholders Since Inception (2)
(1) Based on SNL Financial LC Consensus NAV estimates as of April 30, 2013. Peers include DCT, DRE, EGP, LRY, LXP, PDM, STAG, WPC, NNN and O.
(2) Past performance is not indicative of future results. 9
|
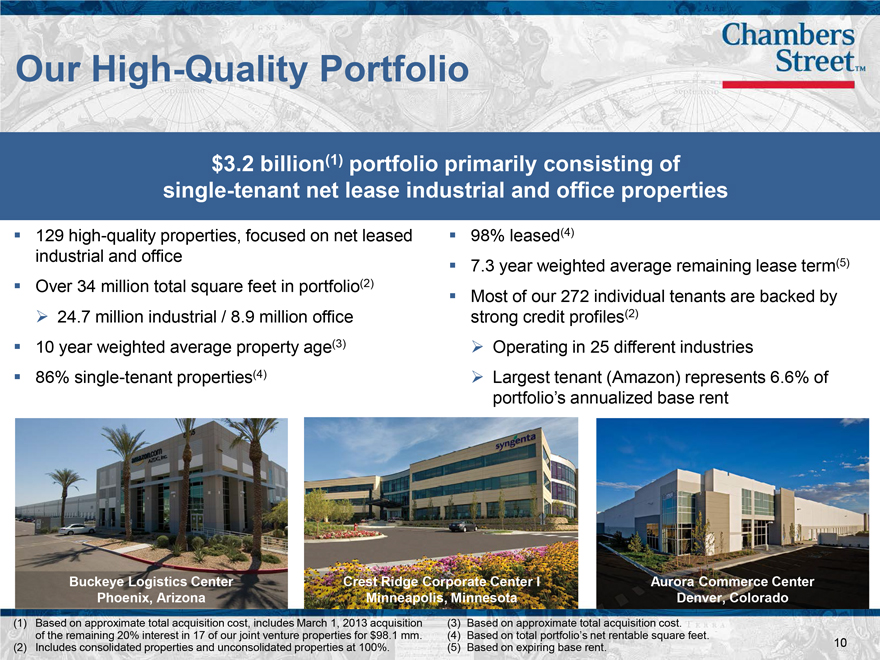
Our High-Quality Portfolio
$3.2 billion(1) portfolio primarily consisting of single-tenant net lease industrial and office properties
129 high-quality properties, focused on net leased industrial and office
Over 34 million total square feet in portfolio(2) ? 24.7 million industrial / 8.9 million office
10 year weighted average property age(3)
86% single-tenant properties(4)
98% leased(4)
7.3 year weighted average remaining lease term(5)
Most of our 272 individual tenants are backed by strong credit profiles(2)
Operating in 25 different industries
Largest tenant (Amazon) represents 6.6% of portfolio’s annualized base rent
Buckeye Logistics Center Crest Ridge Corporate Center I Aurora Commerce Center
Phoenix, Arizona Minneapolis, Minnesota Denver, Colorado
(1) Based on approximate total acquisition cost, includes March 1, 2013 acquisition (3) Based on approximate total acquisition cost.
of the remaining 20% interest in 17 of our joint venture properties for $98.1 mm. (4) Based on total portfolio’s net rentable square feet.
(2) Includes consolidated properties and unconsolidated properties at 100%. (5) Based on expiring base rent. 10
|
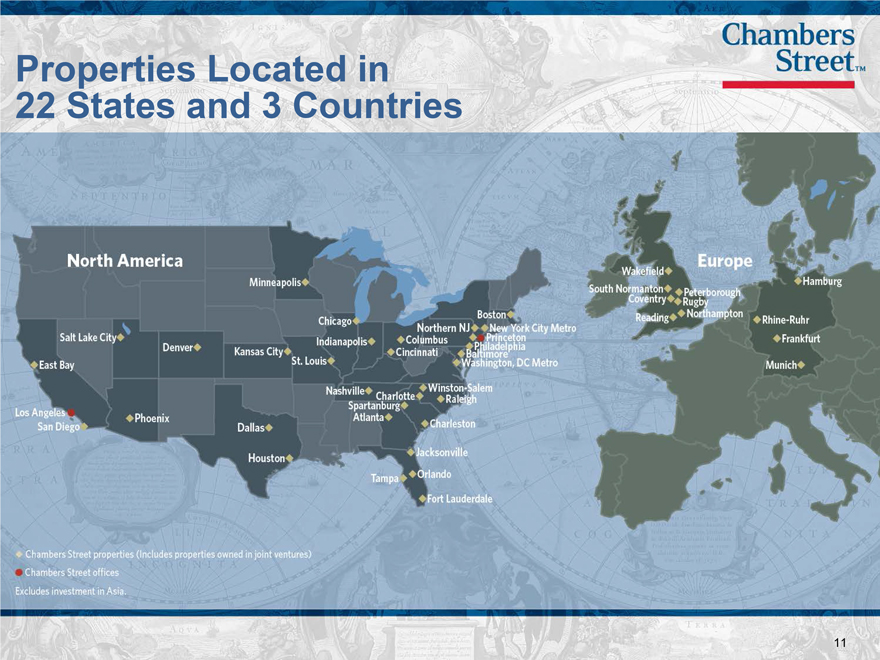
Properties Located in 22 States and 3 Countries
11
|
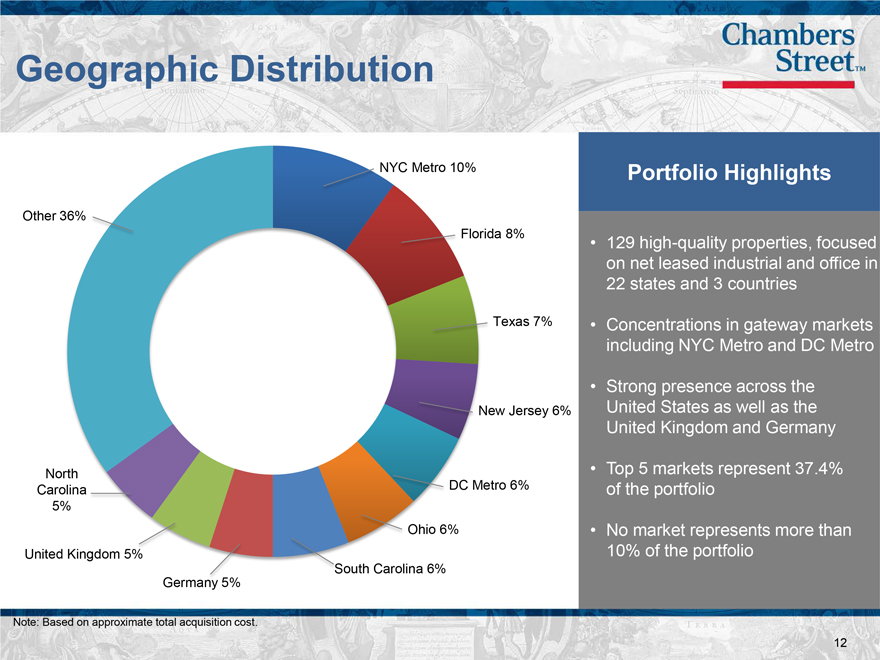
Portfolio Highlights
129 high-quality properties, focused on net leased industrial and office in 22 states and 3 countries
Concentrations in gateway markets including NYC Metro and DC Metro
Strong presence across the United States as well as the United Kingdom and Germany
Top 5 markets represent 37.4% of the portfolio
No market represents more than 10% of the portfolio
12
|
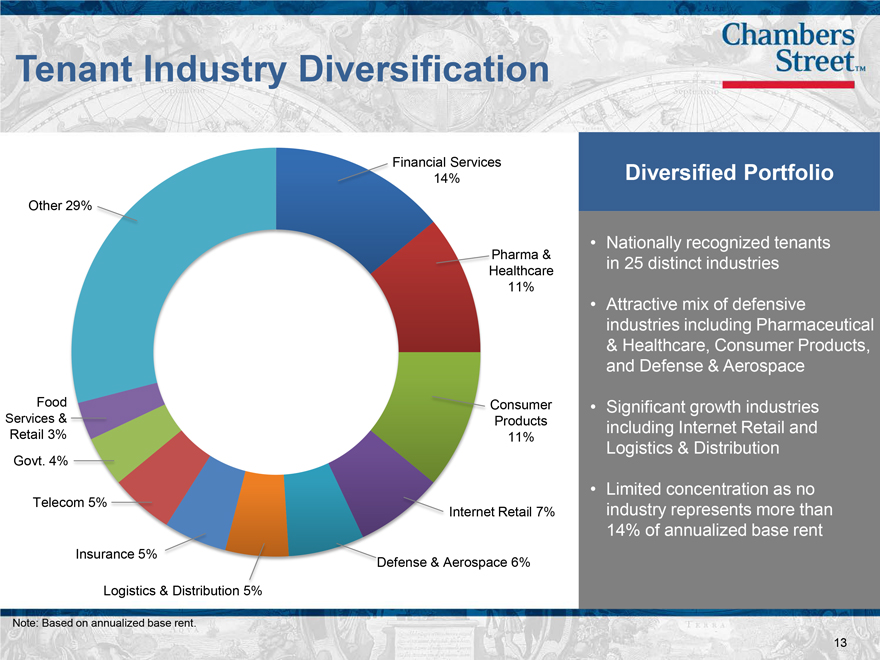
Tenant Industry Diversification
NYC Metro 10% Portfolio Highlights
Other 36%
Florida 8% • 129 high-quality properties, focused on net leased industrial and office in 22 states and 3 countries
Texas 7% • Concentrations in gateway markets including NYC Metro and DC Metro
• Strong presence across the New Jersey 6% United States as well as the United Kingdom and Germany
North • Top 5 markets represent 37.4%
Carolina DC Metro 6% of the portfolio 5%
Ohio 6% • No market represents more than United Kingdom 5% 10% of the portfolio
Germany South Carolina 6%
Note: Based on approximate total acquisition cost.
13
|
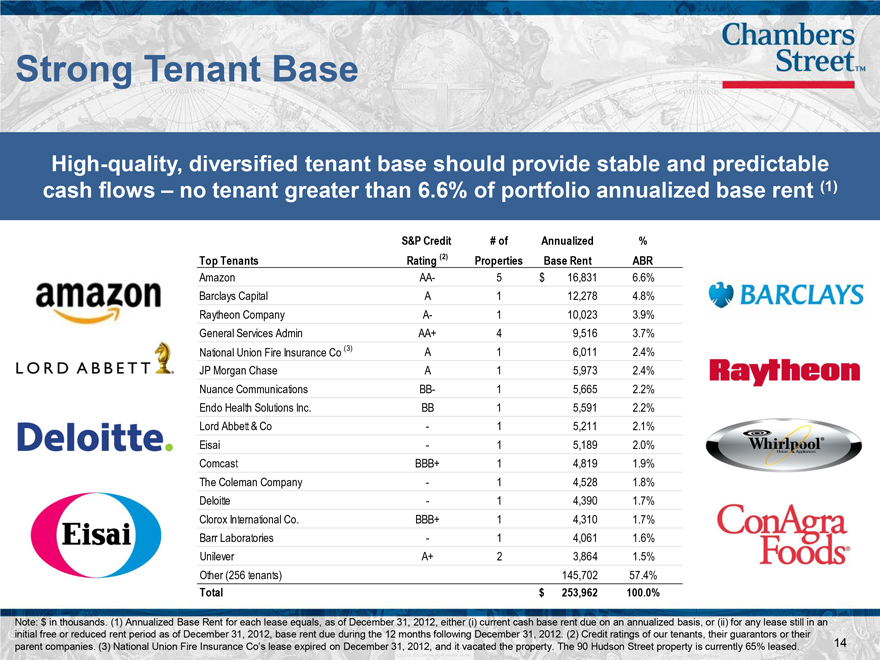
Strong Tenant Base
High-quality, diversified tenant base should provide stable and predictable cash flows _ no tenant greater than 6.6% of portfolio annualized base rent (1)
S&P Credit # of Annualized %
Top Tenants Rating (2) Properties Base Rent ABR
Amazon AA- 5 $ 16,831 6.6%
Barclays Capital A 1 12,278 4.8%
Raytheon Company A- 1 10,023 3.9%
General Services Admin AA+ 4 9,516 3.7%
National Union Fire Insurance Co (3) A 1 6,011 2.4%
JP Morgan Chase A 1 5,973 2.4%
Nuance Communications BB- 1 5,665 2.2%
Endo Health Solutions Inc. BB 1 5,591 2.2%
Lord Abbett & Co — 1 5,211 2.1%
Eisai — 1 5,189 2.0%
Comcast BBB+ 1 4,819 1.9%
The Coleman Company — 1 4,528 1.8%
Deloitte — 1 4,390 1.7%
Clorox International Co. BBB+ 1 4,310 1.7%
Barr Laboratories — 1 4,061 1.6%
Unilever A+ 2 3,864 1.5%
Other (256 tenants) 145,702 57.4%
Total $ 253,962 100.0%
Note: $ in thousands. (1) Annualized Base Rent for each lease equals, as of December 31, 2012, either (i) current cash base rent due on an annualized basis, or (ii) for any lease still in an
initial free or reduced rent period as of December 31, 2012, base rent due during the 12 months following December 31, 2012. (2) Credit ratings of our tenants, their guarantors or their
parent companies. (3) National Union Fire Insurance Co’s lease expired on December 31, 2012, and it vacated the property. The 90 Hudson Street property is currently 65% leased.
14
|
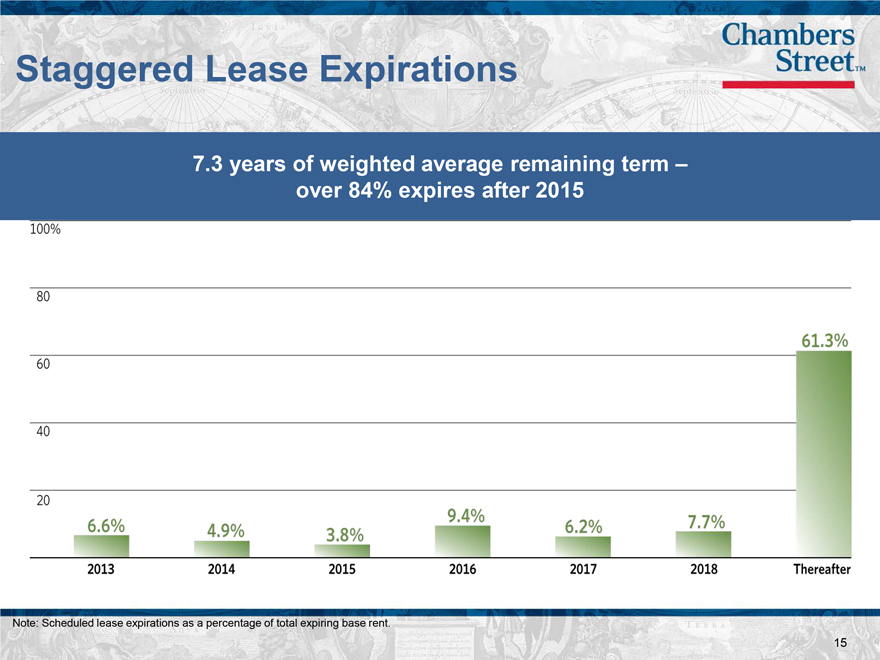
Staggered Lease Expirations
7.3 years of weighted average remaining term _ over 84% expires after 2015
Note: Scheduled lease expirations as a percentage of total expiring base rent.
15
|
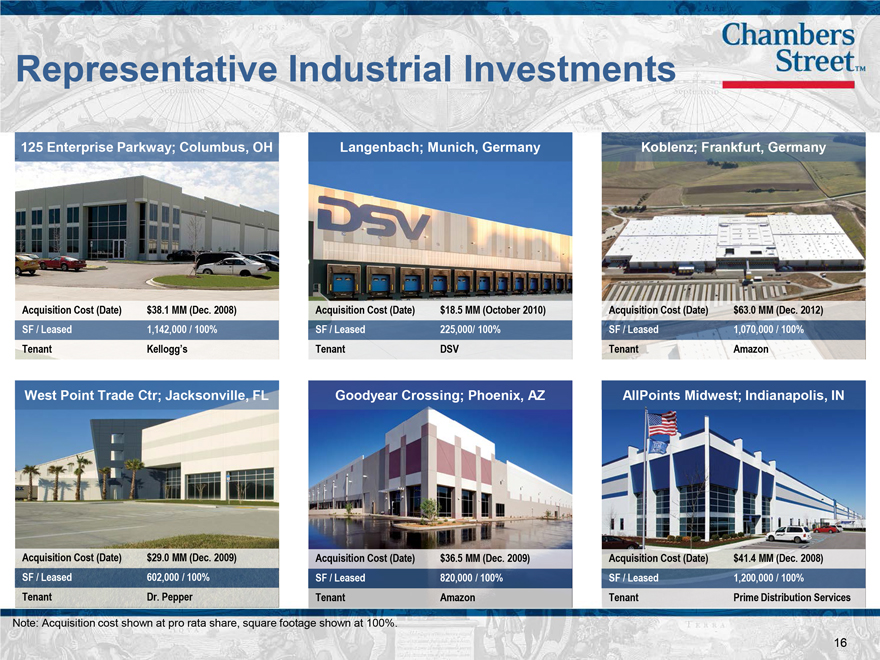
Representative Industrial Investments
125 Enterprise Parkway; Columbus, OH
Langenbach; Munich, Germany
Koblenz; Frankfurt, Germany
Acquisition Cost (Date) $38.1 MM (Dec. 2008) Acquisition Cost (Date) $18.5 MM (October 2010) Acquisition Cost (Date) $63.0 MM (Dec. 2012)
SF / Leased 1,142,000 / 100% SF / Leased 225,000/ 100% SF / Leased 1,070,000 / 100%
Tenant Kellogg’s Tenant DSV Tenant Amazon
West Point Trade Ctr; Jacksonville, FL Goodyear Crossing; Phoenix, AZ AllPoints Midwest; Indianapolis, IN
16
|
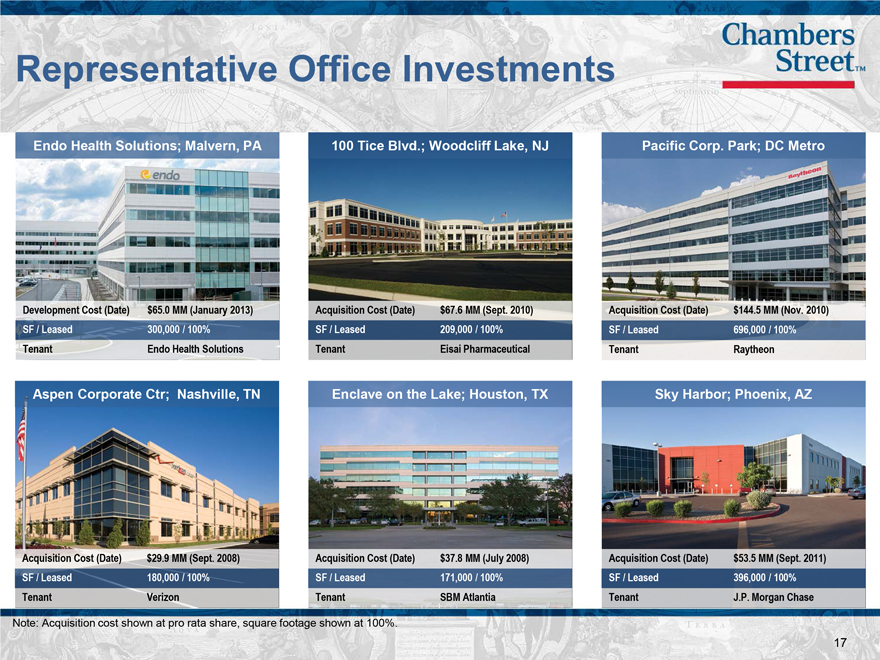
Representative Office Investments
Endo Health Solutions; Malvern, PA
100 Tice Blvd.; Woodcliff Lake, NJ
Pacific Corp. Park; DC Metro
Development Cost (Date) $65.0 MM (January 2013) Acquisition Cost (Date) $67.6 MM (Sept. 2010) Acquisition Cost (Date) $144.5 MM (Nov. 2010)
SF / Leased 300,000 / 100% SF / Leased 209,000 / 100% SF / Leased 696,000 / 100%
Tenant Endo Health Solutions Tenant Eisai Pharmaceutical Tenant Raytheon
Aspen Corporate Ctr; Nashville, TN Enclave on the Lake; Houston, TX Sky Harbor; Phoenix, AZ
Acquisition Cost (Date) $29.9 MM (Sept. 2008) Acquisition Cost (Date) $37.8 MM (July 2008) Acquisition Cost (Date) $53.5 MM (Sept. 2011)
SF / Leased 180,000 / 100% SF / Leased 171,000 / 100% SF / Leased 396,000 / 100%
Tenant Verizon Tenant SBM Atlantia Tenant J.P. Morgan Chase
Note: Acquisition cost shown at pro rata share, square footage shown at 100%.
17
|
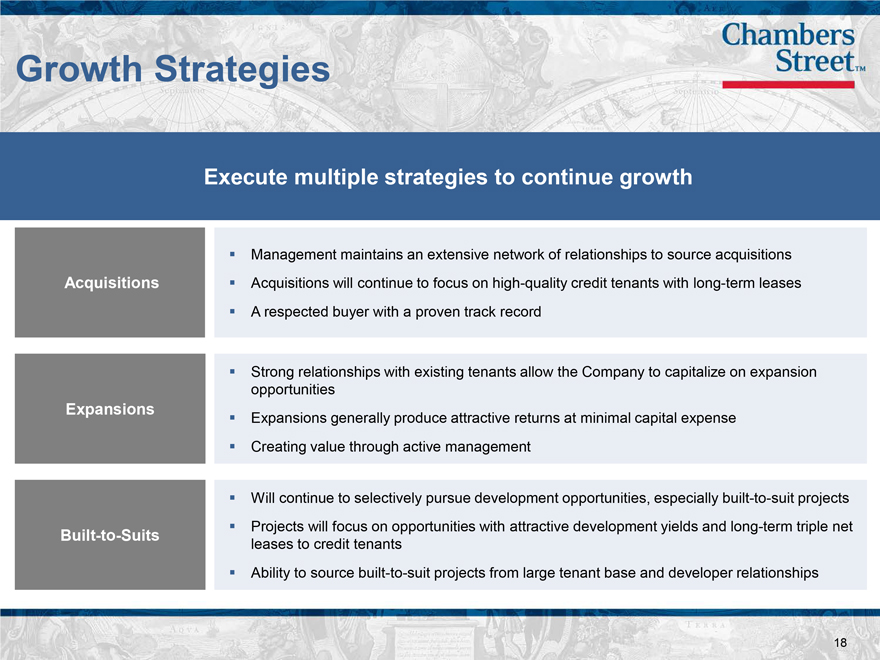
Growth Strategies
Execute multiple strategies to continue growth
? Management maintains an extensive network of relationships to source acquisitions
Acquisitions ? Acquisitions will continue to focus on high-quality credit tenants with long-term leases
? A respected buyer with a proven track record
? Strong relationships with existing tenants allow the Company to capitalize on expansion
opportunities
Expansions ? Expansions generally produce attractive returns at minimal capital expense
? Creating value through active management
? Will continue to selectively pursue development opportunities, especially built-to-suit projects
Built-to-Suits ? Projects will focus on opportunities with attractive development yields and long-term triple net
leases to credit tenants
? Ability to source built-to-suit projects from large tenant base and developer relationships
18
|
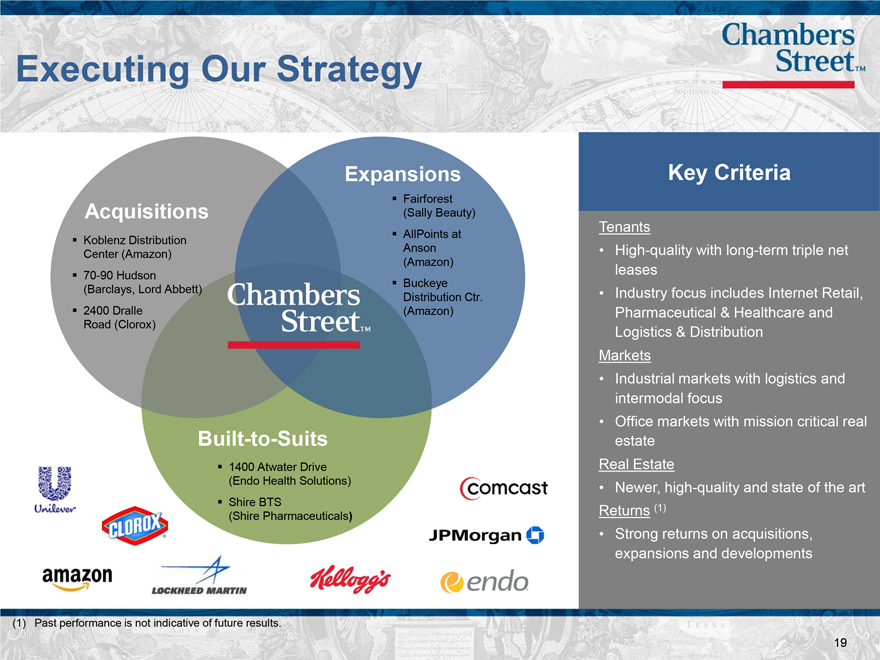
Executing Our Strategy
Acquisitions
Koblenz Distribution Center (Amazon)
70-90 Hudson (Barclays, Lord Abbett)
2400 Dralle Road (Clorox)
Built-to-Suits
Expansions
Fairforest (Sally Beauty)
AllPoints at Anson (Amazon)
Buckeye Distribution Ctr.
(Amazon)
1400 Atwater Drive (Endo Health Solutions)
Shire BTS
(Shire Pharmaceuticals)
(1) Past performance is not indicative of future results.
Key Criteria
Tenants
High-quality with long-term triple net leases
Industry focus includes Internet Retail, Pharmaceutical & Healthcare and Logistics & Distribution
Markets
Industrial markets with logistics and intermodal focus
Office markets with mission critical real estate
Real Estate
“ Newer, high-quality and state of the art Returns (1)
Strong returns on acquisitions, expansions and developments
19
|
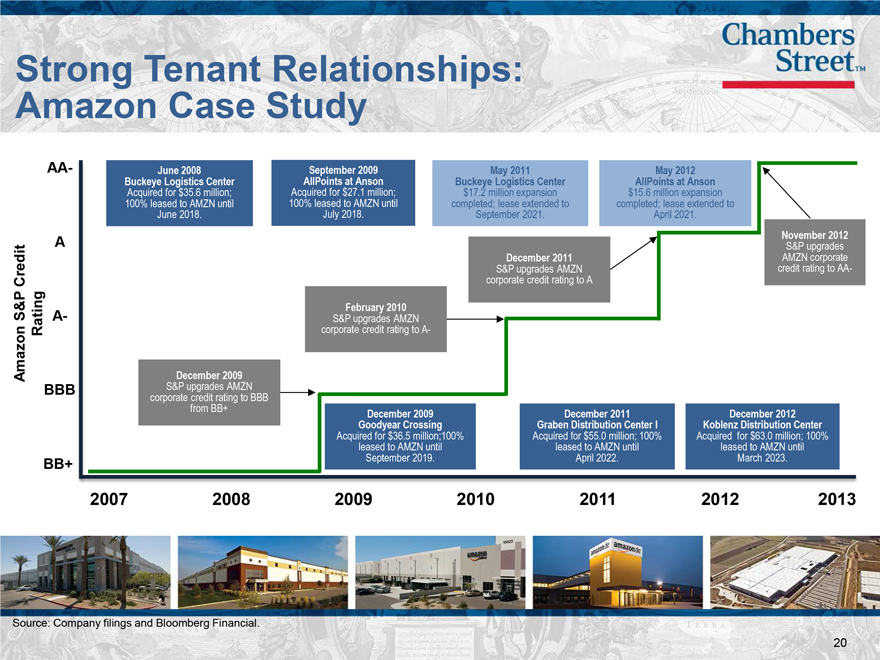
Source: Company filings and Bloomberg Financial.
20
|
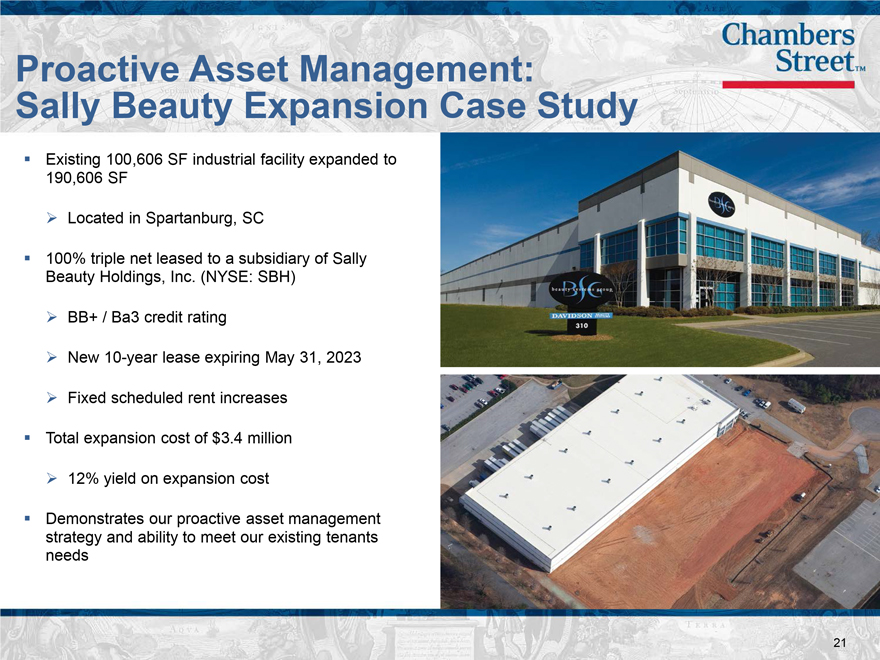
Proactive Asset Management: Sally Beauty Expansion Case Study
Existing 100,606 SF industrial facility expanded to 190,606 SF
Located in Spartanburg, SC
100% triple net leased to a subsidiary of Sally Beauty Holdings, Inc. (NYSE: SBH)
BB+ / Ba3 credit rating
New 10-year lease expiring May 31, 2023
Fixed scheduled rent increases
Total expansion cost of $3.4 million
12% yield on expansion cost
Demonstrates our proactive asset management strategy and ability to meet our existing tenants needs
21
|
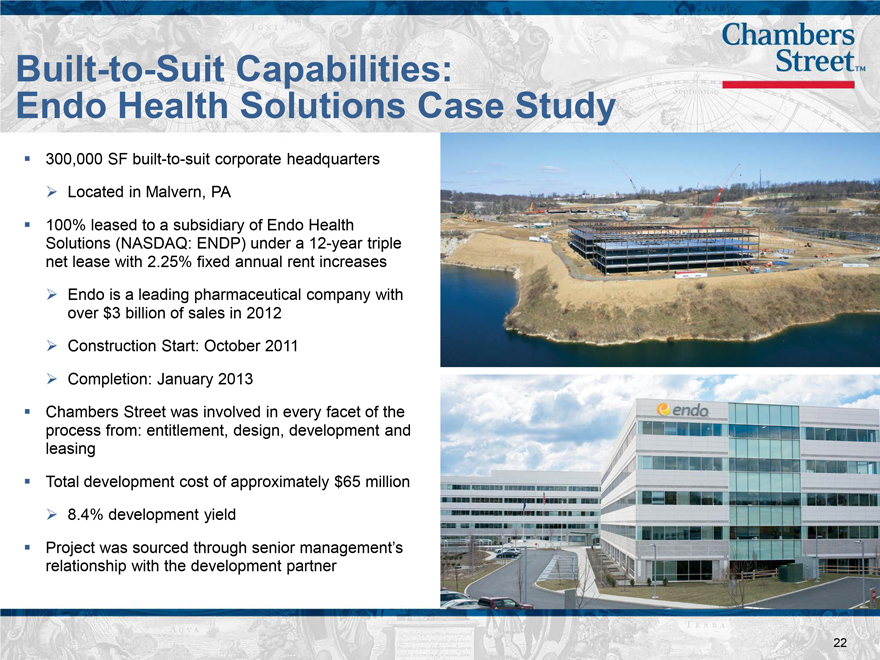
Built-to-Suit Capabilities:
Endo Health Solutions Case Study
300,000 SF built-to-suit corporate headquarters
Located in Malvern, PA
100% leased to a subsidiary of Endo Health Solutions (NASDAQ: ENDP) under a 12-year triple net lease with 2.25% fixed annual rent increases
Endo is a leading pharmaceutical company with over $3 billion of sales in 2012
Construction Start: October 2011
Completion: January 2013
Chambers Street was involved in every facet of the process from: entitlement, design, development and leasing
Total development cost of approximately $65 million
8.4% development yield
Project was sourced through senior management’s relationship with the development partner
22
|
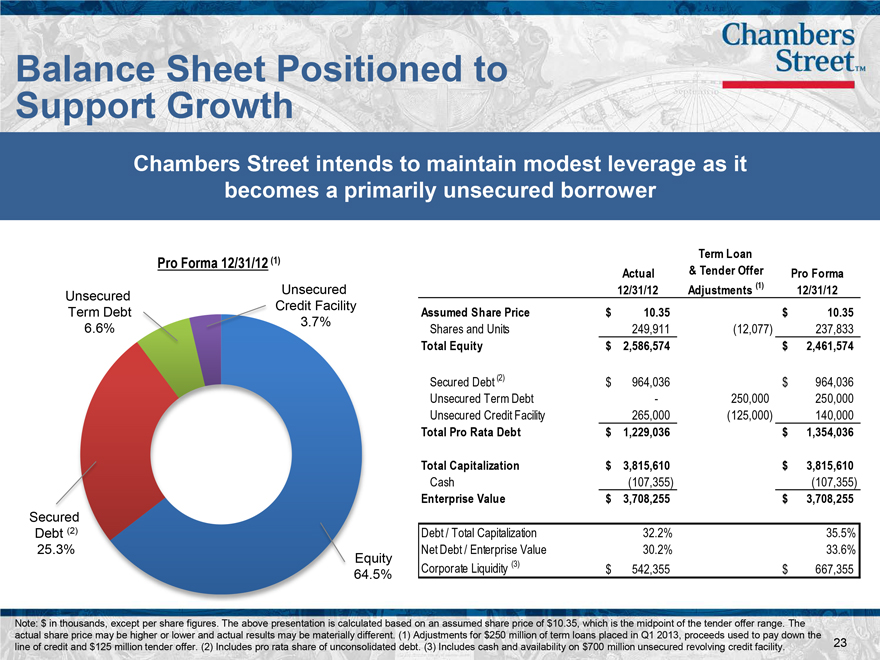
Note: $ in thousands, except per share figures. The above presentation is calculated based on an assumed share price of $10.35, which is the midpoint of the tender offer range. The
actual share price may be higher or lower and actual results may be materially different. (1) Adjustments for $250 million of term loans placed in Q1 2013, proceeds used to pay down the
line of credit and $125 million tender offer. (2) Includes pro rata share of unconsolidated debt. (3) Includes cash and availability on $700 million unsecured revolving credit facility. 23
|
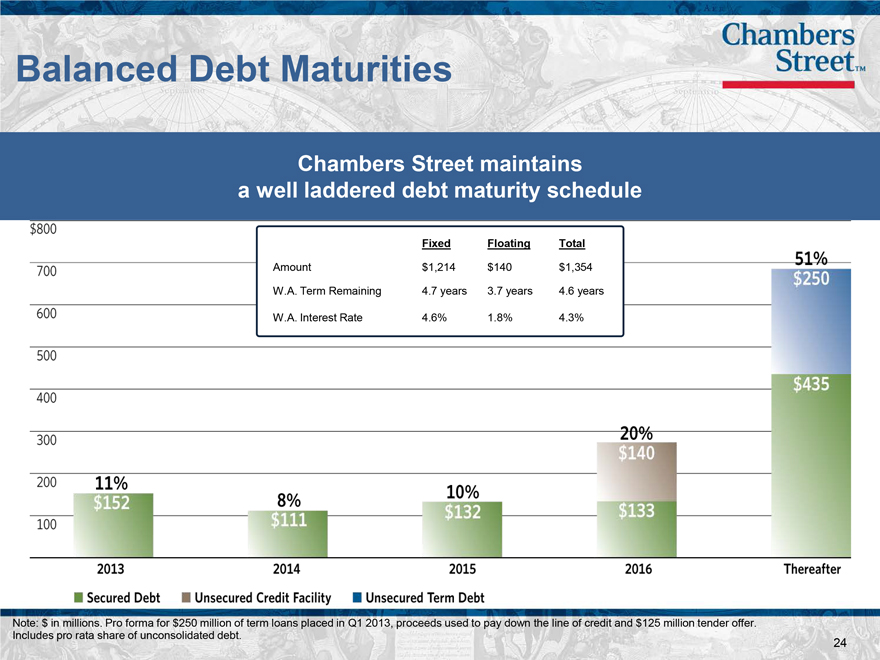
Balanced Debt Maturities
Chambers Street maintains a well laddered debt maturity schedule
Fixed
Floating
Total
Amount
$1,214
$140
$1,354
W.A. Term Remaining
4.7 years
3.7 years
4.6 years
W.A. Interest Rate
4.6%
1.8%
4.3%
Note: $ in millions. Pro forma for $250 million of term loans placed in Q1 2013, proceeds used to pay down the line of credit and $125 million tender offer.
Includes pro rata share of unconsolidated debt. 24
|
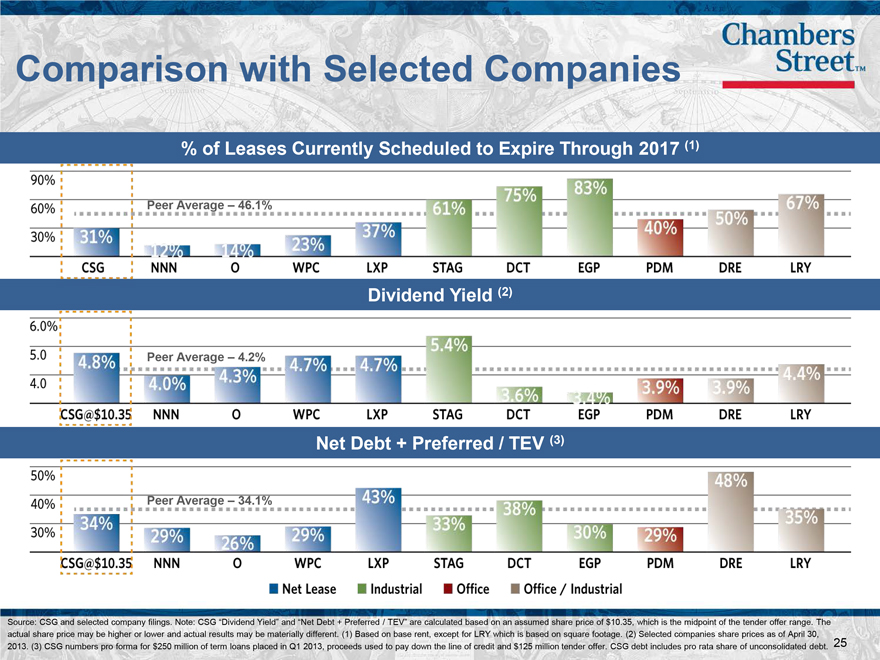
Comparison with Selected Companies
% of Leases Currently Scheduled to Expire Through 2017 (1)
Source: CSG and selected company filings. Note: CSG _Dividend Yield_ and _Net Debt + Preferred / TEV_ are calculated based on an assumed share price of $10.35, which is the midpoint of the tender offer range. The actual share price may be higher or lower and actual results may be materially different. (1) Based on base rent, except for LRY which is based on square footage. (2) Selected companies share prices as of April 30, 2013. (3) CSG numbers pro forma for $250 million of term loans placed in Q1 2013, proceeds used to pay down the line of credit and $125 million tender offer. CSG debt includes pro rata share of unconsolidated debt. 25
|
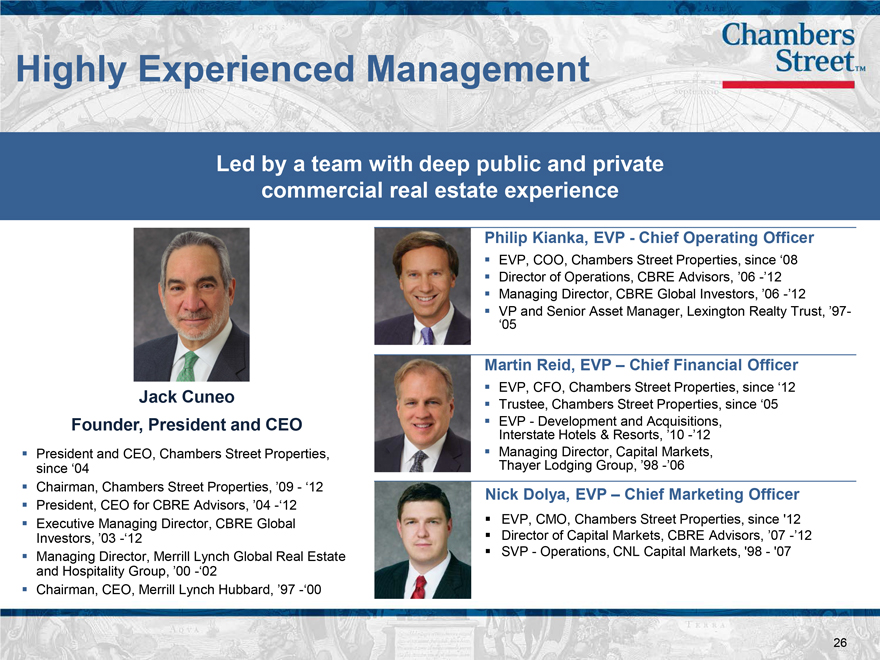
Highly Experienced Management
Led by a team with deep public and private commercial real estate experience
Philip Kianka, EVP—Chief Operating Officer
EVP, COO, Chambers Street Properties, since ‘08
Director of Operations, CBRE Advisors, ’06 -’12
Managing Director, CBRE Global Investors, ’06 -’12
VP and Senior Asset Manager, Lexington Realty Trust, ’97- ‘05
Martin Reid, EVP – Chief Financial Officer
EVP, CFO, Chambers Street Properties, since ‘12
Jack Cuneo Trustee, Chambers Street Properties, since ‘05
Founder, President and CEO
EVP—Development and Acquisitions,
Interstate Hotels & Resorts, ’10 -’12
President and CEO, Chambers Street Properties,
Managing Director, Capital Markets,
since ‘04
Thayer Lodging Group, ’98 -’06
Chairman, Chambers Street Properties, ’09—‘12
Nick Dolya, EVP – Chief Marketing Officer
President, CEO for CBRE Advisors, ’04 -‘12
Executive Managing Director, CBRE Global
EVP, CMO, Chambers Street Properties, since ‘12
Investors, ’03 -‘12
Director of Capital Markets, CBRE Advisors, ’07 -’12
Managing Director, Merrill Lynch Global Real Estate
SVP—Operations, CNL Capital Markets, ‘98—‘07
and Hospitality Group, ’00 -‘02
Chairman, CEO, Merrill Lynch Hubbard, ’97 -‘00
26
|
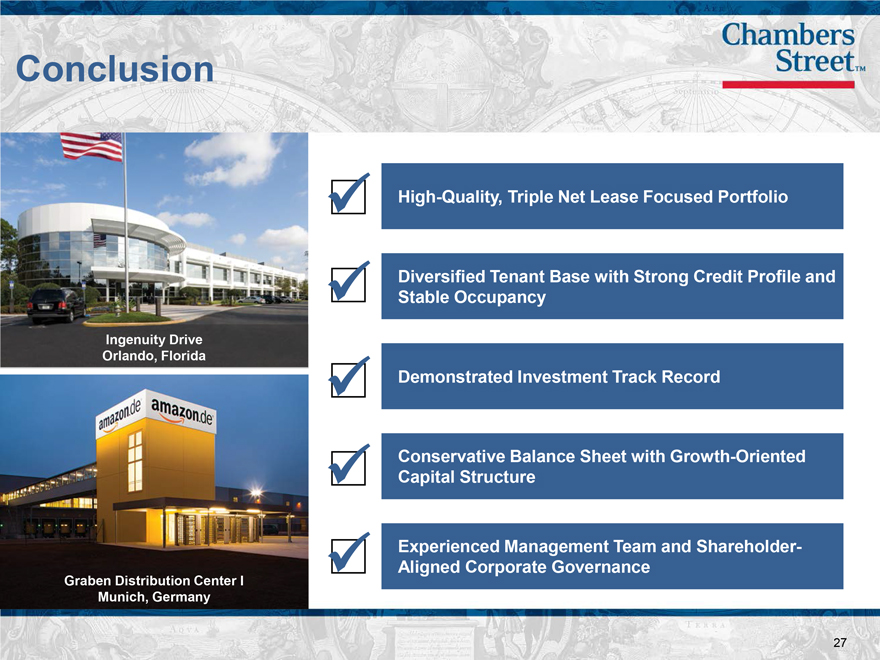
High-Quality, Triple Net Lease Focused Portfolio
Diversified Tenant Base with Strong Credit Profile and
Stable Occupancy
Demonstrated Investment Track Record
Conservative Balance Sheet with Growth-Oriented
Capital Structure
Experienced Management Team and Shareholder-
Aligned Corporate Governance
27
|
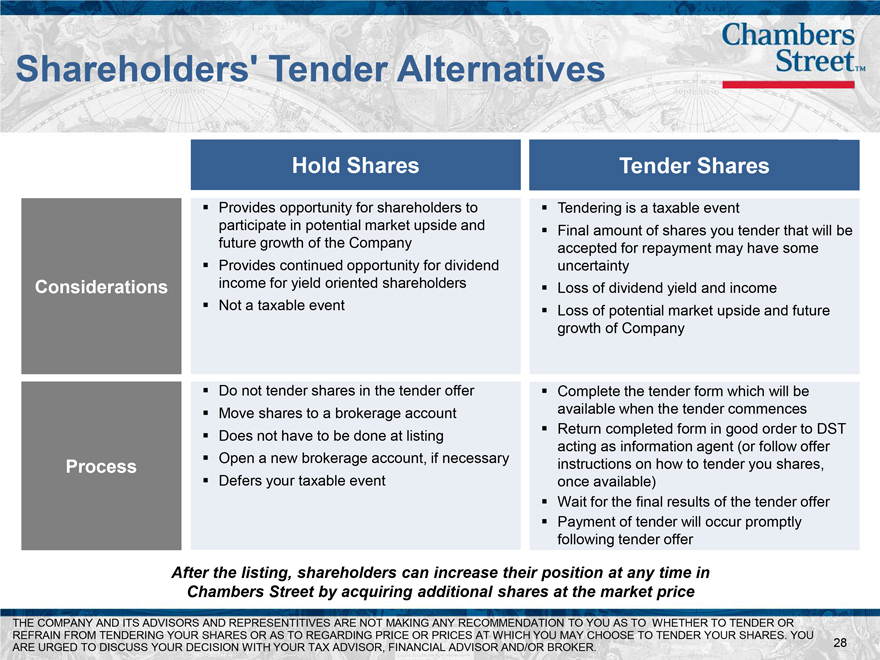
Shareholders’ Tender Alternatives
Hold Shares
? Provides opportunity for shareholders to
participate in potential market upside and
future growth of the Company
? Provides continued opportunity for dividend
Considerations income for yield oriented shareholders
? Not a taxable event
? Do not tender shares in the tender offer
? Move shares to a brokerage account
? Does not have to be done at listing
Process ? Open a new brokerage account, if necessary
? Defers your taxable event
Tender Shares
Tendering is a taxable event
Final amount of shares you tender that will be accepted for repayment may have some uncertainty
Loss of dividend yield and income
Loss of potential market upside and future growth of Company
Complete the tender form which will be available when the tender commences
Return completed form in good order to DST acting as information agent (or follow offer instructions on how to tender you shares, once available)
Wait for the final results of the tender offer
Payment of tender will occur promptly following tender offer
After the listing, shareholders can increase their position at any time in Chambers Street by acquiring additional shares at the market price
THE COMPANY AND ITS ADVISORS AND REPRESENTITIVES ARE NOT MAKING ANY RECOMMENDATION TO YOU AS TO WHETHER TO TENDER OR
REFRAIN FROM TENDERING YOUR SHARES OR AS TO REGARDING PRICE OR PRICES AT WHICH YOU MAY CHOOSE TO TENDER YOUR SHARES. YOU
ARE URGED TO DISCUSS YOUR DECISION WITH YOUR TAX ADVISOR, FINANCIAL ADVISOR AND/OR BROKER. 28
|
Appendix
29
|
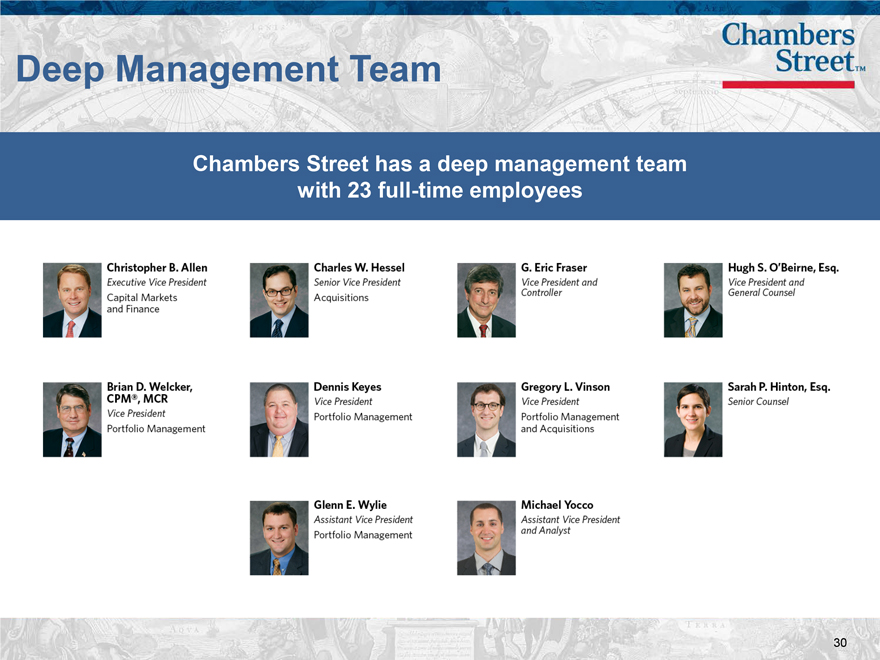
Deep Management Team
Chambers Street has a deep management team with 23 full-time employees
30
|
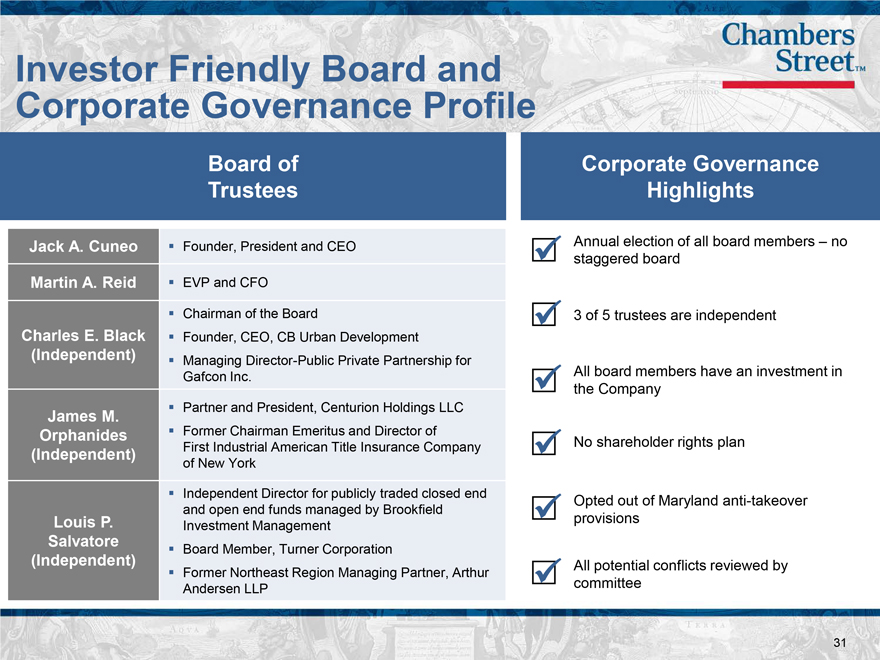
Investor Friendly Board and Corporate Governance Profile
Board of
Trustees
Jack A. Cuneo ? Founder, President and CEO
Martin A. Reid ? EVP and CFO
? Chairman of the Board
Charles E. Black ? Founder, CEO, CB Urban Development
(Independent) ? Managing Director-Public Private Partnership for
Gafcon Inc.
James M. ? Partner and President, Centurion Holdings LLC
Orphanides ? Former Chairman Emeritus and Director of
(Independent) First Industrial American Title Insurance Company
of New York
? Independent Director for publicly traded closed end
and open end funds managed by Brookfield
Louis P. Investment Management
Salvatore ? Board Member, Turner Corporation
(Independent)
? Former Northeast Region Managing Partner, Arthur
Andersen LLP
Corporate Governance Highlights
Annual election of all board members _ noü staggered board ü 3 of 5 trustees are independent ü All board members have an investment in the Company
ü No shareholder rights plan
ü Opted out of Maryland anti-takeover provisions
ü All potential conflicts reviewed by committee
31
|
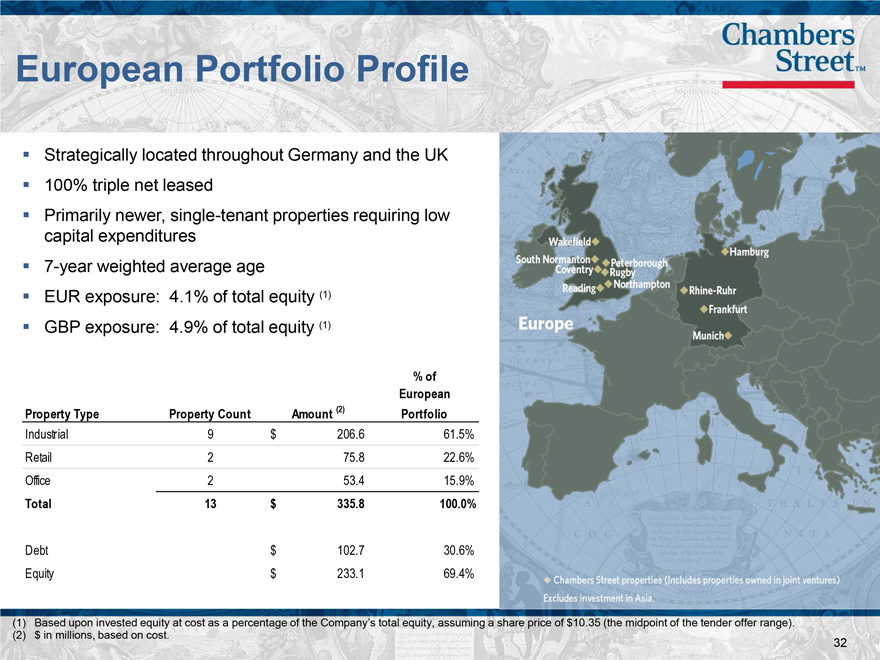
European Portfolio Profile
Strategically located throughout Germany and the UK
100% triple net leased
Primarily newer, single-tenant properties requiring low capital expenditures
7-year weighted average age
EUR exposure: 4.1% of total equity (1)
GBP exposure: 4.9% of total equity (1)
% of
European
Property Type Property Count Amount (2) Portfolio
Industrial 9 $ 206.6 61.5%
Retail 2 75.8 22.6%
Office 2 53.4 15.9%
Total 13 $ 335.8 100.0%
Debt $ 102.7 30.6%
Equity $ 233.1 69.4%
(1) Based upon invested equity at cost as a percentage of the Company’s total equity, assuming a share price of $ 10.35 (the midpoint of the tender offer range).
(2) $ in millions, based on cost. 32
|
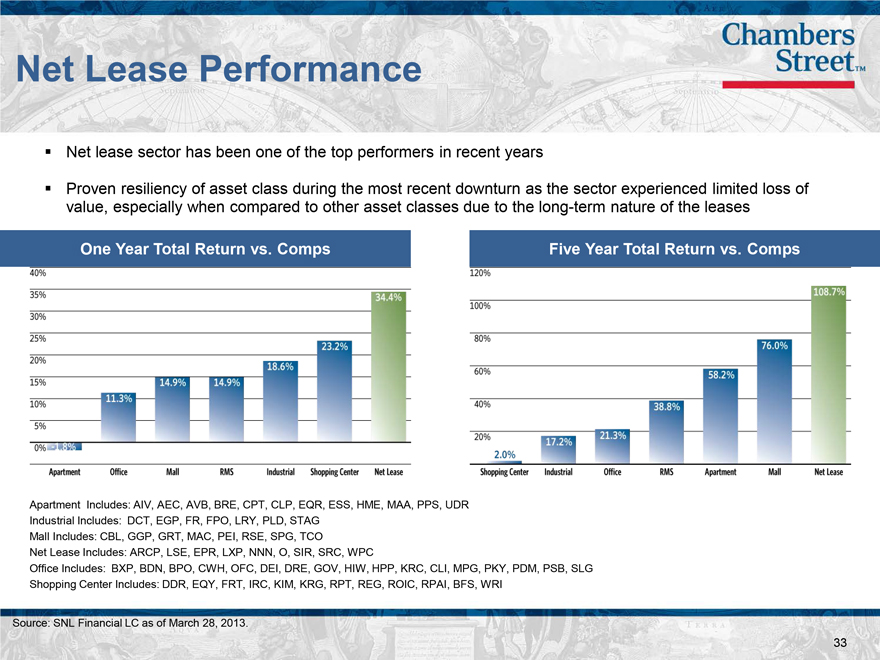
Net Lease Performance
Net lease sector has been one of the top performers in recent years
Proven resiliency of asset class during the most recent downturn as the sector experienced limited loss of value, especially when compared to other asset classes due to the long-term nature of the leases
One Year Total Return vs. Comps
Five Year Total Return vs. Comps
Apartment Includes: AIV, AEC, AVB, BRE, CPT, CLP, EQR, ESS, HME, MAA, PPS, UDR Industrial Includes: DCT, EGP, FR, FPO, LRY, PLD, STAG
Mall Includes: CBL, GGP, GRT, MAC, PEI, RSE, SPG, TCO
Net Lease Includes: ARCP, LSE, EPR, LXP, NNN, O, SIR, SRC, WPC
Office Includes: BXP, BDN, BPO, CWH, OFC, DEI, DRE, GOV, HIW, HPP, KRC, CLI, MPG, PKY, PDM, PSB, SLG Shopping Center Includes: DDR, EQY, FRT, IRC, KIM, KRG, RPT, REG, ROIC, RPAI, BFS, WRI
Source: SNL Financial LC as of March 28, 2013.
33
|
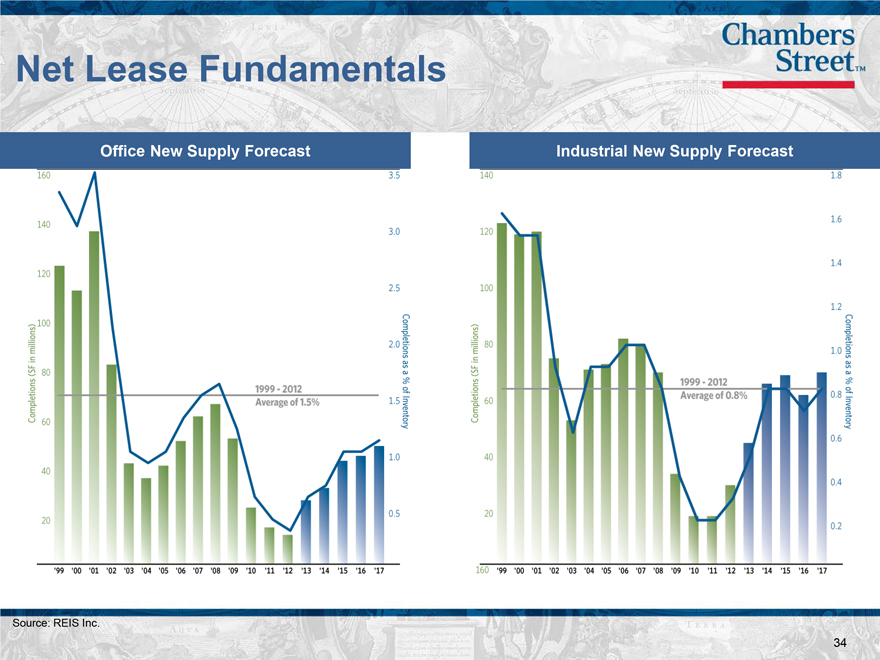
Net Lease Fundamentals
Office New Supply Forecast Industrial New Supply Forecast
Source: REIS Inc.
34
|
Chambers StreetTM